
Table of Contents
The New Zealand Official Yearbook is recognised as a standard reference work. With an informative background of text, there are presented statistics of the population, their health and education, their employment and their production, their trade and their transport, their wages and their spending, their housing standards and food consumption, their national finances and international aid. Supplementary material gives other social, administrative, and legislative information.
As a series, Official Yearbooks are a rich source of material for research workers and students. The yearly record becomes a survey of both growth and change. Every endeavour is made to give comprehensive accurate information as clearly as possible within the limits of space. Each section is progressively revised and the emphasis varies with economic and social developments.
In this latest issue some sections have been extensively revised; these include Social Work, Superannuation, Shipping, and Science. A statement of functions of Government departments has been added to Section 39, Official.
The metric system of weights and measures will be in common use by 1976, and most statistics in this issue are presented in metric measure.
Special articles cover the revision of the Consumers Price Index (1974), the Household Sample Survey 1973-74, and an introduction to inter-industry studies.
The photographic section features Vista of Colourful New Zealand.
Additional and more recent detail on many subjects may be obtained from publications of the Department of Statistics. These are listed towards the end of this Yearbook and are available from Government bookshops.
The preface to the Yearbook is the appropriate place to express my appreciation of the work of J. B. McKinney, M.A., Director of Information and Publicity, who retired at the end of July 1975. Nineteen Yearbooks were produced under his editorship and direction, and his contribution to the development of the Yearbook through these many years of dedicated work was incalculable. The Yearbook also owes much to the assistance and co-operation of other Government departments and especially to the work of the Government Printing Office.
E. A. Harris,Government Statistician.
Department of Statistics,Wellington. October 1975.
Table of Contents
The interpretation of the symbols used in the tables throughout this publication is as follows:
- nil or zero
.. figures not available not yet available — space left blank
... not applicable
- - amount too small to be expressed x revised
New Zealand is to substantially convert to the metric system of weights and measures by the end of 1976.
As far as possible statistics in this issue have been converted to the metric system.
Some relationships between common British units and common SI units are shown in the following table.
| Length— | |
| 1 in. | = 25.4 mm |
| = 2.54 cm | |
| 1 ft | = 30.48 cm |
| = 0.305 m | |
| 1 yd | = 0.914 m |
| 1 mile | = 1.609 km |
| 1 mm | = 0.039 in. |
| 1 cm | = 0.394 in. |
| 1 dm | = 3.937 in. |
| 1 m | = 39.37 in. |
| = 1.094 yds | |
| 1 km | = 0.621 miles |
| Area— | |
| 1 sq ft | = 0.093 m2 |
| = 929.03 cm2 | |
| 1 sq yd | = 0.836 m2 |
| 1 acre | = 0.405 hectare (ha) |
| 1 sq mile | = 2.590 km2 |
| = 259 ha | |
| 1 m2 | = 10.764 sq ft |
| = 1.196 sq yds | |
| 1 da | = 0.247 acres |
| 1 ha | = 2.471 acres |
| 1 km2 | = 247.1 acres |
| = 0.385 sq miles | |
| Volume— | |
| 1 cu in. | = 16.387 cm3 |
| 1 cu fa | = 0.028 m3 |
| 3 cu yd | = 0.765 m3 |
| 1 cm3 | = 0.061 cu in. |
| 1 m3 | = 35.315 cu ft |
| = 1.308 cu yds | |
| Capacity— | |
| 1 pt | = 0.568 litres (l) |
| 1 qt | = 1.137 1 |
| 1 gal | = 4.546 1 |
| 1 litre | = 1.760 pts |
| = 0.880 qts | |
| = 0.220 gal | |
| Weight— | |
| 1 oz | = 28.35 grams (g) |
| 1 lb | = 0.454 kilograms (kg) |
| 1 cwt | = 50.802 kg |
| 1 long ton | = 1,016 kg |
| = 1.016 tonnes (t) | |
| 1 g | = 0.035 oz |
| 1 kg | = 2.205 lb |
| 1 t | = 2.204.62 lb |
| = 0.984 long tons | |
| = 1.102 short tons | |
| Velocity— | |
| 1 mile per hour (mph) | 1.61 kilometres per hour (km/h) |
| 1 kilometre per hour (km/h) | 0.621 miles per hour (mph) |
| Pressure— | |
| 1 pound per sq in. (psi) | 6.89 kilopascals (kPa) |
| 3 kilopascal (kPa) | 0.145 pounds per sq in. (psi) |
| 1 ton per sq in. (ton/in2) | |
| 15.4 megapascals (MPa) | |
| 1 megapascal (MPa) | 0.0647 tons per sq in. (ton/in2) |
| Temperature— | |
| Degree Fahrenheit (°F) | 9 x ° + 32/5 |
| Degree Celsius (°C) | 5/9 (°F-32) |
New Zealand is in the south-west section of the Pacific, that great ocean stretching across one-third of the earth's surface. To the west, beyond the Tasman Sea, is Australia, 1,600 kilometres away. From its position on the rim of the Pacific basin, New Zealand is a little over 10,000 kilometres from San Francisco and Panama and a similar distance from Tokyo and Singapore. In area 26.9 million hectares, it is similar in size to the British Isles and Japan.
One of the chief charms of the New Zealand landscape is its infinite variety. Such level lowlands as exist arc small in area; contrasts between coastal plain and bordering hard-rock mountains are abrupt. High mountains make up most of the South Island area—often stark and bare or mantled in permanent snow. By contrast, most of the North Island is weak-rock hill country. From Cook Strait to the Bay of Plenty a hard-rock mountain core dominates the North Island scene, forming an effective barrier between east and west; the only low level gap across it is at the gorge cut by the Manawatu River near Palmerston North.
A peculiar and special feature of the North Island is the volcanic country of the interior. Here are the largest North Island lakes and in a line from Ruapehu to White Island, most of the still active volcanoes, hot springs, and geysers.
The most spectacular mountains are in the South Island; high mountains, deep and narrow valleys, swift rivers, and glacial lakes, large and small, give infinite variety to the scene. It is in this high country that ice has left its special mark in glacial troughs and fiords and, above all, the noble southern lakes. There is little weak-rock hill country in the South Island; the lowlands are mainly bordering plains, basin plains, and valley plains. Of these the most extensive are the plains of Canterbury and Southland.
New Zealand has large areas of luxuriant forests which are the delight of trampers, campers, and hunters. Forests cover nearly a quarter of the total land area, of which national parks and scenic reserves set aside as permanent forest form 2 million hectares.
The indigenous forests may be grouped broadly into two main formations: mixed temperate evergreen forest and southern beech forest. The former is a mixed community of many species of broad-leaved trees and conifers, and the latter a pure community of one or more of the species of southern beech. Generally, the mixed temperate evergreen forests are the forests of the north and of the warm, wet lowlands and lower mountain slopes. The beeches form the forests of the south, of the high mountains, and of the drier lowlands. But there are extensive areas where the types mingle in forests of extremely varied composition.
Mountains, forests, lakes, rivers, and beaches have influenced the characteristics of the people. New Zealand society has been shaped and subtly tempered by a number of factors—geographical, historical, social, and psychological during more than a century of growth as a nation. New Zealand today represents both an extension and a modification of the European tradition. In addition to its Maori population, New Zealand has experienced in recent years a considerable inflow of Polynesians from its associated territories and elsewhere in the Pacific. Auckland has become the major city of Polynesia, and as such a focal point of the South Pacific. The Polynesian (including Maori) population is of greater significance than its relatively small numbers would suggest. Outside the Pacific area New Zealand may present a basically European face to the world, but the preservation of distinctive life-style by the Maori, together with a close compatibility (extending to frequent intermarriage) between the two races, has doubtless been a determining factor in the evolution of New Zealand society.
GEOGRAPHICAL POSITION—The islands of New Zealand have been shaped from the projecting crests of earth folds which rise as broad ridges from the floor of the South Pacific Ocean, 1,600 kilometres east of the continent of Australia. There are three main islands—North, South, and Stewart separated only by relatively narrow straits—with adjacent islets and a small group called Chatham islands, 850 kilometres to the east of Lyttelton. Dating from 1842 the administrative boundaries of New Zealand, including the minor islands, extend from 33 degrees to 53 degrees south latitude and from 162 degrees east longitude to 173 degrees west longitude. Inhabited outlying minor islands are Raoul Island in the Kermadec Group, 930 kilometres north-east of the Bay of Islands, and Campbell Island, 590 kilometres south of Stewart Island.
New Zealand is also responsible for the administration of two island groups in the South-west Pacific—Niue and the Tokelau Islands. These are incorporated within the boundaries of New Zealand. Niue is 2,460 kilometres north-east of Auckland, while the Tokelau Islands are 1,130 kilometres further north. The territorial area reaches to within 8 degrees of the Equator.
The Ross Dependency, some 2,300 kilometres to the south, has been under New Zealand's jurisdiction since 1923 and comprises the sector of the Antarctic continent between 160 degrees east and 150 degrees west longitude, together with the islands lying between those degrees of longitude and south of latitude 60 degrees south.
The administrative area of New Zealand can be classified as follows. In this Yearbook, in general, New Zealand refers to the group of islands shown in (a) only. Areas are calculated to mean high-water mark. Adjustments have been made to statistics published prior to 1974.
| Area in Square Kilometres | |
|---|---|
| (a) New Zealand— | |
| North Island | 114,453 |
| South Island | 150,718 |
| Stewart Island | 1,746 |
| Chatham Islands | 963 |
| Minor Islands— | |
| Inhabited— | |
| Kermadec Islands | 34 |
| Campbell Island | 114 |
| Uninhabited (Auckland and other offshore islands) | 676 |
| Total | 268,704 |
| (b) Overseas territories— | |
| Tokelau Islands, comprised of— | |
| Fakaofo Island, Nukunonu Island, Atafu Island | 10 |
| Niue | 259 |
| (c) Ross Dependency (Estimated) | 114,400 |
The 16 Cook Islands achieved a status of self-government in free association with New Zealand on 4 August 1965; more detail is given in Section 38 of this Yearbook.
GEOGRAPHICAL FEATURES: Coastline—Since the combined length of the North and South Islands extends over 1,600 kilometres, and since the width of neither Island exceeds 450 kilometres at its broadest point, New Zealand possesses a very lengthy coastline in proportion to its area. With the exception of the low-lying North Auckland Peninsula, the New Zealand land mass lies along a south-westerly and north-easterly axis, parallel to the direction of its mountain chains.
In the North Island, Whangarei, Auckland, Tauranga, and Wellington are natural harbours which have been developed into ports for extensive use by overseas ships. At Napier and Gisborne artificial harbours have been made. On the east coast of the North Auckland Peninsula several other deep and sheltered harbours exist, but production from the hinterland is limited. In the South Island the Marlborough Sounds and the West Coast Sounds form perfect land-locked harbours, but owing to their situations and the rugged nature of the terrain they have—with the exception of Queen Charlotte Sound—little or no commercial utility. By dredging and by breakwater construction, ports capable of accommodating overseas vessels have been formed in Lyttelton, Otago, and Bluff Harbours and on the coast at Timaru. On the west coast of both Islands the strong ocean drifts and high seas cause shoaling at river mouths and harbour entrances, although an overseas port has been developed at New Plymouth, while on the east coast of the South Island similar circumstances prevail, due to the large quantities of shingle brought down by the rivers being spread along the coast by ocean currents.
Mountains—The mountainous nature of New Zealand is one of its most striking physical characteristics, less than one-quarter of the land surface lying below the 200 m contour. In the North Island the higher mountains occupy approximately one-tenth of the surface; but, with the exception of the four volcanic peaks of Egmont (2,518 m), Ruapehu (2,797 m), Ngauruhoe (2,290 m), and Tongariro (1,968 m), they do not exceed an altitude of 1,800 m. Of these four volcanoes only the first named can be classed as dormant. Ruapehu and Ngauruhoe have been particularly active from time to time. Other volcanoes include Mount Tarawera and White Island, each of which has, upon one occasion within historical times, erupted with disastrous consequences. Closely connected with the volcanic system are the multitudinous hot springs and geysers.
The mountain system of the North Island runs generally in a south-west direction, parallel to the coast, from East Cape to Turakirae Head, and includes the following ranges from the north: Raukumara, Huiarau, Ruahine, Tararua, and Rimutaka. This chain is flanked on the west between the Huiarau and Ruahine by the Ahimanawa, Kaweka, and Kaimanawa Ranges, while west of the Kaimanawa is the National Park volcanic group comprising Mounts Ruapehu, Ngauruhoe, and Tongariro. The Hauhangaroa and Rangitoto Ranges run in a northerly direction from the National Park group. In the east the Moehau Range parallels the length of the Coromandel Peninsula. Mount Egmont forms the only area above 1,200 m on the west coast of this Island.
The South Island is much more mountainous than the North. Along almost the entire length of the Island runs the massive chain known as the Southern Alps, which attains its greatest height in Mount Cook (3,764 m), while no fewer than 16 peaks exceed 3,000 m. West and north-west of the main portion of the Southern Alps are the Victoria, Brunner, and Lyell Ranges and the Tasman Mountains, the Victoria Range being flanked by the Papa Range. To the north run the St. Arnaud and Richmond Ranges, while to the north-east are the Spenser Mountains and the Kaikoura and Seaward Kaikoura Ranges, the two latter ranges running parallel to the east coast. The south portion of the Southern Alps breaks up into a miscellany of ranges dominating the mountainous Fiord and north-western Southland regions.
There are at least 223 named peaks of 2,300 m or more in altitude. Below is a list of the peaks restricted to the four largest volcanic cones in the North Island and to mountains of a minimum height of 2,740 m in the South Island.
| Mountain or Peak | Height (metres) |
|---|---|
| NORTH ISLAND | |
| Ruapehu | 2,797 |
| Egmont | 2,517 |
| Ngauruhoe | 2,290 |
| Tongariro | 1,968 |
| SOUTH ISLAND | |
| Kaikoura Ranges— | |
| Tapuaenuku | 2,884 |
| Alarm | 2,865 |
| Southern Alps— | |
| Cook | 3,763 |
| Tasman | 3,497 |
| Dampier | 3,440 |
| Silberhorn | 3,279 |
| Lendenfeldt | 3,201 |
| Mt. Hicks (St. David's Dome) | 3,183 |
| Malte Brun | 3,176 |
| Torres | 3,163 |
| Teichelmann | 3,160 |
| Sefton | 3,157 |
| Haast | 3,138 |
| Elie de Beaumont | 3,109 |
| Douglas Peak | 3,081 |
| La Perouse | 3,079 |
| Haidinger | 3,066 |
| Minarets | 3,066 |
| Aspiring | 3,036 |
| Hamilton | 3,022 |
| Glacier Peak | 3,007 |
| De la Beche | 2,992 |
| Aiguilles Rouges | 2,966 |
| Nazomi | 2,961 |
| Darwin | 2,961 |
| Chudleigh | 2,952 |
| Annan | 2,947 |
| Low | 2,942 |
| Haeckel | 2,941 |
| Goldsmith | 2,905 |
| Conway Peak | 2,901 |
| Bristol Top | 2,898 |
| Walter | 2,898 |
| Grey | 2,893 |
| Green | 2,836 |
| Hutton | 2,834 |
| D'Archiac | 2,828 |
| Ronald Adair | 2,827 |
| Earnslaw | 2,823 |
| Hochstetter Dome | 2,822 |
| Nathan | 2,804 |
| Barnicoat | 2,799 |
| Sibbald | 2,798 |
| Arrowsmith | 2,795 |
| Spenser | 2,794 |
| The Footstool | 2,765 |
| Rudolf | 2,755 |
| The Dwarf | 2,751 |
| Darran Range— | |
| Tutoko | 2,756 |
Glaciers—In keeping with the dimensions of the mountain system, New Zealand possesses, in the South Island, a glacial system of some magnitude. Of the glaciers the largest is the Tasman, which, with others of comparable size, rises in the more elevated area surrounding Mount Cook. Flowing down the eastern slope of the range, the Tasman Glacier has a length of 29 km and a width of 9 km. In common with other glaciers on the eastern slope, of which the more important are the Murchison (17 km), the Mueller (13 km), the Godley (13 km), and the Hooker (11 km), its rate of flow is slow, while its terminal face is an altitude of somewhat over 600 m. On the western slope of the range, owing to the greater snow precipitation, the glaciers are more numerous and descend to lower levels, while the steeper slope gives them a more rapid rate of flow. The two largest of these are the Fox and the Franz Josef, with lengths of 15 km and 13 km respectively, and terminal faces at altitudes of 200 m and 210 m.
Rivers—New Zealand rivers, owing to the high relief of the country, are mostly swift-flowing and difficult to navigate. As sources of hydro-electric power the rivers are of considerable importance, since their rapid rate of flow and dependable volume of water make them eminently suitable for this purpose. The Waikato and the Rangitaiki in the North Island and the Waitaki, Cobb, Clutha, and Waipori in the South are used for major hydro-electric schemes.
Following is a list of the more important rivers. For purposes of uniformity, the length of a river is taken to be the distance from the mouth to the farthest point in the system, whether this should happen to bear the same name or that of an affluent, and is inclusive of the estimated course of a river flowing into and emerging from any lake in the system.
| River | Length (kilometres) |
|---|---|
| *Cook Strait is defined as follows: northern limit is a line between northern point of Stephens Island and Kapiti Island: southern limit is a line between Cape Palliser and Cape Campbell. | |
| NORTH ISLAND | |
| Flowing into the Pacific Ocean— | |
| Piako | 90 |
| Waihou (or Thames) | 175 |
| Rangitaiki | 193 |
| Whakatane | 105 |
| Waipaoa (from source, Mata River) | 121 |
| Waipaoa (from source, Waipapa Stream) | 113 |
| Wairoa (from source, Hangaroa River) | 137 |
| Mohaka (from source, Taharua River) | 172 |
| Ngaruroro | 154 |
| Tukituki | 113 |
| Flowing into Cook Strait*— | |
| Ruamahanga | 124 |
| Hutt | 56 |
| Flowing into the Tasman Sea— | |
| Otaki | 48 |
| Manawatu | 182 |
| Rangitikei | 241 |
| Turakina | 137 |
| Whangaehu | 161 |
| Wanganui | 290 |
| Waitotara | 108 |
| Patea | 143 |
| Waitara | 98 |
| Mokau | 158 |
| Waikato (from source, Upper Waikato River) | 425 |
| Wairoa (from source, Waiotu Stream) | 132 |
| Hokianga (from source, Waihou River) | 72 |
| River | Length (kilometres) |
|---|---|
| SOUTH ISLAND | |
| Flowing into Cook Strait— | |
| Pelorus | 64 |
| Wairau | 169 |
| Awatere | 126 |
| Flowing into the Pacific Ocean— | |
| Clarence | 209 |
| Conway | 48 |
| Waiau-uha (or Waiau) | 169 |
| Hurunui | 138 |
| Waipara | 64 |
| Ashley | 97 |
| Waimakariri | 161 |
| Selwyn | 95 |
| Rakaia | 145 |
| Ashburton | 90 |
| Rangitata (from source, Clyde River) | 121 |
| Opihi | 80 |
| Pareora | 56 |
| Waihao | 64 |
| Waitaki (from source, Hopkins River) | 209 |
| Kakanui | 64 |
| Shag | 72 |
| Taieri | 288 |
| Clutha (from source, Makarora River) | 322 |
| Flowing into Foveaux Strait— | |
| Mataura | 240 |
| Oreti | 203 |
| Aparima (Jacobs River) | 113 |
| Waiau (from source, Clinton River) | 217 |
| Flowing into the Tasman Sea— | |
| Hollyford | 76 |
| Cascade | 64 |
| Arawhata | 68 |
| Haast | 64 |
| Karangarua | 37 |
| Cook | 32 |
| Waiho (from source Callery River) | 32 |
| Whataroa | 51 |
| Wanganui | 56 |
| Waitaha | 40 |
| Hokitika | 64 |
| Arahura | 56 |
| Taramakau | 80 |
| Grey | 121 |
| Buller (from source, Travers River) | 177 |
| Mokihinui | 56 |
| Karamea | 80 |
| Heaphy | 35 |
| Aorere (from source, Spee River) | 72 |
| Takaka (from source, Cobb River) | 72 |
| Motueka | 108 |
| Waimea (from source, Wai-iti River) | 48 |
The discovery in 1861 that the beds of rivers in the South Island contained extensive deposits of alluvial gold was of considerable importance in the early economic development of the country.
With the very successful acclimatisation of freshwater fish, notably trout, many rivers now provide exceptionally fine fishing.
Lakes—In considering New Zealand's numerous lakes a distinction can be made, especially from the scenic viewpoint, between the lakes of the two Islands. Surrounded by extremely rugged country the larger lakes of the South Island are distinguished by the grandeur of their alpine settings, while some of the larger ones of the North Island, situated on a volcanic plateau, have their own particular beauty. As reservoirs the lakes of both Islands are of vital importance for the maintenance of the rivers and streams draining them and as a of flood prevention. More especially is this the case where hydro-electric schemes are involve Waikaremoana and Taupo in the North Island, and Lakes Coleridge, Pukaki, Tekapo, Wanaka, Hawea, and Wakatipu in the South Island, being of particular significance in this respect. A series of narrow man-made lakes have been produced in connection with hydro-electric development along some of the rivers. In 1965 Lake Benmore, New Zealand's largest artificial lake, was created. It lies on the Waitaki River in North Otago and covers 79 sq km in area and consists of two arms, the main arm being 30 km in length and the Ahuriri Arm 18 km in length.
Some particulars of the more important lakes are given in the following table.
| Lake | Length, in Kilometres* | Greatest Breadth, in Kilometres* | Area, in Square Kilometres† | Drainage Area, in Square Kilometres† | Approximate Volume of Discharge, in Cubic Metres per Second | Maximum Height Above Sea Level in Metres (Range in Brackets)‡ | Greatest Depth, in Metres | ||||||
|---|---|---|---|---|---|---|---|---|---|---|---|---|---|
* 1 kilometre equals 0.621 miles. † 1 square kilometre equals 0.386 square miles. ‡ The range in lake levels is not available for all lakes. | |||||||||||||
| NORTH ISLAND | |||||||||||||
| Natural | |||||||||||||
| Taupo | 40.2 | 27.4 | 606 | 3,289 | 1,271 | 357 (1.5) | 159 | ||||||
| Rotorua | 12.0 | 9.7 | 80 | 526 | .. | 280 (0.6) | 26 | ||||||
| Rotoiti | 16.1 | 4.8 | 34 | 642 | 24 | 279 (0.6) | 70 | ||||||
| Tarawera | 11.2 | 8.9 | 36 | 186 | 8 | 299 (0.6) | 87 | ||||||
| Rotoaira | 4.8 | 2.8 | 13 | 129 | 7 | 564 (0.9) | .. | ||||||
| Waikaremoana | 19.3 | 9.7 | 54 | 427 | 18 | 614 (13.7) | 256 | ||||||
| Wairarapa | 19.3 | 6.4 | 80 | 3,201 | .. | 8 | 20 | ||||||
| Rotoehu | 4.8 | 3.2 | 8 | 44 | .. | 295 (1.2) | .. | ||||||
| Rotoma | 5.2 | 3.6 | 12 | 31 | .. | 316 (1.8) | .. | ||||||
| Okataina | 6.4 | 4.8 | 10 | 65 | .. | 310 (2.7) | .. | ||||||
| Okareka | 2.4 | 2.0 | 3 | 21 | .. | 354 (1.2) | .. | ||||||
| Rotomahana | 6.4 | 2.8 | 9 | 70 | .. | 340 (6.7) | .. | ||||||
| Rerewhakaitu | 4.0 | 2.8 | 8 | .. | .. | 439 (1.2) | .. | ||||||
| Tikitapu | 1.6 | 1.2 | 1 | .. | .. | 416 | .. | ||||||
| Rotokakahi | 4.0 | 1.6 | 5 | 28 | 1 | 396 | .. | ||||||
| Artificial | |||||||||||||
| Ohakuri | 33.8 | 0.4 | 14 | 4,791 | 157 | 287 | .. | ||||||
| Atiamuri | 6.4 | 0.4 | 1 | 5,128 | 165 | 252 | .. | ||||||
| Whakamaru | 21.7 | 0.8 | 8 | 5,581 | 174 | 226 | .. | ||||||
| Maraetai | 7.2 | 0.8 | 4 | 6,190 | 191 | 188 | .. | ||||||
| Waipapa | 9.7 | 0.4 | 1 | 6,475 | 198 | 127 | .. | ||||||
| Arapuni | 16.1 | 0.8 | 13 | 6,876 | 207 | 111 (0.6) | .. | ||||||
| Karapiro | 24.1 | 0.4 | 8 | 7,459 | 221 | 54 | |||||||
| Whakamarino | 0.8 | 0.4 | .. | .. | .. | 274 | .. | ||||||
| SOUTH ISLAND | |||||||||||||
| Natural | |||||||||||||
| Rotoiti | 8.9 | 2.8 | 10 | 184 | 12 | 616 (1.8) | 76 | ||||||
| Rotoroa | 14.5 | 3.2 | 23 | 376 | 27 | 446 (1.5) | 152 | ||||||
| Brunner | 8.9 | 8.9 | 39 | 414 | .. | 85 | 109 | ||||||
| Kaniere | 9.7 | 2.0 | 16 | 28 | .. | 131 | 197 | ||||||
| Coleridge | 17.7 | 3.2 | 36 | 559 | .. | 510 | 207 | ||||||
| Sumner | 9.7 | 2.4 | 14 | 337 | .. | .. | .. | ||||||
| Tekapo | 17.7 | 5.6 | 96 | 1,424 | 87 | 715 (7.6) | 189 | ||||||
| Pukaki | 15.3 | 8.0 | 83 | 1,355 | 128 | 500 (9.1) | |||||||
| Ohau | 17.7 | 4.8 | 60 | 1,191 | 65 | 527 (1.7) | |||||||
| Hawea | 30.6 | 8.0 | 119 | 1,469 | 63 | 345 (16.2) | 392 | ||||||
| Wanaka | 45.1 | 4.8 | 192 | 2,543 | 202 | 279 (4.3) | |||||||
| Wakatipu | 77.2 | 4.8 | 293 | 2,978 | 174 | 310 (2.1) | 378 | ||||||
| Te Anau | 61.2 | 9.7 | 344 | 3,302 | 276 | 209 (4.6) | 276 | ||||||
| Manapouri | 28.9 | 8.0 | 142 | 4,623 | 386 | 185 (6.4) | 443 | ||||||
| Monowai | 19.3 | 1.6 | 28 | 272 | 14 | 196 (4.0) | .. | ||||||
| Hauroko | 35.4 | 2.4 | 71 | 583 | 31 | 156 (1.8) | .. | ||||||
| Poteriteri | 28.9 | 2.4 | 47 | 414 | 30 | 29 | .. | ||||||
| Waihola | 6.4 | 2.0 | 8 | 5,698 | .. | (Tidal) | 16 | ||||||
| Ellesmere | 22.5 | 12.9 | 181 | 1,930 | .. | (Tidal) | 2 | ||||||
| >Artificial | |||||||||||||
| Cobb | 4.8 | 0.4 | 2 | 73 | 6 | 808 (15.2) | .. | ||||||
| Waitaki | 4.8 | 0.8 | 6 | 3,712 | 344 | 230 | .. | ||||||
| Roxburgh | 32.2 | 0.4 | 6 | 15,571 | 489 | 131 | .. | ||||||
| Mahinerangi | 14.5 | 1.6 | 21 | 311 | 7 | 391 | .. | ||||||
| Benmore— | |||||||||||||
| Ahuriri Arm | 18.5 | 4.4 | 79 | 7,770 | 340 | 360 | 96 | ||||||
| Main Arm | 29.8 | ||||||||||||
GEOLOGY—The islands of New Zealand are part of the unstable circum-Pacific Mobile Belt. This is a region where volcanoes are active and where the earth's crust has long been buckling and breaking at a geologically rapid rate. The interplay, in the past, of earth movements and erosion has made the sedimentary rocks that cover almost three-quarters of New Zealand. Land areas that the earth movements have raised have been attacked by erosion, and the sand, mud, shingle, and other debris thus formed has been carried away to the sea, where it has accumulated in great thicknesses to form rocks such as sandstone, mudstone, greywacke, and conglomerate; the shells and other skeletons of sea creatures have accumulated to form thick layers of limestone. Many of the sedimentary rocks are in distinct layers called strata. Earth movements have later raised them above the sea to form land, and the strata are in many places tilted and folded by pressure. Seas have advanced and retreated over New Zealand many times and these sedimentary rocks represent almost every geological period since the Cambrian (see Time Scale). Their age is revealed by the shells, foraminifera, and other fossils that they contain.
As well as sedimentary rocks, and volcanic rocks of various ages, New Zealand incorporates in its complex structure schist, gneiss, marble and other metamorphic rocks, and granite, diorite, gabbro, serpentine, and other intrusive igneous rocks. Most of these metamorphic and intrusive rocks are hundreds of millions of years old. They were formed at depth in the earth's crust early in New Zealand's history, in the “roots” of ancient mountain ranges, long ago destroyed, and are visible at the land surface today only because erosion has removed thousands of feet thickness of other rocks that once covered them. The metamorphic rocks developed when huge, elongated sea basins (geosynclines) were formed, in which tens of thousands of feet thickness of sediments accumulated. When these geosynclines were slowly compressed during major mountain-building episodes the deeper sediments were subjected to great pressure and shearing stress, which caused new minerals and structures to develop, changing the sediments into metamorphic rocks. The granites and other intrusive rocks are coarsely crystalline, and are usually considered to have intruded into the outer crust in a molten state during mountain building; some, however, may be the products of an intense metamorphism of sediments.
| GEOLOGICAL TIME-SCALE | |||
|---|---|---|---|
| Eras | Periods | Approximate Time Since Period Began (Years) | |
| Cenozoic | Holocene (Recent) | Quaternary | 10 thousand |
| Pleistocene | 2 million | ||
| Pliocene | 11 “ | ||
| Miocene | Tertiary | 25 “ | |
| Oligocene | 20 “ | ||
| Eocene | 60 “ | ||
| Paleocene | 70 “ | ||
| Mesozoic | Cretaceous | 135 “ | |
| Jurassic | 180 “ | ||
| Triassic | 225 “ | ||
| Paleozoic | Permian | 270 “ | |
| Carboniferous | 350 “ | ||
| Devonian | 400 “ | ||
| Silurian | 440 “ | ||
| Ordovician | 500 “ | ||
| Cambrian | 600 “ | ||
Geological History—Evidence of the earliest-known events in New Zealand's history is given by ancient rocks in Nelson, Westland, and Fiordland that were formed in the early Paleozoic era, perhaps as long as 600 million years ago (some in Westland may be older). They include thick, geosynclinal sedimentary rocks. This suggests that a large land mass existed at that time to yield the great volume of sediments, but little has been deduced about its shape or position.
The history of the later part of the Paleozoic era, and the Mesozoic era, is rather better understood. For a vast span of time from the Carboniferous period—probably until the early Cretaceous period—an extensive geosyncline occupied the New Zealand region. At first, during much of late Paleozoic time, huge quantities of submarine lava and volcanic tuff were included in the materials that accumulated in the geosyncline, but in the later Permian and Mesozoic times the sediments were mainly sand and mud, derived probably from some land west of present New Zealand; they were compacted into hard greywacke (a type of sandstone) and argillite (hard, dark mudstone).
In the early Cretaceous period one of the main mountain-building episodes in New Zealand's history took place. Although geosynclinal sedimentation continued through the Cretaceous period in eastern New Zealand, the geosyncline elsewhere was compressed, and the sediments were intensely crumpled and broken and raised above the sea, probably forming a large, mountainous land mass. Some of the geosynclinal deposits, now exposed over much of Otago, alpine Westland, and parts of Marlborough Sounds, were metamorphosed into schist and gneiss by the tremendous deforming pressures to which the geosyncline was subjected.
The time that has elapsed since the intense folding of the strata in the New Zealand geosyncline in the mid-Cretaceous period may be considered as the later geological history of this country, embracing roughly 100 million years.
During the early part of this late history, erosion slowly wore down the mountains that had risen, producing a land of low relief. Over these worn-down stumps of the Mesozoic mountains the sea gradually advanced, beginning its transgression earlier in some areas than in others. In the early Cretaceous period it began to submerge land in the region of present North Auckland and the eastern margins of the North and South Islands, and thick deposits of mudstone and sandstone accumulated in some parts of these areas. At the close of the Mesozoic era, and in the very early Tertiary, land became so reduced in size and relief that little sediment was formed, and only comparatively thin deposits of fine bentonitic and sulphurous muds, and fine, white, foraminiferal limestone accumulated. In some areas New Zealand's main coal deposits accumulated in swamps on the surface of the old land. These became buried by marine deposits as the sea continued its transgression in the Eocene period.
By the Oligocene period, most of the land was submerged, and in shallow waters free of land sediments, thick deposits of shell and foraminiferal limestone accumulated. (Scattered, remnant patches of this Oligocene limestone furnish most of New Zealand's cement and agricultural lime.)
After the Oligocene submergence earth movements became more vigorous; many ridges rose from the sea as islands, and sank or were worn down again; sea basins formed and rapidly filled with sediments. New Zealand's late Tertiary environment has been described as follows: “The pattern of folds, welts, and troughs that developed was on a finer scale than in the Mesozoic... the land moved up and down as a series of narrow, short, interfingering or branching folds ... we can think of Tertiary New Zealand as an archipelago ... a kind of writhing of part of the mobile Pacific margins seems to have gone on ...”. The thick deposits of soft, grey mudstone and sandstone that now make up large areas of the North Island, and some parts of South Island, are the deposits that accumulated rapidly in the many sea basins, large and small, that developed in the later Tertiary.
Very late in the Cenozoic era—in the Pliocene and Pleistocene periods—one of the greatest episodes of mountain building in New Zealand's history took place. Earth movements became intense, and slowly pushed up the Southern Alps and other main mountain chains, and determined the general shape and size of the present islands of New Zealand. Much of the movement during this mountain building period (the Kaikoura Orogeny) took the form of displacement of blocks of the earth's crust along fractures called faults. The total movements of the earth blocks adjacent to major faults amounted to thousands of feet. It must have been achieved very slowly, probably by innumerable small movements, each of a few inches or feet. The blocks adjacent to “transcurrent” faults moved not only vertically but also laterally along the faults. The New Zealand landscape today in some regions shows well preserved tilted fault blocks bounded by fault-scarps—steep faces hundreds or even thousands of feet high. Fault movements continue to the present day, and have accompanied several major earthquakes of the past century. Many minor but revealing landscape features such as scarplets, fault ponds, and shutter ridges show where movement has been occurring in recent centuries.
Erosion during this time has eaten into the major landscape forms that the earth movements have built, carving detailed landscape pattern of peaks, ridges, valleys, and gorges, and has built up alluvial plains, shingle fans, and other construction forms. At the coast, waves have driven back the headlands and built beaches, splits, and bars. The Pleistocene period was the time of the Ice Age, and in the high mountains of the South Island glaciers carved deep valleys and carried huge loads of rock, dumping them as moraines. The late Pleistocene glaciers carved the fiords of Fiordland and the basins occupied by most South Island lakes; there were small glaciers also on Ruapehu, where remnants survive, and on Mount Egmont and the Tararua Range.
Volcanic activity of the past few million years has played an important part in making the rocks and shaping the landscape of parts of the central and northern North Island. Banks Peninsula, a twin volcanic dome in Canterbury, achieved much of its growth then. The largest volcanic outpourings of late geological times in New Zealand have been in the region between Tongariro National Park and the Bay of Plenty Coast: andesite lava, scoria, and ash were erupted in the Pleistocene period and later to build the huge volcanoes, Ruapehu, Tongariro, and Ngauruhoe. More than 8,000 cu km of molten rhyolitic magma was erupted in the form of ignimbrite, pumice, and rhyolite lava, building up the Volcanic Plateau. This is one of the largest and youngest accumulations of acid volcanic rocks in the world.
Mount Egmont is a huge, conical, andesite volcano, with the remnants of two other volcanic cones nearby; all are of Pleistocene age. In the Waikato there are eroded Pleistocene cones of approximately basic andesite composition. The largest is Pirongia, some 900 m high. Auckland city and the area immediately to the south has been the scene of many eruptions of basalt lava and scoria in late Pleistocene and Holocene times; and many small scoria cones can be seen in the locality. Lafau Tertiary and Quaternary basaltic eruptions in North Auckland have built lava plateaus and many young cones.
Geological maps and an accompanying description were included in issues of the Official Yearbook up to 1971, and are also included in An Encyclopaedia of New Zealand.
A Descriptive Atlas of New Zealand contains geological maps of New Zealand and summaries of New Zealand's geology and landscape development. New Zealand Geological Survey Bulletin 66, the Geological Map of New Zealand, 1:2,000,000, is a lengthier summary with a more detailed geological map and cross sections.
EARTHQUAKES: Geophysical Background—An earthquake occurs when energy is suddenly released from a volume of rock within the earth's outerlayers, and is radiated outwards in the form of elastic waves that can be felt at places near the origin, and detected by sensitive instruments at greater distances. Earthquakes are most common in certain geographically limited regions, one of which includes New Zealand. Within these disturbed zones, young fold mountains, oceanic trenches, volcanoes, anomalies in the earth's gravitational field, and active geological faulting are also usual, and like the earthquakes have their ultimate cause in the internal processes incidental to the major structural development of the earth, and as yet imperfectly understood.
The seismically active zones define the margins of a system of stable blocks or plates which are not completely inactive, but experience large earthquakes only infrequently, and are thought to be the primary units of the earth's crust. Two of these units, the Pacific and Indian Plates, abut in the vicinity of New Zealand, forming a triple junction with a third, the Antarctic Plate, south of Macquarie Island. As a result of thermally generated convective movements in the deeper levels of the earth, relative displacement of the plates is occurring, and this provides the continuing source of the energy that is intermittently released as earthquakes.
Instrumental records have shown that at the time of an earthquake large shearing movements take place at the source. It seems probable that all major earthquakes are the result of the breakage of rock under strain, but other factors such as the presence or absence of liquid in the pores and fractures of the rock are also of primary importance in determining the time and place at which a shock occurs.
In large shallow earthquakes a rupture may appear at the surface, forming or renewing movement on a geological fault. In regions where the majority of earthquakes are very shallow, such as California, there is a tendency for the earthquake origins to cluster near geological fault traces, but in regions where there is deeper activity, such as New Zealand, this is not so. For example, there is little activity near the Alpine Fault, which stretches for some 500 km from Milford Sound to Lake Rotoiti, and is considered one of the world's largest and most active faults. Conversely, instances of fault movement that have not been accompanied by earthquakes are known. Practical assessments of earthquake risk must therefore be based upon the statistics of known earthquake distribution, and the broader geological setting of the origins.
New Zealand Seismicity—Compared with some other parts of the Pacific margin, such as Japan, Chile, and the Philippines, the level of seismic activity in New Zealand is moderate. It may be roughly compared with that prevailing in California. A shock of Richter magnitude 6 or above occurs on the average about once a year, one of the magnitude 7 or above once in ten years, and one of about magnitude 8 perhaps once a century, but in historic times only one shock (the south-west Wairarapa earthquake in 1855) is known to have approached this magnitude.
Other natural disasters and accidents are together responsible for more casualties than earthquakes, the most serious seismic disasters in New Zealand having been the Hawke's Bay earthquake of 1931 in which 255 deaths occurred, and the Buller earthquake of 1929 in which there were 17. The total resulting from all other shocks since 1840 is less than 15. The last earthquake to cause deaths occurred at Inangahua in 1968, when 3 people died.
Regarded broadly, the zone of seismicity within which New Zealand lies extends continuously from the triple junction south of Macquarie Island to Samoa. When looked at more closely, breaks in continuity and changes in the character of the activity become apparent. There are changes in direction, in the positional relationship of the deeper and shallower activity, and in its association with the other geophysical and geological features of the region.
Within New Zealand itself, at least two separate systems of seismic activity can be distinguished. The main seismic region, which is the larger, covers the whole of the North Island apart from the Northland peninsula, and the South Island north of a line passing roughly between Banks Peninsula and Cape Foulwind. The southern, or Fiordland seismic region includes southern Westland, western Southland, and western Otago. Less clearly defined activity covers the remainder of the two main islands, and extends eastwards from Banks Peninsula to include the Chatham Islands.
Shallow earthquakes, which are the most numerous, originate within the earth's crust, which in New Zealand has an average thickness of some 35 km. These shocks are responsible for almost all damage to property, and now and in the past they have been widely scattered throughout the country. In historically recent times, the main and Fiordland seismic regions have been significantly more active than the rest of New Zealand, but neither the central seismic region that lies between them nor the Northland peninsula has been free from damaging shocks. The details of the present pattern are not necessarily unchanging, and could alter significantly after the occurrence of a major earthquake. Because of this, because of the broader geophysical setting, and because of the distance to which the effects of a large earthquake extends, it would be highly imprudent to treat any part of New Zealand as free from the risk of serious earthquake damage.
Many active regions of the earth have only shallow earthquakes, but in others shocks have been known to occur at depths as great as 700 km below the surface. It is thought that these deep shocks originate within the edges of crustal plates that have been drawn down or thrust beneath their neighbours. Such deep events are common in both the main and Fiordland seismic regions of New Zealand, but their relative positions with respect to the shallow activity and to other geophysical features are rough mirror images. This is believed to indicate that in the North Island, the edge of the Pacific Plate lies below that of the Indian Plate, while in the south of the South Island the Pacific Plate is uppermost and the Indian Plate has been thrust beneath it.
The most important system of deep shocks in New Zealand lies in a well-defined zone beneath the main seismic region, stretching from the Bay of Plenty to Nelson and Marlborough. The maximum depth of occurrence at the northern end is about 400 km, and decreases smoothly to merge with the shallow activity before the southern boundary of the region is reached. Along the whole of the system, there is also a decrease in maximum depth from west to east. In northern Taranaki, near the western limit of this activity, a small isolated group of shocks at a depth of about 600 km has also been recorded. In the central seismic region only shallow shocks are known.
The maximum depth of the earthquakes in the Fiordland region appears to be only about 160 km, but it is only recently that instrumental coverage has been adequate for a proper study of this area. Here, the deep activity is more concentrated than in the north, lying close to Lakes Te Anau and Manapouri.
Both earthquakes and volcanoes are found in geophysically disturbed regions, but although small earthquakes usually accompany volcanic eruptions, large ones are rare. Regions of active volcanism are also subject to periodic outbreaks of small earthquakes, all of similar magnitude, and very numerous. These events are known as “earthquake swarms”. Although the number of shocks may cause alarm, it is unusual for even minor damage to result. There is not often a simultaneous volcanic outbreak, but swarms do not seem to occur in non-volcanic regions. In New Zealand they have occurred in the volcanic zone that includes Mt. Ruapehu and White Island, in the Coromandel Peninsula, in parts of Northland, and near Mt. Egmont.
Seismological Observatory—Each year the Seismological Observatory, Wellington, a section of the Geophysics Division of the Department of Scientific and Industrial Research, publishes the analyses of several hundred earthquakes originating in the New Zealand region, using data obtained from its own network of recording stations, and from stations in other countries. The instrumental data are supplemented by information about felt effects, supplied by a large number of voluntary observers, who complete a standard questionnaire.
The network of recording stations controlled by the Observatory is now one of the world's largest and most extended, covering the main islands of New Zealand, a large part of the south-west Pacific, and the Ross Dependency. The 36 permanent stations now operating are:
Apia and Afiamalu (Western Samoa); Nadi (Fiji); Niue; Rarotonga (Cook Islands); Raoul Island (Kermadecs); Cape Reinga, Onerahi, Great Barrier, Auckland, East Cape, Karapiro, Whakatane, Gisborne, Wairakei, Tuai, Tarata, Chateau, Taradale, Mangahao, Castlepoint, Cobb River, Wellington, Kaikoura West, Kaimata, Christchurch, Gebbies Pass, Chatham Islands, Mount John, Milford Sound, Oamaru, Roxburgh, Monowai, Waipapa Point; Campbell Island; Scott Base (Antarctica).
At Afiamalu, Rarotonga, Wellington, and Scott Base the equipment includes instruments of internationally standardised pattern designed to record both local and distant activity. The stations at Karapiro and Roxburgh are also equipped to record both local and distant shocks. At the other stations, many of which record more than one component of the ground motion, the instruments are primarily intended for the study of shocks within about 1000 km.
Scott Base and several of the island stations provide preliminary reading by radio, but all final analyses are made at the Observatory in Wellington. Portable equipment is available for more intensive study of aftershock sequences, earthquake swarms, and micro-earthquakes, and for other research projects. In addition, the department's physics and engineering laboratory maintains a network of strong motion recorders intended to provide data on large shocks for engineering purposes.
The information collected and published by the Observatory covers all significant earthquakes in the New Zealand region. It is made freely available to the public and the press, as well as to seismologists, engineers, and other specialists. In addition, a very large number of distant earthquakes are recorded, and readings of these, as well as of the local activity, are regularly sent to international agencies and to overseas seismologists who have a need for them. The Observatory itself carries out a vigorous programme of research into problems of seismicity and earthquake mechanism, and into the structure and constitution of the earth's crust and its deep interior.
Earthquakes During 1974—For the first time since 1968 a shallow earthquake in the New Zealand region attained a magnitude of 6 (Richter scale). This shock occurred on the evening of 5 November 1974, about 20 km off the Taranaki coast near Opunake, where some minor damage occurred. The shock was felt throughout Taranaki and as far afield as Waikato, Wellington, and the north of the South Island. The main shock was followed by numerous aftershocks the largest, of magnitude 5 1/2, occurring a quarter of an hour later.
The largest earthquake in the South Island was a shallow shock near Milford Sound on the morning of 21 September. Its magnitude was 5.9 and its main aftershock, during the early evening of the same day, was almost as large. The main earthquake was felt in Dunedin and coastal Otago, and throughout the south of the South Island. Felt reports of this earthquake were confused by the occurrence, three minutes later, of an unrelated shock of magnitude 5.2 centred about 30 km to the north-west of Christchurch. This earthquake was felt strongly in the Christchurch area, and there was some difficulty in distinguishing between the effects of the two events.
The most damaging earthquake of the year originated a few kilometres south of Dunedin in the early evening of 9 April. Its magnitude was only 5.0, but its closeness to the city and its shallow depth resulted in damage to nearly 2,000 chimneys, and threw goods from shelves in many shops and houses. The Earthquake and War Damage Commission estimated the cost of the damage at about $250,000, more than for any other New Zealand earthquake since the major Inangahua earthquake in 1968. An interesting feature of the Dunedin earthquake was the variation of its effects in parts of the city, because of differences in the type of underlying ground. The shaking was significantly greater in the low-lying alluvial parts of the city, compared with that on the firmer rock of the surrounding hills.
Early in March, a series of shallow earthquakes occurred in the western Bay of Plenty, about 200 km east of Auckland. They were widely felt in the Auckland district, but resulted in only scattered minor damage. The largest of the series, of magnitude 5.6, took place in the early morning of 1 March, and during the next 3 days six other shocks reached a magnitude of 5 or more. Analysis of the records shows that these earthquakes were richer than usual in long-period energy, and that consequently their effects upon tall buildings would be more severe than upon ordinary dwellings.
There were no particularly large deep earthquakes during the year. One, 100 km deep below the Taupo region on 24 June, had a magnitude of 5.1, and was felt between Taupo and Wellington.
The only earthquakes in the volcanic regions that attracted attention were a swarm of small shocks near Rotorua on the morning of 10 January. Nine confirmed shocks were felt between 6 and 7 a.m., with magnitudes ranging from about 2 1/2 to 3 1/2.
Volcanic activity has been mainly confined to Mt. Ngauruhoe, which was active in January and March. On 26 and 28 January pyroclastic avalanches were produced, which flowed down gullies on the northern and western slopes of the mountain. The principal eruption on 28 March was a spectacular ash and gas discharge, unequalled since the 1954 eruptions. This activity was accompanied by only minor earthquakes.
WEATHER INFORMATION—The collection of weather information and the provision of weather forecasts and climatic data for diverse interests in aviation, shipping, agriculture, Government departments, and the general public are functions of the New Zealand Meteorological Service. By arrangement with the administrations concerned the Service performs similar functions for British territories in the Pacific.
Weather reports for use in forecasting are made at about 140 places within New Zealand and 35 in the Pacific islands and are sent by telegraph and radio, along with measurements of winds at upper levels made at 10 radio wind stations, and of temperatures made at 9 radiosonde stations. Daily observations are made for climatological purposes at about 280 places in New Zealand and 60 in the islands. Rainfall measurements are made at a total of about 2,400 places within New Zealand and 120 outside the country.
Detailed climatological statistics are published annually by the New Zealand Meteorological Service in the Meteorological Observations and in Rainfall Observations. Current statistics appear monthly in the New Zealand Gazette.
CLIMATE—Situated between 34°S and 47°S the main islands lie within the broad belt of strong westerly winds which encircles the hemisphere south of about latitude 35°S. Just to the north is the high-pressure ridge of the subtropics from which barometric pressure decreases southwards over New Zealand to the deep low-pressure trough located near latitude 70°S.
The weather pattern from day to day is dominated by a succession of anticyclones, separated by troughs of low pressure, which pass more or less regularly from west to east across the Australia-Tasman Sea - New Zealand area and beyond. In this region there is no semi-permanent anticyclone such as those found in similar latitudes over the Indian Ocean and eastern Pacific Ocean respectively. The troughs normally have a north-west to south-east orientation and are associated with deep depressions centred far to the south. A typical weather sequence commences with a low-pressure trough approaching from the west. Freshening north-westerly winds prevail with increasing cloud followed by rain for a period during which winds may reach gale force. The passage of the trough with its associated cold front, is accompanied by a change to cold south-westerly or southerly winds and showery weather, occasionally with some hail and thunder. Barometers then rise with the approach of the next anticyclone from the west. Winds moderate and fair weather prevails for a few days as the anticyclone moves across the country.
While the sequence just described is very common the situation is frequently much more complex. The troughs are very unstable systems where depressions readily form, some of which develop into vigorous storms that may pass over New Zealand at any time of the year. Occasionally in summer a cyclonic storm of tropical origin passes over or near New Zealand accompanied by gales and heavy rain affecting mainly northern and eastern districts of the North Island. The anticyclones vary in size, intensity, and rate of movement. Their centres, on the average, follow a track across the North Island but individual centres may pass either north or south of the country, the more northerly tracks being favoured in spring and the southerly tracks in autumn. At times when little development occurs within the troughs the anticyclones follow each other at intervals of about 6-7 days.
The other main factors which influence the climate of New Zealand are first, its position in the midst of a vast ocean, and second, the shape and topography of the country itself.
Hot air masses from the interior of Australia in summer or freezing air masses from the Antarctic, which occasionally reach New Zealand, retain little of their original character after their long ocean passage. Thus, there is an absence of extreme variations of temperature. On the other hand, since abundant supplies of moisture are supplied by evaporation from the ocean, and depressions are frequent and vigorous, the average precipitation is high.
The chain of high mountains, which extends from south-west to north-east through the length of the country, rises as a formidable barrier in the path of the prevailing westerly winds. The effect is to produce much sharper climatic contrasts from west to east than in the north-south direction. In some inland areas of the South Island just east of the mountains the climate is distinctly continental in character, despite the fact that no part of New Zealand is more than 80 miles from the sea.
Winds—Winds from a westerly quarter prevail in all seasons, with a general tendency to increase in strength from north to south. However, considerable local modifications to the general air flow occur during its passage across the mountainous terrain. Approaching the main ranges the flow from the west turns towards the north-east and on descending on the eastern side swings towards the south-east. This results in an increased number of south-westerlies in Westland and a predominance of north-westerlies in inland districts of Otago and Canterbury where strong gales from this quarter occur at times in the late spring and summer. Daytime sea breezes usually extend from the coast inland for 30 km or more during periods of settled weather in summer. On the Canterbury coast the wind comes most frequently from the north-east, partly because there is a persistent sea breeze from this quarter, but south of Dunedin south-westerlies predominate. Cook Strait, the only substantial gap in the main mountain chain, acts as a natural funnel for the air flow and is a particularly windy locality afflicted by gales from the south-east as well as the north-west, This “funnel” effect is also in evidence about Foveaux Strait. North of Taranaki the general air flow is more from the south-west, and there is a noticeable reduction of windiness in the summer.
An indication of the variation in the frequency of strong winds from summer to winter, and in different parts of the country, is given in the next table. These figures were all obtained by the use of anemographs at airports (except for Auckland where the site is at Mechanics Bay).
| Station | Average Number of Days with Gusts Reaching | Years of Data | |||||
|---|---|---|---|---|---|---|---|
| 40 mph or More | 60 mph or More | ||||||
| Nov-Apr | May-Oct | Year | Nov-Apr | May-Oct | Year | ||
| Kaitaia | 16 | 32 | 48 | 0.7 | 1.6 | 2.3 | 21 |
| Whangarei | 16 | 26 | 42 | 0.8 | 1.4 | 2.2 | 8 |
| Auckland | 20 | 28 | 48 | 0.9 | 1.6 | 2.5 | 24 |
| Tauranga | 15 | 23 | 38 | 0.5 | 0.7 | 1.2 | 22 |
| Rotorua | 11 | 16 | 27 | 0.3 | 0.2 | 0.5 | 9 |
| Hamilton | 9 | 13 | 22 | - | 0.6 | 0.6 | 8 |
| Gisborne | 21 | 27 | 48 | 0.4 | 0.9 | 1.3 | 29 |
| New Plymouth | 33 | 48 | 81 | 2.1 | 4.7 | 6.8 | 22 |
| Napier | 17 | 21 | 38 | 0.6 | 0.5 | 1.1 | 23 |
| Wanganui | 37 | 42 | 79 | 2.7 | 4.4 | 7.1 | 16 |
| Palmerston North | 26 | 22 | 48 | 1.1 | 0.8 | 1.9 | 18 |
| Wellington | 90 | 98 | 188 | 18.8 | 22.7 | 41.5 | 8 |
| Nelson | 20 | 14 | 34 | 0.5 | 0.3 | 0.8 | 30 |
| Blenheim | 23 | 15 | 38 | 0.7 | 0.5 | 1.2 | 30 |
| Westport | 14 | 20 | 34 | 0.4 | 1.0 | 1.4 | 23 |
| Hokitika | 14 | 20 | 34 | 0.3 | 1.3 | 1.6 | 8 |
| Christchurch | 31 | 23 | 54 | 1.5 | 1.3 | 2.8 | 29 |
| Timaru | 15 | 12 | 27 | 0.7 | 0.6 | 1.3 | 15 |
| Dunedin | 28 | 32 | 60 | 2.6 | 2.8 | 5.4 | 11 |
| Gore | 29 | 20 | 49 | 0.9 | - | 0.9 | 5 |
| Invercargill | 53 | 45 | 98 | 5.8 | 5.0 | 10.8 | 27 |
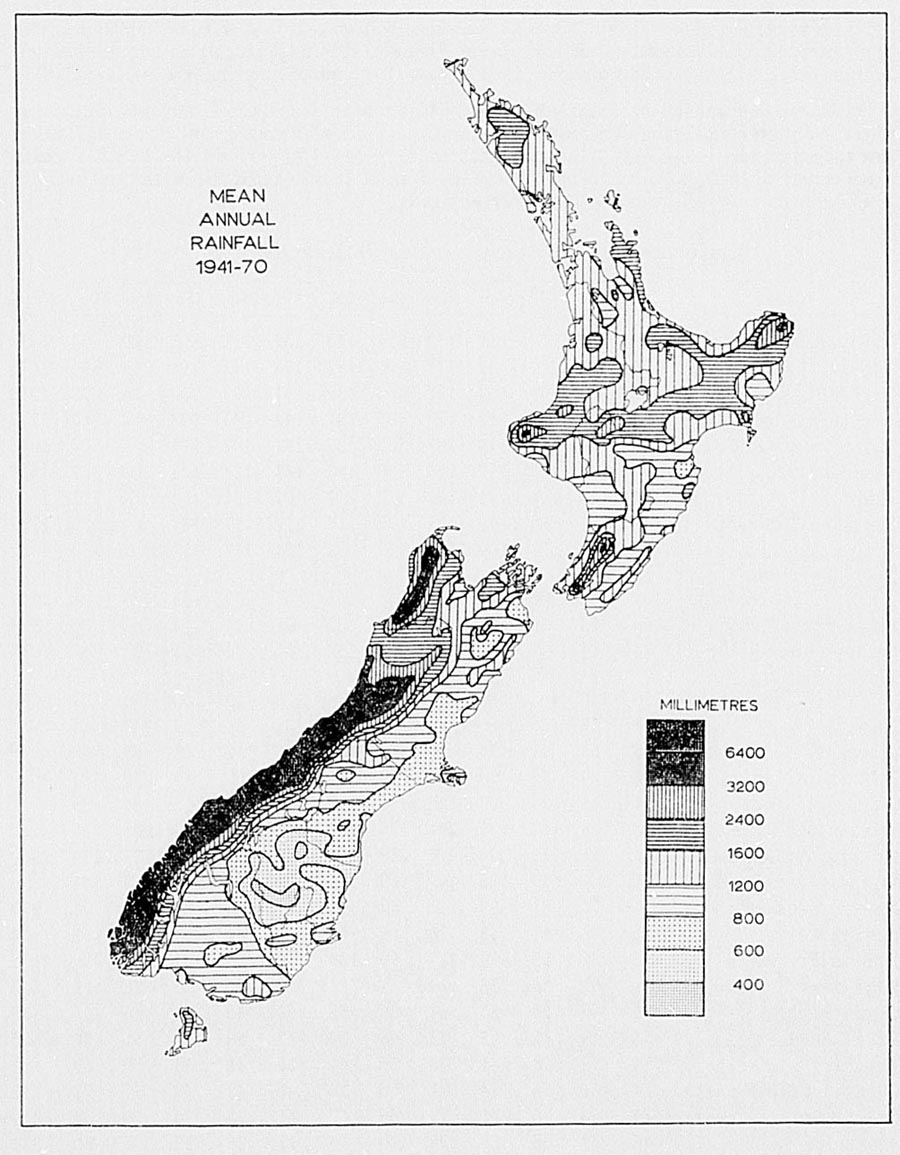
Rainfall—The distribution of rainfall is mainly controlled by mountain features, and the highest rainfalls occur where the mountains are exposed to the direct sweep of the westerly and north-westerly winds. The mean annual rainfall (see map) ranges from as little as 300 mm in a small area of Central Otago to over 7000 mm in the Southern Alps. The average for the whole country is high, but for the greater part it lies between 600 and 1500 mm, a range regarded as favourable for plant growth in the temperate zone. The only areas with under 600 mm are found in the South Island to the east of the main ranges. These include most of central and north Otago, and South Canterbury. In the North Island, the driest areas are central and southern Hawke's Bay, Wairarapa, and Manawatu where the average rainfall is 700-1000 mm a year. Of the remainder, much valuable farm land, chiefly in northern Taranaki and Northland, has upwards of 1500 mm. Over a considerable area of both Islands rainfall exceeds 2500 mm a year but, with the exception of Westland, this is mountainous and unoccupied, much of it being forest-covered.
For a large part of the country the rainfall is spread evenly through the year. The greatest contrast is found in the north, where winter has almost twice as much rain as summer. This predominance of winter rainfall diminishes southwards. It is still discernible over the northern part of the South Island but, over the southern half, winter is the season with least rainfall, and a definite summer maximum is found inland due to the effect of convectional showers. The rainfall is also influenced by seasonal variations in the strength of the westerly winds. Spring rainfall is increased in and west of the ranges as the westerlies rise to their maximum about October, while a complementary decrease occurs at the same time in the lee of the ranges.
Areas which are exposed to the west and south-west experience much showery weather, and rain falls on roughly half the days of the year. Over most of the North Island there are at least 150 rain days (days with at least 0.2 mm of rain) a year except to the east of the ranges where there are, in places, fewer than 125 rain days. Those areas of the South Island with annual rainfall under 600 mm generally have about 100 rain days a year. In the far south the frequency of rain increases sharply; in Stewart Island and Fiordland rain days exceed 200 a year. Over most of the country between 55 and 65 percent of the rain days also qualify as wet days (2.5 mm or more). The percentage increases to over 70 in Westland, but in the low rainfall area of inland Otago there are only about 40 wet days a year compared with 100 rain days.
On the whole the seasonal rainfall does not vary greatly from year to year, the reliability in spring being particularly advantageous for agricultural purposes. It is least reliable in late summer and autumn, when very dry conditions may develop east of the ranges, particularly in Hawke's Bay.
The highest daily rainfall on record is 582 mm which occurred at Rapid Creek, Hokitika Catchment, where the mean annual rainfall exceeds 6000 mm. Other areas with considerably lower rainfall are also subject to very heavy daily falls; such areas are to be found in northern Hawke's Bay and in north-eastern districts of the Auckland Province. By contrast, in the Manawatu district and in Otago and Southland daily falls reaching 80 mm are very rare.
| NORMAL MONTHLY AND ANNUAL RAINFALL (MILLIMETRES)* (1941-70) | |||||||||||||
|---|---|---|---|---|---|---|---|---|---|---|---|---|---|
| Station | Jan | Feb | Mar | Apr | May | Jun | Jul | Aug | Sep | Oct | Nov | Dec | Year |
| *25 millimetres equal 1 inch. | |||||||||||||
| Kaitaia Aerodrome | 79 | 94 | 84 | 119 | 152 | 157 | 150 | 165 | 122 | 112 | 102 | 94 | 1,430 |
| Kerikeri | 76 | 124 | 112 | 142 | 178 | 178 | 183 | 196 | 142 | 114 | 99 | 104 | 1,648 |
| Dargaville | 66 | 84 | 79 | 104 | 132 | 150 | 132 | 137 | 97 | 109 | 84 | 79 | 1,253 |
| Auckland (Albert Park) | 64 | 94 | 86 | 114 | 127 | 135 | 37 | 142 | 94 | 107 | 84 | 84 | 1,268 |
| Tauranga Aerodrome | 84 | 84 | 114 | 114 | 137 | 132 | 137 | 137 | 107 | 114 | 84 | 104 | 348 |
| Rotorua | 99 | 114 | 117 | 117 | 150 | 150 | 142 | 137 | 127 | 122 | 104 | 132 | 1,511 |
| Taupo | 81 | 94 | 76 | 91 | 109 | 122 | 117 | 109 | 84 | 102 | 84 | 112 | 1,199 |
| Hamilton (Ruakura) | 71 | 81 | 84 | 99 | 112 | 132 | 117 | 117 | 97 | 107 | 91 | 89 | 1,197 |
| Taumarunui | 89 | 99 | 84 | 109 | 132 | 152 | 135 | 124 | 117 | 137 | 124 | 130 | 1,432 |
| New Plymouth Aerodrome | 107 | 102 | 102 | 117 | 163 | 168 | 163 | 147 | 112 | 135 | 117 | 132 | 1,565 |
| Masterton (Waingawa) | 64 | 58 | 76 | 71 | 102 | 107 | 102 | 91 | 74 | 74 | 69 | 76 | 964 |
| Gisborne Aerodrome | 74 | 61 | 91 | 91 | 109 | 112 | 112 | 117 | 74 | 71 | 58 | 64 | 1,034 |
| Waikaremoana (Onepoto) | 150 | 140 | 168 | 180 | 211 | 188 | 198 | 226 | 150 | 150 | 147 | 152 | 2,060 |
| Napier | 51 | 58 | 66 | 61 | 84 | 89 | 79 | 81 | 51 | 53 | 43 | 64 | 780 |
| Wanganui | 69 | 64 | 61 | 74 | 86 | 91 | 81 | 76 | 58 | 81 | 69 | 89 | 899 |
| Palmerston North | 84 | 69 | 74 | 74 | 86 | 99 | 91 | 84 | 69 | 89 | 79 | 104 | 1,002 |
| Wellington (Kelburn) | 81 | 84 | 94 | 97 | 132 | 135 | 140 | 124 | 102 | 112 | 84 | 86 | 1,271 |
| Westport Aerodrome | 155 | 168 | 157 | 191 | 201 | 188 | 183 | 170 | 170 | 183 | 201 | 185 | 2,152 |
| Hokitika Aerodrome | 231 | 251 | 239 | 234 | 272 | 229 | 241 | 236 | 239 | 257 | 277 | 234 | 2,940 |
| Milford Sound | 531 | 569 | 630 | 526 | 483 | 419 | 378 | 424 | 538 | 546 | 638 | 554 | 6,236, |
| Nelson Aerodrome | 74 | 74 | 81 | 89 | 112 | 79 | 91 | 94 | 76 | 81 | 74 | 74 | 999 |
| Blenheim | 51 | 43 | 51 | 53 | 76 | 58 | 66 | 61 | 53 | 53 | 48 | 51 | 664 |
| Hanmer Forest | 86 | 81 | 91 | 99 | 117 | 99 | 104 | 114 | 89 | 97 | 89 | 99 | 1,165 |
| Lake Coleridge | 61 | 61 | 58 | 76 | 79 | 71 | 81 | 79 | 74 | 76 | 76 | 71 | 863 |
| Christchurch | 51 | 46 | 58 | 58 | 84 | 56 | 58 | 53 | 46 | 46 | 46 | 56 | 658 |
| Lake Tekapo | 51 | 43 | 48 | 53 | 53 | 48 | 53 | 48 | 56 | 51 | 51 | 51 | 606 |
| Timaru | 58 | 58 | 58 | 48 | 48 | 36 | 41 | 38 | 41 | 48 | 58 | 69 | 601 |
| Dunedin (Musselburgh) | 74 | 61 | 76 | 74 | 71 | 66 | 56 | 46 | 48 | 58 | 71 | 71 | 772 |
| Queenstown | 74 | 66 | 76 | 71 | 79 | 66 | 64 | 61 | 76 | 76 | 76 | 64 | 849 |
| Alexandra | 46 | 38 | 38 | 28 | 28 | 20 | 15 | 15 | 20 | 28 | 33 | 30 | 339 |
| Gore | 76 | 69 | 76 | 79 | 76 | 79 | 56 | 48 | 53 | 69 | 81 | 79 | 841 |
| Invercargill Aerodrome | 89 | 79 | 94 | 104 | 91 | 107 | 69 | 66 | 74 | 86 | 94 | 89 | 1,042 |
Thunderstorms—Thunderstorms are not numerous. Their frequency is greatest in the north and west where thunder is heard on 15 to 20 days a year; east of the ranges (except in Gisborne) the figure is five or less.
Hail—Hail is most frequent in the south-west where it is reported on about 20 days a year, but for the greater part of the country it occurs on about 5 days a year or less. Most of the hailstones are small, but occasionally large stones cause local damage to glasshouses, and to orchards and market gardens, chiefly in Canterbury and Hawke's Bay.
Temperature—Mean temperatures at sea level decrease steadily southwards from 15°C in the far north to 12°C about Cook Strait, then to 9°C in the south. With increasing altitude, temperatures drop about 2°C per 300 m. January and February, with approximately the same mean temperature, are the warmest months of the year; July is the coldest. Some temperature statistics for selected places are included in the table on climatological averages. Highest temperatures are recorded east of the main ranges, where they exceed 30°C on a few afternoons in most summers, usually in association with a north-westerly Föhn wind. The extremes for New Zealand (measured in a standard thermometer screen) are 42°C, which has been recorded in three places: Jordan (Marlborough), Christchurch, and Rangiora (Canterbury); and -19°C Ophir (Central Otago).
As is to be expected, there is a small annual range of temperature (difference between mean temperature of the warmest and coldest months). In Northland and in western districts of both Islands the annual range is about 8°C. For the remainder of the North Island, and east coast districts of the South Island, it is 9°-10°C. Further inland it exceeds 11°C in places, reaching a maximum of 14°C in Central Otago where there is an approach to a continental type of climate.
Temperatures in the preceding paragraphs are recorded on the Celsius scale (formerly called centigrade), and not the Fahrenheit scale. The degree Celsius (°C) equals 5/9 (°F-32).
Frost—It is well known that local variations in frostiness are considerable, even within quite small areas. On a calm, clear night the cold air in contact with a sloping surface gravitates slowly downhill to collect in valleys and depressions, and it is these “Katabatic” drifts which are mainly responsible for local temperature variations at night. Gently sloping ground with a northerly aspect tends to be least affected by frost. Favourable sites in coastal areas of Northland are free of frost, although further inland light frosts occur frequently in the winter months. At Albert Park, Auckland, the screen minimum thermometer (1 m above the ground) has registered below 0°C only once in 65 years, yet up the harbour at Whenuapai Aerodrome there arc eight screen frosts per annum on the average. Excluding the uninhabited mountainous areas, the most severe winter conditions are experienced in Central Otago and the Mackenzie Plains of inland Canterbury, and on the central plateau of the North Island. Even in these areas night temperatures as low as -12°C are rarely recorded. Elsewhere over the North Island the winters are very mild and pastures maintain continuous growth. In both Islands sheep and cattle remain in the open all the year round.
Snow—The majority of New Zealanders rarely see snow except on the mountains. The North Island has a small permanent snow field above 2,500 m on the central plateau, but the snow line rarely descends below 600 m even for brief periods in winter. In the South Island snow falls on a few days a year in eastern coastal districts, and in some years may lie for a day or two even at sea level. In Westland it does not lie at sea level. The snow line on the Southern Alps is around 2,000 m in summer, being slightly lower on the western side where the Franz Josef and Fox Glaciers descend through heavy bush to within 300 m of sea level. In inland Canterbury and Otago, where there are considerable areas of grazing lands above 300 m, snowfalls are heavier and more persistent and have caused serious losses of sheep during severe winters in the past. However, only rarely does the winter snow line there remain permanently below 1,000 m.
Relative Humidity—Humidity is commonly between 70 and 80 percent in coastal areas and about 10 percent lower inland. It varies inversely to the temperature, falling to a minimum in the early afternoon when temperature is highest and frequently lying between 90 and 100 percent during clear nights. As the following table shows, the diurnal variation is greater than the difference between summer and winter.
| Station | Mean Relative Humidity | |||
|---|---|---|---|---|
| January | July | |||
| 3 a.m. | 3 p.m. | 3 a.m. | 3 p.m. | |
| percent | ||||
| Auckland (Mechanics Bay) | 85 | 63 | 90 | 74 |
| Gisborne | 85 | 57 | 87 | 69 |
| Ohakea Aerodrome | 87 | 62 | 89 | 72 |
| Wellington | 89 | 71 | 87 | 77 |
| Christchurch | 83 | 57 | 88 | 70 |
| Hokitika | 94 | 76 | 87 | 70 |
| Invercargill | 87 | 68 | 90 | 77 |
Very low humidity—from 30 percent down to about 5 percent—occurs at times in the lee of the Southern Alps where the Fohn effect is often very marked. In summer the hot, dry “Canterbury Nor'-wester” is generally a most unpleasant wind. Cool south-westerlies are also at times very dry when they reach eastern districts. In Northland the humid mid-summer conditions are inclined to be rather oppressive though temperatures rarely reach 30°C. Dull, humid spells arc generally not prolonged anywhere, but their frequency shows a marked increase in the south.
Sunshine—The sunniest places are near Blenheim, the Nelson-Motueka area, and Whakatane, where the average duration of bright sunshine exceeds 2,400 hours a year. The rest of the Bay of Plenty and Napier are only slightly less sunny. A large portion of the country is favoured with at least 2,000 hours. Even Westland, despite its high rainfall, has 1,800 hours. Southland, where sunshine drops sharply to 1,700 hours a year, lies on the northern fringe of a broad zone of increasing cloudiness. Four hundred miles further to the south at Campbell Island the sunshine has the extremely low value of 650 hours a year. A pleasant feature of the New Zealand climate is the high proportion of sunshine during the winter months. To eliminate the effect of varying day-length the summer and winter sunshine at a few selected stations has been expressed as a percentage of the possible sunshine.
| Station | Summer | Winter |
|---|---|---|
| percent | ||
| Auckland | 51 | 44 |
| Hamilton | 52 | 44 |
| New Plymouth | 53 | 47 |
| Napier | 57 | 52 |
| Wellington | 52 | 42 |
| Nelson | 58 | 57 |
| Hokitika | 43 | 44 |
| Christchurch | 46 | 45 |
| Dunedin | 41 | 43 |
| Invercargill | 42 | 35 |
As these figures indicate, there is a marked increase in cloudiness in the North Island in winter, but little seasonal change in the South Island, except in Southland.
Climatological Averages—The following table provides a brief summary of the main climatological elements for selected locations.
| Station | Annual Averages | Air Temperatures (Degrees Celsius) | ||||||||||
|---|---|---|---|---|---|---|---|---|---|---|---|---|
| Altitude (metres) | Rain Days (0.2 mm or More) | Wet Days (2.5 mm or More)* | Bright Sunshine (Hrs) | Days of Screen Frost (min. air temp, less than 0°C) | Mean Temp. | Mean Daily Maximum | Mean Daily Minimum | Mean Annual | ||||
| Jan | Jul | Jan | Jul | Maximum | Minimum | |||||||
| *2.5 mm equals 0.10 in. | ||||||||||||
| Kaitaia Airport | 80 | 138 | 103 | 2,108 | 0 | 15.3 | 24 | 15 | 15 | 8 | 28 | 2 |
| Kerikeri | 73 | 135 | 101 | 2,011 | 1 | 14.7 | 25 | 15 | 13 | 6 | 29 | 0 |
| Dargaville | 20 | 147 | 108 | 1,948 | 3 | 14.3 | 23 | 15 | 14 | 6 | 29 | -2 |
| Auckland (Albert Park) | 49 | 140 | 102 | 2,102 | 0 | 15.3 | 23 | 14 | 16 | 8 | 27 | 3 |
| Tauranga Airport | 4 | 118 | 90 | 2,297 | 8 | 14.0 | 24 | 14 | 13 | 5 | 29 | -2 |
| Hamilton (Ruakura) | 40 | 131 | 99 | 2,003 | 17 | 13.0 | 24 | 13 | 12 | 3 | 29 | -5 |
| Rotorua | 307 | 123 | 97 | 1,972 | 25 | 12.1 | 23 | 12 | 12 | 3 | 29 | -3 |
| Gisborne Airport | 4 | 113 | 81 | 2,215 | 6 | 13.8 | 24 | 14 | 13 | 4 | 32 | -2 |
| Taupo | 376 | 123 | 87 | 2,037 | 39 | 11.7 | 23 | 11 | 11 | 2 | 29 | -4 |
| Waikaremoana (Onepoto) | 643 | 164 | 131 | 6 | 10.9 | 20 | 9 | 11 | 3 | 28 | -1 | |
| Taumarunui | 171 | 140 | 111 | 1,712 | 39 | 12.7 | 24 | 13 | 12 | 2 | 31 | -5 |
| New Plymouth Airport | 49 | 142 | 116 | 2,110 | 0 | 13.4 | 21 | 13 | 13 | 6 | 26 | 0 |
| Napier | 2 | 92 | 64 | 2,271 | 6 | 13.9 | 24 | 13 | 14 | 4 | 32 | -2 |
| Wanganui | 22 | 117 | 87 | 2,108 | 4 | 13.4 | 22 | 12 | 14 | 5 | 29 | -1 |
| Palmerston North | 34 | 127 | 91 | 1,811 | 15 | 12.8 | 22 | 12 | 13 | 4 | 28 | -3 |
| Masterton (Waingawa) | 114 | 123 | 88 | 2,040 | 29 | 12.2 | 24 | 12 | 11 | 2 | 31 | -4 |
| Wellington (Kelburn) | 126 | 124 | 95 | 2,020 | 0 | 12.4 | 20 | 11 | 13 | 5 | 26 | 1 |
| Nelson Airport | 2 | 96 | 72 | 2,407 | 41 | 11.8 | 22 | 12 | 12 | 1 | 28 | -3 |
| Blenheim | 4 | 84 | 58 | 2,449 | 34 | 12.5 | 24 | 12 | 12 | 1 | 32 | -4 |
| Westport Airport | 2 | 169 | 140 | 1,941 | 1 | 11.9 | 19 | 12 | 12 | 4 | 25 | 0 |
| Hanmer Forest | 387 | 115 | 88 | 1,921 | 85 | 9.8 | 22 | 9 | 9 | -1 | 32 | -9 |
| Hokitika Airport | 39 | 168 | 144 | 1,860 | 25 | 11.9 | 19 | 11 | 11 | 2 | 26 | -2 |
| Lake Coleridge | 364 | 98 | 74 | 70 | 10.0 | 21 | 9 | 10 | -1 | 31 | -7 | |
| Christchurch | 7 | 85 | 58 | 1,974 | 37 | 11.4 | 21 | 10 | 12 | 1 | 32 | -4 |
| Lake Tekapo | 683 | 70 | 53 | 2,223 | 92 | 9.1 | 21 | 6 | 8 | -3 | 30 | -10 |
| Timaru | 17 | 81 | 55 | 1,887 | 39 | 11.1 | 21 | 10 | 11 | 1 | 32 | -4 |
| Milford Sound | 3 | 183 | 165 | 27 | 10.1 | 18 | 9 | 10 | 2 | 25 | -3 | |
| Queenstown | 329 | 93 | 72 | 1,933 | 53 | 10.1 | 22 | 8 | 10 | -1 | 30 | -5 |
| Alexandra | 141 | 64 | 39 | 2,073 | 81 | 10.5 | 23 | 7 | 11 | -2 | 32 | -8 |
| Dunedin (Musselburgh | 2 | 119 | 79 | 1.689 | 8 | 10.9 | 19 | 10 | 11 | 3 | 30 | -2 |
| Gore | 72 | 137 | 93 | 1,695 | 40 | 10.2 | 21 | 9 | 9 | 0 | 31 | -5 |
| Invercargill Airport | 0 | 157 | 111 | 1,631 | 48 | 9.5 | 18 | 9 | 9 | 1 | 28 | -5 |
NOTES: (1) Averages of rain days and wet days 1950-70; sunshine 1935-70; mean temperature 1931-60; other temperature data and days of screen frost, various periods—all exceeding 10 years.
(2) For normal monthly and annual rainfall for these stations, see table under subsection on Rainfall.
Brief Review of 1974:Year—The most important feature of 1974 weather, in which it resembled 1971 to some extent, was an exceptionally high frequency of winds from an easterly quarter. The only month in which this feature did not occur was July. These persistent easterlies brought excessive cloud and rain to eastern districts, especially from Christchurch northward, while most western districts experienced comparatively dry sunny conditions.
Rainfall was above normal, mainly by 10 to 40 percent, east of the ranges from Ashburton northward and also in Bay of Plenty, Wellington, and Nelson. For a number of stations in Southern Wairarapa, Wellington City, North Canterbury and Banks Peninsula, this was the wettest year in 40-60 years of observation. By contrast, rainfall was mainly below normal by 10-40 percent on the West Coast along with Southland and the greater part of Central Otago; in Auckland along with western and northern Northland, and in parts of Waikato and Taranaki. It was the driest year on record for Milford Sound and Manapouri.
It was a warm year, with average increases over the 1931-60 normal of 1.0°C in the North Island, 0.7°C in the South Island and 0.8°C over New Zealand, as in 1973. The highest departures were west of the main ranges, the lowest in the east.
Sunshine was above normal by 1-200 hours in western districts, except South Taranaki, and also over most of Northland. It was below normal by about the same amount east of the main ranges from Timaru northward and in Bay of Plenty.
Seasonal Notes—January was a dry month, with the driest, warmest, and sunniest weather in western and northern districts. In parts of the North Island rainfall had been inadequate since September 1973. Dairy production was already seriously affected by the dry weather, and in some places supplementary feed was being supplied to cows and sheep.
February was a very warm month, especially in the north, besides being very cloudy in Canterbury and Otago. Good rains in the second half brought relief to most districts but they were inadequate in parts of the North Island, where the drought persisted in places.
March was a cool month. Rainfall was inadequate to provide significant drought relief in some North Island areas, especially in the west. Napier, Masterton, and Wellington had their lowest March mean temperatures since 1936. The coldest spell was from the 18th to the 22nd, when the mean temperature was 6°C to 7°C below average in many eastern areas north of Christchurch.
April was a warm month, with very cloudy and wet conditions in eastern districts. Good growth was reported in many areas. Over three times the normal monthly rainfall was recorded in some eastern areas and about Cook Strait.
May was a relatively mild month and good growth was reported over the greater part of the country. The week from the 23rd to the 29th was the wettest part of the month.
In June the weather was very wet and cloudy east of the ranges. Parts of Hawke's Bay received up to 250 mm of rain on the 15th, causing serious and extensive Hooding, mainly around Hastings; at Napier Aerodrome 124 mm of rain was recorded in 12 hours. In most areas the health of stock was reported to be good.
July was unusually wet and mild and also very cloudy. Stratford Mountain House received 1573 mm of rain, one of the highest monthly totals ever recorded in New Zealand. Parts of North Otago received as much as 170 mm from the 28th to the 30th. Many Otago rivers were in flood on the 30th; and extensive dislocation of rail traffic both north and south of Dunedin was reported. The coldest spells were from the 3rd to the 6th and from the 9th to the 11th, with snow to low levels in the South Island and on the high country of the North Island.
During August persistent cloud and rain prevailed in eastern districts, where conditions were too wet for the farmers; lambing losses were reported from snow and cold rain, especially in Canterbury.
September was a cloudy, warm month. As in August, the weather was too wet in most eastern districts. Elsewhere however, farmers found the weather favourable, reporting good growth. Parts of the Kaikoura Coast and North Canterbury reported particularly heavy rain on the 3rd and 4th. Clinton River, northwest of Kaikoura, received 236 mm on these two days. Dannevirke, Masterton, and Wellington reported record low sunshine.
October was a cloudy month and mainly also wetter than normal. Considerable losses of lambs occurred in the South Island due to snow to comparatively low levels, on the 8th and 9th. It was also at this time that a large proportion of the rain fell; and a station to the northeast of Nelson received 315 mm in three days, from the 7th to the 9th. Flooding resulted in parts of Nelson and Marlborough, besides Otago. During the period from April to October Wellington had 1430 mm of rain, making this the wettest 7-month period in 113 years of observation. Similar excesses were recorded in southern Wairarapa, on the Kaikoura coast, and in parts of North Canterbury.
November was unusually dry and also rather warm. On the Canterbury Plains this was the driest November so far this century, with totals of 5 to 10 mm of rain.
December was unusually sunny and also warm. In Manawatu, Wellington, and Wairarapa, and also eastern districts of the South Island, farmers were finding conditions too dry. Thunderstorms were comparatively widespread over both Islands on the 1st, 2nd, 4th, 6th, 8th, 9th, 17th, and 31st. A severe hailstorm caused serious damage to crops in the Darfield/Hororata area of the Canterbury Plains on the 6th. New Plymouth, Masterton, Wallaceville (Upper Hutt), and Blenheim all recorded their highest December sunshine in 35 to 40 years of observation.
Summary of Meteorological Observations for 1974—The observations from which the following summary was compiled for the year 1974 were made at 0900 hours New Zealand standard time, i.e. 2100 hours Greenwich mean time.
| Station | Rainfall (mm) | Rain Days (1.0 mm or More) | Bright Sunshine (hours) | Screen Frost Days† | Mean Temp. | Air Temperature (Degrees Celsius)‡ | |||||
|---|---|---|---|---|---|---|---|---|---|---|---|
| Mean Daily Maximum | Mean Daily Minimum | Extremes | |||||||||
| Jan | Jul | Jan | Jul | Maximum | Minimum | ||||||
| *Partly estimated. †Minimum Air Temperatures less than 0.0°C. ‡°C = 5/9 (°F-32). | |||||||||||
| Whangarei | 1,478 | 134 | 2,140 | 0 | 15.9* | 24.7 | 16.3 | 13.6 | 8.1 | 30.9 | 1.2 |
| Dargaville | 1,064 | 147 | 2169* | 2 | 15.6 | 24.1 | 16.0 | 12.5 | 8.7 | 31.0 | -1.1 |
| Auckland | 921 | 122 | 2,234 | 0 | 16.7 | 24.1 | 15.9 | 16.1 | 9.3 | 28.3 | 4.2 |
| Hamilton (Ruakura) | 1,158 | 134 | 2,143 | 18 | 14.3* | 24.7* | 14.4 | 11.1 | 5.2 | 30.4 | -3.9 |
| Tauranga Aerodrome | 1,499 | 127 | 2,255 | 0 | 14.9 | 24.4 | 15.0 | 13.2 | 6.1 | 29.4 | 0.0 |
| Rotorua | 1,790 | 132 | 1,825 | 12 | 13.4 | 23.8 | 12.7 | 11.7 | 4.9 | 30.3 | -2.7 |
| Taupo | 1,346 | 124 | 1,947 | 29 | 12.8* | 23.9 | 12.2 | 9.8 | 3.5 | 31.7 | -3.5 |
| Gisborne Aerodrome | 1,223 | 126 | 2,027 | 3 | 14.3 | 23.5 | 15.1 | 12.6 | 5.1 | 32.3 | -1.9 |
| Lake Waikaremoana | 2,589 | 186 | .. | 8 | 11.6 | 19.9 | 10.6 | 10.4 | 4.2 | 29.7 | -2.5 |
| Napier | 1,096 | 116 | 2,082 | 7 | 14.4 | 23.2 | 14.7 | 12.8 | 5.9 | 31.4 | -3.2 |
| Taumarunui | 1,493 | 141 | 1,857 | 25 | 13.9 | 25.3 | 13.1 | 10.7 | 3.8 | 31.3 | -4.2 |
| New Plymouth Aerodrome | 1,415 | 131 | 2,279 | 1 | 14.1 | 22.3 | 13.8 | 12.4 | 7.0 | 29.2 | -1.5 |
| Wanganui | 804 | 101 | 2,151 | 0 | 14.3 | 22.1 | 13.4 | 13.2 | 6.9 | 30.9 | 1.4 |
| Palmerston North | 1,069 | 107 | 1,972 | 5 | 14.0 | 22.5 | 12.7 | 12.9 | 6.1 | 30.1 | -1.7 |
| Masterton | 1,193 | 136 | 1,855 | 14 | 12.8 | 22.7 | 12.5 | 10.0 | 4.5 | 32.2 | -1.8 |
| Wellington (Kelburn) | 1,706 | 129 | 2,066 | 0 | 12.8 | 19.6 | 11.6 | 12.1 | 6.5 | 27.5 | 1.0 |
| Nelson Aerodrome | 1,114 | 98 | 2,360 | 25 | 12.8 | 21.9 | 11.6 | 12.4 | 1.7 | 30.0 | -3.6 |
| Westport Aerodrome | 2,134 | 144 | 2,058 | 3 | 13.2* | 20.2 | 12.4 | 11.5 | 5.0 | 25.7 | -3.5 |
| Hokitika Aerodrome | 2,559 | 139 | 2,024 | 11 | 12.4 | 19.2 | 11.8 | 10.9 | 3.2 | 25.0 | -2.5 |
| Blenheim | 687 | 81 | 2,493 | 21* | 13.1 | 22.6 | 12.5 | 11.3 | 3.3 | 30.1 | -3.2 |
| Hanmer Forest | 1,626 | 117 | 1,827 | 80* | 10.2* | 21.8 | 9.2 | 8.1 | 0.4 | 32.6 | -8.3* |
| Lake Coleridge | 825 | 100 | .. | 63 | 10.5 | 21.2 | 8.4 | 8.7 | 0.2 | 30.6 | -6.5 |
| Christchurch | 828 | 99 | 1,990 | 20 | 12.0 | 20.8 | 11.9 | 11.2 | 2.4 | 34.5 | -2.2 |
| Lake Tekapo | 476 | 71 | 2,046 | 100 | 9.0 | 22.4 | 6.1 | 7.6 | -1.1 | 30.0- | -12.1 |
| Timaru | 557 | 78 | 1,714 | 28 | 11.4 | 20.6 | 11.4 | 9.8 | 2.8 | 29.3 | -3.1 |
| Queenstown | 579 | 78 | 1,947 | 49 | 10.9 | 22.6 | 7.7 | 10.0 | 10 | 31.0 | -4.9 |
| Alexandra | 299 | 53 | 2,125 | 86 | 10.9 | 23.6 | 9.1 | 9.6 | -0.8 | 33.1 | -7.8 |
| Dunedin (Musselburgh) | 860 | 140 | 1,626 | 7 | 11.2 | 19.2 | 10.3 | 10.2 | 3.9 | 30.9 | -8.0 |
| Gore | 721 | 120 | 1,693 | 51 | 9.8 | 18.7 | 8.3 | 7.6 | 1.7 | 30.6 | -5.4 |
| Milford Sound | 4,542, | 155 | .. | 33 | 11.1* | 19.6 | 8.7 | 9.5 | 1.8 | 26.2 | -2.7 |
| Invercargill Aerodrome | 812 | 133 | 1,717 | 65 | 9.7 | 17.4 | 9.3 | 7.4 | 0.9 | 27.8 | -7.4 |
For 1974 the mean sea level pressure values in millibars at 0900 hours New Zealand standard time were: Auckland, 1015.1; Kelburn, Wellington, 1014.3; Nelson Aerodrome, 1014.5; Hokitika Aerodrome, 1014.1; Christchurch, 1014.2; and Dunedin Airport, 1013.5.
EARLY HISTORY: General—When New Zealand was discovered by Europeans in 1642 it was found to be inhabited by a race of Polynesians called Maoris, who had migrated to these islands at least 300 years previously. It is generally accepted that the Maoris came originally from South-east Asia, whence, as proto-Polynesians. they moved eastwards from island to island until they reached the eastern Pacific, where they settled the islands now known collectively as Polynesia. From Polynesia the ancestors of the Maori sailed south-west in ocean-going canoes to reach New Zealand and these voyages were probably spread over several generations, perhaps several centuries. Oral Maori history and genealogy support the view that there was a final wave of migration of considerable magnitude about A.D. 1350. Adapting themselves to a new physical environment, in isolation from the outside world, the Maoris produced forms of social and economic organisation and material culture which were significantly different from their Polynesian prototypes.
Coming from tropical latitudes, the Maoris mainly confined themselves to the warmer North Island, and when discovered by Europeans were in a high state of neolithic civilisation, with marked superiority in the arts of wood carving and military engineering. Their principal social unit was the family group, and from combinations of the numerous groups were formed the subtribes and tribes. They had highly developed social and ritualistic customs, and their system of land tenure and methods of cultivation were communal within the subtribes. Inter-tribal and intra-tribal warfare was common, and as individuals Maoris displayed exceptional courage and intelligence.
From the early days of European settlement in the first half of the nineteenth century many Maoris believed that their interests were best served by co-operation with the settlers. For the most part the Europeans adopted a humanitarian attitude to the Maori people, who accepted their assurances and found a satisfactory safeguard for their interests in the exercise of their rights and privileges as British subjects. As the Europeans established a self-contained and aggressively growing society, there grew up a rivalry for land and a clash of power. In the 1860s Maori tribes in Taranaki, Waikato, and Bay of Plenty fought the settlers and Government troops in a series of sporadic campaigns based on loss of land rights and rising Maori nationalism. After 1870 there followed the development of a European colony of settlement with Maori people making further economic adjustments to European ways.
The introduction of European diseases and firearms, and the impact of European civilisation on the traditional way of life and customs of the Maoris, had such an adverse effect that their numbers must have been reduced by over half during the nineteenth century. However, the virility of the race gradually asserted itself, and from the beginning of the twentieth century the Maori population has been rapidly increasing though still forming a minority component.
Discovery by Europeans—On 13 December 1642, Abel Janszoon Tasman, a navigator of the Dutch East India Company, discovered the country to which he gave the name of Staten Land, and which later became known as “Nieuw Zeeland”. Tasman had left Batavia on 14 August 1642, and, after having discovered Tasmania, he steered eastward and sighted the west coast of the South Island, described by him as a high mountainous country. Sailing north, he had the misfortune to come into conflict with the Maoris at Golden Bay, on the north coast of the South Island, so that, though he continued his northward journey until he reached the northern tip of the country, he did not again attempt to land.
There is no record of any European visit to New Zealand after Tasman's departure until Captain James Cook sighted land on 7 October 1769 near Gisborne. Cook and a party of men from the Endeavour landed at Gisborne on 9 October 1769. On his first voyage Cook spent 6 months exploring the New Zealand coastline, and he completely circumnavigated the North and South Islands. His activities can best be described by saying “he found New Zealand a line on a map, and left it an archipelago”. Not only was Cook's ability shown by his cartographical accuracy, but also in his peaceful dealings with the Maoris. He returned to New Zealand again in 1773, 1774, and in 1777. His careful observations made New Zealand known to the western world; the accounts of his voyages were translated into a dozen languages. The bi-centenary of Cook's first visit to New Zealand was celebrated in 1969; an account of his voyages of discovery in the Pacific is given on pages 1116 to 1128 of the 1969 issue of the Official Yearbook.
The European discovery of Niue Island was made by Captain Cook in 1774. The first recorded discovery of the Tokelau Islands was made by Quiros in 1606.
European Settlement and Colonisation—Whaling stations sprang up along the coast from 1792 onwards and a trade with New South Wales began not only in whale oil and seal skins, but also in flax and timber. In 1814 Samuel Marsden., chaplain to the Governor of New South Wales, was responsible for the establishment of the first mission station in the Bay of Islands. To promote the translation of the Bible into Maori, Thomas Kendall (one of Marsden's assistants) took two Maori chiefs with him to England in 1820. The printing of the Bible in Maori was made possible through the establishment of a printing press by William Colenso at Paihia in the Bay of Islands in 1835.
The growing white population in the Bay of Islands, and the lawlessness of crews of visiting ships led to the appointment by the British Government of James Busby as British Resident at Waitangi in 1833. The Governor of New South Wales in 1837 sent Captain William Hobson, in command of HMS Rattlesnake, from Sydney to the Bay of Islands to report on New Zealand. Among other things, Hobson suggested a treaty with the Maori chiefs and the placing of British subjects under British law. On 29 January 1840 Hobson arrived at the Bay of Islands as Governor to proclaim British sovereignty.
By 1840 numerous mission stations had spread through the northern half of the North Island. Conversion of Maori tribes to Christianity was accompanied by the introduction of new crops and methods of cultivation and pacification of the warring tribes.
The first body of immigrants to reach New Zealand under a definite scheme of colonisation arrived at Port Nicholson, Wellington, on 22 January 1840 to found the initial settlement of the New Zealand Company. The colonists were in the main sturdy resourceful people seeking a better future than was offering in nineteenth century industrial England.
The guiding genius of the company, Edward Gibbon Wakefield, aware of the intention of the British Government to annex New Zealand, had earlier (in 1839), dispatched his agents in order to purchase large areas of land from the Maoris before the Crown could assume a monopoly of land purchase.
Wakefield's scheme of colonisation was based on the sale of land to investors or men of wealth for development by labouring class immigrants. With the profit from land sales the company could bring out more immigrants. Wakefield aimed at a balance between landowners and labourers; in effect he aimed to transplant a cross-section of English society. But, ignorant of the system of tribal ownership of Maori land, the company had bought land from individual Maoris; then Hobson provided that all European land titles should derive from the Crown which would be the only purchaser of land from the Maoris. Title to land remained a difficulty for some years and was a cause of distress to the colonists and, combined with a considerable degree of absentee ownership and land speculation, made most precarious the existence of the early company settlements of Wellington, Wanganui, New Plymouth, and Nelson. The company had brought nearly 10,000 persons to New Zealand by 1848. The later settlements of Otago, in 1848, and Canterbury, in 1850, organised under the aegis of the New Zealand Company in co-operation with the Free Church of Scotland and the Church of England respectively, achieved a much greater measure of success owing to the absence of any large Maori population and to satisfactory land purchase arrangements..
The non-Maori population in the main settlements in 1842 totalled 3,801 in Wellington, 2,895 in Auckland, 2,500 in Nelson, 895 in New Plymouth, 380 in Russell, 236 in Hokianga, and 198 in Akaroa. By 1862 the non-Maori population had reached 125,000 (as against 55,000 Maoris) and by 1866 it had jumped to 200,000 with men from Australia joining in the gold rush to Otago. Migration then dropped away until 1874 when there was a high inflow for several years from Britain with the Vogel policy of public works development.
After the death of Hobson in 1842, subsequent governors, through lack of funds and weak administration, found themselves unable to protect the small and helpless settlements from threatening Maori aggression engendered by strong feelings on land ownership. The response of the Colonial Office was to appoint Captain George Grey as Governor and to provide him with adequate funds and troops so that he soon restored order and won not only the confidence of the Maoris but also for a time that of the settlers. Grey, through his chief land purchase officer, Donald McLean, endeavoured to buy up land in advance of the settlers' needs in order to prevent conflict between settlers and Maoris. By 1858 the census revealed that the settlers outnumbered the Maoris who, fearful that they were being swamped by the settlers, became increasingly reluctant to sell their land. At the same time the intensified settler pressure for more land led McLean to negotiate only with those Maoris still favourably disposed to land sales. This practice alarmed the other Maoris and finally the war broke out in 1860 over a land dispute at Waitara in Taranaki where settler demand for land was strongest. The return of Grey as Governor did not solve the problem for, as an autocrat, he could not work with elected ministers nor could he regain the confidence of the Maoris and finally he quarrelled with the commander of the Imperial troops. Widespread confiscation of Maori land by the settlers' government in order to pay the cost of the war included land belonging to friendly as well as hostile Maoris and aroused further resentment. Although the war had died down by 1870 it was only during the term of Donald McLean as Native Minister that some measure of reconciliation began with the establishment of four Maori electorates in 1876.
Public Works and Farm Development—The absence of hostilities and the discovery of gold there had allowed the South Island to obtain a lead in commercial and political development which it long maintained. Moreover, with the subsequent agrarian expansion especially in the development of the large pastoral holdings, the country ceased to be merely self-sufficient agriculturally but began to develop a substantial export trade, mainly in wool.
By 1870 the gold boom had ended in the South Island. To remedy the situation of economic stagnation, Sir Julius Vogel began a policy of extensive borrowing for railway and road construction and for immigrant labour. The results of this policy were to double the population to 500,000 by 1880, to immensely improve transport and communications, and to encourage industry in the towns where most of the immigrants had congregated. After Vogel's plans for these loans to be secured against the land were frustrated by the provinces, he decided that the provincial system, begun in 1853, had outlived its usefulness and that parochialism was a hindrance to the development of the colony. The system was abolished in 1875, local administration being provided for by the Counties Act and the Municipal Corporations Act 1876.
When systematic colonisation began, New Zealand's only important trade association was with the east coast of Australia. It was, however, the inflow of British capital which set the New Zealand economy on a path of growth: that determined by the requirements of markets in the United Kingdom. Britain with a vigorously expanding demand from its working population required from the young colony an assured and increasing supply of food and raw materials, and a guaranteed market for its industrial goods. In accordance with this archetypal pattern of colonial development agricultural trade with the United Kingdom assumed over-riding importance as the land was brought into production. By 1868, in spite of the problem of distance, the United Kingdom had already become New Zealand's principal trading partner.
With the introduction of refrigeration in 1882 and steam navigation in the late 19th century, the development of exports of frozen meat and dairy products assured the dominance of the United Kingdom in New Zealand's external trade. These developments, with a continued substantial investment of British capital, particularly in farming and food processing industries, established that degree of specialisation to meet the needs of the British market, which shaped the entire New Zealand economy during its first hundred years.
The depression of the 1880s, a consequence of a fall in world price levels, resulted in unemployment and large emigration but export prices recovered in the nineties. From 1880 onwards the natural increase of births over deaths exceeded the net inflow from migration.
In 1891 John Ballance, as leader of the Liberal Party, became Premier to be followed on his death in 1893 by Richard John Seddon, who remained Premier until his death in June 1906. The Government pursued a vigorous legislative programme in which the main emphasis was that of social justice, the principal manifestations of which were the breaking up of the large estates, the establishment of the Court of Arbitration, and the introduction of old age pensions. The policy of subdivision of large estates to produce closer settlement included the compulsory purchase of large holdings by the State, but more important were the effects of refrigeration, which encouraged the smaller dairy and fat-lamb farms, the accelerated Government purchase of Maori lands and the widespread introduction of systems of Crown leasehold with subsequent loans to small farmers to establish themselves. In inaugurating the Court of Arbitration, the object was to eliminate strikes by giving labour a recognised bargaining status; and the enactment was in accord with the enlightened code of labour legislation passed at that time under the influence of William Pember Reeves.
The 6 years from 1906 with Joseph Ward as Prime Minister were marked by several notable events in imperial affairs, but, on the whole, the Government's domestic policies were singularly uninspiring.
The expansion of the exports in dairy produce and frozen meat during the 1890s produced more intensive settlement and the rise of a new farming class in which the “cow-cockie” was the dominant figure. These farmers, having benefited by the spread of prosperity, were in 1911 mainly responsible together with the city businessmen for the overthrow of the Liberal regime. The new Reform Government under William Massey, in order to strengthen the primary producer, introduced measures of which the extension of rural credit was typical. Industrial conflict on the waterfront and with the Waihi miners ended in a victory for Massey who relied on the use of troops and special constables to repress the strikes.
Three years after the advent of the Reform Party, the First World War, 1914-1918, broke out, leading to a coalition Government and an Imperial commandeer of exports which created the precedent for the establishment after the war of central boards to regulate the exports of pastoral products. War activities were marked by heavy casualties in proportion to the population while the landing at Gallipoli signified the growing awareness of a sense of nationhood.
Though the effects of the post-war depression during the period 1921-24 showed themselves in an increase in unemployment and slight wage reduction, no drastic legislation was necessary to stabilise economic conditions. During the following years the price level rose; and on the administrative side, the period was characterised by extensive public works expenditure, with particular attention to hydro-electric schemes and highways. Prime Ministers in the 10 years from 1925 were J. Gordon Coates, Sir Joseph Ward, and George Forbes.
Land values rose steeply, accelerated by Government efforts to settle returned servicemen on the land, and between 1915 and 1925 forty percent of the occupied land had changed hands. New Zealand was extremely vulnerable to the overseas price fluctuations of the pastoral products. With the advent of the depression by 1930, farmers, despite greatly increased production, were faced with a serious decline in income (over forty percent) together with heavy mortgage commitments on land bought at high prices so that many were faced with foreclosure. In the towns, tradesmen and shopkeepers faced bankruptcy, and wage earners unemployment or reduction in wages. A coalition Government, formed in 1931 to meet the crisis had, as its leading figure, Coates, who was Minister of Finance from 1933. In order to produce balanced budgets and cope with the effects of the depression, enactments provided for unemployment relief, for the suspension, in effect, of compulsory arbitration, for the establishment of a Reserve Bank, for a mortgage moratorium, for raising the exchange rate, and for reduction in interest rates and wages. Partly as a consequence of these measures and of a rise in overseas price levels a general economic revival was taking place by 1935.
DEVELOPMENT AS A NATION—The election of a Labour Government in 1935 (with notable politicians including Michael Savage, Peter Fraser, and Walter Nash, who successively became Prime Ministers) reflected the general climate of opinion and led to change in administrative policy, the preoccupation being mainly with social problems. These attitudes were reflected in certain distinctive trends in legislation.
The first major influence was a humanitarian attitude reinforced by a progressive economic policy. Evidence of this is implicit in the provision for a basic wage, and later for a minimum wage, employment-promotion legislation, amendments to workers' compensation, industrial conciliation and arbitration, mining, etc., legislation, the system of basic prices for certain farm products, the creation of farm industry reserves, and the rationalisation of production and marketing by the establishment of boards for certain items of primary produce.
Another dominant trend was the acceptance of the principle that society should take active steps towards the improvement of the working, living, and social circumstances of its members. Foremost in this category was the Social Security Act and its later extensions providing for monetary benefits such as age, superannuation, family allowances, sickness, and unemployment, and by the provision of a system of medical, pharmaceutical, hospital, maternity, and other related benefits. (The evolution of social security in New Zealand was summarised in a special article in the 1972 issue of the Official Yearbook; this was an extract from the Report of the Royal Commission of Inquiry on Social Security in New Zealand published in March 1972.)
Other legislative enactments under this heading include the provision for paid annual holidays, reduction of working hours, extension of workers' compensation insurance, improvement in safety and health and welfare conditions in industry, and extension of educational facilities and opportunities.
The financial needs of the Second World War from 1939 onwards were met with virtually no overseas borrowing. Financing the war by taxation and internal borrowing also assisted in the achievement of a successful stabilisation policy. Full employment in war was followed by full employment in peace. Expansion and diversification of manufacturing and servicing industries provided avenues of employment for the growing labour force.
Shaken by conflict with its industrial left-wing, and faced with increasing public impatience at the continued existence of some wartime controls and concern at inflation, the Labour Government was defeated at the 1949 election after holding office since 1936. The National Party took office under the leadership of Sidney Holland and its first term was marked by a conflict with the Waterside Workers' Union. This dispute in 1951 ended in a complete victory for the Government after it introduced most stringent emergency regulations to deal with the situation. For the first time this century, Holland held an emergency election before parliament had run its full 3-year term. The result was to return the National Government with an increased majority.
In 1952, continued inflation and a balance of payments crisis produced restrictions on exchange allocation to importers in an effort to build up overseas reserves. The 1954 election reduced National's majority and was marked by the appearance of a third party, the Social Credit Party which gained 11 percent of the votes.
During his time as Prime Minister, Holland initiated a constitutional change with the abolition of the Legislative Council on the grounds that it no longer possessed any effective function. Illness caused Holland's retirement in 1957 when he was replaced as leader by Keith Holyoake.
In 1957, the Labour Party gained a narrow victory at the polls under the leadership of Walter Nash. Budgetary policy to meet a recurrence of the balance of payments crisis proved unpopular and at the 1960 election, the National Party under the leadership of Keith Holyoake was returned to power, as it was in subsequent elections in 1963, 1966, and 1969. Early in 1972 John Marshall became leader of the National Party. At the 1972 election the Labour Party swept back into power under Norman Kirk; after his untimely death in 1974 W. E. Rowling became Prime Minister.
International affairs have assumed growing importance in recent decades. It was evident when peace returned to the Pacific area in 1945 that New Zealand found itself in a different world, where its relations with the countries geographically closest to it would grow rapidly in importance. This did not, however, alter the extent to which New Zealand identified itself as a European nation. New Zealand took part in the Paris Peace Conference and it was not until 1955 that it altered the planning commitments of its defence forces from security arrangements in the Middle East to similar arrangements in the South-east Asia and Pacific areas.
The most far-reaching reorientation required of New Zealand in this new situation was the need to obtain a guarantee of its security from the United States rather than the United Kingdom to which it had traditionally turned. With Australia it signed the ANZUS pact with the United States in 1951 and this provides the cornerstone of New Zealand's security arrangements. It also gives New Zealand a common interest with the nations of Western Europe in encouraging the United States to maintain outward-looking policies and a global defence capability.
New Zealand's growing regional awareness has been expressed partly in its defence relationships through SEATO, and through the collective defence arrangements with Malaysia and Singapore; but more widely in its participation in the Colombo Plan and other arrangements for extending development aid to South-east Asia, the South-west Pacific and the Indian subcontinent. The stability and well-being of these areas are vital to New Zealand's interests and relationships with the countries of the region are becoming closer every year.
A feature of the 1960s was a series of national conferences on industrial development (1960), export development (1963), agricultural development (1963-64), and national development (1969).
Relations with Europe—Agricultural development has continued to be based on the principle of the family farm, and the New Zealand farmer remains typically both labourer and manager, as well as landowner. The present level of efficiency has been won by hard effort, skilled management, the application of the results of scientific research, and a heavy personal investment in farm improvement. Dairy producers are now faced with problems of maintaining overseas markets as a result of Britain's move to join the European Economic Community.
Farm production has constantly expanded so that New Zealand has become one of the world's greatest exporters of pastoral produce. The bulk of this produce still goes to the British market.
The advantages of a closely bilateral trading relationship with the United Kingdom were not one-sided. The association was grounded in economic logic, and enabled New Zealand to develop its only major natural asset into a pastoral system of unmatched economic efficiency, which, to the present day would, under free trading conditions, enable its farm products to meet any competition.
The pattern of economic dependence developed in accordance with a series of mutually agreed decisions extending over a long period, and these were formalised by the Ottawa Agreement of 1932 between the British and New Zealand Governments which provided preferential access to each other's markets. The advantages of this economic rationalisation were demonstrated most strikingly in the Second World War, 1939-45 when, apart from the New Zealand military contribution, its continued substantial supply of food to a beleaguered Britain was vital to the continuation of the Allied war effort.
Settlers came originally to New Zealand because of some dissatisfaction with the conditions of life they knew in their country of birth. They sought to build a new society which, while retaining what was good in Britain and Europe, would exclude the pressures which they had found damaging to the quality of their own lives. It is perhaps ironic that, to the extent which a new society has been created, this has been achieved by means of, and is contingent upon, continued strong economic ties with Europe. The decision of Britain to become part of the European Economic Community with effect from 1973 and thus subject to a new pattern of trading arrangements would have been disastrous for New Zealand's exports of dairy produce and lamb, but for the negotiations of special arrangements for continuing trade; in these negotiations Holyoake and Marshall were key personalities.
Pacific Orientation—Increasing interest has been taken in the last decade in welfare and social development generally of both the rapidly growing Maori population and the inhabitants of the islands of the Pacific with New Zealand ties.
New Zealand has experienced in recent years a considerable inflow of Polynesians from its associated territories and elsewhere in the Pacific. One-tenth of the New Zealand population is Maori or Polynesian, and there are more Niue Islanders in New Zealand than in Niue. Cook, Niue, and Tokelau Islanders are New Zealand citizens who freely move back and forth. These people have undoubtedly had a big influence on the character, attitudes, and behaviour of the rest of the New Zealand population—most have some understanding of the “Polynesian way”. New Zealand has a number of other basic links with the South Pacific, due in part to the common colonial history shared with such nations as Fiji. This British heritage has given a common language and the democratic tradition. Today all the independent states of the South Pacific are associated in the British Commonwealth.
The most recent political development is the establishment of the South Pacific Forum. This group, comprising the leaders of the independent and self-governing nations of the South Pacific (Cook Islands, Niue, Western Samoa, Tonga, Fiji and Nauru), together with Australia and New Zealand, has had highly successful meetings in their respective capitals. The South Pacific Forum is a new concept in international relations—an exciting development. There is no constitution, there is no agenda, and there is no formality. The leaders come together in private sessions for frank and concentrated discussion on practical matters of direct relevance to the people of the Pacific. The island leaders themselves suggested the formula and proposed Australian and New Zealand participation. Clearly they saw the need to exchange views, discuss projects and priorities, and generally to secure on a regional basis effective collaboration and co-ordination at the highest level. A South Pacific Bureau for Economic Co-operation has been established with a broad programme of trade, production, and economic development. It is based in Suva.
Expansion of overseas aid to the Pacific and to Asia from 1973 onwards was a feature of the Labour Government under Kirk and subsequently under Rowling.
Sovereignty—On 29 January 1840 Captain William Hobson, R.N., arrived in the Bay of Islands. His instructions from the British Government required him to take possession of the country with the consent of the Maori chiefs, this policy being designed by the Colonial Office strongly influenced by missionary opinion, to safeguard the well-being of the native people. Hobson read his commission at Kororareka on 30 January and on 6 February 46 chiefs signed the Treaty of Waitangi, a compact whereby all rights and powers of sovereignty were ceded to the Queen, all territorial rights were secured to the chiefs and their tribes (with the Crown having the sole right of purchase) and in return the Queen extended her protection and all the rights and privileges of British subjects. Other chiefs throughout both Islands later adhered to this Treaty.
On 21 May 1840 Governor Hobson proclaimed British sovereignty in the case of the North Island by virtue of the Treaty of Waitangi, and in the case of the South Island and Stewart Island by right of discovery. New Zealand remained a dependency of New South Wales until 3 May 1841, when it was created a separate colony by Royal Charter dated 16 November 1840. The capital was at first transferred from Russell to Auckland, but in 1865 it was again transferred, on this occasion to Wellington, where the seat of Government has since remained.
During Governor Grey's term, steps were taken to draft a constitution for the colony. An Act granting representative institutions was passed by the Imperial Parliament on 30 June 1852, and was published in New Zealand by Proclamation on 17 January 1853. Under it, provision was made for the constitution of a General Assembly consisting of a Legislative Council and a House of Representatives. Provision was also made for the division of the country into provinces, each province having an elected Council and Superintendent. (The provincial system was abolished in 1875 and the Legislative Council in 1950.) In the first General Assembly of 27 August 1854 certain members of this body were associated with the permanent members of the executive but they did not hold any portfolios. It was not until 7 May 1856 that responsible government was actually established.
One aspect, that of native affairs, was withheld from the responsible Ministers, and the Governor, as representative of the Crown, continued to act independently of his elected advisors in this sphere. In 1861 Grey attempted unsuccessfully to hand over this responsibility but the Ministers were unwilling to assume responsibility for the cost of the war. Finally in 1864 Sir Frederick Weld instituted the “self-reliant policy” whereby the colony accepted responsibility for the settlement of difficulties with the Maoris and consented to the withdrawal of troops by the Imperial Government.
In recognition of a nascent sense of nationality and of an increasing desire for self-reliance in political matters New Zealand was given the title of Dominion in lieu of Colony, the new title taking effect on 26 September 1907.
Of the constitutional events in recent years the passing by the United Kingdom Parliament of the Statute of Westminster in December 1931 was of major importance. The draft of this statute was submitted for the confirmation of the various Commonwealth legislatures before its passage through the United Kingdom Parliament. The statute granted complete autonomy to the various self-governing member countries, but it did not automatically apply to Australia or New Zealand. In other words. its operation in the latter self-governing members of the Commonwealth was declared to require specific adoption by the legislatures of those countries. It was not until 1947 that the New Zealand Government formally adopted the Statute of Westminster.
NEW ZEALAND'S INTERNATIONAL RELATIONS—Until the early 1930s New Zealand's external interests were almost exclusively centred on its relationship with Britain. The British Navy protected New Zealand and Britain took the bulk of New Zealand's exports. Where Britain led, New Zealand followed, not blindly but with pride and conviction. Britain, as a great power, played a major role in world affairs. New Zealand's “foreign policy” consisted chiefly of seeking to modify British policy in those few cases where New Zealand had a strong interest or a viewpoint rather different from that of Britain.
The emergence of a distinctively New Zealand foreign policy is usually regarded as dating from 1935. The Labour Government strongly upheld the principle of collective security and looked on the League of Nations as the custodian of that principle. It pressed for vigorous collective action by the League against aggression in Abyssinia, Spain, and China at a time when the United Kingdom was pursuing the policy which came to be known as “appeasement”. In addition to making its views known in confidential communications to the United Kingdom Government, New Zealand also gave them forthright expression in the Council and Assembly of the League of Nations.
There was nevertheless, no suggestion that New Zealand was departing from its historically close association with Britain. The course it would follow in the event of war was never in doubt. When war broke out the Prime Minister, the Right Hon. M. J. Savage, expressed New Zealand's position in these terms:.
“Behind the sure shield of Britain we have enjoyed and cherished freedom and self-government. Both with gratitude for the past, and with confidence in the future, we range ourselves without fear behind Britain. Where she goes, we go. Where she stands, we stand.”
But the Second World War changed the pattern of power in the world and made it necessary for New Zealand gradually to revise its foreign policy. During the war years the Government had participated in discussions among the allies and it believed that New Zealand, whose armed forces had fought in many theatres of war, should have an effective voice in the development of a post-war world order. To this end the Government established (in effect from 1943) a career foreign affairs service, and made a beginning in stationing its own diplomatic representatives in countries where New Zealand's interests made their presence necessary. In particular. New Zealand sought to foster good relationships with its neighbours in the Pacific and Asia and to increase the measure of security and welfare in these areas.
Woven into post-war policy was the traditional New Zealand belief in the principle of collective security and international justice, which the United Nations was pledged to support. There was also the belief that the international community should give high priority to the welfare and political advancement of dependent peoples and to the elimination of poverty, disease, and other economic and social causes of international tension.
The threat to New Zealand's security posed by Japanese aggression in the Pacific brought this country into close association with two of her Pacific neighbours—Australia and the United States. In 1944, in the Canberra Pact, Australia and New Zealand provided machinery for continuing consultation between the two Governments. The wartime alliance of the two Pacific Commonwealth countries with the United States found expression in peacetime in the ANZUS Treaty, in which, for the first time, New Zealand and Australia entered into a security treaty with a foreign country. The ANZUS Treaty, which came into force in April 1952, gives an assurance of United States support in the event of an armed attack from any quarter in the Pacific and so constitutes New Zealand's major safeguard against aggression in the area. The signing of the Manila Treaty and the establishment of SEATO in 1954, like the formation of the ANZUS alliance, took place against a background of continuing instability and violence in South-east Asia. (Details of New Zealand's defence policies and arrangements are set out later in this chapter.)
The scope of New Zealand's interests in Asia widened considerably in the years following signature of the Manila Treaty. Diplomatic relations were established with a growing number of countries in the area, leading to increased co-operation in fields besides that of defence. By the mid-1960s New Zealand had more widespread representation in Asia than in Western Europe. Subsequent accession to membership of regional organisations such as ECAFE and the Asian Development Bank furnished further evidence of this country's recognition of its constructive links with Asian countries. Diplomatic relations were established with the People's Republic of China in December 1972 and ambassadors have been exchanged. The Government is actively exploring the possibilities for new forms of regional co-operation in Asia.
The political evolution of the South Pacific with the emergence of Western Samoa, Nauru, Fiji, and Tonga as independent states and the Cook Islands as self-governing in free association with New Zealand has led to the development of a new pattern of relationships, bilateral and multilateral, between New Zealand and its South Pacific neighbours. In addition to its special relationship with Western Samoa, a former United Nations Trust Territory administered by New Zealand, and the Cook Islands, New Zealand has close bilateral ties with Fiji, Nauru, and Tonga. It is co-operating with all these countries at the regional level in the South Pacific Forum where the independent and self-governing countries in the South Pacific, together with Australia and New Zealand, discuss their common problems. Also, through its membership of the South Pacific Commission, New Zealand is endeavouring to promote the economic and social welfare of the South Pacific peoples and to foster a strong sense of regional identity.
New Zealand has continued to place special importance upon its membership of the United Nations. It is an active participant in the work of the General Assembly, and has been a member of all Councils of the Organisation. In 1950 it provided troops to the United Nations Command in Korea and has contributed military observers and civilian police in various peace-keeping operations. It has sought to assist all efforts to attain the political and social objectives outlined in the Charter.
The historical links with Britain and with Western Europe and North America remain close, as does the economic relationship with Britain, New Zealand's largest single customer. Although New Zealand has been making satisfactory progress in diversifying her markets, especially within the Pacific Basin, her trading and other interests in the European Economic Community remain a major policy concern.
The Labour Government, which was elected in 1972, has emphasised its wish to strengthen New Zealand's bilateral links with the nations of Asia and the Pacific as well as expand regional cooperation, its commitment to a more vigorous programme of aid to less-developed countries, and its belief that the United Nations can and should do more to protect and advance the interests of its smaller members. It has made clear in action, its total rejection of all doctrines of racial superiority. It intends to ensure that New Zealand plays a more independent role in world affairs.
Ministry of Foreign Affairs—The primary responsibility of the Ministry of Foreign Affairs is to advise and assist the Government in formulating and executing decisions in the field of New Zealand's external relations. It is the agency through which other governments and their representatives in New Zealand communicate with the New Zealand Government. It operates New Zealand's aid programmes and maintains New Zealand's diplomatic and consular representation abroad. Its overseas functions are discharged through a network of 35 diplomatic and consular posts consisting of embassies, high commissions, consulates-general, and other permanent missions. At home, the preparation and co-ordination of foreign policy recommendations is carried out in close association with a number of other Government departments. The ministry is administered jointly with the Prime Minister's Department. Prime Ministers have often held the Foreign Affairs portfolio. The Secretary of Foreign Affairs is also Permanent Head of the Prime Minister's Department.
The ministry has a substantive role in the formulation and execution of New Zealand's economic policies. In Wellington the ministry works closely on these questions with other departments such as the Treasury, Department of Trade and Industry, Customs Department, and the Ministry of Agriculture and Fisheries. Economic activity is as much part of an overseas mission's everyday work as its political, consular, and trade functions. Officers of the ministry have a major responsibility to inform foreign governments of New Zealand's policies, negotiate agreements, and keep the New Zealand Government informed of economic developments in the country to which they are accredited.
The ministry's involvement in the economic sphere was amply demonstrated in the events leading up to Britain's entry into the EEC. The negotiations in Luxembourg, that decided the terms of British entry and the special arrangement for New Zealand exports of butter and cheese to Britain, were preceded by an intensive campaign of publicity for New Zealand's case, continuous ministerial and official contacts in Britain and Europe, and a series of visits to New Zealand by British and European Ministers, officials and journalists directly concerned with Common Market affairs. In all this activity the ministry played a full part in Wellington, with other departments, and abroad where its officers were heavily involved. (More detailed information on New Zealand's external trade and economic policies is contained in section 22.)
The ministry has a special role also as a clearing house for material provided by New Zealand posts overseas for other departments, and through its posts it performs numerous services on behalf of departments without representatives abroad.
In the Official Section at the end of the Yearbook the diplomatic and other New Zealand representation overseas is listed.
New Zealand in the Commonwealth—As a member of the Commonwealth New Zealand is able to consult and co-operate with 34 other countries in a wide variety of activity, both governmental and non-governmental. The value to New Zealand of its Commonwealth links is derived not only from the practical benefits of what the Commonwealth does but also from the heterogenous composition of the association. Its 34 members take in the 6 continents and the 5 oceans of the world. The Pacific region is now fully represented in the Commonwealth. Fiji, Tonga, and Western Samoa are full members along with Australia and New Zealand, and Nauru has special status.
As the Commonwealth has grown and changed, its relationships have taken on a new scope and emphasis. As Commonwealth heads of government affirmed in the Commonwealth Declaration adopted at their meeting in 1971, the association “provides many channels for continuing exchanges of knowledge and views on professional, cultural, economic, legal and political issues among member states. These relationships we foster and extend for we believe that our multinational association can expand human understanding and understanding among nations, assist in the elimination of discrimination based on differences of race, colour, and creed, maintain and strengthen personal liberty, contribute to the enrichment of life for all, and provide a powerful influence for peace among nations.” New Zealand, itself a country where different races live in harmony, sees in the Commonwealth a special opportunity for multi-racial co-operation and understanding.
The value of the association in providing a forum for the exchange of views between a large number of diverse nations was illustrated again at the 1973 Heads of Government meeting at Ottawa. Discussions were frank, informal, and private, ranging over topics which included changing power relationships, security, nuclear testing, trade, monetary issues, development assistance, private foreign investment, international transport, food shortages, and Southern African questions.
The belief of member countries in the potential of the Commonwealth led to the establishment of a permanent Commonwealth Secretariat in London in 1965. Under the leadership of its Secretary-General, Mr Arnold Smith, it has become the main agency for multilateral communication among Commonwealth governments. The Commonwealth Secretariat promotes consultation and disseminates information on matters of common concern, organises meetings and conferences, and coordinates many Commonwealth activities. Prominent among these is the Commonwealth Fund for Technical Co-operation. The fund is financed by voluntary contributions from most Commonwealth countries. Its primary purpose is to promote economic development through self-help and mutual assistance.
New Zealand contributes to the budgets of the Commonwealth Secretariat, the Commonwealth Fund for Technical Co-operation, and the Commonwealth Foundation. The foundation was established at the same time as the Secretariat to promote close links in the professions throughout the Commonwealth. It has sponsored official and non-official Commonwealth professional organisations and strengthened the links between administrators, engineers, lawyers, accountants, scientists, and private individuals in the different Commonwealth organisations. Like the Secretariat it has provided a focus for Commonwealth activities and a basis for extending international co-operation.
New Zealand and the Asian/Pacific Area—Since the Second World War, and particularly since 1955, there has been a noteworthy growth in New Zealand's relations with the countries of the Pacific area. New Zealand has a direct interest in the maintenance of peace and the growth of prosperity in the area. Its political and economic relations with Australia, the United States, Canada, Japan, and the countries of South-east Asia are of particular importance.
Almost half New Zealand's overseas trade is with the countries of the Pacific Basin and is growing steadily.
Private initiative, with Government assistance, has been able to develop new markets, new products, new selling processes, and new economic and commercial relationships. A pattern of regular economic consultations with our main trading partners has been developed; bilateral economic agreements have been concluded.
Aid activities have been expanded. In the early 1950s aid programmes, except for assistance to New Zealand's own Pacific territories, were largely directed towards the Indian subcontinent in the form of capital grants, which called for little direct New Zealand participation. Since the mid 1950s, technical assistance programmes have been enlarged to bring students to New Zealand and send New Zealand experts into the area. Aid activities now include New Zealand's industrial and engineering skills as well as those in the more traditional agricultural and health fields. New Zealand has become a full member of the Economic Commission for Asia and the Far East (ECAFE), a member of the Asian Development Bank (ADB), and a participant in other international bodies co-ordinating aid to countries in the region.
New Zealand's overseas representation has been expanded in response to the growth in New Zealand's interests and involvements overseas. In 1955, when a New Zealand mission in Singapore was established, New Zealand had full diplomatic representation in only four countries in the Pacific area (the United States, Canada, Japan, and Australia). With the opening of posts in Santiago and Lima in 1972, the number of full diplomatic posts in the Asian/Pacific area was increased to 15. This diplomatic network enables New Zealand to assess external events in the light of this country's own interests and needs and to work directly with other countries in areas of common concern. New Zealand has also developed its political contacts with countries of the Asian and Pacific area in other important ways. Three are worthy of particular note: exchanges of visits by Heads of State and Government Ministers and Parliamentarians; participation in many regional arrangements; and the development of regular bilateral consultations.
Cultural contacts with the countries of the Pacific areas have expanded. For many years New Zealanders looked largely to Britain for cultural inspiration and experience. Today, their horizons have been broadened. New Zealand as a cultural entity is much more aware of its own Pacific area than it was 20 years ago. Professional bodies, sporting associations, private business groups, and universities have direct contacts with similar organisations in other countries of the Pacific area where 20 years ago they had links only with Britain and perhaps Australia. Tourism, the development of civil air links, and the general expansion of cultural interests have also helped bring a wider range of contacts.
New Zealand and the South Pacific—New Zealand has a long history of interest and involvement in the South Pacific. In the latter part of the 19th century Prime Minister Richard Seddon harboured ambitions of a South Pacific empire controlled by New Zealand, and as a result of pressure from Seddon the administration of the Cook Islands and Niue, which were British colonial possessions, was handed over to New Zealand in 1901. The number of New Zealand Pacific dependencies increased when, following the establishment of the League of Nations, Western Samoa, which had been occupied by New Zealand troops at the outbreak of the First World War, became a mandated territory under the administration of New Zealand. In 1925 the Tokelau Islands, part of the Gilbert and Ellice Islands Colony, were ceded by the United Kingdom to New Zealand.
Despite its geographical situation, the acquisition of overseas dependencies in the South Pacific and the ethnic kinship of the Maori and the Polynesian peoples, New Zealand's present identity as a South Pacific country was slow in developing for a number of reasons. Culturally, New Zealand has been closer to Western Europe than to the Pacific. For many years almost all of New Zealand's exports went to the United Kingdom. Politically, New Zealand's outlook was oriented towards Europe and, more recently, South-east Asia. Also the Pacific Islands were, and in some cases still are, administered by other countries.
But during the 1960s there was a dramatic emergence of new nations in the South Pacific. New Zealand encouraged this development in its own territories.
In Western Samoa, which had become a United Nations Trust Territory administered by New Zealand, political and constitutional development was carried forward in accordance with the wishes of the Samoan people. This culminated in the establishment of the independent State of Western Samoa on 1 January 1962. A programme of economic and social development for the Cook Islands was formulated in 1955 and legislative assemblies for the Cook Islands and for Niue were set up in 1957. In 1962 the New Zealand Government gave these bodies full responsibility for allocating the large subsidies granted by New Zealand. In the same year, after the alternatives concerning constitutional development had been submitted to the Island assemblies, the Cooks and Niue chose full internal self-government with a continued association with New Zealand. Events thereafter moved rapidly in the Cook Islands and on 4 August 1965 the Cook Islands became a self-governing nation in free association with New Zealand.
These developments were part of a wider pattern of political evolution in the region. In 1968 Nauru became an independent republic and in 1970 both Fiji and Tonga became independent nations.
It is natural that New Zealand and its South Pacific neighbours should have become very closely associated. One important reason has been the movement of Pacific peoples into New Zealand. Cook, Niue, and Tokelau Islanders are New Zealand citizens and move freely back and forth. New Zealand's historical association with Western Samoa, which is reflected in the Treaty of Friendship signed in August 1962, has also resulted in a steady flow of immigrants from that country.
New Zealand has also played an active role in building up regional co-operation in the South Pacific. A major step in this direction was the creation of the South Pacific Forum comprising the independent and self-governing countries of the South Pacific, Fiji, Nauru, Tonga, Western Samoa, the Cook Islands together with Australia and New Zealand which, at the invitation of New Zealand, met for the first time in Wellington in August 1971. Since then meetings have been held in Canberra, Suva and Apia. The South Pacific Forum provides the opportunity for the leaders of the South Pacific states to discuss common problems, exchange information, consider priorities and plan programmes. The topics considered include such matters as regional trade, shipping, telecommunications, education, law of the sea, disaster relief, and nuclear testing.
At the Canberra session of the South Pacific Forum members agreed to establish the South Pacific Bureau for Economic Co-operation (SPEC) to deal with trade and related matters. The main purpose of the SPEC is to advise Forum members on ways of promoting regional trade and free trade among Island members and to encourage collaboration in areas such as regional transport which will assist the economic development of the Island members.
The South Pacific Commission, created in 1947 by the Canberra Agreement of which New Zealand is a signatory, is the other major regional body. It is composed of representatives of the administering powers in the Pacific—the United Kingdom, the United States, France, Australia, and New Zealand—together with Fiji, Nauru, and Western Samoa. Since its establishment the commission has done much useful work in promoting the economic and social welfare of the South Pacific peoples. It is primarily a technical assistance organisation. Its budget for 1974 is A$1,991,258. This includes voluntary contributions of A$250,000 each from Australia and New Zealand and A$50,000 from France, all of which were made in 1973. Within the South Pacific Commission the South Pacific Conference is of particular importance. The conference, which meets annually and is attended by representatives of all the countries of the region, has helped build up a sense of regional identity. The conference decides the work programme of the commission and the priorities within the work programme.
The Thirteenth South Pacific Conference, which met in Guam in September 1973, recommended that the meetings of the commission and the conference be merged. This will remove the colonial implication in the division drawn between metropolitan powers and dependent territories, and will thus bring the organisation more into conformity with political realities in the region.
The United Nations and its Specialised Agencies are also an important source of technical assistance in the South Pacific. The independent countries of the region are members of various UN bodies and the UNDP has a regional office in Western Samoa. They are also members of the Asian Development Bank and receive loans from it to promote their economic development.
The political changes in the South Pacific which began with Western Samoa's independence are continuing. Papua New Guinea became self-governing in December 1973. Niue became self-governing in free association with New Zealand on Constitution Day, 19 October 1974. It is written into the Niue Constitution Act 1974 that New Zealand will continue to be responsible for the external affairs and defence of Niue, that Niueans will remain New Zealand citizens, and that New Zealand will provide necessary economic and administrative assistance. In an exchange of letters between the New Zealand Prime Minister and the Premier of the Cook Islands in April 1973 clarifying the special relationship between the Cook Islands and New Zealand, it was agreed that there are no legal of any kind upon the freedom of the Cook Islands to make their own laws and control their own Constitution. Although New Zealand has a statutory responsibility for the external affairs and defence of the Cook Islands, it is intended that the Cook Islands be free to pursue their own policies and interests in these as well as other areas.
New Zealand continues to have responsibility for the Tokelau Islands which have expressed through their councils and fonos a wish to retain their association with New Zealand. There is a measure of self-government in the Tokelau Islands and the people are normally consulted fully before any major decisions affecting them are taken. At the request of the fonos the New Zealand Government has embarked on a pilot scheme to resettle Tokelauans in New Zealand.
New Zealand in the United Nations—If New Zealand is better known in international affairs than some other small states, this is, in some measure at least, because of New Zealand's record of active participation in the United Nations.
New Zealand's share of the United Nations' regular budget is 0.32 percent. In 1974 this meant a New Zealand contribution to the organisation of US$608,175.
United Nations Security and Peace-keeping Activities—New Zealand Governments have acted upon the conviction that it is only through the United Nations that an effective and comprehensive collective security system can eventually be developed and disarmament achieved. At San Francisco in 1945 the New Zealand Prime Minister, the Right Hon. Peter Fraser, argued forcibly but unsuccessfully to eliminate the veto and to strengthen the collective security provisions of the United Nations Charter. Within the United Nations New Zealand has sought to remove the causes which might produce the need for recourse to collective security action. Its representatives have urged that the Assembly be used for harmonising relations between nations; they have voiced the need for restraint in the pursuit of national objectives; they have consistently sought and supported responsible action in aid of an effective international organisation; and they have reiterated the need for the early adoption of a broad programme of supervised disarmament.
New Zealand was elected to the Security Council for the years 1954 and 1955, and for a second term in 1966 when membership of the Council was increased from 10 to 15.
New Zealand has also advocated adequate and timely preparations in case aggression should occur and has supported development of the United Nations' capacity for peace-keeping. New Zealand has been prepared to play its part; forces were supplied to the United Nations Force in Korea and military observers to the United Nations observer groups in Palestine, Kashmir, and Lebanon; and a civilian police unit served in Cyprus.
While recognising that the objective of developing the United Nations' potential in security and peace-keeping is a long-term one, the New Zealand Government has indicated its interest in making a practical contribution by training some New Zealand military units to take part in future United Nations peace-keeping operations.
Economic and Social Activities—In addition to this concern with international peace and security, other aspects of the work of the United Nations have attracted increased attention in recent years. Article 55 of the United Nations Charter recognises that peaceful and friendly relations among nations depend largely on conditions of economic and social progress. Advancement in these latter fields absorbs annually more and more of the United Nations' resources, and represents at least one area in which international goodwill and co-operation are being given practical expression. First the 1960s and now the 1970s have been designated as “development decades” and an international development strategy—an overall plan setting targets for development during the second decade—was adopted by the Twenty-fifth Anniversary Commemorative Session in 1970
More recent concern has focussed additionally on the problems of the environment and an international conference held in Stockholm in 1972 set up for the first time United Nations machinery to co-ordinate future world-wide activity in this important sphere.
The United Nations body with primary responsibility in the wide-ranging economic and social field is the Economic and Social Council (or ECOSOC), an elective body of 27 members, which co-ordinates the activities of the bodies active in these fields, ranging from the functional commissions and committees of the United Nations itself to the autonomous specialised agencies.
The biggest single task now facing ECOSOC is to promote and direct programmes for economic development in the less-developed countries. New Zealand had always recognised the need for this. Its interest in social and economic questions is illustrated by its membership of ECOSOC from 1947 to 1949, 1959 to 1961, and from 1971 to 1973. New Zealand in 1963 became a full regional member of the Economic Commission for Asia and the Far East (ECAFE)*, a body of which it had previously been a non-regional member. The general trend towards closer ties with Asia further demonstrated by membership of the Asian subgroup of various international bodies such as the ILO Asian group, and the AOPU (affiliated body to the UPU) and by participation in the UNESCO Conference on Cultural Policy in Asia which was held in Jogjakarta in 1973. New Zealand has also served terms of office from time to time on the Status of Women Commission, the Technical Assistance Committee, and on the Statistical, Social, Population, Human Rights and Fiscal Commissions. New Zealand is currently serving on the Statistical Commission, the Committee on Science and Technology for Development and the Governing Council of the United Nations Development Programme (until December 1976).
Specialised Agencies—New Zealand is a member of all the specialised agencies, except the International Development Association, and is also a member of the International Atomic Energy Agency (IAEA), which, though not strictly a specialised agency, exists under the aegis of the United Nations. New Zealand's contributions to the regular budgets of the agencies, which are based for the most part on a scale of assessment similar to that used in the United Nations itself, will total US $1,279,244 in 1974. New Zealand has also subscribed capital to the financial agencies.
Convinced of the value of the form of international co-operation that the agencies represent, New Zealand participates actively in their work. In the case of the technical agencies. there are direct benefits to New Zealand in membership. Membership of the Universal Postal Union, for example, is essential to facilitate the efficient international movement of mails to and from this country; and the International Telecommunication Union works to promote the most rational and efficient operation of world-wide telecommunications services. The World Meteorological Organisation is the medium for establishing a world-wide network for the rapid exchange of meteorological information, which is of particular value to remote island countries like New Zealand. In other cases. New Zealand benefits by the free interchange of knowledge and experience, and from the endeavours of the agencies to establish world-wide standards of safety, to facilitate international traffic, and to examine restrictive or discriminatory practices in these fields. The ILO is concerned with protecting the basic dignities and freedoms of the wage earner and brings together representatives of governments, employers, and workers to frame international conventions on working and living conditions.
In addition to its contributions to the regular budgets of the agencies, New Zealand gives voluntary assistance in the form of further monetary grants, the services of experts to developing countries (for example in agriculture, physiotherapy, police work, forestry, and education) and donations of equipment or commodities.
*Since renamed Economic and Social Commission for Asia and Pacific (ESCAP).
In March 1973 the Government announced substantial increases (to some $27 million in 1973-74) in New Zealand multilateral aid programmes under United Nations and other auspices as part of the Labour Government's policy of progressively increasing the proportion of gross national product (GNP) allocated to aid to reach, by 1975-76, the internationally accepted target of 0.7 percent of GNP in official development assistance. In announcing this decision the Prime Minister indicated that the Government planned to play its part in leading New Zealand to the goal of 1 percent of GNP in total resource transfers, stressing that the co-operation of the general public and the business community would be required if New Zealand was to attain this target. Increases in New Zealand's multilateral contributions have included NZ$550,000 to the World Food Programme in 1973-74 as against expenditure of $235,000 in 1972-73; a 100 percent increase in New Zealand's contribution to UNICEF to $300,000; a five-fold increase in New Zealand's pledge to the United Nations Fund for Population Activities and the International Planned Parenthood Federation (to $200,000); a greater contribution to the United Nations High Commissioner for Refugees (from $25,000 to $45,000); and a pledge of $1.5 million for 1973-74 to the United Nations Development Programme, compared with $600,000 in 1972-73. (Details and statistics of New Zealand development assistance programmes are set out in a later part of this section headed “New Zealand's Aid and Other Resource Flows to Developing Countries”.)
New Zealand's membership of the International Bank for Reconstruction and Development, the International Monetary Fund, and the International Finance Corporation allows this country to participate in international efforts to increase the stability of international trade and promote the economic development of the underdeveloped areas of the world. It also serves to strengthen New Zealand's own economic position by providing access to more varied sources of capital for capital projects or for balance of payments purposes.
New Zealand is also a foundation member of the Asian Development Bank, established in 1967 under the auspices of ECAFE to foster economic growth and co-operation in the Asia/Pacific region.
New Zealand has supported United Nations agency activity which will help the social and economic development of the Pacific Islands. Examples of such projects are: the work of WHO in eradicating yaws and tuberculosis; FAO's efforts to control the rhinoceros beetle which ravages much of the islands' coconut crops, and its support for a regional fisheries development agency; the establishment by UNESCO of a curriculum development unit at the University of the South Pacific; the placement in Suva of a development assistance team, backed by ECAFE and the specialised agencies.
New Zealand has in the past served on the governing bodies of FAO, UNESCO, and UPU, and was a member of the Executive Board of WHO from 1972 to 1974. Although, because of its size and limited scale of contributions, New Zealand is not likely to be elected frequently to the boards of at least the larger agencies, it can expect, over the years, to bear its share of administrative responsibility within them.
Conference on Trade and Development (UNCTAD)—As a result of the United Nations Conference on Trade and Development held in Geneva in 1964, the General Assembly agreed to hold a triennial conference on trade and development with the objective of promoting international trade, particularly between countries at different stages of development, with a view to accelerating the economic growth of developing countries. UNCTAD held its second session in New Delhi in 1968 and its third in Santiago in 1972. UNCTAD is the United Nations body generally responsible for all matters relating to trade development. It is open to all United Nations members and other states who are members of the specialised agencies and the International Atomic Energy Agency. The conference has become a permanent organisation, with a trade and development board which conducts the affairs of the organisation between plenary conferences. New Zealand has been a member of the board since its foundation. There are also within the organisation functional committees on commodities, manufactures, finance invisibles, shipping, technology and preferences. New Zealand has been a member of most of these committees.
GATT—New Zealand has been a contracting party to the General Agreement on Tariffs and Trade since its inception in 1947. Although not strictly a specialised agency, the GATT has assumed some of the characteristics of one, and its activities have extended into all aspects of international trade, including more recently, measures to liberalise non-tariff barriers to agricultural trade and to provide special export opportunities for the goods of the developing countries. A major round of tariff negotiations has been initiated.
OECD—In May 1973 New Zealand was accepted into full membership of the Organisation for Economic Co-operation and Development (OECD). The OECD, founded in 1961 as a successor to the Organisation for European Economic Co-operation, has a membership of 24 countries—19 from Europe plus the United States, Canada, Japan, Australia, and New Zealand. Yugoslavia has a special status in the organisation. The main role of OECD is to promote co-operation among governments in all fields of economic and social policy. Its activities cover not only economic and monetary questions, but also agriculture, the environment, science, education, manpower, industry, and energy. An important part of OECD's activities is to assist its members to discharge, in the most effective way possible, their responsibilities towards the developing countries of the rest of the world. (See special article at pages 1064-67 of the 1973 issue of the Yearbook.)
(Further details of New Zealand's trading relations are set out in section 22, “External Trade”.)
New Zealand's Defence Policies—Since the Second World War the international scene has been clouded in large measure by the cold war. New Zealand was affected by the tensions of the period and took steps to provide for its defence in concert with its allies. As a small country with limited resources, New Zealand alone was not able to defend its extensive but isolated territory against aggression by any militarily significant power. It therefore supported efforts to give effect to the provisions of the United Nations Charter which looked to the creation of a universal system of collective security. In the meantime it accepted that it should act in concert with like-minded countries in order to strengthen its security in its own region.
Recent developments in international affairs—especially the improvement of the United States' relations with China, the cease-fire in Vietnam, the growth in the number of major power centres (multipolarity)—have led to a relaxation of tensions that has lessened the likelihood that New Zealand might be involved in war. Changes in United States policy, which now emphasises that the primary responsibility for long-term stability in Asia rests with the countries of the area, and the large reduction of the British defence presence outside Europe have given new impetus to regional initiative. The relaxation of cold war tensions has given New Zealand and other small nations greater freedom of action but it has also reinforced the requirement for closer collaboration on a regional basis. It has also meant that New Zealand's relations with the countries of South-east Asia are no longer to be regulated primarily by defence considerations.
The Labour Government elected in 1972 is anxious both to build up closer bilateral links with the countries of South-east Asia and the South Pacific, and to encourage the growth of regional cooperation. By means of staff exchanges, exercises, training programmes, and the provision of facilities, New Zealand and several of the countries in the area contribute to one another's defence capacity and preparedness. In addition, New Zealand retains its membership of multilateral regional defence groupings, the major one of which is the Five Power Defence Arrangement relating to Malaysia and Singapore.
The Five Power Defence Arrangement—New Zealand's defence association with Malaysia and Singapore began before the two countries became independent. In 1955 New Zealand agreed to contribute with Britain and Australia to a Commonwealth Strategic Reserve to be established in Malaya and Singapore. Under the terms of the Anglo-Malayan Defence Agreement (subsequently extended to Malaysia on its formation in 1963 and accepted as applying also to Singapore after the latter's change to separate existence in 1965), the United Kingdom undertook to assist in the defence of Malaya and maintained extensive forces for this purpose. In 1959 New Zealand together with Australia were associated with AMDA by an exchange of letters with the Malaysian authorities.
In line with the political and constitutional changes which had taken place in the area during the 1960s, Britain withdrew the greater part of its military forces in South-east Asia in 1971. The Anglo-Malaysia Defence Agreement was terminated in October 1971. The five countries which had co-operated in accordance with the terms of the agreement, Britain, Malaysia, Singapore, Australia, and New Zealand, as a consequence, set up the Five Power Defence Arrangements which came into effect in November 1971.
The basis of the Five Power Defence Arrangement is not a formal treaty or agreement but a statement incorporated in the communique of the meeting of Ministers of the five powers held in London in April 1971. At that meeting the Ministers declared, in relation to the external defence of Malaysia and Singapore, “that in the event of any form of armed attack externally organised or supported or the threat of such attack against Malaysia or Singapore, their governments would immediately consult together for the purpose of deciding what measures should be taken jointly or separately in relation to such attack or threat”. The Ministers agreed to establish an Air Defence Council to provide direction to the commander of an integrated air defence system for Malaysia and Singapore, which was established on 1 September 1971; they also decided to set up a Joint Consultative Council to provide a forum for regular consultation at senior official level on matters relating to the defence arrangement.
New Zealand's military contribution to the Five Power Defence Arrangement includes one battalion, a frigate regularly stationed at Singapore, medium-range transport aircraft and helicopters, and strike aircraft periodically deployed to the area from New Zealand. Underlying New Zealand's participation in the Five Power Defence Arrangements is the belief that defence co-operation of this kind contributes significantly to the maintenance of stability and the continuation of development in the region as a whole.
The new Australian Government decided in 1973 to end its deployment of ground forces by reducing their number progressively over an 18-month period up to April 1975. The Australian Mirage squadrons, based at Butterworth in Malaysia, and the naval contribution would remain. Australia would continue its support for the Five Power Arrangement. Commenting on this decision the New Zealand Prime Minister in July 1973 said that there was no question of New Zealand forces being withdrawn in the near future. It is agreed that they will remain as long as New Zealand and its two regional partners find it mutually advantageous and desirable. The Prime Minister also said that in line with the Government's expressed wish for closer bilateral relations with South-east Asian countries, new arrangements occasioned by the Australian withdrawal would emphasise the national character of New Zealand's contribution.
In accordance with this emphasis the New Zealand forces in South-east Asia were grouped into an independent New Zealand command entitled “The New Zealand Force in South-east Asia”, on 31 January 1974.
Parallel with their assistance to Malaysia and Singapore in the defence field, New Zealand, Australia, and Britain have for some 20 years maintained defence arrangements among themselves known first as ANZAM and after 1971, following the changes in Britain's role east of the Suez as ANZUK. These arrangements have not been organisations established by formal treaty and the three countries have agreed to maintain their longstanding practice of close defence consultation and cooperation. The expression “ANZUK” however which, like ANZAM, was associated with the formerly combined command in South-east Asia is likely to fall into disuse.
SEAT—Eight governments—Australia, Britain, France, New Zealand, Pakistan, the Philippines. Thailand, and the United States—signed the South-east Asia Collective Defence Treaty, also known as the Manila Treaty, on 8 September 1974. Pakistan formally withdrew from the organisation in 1973 and France, while remaining a signatory of the Manila Treaty, has given up any role in the day-to-day co-operative activities established under it. Under the terms of the Manila Treaty, each party recognised that aggression by means of an armed attack in South-east Asia or the South-west Pacific against any of the parties or against “a protocol state” would endanger its own peace and safety, and agreed that it would act to meet the common danger in accordance with its constitutional processes. In the event of any other threat, the parties would consult on the measures to be taken for the common defence.
The South-east Asia Treaty Organisation (SEATO) established under the treaty is headed by a council, made up of the foreign ministers of the signatory governments, which meets annually in members' capitals. Between meetings a body known as the Council Representatives provides continuity with representation generally provided by the heads of member countries' diplomatic missions in Bangkok; New Zealand is thus represented by its Ambassador to Thailand. The organisation set up under the treaty has also undertaken activities intended to foster the security and stability of the regional member countries and to carry out, on a modest scale, projects designed to promote their economic and social development. It has, for example, sponsored research in the fields of tropical medicine, agriculture, and engineering.
Despite the advantages SEATO provided during the earlier years of its existence, it had a number of inherent weaknesses from the start (e.g., more members outside the region than within it, regional members not contiguous, varying points of view among a widely scattered membership), which gradually made it less relevant to the needs of the region as time passed. The end of the United States confrontation with China and of the military tensions that it created has accentuated the need to adapt SEATO to present-day realities.
Nevertheless, a number of SEATO countries wish to see the Manila Treaty remaining in effect at a time of major change within the region. A major review, which New Zealand fully supported, was held at the SEATO Council Meeting in September 1973 with the aim of making the organisation more relevant to the needs of the region. As a result of this review, the organisation has become more compact, military planning has ceased, and there is less emphasis on military preoccupations. Greater weight is being placed on civil security and on economic and social programmes. Opportunities for co-operative training exercises remain.
ANZUS—There is no direct threat to the security of the New Zealand homeland at present. In the unlikely event of such a threat materialising New Zealand would be able to turn for assistance to its partners in the ANZUS Pact. This tripartite security treaty between Australia, New Zealand, and the United States was signed at San Francisco on 1 September 1951 and came into force on 29 April 1952. It assured New Zealand and Australia of American support in the event of aggression in the Pacific.
The main provision of the ANZUS Pact is that each party recognises “that an armed attack in the Pacific area on any of the parties would be dangerous to its own peace and safety and declares that it will act to meet the common danger in accordance with its constitutional processes”. In the context of the agreement, an armed attack on any of the parties is deemed to include “an armed attack on the metropolitan territory of any of the parties or on the island territories under its jurisdiction in the Pacific or on its armed forces, public vessels, or aircraft in the Pacific”.
In the absence of any foreseeable need to invoke the security provisions of the treaty, ANZUS can be seen as a durable expression of a strongly-based community of interest and attitude among the three democracies that are parties to it. The close relationship among the three countries is reflected in the informality and ease of their consultation under the ANZUS Treaty. Meetings of the Council of Ministers are generally held once a year to discuss matters of common interest.
NEW ZEALAND'S AID AND OTHER RESOURCE FLOWS TO DEVELOPING COUNTRIES—New Zealand aid is designed to help foster economic and social development and raise living standards in the less affluent countries, particularly New Zealand's near neighbours in the South Pacific and South-east Asia. The determining factor in the type of aid is the needs of the recipient countries themselves.
But aid as commonly understood does not represent the entire resource flow to developing countries. New Zealand's total resource flow (the transfer of goods, services, and capital) to developing countries takes four forms: official development assistance (ODA), other (or non-concessional) official flows, private flows and grants by voluntary agencies (GVA). The internationally recognised resource flow targets, which New Zealand hopes to reach by 1975-76, are 0.7 percent of GNP (at market terms) for ODA and 1.0 percent of GNP for the total resource flow.
Only the ODA target can be regarded purely as an aid target. While ODA and GVA are both flows at concessional terms, and are both directed at promoting economic and social development no separate target exists for GVA. But such flows clearly have a development intention. The remaining non-ODA flows in the overall 1 percent target are of a commercial nature, related to investment or long-term export credits and other lending. They are included because they have potential development impact, whatever the intention or motivation of those involved.
This basic distinction is drawn because ODA is able to be directly influenced by Government policy measures to increase its volume or soften its terms, whereas the bulk of non-ODA flows for most countries are governed mainly by the opportunities arising for gainful commercial transactions.
Total Resource Flow and its Components 1973-74—For the year ended 31 March 1974 (1973-74), the estimated total flow of resources from New Zealand to developing countries was $29,095,000, comprising:
| $(000) | |
|---|---|
| *Bilateral ODA $17,321,923. | |
| Official development assistance | 24,961* |
| Other official flows | — |
| Private flows | 202 |
| Grants by voluntary agencies | 3,932 |
| Total resource flows | 29,095 |
For 1972-73 the total for ODA was $21.01 million and that for the total resource flow was estimated at $32.82 million. The total resource flow included $2.7 million in private flows and $5.0 million in other official flows. In 1973-74 official development assistance amounted to 0.3 percent of estimated GNP (at market prices).
A. Official Development Assistance—Bilateral—During 1973-74 bilateral official development aid went mainly to the countries of the South Pacific ($9.4 million) and to Asia ($7.3 million).
In Asia, our major countries of concentration were Indonesia ($2,009,132), Malaysia ($1,126,684), Bangladesh ($397,364), the Republic of Vietnam ($708,803), Thailand ($835,625), the Khmer Republic ($236,881), the Philippines ($520,258), India ($178,970), the Republic of Korea ($205,010), Laos ($170,567), and Pakistan ($105,196).
In the South Pacific, the Cook Islands ($3,924,647), Niue ($1,596,800), Fiji ($687,226), Western Samoa ($1,436,786), the Tokelau Islands ($459,151), and Tonga ($426,625) received the bulk of the ODA expenditure, with a substantial amount ($432,136) being devoted mainly to the University of the South Pacific in Fiji.
The following table sets out bilateral ODA in 1973-74 by purpose and sector.
| Purpose and Sector | Amount | |
|---|---|---|
| Technical Co-operation (by area of expertise)—$ | $ | $ |
| Agriculture and forestry— | ||
| Agriculture | 465,844 | |
| Forestry | 160,345 | 626,189 |
| Transport and communications— | ||
| Transport | 954,772 | |
| Communications | 7,241 | 962,013 |
| Energy resources— | .. | |
| Power generation (including geothermal) | .. | 515,851 |
| Industry: Mining | .. | 421,945 |
| Social sector— | ||
| Education | 2,217,864 | |
| Health/medical | 283,203 | |
| Water supply | 275,894 | 2,776,961 |
| Other | 301,872 | .. |
| Total technical co-operation | 5,604,831 | .. |
| Capital Assistance (by sector)—$ | $ | $ |
| Agriculture and forestry— | ||
| Agriculture | 443,882 | |
| Forestry | 166,708 | 610,590 |
| Energy resources: Power generation | .. | 250,000 |
| Transport and communications— | ||
| Transport | 1,315,940 | |
| Communications | 2,000 | 1,317,940 |
| Social infrastructure— | ||
| Education | 1,008,382 | |
| Health | 855,965 | |
| Housing | 211,994 | |
| Water supply | 168,743 | 2,245,084 |
| Other | .. | 5,136,541 |
| Total capital assistance | .. | 9,560,155 |
| Non-project Assistance— | ||
| Contributions to finance current imports— | ||
| Food aid | 235,076 | |
| Relief aid | 343,234 | |
| Loans | 620,000 | 1,198,310 |
| Contributions not directly linked with imports— | ||
| Balance of payments support | 100,066 | |
| Budgetary support | 151,980 | 252,046 |
| Total non-project assistance | .. | 1,450,356 |
| Total bilateral ODA | .. | $17,321,923 |
Technical co-operation or assistance relates to the provision of know-how or technical expertise, in the form of training facilities (education of students and trainees) or advisory personnel (experts and consultants).
Capital assistance provides resources to increases the stock of physical capital such as buildings, aeroplanes, equipment, materials, livestock, and so on.
Non-project assistance comprises assistance which cannot be identified directly with an investment scheme or project. The substantial budgetary support represented aid to the Cook Islands, Niue, and the Tokelau Islands with general administration, including superannuation schemes and refinancing the public debt.
In the following table bilateral ODA is shown by programme.
| $ | |
|---|---|
| Bilateral Aid—Asia and the Pacific (BAAP) | 9,002,688 |
| Commonwealth Education Scheme (CES) and Medical Aid (CMAP) | 149,961 |
| Disaster Relief | 450,197 |
| Maori Affairs Department for South Pacific | 5,599,660 |
| Ministry of Transport for South Pacific | 456,584 |
| Trade credit (to Indonesia) | 554,106 |
| Western Samoa Aid Programme (WSAP) | 417,455 |
| Other programmes | 565,272 |
| Regular contributions to the programme of CORSO and VSA (Volunteer Service Abroad) | 126,000 |
| Total bilateral ODA | $17,321,923 |
The programme BAAP has continued to be the main vehicle for economic aid to the Colombo Plan countries in Asia. This programme was established when the former Colombo Plan item was expanded in 1970 to include countries and territories in the South Pacific, Fiji, Tonga, and Western Samoa.
Expenditure by the Maori Affairs Department was concentrated on the Cook Islands, Niue, and the Tokelau Islands. It included technical and capital assistance as well as loans. The Ministry of Transport contributed towards regional civil aviation costs in the South Pacific.
CES and CMAP were used almost entirely for technical co-operation activities, mainly in the South Pacific, Asia, and Africa. These are New Zealand's only bilateral ODA programmes devoted specifically to the Commonwealth.
The Disaster Relief programme is flexible, liable to fluctuate from year to year, and on occasions supplemented by expenditure from other programmes. Such funds are typically called on after earthquakes, famines, floods, and other disturbances to provide food and materials to assist refugees and aid reconstruction.
The Indonesian trade credit has been renewed twice since 1970 and is sufficiently soft to qualify as ODA.
Further technical and capital assistance is provided under SAF (with expenditure in the Philippines, Thailand, and the Republic of Vietnam), SPAP (spent in Papua New Guinea, Tonga, and on regional items, particularly the University of the South Pacific in Fiji) and WSAP.
B. Official Development Assistance'Multilateral 1973-74—Of the expenditure on multilateral ODA, the largest portion represented contributions to the ordinary capital ($1,195,650), Multi-Purpose Special Fund ($411,200), and Technical Assistance Special Fund ($75,000) of the Asian Development Bank. This bank now has as members some independent South Pacific (as well as Asian) countries which New Zealand assists.
New Zealand's long association with multilateral programmes organised by the United Nations and its specialised agencies continued in 1973-74. Contributions were made to the United Nations Children's Fund ($300,000), United Nations Development Programme ($1,500,000), United Nations High Commissioner for Refugees ($45,000), United Nations Relief and Works Agency ($60,000), and the World Food Programme ($748,356).
Other organisations to which New Zealand contributed included the International Development Association ($1 million), South Pacific Bureau for Economic Co-operation ($45,509), South Pacific Commission ($203,390), Asian and Pacific Council bodies ($40,626), the Commonwealth Fund for Technical Co-operation ($100,000), Asian Institute of Technology ($200,643), and the International Planned Parenthood Federation ($100,000).
C. Non-ODA Flows—The private flows consisted almost entirely of long-term export credits to developing countries, net of amortisation. This figure was based on a survey, conducted by the Ministry of Foreign Affairs, of guaranteed credits, and may well be understated. No estimate of private net direct investment by New Zealand companies is available for 1973-74 but the Department of Statistics notes that the total is usually less than $1 million with most of it directed towards the South Pacific. Portfolio investment in developing countries is understood to be zero for the same year.
Another survey by the Ministry provided the estimate of grants by voluntary agencies. This item also is likely to be understated, given the difficulty of covering all agencies which meet the primary criterion of development orientation and the probable exclusion of many ad hoc activities.
Policy on Resource Flows to Developing Countries—By their actions since shortly after the end of the Second World War in extending aid through bilateral and multilateral programmes, New Zealand Governments have shown a willingness to make a contribution towards helping raise the living standards of the people in the poorer countries of the world, particularly those in Asia and the South Pacific. In formulating ODA policy and in actually giving aid, careful attention is paid to the economic and social aspirations of the developing nations themselves to ensure that our assistance contributes to the objectives and priorities of the peoples it is intended to benefit. Emphasis is placed on projects which will make a direct impact on development, will create employment opportunities and will help lift the income of a broad section of the people.
With these considerations in mind, the Government announced in March 1973 that it would make a determined effort over the next three years to reach the internationally recognised target of 0.7 percent of GNP for ODA. This will involve allocating approximately 50 percent additional resources to assistance programmes in each succeeding year to reach a required expenditure level estimated at $62 million for 1975-76. It is realised, however, that the rate at which projects are developed, inflationary trends and the availability of resources may affect the attainment of the third-year target. A particular feature of the ODA policy is a continued marked emphasis on co-operation with New Zealand's neighbours in the South Pacific. Attention is being given also to ways of stimulating the other components of the total flow of resources to developing countries.
The other major elements of the ODA policy adopted by the Government are set out below:
Allocations of bilateral and multilateral ODA were set for 1973-74 in the ratio 70/30 compared with 75/25 for 1972-73. Contributions to development programmes of the United Nations and other multilateral organisations were expanded substantially in the 1973-74 year.
Allocations for the programme Bilateral Aid—Asia and the Pacific of $11.5 million, $16 million, and $21.5 million have been approved for the 3 years commencing 1973-74. Within this programme, which represents our largest bilateral expenditure, aid was offered in 1973-74 for the first time to the British Solomon Islands, the Gilbert and Ellice Islands, the New Hebrides. and Papua-New Guinea.
CONSTITUTION OF NEW ZEALAND: General—New Zealand is a sovereign independent unitary state being in form a constitutional monarchy with responsible government and a unicameral legislature.
In common with the United Kingdom, New Zealand has no single written instrument purporting to be its supreme or fundamental law. Its constitution is contained in the statutes of the Imperial and New Zealand Parliaments and the decisions of the superior courts of both jurisdictions. Some statutes have greater constitutional significance than others.
To the extent that its constitution is unwritten it is flexible, but restraints by way of conventions prevent, at least in normal circumstances, arbitrary or improper alteration of the constitution and the abuse or misuse of legislative or executive power.
Statutes such as the New Zealand Constitution Act 1852 (United Kingdom) recite law which, by reason of political, legal, and social development, may appear obsolete. If the spirit of the law in such a case cannot readily be observed by the use and development of convention, the law may be repealed, cf. Constitution Amendment Act 1973 (New Zealand). On the other hand, some conventions may be translated into substantive law after a period of time. Thus, the Civil List Act 1950 provides that no person may be appointed or remain a Minister of the Crown unless concurrently, he is a member of the House of Representatives.
The fundamental canon of the constitution is that Parliament is supreme or “sovereign”. The question as to where sovereignty lies does not arise in the sense of its vesting in the people or the legislature or the monarch. Nor can it be argued, except in a very loose sense, that the legislature reflects and executes the will of the people. Reality dictates that the will of the people is expressed through the ballot box in choosing its government and legislature. That is not to say that individuals and organisations do not express their views on measures which may become law but their voice and influence is limited, if only paradoxically, by the very nature of government which the country possesses, that is, representative and responsible.
The constitutional theory of the separation of powers does not operate fully in New Zealand. The Executive Government consists of members of the legislature who are appointed by the Governor-General as Ministers of the Crown but who are, in practice, those members of the government party who are elected to the ministry by their parliamentary fellows through caucus. Strictly speaking, ministers, being members of the legislature, are thereby “responsible” to it for their actions and those of their departments. Moreover, the Executive Government, collectively, is held to be answerable in the same way for its policies and the means of implementation. However, for so long as the two-party system continues to operate in New Zealand so that one party, gaining a majority at the polls, becomes the government of the day, the quantum of responsibility will depend largely on that government's observance of the conventions surrounding the concept. The rigours of individual ministerial responsibility have been eroded to the extent that where it is a question of the appropriate Minister being in the position of respondeat superior for the acts or omissions of his officers or department, the convention that he should resign appears to have fallen into desuetude. Constitutional and political writers appear to be in favour of that convention's demise.
The Sovereign—The Queen, in right of New Zealand, is styled: “Elizabeth the Second, by the Grace of God Queen of New Zealand, and Her Other Realms and Territories, Head of the Commonwealth, Defender of the Faith”, Royal Titles Acts 1953 and 1974.
Being a constitutional monarchy, the Sovereign's powers are defined and circumscribed, first by law and then by convention.
In the Sovereign's absence, most of the royal powers are exercised by her representative, the Governor-General, in terms of the 1852 Act and the Instructions and Letters Patent of 1917. It should be noted that the Governor-General is not a viceroy and it would therefore be possible but unlikely for him to act ultra vires. By convention, the Queen and the Governor-General avoid becoming embroiled overtly in the “politics” of government, although the Sovereign and Governor-General remain an integral part of the legislative process.
Many of the formal procedures associated with government and administration require the participation of the Queen or Governor-General, inter alia, summoning, proroguing, and dissolving Parliament; assenting to measures passed by the House so as to give them the force of law; appointing judges of the Supreme Court and senior officials of State; appointing ministries and individual Ministers; conferring knighthoods and other honours. Most of the royal functions will be performed on advice of the Executive Government and little, if any, information is available as to whether this advice has always been taken without demur within the last 70 years. To reject advice would place the Governor-General in a very difficult situation, his appointment and tenure being at the pleasure, ultimately, of the New Zealand Government. Learned writers have suggested that he would only refuse to act on advice were he reasonably certain that he could find another member of the legislature willing and able to form a government enjoying the confidence of the House or, if this were not feasible, that his rejection would be vindicated by the electorate were he to dissolve Parliament and cause a general election. To reject advice otherwise, or fail having tried the alternatives, would be to invite his own recall.
Speculation remains, of course, on whether the Governor-General would reject advice even in the circumstances outlined above. The question is to determine how much real power, active or residual, is now possessed by the Governor-General. Recent amendments to the 1852 Act have shorn the Governor-General of the legal basis of powers which have lapsed already, in great part, by operation of convention.
Nevertheless it should not be supposed that the Sovereign or the Governor-General have become constitutionally redundant. Many of the powers held and exercised by the Executive Government arise by virtue of the royal prerogative, defined by Dicey as the “residue of discretionary or arbitrary authority, which at any given time is legally left in the hands of the Crown”. While many of the prerogative powers have been superseded by statute (there is debate on whether the prerogative is thereby extinguished or continues to subsist), substantial areas remain untouched, the majority of prerogative powers being exercised by Ministers with or without reference to the Governor-General.
Although calls for its abolition are made from time to time, the Monarchy seems to be an accepted part of New Zealand's constitutional and political structure although overt involvement in the political arena whether by the Queen or the Governor-General might well have the effect of engendering substantial support for abolition.
Parliament—With the abolition of the Legislative Council (Upper House) in 1950. Parliament, for most purposes, has consisted of the Governor-General (the Queen when resident in New Zealand) and the House of Representatives. By convention, this has come to mean the House of Representatives—the Governor-General exercising only those constitutional powers which serve to confer on measures before the House and passed by it, the force of law.
The New Zealand Parliament is a creation of the United Kingdom Parliament and, unlike its creator, cannot claim to be a court of record. However, it has followed Westminster and acts as a court of equity in so far as it will hear petitions from individuals and groups. The basic rule is that the petitioner(s) must have exhausted all available legal and equitable remedies, if the subject matter of the petition if litigious.
By Act, the Parliament claims and possesses all privileges, rights, and immunities, claimed and possessed by the House of Commons as at 1 January 1865. This claim is reiterated by the Speaker to the Governor-General at the time he presents himself for confirmation in his office.
The question of parliamentary privilege escapes precise legal definition. The most that can be said is that the courts will define the ambit of the privilege and within those limits Parliament may do as it will. As yet, the matter has not been tested in a New Zealand court.
The New Zealand Parliament holds plenary power to make laws for New Zealand including those having extra-territorial effect (in this context section 49 of the New Zealand Loans Act 1953 is something of a curiosity). Plenary legislative power was not assumed until 1947 with the passing of the Statute of Westminster (Adoption) Act 1947.
Any residual doubts about the power of the New Zealand Parliament were removed with the passage of the New Zealand Constitution Amendment Act 1973 (New Zealand).
The doctrine that one Parliament cannot bind its successor operates in New Zealand. It would seem therefore that those provisions of the Electoral Act 1956 relating to: (a) the constitution and order of the Representation Commission; (b) the number of European electoral districts, their boundaries based on the total population; (c) the tolerance (5 percent) within which the Commission must work in relation to (b); (d) the age of voting (18 years since 1974); (e) the secret ballot; (f) the duration of Parliament; while expressed as being entrenched by s. 189 of the 1956 Act, in that amendment to any of the above provisions must receive a majority vote of 75 percent or receive the consent of the electors by referendum, are entrenched in a moral sense only. It would be open to any Parliament to repeal section 189 and then proceed to amend or repeal the “entrenched” provisions by ordinary legislation. The same result would be achieved by repealing the 1956 Act in toto.
Meeting, etc., of Parliament—Parliament is summoned, prorogued, or dissolved by the Governor-General and lasts for a maximum of 3 years although there have been some exceptions. The 1852 Act provided for quinquennial Parliaments but this provision was abolished by the Triennial Parliaments Act 1879 which substituted a 3-year term. Since 1881 elections have been held at 3-year intervals except that the term of the Parliament during the First World War was extended to 5 years by special legislation and that of the twenty-fourth Parliament to four by the Electoral Amendment Act 1934. The 3-year term was restored by a 1937 Amendment but the term of the twenty-sixth Parliament was extended to 5 years because of war-time conditions. The 3-year term was enacted in the Electoral Act 1956 and a referendum in 1967 favoured its continuation.
By convention, the Governor-General would accept the Prime Minister's advice to dissolve Parliament before expiry, as was done in 1951, unless the Governor-General were of the opinion that the Prime Minister no longer commanded a majority in the House and that a ministry could be formed without having to hold elections.
Until 1973, sessions (the period between summons and prorogation) usually covered the months June through to November. However, in 1974 Parliament met as early as February and sat until early November. The 1974 session lasted 119 sitting days (a record). Unless provided to the contrary, business introduced during a session and not completed at the time of prorogation, lapses and requires to be re-introduced during the next session.
House of Representatives—For all practical purposes “Parliament” is synonymous with “House of Representatives” but from the constitutional viewpoint distinctions need to be drawn.
The House comprises 87 members with 4 of the electorates being Maori. With certain exceptions, for example, the insane, inmates of penal institutions; any person not being an alien and who is 18 years of age or more may vote in a general election.
The Speaker is elected at the start of a new Parliament and presents himself to the Governor-General for confirmation. The act of claiming the rights, privileges, and immunities of the House and its members can only be described as historical re-enactment when real power has passed from the Monarchy to the Executive Government. It is customary in New Zealand, unlike the United Kingdom, for the Speaker to change according to the government of the day. The Chairman of Committees is also elected soon after the start of a new Parliament. Though he performs the same functions as those performed by his seventeenth century predecessors, the original reason for the House having a Chairman of Committees has never arisen in New Zealand, but the manner and form of the Westminster Parliament has been carried over and maintained in this regard so as to form an integral part of the procedure of the House. That is not to say that the New Zealand House is an antipodean mirror of the Westminster Commons—the differences are many but the form of both Houses is not dissimilar.
The primary functions of the House are to vote supply; pass legislation; to exercise supervision and control of the Government; to consider petitions from individuals or organisations seeking redress for alleged grievances or changes in the existing law. The Opposition may, where necessary or desirable, seek to bring down the Government by a vote of no confidence, although within context of a two-party House the chances of a successful vote in this regard would be very few.
Financial control over the Government is exercised by the House in so far as expenditure of public money must be authorised in the form of an Appropriation Act. A more detailed examination of the Estimates is carried out by the Public Expenditure Committee. However, no appropriation can be made without the recommendation of the Crown (i.e., the Government).
Most Bills are introduced by the Government as a result of decisions made in Cabinet. By convention, the procedure for passing a public Bill is: (a) on introduction, formal first reading; (b) some time after, a second reading which is a debate on the principles and policy underlying the Bill; (c) a clause-by-clause debate with the House sitting as a Committee of the Whole House; (d) the Bill is reported back to the House from the committee and later read a third time. Having passed the three readings, the Bill is printed in its final form incorporating amendments (if any) and sent to the Governor-General for the Royal Assent.
Any member may introduce a Bill. Of course, it is always open to a Government to defeat such a Bill at any stage of its progress. A practice has arisen whereby a private member's Bill will sometimes be withdrawn and substituted by a Government measure incorporating all or some of the provisions in the former Bill although it cannot be said that this is done with every Bill.
Special procedures apply to local and private Bills. A local Bill is one which proposes to affect a particular part of the country and is sought, usually, by the appropriate local authority. Each local Bill stands referred to the Local Bills Committee after its first reading. Its recommendation carries weight with both the House and the Government.
A private Bill is one which applies to a person or group of persons and is introduced after public notice, by a member by way of petition on behalf of the Bill's promoters. It may then be referred to a committee of members for consideration and report.
Delegated Legislation—With the ever-increasing complexity and volume of legislation and the range of subjects which it concerns or touches, the House cannot exercise full and proper control over subordinate legislation authorised by statute. Although all Statutory Instruments* require to be laid before the House and are subject to review by the Statutes Revision Committee, in practice such control has not been required.
It is rare for the Government to accept amendments to legislation from the Opposition although it may sometimes do so if the amendment is constructive and does not conflict overtly with the policy considerations (if any) underlying the measure. Much of the legislation is what might be described as “departmental” in that it is sought by a Government department or agency and does not necessarily affect or reflect the political views of either the Government or the Opposition.
With the increasing load thrust on the House it has become customary for the more controversial or complex pieces of legislation to be referred for further consideration to select committees which comprise usually between seven and nine members, the Government party being in the majority. During the 1974 session, there were some 25 select committees. The aim in using these committees is that it affords a chance for the members to consider the measure in a more detailed fashion and gives individuals and organisations whose interests may be affected, should the legislation become law, an opportunity to state and have their views considered. Changes, sometimes substantial, are made to legislation as a result of this procedure. This practice of lobbying, both by groups and individuals, pervades all facets of political life. It can be argued that those who are familiar with the select committee procedure and used to advancing a particular view are in a superior position in being able to make their views known to the members individually and collectively. While issue cannot be taken with this practice provided no element of bribery or corruption enters into it, nevertheless, it can be argued that those who stand to be affected most by law, whether directly or indirectly, do not have the same opportunity to make their views and ideas known. A number of reasons might be advanced for this contention but primarily it would seem to be a case of the greater bulk of people being unaware of how “to work the system”. Although no empirical research has been done, it would be interesting to be able to isolate the extent to which the influence of lobbyists has or has not contributed towards the increasing use of select committees.
The relations of the House with its members and non-members and the relations of member with member within its precincts are contained in the Standing Orders and the rulings thereon of successive Speakers.
*Statutory Instruments include; Orders in Council, ministerial orders, proclamations, departmental instructions.
Party System—The two major political parties are Labour and National, the former comprising the Government since November 1972.
At a general election any person being qualified as an elector may offer himself for election but it seems that only those who are candidates proffered by a political party have more than a marginal chance of election. The party forming the Government is that which gains the majority of seats, not necessarily the majority of votes cast. Unlike Australia, New Zealand does not have a preferential system of voting nor does the law require everyone to vote, although each eligible elector must register as such. The convention operates that if a Government is defeated at a general election it resigns before the House meets and does not wait to be defeated on a vote in the House. The members for each party form their respective caucuses to which the policies and tactics of the party are submitted for discussion and, where necessary, decision. The discussions of caucus are never published.
Salaries, etc.—Until the making of the Wage Adjustment Regulations 1974, section 27 of the Civil List Act 1950 provided that on the recommendation of a Royal Commission the Governor-General might from time to time, by Order in Council, fix the salaries and allowances to be paid to the Prime Minister and other Ministers of the Crown or members of the Executive Council, to Parliamentary Under-Secretaries, and to the Speaker and Chairman of Committees and other members of the House of Representatives, and that a Royal Commission should be appointed for this purpose within 3 months after the date of every general election of members of Parliament. At April in the intervening years, adjustments were made on a basis matching that for the State Services Remuneration and Conditions of Employment Act 1969; the Government Statistician provided the Prime Minister with a certificate specifying the percentage movements in average weekly ordinary time earnings outside the State Services (as ascertained from the April half-yearly survey of industries in the private sector conducted by the Department of Labour) and adjustments might be made by Order in Council to the salaries of Ministers and members. The 1974 regulations suspend the operation of section 27 of the 1950 Act. The salaries and allowances of Ministers and members of Parliament are now considered and fixed by the Higher Salaries Commission established by the 1974 regulations.
The following table sets out the salaries and allowances payable from 1 April 1974. The amounts are in accordance with the recommendations of the Royal Commission upon Parliamentary Salaries and Allowances 1974.
| Office | Salary | Expense Allowance |
|---|---|---|
*An additional allowance of $2,000 is paid to the Minister holding the portfolio of Foreign Affairs. †Plus travelling allowance $1,275 and house allowance $600. ‡Plus electorate allowance. | ||
| $ | $ | |
| Prime Minister | 27,500 | 5,000* |
| Deputy Prime Minister | 21,000 | 2,150* |
| Minister with Portfolio | 18,000 | 2,000* |
| Minister without Portfolio | 15,500 | 1,600 |
| Parliamentary Under-Secretaries | 13,500 | 1,600 |
| Speaker | 16,500 | 1,500 |
| Chairman of Committees | 14,000 | 900 |
| Leader of the Opposition | 18,000 | 2,000† |
| Deputy Leader of the Opposition | 13,500 | 800 |
| Chief Whips | 12,500 | 2,395‡ |
| Junior Whips | 12,000 | 2,395‡ |
| Members | 11,000 | 2,395‡ |
There is an additional electorate allowance depending on classification of electorates: (a) electorates which are wholly urban, $110; (b) electorates which are substantially urban, $275; (c) electorates which are partially urban and partially rural, $625; (d) electorates which are ordinary rural, $1,100; (e) electorates which are predominantly rural, $1,380. The special additional allowance for Southern Maori electorate is $420 and for each of the other Maori electorates it is $210. The daily sessional allowance is $4 and the night allowance for members entitled thereto is $10.
In addition to the salary and allowances, members are entitled to certain travel concessions and a stamp allowance.
Former Prime Ministers receive an annual payment of $1,000 for each full year in office, with a maximum of $5,000 a year, after retirement, defeat at the polls, or when a member only. This is subject to a 2-year minimum period having been served as Prime Minister.
An amendment in 1973 to the Civil List Act provides that a defeated member of Parliament will continue to receive salary at the rate of an ordinary member for 3 months after the date of the election.
Under the Superannuation Act 1956 there is a compulsory contributory superannuation scheme for members of the House of Representatives. The scheme provides that a retiring allowance shall be payable to a member after 9 years service and the attainment of 50 years of age, and shall be calculated at the rate of one thirty-second of the basic salary for a member as at the date of his ceasing to be a member, for each year of service with a maximum of two-thirds of that basic salary, or alternatively the member may elect to take a variable retiring allowance so as to secure a level income or he may elect to receive a refund of his contributions. The annual contribution is 11 percent of an ordinary member's salary, and the Government subsidises the fund. The rate of contribution was increased by 1 percent from 1 April 1970 to provide for cost-of-living adjustments to be made to retiring allowances. In the case of a male member dying and leaving a widow surviving, she becomes entitled during her widowhood to receive an annuity of half of the retiring allowance to which her husband would have been entitled had he retired age 60 years at the time of his death, or $260 a year, whichever is the greater.
In addition to the foregoing a new member elected for the first time receives a grant of $100 which is a “once only” payment.
ADMINISTRATION AND EXECUTIVE RESPONSIBILITY—After the election of a new Parliament, it is the responsibility of the leader of the party, which is most likely to secure and retain the support of the majority of members in the House, to form a Government. Although procedures for the selection of new Ministers have varied between the two principal parties, the Prime Minister has the final responsibility for allocating portfolios. A portfolio comprises a specific field of Government activity—for instance all matters relating to education will be allocated to one Minister who is henceforth known as the Minister of Education.
A Minister may have more than one portfolio and in addition responsibility for the supervision of one or more Government departments in which the activities carried out, though important, do not rank as portfolios. Occasionally, a Minister is appointed without portfolio, as, for example, an Associate Minister of Finance. There are also Parliamentary Under-Secretaries without Ministerial rank who assist certain Ministers in the work of their portfolios; the Under-Secretaries are not members of the Executive Council or of Cabinet.
Executive Council—In the legal sense those members of Parliament who have been appointed Ministers comprise the Executive Council. The Governor-General normally presides over meetings of the Council. The powers, duties, and responsibilities of the Governor-General and the Executive Council under the present system of responsible government are set out in Royal Letters Patent and Instructions thereunder of 11 May 1917, published in the New Zealand Gazette of 24 April 1919. The Royal Powers Act 1953 provides that the statutory powers conferred on the Governor-General may be exercised either by Her Majesty the Queen in person or by the Governor-General. In the execution of the powers and authorities vested in him the Governor-General must be guided by the advice of the Executive Council; but, if in any case he sees sufficient cause to dissent from the opinion of the Council, he may act in the exercise of his powers and authorities in opposition to the opinion of the Council, reporting the matter to Her Majesty without delay, with the reasons for his so acting.
In any such case any member of the Executive Council may require that there be recorded in the minutes of the Council the grounds of any advice or opinion that he may give upon the question.
The Civil List Act 1950, in section 6, provided that no person shall be appointed a Minister or a member of the Executive Council unless he is a member of Parliament and that a person who ceases to be a member of Parliament cannot continue to be a Minister or a member of the Executive Council for more than 21 days. This gave statutory recognition for the first time to what had long been the convention.
At January 1974 the Executive Council consisted of 20 members. Two members, exclusive of the Governor-General or the presiding member, constitute a quorum.
The Governor-General receives a salary and an allowance which are determined from time to time by the Civil List Act 1950 for the salaries and expenses of his personal establishment, plus all expenditure incurred in respect of the transport to and from New Zealand and the travel within or outside New Zealand of the Governor-General and his family and staff.
Cabinet—The membership of the Executive Council and Cabinet is identical but Cabinet, unlike the Executive Council, is not a body created by any legal document. The existence of Cabinet was not recognised by statute until a passing reference was made in the Parliamentary Commissioner (Ombudsman) Act 1962.
The fact that the Juridical Acts to give legal force to certain of the decisions of Cabinet are taken by others—the Crown, the Executive Council, a Minister of the Crown or a Statutory Commission— does not diminish the power and authority of Cabinet. Cabinet is the top committee of the administrative system, with responsibility for co-ordinating the work of the various Ministers and taking those decisions which largely determine the nature of the legislation put before Parliament and the regulations which the Executive Council is asked to approve.
Cabinet discussions are informal and confidential, anonymity being maintained as to the individual advocacy or opposition to particular proposals. The Cabinet system enables general agreement to be reached on any line of action proposed by either an individual Minister or by the Government as a whole. In Parliament a Minister can be confident that his legislative or other proposals will have the unqualified support of the Government no matter what divergences of opinion may have been apparent before general agreement was reached in Cabinet. A consistent and agreed course of action on any particular issue can be determined. The work of Cabinet thus exemplifies the concept of the collective responsibility of the Government.
Cabinet is assisted in its work by some ten Cabinet committees, the membership of which includes those Ministers principally concerned with the subject matters handled by the committee. These include committees covering Policy and Priorities, Economic Affairs, Government Works, Legislation and Parliamentary Questions, Social Affairs, Honours and Appointments, and the State Services. Some of the committees are supported by inter-departmental committees of officials. All Cabinet committees have delegated authority from Cabinet to make decisions within their terms of reference.
The Cabinet Office is responsible for the servicing and co-ordination of Cabinet and its committees to ensure their smooth functioning as well as providing liaison and advice within the inter-Departmental framework. The Secretary of the Cabinet is also Clerk of the Executive Council.
Government Departments—The Minister as the political head of a department of State may in fact have several departments under his control. There are, however, some 40 different departments with separate functions in New Zealand. Each of these has a permanent head who is responsible for the work and administration of the department. He is of course responsible to the Minister in charge of the department, while he also acts as adviser to the Minister on all matters within his appointed competence. Besides ensuring that the ministerial policy and directions communicated to him are effectively put into practice, his functions as the adviser include assessing the consequences of any executive action resulting from his departmental activity, evaluating the merits and demerits, whether political, social, or financial, of various modes of action, and making suggestions for improvements and for new policy measures as derived from departmental experience in the day-to-day execution of policy.
Departments can be broadly classified according to the administrative or regulatory, developmental, or social nature of their activities. Within the first group are the servicing subgroup, such as the Legislative, Prime Minister's, Ministry of Foreign Affairs, Printing Office, Crown Law, Valuation, Statistics, and Audit; the finance subgroup—Treasury, Customs, Inland Revenue; the regulatory subgroup—State Services Commission, Internal Affairs, Labour; the defence and law and order subgroup—Ministry of Defence, Justice, Crown Law, and Police; the research subgroup— Scientific and Industrial Research.
In the second group are the transport and communications subgroup, such as Ministry of Transport, Post Office, Railways, and Tourist and Publicity; the developmental—Ministry of Works and Development, Ministry of Agriculture and Fisheries, Lands and Survey, Forest Service, Mines, Electricity, Energy Resources, Maori Affairs, Trade and Industry; The commercial—Public Trust, Government Life Insurance, Housing Corporation, Rural Banking and Finance Corporation, and State Insurance.
The third group comprises the Education, Health, and Social Welfare Departments..
This broad division serves merely to indicate the field of the dominant activity or purpose of the particular department. Most departments have servicing, informative, and regulatory functions, and many are equally regulatory and developmental in nature.
In addition to the system of direct administration in the form of Government departments, there are other activities over which the State exercises some ultimate measure of control or ownership though divorced in varying degrees from immediate supervision. The Reserve Bank of New Zealand (the central bank), and one trading bank, are entirely State-owned, although the actual administration is quite independent, subject in the case of the Reserve Bank to the proviso that it must give effect to the monetary policy of the Government, as communicated to the bank by the Minister of Finance, and to any resolution of Parliament in respect of Government monetary policy.
Further instances of this principle are shown by the National Airways Corporation, which, although owned by the State, is administratively self-contained, and by the Tourist Hotel Corporation. In certain other avenues the type of administration is in between the normal departmental form and that evident in the corporation type; of such is the National Roads Board, which, though determining policy to a large degree, yet makes use of departmental administrative structures for implementation of policy.
Some administrative organisations have also quasi-judicial functions. Examples of this class are the Price Tribunal, Transport Charges Authority, Licensing Control Commission, and Local Government Commission.
OMBUDSMEN—Since 1962 there has been an Ombudsman able to investigate, on complaint or on his own initiative, any administrative decision, recommendation, act, or omission of a Government department or related organisation as it affects any individual. The Ombudsman does not have power to reverse departmental decisions, but he may make his recommendations to the department and to the Minister, and if, in his opinion, no appropriate action is taken he may report to the Prime Minister and then to Parliament. He has very wide powers to call for documents and files. The Government cannot refuse information, except in matters relating to the security of the State or to Cabinet proceedings. Jurisdiction is being extended under the Ombudsmen Act 1975 to local authorities and certain national boards and organisations.
JUDICIARY—The hierarchy of courts in New Zealand comprises the Court of Appeal, the Supreme Court, and the Magistrate's Court. Apart from these courts of general jurisdiction there are other courts dealing with specific fields. In the latter category are the Industrial Commission concerned with awards and orders governing wage determination and conditions of employment in industry; the Compensation Court dealing with workers' compensation. For further details refer to Section 8 Justice
PARLIAMENTARY ELECTIONS—The law on elections is contained in the Electoral Act 1956. Following each population census, which is normally taken every 5 years, the boundaries of European electorates are revised. In addition, there are four Maori electoral districts, three in the North Island and one covering a portion of the North Island together with the whole of the South Island, where the Maori population is comparatively small. The Governor-General may at any time by Proclamation alter the boundaries of the Maori electoral districts, and, as in the case of European electoral districts, any alterations are to come into force at the expiry of the Parliament existing when the Proclamation is issued.
The Government Statistician is required to supply population figures to the Surveyor-General as soon as possible after the census. The population used as the basis in obtaining the quota for each European electoral district is defined in section 2 (1) of the Electoral Act 1956
The term “European population” means total population with the following exceptions:
Maoris;
Persons residing on board ship, whether as passengers or members of the crew or otherwise;
Persons residing temporarily as guests in any licensed hotel;
Persons residing temporarily in any naval, military, or air force camp, station, or establishment;
Persons residing as patients and inmates in any hospital;
Persons in respect of whom reception orders under the Mental Health Act 1969 are in force;
Persons detained pursuant to convictions in any penal institution.
After the population figures are supplied by the Government Statistician it is then the responsibility of the Representation Commission to define new electoral districts for Europeans. The commission is constituted by virtue of section 15 of the Electoral Act 1956 and comprises seven members. Four of these, the Surveyor-General, the Government Statistician, the Chief Electoral Officer, and the Director-General of the Post Office, are official members. Two are unofficial members, being persons nominated by the House of Representatives, one nominated to represent the Government, and one to represent the Opposition. The seventh member is appointed, on the nomination of the official and unofficial members of the commission or a majority of them, to be the chairman of the commission. The chairman and unofficial members cease to be members on the date on which the first periodical census is taken after the date of their appointment.
The European population of the South Island is divided by 25 and the quotient so obtained is the quota for the South Island. Then the European population of the North Island is divided by the quota for the South Island, and the quotient so obtained is the number of European electoral districts in the North Island. In applying the quota the commission may make an allowance by way of addition or subtraction of 5 percent of the quota to enable districts to be adjusted to meet considerations of topography, community of interest, communications, and existing electoral boundaries.
When the boundaries have been provisionally determined, maps are prepared illustrating the proposed electoral districts, and descriptions of each electoral district are published in the New Zealand Gazette. A time limit of 1 month is given during which objections to the proposed boundaries may be lodged. These objections are then considered by the Representation Commission and a final decision reached on boundaries which then define the new electoral districts.
All general elections and by-elections are held on a Saturday. Polling hours in all electorates are from 9 a.m. to 7 p.m.
Any serviceman aged 20 years or over serving overseas is qualified to vote as an elector of the electoral district in which he last resided before he left New Zealand.
Franchise—Since September 1974, persons 18 years of age and over have had the right to vote in the election of members of the House of Representatives. (From 1893 onwards all persons aged 21 years had voting rights and the qualifying age had been lowered to 20 years in 1969.)
Registration of Electors—Registration as an elector is compulsory, although it is not compulsory to vote. To be qualified for registration as a parliamentary elector in New Zealand a person must have attained the age of 20 years and must (a) be a British subject or Irish citizen, (b) be ordinarily resident in New Zealand, (c) at some period have resided continuously in New Zealand for at least a year, and (d) except in special cases have resided continuously for 3 months or more in the electoral district in respect of which application for registration is made, and not have subsequently resided for 3 months or more in any other electoral district. Broadly speaking the qualifications restrict the right to vote to permanent residents. Persons of more than half Maori ancestry register in one of the four Maori electoral districts and persons of half Maori ancestry have the option of registering on either a European or Maori roll.
Voting at parliamentary elections is by secret ballot. In general, only those persons whose names are lawfully on the main and supplementary rolls of electors compiled prior to an election may vote at that election.
A vote is normally cast by the elector at a polling booth within his district. An elector may, however, vote as a “special voter”, either at a polling booth outside his district or by post for reasons of distant travel on polling day, sickness, etc.
LOCAL GOVERNMENT: General—Since 1876, following the abolition of the provinces, the structure of territorial local government has been based on counties, boroughs, and town districts. Since then, however, there has developed a further structure, that of special purpose authorities. In this category there are such authorities as harbour boards, pest destruction boards, and electric power boards. Together, these two groups of local authorities (territorial and special purpose) form our local government system, a system to which, however, the Local Government Act 1974 will bring some change. Before these changes are described below, a brief description of the development of the present system follows.
Boroughs—The Municipal Corporations Act 1876 provided for the incorporation of the 36 boroughs then in existence and for the creation of new boroughs. They are now governed by the Municipal Corporations Act 1954. Boroughs provide for the needs of concentrated populations and before they can be constituted there must be a population of at least 1,500 with an average density of population of at least one person per acre. A borough containing a population of 20,000 or more may be proclaimed a city, although the corporation remains unaltered. With the growth and centralisation of population the number of boroughs, despite amalgamations of adjacent boroughs, steadily increased until 1955 when the total was 146. By 30 November 1974 this figure had decreased to 136.
Counties—Counties were originally introduced by the Counties Act 1876 which has now been superseded by the Counties Act 1956. Generally they cater for the primary needs of rural areas. Initially, there were 63 counties but with increasing settlement this number increased to 129 in 1920. Since then, the number of counties has been reduced by amalgamations and mergers and at 30 November 1974 there were 105 counties, of which 104 were actively functioning, Fiord being a sparsely populated county in which the Counties Act is not wholly in force.
County Towns and County Boroughs—Prior to the Local Government Act 1974 county councils could, under the provisions of the Counties Act 1956, declare areas within counties to be county towns. To qualify, the areas concerned must have had a population of at least 200, with an average density of not less than one person to the acre or not less than 60 houses with an average density of not less than one house to 3 acres. After the constitution of a county town the county council was required to appoint a county town committee of not less than three nor more than seven members, to advise it on the administration of the county town. The county council could conduct a poll in the county town to ascertain the wishes of the electors of the county town in respect of the persons to be appointed to this committee. At 30 November 1974 there were 92 county towns in existence. The Counties Amendment Act 1968 made provision for the constitution of county boroughs. This unit of local government could be formed from an existing county town or borough or town district. It remained an integral part of the parent county, but the county borough council, which was a fully-elected body, had a statutory right to exercise some, but not all, of the powers of the county council within the district of the county borough. The minimum population required for a county borough was 1,500. At 30 November 1974 there were 12 county boroughs. Under the Local Government Act 1974, existing county boroughs became communities under the jurisdiction of district community councils, and existing county towns became communities under the jurisdiction of community councils.
Town Districts—The town district represents a form of local government intermediate between the county and the borough. It implies a certain concentration of population. There were two types of town districts—dependent and independent. Dependent town districts were subject to county control (mainly for roads) and the area of their district formed part of the district of their parent counties. Since the 1954 Municipal Corporations Act no new dependent town districts could be constituted, and on the enactment of the Local Government Act 1974 the four existing dependent town districts became community councils. Independent town districts do not form part of the county within which they are situated nor are they subject to any county council control. The Municipal Corporations Act requires the area of an independent town district be not more than 2 square miles, within which no two points are more than 4 miles distant; having a minimum population of 500 and with a density of population of not less than 1 person to the acre. The number of independent town districts at 30 November 1974 was eight.
Special-purpose Authorities—Special-purpose authorities differ from territorial authorities in that each is charged with only one major function. The need for the most efficient and economic discharge of the major function being the prime consideration, their boundaries may either extend beyond or fall within those of territorial authorities in the same geographical area. Only rarely do the boundaries coincide. Sometimes, as is the case with a number of urban fire authorities and pest destruction boards, territorial authorities themselves are also constituted as, and perform the functions of, special-purpose authorities. The more important special-purpose authorities are those administering harbours, hospitals, and the retail distribution of electricity. Others are engaged in fire fighting, water supply, urban drainage and transport, soil conservation and rivers control, pest destruction, nassella tussock control, and land drainage.
Number of Local Authorities—The number of local authorities actively functioning at 30 November 1974 was 543, made up as follows: county councils, 105; borough (including city) councils, 136; town councils (independent), 8; town councils (dependent), 4; regional authority, 1; river boards (2 boards also have the powers of land-drainage boards), 6; catchment boards, 13; catchment commissions, 4; land-drainage boards, 33; electric power boards, 39; water-supply board, 1; regional water board, 1; urban drainage boards, 4; transport board, 1; local railway board, 1; power and gas board, 1; nassella tussock boards, 2; harbour bridge authority, 1; road tunnel authority, 1; valley authority, 1; plantation board. 1; forestry corporation, 1; crematorium board, 1; wallaby board, 1; pest destruction boards (separately elected), 69; independent fire boards, 60; independent harbour boards, 17; hospital boards, 30. Borough and county councils also function as fire authorities in 231cases, as harbour boards in 8 cases, as county pest destruction boards in 37 cases, as domain boards in 407 cases, and as scenic boards in 138 cases. There are 459 independent domain boards and 129 independent scenic boards. In addition, there were 22 district councils of the National Roads Board constituted under the National Roads Act 1953. Although these district roads councils are not local authorities in the strict sense of the term they are intimately connected with certain aspects of local government, providing an advisory service to the National Roads Board concerning the roading needs and the allocation of national roading funds within their respective districts.
LOCAL GOVERNMENT ACT 1974—This Act came into force on 1 December 1974 and in time will bring about some changes in the structure of local government outlined above.
Briefly, the Act provides the means for the establishment of a system of regional bodies to deal in a co-ordinated manner with all functions of a regional nature. It continues and improves the procedures of rationalisation of the local government structure in both the special purpose and territorial spheres and provides for the eventual phasing out of the existing dual system of territorial local government based on counties and boroughs. Furthermore, to encourage greater public involvement in local community affairs the Act provides for the establishment of community councils with varying degrees of authority. Finally, the responsibility for introducing and implementing the above changes lies primarily with a reconstituted and enlarged independent Local Government Commission.
Local Government Commission—The Local Government Act, which repealed the Local Government Commission Act 1967, sets up a revised Local Government Commission which is a permanent institution deemed to be a Commission of Inquiry under the Commissions of Inquiry Act 1908.
The Act provides that the minimum membership of the commission shall be five, one of which shall be chairman, and at least one member must have experience in urban territorial local government and at least one other must have experience in rural territorial local government.
The principal task of the new commission will be to prepare by 31 December 1979, or as soon as possible thereafter, schemes establishing regional authorities throughout New Zealand. These authorities will be called united councils or regional councils and their nature is described in more detail below.
Allied with the task of establishing regional authorities, the commission is to ensure that united councils or regional councils or territorial authorities (a borough, city, county, district, or independent town council) undertake those functions of special purpose authorities which in the opinion of the commission, should be performed by them. For this purpose, practically all types of special-purpose authorities, except for hospital boards and education boards, have been placed within the jurisdiction of the commission. Accordingly, the commission is also empowered to provide for any function undertaken by a territorial authority which, in the commission's opinion, would be more appropriately performed by a united or regional council to be transferred.
The new commission will continue to carry out investigations, prepare reorganisation schemes, and make recommendations and reports for the purpose of ensuring that the system of local government in any local authority will best provide for the needs and well-being of its residents and the continued development of the district, that local authorities have such district boundaries and such functions and powers as will enable them to provide most effectively and economically essential or desirable local government services and facilities, that local authorities shall have such resources as will enable them to engage adequate services and to obtain and operate adequate technical facilities, plant, and equipment, and that districts shall be of such a size and nature as will promote efficient local government and avoid the necessity of uneconomic expenditure. Furthermore, the commission can ensure that any united or regional council has the power to do anything which will facilitate the discharge of any of its functions and particularly the power to undertake any function, which is regional in nature, operated by any other authority.
United and Regional Councils—Apart from the Auckland Regional Authority which has operated since 1963, the regional bodies to be established under the Act will be new to local government in this country. They will be determined by the commission and established by Order in Council giving effect to a final scheme of the commission. The commission will determine whether the governing body for each region is to be either a united council or a regional council. The essential difference between united councils and regional councils are that the former will be appointed by the constituent (territorial) authorities within the regions concerned while regional councils will be directly elected bodies. In both cases the membership of united and regional councils will be not less than 12. To obtain finance, united councils will make levies on their constituent authorities, while regional councils will have direct rating powers.
No criteria are prescribed by the Act to guide the commission in deciding whether a united council or a regional council is to be set up for a region. However, the united council concept is designed to meet the requirements of those regions where the range of functions, or the nature of the responsibilities involved, do not justify the setting up of an organisation of the scale inherent in a directly elected regional council. On this basis it is envisaged that united councils may be more prevalent in rural areas.
Functions of these authorities can be attained in several ways. First, the Act prescribes that every united council or regional council shall have two mandatory functions—that of regional planning and civil defence. Also, in the commission's scheme constituting a united or regional council the Commission may provide for it to undertake the functions of any territorial authority or special purpose authority. Furthermore, a united or regional council is empowered to undertake solely any new regional function which is not undertaken by any other local authority in its region. In this regard, the commission, by scheme, can provide that that function may be one that other local authorities are not empowered to undertake by any other statute. Besides the two mandatory functions, the Act provides that a united or regional council may undertake the functions of regional reserves, forestry, regional roading and community services. A united or regional council may enter into an agreement with a constituent authority to undertake any function of that authority where, in the opinion of either party, that function would be more effectively and economically undertaken by the regional body. Finally, united and regional councils may enter into agreements with the Crown whereby they may exercise any function or provide any service for or on behalf of the Crown.
District Councils—The Act empowers the commission when bringing down schemes affecting boroughs or counties to redesignate them as districts under the jurisdiction of “district councils”. Although district councils will represent a further type of territorial authority, eventually it is intended that the dual system of territorial local government based on county and borough will be abolished. The rationale behind this provision is that today, many territorial authorities are neither “boroughs” nor “counties” in the sense that they are neither wholly urban nor wholly rural. This provision, however, will not apply to the designations of “city” and “city council”.
The Act also provides that where, as a result of amalgamations or unions the new boundaries of the district of a district council coincide with those of a region, the district council may undertake the functions of a regional body. In this case, no united or regional council need be established for the region.
District Community Councils and Community Councils—The Act provides for the establishment of “communities” within the districts of territorial local authorities. Each community will be administered by either a “district community council” or a “community council”. These communities will not be local authorities in the true sense but will have councils of not less than 5 nor more than 12 who will be elected on a residential franchise for a 3-year term.
Except for certain reserved powers dealing with finance, staff, and planning, a district community council may exercise all the powers and functions of its parent territorial authority. Community councils, however, derive most of their powers by delegation from their territorial authority. Once again, powers dealing with finance, staff, and planning cannot be delegated.
The general idea behind communities is that they will encourage public participation in locality affairs through elected bodies who will represent and place the needs and views of their residents before their parent local authority and any government agencies or other organisations involved. Furthermore, they are intended to give a lead to and encourage community participation in the provision of community activities and amenities, and generally to foster a sense of community pride. This idea is not entirely new to local government in New Zealand. It has been successfully applied for some years in rural areas by the “county town” and “county borough” legislation. In the purely urban areas such as cities and boroughs, however, the establishment of equivalent bodies has not been provided for until the Local Government Act. Immediately the Act came into force all county boroughs were redesignated district community councils and all county towns and dependent town districts became community councils.
General Powers—Local authorities in New Zealand derive their powers from the Act under which they are constituted. In the case of territorial local authorities, the Municipal Corporations Act 1954 and the Counties Act 1956 are the main governing Acts, while united, regional, district, district community, and community councils are under the Local Government Act 1974.
There are several statutory measures which are more or less applicable to all local authorities, such as the Local Elections and Polls Act 1966 and the Local Authorities Loans Act 1956. For most harbour boards there is, in addition to the general Harbours Act, a special Act for each board which is subordinate to the general Act. Certain types of local authority—urban drainage boards, transport boards, the Auckland Regional Authority, the Auckland Harbour Bridge Authority, the Christchurch-Lyttelton Road Tunnel Authority, and the Waikato Valley Authority—derive their principal powers from special constituting Acts.
A local authority has no legislative powers beyond the authority to make bylaws within limits defined in its constituting Act, but it can promote legislation on matters which affect the government of the area under its jurisdiction and which it is not already empowered to deal with. If the subject is transient and not contentious and is approved by Government, it is usually dealt with by the inclusion of an appropriate section in the annual Local Legislation Act passed by Parliament for this purpose. If, on the other hand, the local authority seeks powers of a permanent or major nature additional to those conferred on it by general Acts it must submit to Parliament a special local Bill. The extent to which the foregoing privileges are used may be gauged from the fact that the annual Local Legislation Act usually contains 20 to 25 sections, while about 15 local Acts are passed each year.
Franchise—Under the Local Elections and Polls Act 1966, elections are held on the second Saturday in October every third year. The next triennial general elections are due in 1977. Enrolment of residential electors is compulsory. In a poll on any proposal relating to loans or rates, a rate paying qualification is necessary.
Apart from a few special-purpose authorities, some of whose members are appointed by other local authorities, by Government, or, in the case of fire authorities, by insurance interests, members of local authorities are elected triennially, any qualified elector being eligible to seek election. In general the franchise extends to all persons aged 18 years or over who either possess a rating qualification or who, being British subjects, possess a residential qualification in the district of the local authority concerned. The right to vote for members of land drainage and river boards is, however, restricted to those who possess rating qualifications. In the case of regional councils, district community councils and community councils the right to vote is limited to those who reside in the region or community'.
Voting Procedures—Generally speaking, franchise can only be exercised by personal attendance at the polling booth, but the Local Elections and Polls Act 1966 was amended in 1970 to permit county councils to use postal voting. Postal voting will also apply to those district community councils and community councils in counties. Other local authorities are able to use this method only on approval being granted by Order in Council. At the 1974 elections many counties, 8 boroughs, and 4 drainage boards used postal voting. In every such case election participation was appreciably higher than the national average. To a lesser extent use was also made of spread voting where voting is possible at polling booths over a period of up to 6 days instead of being confined to the single day.
Remuneration of Members—The remuneration of members of local authorities is governed by the statutes constituting the various types of local authorities. Most special purpose authorities pay their chairmen an annual allowance with a maximum fixed for each type of authority. The maximum payable to mayors of boroughs and cities and county council chairmen varies according to the population of the local authority. The chairman and members of a united or regional council may be paid such annual allowances as may from time to time be approved by the Minister of Finance after consultation with the Minister of Local Government.
TOWN AND COUNTRY PLANNING—The Town and Country Planning Act 1953 provides for the making and enforcement of regional and district planning schemes, and the detailed procedure to be followed in each case is amplified by the Town and Country Planning Regulations 1960. The Government administers the Act through the Minister of Works and Development who may delegate his authority to the Commissioner of Works..
District Planning—Every district scheme is required to have for its general purpose the development of the area to which it relates (including where necessary the replanning and reconstruction of an area already built on) in such a way as will most effectively tend to promote and safeguard the health, safety and convenience, the economic and general welfare of its inhabitants, and the amenities of every part of the area. The council of every city, borough, county, and independent town district must provide and maintain a district scheme whether or not a regional planning scheme including its district has been prepared or become operative.
This subject is further discussed in Section 13, Pattern of Development and Land Use.
POPULATION GROWTH—New Zealand's first million of population was recorded in 1908, 68 years after the signing of the Treaty of Waitangi. In 1952, 44 years later, the second million was reached, and the third million late in 1973.
Population has two sources of gain—natural increase (excess of births over deaths) and net migration (excess of arrivals over departures). In the early years in New Zealand, the bulk of the increase was through migration. From the late 1870s natural increase permanently displaced immigration as the chief contributor to population growth. At the census of 1881 the percentages of the total population born in New Zealand and born overseas were approximately equal (50.2 percent New Zealand born to 49.8 percent overseas born), and each succeeding census until 1961 recorded an increased proportion of New Zealand-born. Since 1961 (when the New Zealand-born made up 86 percent of the population) the proportion has fallen slightly mainly because of increased international travel and tourism. At the 1971 census 85.6 percent of the population was recorded as having been born in New Zealand.
During the present century, natural increase has accounted for over three-quarters of the growth of population. New Zealand's rate of natural increase is relatively high compared with other countries whose population is predominantly of European origin.
The natural increase rate has, in the main, closely reflected the changes in the birth rate, with a low point of 8.63 per 1,000 in 1935 and high points of 18 per 1,000 in 1947 and 1961; in the 1960s the average rate was less than 14 per 1,000. Like the low birth rate of the thirties, the fall in the birth rate in the sixties and seventies is a feature that New Zealand shares with a number of other developed countries, and notably with Australia, Canada, and the United States.
Details are given in the following table.
| Period | March Years | Calendar Years | ||||
|---|---|---|---|---|---|---|
| Births | Deaths | Natural Increase | Births | Deaths | Natural Increase | |
*Non-Maori population. †Excluding Section 14 birth registrations. | ||||||
| (thousand) | ||||||
| 1901-1905* | .. | .. | .. | 109.4 | 40.7 | 68.7 |
| 1906-1910* | .. | .. | .. | 127.8 | 46.0 | 81.7 |
| 1911-1915 | .. | .. | .. | *138.0 | 49.0 | 89.0 |
| 1916-1920 | .. | .. | .. | 142.5 | 66.1 | 76.4 |
| 1921-1925 | .. | .. | .. | 148.3 | 59.0 | 89.4 |
| 1926-1930 | 146.5 | 64.6 | 81.9 | 146.3 | 64.3 | 82.0 |
| 1931-1935 | 139.8 | 66.2 | 73.6 | 138.4 | 66.3 | 72.1 |
| 1936-1940 | 150.9 | 76.7 | 74.2 | 159.4 | 78.6 | 80.8 |
| 1941-1945 | 188.6 | 85.3 | 103.3 | 191.6 | 87.0 | 104.6 |
| 1946-1950 | 239.9 | 88.0 | 151.9 | 244.9 | 88.1 | 156.8 |
| 1951-1955 | 258.5 | 93.1 | 165.4 | 263.6 | 94.2 | 169.4 |
| 1956-1960 | 295.0 | 101.5 | 193.5 | 300.4 | 102.9 | 197.5 |
| 1961-1965 | 320.0 | 110.5 | 209.5 | 317.9 | 112.1 | 205.8 |
| 1966-1970† | 306.0 | 118.6 | 187.4 | 307.5 | 120.2 | 187.3 |
| 1971-1974† | 250.2 | 99.9 | 150.3 | 247.7 | 99.7 | 148.1 |
| Totals 1916-1974 | .. | .. | .. | 2,608.5 | 1,038.5 | 1,570.2 |
Migration, however, has continued to add to the population quite substantially except during depression and war periods and the recession conditions of 1968-69. Gains from external migration are shown in the following table. Movements of the armed forces are not included.
| Period | March Years* Migration Gain | Calendar Years Migration Gain |
|---|---|---|
*March years ended in years listed. †Excess of departures. | ||
| (000) | (000) | |
| 1901-1905 | .. | 45.4 |
| 1906-1910 | .. | 41.0 |
| 1911-1915 | .. | 35.6 |
| 1916-1920 | .. | 14.9 |
| 1921-1925 | .. | 50.1 |
| 1926-1930 | 27.4 | 24.6 |
| 1931-1935 | —2.1† | —9.9† |
| 1936-1940 | 11.9 | 12.4 |
| 1941-1945 | 1.3 | 2.1 |
| 1946-1950 | 27.4 | 32.6 |
| 1951-1955 | 66.6 | 69.1 |
| 1956-1960 | 49.2 | 44.3 |
| 1961-1965 | 63.9 | 70.7 |
| 1966-1970 | 6.0 | 6.5 |
| 1971-1974 | 78.2 | 96.2 |
| Total 1901-1974 | .. | 598.3 |
Most of the inward migration has been from the United Kingdom, Australia, and the Netherlands. In more recent years increasing numbers have come from the Pacific Islands, notably Western Samoa. A changed economic climate in the country brought a net migration loss to population for 1967, 1968, and 1969 calendar years, but a normal net inflow is again taking place.
CENSUS STATISTICS—Population statistics are based primarily on the five-yearly population census. Intercensal population estimates are based on the most recent census data available, adjusted in accordance with later figures of births, deaths, and migration. Estimates of the populations of particular localities, e.g., cities and boroughs, also take into account local economic developments, housing schemes, the numbers on school rolls, changes in boundaries, and any other factors leading to, or indicating, changes in population.
The basis adopted for the population census, and virtually throughout population statistics in New Zealand, is that of population physically present in the place of enumeration at the time of enumeration.
All references to New Zealand relate solely to geographic New Zealand, i.e., island territories are omitted except where their inclusion is specifically stated. Though Tokelau Islands are constitutionally part of New Zealand, for geographical reasons they are administered separately. The Cook Islands and Niue Island are self-governing but the islanders are New Zealand citizens.
PRESENT POPULATION—The following table gives a summary of population. A 50-year time series is given in the statistical summary towards the back of this Yearbook.
| Territory | Date | Males | Females | Total |
|---|---|---|---|---|
| *Includes population of Kermadec Islands 10 (males) and Campbell Island 9 (males) At 31 December 1974 the population of New Zealand was estimated at 3,094,900. | ||||
| New Zealand* | 31 March 1974 | 1,522,400 | 1,520,400 | 3,042,800 |
| Island Territory— | ||||
| Tokelau Islands | 25 September 1974 | 738 | 836 | 1,574 |
| Cook Islands | 31 March 1974 | 9,866 | 9,656 | 19,522 |
| Niue Island | 30 September 1974 | 2,021 | 1,971 | 3,992 |
| Ross Dependency | 23 March 1971 | 190 | - | 190 |
INCREASE OF POPULATION—The growth of population has been substantial in each intercensal period. The lowest rates are those of 1926-36, which included some years of economic depression, and of 1936-45, which included 6 years of international war, and of 1966-71, mainly attributable to a marked change in migration patterns.
| Census Date | Population | Increase or Decrease | ||
|---|---|---|---|---|
| Intercensal | Intercensal | Annual Average | ||
*Numbers of persons in New Zealand armed forces overseas not available. † Includes members of New Zealand armed forces overseas. | ||||
| Percent | ||||
| 31 March 1901* | 815,862x | 72,648xx | 9.77 | 1.89 |
| 29 April 1906 | 936,309x | 120,447x | 14.76 | 2.75 |
| 2 April 1911 | 1,058,312x | 122,003x | 13.03 | 2.52 |
| 15 October 1916* | 1,149,225 | 90,913x | 8.59 | 1.50 |
| 17 April 1921 | 1,271,668x | 122,443x | 10.65 | 2.27 |
| 20 April 1926 | 1,408,139 | 136,471x | 10.73 | 2.06 |
| 24 March 1936 | 1,573,812x | 165,673x | 11.77 | 1.13 |
| 25 September 1945 | 1,702,330 | 128,518 | 8.17x | 0.83 |
| 25 September 1945† | 1,747,711x | 173,899x | 11.05 | 1.11 |
| 17 April 1951 | 1,939,472 | 237,142x | 13.93 | 2.37 |
| 17 April 1951† | 1,941,366 | 193,655x | 11.08 | 1.91 |
| 17 April 1956 | 2,174,062 | 234,590 | 12.10 | 2.31 |
| 17 April 1956† | 2,176,224 | 234,858 | 12.10 | 2.31 |
| 18 April 1961 | 2,414,984 | 240,922 | 11.08 | 2.12 |
| 18 April 1961† | 2,417,543 | 241,319 | 11.09 | 2.12 |
| 22 March 1966 | 2,676,919 | 261,935 | 10.85 | 2.11 |
| 22 March 1966† | 2,678,855 | 261,312 | 10.81 | 2.10 |
| 23 March 1971 | 2,862,631 | 185,712 | 6.94 | 1.35 |
| 23 March 1971† | 2,864,113 | 185,258 | 6.92 | 1.34x |
COMPARISON WITH OTHER COUNTRIES—The annual average percentage increases of population for the period 1963-72, are given in the following table for certain selected countries.
Source: United Nations Demographic Yearbook 1972.)
| Country | Average Annual Percentage Increase |
|---|---|
| Australia | 1.9 |
| Canada | 1.6 |
| China | 1.8 |
| Denmark | 0.7 |
| Egypt | 2.5 |
| France | 0.9 |
| Germany, West | 0.8 |
| India | 2.2 |
| Ireland | 0.6 |
| Japan | 1.1 |
| Netherlands | 1.2 |
| New Zealand | 1.5 |
| Norway | 0.8 |
| Singapore | 2.0 |
| South Africa | 3.2 |
| Sweden | 0.7 |
| Switzerland | 1.2 |
| Thailand | 3.1 |
| United Kingdom | 0.4 |
| United States | 1.1 |
| U.S.S.R. | 1.1 |
| Western Samoa | 2.4 |
INTERCENSAL RECORDS—Intercensal estimates of total population are prepared from the records of vital statistics and of external migration. The figures in the tables following have been revised in line with 1971 Census results and exclude members of New Zealand armed forces who were overseas, and also members of the armed forces of other countries who were in New Zealand.
| Year | Population at End of Year | Increase During Year | Mean Population for Year | |||
|---|---|---|---|---|---|---|
| Males | Females | Total | Numerical | Percent | ||
| Years Ended 31 March | ||||||
| 1969 | 1,386,770 | 1,390,440 | 2,777,210 | 24,548 | 0.9 | 2,760,077 |
| 1970 | 1,407,007 | 1,408,980 | 2,815,987 | 38,777 | 1.4 | 2,788,839 |
| 1971 | 1,430,108 | 1,430,765 | 2,860,873 | 44,886 | 1.6 | 2,831,222 |
| 1972 | 1,454,510 | 1,455,406 | 2,909,916 | 49,043 | 1.7 | 2,876,388 |
| 1973 | 1,487,696 | 1,486,963 | 2,974,659 | 64,743 | 2.2 | 2,932,406 |
| 1974 | 1,522,400 | 1,520,400 | 3,042,800 | 68,141 | 2.3 | 2,995,400 |
| Years Ended 31 December | ||||||
| 1969 | 1,399,839 | 1,404,220 | 2,804,059 | 31,126 | 1.1 | 2,780,101 |
| 1970 | 1,425,435 | 1,426,702 | 2,852,137 | 48,078 | 1.7 | 2,819,602 |
| 1971 | 1,448,449 | 1,450,618 | 2,899,067 | 46,930 | 1.6 | 2,864,392 |
| 1972 | 1,480,147 | 1,480,849 | 2,960,996 | 61,929 | 2.1 | 2,916,572 |
| 1973 | 1,513,726 | 1,513,204 | 3,026,930 | 65,934 | 2.2 | 2,978,676 |
| 1974 | 1,548,900 | 1,545,800 | 3,094,700 | 67,770 | 2.2 | 3,044,800 |
The figures given in the preceding table are for total population inclusive of New Zealand Maoris.
The following table shows the New Zealand Maori population.
| Year | New Zealand Maori Population at End of Year | Increase During Year | Mean Population for Year | |||
|---|---|---|---|---|---|---|
| Males | Females | Total | Numerical | Percent | ||
| Years Ended 31 March | ||||||
| 1969 | 109,886 | 107,083 | 216,969 | 5,114 | 2.4 | 214,377 |
| 1970 | 112,322 | 109,781 | 222,103 | 5,134 | 2.4 | 219,424 |
| 1971 | 115,037 | 112,537 | 227,574 | 5,471 | 2.5 | 224,718 |
| 1972 | 118,390 | 115,912 | 234,302 | 6,728 | 3.0 | 230,747 |
| 1973 | 121,569 | 119,107 | 240,676 | 6,374 | 2.7 | 237,547 |
| 1974 | 124,200 | 122,000 | 246,200 | 5,524 | 2.3 | 243,400 |
| Years Ended 31 December | ||||||
| 1969 | 111,715 | 109,039 | 220,754 | 5,155 | 2.4 | 218,138 |
| 1970 | 114,340 | 111,768 | 226,108 | 5,354 | 2.4 | 223,365 |
| 1971 | 117,516 | 115,010 | 232,526 | 6,418 | 2.8 | 229,104 |
| 1972 | 120,814 | 118,322 | 239,136 | 6,610 | 2.8 | 235,924 |
| 1973 | 123,602 | 121,192 | 244,794 | 5,658 | 2.4 | 242,017 |
POPULATION PROJECTIONS—An indication of possible future growth of the total New Zealand population (including Maoris) up to 2001 is given by the detailed alternative projections which follow.
Projections of future population involve an element of uncertainty owing to incomplete knowledge of the factors underlying changes in fertility, mortality, and migration levels and difficulties in forecasting the future behaviour of these components of population change.
It should be understood that, as with all demographic projections prepared by the Department of Statistics, these projections are not strict forecasts or targets, but conditional forecasts based on the stated assumptions. Presentation and use of the projections, therefore, cannot be divorced from consideration of the assumptions adopted.
These projections are based on fertility assumptions relating to age-of-mother-specific birth rates as marital status data from 1971 Census of Population were not available at time of their preparation. In the department's judgment this will not significantly impair the validity and utility of the projections. A full description of the projection assumptions is contained in the footnotes to the table.
| As at 31 March | Projected Total New Zealand Population* | Assuming Net Annual Immigration† of | |||||||
|---|---|---|---|---|---|---|---|---|---|
| 5,000 | 10,000 | 15,000 | |||||||
| Males | Females | Total | Males | Females | Total | Males | Females | Total | |
* The base population for these projections is the estimated population as at 31 March 1971. These projections are based on the following assumptions: (a) That future fertility experience will be in accordance with the alternative trends in ge-of-mother-specific birth rates as described in ‡ and § below; (b) That 1965-67 Life Table Mortality Rates (Total Population) apply throughout the projection period. †The assumed net immigration is taken to commence from the projection base point of 31 March 1971. ‡The projection based on “Constant Fertility” assumes a continuance of 1971 experience with regard to age-of-mother-specific birth rates. §The projection based on “medium” fertility assumes the continuation of recent general trends in age-of-mother-specific birth rates, whether increasing or decreasing, for 5 years, with a subsequent continuation of those general trends, somewhat flattened, until 1986. The “high” and “low” assumptions are relative to the “medium” assumption and are based on trends, above and below the “medium” trend respectively, which are considered to be maxima and minima in the light of the assessed reasonably expected range of values which may eventuate. Because of the uncertainty in projecting recent fertility experience for longer than 15-20 years ahead, birth rates which make up the “high”, “medium” and “low” fertility assumptions have been kept constant from 1987 until 2001 at the levels projected for 1986. | |||||||||
| (thousand) | |||||||||
| 1971 (base) | 1,430 | 1,431 | 2,861 | 1,430 | 1,431 | 2,861 | 1,430 | 1,431 | 2,861 |
| Constant Fertility Assumption‡ | |||||||||
| 1976 | 1,551 | 1,551 | 3,102 | 1,565 | 1,563 | 3,129 | 1,580 | 1,575 | 3,155 |
| 1981 | 1,692 | 1,692 | 3,384 | 1,722 | 1,717 | 3,439 | 1,752 | 1,742 | 3,494 |
| 1986 | 1,850 | 1,848 | 3,697 | 1,896 | 1,887 | 3,783 | 1,943 | 1,926 | 3,869 |
| 1991 | 2,016 | 2,012 | 4,028 | 2,080 | 2,066 | 4,146 | 2,144 | 2,121 | 4,265 |
| 1996 | 2,190 | 2,184 | 4,373 | 2,273 | 2,254 | 4,527 | 2,356 | 2,325 | 4,681 |
| 2,001 | 2,380 | 2,370 | 4,750 | 2,483 | 2,458 | 4,941 | 2,586 | 2,547 | 5,133 |
| High Fertility Assumption§ | |||||||||
| 1976 | 1,551 | 1,551 | 3,102 | 1,565 | 1,563 | 3,128 | 1,580 | 1,575 | 3,155 |
| 1981 | 1,695 | 1,695 | 3,390 | 1,725 | 1,720 | 3,445 | 1,755 | 1,745 | 3,500 |
| 1986 | 1,858 | 1,856 | 3,714 | 1,905 | 1,895 | 3,800 | 1,951 | 1,934 | 3,886 |
| 1991 | 2,030 | 2,026 | 4,057 | 2,095 | 2,081 | 4,176 | 2,160 | 2,135 | 4,295 |
| 1996 | 2,212 | 2,205 | 4,417 | 2,295 | 2,276 | 4,571 | 2,379 | 2,347 | 4,725 |
| 2,001 | 2,411 | 2,400 | 4,811 | 2,515 | 2,489 | 5,004 | 2,618 | 2,578 | 5,196 |
| Medium Fertility Assumption§ | |||||||||
| 1976 | 1,544 | 1,544 | 3,088 | 1,558 | 1,556 | 3,114 | 1,572 | 1,568 | 3,140 |
| 1981 | 1,667 | 1,668 | 3,336 | 1,697 | 1,693 | 3,390 | 1,727 | 1,717 | 3,444 |
| 1986 | 1,798 | 1,799 | 3,596 | 1,844 | 1,837 | 3,681 | 1,890 | 1,875 | 3,765 |
| 1991 | 1,930 | 1,930 | 3,861 | 1,993 | 1,983 | 3,976 | 2,056 | 2,036 | 4,092 |
| 1996 | 2,066 | 2,065 | 4,131 | 2,146 | 2,133 | 4,279 | 2,227 | 2,201 | 4,427 |
| 2,001 | 2,208 | 2,205 | 4,414 | 2,307 | 2,289 | 4,596 | 2,406 | 2,374 | 4,779 |
| Low Fertility Assumption§ | |||||||||
| 1976 | 1,536 | 1,537 | 3,073 | 1,550 | 1,549 | 3,099 | 1,565 | 1,560 | 3,125 |
| 1981 | 1,638 | 1,640 | 3,278 | 1,667 | 1,664 | 3,332 | 1,697 | 1,689 | 3,385 |
| 1986 | 1,736 | 1,739 | 3,475 | 1,781 | 1,776 | 3,557 | 1,826 | 1,814 | 3,640 |
| 1991 | 1,828 | 1,833 | 3,661 | 1,889 | 1,883 | 3,773 | 1,950 | 1,934 | 3,884 |
| 1996 | 1,919 | 1,924 | 3,843 | 1,996 | 1,989 | 3,985 | 2,073 | 2,054 | 4,127 |
| 2,001 | 2,007 | 2,012 | 4,020 | 2,101 | 2,092 | 4,193 | 2,195 | 2,171 | 4,366 |
The following diagram presented on a ratio scale shows the growth of actual population from 1880 to 1974 and projections through to 2000.
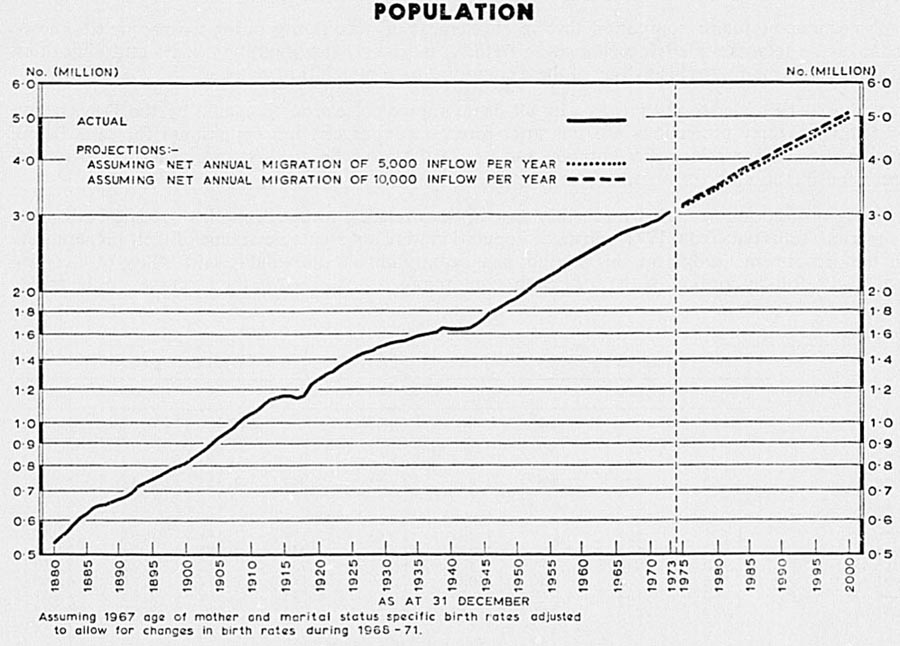
DISTRIBUTION OF POPULATION—Detailed population statistics are compiled for each census and are published in Volume 1, Increase and Location of Population, of the Census of Population and Dwellings.
North and South Islands—In 1858 the North Island had a larger population than the South, but this position was reversed at the succeeding enumeration, and the South Island had the larger population (exclusive of NZ Maoris) at each census from 1861 to 1896. In 1901 the North Island was found to have slightly the larger total and since then has steadily increased its lead.
The following table gives the population of the North and South Islands as disclosed by each census since 1901.
| Census Year | Total Population | Total | Percentages | ||
|---|---|---|---|---|---|
| North Island | South Island | North Island | South Island | ||
| 1901 | 431,471x | 384,391 | 815,862x | 52.9 | 47.1 |
| 1906 | 521,899x | 414,410 | 936,309x | 55.7 | 44.3 |
| 1911 | 610,599x | 447,713 | 1,058,312x | 57.7 | 42.3 |
| 1916 | 698,982 | 450,243 | 1,149,225 | 60.8 | 39.2 |
| 1921 | 791,918 | 479,750x | 1,271,668x | 62.3 | 37.7 |
| 1926 | 892,679 | 515,460 | 1,408,139 | 63.4 | 36.6 |
| 1936 | 1,018,038x | 555,774 | 1,573,812x | 64.7 | 35.3 |
| 1945 | 1,146,315x | 556,015x | 1,702,330x | 67.3 | 32.7 |
| 1951 | 1,313,869 | 625,603 | 1,939,472 | 67.7 | 32.3 |
| 1956 | 1,497,364 | 676,698 | 2,174,062 | 68.9 | 31.1 |
| 1961 | 1,684,785 | 730,199 | 2,414,984 | 69.8 | 30.2 |
| 1966 | 1,893,326 | 783,593 | 2,676,919 | 70.7 | 29.3 |
| 1971 | 2,051,363 | 811,268 | 2,862,631 | 71.7 | 28.3 |
The population of the North Island increased at a greater proportionate rate than that of the South Island between the 1966 and 1971 Censuses. At the 1971 Census the North Island population was 2,051,363, including 213,577 N.Z. Maoris, and the South Island population 811,268, inclusive of 13,837 N.Z. Maoris. The increase since the 1966 Census was 158,037 for the North Island and 27,675 for the South Island.
Between the 1966 and 1971 Censuses, births in the South Island numbered just over 82,000, and deaths almost 38,000, giving a net natural increase of just over 44,000. The fact that the total population increase is under 28,000 indicates a net migration outflow from the South Island during the intercensal period. This is in contrast to the 1961-66 intercensal period when a small net migration inflow of approximately 5,000 was recorded.
Statistical Areas—In the following table are shown the areas and the populations of the statistical areas at the 1971 Census and an estimate at 1 April 1974.
| Statistical Area | Area (Square Kilometres) | Population Census 23 March 1971 | Estimated Population 1 April 1974 |
|---|---|---|---|
| Northland | 12,639 | 96,191 | 98,520 |
| Central Auckland | 5,569 | 698,400 | 775,460 |
| South Auckland - Bay of Plenty | 36,744 | 422,299 | 453,350 |
| East Coast | 10,878 | 47,342 | 48,150 |
| Hawke's Bay | 11,033 | 133,250 | 141,000 |
| Taranaki | 9,713 | 100,895 | 102,260 |
| Wellington | 28,153 | 552,986 | 581,760 |
| Totals, North Island | 114,729 | 2,051,363 | 2,200,500 |
| Marlborough | 10,930 | 31,642 | 33,430 |
| Nelson | 17,897 | 68,838 | 71,160 |
| Westland | 15,566 | 22,861 | 22,430 |
| Canterbury | 43,431 | 398,830 | 420,870 |
| Otago | 36,441 | 182,749 | 184,360 |
| Southland | 29,681 | 106,348 | 110,050 |
| Totals, South Island | 153,946 | 811,268 | 842,300 |
| Totals, New Zealand | 268,675 | 2,862,631 | 3,042,800 |
Statistical Divisions and Urban Areas—Statistical divisions and urban areas are statistical conceptions and not administrative units. Their purpose is to provide definite, stable, and comparable boundaries for the larger centres of population. Statistical divisions are a new concept. The basic criterion for a statistical division is a population of 75,000 or more within the area of economic and social interests of a heavily populated centre. Seven statistical divisions have been established, namely, Auckland, Hamilton, Napier-Hastings, Palmerston North, Wellington (including Hutt), Christchurch, and Dunedin. The division, like the urban area, does not have any administrative functions, but embraces areas of unified community, economic, and social interests. In addition to the central city or borough, urban areas include neighbouring boroughs and town districts and parts of counties which are regarded as suburban to the centre of population. Maps of statistical boundaries are available at Government bookshops.
Previously there were 18 statistically defined urban areas; there are now 24 urban areas. The additional areas result from splitting the Auckland, Wellington, and Hutt urban areas and adding Masterton. Adjustments of urban area boundaries have been made because of the peripheral growth of population in some of the urban centres.
The populations of statistical divisions and urban areas arc given below.
| Statistical Division (S.Div.) and Urban Area (U.A.) | 1966 Census | 1971 Census | Percentage Increase | Estimated Population 1 April 1974 | |
|---|---|---|---|---|---|
| 1961-1966 | 1966-1971 | ||||
| Auckland S. Div.— | |||||
| Northern Auckland U.A. | 86,297 | 107,965 | 34.3 | 25.1 | 133,140 |
| Western Auckland U.A. | 75,792 | 89,946 | 37.3 | 18.7 | 105,350 |
| Central Auckland U.A. | 281,192 | 286,787 | 4.4 | 2.0 | 291,050 |
| Southern Auckland U.A. | 124,886 | 165,048 | 54.7 | 32.2 | 196,480 |
| Remainder S. Div. | 45,504 | 48,654 | 1.2 | 6.9 | 49,440 |
| Totals | 613,671 | 698,400 | 19.3 | 13.8 | 775,460 |
| Hamilton S. Div.— | |||||
| Hamilton U.A. | 68,485 | 80,812 | 23.9 | 18.0 | 92,050 |
| Remainder S. Div. | 55,786 | 55,194 | 2.0 | -1.1 | 55,400 |
| Totals | 124,271 | 136,006 | 13.0 | 9.4 | 147,450 |
| Statistical Division (S.Div.) and Urban Area (U.A.) | 1966 Census | 1971 Census | Percentage Increase | Estimated Population 1 April 1974 | |
|---|---|---|---|---|---|
| 1961-1966 | 1966-1971 | ||||
| Napier-Hastings S. Div.— | |||||
| Napier U.A. | 38,382 | 43,601 | 17.0 | 13.6 | 47,920 |
| Hastings U.A. | 40,655 | 45,512 | 14.1 | 11.9 | 49,670 |
| Remainder S. Div. | 7,874 | 7,820 | 4.0 | -0.7 | 7,870 |
| Totals | 86,911 | 96,933 | 14.4 | 11.5 | 105,460 |
| Palmerston North S. Div.— | |||||
| Palmerston North U.A. | 52,393 | 57,065 | 13.9 | 8.9 | 61,470 |
| Remainder S. Div.23,551 | 23,667 | 3.7 | 0.3 | 23,800 | |
| Totals | 75,944 | 80,732 | 10.5 | 6.3 | 85,270 |
| Wellington S. Div.— | |||||
| Upper Hutt Valley U.A. | 27,398 | 30,986 | 20.9 | 13.1 | 34,870 |
| Lower Hutt Valley U.A. | 88,337 | 92,003 | 14.5 | 4.2 | 96,950 |
| Porirua Basin U.A. | 37,624 | 47,858 | 35.7 | 27.2 | 54,100 |
| Wellington U.A. | 132,005 | 136,782 | 6.1 | 3.6 | 141,100 |
| Remainder S. Div. | 13,561 | 16,403 | 18.0 | 21.0 | 19,880 |
| Totals | 298,925 | 324,032 | 13.5 | 8.4 | 346,900 |
| Christchurch S. Div.— | |||||
| Christchurch U.A. | 257,505 | 275,968 | 12.1 | 7.2 | 292,520 |
| Remainder S. Div. | 24,954 | 26,642 | 6.9 | 6.8 | 28,010 |
| Totals | 282,459 | 302,610 | 11.6 | 7.1 | 320,530 |
| Dunedin S. Div.— | |||||
| Dunedin U.A. | 108,779 | 111,059 | 3.6 | 2.1 | 113,310 |
| Remainder S. Div. | 7,086 | 6,681 | -2.9 | -5.7 | 6,560 |
| Totals | 115,865 | 117,740 | 3.1 | 1.6 | 119,870 |
| Urban Areas Not in Any Statistical Division | |||||
|---|---|---|---|---|---|
| Urban Area | 1966 Census | 1971 Census | Percentage Increase | Estimated Population 1 April 1974 | |
| 1961-1966 | 1966-1971 | ||||
| Whangarei | 31,001 | 34,029 | 32.2 | 9.8 | 36,320 |
| Tauranga | 33,822 | 40,349 | 27.2 | 19.3 | 46,570 |
| Rotorua | 33,613 | 39,752 | 31.5 | 18.3 | 45,390 |
| Gisborne | 28,116 | 30,161 | 11.2 | 7.3 | 31,820 |
| New Plymouth | 35,680 | 38,780 | 8.7 | 8.7 | 41,840 |
| Wanganui | 38,174 | 37,982 | 6.9 | -0.5 | 38,070 |
| Masterton | 19,116 | 20,147 | 12.8 | 5.4 | 20,880 |
| Nelson | 34,459 | 37,994 | 12.3 | 10.3 | 41,160 |
| Timaru | 27,946 | 28,959 | 5.8 | 3.6 | 29,940 |
| Invercargill | 46,939 | 50,681 | 12.0 | 8.0 | 53,120 |
| Totals, 24 urban areas | 1,748,596 | 1,930,226 | 15.7 | 10.4 | 2,095,090 |
| Totals, 7 statistical divisions | 1,598,046 | 1,756,453 | 14.3 | 9.9 | 1,900,940 |
Cities and Boroughs—The population of cities and boroughs is now given.
| City or Borough | Estimated Population 1 April 1974 | Approximate Area in Hectares |
|---|---|---|
| *Now includes Glenfield and other parts of former Waitemata County; estimated population 63,200. Waitemata City was created from the major part of Waitemata County; estimated population, 79,000. | ||
| North Island— | ||
| Kaitaia | 3,820 | 526 |
| Kaikohe | 3,450 | 544 |
| Whangarei (city) | 33,000 | 4,354 |
| Dargaville | 4,190 | 1,133 |
| Helensville | 1,320 | 532 |
| East Coast Bays | 20,700 | 1,558 |
| Takapuna (city)* | 25,000 | 1,336 |
| Devonport | 11,000 | 445 |
| Northcote | 10,050 | 540 |
| Birkenhead | 19,500 | 1,266 |
| Henderson | 6,340 | 517 |
| Glen Eden | 7,520 | 503 |
| New Lynn | 10,250 | 564 |
| Auckland (city) | 152,600 | 7,489 |
| Newmarket | 1,220 | 74 |
| Mt. Albert | 27,000 | 983 |
| Mt. Eden | 20,700 | 598 |
| Mt. Roskill | 34,400 | 1,862 |
| Onehunga | 15,600 | 760 |
| One Tree Hill | 13,000 | 983 |
| Ellerslie | 5,530 | 301 |
| Mt. Wellington | 21,000 | 1,650 |
| Howick | 14,450 | 621 |
| Otahuhu | 10,050 | 558 |
| Papatoetoe (city) | 23,100 | 907 |
| Manukau (city) | 127,800 | 62,269 |
| Papakura | 20,800 | 1,380 |
| Pukekohe | 8,270 | 1,405 |
| Waiuku | 3,160 | 593 |
| Tuakau | 1,890 | 442 |
| Huntly | 5,310 | 785 |
| Cambridge | 6,940 | 1,071 |
| Ngaruawahia | 4,140 | 450 |
| Hamilton (city) | 85,600 | 5,555 |
| Te Awamutu | 7,140 | 713 |
| Te Kuiti | 4,860 | 675 |
| Taumarunui | 6,690 | 1,815 |
| Thames | 5,950 | 1,103 |
| Paeroa | 3,620 | 574 |
| Waihi | 3,080 | 539 |
| Te Aroha | 3,140 | 1,126 |
| Morrinsville | 4,440 | 476 |
| Matamata | 4,290 | 378 |
| Putaruru | 4,660 | 395 |
| Mt. Maunganui | 10,300 | 1,411 |
| Tauranga (city) | 32,500 | 3,806 |
| Te Puke | 3,810 | 532 |
| Rotorua (city) | 36,200 | 2,667 |
| Taupo | 12,400 | 1,446 |
| Whakatane | 10,550 | 1,123 |
| Kawerau | 7,870 | 923 |
| Murupara | 2,830 | 287 |
| Gisborne (city) | 29,800 | 2,628 |
| Wairoa | 5,590x | 649 |
| Napier (city) | 44,600 | 2,847 |
| Hastings (city) | 32,400 | 1,711 |
| Havelock North | 8,630 | 514 |
| Waipawa | 1,680 | 692 |
| Waipukurau | 3,570 | 420 |
| Dannevirke | 5,590 | 526 |
| Woodville | 1,520 | 427 |
| Waitara | 5,460 | 652 |
| New Plymouth (city) | 37,000 | 2,316 |
| Inglewood | 2,180 | 284 |
| Stratford | 5,360 | 816 |
| Eltham | 2,320 | 647 |
| Hawera | 8,300 | 514 |
| Patea | 1,940 | 575 |
| Ohakune | 1,400 | 841 |
| Raetihi | 1,350 | 388 |
| Wanganui (city) | 35,800 | 2,997 |
| Taihape | 2,760 | 778 |
| Marton | 4,680 | 573 |
| Feilding | 10,130 | 855 |
| Foxton | 2,810 | 306 |
| Palmerston N. (city) | 55,800 | 4,302 |
| Levin | 14,300 | 877 |
| Otaki | 3,900 | 663 |
| Upper Hutt (city) | 29,400 | 48,428 |
| Lower Hutt (city) | 64,100 | 8,967 |
| Petone | 9,430 | 1,044 |
| Eastbourne | 4,820 | 1,273 |
| Porirua (city) | 41,400 | 8,508 |
| Tawa | 12,250 | 550 |
| Wellington (city) | 141,800 | 26,343 |
| Pahiatua | 2,630 | 291 |
| Eketahuna | 690 | 384 |
| Masterton | 19,150 | 1,433 |
| Carterton | 3,900 | 512 |
| Grey town | 1,740 | 442 |
| Featherston | 2,290 | 307 |
| Martinborough | 1,350 | 433 |
| Totals, North Island cities and boroughs | 1,586,850x | 252,256 |
| City or Borough | Estimated Population 1 April 1974 | Approximate Area in Hectares |
|---|---|---|
| South Island— | ||
| Picton | 3,140 | 426 |
| Blenheim | 16,050 | 1,012 |
| Nelson (city) | 31,300 | 4,762 |
| Richmond | 6,700 | 1,052 |
| Motueka | 3,980 | 1,021 |
| Westport | 4,880 | 308 |
| Runanga | 1,330 | 487 |
| Greymouth | 7,710 | 1,068 |
| Hokitika | 3,410 | 273 |
| Rangiora | 5,500 | 357 |
| Kaiapoi | 4,660 | 318 |
| Riccarton | 7,120 | 339 |
| Christchurch (city) | 170,600 | 10,635 |
| Lyttelton | 3,200 | 1,036 |
| Ashburton | 14,000 | 1,226 |
| Geraldine | 1,980 | 301 |
| Temuka | 3,450 | 395 |
| Timaru (city) | 29,300 | 2,262 |
| Waimate | 3,190 | 312 |
| Oamaru | 13,100 | 1,161 |
| Port Chalmers | 2,950 | 410 |
| Dunedin (city) | 83,600 | 16,560 |
| St. Kilda | 6,400 | 249 |
| Green Island | 6,590 | 781 |
| Mosgiel | 8,880 | 652 |
| Milton | 2,180 | 204 |
| Kaitangata | 1,040 | 518 |
| Balclutha | 4,780 | 509 |
| Tapanui | 880 | 121 |
| Lawrence | 620 | 249 |
| Roxburgh | 770 | 208 |
| Naseby | 110 | 76 |
| Alexandra | 4,130 | 452 |
| Cromwell | 970 | 321 |
| Arrowtown | 280 | 134 |
| Queenstown | 2,610 | 416 |
| Gore | 9,030 | 946 |
| Mataura | 2,520 | 515 |
| Winton | 2,280 | 231 |
| Invercargill (city) | 49,700 | 5,574 |
| Bluff | 3,250 | 866 |
| Riverton | 1,350 | 403 |
| Totals, South Island cities and boroughs | 529,520 | 59,146 |
| Grand totals, all cities and borough | 2,116,370x | 311,402 |
Town Districts—The population of independent town districts—i.e., those contained in the following table—is not included with that of the county in which the town district is located.
| Town District | Estimated Population 1 April 1974 | Approximate Area in Hectares |
|---|---|---|
| North Island— | ||
| Hikurangi | 1,040 | 389 |
| Warkworth | 1,620 | 577 |
| Ohura | 490 | 330 |
| Manaia | 920 | 206 |
| Waverley | 1,120 | 202 |
| Hunterville | 620 | 320 |
| Totals, North Island | 5,810 | 2,024 |
| South Island— | ||
| Wyndham | 720 | 275 |
| Otautau | 970 | 198 |
| Totals, South Island | 1,690 | 473 |
| Grand totals | 7,500 | 2,497 |
Communities—The following table lists communities with populations of 1,000 or more at 1 April 1974. The parent county is shown in parentheses. The populations of communities (previously known as county towns or dependent town districts) are included in the administrative county populations given in a later table.
| Community | Estimated Population 1 April 1974 | Approximate Area in Hectares |
|---|---|---|
*Now part of Takapuna City. †Now part of Waitemata City. ‡Now part of Kapiti borough. | ||
| North Island— | ||
| Kerikeri (Bay of Islands) | 1,000 | 347 |
| Moerewa (Bay of Islands) | 1,350 | 75 |
| Kawakawa (Bay of Islands) | 1,560 | 229 |
| Paihia (Bay of Islands) | 1,290 | 232 |
| Glenfield (Waitemata)* | 33,600 | 1.860 |
| Kelston West (Waitemata)† | 11,700 | 656 |
| Green Bay (Waitemata)† | 3,340 | 191 |
| Titirangi (Waitemata)† | 10,300 | 119 |
| Orewa (Waitemata)† | 3,480 | 633 |
| Raglan (Raglan) | 1,080 | 372 |
| Kihikihi (Waipa) | 1,220 | 212 |
| Whitianga (Coromandel) | 1,100 | 293 |
| Waihi Beach (Ohinemuri) | 1,000 | 209 |
| Tokoroa (Matamata) | 18,000 | 970 |
| Katikati (Tauranga) | 1,310 | 960 |
| Mangakino (Taupo) | 1,900 | 261 |
| Edgecumbe (Whakatane) | 1,210 | 170 |
| Ohope (Whakatane) | 1,180 | 520 |
| Ashhurst (Oroua) | 1,390 | 125 |
| Paraparaumu (Hutt)‡ | 11,600 | 2,764 |
| Paekakariki (Hutt)‡ | 2,050 | 2,268 |
| South Island— | ||
| Kaikoura (Kaikoura) | 1,720 | 283 |
| Halswell (Paparua) | 4,620 | 204 |
| Brighton (Taieri) | 1,000 | 112 |
| Fairfield (Taieri) | 1,400 | 143 |
| Ranfurly (Maniototo) | 1,020 | 391 |
| Wanaka (Lake) | 1,070 | 294 |
| Te Anau (Wallace) | 2,020 | 395 |
District Communities—The following table lists the populations of district communities as at 1 April 1974. The parent county is shown in parentheses. The populations of district communities (previously known as county boroughs) are included in the administrative county populations given in the following table.
| District Community | Estimated Population 1 April 1974 | Approximate Area in Hectares |
|---|---|---|
| North Island— | ||
| Wellsford (Rodney) | 1,650 | 554 |
| Otorohanga (Otorohanga) | 1,940 | 227 |
| Ngongotaha (Rotorua) | 2,100 | 513 |
| Opotiki (Opotiki) | 2,620 | 299 |
| Bulls (Rangitikei) | 2,000 | 405 |
| Waikanae (Horowhenua) | 3,310 | 1,060 |
| Shannon (Horowhenua) | 1,690 | 342 |
| Heretaunga-Pinehaven (Hutt) | 6,330 | 4,700 |
| Wainuiomata (Hutt) | 18,800 | 26,614 |
| Total | 40,440 | 29,715 |
| South Island— | ||
| Hornby (Paparua) | 9,200 | 491 |
| Sockburn (Paparua) | 6,430 | 1,066 |
| Totals | 15,630 | 1,557 |
| Totals, county boroughs | 56,070 | 31,272 |
Extra-county Islands and Shipboard Population—In addition to the populations quoted for administrative counties, cities and boroughs, and independent town districts, the New Zealand totals include shipboard population and persons located on islands not within the boundaries of any county. The two latter categories comprised an estimated total of 4,580 persons at 1 April 1974.
Counties—The following table gives the estimated population of individual counties at 1 April 1974 together with the approximate area of each. It should be noted that “Administrative counties” do not include boroughs or town districts independent of county control, but include town districts, district communities, and communities which form parts of counties.
Later in 1974 the county of Patangata was incorporated in that of Waipukurau, and the counties of Geraldine and Levels merged to form Strathallan. The county of Waitemata was dissolved, Orewa going to Rodney County, Glenfield to Takapuna City and the remainder forming a new City of Waitemata.
| Administrative County | Estimated Population 1 April 1974 | Approximate Area, in Square Kilometres |
|---|---|---|
| *See preceding note on dissolution of County. | ||
| North Island— | ||
| Mangonui | 7,170 | 2,481 |
| Whangaroa | 1,900 | 622 |
| Hokianga | 3,990 | 1,588 |
| Bay of Islands | 15,130 | 2,131 |
| Whangarei | 13,200 | 2,675 |
| Hobson | 5,200 | 1,929 |
| Otamatea | 6,090 | 1,093 |
| Rodney | 7,510 | 1,256 |
| Waitemata* | 133,120 | 1,554 |
| Waiheke | 2,480 | 155 |
| Great Barrier Is. | 270 | 285 |
| Franklin | 16,750 | 1,419 |
| Raglan | 8,940 | 2,411 |
| Waikato | 15,670 | 1,655 |
| Waipa | 14,970 | 1,129 |
| Otorohanga | 9,850 | 1,976 |
| Waitomo | 5,660 | 3,375 |
| Taumarunui | 5,620 | 4,851 |
| Coromandel | 3,700 | 1,137 |
| Thames | 4,240 | 1,039 |
| Hauraki Plains | 5,120 | 603 |
| Ohinemuri | 4,140 | 624 |
| Piako | 11,200 | 1,168 |
| Matamata | 32,480 | 2,556 |
| Tauranga | 16,780 | 1,829 |
| Rotorua | 18,100 | 2,681 |
| Taupo | 14,300 | 7,244 |
| Whakatane | 14,370 | 4,196 |
| Opotiki | 6,240 | 3,124 |
| Waiapu | 4,500 | 2,818 |
| Waikohu | 3,240 | 2,650 |
| Cook | 8,310 | 2,841 |
| Wairoa | 5,520 | 4,128 |
| Hawke's Bay | 21,200 | 4,842 |
| Waipawa | 3,460 | 1,347 |
| Patangata* | 2,850 | 1,696 |
| Waipukurau | 1,170 | 331 |
| Dannevirke | 3,690 | 1,414 |
| Woodville | 1,460 | 404 |
| Clifton | 2,010 | 1,176 |
| Taranaki | 9,130 | 588 |
| Inglewood | 2,860 | 521 |
| Stratford | 5,120 | 2,157 |
| Egmont | 5,510 | 622 |
| Eltham | 2,910 | 534 |
| Waimate West | 2,350 | 215 |
| Hawera | 4,340 | 495 |
| Patea | 2,760 | 1,531 |
| Waimarino | 1,400 | 2,147 |
| Waitotara | 2,790 | 1,209 |
| Wanganui | 2,830 | 1,189 |
| Rangitikei | 14,590 | 4,486 |
| Kiwitea | 1,730 | 930 |
| Pohangina | 880 | 671 |
| Oroua | 4,900 | 492 |
| Manawatu | 6,400 | 692 |
| Kairanga | 6,080 | 461 |
| Horowhenua | 13,260 | 1,404 |
| Hutt | 39,580 | 603 |
| Pahiatua | 2,070 | 741 |
| Akitio | 900 | 831 |
| Eketahuna | 1,340 | 824 |
| Masterton | 4,060 | 2,390 |
| Wairarapa South | 2,540 | 1,140 |
| Featherston | 2,880 | 2,471 |
| Totals, North Island counties | 604,810 | 111,777 |
| South Island— | ||
| Marlborough | 9,570 | 6,639 |
| Awatere | 1,590 | 3,878 |
| Kaikoura | 3,160 | 2,344 |
| Golden Bay | 3,280 | 2,618 |
| Waimea | 15,700 | 7,511 |
| Buller | 3,040 | 5,035 |
| Inangahua | 1,970 | 2,440 |
| Grey | 4,140 | 3,957 |
| Westland | 5,810 | 11,440 |
| Amuri | 2,600 | 4,273 |
| Cheviot | 1,510 | 875 |
| Waipara | 2,590 | 2,476 |
| Ashley | 2,970 | 1,241 |
| Rangiora | 4,180 | 263 |
| Eyre | 2,770 | 459 |
| Oxford | 1,600 | 814 |
| Malvern | 6,410 | 5,046 |
| Paparua | 30,900 | 445 |
| Waimairi | 67,800 | 115 |
| Heathcote | 8,430 | 34 |
| Mt. Herbert | 720 | 171 |
| Akaroa | 1,520 | 437 |
| Chatham Islands | 730 | 963 |
| Wairewa | 660 | 438 |
| Ellesmere | 7,870 | 1,200 |
| Ashburton | 11,050 | 6,174 |
| Geraldine | 4,420 | 1,995 |
| Levels | 4,800 | 680 |
| Mackenzie | 8,260 | 7,456 |
| Waimate | 5,050 | 3,558 |
| Waitaki | 8,050 | 6,236 |
| Waihemo | 1,670 | 878 |
| Waikouaiti | 3,770 | 828 |
| Taieri | 8,210 | 2,331 |
| Bruce | 3,480 | 1,344 |
| Clutha | 5,500 | 2,717 |
| Tuapeka | 3,950 | 3,584 |
| Maniototo | 2,560 | 3,471 |
| Vincent | 3,890 | 7,568 |
| Lake | 3,400 | 10,025 |
| Southland | 26,250 | 9,577 |
| Wallace | 13,160 | 9,656 |
| Fiord | 140 | 7,861 |
| Stewart Island | 4101,746 | |
| Totals, South Island counties | 309,540 | 152,797 |
| Grand totals, all counties | 914,350 | 264,574 |
Urban Concentration of Population—The bulk of New Zealand's population is located in urban areas, where the most rapid growth rates are occurring. This is due largely to the development of both manufacturing and tertiary industries in urban areas, which provide employment for a growing labour force. Other factors, including better social, cultural, educational, and economic opportunities serve to attract persons to these areas, while the majority of immigrants tend to settle in the larger urban centres. These factors, combined with amalgamation of farms, centralisation of dairy factories, and increasing agricultural mechanisation (resulting in less labour required), combine to produce a noticeable rural-urban drift. Urban concentration features are common to “developed” countries at advanced stages of economic development.
The 1971 Census figures showed a continuing decline in the population of rural areas and in many cases also of small and intermediate-sized towns. Seventy-two counties recorded smaller populations than in 1966. Of 58 small towns (1,000 to 4,999 population) 22 declined in population compared with 7 which showed declines between 1961 and 1966. Six intermediate towns (5,000 to 9,999 population situated outside urban areas) showed decreases on this occasion as against only two in 1966.
The following table indicates the urban movement of the total population and Maori population—the urban content has been taken as the population in the 24 urban areas, plus that of all boroughs, town districts, communities, district communities, and townships with population of 1,000 or over.
| Census | Urban | Rural* | ||
|---|---|---|---|---|
| Number | Percent | Number | Percent | |
| *Excludes shipping. | ||||
| Total Population | ||||
| 1926 | 937,304 | 66.9 | 464,370 | 33.1 |
| 1936 | 1,050,829 | 67.0 | 518,284x | 33.0 |
| 1945 | 1,211,419 | 71.3 | 487,726x | 28.7 |
| 1951 | 1,406,516 | 72.7 | 527,078 | 27.3 |
| 1956 | 1,600,808 | 73.8 | 568,806 | 26.2 |
| 1961 | 1,840,202 | 76.4 | 569,217 | 23.6 |
| 1966 | 2,119,085 | 79.3 | 553,023 | 20.7 |
| 1971 | 2,328,876 | 81.5 | 528,609 | 18.5 |
| New Zealand Maori Population | ||||
| 1926 | 9,815 | 15.4 | 53,804 | 84.6 |
| 1936 | 15,606 | 19.0 | 66,693 | 81.0 |
| 1945 | 24,801 | 25.1 | 73,923 | 74.9 |
| 1951 | 33,529 | 29.0 | 82,054 | 71.0 |
| 1956 | 47,630 | 34.7 | 89,452 | 65.3 |
| 1961 | 76,792 | 46.0 | 90,240 | 54.0 |
| 1966 | 122,942 | 61.1 | 78,153 | 38.9 |
| 1971 | 159,497 | 70.2 | 67,801 | 29.8 |
In the process of urbanisation some cities and areas have grown more quickly than others. There is a tendency towards concentration of population in the largest centres and also a drift of population from the south to the north. Where the two tendencies reinforce each other, as they do in the case of Auckland, the rate of growth has been very rapid. Likewise the urban areas of Whangarei, Hamilton, Tauranga, and Rotorua, which had a combined population in 1926 of 40,164, in 1971 comprised 194,942 inhabitants.
The initial reason for the drift to the north lay in the change in emphasis of farming activities in which the development of dairying played an important part. The expansion of dairying in itself called for the development of factory processing facilities and service industries. These farming trends have been reinforced by the growth of forest processing industries in the North Island and compounded further by the general tendency for the large-scale manufacturing units to be located close to the biggest local markets.
In the larger cities a notable feature of the past 35 years has been a movement of population from the central or “inner” areas to the perimeter or “outer” areas as families in decayed areas have moved to State rental houses and as residential units in the city centres have been replaced by shops, offices, places of entertainment, and other commercial or industrial buildings. In recent years there has been an offsetting movement with the building of multi-storey flats in the inner areas.
The distribution of population by size of centres is shown in the following table.
| Sizes of Centre (City, Borough, Town District, or Community) | Number of Centres | Percentage of Population in These Centres | ||||||
|---|---|---|---|---|---|---|---|---|
| 1926 | 1961 | 1966 | 1971 | 1926 | 1961 | 1966 | 1971 | |
| 1,000- 2,499 | 63 | 45 | 44 | 43 | 7.5 | 3.0 | 2.5x | 2.4 |
| 2,500- 4,999 | 23 | 47x | 41 | 40 | 6.2 | 7.2v | 5.5 | 5.0 |
| 5,000- 9,999 | 11 | 34x | 34 | 35 | 5.9 | 9.6x | 8.9x | 8.8 |
| 10,000-24,999 | 12 | 21 | 23 | 23 | 13.3 | 15.0x | 13.5 | 12.8 |
| 25,000 and over | 4 | 12 | 19 | 22 | 24.1 | 32.5x | 40.9 | 44.6 |
| Total | 113 | 159 | 161 | 163 | 57.0 | 67.3x | 71.3x | 73.6 |
In the South Island a higher proportion of the population is rural, that is, outside urban communities, than in the North Island, the proportion being 22.7 in the South Island against 16.9 percent in the North Island, at the 1971 Census of Population.
Males and Females—The census of 23 March 1971 showed that females outnumbered males by 919 in the total population. Females per 1,000 males at the last six censuses have been:
| Census | Excluding N.Z. Armed Forces Overseas | Including N.Z. Armed Forces Overseas |
|---|---|---|
| 1945 | 1,044 | 991 |
| 1951 | 991 | 989 |
| 1956 | 989 | 987 |
| 1961 | 990 | 988 |
| 1966 | 992 | 991 |
| 1971 | 1,001 | 1,000 |
There are marked differences in the sex distribution of the population of different parts of New Zealand, depending largely on educational and employment opportunities. The following figures give the number of females per 1,000 males at the Census of 1971.
| Statistical Areas | |
| Hawke's Bay | 1,029 |
| Central Auckland | 1,021 |
| Otago | 1,019 |
| Canterbury | 1,014 |
| Nelson | 1,004 |
| East Coast | 1,000 |
| Wellington | 998 |
| Taranaki | 988 |
| South Auckland-Bay of Plenty | 974 |
| Northland | 967 |
| Marlborough | 959 |
| Westland | 945 |
| Southland | 942 |
| Urban Areas | |
| Timaru | 1,102 |
| Hastings | 1,077 |
| Wanganui | 1,074 |
| Gisborne | 1,070 |
| Dunedin | 1,067 |
| Central Auckland | 1,062 |
| Napier | 1,062 |
| New Plymouth | 1,055 |
| Nelson | 1,055 |
| Palmerston North | 1,048 |
| Hamilton | 1,047 |
| Christchurch | 1,045 |
| Tauranga | 1,044 |
| Northern Auckland | 1,044 |
| Whangarei | 1,040 |
| Porirua Basin | 1,023 |
| Masterton | 1,021 |
| Wellington | 1,016 |
| Invercargill | 1,014 |
| Rotorua | 1,013 |
| Lower Hutt Valley | 1,009 |
| Southern Auckland | 1,001x |
| Western Auckland | 984 |
| Upper Hutt Valley | 915 |
DENSITY OF POPULATION—Generally speaking, a dense population must depend upon intensive land utilisation or industrialisation. In New Zealand there is a great area of high mountainous country, particularly in the South Island, and large areas of hilly country which cannot be closely settled, while the growth of mechanisation in farming tends to reduce the size of the labour force engaged in farming operations.
Nevertheless, economic development is providing employment for a growing labour force. More extensive mechanisation, further advances in science and technology, and increases in productivity, wealth, and consumption have paved the way for further specialisation of production and more concentrated urbanisation.
Within New Zealand there are wide variations in density of population. The following table provides comparative density figures on a statistical area basis from 1926 to 1971 censuses.
| Statistical Area | Area in Square Kilometres | Persons Per Square Kilometre | |||||
|---|---|---|---|---|---|---|---|
| 1926 | 1945 | 1951 | 1961 | 1966 | 1971 | ||
| Northland | 12,639 | 4.3 | 5.3 | 6.0 | 6.8 | 7.4 | 7.6 |
| Central Auckland | 5,569 | 42.4 | 59.6 | 68.6 | 92.4 | 110.2 | 125.4 |
| South Auckland - Bay of Plenty | 36,744 | 3.9 | 5.6 | 6.7 | 9.5 | 10.6 | 11.5 |
| East Coast | 10,878 | 3.1 | 3.5 | 3.8 | 4.3 | 4.3 | 4.4 |
| Hawke's Bay | 11,033 | 6.4 | 7.2 | 8.3 | 10.4 | 11.3 | 12.1 |
| Taranaki | 9,713 | 7.4 | 7.9 | 8.9 | 10.3 | 10.4 | 10.4 |
| Wellington | 28,153 | 10.0 | 12.4 | 13.9 | 16.8 | 18.6 | 19.6 |
| Totals, North Island | 114,729 | 7.8 | 10.0 | 11.5 | 14.7 | 16.5 | 17.9 |
| Marlborough | 10,930 | 1.7 | 1.9 | 2.1 | 2.5 | 2.7 | 2.9 |
| Nelson | 17,897 | 2.3 | 2.6 | 3.2 | 3.5 | 3.8 | 3.8 |
| Westland | 15,566 | 1.4 | 1.5 | 1.6 | 1.6 | 1.6 | 1.5 |
| Canterbury | 43,431 | 5.0 | 5.8 | 6.5 | 7.9 | 8.7 | 9.2 |
| Otago | 36,441 | 4.1 | 4.0 | 4.4 | 4.8 | 5.0 | 5.0 |
| Southland | 29,681 | 2.2 | 2.4 | 2.6 | 3.2 | 3.5 | 3.6 |
| Totals, South Island | 153,946 | 3.3 | 3.6 | 4.1 | 4.7 | 5.1 | 5.3 |
| Totals, New Zealand | 268,675 | 5.2 | 6.3 | 7.2 | 9.0 | 10.0 | 10.7 |
NEW ZEALAND MAORI POPULATION—All persons of half or more Maori ancestry are defined as Maoris.
The growth rate of Maoris in the population approaches twice that of the population taken as a whole; an average annual increase in 1966-71 of 2.5 percent as compared with 1.4 percent for the total population. (Nevertheless the growth rate showed a slight fall when compared with the previous intercensal periods.)
The population growth rate among the Maoris is predominantly a result of natural increase, whereas in the total population natural increase is normally supplemented by sizeable increments from migration.
When studying growth rates of the Maori population, however, it should be noted that, as a result of intermarriage, there are increasing numbers of Maori children (half or more Maori) who have one parent not counted in the Maori population, i.e., if a full Maori male marries a full European female or vice versa, the resulting progeny are all counted in the Maori population; this undoubtedly contributes to the high Maori percentage increase.
The decline in the number of Maoris during the early years of European settlement and throughout most of the nineteenth century is a matter of history. The present century has witnessed a resurgence of vitality among the Maori people which has been reflected in a strikingly high birth rate.
A statement of N.Z. Maori population is now given for each census from 1901.
| Year | New Zealand Maori Population | Intercensal Increase | Intercensal Increase | Average Annual Increase |
|---|---|---|---|---|
| *Includes members of New Zealand armed forces overseas. | ||||
| number | percent | |||
| 1901 | 45,549 | 3,436x | 8.16 | 1.59 |
| 1906 | 50,309 | 4,760 | 10.45 | 1.98 |
| 1911 | 52,723 | 2,414 | 4.80 | 0.96 |
| 1916 | 52,997x | 274x | 0.52 | 0.09 |
| 1921 | 56,987 | 3,990 | 7.53 | 1.62 |
| 1926 | 63,670 | 6,683 | 11.73 | 2.24 |
| 1936 | 82,326 | 18,656 | 29.30 | 2.62 |
| 1945 | 98,744 | 16,418 | 19.94 | 1.93 |
| 1945* | 100,044 | 17,718 | 21.52 | 2.07 |
| 1951 | 115,676 | 16,932 | 17.15 | 2.89 |
| 1951* | 115,740 | 15,696 | 15.69 | 2.66 |
| 1956 | 137,151 | 21,475 | 18.56 | 3.46 |
| 1956* | 137,341 | 21,601 | 18.66 | 3.48 |
| 1961 | 167,086 | 29,935 | 21.83 | 4.02 |
| 1961* | 167,390 | 30,049 | 21.88 | 4.03 |
| 1966 | 201,159 | 34,073 | 20.39 | 3.84 |
| 1966* | 201,479 | 34,089 | 20.37 | 3.83 |
| 1971 | 227,414 | 26,255 | 13.05 | 2.48 |
| 1971* | 227,741 | 26,262 | 13.03 | 2.48 |
The increasing urbanisation of the Maori population as younger Maoris seek better job opportunities in the cities and boroughs is a population trend of considerable sociological significance. As late as the 1936 Census only 8,249 Maoris (10 percent) dwelt in cities, boroughs, or independent town districts. By the 1971 Census the comparative figure was 132,970 (58.5 percent); the largest concentration is in Southern Auckland urban area, where 20,675 Maoris were enumerated in 1971.
Of the 227,414 Maoris at the 1971 Census, 213,577 were in the North Island.
The Maori population, which until recently was not greatly affected by external migration, is a much younger population than the non-Maori.
The following table for 1971 shows the high proportion (49.1 percent) of Maori children under 15 years compared with the total population (31.8 percent), and the low proportion of people in the older age groups.
| Age Group (Years) | Percentage in Age Groups (1971 Census) | |
|---|---|---|
| New Zealand Maori | Total Population | |
| Under 15 | 49.1 | 31.8 |
| 15-19 | 10.5 | 9.1 |
| 20-44 | 29.6 | 31.5 |
| 45-59 | 7.5 | 15.1 |
| 60 and over | 3.3 | 12.5 |
| Totals | 100.0 | 100.0 |
EXTERNAL MIGRATION—In recent years there has been a large increase in New Zealanders going overseas on business, on pleasure trips, and on working holidays, resulting in much higher levels of migration. The arrivals include many New Zealanders returning from travel overseas, as well as growing numbers of tourists from overseas countries.
The numbers of arrivals and departures during the last 11 years are given in the table following. Crews of vessels, through passengers, tourists on cruising liners, and members of the armed forces, etc., have not been taken into account in this table.
| Year Ended 31 March | Arrivals | Departures | Excess of Arrivals Over Departures | ||||
|---|---|---|---|---|---|---|---|
| Males | Females | Total | Males | Females | Total | ||
| 1964 | 89,870 | 74,776 | 164,646 | 81,956 | 67,206 | 149,162 | 15,484 |
| 1965 | 104,421 | 85,870 | 190,291 | 98,147 | 80,153 | 178,300 | 11,991 |
| 1966 | 121,106 | 98,833 | 219,939 | 114,000 | 93,918 | 207,918 | 12,021 |
| 1967 | 136,275 | 114,131 | 250,406 | 128,228 | 107,743 | 235,971 | 14,435 |
| 1968 | 136,760 | 122,621 | 259,381 | 143,259 | 124,212 | 267,471 | - 8,090 |
| 1969 | 136,457 | 119,279 | 255,736 | 142,653 | 123,931 | 266,584 | -10,848 |
| 1970 | 156,645 | 136,760 | 293,405 | 157,829 | 137,636 | 295,465 | - 2,060 |
| 1971 | 190,437 | 161,859 | 352,296 | 185,598 | 158,853 | 344,451 | 7,845 |
| 1972 | 217,606 | 190,675 | 408,281 | 211,048 | 186,382 | 397,430 | 10,851 |
| 1973 | 247,135 | 222,247 | 469,382 | 233,721 | 210,186 | 443,907 | 25,475 |
| 1974 | 316,681 | 281,418 | 598,099 | 298,474 | 266,458 | 564,932 | 33,167 |
From 1968 to 1970 there was an alteration in the net migration flow. This is illustrated in the following diagram which covers all passenger migration, excluding through passengers and crews.
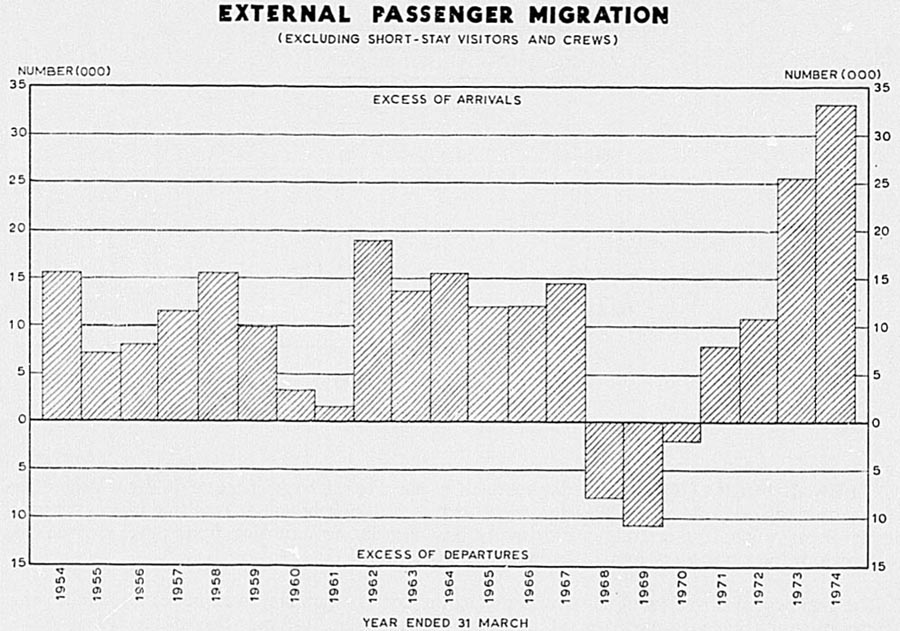
Long-term Migration—The following table gives an analysis of long-term arrivals and departures for March years. (Short-term migration is analysed in Section 39: Travel and Tourism.)
| Year | Long-term (Including Permanent) Arrivals | Long-term (Including Permanent) Departures | ||||||||
|---|---|---|---|---|---|---|---|---|---|---|
| New Permanent Arrivals | Long-term | Permanent and Long-term Arrivals (Immigrants) | Permanent Departures-of New Zealand Residents | Long-term | Permanent and Long-term Departures (Emigrants) | |||||
| Assisted Subsidised | Total (includes others) | N.Z. Residents Returning * | Long-term Visitors* | N.Z. Residents Departing * | Long-term Visitors Departing * | |||||
| *Arrivals: after absence of, or intending to stay, 12 months or more respectively. Departures: persons intending to stay away for, or after stay in New Zealand of, 12 months or more respectively. | ||||||||||
| 1967-68 | 2,764 | 256 | .. | .. | .. | 30.660 | .. | .. | .. | 28,472 |
| 1968-69 | 490 | 198 | .. | .. | .. | 23,225 | .. | .. | .. | 29,802 |
| 1969-70 | 382 | 535 | .. | .. | .. | 26,825 | .. | .. | .. | 29,822 |
| 1970-71 | 538 | 3,182 | 17,735 | 12,236 | 9,406 | 39,377 | 11,234 | 22,235 | 4,696 | 38,165 |
| 1971-72 | 483 | 4,183 | 20,261 | 14,578 | 10,260 | 45,099 | 9,339 | 22,979 | 5,228 | 37,546 |
| 1972-73 | 506 | 3,036 | 26,666 | 16,694 | 11,291 | 54,651 | 7,818 | 21,858 | 5,807 | 35,483 |
| 1973-74 | 450 | 4,836 | 38,121 | 17,123 | 14,571 | 69,815 | 9,591 | 26,832 | 5,915 | 42,338 |
The countries of origin and destination of these long-term migrants are shown in the following table.
| Year | Australia | Canada | India | United Kingdom | Cook Islands and Niue | Fiji | Western Samoa | Netherlands | South Africa | United States | All Other Countries | Total |
|---|---|---|---|---|---|---|---|---|---|---|---|---|
| Immigrants by Country of Last Residence | ||||||||||||
| 1968-69 | 6,758 | 801 | 174 | 9,329 | 393 | 471 | 317 | 478 | 142 | 1,315 | 3,047 | 23,225 |
| 1969-70 | 8,854 | 1,064 | 210 | 9,387 | 755 | 485 | 281 | 540 | 187 | 1,716 | 3,346 | 26,825 |
| 1970-71 | 13,804 | 1,718 | 194 | 13,276 | 1,062 | 795 | 669 | 533 | 331 | 2,161 | 4,834 | 39,377 |
| 1971-72 | 16,083 | 2,135 | 273 | 15,209 | 1,181 | 784 | 445 | 649 | 516 | 2,413 | 5,411 | 45,099 |
| 1972-73 | 17,730 | 2,056 | 219 | 21,676 | 1,949 | 970 | 382 | 819 | 641 | 2,309 | 5,900 | 54,651 |
| 1973-74 | 20,319 | 2,129 | 267 | 31,811 | 2,280 | 1,189 | 553 | 743 | 847 | 2,426 | 7,251 | 69,815 |
| Emigrants by Country of Next Residence | ||||||||||||
| 1968-69 | 16,881 | 1,090 | 84 | 5,989 | 168 | 574 | 203 | 363 | 397 | 1,272 | 2,781 | 29,802 |
| 1969-70 | 15,268 | 941 | 84 | 6,837 | 252 | 660 | 256 | 399 | 408 | 1,492 | 3,225 | 29,822 |
| 1970-71 | 18,850 | 1,102 | 111 | 9,309 | 529 | 848 | 312 | 753 | 435 | 1,443 | 4,473 | 38,165 |
| 1971-72 | 17,630 | 806 | 170 | 9,442 | 437 | 758 | 442 | 579 | 769 | 1,737 | 4,776 | 37,546 |
| 1972-73 | 15,230 | 832 | 183 | 9,757 | 351 | 871 | 647 | 484 | 642 | 1,717 | 4,769 | 35,483 |
| 1973-74 | 20,500 | 1,179 | 116 | 10,863 | 440 | 757 | 583 | 600 | 493 | 1,855 | 4,952 | 42,338 |
Ages—The following table gives the age distribution of long-term arrivals and departures for the year ended 31 March 1973.
| Age, in Years | Permanent Arrivals | Permanent Departures | Excess of Arrivals Over Departures | ||||
|---|---|---|---|---|---|---|---|
| Males | Females | Totals | Males | Females | Totals | ||
| Under 15 | 6,826 | 6,360 | 13,186 | 3,170 | 3,043 | 6,213 | 6,973 |
| 15-19 | 1,942 | 2,387 | 4,329 | 1,572 | 2,160 | 3,732 | 597 |
| 20-24 | 5,344 | 5,736 | 11,080 | 5,711 | 5,801 | 11,512 | -432 |
| 25-44 | 10,960 | 8,671 | 19,631 | 6,093 | 4,549 | 10,642 | 8,989 |
| 45-64 | 2,443 | 2,525 | 4,968 | 1,270 | 1,325 | 2,595 | 2,373 |
| 65 and over | 620 | 837 | 1,457 | 321 | 468 | 789 | 668 |
| Totals | 28,135 | 26,516 | 54,651 | 18,137 | 17,346 | 35,483 | 19,168 |
The occupations of working persons in permanent and long-term arrivals and departures for the year ended March 1973 are given in the following table.
| Occupation Group | Permanent Arrivals | Permanent Departures | ||||
|---|---|---|---|---|---|---|
| Males | Females | Total | Males | Females | Total | |
| Professional (including nurses and teachers) | 3,863 | 3,369 | 7,232 | 2,773 | 3,330 | 6,103 |
| Administrative and managerial | 869 | 53 | 922 | 653 | 53 | 706 |
| Clerical workers | 1,487 | 4,581 | 6,068 | 1,107 | 4,108 | 5,215 |
| Sales workers | 1,418 | 597 | 2,015 | 925 | 408 | 1,333 |
| Farmers and fishermen | 973 | 40 | 1,013 | 828 | 50 | 878 |
| Miners and quarrymen | 111 | - | 111 | 54 | - | 54 |
| Transport and communications workers | 1,146 | 208 | 1,354 | 640 | 159 | 799 |
| Tradesmen, factory workers, labourers | 7,620 | 495 | 8,115 | 5,204 | 455 | 5,659 |
| Personal, servicing | 857 | 1,001 | 1,858 | 572 | 762 | 1,334 |
| Not specified | 396 | 21 | 417 | 420 | 43 | 463 |
| Totals, actively engaged | 18,740 | 10,365 | 29,105 | 13,176 | 9,368 | 22,544 |
Origin—The following table shows for the latest 3 years the birthplaces of long-term migrants.
| Country of Birth | Immigrants | Emigrants | ||||
|---|---|---|---|---|---|---|
| 1970-71 | 1971-72 | 1972-73 | 1970-71 | 1971-72 | 1972-73 | |
| Commonwealth Countries | ||||||
| United Kingdom— | ||||||
| England and Wales | 11,541 | 13,269 | 16,749 | 5,182 | 4,772 | 4,109 |
| Scotland | 1,719 | 1,680 | 1,993 | 913 | 822 | 725 |
| Northern Ireland | 306 | 455 | 626 | 120 | 112 | 99 |
| Other or undefined | 60 | 65 | 1,685 | 38 | 33 | 479 |
| Australia | 6,161 | 7,104 | 8,219 | 2,382 | 2,456 | 2,507 |
| Canada | 884 | 1,222 | 1,297 | 253 | 271 | 355 |
| India | 252 | 304 | 296 | 152 | 163 | 194 |
| New Zealand | 10,865 | 12,842 | 14,525 | 24,959 | 24,672 | 22,526 |
| Pacific Islands— | ||||||
| Cook Islands and Niue | 927 | 973 | 1,621 | 169 | 158 | 127 |
| Western Samoa | 540 | 333 | 281 | 202 | 272 | 322 |
| Fiji | 385 | 354 | 330 | 207 | 245 | 274 |
| Other Pacific | 291 | 284 | 345 | 136 | 166 | 227 |
| Other | 1,134 | 1,357 | 1,539 | 530 | 571 | 705 |
| Totals, Commonwealth countries | 35,065 | 40,242 | 49,506 | 35,243 | 34,713 | 32,649 |
| Other Countries | ||||||
| Austria | 49 | 47 | 52 | 37 | 45 | 21 |
| China | 104 | 102 | 72 | 58 | 74 | 79 |
| Denmark | 62 | 84 | 73 | 56 | 32 | 47 |
| Germany | 261 | 283 | 338 | 190 | 165 | 150 |
| Greece | 98 | 80 | 58 | 83 | 97 | 111 |
| Hungary | 43 | 27 | 50 | 47 | 28 | 30 |
| Ireland, Republic of | 72 | 75 | 403 | 75 | 45 | 149 |
| Italy | 156 | 114 | 87 | 147 | 114 | 175 |
| Indonesia | 85 | 132 | 89 | 58 | 69 | 59 |
| Netherlands | 640 | 713 | 915 | 658 | 541 | 451 |
| Switzerland | 114 | 155 | 176 | 77 | 58 | 73 |
| United States | 1,312 | 1,608 | 1,437 | 548 | 725 | 752 |
| Yugoslavia | 115 | 101 | 98 | 107 | 78 | 67 |
| Others | 1,201 | 1,336 | 1,296 | 780 | 762 | 670 |
| Totals, other countries | 4,312 | 4,857 | 5,144 | 2,921 | 2,833 | 2,834 |
| Grand totals | 39,377 | 45,099 | 54,650 | 38,164 | 37,546 | 35,483 |
IMMIGRATION POLICY—The guidelines of a revised immigration policy on permanent entry were announced by the Government in May 1974. A particular concern of the new policy is to eliminate discrimination but this does not imply that New Zealand should accept migrants from all regions or countries, particularly from those with which New Zealand has no affinity or migration links. Harmonious settlement is emphasised and the number of immigrants is to be matched to New Zealand's capacity to provide employment, housing and community services. (In 1974 the net inflow reached 34,000 and imposed considerable strain on the economy). Immigrants are now selected according to defined criteria, including skills and qualifications, health, character, age 18 to 45 years, and families of not more than four dependent children. There is liberal provision for admitting relatives of New Zealand residents and for other cases with strong humanitarian considerations.
The South Pacific is a special situation. The islands, being our nearest neighbours apart from Australia, must be regarded in some measure as our responsibility. Those born in the Cook, Niue, and Tokelau Islands are New Zealand citizens and may migrate at any time. Western Samoa, as a former trust territory, holds a special place in the policy. The Samoans take full advantage of the opportunities offered, the inflow at present being about 1,500 a year. Provision has been made for permanent entry of a small number of Fijian citizens and Tongans.
A Review of Immigration Policy was published as parliamentary paper E 21, 1974.
Assisted Immigration—Financially assisted by the Government, the subsidy scheme involves a contribution by employers to immigrants' fares. The contribution made by migrants is the equivalent of £10 sterling for single persons and £20 for married persons.
Employers wishing to take advantage of the subsidy scheme are obliged to provide employment, arrange suitable housing in New Zealand, and meet one-quarter of the cost of migrants' fares either by sea or air; the Government meets the remaining three-quarters. The cost is approximately the same for both methods of travel.
The subsidy scheme operates from Britain, the United States, France, Belgium, Switzerland, the Netherlands, and West Germany. The scheme has not been formally approved by the Italian Government but nationals of that country who apply spontaneously to come to New Zealand are permitted to use the scheme. There is no quota on the subsidy scheme. Single people and married men between the ages of 18 and 45 years may be sponsored, but key workers only are sought.
A system of matching skills of immigrants with specific vacancies in New Zealand has been developed by the Chief Migration Officer, New Zealand House, London, for British and most Western European migrants, and similar registers have been established by the New Zealand Immigration Attaché in the Hague for Dutch workers, and by the New Zealand Consul-General in Los Angeles for American migrants. Employers interested in recruiting migrants with certain skills may file details of their vacancies through the Department of Labour in Wellington. The department will also arrange for vacancies to be advertised, if required by employers. In addition, the department holds interview reports for a large number of skilled tradesmen in a variety of occupations and these can be made available to interested employers.
The assisted passage scheme, which operated only from Britain, was limited to 500 migrants a year. This scheme which began in 1947, was terminated in April 1975.
The number of assisted immigrants (excluding displaced persons, and Hungarian and Czech refugees) arriving in the last 11 years are as follows.
| Year Ended 31 March | British | Dutch | Austrian | German | Danish | Swiss | Greek | Other | Total |
|---|---|---|---|---|---|---|---|---|---|
*Includes 68 from United States in 1973 and 59 in 1974. †Includes subsidy scheme migrants not shown prior to 1971-72; their total was 4,183 in 1971-72 and 3,632 in 1972-73; see a preceding table on long-term migration. | |||||||||
| 1964 | 4.171 | - | 6 | 16 | 5 | 14 | 130 | 5 | 4,347 |
| 1965 | 4,300 | - | 9 | 12 | 5 | 11 | 29 | 34 | 4,400 |
| 1966 | 3,963 | - | 19 | 7 | 8 | 27 | 18 | - | 4,042 |
| 1967 | 4,020 | - | 9 | 9 | 10 | 36 | 11 | 2 | 4,097 |
| 1968 | 2,732 | - | 2 | 4 | 5 | 17 | 4 | - | 2,764 |
| 1969 | 485 | - | - | 2 | - | 2 | 1 | - | 490 |
| 1970 | 377 | - | - | - | 2 | - | 1 | 2 | 382 |
| 1971 | 532 | - | - | - | 4 | 3 | - | - | 539 |
| 1972 | 4,556 | 434 | - | 4 | 6 | 37 | - | 111 | 5,148 |
| 1973† | 3,459 | 550 | - | 14 | 4 | 37 | - | 74* | 4,138 |
| 1974† | 6,140 | 493 | 1 | 10 | 2 | 41 | - | 68* | 6,755 |
Refugees—New Zealand has a good reputation for accepting refugees who come within the Mandate of the United Nations High Commission for Refugees. As well as a number of individual cases, New Zealand accepted over 240 persons under the Ugandan Asian resettlement programme. Assistance in the resettlement of refugees received from the Inter-church Committee on Immigration has been invaluable.
Formalities—The legislation respecting immigration into New Zealand is contained in the Immigration Act 1964, and the Undesirable Immigrants Exclusion Act 1919. This legislation is administered by the Department of Labour.
The Immigration Act prescribes that all persons who are not New Zealand citizens require permits to enter the country. Citizens from countries with which New Zealand has negotiated visa abolition agreements may be exempted from this requirements if they intend visiting New Zealand for short periods.
To obtain permission to settle in New Zealand, intending immigrants, other than Australian citizens, should first write to the nearest overseas representative of the New Zealand Government or write direct to the Secretary of Labour, Private Bag, Te Aro, Wellington, New Zealand for the necessary application forms. Each application is considered on its merits.
PASSPORTS—Authority for the issue of passports in New Zealand and by New Zealand representatives overseas is contained in the Passports Act 1946 and the Passport Regulations 1946.
New Zealand passports are issued and renewed within New Zealand by the Department of Internal Affairs at Wellington, Auckland, and Christchurch, at Rarotonga by the High Commissioner, at Niue by the New Zealand representative, and overseas by the representatives of New Zealand at Apia, Athens, Bangkok, Bonn, Brussels, Canberra, Djakarta, Geneva, The Hague, Hong Kong, Kuala Lumpur, Lima, London, Los Angeles, Melbourne, Moscow, New Delhi, New York, Noumea, Ottawa, Paris, Peking, Rome, Saigon, San Francisco, Santiago (Chile), Seoul, Singapore, Suva, Sydney, Tokyo, Vienna, and Washington. United Kingdom, Canadian, Australian, Malaysian, Singaporean, and Indian passports are issued and renewed in New Zealand by the respective High Commissioners for those countries.
Entry into New Zealand—Apart from British subjects and the wives of British subjects arriving from Australia, no person 16 years of age or over may land in New Zealand unless he is in possession of a valid passport or other recognised travel document. Exemption from the passport requirement (which is additional to the requirements of the Immigration Act and Undesirable Immigrants Exclusion Act) may be granted in exceptional circumstances by the Minister of Internal Affairs. A British subject who is a master or a member of the crew of the vessel in which he arrives does not need to produce a passport.
With the exception of nationals of those countries with which New Zealand has concluded agreements for the mutual abolition of visas, every alien landing in New Zealand requires a visa.
Departure from New Zealand—Every person leaving New Zealand, with the exception of a British subject travelling to Australia or making the round trip to New Zealand's island territories, should be in possession of a valid passport or other travel document.
NATIONALITY AND NATURALISATION—The basic nationality law is the British Nationality and New Zealand Citizenship Act 1948. Citizens of all Commonwealth countries are recognised as British subjects.
New Zealand citizenship may be acquired in the following ways: (a) by birth in New Zealand; (b) by descent; (c) by registration; and (d) by naturalisation. Citizens of other Commonwealth countries and the Republic of Ireland acquire New Zealand citizenship by registration, as do alien wives and children of New Zealand citizens. Other aliens acquire it by naturalisation. To be eligible for New Zealand citizenship, an alien or a citizen of another Commonwealth country (other than a woman married to a New Zealand citizen, or a minor) must—(a) have resided in New Zealand for the prescribed period; (b) be of full age and capacity; (c) be of good character; (d) have sufficient knowledge of the English language, and of the responsibilities and privileges of New Zealand citizenship; (e) intend to reside in New Zealand, or to enter or continue Crown service under the New Zealand Government. The residential qualification for naturalisation is 5 years, for registration it is generally 3 years but can be reduced to 1 year.
A person who acquires New Zealand citizenship by naturalisation must take the oath of allegiance, a person who acquires it by registration may be required to take the oath. Ceremonies are held at which applicants, in an atmosphere of dignity and solemnity, take the oath of allegiance and are presented with their certificates of naturalisation or registration as New Zealand citizens. During the 1972-73 year there were 118 such ceremonies, at which 1,327 candidates took the oath of allegiance.
New Zealand citizens may be deprived of New Zealand citizenship if they voluntarily acquire a foreign nationality by any formal act other than marriage, or if they voluntarily exercise the privileges or perform any of the duties of a foreign nationality possessed by them. Citizenship obtained by fraud, false representation, or the concealment of any material fact may be withdrawn.
The following table shows the number of persons, by country of birth, who were granted citizenship in the latest 2 years ended 31 March.
| Country of Birth | 1972-73 | 1973-74 | ||||
|---|---|---|---|---|---|---|
| Naturalisation | Registration | Total | Naturalisation | Registration | Total | |
| Australia | - | 52 | 52 | 3 | 22 | 25 |
| Austria | 10 | 6 | 16 | 4 | 10 | 14 |
| China | 88 | 109 | 197 | 44 | 60 | 104 |
| Denmark | 15 | 8 | 23 | 6 | 2 | 8 |
| Fiji | - | 130 | 130 | - | 107 | 107 |
| Germany | 24 | 21 | 45 | 9 | 24 | 33 |
| Greece | 40 | 50 | 90 | 28 | 25 | 53 |
| Hong Kong | 5 | 44 | 49 | - | 19 | 19 |
| Hungary | 22 | 15 | 37 | 22 | 9 | 31 |
| India | 1 | 144 | 145 | 3 | 125 | 128 |
| Indonesia | 12 | 12 | 24 | 10 | 10 | 20 |
| Ireland | - | 12 | 12 | - | 17 | 17 |
| Italy | 9 | 9 | 18 | 4 | - | 4 |
| Kenya | - | 11 | 11 | - | 9 | 9 |
| Malaysia | 1 | 20 | 21 | - | 36 | 36 |
| Netherlands | 211 | 180 | 391 | 116 | 86 | 202 |
| Poland | 27 | 24 | 51 | 17 | 13 | 30 |
| Romania | 17 | 11 | 28 | 14 | 8 | 22 |
| South Africa | 14 | 50 | 64 | 16 | 64 | 80 |
| Switzerland | 28 | 21 | 49 | 17 | 7 | 24 |
| Tonga | 3 | 40 | 43 | 2 | 17 | 19 |
| U.S.S.R. | 10 | 4 | 14 | 8 | 5 | 13 |
| United Kingdom | - | 702 | 702 | - | 891 | 891 |
| United States | 15 | 11 | 26 | 9 | 10 | 19 |
| Western Samoa | 3 | 162 | 165 | - | 126 | 126 |
| Yugoslavia | 65 | 46 | 111 | 56 | 36 | 92 |
| Other countries | 49 | 174 | 223 | 35 | 192 | 227 |
| Totals | 669 | 2,068 | 2,737 | 423 | 1,930 | 2,353 |
REGISTRATION OF ALIENS—The registration of aliens in New Zealand is provided for by the Aliens Act 1948, which is administered by the Department of Internal Affairs.
The number of aliens on the New Zealand register at any particular date does not constitute the total number in New Zealand, as certain classes are not required to register, including the following: (a) children under 16 years of age; (b) persons holding diplomatic status, consuls, or employees of embassies, legations, and consulates who are resident in New Zealand solely for the purpose of performing official duties; (c) certain temporary visitors to New Zealand. Under the British Nationality and New Zealand Citizenship Act 1948 a citizen of the Republic of Ireland, though not possessing the status of British subject (or, in alternative phraseology, Commonwealth citizen), is nevertheless not classed as an alien and is not required to register.
The following table shows, by country of nationality, the number of males and females on the register.
| Country of Nationality | 1 April 1973 | 1 April 1974 | ||||
|---|---|---|---|---|---|---|
| Males | Females | Total | Males | Females | Total | |
| Afghanistan | 13 | 1 | 14 | s | 1 | 9 |
| Albania | 11 | - | 11 | 9 | - | 9 |
| Austria | 347 | 129 | 476 | 352 | 130 | 482 |
| Belgium | 55 | 41 | 96 | 49 | 39 | 88 |
| Bulgaria | 56 | 5 | 61 | 55 | 6 | 61 |
| Burma | 30 | 2 | 32 | 25 | 2 | 27 |
| Chile | 15 | 12 | 27 | 19 | 19 | 38 |
| China | 931 | 741 | 1,672 | 905 | 678 | 1,583 |
| Czechoslovakia | 93 | 60 | 153 | 89 | 56 | 145 |
| Denmark | 491 | 286 | 777 | 497 | 285 | 782 |
| Finland | 79 | 73 | 152 | 80 | 75 | 155 |
| France | 111 | 140 | 251 | 121 | 159 | 280 |
| Germany | 541 | 450 | 991 | 578 | 458 | 1,036 |
| Greece | 624 | 660 | 1,284 | 585 | 615 | 1,200 |
| Hungary | 265 | 129 | 394 | 238 | 119 | 357 |
| Indonesia | 148 | 87 | 235 | 140 | 87 | 227 |
| Israel | 12 | 2 | 14 | 15 | 3 | 18 |
| Italy | 653 | 235 | 888 | 576 | 225 | 801 |
| Japan | 125 | 165 | 290 | 127 | 178 | 305 |
| Korea | 47 | 11 | 58 | 35 | 11 | 46 |
| Lebanon | 24 | 24 | 48 | 23 | 23 | 46 |
| Nepal | 14 | 7 | 21 | 9 | 7 | 16 |
| Netherlands | 7,403 | 5,583 | 12,986 | 7,354 | 5,550 | 12,904 |
| Norway | 102 | 56 | 158 | 101 | 56 | 157 |
| Philippines | 53 | 25 | 78 | 55 | 28 | 83 |
| Poland | 362 | 270 | 632 | 380 | 283 | 663 |
| Romania | 17 | 12 | 29 | 16 | 11 | 27 |
| South Africa | 112 | 148 | 260 | 143 | 155 | 298 |
| Spain | 43 | 12 | 55 | 40 | 13 | 53 |
| Sweden | 84 | 86 | 170 | 86 | 87 | 173 |
| Switzerland | 559 | 335 | 894 | 624 | 375 | 999 |
| Thailand | 86 | 145 | 231 | 67 | 142 | 209 |
| Turkey | 15 | 13 | 28 | 14 | 14 | 28 |
| United States | 2,324 | 1,429 | 3,753 | 2,518 | 1,682 | 4,200 |
| U.S.S.R. | 143 | 140 | 283 | 150 | 141 | 291 |
| Vietnam | 103 | 62 | 165 | 99 | 61 | 160 |
| Yugoslavia | 949 | 536 | 1,485 | 900 | 514 | 1,414 |
| Other countries | 76 | 54 | 130 | 69 | 44 | 113 |
| Stateless | 24 | 9 | 33 | 31 | 9 | 40 |
| Totals | 17,140 | 12,175 | 29,315 | 17,182 | 12,341 | 29,523 |
Gains in numbers on the register for any nationality occur for several reasons—mainly, (a) immigrants of 16 years of age and over who arrive during the year, (b) registration (on reaching the age of 16) of children whose parents may have arrived in previous years but are still registered aliens.
Reductions in the numbers of registered aliens in the main come from naturalisations, deaths, or departure overseas.
Five years residence in New Zealand is necessary before an alien can qualify for naturalisation.
STATISTICS OF THE POPULATION CENSUS—Publications containing results from the Census of Population and Dwellings are listed towards the back of this Yearbook.
MARITAL STATUS—The marital status of persons aged 16 years and over as returned at the Census of 1971 is summarised in the following tables.
| Age Groups (Years) | Never Married | Married | Legally Separated | Widowed | Divorced | Total* |
|---|---|---|---|---|---|---|
| *Including persons not specifying status. | ||||||
| Males | ||||||
| 16-19 | 101,809 | 2,328 | 22 | 6 | 6 | 104,726 |
| 20-24 | 74,545 | 43,077 | 753 | 38 | 137 | 119,447 |
| 25-34 | 30,723 | 142,445 | 2,815 | 221 | 1,338 | 178,803 |
| 35-44 | 14,560 | 139,242 | 2,578 | 820 | 2,151 | 160,248 |
| 45-54 | 12,088 | 128,967 | 2,508 | 2,506 | 3,145 | 150,020 |
| 55-64 | 9,004 | 101,668 | 1,700 | 5,123 | 2,796 | 120,861 |
| 65-74 | 5,284 | 55,338 | 879 | 7,833 | 1,453 | 71,162 |
| 75 and over | 2,359 | 19,043 | 343 | 10,251 | 416 | 32,687 |
| Totals, 1971 | 250,372 | 632,108 | 11,598 | 26,798 | 11,442 | 937,954 |
| Totals, 1966 | 244,834 | 581,560 | 6,819 | 27,372 | 9,435 | 871,854 |
| Females | ||||||
| 16-19 | 89,091 | 11,015 | 145 | 16 | 6 | 100,387 |
| 20-24 | 40,976 | 72,072 | 1,775 | 182 | 342 | 115,512 |
| 25-34 | 15,053 | 152,951 | 4,005 | 983 | 2,059 | 175,199 |
| 35-44 | 7,747 | 135,836 | 3,103x | 3,047x | 2,776 | 152,637 |
| 45-54 | 8,770 | 125,102 | 2,605 | 9,852 | 3,639 | 150,146 |
| 55-64 | 10,021 | 87,828 | 1,549 | 22,207 | 3,334 | 125,179 |
| 65-74 | 8,622 | 41,112 | 704 | 32,624 | 1,835 | 85,135 |
| 75 and over | 6,339 | 12,006 | 253 | 35,622 | 720 | 55,183 |
| Totals, 1971 | 186,619 | 637,922 | 14,139 | 104,533 | 14,711 | 959,378 |
| Totals, 1966 | 183,093 | 583,172 | 8,548 | 96,577 | 10,853 | 882,716 |
| Total | ||||||
| 16-19 | 190,900 | 13,343 | 167 | 22 | 12 | 205,113 |
| 20-24 | 115,521 | 115,149 | 2,528 | 220 | 479 | 234,959 |
| 25-34 | 45,776 | 295,396 | 6,820 | 1,204 | 3,397 | 354,002 |
| 35-44 | 22,307 | 275,078 | 5,681 | 3,867 | 4,927 | 312,885 |
| 45-54 | 20,858 | 254,069 | 5,113 | 12,358 | 6,784 | 300,166 |
| 55-64 | 19,025 | 189,496 | 3,249 | 27,330 | 6,130 | 246,040 |
| 65-74 | 13,906 | 96,450 | 1,583 | 40,457 | 3,288 | 156,297 |
| 75 and over | 8,698 | 31,049 | 596 | 45,873 | 1,136 | 87,870 |
| Totals, 1971 | 436,991 | 1,270,030 | 25,737 | 131,331 | 26,153 | 1,897,332 |
| Totals, 1966 | 427,927 | 1,164,732 | 15,367 | 123,949 | 20,288 | 1,754,570 |
The percentage distribution of the population aged 16 years or over according to marital status is given in the following summary.
| Marital Status | 1961 | 1966 | 1971 | |||
|---|---|---|---|---|---|---|
| Males | Females | Males | Females | Males | Females | |
| Never married | 27.2 | 20.1 | 28.1 | 20.8x | 26.9 | 19.5 |
| Married | 67.5 | 66.7 | 66.8 | 66.1 | 67.8 | 66.6 |
| Legally separated | 0.7 | 0.9 | 0.8 | 1.0 | 1.2 | 1.5 |
| Widowed | 3.5 | 11.1 | 3.2 | 10.9x | 2.9 | 10.9 |
| Divorced | 1.1 | 1.2 | 1.1 | 1.2 | 1.2 | 1.5 |
| Totals | 100.0 | 100.0 | 100.0 | 100.0 | 100.0 | 100.0 |
HOUSEHOLDS—There were 801,686 households in permanent private dwellings at the Census in 1971. The following table analyses the type of household by the number of occupants. A one-family-only household consists of a husband and wife with or without unmarried children of any age.
| Type of Household | Total Households | Number of Households with Occupancy of | ||||||
|---|---|---|---|---|---|---|---|---|
| 1 | 2 | 3 | 4 | 5 | 6 | 7 or more | ||
| *While not strictly an “extended family”, other groupings are included, mainly consisting of such relationships as a mother and widowed daughter. | ||||||||
| One-family-only— | ||||||||
| Complete | 485,789 | - | 153,592 | 86,379 | 107,011 | 74,244 | 38,072 | 26,491 |
| Incomplete with children absent | 25,400 | - | 5,739 | 6,550 | 5,591 | 3,521 | 1,915 | 2,084 |
| Incomplete with one parent absent | 42,504 | - | 20,307 | 10,852 | 6,131 | 2,898 | 1,304 | 1,012 |
| Incomplete with one parent and child(ren) absent | 3,540 | - | 1,460 | 930 | 552 | 283 | 137 | 178 |
| Totals | 557,233 | - | 181,098 | 104,711 | 119,285 | 80,946 | 41,428 | 29,765 |
| Multi-person— | ||||||||
| One family plus other persons (non-family) | 76,449 | - | 826* | 19,745 | 16,947 | 15,700 | 10,715 | 12,516 |
| Multi-family with or without other persons | 12,040 | - | - | - | 2,259 | 2,603 | 2,334 | 4,844 |
| Totals | 88,489 | - | 826 | 19,745 | 19,206 | 18,303 | 13,049 | 17,360 |
| Non-family | 42,675 | - | 29,630 | 7,812 | 3,465 | 1,205 | 375 | 188 |
| One person | 113,289 | 113,289 | - | - | - | - | - | - |
| Totals | 801,686 | 113,289 | 211,554 | 132,268 | 141,956 | 100,454 | 54,852 | 47,313 |
In the following table these complete one-family-only households are analysed by distribution of the occupants and the occupational status of the head of the household.
| Occupational Status of Head | Total Households | Husband and Wife Only | Husband and Wife with | ||||
|---|---|---|---|---|---|---|---|
| 1 Child | 2 Children | 3 Children | 4 Children | 5 or More Children | |||
| Actively engaged— | |||||||
| Employer | 38,012 | 7,490 | 6,424 | 9,570 | 7,748 | 4,226 | 2,554 |
| Own account | 41,354 | 8,941 | 6,877 | 10,134 | 8,079 | 4,523 | 2,800 |
| Salary or wages | 345,959 | 88,202 | 65,861 | 85,019 | 57,472 | 28,835 | 20,570 |
| Unemployed | 1,643 | 508 | 311 | 301 | 203 | 131 | 189 |
| Relative assisting | 20 | 14 | 1 | - | 3 | 1 | 1 |
| Not specified | 345 | 97 | 52 | 76 | 52 | 25 | 43 |
| Totals | 427,333 | 105,252 | 79,526 | 105,100 | 73,557 | 37,741 | 26,157 |
| Not actively engaged— | |||||||
| Retired | 55,578 | 46,804 | 6,331 | 1,573 | 493 | 196 | 181 |
| Student | 985 | 675 | 177 | 75 | 33 | 19 | 6 |
| Housewife | 138 | 92 | 23 | 11 | 4 | 3 | 5 |
| Other | 1,755 | 769 | 322 | 252 | 157 | 113 | 142 |
| Totals | 58,456 | 48,340 | 6,853 | 1,911 | 687 | 331 | 334 |
| Grand total | 485,789 | 153,592 | 86,379 | 107,011 | 74,244 | 38,072 | 26,491 |
The following table shows the composition of one-complete-family-only households in 1971 by the age group of the head of the household.
| Age group of Head (in Years) | Husband and Wife Only | Husband and wife with | Total | ||||
|---|---|---|---|---|---|---|---|
| 1 Child* | 2 Children* | 3 Children* | 4 Children* | 5 or More Children* | |||
| *Unmarried children of any age living at home. | |||||||
| Numbers | |||||||
| Under 20 | 576 | 742 | 84 | 14 | 5 | 6 | 1,427 |
| 20-24 | 15,930 | 10,860 | 5,731 | 1,083 | 202 | 56 | 33,862 |
| 25-44 | 24,138 | 30,537 | 68,554 | 54,612 | 28,374 | 18,858 | 225,073 |
| 45-64 | 63,920 | 37,655 | 31,139 | 18,119 | 9,321 | 7,450 | 167,604 |
| 65 and over | 49,028 | 6,585 | 1,503 | 416 | 170 | 121 | 57,823 |
| Totals | 153,592 | 86,379 | 107,011 | 74,244 | 38,072 | 26,491 | 485,789 |
| Percentages | |||||||
| Under 20 | 40.4 | 52.0 | 5.9 | 1.0 | 0.4 | 0.4 | 100.0 |
| 20-24 | 47.0 | 32.1 | 16.9 | 3.2 | 0.6 | 0.2 | 100.0 |
| 25-44 | 10.7 | 13.6 | 30.5 | 24.3 | 12.6 | 8.4 | 100.0 |
| 45-64 | 38.1 | 22.5 | 18.6 | 10.8 | 5.6 | 4.4 | 100.0 |
| 65 and over | 84.8 | 11.4 | 2.6 | 0.7 | 0.3 | 0.2 | 100.0 |
| All ages | 31.6 | 17.8 | 22.0 | 15.3 | 7.8 | 5.5 | 100.0 |
The following tables show, for one-complete-family-only households, the number of unmarried children of any age living with their parents on Census night 1971. The income given in the first table is the income of the head of the household, while in the second table the total household income is shown. In a considerable proportion of households, the total household income was substantially above the income of the head of the household, usually indicating at least one other income recipient in the family.
| Income of Head | Husband and Wife Only | Husband and Wife with | ||||
|---|---|---|---|---|---|---|
| One Child | Two Children | Three Children | Four Children | Five or More Childrens | ||
| $ | ||||||
| Nil | 18,258 | 2,596 | 900 | 368 | 233 | 291 |
| 1- 599 | 10,964 | 1,680 | 675 | 345 | 187 | 190 |
| 600-1,399 | 9,855 | 2,572 | 1,612 | 943 | 579 | 529 |
| 1,400-2,199 | 15,413 | 7,268 | 6,197 | 4,120 | 2,202 | 2,120 |
| 2,200-2,999 | 33,343 | 21,722 | 22,338 | 14,743 | 8,036 | 6,703 |
| 3,000-4,999 | 48,125 | 37,313 | 53,938 | 36,605 | 18,059 | 11,730 |
| 5,000-7,999 | 11,554 | 9,256 | 15,429 | 12,007 | 5,925 | 3,235 |
| 8,000-9,999 | 2,038 | 1,500 | 2,415 | 2,054 | 1,118 | 580 |
| 10,000 and over | 2,251 | 1,697 | 2,693 | 2,468 | 1,374 | 735 |
| Not specified | 1,791 | 775 | 814 | 591 | 359 | 378 |
| Totals | 153,592 | 86,379 | 107,011 | 74,244 | 38,072 | 26,491 |
| Total Income of Household | Husband and Wife Only | Husband and Wife with | ||||
|---|---|---|---|---|---|---|
| One Child | Two Children | Three Children | Four Children | Five or More Children | ||
| $ | ||||||
| Nil | 16,090 | 637 | 261 | 132 | 99 | 147 |
| 1- 599 | 9,913 | 623 | 344 | 212 | 132 | 136 |
| 600-1,399 | 8,169 | 1,359 | 899 | 521 | 322 | 322 |
| 1,400-2,199 | 11,353 | 4,410 | 3,690 | 2,450 | 1,360 | 1,311 |
| 2,200-2,999 | 19,383 | 13,440 | 14,054 | 9,270 | 4,998 | 3,892 |
| 3,000-4,999 | 43,027 | 33,182 | 45,957 | 30,979 | 14,966 | 9,653 |
| 5,000-7,999 | 34,098 | 22,471 | 27,536 | 19,458 | 9,961 | 6,357 |
| 8,000-9,999 | 4,937 | 4,719 | 6,537 | 4,946 | 2,611 | 1,685 |
| 10,000 and over | 3,867 | 3,860 | 5,809 | 4,871 | 2,739 | 1,924 |
| Not specified | 2,755 | 1,678 | 1,924 | 1,405 | 884 | 1,064 |
| Totals | 153,592 | 86,379 | 107,011 | 74,244 | 38,072 | 26,491 |
The following table shows persons living alone in 1971 by age and marital status.
| Age Group (in Years) | Marital Status | |||||
|---|---|---|---|---|---|---|
| Never Married | Married | Legally Separated | Divorced | Widowed | Total* | |
| Males | ||||||
| Under 20 | 658 | 29 | 2 | - | - | 689 |
| 20-24 | 2,420 | 457 | 95 | 16 | 7 | 2,995 |
| 25-44 | 6,234 | 1,901 | 1,062 | 721 | 152 | 10,070 |
| 45-64 | 6,504 | 2,556 | 1,275 | 1,956 | 2,763 | 15,054 |
| 65 and over | 2,601 | 1,715 | 376 | 752 | 7,263 | 12,707 |
| Totals | 18,417 | 6,658 | 2,810 | 3,445 | 10,185 | 41,828 |
| Age Group (in Years) | Marital Status | |||||
|---|---|---|---|---|---|---|
| Never Married | Married | Legally Separated | Divorced | Widowed | Total* | |
| *Total includes 313 male heads and 153 females, whose age and marital status were not available. | ||||||
| Females | ||||||
| Under 20 | 409 | 24 | 8 | 1 | - | 442 |
| 20-24 | 1,078 | 364 | 80 | 17 | 10 | 1,549 |
| 25-44 | 3,020 | 581 | 413 | 483 | 249 | 4,746 |
| 45-64 | 6,188 | 2,156 | 989 | 2,366 | 11,956 | 23,655 |
| 65 and over | 5,758 | 2,201 | 447 | 1,279 | 31,231 | 40,916 |
| Totals | 16,453 | 5,326 | 1,937 | 4,146 | 43,446 | 71,461* |
RELIGIOUS PROFESSIONS—The following summary presents the main religious professions returned at the 1961, 1966 and 1971 Censuses.
| Religious Profession | Number of Adherents | Percentage | ||||
|---|---|---|---|---|---|---|
| 1961 | 1966 | 1971 | 1961 | 1966 | 1971 | |
| Anglican (Church of England) | 835,434 | 901,701 | 895,839 | 34.6 | 33.7 | 31.3 |
| Presbyterian | 539,459, | 582,976 | 583,701 | 22.3 | 21.8 | 20.4 |
| Roman Catholic (including Catholic undefined) | 364,098 | 425,280 | 449,974 | 15.1 | 15.9 | 15.7 |
| Methodist | 173,838 | 186,260 | 182,727 | 7.2 | 7.0 | 6.4 |
| Baptist | 40,886 | 46,748 | 47,350 | 1.7 | 1.7 | 1.7 |
| Protestant (undefined) | 45,100 | 46,090 | 37,475 | 1.9 | 1.7 | 1.3 |
| Christian (undefined) | 12,130 | 21,548 | 33,187 | 0.5 | 0.8 | 1.2 |
| Ratana | 23,126 | 27,570 | 30,156 | 1.0 | 1.0 | 1.1 |
| Latter Day Saints | 17,978 | 25,564 | 29,785 | 0.8 | 1.0x | 1.0 |
| Brethren | 25,764 | 23,139 | 25,768 | 1.1 | 0.9 | 0.9 |
| Salvation Army | 15,454 | 17,737 | 19,371 | 0.6 | 0.7 | 0.7 |
| Seventh Day Adventist | 8,220 | 9,551 | 10,477 | 0.3 | 0.4x | 0.4 |
| Jehovah's Witness | 5,944 | 7,455 | 10,318 | 0.2 | 0.3 | 0.4 |
| Agnostic | 2,288 | 4,960 | 9,481 | 0.1 | 0.2 | 0.3 |
| Atheist | 3,359 | 5,474 | 9,291 | 0.1 | 0.2 | 0.3 |
| Church of Christ | 10,485 | 10,301 | 8,930 | 0.4 | 0.4 | 0.3 |
| Congregational | 9,377 | 12,101 | 7,704 | 0.4 | 0.4 | 0.3 |
| Lutheran | 4,817 | 5,730 | 5,930 | 0.2 | 0.2 | 0.2 |
| Ringatu | 5,377 | 5,605 | 5,635 | 0.2 | 0.2 | 0.2 |
| Eastern Orthodox | 3,328 | 3,605 | 4,319 | 0.1 | 0.1 | 0.2x |
| Hindu | 2,074 | 3,599 | 3,845 | 0.1 | 0.1 | 0.1 |
| Hebrew | 4,006 | 4,104 | 3,803 | 0.2 | 0.2 | 0.1 |
| Undenominational | 1,514 | 3,069 | 3,709 | 0.1 | 0.1 | 0.1 |
| Assemblies of God | 1,060 | 2,028 | 3,599 | 0.1 | 0.1 | |
| Apostolic Church | 1,399 | 1,841 | 2,361 | 0.1 | 0.1 | 0.1 |
| Undenominational Christian | 2,170 | 1,968 | 1,903 | 0.1 | 0.1 | 0.1 |
| Christadelphian | 1,498 | 1,628 | 1,667 | 0.1 | 0.1 | 0.1x |
| Christian Scientist | 3,719 | 1,161 | 816 | 0.2 | –– | –– |
| Rationalist | 956 | 1,696 | 779 | –– | 0.1 | ––x |
| All other religious professions | 14,386 | 23,499 | 24,694 | 0.6 | 0.9 | 0.9x |
| No religion (so returned) | 17,486 | 32,780 | 57,485 | 0.7 | 1.2 | 2.0 |
| Object to state | 204,056 | 210,851 | 247,019 | 8.4 | 7.9 | 8.6 |
| Not specified | 14,198 | 19,300 | 103,533 | 0.6 | 0.7 | 3.6 |
| Totals | 2,414,984 | 2,676,919 | 2,862,631 | 100.0 | 100.0 | 100.0 |
The category recorded as “Object to state” represents those persons availing themselves of the special statutory right of objecting to answer a question on this subject. It is probable that the “Not specified” group includes a number of persons objecting to the question.
AGE DISTRIBUTION—Census age-group figures are shown in the following table. Estimates of age distribution for later years are published in the Monthly Abstract of Statistics.
| Age (Years) | 1965 Census | 1971 Census | Percentage of Total Population | |||||
|---|---|---|---|---|---|---|---|---|
| Males | Females | Total | Males | Females | Total | 1966 | 1971 | |
| *Under 20 years. | ||||||||
| 0- 4 | 156,954 | 149,689 | 306,643 | 151,916 | 145,946 | 297,862 | 11.5 | 10.4 |
| 5- 9 | 152,816 | 146,441 | 299,257 | 158,310 | 151,494x | 309,804 | 11.2 | 10.8 |
| 10-14 | 136,498 | 130,001 | 266,499 | 154,286 | 147,671 | 301,957 | 10.0 | 10.5 |
| 15 | 25,621 | 24,329 | 49,950 | 28,390 | 27,286 | 55,676 | 1.9 | 1.9 |
| 16-19 | 99,705 | 95,712 | 195,417 | 104,726 | 100,387 | 205,113 | 7.3 | 7.2 |
| 20-24 | 97,394 | 93,258 | 190,652 | 119,447 | 115,512 | 234,959 | 7.1 | 8.2 |
| 25-29 | 84,927 | 82,319 | 167,246 | 94,622 | 92,690 | 187,312 | 6.2 | 6.5 |
| 30-34 | 76,529 | 72,867 | 149,396 | 84,181 | 82,509 | 166,690 | 5.6 | 5.8 |
| 35-39 | 84,911 | 78,978 | 163,889 | 76,997 | 74,192 | 151,189 | 6.1 | 5.3 |
| 40-44 | 81,385 | 78,795 | 160,180 | 83,251 | 78,445 | 161,696 | 6.0 | 5.6 |
| 45-49 | 72,272 | 73,516 | 145,788 | 80,879 | 78,488 | 159,367 | 5.4 | 5.6 |
| 50-54 | 68,778 | 69,226 | 138,004 | 69,141 | 71,658 | 140,799 | 5.2x | 4.9 |
| 55-59 | 61,438 | 60,316 | 121,754 | 65,264 | 66,919 | 132,183 | 4.5 | 4.6 |
| 60-64 | 49,158 | 49,993 | 99,151 | 55,597 | 58,260 | 113,857 | 3.7 | 4.0 |
| 65-69 | 36,468 | 42,961 | 79,429 | 42,700 | 47,914 | 90,614 | 3.0 | 3.2 |
| 70-74 | 24,497 | 34,050 | 58,547 | 28,462 | 37,221 | 65,683 | 2.2 | 2.3 |
| 75-79 | 18,045 | 25,503 | 43,548 | 16,754 | 26,612 | 43,366 | 1.6 | 1.5 |
| 80-84 | 10,616 | 15,730 | 26,346 | 9,923 | 17,301 | 27,224 | 1.0 | 1.0 |
| 85-89 | 4,561 | 7,260 | 11,821 | 4,542 | 8,204 | 12,746 | 0.4 | 0.4 |
| 90 and over | 1,170 | 2,232 | 3.402 | 1,468 | 3,066 | 4,534 | 0.1 | 0.2 |
| Totals | 1,343,743 | 1,333,176 | 2,676,919 | 1,430,856 | 1,431,775 | 2,862,631 | 100.0 | 100.0 |
| Under 15 years | 446,268 | 426,131 | 872,399 | 464,512 | 445,111 | 909,623 | 32.6x | 31.8 |
| 15-64 years | 802,118 | 779,309 | 1,581,427 | S62,495 | 846,346 | 1,708,841 | 59.1x | 59.7 |
| 65 years and over | 95,357 | 127,736 | 223,093 | 103,849 | 140,318 | 244,167 | 8.3 | 8.5 |
| Minors* | 571,594 | 546,172 | 1,117,766 | 597,628 | 572,784 | 1,170,412 | 41.8x | 40.9 |
| Adults | 772,149 | 787,004 | 1,559,153 | 833,228 | 858,991 | 1,692,219 | 58.2x | 59.1 |
ETHNIC GROUPS—The following table gives the broad ethnic origins of the population.
| Ethnic Group | Census | ||
|---|---|---|---|
| 1961 | 1966 | 1971 | |
| European | 2,216,886 | 2,426,352 | 2,561,280 |
| Maori | 167,086 | 201,159 | 227,414 |
| Other Origins— | |||
| Pacific Islanders— | |||
| Cook Island Maori | 4,499 | 8,663 | 13,772 |
| Samoan | 6,481 | 11,842 | 22,198 |
| Niuean & Tokelauan | 1,728 | 2,846 | 5,459 |
| Tongan | 1,043 | 1,389 | 2,075x |
| Other | 589 | 1,531 | 1,909x |
| Sub-totals, Pacific Islanders | 14,340 | 26,271 | 45,413 |
| Chinese | 8,524x | 10,283x | 12,818 |
| Indian | 4,179x | 6,843x | 7,807 |
| Fijian | 746 | 1,323 | 2,021 |
| Syrian, Lebanese, and Arab | 1,101x | 1,099x | 1,126 |
| Other ethnic groups | 2,122x | 3,589x | 4,752 |
| Sub-totals, others | 16,672 | 23,137 | 28,524 |
| Totals | 2,414,984 | 2,676,919 | 2,862,631 |
COUNTRY OF BIRTH—From 1945 to 1961 the New Zealand-born population remained at about 86 percent of the total population; since 1966 the proportion has dropped slightly, mainly because increased numbers of New Zealanders have been overseas at census date and increased numbers of overseas tourists have been in New Zealand.
The following table classifies persons by country of birth.
| Country of Birth | Census | ||
|---|---|---|---|
| 1961 | 1966 | 1971 | |
| New Zealand (excluding Cook Islands and Niue) | 2,074,509 | 2,279,994 | 2,444,169 |
| United Kingdom | 218,649 | 244,601 | 247,952 |
| Australia | 35,412 | 43,374 | 44,084 |
| Netherlands | 17,844 | 20,461 | 20,471 |
| Ireland (excluding Northern Ireland) | 8,810 | 8,448 | 7,456x |
| Pacific Islands— | |||
| Cook Islands and Niue | 4,788 | 7,852 | 10,301 |
| Fiji | 3,038 | 5,384 | 5,274 |
| Tonga | 777 | 1,005 | 1,273 |
| Tokelau Islands | .. | .. | 950 |
| Western Samoa | 4,450 | 7,447 | 12,354 |
| India | 4,753 | 5,368 | 5,662 |
| China (inch Taiwan) | 4,194 | 4,218 | 4,252 |
| Canada | 2,863 | 4,117 | 4,933 |
| United States | 2,797 | 4,306 | 6,133x |
| Yugoslavia | 3,534 | 3,874 | 3,779 |
| Other countries and born at sea | 28,566 | 36,470 | 43,588x |
| Totals | 2,414,984 | 2,676,919 | 2,862,631 |
The next table shows the duration of residence in New Zealand of persons born overseas.
| Years of Residence | 1961 Census | 1966 Census | 1971 Census | |||
|---|---|---|---|---|---|---|
| Number | Percentages Specified Cases | Number | Percentages Specified Cases | Number | Percentages Specified Cases | |
| 0-4 | 72,685 | 21.7 | 103,064 | 26.5 | 90,360 | 22.3 |
| 5-9 | 64,468 | 19.3 | 56,877 | 14.6 | 67,304 | 16.6 |
| 10-14 | 42,313 | 12.6x | 61,351 | 15.7 | 52,981 | 13.1 |
| 15-19 | 8,147 | 2.4 | 38,957 | 10.0 | 55,387 | 13.7 |
| 20-24 | 10,362 | 3.1 | 8,212 | 2.1 | 36,332 | 9.0 |
| 25-29 | 4,361 | 1.3 | 9,380 | 2.4 | 7,163 | 1.8 |
| 30-39 | 51,208 | 15.3 | 19,923 | 5.1 | 12,512 | 3.1 |
| 40-49 | 39,804 | 11.9 | 47,111 | 12.1 | 39,097 | 9.6 |
| 50 and over | 41,155 | 12.3 | 44,671 | 11.5 | 44,407 | 11.0 |
| Not specified | 5,972 | .. | 7,379 | .. | 12,919 | .. |
| Totals | 340,475 | 100.0 | 396,925 | 100.0 | 418,462 | 100.0 |
STATISTICS OF WORLD POPULATION—The area and estimated population of the major areas and selected countries at 1 July 1972 are shown in the following table. (Source: United Nations Demographic Yearbook 1972.)
| Major Areas and Countries | Area | Population |
|---|---|---|
| sq km (000) | million | |
| Major Areas | ||
| Africa | 30,320 | 364.0 |
| America—North | 21,515 | 233.0 |
| America—Latin | 20,567 | 300.0 |
| Asia | 27,655 | 2,154.0 |
| Europe | 4,936 | 469.0 |
| Oceania | 8,510 | 20.2 |
| U.S.S.R. | 22,402 | 248.0 |
| World Total | 135,906 | 3,782.0 |
| Selected Countries | ||
| Africa | ||
| Algeria | 2,382 | 15.3 |
| Angola | 1,247 | 5.8 |
| Egypt | 1,001 | 34.8 |
| Ethiopia | 1,222 | 25.9 |
| Ghana | 239 | 9.1 |
| Kenya | 583 | 12.1 |
| Morocco | 447 | 15.8 |
| Mozambique | 783 | 8.5 |
| Nigeria | 924 | 58.0 |
| Rhodesia | 391 | 5.7 |
| South Africa | 1,221 | 23.0 |
| Sudan | 2,506 | 16.5 |
| Tanzania, United Republic of | 945 | 14.0 |
| Uganda | 236 | 10.5 |
| Zaire Republic | 2,345 | 22.9 |
| America—North— | ||
| Canada | 9,976 | 21.8 |
| United States | 9,363 | 208.8 |
| America—Latin— | ||
| Argentine | 2,777 | 23.9 |
| Brazil | 8,512 | 98.9 |
| Chile | 757 | 9.0 |
| Colombia | 1,139 | 22.5 |
| Mexico | 1,973 | 52.6 |
| Peru | 1,285 | 14.5 |
| Venezuela | 912 | 11.0 |
| Asia— | ||
| Afghanistan | 647 | 17.9 |
| China | 9,597 | 800.7 |
| Hong Kong | 1 | 4.1 |
| India | 3,280 | 563.5 |
| Indonesia | 1,492 | 120.4 |
| Iran | 1,648 | 30.6 |
| Iraq | 435 | 10.1 |
| Israel | 21 | 3.1 |
| Japan | 370 | 106.0 |
| Jordan | 98 | 2.5 |
| Khmer Republic | 181 | 6.7 |
| Korea—North | 121 | 14.7 |
| Korea—South | 98 | 32.5 |
| Lebanon | 10 | 3.0 |
| Malaysia | 330 | 11.0 |
| Nepal | 141 | 11.5 |
| Pakistan | 804 | 56.1 |
| Philippines | 300 | 39.0 |
| Saudi Arabia | 2,150 | 8.2 |
| Singapore | 0.6 | 2.1 |
| Sri Lanka | 66 | 13.0 |
| Syria | 185 | 6.7 |
| Thailand | 514 | 36.3 |
| Turkey | 781 | 37.0 |
| Europe | ||
| Austria | 84 | 7.5 |
| Belgium | 31 | 9.7 |
| Bulgaria | 111 | 8.6 |
| Czechoslovakia | 128 | 14.5 |
| Denmark | 43 | 5.0 |
| France | 547 | 51.7 |
| Germany—East | 108 | 17.0 |
| Germany—West | 249 | 61.7 |
| Greece | 132 | 8.8 |
| Hungary | 93 | 10.4 |
| Ireland, Republic of | 70 | 3.0 |
| Italy | 301 | 54.3 |
| Luxembourg | 3 | 0.3 |
| Netherlands | 41 | 13.3 |
| Norway | 324 | 3.9 |
| Poland | 313 | 33.1 |
| Portugal | 92 | 8.8 |
| Romania | 238 | 20.8 |
| Spain | 505 | 34.5 |
| Sweden | 450 | 8.1 |
| Switzerland | 41 | 6.4 |
| United Kingdom | 244 | 55.8 |
| Yugoslavia, Republic of | 256 | 20.8 |
| Oceania— | ||
| Australia | 7,687 | 13.0 |
| Fiji | 18 | 0.5 |
| New Caledonia | 19 | 0.1 |
| New Zealand | 269 | 2.9 |
| Papua-New Guinea | 462 | 2.6 |
Table of Contents
The rate of natural increase (excess of births over deaths) is important to national planning; along with net migration it is the major component of population growth. In recent years the rate of natural increase in New Zealand has been higher than for most other countries of predominantly European stock. The following table shows the numbers and rates of natural increase for the last 11 years, and emphasises the high rate for the Maori component of the population.
| Year | Total Population | Maoris | Natural Increase Rates per 1,000 Mean Population | |||||
|---|---|---|---|---|---|---|---|---|
| Births | Deaths | Natural Increase | Births | Deaths | Natural Increase | Total | Maori | |
| 1964 | 62,302 | 22,861 | 39,441 | 7,881 | 1,168 | 6,713 | 15.23 | 35.46 |
| 1965 | 60,047 | 22,976 | 37,071 | 7,776 | 1,217 | 6,559 | 14.07 | 33.43 |
| 1966 | 60,003 | 23,778 | 36,225 | 7,743 | 1,291 | 6,452 | 13.51 | 31.87 |
| 1967 | 61,022 | 23,007 | 38,015 | 7,996 | 1,222 | 6,774 | 13.94 | 32.59 |
| 1968 | 62,112 | 24,464 | 37,648 | 8,089 | 1,324 | 6,765 | 13.68 | 31.75 |
| 1969 | 62,360 | 24,161 | 38,199 | 8,161 | 1,330 | 6,831 | 13.74 | 31.31 |
| 1970 | 62,050 | 24,840 | 37,210 | 8,193 | 1,399 | 6,794 | 13.20 | 30.42 |
| 1971 | 64,460 | 24,309 | 40,151 | 8,364 | 1,421 | 6,943 | 14.01 | 30.31 |
| 1972 | 63,215 | 24,801 | 38,414 | 7,870 | 1,347 | 6,523 | 13.17 | 27.65 |
| 1973 | 60,727 | 25,312 | 35,415 | 7,384 | 1,380 | 6,004 | 11.89 | 24.81 |
| 1974 | 59,336 | 25,262 | 34,075 | 11.19 | ||||
In the 10 years to 31 December 1974 New Zealand gained by natural increase of population a total of 372,423.
COMPARISON WITH OTHER COUNTRIES—An international comparison of birth and natural increase rates for certain countries is made in the following table. The rates, which are for 1973 are taken from the United Nations Monthly Bulletin of Statistics.
| Country | Rate per 1,000 of Population | ||
|---|---|---|---|
| Births | Deaths | Natural Increase | |
| *Rates for 1972. | |||
| Mexico | 44.7 | 9.1 | 35.6* |
| Israel | 27.8 | 7.2 | 20.6* |
| Singapore | 22.1 | 5.5 | 16.6 |
| New Zealand | 20.4 | 8.5 | 11.9 |
| Japan | 19.4 | 6.6 | 12.8 |
| Hong Kong | 19.3 | 5.1 | 14.2 |
| Spain | 19.2 | 8.5 | 10.7 |
| Australia | 18.9 | 8.5 | 10.4 |
| France | 16.4 | 10.7 | 5.7 |
| Italy | 16.0 | 9.9 | 6.1 |
| Canada | 15.7 | 7.4 | 8.3 |
| Norway | 15.5 | 10.1 | 5.4 |
| United States | 15.0 | 9.4 | 5.6 |
| Netherlands | 14.5 | 8.2 | 6.3 |
| United Kingdom | 13.9 | 12.0 | 1.9 |
| Switzerland | 13.6 | 8.8 | 4.8 |
| Sweden | 13.5 | 10.5 | 3.0 |
| Belgium | 13.3 | 12.1 | 1.2 |
| Austria | 12.9 | 12.3 | 0.6 |
| West Germany | 10.2 | 11.8 | -1.6 |
REGISTRATION—The law as to registration of births is contained in the Births and Deaths Registration Act 1951. A birth is normally registered at the office of the Registrar nearest the place of birth.
Births statistics are compiled by the Department of Statistics from the records of the Registrar-General. The births covered by a year's statistics are those registered during the year. The figures do not include still births, except where multiple births are discussed. A special classification of still births is given later in this subsection.
Under section 14 of the Births and Deaths Registration Act 1951, provision is made for births not registered in the ordinary way to be recorded at a later date in a special register kept by the Registrar-General. Such cases include elderly people requiring evidence of age for social security purposes. Until 1971 these late registrations were included in published live-birth statistics but they are now excluded. The numbers were normally relatively small; in 1971 they totalled 244 and in 1972, 257. In 1973 they totalled 234.
NUMBERS AND RATES—The following table shows the numbers of births and the rates for the last 11 years.
| Year | Numbers | Rates per 1,000 of Mean Population | ||
|---|---|---|---|---|
| Total | Maori | Total | Maori | |
| 1964 | 62,302 | 7,881 | 24.06 | 41.63 |
| 1965 | 60,047 | 7,776 | 22.79 | 39.63 |
| 1966 | 60,003 | 7,743 | 22.37 | 38.25 |
| 1967 | 61,022 | 7,996 | 22.37 | 38.47 |
| 1968 | 62,112 | 8,089 | 22.56 | 37.96 |
| 1969 | 62,360 | 8,161 | 22.43 | 37.41 |
| 1970 | 62,050 | 8,193 | 22.01 | 36.68 |
| 1971 | 64,460 | 8,364 | 22.50 | 36.51 |
| 1972 | 63,215 | 7,870 | 21.67 | 33.36 |
| 1973 | 60,727 | 7,384 | 20.39 | 30.51 |
| 1974 | 59,336 | 6,931 | 19.49 | |
REFINED BIRTH RATE—"Crude" rates of the number of births per 1,000 of the mean population, irrespective of sex or age, do not take account of variations in the proportion of women of the child-bearing ages. Refined rates are provided by computations of the legitimate birth rate per 1,000 married women of 16-44 years of age, or the total births per 1,000 of all women aged 115-44 years. The following table gives both rates for census years (on the basis of the births registered in that year and the population as at the census) together with the “crude” rate for the year.
| Census Year | Birth Rate per 1,000 Women | ||
|---|---|---|---|
| Married Women 16-44 Years | Total Women 15-44 Years | "Crude" Birth Rate per 1.000 Mean Population | |
| 1926 | 176.9 | 92.1 | 21.23 |
| 1936 | 155.1 | 79.0 | 18.07 |
| 1945 | 186.5 | 106.5 | 24.58 |
| 1951 | 190.8 | 123.0 | 25.62 |
| 1956 | 191.7 | 128.1 | 25.93 |
| 1961 | 199.3 | 140.6 | 26.99 |
| 1966 | 155.2 | 114.4 | 22.44 |
| 1971 | 173.3 | 112.9 | 22.50 |
The percentage of married women in the child-bearing ages was 68.2 in 1966 compared with 51.6 in 1926. A study of the figures for successive censuses reveals considerable changes in the age constitution of married women within the child-bearing ages; as the birth rate varies with age, the change in age constitution over the period is a factor which should be taken into account.
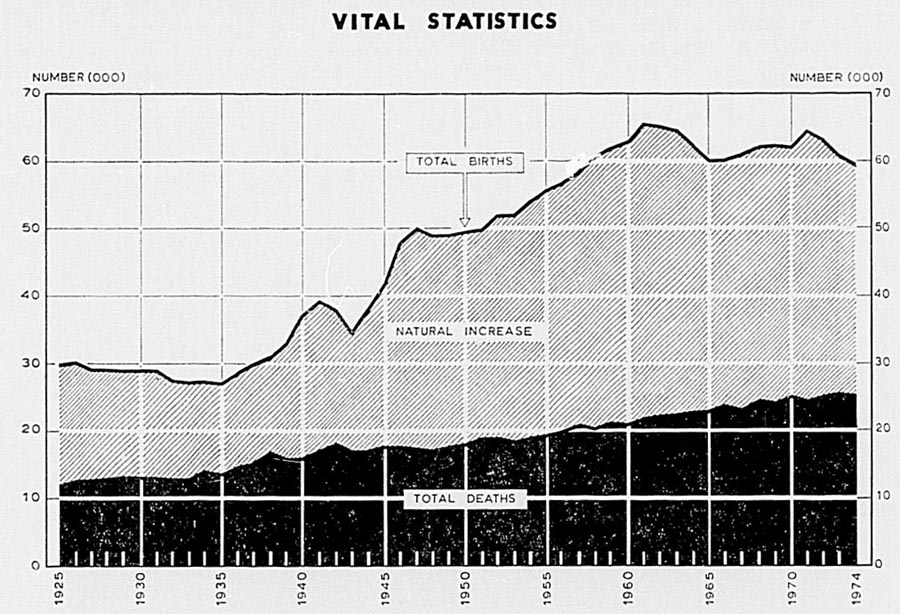
The following diagram shows birth and death rates and indicates the relatively high rate of natural increase in New Zealand.
The period since the Second World War was marked by a high birth rate until 1961, when the level dropped; this experience was also shared by Australia, Canada, and the United States. In recent years the decline has continued at a slower rate and it appears probable that a state of relative stability is being reached.
| Country | Birth Rate per 1,000 Mean Population | |||||||
|---|---|---|---|---|---|---|---|---|
| 1966 | 1967 | 1968 | 1969 | 1970 | 1971 | 1972 | 1973 | |
| (Source: United Nations Monthly Bulletin of Statistics and Statistical Yearbook.) | ||||||||
| New Zealand | 22.4 | 22.4 | 22.6 | 22.4 | 22.0 | 22.5 | 21.7 | 20.4 |
| Australia | 19.3 | 19.4 | 20.1 | 20.4 | 20.6 | 21.7 | 20.5 | 18.9 |
| Canada | 19.3 | 18.2 | 17.6 | 17.6 | 17.4 | 16.8 | 15.9 | 15.7 |
| United States | 18.4 | 17.8 | 17.6 | 17.9 | 18.3 | 17.2 | 15.6 | 15.0 |
The decline of the birth rates over the period from 1961 has been the subject of discussion by demographers, notably at world population conferences. This change in fertility pattern has coincided in time with increasing use of oral contraceptives; their greater effectiveness in birth control appears to have had a significant influence on fertility. Demographers have emphasised the need for further research, stating that it is important to study demographic variables involved in the decline in the birth rate, including changes in age distribution, timing of marriage and birth, past success in achieving the desired family size, and changes in the desired number of children. It could well be that oral contraceptives have presented a practical method of implementing changes in fertility patterns considered desirable from both a social and economic point of view. They may well constitute a means to an end—the attainment of predetermined goals with regard to complete family size—rather than the causes in social altitudes. In New Zealand, considerable increases in the numbers of women in the child-bearing age groups have partially offset the declines in birth rates experienced during the last decade.
REPRODUCTION INDEX—The reproduction index is based on the fact that the future size of a population is related to the number of women in the reproductive age groups at any given time. The gross rate is based on the number of female children born, and the average number of girls that will be born to a woman during her reproductive period, while the net rate takes into account fertility rates at different ages and the percentages of female survivors at those ages, obtained from life tables. A net rate of 1.0 indicates zero population growth, and a higher rate a rising population.
Reproduction rates for the non-Maori population during the latest 11 years were as follows.
| Year | Gross Rate | Net Rate |
|---|---|---|
| 1961 | 2.028 | 1.964 |
| 1962 | 1.970 | 1.908 |
| 1963 | 1.855 | 1.796 |
| 1964 | 1.753 | 1.698 |
| 1965 | 1.624 | 1.571 |
| 1966 | 1.579 | 1.534 |
| 1967 | 1.566 | 1.521 |
| 1968 | 1.541 | 1.498 |
| 1969x | 1.518 | 1.479 |
| 1970x | 1.458 | 1.421 |
| 1971x | 1.470 | 1.432 |
| 1972x | 1.400 | 1.364 |
| 1973 | 1.291 | 1.258 |
SEX OF CHILDREN BORN—Statistics for the latest 5 years are given in the following table.
| Year | Number of Births of | Male Births per 1,000 Female Births | |
|---|---|---|---|
| Males | Females | ||
| 1969 | 32,028 | 30,536 | 1,049 |
| 1970 | 31,924 | 30,283 | 1,054 |
| 1971 | 32,996 | 31,464 | 1,049 |
| 1972 | 32,288 | 30,927 | 1,044 |
| 1973 | 31,097 | 29,630 | 1,050 |
| 1974 | 30,511 | 28,825 | 1,058 |
MULTIPLE BIRTHS—The number of cases of multiple births and the proportion per 1,000 of the total Give births only) during the latest 6 years are shown in the following table.
| Year | Total Births | Total Cases | Cases of Twins | Cases of Triplets | Multiple Cases per 1,000 of Total Cases |
|---|---|---|---|---|---|
| *Includes one case of quadruplets. | |||||
| 1968 | 62,284 | 61,603 | 666 | 8 | 10.94 |
| 1969 | 62,564 | 61,921 | 627 | 8 | 10.26 |
| 1970 | 62,207 | 61,548 | 647 | 6 | 10.61 |
| 1971 | 64,460 | 63,793 | 649 | 9 | 10.31 |
| 1972 | 63,215 | 62,595 | 594 | 13 | 9.70 |
| 1973 | 60,727 | 60,153 | 566 | 5 | 9.49 |
There were 62,595 confinements in 1972 resulting in live births; of these, 607 produced multiple living births and in a further 12 cases 1 of the twins was still-born. The ratio of multiple confinements with live births to total live confinements was 1:101. In eleven additional cases both twins were still-born.
| Year | Cases of Twins | Cases of Triplets, Quads, and Quins | Total Multiple Cases | Rate per 1,000 Confinements | |||||||||
|---|---|---|---|---|---|---|---|---|---|---|---|---|---|
| Both Born Alive | One Born Alive One Still-born | Both Still-born | Total | All Born Alive | One Born Alive Two Still-born | Two Born Alive One Still-born | All Still-born | Quads, all Alive | Quins, all Alive | Total | |||
| *The thirteen cases of triplets in 1972 comprised five cases where there were two females and one male; three cases where there were two males and one female; two cases all males; and three cases all females. | |||||||||||||
| 1968 | 666 | 18 | 6 | 690 | 7 | - | 1 | - | - | - | 8 | 698 | 11.3 |
| 1969 | 627 | 11 | 8 | 646 | 8 | - | - | - | - | - | 8 | 654 | 10.6 |
| 1970 | 647 | 21 | 5 | 673 | 6 | - | - | - | - | - | 6 | 679 | 11.0 |
| 1971 | 649 | 24 | 6 | 679 | 9 | - | - | - | - | - | 9 | 688 | 10.8 |
| 1972 | 594 | 12 | 11 | 617 | 13* | - | - | - | - | - | 13 | 630 | 10.1 |
| Average of 5 year | 637 | 17 | 7 | 661 | 9 | - | - | - | - | - | 9 | 670 | 10.8 |
The likelihood of still births occurring is much greater in cases of multiple births than in single cases. This is exemplified in the following table. The figures in respect of multiple cases include all cases where one or more of the children were still-born.
| Year | Still-birth Cases per 100 of Total Cases (Including Still Births) | |
|---|---|---|
| Single Cases | Multiple Cases | |
| 1968 | 1.17 | 3.58 |
| 1969 | 0.97 | 2.91 |
| 1970 | 1.04 | 3.83 |
| 1971 | 0.98 | 4.36 |
| 1972 | 0.97 | 3.65 |
| 1973 | 0.87 | 4.05 |
| Average of 5 years | 0.97 | 3.76 |
AGES OF PARENTS—Information as to the relative ages of parents of nuptial living children whose births were registered in 1972 is shown in the following table for the total population.
Registrations of births under section 14 of the Births and Deaths Registration Act 1951 are excluded.
| Age of Father, in Years | Age of Mother, in Years | ||||||||||
|---|---|---|---|---|---|---|---|---|---|---|---|
| Under 21 | 21-24 | 25-29 | 30-34 | 35-39 | 40-44 | 45-49 | 50-54 | 55-64 | 65 and Over | Total Cases | |
| *Including 13 cases of triplets and 11 cases where 1 of twins was still-born. | |||||||||||
| single Births | |||||||||||
| Under 21 | 2,527 | 4,175 | 1,012 | 155 | 31 | 10 | 8 | 2 | 1 | 1 | 7,922 |
| 21-24 | 340 | 6,453 | 8,384 | 1,387 | 232 | 68 | 22 | 11 | 3 | - | 16,900 |
| 25-29 | 31 | 849 | 8,595 | 6,087 | 1,180 | 308 | 73 | 24 | 8 | 4 | 17,159 |
| 30-34 | 2 | 51 | 669 | 3,562 | 2,186 | 654 | 152 | 57 | 22 | 2 | 7,357 |
| 35-39 | - | 7 | 51 | 270 | 1,057 | 827 | 269 | 76 | 27 | 2 | 2,586 |
| 40-44 | - | - | 3 | 22 | 97 | 342 | 202 | 61 | 14 | 2 | 743 |
| 45 and over | - | - | - | - | 2 | 5 | 34 | 12 | 4 | 1 | 58 |
| Totals | 2,900 | 11,535 | 18,714 | 11,483 | 4,785 | 2,214 | 760 | 243 | 79 | 12 | 52,725 |
| Multiple Births | |||||||||||
| Under 21 | 13 | 32 | 10 | 2 | - | - | - | — | - | - | 57 |
| 21-24 | 5 | 55 | 77 | 13 | 3 | 2 | - | - | - | - | 155 |
| 25-29 | - | 10 | 88 | 64 | 17 | 2 | 4 | - | - | - | 185 |
| 30-34 | - | 1 | 9 | 45 | 29 | 8 | 3 | 1 | - | - | 96 |
| 35-39 | - | - | - | 7 | 21 | 11 | 3 | 2 | - | - | 44 |
| 40-44 | - | - | - | 1 | - | 6 | 2 | - | 1 | - | 10 |
| 45 and over | - | - | - | - | - | - | - | - | - | - | - |
| Totals | 18 | 98 | 184 | 132 | 70 | 29 | 12 | 3 | 1 | - | 547 |
| Grand Totals | 2,918 | 11,633 | 18,898 | 11,615 | 4,855 | 2,243 | 772 | 246 | 80 | 12 | 53,272* |
PREVIOUS ISSUE OF PARENTS—The following table gives for 1972 the number of previous issue, i.e., children born alive, in conjunction with the age of mother.
| Age of Mother in Years | Number of Previous Issue | Total Nuptial Cases | ||||||||
|---|---|---|---|---|---|---|---|---|---|---|
| 0 | 1 | 2 | 3 | 4 | 5 | 6-9 | 10-14 | 15 and Over | ||
| *This number represents 52,725 single cases and 547 multiple cases. | ||||||||||
| Under 21 | 5,932 | 1,850 | 185 | 12 | - | - | - | - | - | 7,979 |
| 21-24 | 8,059 | 6,235 | 2,091 | 521 | 115 | 31 | 3 | - | - | 17,055 |
| 25-29 | 4,576 | 5,978 | 4,168 | 1,731 | 554 | 208 | 129 | - | - | 17,344 |
| 30-34 | 1,032 | 1,518 | 1,965 | 1,462 | 709 | 389 | 358 | 20 | - | 7,453 |
| 35-39 | 309 | 289 | 420 | 503 | 405 | 240 | 400 | 63 | 1 | 2,630 |
| 40-44 | 73 | 61 | 99 | 112 | 116 | 82 | 155 | 47 | 8 | 753 |
| 45 and over | 10 | 5 | 5 | 7 | 7 | 7 | 12 | 3 | 2 | 58 |
| Totals | 19,991 | 15,936 | 8,933 | 4,348 | 1,906 | 957 | 1,057 | 133 | 11 | 53,272* |
In the following table the total issue and average issue are shown for mothers by age groups where a birth occurred in 1972.
| Age of Mother in Years | Total Mothers | Total Issue | Average Issue |
|---|---|---|---|
| Under 21 | 7,979 | 10,293 | 1.29 |
| 21-24 | 17,055 | 29,827 | 1.75 |
| 25-29 | 17,344 | 41,129 | 2.37 |
| 30-34 | 7,453 | 24,827 | 3.33 |
| 35-39 | 2,630 | 11,623 | 4.42 |
| 40-44 | 753 | 4,007 | 5.32 |
| 45 and over | 58 | 312 | 5.38 |
| Totals | 53,272 | 122,018 | 2.29 |
It should be stressed that the averages are no more than they purport to be—viz., the average number of children (including those registered in 1972) born up to the present time to those mothers of nuptial children whose births were registered during the year. They do not purport to represent, nor do they represent, the average issue of all women of the ages shown. Furthermore, they include issue born to the existing marriages only. The averages for recent years have been as follows: 1967, 2.57; 1968, 2.53; 1969, 2.50; 1970, 2.44; 1971, 2.36; and 1972, 2.29.
FIRST BIRTHS—Statistics of nuptial first confinements show that in recent years there have been reduced proportions occurring within 1 year after marriage and within 2 years after marriage.
| Year | Total Nuptial Cases | Total Nuptial First Cases | Proportion of First Cases to Total Cases | First Cases Within 1 Year After Marriage | First Cases Within 2 Years After Marriage | ||
|---|---|---|---|---|---|---|---|
| Number | Proportion to Total First Cases | Number | Proportion to Total First Cases | ||||
| percent | percent | percent | |||||
| 1967 | 52,845 | 17,564 | 33.24 | 8,287 | 47.18 | 12,621 | 71.86 |
| 1968 | 53,580 | 17,960 | 33.52 | 8,160 | 45.43 | 12,573 | 70.01 |
| 1969 | 53,874 | 18,331 | 34.03 | 7,975 | 43.51 | 12,357 | 67.41 |
| 1970 | 53,326 | 18,828 | 35.31 | 7,791 | 41.38 | 12,455 | 66.15 |
| 1971 | 54,876 | 20,101 | 36.63 | 8,375 | 41.66 | 13,259 | 65.96 |
| 1972 | 53,272 | 19,991 | 37.53 | 7,679 | 38.41 | 12,527 | 62.67 |
| 1973 | 51,042 | 17,958 | 35.18 | 6,394 | 35.61 | 11,655 | 59.34 |
The following table gives the duration-of-marriage factor in first confinements over a longer time-series. Prior to 1962 the statistics concern births of non-Maoris only.
| Duration of Marriage, in Years | Percentage of Total First Confinements | ||||||
|---|---|---|---|---|---|---|---|
| 1934 | 1944 | 1954 | 1964 | 1970 | 1971 | 1972 | |
| Under 1 | 46.25 | 38.47 | 42.64 | 49.85 | 41.38 | 41.66 | 38.41 |
| 1 | 26.79 | 26.30 | 30.56 | 26.42 | 24.77 | 24.30 | 24.25 |
| 2 | 10.24 | 11.28 | 11.56 | 11.42 | 15.48 | 15.74 | 16.39 |
| 3 | 6.16 | 7.88 | 5.95 | 5.07 | 8.84 | 8.69 | 9.98 |
| 4 | 3.96 | 7.18 | 3.30 | 2.82 | 4.39 | 4.55 | 5.30 |
| 5-9 | 5.49 | 7.36 | 5.05 | 3.56 | 4.61 | 4.55 | 5.21 |
| 10 and over | 1.11 | 1.53 | 0.94 | 0.86 | 0.53 | 0.51 | 0.46 |
| Totals | 100.00 | 100.00 | 100.00 | 100.00 | 100.00 | 100.00 | 100.00 |
In the following table first confinements occurring to mothers in different age groups are expressed as a percentage of the total first confinements. Prior to 1962 the statistics concern confinements of non-Maoris only.
| Age of Mother, in Years | Percentage of Total First Confinements | ||||||
|---|---|---|---|---|---|---|---|
| 1934 | 1944 | 1954 | 1964 | 1970 | 1971 | 1972 | |
| Under 20 | 8.90 | 7.33 | 9.08 | 19.64 | 20.45 | 20.65 | 20.53 |
| 20-24 | 40.39 | 41.79 | 47.71 | 52.67 | 51.27 | 51.17 | 49.45 |
| 25-29 | 32.79 | 29.54 | 27.79 | 18.28 | 21.15 | 21.24 | 22.89 |
| 30-34 | 13.10 | 14.61 | 10.39 | 6.00 | 4.84 | 5.21 | 5.16 |
| 35-39 | 3.79 | 5.36 | 3.92 | 2.57 | 1.71 | 1.35 | 1.55 |
| 40-44 | 0.99 | 1.34 | 1.02 | 0.81 | 0.56 | 0.35 | 0.37 |
| 45 and over | 0.04 | 0.03 | 0.09 | 0.03 | 0.02 | 0.03 | 0.05 |
| Totals | 100.00 | 100.00 | 100.00 | 100.00 | 100.00 | 100.00 | 100.00 |
The average ages of mothers at the birth of their first child were as follows: 1924, 26.39; 1934, 25.90; 1944, 25.18; 1954, 25.32; 1964, 23.65; 1969, 23.42; 1970, 23.46; 1971, 23.40; and 1972, 22.99 years.
EX-NUPTIAL BIRTHS—The numbers of ex-nuptial births registered during each of the latest 10 years, with the percentages they bear to total births registered, are given in the following table. The percentages in recent years are higher than those for Australia, Canada, United Kingdom, and United States but lower than those for Sweden. Meaningful international comparisons can only be made with caution; some of the difficulties are discussed in a supplement to the January 1967 issue of the Monthly Abstract of Statistics. Unmarried mothers are not infrequently de facto wives with comparatively stable relationships.
| Year | Number | Percentage of Total Live Births |
|---|---|---|
| *Excludes registrations under section 14 of the Births and Deaths Registration Act 1951. | ||
| 1964 | 6,189 | 9.91 |
| 1965 | 6,554 | 10.89 |
| 1966 | 6,960 | 11.56 |
| 1967 | 7,783 | 12.72 |
| 1968 | 8,094 | 13.00 |
| 1969 | 8,127 | 12.99 |
| 1970 | 8,300 | 13.34 |
| 1971* | 8,981 | 13.93 |
| 1972* | 9,394 | 14.86 |
| 1973 | 9,206 | 15.16 |
| 1974 | 9,359 | 15.17 |
The long-term trend in the rate of ex-nuptial births is indicated by the movement in the proportion of ex-nuptial births per 1,000 unmarried women—i.e., spinsters, widows, and divorced women—at the reproductive ages. The figures for census years are as follows. Up to 1961 the statistics relate to non-Maoris only; from 1966 Maoris are included.
| Census Year | Unmarried Women 15-44 Years of Age | Ex-nuptial Births | Ex-nuptial Birth Rate per 1,000 Unmarried Women |
|---|---|---|---|
| 1911 | 120,778 | 1,078 | 8.93 |
| 1916 | 125,461 | 1,159 | 9.24 |
| 1921 | 136,539 | 1,258 | 9.21 |
| 1926 | 148,551 | 1,473 | 9.92 |
| 1936 | 167,781 | 1,126 | 6.71 |
| 1945 | 156,326 | 1,824 | 11.67 |
| 1951 | 130,343 | 1,935 | 14.85 |
| 1956 | 129,877 | 2,310 | 17.79 |
| 1961 | 138,018 | 3,332 | 24.14 |
| 1966 | 183,996 | 6,940 | 37.72 |
| 1971 | 199,147 | 8,981 | 45.10 |
In 1972 the total number of ex-nuptial confinements was 9,323, of these 9,251 cases were single births, 71 were twins, while there was 1 case of twins in which 1 child was still-born. The total number of ex-nuptial live births was 9,394. From the following table, it will be seen that of the 9,323 mothers, 4,912 or 52.69 percent, were under 21 years of age.
| Age | Number of Mothers |
|---|---|
| 11 | - |
| 12 | 1 |
| 13 | 4 |
| 14 | 37 |
| 15 | 260 |
| 16 | 602 |
| 17 | 990 |
| 18 | 1,094 |
| 19 | 1,056 |
| 20 | 868 |
| 21 | 719 |
| 22 | 610 |
| 23 | 520 |
| 24-29 | 1,644 |
| 30-34 | 548 |
| 35-39 | 277 |
| 40-44 | 87 |
| 45 and over | 6 |
| Total | 9,323 |
Re-registration*—An ex-nuptial child whose parents have later married may be re-registered from birth by reason of such marriage. Applications for registration must be made within 3 months after the date of the marriage.
The numbers of re-registrations in each of the latest 5 years were as follows: 1968,1,310; 1969, 1,386; 1970, 1,513; 1971, 1,749; 1972, 1,619; 1973, 1,482.
The Children and Young Persons Act 1974 requires that all ex-nuptial births be notified to a social worker so that inquiries may be made concerning the circumstances of each mother and child for the purpose of offering advice and assistance.
*Was formerly known as Legitimation, but name was changed when the Status of Children Act 1969 was introduced.
The following table shows the outcome of the inquiries made in recent years. Inquiries relate to some births from the preceding year and do not cover all births in the year stated.
| Location of Infants | 1971 | 1972 | 1973 | |||
|---|---|---|---|---|---|---|
| No. | % | No. | % | No. | % | |
| Re-registered after marriage of parents | 336 | 4 | 313 | 4 | 274 | 4 |
| Remaining with mother (parents co habiting) | 1,855 | 23 | 1,881 | 24 | 2,037 | 24 |
| Remaining with mother (parents not cohabiting) | 2,178 | 27 | 2,293 | 30 | 2,455 | 29 |
| Placed with relatives | 319 | 4 | 250 | 3 | 298 | 4 |
| Placed with strangers with view to adoption | 2,409 | 30 | 2,128 | 28 | 1,883 | 22 |
| Placed with strangers, no expressed wish to adoption | 116 | 1 | 97 | 1 | 73 | 1 |
| In children's home or other institution on a long-term basis | 46 | 1 | 59 | 1 | 36 | - |
| Committed to care of Social Welfare | 34 | - | 36 | - | 34 | - |
| Not traced | 738 | 9 | 523 | 7 | 1,210 | 14 |
| Died | 119 | 1 | 146 | 2 | 137 | 2 |
| Totals | 8,150 | 100 | 7,726 | 100 | 8,437 | 100 |
ADOPTIONS—The following table shows the number of adoptions which have been registered during the latest 5 years.
| Year | Males | Females | Total |
|---|---|---|---|
| 1969 | 1,924 | 1,964 | 3,888 |
| 1970 | 1,972 | 1,865 | 3,837 |
| 1971 | 2,009 | 1,967 | 3,976 |
| 1972 | 1,779 | 1,863 | 3,642 |
| 1973 | 1,749 | 1,775 | 3,524 |
Of the 3,524 adoptions registered in 1973, 1,648 were children under the age of 1 year, 1,203 were aged 1 to 4 years, 428 were aged 5 to 9 years, and 245 were aged 10 years or over.
In 1972, for the first time for many years, there was a substantial drop in the number of adoption orders made by the Court and this was followed by a further drop in 1973. Of the 3,524 adoptions finalised in 1973, social workers of the Social Welfare Department were concerned with 3,088 or 88 percent. Maori welfare officers handled most of the others.
The following table, which relates only to cases handled by the department, shows the number and status of children adopted over the last 4 years.
| Status of Children Adopted | 1970 | 1971 | 1972 | 1973 |
|---|---|---|---|---|
| *These are cases where, because one of the applicants is the child's natural parent, a social worker's report has not been called for. | ||||
| Ex-nuptial | 2,831 | 2,674 | 2,713 | 2,551 |
| Nuptial | 495 | 506 | 498 | 451 |
| Not known* | 36 | 51 | 69 | 86 |
| Totals | 3,362 | 3,231 | 3,280 | 3,088 |
In 1973, 83 percent of the children adopted were born out of wedlock. Of these children born out of wedlock, 86 percent were aged less than one year at the time of placement for adoption. Sixty-five percent were placed with strangers.
The next table shows the age at placement according to the status of the children adopted in 1973.
| Age | Nuptial | Ex-nuptial | Not Known | Total |
|---|---|---|---|---|
| *These are cases where, because one of the applicants is the child's natural parent, a social worker's report has not been called for. | ||||
| Under 1 year | 295 | 2,364 | 8 | 2,667 |
| 1-5 years | 40 | 97 | 15 | 152 |
| 6 years and over | 53 | 13 | 12 | 78 |
| Not known* | 63 | 77 | 51 | 191 |
| Totals | 451 | 2,551 | 86 | 3,088 |
The following table shows the original relationship between adopted children and their new parents.
| Relationship | 1971 | 1972 | 1973 |
|---|---|---|---|
| Strangers | 2,176 | 2,136 | 2,000 |
| One parent and spouse | 738 | 801 | 770 |
| Relative or close friend | 317 | 343 | 318 |
| Totals | 3,231 | 3,280 | 3,088 |
STILL BIRTHS—Although it is compulsory to effect a birth-registration entry for a still-born child, no entry is made in the register of deaths. Particulars of causes of still births will be found in Section 4C relating to deaths. A still-born child is defined as one “which has issued from its mother after the expiration of the twenty-eighth week of pregnancy and which was not alive at the time of such issue”. Still births are not included either as births or as deaths in the various numbers and rates shown in this subsection and in that relating to deaths. The rate was 0.84 per 100 births in 1974.
The registration of still births during each of the latest 5 years were as follows.
| Year | Male Still Births | Female Still Births | Total | Male Still Births per 1,000 Female Still Births | Percentage of Still Births to | |
|---|---|---|---|---|---|---|
| Living Births | All Births | |||||
| 1969 | 327 | 298 | 625 | 1,097 | 1.00 | 0.99 |
| 1970 | 354 | 317 | 671 | 1,117 | 1.08 | 1.07 |
| 1971 | 338 | 322 | 660 | 1,050 | 1.02 | 1.01 |
| 1972 | 327 | 316 | 643 | 1,035 | 1.02 | 1.01 |
| 1973 | 284 | 274 | 558 | 1,036 | 0.92 | 0.91 |
| 1974 | 503 | 0.84 | ||||
The percentage of ex-nuptial births among still-born infants in 1972 was 16.49, and among infants born alive, 14.86.
Of the total of 643 still births in 1972, 552 were non-Maori and 91 Maori; of the Maori total 48 were males and 43 females.
NUMBERS AND RATES—The following table sets out the numbers of deaths and the crude death rates per 1,000 of mean population. (Maoris are defined as persons with half or more Maori ancestry and the term non-Maori covers all other persons.)
| Year | Numbers | Crude Rate per 1,000 of Mean Population | ||||
|---|---|---|---|---|---|---|
| Non-Maori | Maori | Total | Non-Maori | Maori | Total | |
| 1950 | 16,715 | 1,369 | 18,084 | 9.31 | 12.09 | 9.47 |
| 1955 | 17,953 | 1,272 | 19,225 | 8.95 | 9.56 | 8.99 |
| 1960 | 19,524 | 1,368 | 20,892 | 8.81 | 8.56 | 8.79 |
| 1965 | 21,759 | 1,217 | 22,976 | 8.92 | 6.20 | 8.72 |
| 1970 | 23,441 | 1,399 | 24,840 | 9.03 | 6.26 | 8.81 |
| 1971 | 22,888 | 1,421 | 24,309 | 8.69 | 6.20 | 8.49 |
| 1972 | 23,454 | 1,347 | 24,801 | 8.75 | 5.71 | 8.50 |
| 1973 | 23,932 | 1,380 | 25,312 | 8.74 | 5.70 | 8.50 |
| 1974 | 23,988 | 1,273 | 25,262 | 8.30 | ||
The chief merit of the crude death rate is that it is easily calculated, requiring only the number of deaths and the size of the population “at risk”. However, it is very misleading when comparisons arc being made between two or more populations with different age-structures, such as the Maori and non-Maori populations of New Zealand. The Maori population is a “young” one, with a high proportion of children and young people in those age groups in which the death rate is normally very low, and relatively few elderly people in those age groups in which the death rate is normally high. The non-Maori population is older, with a considerably smaller proportion of children and young people and a larger proportion of elderly people. The result is that a comparison of crude death rates gives a false picture of Maori mortality as compared with non-Maori.
In the following table for 1966 adjustments made to effect a truer comparison show that mortality for Maoris is relatively higher than for non-Maoris; in addition, a comparison is supplied in age-specific rates for the two races in each sex.
| Race | All Ages Rates per 10,000 Mean Population | Age-specific Rates per 10,000 of Population at Ages | ||||||
|---|---|---|---|---|---|---|---|---|
| Crude Rate | Maori Rate Adjusted to Non-Maori Population | Under 5 Years | 5-14 Years | 15-24 Years | 25-44 Years | 45-64 Years | 65 Years and Over | |
| Males | ||||||||
| Maori | 71.3 | 144.1 | 82.4 | 10.1 | 22.5 | 36.3 | 217.4 | 1,041.4 |
| Non-Maori | 100.4 | ... | 45.2 | 4.7 | 14.4 | 20.0 | 131.4 | 822.8 |
| Females | ||||||||
| Maori | 55.8 | 140.4 | 66.4 | 8.1 | 8.0 | 34.2 | 200.2 | 814.4 |
| Non-Maori | 80.9 | ... | 33.0 | 3.1 | 4.9 | 12.4 | 69.9 | 583.0 |
| Both Sexes | ||||||||
| Maori | 63.7 | 144.4 | 74.5 | 9.1 | 15.3 | 35.2 | 209.2 | 935.2 |
| Non-Maori | 90.7 | ... | 39.2 | 3.9 | 9.8 | 16.3 | 100.4 | 685.0 |
For both Maoris and non-Maoris the death rate in males exceeds the death rate in females by a considerable margin. The following table sets out the respective crude rates for each sex separately for the latest 11 years in the total population.
| Year | Deaths per 1,000 of Mean Population | Male Deaths to Every 100 Female Deaths | ||
|---|---|---|---|---|
| Males | Females | Total | ||
| 1963 | 9.75 | 7.91 | 8.84 | 124 |
| 1964 | 9.73 | 7.93 | 8.83 | 124 |
| 1965 | 9.58 | 7.86 | 8.72 | 123 |
| 1966 | 9.82 | 7.90 | 8.86 | 125 |
| 1967 | 9.29 | 7.57 | 8.43 | 123 |
| 1968 | 9.80 | 7.95 | 8.88 | 123 |
| 1969 | 9.58 | 7.78 | 8.68 | 123 |
| 1970 | 9.64 | 7.95 | 8.81 | 121 |
| 1971 | 9.37 | 7.60 | 8.49 | 123 |
| 1972 | 9.12 | 7.89 | 8.50 | 115 |
| 1973 | 9.35 | 7.65 | 8.50 | 122 |
DISTRIBUTION OF DEATHS OVER THE YEAR—In 1973 the months during which the greatest number of deaths occurred were September, August, and July, with totals of 2,433, 2,426, and 2,305 respectively. Excluding December (a proportion of deaths occurring in that month not being registered till January), November had the least number of deaths, 1,755, followed by February with 1,768.
AGES AT DEATH—Deaths registered during the year 1973 are shown according to age in the following table.
| Age, in Years | Males | Females | Total |
|---|---|---|---|
| Under 1 | 591 | 394 | 985 |
| 1- 4 | 132 | 104 | 236 |
| 5- 9 | 79 | 48 | 127 |
| 10-14 | 78 | 32 | 110 |
| 15-19 | 250 | 90 | 340 |
| 20-24 | 236 | 65 | 301 |
| 25-29 | 152 | 60 | 212 |
| 30-34 | 124 | 93 | 217 |
| 35-39 | 167 | 121 | 288 |
| 40-44 | 267 | 161 | 428 |
| 45-49 | 489 | 268 | 757 |
| 50-54 | 684 | 399 | 1,083 |
| 55-59 | 1,093 | 562 | 1,655 |
| 60-64 | 1,421 | 805 | 2,226 |
| 65-69 | 1,858 | 1,071 | 2,929 |
| 70-74 | 1,918 | 1,337 | 3,255 |
| 75-79 | 1,610 | 1,623 | 3,233 |
| 80-84 | 1,348 | 1,763 | 3,111 |
| 85-89 | 936 | 1,456 | 2,392 |
| 90-94 | 407 | 720 | 1,127 |
| 95-99 | 82 | 190 | 272 |
| 100 and over | 7 | 21 | 28 |
| Totals | 13,929 | 11,383 | 25,312 |
The Maori population is a very young one compared with the non-Maori and as a result there is a considerable variation in the proportions of deaths of Maoris and non-Maoris which take place at various ages. The following table illustrates the position for the year 1973.
| Age, in Years | Number of Deaths | Percentage of Total Deaths | |||
|---|---|---|---|---|---|
| Non-Maori | Maori | Non-Maori | Maori | Percentage of Maori Deaths in Total Deaths per Age Group | |
| Under 5 | 1,033 | 188 | 4.32 | 13.62 | 15.40 |
| 5-14 | 195 | 42 | 0.81 | 3.04 | 17.72 |
| 15-24 | 545 | 96 | 2.28 | 6.96 | 15.00 |
| 25-44 | 936 | 209 | 3.91 | 15.14 | 18.25 |
| 45-64 | 5,275 | 446 | 22.04 | 32.32 | 7.80 |
| 65 and over | 15,948 | 399 | 66.64 | 28.92 | 2.44 |
| All ages | 23,932 | 1,380 | 100.00 | 100.00 | 5.45 |
In the following table is given a time series for rates of death per 1,000 of mean population by age groups. Health measures have achieved an immense saving of young life and a prolongation of life especially among elderly women.
| Year | Under 1* | 1-4 | 5-14 | 15-24 | 25-34 | 35-44 | 45-54 | 55-64 | 65-74 | 75 and Over |
|---|---|---|---|---|---|---|---|---|---|---|
*Per 1,000 live births in this case. †Non-Maori figures only as Maori deaths at ages not available for these years | ||||||||||
| (Rates per 1,000 of mean population in each age group) | ||||||||||
| Males | ||||||||||
| 1901† | 78.60 | 6.81 | 1.89 | 3.52 | 3.97 | 6.16 | 11.94 | 23.12 | 50.59 | 141.67 |
| 1911† | 63.48 | 5.36 | 1.91 | 2.42 | 3.87 | 6.27 | 11.02 | 20.83 | 53.22 | 130.58 |
| 1921† | 53.10 | 4.78 | 1.85 | 2.44 | 3.56 | 5.55 | 9.61 | 19.96 | 46.17 | 128.60 |
| 1931† | 38.21 | 2.83 | 1.35 | 2.28 | 2.77 | 4.64 | 8.69 | 18.25 | 44.18 | 130.57 |
| 1941 | 43.65 | 4.39 | 1.36 | 2.53 | 2.93 | 3.95 | 9.20 | 21.13 | 47.44 | 140.27 |
| 1951 | 31.69 | 1.87 | 0.75 | 1.82 | 1.95 | 3.15 | 7.57 | 20.46 | 47.52 | 121.66 |
| 1961 | 25.86 | 1.34 | 0.49 | 1.28 | 1.47 | 2.68 | 7.39 | 19.65 | 47.33 | 126.31 |
| 1971 | 17.91 | 1.07 | 0.46 | 1.44 | 1.33 | 2.89 | 7.34 | 20.69 | 48.39 | 137.67 |
| 1972 | 17.66 | 1.00 | 0.34 | 1.64 | 1.32 | 2.50 | 7.25 | 20.10 | 46.89 | 136.14 |
| 1973 | 18.85 | 1.06 | 0.50 | 1.82 | 1.36 | 2.71 | 7.53 | 20.59 | 49.17 | 134.87 |
| Females | ||||||||||
| 1901† | 63.87 | 5.50 | 1.64 | 3.58 | 4.72 | 6.70 | 10.62 | 19.44 | 43.32 | 127.98 |
| 1911† | 48.74 | 5.37 | 1.48 | 2.76 | 4.34 | 4.92 | 8.38 | 17.89 | 40.44 | 119.60 |
| 1921† | 42.31 | 4.49 | 1.31 | 2.34 | 3.38 | 4.46 | 8.00 | 14.88 | 36.81 | 120.23 |
| 1931† | 25.67 | 2.47 | 0.97 | 1.85 | 3.20 | 3.81 | 6.84 | 15.36 | 36.83 | 122.87 |
| 1941 | 37.75 | 3.84 | 1.20 | 1.94 | 2.44 | 3.50 | 6.90 | 15.04 | 38.60 | 118.92 |
| 1951 | 23.09 | 1.59 | 0.54 | 0.89 | 1.30 | 2.27 | 5.67 | 13.85 | 32.80 | 109.79 |
| 1961 | 19.50 | 1.16 | 0.35 | 0.53 | 0.87 | 1.95 | 4.59 | 11.22 | 29.89 | 104.74 |
| 1971 | 15.10 | 0.82 | 0.28 | 0.56 | 0.91 | 1.87 | 4.71 | 10.37 | 25.47 | 100.05 |
| 1972 | 13.83 | 0.95 | 0.36 | 0.62 | 0.74 | 1.87 | 4.44 | 10.71 | 27.73 | 104.43 |
| 1973 | 13.14 | 0.87 | 0.26 | 0.61 | 0.77 | 1.84 | 4.38 | 10.56 | 26.55 | 102.25 |
| Both Sexes | ||||||||||
| 1901† | 71.40 | 6.17 | 1.77 | 3.55 | 4.33 | 6.40 | 11.37 | 21.63 | 47.87 | 135.71 |
| 1911† | 56.31 | 5.36 | 1.70 | 2.58 | 4.09 | 5.64 | 9.82 | 19.55 | 47.74 | 126.13 |
| 1921† | 47.82 | 4.64 | 1.58 | 2.39 | 3.47 | 5.10 | 8.85 | 17.59 | 41.90 | 124.84 |
| 1931† | 32.15 | 2.65 | 1.17 | 2.07 | 2.98 | 4.22 | 7.80 | 16.88 | 40.56 | 126.87 |
| 1941 | 39.81 | 4.12 | 1.28 | 2.22 | 2.67 | 3.72 | 8.02 | 18.16 | 43.04 | 129.15 |
| 1951 | 27.54 | 1.73 | 0.65 | 1.36 | 1.63 | 2.71 | 6.67 | 17.03 | 39.93 | 115.26 |
| 1961 | 22.76 | 1.25 | 0.42 | 0.91 | 1.18 | 2.31 | 6.00 | 15.41 | 37.67 | 114.01 |
| 1971 | 16.54 | 0.95 | 0.37 | 1.01 | 1.12 | 2.39 | 6.02 | 15.43 | 35.94 | 113.96 |
| 1972 | 15.79 | 0.98 | 0.35 | 1.14 | 1.03 | 2.19 | 5.85 | 15.29 | 36.50 | 116.08 |
| 1973 | 16.06 | 0.96 | 0.38 | 1.23 | 1.07 | 2.28 | 5.97 | 15.43 | 36.92 | 114.18 |
The average (arithmetic mean) age at death of non-Maori persons of each sex is shown in the following table.
| Year | Males | Females |
|---|---|---|
| age (years) | ||
| 1901 | 41.64 | 37.68 |
| 1911 | 46.17 | 42.37 |
| 1921 | 48.45 | 46.97 |
| 1931 | 54.14 | 55.48 |
| 1941 | 58.65 | 59.60 |
| 1951 | 61.58 | 65.25 |
| 1961 | 63.80 | 67.32 |
| 1967 | 63.75 | 69.40 |
| 1968 | 64.62 | 69.63 |
| 1969 | 64.65 | 70.10 |
| 1970 | 64.40 | 70.19 |
| 1971 | 64.75 | 70.04 |
| 1972 | 64.65 | 70.48 |
| 1973 | 64.06 | 70.63 |
The average age of death of Maoris in 1973 was 45.45 and 48.32 years for males and females respectively. The age composition of the Maori population is quite different as explained previously.
EXPECTATION OF LIFE—Life tables, depicting the pattern of mortality over the age span of life for particular calendar periods for the non-Maori component of New Zealand's population, have been constructed at regular intervals since 1880. The most recent tables prepared by the Department of Statistics are based on the 1971 population census, together with mortality statistics for 1970-72.
Life tables contain a measure of the degree of longevity of the population called the “expectation of life”. The expectation of life at any age is the average remaining lifetime for persons of this age, assuming that mortality rates at each age continue at the level shown by the life table. The life expectancy at selected ages at the present time, for the non-Maori population in New Zealand, is shown in the table below. The overall longer span of life enjoyed by females, compared with males, is evident. Further details concerning life table methodology and construction and trends in New Zealand life expectancies can be obtained from New Zealand Life Tables 1970-72.
| Exact Age (Years) | Life Expectancy (Years) | |
|---|---|---|
| Males | Females | |
| 0 | 69.09 | 75.16 |
| 1 | 69.27 | 75.15 |
| 2 | 68.38 | 74.26 |
| 3 | 67.45 | 73.31 |
| 4 | 66.49 | 72.35 |
| 5 | 65.53 | 71.38 |
| 10 | 60.66 | 66.49 |
| 15 | 55.78 | 61.59 |
| 20 | 51.16 | 56.74 |
| 25 | 46.53 | 51.89 |
| 30 | 41.80 | 47.03 |
| 40 | 32.40 | 37.46 |
| 50 | 23.52 | 28.37 |
| 60 | 15.82 | 19.91 |
| 70 | 9.82 | 12.48 |
| 80 | 5.53 | 6.76 |
| 90 | 2.94 | 3.29 |
| 100 | 1.23 | 1.31 |
The long-term trend since 1880 for non-Maoris has been a steady improvement in life expectancy for both sexes. The improvement has been striking for the younger ages but relatively small for the advanced ages. Progress in medical science, coupled with improved social conditions, has resulted in substantial reductions in mortality for all ages up to middle age. This trend has continued up to 1970-72 for females, but the decline in male mortality between 1965-67 and 1970-72 was not sufficient to offset the increase between 1960-62 and 1965-67, and male life expectancy has not returned to the 1960-62 level. The following table displays the life expectancy for non-Maoris revealed by each life table compiled since 1880 for the three exact ages of 0, 20, and 60 years.
| Life Table | Life Expectancy (Years) | |||||
|---|---|---|---|---|---|---|
| Males Aged Exactly | Females Aged Exactly | |||||
| 0 | 20 | 60 | 0 | 20 | 60 | |
| 1880-92 | 54.44 | 44.55 | 14.95 | 57.26 | 46.39 | 16.39 |
| 1891-95 | 55.29 | 45.47 | 15.06 | 58.09 | 47.19 | 16.55 |
| 1896-1900 | 57.37 | 46.34 | 15.33 | 59.95 | 47.91 | 16.54 |
| 1901-05 | 58.09 | 46.74 | 15.40 | 60.55 | 48.23 | 16.64 |
| 1906-10 | 59.17 | 47.20 | 15.51 | 61.76 | 48.77 | 16.77 |
| 1911-15 | 60.96 | 47.61 | 15.54 | 63.48 | 49.14 | 16.72 |
| 1921-22 | 62.76 | 48.66 | 16.03 | 65.43 | 50.36 | 17.29 |
| 1925-27 | 63.99 | 48.93 | 15.79 | 66.57 | 50.96 | 17.23 |
| 1931 | 65.04 | 49.61 | 16.22 | 67.88 | 51.28 | 17.30 |
| 1934-38 | 65.46 | 49.89 | 16.06 | 68.45 | 52.02 | 17.49 |
| 1950-52 | 68.29 | 51.15 | 16.19 | 72.43 | 54.64 | 18.53 |
| 1955-57 | 68.88 | 51.44 | 16.19 | 73.88 | 55.87 | 19.16 |
| 1960-62 | 69.17 | 51.53 | 16.09 | 74.51 | 56.33 | 19.39 |
| 1965-67 | 68.67 | 50.89 | 15.82 | 74.84 | 56.46 | 19.68 |
| 1970-72 | 69.09 | 51.16 | 15.82 | 75.16 | 56.74 | 19.91 |
The expectation of life at various ages for the Maori population is shown in the following table. These expectations are token from New Zealand Life Tables 1970-72.
| Exact Age (Years) | Life Expectancy (Years) | |
|---|---|---|
| Males | Females | |
| 0 | 60.96 | 64.96 |
| 1 | 61.52 | 65.58 |
| 2 | 60.79 | 64.80 |
| 3 | 59.89 | 63.88 |
| 4 | 58.96 | 62.94 |
| 5 | 58.02 | 61.98 |
| 10 | 53.26 | 57.12 |
| 20 | 43.97 | 47.54 |
| 30 | 35.15 | 38.14 |
| 40 | 26.50 | 29.22 |
| 50 | 18.90 | 21.14 |
| 60 | 12.96 | 14.60 |
| 70 | 8.72 | 9.90 |
| 80 | 5.04 | 5.94 |
Life expectancy at birth for Maori males decreased by 0.48 years between 1965-67 and 1970-72 while that for Maori females increased by 0.18 years. This is the first time that a decline in Maori male life expectancy has been experienced in the history of Maori life tables—first produced in 1950-52. It can be attributed to increased mortality in most ages resulting from a greater number of fatal accidents and a higher incidence of cancer. A similar decline in life expectancy was experienced by non-Maori males between 1960-62 and 1965-67, while similar trends were evident in some other western countries about this time.
The expectation of life of Maoris is shorter than that of non-Maoris at al! except the highest ages. A comparison at age 0 shows that life expectancy is 8.13 years greater for non-Maori males and 10.20 years greater for non-Maori females. For the period 1965-67, the differences were 7.23 years and 10.06 years respectively.
The table below compares the life expectancy at birth for the total population of New Zealand with that for selected overseas countries. (Source: United Nations Demographic Yearbook.)
| Country | Period | Life Expectancy at Birth (Years) | |
|---|---|---|---|
| Males | Females | ||
*White population only. †Both sexes. | |||
| Australia | 1965-67 | 67.63 | 74.15 |
| Canada | 1965-67 | 68.75 | 75.18 |
| Denmark | 1969-70 | 70.80 | 75.70 |
| England and Wales | 1969-71 | 68.80 | 75.10 |
| France | 1,970 | 68.60 | 76.10 |
| Netherlands | 1,971 | 71.00 | 76.70 |
| New Zealand | 1970-72 | 68.55 | 74.60 |
| Norway | 1961-65 | 71.03 | 75.97 |
| Scotland | 1969-71 | 67.10 | 73.36 |
| Sweden | 1,969 | 71.69 | 76.50 |
| United States* | 1,969 | 66.80 | 75.10 |
| U.S.S.R.† | 1967-68 | 70.00 | 70.00 |
REGISTRATION OF DEATH, BURIAL AND CREMATION—Deaths are required to be registered by the funeral director within 3 days after the day of burial. The law governing burial and cremation in New Zealand is found in the Burial and Cremation Act 1964. The registration by local authorities of funeral directors and mortuaries operated by them is provided for in the Health (Burial) Regulations 1946. Local authorities are charged with ensuring that adequate provision exists for the disposal of the dead. Cremation may be carried out if the deceased is not known to have left any written direction to the contrary.
The rate of cremation for every 100 deaths registered has more than doubled since 1950. The following table relates cremations to the number of deaths since 1950. Prior to 1965 the statistics concern deaths of non-Maoris only.
| Year | Deaths Registered | Cremations | Rate per 100 Deaths Registered | ||
|---|---|---|---|---|---|
| Males | Females | Total | |||
| 1950 | 16,715 | 1,799 | 1,454 | 3,253 | 19.46 |
| 1955 | 17,953 | 2,421 | 2,032 | 4,453 | 24.80 |
| 1960 | 19,524 | 2,958 | 2,582 | 5,540 | 28.38 |
| 1965 | 22,976 | 4,205 | 3,493 | 7,698 | 33.50 |
| 1970 | 24,840 | 5,418 | 4,474 | 9,892 | 39.82 |
| 1971 | 24,309 | 5,445 | 4,551 | 9,996 | 41.12 |
| 1972 | 24,801 | 5,655 | 4,785 | 10,440 | 42.10 |
| 1973 | 25,312 | 5,928 | 5,063 | 10,991 | 43.42 |
Numbers and rates of cremations for statistical areas in 1973 are shown in the following table.
| Statistical Area | Deaths Registered | Cremations | Rate per 100 Deaths Registered | ||
|---|---|---|---|---|---|
| Males | Females | Total | |||
| Northland | 773 | 57 | 38 | 95 | 12.29 |
| Central Auckland | 6,299 | 1,855 | 1,595 | 3,450 | 54.77 |
| South Auckland - Bay of Plenty | 3,225 | 637 | 453 | 1,090 | 33.80 |
| East Coast | 424 | 37 | 24 | 61 | 14.39 |
| Hawke's Bay | 1,279 | 253 | 236 | 489 | 38.23 |
| Taranaki | 900 | 192 | 159 | 351 | 39.00 |
| Wellington | 4,720 | 1,229 | 1,140 | 2,369 | 50.19 |
| Marlborough | 241 | 41 | 33 | 74 | 30.71 |
| Nelson | 662 | 113 | 95 | 208 | 31.42 |
| Westland | 278 | 12 | 6 | 18 | 6.47 |
| Canterbury | 3,813 | 1,040 | 889 | 1,929 | 50.59 |
| Otago | 1,783 | 423 | 372 | 795 | 44.59 |
| Southland | 915 | 39 | 23 | 62 | 6.78 |
| Totals | 25,312 | 5,928 | 063 | 10,901 | 43.42 |
DEATHS BY CAUSES—The accuracy of death data even in medically certified deaths will be affected by two factors—the proportion of deaths in hospitals where diagnostic equipment is available and the proportion of deaths in which a post-mortem report is available for reference.
In recent years in approximately one-third of all deaths, a post mortem was conducted. In the cases of deaths certified by doctors, 19 percent of non-Maori and 11 percent of Maori deaths were followed by an autopsy. In the cases certified by coroners almost all deaths are subject to autopsy.
The Eighth (1965) Revision of the International Classification of Diseases, Injuries, and Causes of Death replaced the Seventh (1955) Revision with effect from 1 January 1968.
Total deaths and the rates per million of total population for the latest 3 years, classified according to the Abbreviated List of 50 Causes for Tabulation of Mortality, are contained in the following table. Certain diseases (plague, smallpox, typhus, and malaria) are not listed in the table as there were no deaths from these causes in the years shown.
| Causes of Death | Number of Deaths | Rate per Million of Mean Population | ||||
|---|---|---|---|---|---|---|
| 1970 | 1971 | 1972 | 1970 | 1971 | 1972 | |
| Cholera | - | - | 1 | - | - | - |
| Typhoid fever | - | - | 1 | - | - | - |
| Bacillary dysentery and amoebiasis | 1 | 1 | - | - | - | - |
| Enteritis and other diarrhoeal diseases | 69 | 50 | 53 | 24 | 18 | 18 |
| Tuberculosis of respiratory system | 55 | 27 | 39 | 20 | 10 | 13 |
| Other tuberculosis, including late effects | 48 | 44 | 52 | 17 | 16 | 18 |
| Whooping cough | - | 1 | 3 | - | - | 1 |
| Streptococcal sore throat and scarlet fever- | 1 | - | - | - | - | - |
| Meningococcal infection | 11 | 3 | 3 | 4 | 1 | 1 |
| Measles | 12 | 5 | 8 | 4 | 2 | 3 |
| Syphilis and its sequelae | 9 | 8 | 10 | 3 | 3 | 3 |
| All other infective and parasitic diseases | 71 | 83 | 97 | 25 | 29 | 33 |
| Malignant neoplasms, including neoplasms of lymphatic and haematopoietic tissue | 4,460 | 4,486 | 4,526 | 1,582 | 1,591 | 1,552 |
| Benign neoplasms and neoplasms of unspecified nature | 38 | 37 | 32 | 13 | 13 | 11 |
| Diabetes mellitus | 366 | 372 | 459 | 130 | 132 | 157 |
| Avitaminosis and other nutritional deficiency | 15 | 4 | 4 | 5 | 1 | 1 |
| Anaemias | 41 | 45 | 63 | 15 | 16 | 22 |
| Meningitis | 34 | 43 | 39 | 12 | 15 | 13 |
| Active rheumatic fever | 2 | 5 | 4 | 1 | 2 | 1 |
| Chronic rheumatic heart disease | 294 | 249 | 263 | 104 | 88 | 90 |
| Hypertensive disease | 387 | 354 | 400 | 137 | 126 | 137 |
| Ischaemic heart disease | 6,788 | 6,932 | 7,100 | 2,407 | 2,459 | 2,434 |
| Other forms of heart disease | 905 | 881 | 624 | 321 | 312 | 214 |
| Cerebrovascular disease | 3,213 | 3,310 | 3,447 | 1,140 | 1,174 | 1,182 |
| Influenza | 214 | 23 | 31 | 76 | 8 | 11 |
| Pneumonia | 1,396 | 1,195 | 1,041 | 495 | 424 | 357 |
| Bronchitis, emphysema and asthma | 1,023 | 987 | 1,030 | 363 | 350 | 353 |
| Peptic ulcer | 117 | 107 | 130 | 41 | 38 | 45 |
| Appendicitis | 15 | 17 | 15 | 5 | 6 | 5 |
| Intestinal obstruction and hernia | 90 | 90 | 95 | 32 | 32 | 33 |
| Cirrhosis of liver | 107 | 104 | 125 | 38 | 37 | 43 |
| Nephritis and neophrosis | 96 | 128 | 95 | 34 | 45 | 33 |
| Hyperplasia of prostate | 66 | 67 | 39 | 23 | 24 | 13 |
| Abortion | 1 | - | 1 | - | - | - |
| Other complications of pregnancy, childbirth and the puerperium, delivery without mention of complication | 19 | 14 | 9 | 7 | 5 | 3 |
| Congenital anomalies | 320 | 303 | 308 | 113 | 107 | 106 |
| Birth injury, difficult labour and other anoxic and hypoxic conditions | 148 | 176 | 163 | 52 | 62 | 56 |
| Other causes of perinatal mortality | 327 | 332 | 291 | 116 | 118 | 100 |
| Symptoms and ill-defined conditions | 146 | 104 | 125 | 52 | 37 | 43 |
| All other diseases | 2,020 | 1,864 | 2,133 | 716 | 661 | 731 |
| Motor vehicle accidents | 649 | 674 | 719 | 230 | 239 | 247 |
| All other accidents | 937 | 895 | 904 | 332 | 317 | 310 |
| Suicide and self-inflicted injuries | 271 | 237 | 262 | 96 | 84 | 90 |
| All other external causes | 59 | 51 | 49 | 21 | 18 | 17 |
| Totals | 24,840 | 24,309 | 24,793 | 8,810 | 8,621 | 8,501 |
In a variety of conditions and in external causes of death the mortality rate for Maoris is very much higher than the non-Maori experience. Much of this disparity is concealed, however, by crude rates which are calculated by dividing the total population into the number of deaths from any particular disease or circumstance. With two populations so very dissimilar in age structure (at ages under 5 years non-Maoris are seven times more numerous than Maoris, but at ages 75 years and upward they are 85 times as numerous), it is necessary to resort to an adjustment of Maori rates so that the figures for any condition become directly comparable in any particular year. This has been done in the following table by firstly calculating age-specific rates for the Maori and then applying these to the non-Maori population, age group to age group. This computation provides an "expected" number of Maori deaths in each age group and these added together and then divided by the non-Maori population give an adjusted rate. In addition to the rates expressed per million of population the absolute numbers of deaths in the two races are furnished for the same 50 causes.
| Causes of Death | Number of Deaths | Rates per Million of Population (Non-Maori: Crude Rate—Maori: Adjusted Rate) | ||||||
|---|---|---|---|---|---|---|---|---|
| 1971 | 1972 | 1971 | 1972 | |||||
| Non-Maori | Maori | Non-Maori | Maori | Non-Maori | Maori | Non-Maori | Maori | |
| Cholera | - | - | 1 | - | - | - | - | - |
| Typhoid fever | - | - | - | 1 | - | - | - | - |
| Bacillary dysentery and amoebiasis | 1 | - | - | - | - | - | - | - |
| Enteritis and other diarrhoeal diseases | 32 | 18 | 38 | 15 | 12 | 49 | 14 | 65 |
| Tuberculosis of respiratory system | 16 | 11 | 29 | 10 | 6 | 128 | 11 | 100 |
| Other tuberculosis, including late effects | 33 | 11 | 40 | 12 | 13 | 114 | 15 | 142 |
| Whooping cough | 1 | - | 2 | 1 | - | - | 1 | 3 |
| Streptococcal sore throat and scarlet fever | 1 | - | - | - | - | - | - | - |
| Meningococcal infection | 3 | - | 2 | 1 | 1 | - | 1 | 3 |
| Measles | 3 | 2 | 4 | 4 | 1 | 5 | 1 | 10 |
| Syphilis and its sequelae | 6 | 2 | 8 | 2 | 2 | 25 | 3 | 19 |
| All other infective and parasitic diseases | 65 | 18 | 80 | 17 | 25 | 114 | 30 | 92 |
| Malignant neoplasms, including neoplasms of lymphatic and haematopoietic tissue | 4,284 | 202 | 4,309 | 217 | 1,650 | 2,550 | 1,607 | 2,868 |
| Benign neoplasms and neoplasms of unspecified nature | 35 | 2 | 27 | 5 | 13 | 39 | 10 | 49 |
| Diabetes mellitus | 334 | 38 | 421 | 38 | 129 | 543 | 157 | 480 |
| Avitaminosis and other nutritional deficiency | 4 | - | 4 | - | 2 | - | 1 | - |
| Anaemias | 43 | 2 | 61 | 2 | 17 | 37 | 23 | 35 |
| Meningitis | 29 | 14 | 34 | 5 | 11 | 37 | 13 | 13 |
| Active rheumatic fever | 3 | 2 | 3 | 1 | 1 | 6 | 1 | 11 |
| Chronic rheumatic heart disease | 216 | 33 | 219 | 44 | 83 | 342 | 82 | 434 |
| Hypertensive disease | 323 | 31 | 358 | 42 | 124 | 440 | 134 | 561 |
| Ischaemic heart disease | 6,691 | 241 | 6,849 | 251 | 2,577 | 3,951 | 2,555 | 3,612 |
| Other forms of heart disease | 841 | 40 | 580 | 44 | 324 | 708 | 216 | 747 |
| Cerebrovascular disease | 3,231 | 79 | 3,369 | 78 | 1,244 | 1,352 | 1,257 | 1,034 |
| Influenza | 21 | 2 | 28 | 3 | 8 | 44 | 10 | 58 |
| Pneumonia | 1,098 | 97 | 974 | 67 | 423 | 1,093 | 363 | 645 |
| Bronchitis, emphysema, and asthma | 909 | 78 | 959 | 71 | 350 | 1,314 | 358 | 987 |
| Peptic ulcer | 101 | 6 | 124 | 6 | 39 | 90 | 46 | 96 |
| Appendicitis | 11 | 6 | 13 | 2 | 4 | 44 | 5 | 10 |
| Intestinal obstruction and hernia | 83 | 7 | 88 | 7 | 32 | 71 | 33 | 51 |
| Cirrhosis of liver | 99 | 5 | 116 | 9 | 38 | 52 | 43 | 85 |
| Nephritis and nephrosis | 112 | 16 | 84 | 11 | 43 | 126 | 31 | 65 |
| Hyperplasia of prostate | 64 | 3 | 37 | 2 | 25 | 65 | 14 | 56 |
| Abortion | - | - | - | 1 | - | - | - | 6 |
| Other complications of pregnancy, childbirth, and the puerperium, delivery without mention of complication | 13 | 1 | 8 | 1 | 5 | 5 | 3 | 6 |
| Congenital anomalies | 273 | 30 | 271 | 37 | 105 | 98 | 101 | 132 |
| Birth injury, difficult labour and other anoxic and hypoxic conditions | 140 | 36 | 139 | 24 | 54 | 94 | 52 | 61 |
| Other causes of perinatal mortality | 279 | 53 | 257 | 34 | 107 | 139 | 96 | 87 |
| Symptoms and ill-defined conditions | 96 | 8 | 120 | 5 | 37 | 106 | 45 | 115 |
| All other diseases | 1,744 | 120 | 2,020 | 113 | 672 | 1,422 | 754 | 1,150 |
| Motor vehicle accidents | 569 | 105 | 606 | 113 | 219 | 585 | 226 | 563 |
| All other accidents | 803 | 92 | 843 | 61 | 309 | 713 | 314 | 387 |
| Suicide and self-inflicted injuries | 232 | 5 | 255 | 7 | 89 | 34 | 95 | 16 |
| All other external causes | 42 | 9 | 42 | 7 | 16 | 65 | 16 | 34 |
| Totals | 22,884 | 1,425 | 23,422 | 1,371 | 8,814 | 16,627 | 8,737 | 14,892 |
Age-specific rates and Maori age-adjusted rates have been published for a comprehensive list of diseases in Maori-European Standards of Health, one of a series of special reports issued by the Department of Health.
The comparatively poor state of health of the Maori is shown by the excess in the Maori adjusted rates for most diseases. As can be seen in the table, the absolute numbers of Maoris dying from any cause of death is small. This is because the Maori population has a high proportion of young people, and most diseases which cause death develop at the older ages.
The susceptibility of the Maori to epidemic and communicable disease is well known. Again there is a Maori excess mortality in cancer and diabetes. The disparity is also very noticeable in acute rheumatic fever and chronic rheumatic heart disease; in certain other forms of degenerative heart disease and hypertension; in both acute and chronic chest conditions, and in gastro-intestinal and kidney infections. Recent health surveys have indicated that an inclination towards overnutrition, combined with a racial predisposition to excess weight, may underlie the early development of degenerative conditions and the high incidence of metabolic disorders.
In addition to the greater susceptibility to disease processes, the Maori shows a much higher accident rate. Especially accident prone is the Maori child and young adult, while proportionately many more Maoris are involved in road fatalities.
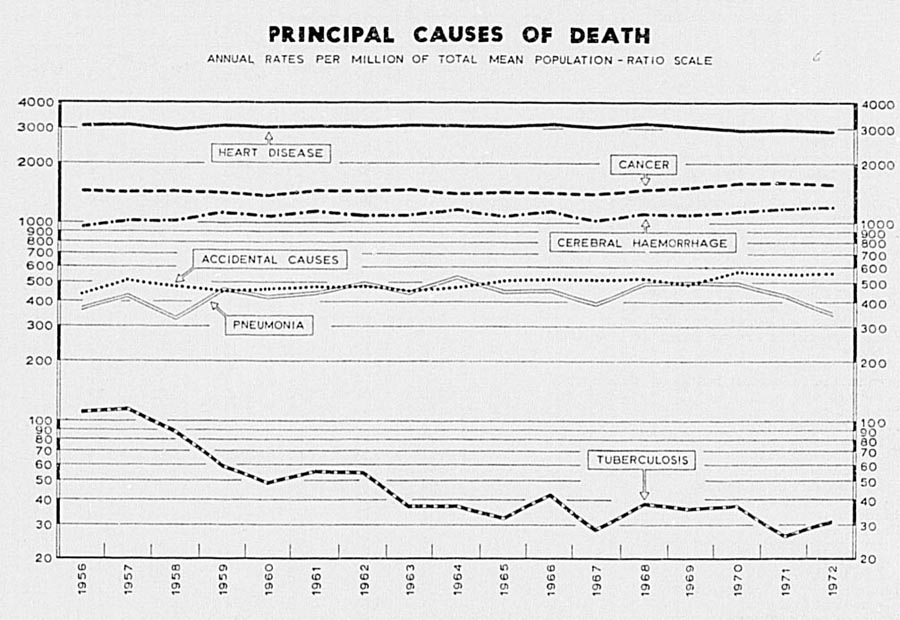
Cancer—Cancer is annually responsible for more deaths in New Zealand than any other cause except diseases of the heart. While it is most prevalent in middle and old age, cancer is a leading cause of death at all ages, even among children and adolescents.
A detailed report on cancer mortality and morbidity in New Zealand was issued in 1974 by the National Health Statistics Centre of the Department of Health. This report covers mortality from cancer from 1970 to 1971, and also surveys all cases reported to the National Cancer Registry by hospitals and by the various cancer clinics established in New Zealand under the auspices of the Cancer Society of New Zealand.
Attention is drawn to the transference, under the 1948 Revision of the International Classification, of Hodgkin's disease, leukaemia, etc., into the category of malignant disease. This classification was introduced in New Zealand in 1950, and all cancer figures quoted for that and subsequent years include these conditions*.
In 1972 there were 4,526 deaths from cancer, of which 217 were Maori. While the 1972 non-Maori crude cancer death rate of 160.7 was much higher than the Maori crude rate of 92.0 (both per 100,000 of population), these figures are misleading as a measure of the incidence of malignant disease in the two groups. When allowance is made for the comparatively few persons in the Maori population at older ages where cancer is most frequently diagnosed, it is seen that Maori cancer mortality is markedly higher than non-Maori cancer mortality. This fact is no indication at all that in general the Maori is more prone to cancer (in cancers of the intestines in both sexes and in two sites in the Maori female, the cervix and the lung, the incidence appears to be higher), but that there is more delay in reporting the symptoms of cancer by Maoris and that more cancer in Maoris goes untreated.
*The 1965 Revision of the International Classification transferred Polycythaemia Vera and Myelofibrosis into the malignant categories but these are not included in cancer figures
A summary of numbers, crude rates, and standardised mortality ratios is provided in the following table.
| Year | Number of Deaths from Cancer | Crude Death Rate per 100,000 | Standardised Mortality Ratios | Number of Deaths from Cancer | Crude Death Rate per 100,000 | Standardised Mortality Ratios* |
|---|---|---|---|---|---|---|
| Males | Females | |||||
| *Base years 1950-52= 100. | ||||||
| 1950 | 1,431 | 148.2 | 99 | 1,286 | 134.6 | 97 |
| 1955 | 1,660 | 151.3 | 104 | 1,511 | 142.2 | 100 |
| 1960 | 1,724 | 144.3 | 101 | 1,566 | 132.5 | 92 |
| 1965 | 2,034 | 153.0 | 112 | 1,783 | 135.3 | 95 |
| 1967 | 2,037 | 148.9 | 109 | 1,815 | 133.4 | 93 |
| 1968 | 2,225 | 161.3 | 117 | 1,844 | 133.9 | 93 |
| 1969 | 2,282 | 164.1 | 119 | 1,875 | 134.6 | 93 |
| 1970 | 2,436 | 173.2x | 126x | 2,024 | 143.5 | 99 |
| 1971 | 2,479 | 175.2x | 126 | 2,007 | 142.3 | 96x |
| 1972 | 2,411 | 165.4 | 121 | 2,115 | 145.0 | 99 |
The standardised mortality ratio shows the number of deaths registered in the year of experience expressed as a percentage of those which would have been expected in that year had there operated the sex-age mortality of a standard period (the 3 years 1950-52 were chosen). The standardised mortality ratio has been adopted to eliminate the distorting effect of the changes which take place over a period in the age structure of the population. The standardised mortality ratio for males has risen from 99 in the year 1950, to 101 in 1960 and 121 in 1972. This would indicate that there has been a real increase in the death toll in the male sex and this, as discussed ater, is mainly attributable to the rise in lung cancer. The mean standardised mortality ratio for females has fluctuated between 97 in 1950 and 99 in 1972.
A classification of cancer deaths during 1972 according to age subdivisions, ethnic origin, and sex is now given. Ninety-two percent of deaths from cancer during 1972 were at ages 45 and upwards, and 58 percent were at ages 65 years and upwards.
| Age Group, in Years | Race | Deaths of Males | Deaths of Females | ||||
|---|---|---|---|---|---|---|---|
| Numbers | Rate per 100,000 of Population at Ages | Percentage of Total Deaths at Ages | Numbers | Rate per 100,000 of Population at Ages | Percentage or Total Deaths at Ages | ||
| *All ages crude rate. | |||||||
| Under 5 | Non-Maori | 12 | 8.9 | 2.0 | 14 | 10.8 | 3.3 |
| Maori | - | - | - | 1 | 5.3 | 0.9 | |
| 5-14 | Non-Maori | 13 | 4.7 | 15.3 | 16 | 6.1 | 18.2 |
| Maori | 3 | 7.9 | 13.0 | 2 | 5.4 | 10.5 | |
| 15-24 | Non Maori | 24 | 10.2 | 6.7 | 14 | 6.2 | 10.9 |
| Maori | 6 | 26.1 | 8.7 | 2 | 8.8 | 7.4 | |
| 25-44 | Non-Maori | 101 | 31.1 | 18.6 | 116 | 36.9 | 32.9 |
| Maori | 9 | 35.3 | 8.6 | 11 | 43.2 | 15.7 | |
| 45-64 | Non-Maori | 776 | 295.0 | 23.9 | 681 | 254.3 | 36.9 |
| Maori | 60 | 559.7 | 20.8 | 48 | 464.7 | 25.5 | |
| 65 and over | Non-Maori | 1,362 | 1,309.6 | 17.7 | 1.180 | 835.3 | 14.6 |
| Maori | 45 | 1,866.4 | 22.0 | 30 | 1,336.9 | 17.3 | |
| All ages Non-Maori | 2,288 | 170.9* | 18.3 | 2,021 | 150.6 | 18.5 | |
| Maori | 123 | 103.2* | 15.7 | 94 | 80.5 | 16.0 | |
Cancer contributes substantially to the total of non-Maori deaths at all ages. In the non-Maori female from 25 to 64 years one death in three is a cancer death and for males the proportion is one death in five.
For Maoris the proportions of cancer deaths to total deaths are very much lower than for non-Maoris, by reason that the competing risks from other diseases are so very much higher.
A summary of all cancer deaths occurring in New Zealand during 1972 by location of the disease is shown in the following table. Figures by site for Maoris have not been separated as the numbers are so small for most sites. Rates for Maoris tend to be higher in cancers involving the digestive tract, the respiratory organs, and the female genital organs.
| Site of Disease | Numbers | Rates per Million of Mean Population | ||||
|---|---|---|---|---|---|---|
| Males | Females | Total | Males | Females | Total | |
| Buccal cavity and pharynx | 47 | 20 | 67 | 32 | 14 | 23 |
| Oesophagus | 56 | 44 | 100 | 38 | 30 | 34 |
| Stomach | 203 | 130 | 333 | 139 | 89 | 114 |
| Intestine, except rectum | 227 | 286 | 513 | 156 | 196 | 176 |
| Rectum | 151 | 116 | 267 | 104 | 80 | 92 |
| Larynx | 26 | 3 | 29 | 18 | 2 | 10 |
| Lung, bronchus, and trachea | 636 | 172 | 808 | 436 | 118 | 277 |
| Bone and connective tissue | 20 | 28 | 48 | 14 | 19 | 16 |
| Skin | 67 | 39 | 106 | 46 | 27 | 36 |
| Breast | 1 | 392 | 393 | 1 | 269 | 135 |
| Cervix, uterus | - | 84 | 84 | - | 58 | 29 |
| Other and unspecified parts of uterus | - | 74 | 74 | - | 51 | 25 |
| Prostate | 226 | - | 226 | 155 | - | 77 |
| All other and unspecified sites | 512 | 543 | 1,055 | 351 | 372 | 362 |
| Leukaemia and aleukaemia | 136 | 124 | 260 | 93 | 85 | 89 |
| Lymphosarcoma and other neoplasms of lymphatic and haematopoietic tissue | 103 | 60 | 163 | 71 | 41 | 56 |
| Totals | 2,411 | 2,115 | 4,526 | 1,654 | 1,450 | 1,552 |
There is considerable variation in the numbers and rates for different sites in both males and females. The site principally involved in the male is the lung and bronchus and one male cancer death in every four relates to this site. Cancer of the stomach is very much more common in the male than the female but the position is reversed in cancer involving the intestines. The leading site in the female is the breast, which contributes one-fifth to total female cancer deaths.
The world-wide phenomenal increase over the last 30 years in cancer of the lung and bronchus (excluding trachea and pleura) is accepted as being associated with cigarette smoking and atmospheric pollution. The following table shows the increase in deaths from cancer of this site in each group and in each sex over the latest 11 years.
| Year | Number of Deaths from Cancer of Lung and Bronchus | Crude Rate per 100,000 of Mean Population | ||||||
|---|---|---|---|---|---|---|---|---|
| Non-Maori | Maori | Non-Maori | Maori | |||||
| Male | Female | Male | Female | Male | Female | Male | Female | |
| 1962 | 422 | 58 | 17 | 5 | 36.3 | 5.0 | 19.1 | 5.8 |
| 1963 | 448 | 68 | 18 | 12 | 37.8 | 5.8 | 19.5 | 13.4 |
| 1964 | 459 | 71 | 19 | 9 | 37.9 | 5.9 | 19.9 | 9.7 |
| 1965 | 469 | 57 | 20 | 13 | 38.1 | 4.7 | 20.3 | 13.6 |
| 1966 | 522 | 69 | 24 | 6 | 42.0 | 5.6 | 23.3 | 6.0 |
| 1967 | 492 | 78 | 17 | 16 | 39.0 | 6.2 | 16.0 | 15.5 |
| 1968 | 597 | 91 | 31 | 12 | 47.0 | 7.2 | 28.3 | 11.3 |
| 1969 | 619 | 104 | 26 | 13 | 48.4 | 8.1 | 23.1 | 11.9 |
| 1970 | 650 | 132 | 30 | 17 | 50.2 | 10.2 | 26.6 | 15.4 |
| 1971 | 643 | 121 | 35 | 14 | 49.6 | 9.3 | 31.0 | 12.7 |
| 1972 | 587 | 151 | 47 | 21 | 43.8 | 11.3 | 39.4 | 18.0 |
The crude rates for the Maori conceal the true relative incidence of lung cancer. Adjusted to the non-Maori population structure, the Maori rates exceed the non-Maori rates, the greatest margin being in the female.
While cancer is undoubtedly increasing in numerical incidence it is not doing so out of proportion to the population exposed to the cancer risk. The following table shows the movement in the standardised mortality ratio, the standard population employed being that of New Zealand 1950-52.
| Site | Male | Female | ||||
|---|---|---|---|---|---|---|
| 1966-68 | 1969-71 | 1972 | 1966-68 | 1969-71 | 1972 | |
| Buccal cavity and pharynx | 59 | 88 | 77 | 87 | 64 | 69 |
| Oesophagus | 96 | 88 | 85 | 90 | 83 | 100 |
| Stomach | 64 | 60 | 53 | 56 | 51 | 48 |
| Large intestine, except rectum | 111 | 126 | 117 | 88 | 89 | 90 |
| Rectum | 95 | 113 | 134 | 84 | 89 | 108 |
| Biliary passages and liver | 125 | 157 | 150 | 78 | 96 | 98 |
| Pancreas | 92 | 103 | 107 | 106 | 96 | 97 |
| Larynx | 87 | 70 | 87 | 46 | 32 | 37 |
| Lung, bronchus and trachea | 211 | 241 | 221 | 177 | 162 | 312 |
| Skin (including melanoma) | 117 | 141 | 155 | 142 | 128 | 122 |
| Breast | 125 | 25 | 33 | 100 | 103 | 97 |
| Uterus, all parts | - | - | - | 71 | 69 | 74 |
| Ovary, fallopian tube | - | - | - | 97 | 111 | 121 |
| Prostate | 104 | 112 | 110 | - | - | - |
| Kidney | 113 | 111 | 114 | 77 | 100 | 97 |
| Bladder, urinary organs | 113 | 107 | 129 | 93 | 104 | 145 |
| Brain, nervous system | 110 | 142 | 155 | 81 | 161 | |
| Lymphosarcoma and reticulo-sarcoma | 92 | 113 | 135 | 115 | 104 | 87 |
| Hodgkin's disease | 148 | 110 | 135 | 122 | 116 | 82 |
| Leukaemia and aleukaemia | 112 | 120 | 118 | 131 | 129 | 151 |
The upward trend in the total male cancer death toll can be ascribed chiefly to the steep rise in lung and bronchus cancer, already commented upon. Lung cancer among females showed a substantial rise in the 1966-68 period, but has declined again in more recent years.
Heart Disease—Heart disease is still the leading cause of death in New Zealand, but the mortality rate has dropped a little in each of the latest five years for which figures are available, from 31.7 per 10,000 population in 1968 to 28.5 in 1972. However, when allowance is made for the general ageing of the population by employing the standardised mortality ratio it is seen that, although a rise to 6 percent above the 1950-52 level occurred in males in 1968, there was a fall of 7 percent to below the 1950-52 level again by 1972. The female rate in 1971 and 1972 was 30 percent below the 1950-52 level used as the standard for the mortality ratio.
A disease phenomenon of recent years has been the rapid increase in deaths assigned to coronary heart disease, and in 1972 no less than 28 percent of all deaths were due to this single disease entity. During the 10 years from 1962 to 1972 there was a rise of 23 percent for males and 41 percent for females in this form of heart disease. It is a matter of conjecture as to whether the real incidence of coronary heart disease in the community has risen to this extent or whether it is due, in part at least, to increased recognition of the condition.
The numbers of deaths and standard mortality ratios for heart disease, excluding acute rheumatic forms and congenital malformations, for the last 11 years are tabled for a series of years, males and females separately.
| Year | All Forms of Heart Disease | Coronary Heart Disease | ||||||
|---|---|---|---|---|---|---|---|---|
| Males | Females | Males | Females | |||||
| Number | Standardised Mortality Ratio* | Number | Standardised Mortality Ratio* | Number | Standardised Mortality Ratio* | Number | Standardised Mortality Ratio* | |
| *Base years 1950-52 = 100. | ||||||||
| 1962 | 4,396 | 96 | 3,205 | 79 | 3,187 | 141 | 1,828 | 146 |
| 1963 | 4,628 | 100 | 3,302 | 80 | 3,495 | 153 | 1,980 | 156 |
| 1964 | 4,737 | 102 | 3,322 | 79 | 3,637 | 157 | 2,082 | 161 |
| 1965 | 4,710 | 100 | 3,394 | 79 | 3,619 | 154 | 2,159 | 163 |
| 1966 | 4,941 | 104 | 3,496 | 79 | 3,893 | 164 | 2,275 | 169 |
| 1967 | 4,851 | 100 | 3,446 | 76 | 3,845 | 159 | 2,254 | 164 |
| 1968 | 5,217 | 106 | 3,506 | 76 | 4,372 | 178 | 2,581 | 183 |
| 1969 | 4,919 | 100 | 3,500 | 74 | 4,150 | 167 | 2,549 | 178 |
| 1970 | 4,886 | 99 | 3,405 | 72 | 4,228 | 169 | 2,560 | 177 |
| 1971 | 4,938 | 98 | 3,413 | 70 | 4.313 | 172 | 2,619 | 176 |
| 1972 | 4,784 | 93 | 3,515 | 70 | 4,262 | 164 | 2,838 | 187 |
Coronary heart disease is predominantly a disease of old age in both sexes, although among men appreciable numbers of deaths occur in middle age. There are marked differences in the mortality from the disease both between men and women, and between non-Maoris and Maoris.
The following table averages both the numbers and the age-specific rates for coronary heart disease in both non-Maoris and Maoris over the 5 years 1968-72.
| Race | Ages 35 to 44 Years | Ages 45 to 54 Years | Ages 55 to 64 Years | Ages 65 Years and Over | ||||
|---|---|---|---|---|---|---|---|---|
| Average Number of Deaths Each Year | Average Rate per 10,000 of Population at Ages | Average Number of Deaths Each Year | Average Rate per 10,000 of Population at Ages | Average Number of Deaths Each Year | Average Rate per 10,000 of Population at Ages | Average Number of Deaths Each Year | Average Rate per 10,000 of Population at Ages | |
| Males | ||||||||
| Non-Maori | 99 | 6.5 | 405 | 28.7 | 1.004 | 87.3 | 2,605 | 261.1 |
| Maori | 10 | 9.7 | 24 | 38.3 | 41 | 104.6 | 58 | 259.9 |
| Females | ||||||||
| Non-Maori | 23 | 1.6 | 101 | 7.1 | 314 | 26.3 | 2,106 | 155.5 |
| Maori | 4 | 3.9 | 17 | 27.4 | 24 | 69.1 | 37 | 180.5 |
For non-Maoris at ages 35 to 44 years male coronary heart disease rates exceed female rates by over 4 to 1, the ratio decreasing as age advances to a ratio of under 2 to 1 at ages 65 years and upwards.
The absolute numbers of Maori deaths from the disease are small but when related to the population at risk produce fairly similar rates to the non-Maori population in the male sex.
Maori women have a very much greater chance of dying from a coronary condition than non-Maori women, the risk being over twice as great at ages 35 to 44 years, almost four times greater at ages 45 to 54 years and twice as great at ages 55 to 64 years. Hypertensive forms of heart disease are also very much more common in Maori women in middle age, while both sexes in the Maori have a higher mortality from rheumatic valvular heart disease.
INFANT MORTALITY—Infant mortality concerns deaths of children under 1 year of age. Statistics for non-Maoris and Maoris are given in the following table.
| Year | Numbers | Rates per 1.000 of Live Births | ||||
|---|---|---|---|---|---|---|
| Non-Maori | Maori | Total | Non-Maori | Maori | Total | |
| 1945 | 1,036 | 413 | 1,449 | 27.99 | 88.93 | 34.79 |
| 1950 | 1,008 | 356 | 1,364 | 22.75 | 69.74 | 27.60 |
| 1955 | 1,002 | 363 | 1,365 | 20.09 | 62.51 | 24.52 |
| 1960 | 1,090 | 330 | 1,420 | 19.66 | 44.50 | 22.59 |
| 1965 | 940 | 234 | 1,174 | 17.97 | 29.79 | 19.51 |
| 1970 | 815 | 225 | 1,040 | 15.11 | 27.17 | 16.72 |
| 1971 | 844 | 222 | 1,066 | 15.05 | 25.54 | 16.54 |
| 1972x | 827 | 160 | 987 | 14.94 | 20.33 | 15.61 |
Male rates of infant loss are about 41 percent above female rates and this tends to counterbalance the male excess in births.
When international infant death rates are compared it is seen that Netherlands and the Scandinavian countries have the lowest rates in the world. The following table sets out the rates for a number of countries in 1972. It is pointed out, however, that definitions and practices are not precisely alike in all countries.
| Country | Deaths Under 1 Year per 1,000 Live Births in 1972 |
|---|---|
(Source: World Health Statistics Report, Vol. 26, No. 12.) *1971 Rates. | |
| Sweden | 11.1 |
| Finland | 11.3 |
| Netherlands | 11.5 |
| Norway | 12.5* |
| Denmark | 13.5* |
| Switzerland | 14.4* |
| New Zealand | 16.5 |
| Australia | 16.7 |
| England and Wales | 17.3 |
| France | 16.0 |
| Germany (East) | 22.8 |
| Ireland | 17.8 |
| Scotland | 18.9 |
| United States | 18.5 |
| Belgium | 18.1 |
| Czechoslovakia | 21.6* |
| Germany (West) | 17.7 |
| Austria | 25.1 |
| Bulgaria | 24.9* |
| Italy | 27.0 |
One out of every six infant deaths is a Maori infant death and the Maori rate of loss is nearly 50 percent higher than the non-Maori. The excess in the Maori rate is largely due to infants who die between the end of the fourth week of life and the first birthday. This is illustrated in the following table showing numbers and rates of infant deaths by race and age for the year 1972.
| Race | Under 1 Day | 1 Day and Under 1 Week | 1 Week and Under 28 Days | Total Under 28 Days | 28 Days and Under 12 Months | Total Under 1 Year |
|---|---|---|---|---|---|---|
| Non-Maori | 271 | 214 | 72 | 557 | 270 | 827 |
| Maori | 38 | 30 | 11 | 79 | 81 | 160 |
| All races | 309 | 244 | 83 | 636 | 351 | 987 |
| Rates per 1,000 Live Births | ||||||
| Non-Maori | 4.9 | 3.9 | 1.3 | 10.1 | 4.9 | 14.9 |
| Maori | 4.8 | 3.8 | 1.4 | 10.0 | 10.3 | 20.3 |
| All races | 4.9 | 3.9 | 1.3 | 10.1 | 5.6 | 15.6 |
The explanation of the higher rate for Maoris between the twenty-eighth day and the end of the first year is the susceptibility of the Maori baby in its home environment to forms of infection such as gastro-enteritis and pneumonia.
The infant mortality rates per 1,000 live births for the two sexes combined at different periods during the first year of life are now given for a series of years.
| Year | Non-Maori | Maori | ||||||||
|---|---|---|---|---|---|---|---|---|---|---|
| Under 1 Day | 1 Day and Under 2 Days | 2 Days and Under 1 Week | 1 Week and Under 28 Days | 28 Days and Under 12 Months | Under 1 Day | 1 Day and Under 2 Days | 2 Days and Under 1 Week | 1 Week and Under 28 Days | 28 Days and Under 12 Months | |
| 1962 | 6.2 | 2.0 | 3.0 | 1.2 | 5.6 | 6.6 | 3.4 | 2.5 | 2.5 | 23.8 |
| 1963 | 5.8 | 2.4 | 3.0 | 1.3 | 5.3 | 6.3 | 3.4 | 3.0 | 2 5 | 17.5 |
| 1964 | 6.6 | 2.3 | 2.1 | 1.3 | 5.2 | 7.7 | 1.6 | 1.6 | 1.8 | 17.3 |
| 1965 | 5.8 | 2.0 | 2.8 | 1.4 | 6.0 | 5.7 | 2.5 | 2.2 | 2.3 | 17.1 |
| 1966 | 5.9 | 1.8 | 2.0 | 1.4 | 5.1 | 6.5 | 2.0 | 2.4 | 1.5 | 15.5 |
| 1967 | 5.9 | 1.5 | 2.3 | 1.4 | 5.2 | 4.6 | 2.8 | 2.8 | 2.2 | 17.2 |
| 1968 | 6.2 | 1.7 | 2.5 | 1.5 | 5.4 | 5.2 | 2.1 | 1.8 | 2.1 | 16.2 |
| 1969 | 5.3 | 1.5 | 2.4 | 1.3 | 5.2 | 5.7 | 1.6 | 4.4 | 1.0 | 11.7 |
| 1970 | 4.8 | 1.6 | 2.2 | 1.1 | 5.3 | 7.0 | 1.9 | 3.7 | 2.4 | 13.4 |
| 1971 | 5.1 | 1.7 | 2.1 | 1.3 | 4.9 | 7.0 | 1.6 | 2.6 | 2.2 | 12.7 |
| 1972 | 4.9 | 1.6 | 2.3 | 1.3 | 4.9 | 4.8 | 1.3 | 2.5 | 1.4 | 10.3 |
The following diagram illustrates infant mortality rates.
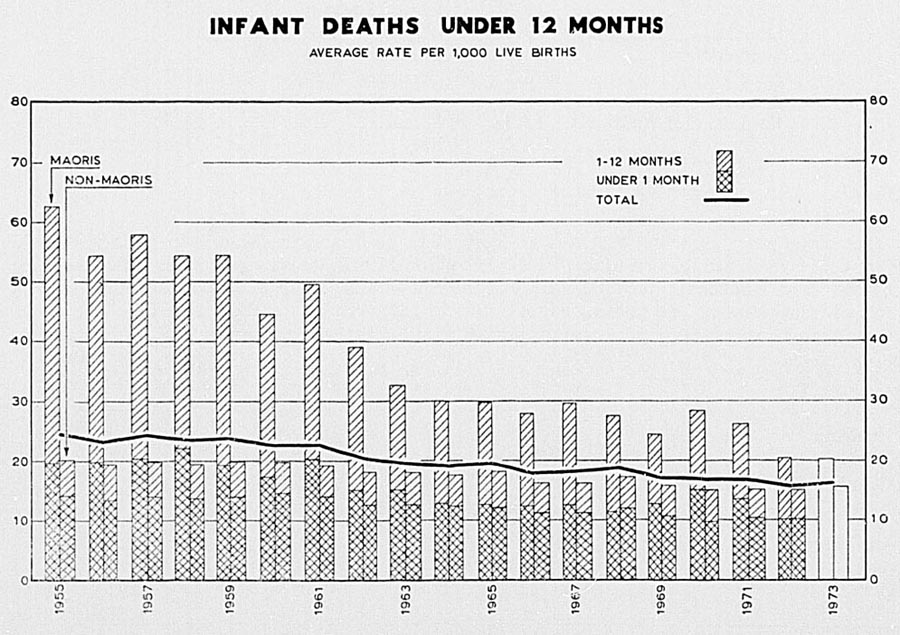
Causes of Infant Mortality—Deaths from the principal causes of infant mortality and the rate per 1,000 live births, are shown in the following table for 1972.
| Cause of Death | Number of Deaths | Rate per 1,000 Live Births | ||||
|---|---|---|---|---|---|---|
| Non-Maori | Maori | Total | Non-Maori | Maori | Total | |
| Influenza, pneumonia, and bronchitis | 89 | 30 | 119 | 1.6 | 3.8 | 1.9 |
| Gastro-enteritis, diarrhoea, also dysentery | 12 | 13 | 25 | 0.2 | 1.7 | 0.4 |
| Congenital anomalies | 178 | 20 | 198 | 3.2 | 2.5 | 3.1 |
| Neonatal disorders arising from certain diseases of the mother | 78 | 12 | 90 | 1.4 | 1.5 | 1.4 |
| Birth injury, difficult labour, and other anoxic and hypoxic conditions | 48 | 10 | 58 | 0.9 | 1.3 | 0.9 |
| Asphyxia of newborn unspecified | 29 | 6 | 35 | 0.5 | 0.8 | 0.6 |
| Haemolytic disease of newborn | 11 | - | 11 | 0.2 | - | 0.2 |
| Hyaline membrane disease | 32 | 4 | 36 | 0.5 | 0.6 | 0.6 |
| Immaturity and multiple pregnancy | 46 | 11 | 57 | 0.8 | 1.4 | 0.9 |
| All other causes | 304 | 54 | 358 | 5.5 | 6.9 | 5.7 |
| Total infant deaths | 827 | 160 | 987 | 14.9 | 20.3 | 15.6 |
PERINATAL MORTALITY—Perinatal deaths comprise still births and deaths in the first week of life. Numbers and rates are shown in the following table. The still births and the perinatal mortality rate are calculated per 1,000 total births (still births plus live births), while the death rate for the first week of life is calculated per 1,000 live births.
| Cause | Number | Rate | ||||||
|---|---|---|---|---|---|---|---|---|
| 1971 | 1972 | |||||||
| 1971 | 1972 | Non-Maori | Maori | Total | Non-Maori | Maori | Total | |
| Still births | 648 | 648 | 9.9 | 10.2 | 9.9 | 10.1 | 10.8 | 10.1 |
| Deaths under 1 week | 596 | 553 | 8.9 | 11.3 | 9.2 | 8.8 | 8.6 | 8.7 |
| Perinatal deaths | 1,244 | 1,201 | 18.7 | 21.4 | 19.10 | 8.7 | 19.4 | 18.8 |
MATERNAL DEATHS—Improvements in the standard of antenatal care and obstetrical skill, as well as advances in medical science, have reduced the numbers of deaths from septic abortion, puerperal sepsis, and toxaemia, and deaths from complications of childbirth are few. Maternal deaths during the latest 3 years are given in the following table.
| Cause | 1970 | 1971 | 1972 |
|---|---|---|---|
| Pre-eclampsia, eclampsia and toxaemia unspecified | 4 | - | 3 |
| Abortion | 1 | - | 1 |
| Complications of— | |||
| Pregnancy | 2 | 4 | - |
| Delivery | 6 | 3 | 3 |
| Puerperium | 7 | 7 | 3 |
| Totals | 20 | 14 | 10 |
DEATHS FROM EXTERNAL CAUSES—Deaths from external causes, apart from suicide, claim approximately 6 percent of the total deaths and again the Maori rate is higher than the non-Maori. The following table shows deaths from external causes for the 3 latest years classified according to the Intermediate List of the 1965 Revision of the Intermediate Classification. In this table, falls on board ship and from horseback are included as transport fatalities.
| Causes of Death | Number of Deaths | Rate per Million of Mean Population | ||||
|---|---|---|---|---|---|---|
| 1970 | 1971 | 1972 | 1970 | 1971 | 1972 | |
| *Includes drowning from water transport. | ||||||
| Motor-vehicle accidents | 649 | 674 | 719 | 230 | 235 | 247 |
| Other transport accidents | 43 | 42 | 33 | 15 | 15 | 11 |
| Accidental poisoning | 54 | 41 | 20 | 19 | 14 | 7 |
| Accidental falls | 440 | 454 | 527 | 156 | 158 | 181 |
| Accidents caused by machinery | 38 | 44 | 27 | 13 | 15 | 9 |
| Accidents caused by fire and explosion of combustible material | 33 | 28 | 36 | 12 | 10 | 12 |
| Accidents caused by hot substance, corrosive liquid, steam, and radiation | 4 | 7 | 7 | 1 | 2 | 2 |
| Accidents caused by firearms | 19 | 17 | 12 | 7 | 6 | 4 |
| Accidental drowning and submersion* | 147 | 135 | 108 | 52 | 47 | 37 |
| All other accidental causes | 118 | 118 | 116 | 42 | 41 | 40 |
| Homicide and injury purposely inflicted by other persons (not in war) | 34 | 25 | 30 | 12 | 9 | 10 |
| Totals | 1,579 | 1,585 | 1,635 | 562 | 553 | 561 |
Drownings are a leading cause of accidental death in New Zealand. Included in the preceding table for 1972 are 39 deaths from drowning due to accidents in water transport.
Transport Accidents—The number and rate of deaths resulting from railway, motor vehicle, and aircraft accidents during each of the last 11 years are as follows. Road accidents are further analysed in the section on Roads and Road Transport.
| Year | Deaths Due to Accident | Rate per 10,000 of Mean Population | ||||
|---|---|---|---|---|---|---|
| Railway | Motor Vehicle | Aircraft | Railway | Motor Vehicle | Aircraft | |
| 1962 | 27 | 408 | 11 | 0.11 | 1.64 | 0.04 |
| 1963 | 16 | 416 | 20 | 0.06 | 1.64 | 0.08 |
| 1964 | 26 | 428 | 30 | 0.10 | 1.65 | 0.12 |
| 1965 | 14 | 551 | 26 | 0.05 | 2.08 | 0.10 |
| 1966 | 13 | 567 | 16 | 0.05 | 2.11 | 0.06 |
| 1967 | 15 | 620 | 12 | 0.05 | 2.27 | 0.04 |
| 1968 | 10 | 548 | 16 | 0.04 | 1.99 | 0.06 |
| 1969 | 5 | 582 | 17 | 0.02 | 2.09 | 0.06 |
| 1970 | 11 | 649 | 20 | 0.04 | 2.31 | 0.07 |
| 1971 | 12 | 674 | 12 | 0.04 | 2.35 | 0.04 |
| 1972 | 9 | 719 | 10 | 0.03 | 2.47 | 0.03 |
Non-transport Accidents—The 1965 Revision of the International List makes provision for non-transport accidents (excluding therapeutic misadventure in treatment, complications following vaccination or inoculation, and late effects of injury and poisoning) to be grouped according to the place where the accident or poisoning occurred. The following table shows the deaths, both numbers and rates, for the latest 3 years, according to this classification.
| Place of Occurrence | Number | Rate per Million of Mean Population | ||||
|---|---|---|---|---|---|---|
| 1970 | 1971 | 1972 | 1970 | 1971 | 1972 | |
| Home (including home premises and vicinity and any non-institutional place of residence) | 328 | 350 | 392 | 116 | 122 | 134 |
| Farm (including buildings and land under cultivation, but excluding farm and home premises) | 53 | 58 | 37 | 19 | 20 | 13 |
| Mine and quarry | 12 | 4 | 6 | 4 | 1 | 2 |
| Industrial place and premises | 28 | 32 | 30 | 10 | 11 | 10 |
| Place for recreation and sport | 56 | 14 | 12 | 20 | 8 | 4 |
| Street and highway | 19 | 22 | 16 | 7 | 7 | 5 |
| Public building (building used by the general public or a particular group of the public) | 11 | 13 | 17 | 4 | 5 | 6 |
| Resident institution (homes, hospitals, etc.) | 142 | 139 | 142 | 50 | 49 | 49 |
| Other specified places | 100 | 93 | 113 | 35 | 32 | 39 |
| Place not specified | 57 | 57 | 68 | 20 | 20 | 23 |
| Totals | 806 | 782 | 833 | 286 | 273 | 286 |
Approximately 47 percent of fatal non-transport accidents occur in or about the home.
Falls are the chief cause of home fatalities, exacting a heavy toll of the aged and infirm. This is clearly illustrated in a special report on domestic accidents issued by the Department of Health in 1970. Another important cause of death in the home is asphyxia from regurgitation of food and inhalation of other objects, or mechanically from pillows and bedclothes; this is the principal hazard of the first 6 months of life, though a proportion of these deaths is probably due to some undisclosed and 2 years of age who fall into rivers, creeks, and ponds in the vicinity of the home.
Accidents with tractors are the main feature of fatalities on farms. Later sections deal with statistics of industrial and farm accidents.
Water Accidents—The following table shows drowning 1973.
| Locations | Age in Years | |||||
|---|---|---|---|---|---|---|
| Under 5 | 5-15 | 16-30 | 31-50 | Over 50 | Totals* | |
*Includes victims of unspecified age. † Public and Private. | ||||||
| Boating accidents | 1 | 5 | 15 | 12 | 4 | 37 |
| Rivers and streams | 9 | 16 | 10 | 4 | 5 | 44 |
| Seas and beaches | 1 | 4 | 5 | 4 | 4 | 20* |
| Harbours | - | - | 1 | 1 | 1 | 3 |
| Pools, ponds, troughs, sheep dips | 4 | 1 | - | - | - | 5 |
| Lakes and lagoons | 1 | 1 | 6 | - | - | 8 |
| Household bath | 1 | - | - | - | - | 1 |
| Swimming pools and baths† | 5 | 7 | 1 | - | 1 | 14 |
| Other | 2 | - | - | - | - | 2 |
| Total | 24 | 34 | 38 | 21 | 15 | 134 |
Suicide—The were 255 suicidal deaths of non-Maoris in 1972-170 males and 85 females—the death rate per 100,000 of population being 12.7 for males and 6.3 for females. For Maoris there were 7 suicidal deaths—3 males and 4 females—the death rates per 100,000 of population being 2.5 for males and 3.4 for females.
Rates per 100,000 of population showing the age distributions, averaged over the years 1970 to 1972, are shown next for the total population, by age groups.
| Sex | Age Group (Years) | |||||||||||||||
|---|---|---|---|---|---|---|---|---|---|---|---|---|---|---|---|---|
| 5-9 | 10-14 | 15-19 | 20-24 | 25-29 | 30-34 | 35-39 | 40-44 | 45-49 | 50-54 | 55-59 | 60-64 | 65-69 | 70-74 | 75-79 | 80+ | |
| Males | 0.2 | 1.1 | 7.9 | 12.6 | 9.3 | 11.7 | 15.3 | 23.4 | 21.7 | 25.3 | 22.7 | 19.1 | 23.4 | 33.3 | 30.0 | 13.0 |
| Females | - | 0.2 | 2.6 | 7.0 | 6.7 | 6.4 | 6.7 | 7.7 | 10.3 | 14.8 | 16.4 | 15.4 | 15.4 | 15.0 | 7.5 | 7.0 |
These figures show the typical increase in the suicide rates with increasing age and the fall in the rates after the age of 75.
The next table presents the average, over 3-yearly periods, and most recent years, of standardised mortality ratios of suicides, standardised on years 1950-52 = 100.
| Annual Average During | Males | Females |
|---|---|---|
| 1962-64 | 83 | 136 |
| 1965-67 | 95 | 142 |
| 1968-70 | 98 | 147 |
| 1971 | 78 | 137 |
| 1972 | 89 | 135 |
GENERAL—Marriage may be solemnised in New Zealand either by a minister included in the list of officiating ministers under the Marriage Act 1955, or before a duly appointed Registrar or Deputy Registrar of Marriages. A licence must be obtained from a Registrar of Marriages before a marriage by an officiating minister can be solemnised. Marriage by an officiating minister may be solemnised at any time between 6 o'clock in the morning and 8 o'clock in the evening. Marriage before a Registrar can be solemnised at any time during the hours the office of the Registrar is open for the transaction of public business; notice of intended marriage must be given to a Registrar of Marriages by one of the parties to the proposed marriage.
In the case of a person under 20 years of age, not being a widow or widower, the consent of parents or guardian is necessary. Consent of a Magistrate may be sought in cases of refusal by any person whose consent is required.
Since 1933 the minimum age for marriage has been 16 years of age. No marriage shall be deemed to be void, however, by reason only of an infringement of the minimum age.
Since 1 April 1952 it has been required under the Maori Purposes Act 1951 that every marriage to which a Maori is a party shall be solemnised in the same manner, and its validity shall be determined by the same law, as if each of the parties was a non-Maori.
Particulars regarding divorce will be found later in this subsection.
NUMBERS AND RATES—The numbers of marriages and rates during the last 21 years are now given.
| Year | Number | Rate per 1,000 of Population |
|---|---|---|
| 1954 | 17,557 | 8.38 |
| 1955 | 17,795 | 8.32 |
| 1956 | 17,531 | 8.03 |
| 1957 | 17,614 | 7.89 |
| 1958 | 18,305 | 8.01 |
| 1959 | 18,315 | 7.84 |
| 1960 | 18,909 | 7.96 |
| 1961 | 19,426 | 8.01 |
| 1962 | 19,572 | 7.88 |
| 1963 | 19,856 | 7.83 |
| 1964 | 20,720 | 8.00 |
| 1965 | 21,702 | 8.23 |
| 1966 | 22,949 | 8.55 |
| 1967 | 23,515 | 8.62 |
| 1968 | 24,057 | 8.74 |
| 1969 | 24,971 | 8.98 |
| 1970 | 25,953 | 9.20 |
| 1971 | 27,199 | 9.50 |
| 1972 | 26,868 | 9.21 |
| 1973 | 26,274 | 8.82 |
| 1974 | 25,418 | 8.35 |
Comparison with Other Countries—Marriage rates for certain countries for 1973 are given below. (Source: United Nations Monthly Bulletin of Statistics.)
| Country | Rate per 1,000 Mean Population |
|---|---|
| *Figures relate to 1972. | |
| Australia | 8.6 |
| Austria | 6.6 |
| Belgium | 7.6 |
| Canada | 8.9 |
| Finland | 7.5 |
| France | 7.7 |
| Germany, East | 8.1 |
| Germany, West | 6.4 |
| Hungary | 9.8 |
| Ireland, Republic | 7.5 |
| Israel | 9.5* |
| Italy | 7.6 |
| Jamaica | 4.5 |
| Japan | 10.0 |
| Netherlands | 8.0 |
| New Zealand | 8.8 |
| Norway | 7.0 |
| Spain | 7.7 |
| Sweden | 4.7 |
| Switzerland | 6.2 |
| United Kingdom | 8.6* |
| United States | 10.9 |
| Yugoslavia | 8.8 |
MARITAL STATUS PRIOR TO MARRIAGE—The following table gives marital status prior to marriage for the latest 5 years.
| Year | Single | Widowed | Divorced | Total Persons Married | |||
|---|---|---|---|---|---|---|---|
| Bridegroom | Bride | Bridegroom | Bride | Bridegroom | Bride | ||
| 1969 | 22,168 | 22,339 | 981 | 1,023 | 1,822 | 1,609 | 49,942 |
| 1970 | 23,003 | 23,110 | 1,002 | 1.035 | 1,948 | 1,808 | 51,906 |
| 1971 | 24,014 | 24,195 | 1,000 | 1,049 | 2,185 | 1,955 | 54,398 |
| 1972 | 23,607 | 23,661 | 1,017 | 1,081 | 2,244 | 2,126 | 53,736 |
| 1973 | 22,768 | 22,970 | 1,020 | 1,039 | 2,486 | 2,265 | 52,548 |
The nature of the marriage according to marital status of persons prior to marriage is given next.
| Year | Marriages Between Bachelors and | Marriages Between Widowers and | Marriages Between Divorced Men and | ||||||
|---|---|---|---|---|---|---|---|---|---|
| Spinsters | Widows | Divorced Women | Spinsters | Widows | Divorced Women | Spinsters | Widows | Divorced Women | |
| 1969 | 21,142 | 270 | 756 | 231 | 498 | 252 | 966 | 255 | 601 |
| 1970 | 21,826 | 261 | 916 | 261 | 514 | 227 | 1,023 | 260 | 665 |
| 1971 | 22,814 | 255 | 945 | 248 | 502 | 250 | 1,133 | 292 | 760 |
| 1972 | 22,310 | 263 | 1,034 | 218 | 529 | 270 | 1,133 | 289 | 822 |
| 1973 | 21,426 | 253 | 1,089 | 244 | 526 | 250 | 1,300 | 260 | 926 |
During the years 1938-40 there were 95 male divorcees who remarried for every 100 female divorcees who remarried. In the period 1969-73 more male divorcees than female divorcees remarried.
The number of widows per 100 widowers who remarried was 67 in 1938-40, but with a changed social outlook the position in 1969-73 was that 104 widows remarried for every 100 widowers.
AGES OF PERSONS MARRIED—The proportion of minors among persons marrying has been increasing over a fairly long period of years. On 1 January 1971 the age of majority was lowered from 21 to 20 years of age. In 1973 one bride in every three was under 20 years of age, the proportion of grooms being one in eleven.
Of the persons married in 1973 10,738 or 20.43 percent, were under 20 years of age; 25,495 or 48.52 percent, were returned as 20-24 years; 8,017 or 15.26 percent, as 25-29 years, 3,959 or 7.53 percent, as 30-39 years; and 4,339 or 8.26 percent, as 40 years of age or over.
The following table relates to the 1973 year.
| Age of Bridegroom, in Years | Age of Bride, in Years | Total Bridegrooms | ||||||
|---|---|---|---|---|---|---|---|---|
| Under 20 | 20-24 | 25-29 | 30-34 | 35-39 | 40-44 | 45 and Over | ||
| Under 20 | 1,886 | 366 | 13 | 5 | 3 | - | - | 2,273 |
| 20-24 | 5,700 | 7,440 | 583 | 68 | 12 | 2 | 2 | 13,807 |
| 25-29 | 745 | 3,003 | 1,211 | 212 | 37 | 12 | 3 | 5,223 |
| 30-34 | 89 | 582 | 582 | 257 | 84 | 31 | 14 | 1,639 |
| 35-39 | 30 | 180 | 215 | 185 | 114 | 48 | 26 | 798 |
| 40-44 | 10 | 69 | 105 | 141 | 116 | 102 | 83 | 626 |
| 45 and over | 5 | 48 | 85 | 130 | 15S | 245 | 1,237 | 1,908 |
| Total brides | 8,465 | 11,688 | 2,794 | 998 | 524 | 440 | 1,365 | 26,274 |
The following table shows since 1950 the proportions of men and women married at each age group to every 100 marriages.
| Period | Under 21* | 21-24* | 25-29 | 30-34 | 35-39 | 40-44 | 45 and Over | Totals |
|---|---|---|---|---|---|---|---|---|
| *Under 20 and 20-24 respectively from 1971. | ||||||||
| Males | ||||||||
| 1950-54 | 5.05 | 35.42 | 31.21 | 10.95 | 5.86 | 3.56 | 7.95 | 100.0 |
| 1955-59 | 7.18 | 36.68 | 29.44 | 11.21 | 4.81 | 2.97 | 7.71 | 100.0 |
| 1960-64 | 10.95 | 41.99 | 23.49 | 9.04 | 4.50 | 2.62 | 7.41 | 100.0 |
| 1965-69 | 15.23 | 44.79 | 21.24 | 6.31 | 3.46 | 2.34 | 6.63 | 100.0 |
| 1971 | 9.05* | 54.92* | 18.54 | 5.74 | 2.76 | 2.13 | 6.86 | 100.0 |
| 1972 | 8.83* | 53.90* | 19.03 | 6.17 | 2.83 | 2.16 | 7.08 | 100.0 |
| 1973 | 8.65 | 52.55 | 19.88 | 6.24 | 3.04 | 2.38 | 7.26 | 100.0 |
| Females | ||||||||
| 1950-54 | 25.78 | 38.65 | 16.85 | 6.96 | 4.12 | 2.59 | 5.05 | 100.0 |
| 1955-59 | 32.99 | 35.71 | 13.76 | 6.11 | 3.65 | 2.49 | 5.29 | 100.0 |
| 1960-64 | 39.63 | 35.19 | 10.13 | 4.42 | 3.05 | 2.21 | 5.37 | 100.0 |
| 1965-69 | 45.33 | 33.62 | 9.08 | 3.05 | 2.10 | 1.81 | 5.01 | 100.0 |
| 1971 | 32.05* | 47.73* | 8.85 | 3.01 | 1.67 | 1.54 | 5.15 | 100.0 |
| 1972 | 32.33* | 45.95* | 9.44 | 3.65 | 1.88 | 1.55 | 5.20 | 100.0 |
| 1973 | 32.22 | 44.49 | 10.63 | 3.80 | 1.99 | 1.67 | 5.20 | 100.0 |
The average ages (arithmetic mean) at marriage for both males and females are shown in the following table.
| Year | Average Age at Marriage | |
|---|---|---|
| Bridegrooms | Brides | |
| 1963 | 27.93 | 24.63 |
| 1964 | 27.74 | 24.45 |
| 1965 | 27.43 | 24.24 |
| 1966 | 26.76 | 23.65 |
| 1967 | 26.53 | 23.45 |
| 1968 | 26.33 | 23.29 |
| 1969 | 26.45 | 23.56 |
| 1970 | 26.36 | 23.45 |
| 1971 | 26.25 | 23.40 |
| 1972 | 26.38 | 23.54 |
| 1973 | 26.54 | 23.68 |
The average ages of bachelors and spinsters at marriage are considerably lower than those shown in the preceding table, which covers all parties and is naturally affected by the inclusion of remarriages of widowed and divorced persons. The average ages of grooms and brides for each of the latest 5 years according to marital status were as shown in the next table.
| Year | Bridegrooms | Brides | ||||
|---|---|---|---|---|---|---|
| Bachelors | Divorced | Widowers | Spinsters | Divorced | Widows | |
| Age in Years | ||||||
| 1969 | 23.90 | 41.02 | 57.06 | 21.36 | 37.03 | 50.45 |
| 1970 | 23.85 | 40.37 | 56.85 | 21.26 | 36.13 | 50.07 |
| 1971 | 23.65 | 40.33 | 57.64 | 21.19 | 36.02 | 50.91 |
| 1972 | 23.73 | 40.06 | 57.64 | 21.20 | 35.80 | 50.67 |
| 1973 | 23.76 | 39.29 | 57.45 | 21.30 | 35.12 | 51.39 |
The foregoing figures give the average age at marriage, but these do not correspond with the modal or popular age, if the age at which the most marriages are celebrated may be so termed. The modal age for brides in 1973 was 20 years. In the case of bridegrooms the most popular age has varied and for recent years it has been 21 to 24; in 1973, it was 21 years.
Marriage of Minors—Of every 1,000 men married in 1973, 87 were under 20 years of age, while 322 in every 1,000 brides were under 20. Since 1 January 1971 the age of majority has been 20 years.
In 1,886 marriages in 1973 both parties were given as under 20 years of age, in 6,579 marriages the bride was returned as a minor and the bridegroom as an adult, and in 387 marriages the bridegroom was a minor and the bride an adult.
The proportion of minors among persons marrying has been increasing over a fairly long period, and in the table below figures are given for the last 5 years.
| Year | Age in Years | Total Minors | |||||||
|---|---|---|---|---|---|---|---|---|---|
| 16 | 17 | 18 | 19 | 20 | 16-20 Years | 16-19 Years | Rate per 100 Marriages 16-20 Years | Rate per 100 Marriages 16-19 Years | |
| Bridegrooms | |||||||||
| 1969 | 29 | 197 | 657 | 1,175 | 1,997 | 4,055 | 2,058 | 16.24 | 8.24 |
| 1970 | 27 | 193 | 679 | 1,226 | 2,115 | 4,240 | 2,125 | 16.34 | 8.19 |
| 1971 | 34 | 251 | 718 | 1,458 | 2,552 | 5,013 | 2,461 | 18.43 | 9.05 |
| 1972 | 40 | 229 | 711 | 1,392 | 2,604 | 4,976 | 2,372 | 18.52 | 8.83 |
| 1973 | 30 | 246 | 679 | 1,318 | 2,535 | 4,808 | 2,273 | 18.30 | 8.65 |
| Brides | |||||||||
| 1969 | 624 | 1,338 | 2,287 | 3,364 | 3,686 | 11,299 | 7,613 | 45.25 | 30.49 |
| 1970 | 626 | 1,439 | 2,457 | 3,520 | 3,825 | 11,867 | 8,042 | 45.72 | 30.99 |
| 1971 | 697 | 1,607 | 2,756 | 3,657 | 4,169 | 12,886 | 8,717 | 47.38 | 32.05 |
| 1972 | 748 | 1,494 | 2,732 | 3,712 | 4,114 | 12,800 | 8,686 | 47.64 | 32.33 |
| 1973 | 693 | 1,445 | 2,680 | 3,647 | 3,889 | 12,354 | 8,465 | 47.00 | 32.22 |
MARRIAGES BY MINISTERS OF VARIOUS CHURCHES—Of the 26,274 marriages performed in 1973, Anglican clergymen officiated at 6,425, Presbyterians at 5,710, Roman Catholics at 3,884, Methodists at 1,897, and clergymen of other churches at 2,042, while 6,316 marriages were solemnised by Registrars.
The following table shows the proportions of marriages by ministers of the largest churches and before Registrars in each of the 7 latest years.
| Church | Percentage of Marriages | ||||||
|---|---|---|---|---|---|---|---|
| 1967 | 1968 | 1969 | 1970 | 1971 | 1972 | 1973 | |
| Anglican | 26.14 | 26.64 | 25.95 | 26.39 | 25.64 | 25.07 | 24.45 |
| Presbyterian | 23.81 | 23.46 | 23.85 | 23.52 | 22.55 | 22.65 | 21.73 |
| Roman Catholic | 15.45 | 15.83 | 15.33 | 15.24 | 15.44 | 15.13 | 14.78 |
| Methodist | 8.19 | 7.96 | 8.00 | 7.69 | 7.39 | 6.85 | 7.22 |
| Others | 7.95 | 8.12 | 7.85 | 7.20 | 7.44 | 7.60 | 7.78 |
| Before Registrars | 18.46 | 17.99 | 19.02 | 19.96 | 21.54 | 22.70 | 24.04 |
| Totals | 100.00 | 100.00 | 100.00 | 100.00 | 100.00 | 100.00 | 100.00 |
The foregoing figures must not be taken as an exact indication of the religious professions of the parties married, as it does not necessarily follow that both (or even one) of the parties are adherents of the church whose officiating minister performed the ceremony, and persons married before Registrars may belong, in greater or lesser proportion, to any or none of the churches. Of the total population at the general census of 1971, 31.3 percent were recorded as adherents of the Anglican Church, 20.4 percent Presbyterian, 15.7 percent Roman Catholic, 6.4 percent Methodist, and 26.2 percent were of other religion or of no religion, or objected to stating their religious profession.
NUMBER OF OFFICIATING MINISTERS—The number of names on the list of officiating ministers under the Marriage Act was 41, 70 in February 1975 and the churches to which they belong are shown hereunder.
| Church | Number |
|---|---|
| Roman Catholic Church | 883 |
| Anglican (Church of England) | 736 |
| Presbyterian Church of New Zealand | 664 |
| Methodist Church of New Zealand | 336 |
| Baptist | 223 |
| Salvation Army | 244 |
| Ratana Church of New Zealand | 133 |
| Brethren | 135 |
| Latter Day Saints | 118 |
| Ringatu Church | 66 |
| Assemblies of God | 54 |
| Associated Churches of Christ | 63 |
| Jehovah's Witness | 76 |
| Seventh Day Adventist | 42 |
| Apostolic Church | 29 |
| Liberal Catholic Church | 20 |
| Christian Revival Crusade | 8 |
| Evangelical Lutheran Concordia Conference | 16 |
| Absolute Reformed Maori Church of Aotearoa | 13 |
| Congregational Union | 11 |
| Church of Te Kooti Rikirangi | 17 |
| Commonwealth Covenant Church | 11 |
| Reformed Churches of New Zealand | 14 |
| Evangelistic Church of Christ | 9 |
| Elim Church | 8 |
| Congregational Church of Samoa | 16 |
| Church of the Nazarene | 12 |
| Open Air Campaigners (NZ) | 10 |
| Others | 203 |
| Total | 4,170 |
The Ratana Church of New Zealand, the Ringatu Church, the United Maori Mission, and the Church of Te Kooti Rikirangi are Maori organisations.
DIVORCE AND OTHER MATRIMONIAL PROCEEDINGS—From 1 January 1969, some important changes have applied in the principal legislation on grounds for divorce; the period of 3 years was reduced to 2 years for separation by agreement and decree of separation or separation order, and in cases living apart and unlikely to be reconciled the period of 7 years was reduced to 4 years. This amendment to the Matrimonial Proceedings Act 1963 has had an accelerating effect on divorce statistics in 1969.
Divorce—A petition for divorce may be presented to the Supreme Court on one or more of several grounds, which include adultery, desertion, separation by agreement for not less than 2 years, separation by decree of separation or separation order for not less than 2 years, and the parties living apart for 4 years and not likely to be reconciled. Where the parties are separated or living apart one of the parties must have been resident in New Zealand for at least 2 years immediately preceding the filing of the petition. The Court is required to give consideration to the possibility of reconciliation of the parties to the marriage.
Petitions filed and decrees granted by the Supreme Court in recent years are shown in the following table.
| Year | Dissolution of Marriage* | Judicial Separation | |||
|---|---|---|---|---|---|
| Petitions Filed | Decrees Nisi | Decrees Absolute | Petitions Filed | Decrees for Separation | |
| *Includes nullity cases which are usually very few; they totalled only two in 1971, one in 1972, and one in 1973. | |||||
| 1963 | 2,138 | 1,842 | 1,905 | 15 | 7 |
| 1964 | 2,234 | 1,916 | 1,894 | 14 | 5 |
| 1965 | 2,440 | 2,050 | 1,814 | 6 | 1 |
| 1966 | 2,351 | 2,099 | 2,064 | 13 | 1 |
| 1967 | 2,554 | 2,263 | 2,047 | 13 | 1 |
| 1968 | 2,688 | 2,381 | 2,172 | 15 | 2 |
| 1969 | 4,108 | 3,496 | 2,996 | 10 | - |
| 1970 | 3,787 | 3,298 | 3,136 | 2 | 1 |
| 1971 | 4,072 | 3,522 | 3,347 | 2 | - |
| 1972 | 4,269 | 3,387 | 3,471 | 1 | - |
| 1973 | 4,830 | 3,950 | 3,616 | 3 | 3 |
The next table gives the grounds of petitions and decrees during the two latest years.
| Grounds | Petitions Filed | Decrees Absolute Granted | ||||||
|---|---|---|---|---|---|---|---|---|
| Husbands' Petitions | Wives' Petitions | Husbands' Petitions | Wives' Petitions | |||||
| 1972 | 1973 | 1972 | 1973 | 1972 | 1973 | 1972 | 1973 | |
| Adultery | 642 | 682 | 412 | 413 | 428 | 477 | 276 | 333 |
| Desertion | 136 | 53 | 108 | 138 | 143 | 109 | 104 | 94 |
| Separation by agreement | 1,067 | 1,212 | 1,086 | 1,279 | 859 | 888 | 933 | 925 |
| Separation by Court order or decree | 57 | 147 | 137 | 236 | 42 | 83 | 130 | 164 |
| Living apart | 303 | 304 | 290 | 320 | 271 | 242 | 266 | 279 |
| Non-consummation | 3 | 16 | 13 | 8 | 4 | 6 | 5 | 7 |
| Other | 4 | 6 | 11 | 16 | 3 | 3 | 7 | 6 |
| Totals | 2,212 | 2,420 | 2,057 | 2,410 | 1,750 | 1,808 | 1,721 | 1,808 |
The figures shown for decrees absolute cover all such granted during the year, whether the antecedent decree nisi was granted in the same or in a previous year. A decree nisi normally applies for at least 3 months before a decree absolute is granted.
In 725 of the 3,616 cases where decrees absolute were granted during 1973 there was no living issue of the marriage. The number of living issue was 1 in 655 cases, 2 in 955 cases, 3 in 676 cases, and 4 or more in 605 cases.
The table which follows shows the duration of marriage in all cases for which decrees absolute were granted in the latest 5 years.
| Duration of Marriage, in Years | Husbands' Decrees Absolute Granted | Wives' Decrees Absolute Granted | ||||||||
|---|---|---|---|---|---|---|---|---|---|---|
| 1969 | 1970 | 1971 | 1972 | 1973 | 1969 | 1970 | 1971 | 1972 | 1973 | |
| Under 5 | 128 | 164 | 184 | 216 | 191 | 138 | 182 | 188 | 168 | 221 |
| 5-9 | 410 | 427 | 478 | 465 | 514 | 462 | 489 | 538 | 592 | 574 |
| 10-14 | 291 | 191 | 310 | 343 | 397 | 303 | 305 | 341 | 358 | 386 |
| 15-19 | 222 | 219 | 221 | 266 | 242 | 216 | 206 | 197 | 228 | 258 |
| 20-29 | 317 | 332 | 350 | 335 | 345 | 278 | 296 | 325 | 312 | 305 |
| 30 and over | 133 | 139 | 128 | 125 | 119 | 98 | 91 | 87 | 63 | 64 |
| Totals | 1,501 | 1,472 | 1,671 | 1,750 | 1,808 | 1,495 | 1,569 | 1,676 | 1,721 | 1,808 |
The number of living issue affected by the decrees absolute of their parents during each of the last 5 years were as follows: 1969, 5,604; 1970, 5,927; 1971, 6,635; 1972, 6,872; and 1973, 7,457.
The following table shows the duration of marriage by ages of husbands and wives at the time of marriage, for cases in which decrees absolute were granted in 1973.
| Duration of Marriage (in Years) | Age (in Years) at Marriage | |||||||
|---|---|---|---|---|---|---|---|---|
| Under 20 | 20-24 | 25-29 | 30-34 | 35-39 | 40-44 | 45 and over (Including not Stated) | Total | |
| Husbands | ||||||||
| Under 5 | 41 | 223 | 70 | 24 | 19 | 11 | 24 | 412 |
| 5-9 | 200 | 543 | 186 | 58 | 34 | 17 | 50 | 1,088 |
| 10-14 | 91 | 420 | 164 | 39 | 25 | 20 | 24 | 783 |
| 15-19 | 27 | 265 | 134 | 36 | 15 | 13 | 10 | 500 |
| 20 and over | 28 | 446 | 250 | 76 | 17 | 9 | 7 | 833 |
| Totals | 387 | 1,897 | 804 | 233 | 110 | 70 | 115 | 3,616 |
| Wives | ||||||||
| Under 5 | 150 | 172 | 38 | 17 | 12 | 4 | 19 | 412 |
| 5-9 | 534 | 400 | 53 | 30 | 13 | 20 | 38 | 1,088 |
| 10-14 | 331 | 329 | 57 | 20 | 25 | 3 | 18 | 783 |
| 15-19 | 192 | 218 | 51 | 21 | 7 | 4 | 7 | 500 |
| 20 and over | 228 | 445 | 109 | 31 | 12 | 3 | 5 | 833 |
| Totals | 1,435 | 1,564 | 308 | 119 | 69 | 34 | 87 | 3,616 |
Dissolution of a Voidable Marriage—A decree of dissolution of a voidable marriage puts an end to the marriage from the date of the decree. On average there are only about 40 such decrees in New Zealand each year and the principal ground is non-consummation.
CONCILIATION PROCESSES—Under the Domestic Proceedings act 1968, the principle was introduced of having specialist magistrates to exercise jurisdiction in domestic matters. The Act aims to encourage by all practicable means the reconciliation of married couples who institute court proceedings. Domestic proceedings became a separate division from civil and criminal proceedings in Magistrates' Courts. (See Section 8: Justice.)
There is a Court Conciliation Centre in Auckland providing a full-time conciliation service for cases referred by the Magistrates' Courts. In 18 other centres local marriage guidance councils make available to the courts in their areas their more experienced counsellors to provide trained help to those involved in domestic proceedings. Through these agencies it is possible to offer specialist help in over 80 percent of cases in this category.
MARRIAGE GUIDANCE—A National Marriage Guidance Council was established in 1950 as a voluntary agency to assist with social problems arising from unhappy or maladjusted marriages. From 1959 to 1968 an adviser in marriage guidance was attached to the staff of the Justice Department. An advisory committee was also set up to keep Government informed and to organise, with the assistance of appropriate professional groups, a programme for the selection, training, and accrediting of voluntary marriage counsellors. Although the training system is kept under constant review, the procedures followed have become well established and administration has now been taken over largely by the National Council with the support and advice of the department.
There are now 24 councils affiliated to the National Marriage Guidance Council and these provide counselling centres staffed by over 130 accredited counsellors and some 60 counsellors in training. Accredited counsellors, in many centres, assist the courts by serving as conciliators under the Domestic Proceedings Act. (See also Section 8, Justice.)
The National Marriage Guidance Council employs a full-time director to organise and co-ordinate the work of affiliated councils. There are also seven directors employed by the larger of the local councils. These appointments, were necessary because of the rapid development of the Marriage Guidance Service.
Educational work includes the conducting of courses for young couples in preparation for marriage, and parent groups. Secondary schools have been assisted by local marriage guidance councils with the arranging of courses in personal relationships. In many cases tutors are recruited and trained by local councils.
The marriage guidance service is readily available to those whose marriages are in difficulty. There is a growing recognition by the public of the importance of this service and a greater readiness of people in trouble to make use of it.
GENERAL—Responsibility for the nation's health is undertaken by a partnership of central and local government, private medical practitioners, para-medical workers, charitable and religious organisations and private citizens, with Central Government providing encouragement, financial assistance and incentives, and assuming final responsibility. This has been a deliberate policy of successive Governments, although emphases have varied from time to time according to political and economic conditions and demands for specific services. Growing urbanisation and industrialisation, with consequent intensification of the problems of pollution of water, air, and land, are imposing a current emphasis nationally and locally on environmental health.
Public health services have to do with environmental health, communicable diseases and quarantine, occupational health and toxicology, food and nutrition, health education, family health, dental services and certain aspects of nursing. In the case of environmental health the concern of the Department of Health and local authorities is with matters such as the provision and protection of public water supplies, sewage treatment and disposal, food hygiene and housing standards. Its objectives are the maintenance of a healthy environment by the application of the principles of preventive medicine.
The functions of local authorities are defined by statute and regulation Elected local authorities must, under the Health Inspectors Qualifications Regulations 1958. appoint a sufficient number of qualified health inspectors. Where a local authority is too small to need a separate, full-time inspector, the Act permits two or more to combine to share the cost. In sonic smaller sparsely-populated districts where a local authority does not employ its own inspector, the departmental inspectors of health do the work and the authority pays for it. Only 25 percent of inspectors are employed by the department.
In each of the 18 health districts, the medical officer of health, who is a medical practitioner with special qualifications in public health, is the adviser to all local authorities in his district: in some cases his approval is required before action can be taken by a local authority, and in others he is the first line of appeal against its decisions. He is required to keep the Director-General of Health and the Board of Health informed of local authority deficiencies in their responsibilities under the Health Act.
Scheduled communicable diseases must be notified by doctors and hospitals to the medical officer of health who is responsible for control measures; within this area the local authority health inspector is subject to his direct supervision and control. New programmes of immunisation are undertaken by the department and, when established, vaccines arc provided free and the general practitioner encouraged in this work. Quarantine arrangements for both aircraft and ships comply with obligations under the International Health Regulations. Medical officers of health administer this service. The broad objective is the control of communicable and chronic diseases in man and the keeping of New Zealand free of quarantinable diseases.
The health of industrial and agricultural workers is the care of the Department of Health in conjunction with the Department of Labour, including co-operation in accident prevention. The aim is to prevent occupational disease, control toxic hazards, and raise standards of first-aid services. Agricultural health includes attention to the safe use of agricultural chemicals.
Food and nutrition administration aims to protect the consumer. There is an extensive programme backed by legislation, to govern packing, labelling, storage, and sale of poisons. Special environmental problems, including radiation protection, occupational health, and atmosphere pollution, are also the responsibility of the Department of Health.
The objectives of health education programmes are to increase understanding of the value of health, to inform people of health services available, and to equip them with knowledge and skills they can use to solve health problems.
Maternal and child health responsibilities include licensing and supervision of maternity hospitals; medical and nursing supervision of infant, pre-school, and school children; inspection of schools and child care centres; immunisation of infants against poliomyelitis, etc.; and the administration of regulations bearing on home safety.
A dental service, directed by dental officers and staffed by dental nurses, provides regular dental treatment for all pre-school, primary, and intermediate school children. Arrangements with private dental practitioners ensure similar treatment for adolescents up to the age of 16 years. Dental health education is also undertaken.
The Department of Health is responsible for the organisation and control of nursing services to the public in general; in hospitals (public or private); in homes for the aged, incapacitated, or infirm; or in any other places where the Department of Health has statutory responsibility. Considerable delegation has taken place mainly to hospital boards whose chief nursing officer is responsible to the chief medical officer for the day-to-day administration of the services provided. The department reviews nursing services in public and departmental hospitals, district nursing services, and public health nursing services.
Nursing education is provided in 55 schools of nursing in New Zealand and there are normally about 7,000 students undertaking basic nursing programmes. The Department of Health organises and controls the School of Advanced Nursing Studies.
Within its public health nursing service, the department employs over 300 well-qualified nurses. Infant welfare occupies a high proportion of their time, but other work includes child health programmes in schools.
Scientific support for State health activities comes from the National Health Institute, the Medical Research Council, the Department of Scientific and Industrial Research, and the research institutes of the Ministry of Agriculture and Fisheries. Standards of professional education are established by the appropriate professional councils or boards on which the department is represented, while training is conducted by universities (doctors, dentists, engineers, etc.); hospital boards or the department (nurses, midwives, physiotherapists, health educators, laboratory technicians, radiographers, dietitians); and polytechnics (health inspectors, pharmacists).
The Department of Health works closely with and seeks the advice and help of boards, committees, and councils such as the Board of Health, Medical Research, Dental, Hospitals Advisory Pharmacy, Nursing, and Radiological Advisory Councils, the Hospital Works, Medical Services Advisory Committees, and the Dietitians, Physiotherapy, Occupational Therapy, Opticians, and Plumbers and Gasfitters Boards. In all, officers of the department serve on over 100 boards, committees, and other organisations concerned with health.
In addition, there are very close working relationships with professional and other associations, voluntary health and welfare agencies, the universities, and other Government departments.
In addition to the Health Act 1956, the following Acts are administered by the department:
| Burial and Cremation Act 1964 |
| Children's Health Camps Act 1972 |
| Clean Air Act 1972 |
| Dental Act 1963 |
| Dietitians Act 1950 |
| Food and Drug Act 1969 |
| Hospitals Act 1957 |
| Human Tissue Act 1964 |
| Maternal Mortality Research Act 1968 |
| Medical and Dental Auxiliaries Act 1966 |
| Medical Practitioners Act 1968 |
| Medical Research Council Act 1950 |
| Mental Health Act 1969 |
| Narcotics Act 1965 |
| Nurses Act 1971 |
| Occupational Therapy Act 1949 |
| Opticians Act 1928 |
| Physiotherapy Act 1949 |
| Plumbers and Gasfitters Registration Act 1964 |
| Poisons Act 1960 |
| Radiation Protection Act 1965 |
| Social Security Act 1964 (Part II) |
| Tuberculosis Act 1948 |
A detailed report of the activities of the Department of Health is given in the annual report of the Director-General of Health (parliamentary paper E. 10).
A general history of public health services may be found in A Health Service for New Zealand (parliamentary paper H. 23, 1974). This report contains radical proposals for a reshaped health service to come into operation on 1 April 1978.
| Activity Programme | 1971-72 | 1972-73 | 1973-74 |
|---|---|---|---|
*Mostly grants to hospital boards. †Mostly grants of Medical Benefits under Social Security Act. ‡The Government provides a subsidy of $1 for $2 on the total cost of approved works for main water supply facilities, sewerage reticulation am. sewerage disposal schemes which have been put into effect by local authorities. Expenditure in the three years above was $1,769,383, $3,090,079 and $5,064,589 respectively. §Expenditure funded from Works and Trading Account was previously provided for in Vote—Works. | |||
| $(000) | |||
| Administrative services | 2,494 | 2,766 | 3,164 |
| Dental services | 9,576 | 10,609 | 11,837 |
| Hospital services* | 207,233 | 242,365 | 282,106 |
| Family health services | 5,404 | 5,511 | 5,783 |
| Medical research | 1,167 | 1,353 | 2,511 |
| Medical services and drug control† | 53,126 | 64,043 | 76,634 |
| Public health and environmental protection | 6,089 | 7,331 | 10,240‡ |
| Welfare services | 3,711 | 5,597 | 6,769 |
| Funded from Consolidated Revenue Account | 288,800 | 339,575 | 399,044 |
| Psychiatric hospital buildings | - | - | 2,777 |
| Public buildings construction | - | - | 59 |
| Funded from Works and Trading Account | - | - | 2,836§ |
| Totals | 288,800 | 339,575 | 401,880 |
| Less departmental receipts | 1,099 | 757 | 785 |
| Net expenditure | 287,701 | 338,818 | 401,095 |
| Expenditure as percentage of gross national product | 4.4 | 4.6 | 4.7 |
ENVIRONMENTAL HEALTH: Local Authority Control—The provision and proper maintenance of public water supplies and sewerage systems, the disposal of refuse, the condition of dwellinghouses, the control of offensive trades, and the hygiene of premises in which food is manufactured and sold, including eating houses, are primarily the responsibility of local authorities, but the Department of Health exercises general supervision. In the case of some of the smaller local authorities the necessary inspections are made by departmental inspectors on behalf of and by arrangement with the local authorities. The department undertakes the basic training of health inspectors employed by local authorities and conducts specialist and refresher courses for health inspectors.
Department of Health Control—The objectives of the Department of Health in environmental health control are: (a) to create and maintain a healthy environment for the general public by the application of principles of preventive medicine and the administration of legislation directly and indirectly related to this end; (b) to control air pollution; (c) to provide physical services and undertake research on all aspects of the use of ionising radiation with special emphasis on the medical applications and public health aspects. To monitor radiation exposure of the population from all sources and to take action to reduce this where necessary. To promote general understanding of the nature of the hazards involved in radiation exposure in their current perspective; and (d) to conserve hearing and detect its early deterioration.
Air Pollution Control—Air pollution has been a growing health problem with advancing urbanisation and the rising consumption of energy for industrial activity and transport. The Clean Air Act 1972 provides for the control of all sources of air pollution, both existing and potential. Placing considerable emphasis on co-operation among Central Government, local authorities, industry, and the public, the Act in effect imposes on every person an obligation to minimise his interference with the air environment.
It provides for a technical advisory body, the Clean Air Council, which as its first task will advise the Government on the desirability of immediate regulations to control pollution from motor vehicles. The Act also seeks to integrate the work of local authorities in pollution control by making available to them the specialist technical knowledge that only Central Government can provide. General provisions in the Act provide for the control of industrial sources of pollution to a standard as high as that attained in any other country. Special provisions concern the setting up of clean air zones. They are a recognition that in some parts of the country, where ventilation by natural process is poor, the smoke from domestic fires is an important air pollution problem. The clean air zone provisions make it possible for a local authority to tackle this problem where it has the support of local residents.
A general duty is imposed by the Act on occupiers of industrial or trade premises to take certain steps designed to reduce air pollution. Certain provisions apply in respect of locomotive engines, aircraft, hovercraft, and motor vehicles, and power is taken to make regulations designed to minimise the emission of air pollutants from these sources. Special provision is also made for ships. Standards may be prescribed in respect of the emission of air pollutants by any trade, industry process, fuel burning equipment, or industrial plant. Failure to observe these standards will be an offence unless the occupier of the relevant premises is exempted by the Director-General of Health.
There are 26 classes of process requiring registration and they include the control of odours and the supervision of rendering processes. Most registrable processes are governed by the requirement to adopt the best practicable means to control noxious discharges and emissions, but there are limiting standards for lead and acid gases. All new installations or extensions of these registrable processes require approval by the Department of Health.
Some 250 works are registered and regularly inspected by chemical inspectors. Industries not registered are the responsibility of local authorities. New industrial plants being established in New Zealand are required to meet standards as rigorous as any in the world for industrial sources of air pollution.
CONTROL OF DRUGS—The definitions of “drug” in the Food and Drug Act 1969 establish groups to which differing provisions apply. Therapeutic drugs, that is those substances or mixtures whether used internally or externally for the diagnosis, prevention, or treatment of any illness or injury of the human body or for modifying any physiological process or desires or emotions, and chemical contraceptives are required, before being introduced commercially, to be “acceptable”, according to a procedure under the Food and Drug Act. No new therapeutic drug may be distributed in New Zealand without the consent of the Minister of Health, under sections 12 and 13 of the Act.
This Act also requires that any drug which has been changed in any way, in use, strength, or labelling must not be distributed until 90 days after notice of the change has been given to the Director-General of Health. He may consent to earlier distribution of a changed drug if he is satisfied of the drug's safety. If the Director-General considers the change to be of such character or degree that the drug ought not to be distributed without the consent of the Minister, the drug is referred to the Minister and may not be distributed until the Minister's specific consent has been obtained. A new therapeutic drug is also restricted to sale from pharmacies only, unless special authority is given for general distribution in a schedule to the Therapeutic Drugs (permitted sales) Regulations 1970.
A cosmetic, dentifrice, detergent, disinfectant, or antiseptic does not have to be “cleared” for marketing unless claims in labelling or advertising bring it within the definition of a “therapeutic drug”.
As in the case of food, the Food and Drug Act 1969 provides for the analysis of any drug, which may be sold, offered for sale, or exposed for sale, and for the inspection of any place where there is any drug intended for sale. Measures provide for the prevention of adulteration and for the inspection of places where drugs are manufactured or packed. Control over medical advertisements and publicity is also incorporated in this legislation.
Under the Poisons Act 1960 and the Poisons Regulations 1964, certain drugs may not be sold to the public except on the prescription of a doctor, a dentist, or a veterinary surgeon. This legislation also requires specific warning statements to be included in the labelling of certain drugs such as the antihistamines, aspirin, phenacetin, paracetamol, and hexaclorophane.
Narcotics—Under the Narcotics Act 1965, and the Narcotics Regulations 1966, the Director-General of Health is the competent authority for the purpose of the international conventions and for the oversight of the legitimate distribution and use of narcotics within the country. Written approval of the Minister of Health is required for the import or export of cannabis, desomorphine, heroin, ketobemicone, etorphine, and acetorphine, including their salts, and preparations containing them. The import, export, cultivation, production, possession, distribution, supply, and administration of narcotics is strictly controlled. Balanced quantitative records of transactions and stock are generally required to be kept. There is an extensive system of notification to medical officers of health of narcotics supplied and a system of control of habituated persons.
Legislation consolidating and amending the Narcotics Act 1965 in the form of Drugs (Prevention of Misuse) Bill was introduced in Parliament in 1974.
To curb illicit drug abuse, a National Drug Intelligence Bureau has been set up jointly by the Departments of Health, Customs, and Police.
FOOD AND NUTRITION—The Food and Drug Act 1969 provides for the analysis, by analysts appointed under the Act, of any articles of food or drink which may be sold, offered for sale, or exposed for sale, and for the inspection of any place where there is any food intended for sale. Stringent measures are provided for the prevention of adulteration and for the inspection of places where food is manufactured or packed. Regulations lay down minimum standards for many classes of food, control additives of all kinds, and deal with labelling of food packages. Control is also established over all utensils and appliances coming into contact with food. Regular sampling of foods is undertaken by departmental inspectors and the samples are analysed in the Chemistry Division (DSIR) or its branch laboratories.
An important provision of the Act controls all kinds of publicity concerning any food whereby a purchaser would possibly be deceived in regard to the properties of such food, whether or not it is standardised by regulations.
A Food Standards Committee, with a membership of highly qualified persons, meets regularly to discuss the latest technical advances in food production and to make appropriate recommendations for amendments to the legislation.
The nutrition section of the Department of Health provides advisory services on nutrition and dietetics to dietary departments of hospitals, and food service departments of welfare and other institutions. It is responsible for nutrition education programmes and provides a nutrition information service for Government departments, organisations concerned with production and marketing of food, and the public. The section also carries out dietary research projects, generally in liaison with medical research teams concerned with nutrition research.
OCCUPATIONAL HEALTH AND TOXICOLOGY—Since 1957 medical officers of health have had responsibility for occupational health. The objective of the occupational health programmes is to work with labour, management, the medical profession, and other groups to assist in improving the health of the worker.
The Department of Labour, which is responsible for accident prevention, hours of work, employment of women, and children etc., calls to the attention of the Department of Health any health problems which the factory inspectors may encounter. The Factories Act 1946 gives to medical officers of health or other authorised officers of the Department of Health the same powers and authorities as inspectors of factories with regard to the health and welfare sections of the Act. The suspension of workers on health grounds, approval of respirators and similar protective equipment, and the arrangements for medical examinations are undertaken by the Department of Health. A series of regulations deal with health hazards, many of them being administered by the two departments, each in its own sphere.
A similar understanding has been established with the Waterfront Industry Commission and New Zealand Railways, and illustrates the general pattern of arrangements between the Department of Health and other Government departments or agencies concerned with particular aspects of workers' health. An occupational health laboratory was established at Wellington in 1964.
Occupational Diseases—The notifiable occupational diseases are scheduled in the Health Act 1956 and details of diseases notified are published annually in the report of the Director-General of Health.
Commercial, Household, and Agricultural Poisons—The advertising, distribution, use, labelling, and packing of all poisons and toxic substances is controlled under the Poisons Act 1960 and the Poisons Regulations 1964. A manufacturer or importer must notify the Registrar of Poisons before importing or putting on the market any new substance which might be toxic, be it a chemical, household preparation, cosmetic, or drug. Special safeguards are provided for certain hazardous chemicals, used in agriculture or horticulture. It is an offence to pack poisons in bottles that are ordinarily used for food, drink, or medicine. Labels for “Restricted Poisons” must bear statements of the precautions to be taken in use, the symptoms of poisoning and the remedial treatment, and must be approved by the Registrar of Poisons. This legislation is at present under extensive review.
Control of Health Hazards—An increasing number of specific health hazards are coming under formal control, namely, lead processes, electroplating, spray painting, sand blasting (siliceous blasting agents in factories are prohibited), fumigation, aerial application of poisons, where in conjunction with the Civil Aviation Division of the Ministry of Transport a special rating is required by pilots, and agricultural chemicals. The organisation of radiation protection is dealt with by the National Radiation Laboratory, while a number of other specific hazards are currently receiving consideration.
Medical, Nursing, and First-aid Services—Minimal first-aid requirements have been laid down by the Department of Health, which generally endeavours to encourage both the development of medical and nursing services and the raising of first-aid standards throughout industry generally. While there are no statutory obligations on industry to provide medical and nursing services, an increasing number of factories do provide such services. To meet the needs of small plants the department has developed industrial health centres with financial support from the Waterfront Industry Commission in the case of harbour areas, and the Accident Compensation Commission in the case of general industry.
Pre-employment Examinations—Pre-employment medical examinations are required for young workers before entering factory employment.
National Audiology Centre—The National Audiology Centre assists with the early detection of deafness and conservation of hearing. The centre conducts and promotes research into noisy industries, occupational deafness, and other forms of deafness. An advisory service is provided for those working with deaf people and training is given to those responsible for testing groups for hearing loss.
Radiation Protection—The National Radiation Laboratory provides the administrative and technical services required to maintain the primary X-ray standard for New Zealand and also reference standards for the accurate measurement of radioactive substances used in clinical work. Control of radiation sources is effectively obtained by licensing operators at each place where ionising sources are used, and the Electrical (X-ray) Wiring Regulations 1944 provide for the compulsory registration of all X-ray plants in the country. The importation and use of radioactive materials is strictly controlled, and requests for such materials on overseas suppliers must be authorised by the laboratory, which acts as the procurement agency for most of the radioisotopes required.
The laboratory operates a field service whereby trained physicists regularly visit all places where ionising sources are used. During these visits measurements are taken, protection problems discussed, and everything possible is done to ensure that persons associated with the ionising sources adopt safe working habits. Apart from the obvious groups, e.g., medical and dental users, the laboratory is also concerned with specialised equipment, such as mass X-ray units, X-ray apparatus used in schools, radar and television equipment, X-ray diffraction units, electron microscopes, research accelerators, etc.
Air, rainwater, and soil are monitored for radioactive contamination from fall-out.
MATERNAL AND CHILD HEALTH—Medical practitioners give ante-natal, neo-natal, and postnatal attention under the Social Security Act. Free ante-natal clinics are established in connection with the St. Helens Hospitals, all public maternity hospitals and maternity wards. Ante-natal classes to prepare mothers for the baby's arrival are also being developed, and doctors can refer patients to these to supplement their own ante-natal instructions. In the case of women living far away from the main centres of population, ante-natal work is supplemented by the public health nurses employed by the Department of Health, or by district nurses employed by hospital boards.
Approximately 99 percent of confinements take place in maternity hospitals or in maternity units of public hospitals. The medical care of the mother and child is based on co-operation between the Department of Health, hospital boards, the medical and nursing professions, and the Royal New Zealand Society for the Health of Women and Children (Plunket Society). All private maternity hospitals are licensed under the Hospitals Act 1957 and the Department of Health has responsibility for ensuring that regulations regarding buildings, equipment, and staff are observed. Medical officers of health, through their senior nursing staff, exercise general supervision over the work of private hospitals in the local areas.
Family Planning—General practitioners provide the major portion of family planning services. Contraceptives are provided free for those who need them for medical reasons, where cost would be a barrier. Since 1971 priority has been given to family planning as a health measure. In addition to the private doctor service 20 Family Planning Association clinics are now in operation in various centres of the country. Government provides financial assistance towards operating costs, education material, and to help establish new clinics.
A number of hospital boards have established family clinics within their obstetrics and gynaecology departments to provide additional facilities for the public and training for doctors, medical students, and nurses, and other boards are being encouraged to provide these facilities.
Child Health—The Department of Health provides a preventive child health service. Infants are examined by doctors at three stages between birth and 3 months of age and another medical examination is undertaken before the end of the first year for those requiring further investigation. Public health nurses undertake supervision of infants and pre-school children although the major proportion of this service is provided by the nurses of the Plunket Society. Where necessary the children are referred to family doctors or medical officers of the Department of Health.
A consultative service is provided for schools, with special emphasis on the health supervision of handicapped children, both in the normal schools and in special education classes. Nursing staff make regular visits to all schools and from pre-school record cards and by consultation with teachers and parents refer children for examination by medical officers. Correspondence School children are kept under health supervision as necessary and any school child requiring treatment is referred to the appropriate family doctor. Vision and hearing testing is carried out by trained staff for pre-school children at school entry and in Form I.
The Government supports the Children's Health Camps Board which maintains six permanent camps for the short-stay placement of children convalescent after illness, for those whose physical health is unsatisfactory, and for those suffering from minor emotional disorders. Medical officers select children for admission and undertake general health supervision of the camps. Children derive benefit from the ordered routine of camp life which provides a diet designed to improve nutrition and a balance of free activity, rest, and sleep. The Department of Education maintains school classes with emphasis on remedial teaching.
Immunisation Programme—Protection by two doses of the oral vaccine for poliomyelitis is available to all infants. Protection against diphtheria, whooping cough, and tetanus is a routine procedure and a triple vaccine is used. It is preferable that immunisation be done by the family doctor, and the course of injections should be commenced as soon as possible after babies are 3 months old. Arrangements can be made for mothers who are unable to have the immunisation done privately to attend with her child at a departmental clinic. If necessary in country areas the public health nurse will visit the home to immunise the child. Booster doses (against diphtheria and tetanus) are given at 18 months and after the child's fourth birthday or as soon as possible after the child commences school. Further booster doses (against tetanus only) are recommended at 10-yearly intervals and on injury. Measles vaccination is available from family doctors for infants from 10 months of age onwards. Rubella vaccination is available from family doctors for pre-school children.
HEALTH EDUCATION—Medical and dental officers, public health nurses, dental nurses, and inspectors of health all devote some of their time to health education. The health education officer acts as a co-ordinator and stimulates and extends health teaching and health programmes in the district. Most health education officers are women and the majority hold the diploma in health education issued by the Royal Society for the Promotion of Health. Daily newspapers and national periodicals carry advertisements of health subjects. Leaflets, pamphlets, and posters are available on many health topics from district health offices.
The Department of Health's official bulletin Health has a circulation of over 78,000 and is issued free to the public 4 times a year. It gives health information and publishes various aspects of the department's work.
Officers are available for lectures and discussions on health with schools and community groups.
DENTAL HEALTH—New Zealand's dental health service combines a school dental service for children, dental benefits for adolescents, and private dental practice for adults. There are 14 dental districts and 3 schools for the training of school dental nurses at Auckland, Wellington, and Christchurch.
School Dental Service—Briefly, the functions of the service are to improve the standard of dental health of school children (and of pre-school children) by regular and systematic treatment at 6-monthly intervals commencing from the primer classes (or earlier when possible), and continuing through to the highest class of the primary (or intermediate) school. Thereafter they are eligible for enrolment in the adolescent service.
On completing her 2-year course of training, a school dental nurse is posted to a school dental clinic, where she becomes responsible to the principal dental officer of her district for the dental treatment of a group of approximately 500 patients. She is visited at regular intervals by the principal dental officer and by a dental nurse inspector who assist the dental nurse to maintain a high standard of performance in. all aspects of work.
In 1974 there were 1,356 school dental nurses responsible for a total of 610,709 children in 2,544 schools. School dental treatment during 1973-74 included 2,589,019 fillings and 63,756 extractions, a ratio of 2.5 extractions to every 100 fillings. A further 183,634 children under 18 years of age received regular treatment from private dentists under the social security (dental benefits) scheme, and from a limited number of salaried dental officers.
Dental treatment comprises fillings in both temporary teeth and permanent teeth, cleaning and scaling of the teeth, extractions when necessary, and sodium fluoride treatment. The aim of the service is to promote dental health by conserving the natural teeth and preventing dental decay. Only a small number of teeth have to be extracted as unsavable, less than 3 for every 100 saved by conservative treatment.
Adolescent Dental Service—Dental care for adolescents up to 16 years of age and if dependent up to 18 years of age is provided by private dentists as a dental benefit under the Social Security Act, the dentist being reimbursed on a fee-service basis. Children who remain at school after their sixteenth birthday and qualify for the extended family benefit, or who are otherwise dependent upon parents for support, will continue to receive the dental benefit to their eighteenth birthday.
Eligibility for dental treatment as an adolescent is contingent upon a person's having undergone regular dental care up to within 3 months of the time of application, either at a school dental clinic or from a private dental practitioner.
Treatment is essentially of a nature designed to conserve the natural teeth. Dental supervision of adolescents is on a basis of examination and treatment at 6-monthly intervals. There is free choice of dentists, and dentists have the right to decline patients.
The treatment (other than treatment requiring special approval) which may be provided as dental benefits, and the fees payable, are indicated in the Schedule to the Social Security (Dental Benefits) Regulations 1960.
Dental Health Education—The dental health education activities of the department include the production of posters, pamphlets, sound films, filmstrips, radio talks, newspaper advertisements, and all other types of advertising media.
Officers of the service are kept in touch with health education and other matters by means of the School Dental Service Gazette, which is published bi-monthly.
Dental Research—Dental research is directed by the dental research committee of the Medical Research Council. The staff consisting of a director, three professional assistants, and three associated workers are primarily engaged in a long-term programme of research in dental problems.
Dental Bursaries—The Government grants bursaries each year to selected students to assist them to qualify as dentists. The bursaries are the equivalent of the bursary that would be payable under the University Bursary Regulations plus $350 a year. Students who are granted bursaries must enter into an agreement to pursue their studies diligently and, on graduating, to enter the service of the Crown or of a hospital board appointed by the Crown for a specified period not exceeding 3 years.
Fluoridation—Approximately half of all persons living in water-reticulated areas are drinking fluoridated water, which reduces the need for dental treatment.
REHABILITATION OF DISABLED CIVILIANS—The rehabilitation of disabled and handicapped civilians has received increasing emphasis over recent years in New Zealand. Public hospitals are the hub for development of an adequate medical rehabilitation service, with co-operation from Government and voluntary agencies in furthering the medical, social, and vocational welfare of the disabled.
Civilian rehabilitation centres are established at Otara, under the Auckland Hospital Board's administration, and Palmerston North under the Palmerston North Hospital Board's administration; for the treatment and overall restoration of those injured in employment or road accidents. For the rehabilitation of persons suffering from spinal injuries and paraplegia, specialist spinal injury centres are in course of development at Auckland and Christchurch. Rehabilitation activities are also being carried out at the Queen Elizabeth Hospital in Rotorua, and in many of the psychiatric and psychopaediatric hospitals.
The Disabled Re-establishment League is the principal agent of Government in vocational rehabilitation. The main function of the league is to provide facilities for work assessment and work-experience for the disabled. Policy is decided by a central board of management and district committees administer the centres which are established in Auckland, Wellington, Christchurch, Dunedin, Napier, and Invercargill.
A National Civilian Rehabilitation Committee, comprising representatives from the Departments of Labour, Social Welfare, Health, and Education, advise Government on steps to co-ordinate and promote rehabilitation in New Zealand.
PHYSICAL MEDICINE—Physical medicine is concerned with potentially disabling conditions such as rheumatic diseases, cerebral palsy, and other disorders of the locomotor system.
The national centre for the treatment of rheumatism is established at the Queen Elizabeth Hospital, Rotorua, which has approximately 100 beds set aside for diagnosis, research, and treatment of these diseases. Full physiotherapy and occupational therapy facilities are provided and active steps towards rehabilitation of patients are carried out. A large number of outpatients referred from all parts of New Zealand and a few from overseas are seen every year.
Physiotherapists and occupational therapists work together in preventing and controlling deformity, and teaching people how to overcome their disabilities. Social workers assist in bridging the gap between rehabilitation and vocational and social resettlement.
A cerebral palsy unit is situated at Queen Elizabeth Hospital providing residential accommodation for 20 children. At this unit the activities of a team of physiotherapists, occupational therapists, teachers, and speech therapists are co-ordinated by the supervisor of the unit working under a physician. Patients can be referred by their doctors to the physician in charge of the unit for assessment only, or for admission and treatment. Cerebral palsy visiting therapist services are operating under hospital boards. Post-graduate courses are given to physiotherapists, occupational therapists, teachers, and speech therapists.
Cerebral palsy day schools have been established in Auckland, Wellington, Christchurch, Dunedin, and Invercargill. Parents of cerebral palsy cases who seek their children's admission first apply to the appropriate medical officer of health or education board. The schools are administered by the education boards, but close liaison exists between the schools, the Rotorua unit, and the visiting cerebral palsy therapists.
Cerebral palsy schools administered by education boards have been established in Auckland, Wellington, Christchurch, Dunedin, and Invercargill. Close liaison exists between the schools, the Rotorua unit, and the visiting cerebral palsy therapist. Parents seeking the admission of their children to one of the schools make application to the appropriate education board. A medical report on a child's condition is required by the schools.
HEALTH STATISTICS—The National Health Statistics Centre is responsible for the compilation of the statistics included in the Annual Reports on the Health Statistics of New Zealand. The centre also prepares special statistics for the various divisions of the department and for research workers in different fields both in New Zealand and overseas. A constant liaison is maintained with the World Health Organisation, which is supplied with statistical material giving a picture of health trends in
New Zealand. In addition, from time to time special statistical investigations are made into important aspects of public health and diseases that warrant specific study. The centre publishes Trends in Health and Health Services every 2 years.
A question in the 1971 Census of Population revealed that 17,430 persons were under treatment for diabetes, of whom 5,516 were being treated with insulin. These statistics are believed by the medical profession to be understated.
There are 4,300 registered blind people and the number is being added to by 12 every week.
NATIONAL HEALTH INSTITUTE—The Institute is the Department of Health's centre for the scientific study of public health problems. It contains an epidemiology section and public health laboratories (microbiology, virology and environmental health).
The epidemiology section conducts field research into matters of public health interest.
The public health laboratories provide diagnostic and reference services in bacteriology and virology for medical officers of health, hospital and private laboratories, and general practitioners, as well as for the other sections of the institute. The Institute is the national centre for those reference services which are organised on an international basis, such as salmonellosis, leptospirosis, toxoplasmosis, influenza, and staphylococcal phage typing.
MEDICAL RESEARCH COUNCIL—The Medical Research Council of New Zealand has the following functions:
To initiate, foster, and support medical research;
To furnish information, advice, and assistance to persons and organisations concerned with medical research;
To collect and disseminate scientific information, including the publication of reports.
At the end of 1974 research was in progress in many fields, including the following: dentistry; experimental endocrinology and metabolism; human genetics; hydatids; Island Territories research; toxicology; electron microscopy; renal physiology; cardiology; hypertension; environmental physiology; coronary disease; immunology and genetics of tissue transplantation; mechanisms of action of psychotropic drugs; diabetes; molecular biology of bacterial viruses; biology; pathology; rheumatic diseases; human nutrition; maternal and infant health; tumour virology; social medicine and community health.
The council maintains liaison with the research work being carried out by private medical research foundations and societies such as the Cancer Society of New Zealand, and regional medical research foundations established in Auckland, Wellington, Christchurch, Palmerston North, Hawke's Bay, Otago, and Southland.
The council administers the Medical Research Endowment Fund, from which an annual expenditure of $2.3 million is incurred in supporting research projects at the University of Otago, the University of Auckland, Massey University, and the institutions of the Auckland, Wellington, North Canterbury, Palmerston North, Southland, and Otago Hospital Boards.
The council employs a staff of about 50 full-time workers. A further 200 workers are employed by other institutions under project grants from the council.
The council awards scholarships and fellowships to selected graduates and undergraduates who wish to engage in medical research.
The council is empowered to receive bequests and donations to the fund for furthering the objects of the council as set out in the Medical Research Council Act 1950.
MEDICAL COUNCIL—The Medical Council of New Zealand, constituted under the Medical Practitioners Act 1968, consists of the Director-General of Health, the deans of the faculties of medicine in the Universities of Otago and Auckland, and eight registered medical practitioners appointed on a representative basis.
The council deals with all applications for registration under the Act. Until an applicant is able to satisfy the council that he has obtained house officer experience, in a resident medical capacity, of not less than 12 months or has otherwise obtained comparable experience, registration is on a conditional basis. Persons registered conditionally may practise only in an approved hospital. A medical education committee responsible to the council exercises general supervision over the training of persons conditionally registered. The number of medical practitioners on the register at 30 June 1974 was 5,603, but not all are in active practice in New Zealand.
The Medical Council is vested with certain disciplinary powers. Right of appeal to the Supreme Court is provided.
DOCTORS IN PRACTICE—ADMINISTRATION—A report made in 1970 by the Joint Committee on Medical Graduate Needs assessed that in 1968 the doctors in active practice in New Zealand totalled 3,182 and that they were engaged as follows:
| Type of Practice | Doctors |
|---|---|
*Specialties. †Non-specialist psychiatrist medical officers. ‡Includes preventive and social medicine and medically qualified teachers in non-clinical subjects. §Hospital boards, armed services, student health, trainees and industry, Government (other than Department of Health), family planning associations, research, etc. | |
| General practice | 1,335 |
| Surgery* | 303 |
| Medicine* | 290 |
| Registrars | 296 |
| House surgeons | 247 |
| Psychiatry | 90 |
| Anaesthetics | 88 |
| Pathology | 85 |
| Radiology | 83 |
| Obstetrics and gynaecology | 82 |
| Ophthalmology | 50 |
| Health administration— | |
| Department of Health | 36 |
| Hospital boards | 22 |
| Medical Officers in Department of Health— | |
| Psychiatric hospitals† | 48 |
| Other | 35 |
| Medical education not included elsewhere‡ | 26 |
| Other§ | 66 |
| Total | 3,182 |
On this basis the doctor to population ratio in 1968 was 1:866. For Australia in 1966 the ratio was reported by the World Health Organisation as 1:840 and for selected other countries in 1965 as: Sweden 1:910; England and Wales 1:870; United States 1:700. The New Zealand target is 1:720. Medical graduates from the University of Otago have totalled 114 annually, from 1973 this output has been supplemented by graduates from the University of Auckland to a total of 165. Medical graduates are expected to reach 207 a year by 1977.
At present, there is, on average, one active general practitioner for every 2,400 people in New Zealand. Whether there are sufficient general practitioners is a matter for debate. More important than the overall population/doctor ratio is the fact that there are areas where this ratio is 50 percent above or below the national average. In recent years financial inducements have helped to redress the imbalance between urban and rural areas in this respect. However, the problem has not been solved entirely. There remains the intra-urban maldistribution, where well-established, middle-class areas tend to be relatively overprovided with general practitioners, while some other areas are often characterised by a shortage of general practitioners.
REGISTRATION COUNCILS AND BOARDS: Dentists—Under the Dental Act 1963 there is constituted a Dental Council, the functions of which are to examine and approve of the qualifications of applicants desiring registration as dentists and to exercise disciplinary control over registered dentists.
The number of private dentists holding annual practising certificates at 1 September 1970 was 901 and in addition there were 150 dentists in Government, hospital, research, and university employment.
Under provisions of the Dental Technicians Regulations 1968, a Registration Board for Dental Technicians has been constituted and 310 dental technicians are on the register.
Nurses—Under the Nurses Act 1971 is constituted the nursing council. The council controls nursing education programmes, conducts examinations and effects registrations.
Provision is made in Nurses Registration Regulations 1966 for 3-year programmes for registration as nurse and maternity nurse, male nurse, psychiatric nurse, and psychopaedic nurse. Provision is also made for 18-month programmes for registration as maternity nurse and community nurse, and 6-month programmes for registration as midwife and, where registration has already been obtained as nurse, as maternity nurse.
Physiotherapists—Under the Physiotherapy Act 1949 is constituted the New Zealand Physiotherapy Board. The board's functions are the training, examination, and registration of candidates for physiotherapy practice, the issuing of special licences, the approval of physiotherapy training schools, and the conduct of those registered under the Act.
The training period for physiotherapists is 3 years. Full-time training is conducted at the New Zealand School of Physiotherapy, Dunedin, administered by the Otago Hospital Board, and the final year is spent at one of the subsidiary training schools in various parts of New Zealand. All students are required to pass the State Examination in Physiotherapy to qualify for registration.
Occupational Therapists—Under the Occupational Therapy Act 1949 is constituted the Occupational Therapy Board. The board is concerned with the registration and conduct of persons engaged in the practice of occupational therapy.
The Central Institute of Technology, Wellington, conducts the 3-year course of training and clinical experience is gained at hospitals. Students who successfully complete the course are awarded a diploma in occupational therapy and then registered. There are some 200 occupational therapists in active practice.
Dietitians—Under the Dietitians Act 1950 is constituted the Dietitians Board, which is concerned with the training, examination, and registration of persons engaged in the practice of dietetics.
The training period for a dietitian is, in the case of the holder of a degree of bachelor of home science conferred by the University of Otago or of the holder of a diploma in home science of the University of Otago, 12 months in a hospital training school.
Opticians—The Opticians Act 1928 provides for the constitution of an Opticians Board, consisting of the Director-General of Health (the Registrar), three persons engaged in practice as opticians in New Zealand, and a registered medical practitioner with special knowledge of diseases of the eyes. The board deals with all applications for registration under the Act. There are approximately 270 opticians registered, but not all are engaged in active practice.
Plumbers—The Plumbers and Gasfitters Board consists of 10 members—the Director-General of Health as chairman, a registrar (deputy chairman), and representatives of the Department of Education, the Municipal and Counties Association, the Gas Association, the Master Plumbers Society (2), the Plumbers, Gasfitters, and Related Trades Industrial Union of Workers (2), and a nominee of a borough council or drainage board.
The Board is concerned with the registration of plumbers and gasfitters. It issues annual licences and limited certificates for plumbers and gasfitters. It has also authority and responsibility for disciplinary action against registered plumbers and gasfitters if it is established they have done unsatisfactory work.
In New Zealand, except in specially exempted areas, all sanitary plumbing as defined in the Plumbers and Gasfitters Registration Act 1964 can only be performed by registered plumbers and holders of limited certificates working in the employment or under the supervision of registered plumbers.
Specifications and standards of workmanship and materials in plumbing work are prescribed in the provisions of the Drainage and Plumbing Regulations enacted under the Health Act.
Pharmacists—There are now 2,545 names on the Pharmaceutical Register in New Zealand. All registered pharmacists, except those who notify the registrar that they have conscientious objection to membership, automatically become members of the Pharmaceutical Society of New Zealand, the society's affairs being managed by a council constituted by the Pharmacy Act 1970.
The council consists of 12 members, 11 being pharmacists, and 1 a barrister appointed by the Minister of Health. Seven members are elected on a district basis by registered pharmacists who are proprietors of pharmacies and four by members of the Pharmaceutical Society who are not in the previous category. The main function of the council of the Pharmaceutical Society is to administer the Pharmacy Act and generally to protect and promote the interests of the profession of pharmacy and the public interests.
It is a specific requirement of the Pharmacy Act that pharmacies in New Zealand be at all times maintained under the immediate supervision and control of a registered pharmacist.
The present system for pharmacy education requires a minimum of 3 years' attendance at the School of Pharmacy, Central Institute of Technology, Upper Hutt, at which the diploma in pharmacy is obtained. There is also a 4-year degree course in pharmacy at the University of Otago. Graduates from both courses are required to serve 12 months' practical training before becoming eligible for registration as pharmacists.
Any pharmacist or company in which not less than 75 percent of the share capital is owned by a pharmacist or pharmacists may establish one pharmacy. Unqualified persons or companies in which less than 75 percent of the share capital is pharmacist-owned must, however, secure the consent of the Pharmacy Authority, set up under the Act, before commencing business, and in all cases the establishment of more than one pharmacy under the same ownership is subject to the consent of the authority. All pharmacies must be registered with the society. There are about 1,160 pharmacies in New Zealand. A survey in 1973 showed that on average there were 1.56 pharmacists per pharmacy; about 200 pharmacists work outside the retail trade in hospitals, Government departments and the pharmaceutical industry.
MEDICAL, HOSPITAL, AND OTHER RELATED BENEFITS—Part II of the Social Security Act 1904, administered by the Department of Health and dealing with medical and like benefits, is of general application to all persons ordinarily resident in New Zealand, and makes provision for medical, pharmaceutical, hospital, maternity, and other related benefits.
Medical Benefits—Medical benefits apply to such medical treatment as is ordinarily given by medical practitioners in the course of a general practice. Certain services are excluded, these being principally:
Medical services in maternity cases. (These services are covered by maternity benefits and are described under a later heading.)
Medical services involved in any medical examination of which the sole or primary purpose is the obtaining of a medical certificate.
Medical services other than anaesthetic services, involved in or incidental to the extraction of teeth by a medical practitioner.
Medical services in respect of which fees are payable under the Social Security (X-ray Diagnostic Services) Regulations 1941, Social Security (Physiotherapy Benefits) Regulations 1951, and Social Security (Laboratory Diagnostic Services) Regulations 1946—see later headings.
Medical services afforded by means of advice given by telephone, telegram, or letter except under circumstances specifically approved by the Director-General of Health and medical services not rendered by a medical practitioner in person.
Every medical practitioner who renders any of the prescribed services is entitled, on behalf of the patient, to receive from the Department of Health a fee of $1.25 for a service provided in normal hours and up to $2.00 for a service rendered at night or on Saturdays, Sundays, or holidays; for social security beneficiaries, including those for whom the family benefit is payable, the benefit ranges from $3 to $7. The department pays a fee of $5 for an initial consultation with a recognised specialist physician, psychiatrist, neurologist, neurosurgeon, or paediatrician, and of $3.50 in the case of other recognised specialists. These rates apply only to the first occasion on which a patient is referred by a general practitioner to a specialist and, in the case of inter-specialist referral, with the prior concurrence of the original doctor. For subsequent visits, the fee paid by the department reduces to $1.25 for each visit, except in the case of social security beneficiaries and pensioners and their dependants for whom the fee is $3. In designated rural areas, an incentive bonus is payable. In 1972 immunisation benefits were introduced; they apply to children and adolescents up to their sixteenth birthday; the benefit is $1.50 if the vaccine is administered by a doctor, or $1.25 if administered by a registered nurse in his employ.
Most doctors (91 percent) make a claim directly from the Department of Health and ask patients for the balance of their fees. A minority require their patients to pay the whole fee and make personal claims on the Department of Health.
The number of doctors providing general and specialist medical services in March 1974 was 2,607 and the cost per head of population in the year ended 31 March 1972 was $6.57, the average population per active practitioner was 1,638.
Pharmaceutical Benefits—Persons receiving medical attention under the Act are entitled, generally without cost to themselves, to those medicines, drugs, approved appliances, and materials, prescribed for their medical practitioners and which are included in the Drug Tariff.
Prescriptions passed for payment in the year ended 31 March 1974 totalled 21,070,618 or 7.1 per head of population. The average cost per prescription was $2.07, the cost per head of population being $14.70.
Hospital Benefits—Treatment is provided free by public hospitals where a patient is entitled to hospital benefits under the Act. In the case of private hospitals and other approved institutions benefits paid are in partial satisfaction of claims against the patients. The rates from 1 October 1971 are as follows:
For surgical treatment S9.00 a day, with a minimum of $18.00.
For medical (including psychiatric) treatment $5.50 a day.
Free treatment is accorded outpatients at public hospitals; this also covers the supply of artificial aids, including contact lenses, hearing aids, artificial limbs, surgical footwear, wheelchairs, orthopaedic implants in private hospitals, ileostomy and colostomy appliances, and urinals. It does not include dental treatment or services in respect of which fees are payable under specific Social Security Regulations (X-ray diagnostic services, laboratory diagnostic services) referred to under later headings. In respect of surgical footwear, part payment by the patient is required.
Psychiatric Hospitals—Treatment of patients in public psychiatric hospitals is also free. A licensed (private) psychiatric hospital may be recognised and approved by the Minister as a hospital for the purposes of the Act, and hospital benefits in respect of treatment are payable accordingly.
Maternity Benefits—Maternity benefits cover ante-natal and post-natal advice and treatment by medical practitioners, and the services of doctors and nurses at confinements in maternity hospitals or elsewhere. Recognised specialists may make a charge on the patient over and above the benefit. Licensed maternity hospitals are entitled to receive fees of S9.00 in respect of the day of birth of the child and for each of the succeeding 14 days.
X-ray Diagnostic Services—These X-ray diagnostic services on the recommendation of a medical practitioner, attract a health benefit:
The making of X-ray examinations with the aid of a fluorescent screen.
The taking of X-ray photographs.
The supply and administration of any drugs or other substances for the purposes of any such examination or photograph.
X-ray photographs or X-ray examinations made or taken for dental purposes or for the purposes of life assurance, visas, emigration permits, and examinations for the sole or primary purpose of obtaining medical certificates for production to some other person, are not included in the free services. Eligible X-ray examinations at public hospitals are free, but those undertaken by private radiologists are limited to a specified benefit. Additional charges are the patient's responsibility.
Laboratory Diagnostic Services—The benefits concerning laboratory diagnostic services comprise the supply of all materials or substances required for the purpose of providing laboratory diagnostic services, and associated medical services.
The following services are not included:
Examination of specimens for public health.
Post-mortem examinations.
Laboratory services for dental purposes or for the purposes of life insurance.
The preparation of sera and vaccines.
Physiotherapy Benefits—Physiotherapy treatment afforded by contracting physiotherapists is the subject of a benefit under the Social Security (Physiotherapy Benefits) Regulations 1951. The standard benefit is $1 for each recommended treatment, but a higher rate of $1.50 is payable for beneficiaries and their dependants who qualify for the higher medical benefit. Where patients are treated in groups the universal benefit is 40 cents per patient.
To qualify for the benefit, physiotherapy treatment must in all cases be recommended by a registered medical practitioner. Treatment is limited to 6 weeks on a single recommendation but in the case of certain specified illnesses the Director-General of Health may extend the period of treatment on any one recommendation up to 6 months.
Home-nursing Services—Under the Social Security (District Nursing Services) Regulations 1944, home-nursing services are provided free where the services are afforded by a registered nurse, midwife, or maternity nurse in the employ of the Department of Health, a hospital board, or an organisation recognised for the purpose.
Domestic Assistance—Monetary assistance is given to approved incorporated associations formed for the purpose of providing domestic help in the home, where it is required because of age and infirmity, or to support family situations in which the mother is incapacitated or needs help on account of family commitments.
Dental Services—The Social Security (Dental Benefits) Regulations 1960 provide for free dental treatment. These benefits are confined to persons who are under 16 years of age or under 18 years in the dental department of a public hospital, if still attending school. Treatment may be provided in a State dental clinic by a contracting dentist for whom there is a prescribed scale of fees, or in the dental department of a public hospital.
Artificial Aids—The Social Security (Hospital Benefits for Outpatients) Regulations 1947 made provision for the supply of artificial aids, such as artificial limbs, hearing aids, and contact lenses.
Contact Lenses—These may be supplied in respect of the following optical disabilities: (a) conical cornea, (b) high myopia, where the degree of myopia present in the greatest axis of the better eye is not less than—10 diopters, (c) monocular aphakia, if the restoration of binocular vision is highly desirable by reason of the patient's occupation or other circumstances and binocular vision cannot be restored without the use of contact lenses. In each case the supply of such lenses must be recommended by an approved ophthalmologist.
Lenses may also be supplied in respect of any other ocular condition which cannot be corrected by ordinary spectacles; in these cases recommendation by two ophthalmologists is necessary.
Hearing Aids—A free aid may be supplied, or a subsidy of $45 is payable towards the purchase of a hearing aid where the patient suffers a hearing loss which renders the use of an aid necessary. A subsidy of up to $70 is payable towards the cost of an aid for a patient under 16 years of age.
Eligibility on medical grounds for the provision of a hearing aid is to be determined by an otologist employed or engaged by a hospital board or the Department of Health.
Normally a patient will be eligible for the payment of the full benefit only once every 5 years. However, if in the opinion of the authorising otologist, a patient's existing aid is inadequate after less than 5 years from the date of its issue, and a new aid is required to improve hearing ability, the hearing aid benefit at full rates is to be payable.
Artificial Limbs—The free supply of artificial limbs is subject to the following conditions:
The patient has not obtained or is not entitled to obtain a limb as an ex-serviceman under the provisions of the War Pensions Regulations 1956 or under the provisions of the Accident Compensation Act 1972.
The supply of the limb is recommended by an approved orthopaedic surgeon.
The limb is of an approved type and can, in the opinion of the supplier's orthopaedic adviser, be satisfactorily fitted.
For the purposes of the regulations “artificial limb” includes artificial arms, artificial hands, artificial legs, and artificial feet, and includes limb socks for such limbs and for female amputees, replacement understockings.
Orthopaedic Implants—Artificial hips and similar implants also qualify for benefit under the arrangements for artificial aids.
Wheelchairs—Manually operated wheelchairs are available through hospital boards on a free loan basis to disabled persons who require them on medical grounds. Motorised wheelchairs are the subject of a 50 percent benefit towards their cost. The balance of the cost may be assisted with grants from lottery funds.
The following table gives details of expenditure on the various classes of health benefits during the last five financial years.
| Item | 1969-70 | 1970-71 | 1971-72 | 1972-73 | 1973-74 | |
|---|---|---|---|---|---|---|
| $(thousand) | ||||||
| Maternity Benefits— | ||||||
| Medical practitioners' fees | 2,542 | 2,670 | 3,317 | 3,364 | 3,269 | |
| Medical practitioners' mileage fees | 72 | 82 | 105 | 101 | 101 | |
| Obstetric nurses' fees | 2 | 3 | 4 | 2 | 2 | |
| - | 2,616 | 2,756 | 3,426 | 3,467 | 3,372 | |
| Medical benefits— | ||||||
| General medical services | 9,099 | 9,785 | 9,692 | 11,820 | 17,378 | |
| GMS mileage | 191 | 181 | 159 | 151 | 137 | |
| Specialist medical services | - | 1,256 | 1,286 | 1,721 | 2,148 | |
| Rural practice bonus and other incentives | - | 292 | 337 | 405 | 545 | |
| Immunisation benefit | - | - | - | 127 | 407 | |
| - | 9,289 | 11,514 | 11,474 | 14,225 | 20,614 | |
| Private practice and post-graduate grants | - | 11 | 32 | 24 | 27 | |
| Special area and other arrangements — section 117 Social Security Act | 410 | 152 | 117 | 164 | 153 | |
| - | 410 | 163 | 149 | 189 | 180 | |
| Hospital Benefits— | ||||||
| Treatment in private hospitals—maternity benefits | 341 | 377 | 394 | 397 | 388 | |
| Treatment in private hospitals—medical, surgical, and Karitane | 4,590 | 5,291 | 5,915 | 7,016 | 7,541 | |
| Treatment in approved institutions | 423 | 495 | 526 | 626 | 700 | |
| - | 5,354 | 6,162 | 6,836 | 8,039 | 8,630 | |
| Pharmaceutical Benefits— | ||||||
| Drugs supplied— | ||||||
| By chemists | 26,697 | 30,154 | 32,480 | 39,323 | 44,397 | |
| By medical practitioners and Department of Health | 278 | 168 | 206 | 181 | 207 | |
| To institutions and private hospitals | 332 | 462 | 550 | 515 | 562 | |
| - | 27,308 | 30,783 | 33,236 | 40,020 | 45,166 | |
| Supplementary Benefits— | ||||||
| Dental services | 2,339 | 2,800 | 2,799 | 2,849 | 3,135 | |
| Laboratory services | 4,142 | 5,335 | 6,584 | 7,355 | 7,860 | |
| Artificial aids | 16 | 14 | 18 | 21 | 24 | |
| Physiotherapy services | 227 | 234 | 242 | 246 | 251 | |
| Radiological services | 708 | 787 | 757 | 788 | 1,184 | |
| Specialist services (neurosurgery) | 4 | 4 | 3 | 2 | 2 | |
| - | 7,436 | 9,174 | 10,403 | 11,262 | 12,457 | |
| Totals | 52,413 | 60,552 | 65,524 | 77,202 | 90,418 | |
WELFARE SERVICES—Government assistance is offered to religious and voluntary organisations and local authorities in providing housing, accommodation, and services for elderly people and others whom it is considered are in special need. Under this partnership with Government, the social service agencies of all the major religious bodies, as well as other welfare organisations, have established additional accommodation for the aged, frail, and sick who need residential care in either an old people's home or a geriatric hospital. Where it is not possible to meet the need of elderly people through these agencies, the provision of residential care for the aged becomes a hospital board responsibility. At 31 March 1974 religious and welfare organisations provided 6,968 home and hospital beds for the elderly. Hospital boards maintain 1,109 old people's home beds, while approximately 4,700 of their hospital beds (42 percent) are required for care of the elderly sick, either on a short-stay or long-term basis.
Other measures which are of importance in assisting elderly people to remain in their homes as long as possible are receiving increased attention. Chief amongst these are the provision of district nursing services, home aid, meals-on-wheels, laundry services, and occupational therapy. In general the services are provided by hospital boards with voluntary organisations and old people's welfare councils assisting in various ways. The importance of old people's clubs and social centres, with an adequate range of services, is also receiving increasing recognition. Government lottery funds are being used to assist in providing suitable premises and assisting welfare councils with administrative costs. At 31 December 1973 the number of meals delivered daily by the meals-on-wheels service was 4,245; the service is operated by 28 hospital boards.
Old People's Homes and Hospitals—Subject to maximum subsidies of $9,000 per bed for old people's homes and $12,000 for a geriatric hospital, capital cost limits per bed of $10,000 and $13,000 respectively, and certain other conditions, religious or welfare organisations providing accommodation for old people may be granted 100 percent of the approved building cost. In addition, a subsidy of up to $500 per bed is available towards initial land and land development costs. Since April 1966, the policy has been widened to provide a 50 percent subsidy towards the cost of approved improvements and the upgrading of existing accommodation, and 75 percent for fire protection work as required by the local authority. The administration of policy is a Department of Health responsibility.
During the year 1973-74, subsidies amounting to $6,282,134 were approved to assist in the provision of accommodation for 489 old people. From April 1950 to 31 March 1974. subsidies totalling $31,896,966 have been approved, and buildings erected as a result will accommodate 6,285 old people.
VOLUNTARY WELFARE ORGANISATIONS—Over the years voluntary welfare organisations have made valuable contributions to certain aspects of the field of public health. In many cases they are encouraged and assisted in their work by grants from the public funds.
National voluntary health organisations in New Zealand as at November 1973 are listed below.
There is no national index of voluntary organisations working in the health field. This list has been drawn from several sources, but may well be incomplete.
Family Health
Children's Health Camps Board.
The New Zealand Family Planning Association (Inc.).
Royal N.Z. Society for the Health of Women and Children (Plunket Society).
Society for Protection of the Unborn Child.
New Zealand Crippled Children Society Inc.
New Zealand League for Hard of Hearing.
Mental Health
Al Anon Family Groups.
Alcoholics Anonymous.
National Society on Alcoholism and Drug Dependence (N.Z.) Inc.
New Zealand Society for the Intellectually Handicapped.
Recovery (New Zealand) Inc.
New Zealand Trust Board for Home Schools for Curative Education.
Disease Control
Cancer Society of New Zealand. Glaucoma Society.
New Zealand Haemophilia Society Inc.
National Heart Foundation of New Zealand.
National Multiple Sclerosis Society.
New Zealand Asthma Society Inc.
Muscular Dystrophy Association.
New Zealand Federation of Tuberculosis Associations.
The Arthritis and Rheumatism Foundation of New Zealand Inc.
Paraplegics Associations of New Zealand.
Neurological Foundation.
Cystic Fibrosis Association of New Zealand.
Diabetic Association of New Zealand Inc.
Psoriasis Association of New Zealand.
Public Health
Nutrition Society of New Zealand.
Miscellaneous
New Zealand Red Cross Society Inc.
St. John Ambulance Association.
Rehabilitation League (Inc.).
Council of Christian Social Services.
New Zealand Association of Health, Physical Education and Recreation.
Australian and New Zealand Clean Air Society.
Laura Fergusson Trust for Disabled Persons.
Royal New Zealand Foundations for the Blind.
Overseas Welfare
CORSO.
Medical Aid Abroad.
Volunteer Service Abroad.
Lepers Trust Board.
Leprosy Mission of New Zealand.
GENERAL—The Hospitals Act 1957 requires the Minister of Health to ensure the provision and maintenance by hospital boards of hospitals and hospital services and to encourage the provision and maintenance of private hospitals. The Department of Health advises the Minister on or determines in respect of boards the extent and standard of hospital and allied services, the building requirements to provide these services, the numbers and levels of the main groups of professional staffs to be employed, the appropriate annual financial grants, the salaries and conditions of employment of about 60 percent of staff and the measure of financial assistance to be given to private hospitals, including loan finance. The department also licenses and supervises private hospitals, inspects the work of all hospitals and compiles financial and statistical data about them. There are 30 hospital boards and over 150 private hospitals.
Since 1 April 1958, the cost of hospital treatment in public hospitals has been borne entirely by the State. Private hospitals which provide about one-sixth of the available beds, receive payment from the Government for hospital treatment of patients; additional fees may be claimed from the patients.
The report A Health Service for New Zealand (parliamentary paper H.23, 1974) proposes that regional health authorities replace hospital boards from 1 April 1978.
Hospital and home nursing services involve the Department of Health in establishing and assisting to maintain minimum standards of nursing service in general hospitals, in homes for the aged, etc., in advising, inspecting and reporting on such services in hospitals; and generally advising the Minister on nursing.
Experience has been that, generally speaking, boards, committees and councils play a most valuable part in helping to formulate health policies and programmes, and, in certain cases, in administering policies or programmes laid down by Government. The setting-up of such agencies enables the Minister and the Department of Health to draw upon expert advice and wide experience and ensures that non-departmental people with up-to-date knowledge, day-to-day working experience and responsibility in particular areas of health play a worthwhile part in health administration. A partnership of this kind is particularly important in the case of public hospitals, which are run by democratically elected boards. Recognition of this is seen in the requirements of the Hospitals Act that the Minister of Health may not act in certain public hospital matters without a recommendation from the Hospitals Advisory Council.
The department's objectives in the case of physical medicine and rehabilitation are to stimulate interest and co-ordinate treatment of diseases such as chronic arthritis, poliomyelitis, and cerebral palsy; to promote and maintain a unified rehabilitation service and to maintain and develop physiotherapy and occupational therapy services. It supervises physiotherapy and occupational therapy training, licensing and services, and supervises the provision of rehabilitation services in public hospitals. (See Section 5 A.)
The welfare services involving the department include the medical and social care and general welfare of the aged. The department advises the Minister on subsidies to be paid to religious and welfare organisations which provide homes and hospital beds for the elderly, and administers legislation governing the standards and oversight of old people's homes.
Private Hospitals—Hospital benefits are paid to patients in registered private hospitals according to the nature of the treatment given: For surgical and maternity treatment, $9 per day; for medical (including psychiatric) treatment, $5.50 per day.
The Government assists in the development of private hospitals by the provision of loan moneys. at a low interest rate. New loans amounting to $475,000 were approved in 1972-73.
HOSPITAL BOARDS—General and psychiatric hospitals are controlled by locally elected hospital boards. A hospital board of 8 to 14 members is elected every 3 years for each hospital district. It is the duty of every hospital board to provide, maintain and staff such institutions, hospital accommodation, and medical, nursing, and other services as the Minister of Health considers necessary.
In recent years there has been a pressure of activity, replanning, and development in all medical services for which hospital boards are responsible. This replanning of medical services has been undertaken against a background of sharp population increases in moan areas. More rapid and comfortable transport is encouraging the build-up of specialist diagnostic and therapeutic resources in regional centres. The Management Services Research Unit, headed by a medical practitioner in the Department of Health, has the task of applying techniques such as operational research and work study to problems of management in the health services, particularly in hospitals, and ascertaining in what ways efficiency can be improved.
The Director-General of Health is authorised to visit and inspect hospitals and to appoint assistant inspectors, and is required to report to Parliament through the Minister on the administration of the Hospitals Act.
Hospital boards are required to operate their own ambulance services unless they enter into some arrangement with a subsidised voluntary agency. In this regard the Order of St. John and organisations such as the Wellington Free Ambulance perform valuable services.
HOSPITAL ACCOMMODATION: Public Institutions—The number of beds in public institutions available at 31 March 1974 and the average number occupied during the year are set out in the following table. These statistics relate to patients and inmates in all institutions (general, maternity, special hospitals, and old people's homes) including institutions under the control of the Department of Health.
| Type of Bed | Beds Available | Average Number of Occupied Beds per Day | ||
|---|---|---|---|---|
| Number | Proportion per 1,000 of Population | Number | Proportion per 1,000 of Population | |
| General | 14,869 | 4.9 | 11,850.5 | 3.9 |
| Maternity | 2,970 | 1.0 | 1,636.0 | 0.5 |
| Total hospital beds | 17,839 | 5.9 | 13,486.5 | 4.4 |
| Non-hospital beds | 878 | 0.3 | 726.1 | 0.2 |
| Totals | 18,717 | 6.2 | 14,212.6 | 4.7 |
In the past some hospitals which provided geriatric treatment only were not included in general hospitals. These have now been reclassified with the result that available general beds show a marked increase while available non-hospital beds have decreased.
In addition to the 17,839 hospital beds in public institutions there were 4,264 (4,060 general and 204 maternity) in the 154 licensed private hospitals. If the beds in licensed private hospitals are included, the ratio of beds per 1,000 of population becomes 6.2 for general beds and 1.0 for maternity beds.
The average number of occupied hospital beds per 1,000 of population in hospital districts varies from 3.2 to 11.5. This variation can be accounted for in the main by the fact that many hospitals to a varying extent draw patients from other districts. Other factors which influence the figures are the availability of medical practitioners and their habits in sending patients to hospital or retaining them for home treatment, the availability of private-hospital beds, housing facilities, domestic assistance, private or district nursing assistance, and the efficiency of the outpatient departments.
The number of institutions coming under the heading of public institutions for the year ended 31 March 1974 was 197, comprising 111 general hospitals, 66 maternity hospitals and 20 old people's homes.
A total of 373,379 persons were treated or maintained in public hospitals or similar institutions during the year ended 31 March 1974. This figure, which included persons in maternity beds and non-hospital beds in old peoples homes but not hospital outpatients, was equivalent to 12.3 percent of the population. The 1972-73 figure was 362,452.
General Hospitals—In the following table the figures relate only to general hospitals under the control of hospital boards.
| Year | Inpatients Treated | Average Number of Occupied Beds per Day | Average Turnover of Patients Treated per Occupied Bed | Available Beds | Outpatient Attendances (Including Dental) | ||||
|---|---|---|---|---|---|---|---|---|---|
| Number | Proportion per 1,000 of Population | Number | Proportion per 1,000 of Population | Number | Proportion per 1,000 of Population | Number | Proportion per 1,000 of Population | ||
| 1968-69 | 276,248 | 100.1 | 10,334.0 | 3.7 | 24.9 | 13,045 | 4.7 | 2,923,505 | 1,059.7 |
| 1969-70 | 279,400 | 100.0 | 10,438.5 | 3.7 | 25.8 | 13,430 | 4.8 | 3,022,782 | 1,082.2 |
| 1970-71 | 287,112 | 100.6 | 10,448.7 | 3.7 | 26.6 | 13,506 | 4.7 | 3,266,886 | 1,144.3 |
| 1971-72 | 292,956 | 100.8 | 10,400.2 | 3.6 | 27.5 | 13,609 | 4.7 | 3,479,463 | 1,197.7 |
| 1972-73 | 307,562 | 103.4 | 10,700.6 | 3.6 | 27.9 | 13.846 | 4.6 | 3,904,838 | 1,312.7 |
| 1973-74 | 330,819 | 108.7 | 11,850.5 | 3.9 | 27.9 | 14,869 | 4.9 | .. | .. |
Private Hospitals—The total number of private hospitals licensed in New Zealand at 31 March 1974 was 154, providing 204 maternity, 33 psychiatric, and 4,027 beds for general cases.
Census of Hospitals and Old People's Homes—A census of hospitals and old people's homes was held on 23-24 March 1971 at the same time as the national census.
The ages of people in public, private and psychiatric hospitals and old people's homes in 1971 are shown in the following table.
| Ages | Public | Private | Psychiatric | Old People's | Total | |||||
|---|---|---|---|---|---|---|---|---|---|---|
| Number | Rate* | Number | Rate* | Number | Rate* | Number | Rate* | Number | Rate* | |
| * Age-specific rates per 1,000 population. | ||||||||||
| 0-4 | 799 | 2.7 | 170 | 0.6 | 63 | 0.2 | - | - | 1,032 | 3.5 |
| 5-9 | 474 | 1.5 | 32 | 0.1 | 357 | 1.2 | - | - | 863 | 2.8 |
| 10-14 | 385 | 1.3 | 14 | - | 571 | 1.9 | 1 | - - | 971 | 3.2 |
| 15-19 | 423 | 1.6 | 28 | 0.1 | 800 | 3.1 | - | - | 1,251 | 4.8 |
| 20-24 | 446 | 1.9 | 48 | 0.2 | 765 | 3.3 | - | - | 1,259 | 5.4 |
| 25-29 | 366 | 2.0 | 28 | 0.1 | 643 | 3.4 | - | - | 1,037 | 5.5 |
| 30-34 | 362 | 2.2 | 53 | 0.3 | 580 | 3.5 | 3 | - - | 998 | 6.0 |
| 35-39 | 319 | 2.1 | 38 | 0.3 | 539 | 3.6 | 5 | - - | 901 | 6.0 |
| 40-44 | 412 | 2.5 | 77 | 0.5 | 688 | 4.3 | 13 | 0.1 | 1,190 | 7.4 |
| 45-49 | 489 | 3.1 | 81 | 0.5 | 732 | 4.6 | 26 | 0.2 | 1,328 | 8.3 |
| 50-54 | 559 | 4.0 | 74 | 0.5 | 813 | 5.8 | 43 | 0.3 | 1,489 | 10.6 |
| 55-59 | 696 | 5.3 | 81 | 0.6 | 803 | 6.1 | 94 | 0.7 | 1,674 | 12.7 |
| 60-64 | 787 | 6.9 | 98 | 0.9 | 699 | 6.1 | 204 | 1.8 | 1,788 | 15.7 |
| 65-69 | 782 | 8.6 | 144 | 1.6 | 601 | 6.6 | 425 | 4.7 | 1,952 | 21.6 |
| 70-74 | 905 | 13.8 | 233 | 3.5 | 526 | 8.0 | 788 | 12.0 | 2,452 | 37.3 |
| 75-79 | 926 | 21.4 | 405 | 9.3 | 410 | 9.5 | 1,455 | 33.6 | 3,196 | 73.7 |
| 80-84 | 1,002 | 37.0 | 562 | 20.8 | 322 | 11.9 | 1,914 | 70.7 | 3,800 | 140.4 |
| 85† | 1,139 | 65.4 | 865 | 49.7 | 217 | 12.5 | 2,384 | 137.0 | 4,605 | 264.6 |
| Totals | 11,271 | 3.9 | 3,031 | 1.1 | 10,129 | 3.5 | 7,355 | 2.6 | 31,786 | 11.1 |
Waiting Lists—At the Census of Hospitals on 23 March 1971 there were 36,003 names on waiting lists for admission to public hospital, a rate of 12.6 persons per 1,000 residents. Some 26.6 percent of patients in hospitals at that date had been admitted from the waiting list; they comprised 3,001 persons.
The position for selected hospital districts is shown in the following table.
| Hospital district | Names on Waiting Lists | Patients in Hospital at Time of Census Admitted from Waiting List | ||
|---|---|---|---|---|
| Number | Rate per 1,000 Residents* | Number | Percentage of Total Patients in Hospital | |
| *Hospital district population figures at Census date. | ||||
| Tauranga | 1,170 | 20.9 | 53 | 22.9 |
| Otago | 2,279 | 18.0 | 162 | 26.5 |
| North Canterbury | 5,078 | 15.9 | 270 | 25.1 |
| Waikato | 4,576 | 15.8 | 209 | 19.5 |
| Wellington | 5,061 | 15.8 | 474 | 33.1 |
| Taranaki | 1,466 | 15.7 | 74 | 17.5 |
| Hawke's Bay | 1,413 | 14.4 | 97 | 21.5 |
| Palmerston North | 1,535 | 13.5 | 239 | 44.7 |
| Auckland | 8,380 | 12.0 | 670 | 34.6 |
| Nelson | 608 | 10.5 | 25 | 11.3 |
| Wanganui | 730 | 9.8 | 119 | 34.4 |
| Southland | 820 | 7.4 | 44 | 9.6 |
| Northland | 630 | 6.6 | 97 | 21.8 |
| South Canterbury | 311 | 5.5 | 137 | 41.3 |
As long as extensive waiting lists continue and public hospital treatment is not universally available within a reasonable period, other than for emergency cases for other patients whose need is considered as urgent, more and more people feel obliged to accept private specialist and hospital care with or without taking out voluntary health insurance. Substantially preferential treatment is being given to those who can afford to pay for it privately. Those who cannot afford the cost or who are excluded from voluntary health insurance programmes because of age, psychiatric illness, chronic, or congenital disease or illness, must wait their turn for access to public hospitals. The needs of these excluded groups are often the most pressing.
The pressure caused by public hospital shortcomings has led to the rapid growth of voluntary health insurance and altered the use and scope of private hospitals and health facilities.
Over 300,000 New Zealanders, about 10 percent of the population, are covered by private health insurance schemes. Membership has grown greatly since premiums for health insurance were made tax deductible in 1967.
STAFF—The numbers of staff employed in public hospitals and other institutions and activities controlled by hospital boards in the latest 5 years were as follows.
| Category of Staff | At 31 March | ||||
|---|---|---|---|---|---|
| 1970 | 1971† | 1972 | 1973 | 1974 | |
*Includes duplication where persons provide medical services at more than one institution. †This is the first year that all staff have been published as full time equivalent, previous years part-time staff were counted as full time, hence the reduction in staff numbers. | |||||
| Institutional medical | 1,947* | 1,309 | 1,383 | 1,472 | 1,648 |
| Other professional and technical | 3,332 | 2.896 | 3,150 | 3,367 | 3,513 |
| Nursing | 15,740 | 14,350 | 15,237 | 16,360 | 16,726 |
| Other treatment staff | 656 | 873 | 954 | 979 | 1,043 |
| Domestic and other institutional staff | 10,126 | 9,633 | 10,074 | 10,251 | 10,591 |
| Administrative staff | 712 | 690 | 700 | 743 | 765 |
| Domiciliary services | 1,182 | 561 | 593 | 608 | 641 |
| Farm and garden | 67 | 18 | 14 | 13 | 13 |
| Other non-institutional | 180 | 117 | 137 | 125 | 160 |
| Totals | 33,942 | 30,447† | 32,242 | 33,918 | 35,100 |
FINANCE: Institutional Operating Expenditure—The average operating expenditure per occupied bed, relating to hospitals of all types (excluding psychiatric hospitals) and to general hospitals, is shown in the following table.
| Year | Treatment | Institutional Administration | Heat, Light, Power, and Water | Household Expenses | Buildings and Grounds | Miscellaneous | Total |
|---|---|---|---|---|---|---|---|
| *The figures for 1973-74 include outpatient costs. Due to a change in the accounting system, separate inpatient/outpatient figures are no longer provided. | |||||||
| All Institutions | |||||||
| $ | $ | $ | $ | $ | $ | $ | |
| 1968-69 | 3,141.5 | 423.8 | 359.6 | 1,356.8 | 195.0 | 4.7 | 5,481.4 |
| 1969-70 | 3,475.2 | 486.7 | 384.5 | 1,357.4 | 221.6 | 5.3 | 5,930.7 |
| 1970-71 | 4,088.6 | 609.8 | 419.9 | 1,626.1 | 266.6 | 7.0 | 7,018.0 |
| 1972-73 | 6,159.0 | 849.6 | 508.2 | 2,075.4 | 345.0 | 7.4 | 9,944.6 |
| 1973-74* | 8,017.2 | 1,080.8 | 560.9 | 2,436.8 | 406.4 | 11.9 | 12,514.0 |
| General Hospitals | |||||||
| 1968-69 | 3,481.5 | 487.1 | 381.8 | 1,338.3 | 204.7 | 4.6 | 5,898.0 |
| 1969-70 | 3,857.6 | 558.0 | 411.1 | 1,409.1 | 230.4 | 5.1 | 6,471.3 |
| 1970-71 | 4,561.0 | 703.4 | 454.6 | 1,703.3 | 276.6 | 6.9 | 7,705.8 |
| 1972-73 | 6.899.4 | 983.4 | 558.7 | 2,184.5 | 373.3 | 7.8 | 11,007.2 |
| 1973-74* | 8,816.3 | 1,214.9 | 619.2 | 2,644.1 | 447.0 | 13.1 | 13,754.6 |
Each of these averages includes the direct expenditure on each activity for labour, materials, and incidental expenses, but excludes overheads such as depreciation and interest on capital.
For 1972-73 the average daily expenditure for individual inpatients treated in hospitals classed as general hospitals was $30.16 and the average total expenditure for each inpatient was $382.96.
Loans—Boards have been authorised by the Minister of Health to raise loans to cover a very extensive building programme. The position of loan liability is set out in the following table.
| Year | Amount Uplifted | Repayment* | Balance Owing |
|---|---|---|---|
| *Includes payments from sinking funds. | |||
| $(000) | |||
| 1968-69 | 23,566 | 7,931 | 106,070 |
| 1969-70 | 19,170 | 9,436 | 115,797 |
| 1970-71 | 19,200 | 10,043 | 124,878 |
| 1971-72 | 20,118 | 10,574 | 134,425 |
| 1972-73 | 30,619 | 14,439 | 151,923 |
| 1973-74 | 24,083 | 14,453 | 162,783 |
Payments—Hospital board expenditure is subject to control by the Minister of Health. The sum provided by Government for public hospital maintenance expenditure is allocated to the individual hospital boards on the basis of allocations made in the previous year, adjusted to take account of known increases in commitments plus an allowance for normal growth. A portion of the total is, however, held in reserve, to enable special allocations to be made to boards having to meet the cost of commissioning major capital works reaching completion during the year. Additional grants are also made for general wage increases which may be approved after the basic allocation has been made. Grants for minor capital works and equipment are made to boards on the basis of population and average occupied beds. Major works over $20,000 are financed by loans raised by hospital boards, interest and principal repayments being met by Government grants.
| Item of Expenditure | 1968-69 | 1969-70 | 1970-71 | 1971-72 | 1972-73 |
|---|---|---|---|---|---|
| *Includes payments to sinking funds. | |||||
| $(thousand) | |||||
| Institutional operating expenses | 83,091 | 91,882 | 109,610 | 135,579 | 157,050 |
| Extramural relief | 118 | 153 | 205 | 266 | 337 |
| Grants to private hospitals, etc. | 129 | 124 | 126 | 181 | 186 |
| Other grants | 12 | 16 | 13 | 18 | 29 |
| Transport of patients | 942 | 920 | 1,190 | 1,296 | 1,703 |
| Domiciliary services | 1,762 | 2,023 | 2,289 | 2,885 | 3,362 |
| Administration | 2,172 | 2,342 | 2,776 | 3,397 | 3,953 |
| Superannuation | 647 | 718 | 910 | 1,859 | 2,393 |
| Other expenses | 1,049 | 2,211 | 3,722 | 7,478 | 10,057 |
| Interest on loans | 4,961 | 5,794 | 6,182 | 6,748 | 7,559 |
| Repayment of loans* | 7,088 | 8,107 | 9,251 | 10,241 | 11,859 |
| Capital works other than “loan” | 3,400 | 3,782 | 4,395 | 4,915 | 4,784 |
| Totals, excluding loans | 105,371 | 118,072 | 140,669 | 174,863 | 203.274 |
| Loan works | 15,179 | 15,465 | 15,639 | 22,353 | 24,481 |
| Totals | 120,550 | 133,537 | 156,308 | 197,216 | 227,756 |
PSYCHIATRIC HOSPITALS—The total expenditure on psychiatric hospitals (not including the cost of new buildings and additions) and particulars of receipts during the last 11 financial years are shown in the next table. This expenditure was incurred by the Department of Health until 31 March 1972, since which date psychiatric hospitals have become the responsibility of hospital boards.
| Year Ended 31 March | Total Expenditure | Receipts | Net Expenditure | Average Cost per Occupied Bed |
|---|---|---|---|---|
| $(000) | $(000) | $(000) | $ | |
| 1964 | 12,109 | 212 | 11,897 | 1,143 |
| 1965 | 13,783 | 686 | 13,097 | 1,258 |
| 1966 | 14,778 | 692 | 14,086 | 1,353 |
| 1967 | 17,330 | 699 | 16,631 | 1,610 |
| 1968 | 18,559 | 556 | 18,003 | 1,743 |
| 1969 | 19,901 | 362 | 19,539 | 1,919 |
| 1970 | 21,873 | 488 | 21,385 | 2,106 |
| 1971 | 26,006 | 589 | 25,417 | 2,521 |
| 1972 | 30,067 | 585 | 29,481 | 3,034 |
| 1973 | 34,397 | 127 | 34,269 | 3,660 |
| 1974 | 42,289 | 431 | 41,858 | 4,625 |
As already stated, the expenditure included in the foregoing table does not include amounts spent on new buildings, additions, etc. Expenditure for the last five financial years has amounted to $2,640,000 in 1969-70, $3,261,000 in 1970-71, $3,962,000 in 1971-72, $4,217,000 in 1972-73, and $2,777,000 in 1973-74.
PUBLIC HOSPITAL PATIENTS: Principal Diseases and Disabilities—Detailed statistical information is supplied to the Department of Health about every patient, except normal maternity cases, discharged from or dying in public hospitals in New Zealand.
The following summary shows the principal diseases and injuries treated, together with the number of deaths and the fatality rate percent of total cases, in public hospitals in 1971. The disease headings are the subtitles of the International Classification of Diseases. More detailed information is available in Hospital and Selected Morbidity Data, Health Statistics Report.
It should be noted that the disease or condition for which a patient is admitted to hospital is not necessarily that which would rank as the cause of death in mortality statistics. Congestive heart failure, for instance, is comparatively highly ranked in hospital cases as the condition immediately affecting the patient, but is frequently only the consequence of some underlying disease, which would take precedence over congestive heart failure in the statistics of causes of death. Hospital returns show each disease for which the patient was treated while in hospital, but the classification for statistical purposes has been made on the basis of the principal disease for which the patient was admitted, regardless of what ether unrelated diseases may have been present or developed during the stay in hospital. In mortality statistics, on the other hand, the underlying cause of death is of paramount importance. In the summary below a patient admitted on account of an injury is classified according to the nature of the injury. Should the patient die, however, the death would be classified in the mortality statistics according to the cause of the injury, e.g., motor-vehicle accident, accidental fall, etc.
| DISEASES AND DISABILITIES TREATED IN PUBLIC HOSPITALS DURING 1971 | |||
|---|---|---|---|
| Disease or Disability | Total Discharges and Deaths in Public Hospitals | Deaths in Public Hospitals | Fatality Rate Percent |
| Intestinal infectious diseases | 2,799 | 39 | 1.4 |
| Tuberculosis | 1,072 | 47 | 4.4 |
| Zoonotic bacterial diseases | 33 | - | - |
| Other bacterial diseases | 522 | 47 | 9.0 |
| Poliomyelitis and other enterovirus diseases of central nervous system | 313 | 4 | 1.3 |
| Viral diseases accompanied by exanthem | 833 | 6 | 0.7 |
| Arthropod-borne viral diseases | 44 | 7 | 15.9 |
| Other viral diseases | 1,618 | 17 | 1.1 |
| Rickettsioses and other arthropod-borne diseases | 25 | - | - |
| Syphilis and other venereal diseases | 176 | 4 | 2.3 |
| Other spirochaetal diseases | 156 | - | - |
| Mycoses | 86 | 2 | 2.3 |
| Helminthiases | 139 | 3 | 2.2 |
| Other infective and parasitic diseases | 253 | 4 | 1.6 |
| Malignant neoplasm of buccal cavity and pharynx | 343 | 56 | 16.3 |
| Malignant neoplasm of digestive organs and peritoneum | 2,636 | 765 | 29.0 |
| Malignant neoplasm of respiratory system | 1,945 | 550 | 28.3 |
| Malignant neoplasm of bone, connective tissue, skin, and breast | 2,509 | 173 | 6.4 |
| Malignant neoplasm of genito-urinary organs | 3,114 | 388 | 12.5 |
| Malignant neoplasm of other and unspecified sites | 2,309 | 674 | 29.2 |
| Neoplasms of lymphatic and haematopoietic tissue | 1,707 | 318 | 18.6 |
| Benign neoplasms | 4,048 | 18 | 0.4 |
| Neoplasm of unspecified nature | 231 | 5 | 2.2 |
| Diseases of thyroid gland | 842 | 14 | 1.7 |
| Diseases of other endocrine glands | 2,810 | 181 | 6.4 |
| Avitaminoses and other nutritional deficiency | 408 | 5 | 1.2 |
| Other metabolic diseases | 674 | 16 | 2.4 |
| Diseases of blood and blood-forming organs | 1,618 | 33 | 2.0 |
| Psychoses | 2,385 | 71 | 3.0 |
| Neuroses, personality disorders, and other non-psychotic mental disorders | 3,846 | 15 | 0.4 |
| Mental retardation | 198 | 1 | 0.5 |
| Inflammatory diseases of central nervous system | 414 | 43 | 10.4 |
| Hereditary and familial diseases of nervous system | 110 | 8 | 7.3 |
| Other diseases of central nervous system | 2,999 | 182 | 6.1 |
| Diseases of nerves and peripheral ganglia | 1,042 | 5 | 0.5 |
| Inflammatory diseases of the eye | 923 | 1 | 0.1 |
| Other diseases and conditions of the eye | 4,082 | 9 | 0.2 |
| Diseases of the ear and mastoid process | 3,152 | 1 | - - |
| Active rheumatic fever | 675 | 8 | 1.2 |
| Chronic rheumatic heart disease | 786 | 76 | 9.7 |
| Hypertensive disease | 1,546 | 98 | 6.3 |
| Ischaemic heart disease | 9,108 | 1,697 | 18.6 |
| Other forms of heart disease | 3,866 | 798 | 20.6 |
| Cerebrovascular disease | 5,854 | 2,099 | 35.9 |
| Diseases of arteries, arterioles and capillaries | 2,520 | 405 | 16.1 |
| Diseases of veins and lymphatics, and other diseases of circulatory system | 6,040 | 106 | 1.8 |
| Acute respiratory infections (except influenza) | 4,372 | 23 | 0.5 |
| Influenza | 190 | 1 | 0.5 |
| Pneumonia | 5,255 | 498 | 9.5 |
| Bronchitis, emphysema and asthma | 6,450 | 364 | 5.6 |
| Other diseases of upper respiratory tract | 10,008 | 2 | - - |
| Other diseases of respiratory system | 1,473 | 101 | 6.9 |
| Diseases of oral cavity, salivary glands, and jaws | 2,141 | 1 | - - |
| Diseases of oesophagus, stomach, and duodenum | 2,455 | 115 | 4.7 |
| Appendicitis | 5,836 | 13 | 0.2 |
| Hernia of abdominal cavity | 5,119 | 53 | 1.0 |
| Other diseases of intestine and peritoneum | 3,827 | 122 | 3.2 |
| Diseases of liver, gall bladder, and pancreas | 4,560 | 157 | 3.4 |
| Nephritis and nephrosis | 975 | 101 | 10.4 |
| Other diseases of urinary system | 3,906 | 91 | 2.3 |
| Diseases of male genital organs | 3,296 | 78 | 2.4 |
| Diseases of breast, ovary, fallopian tube, and parametrium | 2,157 | 3 | 0.1 |
| Diseases of uterus and other female genital organs | 9,360 | 7 | 0.1 |
| Complications of pregnancy | 2,515 | 3 | 0.1 |
| Urinary infections and toxaemias of pregnancy and the puerperium | 1,212 | 1 | 0.1 |
| Abortion | 5,067 | - | - |
| Delivery | 1,804 | 1 | 0.1 |
| Complications of the puerperium | 639 | 3 | 0.5 |
| Infections of skin and subcutaneous tissue | 3,375 | 5 | 0.1 |
| Other inflammatory conditions of skin and subcutaneous tissue | 854 | 4 | 0.5 |
| Other diseases of skin and subcutaneous tissue | 1,473 | 8 | 0.5 |
| Arthritis and rheumatism, except rheumatic fever | 4,402 | 109 | 2.5 |
| Osteomyelitis and other diseases of bone and joint | 4,709 | 21 | 0.4 |
| Other diseases of musculoskeletal system | 2,512 | 10 | 0.4 |
| Congenital anomalies | 6,528 | 186 | 2.8 |
| Certain causes of perinatal morbidity and mortality | 2,790 | 252 | 9.0 |
| Symptoms referable to systems or organs | 12,436 | 16 | 0.1 |
| Senility and ill-defined diseases | 2,149 | 175 | 8.1 |
| Fracture of skull, spine, and trunk | 4,326 | 164 | 3.8 |
| Fracture of upper limb | 4,117 | 9 | 0.2 |
| Fracture of lower limb | 6,385 | 327 | 5.1 |
| Dislocation without fracture | 1,187 | 3 | 0.3 |
| Sprains and strains of joints and adjacent muscles | 1,060 | 1 | 0.1 |
| Intracranial injury (excluding those with skull fracture) | 8,847 | 89 | 1.0 |
| Internal injury of chest, abdomen, and pelvis | 742 | 65 | 8.8 |
| Laceration and open wound of head, neck, and trunk | 1,946 | 6 | 0.3 |
| Laceration and open wound on upper limb | 2,734 | 1 | - - |
| Laceration and open wound of lower limb | 1,622 | 2 | 0.1 |
| Laceration and open wound of multiple location | 239 | - | - |
| Superficial injury | 379 | - | - |
| Contusion and crushing with intact skin surface | 2,502 | 7 | 0.3 |
| Effects of foreign body entering through orifice | 965 | 5 | 0.5 |
| Burn | 1,891 | 26 | 1.4 |
| Injury to nerves and spinal cord | 361 | 1 | 0.3 |
| Adverse effect of medicinal agents | 3,108 | 15 | 0.5 |
| Toxic effect of substances chiefly non-medicinal as to source | 1,410 | 18 | 1.3 |
| Other adverse effects | 1,608 | 11 | 0.7 |
| Special admissions without sickness | 3,259 | - | - |
| All conditions | 255,342 | 12,273 | 4.8 |
Duration of Stay in Public Hospitals—The average duration of stay of patients in public hospitals in 1969 was 16.1 days. Among sufferers from specified diseases and disabilities, the longest average stays were made by those with tuberculosis or cerebrovascular disease (each 67 days), followed by patients with diseases of the nervous system (40,5 days), arthritis and rheumatism (39.1 days), diseases of arteries, arterioles, and capillaries (38.2 days), and active rheumatic fever and chronic rheumatic heart disease (32.8 days).
Accident Cases—A summary is given below of accident cases treated as inpatients in public hospitals during 1971.
| Type of Accident | Total Cases | Percentage of All Accident Cases | Average Stay (Days) | Aggregate Stay (Days) | Aggregate Slay as Percentage of Total |
|---|---|---|---|---|---|
| Transport— | |||||
| Railway | 70 | 0.1 | 22.4 | 1,568 | 0.3 |
| Motor-vehicle traffic | 10,700 | 22.3 | 11.6 | 123,764 | 21.2 |
| Motor-vehicle non-traffic | 293 | 0.6 | 13.0 | 3,801 | 0.7 |
| Other road vehicles | 1,792 | 3.7 | 6.5 | 11,646 | 2.0 |
| Water | 230 | 0.5 | 7.6 | 1,740 | 0.3 |
| Aircraft | 22 | 8.6 | 189 | - - | |
| Total transport | 13,107 | 27.4 | 10.9 | 142,708 | 24.4 |
| Non-transport— | |||||
| Accidental poisoning | 2,194 | 4.6 | 2.6 | 5,759 | 1.0 |
| Accidental falls | 11,384 | 23.8 | 18.5 | 211,123 | 36.1 |
| Other accidents | 12,886 | 26.9 | 8.7 | 111,481 | 19. 1 |
| Total non-transport | 26,464 | 55.2 | 12.4 | 328,363 | 56.2 |
| Surgical and medical complications and misadventures | 3,006 | 6.3 | 16.5 | 49,688 | 8.5 |
| Late effects of accidental injury | 1,279 | 2.7 | 28.6 | 36,614 | 6.3 |
| Suicide and self-inflicted injury | 2,400 | 5.0 | 7.2 | 17,261 | 3.0 |
| Homicide and injury purposely inflicted by other persons | 1,458 | 3.0 | 5.4 | 7,802 | 1.3 |
| Legal intervention | 6 | - - | 3.3 | 20 | - - |
| Injury undetermined whether accidentally or purposely inflicted | 145 | 0.3 | 5.2 | 761 | 0.1 |
| Injury resulting from operations of war | 37 | 0.1 | 26. | 980 | 0.2 |
| Grand totals | 47,902 | 100.0 | 12.2 | 584,197 | 100.0 |
Most cases come under the heading “Non-transport—Other accidents”, which includes accidents caused by cutting and piercing instruments, machinery, falling objects, fire and hot objects, and so on.
The second largest group is “Accidental falls”, which has an aggregate stay greater than any other group. This is due to the long periods spent in hospital by elderly people who have sustained fractures of the femur in falls. Almost one in every four patients had been injured in a fall of some kind.
Motor-vehicle traffic accidents comprise the third largest group, and have the second largest aggregate stay. It is interesting to note that there were almost three times as many admissions to hospital and almost three times as many beds occupied by people injured in non-transport accidents as there were in motor-vehicle traffic accidents. Traffic accidents on roads are analysed in tables in Section 11c Roads and Road Transport.
Accidents in the Home—A high percentage of non-transport accidents, especially those involving young children and elderly people, occur in the home. Accidents in the home in 1971 are included by type of accident in the previous section, but they are not separated out from accidents sustained elsewhere. The following table shows for the previous year (1970) the number of patients discharged from, or dying, in public hospitals after treatment for accidents sustained in the home. It includes only inpatients in public hospitals; not, of course, the large numbers of home accident cases treated in outpatient departments, doctors' surgeries, and in the home itself.
| Cause of Accident | Total Patients | Days Stay |
|---|---|---|
| Accidental poisoning by— | ||
| Drugs and medicaments | 1,078 | 2,550 |
| Petroleum products and other solvents | 431 | 777 |
| Pesticides, fertilisers, and plant foods | 167 | 266 |
| Noxious foodstuffs and poisonous plants | 127 | 209 |
| Other solid and liquid substances | 401 | 684 |
| Gases and vapours | 16 | 52 |
| Accidental falls | 5,122 | 110,680 |
| Blow from falling object | 104 | 1,242 |
| Accidents caused by cutting and piercing instruments | 1,449 | 8,877 |
| Accidental burns | 1,184 | 23,868 |
| Accidents caused by foreign bodies | 618 | 1,545 |
| Accidents caused by machinery | 30 | 323 |
| All other and unspecified accidents | 1,389 | 10,962 |
| Totals | 12,116 | 162,035 |
Deaths in Public Hospitals—The percentage of deaths in public hospitals to all deaths are shown in the following table.
| Year | Deaths in Public Hospitals | Total Deaths | Percentage of Deaths in Public Hospitals to Total Deaths |
|---|---|---|---|
| 1960 | 9,768 | 20,892 | 46.8 |
| 1961 | 10,280 | 21,782 | 47.2 |
| 1962 | 10,436 | 22,081 | 47.3 |
| 1963 | 10,784 | 22,416 | 48.1 |
| 1964 | 10,883 | 22,861 | 47.6 |
| 1965 | 11,265 | 22,976 | 49.0 |
| 1966 | 11,626 | 23,778 | 48.9 |
| 1967 | 11,299 | 23,007 | 49.1 |
| 1968 | 12,254 | 24,464 | 50.1 |
| 1969 | 12,026 | 24,161 | 49.8 |
| 1970 | 12,291 | 24,840 | 49.5 |
| 1971 | 12,273 | 24,309 | 50.5 |
Age and Sex of Patients—The age and sex of patients discharged from or dying in public hospitals during 1971 are shown below.
| Age Groups | Males | Females | Total |
|---|---|---|---|
| Under 1 year | 7,012 | 5,276 | 12,288 |
| 1-4 years | 11,162 | 8,078 | 19,240 |
| 5-9 years | 10,539 | 7,684 | 18,223 |
| 10-14 years | 8,150 | 5,965 | 14,115 |
| 15-19 years | 9,875 | 10,800 | 20,675 |
| 20-24 years | 9,049 | 12,213 | 21,262 |
| 25-29 years | 5,598 | 9,599 | 15,197 |
| 30-34 years | 4,713 | 7,787 | 12,500 |
| 35-39 years | 4,454 | 6,497 | 10,951 |
| 40-44 years | 5,239 | 6,620 | 11,859 |
| 45-49 years | 6,232 | 6,888 | 13,120 |
| 50-54 years | 6,231 | 6,454 | 12,685 |
| 55-59 years | 7,370 | 6,060 | 13,430 |
| 60-64 years | 8,072 | 5,782 | 13,854 |
| 65-69 years | 7,569 | 5,817 | 13.386 |
| 70-74 years | 6,026 | 5,396 | 11,422 |
| 75-79 years | 4,367 | 4,734 | 9,151 |
| 80-84 years | 3,057 | 3,724 | 6,781 |
| 85 years and over | 2,117 | 3,086 | 5,203 |
| 126,832 | 128,510 | 255,342 |
PATIENTS IN PSYCHIATRIC HOSPITALS—Under the Mental Health Act 1969 the control of psychiatric hospitals (with the exception of Lake Alice Hospital, Marton, which will continue to make national provision for security patients) was transferred from the Department of Health to local hospital boards from 1 April 1972.
A detailed report Mental Health Data is published annually by the National Health Statistics Centre of the Department of Health. The report contains administrative and clinical data about first admissions and readmissions (including replacements from leave), transfers, discharges, and deaths for all inpatients under psychiatric care. The report also presents information about psychiatric disorders in terms of age and sex, domicile, race, and length of stay.
In 1967 the statistical system was enlarged to include, in addition to people treated as inpatients in psychiatric hospitals, people treated in psychiatric inpatient units in public hospitals. The system was further enlarged in 1969 with the inclusion of alcoholics treated at Rotoroa Sanatorium. These developments provide more comprehensive data about treatment of people with psychiatric disorders in the community, but the greater coverage prevents strict comparability with statistical data published for earlier years.
At the end of 1972 there were 10,268 people on the registers of psychiatric hospitals of the Department of Health, 151 in psychiatric units of public hospitals, and 176 in Salvation Army institutions, a total of 10,595. There were 12,008 registrations during the year (excluding transfers and changes of status), of which 9,882 or 82 percent were voluntary patients. The average number of occupied psychiatric hospital beds was 9,398, which was 409 fewer than in 1971. The average number of resident patients per 100,000 mean population has declined steadily over the last 28 years.
The following table gives the annual averages and the rates per 100,000 mean population for those in psychiatric hospitals and public hospitals.
| Year | Resident in Psychiatric Hospital | On Leave from Psychiatric Hospital | Total for Psychiatric Hospitals | Patients in Public Hospitals | ||||
|---|---|---|---|---|---|---|---|---|
| Average Number | Rate | Average Number | Rate | Average Number | Rate | Average Number | Rate | |
| All Patients | ||||||||
| 1942 | 7,926 | 483.4 | 459 | 28.0 | 8,385 | 511.4 | .. | .. |
| 1947 | 8,439 | 469.3 | 591 | 32.9 | 9,030 | 502.2 | .. | .. |
| 1952 | 9,070 | 454.3 | 807 | 40.5 | 9,877 | 494.8 | .. | .. |
| 1957 | 9,850 | 441.2 | 945 | 42.3 | 10,795 | 483.5 | .. | .. |
| 1962 | 10,267 | 413.2 | 1,235 | 49.7 | 11,502 | 462.9 | .. | .. |
| 1967 | 10,415 | 381.6 | 1,681 | 61.6 | 12,096 | 443.2 | .. | .. |
| 1969 | 10,245 | 368.0 | 2,049 | 73.6 | 12,294 | 441.6 | 158 | 5.7 |
| 1970 | 10,169 | 360.6 | 1,663 | 59.0 | 11,832 | 419.6 | 154 | 5.5 |
| 1971 | 9,807 | 342.4 | 1,444 | 50.4 | 11,251 | 392.8 | 131 | 4.6 |
| 1972 | 9,398 | 322.2 | 1,498 | 51.4 | 10,896 | 373.6 | 162 | 5.6 |
First Admissions—In 1972 there were 3,250 first admissions (1,815 male and 1,435 female) to psychiatric hospitals, 1,606 (536 male, 1,070 female) to psychiatric inpatient units, and 44 males to Salvation Army institutions, a total of 4,900. The number of informal patients (4,035) exceeded the number of non-voluntary patients (865) by more than four to one.
The numbers and rates of first admissions together with the percentage of first admissions in total admissions and the percentage of informal patients in first admissions, are shown in the next tables.
| Years | Informal Patients | Non-Voluntary Patients | All Patients | |||
|---|---|---|---|---|---|---|
| Total | Rate | Total | Rate | Total | Rate | |
| *Average over 5 years. | ||||||
| 1935-39* | 212 | 13.3 | 943 | 59.2 | 1,155 | 72.5 |
| 1940-44* | 236 | 14.4 | 996 | 60.8 | 1,232 | 75.2 |
| 1945-49* | 502 | 27.9 | 1,151 | 64.5 | 1,653 | 92.4 |
| 1950-54* | 733 | 36.6 | 1,371 | 68.5 | 2,104 | 105.1 |
| 1955-59* | 1,066 | 47.5 | 1,400 | 62.7 | 2,466 | 110.2 |
| 1960-64* | 2,600 | 103.8 | 1,124 | 45.5 | 3,724 | 149.3 |
| 1965-69* | 3,626 | 133,3 | 976 | 35.9 | 4,602 | 169.2 |
| 1970 | 4,127 | 146.4 | 869 | 30.8 | 4,996 | 177.2 |
| 1971 | 3,869 | 135.1 | 803 | 28.0 | 4,672 | 163.1 |
| 1972 | 4,035 | 138.4 | 865 | 29.7 | 4,900 | 168.0 |
NOTES—For 1962 and subsequent years, informal patient totals include voluntary patients. Since 1967 the figures include psychiatric inpatients in public hospitals. The figures from 1969 include patients in Rotoroa Sanatorium.
Admissions to psychiatric hospitals for alcoholism and drug addiction under the Alcoholism and Drug Addiction Act 1966 are shown in the following table. The 1973 figures arc provisional.
| Hospital | Section 8 | Section 9 | Total | |||
|---|---|---|---|---|---|---|
| 1972 | 1973 | 1972 | 1973 | 1972 | 1973 | |
| Oakley | 38 | 56 | 63 | 57 | 101 | 113 |
| Kingseat | 37 | 45 | 44 | 28 | 81 | 73 |
| Tokanui | 10 | 3 | 7 | 6 | 17 | 9 |
| Porirua | 15 | 21 | 29 | 29 | 44 | 50 |
| Sunnyside | 15 | 22 | 17 | 21 | 32 | 43 |
| Cherry Farm | 18 | 24 | 20 | 18 | 38 | 42 |
| 133 | 171 | 180 | 159 | 313 | 330 | |
| Rotoroa | 54 | 63 | 13 | 10 | 67 | 73 |
| The Bridge (Wellington) | 12 | 18 | 3 | 3 | 15 | 21 |
| Totals | 199 | 252 | 196 | 172 | 395 | 424 |
Readmissions are not included in the above table.
Admissions under section 8 of the Act are made as a result of applications from the patients themselves; applications under section 9 are a result of applications made on the patients' behalves by reputable persons. The section 9 figures for both years include I patient transferred from a penal institution under section 21 of the Act. Rotoroa Island and the Bridge, Wellington, are conducted by the Salvation Army.
On the preliminary figures for 1973 the average number of occupied beds in psychiatric hospitals was about 3.08 per thousand of population. This is the lowest figure recorded since 1907. No absolute conclusions can be drawn from a low bed-occupancy rate; but a consistently falling rate, despite substantial admission rates, can fairly be assumed to indicate an active philosophy of treatment and successful therapeutic programmes.
Diagnosis—The three leading diagnoses in 1972 were: depressive neurosis, 818 cases; other personality disorders, 739 cases; and schizophrenia and paranoid states, 623 cases. These three diagnoses accounted for 44.4 percent of first admissions.
The numbers of first admissions to each division of psychiatric care by short list diagnoses are shown for 1972.
| Diagnosis | All Hospitals | Mental Hospitals | Public Hospital Psychiatric Units | Salvation Army |
|---|---|---|---|---|
| Senile and pre-senile dementia | 216 | 201 | 15 | - |
| Alcoholic psychosis | 49 | 37 | 12 | - |
| Other organic psychoses | 224 | 177 | 47 | - |
| Schizophrenia and paranoid states | 623 | 389 | 234 | - |
| Depressive psychosis | 480 | 290 | 190 | - |
| Other functional psychoses | 267 | 146 | 121 | - |
| Depressive neurosis | 818 | 349 | 469 | - |
| Other neuroses and psychosomatic disorders | 223 | 132 | 91 | - |
| Alcoholism | 555 | 478 | 33 | 44 |
| Other personality disorders | 739 | 467 | 272 | - |
| Transient situational disturbances and behaviour disorders of children | 142 | 70 | 72 | - |
| Non-psychotic mental disorders associated with physical condition | 84 | 76 | 8 | - |
| Mental retardation | 295 | 290 | 5 | - |
| No psychiatric diagnosis (includes observation) | 185 | 148 | 37 | - |
| Totals | 4,900 | 3,250 | 1,606 | 44 |
Numbers and rates of first admissions by diagnosis are shown in the following table.
| Diagnosis | Numbers | Rates per Million of Mean Population | ||||
|---|---|---|---|---|---|---|
| 1970 | 1971 | 1972 | 1970 | 1971 | 1972 | |
| Senile and pre-senile dementia | 264 | 208 | 216 | 93 | 73 | 74 |
| Alcoholic psychosis | 75 | 76 | 49 | 27 | 27 | 17 |
| Other organic psychoses | 279 | 215 | 224 | 99 | 75 | 77 |
| Schizophrenia and paranoid states | 565 | 538 | 623 | 200 | 188 | 214 |
| Depressive psychosis | 496 | 466 | 480 | 176 | 163 | 165 |
| Other functional psychoses | 195 | 224 | 267 | 69 | 78 | 92 |
| Depressive neurosis | 986 | 831 | 818 | 349 | 290 | 280 |
| Other neuroses and psychosomatic disorders | 316 | 260 | 223 | 112 | 91 | 76 |
| Alcoholism | 457 | 482 | 555 | 162 | 168 | 190 |
| Other personality disorders | 567 | 608 | 739 | 201 | 212 | 253 |
| Transient situational disturbances and behaviour disorders of children | 146 | 187 | 142 | 52 | 65 | 49 |
| Non-psychotic mental disorders associated with physical condition | 91 | 86 | 84 | 32 | 30 | 29 |
| Mental retardation | 325 | 307 | 295 | 115 | 107 | 101 |
| No psychiatric diagnosis (includes observation) | 234 | 184 | 185 | 83 | 64 | 63 |
| All cases | 4,996 | 4,672 | 4,900 | 1,769 | 1,631 | 1,680 |
The first admission rates for depressive neuroses and psychosomatic disorders, and for mental retardation decreased in the latest 3 years. Over the same period rates for other functional psychoses, alcoholism and other personality disorders increased.
Readmissions—A readmission is a person admitted as an inpatient for psychiatric care who has previously received psychiatric care in a New Zealand hospital.
Diagnosis—In the following table the numbers and rates of readmissions are shown by short list diagnoses.
| Diagnosis | Numbers | Rates per Million of Mean Population | ||||
|---|---|---|---|---|---|---|
| 1970 | 1971 | 1972 | 1970 | 1971 | 1972 | |
| Senile and pre-senile dementia | 115 | 76 | 101 | 41 | 27 | 35 |
| Alcoholic psychosis | 125 | 125 | 106 | 44 | 44 | 36 |
| Other organic psychoses | 275 | 274 | 229 | 97 | 96 | 79 |
| Schizophrenia and paranoid states | 2,054 | 1,799 | 1,995 | 727 | 628 | 684 |
| Depressive psychosis | 897 | 815 | 898 | 318 | 285 | 308 |
| Other functional psychoses | 557 | 540 | 670 | 197 | 189 | 230 |
| Depressive neurosis | 853 | 666 | 729 | 302 | 233 | 250 |
| Other neuroses and psychosomatic disorders | 266 | 204 | 207 | 94 | 71 | 71 |
| Alcoholism | 1,162 | 1,222 | 1,503 | 411 | 427 | 515 |
| Other personality disorders | 760 | 741 | 885 | 269 | 259 | 303 |
| Transient situational disturbances and behaviour disorders of children | 82 | 102 | 116 | 29 | 36 | 40 |
| Non-psychotic mental disorders associated with physical condition | 152 | 148 | 110 | 54 | 52 | 38 |
| Mental retardation | 899 | 886 | 865 | 318 | 309 | 297 |
| No psychiatric diagnosis (includes observation) | 141 | 130 | 111 | 50 | 45 | 38 |
| All cases | 8,338 | 7,728 | 8,525 | 2,952 | 2,698 | 2,923 |
Readmission rate is not necessarily an indication of therapeutic failure and may in many respects be a more accurate index of therapeutic vigour. It is still possible to encounter grossly over-simplified ideas with regard to the operations of psychiatric hospitals. For example it is sometimes assumed that discharge from hospital is, or should be, an indication of final and complete cure.
In certain respects the long-established practice of publishing readmission rates for psychiatric hospitals (no similar figures appear for general hospitals) seem to perpetuate this misconception. Readmission figures are sometimes quoted as evidence that psychiatric hospitals “do not actually cure people.” As with many other types of illness psychiatric disorders may require more than one hospital admission before the condition is stabilised.
Discharges—There are three principal ways of being discharged from psychiatric hospital: (a) outright discharge, which means being formally discharged at the time of leaving hospital; (b) discharge on leave; and (c) discharged “not committed”, which means being discharged from a psychiatric hospital on the grounds that the patient's mental condition does not warrant his being detained. All people discharged from a psychiatric unit of a public hospital are discharged outright.
There were 12,995 discharges in 1972. Of these 10,230 were outright discharges, 2,431 were discharges on leave, and 334 were discharged “not committed”.
The principal diagnoses were: schizophrenia and paranoid states 2,674 cases; all forms of alcoholism 2,111 cases, other personality disorders 1,547 cases, and depressive neurosis 1,587 cases.
The following table shows the number of discharges for 1972 by short list diagnoses.
| Diagnosis | Outright Discharge | Leave | Not Committed | Total |
|---|---|---|---|---|
| Senile and pre-senile dementia | 118 | 33 | - | 151 |
| Alcoholic psychosis | 85 | 73 | 1 | 159 |
| Other organic psychoses | 280 | 96 | - | 376 |
| Schizophrenia and paranoid states | 1,821 | 837 | 16 | 2,674 |
| Depressive psychosis | 1,260 | 93 | 2 | 1,355 |
| Other functional psychoses | 738 | 169 | 5 | 912 |
| Depressive neurosis | 1,492 | 38 | 17 | 1,547 |
| Other neuroses and psychosomatic disorders | 416 | 22 | 3 | 441 |
| Alcoholism | 1,365 | 581 | 6 | 1,952 |
| Other personality disorders | 1,313 | 194 | 80 | 1,587 |
| Transient situational disturbances and behaviour disorders of children | 240 | 17 | 5 | 262 |
| Non-psychotic mental disorders associated with physical condition | 120 | 40 | 3 | 163 |
| Mental retardation | 873 | 237 | 5 | 1,115 |
| No psychiatric diagnosis (includes observation) | 109 | 1 | 191 | 301 |
| Totals | 10,230 | 2,431 | 334 | 12,995 |
Duration of stay—Over half (53.2 percent) of those discharged left hospital within a month of admission, 27.6 percent left in the next 2 months, and a further 8.7 percent were discharged in the subsequent 3 months. The average stay of all discharges was 35 weeks.
Deaths—In 1972 there were 558 deaths in psychiatric hospitals, 13 in psychiatric units of public hospitals and one in Rotoroa Sanatorium. In addition 59 died while on leave.
The principal diagnosis was senile and pre-senile dementia, 191 cases. Next came schizophrenia and paranoid states, 99 cases, and other organic psychoses, 97 cases.
In 1972 93 people died during the first month in hospital, and a further 47 deaths occurred in people who had been in hospital for over 1 month but under 3 months. The provisional total of deaths in psychiatric hospitals in 1973 was 583.
Staff—The pattern of staffing at 31 March 1973 is compared in the following table for psychiatric and general hospitals.
Staff establishments were higher in psychiatric hospitals, as there were numbers of unfilled vacancies.
| Group | Psychiatric Hospitals | General Hospitals* | ||
|---|---|---|---|---|
| Number* | Percentage of Total Nursing Staff | Number* | Percentage of Total Nursing Staff | |
| *Average full-time equivalent. | ||||
| Matron | 25 | 0.8 | 150 | 0.9 |
| Assistant Matrons and Supervisor | 100 | 3.1 | 426 | 2.6 |
| Charge nurse/ward sister | 384 | 12.1 | 1,139 | 7.0 |
| Tutor | 34 | 1.1 | 296 | 1.8 |
| Staff nurse/staff sister | 613 | 19.3 | 3.233 | 19.8 |
| RCK/RM/RMN Karitane | 59 | 1.8 | 1,695 | 10.4 |
| Sub-total (percent) | ... | 38.2 | ... | 42.5 |
| Hospital aids, etc. | 1,282 | 40.4 | 2,720 | 16.6 |
| Trainee or student nurse | 648 | 20.4 | 4,792 | 29.3 |
| Student community nurse | 26 | 0.8 | 1,908 | 11.7 |
| Totals | 3,170 | 100.0 | 16,360 | 100.0 |
GENERAL—Increasing interest is being shown in the heights and weights of New Zealanders—adults as well as children. Medical and health experts have formed the impression that the heights of persons in New Zealand have increased significantly over the past 50 years. It is likely that weights have also increased.
Most recent New Zealand figures certainly show that the above impression is justified, at least as far as school children are concerned. They also show that maturity judged by the development of secondary sex characteristics in both male and female children occurs on the average at an earlier age.
The various surveys show that New Zealand school children have exhibited a pattern of growth similar to that of children in other developed countries. The growth spurt appears between 11 and 12 years in girls and between 12 and 14 years in boys, and in both sexes is associated with early maturation. It is probable that in line with other countries the development of secondary sex characteristics are occurring earlier than in past years. Causes of earlier physical development are likely to have been multifactorial and to include better housing and education, improved nutritional standards, fewer debilitating diseases, and the effects of measures taken to prevent deficiency diseases.
New Zealand figures suggest that significant changes in height, which have been a feature of the past half-century, will not continue. There is reason to believe that the continued weight increases are indicative of an emerging problem of overweight for height at all ages. This suggests that in New Zealand obesity may become the main nutritional problem. In view of its relationship to cardiovascular and other diseases in the adult, obesity requires greater attention when the health and physical development of New Zealand children are considered.
CHILDREN—Surveys of heights and weights of primary school children in New Zealand have been made from time to time—namely in 1913, 1925, 1934, 1954 and more recently in 1969. Each successive survey has shown general increases over the preceding survey in heights and weights at all ages, in some decades more marked than others. The 1969 survey shows that the very marked gain in both heights and weights which occurred between 1934 and 1954 now tends to be slowing down, especially at the lower age levels, although a significant gain in weights at the higher age levels still seems to be continuing.
In 1954 the survey covered 22,078 boys and 21,845 girls selected on a nation-wide sample basis. Compared with the 1934 survey it was found that for both boys and girls the average heights and weights had increased fairly uniformly on a geographic basis, that is, for main urban areas, minor urban areas and rural areas; they also applied to both non-Maoris and Maoris. (Other evidence indicated that the increases were primarily due to earlier maturity rather than to changes in racial characteristics.)
In the 1969 survey the total number of school children included in the sample was 24,852, taken from 19 health districts in proportion to the populations of the districts. Approximately equal numbers, about 2,000, were sampled from each age group from 5 to 15 years. Roughly one-sixth of the children were Maoris and five-sixths were, in the main, Europeans but included small numbers of Indians, Chinese, Samoans and other Pacific Islanders of the same Polynesian stock as the Maoris themselves. The number of Maoris was chosen again in relation to the total Maori population in each district.
As previous surveys had shown little significance in the difference of heights and weights between urban areas and rural districts no attempt was made during the 1969 survey to obtain separate figures for geographical groupings although, in selecting schools, allowance was made in the choice so as not to overload the figures in the direction of either urban, rural, or socio-economic groups.
Information from the surveys is related in the following tables.
| MEAN HEIGHTS (cm) | ||||||||||
|---|---|---|---|---|---|---|---|---|---|---|
| Average Age (Years) | 1913 | 1925 | 1934 | 1954 | 1969 | |||||
| Boys | Girls | Boys | Girls | Boys | Girls | Boys | Girls | Boys | Girls | |
| NOTE: 1934 values are convened from whole inches. | ||||||||||
| 5 | 109.2 | 109.2 | ||||||||
| 5 1/2 | 112.75 | 111.68 | 112.23 | 111.51 | ||||||
| 6 | 112.1 | 112.6 | 114.3 | 114.3 | ||||||
| 6 1/2 | 118.72 | 117.81 | 118.34 | 117.61 | ||||||
| 1 | 117.8 | 117.4 | 119.4 | 119.4 | ||||||
| 7 1/2 | 124.61 | 123.60 | 124.62 | 123.87 | ||||||
| 8 | 123.8 | 123.4 | 124.5 | 124.5 | ||||||
| 8 1/2 | 130.20 | 129.03 | 130.09 | 128.87 | ||||||
| 9 | 128.7 | 131.1 | 129.5 | 129.5 | ||||||
| 9 1/2 | 125.31 | 134.42 | 135.27 | 134.28 | ||||||
| 10 | 132.5 | 132.5 | 134.2 | 134.4 | 134.6 | 134.6 | ||||
| 10 1/2 | 136.8 | 135.8 | 140.46 | 140.31 | 140.10 | 140.03 | ||||
| 11 | 136.5 | 136.7 | 138.9 | 138.2 | 137.2 | 139.7 | ||||
| 11 1/2 | 141.0 | 141.0 | 145.03 | 146.35 | 145.38 | 147.66 | ||||
| 12 | 141.1 | 141.8 | 142.5 | 143.9 | 144.8 | 144.8 | ||||
| 12 1/2 | 144.5 | 147.6 | 150.47 | 152.48 | 151.26 | 152.95 | ||||
| 13 | 145.6 | 14S.0 | 146.8 | 150.1 | 149.9 | 149.9 | ||||
| 13 1/2 | 149.4 | 151.9 | 156.79 | 156.92 | 157.48 | 158.02 | ||||
| 14 | 150.6 | 152.1 | 151.9 | 153.8 | 154.9 | 154.9 | ||||
| 14 1/2 | 154.4 | 155.7 | 162.94 | 159.51 | 164.56 | 160.45 | ||||
| 15 | 155.2 | 152.6 | 157.5 | 157.5 | ||||||
| 15 1/2 | 168.00 | 161.16 | 169.18 | 162.21 | ||||||
| MEAN WEIGHTS (kg) | ||||||||||
|---|---|---|---|---|---|---|---|---|---|---|
| Average Age (Years) | 1913 | 1925 | 1934 | 1954 | 1969 | |||||
| Boys | Girls | Boys | Girls | Boys | Girls | Boys | Girls | Boys | Girls | |
| 5 | 19.1 | 18.6 | ||||||||
| 5 1/2 | 20.72 | 20.06 | 2.33 | 19.93 | ||||||
| 6 | 20.4 | 20.7 | 20.9 | 20.4 | ||||||
| 6 1/2 | 22.92 | 22.48 | 22.64 | 22.30 | ||||||
| 7 | 22.4 | 22.1 | 22.7 | 22.2 | ||||||
| 7 1/2 | 25.46 | 25.02 | 25.35 | 25.30 | ||||||
| 8 | 24.8 | 24.3 | 24.9 | 24.5 | ||||||
| 8 1/2 | 28.13 | 27.81 | 28.22 | 27.73 | ||||||
| 9 | 27.1 | 26.6 | 27.7 | 27.2 | ||||||
| 9 1/2 | 31 32 | 30.98 | 30.87 | 30.77 | ||||||
| 10 | 28.9 | 28.6 | 30.1 | 29.5 | 29.9 | 29.5 | ||||
| 10 1/2 | 31.4 | 30.4 | 34.49 | 34.96 | 33.97 | 34.60 | ||||
| 11 | 31.4 | 31.4 | 32.6 | 32.2 | 32.7 | 33.1 | ||||
| 11 1/2 | 33.4 | 33.7 | 37.49 | 39.37 | 37.88 | 40.49 | ||||
| 12 | 34.2 | 34.6 | 34.7 | 35.9 | 35.4 | 37.2 | ||||
| 12 1/2 | 36.2 | 38.4 | 41.73 | 44.64 | 42.37 | 45.05 | ||||
| 13 | 37.6 | 39.9 | 38.1 | 40.9 | 39.9 | 42.6 | ||||
| 13 1/2 | 39.8 | 42.9 | 47.02 | 49.85 | 47.93 | 50.69 | ||||
| 14 | 42.7 | 43.4 | 41 9 | 45.3 | 44.0 | 45.8 | ||||
| 14 1/2 | 44.0 | 47.4 | 53.28 | 54.33 | 54.52 | 54.55 | ||||
| 15 | 45.4 | 45.5 | 46.7 | 49.0 | ||||||
| 15 1/2 | 58.67 | 56.65 | 60.13 | 58.16 | ||||||
| MEAN HEIGHTS (cm)—MAORIS | ||||||
|---|---|---|---|---|---|---|
| Average Age (Years) | 1934 | 1954 | 1969 | |||
| Boys | Girls | Boys | Girls | Boys | Girls | |
| 5 1/2 | (109.2) | .. | 111.40 | 110.41 | 112.11 | 110.83 |
| 6 1/2 | (115.6) | (119.4) | 116.94 | 116.36 | 117.38 | 116.69 |
| 7 1/2 | (121.9) | (123.2) | 122.86 | 121.89 | 124.33 | 123.51 |
| 8 1/2 | (128.3) | (127.0) | 128.07 | 127.43 | 128.70 | 128.65 |
| 9 1/2 | (133.4) | (132.1) | 133.63 | 133.25 | 134.05 | 134.24 |
| 10 1/2 | (138.4) | (138.4) | 138.40 | 139.07 | 139.52 | 140.31 |
| 11 1/2 | (143.5) | (144.8) | 143.48 | 145.24 | 144.98 | 148.06 |
| 12 1/2 | (147.3) | (148.6) | 149.25 | 151.54 | 151.89 | 154.67 |
| 13 1/2 | (152.4) | (152.4) | 156.06 | 155.19 | 158.52 | 157.59 |
| 14 1/2 | (157.5) | (154.9) | 161.39 | 157.61 | 164.72 | 160.06 |
| 15 1/2 | .. | .. | 166.27 | 158.85 | 169.26 | 161.17 |
| MEAN WEIGHTS (kg)—MAORIS | ||||||
|---|---|---|---|---|---|---|
| Average Age (Years) | 1934 | 1954 | 1969 | |||
| Boys | Girls | Boys | Girls | Boys | Girls | |
| NOTE: The 1934 figures are interpolated from data tabulated at ages, 5, 6, etc. Mean weights are converted from whole pounds. | ||||||
| 5 1/2 | (19.5) | .. | 20.97 | 20.28 | 20.63 | 19.94 |
| 6 1/2 | (21.8) | (20.4) | 23.07 | 22.65 | 22.83 | 22.42 |
| 7 1/2 | (24.7) | (23.4) | 25.52 | 25.03 | 26.32 | 26.00 |
| 8 1/2 | (27.7) | (26.1) | 28.20 | 27.72 | 28.40 | 28.46 |
| 9 1/2 | (30.2) | (28.8) | 31.91 | 31.34 | 31.27 | 32.11 |
| 10 1/2 | (32.9) | (33.8) | 34.99 | 35.58 | 34.71 | 36.44 |
| 11 1/2 | (35.8) | (39.0) | 38.39 | 40.13 | 38.70 | 42.91 |
| 12 1/2 | (40.1) | (44.2) | 42.76 | 47.24 | 44.36 | 49.75 |
| 13 1/2 | (45.1) | (48.5) | 49.21 | 52.53 | 50.76 | 54.43 |
| 14 1/2 | (49.9) | (50.6) | 55.22 | 57.36 | 57.22 | 58.74 |
| 15 1/2 | .. | .. | 61.04 | 60.74 | 62.70 | 61 02 |
Thus Maori children were seen to be consistently heavier than non-Maori children of the same age, more predominantly so for females in whom the maximum difference occurred a year earlier than in the males. From studying the ratio of average height to weight it can be postulated that at all ages Maoris were consistently heavier per centimetre of height than non-Maoris.
A detailed report on the 1969 survey was published in the special report series of the Department of Health entitled Physical Development of New Zealand School Children 1969.
International Comparison—In the following table New Zealand figures are set alongside those of other national surveys. The New Zealand figures were compiled by combining Maori and non-Maori figures using appropriate weighting factors. (11.5 percent of New Zealand children aged 5 to 15 in 1969 were Maori.)
In height New Zealand school children of 1969 compared very closely with Canadian children of the same year; the only marked difference was that New Zealand girls weighed consistently more than their Canadian counterparts. American children in 1963 do not appear to have differed greatly in height from New Zealand children in 1969, but were heavier, the difference being greater in boys. Comparison with the United Kingdom 1965 figures showed only slight differences in weight but New Zealand girls tended to be heavier.
The results of surveys will be affected to some extent by the time of the year at which they were made; growth in height is greater in the spring whereas weight tends to show a spurt in the autumn months.
| Average Age | Boys | Girls | ||||||
|---|---|---|---|---|---|---|---|---|
| U.S. 1963 | Canada 1969 | N.Z. 1969 | U.K. 1965 | U.S. 1963 | Canada 1969 | N.Z. 1969 | U.K. 1965 | |
NOTE: New Zealand figures are interpolated median heights and weights. Source: Department of Health | ||||||||
| Median Height (Inches) | ||||||||
| 6 | 46.0 | 45.0 | 45.4 | 45.0 | 45.5 | 45.0 | 45.1 | 44.6 |
| 7 | 48.5 | 47.5 | 47.8 | 47.5 | 48.0 | 47.0 | 47.5 | 46.9 |
| 8 | 50.7 | 49.5 | 50.1 | 49.5 | 50.1 | 49.0 | 49.7 | 49.1 |
| 9 | 52.8 | 51.5 | 52.2 | 51.8 | 52.3 | 51.5 | 51.7 | 51.3 |
| 10 | 54.6 | 54.0 | 54.2 | 53.7 | 54.5 | 53.5 | 53.8 | 53.6 |
| 11 | 56.5 | 56.0 | 56.2 | 55.8 | 56.5 | 57.5 | 56.5 | 56.0 |
| 12 | 58.5 | 58.0 | 58.3 | 58.0 | 59.0 | 58.5 | 59.2 | 58.5 |
| 13 | 60.8 | 60.5 | 60.7 | 60.3 | 61.6 | 61.0 | 61.3 | 61.0 |
| 14 | 63.6 | 63.5 | 63.5 | 62.9 | 63.0 | 62.5 | 62.7 | 62.8 |
| 15 | 65.9 | 66.0 | 65.9 | 65.9 | 63.7 | 63.0 | 63.5 | 63.6 |
| Median Weight (Pounds) | ||||||||
| 6 | 49 | 45 | 46.7 | 46 | 46 | 44 | 46.0 | 45 |
| 7 | 54 | 51 | 51.9 | 51 | 52 | 49 | 51.7 | 50 |
| 8 | 61 | 56 | 57.7 | 55 | 58 | 54 | 57.2 | 55 |
| 9 | 67 | 63 | 63.7 | 61 | 65 | 61 | 62.7 | 61 |
| 10 | 74 | 69 | 69.8 | 67 | 73 | 68 | 70.0 | 68 |
| 11 | 81 | 76 | 77.4 | 74 | 82 | 79 | 80.1 | 78 |
| 12 | 90 | 86 | 86.5 | 83 | 92 | 88 | 91.5 | 89 |
| 13 | 101 | 95 | 97.4 | 94 | 104 | 100 | 103.8 | 101 |
| 14 | 115 | 113 | 111.2 | 107 | 115 | 111 | 114.2 | 113 |
| 15 | 128 | 124 | 124.5 | 121 | 122 | 116 | 121.4 | 120 |
In a study made in 1966 for the School of Physical Education at the University of Otago, Miss Kathryn McQuarrie showed that for Norwegian and Swedish children similar increases in heights and weights to those of New Zealand children had been recorded, and that for Japanese children the increases were relatively greater. It is of interest to note that for Norwegian and Swedish boys and girls over a period 50 years, there have been close correlations with the changes for New Zealand boys and girls, though in more recent years the New Zealand children have become relatively heavier.
Adults—Statistics from surveys of military personnel were published in the 1974 and earlier issues of the Yearbook.
A study of Maori somatology was made by Sir Peter Buck using as his subjects the remnants of the Maori Battalion after the First World War. According to Buck, the weight and height of the men was fairly representative of the race as a whole, the average being, if anything, rather on the low side. The average height of 424 men was found to be 67.3 inches and the average weight of 384 men was 163.9 pounds. (Sir Peter Buck's study covered a wide range of other physical characteristics and was published in the Journals of the Polynesian Society in 1922 and 1923.)
Comparative Studies of Adults—Examinations of conscripts in Sweden have shown an increase in mean height of no less than 2.3 cm or nearly 1 inch (from 174.4 to 176.7 cm) from 1940 to 1960 (Official Statistics of Sweden).
Other studies by McCane, 1962, and Tanner, 1962, have led to the conclusion that during the past century the growth in height of the population of western Europe has increased by approximately 1 centimetre each decade, with no signs of ceasing. (2.54 centimetres equal 1 inch.)
A report in Newsweek of 29 July 1968 of studies at Vassar and Smith Colleges shows that between 1920 and 1968 the average height of 18-year-old boys increased from 69.0 in. to 70.2 in. and their average weight from 126.6 lb to 144.8 lb. For 18-year-old girls the average height increased from 62.4 in. to 64.4 in. and the average weight from 116.2 lb to 126.2 lb.
For purposes of comparison, some United States averages are given in the following table; they are based on a nationwide sample of 6,672 persons aged 17 to 79 years selected for the health examination survey conducted from October 1959 to December 1962 by the Department of Health, Education and Welfare. (Source: Statistical Abstract of the United States, 1966.)
| Item | Age Group (Years) | |||||||
|---|---|---|---|---|---|---|---|---|
| 17-19 | 20-24 | 25-34 | 35-44 | 45-54 | 55-64 | 65-74 | 75-79 | |
| Men— | ||||||||
| Height in. | 68.2 | 68.7 | 69.1 | 68.5 | 68.2 | 67.4 | 66.9 | 65.9 |
| Weight lb | 168 | 160 | 171 | 172 | 172 | 166 | 160 | 150 |
| Women— | ||||||||
| Height in. | 63.0 | 63 S | 63.7 | 63.5 | 62.9 | 62.4 | 61.5 | 61.1 |
| Weight lb | 142 | 129 | 136 | 144 | 147 | 152 | 146 | 138 |
Table of Contents
GENERAL—Social services are continually evolving as a collective response to the changing needs of society. The operative basis for social security administration has been the acceptance by the community of responsibility for income maintenance and medical treatment of those who are handicapped or otherwise in need.
Social welfare policies and programmes have received increased emphasis at the personal level in New Zealand in recent years, and measures of co-ordination between Government and voluntary agencies have been strengthened.
The Department of Social Welfare is the main Government agency.
Also involved in social welfare are the Departments of Health, Education, Justice, Labour, and Maori Affairs.
DEPARTMENT OF SOCIAL WELFARE—The principal functions of the Department of Social Welfare are:
To administer the Department of Social Welfare Act 1971; the Children and Young Persons Act 1974; Part I of the Social Security Act 1964; the Family Benefits Home Ownership Act 1964; and to provide for the effective administration and servicing of the War Pensions Act 1954; and the Rehabilitation Act 1941.
Advise the Minister on the development of social welfare policies for New Zealand.
Provide such social welfare services as the Minister may from time to time direct.
Provide for the training of persons to undertake social welfare activities in Government or voluntary organisations.
Maintain close liaison with and encourage co-operation and co-ordination among any organisations and individuals (including departments of State and other agencies of the Crown) engaged in social welfare activities.
Undertake and promote research into aspects of social welfare.
Provide administrative services to boards, councils, committees, and agencies.
The objects of the department's administrative services are to provide such administrative support, advisory, training, and research services as necessary for the efficient and effective administration of the department's functions. The department is a principal adviser to Government on matters of social welfare policy. It also has particular responsibilities to private and voluntary organisations. Units with special responsibilities for liaison with such organisations and for publicity and information are to be established so that the public are kept abreast of developments.
The objectives of the policy for benefits and pensions are:
To safeguard individuals in the community against loss of income or reduction in income brought about by age, incapacity, widowhood, orphanhood, unemployment or other circumstances by providing income security at a level which will enable them to belong and participate in the community; and benefits for children as a contribution towards their maintenance.
To provide assistance towards housing finance for families of moderate means by way of an advance of family benefit.
(c) To provide supplementary assistance for those whose income and financial resources are in- sufficient to meet their living costs and other commitments.
To provide pensions on the death or disablement of members of the forces as recompense for physical loss, at a level reviewed and set each year at 1 April in accordance with movements in the Consumers' Price Index; and to provide other allowances and concessions according to the nature and extent of disablement.
To provide and maintain a service to ensure the rehabilitation and resettlement in civil life of former members of the forces.
The objectives of the policy for social work services are:
To make better provision for the maintenance, care, and control of children who are under the protection of the State and to provide generally for the protection and training of indigent, neglected, maltreated, and delinquent children.
To establish and maintain institutions, or arrange foster homes, for the care and control of children committed to the guardianship of the State.
To promote and maintain a preventive work, social work, and general counselling service for persons and families facing social and economic difficulties.
To promote and maintain an effective rehabilitation service to ensure that disabled persons are given encouragement, counselling, and assistance to restore them to a fuller and more meaningful life.
The social work services involve individual and family casework and general welfare work. Emphasis is given to the care and control of children including those with emotional or behavioural problems. With the establishment of the new department it is hoped to evolve more comprehensive policies of family care, preventive work, and community participation.
The residential programme includes the inspection of children's homes run by voluntary organisations and the licensing and supervision of child care centres in order to ensure satisfactory standards are maintained. This division also has a responsibility for children in licensed foster homes.
Added emphasis is to be given in the programme to the rehabilitation of disabled persons. Coordination with other agencies which also have responsibilities in this work, such as the Department of Health and Department of Labour, is achieved through representation of the department on the National Civilian Rehabilitation Committee, which also acts as an advisory body to Government on rehabilitation.
SOCIAL SECURITY DEVELOPMENT—Social security is a comprehensive plan of State assistance by a system of cash benefits and free or subsidised medical and hospital visions for the safeguarding of health. The principal objects of the legislation which came into operation on 1 April 1939 were: (a) to substitute a system of extended cash benefits on contributory basis for the system of non-contributory civil pensions, e.g., old age, widows', and other pensions; (b) the inauguration of a system of medical and hospital benefits and of other related benefits. Universal family benefits were introduced on 1 April 1946, since which date each mother has received a benefit in respect of each of her dependent children irrespective of the family income or property. The governing legislation is now the Social Security Act 1964.
A Royal Commission to inquire into social security began hearing submissions in December 1969. Its report was published in March 1972 as parliamentary paper H.53. A section of the report was reprinted as a special article in the 1972 issue of the Yearbook entitled Evolution of Social Security in New Zealand.
MAIN FEATURES OF SOCIAL SECURITY SYSTEM—The present system cannot be characterised according to any single principle, theory, or formula. It has evolved from changing needs and experience in dealing with them. For example, it looks like a form of community insurance, but is not financed, funded, or administered on an insurance basis. It is contributory, because it is financed from taxation; it acts with the progressive income tax structure in redistributing income. But a person's benefit bears no relation to his tax contribution, While basically income-tested and selective as to need within classes of benefit, it is also universally applied without regard to other income or means in three main cases (superannuation, family, and medical benefits) and in the lesser miners' benefit. It transfers income from the more to the less affluent mainly on the basis of greatest help for those in greatest need. It reflects the traditional humanitarian, egalitarian, and pragmatic approach of New Zealanders and, most importantly, reflects acceptance of community responsibility for social welfare.
The main features of the system are:
Eligibility for benefits (other than emergency) is based on residence for varying qualifying periods and not on the amount of tax paid.
Benefits (other than family, miners', superannuation, and medical benefits) are subject to an income test with the amount of benefit being reduced if other income is over a prescribed level. Emergency benefits and supplementary assistance are subject to tests of both income and property.
In paying superannuation and family benefit without any tests of income or need it is assumed that for everybody over 65 years and for all families with dependent children, a community-financed income supplement is necessary and desirable, irrespective of actual financial need or resources. Miners' benefit is not income tested, on the accepted assumption that if a person is disabled by disease arising from mining he needs to be compensated for losing income and enjoyment of life and that the income loss does not require to be established or tested.
The concept of the family as the fundamental economic and social unit is recognised by the payments made in respect of the otherwise ineligible but dependent wife and children of a beneficiary; and the taking into account of the income of the husband or wife (legal or de facto) of a beneficiary when assessing the amount of those benefits subject to an income test.
Contribution under a graduated income tax system and payment of benefits at a flat rate irrespective of contributions (that is, taxes paid) distinguishes the New Zealand system from many of those of other countries.
The cash and medical benefits give a comprehensive coverage of need.
Beneficiaries are given incentives to self-help and to work. From the start, amounts payable from standard benefits have been set below the average wages of low-earner groups; and small incomes, and most property, have been disregarded in assessing an individual's benefit. Conversely the income-tested age benefit for men over 60 years and some women over 55 years, superannuation for people over 65 years, and the benefits for widows with dependent children or over a prescribed age recognise these people's right to stop working if they want to.
Contribution through taxation is compulsory. The right to “contract out” on the grounds that the individual may not need, or qualify for, public aid is denied in the community interest, as it is with other State services such as education, defence, police.
The Social Security Commission has wide discretionary power to grant, withhold, or reduce benefits, and a general power of direction is given to the Ministers of Health and Social Welfare (who are often the same person).
With certain exceptions no person is entitled to more than one analogous benefit from either New Zealand or overseas.
Standard rates with supplements, rather than differential rates according to the class of benefit, relate benefits to need rather than to the cause of need.
ADMINISTRATION—The Social Security Commission in the Department of Social Welfare administers, under the direction of the Minister of Social Welfare, Part I of the Social Security Act 1964 dealing with cash benefits, while matters concerning medical, hospital, and other related benefits are administered by the Department of Health under the direction of the Minister of Health (see Section 5A).
The War Pensions Act 1954 is also administered by the Department of Social Welfare, which likewise handles ex-servicemen's rehabilitation.
Child welfare activities are governed by the Children and Young Persons Act and other legislation detailed later in this section.
FINANCIAL PROVISIONS—Finance to enable the provisions of the Act to be carried out was originally provided for by the establishment within the Public Account of the Social Security Fund. The principal revenue of the fund was derived from a charge (collected by the Inland Revenue Department) on salaries, wages, and other income, including the income of companies, but the Act also made provision for the payment to the fund of such other moneys as might be appropriated by Parliament from time to time. Social security tax and income tax were combined in the tax deduction tables prepared for the operation of the PAYE system from 1 April 1958.
On 1 April 1964 the Social Security Fund was absorbed into the Consolidated Revenue Account in connection with a rearrangement of Government accounts.
From 1 April 1964 the payment of medical benefits has been made by the Department of Health from money appropriated by Parliament for this purpose. From 1 April 1958, the cost of public hospital administration has been borne directly by general taxation; treatment in public hospitals is free. Details of medical benefits are set out in Section 5A—Health and Medical Services.
Payments—The New Zealand system has developed the following types of social security assistance.
Cash benefits as of right for those eligible by category, residence, and income, paid at flat standard rates (plus allowance for dependants) without regard to taxes paid.
Emergency benefits for those who need help but who are not, for any reason, eligible for standard benefits.
Supplementary assistance for those beneficiaries whose incomes and resources, including any social security benefit, cannot meet their particular needs or reasonable commitments.
Medical and pharmaceutical benefits for all members of the community; free public and subsidised private hospital care.
Universally applied benefits (with no means test) for dependent children, and for those over 65 years of age.
Particulars of payments under the Social Security Act during the last 5 financial years are contained in the following table.
| Item | 1969-70 | 1970-71 | 1971-72 | 1972-73 | 1973-74 |
|---|---|---|---|---|---|
| *A considerable number of superannuation beneficiaries transferred to age benefits during the year following changes in tax law for those over 65 years of age. | |||||
| Cash benefits— | $(thousand) | ||||
| Superannuation | 88,819 | 101,009 | 114,575 | 133,236* | 135,681 |
| Age | 67,003 | 76,173 | 88,441 | 115,840* | 169,583 |
| Widows' | 13,742 | 15,936 | 18,026 | 21.158 | 24,821 |
| Orphans' | 150 | 179 | 213 | 235 | 295 |
| Family | 72,318 | 70,402 | 73,886 | 128,733 | 160,103 |
| Invalids' | 6,093 | 6,985 | 8,017 | 9,830 | 11,710 |
| Miners' | 99 | 95 | 94 | 93 | 92 |
| Unemployment | 1,465 | 1,004 | 2,683 | 5,034 | 3,462 |
| Sickness | 6,073 | 7,136 | 8,333 | 11,365 | 14,590 |
| Emergency | 4,025 | 5,948 | 8,613 | 14,125 | 19,526 |
| Supplementary assistance | 2,703 | 3,164 | 4,171 | 4,151 | 3,912 |
| Advances for repairs to homes | 54 | 61 | 61 | 71 | 101 |
| Employment subsidy for disabled civilians | 8 | 8 | 6 | 8 | 4 |
| Capitalisation of family benefit | 7,486 | 10,649 | 6,619 | 6,332 | 7,114 |
| Total, cash benefits | 270,038 | 298,749 | 333,737 | 450,211 | 550,994 |
| Medical benefits— | |||||
| Medical | 9,695 | 11,756 | 11,797 | 14,561 | 20,795 |
| Hospital | 5,487 | 6,627 | 6,870 | 8,082 | 8,630 |
| Maternity | 2,956 | 3,133 | 3,821 | 3,864 | 3,372 |
| Pharmaceutical | 27,308 | 30,783 | 33,236 | 40,020 | 45,166 |
| Supplementary | 7,628 | 9,375 | 10,637 | 11,524 | 12,457 |
| Total, medical benefits | 53,074 | 61,674 | 66,361 | 78,050 | 90,418 |
About one-half of the total expenditure on cash benefits (including supplementary assistance advances for repairs to homes, and employment subsidy for disabled civilians) is paid without an income test.
The following table summarises social security expenditure according to type of benefit and per head of mean population, and also relates expenditure to national income.
| Year Ended 31 March | National Income at Factor Cost | Expenditure* | ||||
|---|---|---|---|---|---|---|
| Medical Benefits | Family Benefits | Other Benefits | Total | Per Head of Mean Population† | ||
*Excluding capitalised family benefits. †Prior to 1965 benefits were paid to public hospitals when beneficiaries were receiving treatment. | ||||||
| $(million) Amount | $ | |||||
| 1963 | 2,504 | 47.5 | 64.6 | 118.6 | 230.7 | 92.34 |
| 1964 | 2,742 | 48.4 | 68.5 | 126.2 | 243.1 | 95.32 |
| 1965 | 3,002 | 36.5 | 65.9 | 132.8 | 235.3 | 90.46 |
| 1966 | 3,261 | 39.6 | 70.2 | 137.3 | 247.0 | 93.31 |
| 1967 | 3,370 | 42.2 | 66.8 | 150.7 | 259.7 | 96.35 |
| 1968 | 3,467x | 44.4 | 71.4 | 163.5 | 279.3 | 102.04 |
| 1969 | 3,650x | 47.4 | 68.3 | 174.5 | 290.2 | 105.03 |
| 1970 | 4,041x | 53.1 | 72.3 | 190.2 | 315.6 | 112.10 |
| 1971 | 4,629x | 61.7 | 70.4 | 217.6 | 349.7 | 123.52 |
| 1972 | 5,449x | 66.3 | 73.9 | 253.2 | 393.4 | 136.77 |
| 1973 | 6,320x | 78.1 | 128.7 | 315.1 | 521.9 | 177.98 |
| 1974 | 7,521x | 90.4 | 160.1 | 383.7 | 634.2 | 211.72 |
| Percentage of Expenditure to National Income | ||||||
| 1963 | ... | 1.9 | 2.6 | 4.7 | 9.2 | ... |
| 1964 | ... | 1.8 | 2.5 | 4.6 | 8.9 | ... |
| 1965 | ... | 1.2 | 2.2 | 4.4 | 7.9 | ... |
| 1966 | ... | 1.2 | 2.2 | 4.3 | 7.6 | ... |
| 1967 | ... | 1.3 | 2.0 | 4.5 | 7.7 | ... |
| 1968 | ... | 1.3 | 2.1 | 4.7 | 8.1 | ... |
| 1969 | ... | 1.3 | 1.8 | 4.7 | 8.0 | ... |
| 1970 | ... | 1.3 | 1.8 | 4.7 | 7.8 | ... |
| 1971 | ... | 1.3 | 1.5 | 4.7 | 7.5 | ... |
| 1972 | ... | 1.2 | 1.4 | 4.6x | 7.2x | ... |
| 1973 | ... | 1.2x | 2.0x | 5.0x | 8.3x | ... |
| 1974 | ... | 1.2 | 2.1 | 5.1 | 8.4 | ... |
Government expenditure on social services (including health and education) is shown in relation to total Government expenditure in a table in the Statistical Summary at the back of this Yearbook.
Benefits and Pensions in Force—The total number of persons in respect of whom social security cash benefits (including dependent wives and children) were payable at 31 March 1974 was 1,390,690, or 4,570 per 10,000 of population. A year earlier the corresponding figures were 1,351,035 and 4,552 respectively. Particulars of the various social security benefits in force at 31 March for the 4 latest years were as follows.
| Class of Benefit | 1971 | 1972 | 1973 | 1974 |
|---|---|---|---|---|
| *About 25,000 superannuation beneficiaries transferred to age benefit during the year following changes in tax law for those over 65 years of age. | ||||
| Superannuation | 146,299 | 149,190 | 126,581* | 119,025 |
| Age | 102,797 | 106,681 | 140,719* | 160,137 |
| Widows' | 15,899 | 16,540 | 16,962 | 16,854 |
| Orphans' | 319 | 306 | 316 | 387 |
| Family | 414,195 | 420,961 | 429,804 | 445,040 |
| Invalids' | 8,557 | 8,686 | 8,842 | 9,130 |
| Miners' | 91 | 77 | 66 | 52 |
| Unemployment | 715 | 2,935 | 1,782 | 483 |
| Sickness | 6,306 | 6,863 | 8,162 | 7,305 |
| Emergency | 6,422 | 8,177 | 11,367 | 14,661 |
| Supplementary assistance | 13,968 | 17,120 | 17,764 | 18,260 |
| Totals | 715,568 | 737,536 | 762,365 | 791,334 |
In addition there were 1,154 pensions at 31 March 1974 classed as “sundry pensions and annuities”. This class covers ex-officers of the Legislative Department, ex-members of the defence forces, certain ex-members of the Legislature, and others, by way of compassionate allowance, etc.
Relationship to Wages—In the following table standard weekly benefit rates are related to nominal award wages and average weekly earnings. (Source: Royal Commission of Inquiry.)
| Year | Standard Benefit Rate* | Percentage of Nominal Award Wage† | Percentage of Average Weekly Earnings‡ | |||
|---|---|---|---|---|---|---|
| Unmarried | Married | Unmarried Benefit | Married Benefit | Unmarried Benefit | Married Benefit | |
*Standard rate includes age, widows', miners', invalids', sickness, and unemployment benefits (except that a lesser rate is payable to unmarried invalids and sickness beneficiaries under 18 years and unemployment beneficiaries under 20 years). Superannuation benefit became payable at half the shown married rate from 30 March 1960, while the higher rate for unmarried beneficiaries was extended to superannuation beneficiaries from 12 October 1960. A married superannuation beneficiary receives half the married rate. †Relates to adult males only and is the average of a comprehensive survey of the wages of occupational groups used in the calculation of the Nominal Weekly Wage Rates Index compiled by the Department of Statistics. The average is determined after occupations are “weighted” according to their relative importance in the survey. ‡In the half-yearly survey, weekly wage payout and hourly earnings relate to all employees, males and females, adult and juvenile combined. Salaried executives are included but no working proprietors. Earnings include overtime, bonuses, and all allowances and special payments. | ||||||
| % | % | % | % | |||
| 1946 | 4.00 | 8.00 | .. | .. | 31.6 | 63.1 |
| 1947 | 4.00 | 8.00 | .. | .. | 30.4 | 60.8 |
| 1948 | 4.50 | 9.00 | .. | .. | 30.9 | 61.8 |
| 1949 | 4.50 | 9.00 | .. | .. | 29.5 | 59.0 |
| 1950 | 5.00 | 10.00 | .. | .. | 30.9 | 61.7 |
| 1951 | 5.75 | 11.50 | .. | .. | 30.0 | 60.0 |
| 1952 | 5.75 | 11.50 | .. | .. | 28.1 | 56.3 |
| 1953 | 5.75 | 11.50 | .. | .. | 26.4 | 52.8 |
| 1954 | 6.75 | 13.50 | .. | .. | 28.4 | 56.7 |
| 1955 | 7.00 | 14.00 | .. | .. | 28.0 | 56.0 |
| 1956 | 7.50 | 14.00 | .. | .. | 28.8 | 53.7 |
| 1957 | 7.90 | 14.80 | .. | .. | 28.6 | 53.6 |
| 1958 | 8.25 | 15.50 | .. | .. | 29.4 | 55.2 |
| 1959 | 9.00 | 16.00 | .. | .. | 31.3 | 55.7 |
| 1960 | 9.50 | 17.00 | .. | .. | 31.1 | 55.6 |
| 1961 | 9.50 | 17.00 | .. | .. | 29.6 | 52.9 |
| 1962 | 9.50 | 17.00 | .. | .. | 28.9 | 51.7 |
| 1963 | 9.75 | 17.50 | .. | .. | 28.5 | 51.2 |
| 1964 | 10.00 | 18.00 | .. | .. | 28.3 | 51.0 |
| 1965 | 10.60 | 19.20 | .. | .. | 27.7 | 50.1 |
| 1966 | 10.60 | 19.20 | 29.1 | 52.8 | 26.7 | 48.4 |
| 1967 | 11.75 | 21.50 | 30.6 | 55.9 | 28.0 | 51.2 |
| 1968 | 11.75 | 21.50 | 30.0 | 54.8 | 27.2 | 49.7 |
| 1969 | 12.25 | 22.50 | 29.2 | 53.6 | 26.4 | 48.5 |
| 1970 | 13.25 | 24.00 | 29.5 | 53.5 | 26.3 | 47.6 |
| 1971 | 14.75 | 27.00 | 26.6 | 48.7 | 24.7 | 45.2 |
| 1972 | 21.00 | 35.00 | 33.2 | 55.4 | 31.1 | 51.8 |
| 1973 | 23.70 | 39.50 | 31.7 | 52.7 | 31.6 | 52.7 |
Persons Wholly Dependent on Social Security—At the 1971 Census of Population and Dwellings there were 19,304 one-complete-family heads of households not in the labour force with no income apart from social security benefits and whose spouse also was without income.
Of the persons living alone at the 1971 Census there were 32,040 without income except for social security benefits. (Other such persons with limited incomes were as follows: $1-$199, 6,554; $200-$599, 9,105; $600-$999, 7,582; $1,000-$1,399, 6,152.)
CASH BENEFITS—The rates of benefits have been increased from time to time, mainly as a result of the increased cost of living. More recent increases for age, invalids', widows', and miners' benefits are shown in the following table.
| Date of Increase | Amount of Increase per Week | |
|---|---|---|
| Married Couples | Unmarried Beneficiaries | |
| $ | $ | |
| 14 May 1969 | 1.50 | 1.00 |
| 15 Apr 1970 | 1.00 | 0.50 |
| 2 Sep 1970 | 2.00 | 1.00 |
| 9 Jun 1971 | 2.00 | 1.25 |
| 16 Feb 1972 | 2.00 | 1.10 |
| 5 Jul 1972 | 4.00 | 3.90 |
| 6 Jun 1973 | 2.50 | 1.50 |
| 1 Aug 1973 | 2.00 | 1.20 |
| 13 Feb 1974 | 1.20 | 0.80 |
| 3 Jul 1974 | 4.00 | 2.35 |
| 15 Jan 1975 | 3.20 | 1.90 |
The list below gives a summary of the weekly rates for cash benefits. The term Unmarried includes those widowed or divorced. Later rates are included in latest statistical information.
| Benefit | Weekly Rate | |
|---|---|---|
| 3 July 1974 | 15 Jan 1975 | |
| †Subject to withholding tax for income-tax purposes. | ||
| Age*, Invalids*, and Sickness*— | ||
| Unmarried— | $ | $ |
| 18 or over | 26.85 | 28.75 |
| Under 18 without dependants | 20.50 | 22.00 |
| Married— | ||
| Husband or wife separately | 22.35 | 23.95 |
| Husband (wife included) | 44.70 | 47.90 |
| Widows* | 26.85 | 28.75 |
| Domestic Purposes— | ||
| Solo parent* or women alone | 26.85 | 28.75 |
| Caring for sick or infirm— | ||
| Unmarried and 18 or over | 26.85 | 28.75 |
| Unmarried and under 18 | 20.50 | 22.00 |
| Married | 22.35 | 23.45 |
| Unemployment*— | ||
| Unmarried person— | ||
| Twenty years or over | 26.85 | 28.75 |
| Under 20 years without dependants | 20.50 | 22.00 |
| Married man (wife included) | 44.70 | 47.90 |
| *ANY OF ABOVE BENEFITS WITH DEPENDENT CHILDREN | ||
| Solo parent and 1 child | 44.70 | 44.90 |
| Solo parent and 2 children | 44.70 | 47.90 |
| Increased by $65 a year ($1.25 p.w.) for each subsequent child | ||
| Married couple with 1 child | 47.70 | 50.90 |
| Increased by $65 a year ($1.25 p.w.) for each subsequent child | ||
| Superannuation— | ||
| Unmarried person | 26.85† | 28.75† |
| Married person | 22.35† | 23.95† |
| Miners | ||
| Unmarried person | 26.85 | 28.75 |
| Married man (wife included) | 44.70 | 47.90 |
| Miner's widow | 25.25 | 27.15 |
| Orphans | ||
| Family | ||
| Each dependent child | 3.00 | 3.00 |
| Supplementary Assistance—According to circumstances. | ||
| Emergency Benefits—According to circumstances. | ||
Standard Hospital Rate—The usual rate of benefit for a person whose benefit is reduced while in hospital is $7.50 a week, but this may be increased if necessary to meet continuing expenses.
Basic Income Exemptions—Superannuation, family, miners benefits are paid regardless of the financial circumstances of the beneficiary. Other benefits are reduced if the income of the beneficiary and spouse is more than the income exemption. The basic income exemptions were as follows at 3 July 1974.
Age Benefit—$884 a year increased by $13 a year from age 65, for each year application was deferred between the ages of 60 and 65, provided age 60 was attained on or before 1 November 1972.
Widows Benefit and Domestic Purposes Benefit for solo parents and women alone—$884 a year increased to $1,092 a year if the applicant has a dependent child.
Invalids Benefit and Domestic Purposes Benefit for person caring for sick or infirm—$884 a year.
Sickness and Unemployment Benefits—$17 a week (but see below regarding unemployment benefits and personal earnings).
Orphans Benefit—$260 a year.
Adjustment of Benefit for Income Above Exemption—Age, invalids, widows, and domestic purposes benefits are reduced by $1 for every complete $2 a year of income over the appropriate income exemption and up to $1,300 a year, then $3 for every $4 a year.
Sickness benefits are reduced by 10c for every 20c over $17 a week up to $25 a week, then 15c for every 20c a week of income.
Unemployment benefits are reduced by 10c for every 10c of personal earnings in excess of $10 a week. The first $10 a week of personal earnings (if any) is added to other income and the benefits are reduced by 10c for every 20c of other income over $17 a week up to $25 a week, then 15c for every 20c a week.
Orphans benefits are reduced by $3 for every complete $4 a year of income over $260 a year.
Superannuation Benefits—Every person over the age of 65 years who satisfies the prescribed residential qualification is entitled to a superannuation benefit. The residential qualification is, in general, a period of residence in New Zealand of 20 years. Allowances are made for occasional absences and for special circumstances such as service overseas with the armed forces, on missionary work, and with Volunteer Service Abroad.
Age Benefits—Every person who has attained the age of 60 years is entitled to receive an age benefit, subject to residential qualifications and an income test.
Age benefits are payable, in the discretion of the Social Security Commission, to unmarried women between 55 and 60 years of age who are unable to engage in regular employment.
The basic rate for a male recipient is doubled when his wife is ineligible for any benefit.
At 31 March 1974, 11,219 husbands received benefits on account of dependent wives who were not eligible for benefits in their own right.
Age of Beneficiaries—The following table shows the estimated age distribution of persons on superannuation and age benefits at 31 March 1974 and of persons granted age benefits in 1973.
| Age Group (Years) | Benefits in Force At 31 March 1974 | Age Benefits Granted During 1973 | ||||
|---|---|---|---|---|---|---|
| Superannuation | Age | |||||
| Males | Females | Males | Females | Males | Females | |
| Under 60 | - | - | - | 589 | - | 450 |
| 60-64 | - | - | 13,090 | 23,452 | 6,085 | 8,961 |
| 65-69 | 25,406 | 23,796 | 18,363 | 25,389 | 4,888 | 4,487 |
| 70-74 | 16,047 | 16,626 | 14,583 | 20,015 | 3,687 | 5,013 |
| 75-79 | 8,095 | 10,823 | 5,840 | 15,067 | 1,565 | 3,951 |
| 80-84 | 4,229 | 6,708 | 3,127 | 10,460 | 824 | 2,307 |
| 85 and over | 2,609 | 4,686 | 2,491 | 7,671 | 493 | 1,284 |
| Totals | 56,386 | 62,639 | 57,494 | 102,643 | 17,542 | 26,453 |
Widows' Benefits—Subject to an income qualification every widow who is the mother of one or more dependent children under 16 years of age is entitled to a benefit in respect of widowhood. In addition, any widow not being the mother of a dependent child under 16 years of age who satisfies certain conditions is also entitled to the benefit.
The following table affords an analysis of widows' benefits in force at 31 March 1974, according to the ages of beneficiaries and the numbers of dependent children. (Deserted wives (1,015) are also included.)
| Age Group (Years) | Number of Dependent Children | ||||||
|---|---|---|---|---|---|---|---|
| Nil | 1 | 2 | 3 | 4 | 5 and over | Total | |
| Under 25 | - | 72 | 47 | 8 | - | - | 127 |
| 25-29 | - | 89 | 137 | 62 | 28 | 15 | 331 |
| 30-34 | 12 | 62 | 217 | 159 | 94 | 70 | 614 |
| 35-39 | 23 | 123 | 233 | 225 | 126 | 131 | 861 |
| 40-44 | 228 | 374 | 380 | 213 | 109 | 85 | 1,389 |
| 45-49 | 885 | 696 | 407 | 165 | 83 | 54 | 2,290 |
| 50-54 | 2,450 | 852 | 301 | 89 | 20 | 14 | 3,726 |
| 55-59 | 5,411 | 549 | 116 | 16 | 4 | 1 | 6,097 |
| 60 and over | 1,213 | 166 | 29 | 8 | 2 | 1 | 1,419 |
| Totals | 10,222 | 2,983 | 1,867 | 945 | 466 | 371 | 16,854 |
| Children involved | 2,983 | 3,734 | 2,835 | 1,864 | 2,114 | 13,530 | |
Domestic Purposes Benefits—Persons who qualify for domestic purposes benefit are:
A woman with a dependent child or children who is living apart from and has lost the support of or is inadequately maintained by her husband, or who is divorced from her husband or, whose husband has been a mental patient for 6 months or a prisoner;
An unmarried mother of one or more dependent children;
A father of one or more dependent children who has lost his wife by death, divorce or some other cause.
Women without dependent children who come within the definition of “a woman alone”, which is a woman who has never been married or who has lost the support of her husband, and who has cared for dependent children or for incapacitated relatives.
In the case of both a solo parent and a woman alone, de facto marriages are considered as marriages. Persons qualifying for the domestic purposes benefit are those required to give full-time care and attention at home to a person who would otherwise have to be admitted to hospital.
Orphans' Benefits—A benefit in respect of orphanhood is payable in the case of a child under 16 years of age who was born in New Zealand or whose last surviving parent was ordinarily resident in New Zealand for a period of not less than 3 years preceding the date of his or her death.
The number of benefits in force at 31 March 1974 was 387 (in respect of 457 children).
Family Benefits—The rate of the benefit is $3 a week for each child, until he or she reaches 16 years, or, if a full-time school pupil, the end of the year in which 18 years is reached.
A family benefit or portion of a family benefit may be paid in a lump sum in advance for a period not exceeding 52 weeks in respect of the first child or a child who has commenced his first year of intermediate or secondary education.
A family benefit may be paid in cash, or to the credit of the Post Office Savings Bank account of the mother. The number of family benefits being paid to Post Office Savings Bank accounts at 31 March 1974 was 153,531 and the amount lodged during the year was $57,384,446. The total number of benefits in force at 31 March 1974 was 445,040 covering 1,029,160 children, compared with corresponding figures of 429,804 and 1,021,378 at 31 March 1973. At the end of the 1973 school year there were 67,100 children over 16 at school in respect of whom benefits were being paid.
The following table gives the number of family benefits in force at 31 March 1974 classified according to the number of children for whom the benefit was paid.
| Number of Children in Each Case | Benefits at 31 March 1974 |
|---|---|
| 1 | 133,713 |
| 2 | 149,880 |
| 3 | 93,878 |
| 4 | 43,766 |
| 5 | 16,335 |
| 6 | 6,879 |
| 7 | 2,986 |
| 8 | 1,373 |
| 9 | 575 |
| 10 or more | 322 |
| Total | 449,707 |
The average number of children in respect of whom benefits were paid was 2.25 per family in 1950-51, 2.30 in 1952-53, 2.33 in 1954-55, 2.36 in 1956-57, 2.39 in 1958-59, 2.45 in 1960-61, 2 51 in 1965-66, 2.38 in 1971-72 and 2.36 in 1973-74.
Under the provisions of the Family Benefits (Home Ownership) Act 1964, family benefits may be capitalised and paid in advance to assist parents with the erection or purchase of house properties, whether previously occupied or not, additions or alterations to existing homes, or in certain circumstances the repayment of mortgages and other obligations on family homes. In outline, the measure provides for the capitalisation of up to $1.50 of the weekly family benefit in respect of each of one or more children from the age of 1 year up to the age of 16 years, provided that the total of the advance or advances in the case of any one family is not less than $400 nor more than $2,000. The maximum income limit for eligibility is $75 a week for a family with one child, rising by $5 a week for each additional child.
Details of family benefit capitalisation are shown in the following table.
| Year Ended 31 March | Applications for Capitalisation Approved | Number of Children Concerned | Capitalised Value of Benefits |
|---|---|---|---|
| $(000) | |||
| 1963 | 8,884 | 14,931 | 10,503 |
| 1964 | 8,137 | 13,604 | 9,756 |
| 1965 | 8,288 | 14,074 | 10,162 |
| 1966 | 7,485 | 12,986 | 9,250 |
| 1967 | 6,621 | 11,283 | 8,238 |
| 1968 | 6,553 | 10,811 | 7,901 |
| 1969 | 7,708 | 12,744 | 9,212 |
| 1970 | 8,373 | 14,889 | 10,696 |
| 1971 | 7,895 | 14,435 | 10,370 |
| 1972 | 5,308 | 9,920 | 7,031 |
| 1973 | 7,165 | .. | 6,332 |
| 1974 | 5,980 | .. | 7,114 |
Invalids' Benefits—An invalids' benefit is payable if a person is—(a) is totally blind; or (b) is permanently and severely restricted in his capacity for work as the result of an accident or by reason of illness or of any congenital defect.
In computing the income of any blind person no account is taken of his personal earnings. In addition, the benefit of a totally blind person may within certain limits be increased by up to 25 percent of his personal earnings. The personal earnings of a severely disabled beneficiary may be disregarded in whole or in part in computing his benefit.
Miners' Benefits—A miner's benefit is payable to any person who, while engaged as a miner in New Zealand, contracted pneumoconiosis or any other occupation disease and is thereby permanently and seriously incapacitated for work, provided that compensation in respect of the same disability is not being received.
Unemployment Benefits—An applicant for unemployment benefit is required to satisfy the Commission: (a) that he is unemployed; (b) that he is capable of undertaking and is willing to undertake suitable work; (c) that he has taken reasonable steps to obtain suitable employment; (d) that he has resided continuously in New Zealand for not less than 12 months at any time.
An unemployment benefit is not payable in respect of the first 7 days of any period of unemployment, except in special circumstances. The Commission may postpone, for a period not exceeding 6 weeks, the commencement of the benefit if the applicant: (a) has voluntarily become unemployed without good and sufficient reason; or (b) has lost his employment by reason of any misconduct as a worker. The benefit may be terminated if the beneficiary has refused or failed, without a good and sufficient reason, to accept any offer of suitable employment.
The benefit is payable so long as the beneficiary is unemployed or until he becomes eligible to receive another class of benefit, other than a family benefit—e.g., an age benefit.
A married woman is entitled to receive the benefit only if her husband is unable to maintain her. If a beneficiary is not receiving a benefit in respect of a wife, an allowance may be paid in respect of any person who has the care of his home.
The rates of benefit may be reduced having regard to the income received by the applicant or his wife in excess of $17 a week. For personal earnings of the applicant exceeding $10 a week the deduction is 10c for 10c of the excess. For income which is not earnings in excess of $17 a week the deduction is 10c for 20c up to $25 a week and thereafter 15c for every complete 20c.
The number of applications for unemployment benefits dealt with during the years ended 31 March 1973 and 1974 were 37,276 and 12,281 respectively, 24,532 persons being granted a benefit in 1972-73 and 8,184 in 1973-74. At the end of March 1974 483 benefits were in force, compared with 1,782 at the end of the previous year. Payment of additional benefit for a dependent wife was included in 509 of the benefits in force at 31 March 1973 and in 157 of the benefits in force at 31 March 1974.
Sickness Benefits—A person over the age of 15 years who is temporarily incapacitated for work through sickness or accident, and as a result suffers a loss of salary, wages, or other earnings, may apply for a sickness benefit.
The number of applications for sickness benefits dealt with during the years ended 31 March 1973 and 1974 were 42,295 and 42,837 respectively. The number of persons granted sickness benefits was 37,851 in 1972-73 and 38,506 in 1973-74.
In the following table sickness benefits which ceased during the calendar year 1973 are shown according to the duration of the sickness benefit (based on a 20 percent sample of the estimated 41,000 benefits which ceased).
| Period on Benefit (Weeks) | Number of Benefits | ||
|---|---|---|---|
| Males | Females | Total | |
| Up to 5 | 10,770 | 3,150 | 13,920 |
| 5-8 | 6,830 | 2,450 | 9,280 |
| 9-12 | 3,680 | 1,740 | 5,420 |
| 13-25 | 4,050 | 3,980 | 8,030 |
| 26-38 | 1,370 | 950 | 2,320 |
| 39-51 | 490 | 240 | 730 |
| 52-77 | 430 | 160 | 590 |
| 78-103 | 230 | 80 | 310 |
| 104 and over | 230 | 170 | 400 |
| Totals | 28,080 | 12,920 | 41,000 |
The following table gives a classification of sickness benefits according to the disease suffered by the beneficiary. The data were obtained from an analysis of a sample of 20 percent of the benefits which ceased during the calendar year 1973.
| Disease Category | Males | Females | Percentage of Total |
|---|---|---|---|
| Infective and parasitic diseases | 1,070 | 400 | 3.6 |
| Neoplasms | 470 | 190 | 1.6 |
| Endocrine system, metabolic, and nutritional diseases | 720 | 160 | 2.2 |
| Diseases of the blood and blood-forming organs | 100 | 10 | 0.3 |
| Mental disorders | 3.490 | 2,060 | 13.5 |
| Diseases of the nervous system and sense organs | 910 | 190 | 2.7 |
| Diseases of the circulatory system | 2,160 | 390 | 6.2 |
| Diseases of the respiratory system | 2,220 | 610 | 6.9 |
| Diseases of the digestive system | 2,950 | 710 | 8.9 |
| Diseases of the genito-urinary system | 370 | 310 | 1.7 |
| Complications of pregnancy, childbirth, and the puerperium | .. | 5,210 | 12.7 |
| Diseases of the skin and subcutaneous tissue | 1,070 | 120 | 2.9 |
| Diseases of the musculosketal system and connective tissue | 1,050 | 220 | 3.1 |
| Congenital anomalies | 310 | 100 | 1.0 |
| Symptoms and ill-defined conditions | 2,580 | 1,090 | 8.9 |
| Accidents, poisonings, and violence | 8,610 | 1,150 | 23.8 |
| Totals | 28,080 | 12,920 | 100.0 |
Emergency Benefits—An emergency benefit may be granted on the grounds of hardship to any person who by reason of age, physical or mental disability, or any other reason is unable to earn a sufficient livelihood for himself and those dependent on him and is ineligible for any other monetary benefit other than family benefit.
Supplementary Assistance—Supplementary assistance is available to social security beneficiaries and others who have special commitments which cannot be met out of current income, have insufficient other resources, and are unable to help themselves. Continuing grants are made where the applicant's continuing commitments, e.g., food, fuel, rent, are in excess of the income received by this applicant, and lump sum grants may be made to meet some non-recurring expense. An analysis of these grants showing purpose and amounts of grants, is given in the parliamentary paper E. 12.
Since 1973 a telephone rental concession equal to one-half of the amount of the rental may be granted to persons in receipt of age, invalids', widows', or related benefits. Commencing on 1 January 1975 a concession equivalent to one-half of a television licence fee is also available for these persons.
Reciprocity with Australia—The Social Security (Reciprocity with Australia) Act 1948, provided for reciprocity in relation to a wide range of benefits between New Zealand and the Commonwealth of Australia. The Act came into force on 1 July 1949. (A similar Act was passed in Australia and came into force on the same date.)
For the purpose of any application for a benefit (except the New Zealand non-income-test superannuation benefit) residence in Australia or birth in Australia is regarded as residence or birth in this country.
Applicants for age, invalids' or widows' benefits must be qualified on residential grounds to receive the corresponding pensions under the Social Services Act (Australia) as if their residence in New Zealand had been residence in Australia. No male person is entitled to receive an age benefit unless he has attained the age of 65 years. The Act also provides that the department shall treat blindness or permanent incapacity for work occurring in Australia as if it had occurred in New Zealand.
Reciprocal benefits in force in New Zealand at 31 March 1974 comprised 659 age benefits, 53 widows' benefits, 46 invalids' benefits, 1 sickness benefit, and 2 unemployment benefits, a total of 761 compared with 750 a year earlier.
Reciprocity with United Kingdom—The Social Security (Reciprocity with United Kingdom) Act 1969 provides for reciprocity in a comprehensive range of benefits between New Zealand and the United Kingdom. The general principle of the agreement is that persons migrating from one country to the other will be taken into the social security scheme of the receiving country and paid benefits by the receiving country under the laws and conditions applicable to other residents of that country. For age benefits the qualifying age is 65 years.
Reciprocal benefits in force in New Zealand at 31 March 1974 comprised 4,983 superannuation benefits, 7,519 age benefits, 276 widows' benefits, 2 orphans' benefits, 134 invalids benefits, 12 sickness benefits, and 3 unemployment benefits, a total of 12,929 compared with 11,981 a year earlier.
New Zealand Residents in the United Kingdom—In the United Kingdom the agreement applies to former residents of New Zealand who claim retirement pensions, widows' pensions, widowed mothers' and guardians' allowances, family allowances, sickness and unemployment benefits under the National Insurance Act.
The qualifying age for retirement pensions under the National Insurance Act is 60 years for women and 65 years for men.
It is to be noted that, although a man may have been in receipt of an age benefit when he left New Zealand, he is not entitled to retirement pension in the United Kingdom unless he is 65 years of age. Special provisions apply to married women arriving in the United Kingdom from New Zealand as far as entitlement to the United Kingdom retirement pension is concerned.
Persons in receipt of social security benefits in New Zealand otherwise than by virtue of the Reciprocal Agreement, who leave New Zealand wholly or mainly for a visit to the United Kingdom, will normally have their benefits suspended on departure, but if they return to New Zealand within 12 months they will be paid arrears of their social security benefits for the period of their absence.
FRIENDLY SOCIETIES—Friendly societies or lodges had a membership of 59,000 in 1973 compared with 113,000 in 1938 before the introduction of social security. They provide sickness and death benefits for members. The funds of the lodges totalled $40.2 million in 1973.
Specially Authorised Societies—The majority of new societies registered under the Friendly Societies Act in recent years have been specially authorised societies in the form of credit unions; the number of such societies registered is now 134 and their funds totalled $22.9 million in 1973.
Medical Care Societies—The provision of benefits to provide part or all of the costs of medical or surgical attendance in return for voluntary contributions may be administered through a separate fund of a traditional friendly society or through a society providing only such benefits, including the costs of private hospital treatment. The latter type of society may be registered under the Friendly Societies Act 1909, but at least two are known not to be so registered. It is, therefore, not possible to give comprehensive statistics of either membership or funds related to such benefits. The number of individuals covered for such benefits is approximately 150,000 in societies registered under the Friendly Societies Act solely for the purpose and could be in excess of this figure in respect of traditional societies.
SOCIAL WORK—The establishment of the Department of Social Welfare from 1 April 1972 has resulted in a widening of the scope of social work formerly undertaken by the Child Welfare Division of the Department of Education and the Social Security Department. Although much of it is still concerned with the care, protection, and control of children and young persons, it now includes counselling work with the mentally and physically disabled, solo parents and their children, and the aged. The department now maintains a team of social workers and other staff who provide a general, individual, and family welfare counselling and guidance service for all age groups as well as undertaking general field investigation and inquiry work.
CHILDREN AND YOUNG PERSONS ACT 1974—The Children and Young Persons Act was enacted in 1974 and came into force from 1 April 1975. The Act replaced the Child Welfare Act 1925 and makes provision for preventive and social work services for children and young persons whose needs for care, protection, or control are not being met by parental or family care and who are, or are at risk of becoming, deprived, neglected, disturbed, or ill-treated, or offenders against the law.
The new Act makes a distinction between a child who is defined as a person under 14 years, and a young person who is defined as a person over 14 and under 17 years. Children's Boards have been established throughout New Zealand as a preventive measure to keep children out of court.
Social Work with Children and Young Persons—Besides clerical officers, social work services involve over 400 social workers and over 450 institution workers. Casework duties include preventive work; investigations and reporting for the Children's Court; supervision of children in their own homes; foster home, institution, and work placement; adoption and ex-nuptial birth inquiry work; the licensing of foster parents defined in the Infants Act 1908; reporting to courts on matrimonial proceedings affecting custody of children; registration of child care centres; inspection of children's homes run by voluntary organisations and examination of requests made by them for financial subsidies; the oversight of immigrant and refugee children. Social workers receive assistance in many of these duties from about 120 honorary social workers, who are people of integrity and local standing in their communities.
Institutional care facilities include long-term training centres for difficult and delinquent children, short-term facilities providing classification, emergency, and temporary care for both infants and older children, and family homes which provide care for children of all ages either on a short-term or long-term basis.
Social workers undertake a wide variety of miscellaneous investigations and inquiries concerning the welfare of children. In the year ended 31 December 1973, 17,957 cases were handled. Cases may be referred by neighbours, police, teachers, employers, doctors, solicitors, etc., or by parents themselves who are seeking advice and guidance. Some of these cases will respond quickly to help. Others may need preventive oversight and guidance over several months or even 2 or 3 years. Financial help can be given in special cases. In a relatively small number of cases preventive help is not sufficient and court action is the outcome of inquiries.
Social workers, on receiving from the registrars notifications of ex-nuptial births, make confidential inquiries and assist the mother as necessary in making provision for her child. The higher number of such births in recent years has had its effect in the adoption situation. However, over half of these children born each year remain with their mothers or with both parents who are cohabiting or who subsequently marry, and not all the remainder are made available for adoption. In fact only 30 percent of children born out of wedlock are available for adoption. Placements in adoption homes are made by social workers for those children (about three-fifths) for whom placements have not been made by private persons and other organisations. Further details are given in section 4B, Births.
The smaller proportion of children being offered for adoption is thought to reflect the beginnings of a changing pattern in society, with an increase both in de facto liaisons and in the proportion of mothers wanting to undertake the sole care of a child.
Under the Adoption Act 1955 a social worker must give prior approval to the placement for adoption of a child under 15 years, or alternatively, the applicants must apply for an interim order of adoption from the court. The court is required to obtain a social worker's report on such a placement before granting an order. A waiting period of at least 6 months is normally required, during which the placement is supervised by a social worker, before a final order can be made.
Any person who is not a close relative and who undertakes to care for a child under the age of 6 years apart from its mother for a period of more than 7 days for payment or reward must have her home licensed by a social worker. At 31 December 1973 social workers were visiting 294 children so placed.
Inspecting children's homes operated by private organisations and administering schemes of Government financial assistance to these homes is another important social welfare function. Financial assistance is given by payments of $7 per week for each child in care and subsidies of up to 50 percent on expenditure for extension or replacement of buildings or additions to facilities. A similar capital subsidy is available for private organisations to help in providing accommodation for unmarried mothers and their children.
Regulations for the registration and licensing of child care centres (e.g., day nurseries, creches, etc.) have been in force since 1961.
The Department of Social Welfare has built up a considerable body of knowledge on new trends and methods in the fields of both residential and day care for children. As a result, it has become an important point of reference for information and advice.
Children and Young Persons Courts—Such Courts are presided over by stipendiary magistrates who are authorised to exercise jurisdiction in these courts. Very wide discretionary powers are given to Children's Courts. Wherever practicable the hearings are conducted in premises apart from the Magistrate's Court, and no newspaper is permitted to publish either the names of children appearing before these courts or any particulars that are likely to identify a child.
Children and Young Persons Courts deal with cases of children brought either (a) on a complaint under the Act that a child is neglected, indigent, delinquent, not under proper control, or living in a detrimental environment or (b) charged with an offence. After the court has heard the complaint or the charge and considered the social worker's report, the child—according to the needs of the case—may be committed to the care of the Director-General of Social Welfare, or placed under the supervision of a social worker for a period (usually 1 year or 2 years), or discharged with an admonition. Occasionally, orders for the payment of restitution may be made against either the child or parent, and fines also may be imposed. Alternatively, if the case warrants it, the child may be sent to borstal or to a detention centre or be placed on probation.
Children's Courts operated until 1 April 1975, when the Children and Young Persons Act 1974 established the new Courts and instituted Children's Boards.
Appearances before the Children's Courts in the 3 latest calendar years and the rates per 10,000 children aged 10 to 17 years are given in the following table:
| Reason for Appearance | Appearances | Rate | ||||
|---|---|---|---|---|---|---|
| 1971 | 1972 | 1973 | 1971 | 1972 | 1973 | |
| *These appearances represented 10,221 individual children (7,823 boys and 2,398 girls). For 49 percent of the appearances the children involved had been before the courts previously. | ||||||
| For offences against special Acts, regulations, or bylaws | 995 | 962 | 1,030 | 23 | 20 | 21 |
| For more serious offences | 9,755 | 10,157 | 10,057 | 208 | 212 | 205 |
| Subtotals | 10,750 | 11,119 | 11,087 | 231 | 232 | 226 |
| On “complaints” under the Child Welfare Act | 2,044 | 1,930 | 1,884 | ... | ... | ... |
| Totals | 12,794 | 13,049 | 12,971* | ... | ... | ... |
The decisions made in Children's Courts are shown in the summary below for the three latest calendar years.
| Decision | 1971 | 1972 | 1973 |
|---|---|---|---|
| Committed to the care of the Director-General of Social Welfare | 1,176 | 1,058 | 1,079 |
| Placed under supervision of social workers | 4,176 | 4,067 | 3,626 |
| Admonished and discharged with or without costs, restitution, or fine | 5,200 | 5,294 | 5,546 |
| All other decisions | 2,242 | 2,630 | 2,720 |
| Totals | 12,794 | 13,049 | 12,971 |
A new approach to the problem of delinquency was the establishment throughout New Zealand in 1959 of a youth aid section of the New Zealand Police. The aim is to detect delinquency at an early stage and, by close co-operation between social workers and specialist police officers, to deal with the less serious offenders without court action. The police, after consultation with social workers, decide whether or not there will be a prosecution. For those not being prosecuted appropriate action is taken, for example, in the form of a warning from the police or continuing informal supervision by social workers. During the year ended 31 December 1973, 11,570 cases were dealt with under this scheme without prosecution, compared with 12,435 cases in the preceding year.
Rates of Children's Court appearances for all offences per 10,000 of population of relevant age are shown in the following table.
| Age of Child (Years) | Boys | Girls | ||||
|---|---|---|---|---|---|---|
| 1971 | 1972 | 1973 | 1971 | 1972 | 1973 | |
| 10 | 33 | 32 | 32 | 4 | 3 | 2 |
| 11 | 89 | 88 | 81 | 10 | 7 | 9 |
| 12 | 201 | 198 | 168 | 31 | 33 | 30 |
| 13 | 301 | 350 | 324 | 70 | 71 | 73 |
| 14 | 514 | 514 | 518 | 142 | 122 | 118 |
| 15 | 725 | 725 | 725 | 164 | 175 | 151 |
| 16 | 1,104 | 1,076 | 1,108 | 206 | 224 | 203 |
The table shows clearly the way in which offending rates become higher with each year of age. It also shows that girls have relatively low rates compared with those for boys.
Since over 60 percent of all juvenile offending is accounted for by boys in the 14- to 16-year old age group the following table presents more detailed information on the offending rates for these groups per 10,000 of mean population in each age group.
| Offences | Boys 14 years | Boys 15 years | Boys 16 years | ||||||
|---|---|---|---|---|---|---|---|---|---|
| 1971 | 1972 | 1973 | 1971 | 1972 | 1973 | 1971 | 1972 | 1973 | |
| All offences excluding technical offences | 501 | 500 | 499 | 655 | 669 | 661 | 934 | 926 | 950 |
| Technical offences | 13 | 14 | 19 | 70 | 56 | 64 | 170 | 150 | 158 |
| All offences | 514 | 514 | 518 | 725 | 725 | 725 | 1,104 | 1,076 | 1,108 |
State Wards—Where a child's circumstances or behaviour causes such concern that it is in his best interests for him to be removed from his own home, a magistrate in a Children's Court may make an order committing the child to the care of the Director-General of Social Welfare. This means that the legal guardianship is transferred from the parents to the Director-General, and the child is taken from home. However, continuing efforts are made to keep the child in touch with his own family and, if possible, to return him home eventually. Many of the children who are committed to the care of the Director-General and who are thereby under his guardianship are placed immediately in foster homes and go to school or work. Those who require special care and training which cannot be provided in the ordinary life of the community are placed in institutions administered by the Director-General. Some few reside in private institutions and some are in boarding schools.
Of the total of 15,713 children under the control and supervision of the Director-General of Social Welfare and his officers at 31 December 1973, 6,428 were under the guardianship of the Director-General and were placed as shown in the following summary.
| Category | 1971 | 1972 | 1973 |
|---|---|---|---|
| Residing in individual private homes (foster homes, employers' or relatives homes) | 3,934 | 4,204 | 4,572 |
| In institutions administered by the Department of Social Welfare or Department of Justice (including those temporarily admitted) | 1,099 | 1,184 | 1,250 |
| In hospitals (including psychiatric hospitals) | 137 | 138 | 138 |
| In residential schools and colleges (including schools for handicapped children) | 187 | 183 | 174 |
| In private institutions | 150 | 229 | 293 |
| Attending university or teachers' training colleges | 8 | 12 | 1 |
| Totals | 5,515 | 5,950 | 6,428 |
For the children requiring institutional care and training the Department of Social Welfare administers several different types of institution. There are long-term training institutions for disturbed and delinquent adolescents. They are essentially open institutions providing full educational facilities with qualified and trained teachers and also a wide range of vocational training. Three other small institutions provide separately for girls and boys of primary school age who are so difficult or disturbed as to require special educational and social training. A small hostel for girls in Wellington provides for some who, while in ordinary employment, require for the time being the conditions of supervision and care obtainable in a hostel. There are 12 girls' homes and boys' homes in the larger centres and 3 reception centres (at Auckland, Hamilton and Greytown) which provide remand facilities, temporary care, and observation. Children not requiring institutional care but presenting behaviour and personality problems beyond the capacity of most ordinary foster parents are provided for in “Family Homes”. These are private houses owned by the department and occupied rent-free by specially selected married couples who receive board payments and agree to care for children on a long-term basis as a condition of the tenancy. These homes are also used to provide transit accommodation in areas in which there is no receiving girls' home, or boys' home. Of the 83 homes in operation at 31 March 1974, approximately a third were used as hostels for working adolescents and for children being discharged from institutions.
Children Under Supervision—Children placed by the courts under supervision of social workers are supervised in their own homes, except that in a few cases, with the approval of the parents or guardians, the social worker arranges placement elsewhere—e.g., in employment. Magistrates have the authority to order that part or all of the period of supervision be spent in an institution. Some children placed under supervision respond well; where they do not they may appear before the court again and be committed to the care of the Director-General. There were 3,683 children under supervision at 31 December 1973.
Preventive cases, numbering 3,427 at 31 December 1973, consist of children who, without any court appearance, are being supervised and assisted by social workers under arrangements made voluntarily with the parents or guardians.
Services for Intellectually Handicapped Children—There is a subsidy of up to 50 percent on the capital cost of approved buildings and furnishings acquired for short-stay homes for intellectually handicapped children, including hostels built by the Intellectually Handicapped Children's Society for children attending occupation groups run by the Department of Education. The limit of the subsidy is $5,000 per bed. In addition, a maintenance subsidy of $1.60 per day is paid in respect of children under 16 years of age. There is a capital subsidy of $400 per place for day care centres, and Government subsidies of 50 percent of salaries of staff for day care centres, sheltered workshops, and of approved branch administrators.
The total amount expended on capital subsidies for short-stay homes and hostels during the year ended 31 March 1974 was $383,651. In addition, $100,000 was paid by way of operating costs during the same period and $472,272 in salary subsidies.
WELFARE OF MAORIS AND PACIFIC ISLANDERS—The legislative basis of the Maori welfare programme is the Maori Welfare Act 1962 and the aim is the social and economic advancement and the promotion and maintenance of the health and general well-being of the Maori community and the facilitation of full integration of the Maori race into the social and economic life of the country. An important feature of the programme is that it does not seek to impose standards from without; rather, it calls upon the Maori people to exercise control and direction of their own communities in the essentials of good citizenship and civic responsibility.
The Maori welfare organisations consist of two statutory groups and various voluntary groups.
The statutory groups are:
Maori associations comprising the New Zealand Maori Council, the district Maori councils, Maori executive committees, and the Maori committees. All are democratically elected and work independently of the department.
The Maori Affairs Department, which works closely with all Maori groups as it realises that its main objectives cannot be achieved without full acceptance and participation by the people themselves.
The main organisation in the non-statutory group is the Maori Women's Welfare League. It was formed in 1951 and has branches throughout the country. Its membership approximates 3,000. Special tribal groups, social, sports, and cultural clubs, church groups, women's and other organisations are some of the many other groups which have their own spheres of action promoting and furthering the physical, social, spiritual, and moral well-being of the people.
The primary function of the Maori Women's Welfare League is to educate the mothers of the race to an appreciation of the higher standards of attainment on the home front. It also interests itself actively in education, particularly at the pre-school level.
The primary function of the New Zealand Maori Council is to encourage Maoris as individuals and in groups to take the initiative in matters affecting their own welfare and that of their kinsfolk, to be a forum of discussion in which they can crystallise their ideas and gain the co-operation of others in actively pursuing mutually agreed objectives and eventually achieving progressive improvement in the various spheres of welfare. By its own request it is charged with the duty of maintaining and promoting harmony between Maori and non-Maori.
The Maori Affairs Department through the activities of its social services division in particular, collaborates with and gives Maori associations and other groups such assistance and advice as may be necessary or helpful so that the members themselves may find and apply their own solutions to their problems and develop and achieve the utmost satisfaction from their own culture. The department also collaborates with appropriate social welfare agencies, State and voluntary, in helping individuals and families who are experiencing difficulties in adapting themselves to their social and economic environment, accepting the full responsibility where a need is not being met. The department actively encourages these State and voluntary organisations to understand and to communicate successfully with the Maori so that they can work more effectively with him.
Maori wardens carry out special functions. They are appointed by the Minister at the initiative of Maori committees to whom they are responsible. Their function is to assist in the maintenance of order and in stamping out mischief before it becomes crime. Wardens do not usurp the duties of the police but are an influence among the people in maintaining law and order.
The Act provides for subsidies to be paid on moneys raised by the Maori people through their associations for the promotion of welfare. The subsidy granted in the financial year ended 31 March 1974 amounted to $84,440.
The Maori Affairs Department again primarily through its social services division, assists Pacific Islanders of New Zealand nationality to adjust to the New Zealand situation and provides advisory services to individuals or groups facing difficulties. Special responsibilities are accepted for the housing, employment, educational, and welfare needs of Tokelau Islanders arriving under the official resettlement scheme.
An inter-departmental committee fosters and finances research into social and educational aspects of Maori and Islander welfare.
Maori welfare officers are intended to carry out quite a different range of functions from those of other social workers. They are not intended to replace child welfare officers, probation officers, truant officers, and so on. Although they are available when other social workers encounter problems which are peculiarly Maori, their primary function is to work with groups rather than individuals. For example, it is not strictly a Maori welfare officer's duty to deal with a Maori child playing truant from school, but if truancy is a common problem amongst Maori students in any locality, it is the welfare officer's duty to hold discussions with parents and try to convince them of the importance of ensuring that their children attend school regularly. A great deal of the time of the welfare staff is occupied in informing Maori and Island parents of vocational opportunities open to their children, in recruiting and organising vocational training groups for school leavers, stimulating the formation of play centres and other pre-school groups, and in dealing with youth problems in the cities.
GENERAL—The war pensions programme is largely the outcome of New Zealand participation in two world wars in which large numbers of citizens served as members of the forces. It applies also to service in Korea, South-east Asia, and in any emergency, including obligations undertaken under the charter of United Nations.
The war pensions scheme has developed from one which initially gave limited compensation for those returned from active service to one of comprehensive coverage for ex-servicemen who are disabled or incapacitated at any time of their lives as a result of their service, and for their dependants and also for the dependants of those who have died as a result of war service.
The war pensions legislation is designed to provide (a) basic pensions to compensate for disablement or death, which provide for physical loss and are therefore compensatory in character, and (b) supplementary pensions, in appropriate cases, to meet loss of income. The latter depend on the means of the pensioner and arc economic in character, acting as income maintenance and being therefore similar to social security benefits.
LEGISLATIVE AUTHORITY—All pensions payable to or on account of former members of the armed forces, the mercantile marine, and the Emergency Reserve Corps are governed by the War Pensions Act 1954.
ADMINISTRATION—For many years social security monetary benefits and war pensions have been administered by the same department.
The authority for paying war pensions is vested in the War Pensions Board, an independent body appointed by the Minister in Charge of War Pensions, with a chairman, a medical member, and a representative of the members of the forces appointed on the nomination of the New Zealand Returned Services Association. The administration of the War Pensions Act is however, the responsibility of the Secretary for War Pensions who acts under the general direction and control of the Minister.
It is laid down that the onus of proving that death or disablement was attributable to service, or that the condition which resulted in death or disablement was aggravated by such service, shall not be on the claimant and that the War Pensions Board and the War Pensions Appeal Board shall give claimants the full benefit of all presumptions in their favour. A member who was graded fit for service when he entered the forces is deemed to have been absolutely fit at that time unless any defects were noted then or within the first 2 months of service. This presumption does not operate if the member failed to disclose any material fact to the medical examines The boards are not bound by technicalities or legal forms or rules of evidence, but determine all claims in accordance with their merits.
RATES AND ALLOWANCES—The list below summarises the rates of war pensions and allowances. The pensions for war disablement and war widows are now adjusted annually on a cost of living basis.
| Pension | Weekly Rate |
|---|---|
| 15 Jan 1975 | |
| *Adjusted annually at 1 April in relation to movements in the consumers' price index. The increase at 1 April 1973 was 50c, and at 1 April 1974 $1.80 for total disablement pension. | |
| Disablement pension*— | |
| Total disablement | 19.50 |
| Special additional pension for blindness or serious disablement | 11.70 |
| Economic pension— | |
| Unmarried person | 28.75 |
| Married person | 23.95 |
| Wife's pension | 23.95 |
| War widow's pension— | |
| Basic pension* | 14.40 |
| Economic pension | 28.75 |
| Mother's allowance— | |
| One dependent child | 14.85 |
| Two dependent children | 17.85 |
| Increased by $1.25 a week for each subsequent child | |
| Orphan's pension | 14.55 |
| Child's pension | 3.00 |
| Widowed mother's pension (totally dependent)— | |
| Basic pension | 14.40 |
| Economic pension | 28.75 |
| Widowed mother's pension (partly dependent)— | |
| Basic pension | 4.00 |
| Economic pension | 24.60 |
| War service pension and war veteran's allowance— | |
| Unmarried | 28.75 |
| Married male | 23.95 |
| Married female | 23.95 |
| Age supplement (each) | 1.50 |
| Gratuity (veteran's widow) | 41.25 |
| Dependent children (replacing the rates shown where there are dependent children)— | |
| Solo parent and one child | 44.90 |
| Solo parent and two children | 47.90 |
| Increased by $1.25 a week for each subsequent child | |
| Married couple and one child | 50.90 |
| Increased by $1.25 for each subsequent child | |
Economic pensions, war service pensions, and war veterans' allowances are subject to a means test on income and are reducible if income from other sources exceeds $17 a week or $884 a year. In the case of a widow supporting a dependent child or children the allowable income without reduction in pension is, however, $21 a week. In the computation of a wife's pension, the income of the husband only is taken into account.
Travel grants and other concessions may be made to severely disabled persons.
The social security legislation permits basic war disablement and war widows' pensions to be paid concurrently with any social security benefit and to be entirely disregarded for income tests.
Pensions for Dependants—From 1 April 1971 wives' pensions have not been payable in respect of service on or after 3 September 1939 unless such pension was already payable at that date. From 1 April 1971 the wife of a member of the forces pensioned for total blindness in respect of service on or after 3 September 1939 may receive a war service pension but not an age supplement. In addition to pensions for wives and children, a pension may be granted to any member of a deceased or disabled serviceman's family.
Economic Pensions—An “economic pension” is defined as a supplementary pension granted on economic grounds and is in addition to any pension payable as of right in respect of death or disablement. In considering a claim for an economic pension a War Pensions Board is required to take into consideration the ability of the claimant to obtain and retain suitable employment, the personal income and ownership of any property, the cost of living, and other relevant matters.
Servicemen pensioned for minor disablement do not receive economic pensions.
Servicemen pensioned in respect of service on or after 3 September 1939 have not, from 1 April 1971, been eligible to receive an economic pension unless already in receipt of an economic pension at that date. At 31 March 1974 there were 4,636 economic pensions in force.
War Veterans' Allowances—These make provision on economic grounds for ex-servicemen, mainly of the First World War, who have become unfit for permanent employment by reason of mental or physical incapacity. At 31 March 1974 there were 9,175 allowances in force.
War Service Pensions—From 1 April 1971 the war service pension is payable on economic grounds in respect of overseas service in the Second World War or any subsequent war or emergency in which members of the New Zealand forces have served. Payable subject to an income test, the pension is designed for disabled or prematurely retired ex-servicemen who saw service overseas after 3 September 1939. Ex-servicemen of other Commonwealth countries may also qualify as applicants for the pension.
An applicant must also fulfil one of the following conditions: (a) be in receipt of a war disablement pension of not less than 70 percent of the maximum pension payable for total disablement; or, (b) being in receipt of a war disablement pension of less than 70 percent, unable by reasons of physical or mental infirmity to undertake permanent employment.
There are residential qualifications of 5 years for an ex-member of New Zealand forces, or an ex-member of other Commonwealth forces, who was a bona fide resident of New Zealand at the commencement of the war or emergency in which he served, and 20 years for other applicants.
No account is taken of the amount of war disablement pension in determining the amount of the basic war service pension. A war service pension cannot be paid concurrently with a social security benefit other than a family benefit.
The war service pension will ultimately be the only war pension paid for economic reasons. The rates and income exemption for this pension are similar to social security benefits and, by agreement with the War Pensions Board, the same general rules of treatment of income and assets are applied. In most respects, therefore, the war service pension is similar to its civilian counterparts, the age, sickness, or invalids' benefit as appropriate.
Where any war service pensioner and/or his wife has attained the age of 65 years an age supplement of a maximum of $78 a year each is added to the basic war service pension. At 31 March 1974 there were 3,465 war service pensions in force.
EMERGENCY RESERVE CORPS PENSIONS—These pensions are payable where death or disablement was suffered by a member of the Emergency Reserve Corps in the course of service (including training), or was directly attributable to such service.
MERCANTILE MARINE PENSIONS—Pensions and allowances are paid in respect of death or disablement of members of the mercantile marine as a result of the Second World War.
SUPPLEMENTARY ASSISTANCE—Supplementary assistance is available on a similar basis to social security supplementary assistance. During the year ended 31 March 1974 there were 343 grants totalling $131,046, compared with 366 grants totalling $102,966 in the previous year.
WAR BURSARIES—Bursaries for educational purposes are available to children of ex-servicemen in receipt of war service pension or 70 percent disablement pension and of deceased ex-servicemen in respect of whose deaths war pensions are paid.
During 1973-74, 1,121 bursaries were granted, expenditure being $102,701 for the year. The 1972-73 figures were 1,292 bursaries and $117,379.
WAR PENSIONS MEDICAL RESEARCH TRUST BOARD—When a pensioner dies any unpaid pension money not paid to dependants in the normal way may be paid to the War Pensions Medical Research Trust Fund for research into mental disorders or other fields of medical research beneficial to former members of the forces. This Medical Research Trust Fund is administered by a trust board which ensures that the money is applied to research beneficial to former members of the forces.
STATISTICAL REVIEW OF WAR PENSIONS, ALLOWANCES, ETC.—During the year ended 31 March 1974 the department dealt with 3,092 applications for war pensions. Of these, 798 applications were lodged by ex-servicemen in respect of their own disabilities, the balance being made up of claims by dependants, applications for economic pensions, war veterans' allowances, war service pensions, and pensions in respect of peacetime forces. The total for the previous year was 3,120. Of these, 789 were in respect of the applicant's own disability.
The number of appeals to the War Pensions Board dealt with in 1973-74 was 223, of which 52 were upheld.
Summary of Disabilities for Which Pensions Granted 1939-74—The following is a summary of the disabilities attributed to war service from 1939 onwards and for which ex-service personnel had been granted pensions up to 31 March 1974.
| Class of Disability or Disease | Type of Service | |||||
|---|---|---|---|---|---|---|
| 1939-45 War | Korean War | J Force | Vietnam | New Zealand | Total | |
| Infections and infestations | 2,072 | 92 | 8 | 7 | 160 | 2,339 |
| Nervous systems (including mental illness) | 9,847 | 44 | 13 | 5 | 1,755 | 11,664 |
| Eye, ear, and nose | 7,679 | 109 | 22 | 93 | 1,670 | 9,573 |
| Circulatory and blood systems | 2,809 | 12 | 3 | - | 1,085 | 3,909 |
| Metabolism and endocrine system | 446 | 2 | 1 | - | 180 | 629 |
| Respiratory system | 3,875 | 32 | 54 | 1 | 1,246 | 5,208 |
| Disease of bones, joints, muscles, tendons, and ligaments | 5,572 | 33 | 10 | - | 1,910 | 7,525 |
| Digestive system | 4,819 | 39 | 13 | 2 | 1,240 | 6,113 |
| Generative system | 357 | 1 | 1 | - | 126 | 485 |
| Gunshot wounds and accidental injuries to bones, joints, and soft tissues | 8,509 | 127 | 31 | 43 | 2,221 | 10,931 |
| Skin | 2,595 | 31 | 12 | 1 | 560 | 3,199 |
| Areolar tissues | 50 | 2 | - | - | 29 | 81 |
| Tumours and neoplastic growths | 231 | 2 | - | 1 | 57 | 291 |
| Malformations | 315 | 1 | - | - | 133 | 449 |
| Amputations (not including fingers and toes) | 519 | 4 | - | 7 | 23 | 553 |
| Urinary tract | 652 | 8 | 3 | 1 | 164 | 828 |
| Debility | 447 | - | - | - | 109 | 556 |
| Totals | 50,794 | 539 | 171 | 161 | 12,668 | 64,333 |
The following table shows for all classes of war pensions the number in force, except peacetime forces and war service pensions, at the end of March in each year and the expenditure during the years given.
| Year Ended 31 March | First World War (1914-18) | Second World War (1939-45) | K Force | War Veterans | South African | Mercantile Marine | Emergency Reserve Corps | Supplementary Assistance | Total |
|---|---|---|---|---|---|---|---|---|---|
| Number in Force | |||||||||
| 1964 | 12,556 | 24,521 | 184 | 14,350 | 14 | 25 | 8 | 212 | 51,870 |
| 1965 | 11,946 | 24,629 | 167 | 13,894 | 12 | 23 | 8 | 295 | 50,974 |
| 1966 | 11,389 | 24,716 | 190 | 13,488 | 11 | 21 | 8 | 377 | 50,200 |
| 1967 | 10,676 | 24,508 | 204 | 12,845 | 10 | 23 | 5 | 386 | 48,657 |
| 1968 | 10,160 | 24,497 | 239 | 12,642 | 7 | 20 | 6 | 419 | 47,990 |
| 1969 | 9,507 | 24,377 | 261 | 12,366 | 7 | 25 | 9 | 442 | 46,994 |
| 1970 | 8,836 | 24,254 | 255 | 12,032 | 6 | 25 | 8 | 423 | 45,839 |
| 1971 | 8,250 | 24,044 | 230 | 11,701 | 5 | 26 | 10 | 423 | 44,689 |
| 1972 | 7,640 | 23,275 | 237 | 10,183 | 4 | 26 | 6 | 490 | 41,861 |
| 1973 | 7,058 | 23,075 | 240 | 9,808 | 2 | 22 | 5 | 507 | 40,717 |
| 1974 | 6,467 | 22,765 | 234 | 9,175 | 2 | 20 | 5 | 471 | 39,139 |
| Expenditure $(000) | |||||||||
| 1964 | 6,756 | 6,967 | 27 | 12,928 | 10 | 10 | 4 | 29 | 26,731 |
| 1965 | 6,586 | 7,126 | 22 | 13,348 | 9 | 9 | 4 | 37 | 27,142 |
| 1966 | 6,507 | 7,829 | 23 | 13,299 | 9 | 8 | 5 | 48 | 27,728 |
| 1967 | 6,571 | 8,018 | 33 | 13,636 | 8 | 9 | 5 | 56 | 28,336 |
| 1968 | 6,399 | 8,310 | 42 | 13,521 | 8 | 9 | 5 | 58 | 28,352 |
| 1969 | 6,125 | 8,517 | 46 | 13,582 | 4 | 9 | 4 | 102 | 28,389 |
| 1970 | 6,303 | 9,434 | 54 | 14,195 | 4 | 10 | 5 | 71 | 30,077 |
| 1971 | 6,209 | 9,824 | 60 | 15,102 | 5 | 12 | 7 | 73 | 31,292 |
| 1972 | 6,530 | 11,907 | 70 | 15,430 | 5 | 14 | 7 | 73 | 34,036 |
| 1973 | 6,921 | 14,740 | 84 | 16,399 | 5 | 15 | 5 | 103 | 38,272 |
| 1974 | 7,069 | 17,425 | 96 | 17,794 | 2 | 19 | 5 | 131 | 42,541 |
The foregoing figures of expenditure include the following: (a) travelling allowances of $2 a week paid to 911 pensioners at 31 March 1974; (b) clothing allowances, of which 1,196 were being paid at 31 March 1974; (c) gallantry awards. The following are not included: (a) costs of certain medical treatment not available under social security, amounting to $187,015 in 1973-74; (b) railway and bus concessions to pensioners with severe disablement and locomotive disabilities, costing $41,740 in 1973-74; (c) funeral grants which cost $66,607 in 1973-74, and (d) loans towards the purchase of motor vehicles by certain seriously disabled pensioners (19 loans in 1973-74 totalling $19,300).
Administration costs in connection with war pensions and allowances are included in the administration costs of the Department of Social Welfare which are given in Section 6A.
Pensions paid in respect of all wars and types of service are shown by class in the following table.
| At 31 March | Disablement Pensions | Dependants of Disabled Ex-members | On Account of Death | Total | |
|---|---|---|---|---|---|
| Widows | Parents and Other Dependants | ||||
| First World War, 1914-18 | |||||
| 1969 | 5,639 | 663 | 3,193 | 12 | 9,507 |
| 1970 | 5,106 | 582 | 3,135 | 13 | 8,836 |
| 1971 | 4,683 | 498 | 3,060 | 9 | 8,250 |
| 1972 | 4,187 | 419 | 3,027 | 7 | 7,640 |
| 1973 | 3,775 | 328 | 2,945 | 10 | 7,058 |
| 1974 | 3,348 | 251 | 2,860 | 8 | 6,467 |
| Second World War, 1939-45 | |||||
| 1969 | 20,997 | 965 | 2,045 | 370 | 24,377 |
| 1970 | 20,862 | 953 | 2,092 | 347 | 24,254 |
| 1971 | 20,580 | 956 | 2,194 | 314 | 24,044 |
| 1972 | 20,256 | 504 | 2.224 | 291 | 23,275 |
| 1973 | 20,148 | 396 | 2,281 | 250 | 23,075 |
| 1974 | 19,865 | 356 | 2,318 | 226 | 22,765 |
| K Force | |||||
| 1969 | 244 | 8 | 6 | 3 | 261 |
| 1970 | 236 | 10 | 5 | 4 | 255 |
| 1971 | 214 | 10 | 1 | 5 | 230 |
| 1972 | 226 | 6 | 1 | 4 | 237 |
| 1973 | 230 | 4 | 2 | 4 | 240 |
| 1974 | 226 | 3 | 2 | 3 | 234 |
| Vietnam Force | |||||
| 1972 | 73 | 1 | 2 | 1 | 77 |
| 1973 | 109 | 2 | 4 | 1 | 116 |
| 1974 | 128 | 2 | 4 | 1 | 135 |
| Peacetime Forces | |||||
| 1972 | 921 | 17 | 54 | 22 | 1,014 |
| 1973 | 983 | 10 | 66 | 15 | 1,074 |
| 1974 | 1,012 | 4 | 67 | 14 | 1,097 |
| Other | |||||
| 1972 | 43 | 1 | 14 | 2 | 60 |
| 1973 | 36 | 1 | 13 | 1 | 51 |
| 1974 | 37 | 1 | 12 | 1 | 51 |
The next table shows the number of disability pensions in force at 31 March 1974, classified according to percentage of disablement.
| Percentage of Disablement | First World War 1914-18 | Second World War 1939-45 | K Force | Peacetime | Vietnam Forces | Other | Total |
|---|---|---|---|---|---|---|---|
| *Includes “over 100 percent” disablement which is a special rate pension for total blindness or other serious disablement. | |||||||
| 100* | 672 | 1,775 | 14 | 29 | 6 | 3 | 2,499 |
| 90-99 | 35 | 124 | - | 1 | 1 | - | 161 |
| 80-89 | 142 | 454 | 3 | 13 | 2 | - | 614 |
| 70-79 | 266 | 898 | 8 | 16 | 2 | - | 1,190 |
| 60-69 | 162 | 647 | 8 | 18 | - | 1 | 836 |
| 50-59 | 367 | 1,416 | 16 | 50 | 4 | 4 | 1,857 |
| 40-49 | 473 | 1,558 | 16 | 73 | 3 | 3 | 2,126 |
| Under 40 | 1,231 | 12,993 | 161 | 812 | 110 | 26 | 15,333 |
| Totals | 3,348 | 19,865 | 226 | 1,012 | 128 | 37 | 24,616 |
REHABILITATION—The Rehabilitation Act 1941 and the Emergency Forces Rehabilitation Act 1953 make provision for the re-establishment of ex-servicemen in civil life after service during a war or emergency.
The extent and nature of assistance is determined from time to time.
Rehabilitation Assistance—All forms of rehabilitation assistance available to ex-servicemen of the Second World War and K force ceased on 31 March 1965.
Resettlement assistance is available to men who have served in South-east Asia for 6 months prior to 1 April 1972 and for 12 months after that date.
Application for housing loans, which attract a 3 percent concession rate of interest, and interest free furniture loans of $400, must be lodged within 5 years from the date of return to New Zealand after qualifying service or 2 years after discharge from the forces whichever is the later.
Applications for subsidised trade training, and education assistance must be lodged within 2 years of return to New Zealand. Limited preferences in farm ballots are also available to ex-servicemen with a farming background.
Special provisions exist to ensure that rehabilitation assistance will continue to be available to all ex-servicemen whose rehabilitation may at any time be interrupted or become necessary as a result of disability arising from service.
Expenditure—Rehabilitation expenditure (including loan authorisations) for the 3 latest years ended 31 March was as follows.
| Item | Year Ended 31 March 1972 | Year Ended 31 March 1973 | Year Ended 31 March 1974 |
|---|---|---|---|
| $(000) | $(000) | $(000) | |
| Educational facilities, including books, tuition fees, and subsistence allowance | 26 | 22 | 17 |
| Trade training— | |||
| Salary subsidy | 9 | 9 | 13 |
| Training of blinded ex-servicemen | 14 | 14 | 19 |
| Loans— | |||
| Interest concessions | 1,045 | 950 | 761 |
| Loans authorised | 3,815 | 4,161 | 4,781 |
| Reserve Fund contribution | 53 | 112 | 78 |
| Totals | 4,962 | 5,268 | 5,669 |
GENERAL—Following the passing of the New Zealand Superannuation Act 1974, employer-subsidised superannuation has become a condition of employment for all employees in the country from 1 April 1975. Superannuation for all State employees is available under the authority of the Superannuation Act 1956. Local government employees and the staff of statutory bodies are provided for under the National Provident Fund Act 1950, which also authorises certain schemes for members of the general public. There are a considerable number of private superannuation funds operating under trust deeds subject to Government approval.
NEW ZEALAND SUPERANNUATION FUND—The fund came into existence on 1 April 1975 and is administered by the autonomous New Zealand Superannuation Corporation. The corporation consists of nine members of the board of management, four of whom are appointed by the Governor General and one of whom is chairman; two appointed after consultation with the New Zealand Federation of Labour and New Zealand Employers' Federation respectively; the Secretary to the Treasury; the Director-General of Social Welfare and the Commissioner of Inland Revenue.
Membership—From 1 April 1975 employees in New Zealand other than those in part-time domestic or gardening service must belong to a superannuation scheme from age 17 to age 65 years, although those who are age 55 years at that date may opt out. Membership for those under 17 years and the self-employed, which includes anybody owning or having control of 50 percent or more of a business by which they are employed, is voluntary, but to encourage membership taxation concessions for contributions have been increased. The New Zealand Superannuation Scheme works in partnership with other schemes which may be approved alternative or restricted schemes with the consent of the Government Actuary, who has now been given the responsibility formerly exercised by the Commissioner of Inland Revenue for safeguarding the interests of employee members of private superannuation schemes. An approved alternative scheme is one providing benefits in the same circumstances as they would result from membership of the New Zealand scheme, and in the case of a scheme existing on 6 September 1973, benefits of a comparable quantum, while later schemes have to provide benefits better by at least 25 percent. The rights of those who were members of schemes on 6 September 1973 which either cannot or do not intend to comply with the requirements to become alternatives to the New Zealand Scheme, can be preserved by the schemes being closed to new members and becoming approved restricted schemes. Rates of contributions and employer subsidy attained in terms of the trust deed by 31 March 1975 can continue in future and may be offset against any liability for contributions to the New Zealand scheme. By this means existing rights are preserved. It has been estimated that approximately 750,000 new contributors will join superannuation schemes as a result of the legislation.
Contributions—Contributions paid to superannuation schemes from 1 April 1975 will generally remain “locked in” until a benefit becomes payable and only those temporarily in New Zealand or who leave the country permanently and are overseas for more than 2 years will be able to obtain a refund of contributions. The minimum rates of contributions to the New Zealand scheme, the liability for which may be satisfied by contributions to an approved alternative or restricted scheme, start at 1 percent of taxable earnings from 1 April 1975 rising from 1 April 1976 to 2 percent and by one-half of 1 percent in each succeeding year to reach 4 percent from 1 April 1980. Employers must subsidise these contributions by at least a like amount of subsidy. Taxable earnings include overtime, bonus, and most allowances such as shift allowance, and also earnings from alternative sources of employment whether full or part-time, casual or permanent. To the contributions and subsidy collected for the New Zealand scheme (through the agency of the Inland Revenue Department) and accumulated in individual accounts for each employee, will be added annually compound interest of initially not less than 5 percent. Full portability is achieved because the contributions and subsidy continue to be credited irrespective of the employer from time to time. Approved alternative schemes must also provide portability and they may provide that on cessation a contributor's accumulated credit is either held by that scheme until a benefit becomes payable, is transferred to another alternative scheme or the New Zealand scheme, or the contributor may be given the choice of deciding whether the credit is held or transferred. The transfer value provided must be at least equal to the employee's contributions and the equivalent subsidy that would have accumulated had contributions been made to the New Zealand scheme, plus compound interest at an initial minimum of 5 percent compounded annually on both. If that part of the benefit on leaving an approved restricted scheme, arising from contributions made after 1 April 1975 is less than the credit that would have built up in the New Zealand scheme, the difference must be paid as a transfer value to the New Zealand scheme or to an approved alternative.
Benefits—On retirement, which is at the contributor's option from age 60 years but if he does not retire earlier is deemed to occur at age 65 years, the accumulated credit in each account is transferred to the annuity account of the New Zealand Superannuation Fund to purchase an annuity for life. The annuity will vary according to the credit and the average life expectancy at the age chosen for retirement, and will provide that annual adjustments for rises in the cost of living will be made, with the assumption for the first 5 years that these will average 4 percent each year. The annuity tables will be uniform for all and will make no distinction on the grounds of sex, marital status, or ethnic or geographical origins. The annuity account will also accept accumulated credits from other schemes and pay cost of living adjusted pensions. Up to a quarter of the accumulated credit may be taken as a lump sum cash payment on retirement, although members of the clergy with a demonstrated housing need may receive a greater lump sum. An annuity for life is also payable to a contributor who becomes unfit for work before age 60 years through mental or bodily infirmity or disability. If a contributor dies before retirement and leaves a spouse the spouse receives an immediate or deferred annuity at the rate the contributor would have received on retirement because of ill health, if the contributor was under age 51 years. From age 51 onwards there is a reduction in the proportion of the allowance available, and in the case of death from age 60 years, whether before or after retirement, a pension of one-half of the contributor's annuity is payable. As an alternative the spouse can choose a refund of half the credit in the contributor's account and this is the sum payable to a contributor's estate if there is no spouse. In the event of remarriage or death the spouse's allowance payable to the widow or widower ceases and any amount by which benefits paid fall short of half the credit in the contributor's account is paid as a lump sum. There are provisions for the recognition of regular relationships where a couple are not legally married, particularly when there are children.
Investment—The New Zealand Superannuation Fund itself, and the funds of other organisations operating superannuation schemes, will, because of compulsory membership, grow steadily and will possibly exceed the present level in real terms of the funds available for investment by all the life insurance offices in New Zealand. This will represent a substantial and regular increase in the capital available for development purposes within New Zealand. Regulations made under the authority of the Reserve Bank Act will specify the investment powers of all superannuation funds, including the New Zealand Fund and (apart from continuing the previous requirement that a proportion of investments must be in Central Government or local body fields) will also prohibit any one fund owning more than 15 percent of the shares carrying voting rights of any company listed on the stock exchanges in New Zealand. This is a measure designed to ensure the responsible use of economic power which superannuation funds will come to possess.
GOVERNMENT SUPERANNUATION FUND—The Government Superannuation Fund in its present form was established on 1 April 1948, amalgamating funds which had been in existence since the early 1900s. Its revenues consist of contributions, subsidies from the Consolidated Revenue Account, trading departments, and other bodies, plus interest earned on investments.
The fund is administered by a board comprising the Minister of Finance as statutory chairman, the Secretary to the Treasury as deputy chairman, the Chairman of the State Services Commission the General Manager of Railways, the Director-General of Education, and the Post Office, the Commissioner of Police, and five members appointed on the nomination of various employee organisations and one on the nomination of the Minister of Defence.
Membership—All State employees may belong to the fund and this covers those in departments under the control of the State Services Commission, the Education Service, the New Zealand Railways, and the Post Office. Membership is compulsory for permanent members of the armed forces, the Police, the Prison Service, judges of the Supreme Court, Maori Land Court judges, magistrates, members of Parliament, and members of the Cook Islands, Niue, and Tokelau Islands public services. In addition, from 1 January 1964 membership has been compulsory for permanent employees of the Government, except married women, from age 17 to age 24 years.
Contributions—Deductions are made from basic salary on a sliding scale according to the age from which membership of the fund dates. These are at the rate of 6 percent to age 29 years increasing by 1 percent steps each succeeding 5 years of age until a maximum rate of 11 percent is payable from age 50 years. From 1955 contributors have been able to elect to contribute at 60 percent of normal rates and be eligible for only that proportion of the standard benefits.
Credit may be purchased in certain circumstances for periods of Government service not currently ranking and for full-time study or periods of training outside Government service and which resulted in a qualification being gained. Certain intervals in Government service may also be purchased for superannuation purposes. The costs of buying credit for these periods varies according to age and salary at the time of purchase.
Benefits—The principal objective of the fund is the payment of an allowance on retirement, which is usually between ages 60 and 64 years, but may be earlier with the consent of a contributor's controlling authority and of the board where retirement is because of medical unfitness for further duty. Standard retiring allowances are calculated at one one-hundred-and-twentieth of the average of a contributor's salary over the final 5 years of service, for each year of contributory service, plus an equal amount for the first 40 years of service. In some cases of short service the average of the salaries over the final 3 years of service is used. Up to a quarter of the annual allowance may be surrendered on retirement in return for a cash payment of nine times the amount commuted. Those reaching normal retiring ages may also elect to receive a higher rate of allowance to age 65 years in return for a lower rate thereafter when they qualify to receive the social security universal superannuation benefit.
On death before or after retirement an allowance at the rate of half the allowance a contributor would have received had retirement occurred on the date of death, or half the allowance actually being paid at the time of death, is payable to any surviving spouse, for life or until remarriage. To this is added $78 a year for children to age 16 or 18 years where schooling is extended, or possibly to a higher age in the case of inability to earn a living because of physical or mental reasons.
All allowances are paid in advance in instalments each 28 days and no recovery is made where an entitlement ceased during a benefit period.
A cost-of-living adjustment scheme was introduced in 1969 providing for allowances to be increased relative to movements in the Consumers' Price Index. Existing and future contributors pay an extra 1 percent of their salaries to participate but those already retired at the time the scheme was introduced receive an ex gratia adjustments based on 70 percent of price movements. Those who were already contributors in 1969 receive the basic 70 percent adjustment plus the proportion of the remaining 30 percent that the period paying the extra contributions bears to their total superannuation service. The adjustments reflect price rises that occur from age 60 years for superannuitants and age 55 years for widows.
Special Conditions—Armed forces contributors may qualify for a retiring allowance after completing their engagements with not less than 20 years' service, whatever their age at the time. In 1972 a special variation of the cost-of-living adjustment scheme was introduced allowing this group to pay an additional 0.7 percent of salary additional to the rates payable under the main adjustment scheme, in return for which they now receive adjustments after age 60 years for price movements since retirement.
Female contributors who were employed before the introduction of equal pay for women in the State Services in 1962 still retain some special conditions related to the former entitlement of women to retire on completion of 30 years service or on reaching age 55 years, but those joining the fund since 1962 have the same conditions as males.
Judges of the Supreme Court contribute at the rate of 8 percent of their salaries and their retiring allowances are based on a varying formula which produces a maximum of two-thirds of the final salary after 20 years' service. They normally retire on attaining age 72 years and with service up to 10 years they are paid the appropriate proportion of an allowance of a quarter of their salary. Each year of service beyond 10 attracts an addition to the allowance of one twenty-fourth of salary up to 20 years. A widow of a judge receives half her husband's entitlement with a minimum of 15 percent and a maximum of 25 percent of his final salary.
Magistrates and judges of the Maori Land Court contribute at the rate of 9 percent of their salaries for retiring allowances based on one thirty-sixth of their final salary for each year of service, up to a maximum of two-thirds after 24 years' service. They normally retire at age 60 years and the widow's benefit is calculated as for judges.
Members of Parliament contribute at the rate of 11 percent of an ordinary member's salary for an allowance based on one thirty-second of an ordinary member's salary at the point of retirement for each year of service, up to a maximum of two-thirds after approximately 21 years' service. They qualify for an allowance from age 50 years on retiring from Parliament after not less than 9 years' service or not less than 8 years if this covers the duration of at least three sessions. The standard provisions for spouses and children apply.
Police and Prison Service contributors are obliged to retire at age 60 years and to enable older entrants to attain additional superannuation service their service is counted as 1 year and one-seventh if they join the fund after age 25 years. A lesser fraction is added for those joining between 20 and 24 years increased rates of contributions are payable by those whose service is scaled up. The standard benefits apply.
Statistics—As at 31 March 1974 there were 114,984 contributors to the Government Superannuation Fund who paid $37,237,436 into the fund during the year. At the same time there were 28,989 super-annuitants who were entitled to $39,093,586 a year, made up as follows:
| Qualification for Allowance | Males | Females | Total | Annual Allowances |
|---|---|---|---|---|
| $(000) | ||||
| Retired for age or length of service | 15,007 | 3,377 | 18,384 | 32,097 |
| Retired for ill health | 859 | 196 | 1,055 | 1,015 |
| Widows and dependant widowers | 2 | 8,274 | 8,276 | 5,883 |
| Children | 665 | 609 | 1,274 | 99 |
| Totals | 16,533 | 12,456 | 28,989 | 39,094 |
Accumulated funds at 31 March 1974 amounted to $267,243,574. Total assets, which amounted to $268,446,038 included investments $259,586,600; interest due and accrued $3,461,569; contributions in course of transmission etc $1,960,939; and cash in hand and at the bank $3,436,930.
The average effective interest earning of the fund for the year ended 31 March 1974 was $5.40 percent.
The total revenue of the fund for the year ended 31 March 1974 was $84,645,885 including members' contributions $37,237,436, interest on investments and contributions $13,163,304, other items $2,148, and subsidy $32,242,997. The total amount expended during the year was $52,296,567, including retiring and other allowances $42,340,329, and refunds of contributions $9,956,238.
In the Parliamentary Superannuation Account revenue was $218,938, including contributions and subsidy each of $105,267 and interest $8,404. Expenditure on retiring and other allowances was $129,501.
| Year Ended 31 March | Number of Contributors | Annual Contributions* | Interest Received From Investments | Subsidy From Government Trading Departments, and Others | Annual Value of Allowances | Accumulated Fund |
|---|---|---|---|---|---|---|
| *Includes transfers from National Provident Fund. | ||||||
| $(000) | $(000) | $(000) | $(000) | $(000) | ||
| 1970 | 105,000 | 17,572 | 7,277 | 22,741 | 30,250 | 151,831 |
| 1971 | 107,857 | 23,590 | 8,255 | 28,062 | 31,084 | 174,843 |
| 1972 | 109,015 | 29,170 | 9,642 | 29,141 | 33,267 | 203,516 |
| 1973 | 113,121 | 32,182 | 11,325 | 31,136 | 36,131 | 234,894 |
| 1974 | 114,984 | 37,237 | 13,163 | 32,243 | 39,094 | 267,244 |
NATIONAL PROVIDENT FUND—The National Provident Fund was established on 1 March 1911 with the object of providing a superannuation scheme for the general public. The present legislative authority is contained in the National Provident Fund Act 1950 and its amendments.
The fund is administered by a board comprising the Minister of Finance as statutory chairman, the Secretary to the Treasury, the Director-General of Health, the Valuer-General, the Superintendent of the Fund, and up to three other members appointed by the Governor-General.
The fund now provides services in five separate areas:
Public Fund—The two oldest pension schemes have catered for the general public on an individual basis, sometimes with encouragement from their employer or as members of a group.
Local Authorities Superannuation—Three schemes cover employees of all local bodies, quasi-government and other approved organisations, firemen, and nurses.
National Superannuation Schemes—Two employer subsidised schemes are available, one for farm employees and the other for any employees of companies, firms, Government departments, or local authorities willing to become contributing employers. A further scheme is available for the self-employed.
Supplementary Scheme—This scheme offers a choice of benefits beyond the minimum requirements of compulsory superannuation.
Local Authorities Investment Pool—This ancillary activity enables local authorities to invest surplus funds at interest.
The State guarantees the benefits payable under all the schemes and meets all administration expenses. There are some elements of State subsidy in the public fund and local authority schemes, and a guarantee of minimum interest earnings in the national schemes.
Public Fund—Membership was available to any resident of New Zealand from age 15 to age 59.
The first scheme of the fund, the Level Premium Scheme, which is closed to new members, enables contributors to purchase a pre-determined weekly pension from age 60 years by paying fixed regular contributions according to age on joining. For the first $20 per week a State subsidy of 25 percent is built into the contribution rates and after 5 years' membership contributors qualify for incapacity, widows', and dependent children's allowances.
The Annual Single Premium Scheme accepts contributions of any amount from members at any time. The contributions paid during each year are applied at the end of that year towards the purchase of a pension from age 60 years according to the contributors' then age. Only the first $1,000 contributed each year attracts State subsidy and this ceases once the aggregate pension purchased reaches $20 per week. There is a widow's benefit.
In both schemes contributors may defer for up to 5 years the start of their pensions, which then increase by 10 percent each year of deferment and contribution may continue. On accepting the pension, or at age 65 years, contributors may vary the amount payable by surrendering up to a quarter in return for a lump sum equal to nine times the annual amount foregone. Level Premium Scheme members may choose a joint and survivorship option, which is a reduced pension payable for a life to either the beneficiary or their surviving spouse. The Annual Single Premium Scheme offers the choice of surrendering part of the pension entitlement to purchase an annuity for an approved dependant or an additional entitlement for a widow.
Local Authorities Superannuation—The schemes provide superannuation with the contributions and benefits related to salaries and service for local government employees, with schemes to suit the special needs of firemen and nurses and variations for the aircrew of the National Airways Corporation and Air New Zealand.
The standard conditions are substantially the same as those for the Government Superannuation Fund set out in the section in that fund. As there is provision for transfer to and from that fund, State and local authority employees have a wide range of employment possibilities open to them without loss of accrued superannuation rights.
A scheme for adjusting allowances in accordance with rises in the cost of living was introduced on 1 April 1971 for the contributing employees and superannuitants of contributing authorities which agreed to pay the extra subsidies involved. This was almost 2 years later than the cost-of-living adjustment scheme of the Government Superannuation Fund. Similarly the increase in the basic rate of adjustment to 70 percent took effect from October 1974, 6 months after the Government scheme but otherwise the adjustment schemes are similar.
National Superannuation Schemes—The national scheme for farm employees was originally prepared at the request of the Federated Farmers of New Zealand to assist in retaining farm employees. Contributions may be from 50c per week up to 5 percent of gross earnings and are subsidised by an equal amount from the employer. These aggregate payments accumulate at compound interest until retirement, normally between ages 60 and 65 years, when the credit may be used to purchase an annuity for life, or up to half may be used to purchase an annuity for a wife. Up to a quarter of the credit may be taken as a lump sum or a greater proportion where these is a demonstrated housing need. Pensions paid to members age 66 years or older, or widows age 56 years or older, are adjusted annually as reserves allow and when cost-of-living increases are warranted. If a contributor dies before retirement his widow is entitled to the benefit of his credit in the fund immediately, or she may defer her election. A contributor may withdraw his personal contributions plus 3 percent compound interest after a minimum period of 10 years from joining, or may cease to contribute temporarily or permanently but still retain his accrued rights with his credit continuing to earn interest and bonus until retirement. The scheme is now closed to new members as an approved restricted scheme.
The National Superannuation Scheme is a general extension of the farm employees' scheme and any employee is eligible to join, provided his employer is willing to subsidise contributions on a dollar-for-dollar basis. The two schemes were similar except for the right to take more than a quarter of the credit at retirement in a lump sum. However, the National Superannuation Scheme has been amended to become an approved alternative to the New Zealand scheme. There are now minimum contribution rates in accordance with those prescribed in the New Zealand Superannuation Act, transfer values are payable, withdrawal rights apply only to those leaving New Zealand permanently, the accumulated credit on retirement will be transferred to and cost-of-living adjusted pensions paid from the annuity account of the New Zealand fund and options available to the surviving spouse on the death of a contributor before retirement include the right to uplift the total credit. The National Superannuation Scheme for the Self-Employed is similar to the amended national scheme, except that contributions of any amount may be made at any time and there is of course no employer subsidy. The scheme should cater for those in the New Zealand or national schemes as employees who wish to continue making provision for retirement on becoming self-employed and thus exempt from compulsory superannuation.
Supplementary Schemes—The Supplementary National Superannuation Scheme is designed to accept contributions beyond the minimum rates stipulated by the New Zealand Superannuation Act and will pay benefits in a similar manner to the national scheme. However there will be the additional right to withdraw contributions after 5 years' membership and to take a refund of contributions and interest on retirement instead of a pension. There is a built-in widow's cover for death before retirement, but to provide for a widow after that time the contributor has the option of surrendering up to half his credit at retirement to purchase an annuity for any spouse.
Investment Pool—Most local authorities and other quasi-government organisations which are contributing authorities to the standard scheme, as well as an increasing number of other generally non-commercial approved bodies lodge sums at interest with the fund for investment. The turnover of the pool for the year ended 31 March 1974 was $356.4 million and the balance at that date was $140.6 million. The following table shows the various terms for which money is deposited and the different classes of organisations supporting the pool as at 31 March 1974.
| Class of Local Authority | At Call | 3-6 months | 6-12 months | 1 and under 2 years | 2 and under 3 years | 3 and under 5 years | Sinking Funds | Total |
|---|---|---|---|---|---|---|---|---|
| $m | $m | $m | $m | $m | $m | $m | $m | |
| Cities and boroughs | 17.150 | 2.872 | 3.536 | 4.365 | 1.886 | 8.163 | 4.938 | 42.910 |
| Counties | 5.844 | 0.468 | 0.700 | 0.776 | 0.698 | 2.804 | 1.336 | 12.626 |
| Electric power boards | 2.107 | 0.193 | 1.066 | 0.472 | 0.168 | 5.556 | 2.992 | 12.554 |
| Fire boards | 0.935 | — | 0.071 | 0.091 | 0.094 | 0.125 | 0.142 | 1.458 |
| Harbour boards | 3.834 | 0.422 | 2.457 | 0.881 | 0.353 | 4.484 | 1.124 | 13.555 |
| Hospital boards | 4.372 | 0.101 | 4.543 | 3.907 | 0.692 | 1.679 | 9.956 | 25.250 |
| Sundry local authorities | 2.005 | 0.363 | 1.691 | 0.517 | 0.443 | 2.342 | 1.388 | 8.749 |
| Other approved bodies | 9.538 | 0.334 | 1.018 | 2.217 | 5.638 | 4.768 | — | 23.513 |
| Totals | 45.785 | 4.753 | 15.082 | 13.226 | 9.972 | 29.921 | 21.876 | 140.615 |
About one-half of the pool is made up of short-term deposits of up to 12 months which cannot be expected to be retained in the fund for very long, so that a considerable portion must necessarily be invested in readily realisable short-term Government stock. There is however a relatively stable balance in the pool, principally of longer term money, from which the fund is able to augment substantially its investable income for lending to local authorities and other organisations using the fund for their staff superannuation.
Statistics—As at 31 March 1974 there were 63,431 contributors, 17,213 of whom belonged to local authorities schemes, and they paid a total of $26,154,835 into the fund. At the same time there were 8,919 allowances being paid totalling $5,523,449 a year, $4,902,196 of which was payable to the 3,731 local authority superannuitants, their widows, or dependants. Contributors' accumulated funds at 31 March 1974 amounted to $227,677,366 and the total assets, which amounted to $369,176,097 with the investment pool, included New Zealand Government stock $90,393,600, Western Samoan Government stock $348,292, local authorities securities $267,287,049, mortgages $1,448,527, company shares and debentures $806,710, building work in progress $240,899, cash $2,397,985, accrued interest and subsidy $4,986,916, and miscellaneous $1,266,119.
The average effective interest earnings of the fund for the year ended 31 March 1974 was $6.49 percent.
The total revenue of the fund for the year ended 31 March 1974 was $219,408,255 including investment pool $175,390,000, contributions $26,158,559, interest $13,269,167, and Government subsidy $4,590,529. The total expenditure for the year was $191,839,871, including investment pool $180,996,000, retiring and other allowances $6,984,614, refunds of contributions $2,859,257, and transfer to Government of Western Samoa $1,000,000.
PRIVATE SCHEMES—There is a great diversity in the pattern of benefits and scheme design generally in existing private schemes even though substantial numbers do fall into broad categories.
Numbers of funds or employers at 31 March 1973 covered by a survey of staff superannuation funds are shown in the following table, along with members.
| Type of Fund | Number | Members |
|---|---|---|
| *Including approximately 5,000 Government and local authority employees. | ||
| Private lump sum funds | 3,994 | 110,834 |
| Private pension funds | 459 | 50,917 |
| Employers participating in the National Provident Fund schemes (including Govt. and Local Auth.) | 1,191 | 12,960* |
| Totals | 5,644 | 174,711 |
Thirty-six self-superannuation schemes had a membership of approximately 60,000.
Under the New Zealand Superannuation Act 1974 alternatives to the New Zealand Superannuation Scheme require the consent of the Government Actuary.
Table of Contents
—Since 1945 education has been marked by extensive growth. In 1945, school, college, and university enrolments combined were 328,000 or 19.3 percent of the population but by 1973 the combined enrolments had risen to 923,000 or 31.0 percent of the population. This growth is accounted for by increased births for the major part of the period; a marked tendency for more pupils to stay on longer at school and also to undertake further education after leaving school; and the development of new educational services. In the last 25 years pupils in primary schools have doubled and pupils in secondary schools more than trebled (with an eightfold increase in sixth and seventh forms), while the number of students in universities more than trebled and students receiving technical education quadrupled.
At the same time education has grown more intensive and education expenditure has expanded from 6 percent of total Government expenditure in 1945-46 to 17.8 percent in 1973-74.
The strongly egalitarian temper of New Zealand society—a product of historical, geographical, and economic factors—is reflected in education administration by the policy of marking education at all level freely available. In few other countries is there closer approximation to equality of educational opportunity—and few countries have a larger proportion of their populations is schools, colleges, and universities.
ADMINISTRATION—The Education Act 1964 provides for free and secular education in State primary and secondary schools, and compulsory education for all children between the ages of 6 and 15 years. University education is provided under the Universities Act 1961, and funds for universities are distributed by the University Grants Committee.
The central administrative body directing education is the Department of Education, whose permanent head is the Director-Central of Education. The department consists of professional and administrative officers with its head office in Wellington. To bring administration closer to schools and institutions in the system the department has regional offices in Auckland, Wellington, and Christchurch, each under the control of a superintendent.
The Department of Education, in discharging its responsibility to the Minister for administration of the system, advises the Minister on policy and development, controls the expenditure of money voted, ensures that schools are built and equipped when and where required and that teachers are recruited and trained, checks that standards are maintained in schools, State and private, and assesses the efficiency of teachers. An important professional function of the department is to conduct curriculum revision and development and to recommend curriculum changes to the Minister.
Machinery for planning in the broadest sense as it affects national development has been set up in the form of an Advisory Council on Educational Planning. This body is concerned with the establishment of priorities in educational development.
The control and management of State primary schools are the responsibility of the ten education boards, and local secondary schools boards control State secondary schools. These boards are responsible for the schools in their area. They are the employing authorities of the teachers. They disburse the grants received from the Department of Education for the maintenance of schools and building of new schools, and for equipment and teaching materials. No local rates are levied for education either by municipal or local education authorities.
The Department of Education directly administers the Correspondence School and State special schools. It controls the inspectorate, supervises the staffing of schools, and conduct the School Certificate Examination. All State and registered private matters. The department also administers the capital expenditure voted for schools buildings.
There are a number of private primary and secondary schools in New Zealand conducted either by religious bodies or private individuals. These schools are required by the Education Act 1964 to comply with defined standards of accommodation and teaching as a pre-requisite for compulsory registration under the Education Act.
The Department of Education has official contacts with the National Council of Adult Education and the University Grants Committee but the universities are independent in their educational activities.
Education Boards and School Committees—The members of education boards have in the past been elected solely by members of school committees on a ward system, but provision has now been made for the appointment to each board of a teacher to represent all teachers employed by the board.
Each State primary school controlled by an education board has its school committee, elected by the parents of pupils and adults resident in the school district. It is a statutory body charged with management of property and other matters on behalf of the board. The members of school committees form the electorates for electing education board members.
A school committee's essential function is the care of school buildings, grounds, and equipment, but, in addition to this, many interest themselves very keenly in the general activities of the school and provide, along with voluntary parent-teacher associations, a focusing point for local opinion on educational matters.
Secondary School Boards—Secondary schools are controlled and administered by their own boards of governors. The local boards controlling secondary schools (either singly, or several schools in the same town) are made up of representatives of the parents of pupils, of the education board of the district, and of other local groups and organisations and provision has recently been made for the election of teacher representatives. They are constituted by the Minister and published in the New Zealand Gazette. In some metropolitan areas, groups of secondary schools have been linked together for administrative purposes under secondary school councils but each school still retains its own board of governors which has a large measure of autonomy in the control and management of its own school.
Technical Institute Councils—Technical institutes, including the Technical Correspondence Institute, are controlled by councils with members representing business and industry, local authorities, the university, and governing bodies of secondary schools.
Community Colleges—Amendments to the Education Act in 1974 created a new category of institution “Community Colleges” designed to meet continuing education needs in provincial centres particularly. They are governed as Technical Institutes.
Teachers' College Councils—Independent of education boards, teachers' college councils have been established. The councils have the usual administrative functions, combined with some professional responsibility for the training of teachers. They include representatives of education boards, of the Department of Education, the university, and of the teachers' organisations.
EDUCATIONAL DEVELOPMENT CONFERENCE 1974—Wider facilities for pre-school education, greater community-school participation and more flexibility in the school curriculum were among the major recommendations made in a top-level report to the Government in December 1974. The 200-page 110-reeommendation report came from the advisory council on educational planning, and represented the outcome of the Educational Development Conference held throughout New Zealand earlier in 1974.
This conference and its working parties and associated study groups represent easily the biggest study of education ever undertaken in New Zealand. At one time, over 50,000 people were meeting week by week in 3,000 study groups throughout the country.
The council said there should be five main thrusts in education development:
There should be much greater attention to preschool facilities which should be doubled over a five to 10-year period;
Although educational opportunity is available to all, many fail to take advantage of it. There should be a wide-scale attack on this problem, with special attention to “under-achievers”, and to more flexibility in the whole system;
More positive efforts should be made to ensure realistic parent and community participation in education, beginning with the early childhood years;
There should be continuing education for all, with an open-door policy wherever feasible. The philosophy of “second chance” education is strongly supported; and
Delegation of authority and responsibility is clearly desired.
Private Schools—There are a number of private primary and secondary schools conducted by religious bodies or private individuals. Financial assistance is provided by the State subject to certain conditions. Academic bursaries, secondary school bursaries, and Maori scholarships may be tenable at private secondary schools. Assistance for transport by rail and road and a boarding allowance under certain conditions may also be given to pupils attending private schools, whether primary or secondary. School publications are supplied to private schools. From February 1970 Central Government has made grants to independent schools on the basis of teachers' salaries. For the first year the proportion was 20 percent and the estimated cost $2.5 million; the proportion is to rise to a maximum of 35 percent over 7 years; it reached 32.5 percent in 1974. Associated government controls are approved before new independent schools can be built, and there is a requirement that after a transitional period, new teacher entrants to independent schools must possess certain minimum qualifications.
State Aid Conference—The whole question of financial assistance by the State has been the subject studied by a conference of all interested parties, educational and political, which first met in May 1973. By December 1974 the conference was able to examine proposals relating to the conditional integration of private schools into the State system.
Co-education—Co-education applies at all stages of the school system. All State primary schools and some private primary schools teach boys and girls together. At the secondary level all district high schools and three-quarters of the State secondary schools have both boys and girls on their rolls, whilst the remaining quarter of the State secondary schools and nearly all of the private secondary schools are single-sex schools. A comparison of the total enrolment of all secondary schools (State as well as private) shows that over the last two decades, there has been a trend toward the provision of more co-educational than single-sex schools.
PUBLIC EXPENDITURE ON EDUCATION—The following table shows the net expenditure from public funds on each branch or service of education for the latest March years.
| Item | 1972-73 | 1973-74 |
|---|---|---|
| $(000) | $(000) | |
| Programme— | ||
| I—Administration and General | 5,918 | 6,666 |
| II—Pre-school Education | 2,732 | 3,711 |
| III—Primary and Secondary Education | ||
| Administration and support services | 52,435 | 60,575 |
| State primary education | 110,820 | 131,267 |
| State secondary education | 73,961 | 86,876 |
| Assistance to private schools | 6,889 | 8,661 |
| Special education | 4,303 | 5,376 |
| Sub-total | 248,408 | 292,755 |
| IV—Higher Education— | ||
| University education | 70,783 | 78,657 |
| Teacher training | 29,758 | 35,247 |
| Senior technical education | 17,067 | 20,698 |
| Sub-total | 117,608 | 134,602 |
| V—National Library | 2,173 | 2,473 |
| Totals | 376,839 | 440,207 |
The foregoing figures do not include revenue received by universities from endowments, fees, etc., which are available for educational purposes.
The following table gives Government net expenditure on education and relates it to total Government expenditure in national accounting terms. The share of public expenditure devoted to education has increased significantly in relation to other forms of Government expenditure. Much of the increased spending has, of course, been a direct consequence of roll growth.
| Year Ended 31 March | Net Education Expenditure* | As Percentage of Total Government Expenditure | |||
|---|---|---|---|---|---|
| Current (Salaries, etc.) | Buildings | Total | Current Education Expenditure | Total Education Expenditure | |
*Including Child Welfare up to 1972 and National Library Service. †About 66 percent of present current expenditure is on salaries of teachers and other staff. ‡Government expenditure in national accounting terms is the total net expenditure on Central Government plus Central Government gross capital formation. Details of Government expenditure prior to 1947 are not available in their present form. | |||||
| $(million) | percent | ||||
| 1946 | 13.3 | 2.4 | 15.7 | ‡ | ‡ |
| 1951 | 25.1 | 5.0 | 30.1 | 6.9 | 8.3 |
| 1956 | 44.2 | 12.8 | 57.0 | 7.9 | 10.2 |
| 1961 | 69.3 | 17.8 | 87.1 | 8.9 | 11.2 |
| 1963 | 83.2 | 19.6 | 102.8 | 9.9 | 12.2 |
| 1964 | 91.6 | 22.0 | 113.6 | 10.0 | 12.4 |
| 1965 | 102.0 | 27.0 | 129.0 | 10.2 | 12.9 |
| 1966 | 112.5 | 28.0 | 140.5 | 10.3 | 12.9 |
| 1967 | 125.2 | 32.0 | 157.2 | 10.6 | 13.3 |
| 1968 | 140.5 | 32.5 | 173.0 | 11.6 | 14.3 |
| 1969 | 155.1 | 30.9 | 186.0 | 12.2 | 14.7 |
| 1970 | 173.4 | 33.9 | 207.3 | 12.6 | 15.0 |
| 1971 | 221.2 | 44.4 | 265.6 | 13.7 | 16.4 |
| 1972 | 284.7 | 50.4 | 335.1 | 15.1 | 17.8 |
| 1973 | 315.6 | 61.2 | 376.8 | 13.9 | 16.6 |
| 1974 | 375.0† | 65.2 | 440.2 | 14.2 | 16.7 |
Over the years 1965-71 spending on education was divided as follows: State primary education, 40 percent; State secondary education, 24 percent; universities, technical institutes, teachers colleges, 27 percent; other spending, 9 percent.
The average annual compound rates of growth for types of education over a 20-year period are shown in the following table.
| Type of Education | Expenditure | Average Annual Compound Rate of Increase | |
|---|---|---|---|
| 1951 | 1971 | ||
| *For 1966 year, not previously costed. | |||
| $(million) | percent | ||
| State primary | 17 | 102 | 9 |
| State secondary | 7 | 64 | 12 |
| Universities | 2 | 44 | 16 |
| Teacher training | 2 | 20 | 13 |
| Technical | 5* | 11 | 21 |
| All State education | 30 | 268 | 12 |
The following figures relate Government net expenditure on education to gross national product and mean population.
| Year Ended 31 March | Expenditure from Public Funds | Expenditure as Percentage of Gross National Product | Expenditure per Head of Mean Population |
|---|---|---|---|
| *Provisional. | |||
| $(000) | percent | $ | |
| 1964 | 113,574 | 3.6 | 44.54 |
| 1965 | 128,988 | 3.7 | 49.59 |
| 1966 | 140,509 | 3.7 | 53.08 |
| 1967 | 157,209 | 4.0 | 58.33 |
| 1968 | 173,049 | 4.2 | 63.27 |
| 1969 | 186,016 | 4.3 | 67.40 |
| 1970 | 207,342 | 4.4 | 74.35 |
| 1971 | 265,554 | 4.9 | 93.79 |
| 1972 | 335,051 | 5.3 | 116.48 |
| 1973 | 376,839 | 5.2 | 128.51 |
| 1974 | 440,207 | 5.1* | 146.96 |
An international comparison of public expenditure on education as a percentage of national income is given in the following table for selected countries. (Source: Organisation for Economic Co-operation and Development.) Educational expenditures w many countries have been rising twice as fast as national income.
| Country | Public Expenditure on Education as Percentage of National Income | |
|---|---|---|
| 1955 | 1965 | |
| Austria | 3.98 | 4.79 |
| Belgium | 3.99 | 6.48 |
| Canada | 3.50 | 7.63 |
| Denmark | 4.00 | 6.98 |
| France | 3.73 | 6.05 |
| Germany, West | 2.80 | 3.84 |
| Italy | 3.79 | 6.48 |
| Netherlands | 4.41 | 7.53 |
| Norway | 4.27 | 6.98 |
| Switzerland | 3.58 | 4.31 |
| United Kingdom | 3.32 | 5.21 |
| United States | 4.07 | 6.28 |
Australia's figure for 1965-66 (4.36 percent) was very similar to that for New Zealand.
International comparisons need to be treated with reserve because of the differing education systems and expenditure measures.
EDUCATION BUILDINGS—The increases in school population coupled with the increasing urbanisation of the population and the development of new housing areas has led to a continued expansion of the school building programme. Figures for additional classrooms completed in recent years are shown below. The figures do not include classrooms to replace obsolete accommodation.
| Year | Primary | Secondary |
|---|---|---|
| 1963 | 521 | 330 |
| 1964 | 501 | 305 |
| 1965 | 500 | 266 |
| 1966 | 479 | 264 |
| 1967 | 528 | 304 |
| 1968 | 559 | 295 |
| 1969 | 578 | 302 |
| 1970 | 603 | 376 |
| 1971 | 666 | 451 |
| 1972 | 847 | 570 |
| 1973 | 810 | 551 |
The year 1973-74 was one of considerable activity in education building. Included in the work undertaken was a total of 1,103 permanent classrooms and 368 temporary rooms. Three new secondary schools, 4 new primary schools, 9 new intermediate schools, and 5 Form I-VII schools were opened at the beginning of the 1974 school-year.
Building expenditure for 1973-74 was as follows:
| $(m) | |
|---|---|
| Universities (including equipment) | 18.6 |
| Education buildings | 43.6 |
| Technical institutes | 2.5 |
| Teachers colleges | 3.8 |
| Pre-school buildings | 0.5 |
Since 1955 the “block” principle has been used in the planning of schools, giving improved teaching facilities and amenities at a lower cost. Development has continued with the design of new secondary schools in the light of changing needs.
Within the limits imposed by Central Government policy and by finance allocated, local education boards, which employ architectural and specialist building staff, are responsible for the planning and building of primary schools. A building code, which was revised in 1970 to provide better facilities and to allow for more flexibility in the layout of primary and intermediate schools, ensures that basic requirements are met throughout New Zealand.
A period of relative stability in primary school rolls has been used to introduce progressively the smaller class programme. This in turn accelerated the need for extra classrooms. In addition, in 1973-74, a special financial allocation was made to education boards to enable them to replace old substandard temporary classrooms with permanent rooms.
The period since the Second World War has been one of remarkable growth in secondary school enrolment. In part this results directly from increases in child population, which is known well before the pupils reach the secondary school level. Not so firmly predictable, however, is the length of stay of pupils at secondary school. The present trend towards longer stay has been unexpectedly accelerated or retarded from year to year according to conditions prevailing at the time. In these circumstances accurate planning schedules, in curriculum and in teaching methods have required additional or modernised accommodation. In urban areas particularly, where it is seldom easy to procure the large block of land (some 20 acres) needed for buildings and recreation, schools have tended to become very large and large schools require specialised accommodation.
Proposals prepared in the Department of Education for building and other capital requirements of technical institutes and teachers' colleges are considered, before submission to the Government, by special works committees representative of the Department of Education, the Ministry of Works and Development and the Treasury. Major capital works undertaken in recent years have included 2 new primary teachers colleges (North Shore and Hamilton) and major additions made to the existing permanent colleges following the introduction of 3-year training for primary teachers. A college for the secondary division of the Christchurch Teachers College has been built on a new site adjacent to the University of Canterbury. Senior technical education has also required substantial new buildings or additions to existing buildings, the biggest single project being the Central Institute of Technology.
University Buildings—University buildings in use in 1965 had an area of 2 million sq ft; estimated requirements for 1980 are 8 million sq ft for teaching, library, administration, and student union buildings. Building and other capital requirements of universities are handled through the University Works Committee. This committee prepares for the approval of the Government an annual programme of projected expenditure on university capital works—buildings, land purchase, furniture and equipment, and subsidies on halls of residence. Expenditure in recent March years has been: 1963-64, $3.9 million; 1964-65, $6.2 million; 1965-66, $7.6 million; 1966-67, $11.1 million; 1967-68, $13.8 million; 1968-69, $10 million; 1969-70, $9.9 million; 1970-71, $11.5 million; 1971-72, $14.6 million; 1972-73, $20.1 million; 1973-74, $18.6 million.
During 1973, the Government approved a building programme for the 5 years ending on 31 March 1978 setting out the University Grants Committee's latest assessment of the needs of the universities for capital works. Including the balances still to be spent on jobs under construction the total of the 5-year programme was over $135 million. New works included in the programme were teaching buildings for the growth of the existing universities and for the expansion of medical education.
The Government's policy of offering a subsidy on money raised by the universities and other bodies who wish to build and run halls of residence for university students has been in operation since 1963. By the end of 1971 it had resulted in the building of 15 new halls with 2,190 places and the extension of a number of existing halls to provide a further 292 places. This means that, in the 9 years since the policy had been in operation, 2,482 new places had been added to the 2,000 already in existence at a cost in subsidies of $5.7 million. Although the expanded and new halls have been valuable additions to the universities, it must be borne in mind that, during the same period, the university rolls have increased from 16,999 to 35,052.
Technical Institute Buildings—There is a 5-year building programme for technical institutes which is kept under review by the Technical Institutes Works Committee. For the period 1974-75 expenditure is estimated to amount to $82.5 million.
Between 1968 and 1974 the number of established institutes grew from 7 to 12, and sites for a further 8 were located. One of these, in Hawke's Bay, was established as a community college and opened in 1975.
Teachers Colleges—The 5-year building programme for teachers colleges is estimated to cost $29.0 million for the period 1974-79 with $5.9 million allocated for expenditure during 1974-75.
SCHOLARS AND STUDENTS—The numbers of scholars and students receiving instruction in educational institutions are shown in the following summary. The table refers to roll numbers at 1 July.
| Type of Institution | 1968 | 1972 | 1973 |
|---|---|---|---|
*Includes 67 kindergarten trainees. †Amends number published last year. ‡Students on studentships or bursaries are included in university totals. | |||
| Pre-school— | |||
| Playcentres | 13,436 | 19,300 | 20,792 |
| Kindergartens | 22,050 | 26,870 | 28,580 |
| 35,486 | 46,170 | 49,372 | |
| Primary— | |||
| Primary schools under board control | 394,427 | 396,653 | 393,987 |
| Maori primary schools | 8,200 | - | - |
| Intermediate schools | 49,952 | 67,506 | 71,632 |
| Forms 1 and 2 at Form 1 to 7 schools | 1,712 | 3,712 | 3,839 |
| Chatham Islands schools | 170 | 151 | 154 |
| Correspondence school | 940 | 1,117 | 887 |
| Departmental special schools | 565 | 577 | 543 |
| Royal New Zealand Foundation for the Blind | 93 | 93 | 118 |
| Private primary schools | 53,782 | 50,859 | 50,711 |
| 509,841 | 520,668 | 521,871 | |
| Secondary— | |||
| State secondary schools | 146,409 | 162,981 | 168,217 |
| District high schools and area schools | 6,013 | 3,870 | 3,761 |
| Correspondence school | 480 | 726 | 697 |
| Private secondary schools | 27,020 | 29,804 | 30,201 |
| 179,922 | 197,381 | 202,876 | |
| Technical— | |||
| Technical Correspondence institute | 13,334 | 16,293 | 17,679 |
| Other technical institutes— | |||
| Full-time students | 1,358 | 2,944 | 3,182 |
| Part-time students | 23,367 | 37,272 | 36,951 |
| Technical classes at other institutions— | |||
| Full-time students | 120 | 174 | 196 |
| Part-time students | 51,627 | 38,254 | 43,678 |
| 89,806 | 94,937 | 101,686 | |
| Teacher training‡— | |||
| Teachers colleges | 6,096 | 8,088† | 7,853* |
| Kindergarten training centres | 273 | 412 | 409 |
| Technical institutions | 6,376 | 8,500 | 8,262 |
| University institutions— | |||
| Full-time internal students | 19,058 | 25,518 | 25,859 |
| Part-time internal students | 7,736 | 9,534 | 9,364 |
| Extra-mural students | 2,027 | 3,177† | 3,549 |
| Agricultural short courses | 525 | 217 | 204 |
| Medical short courses | 29,407 | 38,482† | 38,995 |
| Totals | 850,838 | 906,138† | 923,062 |
The classification of the table has been revised. Some categories consequently cannot be directly compared with those presented in previous Yearbooks.
TEACHING STAFF—Statistics of full-time teaching staff at all educational institutions are shown in the following table.
| Institution | 1972 | 1973 | ||||
|---|---|---|---|---|---|---|
| Males | Females | Total | Males | Females | Total | |
| *Includes 589 manual training assistants employed at manual training centres in 1973 and 603 in 1972. | ||||||
| Kindergartens | - | 690 | 690 | - | 737 | 737 |
| Primary— | ||||||
| State | 6,697 | 11,142 | 17,839 | 6,788 | 11,383 | 18,171 |
| Private | 253 | 1,407 | 1,660 | 275 | 1,385 | 1,660 |
| 6,950 | 12,549 | 19,499 | 7,063 | 12,768 | 19,831 | |
| Secondary— | ||||||
| State | 5,669 | 3,822 | 9,491 | 5,883 | 3,883 | 9,766* |
| Private | 723 | 701 | 1,424 | 737 | 720 | 1,457 |
| 6,392 | 4,523 | 10,915 | 6,620 | 4,603 | 11,223 | |
| Technical institutes | 738 | 103 | 841 | 828 | 120 | 948 |
| New Zealand Technical Correspondence Institute | 255 | 15 | 270 | 276 | 15 | 291 |
| 993 | 1.18 | 1,111 | 1,104 | 135 | 1,239 | |
| Teachers colleges | 484 | 130 | 614 | 481 | 122 | 603 |
| Kindergarten training centres | 3 | 23 | 26 | 9 | 30 | 39 |
| 487 | 153 | 640 | 490 | 152 | 642 | |
| University institutions | 2,045 | 214 | 2,259 | 2,154 | 261 | 2,415 |
| Totals | 16,867 | 18,247 | 35,114 | 17,431 | 18,656 | 36,087 |
Over the past two decades there has been a steady growth in the demand for teachers for primary and secondary schools. This has been due, firstly, to increases in school rolls and, secondly, to improved teacher-pupil ratios. In 20 years the numbers of primary teachers have increased by about 83 percent, and the numbers of secondary teachers by about 210 percent.
The growth in school and university student population is illustrated by the diagram below, which is drawn on a logarithmic scale.
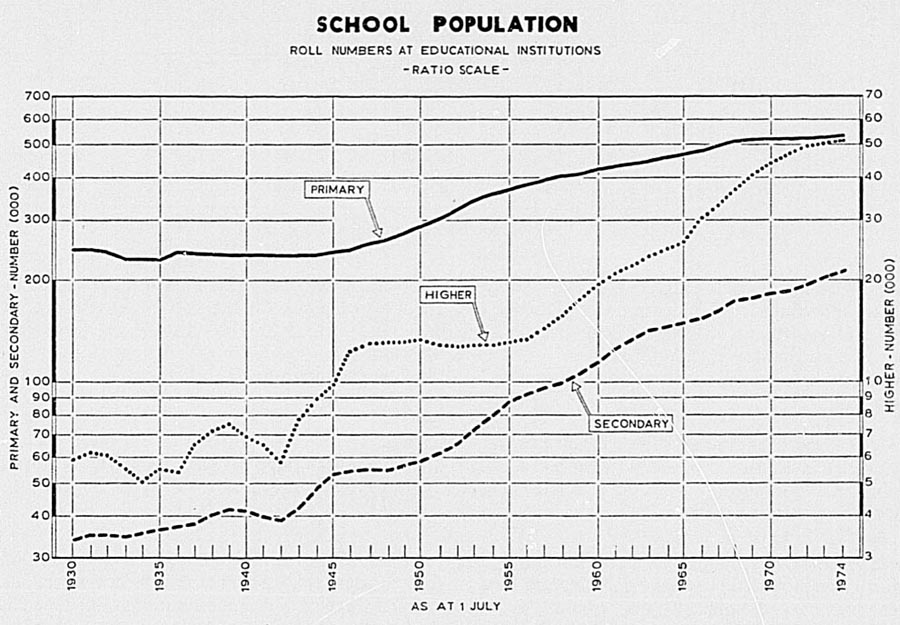
OVERSEAS STUDENTS—Overseas students attending New Zealand institutions at 1 July 1973 are shown in the following table.
| Regional Origin | Universities | Technical Institutes | Teachers Colleges | Secondary Schools | Total | Combined | |||||
|---|---|---|---|---|---|---|---|---|---|---|---|
| M | F | M | F | M | F | M | F | M | F | ||
| Pacific— | |||||||||||
| Fiji | 240 | 33 | 12 | 6 | 8 | 10 | 76 | 37 | 336 | 86 | 422 |
| Samoa | 55 | 17 | 2 | 5 | 6 | 10 | 117 | 156 | 180 | 188 | 368 |
| Tonga | 15 | 9 | 1 | 3 | 3 | 5 | 29 | 25 | 48 | 42 | 90 |
| Cook Islands | 8 | 4 | 2 | - | 4 | 4 | 13 | 8 | 27 | 16 | 43 |
| Niue | 4 | 3 | - | - | 3 | - | 10 | 6 | 17 | 9 | 26 |
| Tokelau Islands | 2 | - | - | - | 1 | - | 13 | 10 | 16 | 10 | 26 |
| Other Islands | 8 | - | 2 | 1 | 1 | - | 58 | 48 | 69 | 49 | 118 |
| Totals | 332 | 66 | 19 | 15 | 26 | 29 | 316 | 290 | 693 | 400 | 1,093 |
| Australia | 42 | 16 | - | - | - | - | 18 | 31 | 60 | 47 | 107 |
| South-east Asia— | |||||||||||
| Malaysia | 1,144 | 268 | 32 | 16 | - | 5 | 127 | 37 | 1,303 | 326 | 1,629 |
| Singapore | 99 | 34 | 3 | 4 | - | - | 5 | 1 | 107 | 39 | 146 |
| South Vietnam | 72 | 31 | - | - | - | - | 2 | - | 74 | 31 | 105 |
| Thailand | 44 | 38 | 2 | 4 | - | - | 2 | - | 48 | 42 | 90 |
| Hong Kong | 27 | 9 | - | - | - | - | 6 | 10 | 33 | 19 | 52 |
| Other countries | 49 | 19 | 12 | - | - | - | 27 | 10 | 88 | 29 | 117 |
| Totals | 1,435 | 399 | 49 | 24 | - | 5 | 169 | 58 | 1,653 | 486 | 2,139 |
| India Sub-continent | 24 | 9 | - | - | - | 2 | 1 | 2 | 25 | 13 | 38 |
| Asia (remainder) | 26 | 8 | - | - | - | - | 6 | 7 | 32 | 15 | 47 |
| North America | 48 | 27 | - | - | - | - | 14 | 36 | 62 | 63 | 125 |
| Central and South America | 4 | - | - | - | - | - | 3 | - | 7 | - | 7 |
| West Indies | 2 | 1 | - | - | - | - | 1 | - | 3 | 1 | 4 |
| Africa | 25 | 6 | - | - | - | - | 7 | 2 | 32 | 8 | 40 |
| United Kingdom | 10 | 9 | 1 | - | - | - | 4 | 2 | 15 | 11 | 26 |
| Europe | 8 | 2 | - | - | - | - | 1 | 6 | 9 | 8 | 17 |
| Totals | 1,956 | 543 | 69 | 39 | 26 | 36 | 540 | 434 | 2,591 | 1,052 | 3,643 |
Projected Students—A projection of education rolls, made in 1972 by the Department of Education for Public Education in 1972 and based on policies and trends at the time, is set out in the following table.
| Period | Rolls | |||
|---|---|---|---|---|
| Pre-School | Total Primary | Total Secondary | Tertiary* | |
| *Equivalent full-time students. | ||||
| Actual— 1971 | 43,204 | 518,554 | 190,709 | 48,574 |
| Projected— 1976 | 54,200 | 508,100 | 230,500 | 63,200 |
| 1981 | 65,200 | 545,100 | 227,300 | 81,600 |
ANNUAL EXAMINATIONS: School Certificate—A School Certificate Examination conducted by the Department of Education is taken by the majority of pupils at the end of three years of secondary education. The course of each candidate must include English, history or geography or a foreign language, mathematics, or science. A candidate may enter the examination in any number of subjects up to six and is credited with passes in the individual subjects in which he is successful.
Sixth Form Certificate—A new certificate was introduced in 1969 to replace the Endorsed School Certificate. Sixth Form Certificates are awarded to pupils who have satisfactorily completed an advanced course of 1 year on a single-subject basis—to a maximum of 6 subjects—beyond the level of School Certificate.
University Entrance—Pupils attending certain approved schools may be accredited for matriculation purposes provided they have completed a four years' secondary school course. Pupils not accredited for entrance to university may qualify by passing the University Entrance Examination which is conducted by the University Entrance Board.
The University Bursaries examination and the University Entrance Scholarship Examination, taken by secondary school pupils usually in form 7, are also conducted by the University Entrance Board; they are competitive examinations for supplementary awards for study at a university.
Higher School Certificate—Higher School Certificates are awarded after a 5-year course to pupils who have been accepted for entry to the Sixth Form and satisfactorily completed an advanced course of 2 years; and to pupils who have obtained a qualification recognised by the University Entrance Board for admission to a university in New Zealand and satisfactorily completed an advanced course of 1 year.
Examination passes at other than university examinations are set out in the following table.
| Year | School Certificate* | Other† | University Entrance* | University Entrance Scholarship | University Bursaries A and B |
|---|---|---|---|---|---|
*Includes Certificate of Attainment. †Includes Trained Teachers' Certificates, Technological, Engineers' and Surveyors' Assistants, Public Service Shorthand Typiststs Examinations up to 1970. From 1971 the number includes Trained Teachers Certificate, Diploma of Teaching, Technical Teachers Certificates, City and Guilds of London Institute Examination. Technological, Engineers, and Surveyors Assistants and Public Service Shorthand Typists Examination are not now administered by the Department. ‡From 1968 School Certificate figures refer to passes in one or more subjects. | |||||
| 1960 | 11,660 | 1,464 | 5,354 | 50 | 206 |
| 1965 | 28,502 | 1,654 | 8,563 | 90 | 454 |
| 1967 | 32,548 | 1,561 | 9,762 | 94 | 2,093 |
| 1968‡ | 38,992 | 1,869 | 10,988 | 103 | 2,462 |
| 1969 | 40,844 | 2,747 | 12,651 | 114 | 2,667 |
| 1970 | 42,544 | 2,654 | 13,205 | 116 | 3,103 |
| 1971 | 45,078 | 1,047 | 13,754 | 120 | 3,460 |
| 1972 | 46,987 | 925 | 14,291 | 131 | 3,588 |
| 1973 | 47,665 | 1,203 | 14,429 | 133 | 3,600 |
| Year | Technician Certificate 3-year Course | N.Z. Certificate 5-year Course | Certificates Issued | |||
|---|---|---|---|---|---|---|
| Intermediate | Final | Trade | Advanced Trade | Industrial Practice | ||
*Includes Certificate of Attainment. †Includes Trained Teachers' Certificates. Technological, Engineers' and Surveyors' Assistants, Public Service Shorthand Typists Examinations up to 1970. From 1971 the number includes Trained Teachers Certificate, Diploma of Teaching, Technical Teachers Certificates, City and Guilds of London Institute Examination. Technological, Engineers, and Surveyors Assistants and Public Service Shorthand Typists Examinations are not now administered by the Department. ‡Provisional. §From 1968 School Certificate figures refer to passes in one or more subjects. | ||||||
| 1960 | - | 77 | 29 | 911 | 389 | - |
| 1965 | 14 | 387 | 180 | 1,216 | 909 | 36 |
| 1967 | 73 | 605 | 416 | 2,301 | 587 | 48 |
| 1968§ | 166 | 722 | 455 | 1,874 | 753 | 115 |
| 1969 | 164 | 746 | 487 | 2,695 | 590 | 54 |
| 1970 | 151 | 787 | 559 | 5,779 | 408 | 33 |
| 1971 | 145 | 857 | 606 | 2,733 | 671 | 18 |
| 1972 | 246 | 964 | 647 | 2,384 | 636 | 28 |
| 1973 | 286‡ | 1,000‡ | 691‡ | 2,510 | 747 | 20 |
In 1973 there were 1,091 candidates for the University Entrance Scholarships examination and 133 scholarships were awarded; the remaining 954 scholarship candidates and 4,979 others (5,933 in ail) were candidates for bursaries and 3,600 bursaries were awarded.
Comparative figures for the number of candidates for the University Entrance Examination and the number of passes by accrediting and by examination are given in the following table.
| Year | Candidates | Passes | |
|---|---|---|---|
| Accredited | By Examination | ||
| 1969 | 21,580 | 10,698 | 1,953 |
| 1970 | 22,602 | 10,815 | 2,390 |
| 1971 | 23,615 | 11,372 | 2,382 |
| 1972 | 24,572 | 11,965 | 2,326 |
| 1973 | 24,840 | 12,390 | 2,039 |
SPECIAL EDUCATION—A comprehensive range of education services has been developed for handicapped children whose special needs cannot be met in an ordinary classroom.
Special classes for children who are backward (mildly mentally retarded), physically handicapped, deaf, visually handicapped, or maladjusted are established at ordinary primary schools, and are administered by the education boards. Education boards also administer special schools for intellectually handicapped (moderately or severely mentally retarded) or severely physically handicapped children, classes in hospitals, schools in psychiatric hospitals, and speech clinics. Reading clinics have been established in some major centres to complement the help given in ordinary schools to those pupils who find learning to read particularly difficult.
Special classes for backward, deaf, or maladjusted pupils are also provided in selected secondary schools. Most of these classes are administered by the boards of governors of the secondary schools concerned.
The Department of Education itself administers six residential schools—two for deaf children, two for backward children, and two for maladjusted children. The department also provides the teaching service in Social Welfare Department institutions for socially maladjusted children and the education service in adult penal institutions administered by the Department of Justice. The Department of Education also administers two important special education services—the advisers on deaf children provide guidance for the parents and teachers of deaf children, and the Psychological Service provides a comprehensive diagnostic, advisory, and counselling service for children whose scholastic or social progress is causing concern. Approximately 25,000 children were assisted by the staff of the Psychological or Visiting Teachers Services in 1973. The Psychological Service maintains close links with all other social and educational services for children, with the visiting teachers working with primary schools in city areas, and with an increasing number of guidance counsellors on the staffs of secondary schools.
In 1973, approximately 1,000 teachers were employed in the special education services, which enrolled some 8,700 children in special classes and schools at primary or secondary level and provided part-time tuition in speech and reading clinics for some 5,700 children.
The following table shows the number of pupils receiving special education at primary and secondary schools (including intermediate, correspondence, and special schools) at 1 July 1973.
| Group | Boys | Girls | Total |
|---|---|---|---|
| Blind and partially seeing | 137 | 130 | 267 |
| Deaf and partially hearing | 428 | 325 | 753 |
| Physically handicapped | 172 | 113 | 285 |
| Health camp schools | 141 | 124 | 265 |
| Hospital classes | 391 | 223 | 614 |
| Speech clinics (part time) | 3,965 | 1,732 | 5,697 |
| Intellectually handicapped | 960 | 688 | 1,648 |
| Mentally backward | 2,332 | 1,449 | 3,781 |
| Educationally retarded | 385 | 162 | 547 |
| Maladjusted | 361 | 198 | 559 |
| Home emergency and convalescent | 11 | 7 | 18 |
| Total | 9,283 | 5,151 | 14,434 |
The Department of Education co-ordinates the administration and development of the special education services for handicapped children through the district senior inspectors of primary and secondary schools.
PRE-SCHOOL EDUCATION—Children below the age of 5 years are not enrolled in the State primary schools. They may be enrolled, however, at free kindergartens controlled by local free kindergarten associations, which are voluntary bodies formed for the purpose, or at play centres controlled by play centres associations.
The Government accepts responsibility for the full cost of new sites for kindergartens and play centres and pays a subsidy of $4 to $1 to both organisations for buildings. The maintenance of the buildings is the financial responsibility of the Government. In areas of special need the cost of the buildings may be met by the Government. Equipment for kindergartens and play centres is subsidised at the rate of $2 to $1. Grants are made available to both organisations for administration and the day-to-day running costs. In July 1973 there were 28,580 children enrolled at 366 free kindergartens.
In July 1973 there were 655 recognised play centres for 20,792 children.
Kindergarten student teachers are now trained in the 17 teachers colleges and the Government accepts the full cost of training and student allowances on the same basis as for primary and secondary teachers.
PRIMARY EDUCATION—At the age of 5 years a child may enter, and at 6 years must enter, a primary school or, if living in an isolated area, must enrol with the primary department of the Department of Education's Correspondence School. The top 2 years of the primary course, Forms I and II, may be taken at an intermediate or a Form I-VII school. On completing instruction in Form II, usually after 8 years' school attendance, a child normally enters Form III of a secondary school, or alternatively the secondary department of a district high school. All children are required to attend school until they reach the age of 15 years.
The curriculum of the primary and intermediate schools, as set out in the syllabuses of instruction, covers oral and written language (including reading and handwriting), mathematics, social studies, art and crafts, science, physical education (including swimming), health education, music, and, for some children in Form II, French. At the Forms I and II levels, woodwork and metalwork instruction is given to boys, and girls are taught homecraft and sewing.
Teachers have the assistance of specialist teachers in a variety of fields, including science, physical education, art and crafts, reading, mathematics, music, Maori Language programmes, and language programmes for Maori children. Itinerant specialists are also available to help teachers in small rural schools and teachers of infant classes. Specialist assistance in helping children with special needs is provided by the psychological service, speech therapists, visiting teachers and advisers on deaf children.
Textbooks are issued free to pupils in all registered schools, both State and private. A series of basic primer readers and a considerable amount of equipment for primer classes are also provided by the Government.
State Primary Schools—The figures set out in the following table refer to all pupils in State primary schools and intermediate schools and departments, including Chatham Islands schools.
| Year | Schools (Including Intermediate Schools and Departments) | Pupils at 1 July | Pupils at 30 September | Pupils at End of Year |
|---|---|---|---|---|
| 1969 | 2,259 | 458,284 | 476,227 | 481,847 |
| 1970 | 2,257 | 462,041 | 479,315 | 486,438 |
| 1971 | 2,268 | 462,866 | 479,531 | 487,926 |
| 1972 | 2,250 | 464,310 | 480.836 | 490,002 |
| 1973 | 2,234 | 465,773 | 484,350 | 495,961 |
The following table relates to pupils on the rolls of the State primary schools, Chatham Islands schools, and Forms I and II at intermediate schools at 1 July in each of the years shown.
| Age, in Years | 1972 | 1973 | ||||
|---|---|---|---|---|---|---|
| Boys | Girls | Total | Boys | Girls | Total | |
| 5 | 28,059 | 27,048 | 55,107 | 28,402 | 27,239 | 55,641 |
| 6 | 27,625 | 26,297 | 53,922 | 28,142 | 27,186 | 55,328 |
| 7 | 27,799 | 26,458 | 54,257 | 27,681 | 26,496 | 54,177 |
| 8 | 28,837 | 27,497 | 56,334 | 28,107 | 26,554 | 54,661 |
| 9 | 29,664 | 28,423 | 58,087 | 29,119 | 27,615 | 56,734 |
| 10 | 30,014 | 29,051 | 59,065 | 29,536 | 28,779 | 58,315 |
| 11 | 28,614 | 27,365 | 55,979 | 29,264 | 27,977 | 57,241 |
| 12 | 26,508 | 24,886 | 51,394 | 27,409 | 26,082 | 53,491 |
| 13 | 11,081 | 7,855 | 18,936 | 10,978 | 7,969 | 18,947 |
| 14 | 538 | 323 | 861 | 550 | 349 | 899 |
| 15 | 74 | 67 | 141 | 57 | 55 | 112 |
| 16 and over | 116 | 111 | 227 | 117 | 110 | 227 |
| Totals | 238,929 | 225,381 | 464,310 | 239,362 | 226,411 | 465,773 |
Size of Classes—The size of classes at State primary schools at 30 September are shown in the following table.
| Pupils in Class | 1970 | 1971 | 1972 | 1973 |
|---|---|---|---|---|
| NOTE—Prior to 1970 special classes were excluded from this table, but from 1970 onwards special classes are included in the official size of class statistics. The table includes intermediate schools and departments and Chatham Islands schools. | ||||
| Under 31 | 5,523 | 5,848 | 6,541 | 7,471 |
| 31-35 | 3,429 | 3,670 | 4,385 | 5,244 |
| 36-40 | 5,071 | 4,918 | 4,279 | 3,260 |
| 41-45 | 997 | 810 | 476 | 261 |
| Totals | 15,020 | 15,246 | 15,681 | 16,236 |
During 1973 good progress was made in reducing class sizes. The percentage of classes with over 40 pupils dropped to 1.6 percent compared with 3 percent the previous year, and the percentage of classes with 35 or fewer pupils rose to 78.3 percent compared with 69.7 percent in 1972.
Maori Pupils—At 1 July 1974 there were 76,994 Maori children attending State schools and 2,974 attending private schools. Staffing is more liberal in schools with a large proportion of Maori or other Polynesian children. A report by the National Advisory Committee on Maori Education was published in 1970.
Intermediate Schools—Pupils on the rolls of the 122 intermediate schools and 2 intermediate departments at the end of 1973, numbered 72,140. Of all children in Forms I and II at State primary schools at 1 July 1972, 62.5 percent were enrolled at the intermediate schools. The ages of pupils on the roll at 1 July of each of the latest 3 years were as follows.
| Age, in Years | 1971 | 1972 | 1973 | ||||||
|---|---|---|---|---|---|---|---|---|---|
| Boys | Girls | Total | Boys | Girls | Total | Boys | Girls | Total | |
| 10 | 283 | 381 | 664 | 324 | 441 | 765 | 363 | 441 | 804 |
| 11 | 10,073 | 11,417 | 21,490 | 10,691 | 11,922 | 22,613 | 11,476 | 12,429 | 23,905 |
| 12 | 15,763 | 14,587 | 30,350 | 16,217 | 15,565 | 31,782 | 17,417 | 16,736 | 34,153 |
| 13 | 6,216 | 4,328 | 10,544 | 6,848 | 5,005 | 11,853 | 6,974 | 5,202 | 12,176 |
| 14 | 339 | 206 | 545 | 287 | 182 | 469 | 345 | 229 | 574 |
| 15 | 16 | 10 | 26 | 9 | 12 | 21 | 14 | 6 | 20 |
| 16 and over | 2 | 1 | 3 | 2 | 1 | 3 | - | - | - |
| Totals | 32,692 | 30,930 | 63,622 | 34,378 | 33,128 | 67,506 | 36,589 | 35,043 | 71,632 |
The roll at 30 September 1973 was 72,430.
Private Schools—The following table contains the principal statistics of private primary schools.
| Year | Number of Schools | Pupils at | Teachers | ||||
|---|---|---|---|---|---|---|---|
| 1 July | 30 Sept. | End of year | Male | Female | Total | ||
| 1969 | 344 | 52,407 | 53,406 | 53,750 | 241 | 1,418 | 1,659 |
| 1970 | 338 | 50,904 | 52,015 | 52,232 | 252 | 1,404 | 1,656 |
| 1971 | 339 | 51,009 | 51,863 | 52,587 | 242 | 1,385 | 1,627 |
| 1972 | 331 | 50,859 | 52,124 | 52,373 | 253 | 1,407 | 1,660 |
| 1973 | 324 | 50,711 | 51,861 | 51,875 | 275 | 1,385 | 1,660 |
The majority of the schools included in the preceding table are Roman Catholic Church schools, of which there were 254 at the end of 1973, with 44,282 pupils and 1,322 teachers (134 males and 1,188 females). The remaining private schools comprised 49 church schools of other denominations, with 248 teachers and 5,827 pupils, and 21 undenominational schools, with 90 teachers and 1,766 pupils.
SECONDARY EDUCATION—The secondary syllabus is based on a common core, consisting of English, social studies, general science, elementary mathematics, music, arts and crafts, and physical education, to be followed by a degree of specialisation within a wide range of subjects that may be taken to the School Certificate stage. All types of secondary schools are required to give all pupils during the first 2 years of their secondary course a minimum number of units of instruction in the common core subjects.
The following table shows the number of secondary schools in existence during each of the latest 6 years.
| Year | State Secondary Schools | Secondary Departments of District High Schools and Area Schools | Private Secondary Schools | Total |
|---|---|---|---|---|
| 1968 | 196 | 70 | 116 | 382 |
| 1969 | 204 | 66 | 116 | 386 |
| 1970 | 210 | 61 | 115 | 386 |
| 1971 | 219 | 57 | 115 | 391 |
| 1972 | 223 | 55 | 114 | 392 |
| 1973 | 229 | 50 | 114 | 393 |
District high schools are State primary schools with a secondary “top” and the basic course is academic, as in the normal secondary school. Where staffing and equipment allow, special courses are provided in agriculture, commercial practice, and domestic science. In 1973, 25 of the State secondary schools enrolled only boys and 25 schools only girls, with 179 schools co-educational. Most of the private schools are single-sex schools. There were 74 State secondary schools with over 1,000 pupils. Only one secondary department of a district high school had a roll of over 200.
The inspection of secondary schools is carried out by inspectors of secondary schools attached to the Department of Education. In 1974, there were 50 inspectors. The entitlement is 65.
The numbers of each sex attending schools providing secondary education at the end of 1973 were; State secondary schools, 83,091 boys and 77,441 girls; secondary departments of district high schools, 1,649 and 1,723; private secondary schools, 14,794 and 14,943; and full-time pupils of Correspondence School, 280 and 417.
During 1973 approval was given for the development of an improved guidance network in secondary schools and for the appointment of a further 40 guidance teachers.
Maori pupils—At 1 July 1973,20,797 Maori pupils were receiving secondary education. This number comprised 18,951 pupils attending State secondary schools and 1,846 pupils attending private secondary schools.
Secondary School Hostels—In 1973 there were 37 hostels for State secondary schools. A programme for 5-day hostels at certain rural secondary schools is being developed to strengthen rural secondary education.
Attainment Levels of State and Private Secondary Schools—The following table gives particulars of pupils who left schools providing secondary education, classified according to years of attendance and attainments.
| Year of Attendance | 1972 | 1973 |
|---|---|---|
| First | 1,289 | 1,579 |
| Second | 7,155 | 8,431 |
| Third | 16,932 | 18,584 |
| Fourth | 16,587 | 17,623 |
| Fifth | 10,476 | 10,684 |
| Sixth and over | 486 | 477 |
| Totals | 52,925 | 57,378 |
| Attainments | 1,972 | 1,973 |
| University scholarship | 137 | 137 |
| University bursary | 3,388 | 3,450 |
| Higher School Certificate | 2,897 | 2,981 |
| University Entrance | 7,201 | 7,196 |
| Sixth Form Certificate | 5,715 | 6,202 |
| School Certificate (three or more subjects) | 6,154 | 6,466 |
| School Certificate (one or two subjects) | 7,095 | 7,823 |
| Other | 20,338 | 23,123 |
| Totals | 52,925 | 57,378 |
Probable Destination of State and Private Secondary Pupils—An indication of the vocations intended to be followed by pupils leaving secondary schools is contained in the next table.
| Probable Destination | Boys | Girls | Total | Boys | Girls | Total |
|---|---|---|---|---|---|---|
| 1,972 | 1,973 | |||||
| Full-time education at university | 3,873 | 1,986 | 5,859 | 3,642 | 1,995 | 5,637 |
| Further full-time education— | ||||||
| Teachers college | 380 | 1,435 | 1,815 | 398 | 1,424 | 1,822 |
| Kindergarten T.C. | 244 | 244 | 5 | 251 | 256 | |
| Technical training | 729 | 510 | 1,239 | 801 | 560 | 1,361 |
| Commercial training | 144 | 1,323 | 1,467 | 154 | 1,341 | 1,495 |
| Art | 54 | 80 | 134 | 54 | 91 | 145 |
| Technical traineeships— | ||||||
| Draughting cadets | 239 | 55 | 294 | 325 | 94 | 419 |
| Technical trainees | 813 | 258 | 1,071 | 979 | 310 | 1,289 |
| Health services | 107 | 3,101 | 3,208 | 106 | 3,192 | 3,298 |
| Office— | ||||||
| Government | 668 | 1,163 | 1,831 | 676 | 1,411 | 2,087 |
| Local authority | 81 | 349 | 430 | 148 | 348 | 496 |
| Private enterprise | 1,429 | 4,980 | 6,409 | 1,351 | 5,617 | 6,968 |
| Shop and warehouse assistant | 1,421 | 2,682 | 4,103 | 1,444 | 2,816 | 4,260 |
| Skilled trades— | ||||||
| Government | 727 | 113 | 840 | 791 | 93 | 884 |
| Local authority | 182 | 39 | 221 | 204 | 32 | 236 |
| Private enterprise | 6,032 | 785 | 6,817 | 7,250 | 910 | 8,160 |
| Farming | 3,034 | 254 | 3,288 | 3,072 | 311 | 3,383 |
| Factory and clothing workers | 1,231 | 1,509 | 2,740 | 1,756 | 1,824 | 3,580 |
| Domestic work and home | 124 | 1,477 | 1,601 | 113 | 1,394 | 1,507 |
| Armed forces | 614 | 73 | 687 | 687 | 90 | 777 |
| Other | 5,848 | 2,779 | 8,627 | 6,105 | 3,213 | 9,318 |
| Totals | 27,730 | 25,195 | 52,925 | 30,061 | 27,317 | 57,378 |
CURRICULUM DEVELOPMENT—The Curriculum Development Unit was established in 1963 following a recommendation by the Currie Commission on Education. The principal functions of the Unit are the preparation and revision of school syllabuses from the infant department to the seventh form, the prevision of guides, handbooks and resource materials for teachers, the initiation of pilot schemes to test new courses and methods and communication to teachers of new or revised materials and methods. The staff of the Unit has increased rapidly in recent years to its level at June 1974 of 26 professional officers with responsibility for development in areas including science, mathematics, English, social studies, foreign languages, music, audio-visual media and examinations and testing.
RURAL EDUCATION: Consolidation of Schools—In order to give children in country districts the advantage of special equipment and more specialised teaching in larger schools, the consolidation of the smaller rural schools has been a feature of the last 25 years. Three types of composite schools have been developed in recent years to bring together larger concentrations of children from form one and above: Form I-VII schools; area schools; and district high schools (reorganised type).
The first Form I-VII school was opened in 1962 and by 1974 there were 30 of these schools. This type of school usually developed from the translation of the secondary department of a district high school with the addition of Form I and II pupils from neighbouring primary schools. They receive improved staffing, accommodation, and equipment in the endeavour to promote equality of educational opportunity for country children.
However, a large number of Form I and II children remain in the country districts too small to support a Form I-VII school.
In these districts, area schools and district high schools (reorganised type) have been established. The area school is a unified school providing education from primers to Form VI for all children in the immediate vicinity and from Form I-VI from contributing schools in a wider area. The first area school was opened in 1969 and there are now 3 of these schools.
More recently, district high schools (reorganised type) have been established. In the main these schools have been established in centres where there is a district high school which is too small to be replaced by a Form I-VII school. As with the area school, the district high school (reorganised type) is a unified school and serves the same groups of pupils. The reorganised school receives improved staffing, accommodation and equipment on a comparable basis to area schools while still retaining the name of district high school. There are now 8 of these schools.
Transport and Boarding Allowance—In recent years school transport facilities have been steadily developed until now 16 percent of the total school population receive assistance in one form or another. Most of these pupils are conveyed by buses under contract to education boards or operated by the Department of Education.
The trend towards consolidating small country schools and improving educational facilities in larger rural centres has been paralleled by the continuing movement of families into provincial towns and cities. These factors are resulting in only a relatively small increase in transport services.
Pupils carried by the school transport services rose from almost 107,000 (including rail transport) in 1971 to just over 112,000 in 1972, while the number of separate transport services increased from 2,300 to 2,400. These services covered a total of over 22,000,000 miles for the year, at a cost of more than $9 million.
School boarding bursaries were increased in 1972 from $200 to $300 a year. The number of pupils receiving boarding bursaries is declining and stood at 4,889 in 1973.
The next table gives particulars of the number of children transported to school and the number in receipt of boarding allowances as at 1 July 1973, according to the type of school attended.
| Type of School | Pupils on Roll | Pupils Transported to School | Pupils Receiving Boarding Allowance |
|---|---|---|---|
| State primary schools | 465,619 | 64,126 | 116 |
| State secondary schools (including district high schools) | 175,817 | 42,784 | 2,692 |
| Private primary schools | 50,711 | 2,957 | 78 |
| Private secondary schools | 30,201 | 3,422 | 2,003 |
| Totals | 722,348 | 113,289 | 4,889 |
Correspondence School—Correspondence classes are conducted for the education of children in very remote areas and for those unable to attend school because of lengthy illness or other causes. A corporate school spirit is developed through the school badge and uniform, daily radio lessons, club activities, the publication of a school magazine, periodical exhibitions of work, and by parents' and ex-pupils' associations. The personal link between the pupil and the school is strengthened by a number of teachers visiting pupils in their homes. At a district level, school day and school week gatherings are held in order to enable pupils to gain the opportunity of social education by working in the classroom.
Young persons in employment, including uncertificated teachers of small State primary schools, inmates of Department of Justice institutions, pupils of secondary schools who require examination subjects which their own schools cannot provide, officers of Government departments, and others who are unable to attend classes at secondary schools, also receive tuition as part-time students of the Correspondence School. In addition, the school enrols teachers for the Diploma in Teaching courses.
In 1974 there were 7,805 pupils on the roll of the Correspondence School, 1,202 being in the primary division, 592 full-time and 4,819 part-time students in the secondary division, 1,915 students taking the Diploma in Teaching course, and 277 students studying for Trained Teachers' Certificates. The staff of the school consists of the principal, deputy principal, 160 teachers, 26 tutors, and 45 clerical personnel.
Agricultural Clubs—More particularly in rural schools, practical interest in agriculture has been stimulated by the widespread formation of boys' and girls' agricultural clubs. The pupils undertake projects in livestock rearing and crop growing which are judged annually on the club field day, usually held at the school or local centre.
The agricultural instructors and advisers on school science employed by the education boards play an important part in the formation of the clubs, and by giving technical advice do much to assure the successful completion of the various projects. The clubs receive active support from parents, teachers, and the farmers' organisations.
HEALTH SERVICES—Information on the medical and dental inspection of school children and the dental-clinic system is given in Section 5A (Public Health) of this Yearbook.
TRAINING OF TEACHERS—In 1974 there were nine teachers colleges (North Shore, Auckland, Auckland Secondary, Ardmore, Hamilton, Palmerston North, Wellington, Christchurch, and Dunedin), with staffs totalling 603 (481 males and 122 females). At 1 July 1974 there were 9,931 students in training. This number includes 1,803 holders of secondary teacher studentships (Division U) and 238 holders of primary teachers studentships (Division S) who were attached to teachers colleges while attending universities as full-time students as part of their training for teaching, and 819 Division C students undertook training for secondary teaching.
The minimum entry qualification for admission to primary teacher training (Division A) and for entry to the secondary 3-year commercial course and the 3-year home-economics course, is Sixth Form Certificate with acceptable grades in four subjects. University Entrance is required for the 3-year Division B course in general secondary subjects, and the 1-year Division C course is for graduates. Other specialist secondary training courses of 1 year's duration for adults include woodwork and metalwork, commercial, music, and Maori language and these courses have various minimum entry requirements.
The following table shows the number of students in these two groups at 1 July.
| Year | Division A | Division C | Totals | ||
|---|---|---|---|---|---|
| Males | Females | Males | Females | ||
| 1969 | 1,324 | 4,228 | 232 | 311 | 6,095 |
| 1970 | 1,362 | 4,817 | 262 | 302 | 6,743 |
| 1971 | 1,328 | 4,919 | 228 | 346 | 6,821 |
| 1972 | 1,441 | 4,997 | 325 | 396 | 7,159 |
| 1973 | 1,493 | 4,671 | 448 | 371 | 6,983 |
The normal course of training for Division A students is a period of 3 years at a teachers college, followed by a further period of 1 year as a probationary assistant attached to a State primary school. The primary teachers' studentship scheme which was introduced in 1965 enables a number of selected students to attend university full time as part of the primary teaching course. Specialist studentships are available to selected students who wish to become speech therapists or teachers of deaf children.
The normal period of training for teaching is 3 years. Courses may be shortened to 2 years for students partway through degree courses and to 1 year for university graduates and specialists courses such as are mentioned above for secondary teaching as well as those courses for speech therapists or teachers of the deaf or children with handicaps.
A concurrent secondary teacher training course (Division B) was introduced in 1966. The course provides for up to 3 years of concurrent training at a university or a technical institute and at a teachers college, and is available at Auckland Secondary Teachers College and at the secondary division of Christchurch Teachers College.
Successful Division B students may complete the teachers college course with six units of a degree or equivalent and apply for a Teachers University Studentship for a year of full-time university study in order to complete a degree. Under the provisions of this concurrent course a successful student may commence his career of teaching as a teacher-trained university graduate in 4 years. This is the same period of time taken by student who are awarded a studentship for 3 years full-time university study (Division U) followed by the 1-year course of teacher training for graduates in Division C.
A total of 1,445 students were admitted to secondary training courses in 1973 compared with 1,493 in the previous year.
The ages and classification of students at teachers colleges at 1 July 1973 are shown in the following table.
| Course | Under 17 Years | 17 Years | 18 Years | 19 Years | 20 Years | 21-24 Years | 25 Years and Over | Total | |||||||||
|---|---|---|---|---|---|---|---|---|---|---|---|---|---|---|---|---|---|
| M | F | M | F | M | F | M | F | M | F | M | F | M | F | M | F | Combined | |
*A11 students 21 and over. NOTE—In addition the following students on studentships and bursaries were enrolled at teachers colleges in 1973: | |||||||||||||||||
| Division A— | |||||||||||||||||
| First year | 1 | 16 | 44 | 592 | 147 | 486 | 123 | 188 | 74 | 46 | 93 | 47 | 30 | 25 | 512 | 1,400 | 1,912 |
| Second year | - | - | - | 51 | 44 | 655 | 170 | 466 | 127 | 129 | 162 | 114 | 36 | 89 | 539 | 1,504 | 2,043 |
| Third year | - | - | - | - | - | 43 | 38 | 684 | 106 | 454 | 196 | 246 | 42 | 118 | 382 | 1,545 | 1,927 |
| Specialist | - | - | - | - | - | 1 | 5 | 15 | - | 14 | 3 | 10 | 1 | 8 | 4 | 53 | 57 |
| Graduate (1-year course) | - | - | - | - | - | - | - | 1 | 1 | 15 | 36 | 123 | 19 | 30 | 56 | 169 | 225 |
| Totals | 1 | 16 | 44 | 644 | 191 | 1,189 | 331 | 1,354 | 308 | 658 | 490 | 540 | 128 | 270 | 1,493 | 4,671 | 6,164 |
| Division B— | |||||||||||||||||
| First year | - | - | 2 | 3 | 11 | 18 | 14 | 4 | 5 | 1 | 5 | 2 | 2 | 1 | 39 | 29 | 68 |
| Second year | - | - | - | - | 3 | 13 | 12 | 20 | 14 | 10 | 36 | 13 | 6 | 2 | 71 | 58 | 129 |
| Third years | - | - | - | - | - | - | 2 | 10 | 14 | 32 | 103 | 47 | 14 | 7 | 133 | 96 | 229 |
| Totals | - | - | 2 | 3 | 14 | 31 | 28 | 34 | 33 | 43 | 144 | 62 | 22 | 10 | 243 | 183 | 426 |
| Division C (Total) | - | - | - | - | - | - | 1 | 3 | 6 | 25 | 335 | 306 | 106 | 37 | 448 | 371 | 819 |
| Other courses | - | 3 | - | 47 | - | 70 | - | 77 | - | 42 | 12 | 29 | 30 | 25 | 42 | 293 | 335 |
| Totals | 1,973 | 1 | 19 | 46 | 694 | 205 | 1,290 | 3601,468 | 347 | 768 | 981 | 937 | 286 | 342 | 2,226 | 5,518 | 7,744 |
| 1972 | 1 | 68 | 71 | 899 | 270 | 1,451 | 324 | 1,488 | 333 | 831 | 985 | 884 | 140 | 343 | 2,124 | 5,964 | 8,088 |
| 1971 | 2 | 53 | 57 | 919 | 210 | 1,534 | 345 | 1,517 | 324 | 789 | 779 | 727 | 180 | 355 | 1,897 | 5,894 | 7,791 |
| 1970 | - | 53 | 69 | 1,091 | 285 | 1,667 | 3,501, | 348 | 328 | 644 | 679 | 595 | 187 | 291 | 1,898 | 5,689 | 7,587 |
| 1969 | 5 | 56 | 73 | 1,057 | 289 | 1,582 | 380 | 1,135 | 266 | 442 | 818* | 809* | - | - | 1,831 | 5,031 | 6,912 |
| M | F | Total | |
|---|---|---|---|
| Division S (primary teacher studentship) | 62 | 176 | 238 |
| Division U (secondary teacher studentship) | 866 | 937 | 1,803 |
| Division Bs (secondary bursar studentship) | 51 | 44 | 95 |
| Secondary teacher bursaries | 1 | 5 | 6 |
FREE TEXTBOOKS IN SCHOOLS—Free textbooks are supplied to all primary and secondary pupils in both State and private schools. Under the free textbooks scheme, the books remain the property of the school controlling authorities and are issued on loan to pupils. The school authorities have a wide discretion in their choice of suitable books.
SCHOOL LIBRARY SERVICE—This service, which is financed by the Department of Education and administered by the National Library of New Zealand, aims at giving children access to the best literature. Regular exchanges of children's and young people's books are sent on a circulating basis to approximately 2,880 schools. The schools served are primary, both public and private, intermediate, and district high schools. Pupils of the Correspondence School also receive books regularly.
All schools, including secondary schools, receive additional books on request. Some 2,143,493 requests were filled during the year ended 31 March 1974.
AUDIO-VISUAL TEACHING AIDS—A varied series of programmes linked with the curriculum are broadcast each school day from all main national radio stations. Special lessons are also broadcast each day for Correspondence School pupils.
The National Film Library, a branch of the Department of Education, lends films and gramophone records free of charge to schools. It also lends films free-of-charge to other organisations having some educational purpose. Films are also supplied to the education services in Western Samoa, and in the Tokelau, Niue, Pitcairn, Cook, and Chatham Islands. A branch of the library situated in Auckland supplies films to schools and organisations in the upper half of the North Island and another in Christchurch serves the South Island except Nelson and Marlborough. The rest of New Zealand is serviced from Wellington.
The library contains more than 32,000 films with over 8.000 titles. Up to 7,500 reels of film axe issued each week, and of these 80 percent go to schools or colleges. Approximately 2,700 schools and 2,800 other organisations having some educational purposes benefit from this service.
A number of filmstrips are produced each year by the Visual Production Unit. These and selected productions from overseas are available to schools on free loan from filmstrip libraries in the offices of education boards. They can also be purchased by schools for a nominal sum from the Department of Education. More than 1,500 titles are available to primary and secondary schools. Up to 36,000 issues of filmstrips are made each year. Nearly all schools are equipped with filmstrip projectors.
A tape-copying service is also provided by the National Film Library for schools, teachers colleges, and universities. Tapes submitted are transcribed from master tapes held by the National Film Library. The catalogue includes more than 200 master tapes.
A gramophone record library of 2,854 titles and 6,280 records is available for use by schools and teachers colleges. Issues exceed 12,600 records a year.
Museums—To assist schools to make the fullest use of the museums, an education officer is attached jointly to the museum and the teachers training college in each of the four main centres. Cases of exhibits are circulated amongst schools where pupils are unable to make regular visits to a museum.
School Publications—The School Journal, an illustrated paper, is published in four separate parts suitable for pupils in the various standard classes. Parts 1 and 2 are published six times in the year while Parts 3 and 4 for the senior classes appear four times a year. Bulletins dealing with topics of New Zealand history, geography, and nature study, and family life in other countries, are published every year. These and other publications are prepared in the School Publications Branch of the Department of Education and issued free to all primary and intermediate schools, both State and private.
A wide range of syllabuses, textbooks, and handbooks is published for secondary and primary schools.
New mathematics textbooks have been issued to all primary pupils in standard one and above.
Secondary school bulletins are published five times a year and issued free to all State and private secondary schools. They provide background reading for subjects of the revised curriculum, particularly in social studies, science, and literature. Te Wharekura, a bulletin in the Maori language, is published three times a year and issued free to secondary pupils studying Maori language.
The Education Gazette is published by the department twice a month. It is a medium for the dissemination of official information and for the advertisement of vacancies. Copies are distributed to educational authorities and to State and private schools.
Education, a magazine for teachers, is published 10 times a year.
A number of publications are published for the New Zealand Broadcasting Corporation to accompany the broadcasts to schools.
VOCATIONAL GUIDANCE—There are vocational guidance centres at Auckland, Papatoetoe, Hamilton, Napier, Wellington, Lower Hutt, Christchurch, and Dunedin. Vocational guidance officers see young people, and often their parents, at the centres, as well as visiting the secondary schools throughout the country. A growing number of secondary schools now have full-time guidance counsellors who, as part of their duties, help students with educational and vocational problems. Other schools have Careers Advisers who are teachers appointed to spend part of their time assisting young people with their vocational plans. The school personnel works in close contact with the vocational guidance officers who keep them informed, by means of careers leaflets and bulletins, of up-to-date particulars about qualifications, entry, and training for some 700 occupations.
Interviews are given to young people at the centres and further interviews are undertaken by vocational guidance officers in schools. Various 1-week courses are conducted, mostly for pupils, by all centres. These include career courses (visits to and discussions on places of employment), “Living in the City” or citizenship courses for rural pupils, and two residential courses for newly-appointed career advisers. Short seminars for career advisers are currently conducted in Auckland and are to be extended to other districts.
UNIVERSITY EDUCATION—The system of university education in New Zealand has evolved in recent years from a federal university with constituent colleges to a system of separate universities and a university college of agriculture. These are the University of Auckland, the University of Waikato (at Hamilton), Massey University (at Palmerston North), the Victoria University of Wellington, the University of Canterbury (at Christchurch), and the University of Otago (at Dunedin), with Lincoln College a constituent agricultural college of the University of Canterbury.
At the centre there is the University Grants Committee which functions under the Universities Act 1961. The primary function of the University Grants Committee is to advise the Government of the needs of New Zealand for university education and research. It determines the allocation of grants of money which it recommends for appropriation by Parliament to meet these needs, and reviews the expenditure by the universities of money appropriated by Parliament. The University Grants Committee is also responsible for the award of scholarships, and through its statutory subcommittee, the Research Committee, for the distribution of a Government grant for research. Another statutory subcommittee of the University Grants Committee, the Curriculum Committee, has responsibility in respect of regulations of courses for degrees and diplomas. In the performance of its duties it is required to have regard to the comparative equivalence of courses.
The Universities Entrance Board was established on 1 January 1962 to maintain a common educational standard for admission to the universities. The board prescribes the conditions of examinations for University Entrance, Entrance Scholarships, the University Bursaries Examination, and Fine Arts Preliminary.
The special problems of legal education are the province of the Council of Legal Education which prescribes the examination requirements of candidates for admission as barristers and solicitors of the court.
The characteristics of university systems vary from country to country. They show marked differences in levels and sources of finance, public or private; in the constitution of the student population and the means adopted to support it; and in the relationships of the universities to other forms of tertiary education. The characteristics of the New Zealand university system are distinguishable from those of other national systems and may be partly explained as reflecting the New Zealand point of view. Thus, in our welfare state, there has arisen a public expectation that most of the finance required for the capital and running needs of the universities, and for a contribution towards the support of students by bursaries, will come from the public purse.
The test which applies for entrance to university is not financial but achievement at secondary school. In a country where equality of opportunity for self-improvement still counts for much, the right to a university education is conferred by qualifying for University Entrance. It is true that the relatively open system of admission entails some uncertainties about student numbers and planning university facilities for them. It also leads to higher failure rates arising from the mixed quality of the first-year intake; but this situation is improving in some respects without depriving the universities of their characteristics of open entry. Seventh form work is now taken by the majority of entrants to the universities, and the fees charged and bursaries paid are now more closely geared to successful study after entry. It is likely, too, that the strengthening and diversifying of courses offered in the technical institutes will enable them to cater better for some students and improve the efficiency of tertiary education as a whole. In the meantime, however, relatively ready access to university education associated with flexible degree structures meets the national needs well and at a cost which is modest by overseas standards.
Apart from the income from students' fees and the relatively small amounts now available to some of the universities from endowments, the block grants from the Government determine the income of the universities to meet their running costs for each 5 years. Under the block grant system that has been in operation since 1950, grants have been calculated and approved 5 years in advance to enable the universities to plan their activities ahead in the knowledge of what their income from the Government will be. They are block grants in the sense that they are not itemised and their detailed calculation is not disclosed to the universities. This has the effect of making the governing bodies—the university councils—not only responsible for arranging their budgets within their incomes, but also free to make their own decisions about the allocation of new expenditure among the many competing academic proposals which arise within the institutions. With these grants the university councils have an obligation to expand existing classes as necessary where students number increase and, subject to the scrutiny of the Curriculum Committee, to offer such courses as they see to be warranted by the demands put on them by the students and by the New Zealand community in which they exist.
The universities regard as their primary function the pursuit and dissemination of knowledge through study, teaching, and research. They have always endeavoured to perform this function with due regard to the specific needs of New Zealand, through their professional schools and through the general disciplines.
The universities in Auckland, Wellington, Canterbury, and Otago, besides offering courses in the faculties of arts, science, commerce, law, and music, specialise in certain fields. The University of Otago provides courses in medicine and dentistry, mineral technology, home science, and physical education; the University of Canterbury provides courses in engineering (mechanical, electrical, civil, agricultural, and chemical) and fine arts; the University of Auckland provides courses in architecture, fine arts, engineering (mechanical, chemical and materials, electrical, engineering science, and civil), and medicine; and the Victoria University of Wellington provides courses in architecture, public administration, and social science. Massey University provides courses in agriculture, horticulture, food technology, and veterinary science, as well as courses in arts and science, and also provides extra-mural tuition in a number of subjects to students throughout New Zealand. The University of Waikato offers courses in the schools of humanities, social sciences, and science and, in association with the Hamilton Teachers College, offers courses in its School of Education leading to a Diploma in Education and the degree of Bachelor of Education.
Free University Education:Scholarships—The most important awards for those entering university are the University Junior Scholarships. These scholarships are tenable for 3 to 6 years, depending upon the minimum time in which the holder, studying full time, could complete the recognised course taken under the scholarship. The University Junior Scholarship provides a scholarship allowance of $300 a year and is tenable with a fees and allowances bursary (see Bursaries below). These scholarships, together with privately endowed scholarships, are awarded on the results of the Entrance Scholarships Examination conducted by the Universities Entrance Board.
Scholarships awarded during degree courses include Senior Scholarships awarded by the individual universities and Lincoln College (and of a value to be determined by them). The various university institutions also have private scholarships for which their own students may compete. The scholarships awarded at the end of the university course, which are listed in full in the university calendars, include the Rhodes Scholarships, the 1851 Exhibition Scholarships, post-graduate scholarships, and post-doctoral fellowships, the Macmillan Brown Agricultural Scholarships, the Shirtcliff Scholarships, the Gordon Watson Scholarship, the Shell Post-graduate Scholarship, the Michael Hiatt Baker Scholarship, the Rutherford Scholarships, and the National Research Scholarships. Most of the post-graduate scholarships and post-doctoral fellowships are tenable in New Zealand. The other awards are in general tenable overseas.
University Bursaries—The system of bursaries for students entering upon a university course is set out in the University Bursaries Regulations 1971.
Fees Bursaries are awarded to students following part-time or full-time courses who have qualified for entrance to the university either by examination or accrediting, been admitted ed eundum statum, or who, having been granted provisional admission, pass two units in any 1 year. These bursaries provide for payment of tuition fees during their term.
Fees and Allowances Bursaries are awarded to students who hold the Higher School Certificate and are tenable for any recognised course at a university provided that the bursar undertakes a full-time course of study in each year of the bursary. Also, a student who in any year is credited with passes in the subjects or units comprising a full-time course will qualify for a fees and allowances bursary.
A fees and allowances bursary entitles the holder to payment of tuition fees plus allowances of $180 in the first year of the bursary, and (subject to the attainment of a defined standard in his university work) $225 in the second year, $270 in the third year, $315 in the fourth year, $360 in the fifth year; and $405 in the sixth and later years.
Bursaries may be extended to assist students undertaking a second course of study, and further extended for study at the master's level.
The holder of a fees and allowances bursary who is obliged to live away from his home or his usual place of residence in order to attend a university affording tuition in the subjects appropriate to his course and year may also qualify for a boarding allowance of $350 a year.
Supplementary Allowances of $150 a year and $100 a year are awarded to students who gain the required grades in the university bursaries examination and who are holding a fees and allowances bursary. A supplementary allowance may also be awarded to a student who gains the requisite grade of pass in the subjects or units of a full-time university course.
All these bursaries are subject to strict rules as to suspension and cancellation. A student who in any year does not pass in a prescribed number of units or subjects will have his bursary suspended and it will not be reinstated unless in the next year of study he is credited with a prescribed number of passes. Only one such suspension is allowed and subsequent failure results in the termination of the bursary.
Further details of the amounts payable and other qualifying conditions for the various classes of bursaries are available from university liaison officers and from the Head Office of the Department of Education, Wellington.
Students—In 1973 there were 35,223 students actually in attendance at the seven universities; 3,684 were graduates, 31,539 undergraduates (1,185 were enrolled in more than one course). In addition, there were 3,549 students attached to the various universities, but exempt from lectures, and 223 students who were taking short courses. Comparable figures for the latest 5 years are given in the following table. Students now exceed 1 percent of the population.
| Year | Students Attending Lectures | Exempt Students | Total | ||
|---|---|---|---|---|---|
| Males | Females | Males | Females | ||
| 1969 | 20,732 | 8,477 | 1,385 | 900 | 31,494 |
| 1970 | 22,310 | 9,598 | 1,472 | 1,066 | 34,446 |
| 1971 | 23,234 | 10,855 | 1,755 | 1,413 | 37,257 |
| 1972 | 23,477 | 11,575 | 1,799 | 1,378 | 38,229 |
| 1973 | 22,975 | 12,248 | 1,885 | 1,664 | 38,772 |
The following table gives particulars of internal students who were taking definite courses at universities, including agricultural college, during 3 recent years. Additional information is published in Education Statistics of New Zealand available from the Department of Education, Wellington.
| Course | 1969 | 1970 | 1971 | ||||||
|---|---|---|---|---|---|---|---|---|---|
| Males | Females | Total | Males | Females | Total | Males | Females | Total | |
| Agriculture | 1,712 | 83 | 1,795 | 1,692 | 94 | 1,786 | 1,713 | 110 | 1,823 |
| Architecture | 489 | 14 | 503 | 488 | 24 | 512 | 489 | 41 | 530 |
| Arts and music | 5,080 | 5,514 | 10,594 | 5,488 | 5,976 | 11,464 | 5,566 | 6,596 | 12,162 |
| Commerce | 2,896 | 190 | 3,086 | 3,200 | 253 | 3,453 | 3,256 | 310 | 3,566 |
| Divinity | 22 | 5 | 27 | 18 | 4 | 22 | 20 | 4 | 24 |
| Education | 243 | 349 | 592 | 410 | 784 | 1,194 | 472 | 864 | 1,336 |
| Engineering | 2,213 | 19 | 2,232 | 2,387 | 20 | 2,407 | 2,363 | 22 | 2,330 |
| Fine Arts | 133 | 134 | 267 | 128 | 134 | 262 | 132 | 144 | 276 |
| Food Technology | 117 | 20 | 137 | 114 | 29 | 143 | 182 | 36 | 218 |
| Home Science | - | 236 | 236 | - | 230 | 230 | - | 246 | 246 |
| Law | 1,907 | 181 | 2,088 | 1,993 | 213 | 2,206 | 1,910 | 263 | 2,173 |
| Medicine and Dentistry | 1,041 | 212 | 1,253 | 1,028 | 215 | 1,243 | 1,065 | 242 | 1,307 |
| Physical Education | 79 | 120 | 199 | 87 | 120 | 207 | 86 | 127 | 213 |
| Science | 4,243 | 1,072 | 5,516 | 4,693 | 1,282 | 5,975 | 5,197 | 1,457 | 6,654 |
| Surveying | 65 | - | 65 | 109 | - | 109 | 121 | - | 121 |
| Veterinary Science | 270 | 31 | 301 | 307 | 33 | 340 | 286 | 54 | 340 |
| Others | 582 | 388 | 970 | 739 | 395 | 1,134 | 1,132 | 586 | 1,718 |
| Total | 21,092 | 8,569 | 29,661 | 22,881 | 9,806 | 32,687 | 23,935 | 11,102 | 35,037 |
| Adjustment for students enrolled in more than one course | 360 | 92 | 452 | 571 | 208 | 779 | 701 | 247 | 948 |
| Totals | 20,732 | 8,477 | 29,209 | 22,310 | 9,598 | 31,908 | 23,234 | 10,855 | 34,089 |
Students on the books of the university institutions in 1973 are shown in the following table.
| — | Auckland | Waikato | Massey | Victoria | Canterbury | Lincoln | Otago | All Universities | ||||||||
|---|---|---|---|---|---|---|---|---|---|---|---|---|---|---|---|---|
| M | F | M | F | M | F | M | F | M | F | M | F | M | F | M | F | |
| Internal students | ||||||||||||||||
| Full-time | 4,731 | 1,954 | 965 | 708 | 1,903 | 723 | 2,884 | 1,478 | 3,515 | 1,286 | 855 | 82 | 3,078 | 1,697 | 17,931 | 7,988 |
| Part-time | 1,622 | 1,186 | 228 | 234 | 412 | 642 | 1,057 | 746 | 993 | 878 | 62 | 3 | 670 | 631 | 5,044 | 4,320 |
| All internal students | 6,353 | 3,140 | 1,193 | 942 | 2,315 | 1,365 | 3,941 | 2,224 | 4,508 | 2,164 | 917 | 85 | 3,748 | 2,328 | 22,975 | 12,248 |
| External students | ||||||||||||||||
| Taking courses at Massey University | 81 | 69 | 14 | 12 | 1,181 | 1,233 | 59 | 92 | 70 | 50 | - | - | 43 | 51 | 1,488 | 1,507 |
| Taking courses at own university | 226 | 49 | 1 | 4 | - | - | 80 | 33 | 16 | 3 | - | - | 114 | 68 | 437 | 157 |
| All external students | 307 | 118 | 15 | 16 | 1,181 | 1,233 | 139 | 125 | 86 | 53 | - | - | 157 | 119 | 1,885 | 1,664 |
| All students | 6,660 | 3,258 | 1,208 | 958 | 3,496 | 2,598 | 4,080 | 2,349 | 4,594 | 2,217 | 917 | 85 | 3,905 | 2,447 | 24,860 | 13,912 |
| Overseas students included in totals | 470 | 88 | 71 | 24 | 151 | 53 | 410 | 146 | 504 | 107 | 58 | 12 | 292 | 113 | 1,956 | 543 |
Internal students by years of university study in 1973 are shown in the following table.
| Year of University Study | Full-time Students | Part-time Students | External Students | All Students, Internal and External | Of these, Overseas Students numbered* | ||||||||||
|---|---|---|---|---|---|---|---|---|---|---|---|---|---|---|---|
| M | F | Total | M | F | Total | M | F | Total | M | F | Total | M | F | Total | |
| *Includes 72 external students. | |||||||||||||||
| First | 4,601 | 2,395 | 6,996 | 698 | 1,484 | 2,182 | 235 | 456 | 691 | 5,534 | 4,335 | 9,869 | 369 | 139 | 508 |
| Second | 3,823 | 1,981 | 5,804 | 547 | 827 | 1,374 | 212 | 273 | 485 | 4,582 | 3,081 | 7,663 | 300 | 90 | 390 |
| Third | 3,432 | 1,812 | 5,244 | 525 | 491 | 1,016 | 203 | 202 | 405 | 4,160 | 2,505 | 6,665 | 340 | 109 | 449 |
| Fourth | 2,601 | 928 | 3,529 | 717 | 555 | 1,272 | 181 | 221 | 402 | 3,499 | 1,704 | 5,203 | 449 | 111 | 560 |
| Fifth | 1,616 | 398 | 2,014 | 728 | 408 | 1,136 | 238 | 200 | 438 | 2,582 | 1,006 | 3,588 | 263 | 58 | 321 |
| Sixth or later | 1,858 | 414 | 2,272 | 1,829 | 555 | 2,384 | 816 | 312 | 1,128 | 4,503 | 1,281 | 5,784 | 235 | 36 | 271 |
| Totals | 17,931 | 7,928 | 25,859 | 5,044 | 4,320 | 9,364 | 1,885 | 1,664 | 3,549 | 24,860 | 13,912 | 38,772 | 1,956 | 543 | 2,499 |
The ages of internal students at universities in 1973 are shown in the following table.
| Age in Years at 1 July | Full-time Students | Part-time Students | All Internal Students | ||||||
|---|---|---|---|---|---|---|---|---|---|
| Men | Women | Total | Men | Women | Total | Men | Women | Total | |
| Under 18 | 1,096 | 963 | 2,059 | 112 | 559 | 671 | 1,208 | 1,522 | 2,730 |
| 18 | 3,137 | 1,904 | 5,041 | 250 | 657 | 907 | 3,387 | 2,561 | 5,948 |
| 19 | 3,300 | 1,683 | 4,983 | 380 | 480 | 860 | 3,680 | 2,163 | 5,843 |
| 20 | 2,774 | 1,321 | 4,095 | 378 | 361 | 739 | 3,152 | 1,682 | 4,834 |
| 21 | 2,282 | 737 | 3,019 | 471 | 331 | 802 | 2,753 | 1,068 | 3,821 |
| 22 | 1,594 | 368 | 1,962 | 493 | 274 | 767 | 2,087 | 642 | 2,729 |
| 23 | 1,108 | 220 | 1,328 | 429 | 194 | 623 | 1,537 | 414 | 1,951 |
| 24 | 780 | 140 | 920 | 370 | 157 | 527 | 1,150 | 297 | 1,447 |
| 25-29 | 1,326 | 298 | 1,624 | 1,055 | 510 | 1,565 | 2,381 | 808 | 3,189 |
| 30-34 | 323 | 109 | 432 | 488 | 306 | 794 | 811 | 415 | 1,226 |
| 35-39 | 95 | 72 | 167 | 257 | 182 | 439 | 352 | 254 | 606 |
| 40 and over | 114 | 111 | 225 | 360 | 308 | 668 | 474 | 419 | 893 |
| Not stated | 2 | 2 | 4 | 1 | 1 | 2 | 3 | 3 | 6 |
| Totals | 17,931 | 7,928 | 25,859 | 5,044 | 4,320 | 9,364 | 22,975 | 12,248 | 35,223 |
Holders of bursaries in 1973 by year of bursary, are shown in the following table.,
| Year of Bursary | Fees Bursaries | Fees and Allowance Bursaries | ||||||
|---|---|---|---|---|---|---|---|---|
| Full-time Students | Part-time Students | Bursaries | Bursaries and Boarding Allowances | |||||
| Male | Female | Male | Female | Male | Female | Male | Female | |
| First | 921 | 542 | 267 | 247 | 1,657 | 714 | 1,954 | 1,039 |
| Second | 291 | 126 | 146 | 94 | 1,173 | 663 | 1,624 | 872 |
| Third | 79 | 22 | 113 | 61 | 1,060 | 644 | 1,445 | 692 |
| Fourth | 19 | 3 | 84 | 33 | 605 | 196 | 985 | 308 |
| Fifth | 22 | 3 | 84 | 24 | 289 | 77 | 525 | 115 |
| Sixth | 7 | - | 44 | 6 | 60 | 22 | 165 | 24 |
| Seventh and over | - | - | 1 | - | 4 | 1 | 81 | 12 |
| Totals | 1,339 | 696 | 739 | 465 | 4,848 | 2,317 | 6,779 | 3,062 |
| Combined totals | 2,035 | 1,204 | 7,165 | 9,841 | ||||
In 1972 Master Bursaries were replaced by further steps of the Fees and Allowance Bursaries.
The nature of residence of full-time students at universities in 1973 is shown in the following table.
| Nature of Residence | Auckland | Waikato | Massey | Victoria | Canterbury | Lincoln | Otago | All Full-time Students | Of These, Overseas Students Numbered | |||
|---|---|---|---|---|---|---|---|---|---|---|---|---|
| M | F | Total | M | F | ||||||||
| Living at home | 3,871 | 516 | 424 | 2,197 | 1,945 | 148 | 716 | 6,756 | 3,061 | 9,817 | 47 | 16 |
| In halls of residence | 524 | 363 | 850 | 499 | 848 | 242 | 1,355 | 3,134 | 1,547 | 4,681 | 422 | 170 |
| Boarding | 483 | 225 | 155 | 225 | 557 | 51 | 189 | 1,411 | 474 | 1,885 | 245 | 82 |
| Sharing flat or house with other students | 1,653 | 548 | 973 | 1,228 | 1,446 | 496 | 1,975 | 5,772 | 2,547 | 8,319 | 956 | 165 |
| Other, and not known | 154 | 21 | 224 | 213 | 5 | - | 540 | 858 | 299 | 1,157 | 74 | 17 |
| Totals | 6,685 | 1,673 | 2,626 | 4,362 | 4,801 | 937 | 4,775 | 17,931 | 7,928 | 25,859 | 1,744 | 450 |
Occupations of part-time university students in 1973 are shown in the following table.
| Occupation | Males | Females | Total |
|---|---|---|---|
| No occupation other than study | 485 | 276 | 761 |
| University staff | 495 | 250 | 745 |
| Teacher | 670 | 465 | 1,135 |
| Teachers College student | 866 | 1,726 | 2,592 |
| Government employee | 684 | 347 | 1,031 |
| Local body employee | 129 | 132 | 261 |
| Private employment | 1,415 | 425 | 1,840 |
| Self-employed person | 134 | 32 | 166 |
| Housewife | - | 542 | 542 |
| Full-time student at technical institutes | 7 | 7 | 14 |
| Other occupations | 159 | 118 | 277 |
| Totals | 5,044 | 4,320 | 9,364 |
Totals of assisted overseas students at New Zealand universities in 1973, by the nature of the assistance, are shown in the following table.
| Nature of Assistance | Males | Females | Total |
|---|---|---|---|
| *Includes Western Samoa Aid Programme, Commonwealth Education Scheme, and Maori and Island Education Scholarships. | |||
| Assisted by the New Zealand Government— | |||
| Colombo Plan | 286 | 92 | 378 |
| Island Territories Scholarships | 29 | 15 | 44 |
| Commonwealth Scholarships | 23 | 5 | 28 |
| Aid to Africa Scholarships | 10 | 3 | 13 |
| Others* | 5 | 2 | 7 |
| 353 | 117 | 470 | |
| Other assistance from— | |||
| Fijian Government | 38 | 4 | 42 |
| Tongan Government | 4 | 1 | 5 |
| Other Governments (Malaysia, Western Samoa, Brunei, Victoria, and Hong Kong) | 21 | 3 | 24 |
| WHO, UNESCO, Fulbright, FOA | 16 | 1 | 17 |
| MARA Awards | 12 | 1 | 13 |
| Other | 29 | 2 | 31 |
| 120 | 12 | 132 | |
| All assisted Overseas Students | 473 | 129 | 602 |
Examination Performance—The results of studies of the examination performance of undergraduates in 1970 and 1971 are shown in the following table.
| Examination Performance | 1970 | 1971 | ||
|---|---|---|---|---|
| Full-time | Part-time | Full-time | Part-time | |
| *Or equivalent. | ||||
| percent | percent | |||
| Completed university degree or diploma | 18.3 | 7.6 | 17.6 | 8.3 |
| Passed three degree units* | 48.0 | 1.4 | 48.9 | 19.3 |
| Passed two degree units* | 12.9 | 17.6 | 14.0 | |
| Passed one degree unit* | 9.9 | 41.5 | 9.4 | 44.5 |
| Passed none or half degree units* | 10.9 | 31.9 | 10.1 | 27.9 |
| Totals | 100.0 | 100.0 | 100.0 | 100.0 |
Three-quarters of the undergraduates are full-time. In 1970 there were 19,976 full-time and 6,910 part-time undergraduates. In 1971 there were 23,080 full-time and 7,754 part-time undergraduates.
It is relevant to the interpretation of these figures to note the following points:
The student who passed all the work of a full-time course progressed at the rate required to gain a degree or diploma in the minimum time, for example, 3 years for the ordinary B.A., or B.Sc. degree.
Although the students who passed two units or the equivalent were not fully successful, they nevertheless achieved a degree of success recognised as sufficient to justify the continuation of a bursary or its reinstatement after suspension.
The figures are for all students who were enrolled on 1 April not only those who actually sat the final examinations. Those who drop out, and are therefore included in the group with no passes to their credit, are no doubt usually students with poor records, but this is not always so. Severe illness, for example, may interrupt the studies of the ablest of students.
Graduates—The numbers of degree graduates from New Zealand universities for the year ending with the graduation ceremony in 1972 and 1973 are shown in the following table.
| Course | First Degree | Post-graduate | Post-graduate Honours | |||
|---|---|---|---|---|---|---|
| 1972 | 1973 | 1972 | 1973 | 1972 | 1973 | |
| Agriculture | 7 | 21 | - | - | - | - |
| Agricultural Engineering | 4 | 2 | - | - | - | - |
| Agricultural Science | 91 | 108 | 4 | 4 | 37 | 25 |
| Architecture | 41 | 49 | 4 | 4 | - | - |
| Arts | 1,601 | 1,709 | 159 | 144 | 297 | 293 |
| Commerce | 406 | 447 | 22 | 26 | 26 | 20 |
| Dental Surgery | 55 | 44 | - | 6 | 4 | - |
| Divinity | - | - | 7 | 6 | - | - |
| Education | 26 | 41 | 2 | 5 | 1 | 5 |
| Engineering (Chemical) | 54 | 54 | 32 | 24 | 17 | 7 |
| Engineering (Civil) | 129 | 120 | ||||
| Engineering (Electrical) | 77 | 85 | ||||
| Engineering (Mechanical) | 79 | 88 | ||||
| Engineering (Science) | 10 | 11 | ||||
| Fine Arts | 15 | 7 | - | - | - | 2 |
| Forestry Science | 18 | 17 | - | - | - | - |
| Home Science | 11 | 11 | - | - | - | 1 |
| Horticultural Science | 18 | 19 | - | 2 | 6 | 4 |
| Law | 295 | 302 | 5 | 27 | 10 | 3 |
| Medical Science | 4 | 10 | - | - | - | - |
| Medicine and Surgery | 116 | 124 | - | - | - | - |
| Music | 25 | 39 | 1 | 4 | 1 | - |
| Pharmacy | 13 | 11 | - | - | 2 | - |
| Philosophy | - | - | 15 | 23 | 3 | - |
| Science | 969 | 1,151 | 100 | 116 | 84 | 71 |
| Social Science | 33 | 40 | 2 | 2 | 2 | 6 |
| Technology | 18 | 28 | - | - | - | 2 |
| Veterinary Science | 36 | 38 | - | - | 1 | - |
| Totals | 4,151 | 4,576 | 353 | 393 | 491 | 439 |
In addition in 1972, 128 doctorates were completed, literature 1, science 3, medicine 5, philosophy 119, while in 1973 there were 125 doctorates, literature 4, science 4, medicine 2, dental science 1, philosophy 114.
Of those graduating with first degrees in 1973, 50.7 percent completed their qualifications in the minimum time, 26.6 percent in the minimum time plus 1 year, 12.0 percent in the minimum time plus 2 years, and 10.6 percent took over 2 years beyond the minimum time.
Time Taken to Complete First Degrees—The following table shows the time taken to complete first degrees for the year ending with the graduation ceremonies in 1973.
| Degree | Minimum Time | Minimum Time + One Year | Minimum Time + Two Years | Minimum Time + Over Two Years | All Students | |||||
|---|---|---|---|---|---|---|---|---|---|---|
| Total | Women | Total | Women | Total | Women | Total | Women | Total | Women | |
| Bachelor Honours | ||||||||||
| Arts | 39 | 30 | 1 | - | 1 | - | - | - | 41 | 30 |
| Law- | 40 | 4 | 7 | 2 | 7 | - | 1 | - | 55 | 6 |
| Science | 151 | 40 | 16 | - | - | - | - | - | 167 | 40 |
| Engineering | 153 | 1 | 5 | - | 2 | - | - | - | 160 | 1 |
| Other | 36 | 10 | 5 | 2 | 1 | - | - | - | 42 | 12 |
| Totals | 419 | 85 | 34 | 4 | 11 | - | 1 | - | 465 | 89 |
| Bachelor | ||||||||||
| Arts | 736 | 447 | 471 | 240 | 209 | 87 | 252 | 102 | 1,668 | 876 |
| Commerce | 142 | 18 | 137 | 12 | 69 | 2 | 94 | 5 | 442 | 37 |
| Law | 87 | 14 | 82 | 7 | 49 | 3 | 29 | 1 | 247 | 25 |
| Science | 492 | 135 | 296 | 76 | 124 | 16 | 72 | 8 | 984 | 235 |
| Engineering | 95 | 1 | 58 | - | 30 | - | 17 | - | 200 | 1 |
| Medicine and Surgery | 131 | 15 | 37 | 2 | 6 | - | 4 | 1 | 178 | 18 |
| Agriculture and horticulture | 60 | 6 | 42 | 2 | 17 | - | 6 | - | 125 | 8 |
| Other | 159 | 58 | 62 | 30 | 34 | 10 | 12 | 2 | 267 | 100 |
| Totals | 1,902 | 694 | 1,185 | 369 | 538 | 118 | 486 | 119 | 4,111 | 1,300 |
Staff—The staffing of university institutions in 1973 is shown in the following table.
| Position | Full-time Staff | Part-time Staff | ||||
|---|---|---|---|---|---|---|
| M | F | Total | M | F | Total | |
| Teaching posts— | ||||||
| Full professor | 347 | 6 | 353 | 11 | - | 11 |
| Senior lecturer, associate professor, reader, lecturer-in-charge | 881 | 82 | 963 | 55 | 7 | 62 |
| Lecturer | 814 | 84 | 898 | 181 | 13 | 194 |
| Junior lecturer, assistant lecturer | 173 | 75 | 248 | 64 | 6 | 70 |
| Instructor and demonstrator, engaged in teaching | 46 | 14 | 60 | 693 | 229 | 922 |
| Totals, established teaching posts | 2,261 | 261 | 2,522 | 1,004 | 255 | 1,259 |
| Other staff— | ||||||
| Technician, research assistant, and other technical staff not engaged in teaching | 737 | 225 | 962 | 28 | 31 | 59 |
| Library staff | 84 | 258 | 342 | 51 | 45 | 96 |
| Administrative staff, clerical and office staff | 279 | 790 | 1,069 | 7 | 98 | 105 |
| Groundsmen, tradesmen, cleaner, etc. | 404 | 181 | 585 | 121 | 179 | 300 |
| Totals, non-teaching staff | 1,504 | 1,454 | 2,958 | 207 | 353 | 560 |
Of the full-time teaching positions, there were 127 positions filled temporarily and 107 not filled, and of the part-time positions 20 were filled temporarily and 35 not filled.
TECHNICAL EDUCATION—In 1945, technical education was a variant form of secondary education. It was provided by separate technical high schools and technical departments in other secondary schools, and was avowedly vocational in purpose. During the past 10 to 15 years, technical education has been transferred from the secondary to the tertiary sector of the educational system. Technical high schools, as such, no longer exist. Vocational education and training is now provided by 11 technical institutes, supported by the technical departments of 43 high schools throughout the country.
This transformation is the result of a number of policy decisions which have had the effect of creating a demand for types of education and training that belonged not to the secondary but to the post-secondary school phase of a person's career. The Apprenticeship Act 1948, for example, made it compulsory for apprentices to undertake technical classes. At first, this requirement was met through attendance at evening classes, later by day-release classes and, increasingly in recent years, by block courses for which the apprentice is released by his employer to attend a technical institute as a full-time student (usually for 3 weeks). The establishment, in 1949, of the Trades Certification Board and of national trades examinations, gave point and direction to apprentice studies.
To provide a teaching service for students for whom technical education was not readily available, the Department of Education established the Technical Correspondence School (now the Technical Correspondence Institute) in 1946 and from small beginnings, with a staff of half a dozen or so, this institute now employs some 290 full-time tutors.
The beginnings of technician training date from the early 1950s and were a result of the efforts of the engineering profession to specify a role for a highly-trained person whose qualifications were derived, not from study in a university school of engineering, but from theoretical studies taken in conjunction with industrial experience.
The New Zealand Certificate of Engineering was introduced in 1954. Experience of this qualification led, in 1960, to the establishment of the Technicians Certification Authority and, during the last 10 years, there has been a spectacular increase in the range of technician courses and the number of students studying for New Zealand certificates. The number of New Zealand certificates awarded annually has increased from 29 in 1960 to 691 in 1973. At the present time, technician studies account for 42 percent of the enrolments of technical institutes.
Technical education is being developed through national, regional, and local institutes. Approval for the establishment of a Central Institute of Technology was given in 1957; the institute opened in 1960 and commenced moving in 1972 to its permanent accommodation at Heretaunga—a building project costing $5.5 million. Included in this contract is a 500-bed hostel, which will provide living accommodation for the students who will come from all parts of the country to undertake full-time courses of 1 week to 4 years of instruction. Technical institutes have been established in the six main centres of population; and with the opening of Manukau Technical Institute in 1970, the first of a number of “satellite” institutes has been opened to serve the greater Auckland area. Following a recommendation of the National Development Conference, Government, in 1969, approved the establishment of technical institutes in centres where there was an assured teaching load for at least 10 full-time tutors. The first of the institutes to be set up under this policy—Southland and Nelson—opened in 1971. Since the 1966-67 financial year, more than $10 million has been spent on technical institute buildings alone.
The list of Technical institutes is as follows: Auckland, Manukau, Waikato, Taranaki Polytechnic, Palmerston North, Central Institute of Technology, Wellington Polytechnic, Nelson Polytechnic, Christchurch, Otago Polytechnic, Southland Polytechnic, and the New Zealand Technical Correspondence Institute.
In 1965, Government introduced technical institute bursaries for students attending approved full-time courses at technical institutes, and boarding allowances are also paid.
A Standing Committee on Relationships in Tertiary Education has been set up to consider the problems of placement of courses and the rationalisation of tuition in the technician, semi-professional, and professional fields.
In 1973 over 90 percent of apprentices received their practical instruction at block courses. This practical instruction is supplemented by instruction in theory at evening classes, where numbers are sufficient to justify local classes, or else by correspondence tuition from the Technical Correspondence Institute. The examinations for apprentices are administered by the Trades Certification Board.
Trade and Technician Courses—The term “technician” covers a wide field, but national New Zealand certificate courses have been devised for engineering, draughting, draughting (architectural), science, building, quantity surveying, and commerce. In addition, at a lower level, there is a certificate in garage management and courses leading to certificates for radio technicians, telegraph and telephone technicians, engineering technicians, survey technicians, automotive engineering technicians, and forest rangers. The courses for these qualifications, and other courses not on a certificate basis, are devised by the Technicians Certification Authority, which was established under the Technicians Certification Act 1958 to prescribe courses and syllabuses and conduct examinations appropriate to the needs of persons in occupational groups. The instruction for the New Zealand certificate courses is given at part-time classes, or on a sandwich basis (i.e., regular intermittent periods in full-time classes), or by correspondence tuition from the Technical Correspondence Institute supplemented in the case of science and workshop by short practical courses, usually of 1 week per subject at junior levels and 3 weeks at the senior levels. All these practical block courses are at the Central Institute of Technology. In a few cases the stages can be taken at full-time courses in the technical institute, but for the first 2 or 3 years only. All New Zealand certificates require students to be suitably employed during the last two stages of the courses.
Apprentice training accounts for some 40 percent of the enrolment load of technical institutes.
In addition to the national trade and technician courses, there are a large number of courses available which have been organised regionally to meet local demands. These include courses in commerce, work study, electronic data processing, journalism, and in industrial and commercial design. In addition, instruction is given on the examination syllabuses devised by independent organisations, e.g., the New Zealand Society of Accountants, Chartered Institute of Secretaries, New Zealand Institute of Valuers, etc.
Statistics of students taking full-year courses in technical education at 1 July 1973 are shown in the following table.
| Full-time Courses: As at 1 July 1973 | Males | Females | Total Students |
|---|---|---|---|
| N.Z. Certificates | 277 | 62 | 339 |
| Other— | |||
| Apparel technology | 3 | 12 | 15 |
| Accountancy | 110 | 26 | 136 |
| Advertising | 26 | 22 | 48 |
| Business administration | 31 | 5 | 36 |
| Clothing and textiles | 22 | 42 | 64 |
| Data processing | 17 | 26 | 43 |
| Design courses | 132 | 88 | 220 |
| Fine and applied arts | 40 | 50 | 90 |
| Health inspector | 19 | - | 19 |
| Health receptionist | - | 13 | 13 |
| Hotel receptionist | - | 29 | 29 |
| Journalism | 32 | 46 | 78 |
| Nursing | 5 | 70 | 75 |
| Occupational therapy | 2 | 170 | 172 |
| Pharmacy | 102 | 92 | 194 |
| Pre-apprentice (Maori) | 257 | - | 257 |
| Physiotherapy | 15 | 47 | 62 |
| Senior business and secretarial | 2 | 1,343 | 1,345 |
| Technicians (n.e.i.) | 115 | 16 | 131 |
| Technical teacher training | 12 | - | 12 |
| Totals | 1,219 | 2,159 | 3,378 |
| Part-time Courses: As at 1 July 1973 | Day or Day and Evening Courses | Evening Courses Only | Correspondence Courses | Male | Female | Total |
|---|---|---|---|---|---|---|
| Apprentice trade | 1,583 | 11,160 | 10,402 | 22,331 | 814 | 23,145 |
| Technician | 4,451 | 1,189 | 3,419 | 7,857 | 1,202 | 9,059 |
| Professional and advanced technical | 4,356 | 6,451 | 2,118 | 11,335 | 1,590 | 12,925 |
| Other vocational | 1,373 | 9,073 | 1,740 | 5,264 | 6,922 | 12,186 |
| Continuation | 1,387 | 7,566 | - | 4,667 | 4,286 | 8,953 |
| Non-vocational | 2,344 | 31,969 | - | 9,096 | 25,217 | 34,313 |
| Totals | 15,494 | 67,408 | 17,679 | 60,550 | 40,031 | 100,581* |
| Block Courses Held During 1973 | Student-weeks | Males | Females | Total Students |
|---|---|---|---|---|
| *Includes 108 full-time secondary students and 2,165 part-time technical students enrolled in more than one course. | ||||
| Trade courses | 54,825 | 18,670 | 590 | 19,260 |
| Technicians Certification Authority courses | 12,594 | 1,897 | 196 | 2,093 |
| Other courses | 16,463 | 2,658 | 512 | 3,170 |
| Totals | 83,882 | 23,225 | 1,298 | 24,523 |
New Zealand Technical Correspondence Institute—Instruction is now given in 589 technical subjects and so far the institute has published 13 textbooks.
The main function of the institute is to provide technical education from apprentice up to advanced technician level for those who are unable to obtain such education through the usual institutions. In particular, the institute meets many demands for technical education in the building, electrical,and engineering occupations, and also provides courses in agriculture and horticulture, dairy manufactures, management and commerce, mining and fire engineering, surveying, textiles, and valuation. As all students are employed in an industry or profession, their correspondence studies are supported by practical experience.
The work of the Technical Correspondence Institute parallels the teaching given in the other senior technical institutes, and instruction is given in many subjects not taught elsewhere. The institute plays an important role in the education of many of the apprentices who sit the annual examinations of the Trades Certification Board. It also prepares a large percentage of candidates for the various examinations of the Technicians Certification Authority in engineering, building, commerce, draughting, and science as well as for other professional and industrial examinations.
The number of students on the roll at 1 July 1973 was 17,679. There is an establishment of 270 full-time tutors, besides the principal, and some 60 administrative staff.
Vocational Training Council—This council was established by the Vocational Training Act 1968. Its responsibilities and activities are set out in Section 32, Employment. The council has set up 30 Industry Training Boards.
EDUCATIONAL QUALIFICATIONS OF LABOUR FORCE—The Census of Population and Dwellings includes a question on the highest educational and vocational qualifications obtained. An analysis concerning persons in the labour force in 1971 is set out in the following table; where persons have more than one qualification they have been included only once in the higher academic qualifications, for example, certificated teachers with a university degree are included in the university qualification group.
| Qualification | Males | Females | Total |
|---|---|---|---|
*Includes nursing, commercial, engineering, draughting, etc. †Includes electricians', plumbers', carpenters', joiners', radio and T.V. servicemen's, and motor mechanics'. The labour force at the 1971 census comprised 784,969 males and 333,866 females. | |||
| University— | |||
| Doctorate | 1,344 | 116 | 1,460 |
| Master's degree | 4,874 | 1,227 | 6,101 |
| Bachelor's degree | 23,132 | 4,919 | 28,051 |
| Diploma | 8,293 | 1,791 | 10,084 |
| Other | 78 | 4 | 82 |
| Teacher's Certificate | 15,068 | 19,736 | 34,804 |
| Secondary— | |||
| Higher School Certificate or equivalent, University Scholarship | 8,524 | 4,268 | 12,792 |
| University Entrance | 48,862 | 25,407 | 74,269 |
| School Certificate | 67,149 | 51,244 | 118,393 |
| Other | 32,816 | 18,262 | 51,078 |
| Professional certificate* | 28,710 | 31,127 | 59,837 |
| Trade certificate† | 87,324 | 1,762 | 89,086 |
| Other vocational | 19,874 | 5,715 | 25,589 |
EDUCATIONAL DEVELOPMENT—The Advisory Council on Educational Planning has acted as the steering committee for the Educational Development Conference. The reports of the three conference working parties on “Aims and Objectives”, “Organisation and Administration” and “Improving Learning and Teaching” have been published. Their recommendations were discussed in small groups and at regional seminars during the public phase of the Conference in the first half of 1974. The findings of the Conference have been summarised in a paper on directions for educational development prepared by the Advisory Council on Educational Planning.
NEW ZEALAND COUNCIL FOR EDUCATIONAL RESEARCH—The Carnegie Corporation of New York was instrumental in founding the New Zealand Council for Educational Research in 1933 and supported it with grants for 10 years. Since 1945 the council has been supported principally by State funds, the remainder coming from contributions from educational bodies, philanthropic foundations, business organisations, and its own trading operations. It has remained, however, under independent control as provided for in the New Zealand Council for Educational Research Act 1945.
In its research programme, the council has concentrated on New Zealand problems, and its main publications (48 research reports and 20 shorter studies in education) include critical surveys of major policy issues in New Zealand education and accounts of outstanding experiments in school practice. These have brought about or helped reshape major developments in such areas as secondary, university, and adult education, intermediate schools, consolidation of rural schools, and care of children with special needs.
Since the 1930s, the council has served as the main source of supply for overseas and locally standardised educational and psychological tests used by universities, Government agencies, hospitals, business firms, and schools. In 1965 the council established a special Test Development Division to produce achievement tests designed specifically to suit the curriculums of New Zealand schools. Known as the Progressive Achievement Tests, they are now used extensively in schools throughout the country.
The council employs its own permanent research staff as well as temporary research fellows or project assistants, and it also assists honorary research workers in other institutions such as universities, teachers colleges, and schools. Its current research programme includes major projects related to educational planning, the supply of qualified people in the community, teaching practices, Maori and pre-school education, and services for children with special needs. The council also acts as a clearing house for information on educational matters and maintains six local institutes for educational research in Auckland, Wellington, Christchurch, Dunedin, Palmerston North, and Hamilton.
MAORI EDUCATION FOUNDATION—The Maori Education Foundation Act 1961 established the Maori Education Foundation for the general purpose of promoting and encouraging the better education of Maoris and of providing financial assistance for that purpose. The capital resources of the foundation are $2,304,000. Some of the principal purposes for which the Board of Trustees is empowered to apply the income of the foundation include the education and vocational training of Maoris; the granting of financial assistance or of equipment to schools and institutions at which Maoris are receiving education; the provision of bursaries to assist Maoris attending secondary schools or any New Zealand or overseas university, agricultural college, or institution of similar status; the provision of post-graduate scholarships for Maoris holding university degrees or diplomas; and the making of special research or study grants to Maoris undertaking special research or study projects. The bulk of the foundation's income is expended on grants to individuals. During the 1974 academic year, assistance totalling 5400,293 was granted to 1,255 pupils and students. The bulk of the grants were towards the cost of board and tuition of secondary boarding school pupils. In a number of cases Foundation grants are a necessary supplement to other scholarships and awards. Financial assistance towards the cost of tertiary studies was made to 187 students in 1974.
POLYNESIAN EDUCATION FOUNDATION—In 1972 a Pacific Islands Polynesian Education Foundation was set up on similar lines to the Maori Education Foundation. The target for the foundation was to raise a capital of $100,000 including a $1 for $1 Government subsidy. By the close of 1974 the capital fund had reached $28,120. The aim is to assist New Zealand resident Pacific Islands families to further the education of their children. In 1974 the sum of $7,255 was awarded to 27 pupils and students.
ASSESSMENT OF MAORI AND POLYNESIAN CHILDREN—During 1970 the National Advisory Committee on Maori Education, a body representative of the Departments of Education and of Maori Affairs, Maori leaders throughout the country, controlling authorities and teachers' organisations, held a number of meetings and study courses to establish priorities in the many proposals advanced by the department, the advisory committee, and teachers to improve the education of Maoris. The report of the committee was published in 1970, and during 1970 and 1971 action was taken to put many of the recommendations into effect, or to amend or accelerate moves already under way. The main recommendations concerned the pre-service and in-service training of teachers, the strengthening of the advisory service, extended provision for pre-school children, additional staffing for schools, primary, intermediate, and secondary, with a high proportion of Maori and Pacific Island Polynesian pupils, the teaching of Maori language in schools where there was a demand down to the Form 11 level, and the introduction of studies in Maori in past and present New Zealand society as a part of the new Forms I-IV social studies syllabus.
The educational performance and progress of Maori and Polynesian children as a whole group has not equalled that of other New Zealand children for a variety of complex reasons, largely linguistic and cultural. As a general rule Maori and Polynesian children have not stayed on as long at secondary school and a relatively small proportion of those doing so have continued their education at the tertiary level. In some cases, this has not been possible economically. Strenuous efforts have been made, particularly in recent years, to encourage Maori children to continue their education as far as possible, by increasing the appreciation of their problems on the part of teachers, by creating school situations conducive to a desire for further education, and by involving parents more closely in their children's education. Practical assistance has been given by increasing the number and value of scholarships awarded each year by the Department of Education. The Maori Education Foundation has also given valuable help to Maoris, at the senior levels of education particularly. The importance of and the opportunities available in vocational education beyond the secondary school level have been brought to the notice of young Maoris through the schools and through vacation courses. Special trade training courses for Maori boys have been set up and extended.
If the efforts to upgrade the education of Maori and Polynesian children are measured solely in terms of the proportion who pass subjects in the School Certificate examination, who obtain a trade certificate or a New Zealand certificate at the technician's level, or who complete a university degree, it is obvious that there is still much room for improvement. But it is fair to state that a good deal has been achieved at all levels of education and that there is a greater awareness of the value of education on the part of children and parents. In the whole country, too, there is a better informed appreciation of Maori and Pacific Island Polynesian society and culture and of the need for special measures so that all children of these races in New Zealand receive the maximum benefit from the opportunities offered them.
Some evidence of improvement is seen in the statistics of pupils at secondary school.
CONTINUING EDUCATION—Under the Education Amendment Act 1974, a new definition of “continuing education” was introduced which, among other effects, removes a previous legal distinction between non-vocational and vocational education.
In 1973 a feasibility study was published on the setting up of a community college in Hawke's Bay and the college opened in 1975. Further studies have been conducted and one on Northland has been completed.
National Council of Adult Education—The functions and powers of the National Council of Adult Education are set out in the Adult Education Act 1963. The council advises the University Grants Committee, the Director-General of Education and other bodies on adult education, co-ordinates and conducts pilot projects and experiments, maintains a national library and documentation centre on adult education, and publishes occasional papers and reports as well as a periodical entitled Continuing Education in New Zealand.
University Extension—Although full responsibility and control of their continuing education activities rests with the universities, they use various systems to ascertain the views and in some cases to seek advice from various community interests.
The typical extension department in each university has a director in charge and a staff of lecturers in a range of academic disciplines. In addition to teaching, the lecturers may be responsible for planning and developing sections of the department's programme or have special responsibility for a geographical area and its programme. Two of the North Island universities also have lecturers specialising in work among the Maori people. All six universities now carry out extension work, and show marked differences in their approaches and systems of organisation. A large number of part-time lecturers supplement the activity of the full-time staff (numbering approximately 60). The work is carried out by various methods—lecture courses, study conferences, seminars, schools of varying length (both residential and non-residential), and correspondence courses. While most universities continue to provide substantial extension programmes of liberal studies for the general public, there has been a rapid increase in programmes designed for specialised groups, largely occupational. Some of these are national in scope.
Secondary Schools—The largest amount of organised adult education is being done by evening classes in secondary schools. Since the revision of the School Certificate regulations to allow single subject passes, there has been some increase in adult classes leading to the School Certificate Examination, but there is a very wide range of other examinable and non-examinable courses. There has also been an increase in the number of technical institutes which cater for a wide variety of adult education interests. The National Council is interested in the co-ordination of these wider developments and provided advice and assistance.
Voluntary Agencies—Many voluntary organisations make some provision for continuing education. For most of them, such as the Play Centres Federation which is heavily involved in parent education, continuing education is incidental to their other purposes. The following two organisations, however, have continuing education as their primary purpose.
Workers' Educational Association—District councils of the Workers' Educational Association exist in Auckland, New Plymouth, Wellington, Canterbury, Otago, and Southland. Small administrative grants are received from the respective universities with which the councils are associated, together with payment of tutors' fees for a limited number of courses approved by them. District councils, in their own right, organise additional courses, summer schools, public forums and seminars. The co-ordinating body is the New Zealand Workers' Education Association which also publishes the WEA Review.
Countrywomen's Co-ordinating Committee—This is a national liaison committee of the Countrywomen's Institute and the Women's Division of Federated Farmers; it has regional committees at Auckland, Hamilton, Palmerston North, Wellington, Christchurch, and Dunedin and over 50 district committees. The organisation co-operates with other adult education organisations and also arranges classes of special interest to women.
Community Centres—Community centres on an experimental basis were opened some 20 or more years ago at Feilding, Christchurch, Westport, Dunedin, and Hawera. These centres received some assistance, directly or indirectly, from public funds. A new “community action programme”, in the Wairarapa is being supported by Government under the provisions for community centres.
PACIFIC ISLANDS EDUCATION—The Department of Education, in liaison with the Ministry of Foreign Affairs, assists other administrations, including those in the Cook Islands, Niue, Tokelau, Fiji, Tonga, Western Samoa, the Gilbert and Ellice Islands, Pitcairn Island, New Hebrides, British Solomon Islands Protectorate, Papua New Guinea, and the University of the South Pacific, with educational matters.
As part of the assistance, the Department of Education assumes responsibility on request for filling about 150 teaching and administration positions in the Pacific. Officers and teachers are inspected and their service, grading, and superannuation rights protected while serving in island positions. Advisory visits are made to most of the islands and supplies of modern textbooks and apparatus are sent regularly to some countries. The Islands Education Division has also printed books in the vernacular for some areas, and has helped in the development of a system for teaching English as a second language.
In addition, a very important function of the Islands Education Division is to operate and supervise closely a scholarship system which in 1973 enabled 434 island students to obtain in New Zealand schools, trade centres, teachers colleges, universities, Government departments, and private firms more advanced education and training than would otherwise be available to them. During the term of their scholarship these students are fully maintained by the Ministry of Foreign Affairs.
In 1973 17 teachers from the Pacific attended the annual 6-month in-service course in New Zealand. Increasing numbers of students in island schools are availing themselves of the facility to sit New Zealand examinations. In 1973 there were 5,325 candidates for New Zealand School Certificate from 69 schools compared with 4,607 in 1972 from 65 schools. The Department of Education is assisting Island governments with curriculum development and evaluation and is providing alternative papers at the School Certificate level.
Science and technology are an integral part of social and economic development, and we believe that this implies a much closer relationship between policies for science and technology and all socio-economic concerns and governmental responsibilities than has existed in the past. (Science, Growth, and Society: A New Perspective, The Harvey Brooks Report, Organisation for Economic Co-operation and Development, Paris, 1971.)
GENERAL—Although economic growth and higher living standards continue to depend on increased productivity and full development of natural resources, it is becoming increasingly recognised that economic growth in itself does not guarantee improvement in general social development. Improvement in the quality of life is perhaps a more desirable element of growth to strive for.
In past years, production, in particular that in agriculture, has been promoted extensively by scientific research, and it is expected that similar developments will now take place in manufacturing industries. The example set by agricultural extension officers in fostering the practical application of research results should not be overlooked, and current emphasis in manufacturing is similarly on translating experimental findings into tangible benefits. At the same time the objectives underlying particular research programmes and their potential for yielding appropriate benefits are being more critically assessed.
Science and technology and their products cannot be separated from the social and political environment in which they develop and on which they exert their own effects. The recent period has been marked by rapid advance of scientific and technological progress, most evident in the development of industrialisation with accompanying urbanisation, and resulting in changes in our culture and society. Scientific research is needed to understand and minimise the human problems created by these rapid changes, and so the emphasis of scientific development is continually changing too. Greatly increased research effort is being directed towards quantifying and solving social and environmental problems.
More than three-quarters of the scientific research in New Zealand is financed from Government sources. The Government itself engages in research on farming, forestry, mining, manufacturing, building and transport, the environment, health, and social and economic factors, and provides other scientific services, e.g., publications and forensic services. Industry supports research which may be of short or long-term benefit to its business and, together with private individuals, supports research for philanthropic reasons.
Government also supports science as a cultural, educational, and intellectual activity through the schools, universities, and museums, and in other ways. Developments in scientific equipment have made possible most scientific advances (including those related to environmental and social problems), but the calibre of the scientists who devise and operate the equipment is of greatest importance, and Government recognises the continued need for education and training in scientific skills and the scientific attributes of open-mindedness and critical analysis. The high reputation of our scientists is shown by their frequent invited participation in international research activities and overseas aid programmes. The liveliness of our scientific community is shown by the proliferation of learned societies. Many of these societies are also placing increased emphasis on communicating an appreciation of scientific endeavour to members of the community who have hitherto been largely unaware of, or apathetic to, science, and it could be held that improved communication is the key to further scientific and technological progress.
DEPARTMENT OF SCIENTIFIC AND INDUSTRIAL RESEARCH—The work of DSIR illustrates particularly well the principle, quoted above from the Harvey Brooks Report, of the pervasiveness of science and technology in all fields of human endeavour. The major part of DSIR's work is in agricultural production and processing, but in addition, the department conducts research and provides services for manufacturing industry and in fields such as forestry, mineral extraction and processing, and the natural environment; and provides scientific services in human health, social sciences, building, and transport.
The national science budget is allocated between 16 Government departments, principally DSIR and the Ministry of Agriculture and Fisheries. A little less than half the total goes to DSIR, and this is spread between 21 divisions and branches covering a wide range of applied scientific activities. More than one-tenth of DSIR's allocation is used as grants-in-aid to subsidise the work of 10 industrial research associations, and as special research grants to other organisations and to practical research projects being undertaken by various university departments. Most of the projects being investigated entail extensive collaboration between DSIR divisions, research associations, university departments, and various Government departments.
The primary long-term aim of DSIR is to continue with mission-oriented research, i.e., research concentrated in fields considered to be important nationally. It is recognised that agriculture will continue to be the mainstay of the economy. However, the need to broaden the basis of the economy has meant that, in addition, priority is being given to the processing of agricultural, forestry, and mineral resources, and to liaison, extension, and research in manufacturing. The expanding population and general public concern over the environment have meant that priority is also being given to environmental and pollution investigations.
Agricultural Production and Processing—A large and sustained research effort, involving over one-third of the scientists and technicians in DSIR, is devoted to increasing the diversity and quality of agricultural products, and improving the efficiency of their production. Special efforts are being made to increase the range and value of animal feeding stuffs available.
Agricultural production may be increased by broadening the range of plants available for particular enviroments and by improving those environments for the different plants. DSIR is continuously surveying soils to assess their suitability for particular crops, including pastures and forest species, and forms of land use. The demand for information about basis soil resources continues to grow, and there is also a need for interpretation of this information so that it can be used in the solution of production and environmental problems. The Soil Bureau has a large team continuously working on these basic aspects, using computers and other modern equipment as they become available.
One of the main factors influencing growth is soil moisture, and major soil groups are being classified by moisture availability. At the same time the responses of different pasture plants, and forage plants such as maize and sorghum, to moisture stress and other adverse climatic and soil conditions are being studied in the controlled-climate laboratory at Plant Physiology Division. A breeding programme is assessing plants for the wetter hill country, and the improvements possible with irrigation of the drier hill country are being demonstrated.
As well as covering specialist disciplines of plant ecology, physiology, breeding, and nutrition in relation to pasture plants, Grasslands Division has five research committees to deal with projects for specific regions and their particular farming systems. These committees integrate the research findings of this division with those of other DSIR divisions (such as Plant Physiology, Applied Biochemistry, and Entomology) and the Ministry of Agriculture and Fisheries and elsewhere. For high-country farming, prospects for irrigation, production of seeds of clovers, and broadening the range of pasture species are being developed. In other regions, research is concentrated on filling feed ‘gaps’, in winter for dryland and hill country, and in late summer for Northland. There is intense effort on ameliorating wintering systems for sheep.
Considerable effort has been devoted to using clovers for nitrogen fixation in pastures, and this has become even more important with recent concern over the side-effects of fertiliser nitrogen on the environment and the rapidly increasing cost of this fertiliser. At Applied Biochemistry Division, integrated studies involve nitrogen fixation, photosynthesis, and mineral cycling in the soil-plant-animal system. The nutritive value of proteins in foods and feeds is investigated, particular emphasis being given to leaf protein concentrate as a food for animals and, ultimately, for humans. Special effort is devoted to the flavour of mutton. Studies also include the possibility of using other natural resources such as seaweeds and wood wastes.
With all advances there are usually unforeseen problems, and a check is kept on the effects of different cropping systems on the soil structure and availability of nutrients to plants, together with any correlations that appear to exist between pasture management systems and deficiency diseases of livestock, such as grass staggers.
New Zealand is particularly active in developing alternative methods of pest control that will reduce the use of toxic chemicals, because insecticide residues in exported animal products are now required to be absent or extremely low. Work at Entomology Division towards control of the grass grub, our most economically harmful pest, includes basic research on the chemicals in pastures which attract it, as a preliminary to pasture breeding studies or for formulation of poisoned baits, and research on bacterial or virus diseases that specifically attack the pest. Another aspect of biological control is the elimination of weeds, and work has begun on suitability of various insects for controlling thistles in pastures and arable land.
Breeding of new varieties of plants with improved resistance to pests or diseases or with improved yields can result in big increases in production without the need for greatly increased input, and this is a major objective of Crop Research Division. Some success has been had in producing varieties of peas resistant to wilt, and ryecorn resistant to rust, and work continues on brassicas resistant to aphids and viruses, and potatoes resistant to viruses. Several high-yielding cereals have been produced, or example, varieties of barley, maize, and semi-dwarf wheats. Sorghums and various subtropical grasses are being evaluated as forage crops. Increased emphasis is placed on crops for processing, and work is being done on potatoes for canning, instant mash, and crisps, and on peas and tomatoes that can be harvested mechanically. New types of oilseed crops are being evaluated for a vegetable-oil industry, peppermint is being developed for its essential oil, and wild Solanum species are being developed as a new drug-producing crop.
Soil-borne diseases of crops are difficult to control, and, as well as breeding for resistance, work is being done at Plant Diseases Division on other means of overcoming these diseases. Work is also being done on fruit, both with a view to preventing problems such as bitter pit in apples and frost damage to apricots, and on developing less well known fruits such as kiwifruit and tamarillos for overseas markets.
As well as giving high yields, wheat varieties must have improved milling and baking qualities. At the Wheat Research Institute fundamental work on the milling process is being done, partly with the aim of simplifying testing for milling quality.
Most of the other agricultural processing work is done in support of work at research associations to which DSIR contributes finance, such as the Dairy Research Institute, the Meat Industry Research Institute, the Wool Research Organisation, and the Leather and Shoe Research Association. A noteworthy current project at the Dairy Research Institute is the attempt to produce a butter that will spread easily when taken from the refrigerator, and the low-melting butter that has been marketed in New Zealand is being superseded by an improved type with more of the spreading characteristics of margarine. At the Meat Industry Research Institute work is being done both on speeding up conditioning time by high-voltage stimulation immediately after slaughter and on improvements to tenderness by hanging carcasses in the squatting position. Expansion of facilities and staff, for studies on hygiene of meatworks and diversification of products and markets, is completed.
Part of the work of the Wool Research Organisation has been devoted to improving the acceptability of New Zealand crossbred wool for yarns. A range of acceptable semi-worsted hand-knitting yarns has been produced, and the self-twist spinning machine has been found to be adaptable to these slightly coarser wools. A new method of making yarns with variegated colours has been patented.
At the Leather and Shoe Research Association, recently relocated at Palmerston North, studies are continuing on the prevention of grain defects in sheepskins.
Other Primary Production—Some work on forestry is done, in consultation with the Forestry Service, by Ecology Division and Soil Bureau, both dealing with aspects of the ecology of native forests. Ecology Division's main interest in this respect is in the food and population changes of opossums in the Orongorongo Valley.
Staff at Chemistry Division are investigating the chemical composition of radiata pine wood and bark, and the possibility of commercial production of tall oil, and the Physics and Engineering Laboratory is studying wood structure using the scanning electron microscope and has produced original and attractive books on the subject.
Geological Survey has intensified the search for exploitable industrial minerals and rocks (see Minerals section). The survey is also the permanent repository for all earth science information, including oil prospecting done by private groups. The recent concern about energy supplies has drawn attention to the work of various DSIR divisions on coalfield prospecting and the utilisation of ash from coal-fired power stations; on testing geothermal sources for potential for development in electric power production and other industrial purposes; and on computer modelling of the flow from Kapuni natural gas field. The first of several studies on New Zealand's energy resources has been issued.
The Soil Bureau has surveyed peat deposits from Chatham Island, Chemistry Division is investigating the potential of peat for yielding wax similar to montan wax, and the possibility of using peat after wax extraction for fuel, fertiliser, or plant growth medium is also being examined. Chemistry Division is setting up pilot plant for producing titanium dioxide from West Coast ilmenite. The Institute of Nuclear Sciences has found that the Waikato River has a potentially useful content of heavy water.
In collaboration with the Fertiliser Manufacturers' Research Association, considerable work is being done on means of producing usable fertilisers from Christmas Island “B” and “C” phosphates.
Manufacturing—High priority is being given to research on manufacturing and to industrial liaison to which considerable increase in staff is being assigned.
A Science in Industry Unit co-ordinates and facilitates liaison with industry through the various divisions dealing with industrial problems, and advises the department on how to match its allocation of resources to the needs of industry. One recent result of this has been the establishment of a Testing Laboratory Registration Council (TELARC), under which laboratories can have their testing facilities certified. This enables companies to adhere more closely to standards of machining strength, safety, and so on required of exported manufactured goods. The standards of any laboratory must be calibrated periodically against the national standards held at the Physics and Engineering Laboratory. The need for making accurate and reproducible measurements becomes greater as industrial technology increases in sophistication.
The Auckland and Christchurch Industrial Development Divisions and the Physics and Engineering Laboratory (in Wellington) between them provide an extensive liaison service for all kinds of industry in all parts of New Zealand. Each has its own staff of liaison officers who make contact and pass on information about industrial needs to appropriate expert consultants in their industrial division or in other industrially oriented divisions, such as Chemistry Division and Institute of Nuclear Sciences. In all the help to industry, close collaboration is maintained between several divisions, the research associations, and university engineering departments.
The Physics and Engineering Laboratory has a management advisory service, consisting of scientists with direct working experience in industry who advise on production control and costing so that technical advice offered is used most effectively. The group advises firms on use of computers, and has published a directory of all known computer installations in New Zealand.
Other experience with computers, in control of laboratory experiments, is also being applied in industry, for example in process control for milk-powder drying and in electronic weighing and grading of sheep carcasses.
Advice has been offered on various aspects of automation, particularly on numerical control of machine tools, a procedure well suited to short-run production of precisioned equipment.
Equipment now in use at Auckland Industrial Development Division enables production machining problems to be reproduced in the laboratory, and there is a “quick-stop” facility so that equipment is used to show where improvements can be made in minimising cutting forces, in or organising tool type and drill speeds, in lubrication, and so on. A widespread cause of lowered machine, performances is incorrect balancing and excessive vibration, and advice on routine balancing has been successfully applied in industries ranging from papermaking to power generation.
This division has designed and built a carbon dioxide laser primarily in response to industrial inquiries about the use of lasers for cutting and drilling materials that are difficult to deal with by conventional methods. Problems being investigated are drilling of contact lenses and cutting of complex gaskets and wallboards.
Apart from standards testing and advisory work, the Christchurch Industrial Development Division has designed and built prototype industrial machinery, for example a knotting machine for producing string loops for holding lamb carcasses in position in the freezer, and a hydraulically operated wool-coring machine, for extracting samples from the highly compressed wood-hard bales used in recent years.
Projects tackled range from developing strong light plastic sheeting to replace glass in glasshouses, to trials in impregnating wooden golf-club heads with plastic (in collaboration with the Institute of Nuclear Sciences).
Apart from pilot-plant and other studies towards development of new products in the way of minerals, fertilisers, and fine chemicals already mentioned and work on aspects of energy production, especially from geothermal sources, Chemistry Division is involved in helping industry control its undesirable by-products. A noteworthy project, in combination with the Wool Research Organisation, is the cleaning of woolscour effluents; this has the added advantage that the lanolin removed from the effluent is marketable. The Institute of Nuclear Sciences also is actively involved in pollution control studies and uses radioactive tracers and mathematical models to simulate tidal motion and predict sewage dispersion.
Building and Construction, Transport—Most of the work of DSIR in these spheres is done in support of various research associations and other Government departments. For example, advice is given about corrosion prevention in pipes, turbines, and other equipment in geothermal power stations, in electrical conductors, in underground gas and water pipelines, and in water piping in buildings. Mathematical assistance has been given in computer modelling of the electricity supply system, geological advice has been given on the siting of power stations, and help has been given in cases of turbine blade failure and to prevent earthquake damage of electrical sub-station gear. A wide variety of building materials, such as paints and wood finishes, adhesives, and plastics, metal, plaster, and stone components is tested for suitability for the job, strength, permanence, and the presence of undesirable chemicals.
A special study in DSIR is the design and construction of buildings to resist earthquake damage. A design in which load-bearing and vibration-damping structures are separated, leading to more efficient functioning of each, has recently been patented. The Physics and Engineering Laboratory has also been perfecting a solar heater for hot-water systems in private houses. Staff are collaborating with the Building Research Association in a survey of thermal insulation requirements in houses. The association has been studying timber house framing with a view to revision of the code of practice, and has done considerable work towards preparation of a New Zealand code for fire resistance of buildings.
The Concrete Research Association, in collaboration with Chemistry Division, has been studying the behaviour of aggregates in relation to dimensional stability of concrete, and the use of pumice as a concrete aggregate. Work at the Pottery and Ceramics Research Association has dealt with bond strength between mortar and brick, and the testing of structural strength of brick masonry walls.
A problem that is becoming increasingly recognised is that of noise, the main source of which is road traffic, and DSIR has surveyed various urban and suburban areas to help specify requirements for insulation against noise.
The Physics and Engineering Laboratory has constructed a portable light-meter for use in assessing the influence of inadequate street lighting on traffic accidents.
A national transport policy study was assisted by Applied Mathematics Division in the development of mathematical models, particularly for the rail and air parts of the study.
Natural Environment—A large part of DSIR's work concerns provision of information about the environment, and this work has been extended by the recent need for specialised comment on environmental impact reports. The information should help to minimise environmental deterioration and be a guide to the wise management of natural resources. Many projects are handled in co-operation with other Government departments, and several are done on a contract basis by university departments.
Geophysics Division is investigating a possible physical basis for earthquake prediction and a soundly based warning system for volcanic activity. The Seismological Observatory maintains a network of recording stations throughout New Zealand and extending to the islands of the south-west Pacific and to Antarctica.
Of continuing importance is the regional surveying of geophysical properties, geological strata, and soil parent materials. The Geology of New Zealand, recording in two volumes 100 years of geological observation, is about to be published, and recently completed work means that comparable sets of maps on geology, soils, and parent rocks on a scale of 1:1,000,000 are available.
A network of stations attached to Physics and Engineering Laboratory studies various aspects of the upper atmosphere, such as its physical properties, and electromagnetic and corpuscular radiation streaming through. They also provide information to help correlate conditions in the ionosphere with meteorological phenomena. In a joint project with the Meteorological Service, acoustic radar equipment has been built to provide knowledge of changes in structure of the lower atmosphere. This will also provide information about atmospheric “inversions” that trap gaseous pollutants over industrialised areas. Precise measurements are being made of the increases in carbon dioxide in the atmosphere resulting from combustion of fossil fuels.
The Oceanographic Institute is well on the way to completing its survey of the ocean floor around New Zealand on a scale of 1:1,000,000 and is carrying out more detailed seismic and magnetic surveys. Studies are being made of the sediments on the continental shelf and the slope, a practical outcome of this work being provision of guidance on the siting of oil and gas pipelines and power cable on the sea floor. The off-shore sea current circulation has been defined in general terms, and detailed surveys of particular areas such as the Foveaux Strait - East Cape region have begun. Marine minerals, such as manganese nodules, have been investigated with a view to commercial exploitation. Bathymetric surveys of major lakes have been made.
Additions to the series of monographs on the marine fauna of New Zealand are continually being produced as a basis for ecological studies concerned mainly with fish that feed on the sea floor and with all species in the food chain. A great deal is known now about diatoms and copepods in the plankton, which forms the first part of the food chain on which all life in the sea depends, but studies continue on the effects of variability of the environment and productivity of species themselves.
Part of Ecology Division has recently moved to Lake Taupo to start detailed studies of the lake and its catchment area and of other lakes in the Rotorua area. A complete registry of the nutrient status of lakes is being compiled. Ecology Division is also mapping the distribution of birds, lizards, frogs, and bats, and making complete studies of the ecology of various islands, e. g., Campbell Island and the Auckland Islands. Effects of birds and mammals on agricultural land and their ecology in forests are being studied.
Botany Division is completing a survey of all reserves and some national parks. Volumes 3 and 4 of Flora of New Zealand, dealing with grasses and monocotyledonous weeds respectively, are being compliled, and work continues on production of publications in the series Chromosome Atlas of the New Zealand Flora.
Work in the Antarctic and the Pacific Islands is described in the Overseas Territories section.
Scientific Services—Chemical work in the investigation of crime and toxicology, and chemical and bacteriological examination of food, pharmaceuticals, and water supplies form a large part of Chemistry Division's service to other departments. Recent response to the observation of an abnormally high lead content in a child's blood led to investigations, with the Health Department, of sources of lead in the environment, and an important source was found to be the soil of sections containing older painted houses.
The department undertakes blood alcohol analyses on behalf of the Ministry of Transport and the Police Department, and a booklet describing the results and their relationship to road traffic accidents has recently been published.
Chemistry Division is also called on to advise on safe handling of toxic chemicals, and there have been several occasions when a harbour board or a fire service has asked for help in dealing with a chemical spillage.
Applied Mathematics Division is sometimes asked to help with advice for social services, and a recent case was to develop a mathematical model to help Treasury formulate the proposed New Zealand superannuation scheme.
The Information Service edits and publishes all the DSIR publications and maps mentioned and many others, and offers a publication service to all New Zealand scientists in its research journals, New Zealand Journal of Agricultural Research, New Zealand Journal of Experimental Agriculture, New Zealand Journal of Botany, New Zealand Journal of Geology and Geophysics, New Zealand Journal of Marine and Freshwater Research, New Zealand Journal of Science, and New Zealand Journal of Zoology.
The department's reputation for expertise and standards of service is high with the general public and overseas, as well as in scientific circles in New Zealand. Its activities, achievements, and organisation are described in detail in the annual publication DSIR Research, available from the department, and its annual report to Parliament, available from the Government Printer.
Grants paid in 1973-74 to research and allied institutions by DSIR are shown in the following table.
| Institution | Amount |
|---|---|
| $(000) | |
| Universities (Auckland, Canterbury, Lincoln, Massey, Otago) and University Grants Committee | 125 |
| Research associations— | |
| Building Research Association | 168 |
| Coal Research Association | 99 |
| Concrete Research Association | 43 |
| Dairy Research Institute | 445 |
| Fertiliser Manufacturers' Research Association | 63 |
| Launderers, Drycleaners, and Dyers Institute | 23 |
| Leather and Shoe Research Association | 60 |
| Meat Industries Research Institute | 326 |
| Pottery and Ceramics Research Association | 50 |
| Wool Research Organisation | 355 |
| New Buildings | 110 |
| Overseas institutions— | |
| Commonwealth Agricultural Bureaux | 45 |
| International Atomic Energy Agency | 49 |
| Others | 15 |
| New Zealand institutions— | |
| Carter Observatory | 41 |
| Cawthron Institute | 92 |
| Royal Society of New Zealand | 80 |
| Testing Laboratory Registration Council | 30 |
| Total | 2,219 |
Staff numbers and expenditure by DSIR for 1973-74 in scientific activity classifications are given in the following table.
| Activity | Staff as at 31 March 1974 | Departmental Expenditure | Grants | Total |
|---|---|---|---|---|
| $(000) | $(000) | $(000) | ||
| Agriculture—Production | 708 | 6,253 | 227 | 6,480 |
| Agriculture—Processing | 61 | 496 | 1,195 | 1,692 |
| Building and construction | 73 | 636 | 244 | 880 |
| Manufacturing | 249 | 2,150 | 110 | 2,260 |
| Minerals | 122 | 1,198 | 149 | 1,347 |
| Natural environment | 379 | 3,717 | 138 | 3,855 |
| Other activities | 256 | 2,254 | 156 | 2,410 |
| Total | 1,848 | 16,705 | 2,219 | 18,924 |
MINISTRY OF AGRICULTURE AND FISHERIES—Almost all agricultural research within the Ministry of Agriculture and Fisheries is now conducted by the Research Division, which has a staff of approximately 227 scientists and 485 technicians: the headquarters is at Ruakura Agricultural Research Centre, Hamilton.
A proportion of resources is devoted to servicing activities for farmers and advisory personnel. Chief among these are soil-testing services. In two soil-testing laboratories about 60,000 samples of soil from farms and experimental areas are analysed for pH and major elements as a basis for fertiliser recommendations by farm advisers.
Research work is carried out at seven stations, at smaller experimental stations and areas, and on farmers' properties throughout the country. Major work areas of the seven stations are: animal and plant production (Invermay); animal production and some local diseases (Ruakura Animal); animal health (Wallaceville); hill country (Whatawhata); soil fertility and plant production (Ruakura Soil and Field); irrigation (Winchmore); and horticulture (Levin). In addition, field research staff investigate local problems throughout the country and test, on experimental areas and farms in a range of environments, the findings of research stations. A biometrics unit provides statistical services for research workers.
Major Agricultural Research Projects—Because of the vital importance of fertilisers to agricultural production, considerable work is being done on the fertiliser requirements of soils throughout New Zealand. Most major soil groups are being studied in detail. There are few, if any, soils or areas where it has not been possible to establish pastures satisfactorily with suitable fertilisers, seed, inoculants, and in some cases drainage. Problem areas such as sands, peats, gumlands, pakihi soils, and high country (up to about 900 m) have been successfully and profitably improved, using specialised techniques and often specialised equipment.
From animal production research, targets have been set which are acting as a spur to producers. Six hundred and seventy kilograms of milkfat or beef per hectare; 340 kg of lamb and over 110 kg of wool—these are the levels of production which have been achieved from selectively-bred animals grazed on productive, well-utilised pastures. Studies of different classes of sheep in relation to beef cattle have provided valuable information on the most profitable type of stock to run.
Major sheep and cattle breed evaluation and improvement projects, in which both local and exotic stock are represented, fall into two groups: collaborative studies on properties administered by other Government departments, and integrated breeding studies on research stations in both the North and South Islands.
Animal health research is concerned with most of the important diseases which afflict sheep and cattle. Internal parasites, mastitis, salmonellosis, facial eczema, bloat, tuberculosis, brucellosis, and hypomagnesaemia are all being investigated with the aim of finding more effective methods of prevention and control.
As farming becomes more intensive, diseases can have much greater effects, and science must continue to find answers to existing and changing problems.
OTHER GOVERNMENT DEPARTMENTS—The Department of Scientific and Industrial Research and the Ministry of Agriculture and Fisheries are responsible for about 71 percent of the total Government science expenditure. A number of other departments do, however, undertake research. The departments concerned and the expenditure involved are listed in the table on page 236, and more details of their research activities are contained in the appropriate departmental sections.
SCIENTIFIC RESEARCH OUTSIDE GOVERNMENT DEPARTMENTS—The bulk of university funding comes direct from the Department of Education's Vote but university research is funded through the University Grants Committee. A number of Government departments are, however, substantially increasing their contact with the universities by granting research contracts for specific programmes of research.
There are 11 industry research associations which are funded jointly by Government and the industry they serve. The present associations are the Building Research Association, the New Zealand Coal Research Association, the New Zealand Dairy Research Institute, the New Zealand Fertiliser Manufacturers' Research Association, the Research Institute of Launderers, Drycleaners and Dyers, the New Zealand Leather and Shoe Research Association, the Logging Industry Research Association, the Meat Industry Research Institute of New Zealand, the New Zealand Cement and Concrete Research Association, the New Zealand Pottery and Ceramics Research Association and the Wool Research Organisation of New Zealand. The estimated total cost of the government funding for 1974-75 is 52,000,000.
The only major endowed research organisation in New Zealand is the Cawthron Institute at Nelson which was established in 1920 with a bequest of $500,000 under the will of Thomas Cawthron. As the value of the investment of the bequest has declined the institute has received increasing income from other bequests, chemical services earnings, and from a Government grant which comprises about 47 percent of the institute's income.
The organisation of medical research is described in Section 5A, Public Health, under the headings Medical Research Council and National Health Institute.
THE PRESENT ORGANISATION OF SCIENTIFIC RESEARCH—Decisions on national scientific policies are made by the Minister of Science and the Cabinet, subject to the guidance and control of parliament during the annual consideration of the Estimates.
Scientific research in New Zealand is carried out by the research divisions of 15 Government departments, universities, joint Government/industry-funded research associations and private organisations, such as the Cawthron Institute, which receive government assistance. Accurate statistics on proportionate expenditure on research are not yet available but means of obtaining the necessary information are being studied, as the data is needed both for internal use and for OECD comparative purposes. It is certain, however, that the majority of research in New Zealand is funded by Government departments, of which about 71 percent is expended by DSIR and the Ministry of Agriculture and Fisheries.
Advising the Government on a co-ordinated national policy for scientific research, which takes into consideration the work of all these agencies, is the role of the National Research Advisory Council (NRAC), which was established on 1 April 1964 to advise the Minister of Science on:
the promotion and development of scientific research in New Zealand;
the planning and co-ordination of scientific research and services in New Zealand, including:
the determination of priorities among research activities of Government departments having regard to research done by other organisations;
the provision of scholarships and fellowships and the promotion of the training of research workers;
the association of Government with industry in the promotion of fundamental and applied research, including the promotion of research associations;
the collection and dissemination of scientific information including the publication of reports and journals;
the promotion of co-operation with the governments of, or organisations in, other countries, or with international organisations, in scientific matters;
any other matters that are appropriate for the carrying out of any of the above-mentioned functions, or that are referred to it by the Minister.
The National Research Advisory Council Act 1963 provides for six members, including the chairman, to be appointed by the Governor-General and for three ex-officio members, the Director-General of Agriculture and Fisheries, the Director-General of Scientific and Industrial Research, and the Secretary to the Treasury. The council is assisted by three advisory committees (each chaired by a council member), covering the fields of primary production, manufacturing and processing, and research related to the natural and social environment.
By Government directive, all departmental proposals involving the establishment of new scientific activities of the major expansion, reduction, or modification of existing activities are referred to the council for evaluation, as are proposals likely to make substantial demands on scientific manpower or other scientific resources.
The NRAC is a sector council of the national planning machinery, reporting through the Minister of Science to the Cabinet Committee on Policy and Priorities.
A working group was set up during 1974 to enable consultation between the council and the newly-established Planning Advisory Group. They are to report jointly to the Minister of Finance on various factors concerning the contribution of research to economic growth, including integration between science policy and economic development, and the basis on which Government's science resources should be available to the private sector.
All Government science activities and science groups are dealt with in one forward programme, the Science Budget, which is prepared annually to assist the council in advising government on the appropriate allocation of resources to various areas of scientific activity.
The Science Budget is an accumulation of the portions of the Votes of Government departments expended on scientific research. Each department's work is classified according to 11 major activity headings, rather than by scientific disciplines. The council ascertains what work is under way in each activity, the resources devoted to it, and the relevant cost. Forecasts of costs and resources needed to maintain existing levels of effort are obtained on a 3-year forward planning basis and the council analyses proposed new work and extensions of existing efforts.
This background information enables the council to recommend to the Government desirable growth rates in scientific and directly-supporting manpower for each activity, with an estimate of the likely cost. Manpower, as the most common and constant factor in scientific planning and expenditure, is a prime consideration in recommendations. As the council is a purely advisory body, the actual disbursement of Science Budget funds remains the responsibility of the Government departments concerned.
The following tables show the Government expenditure and manpower by department and scientific activity.
| GOVERNMENT EXPENDITURE ON SCIENCE BY DEPARTMENT | ||||||
|---|---|---|---|---|---|---|
| Department | Gross Expenditure on Science | Grants | ||||
| 1971-72 | 1972-73 | 1973-74 | 1971-72 | 1972-73 | 1973-74 | |
| N.B —This table excludes expenditure on public buildings. | ||||||
| $(000) | $(000) | |||||
| Agriculture and Fisheries | 7,477 | 9,004 | 10,712 | 284 | 399 | 705 |
| Defence | 731 | 742 | 1,026 | 2 | 12 | 3 |
| Education | 765 | 877 | 1,005 | 735 | 832 | 935 |
| Electricity | 12 | 10 | 12 | 10 | 9 | 7 |
| Forest Service | 2,338 | 2,858 | 3,333 | 21 | 34 | 21 |
| Internal Affairs | 212 | 250 | 335 | - | - | - |
| Justice | 25 | 29 | 28 | - | - | - |
| Labour | 155 | 167 | 183 | 8 | 8 | 7 |
| Lands and Survey | 10 | 15 | 15 | 10 | 15 | 15 |
| Maori Affairs | 4 | 2 | - | 4 | 2 | |
| DSIR | 13,872 | 16,154 | 18,924 | 1,769 | 2,118 | 2,219 |
| Social Welfare | 31 | 58 | 77 | - | - | 4 |
| State Services Commission | 44 | 42 | 43 | - | - | - |
| Transport | 2,426 | 3,547 | 4,094 | - | 42 | 26 |
| Works and Development | 1,482 | 1,702 | 2,105 | 150 | 155 | 180 |
| Total | 29,580 | 35,459 | 41,894 | 2,989 | 3,628 | 4,124 |
| GOVERNMENT EXPENDITURE ON SCIENCE BY SCIENCE BUDGET ACTIVITIES | ||||||
|---|---|---|---|---|---|---|
| Activity | Gross Expenditure on Science | Grants | ||||
| 1971-72 | 1972-73 | 1973-74 | 1971-72 | 1972-73 | 1973-74 | |
| N.B.—This table excludes expenditure on public buildings. | ||||||
| $(000) | $(000) | |||||
| Agriculture | 12,822 | 15,184 | 18,289 | 1,597 | 1,812 | 2,129 |
| Forestry | 2,782 | 3,397 | 3,883 | 23 | 37 | 25 |
| Fisheries | 992 | 1,207 | 1,032 | 14 | 23 | 17 |
| Minerals | 1,021 | 1,201 | 1,347 | 144 | 155 | 149 |
| Manufacturing | 1,670 | 1,957 | 2,260 | 87 | 128 | 110 |
| Building and construction | 835 | 964 | 1,203 | 150 | 204 | 251 |
| Transport | 427 | 879 | 830 | 43 | 65 | 53 |
| Natural environment | 6,817 | 8,116 | 10,031 | 145 | 299 | 352 |
| Social sciences | 422 | 538 | 675 | 149 | 202 | 264 |
| Human health | 517 | 593 | 677 | 11 | 13 | 16 |
| Fundamental research | 619 | 8 | 22 | 613 | 4 | 11 |
| Other scientific services | 656 | 1,415 | 1,645 | 13 | 686 | 747 |
| Total | 29,580 | 35,459 | 41,895 | 2,989 | 3,628 | 4,124 |
| SCIENCE BUDGET MANPOWERACTUAL STAFF AS AT 31 MARCH 1974 | |
|---|---|
| Activity | |
| Agriculture | 1,824 |
| Forestry | 420 |
| Fisheries | 101 |
| Minerals | 174 |
| Manufacturing | 249 |
| Building and construction | 74 |
| Transport | 63 |
| Natural environment | 1,064 |
| Social sciences | 66 |
| Human health | 77 |
| Fundamental Research | 1 |
| Other scientific services | 101 |
| Total | 4,214 |
| GOVERNMENT RESEARCH EFFORT | |||
|---|---|---|---|
| Year Ended 31 March | Gross Expenditure on Science | Percentage of Total Government Expenditure | Total Staff Employed |
| $(000) | |||
| 1972 | 33,570 | 1.90 | 3,691 |
| 1973 | 35,455 | 1.60 | 3,930 |
| 1974 | 41,894 | 1.59 | 4,214 |
In a study by the Organisation for Economic Co-operation and Development (OECD) on reviews of national science policy, the following comparisons were made for 1967 of gross domestic research and development expenditure for economic and social purposes (in U.S. dollars per head of population): United States, $34.5; Netherlands, $25.8; United Kingdom, $24.0; Canada, $23.7; Sweden, $22.1; West Germany, $20.4; France, $19.0; Belgium, $14.1; Norway, $10.0; Japan, $9.3; Italy, $5.4; Austria, $2.8.
In another study OECD has calculated civilian research and development expenditure as a percentage of gross national product to give the following country comparison. (This omits military and defence expenditure which inflates the expenditure unevenly for many countries.)
| Source: Review of National Science Policy of Netherlands, 1973 | ||
|---|---|---|
| Country | Year | Percent of GNP |
| United States | 1,967 | 2.2 |
| Netherlands | 1,967 | 2.15 |
| United Kingdom | 1966-67 | 1.7 |
| France | 1,967 | 1.6 |
| West Germany | 1,967 | 1.5 |
| Japan | 1,967 | 1.4 |
| Canada | 1,966 | 1.1 |
| Norway | 1,967 | 0.9 |
| Belgium | 1,967 | 0.85 |
| Italy | 1,967 | 0.65 |
| Ireland | 1,967 | 0.6 |
| Austria | 1966-67 | 0.6 |
| Greece | 1,966 | 0.2 |
Bibliography—Further information on New Zealand scientific services may be obtained from:
Department of Scientific and Industrial Research: Annual Reports, Parliamentary Paper H.34.
Ministry of Agriculture and Fisheries: Annual Reports, Parliamentary Paper H.29.
Medical Research Council: Annual Reports, Parliamentary Paper H.31B.
National Research Advisory Council: Annual Reports, Parliamentary Paper H.41.
DSIR Research 1970: DSIR Information Series Bulletin No. 77.
National Research Advisory Council: Some Aspects of Technical Manpower in New Zealand, N.R.A.C. Publication 2, Wn, 1967.
Callaghan F. R. ed.: Science in New Zealand, Wn, Reed 1957.
Jansen, H. ed.: Directory of New Zealand Science, 4th Ed., 1962, Wn.
McBride, C. P. and de Joux, Christine: Scientific Research in New Zealand, Government Expenditure and Manpower, 1926-66, N.R.A.C. Publication 1, Wn, 1966.
Otago University Science Students' Association: Science Record (this contains the only published list of science research topics studied in all New Zealand universities).
Report of the Committee on Education, Training, and Research to the National Development Conference—May 1969.
Research in the Department of Agriculture: Annual Report of Research Division 1969-70.
R. E. Gibson and N. E. Harcourt: An Index of Current Research in the Social Sciences, N.R.A.C. Publication 3, Wn, 1971.
SOURCES OF LAW—The law of New Zealand consists of the common law, certain statutes of the United Kingdom Parliament, statutes of the New Zealand Parliament, and regulations, bylaws, and other forms of subordinate legislation made under statutory authority.
The common law, sometimes referred to as case law or judge-made law, has been built up over the centuries by the courts in England and, later, in New Zealand and other countries where it was introduced. Like any living law, the common law continues to develop.
In New Zealand the policy of the courts has been to preserve uniformity with the common law in England. This is partly for reasons of convenience and partly because of the assumption prevailing in New Zealand that there is a single common law, the law of England, and that there are not separate, though similar, common laws in different countries.
United Kingdom statutes in force in New Zealand comprise those passed before 1840 which were applicable to the circumstances of the colony at that date, and those passed between 1840 and 1947 which extended to New Zealand expressly or by necessary implication. Many of these statutes have, of course, since been repealed. In 1947 New Zealand adopted the Statute of Westminster, and our Parliament has since been the sole authority with inherent power to legislate for the country. There are no constitutional restrictions on the laws Parliament can pass.
LAW REFORM—In any progressive society the law requires alteration from time to time if it is to reflect the life of the community and adequately give effect to the needs of the people. As in other countries in modern times, legislation is by far the most important means by which the law of New Zealand is adapted to changing circumstances. The responsibility of bringing before Parliament proposals for the revision of the common law and that part of the statute law not administered by other departments of State is in the hands of the Minister of Justice. The Minister is assisted in carrying out his responsibility by the Law Revision Commission, an advisory body set up in 1965 as successor to the Law Revision Committee. The commission is a part-time body with the Minister of Justice as chairman. Its principal functions are to prepare programmes for the reform of the law, to indicate the order in which topics should be examined, to allocate the work, to study particular topics from time to time, and to exercise a general oversight over law reform. In addition to the commission there are five standing committees each specialising in a particular area of the law. These committees consider topics referred to them by the commission or by the Minister and report thereon to the Minister of Justice. The chairman of each committee is a member of the commission.
Public Acts and regulations are drafted in the Law Drafting Office. The ordinances of the 1840s issued when New Zealand was a Crown colony, began a tradition of good drafting that has continued to the present. Allowing for the inescapable complexity of much modern legislation. New Zealand statutes are distinguished by a clarity, accuracy, and simplicity that have been equalled in few other countries.
COURTS—The hierarchy of courts in New Zealand comprises the Court of Appeal, the Supreme Court, and the Magistrates' Courts. All exercise both civil and criminal jurisdiction. Under the Domestic Proceedings Act 1968, particular magistrates are appointed by the Governor-General to exercise the domestic jurisdiction of the Magistrates' Courts. Children's Courts hear cases against children under 17 years of age.
As constituted by the Judicature Amendment Act 1957 the Court of Appeal consists of the Chief Justice by virtue of his office as head of the judiciary and of a president and two judges of the Court of Appeal appointed by the Governor-General. An additional judge or judges of the Supreme Court may be nominated by the Chief Justice to sit on the Court of Appeal. The judges of the Court of Appeal are also judges of the Supreme Court, but have seniority over all other judges of that court except the Chief Justice or the acting Chief Justice.
The Court of Appeal may from time to time appoint ordinary or special sittings and may make rules in respect of places and times for sittings and similar matters. This court, unlike other courts, exercises an appellate jurisdiction only. In addition to ordinary appeals from the Supreme Court, certain other proceedings in inferior courts may, on an order from the Supreme Court, be removed into the Court of Appeal for argument. The Court of Appeal also determines criminal appeals under the Crimes Act 1961.
All decisions of the Court of Appeal are final except where an appeal lies to Her Majesty in Council (the Privy Council). In cases where the amount at issue exceeds $5,000 there is an appeal as of right. In other cases leave to appeal is required. This leave may in most cases be granted either by the Court of Appeal or by the Privy Council itself. The Privy Council thus remains the final court of appeal in almost all civil cases and may also occasionally hear appeals in special criminal cases.
The Supreme Court, which was first established by the Supreme Court Ordinance 1841, is now constituted under the Judicature Act 1908. The members of the court are a Chief Justice and 19 other judges, the number being fixed by statute. An additional judge or judges may be appointed whenever the Governor-General deems it necessary by reason of absence or anticipated absence of any of the judges on leave prior to retirement, each appointment being a permanent one from the time when it is made. The fixing of the number of judges, together with the provision that the salary of a judge shall not be diminished during his term of office, is an important safeguard for the principle of judicial independence. Judges, who must retire at 72 years, are appointed to hold office during good behaviour and may be removed only by the Queen upon an Address by the House of Representatives.
In 1968 a separate Administrative Division of the Supreme Court was created. It consists of not more than four judges of the Supreme Court assigned to the Administrative Division by the Chief Justice. The Administrative Division determines disputes over the valuation of land and hears claims for compensation when land is taken for public purposes. It hears appeals from administrative tribunals under the following Acts: War Pensions Act, Sale of Liquor Act, Cinematograph Films Act, Animal Remedies Act, Land Act, Medical Practitioners' Act, Pharmacy Act, Nurses Act, Trade Practices Act, Distillation Act, Mining Act, Coal Mines Act, Town and Country Planning Act, Soil Conservation and Rivers Control Act, and Clean Air Act. Other classes of applications may be referred to it by the Chief Justice.
Magistrates' Courts are set up under the Magistrates' Courts Act 1947 and possess an extensive jurisdiction in both civil and criminal cases and domestic proceedings. The jurisdiction of the court is exercised by stipendiary magistrates, whose number is limited by statute to 60. Justices of the peace can sit as a Magistrate's Court to hear a limited number of minor criminal charges.
Stipendiary magistrates must have been qualified as barristers and solicitors of the Supreme Court for at least 7 years. They are appointed by the Governor-General, and may be removed by the Governor-General for inability or misbehaviour only. They retire at 68 years of age.
Apart from these courts of general jurisdiction there are in New Zealand several courts with specialist functions. These include the Maori Land Court and Maori Appellate Court, which have jurisdiction in respect of questions relating to Maori land.
There are also numerous administrative tribunals exercising functions of a judicial nature and performing an important and increasing role in the legal system (a list was published in the 1971 and earlier issues of the Yearbook).
JURIES—The institution of the jury is regulated in New Zealand by the Juries Act 1908. Subject to certain exceptions, every British subject between 20 and 65 years of age and resident within 15 miles of a Supreme Court centre is liable to serve on a jury. Women have the right to exemption on request.
The list of exempted persons is contained in the Juries Amendment Act 1951. The following is a summary of the persons now exempted from jury service:
Members of the Executive Council and of the House of Representatives; judges of the Supreme Court and of the Compensation Court; judges and members of the Industrial Court; judges and commissioners of the Maori Land Court; magistrates; visiting prison justices and members of parole boards; coroners; the chairman of the Local Government Commission; the chairman and members of the Licensing Control Commission; officers of Parliament; clergymen; nuns; persons wholly engaged in teaching and school inspectors; barristers and solicitors; medical practitioners, nurses, ambulance drivers, and dentists; registered chemists; members of the armed forces; Police and traffic officers; pilots, masters, and crews of vessels; members of fire brigades; certain Civil Defence personnel; members of an Inland Revenue Board of Review and certain officers of the Department of Justice, including those engaged in court or prison work, and wives of prison officers.
Special juries are provided for in section 71 of the Juries Act. That section provides that in a civil action in the Supreme Court triable by jury either party may, by leave of the court or a judge thereof, procure trial by a special jury instead of a common jury. Except with the consent of all the parties, however, no action may be tried with a special jury unless in the opinion of the court or a judge difficult questions in relation to scientific, technical, business, or professional matters are likely to arise.
LEGAL PROFESSION—In December 1974 there were 3,222 members of the New Zealand Law Society holding practising certificates.
PENAL SYSTEM—The penal system exists to protect the community against those who would break the laws which are laid down so that citizens may live harmoniously together and the common good be promoted. This purpose is achieved principally through the processes of deterrence and reformation; in modern times in New Zealand as in other countries an increasing emphasis is being placed on the reformation and rehabilitation of the offender.
The paramount policy is to ensure first that those who, by reason of the nature of their offences or character of their offending, are a serious danger to society are removed from the community. Subject to that, the goal is to deal with offenders within the community wherever possible—that is, to impose sanctions that do not involve imprisonment. Where prison or other forms of detention are necessary the aim is to do as much as possible during the sentence to rehabilitate the offender and to bridge the gap between institution and free society. The interest of the community as well as of the offender is promoted by his reformation.
Treatment of Offenders Within the Community—The principal penalties available to the courts in dealing with offenders outside a prison are fines, probation, and periodic detention.
Fines—Fines are by far the most common sentence imposed by the courts in New Zealand, even if traffic offences are not taken into account. For very minor offences the imposition of a fine is the only sanction available to the courts, but even where there is power to sentence the offender to a term of imprisonment the courts often content themselves with fining him.
Probation—The legislation on probation is contained in Part I of the Criminal Justice Act 1954. The court may release on probation any offender guilty of an offence punishable by imprisonment either on indictment or summarily. Probation is a conditional suspension of punishment and provides the opportunity for an offender to rehabilitate himself in the community. An offender may be released on probation for a period of not less than 1 year or more than 3 years and during this time he must accept the supervision of a probation officer and observe conditions imposed regarding employment and residence, associates, and general behaviour. These conditions are automatic, but the courts have power to impose further conditions at their discretion on granting probation. This power makes probation a very flexible type of treatment and is coming to be more freely and imaginatively used. Where the offence consists of the destruction or damage of property, restitution of the whole or part of the loss is commonly required as a condition of probation. Some courts have in suitable cases made it a condition of probation that the offender do particular work of value to the community in his spare time. The probation method is widely used.
Persons on probation at 31 December were as follows: 1968, 4,318; 1969, 4,868; 1970, 5,204; 1971, 5,878; 1972, 5,837; 1973, 6,305. In December 1973, of all offenders on probation and in penal institutions, 71 percent were on probation.
Periodic Detention—The Criminal Justice Amendment Act 1962 made provision for sentences of periodic detention. Pursuant to this legislation residential work centres have been set up in Auckland, Otahuhu, Hamilton, Lower Hutt, Wellington, Christchurch, Dunedin, and Invercargill. Some of these are available for offenders under 21 years, and some for adults generally. Where the Act applies, any person of the ages specified who is convicted of an offence punishable by imprisonment or who wilfully refuses to pay a fine may be sentenced to periodic detention for any term up to 12 months.
Under the sentence he is required to attend a work centre on a certain number of occasions each week and while in custody must attend classes or groups, undergo physical training, or perform work either in the centre or outside it. Work outside a centre may be at a hospital or school, at the home of an elderly or infirm person, or on Crown or local authority property. Work centres for young people provide sleeping accommodation as well as other facilities, and in practice such offenders sentenced to periodic detention are usually required to attend during the whole of a weekend. Non-residential centres have been opened at Auckland, Christchurch, Hamilton, Lower Hutt, New Plymouth, Otahuhu, Papakura, Wellington, Whangarei, Tokoroa, Rotorua, Gisborne, Napier, Palmerston North, Wanganui, Tauranga, Nelson, Dunedin, and Invercargill. At 31 March 1973 there were 960 detainees reporting.
Other Powers of the Court—Although not sentences in the strict sense various other means are available to the courts in dealing with offenders whose offences are not serious. They include conviction and discharge, the effect of which is that the offender has a conviction recorded against him but no sanction is imposed, and conviction coupled with an order that the offender come up for sentence if called upon within a specified period. This is a suspension of punishment conditional upon good behaviour but is not subject to the positive conditions of a probation order.
Finally the court, although it may find an offender guilty, may discharge him without conviction if it considers the offence to be of a trivial or technical character.
Detention in Penal Institution—The sentences of detention which the courts may now impose are as follows—
Borstal training, which means detention in a borstal institution for an indefinite period not exceeding 2 years. The offender must be at least 17 years (in special cases 15) but under 21 years. The time of his release is decided by the appropriate Borstal Parole Board, which must consider his case from time to time. After his release he is on probation for 12 months.
Detention in a detention centre, the term fixed by statute being 3 months. The offender must be at least 16 but under 21 years of age, and he may earn up to 1 month's remission of his sentence by good conduct. After his release the offender is on probation for 12 months.
Imprisonment for a stated number of years or for life. An offender sentenced to imprisonment for a fixed term may earn remission of up to one-quarter of his sentence, or, in exceptional circumstances, up to one-third.
Preventive detention, which means detention in prison for an indefinite term to be decided by the Prisons Parole Board, but in any event not less than 7 years This sentence may be imposed on conviction for certain sexual offences if the offender has been convicted for a sexual offence on at least one previous occasion. The offender must be 25 years of age or over. After serving 7 years of his sentence the offender may be released on probation on the recommendation of the Parole Board, provided the board is of opinion that he is not likely to resume his criminal career. The period of probation in each case extends for life. Preventive detention was restricted to sexual offenders by the Criminal Justice Amendment Act 1967. Hitherto, it had been available for persistent offenders in a number of other cases.
Restrictions on Imprisonment—The policy is to restrict detention of offenders in an institution as far as is practicable consistent with the protection of the community from dangerous criminals. In particular short-term imprisonment is usually open to objection on several counts. The Criminal Justice Amendment Act 1967 accordingly provides that no court is to sentence any person to imprisonment for a term of less than 6 months unless, having regard to the nature of the offence and all the circumstances of the case, the court is of opinion that no other punishment than imprisonment is appropriate.
CRIMINAL JURISDICTION: Court of Appeal—The law relating to criminal appeals from the Supreme Court is contained in the Crimes Act 1961.
If it allows an appeal, the Court of Appeal may quash the conviction, vary the sentence, or order the case to be retried in the Supreme Court.
Applications filed in criminal cases and the results of the appeals are shown in the following table.
| Year | Applications Filed | Sentence Varied | Appeal Dismissed or Disallowed |
|---|---|---|---|
| 1967 | 82 | 16 | 66 |
| 1968 | 108 | 14 | 94 |
| 1969 | 86 | 14 | 72 |
| 1970 | 104 | 18 | 86 |
| 1971 | 111 | 10 | 101 |
| 1972 | 102 | 17 | 85 |
| 1973 | 149 | 19 | 130 |
Supreme Court—Criminal cases in the Supreme Court are of two classes—those in which the accused person has pleaded guilty in the Magistrate's Court and has been committed to the Supreme Court for sentence or has been committed for trial and subsequently changed his plea to guilty, and those actually tried in the Supreme Court.
The following table gives a summary of criminal cases dealt with in the Supreme Court during each of the latest 6 years. Frequently a series of charges is preferred against the one offender and this serves to explain the distinction between total cases and distinct persons.
| Year | Tried in Supreme Court | Sentences in Case of Committal for Sentence | Total Sentences | Total | |||||
|---|---|---|---|---|---|---|---|---|---|
| Indictments and Informations | Convictions | ||||||||
| M | F | M | F | M | F | M | F | ||
| Total Cases | |||||||||
| 1968 | 1,468 | 53 | 857 | 35 | 443 | 4 | 1,300 | 39 | 1,339 |
| 1969 | 1,112 | 91 | 603 | 26 | 440 | 9 | 1,043 | 35 | 1,078 |
| 1970 | 755 | 178 | 395 | 123 | 677 | 29 | 1,072 | 152 | 1,224 |
| 1971 | 1,059 | 64 | 508 | 31 | 604 | 10 | 1,112 | 41 | 1,153 |
| 1972 | 1,291 | 86 | 752 | 39 | 576 | 14 | 1,328 | 53 | 1,381 |
| 1973 | 1,313 | 73 | 790 | 41 | 393 | 14 | 1,183 | 55 | 1,238 |
| Distinct Persons | |||||||||
| 1968 | 432 | 22 | 267 | 13 | 68 | 3 | 335 | 16 | 351 |
| 1969 | 390 | 24 | 241 | 12 | 56 | 5 | 297 | 17 | 314 |
| 1970 | 335 | 31 | 218 | 16 | 119 | 7 | 337 | 23 | 360 |
| 1971 | 363 | 31 | 236 | 16 | 147 | 5 | 383 | 21 | 404 |
| 1972 | 429 | 30 | 291 | 20 | 156 | 9 | 447 | 29 | 476 |
| 1973 | 447 | 29 | 291 | 20 | 151 | 12 | 442 | 32 | 474 |
Of the 476 distinct persons indicted during 1973, 311 were convicted, 5 were awaiting trial, and 116 acquitted, and the prosecution was not proceeded with in the remaining 44 cases.
The next table summarises the offences of persons convicted and sentenced in the Supreme Court during each of the latest 6 years.
| Year | Total Convictions and Sentences | Distinct Persons Convicted and Sentenced | ||||||
|---|---|---|---|---|---|---|---|---|
| Offences Against the Person | Offences Against Property and Forgery | Other Offences | Total | Offences Against the Person | Offences Against Property and Forgery | Other Offences | Total | |
| 1968 | 232 | 1,025 | 82 | 1,339 | 126 | 189 | 36 | 351 |
| 1969 | 219 | 790 | 69 | 1,078 | 130 | 159 | 25 | 314 |
| 1970 | 9 | 898 | 57 | 1,224 | 140 | 175 | 45 | 360 |
| 1971 | 269 | 770 | 114 | 1,153 | 164 | 180 | 60 | 404 |
| 1972 | 310 | 947 | 124 | 1,381 | 195 | 214 | 67 | 476 |
| 1973 | 452 | 694 | 92 | 1,238 | 237 | 174 | 63 | 474 |
The table which follows shows the number of distinct persons sentenced in the Supreme Court during each of the latest 5 years classified according to the principal types of offences.
| Type of Offence | 1969 | 1970 | 1971 | 1972 | 1973 |
|---|---|---|---|---|---|
| *Includes persons charged with murder but convicted of manslaughter. | |||||
| Murder | 2 | 7 | 5 | 2 | 9 |
| Attempted murder | 3 | 1 | 1 | 3 | - |
| Manslaughter* | 9 | 6 | 6 | 12 | 10 |
| Traffic offences involving death or injury | 4 | 3 | 1 | 5 | 8 |
| Assaults and wounding | 48 | 58 | 81 | 109 | 116 |
| Sexual offences | 60 | 58 | 64 | 57 | 86 |
| Other offences against the person | 4 | 7 | 6 | 7 | 8 |
| Robbery, burglary, and breaking and entering | 67 | 64 | 75 | 73 | 56 |
| Theft, receiving, and fraud | 78 | 84 | 84 | 110 | 90 |
| Other offences against property | 11 | 20 | 19 | 23 | 26 |
| Forgery and uttering | 3 | 7 | 2 | 8 | 2 |
| Other offences | 25 | 45 | 60 | 67 | 63 |
| Totals | 314 | 360 | 404 | 476 | 474 |
| Per 10,000 mean population | 1.13 | 1.28 | 1.41 | 1.63 | 1.59 |
Sentences imposed in the Supreme Court during each of the latest 5 years were as follows:
| Sentence | 1969 | 1970 | 1971 | 1972 | 1973 |
|---|---|---|---|---|---|
| *Also includes persons committed into the care of the Department of Social Welfare. | |||||
| Probation (under Criminal Justice Act) | 34 | 65 | 40 | 63 | 52 |
| Ordered to come up for sentence | 23 | 13 | 13 | 16 | 28 |
| Discharged | 6 | - | 9 | 9 | 10 |
| Fined | 62 | 36 | 54 | 44 | 59 |
| Imprisoned | 171 | 233 | 243 | 291 | 325 |
| Detention centre (includes periodic)* | 3 | 1 | 17 | 32 | 27 |
| Borstal training | 13 | 9 | 24 | 20 | 20 |
| Preventive detention | 2 | 2 | 4 | - | 1 |
| Detained in mental institution | - | 1 | - | 1 | 1 |
| Totals | 314 | 360 | 404 | 476 | 474 |
In 1941 the death sentence for murder was abolished. It was restored in 1950 by the Capital Punishment Act but was again abolished by the Crimes Act 1961. The only crime for which the death penalty may be imposed is treason. On conviction for murder a mandatory sentence of life imprisonment is imposed.
Flogging and whipping were also abolished in 1941 and have not been restored.
Magistrates' Courts—Magistrates deal with the majority of indictable offences. They have jurisdiction over all crimes against property and all but the most grave of other crimes, such as treason, homicide, rape, and perjury. If the magistrate deals summarily with an indictable offence, he may impose a sentence of imprisonment of up to 3 years or a fine of up to $1,000, or both. A magistrate may, however, decline to deal with an offence summarily, in which case the accused is committed for trial in the Supreme Court in the ordinary way. The accused person has, moreover, the right to claim jury trial if he is charged with any offence, indictable or summary, punishable by imprisonment for more than 3 months.
The following table classifies the convictions in Magistrates' Courts into more common offences or groups of offences for the latest 5 years. The figures refer to total charges, with the corresponding number of distinct cases following the totals in each year. There were 32,516 charges against females in the 299,099 total charges and 28,082 females in the 240,779 distinct cases for 1973.
| Type of Offence | 1969 | 1970 | 1971 | 1972 | 1973 |
|---|---|---|---|---|---|
*Counting only the principal offence in cases where a person is charged simultaneously with two or more offences. †Excludes offences of negligence or drunk in charge causing death or injury; conversion; drunk in charge including excessive blood alcohol; failing to take breathalyser or blood tests; failing to stop after accidents involving injury. ‡From 1 April 1969 excludes overparking offences and from 1 July 1971 some speeding offences, both being handled by traffic controlling authorities and previously dealt with as court cases. §Not offences; included only for administration purposes. Since 1 January 1970 maintenance, separation, and paternity orders have been returned separately under the Domestic Proceedings Act 1968, statistics for which may be found at the end of this section. | |||||
| Common assault | 2,313 | 2,603 | 3,085 | 3,405 | 3,761 |
| Sexual offences | 600 | 558 | 638 | 693 | 704 |
| Other offences against the person | 1,448 | 1,607 | 1,722 | 1,874 | 2,557 |
| Theft | 6,668 | 6,717 | 7,389 | 7,456 | 7,845 |
| Wilful damage | 1,231 | 1,317 | 1,480 | 1,751 | 2,022 |
| Other offences against property (including forgery) | 9,538 | 10,556 | 11,767 | 12,321 | 11,884 |
| Drunkenness (including drunk in charge, etc.) | 4,172 | 4,143 | 3,758 | 3,111 | 3,021 |
| Offensive conduct or language, and vagrancy | 5,168 | 5,847 | 6,039 | 5,328 | 5,444 |
| Other offences against good order | 3,122 | 4,385 | 6,247 | 7,472 | 8,795 |
| Breach of probation | 737 | 880 | 937 | 819 | 811 |
| Offences relating to dangerous drugs | 170 | 235 | 481 | 532 | 1,096 |
| Failing to pay maintenance | 2,064 | 1,228 | 1,318 | 1,510 | 1,301 |
| Other offences relating to administration of justice, drugs, etc. | 874 | 1,064 | 1,291 | 1,123 | 1,536 |
| Failing to furnish return and making false return of land and income | 1,986 | 1,825 | 1,713 | 3,302 | 3,682 |
| Unlawfully on licensed premises and other breaches of Licensing and Sale of Liquor Acts | 7,060 | 6,086 | 7,254 | 7,028 | 6,293 |
| Deserting merchant ships | 155 | 173 | 95 | 52 | 37 |
| Other offences | 6,704 | 6,336 | 6,487 | 7,497 | 7,688 |
| Sub-totals | 54,010 | 55,560 | 61,701 | 65,274 | 68,477 |
| Minor traffic offences†‡ | 171,440 | 159,655 | 179,230 | 166,457 | 193,886 |
| Application for prohibition order§ | 605 | 595 | 176 | 218 | 213 |
| Applications for maintenance, separation order, etc.§ | 1,301 | 136 | - | - | - |
| Application for paternity order§ | 400 | 28 | - | - | - |
| Totals | 227,756 | 215,974 | 241,107 | 231,949 | 262,576 |
| Distinct Cases* | 189,326 | 176,851 | 199,732 | 190,019 | 213,945 |
| Rate per 10,000 mean population for convictions, excluding minor traffic offences and applications | 194.3 | 197.0 | 215.4 | 223.8 | 225.7 |
The next table classifies the result of hearing in all distinct cases heard in 1973.
| Result of Hearing | Offences Against the Person | Offences Against Property, Forgery and Currency | Offences Against Good Order | Offences Affecting Administration of Justice, etc. | Other Offences | Total |
|---|---|---|---|---|---|---|
*Minor traffic offences accounted for 159,823 of the cases where fines were imposed. †Mostly orders made. | ||||||
| Committed for trial or sentence | 212 | 315 | 26 | 45 | 5 | 603 |
| Imprisonment | 627 | 1,130 | 929 | 397 | 35 | 3,118 |
| Detention in detention centre | 96 | 234 | 128 | 52 | 7 | 517 |
| Periodic detention | 334 | 817 | 718 | 98 | 29 | 1,996 |
| Detention in borstal institution, etc. | 87 | 371 | 54 | 65 | 3 | 580 |
| Released on probation | 558 | 2,022 | 622 | 227 | 64 | 3,493 |
| Convicted and ordered to come up for sentence if required | 365 | 555 | 259 | 229 | 56 | 1,464 |
| Fined* | 3,487 | 5,011 | 172,307 | 1,313 | 12,968 | 195,086 |
| Convicted and discharged (or pay costs) | 249 | 555 | 4,850 | 382 | 654 | 6,690 |
| Suspended imprisonment (maintenance cases) | - | - | - | 840 | - | 840 |
| Miscellaneous† | 17 | 38 | 41 | 53 | 55 | 204 |
| Dismissed, withdrawn, or struck out | 1,040 | 1,373 | 18,542 | 1,731 | 1,813 | 24,499 |
| Discharged under section 42 of Criminal Justice Act | 227 | 568 | 637 | 70 | 187 | 1,689 |
| Total distinct cases | 7,299 | 12,989 | 199,113 | 5,502 | 15,876 | 240,779 |
Traffic Offences—Traffic offences form a large proportion of summary convictions. The most frequent traffic offences dealt with are breaches of parking regulations and excessive speed. Since 1 April 1969 parking infringements which result merely from overstaying a time limit have been dealt with outside the criminal law and from 1 July 1971 some local authorities and the Ministry of Transport have imposed speeding infringement penalties.
The following table analyses all traffic convictions dealt with in Magistrates' Courts for the latest 5 years.
| Offence | 1969 | 1970 | 1971 | 1972 | 1973 |
|---|---|---|---|---|---|
| *Excludes trailers and caravans. | |||||
| Reckless, dangerous, or careless use or driving of motor vehicle causing death | 81 | 106 | 94 | 98 | 108 |
| Reckless, dangerous, or careless use or driving of motor vehicle causing injury | 144 | 166 | 206 | 215 | 221 |
| Driving, or in charge of, motor vehicle under the influence of drink or drugs causing death | 1 | 5 | 4 | 9 | 19 |
| Driving, or in charge of, motor vehicle under the influence of drink or drugs causing injury | 5 | 7 | 8 | 6 | 20 |
| Failing to stop motor vehicle after accident involving bodily injury | 122 | 89 | 156 | 242 | 349 |
| Unlawfully converting vehicle to own use | 1,297 | 1,694 | 1,803 | 1,898 | 1,879 |
| Driving, or in charge of, motor or other vehicle under the influence of drink or drug | 2,213 | 4,273 | 5,736 | 6,636 | 7,897 |
| Exceeding speed limits | 50,862 | 45,427 | 47,902 | 32,808 | 39,068 |
| Reckless, dangerous, or careless use or driving of motor vehicle | 29,817 | 28,606 | 33,428 | 33,138 | 35,761 |
| Reckless, dangerous, or careless use or driving of other vehicle | 196 | 196 | 139 | 111 | 89 |
| Incorrect lighting of vehicles | 6,324 | 5,598 | 5,575 | 5,841 | 6,054 |
| Offences relating to the registration, etc., of motor vehicles | 11,987 | 7,832 | 9,041 | 9,685 | 11,906 |
| Offences relating to driver's licence | 15,977 | 17,572 | 19,377 | 17,597 | 20,561 |
| Breaches of parking regulations | 31,686† | 26,006† | 34,355 | 34,072 | 39,253 |
| Other traffic offences | 25,021 | 28,418 | 29,302 | 33,205 | 41,194 |
| Totals | 175,733 | 165,995 | 187,226 | 175,561 | 204,379 |
| Convictions per 1,000 of mean population | 63.21 | 58.87 | 65.36 | 60.19 | 68.61 |
| Convictions per 1,000 motor vehicles* | 152.98 | 137.33 | 1.47.14 | 130.13 | 142.13 |
The previous table excludes the more serious cases involving death or injury, which are sent forward to the Supreme Court for trial or sentence. In 1973 3 cases were sent forward, one being for driving under the influence of drink or drug causing death and the others for reckless driving causing injury, and failing to stop after accident causing injury.
Disqualifications of drivers by length of disqualification are shown in the following table.
| Period for which Driver Disqualified | 1969 | 1970 | 1971 | 1972 | 1973 |
|---|---|---|---|---|---|
| *In addition there were 70 probationary licence holders disqualified. The decrease of 3,964 on 1972 figures (4,034), is accounted for by the revoking of regulations relating to probationary motor drivers' licences as from 10 August 1972, figures included from this date onwards relate only to probationary motor cyclists. | |||||
| Under 3 months | 2,186 | 2,661 | 2,562 | 2,118 | 3,192 |
| 3 months and under 6 months | 5,996 | 6,146 | 4,581 | 4,638 | 6,877 |
| 6 months and under 1 year | 2,330 | 3,323 | 4,663 | 5,411 | 7,230 |
| 1 year and under 2 years | 3,217 | 4,480 | 4,095 | 5,026 | 7,099 |
| 2 years and under 3 years | 530 | 969 | 1,045 | 1,128 | 1,392 |
| 3 years and under 4 years | 998 | 1,197 | 513 | 408 | 431 |
| 4 years and under 5 years | 51 | 94 | 33 | 34 | 31 |
| 5 years and over | 117 | 122 | 165 | 140 | 162 |
| Total disqualifications | 15,425 | 18,992 | 17,657 | 18,903 | 26,414* |
Drunkenness—The following table shows the number of convictions for all types of drunkenness, together with the rate per 1,000 of mean population, for each of the latest 5 years. Children's Courts, in which there were 79 convictions for drunkenness in 1973, are not included in this table.
| Year | Convictions for Drunkenness | Per 1,000 of Mean Population | ||||
|---|---|---|---|---|---|---|
| Males | Females | Total | Males | Females | Total | |
| 1969 | 4,001 | 171 | 4,172 | 2.88 | 0.12 | 1.50 |
| 1970 | 3,959 | 184 | 4,143 | 2.81 | 0.13 | 1.47 |
| 1971 | 3,602 | 156 | 3,758 | 2.52 | 0.11 | 1.31 |
| 1972 | 2,944 | 167 | 3,111 | 2.02 | 0.11 | 1.07 |
| 1973 | 2,889 | 132 | 3,021 | 1.94 | 0.09 | 0.97 |
Repeated (or duplicate) convictions against the same person are included in the statistics shown in the preceding table, but the figures do not include cases of application for prohibition orders of which there were 219 in 1973, 218 in 1972, 176 in 1971, and 595 in 1970. In addition, in 1973, 6,751 persons were convicted of driving or attempting to drive with excessive blood alcohol concentration compared with 5,859 in 1972.
Offences by Women—Of the 299,099 charges dealt with in the Magistrates' Courts in 1973. 32,516, or 10.87 percent, were preferred against females. This figure showed an increase of 4,983 from the 1972 total of 27,533.
Most of the offences for which summary convictions are entered against women are of a relatively trivial nature, such as minor breaches of traffic regulations.
Convictions for more serious offences are set out in the following table.
| Offence | 1969 | 1970 | 1971 | 1972 | 1973 |
|---|---|---|---|---|---|
| Common assault | 55 | 65 | 104 | 134 | 138 |
| Drunkenness | 151 | 184 | 156 | 167 | 132 |
| Burglary, breaking and entering, etc. | 81 | 106 | 104 | 109 | 157 |
| Theft | 1,380 | 1,571 | 1,771 | 1,884 | 2,055 |
| Fraud and false pretences | 247 | 386 | 534 | 462 | 801 |
| Offensive conduct or language | 197 | 251 | 273 | 245 | 257 |
| Vagrancy | 262 | 271 | 259 | 148 | 80 |
Women received into prison under sentence during 1973 numbered 214 compared with 310 in 1972. The more prevalent offences concerned were (with the previous year's figures in parentheses); robbery and stealing from the person, 7 (16); burglary, breaking and entering, etc., 21 (18); theft, 50 (66); fraud and false pretences, 17 (18); vagrancy, 6 (20); failing to pay fine, 34 (71); breach of probation, 18 (23); common assault, 7 (10).
Assessment of Crime—One important index of crime in the community is the number of those who are convicted of offences. This gives a useful guide to the amount of crime, providing the proportion of crime reported and the proportion of known crime whose perpetrators are detected remains more or less constant. This, of course, may not be a justified assumption. A greater number of court convictions might mean merely more efficiency by the police and a greater willingness on the part of the public to report offences that previously went unreported. Care should therefore be taken to avoid reading too much into figures for court convictions.
Over the 10 years 1964 to 1973 the number of convictions in the Magistrates' Courts increased by 234 percent. The trend over most categories of serious crime has been upwards. The number of persons with convictions against property (including forgery) in the Magistrates' Courts increased by 224 percent. For burglary, breaking and entering, 365 percent more were convicted in 1973 than in 1964. For offences against the person (of which common assault, and assaulting, resisting, or obstructing the police are the more frequent offences) convictions have increased by 468 percent from 69 in 1964 to 328 in 1973. The phenomenon of increasing serious crime is not confined to New Zealand, and indeed the situation is much worse in many overseas countries.
History and current experience alike testify that crime almost invariably flourishes in large cities, particularly those that are growing rapidly, and drawing large numbers of young people from a less sophisticated environment. This is less a penal problem than a social one. In New Zealand it has occurred to a marked degree only recently.
The following table gives an annual comparison by ages of the persons sentenced to penal institutions. In 1965, 32 percent of persons sent to prison were 20 years of age or younger; in 1973 the proportion had risen to 43 percent. Similarly, 65 percent of those imprisoned in 1965 were under 30 years of age, in 1973 the proportion had risen to 76 percent.
| Age in Years | 1965 | 1970 | 1971 | 1972 | 1973 |
|---|---|---|---|---|---|
| 15 | 28 | 56 | 88 | 69 | 82 |
| 16 | 117 | 223 | 317 | 321 | 289 |
| 17 | 228 | 380 | 474 | 485 | 430 |
| 18 | 267 | 454 | 508 | 490 | 532 |
| 19 | 241 | 427 | 454 | 464 | 403 |
| 20 | 238 | 437 | 509 | 442 | 426 |
| 21-24 | 722 | 1,044 | 1,215 | 1,113 | 979 |
| 25-29 | 459 | 600 | 701 | 702 | 667 |
| 30-34 | 313 | 387 | 421 | 436 | 384 |
| 35-39 | 271 | 253 | 298 | 296 | 252 |
| 40-44 | 227 | 222 | 254 | 239 | 194 |
| 45-49 | 158 | 196 | 205 | 199 | 137 |
| 50-54 | 126 | 95 | 150 | 129 | 127 |
| 55-59 | 68 | 58 | 58 | 53 | 49 |
| 60-64 | 38 | 16 | 27 | 39 | 26 |
| 65-69 | 12 | 12 | 12 | 19 | 9 |
| 70 and over | 7 | 1 | 4 | 5 | 4 |
| Totals | 3,520 | 4,861 | 5,695 | 5,501 | 4,990 |
PROBATION—The following figures show the numbers of persons placed on probation during each of the latest 12 years.
| Year | Number Admitted to Probation |
|---|---|
| 1962 | 1,978 |
| 1963 | 2,162 |
| 1964 | 2,024 |
| 1965 | 2,456 |
| 1966 | 2,773 |
| 1967 | 3,033 |
| 1968 | 3,345 |
| 1969 | 3,794 |
| 1970 | 4,062 |
| 1971 | 4,274 |
| 1972 | 4,687 |
| 1973 | 5,311 |
The next table gives the number of offenders in each group placed on probation during 1973, together with the period of their probation.
| Age in Years | Period of Probation | |||||||||||||||||||
|---|---|---|---|---|---|---|---|---|---|---|---|---|---|---|---|---|---|---|---|---|
| 1 Year | 15 Months | 16 Months | 18 Months | 20 Months | 21 Months | 2 Years | 2 1/2 Years | 3 Years | Totals | |||||||||||
| M | F | M | F | M | F | M | F | M | F | M | F | M | F | M | F | M | F | M | F | |
| Under 17 | 331 | 44 | .. | .. | .. | 250 | 35 | .. | .. | .. | .. | .. | 146 | 31 | 1 | .. | 14 | 3 | 786 | 113 |
| 17-18 | 377 | 86 | 36 | 2 | 3 | .. | 275 | 49 | .. | .. | .. | .. | 122 | 36 | 1 | .. | 7 | 1 | 821 | 174 |
| 18-20 | 479 | 89 | 43 | 4 | 3 | .. | 339 | 66 | 1 | .. | .. | .. | 170 | 42 | 3 | .. | 7 | 2 | 1,045 | 203 |
| 20-25 | 456 | 70 | 47 | 1 | 2 | .. | 302 | 51 | .. | .. | .. | .. | 193 | 30 | 2 | .. | 14 | 2 | 1,016 | 154 |
| 25-30 | 161 | 33 | 13 | .. | .. | .. | 100 | 19 | .. | .. | .. | .. | 69 | 18 | .. | .. | 6 | 2 | 349 | 72 |
| 30-40 | 137 | 27 | 9 | 1 | .. | .. | 73 | 12 | .. | .. | 1 | .. | 71 | 7 | .. | .. | 11 | 2 | 302 | 49 |
| 40-50 | 65 | 19 | 6 | 1 | 1 | .. | 35 | 4 | .. | .. | .. | .. | 20 | 3 | .. | .. | 5 | .. | 132 | 27 |
| 50-60 | 22 | 5 | 1 | .. | .. | .. | 7 | 3 | .. | .. | .. | .. | 7 | 1 | .. | .. | 5 | .. | 42 | 9 |
| 60-70 | 6 | .. | .. | .. | .. | .. | 6 | .. | .. | .. | .. | .. | 2 | .. | .. | .. | 1 | .. | 15 | .. |
| 70 and over | 1 | .. | .. | .. | .. | .. | 1 | .. | .. | .. | .. | .. | .. | .. | .. | .. | .. | .. | 2 | .. |
| Totals | 2,035 | 373 | 199 | .. | 9 | 9 | 1,388 | 239 | 1 | .. | 1 | .. | 800 | 168 | 7 | .. | 70 | 12 | 4,510 | 801 |
PRISONS AND PRISONERS—The New Zealand prison population is accommodated in 33 institutions comprised of 18 prisons, 5 borstals, 3 detention centres, and 7 police jails. Any person serving a sentence of not more than 30 days may be detained at any police station, which is also deemed to be a prison for that period.
The prison population during the year 1973 is shown in the following table.
| Category | Males | Females | Total |
|---|---|---|---|
| Persons in prison at January 1973 | 2,409 | 110 | 2,519 |
| Receptions during the year (including multiple receptions of the same person, but excluding transfers) | 9,573 | 520 | 10,093 |
| Discharges during the year (including multiple discharges of the same person, but excluding transfers) | 9,512 | 533 | 10,045 |
| Persons in prison at 31 December 1973 | 2,470 | 97 | 2,567 |
| Daily average number of prisoners | 2,402 | 91 | 2,493 |
The number of inmates in penal institutions reached a peak in early 1972, but declined sharply towards the end of that year. The number of offenders in custody at the end of December 1973 was the lowest for 3 years.
Not all prisoners received were actually persons undergoing sentence on conviction for criminal offences. Many, for example, are in custody awaiting their trial. In 1972, 211 debtors were released after being detained or imprisoned for non-payment of debt following a court order; 58 were classed as mental defectives and transferred to mental hospitals, while 4,444 persons were not returned to prison after release for hearing of the charge, having been acquitted, fined, placed on probation, etc.
The following table analyses the ages and offences of distinct persons received into prison under sentence during 1973.
| Age, in Years | Offences Against the Person | Burglary, Theft, and Fraud | Conversion, Wilful Damage, etc. | Vagrancy and Drunkenness | Other Offences | Total | ||
|---|---|---|---|---|---|---|---|---|
| Sexual Offences | Assaults | Other | ||||||
| Under 21 | 60 | 305 | 48 | 660 | 325 | 37 | 727 | 2,162 |
| 21-24 | 29 | 116 | 23 | 237 | 77 | 18 | 479 | 979 |
| 25-29 | 24 | 82 | 17 | 179 | 21 | 23 | 321 | 667 |
| 30-39 | 34 | 53 | 9 | 157 | 21 | 19 | 343 | 636 |
| 40-49 | 26 | 18 | 3 | 69 | 9 | 24 | 182 | 331 |
| 50-59 | 12 | 7 | 4 | 38 | 4 | 17 | 94 | 176 |
| 60 and over | 3 | - | - | 11 | - | 4 | 21 | 39 |
| Totals | 188 | 581 | 104 | 1,351 | 457 | 142 | 2,167 | 4,990 |
The next table gives particulars of ages and length of sentence of distinct persons received into prison under sentence during 1973.
| Age, in Years | Length of Sentence | |||||||
|---|---|---|---|---|---|---|---|---|
| Under 1 Month | 1 Month* and Under 3 Months | 3 Months and Under 12 Months | 1 Year and Under 3 Years | 3 Years and Under 5 Years | 5 Years‡ and Over | Other† | Total | |
*Includes detention in a detention centre. †Includes borstal detention and one prisoner (40-49) sentenced to preventive detention. ‡Includes life imprisonment. | ||||||||
| Under 21 | 240 | 198 | 290 | 121 | 25 | 6 | 1,282 | 2,162 |
| 21-24 | 188 | 216 | 351 | 184 | 25 | 14 | 1 | 979 |
| 25-29 | 151 | 138 | 224 | 131 | 20 | 3 | - | 667 |
| 30-39 | 177 | 135 | 182 | 115 | 20 | 7 | - | 636 |
| 40-49 | 108 | 67 | 90 | 53 | 12 | - | 1 | 331 |
| 50-59 | 55 | 42 | 39 | 31 | 7 | 2 | - | 176 |
| 60 and over | 15 | 6 | 10 | 7 | 1 | - | - | 39 |
| Totals | 934 | 802 | 1,186 | 642 | 110 | 32 | 1,284 | 4,990 |
The special types of detention (or imprisonment) imposed during 1973 are included in the previous table. The following table gives these special types of detention by age of detainee at the time of conviction.
| Sentence | Age in Years | |||||||||
|---|---|---|---|---|---|---|---|---|---|---|
| 15 | 16 | 17 | 18 | 19 | 20 | 21-24 | 25-54 | 55-59 | Total | |
| Borstal training— | ||||||||||
| Males | 72 | 121 | 167 | 188 | 80 | 33 | 1 | - | - | 662 |
| Females | 5 | 15 | 24 | 12 | 6 | 1 | - | - | - | 63 |
| Detention centre | 1 | 132 | 156 | 146 | 82 | 41 | - | - | - | 558 |
| Preventive detention | - | - | - | - | - | - | - | - | - | - |
Of the total of distinct persons received into prison in 1973,63 percent had been convicted for an offence on at least one previous occasion, and 44 percent of these had been convicted more than six times.
The number of prisoners received to serve a sentence imposed during the year 1973 for criminal offences was 5,457 but deducting multiple receptions of the same prisoner, the number of distinct persons was 4,990 (4,776 males and 214 females). The corresponding total for 1972 was 6,083 and there were 5,501 distinct persons (5,191 males and 310 females).
An analysis is given below for the 5 latest years of distinct persons received into prison according to nature of sentence.
| Nature of Sentence | 1969 | 1970 | 1971 | 1972 | 1973 |
|---|---|---|---|---|---|
| Imprisonment | 2,932 | 3,654 | 4,244 | 4,125 | 3,706 |
| Detention centre | 397 | 442 | 558 | 563 | 558 |
| Borstal training | 609 | 764 | 889 | 813 | 725 |
| Preventive detention | 2 | 1 | 4 | - | 1 |
| Totals | 3,940 | 4,861 | 5,695 | 5,501 | 4,990 |
| Rate per 10,000 of population | 14.15 | 17.21 | 19.88 | 18.70 | 16.75 |
The next table shows the number of persons in prison at 31 December in each of the latest 11 years.
| At 31 December | Persons in Jail | Proportion per 10,000 of Population as at 31 December | |||
|---|---|---|---|---|---|
| Undergoing Sentence | On Remand and Awaiting Trial, etc. | Total | Undergoing Sentence | Total in Prison | |
| 1963 | 1,744 | 60 | 1,804 | 6.86 | 7.09 |
| 1964 | 1,685 | 72 | 1,757 | 6.49 | 6.76 |
| 1965 | 1,652 | 50 | 1,702 | 6.24 | 6.43 |
| 1966 | i 897 | 67 | 1,964 | 7.07 | 7.32 |
| 1967 | 1,977 | 76 | 2,053 | 7.24 | 7.52 |
| 1968 | 2,021 | 72 | 2,093 | 7.33 | 7.59 |
| 1969 | 1,963 | 84 | 2,047 | 7.05 | 7.35 |
| 1970 | 2,282 | 83 | 2,365 | 8.08 | 8.37 |
| 1971 | 2,544 | 92 | 2,636 | 8.88 | 9.20 |
| 1972 | 2,447 | 84 | 2,531 | 8.39 | 8.68 |
| 1973 | 2,371 | 196 | 2,567 | 7.83 | 8.62 |
PRISONS POLICY: Classification—The key to successful prison work lies in understanding the individual prisoner, and in order to assist the prisons administration to this end classification boards operate in the main reception centres, Auckland, Wellington, and Christchurch, and in Wi Tako Prison, an institution for those in prison for the first time.
A census of convicted persons under the official jurisdiction of the Department of Justice was taken as at midnight on 4 July 1972.
The census revealed that a high proportion of persons included had had previous penalties. As would be expected this was most marked among prisoners. Seventy-two percent of male prisoners (42 percent of females) had been in penal custody before the present sentence. (Penal custody included prison, borstal, or detention centre.)
Comparable figures for males in other statuses were 31 percent of borstal trainees, 24 percent of probationers and parolees, 23 percent of periodic detainees and 2 percent of detention centre detainees.
The great majority of persons in the census were aged 24 years or less—72 percent of the total.
In general the level of education reached by the persons in the Department of Justice census was low. Only 22 percent of male and 24 percent of female sentenced persons remained at school beyond form IV.
Every man sentenced to imprisonment for a term of 6 months or more (or in some cases for shorter terms) comes before the classification board which can call upon a chaplain, psychologist, psychiatrist, education officer, probation officer, or any other form of specialist service to assist in defining the offender's character and potential and advise upon the most hopeful form of treatment while he is in prison.
Measures Employed in Treatment:Vocational Training—Prisoners are put to work on some form of constructive employment, whether it be industrial production in a secure institution or food production on a prison farm. In addition, and particularly for the younger offender, an attempt is made to teach some trade skills.
Non-vocational Training—A variety of evening activities have been introduced into the prisons and training benefit is derived from these activities, whether they be recreational, educational, cultural, individual, or collective.
There are full-time teachers in Auckland Prison, Mt. Eden Prison, Christchurch Prison, Tongariro Prison Farm, Waikune Prison, Wi Tako Prison, Waikeria and Waipiata Youth Centres, Arohata and Invercargill Borstal Institutions, and part-time teachers in many other institutions. It is their task to seek to improve the general education of those prisoners who have been unable to reach the level of Form II, and also to assist those who are undertaking further education or technical courses through a Correspondence School. The interest shown in education is encouraging, since in many cases it fits a prisoner for better employment on his release and thereby helps to reduce the chances of his further offending.
All institutions receive at regular intervals a supply of well-chosen books from the National Library Service and, in addition, inmates are permitted a free use of the library's request service.
Group Therapy—Group discussions are part of the programme of institutions. These groups of about seven or eight inmates meet regularly with an officer under informal conditions to discuss their problems and attitudes.
The leadership of a group is not confined solely to professional psychologists. Many are led by selected custodial officers who receive subsequent help and guidance from professional staff.
The primary aim of a group discussion is to help inmates to come to a closer understanding of themselves and their problems. At the same time the groups also encourage inmates to form constructive relationships with officers.
Earnings—All prisoners are credited with modest earnings based on a system of marks assessed according to diligence and conduct. A portion of the earnings may be spent on tobacco, confectionery, and toilet necessities in a prison canteen, and this provides an incentive to good work and conduct. At the same time the loss of this privilege is a useful disciplinary measure.
Punishments—An inmate charged with one of the less serious offences against discipline appears before the superintendent, who may impose a penalty or in his discretion refer the case to a visiting justice or to the court. A visiting justice may deal with all cases of offences against discipline and must deal with those which are outside the jurisdiction of the superintendent, unless he thinks they should be brought before the court. His powers of punishment are wider than those of a superintendent. The provisions as to offences and punishments are the same for both prisons and borstals.
Pre-release Hostels—The setting up in 1961 of the first pre-release hostel at Invercargill for male borstal inmates was an important step forward toward the goal of bridging the gap between the wholly controlled life of the penal institution and the responsibilities and temptations of free society. Further pre-release hostels have been established for male borstal inmates at Auckland, Hamilton, and Wellington, at Auckland and Christchurch for adult male inmates, and one in Wellington for female borstal inmates. Selected inmates are sent to these hostels during the last part of their sentence. They live at these hostels and spend their leisure time there under supervision while working in the community.
Release to Work—Under the Penal Institutions Amendment Act 1961, inmates may be released during the day to engage in private employment. The selection of inmates for this privilege is made on the recommendation of the superintendent of a penal institution, by a special committee chaired by a magistrate. The inmates are required to contribute part of their wages towards the cost of their maintenance in the institution and part may also be withheld in satisfaction of outstanding fines or debts. The balance is made available to their dependant or is held by the Department of Justice for payment upon final release.
Post-release Care—Offenders serving a sentence of borstal training, preventive detention, or imprisonment for 12 months or more are discharged on probation. For a period of time they must be under the supervision of a probation officer and, during any part of that period falling within the maximum period they could have been detained in an institution, are subject to recall if their behaviour on release is not satisfactory. Offenders sentenced to detention in a detention centre are also subject to probationary supervision for 12 months following release. The period of supervision his a dual purpose—it is the protection of the community against further offending and it is at the same time an aid to the prisoner to re-establish himself. The step from custody to freedom is a difficult one for prisoners, many of whom require assistance, advice, and guidance during this period.
An offender serving a sentence of imprisonment of less than 12 months is on probation after release if the sentencing court so orders.
Parole System—The introduction of types of sentences designed to encourage the rehabilitation of an offender or to protect society against the hardened criminal, rather than merely to inflict punishment for an offence which has been committed, has created the need for a procedure to enable a person serving one of these sentences to be released as soon as he shows that he is fit to be returned to society.
This need is filled by the parole boards which have the responsibility of reviewing the cases of all persons sentenced to borstal training, preventive detention, or life imprisonment, and of recommending, or in the case of borstal trainees directing, release on probation at the appropriate time.
There are at present five parole boards: the Prisons Parole Board, which deals with all offenders except those sentenced to borstal training, and four Borstal Parole Boards which between them have jurisdiction over all borstal trainees. The Prisons Parole Board is now required to consider the case of every offender sentenced to a finite term of imprisonment for 6 years or more (thus excluding those sentenced to preventive detention or to life imprisonment, whose cases are dealt with under separate provisions) after the offender has served 3 1/2 years of his sentence, and annually thereafter until the offender is released.
The Prisons Parole Board consists of a judge of the Supreme Court as chairman, the Secretary for Justice, and at least one but no more than five other members, all except the Secretary for Justice being appointed by the Governor-General for 3 years and being eligible for reappointment.
Each Borstal Parole Board consists of a magistrate as chairman, the Secretary for Justice, the superintendent of the local borstal institution in respect of which the board is appointed, and two residents of the locality in which the institution is situated. All the members except the Secretary for Justice and the superintendent are appointed by the Governor-General for 3 years and are eligible for reappointment.
Categories of persons whose cases were considered by the Prisons Parole Board and the Borstal Parole Boards during each of the latest 6 years were as follows:
| Year | Borstal Detention | Imprisonment | Habitual Criminals or Preventive Detention | Person on Parole | Total |
|---|---|---|---|---|---|
| 1968 | 1,592 | 42 | 49 | 39 | 1,722 |
| 1969 | 1,673 | 38 | 35 | 17 | 1,763 |
| 1970 | 1,764 | 44 | 22 | 9 | 1,839 |
| 1971 | 2,084 | 25 | 9 | 16 | 2,134 |
| 1972 | 1,794 | 42 | 13 | 6 | 1,855 |
| 1973 | 1,732 | 34 | 5 | 11 | 1,782 |
Of the cases coming before the boards in 1973, there were 751 recommendations made for release on probation and 11 persons on parole were favourably recommended for discharge.
JUVENILE OFFENDERS—All offences, except murder or manslaughter on the one hand, and certain traffic offences not punishable by imprisonment on the other, committed by children under 17 years are dealt with in Children's and Young Persons Courts, the procedure and rules of which differ widely from those of the ordinary courts. In addition, when an offender between 17 and 18 years comes before a regular court, the court may order his case to be heard in the Children and Young Persons Court.
Unless no other suitable room is available, sittings of the Children and Young Persons Court are not held in a courtroom. Proceedings in Children and Young Persons Courts are not open to the public and no report of them may be published except with the consent of the presiding magistrate.
When a child is brought before a Children and Young Persons Court and charged with any offence, it is not necessary to record a conviction even if the charge is proved. The court has power without recording a conviction to impose any penalty or make any order as if a conviction had been recorded. Before 1 April 1975 these courts were called Children's Courts.
The cases heard in the latest 3 years resulted as follows:
| Decision | Total Charges | Distinct Cases | ||||
|---|---|---|---|---|---|---|
| 1971 | 1972 | 1973 | 1971 | 1972 | 1973 | |
| *Includes periodic detention. | ||||||
| Dismissed or withdrawn | 1,541 | 1,490 | 1,863 | 947 | 887 | 1,084 |
| Admonished and discharged | 5,274 | 5,101 | 5,014 | 3,102 | 2,873 | 2,934 |
| Committed to care of Social Welfare Department | 2,912 | 3,245 | 2,988 | 1,270 | 1,241 | 1,134 |
| Placed under supervision | 8,069 | 8,259 | 7,785 | 3,894 | 3,532 | 3,457 |
| Committed to an institution* | 1,899 | 2,155 | 2,283 | 567 | 609 | 665 |
| Fined | 3,649 | 3,774 | 4,230 | 2,605 | 2,733 | 3,086 |
| Otherwise dealt with | 2,294 | 2,418 | 2,834 | 1,004 | 1,099 | 1,244 |
| Total cases | 25,638 | 26,442 | 26,997 | 13,389 | 12,974 | 13,604 |
The following table shows the number of cases dealt with in Childrens' Courts during each of the latest 11 years. It is shown in two ways: i.e., total charges (meaning each offence counted once irrespective of the number with which a person is charged at the one time); and distinct cases (meaning only one charge, the most serious, is counted, irrespective of the number a person is charged with at the time). All the Children's Court tables are shown in this way.
| Year | Total Charges | Distinct Cases | ||||
|---|---|---|---|---|---|---|
| Males | Females | Total | Males | Females | Total | |
| 1963 | 9,000 | 1,414 | 10,414 | 4,139 | 1,047 | 5,186 |
| 1964 | 9,099 | 1,665 | 10,764 | 4,547 | 1,195 | 5,742 |
| 1965 | 9,654 | 2,000 | 11,654 | 4,764 | 1,453 | 6,217 |
| 1966 | 11,512 | 2,450 | 13,962 | 5,576 | 1,656 | 7,232 |
| 1967 | 12,476 | 2,638 | 15,114 | 5,972 | 1,841 | 7,813 |
| 1968 | 13,778 | 3,140 | 16,918 | 6,681 | 1,996 | 8,677 |
| 1969 | 14,835 | 3,153 | 17,988 | 7,261 | 2,070 | 9,331 |
| 1970 | 17,785 | 3,717 | 21,502 | 9,108 | 2,529 | 11,637 |
| 1971 | 21,234 | 4,404 | 25,638 | 10,554 | 2,835 | 13,389 |
| 1972 | 22,166 | 4,276 | 26,442 | 10,342 | 2,632 | 12,974 |
| 1973 | 22,814 | 4,183 | 26,997 | 10,994 | 2,610 | 13,604 |
Detailed statistics for Children's Court cases during each of the latest 5 years are as follows:
| Type of Offence | 1969 | 1970 | 1971 | 1972 | 1973 |
|---|---|---|---|---|---|
*Includes forgery and uttering. NOTE—Distinct cases figures are included in those for total charges. | |||||
| Total Charges | |||||
| Sexual offences | 169 | 144 | 185 | 153 | 182 |
| Assaults | 463 | 534 | 783 | 818 | 1,060 |
| Other offences against the person | 38 | 63 | 59 | 67 | 85 |
| Robbery, burglary, and breaking and entering | 4,118 | 4,687 | 6,501 | 6,252 | 6,294 |
| Theft, receiving, and fraud | 5,431 | 6,392 | 7,590 | 8,162 | 7,512 |
| Unlawful conversion of vehicles | 2,166 | 3 | 3,271 | 3,960 | 4,286 |
| Wilful damage | 471 | 523 | 812 | 904 | 1,022 |
| Other offences against property* | 216 | 925 | 207 | 255 | 295 |
| Offences against good order | 1,553 | 1,899 | 2,240 | 2,266 | 2,592 |
| Indigent or delinquent child | 2,109 | 2,300 | 1,922 | 1,590 | 1,572 |
| Other offences | 1,254 | 1,016 | 2,068 | 2,015 | 2,097 |
| Totals | 17,988 | 21,502 | 25,638 | 26,442 | 26,997 |
| Distinct Cases | |||||
| Sexual offences | 128 | 116 | 139 | 113 | 130 |
| Assaults | 386 | 429 | 632 | 678 | 851 |
| Other offences against the person | 33 | 58 | 49 | 57 | 77 |
| Robbery, burglary, and breaking and entering | 1,711 | 1,975 | 2,767 | 2,608 | 2,608 |
| Theft, receiving, and fraud | 2,400 | 3,027 | 3,529 | 3,560 | 3,423 |
| Unlawful conversion of vehicles | 733 | 871 | 1,233 | 1,305 | 1,576 |
| Wilful damage | 200 | 262 | 399 | 436 | 461 |
| Other offences against property* | 85 | 382 | 33 | 81 | 83 |
| Offences against good order | 989 | 1,249 | 1,442 | 1,364 | 1,588 |
| Indigent or delinquent child | 1,849 | 2,026 | 1,771 | 1,437 | 1,459 |
| Other offences | 817 | 1,242 | 1,395 | 1,335 | 1,348 |
| Totals | 9,331 | 11,637 | 13,389 | 12,974 | 13,604 |
CIVIL JURISDICTION: Supreme Court—The jurisdiction of the Supreme Court is twofold, original and appellate. It has by statute a general jurisdiction to administer the laws of New Zealand. One important aspect of this original jurisdiction is an inherent power to control inferior Courts and judicial tribunals through the writs of certiorari and prohibition. This is essentially a power to determine the limits of jurisdiction of other Courts and is to be distinguished from its appellate function by which the Supreme Court reviews a case which was properly heard and determined by a lower Court. An appeal to the Supreme Court lies only where it is provided for by statute. With certain exceptions, all cases determined in the Magistrate's Court are subject to appeal to the Supreme Court.
The next table shows the number of actions commenced, cases tried, and judgments entered, together with the amounts for which judgments were recorded in the civil jurisdiction of the Supreme Court in the latest 11 years.
| Year | Number of Actions Commenced | Cases Tried | Judgments Recorded (Entered or in Cases Tried) | |||
|---|---|---|---|---|---|---|
| With Jury | Without Jury | Number | Amount Claimed | Amount Recovered | ||
| $(000) | $(000) | |||||
| 1963 | 2,008 | 141 | 256 | 436 | 3,035 | 1,865 |
| 1964 | 1,967 | 106 | 241 | 345 | 1,601 | 889 |
| 1965 | 2,183 | 98 | 296 | 319 | 2,105 | 1,181 |
| 1966 | 2,555 | 89 | 296 | 325 | 2,419 | 1,370 |
| 1967 | 2,952 | 166 | 273 | 425 | 3,373 | 1,850 |
| 1968 | 2,976 | 157 | 340 | 578 | 3,565 | 1,917 |
| 1969 | 2,935 | 133 | 279 | 469 | 3,976 | 2,165 |
| 1970 | 3,273 | 114 | 362 | 536 | 3,246 | 1,712 |
| 1971 | 3,849 | 120 | 393 | 639 | 4,460 | 2,569 |
| 1972 | 3,903 | 108 | 349 | 537 | 4,751 | 2,484 |
| 1973 | 3,865 | 100 | 292 | 387 | 4,176 | 2,527 |
Court of Appeal—During the 5 years 1968 to 1972 there were 240 civil appeals, of which 96 were allowed, and also 3 cases removed to the Appeal Court, 2 resulting in judgment for the plaintiff, and 1 for the defendant.
Magistrates' Courts—Magistrates' Courts may now hear all claims up to $3,000, but if the parties agree in writing that the court shall hear their case it has jurisdiction whatever the amount claimed. In the exercise of this jurisdiction it may grant the same remedies, legal and equitable, as the Supreme Court.
The following table shows the number of plaints entered, cases disposed of, amounts sued for, and amounts for which judgment was recorded in the Magistrates' Courts during the latest 11 years.
| Year | Plaints Entered | Cases Disposed of | |||
|---|---|---|---|---|---|
| Number | Total Amount Sued for | Number | Total Amount Claimed | Total Amount for which Judgment Entered | |
| 1963 | 112,692 | 9,520 | 66,663 | 5,192 | 4,472 |
| 1964 | 115,902 | 9,444 | 69,016 | 5,154 | 4,554 |
| 1965 | 112,813 | 11,526 | 69,690 | 5,244 | 4,644 |
| 1966 | 118,976 | 10,991 | 67,805 | 5,487 | 4,934 |
| 1967 | 128,518 | 12,351 | 73,508 | 6,257 | 5,425 |
| 1968 | 127,517 | 13,781 | 81,155 | 7,536 | 6,393 |
| 1969 | 115,018 | 12,708 | 71,435 | 6,916 | 6,102 |
| 1970 | 111,393 | 12,930 | 68,160 | 6,875 | 6,100 |
| 1971 | 120,388 | 15,326 | 75,035 | 7,597 | 6,663 |
| 1972 | 132,036 | 20,126 | 77,057 | 9,501 | 8,009 |
| 1973 | 115,305 | 19,662 | 70,267 | 9,571 | 8,450 |
The average amount claimed in each plaint was $85 in 1963 and $170 in 1973.
COMPENSATION FOR VICTIMS OF CRIME—The Criminal Injuries Compensation Act 1963 introduced the first statutory scheme in the world for compensation by the State to persons injured by crimes of violence and to the dependants of persons killed by such acts. The scheme is administered by the Crimes Compensation Tribunal, consisting of a judge, or a person qualified to hold judicial office, as chairman and two other members. Compensation may be awarded in respect of any one or more of the following matters:
Expenses actually and reasonably incurred as a result of the victim's injury or death.
Pecuniary loss to the victim as a result of total or partial incapacity for work.
Pecuniary loss to dependants as a result of the victim's death.
Other pecuniary loss resulting from the victim's injury and any expenses which in the opinion of the tribunal it is reasonable to incur.
Pain and suffering of the victim.
In considering any application for compensation the tribunal may take into account any behaviour by the victim which may have contributed to his injury. It is not the policy of the Act to permit double compensation, and the tribunal is therefore directed to deduct any amount that may be received by the victim or his dependants in consequence of the injury, for example, social security benefits. However, the proceeds of any accident insurance policy need not be taken into account.
The availability since 1 April 1974 of compensation under the Accident Compensation Act 1972 has a significant impact on the criminal injuries scheme. The accident compensation scheme caters for all personal injury by accident in New Zealand, and thus covers (with the exception of pregnancy by rape and criminal infection with disease) the whole range of listed criminal injuries. The accident compensation scheme is designed as a fund of first resort and in practice the two schemes have merged in all but the exceptions mentioned and the residual area of property damage caused by escapers.
The following table shows the trend of operations under the Act.
| Action | 1969 | 1970 | 1971 | 1972 | 1973 |
|---|---|---|---|---|---|
| Applications filed | 44 | 40 | 67 | 76 | 87 |
| Cases in which an award made | 32 | 33 | 46 | 48 | 45 |
| Amounts of awards | $15,605 | $14,552 | $28,156 | $18,902 | $18,570 |
LEGAL AID—The Legal Aid Act 1969 introduced from 1 April 1970 a scheme of legal aid in civil proceedings for persons of small or moderate means, and gave effect to the principle that no persons should be prevented by lack of means from having his grievances heard and determined fairly by the courts of the land. The scheme applies to practically all civil proceedings other than divorce. In order to receive legal aid the applicant must have a sufficiently meritorious case. Except in special cases of hardship, every aided person is required to make a contribution of S30 towards the cost of proceedings, and he will be liable to make an additional contribution proportionate to his income and capital resources.
Of the applications received by the 19 district legal aid committees during the year ended 31 March 1974, 7,170 applications were granted, 450 were refused, 151 were withdrawn, and 301 lapsed.
The amount paid out in legal aid in the year ended 31 March 1974 was $679,554; set off against this were contributions of $63,417 from legally aided persons and recoveries of costs of $92,118. The net cost was $524,019.
Comparatively few problems have been presented to district legal aid committees. Such problems as do arise are referred to the Legal Aid Board which gives advice or makes a ruling as required in the particular case. It is expected that legal aid applications will continue to increase as the legal aid scheme becomes more widely known.
The Social Welfare Department is responsible, in accordance with the Act, for investigating the resources of persons applying for legal aid; for assessing their “disposable income” and “disposable capital” within the statutory limits and reporting to district committees on the maximum contribution, if any, that applicants should be expected to pay towards the cost of the proceedings in respect of which legal aid is sought.
THE LAW AND THE FAMILY—The work of Magistrates' Courts used to be classified as civil and criminal. Domestic proceedings were procedurally and administratively an uneasy appendage of the criminal side. Following the passing of the Domestic Proceedings Act 1968, the domestic side of the work of Magistrates' Courts ranks as a separate division alongside the civil and criminal divisions. There is, for instance a separate domestic record book, separate domestic statistics, and, wherever practicable, special courtrooms designed for the hearing of domestic cases. The aim here is to achieve a procedure which, though informal, still preserves dignity.
Domestic Proceedings—The basic objects of the Domestic Proceedings Act 1968 are fourfold.
The first is to empower the court to ensure that a greater measure of justice is received by parties to domestic proceedings. The court is given much greater powers to ascertain the truth. It may call any person as a witness, and may require a lawyer to be provided—at public expense—to assist the court.
The second major aim of the Act is to encourage by all practicable means the reconciliation of warring married couples. A duty is imposed on the court, and on the lawyers acting for each spouse, to give consideration to the possibility of reconciliation, and to take all proper steps towards assisting a reconciliation. It is now possible to institute special legal proceedings for conciliation, quite separately from other proceedings under the Act.
On the other hand, the Act acknowledges as a fact of life that reconciliation procedures may fail, or be obviously hopeless. In such circumstances, separation orders are made available on broad and untechnical grounds. Legal recognition (in the form of a separation order) is now given to the fact that a relationship has actually and permanently broken down.
Third, the Act seeks to ensure that parents have an equal legal responsibility to provide for all their children, whether born in or out of wedlock. As an extension of this principle, the Act for the first time places on the father of ex-nuptial children a limited legal responsibility to maintain their mother. He may be required to maintain her for up to 5 years after the birth of such a child—in other words, till the child reaches school age. Previously, such men were liable to maintain the children only, leaving the mother to fend for herself.
The last major object of the Act is to deal with the perennial problem of maintenance, in such a way that both husbands and wives are dealt with as fairly as possible, and also to ensure that the person liable to pay such maintenance does not escape that obligation.
The basis for the making of maintenance orders has been much simplified and the courts have been given clear guidelines on the principles to be followed when making them. Also, the procedure for enforcing maintenance orders has been considerably tightened up.
The following tables give statistics for the year ended 31 December 1973 of applications and orders made under the provisions of the Domestic Proceedings Act 1968.
| Nature of Order | Applications | Orders Made |
|---|---|---|
*Custody, 1,356; guardianship, 5. Custody order in favour of mother, 1,254; in favour of father, 69; in favour of the parties and divided, 33. †Maintenance also granted in 725 cases. | ||
| Separation | 4,199 | 1,466 |
| Maintenance | 4,428 | 1,659 |
| Custody or guardianship | 4,172 | 1,361* |
| Non-molestation | 1,963 | 251 |
| Tenancy | 528 | 119 |
| Matrimonial home | 2,189 | 445 |
| Paternity | 1,790 | 794† |
| Consent to marry | 75 | 47 |
| Minor's contracts | ... | 138 |
The following were the grounds for the separation orders: serious disharmony, 1,335; defendant's conduct, 97; assault, 12; disharmony and conduct, 22. Seventy-two of the applicants were husbands.
Relative ages of parties when separation order made in 1973 are given below.
| Age of Husband (in Years) | Age of Wife (in Years) | |||||||
|---|---|---|---|---|---|---|---|---|
| 16-19 | 20-24 | 25-29 | 30-34 | 35-39 | 40 and over | Not Known | Total | |
| 16-19 | 7 | 11 | - | - | - | - | - | 18 |
| 20-24 | 46 | 164 | 23 | - | - | 1 | - | 234 |
| 25-29 | 7 | 141 | 127 | 16 | 3 | 1 | - | 295 |
| 30-34 | 1 | 23 | 100 | 88 | 12 | 3 | - | 227 |
| 35-39 | - | 8 | 19 | 67 | 59 | 21 | - | 174 |
| 40 and over | 2 | 1 | 8 | 32 | 98 | 315 | - | 456 |
| Not known | - | 2 | 1 | - | - | - | 59 | 62 |
| Totals | 63 | 350 | 278 | 203 | 172 | 341 | 59 | 1,466 |
The next table shows, in the case of separation orders for 1973, the age of wife at separation and duration of marriage.
| Duration of Marriage, in Years | Age of Wife (in Years) at date of separation order | |||||||
|---|---|---|---|---|---|---|---|---|
| 16-19 | 20-24 | 25-29 | 30-34 | 35-39 | 40 and over | Not Known | Total | |
| Under 1 | 2 | 1 | - | 1 | - | - | - | 4 |
| 1 | 11 | 26 | 7 | 5 | - | 10 | 4 | 63 |
| 2 | 42 | 71 | 14 | 2 | 2 | 14 | 4 | 149 |
| 3 | 7 | 54 | 9 | 7 | 1 | 7 | 3 | 88 |
| 4 | 1 | 80 | 26 | 6 | 1 | 5 | 8 | 127 |
| 5 | - | 49 | 20 | 4 | 4 | 3 | 1 | 81 |
| 6 | - | 34 | 34 | 3 | 4 | 7 | 1 | 83 |
| 7 | - | 22 | 40 | 15 | 4 | 2 | 58 | 8 |
| 8 | - | 8 | 37 | 10 | 7 | 4 | 1 | 67 |
| 9 | - | 2 | 39 | 10 | 4 | 6 | 3 | 64 |
| 10-14 | - | - | 52 | 104 | 43 | 26 | 11 | 236 |
| 15-19 | - | - | - | 35 | 80 | 57 | 2 | 174 |
| 20-24 | - | - | - | - | 21 | 102 | 5 | 128 |
| 25 and over | - | - | - | - | - | 97 | 8 | 105 |
| Not known | 3 | - | 1 | 1 | 1 | 3 | 9 | |
| Totals | 63 | 350 | 278 | 203 | 172 | 341 | 59 | 1,466 |
The next table gives details as to the amounts of weekly maintenance ordered in 1973.
| Amount Ordered | Orders for Weekly Payments in Support of— | |||
|---|---|---|---|---|
| Wife only | Children only | Wife and Children | Total Orders | |
| $ | ||||
| Under 1 | 5 | - | 1 | 6 |
| 1 - 4 | 9 | 20 | 4 | 33 |
| 5 - 9 | 30 | 147 | 12 | 189 |
| 10 - 14 | 33 | 71 | 61 | 165 |
| 15 - 19 | 23 | 42 | 112 | 177 |
| 20 - 24 | 36 | 31 | 207 | 274 |
| 25 - 29 | 24 | 7 | 199 | 230 |
| 30 - 34 | 10 | 5 | 255 | 270 |
| 35 - 39 | 1 | 3 | 134 | 138 |
| 40 - 49 | 4 | 1 | 135 | 140 |
| 50 and over | 3 | 1 | 30 | 34 |
| Not known | - | - | - | (3) |
| Totals | 178 | 328 | 1,150 | 1,659 |
Numbers of children involved in custody orders granted in 1973 are given next.
| Item | Number of Children Involved | Total | ||||||||
|---|---|---|---|---|---|---|---|---|---|---|
| 1 | 2 | 3 | 4 | 5 | 6 | 7 | 8 | 9 | ||
| Number of orders | 423 | 440 | 265 | 131 | 53 | 30 | 11 | 2 | 1 | 1,356 |
| Total children | 423 | 880 | 795 | 524 | 265 | 180 | 77 | 16 | 9 | 3,169 |
The amount of weekly maintenance payments ordered in 1973 in the case of paternity orders are set out below:
| Amount | Number of Orders |
|---|---|
| $ | |
| Under 1 | 5 |
| 1-2 | 5 |
| 3-4 | 23 |
| 5-6 | 176 |
| 7-8 | 78 |
| 9-10 | 60 |
| 11-14 | 75 |
| 15-19 | 138 |
| 20-24 | 138 |
| 25-29 | 41 |
| 30-39 | 43 |
| 40-44 | 3 |
| Total orders | 785 |
POLICE—The Police Service in New Zealand is a national one maintained by Central Government. The law relating to its establishment and regulation is contained in the Police Act 1958.
Organisation—The national administrative and operational control of the Police Service is vested in a Commissioner who is responsible to the Government through a Minister of Police. His senior assistants at Police National Headquarters, Wellington, are his deputy, with responsibility for personnel and development, and a second Assistant Commissioner in charge of crime and operations.
Apart from criminal investigations and the normal police duties under the statutes, other functional responsibilities include crime prevention, youth aid, training, and coping with armed offenders.
For operational purposes New Zealand is divided into 16 police districts. Auckland district, by virtue of its greater population, is controlled by an assistant commissioner. Other districts, because of their varying size, are commanded by officers ranging in rank from chief inspector to chief superintendent.
Policing is maintained by a system of mobile patrols and foot ‘beats’ co-ordinated by an effective communications net which permits cohesion and direction of operations.
In addition to the enforcement of the criminal law and the Police Offences Acts, there are various statutes of a regulatory nature which the members of the Police are called upon to administer, wholly or partly, such as the Arms Act, Sale of Liquor Act, Gaming Act, Narcotics Act, Transport Act, Pawnbrokers Act, Secondhand Dealers Act. They also undertake certain inquiries and other duties on behalf of other departments of the Government service.
Police in country districts in some cases hold such additional appointments as registrars and bailiffs at Magistrates' Courts, probation officers, and honorary fishery officers.
Recruiting—Male recruits for the Police, for entry as constables, must be between the ages of 19 and 35 years. Cadets must be between the ages of 17 years and 18 years 3 months. Male recruits and cadets must have a height of not less than 5 ft 8 in. The term of cadetship at the Police Training School is 19 months and on successful completion of the course and on attaining the age of 19 years, cadets are appointed constables.
Female recruits, who enter as constables, must be between the ages of 20 and 33 years with a height of not less than 5 ft 5 in.
All candidates for entry into the Police must pass a departmental education pre-entry test and also a medical test. They must be of good character, smart, active, and intelligent. Selection is made only after exhaustive inquiries into the character, antecedents, and qualifications of the applicants. On appointment, male and female constable recruits undergo a 3 1/2 months' course of training at the Police College, Trentham, where they receive training in their powers and responsibilities as police officers, fitting them to deal with the situations which may be faced on duty.
Examinations are required to be passed for promotion to sergeant and senior sergeant and to commissioned rank. Promotion through the ranks of those qualified by examination is governed principally by merit, seniority being a deciding factor only when equality in merit exists.
Members who show an aptitude for detective duty are detailed for service in the Criminal Investigation Branch. Detectives are attached to each of the 16 district headquarters and to some of the larger outlying police stations, and they undertake duty, as required, in the investigation and detection of serious crime throughout the country.
Strength—The effective strength of the Police at 31 March 1974, inclusive of 116 women police, was 3,742 (3,210 Uniform Branch, 532 Criminal Investigation Branch).
Women Police—At 31 March 1974 the women police consisted of 2 senior sergeants, 2 sergeants, and 112 constables, and these were stationed in cities throughout New Zealand.
Women police are called upon to perform similar duties to male staff and have equal pay status and opportunity.
DEFENCE POLICY—The maintenance of defence forces and a defence potential in New Zealand are related to the support of broad national objectives. Some of these objectives are relatively fixed because they reflect unchanging basic factors, such as resources, geographical remoteness, and dependence on overseas trade. Others are the products of history or circumstances. The objectives of New Zealand's defence policy may be summed up as the preservation of the security, national interests, and independence of New Zealand; the provision of assistance to maintain the stability and security of New Zealand's partners; and the provision of material backing to political efforts to preserve peace through the United Nations or through regional arrangements. Defence policy has been elaborated in parliamentary papers A.19 in 1961, A.8 in 1966, and A.5 in 1972. International relationships are discussed in Section 2 of this Yearbook.
CONTROL AND CO-ORDINATION OF DEFENCE—The Governor-General as Commander-in-Chief is empowered to raise and maintain the Royal New Zealand Navy, the New Zealand Army, and the Royal New Zealand Air Force. These forces, together with public servants appointed under the State Services Act 1962, constitute the Ministry of Defence, which is responsible under the Minister for the central control of the whole field of national defence.
The Secretary of Defence is permanent head of the ministry and principal civilian adviser to the Minister, responsible in particular for co-ordinating the business of the ministry as a whole, including long-term financial planning as well as supervision of defence expenditure. In accordance with the State Services Remuneration and Conditions of Employment Act 1969, the Secretary of Defence prescribes the pay, allowances, expenses, and other conditions of employment of all servicemen and public servants in the ministry.
The Chief of Defence Staff is principal military adviser to the Minister; he is convenor and chairman of the Chiefs of Staff Committee and conveys its advice to the Minister. Like the Secretary of Defence, he carries out inspections of the services and reports to the Minister.
Command and Administration—The Defence Council is responsible for the administration and, through the officers appointed for the purpose, the command of the New Zealand armed forces. The Defence Council consists of the Minister as chairman, the Secretary of Defence and the Chief of Defence Staff as deputy chairmen, and the Chiefs of Staff of the three services. The Secretary to the Treasury and the Secretary of Foreign Affairs are associate members. In addition, the council may from time to time co-opt officers of other departments of State. Without limiting the duties of the Secretary of Defence or the Chief of Defence Staff, the Defence Council is responsible for advising the Minister on important matters of defence policy.
Roles of the New Zealand Armed Forces—The roles and missions of the New Zealand armed forces are related to the following tasks:
To provide regular forces for low intensity ground/air/naval operations in a variety of situations in our area of direct strategic concern.
To provide regular forces for maritime reconnaissance/surveillance patrols over New Zealand territory and the surrounding waters.
To maintain forces trained and available for use in a major emergency.
In addition, they discharge, wherever possible, a number of secondary roles, including:
Assistance to the New Zealand community.
The provision of mutual assistance, including technical aid to certain countries in Southeast Asia and the South Pacific.
Contributions to United Nations peace-keeping operations
Co-operation With Other Countries—To facilitate exchanges on military matters New Zealand defence liaison staffs are maintained in London, Canberra, Washington, Kuala Lumpur, Singapore, Indonesia and Thailand. In addition some members of these staffs are duly accredited to other countries. The United Kingdom, Australia and Malaysia have service representatives attached to their respective High Commissions in Wellington and there are service attaches on the staffs of the United States and French Embassies in Wellington. Several other countries have service attachés accredited to, but not resident in, New Zealand.
DEFENCE SCIENCE—The Defence Scientific Establishment is at Auckland and is particularly concerned with research in fields of concern to the Royal New Zealand Navy and the Royal New Zealand Air Force. The establishment also carries out metallurgical and other specialised studies related to the adaption of equipment to the New Zealand environment.
Cc-ordination of defence science policy is achieved through the Ministry of Defence, the Department of Scientific and Industrial Research, and the National Research Advisory Council. Commonwealth and allied co-ordination is achieved by membership of specialised bodies.
The Defence Scientific Establishment has been responsible for useful savings of foreign exchange, both in the rejection of faulty equipment as a result of metallurgical testings, and in enabling tasks previously carried out overseas to be undertaken in New Zealand. Electronic equipment produced by the Defence Scientific Establishment which has commercial potential has been made available to New Zealand industry for development and production and the work of defence scientists could result in the introduction into industry of new techniques bringing more economical production.
LEGISLATIVE AUTHORITY FOR THE ARMED SERVICES—The principal statutes governing the armed services are the Defence Act 1971 and the Armed Forces Discipline Act 1971. These rationalised command and provided the services with a common disciplinary code.
DEFENCE EXPENDITURE—Expenditure on defence in the 3 latest years ended 31 March was made up as follows.
| Item | 1971-72 | 1972-73 | 1973-74 |
|---|---|---|---|
| $(m) | $(m) | $(m) | |
| Personnel | 76.57 | 79.76 | 89.72 |
| Travel, transport, and communications | 3.82 | 4.94 | 5.26 |
| Maintenance, operation, upkeep, and rental | 6.26 | 7.85 | 8.74 |
| Material and supplies | 17.50 | 19.21 | 17.71 |
| Services | 2.58 | 2.81 | 2.99 |
| Other operating expenditure | 0.56 | 0.92 | 1.25 |
| Grants, contributions, subsidies | - | 0.08 | .05 |
| Capital works | 1.65 | 1.30 | 2.00 |
| Capital equipment | 12.23 | 12.95 | 12.78 |
| Totals | 121.17 | 129.82 | 140.51 |
About 77 percent of the Defence Vote is spent within New Zealand, mainly on salaries, capital works, servicing, and general operating costs, so that there is an important feedback into the economy. Attempts are being made to become more self-supporting logistically.
The memorandum of understanding signed in 1969 between the governments of Australia and New Zealand provides, in effect, for the establishment of an Australian and New Zealand defence production community and has as its aim the maximum reciprocity in defence procurement. Opportunities have thus been opened to New Zealand manufacturers not only in a wider market, but also in the identification of new industrial technologies. Since the signing of the memorandum there has been a small, but steady growth of orders placed in New Zealand for Australian defence requirements. Defence production in New Zealand will promote the enforcement of high standards of quality control to suit the exacting standards demanded by service requirements. The consequent upgrading of technology and industrial skill should be significant.
The industrial spin-off from defence spending will depend in large measure on the response of New Zealand manufacturers to the opportunities provided by the memorandum of understanding with Australia. Should these opportunities be taken, new technological skills will be introduced and the base of manufacturing industry will be broadened with a consequent improvement in the capacity to compete in export markets.
Defence expenditure is related to Government expenditure and gross national product in the following table.
| Year Ended 31 March | Defence Expenditure | Percentage of Government Expenditure* | Percentage of Gross National Product |
|---|---|---|---|
| *Excludes repayment of public debt. | |||
| $(m) | percent | percent | |
| 1964 | 58.50 | 5.4 | 1.8 |
| 1965 | 73.94 | 6.3 | 2.1 |
| 1966 | 81.20 | 6.3 | 2.1 |
| 1967 | 88.58 | 6.4 | 2.3 |
| 1968 | 87.11 | 6.2 | 2.1 |
| 1969 | 85.34 | 5.9 | 2.0 |
| 1970 | 89.72 | 5.7 | 1.9 |
| 1971 | 109.07 | 5.8 | 2.0 |
| 1972 | 121.17 | 5.6 | 1.9 |
| 1973 | 129.82 | 5.1 | 1.8 |
| 1974 | 140.51 | 6.0 | 1.9 |
STRENGTH OF DEFENCE SERVICES—The following table gives the strengths of the regular forces of the three services over the last 11 years.
| As at 31 March | Navy | Army | Air Force | Total |
|---|---|---|---|---|
| 1964 | 3,035 | 5,559 | 4,338 | 12,932 |
| 1965 | 2,976 | 5,374 | 4,390 | 12,740 |
| 1966 | 2,922 | 5,549 | 4,381 | 12,852 |
| 1967 | 2,934 | 5,620 | 4,378 | 12,932 |
| 1968 | 2,912 | 5,840 | 4,485 | 13,237 |
| 1969 | 2,935 | 5,730 | 4,498 | 13,163 |
| 1970 | 2,975 | 5,782 | 4,530 | 13,287 |
| 1971 | 2,941 | 5,638 | 4,413 | 12,992 |
| 1972 | 2,966 | 5,449 | 4,222 | 12,637 |
| 1973 | 2,972 | 5,498 | 4,319 | 12,789 |
| 1974 | 2,845 | 5,553 | 4,232 | 12,630 |
THE ROYAL NEW ZEALAND NAVY—The Government in New Zealand has since the earliest days made provision for naval forces in its defence measures. Royal naval vessels regularly visited New Zealand waters, but these were soon supplemented by a number of Government-owned vessels, the first of which was the Australia, a schooner purchased from India in 1842. In addition, in 1877 the New Zealand Government began regular financial contributions towards maintaining Royal naval ships in New Zealand waters. In 1921 the naval forces became the New Zealand Division of the Royal Navy, and in 1941 they became the Royal New Zealand Navy.
Command and Administration—The Chief of Naval Staff exercises command and control of the Royal New Zealand Navy assisted in the performance of his functions by the naval staff as well as the integrated staff of Defence Headquarters.
State of the Navy—Her Majesty's New Zealand ships, as at 30 September 1974 were:
| †On loan from U.S Navy | ||
|---|---|---|
| Frigate (Leander class) | Waikato | One frigate on station in the Malaysia/Singapore area as part of the NZFORSEA national force. The remaining ships in commission are normally employed on exercises in New Zealand and overseas and undertake visits around New Zealand and the South Pacific, and to foreign ports. |
| Canterbury | ||
| Frigates (Otago class) | Otago | |
| Taranaki | ||
| Survey ship | Monowai | |
| Research ship | Tui† | |
| Ocean minesweepers | Kiama | Training and fishery protection. (Kiama—Operational Reserve). |
| Inverell | ||
| Motor launches | Ten | Fishery protection, training, survey work, harbour duties, RNZNVR Divisions. |
| Patrol Craft | Five | |
| Patrol Craft | Five | Fishery protection. |
The naval base at Devonport, Auckland, consists of the office of the Commodore Auckland (the administrative authority of the RNZN), HMNZS Philomel (the naval barracks and training establishment), the Royal New Zealand Naval Hospital, the Naval Supply Depot, and dockyard.
The dockyard is under the charge of a captain superintendent and is capable of refitting ships up to light cruisers. The RNZN Armament Depot is situated at Kauri Point and the RNZN Hydrographic Office is at Takapuna.
HMNZS Tamaki is the new entry seamanship and artificer apprentice training establishment for the Navy and is located at Narrow Neck, Devonport, Auckland. HMNZS Iriangi is the naval radio receiving and transmitting station and is situated at Waiouru.
HMNZS Wakefield is the administrative unit for RNZTN personnel in the Wellington area. Strength of the Navy—The strength of the Navy was as follows:
| Category | At 31 March 1972 | At 31 March 1973 | At 31 March 1974 |
|---|---|---|---|
| Regular Forces— | |||
| Officers (male and female) | 292 | 295 | 299 |
| Ratings | 2,578 | 2,580 | 2,446 |
| WRNZNS ratings | 96 | 97 | 100 |
| Total | 2,966 | 2,972 | 2,845 |
| Non-regular Forces— | |||
| Royal New Zealand Naval Reserve officers | 6 | 6 | 5 |
| Royal New Zealand Naval Volunteer Reserve all ranks | 273 | 295 | 263 |
| Royal New Zealand Naval Fleet Reserve ratings | 2,225 | 2,191 | 2,401 |
Women's Royal New Zealand Naval Service—The Women's Royal New Zealand Naval Service was first formed in 1942 as a wartime service. In 1949 the WRNZNS became a permanent part of the Royal New Zealand Navy. Employment of members of the WRNZNS is varied and includes duties as cooks, stewards, writers, shorthand typists, motor-transport drivers, and teleprinter operators.
Royal New Zealand Naval Volunteer Reserve—There is a division of the Royal New Zealand Naval Volunteer Reserve in each of the four main centres—Auckland, Wellington, Christchurch, and Dunedin—where reservists are given the basic elements of naval training.
THE ARMY—The New Zealand Army is raised, maintained, and organised under the authority of the Defence Act 1971, and the policy outlined in the Defence White Paper 1972. It comprises a Regular Force, Territorial Force, and the Army Reserves.
Personnel are posted to one of the following corps: Artillery, armour, engineers, signals, infantry, special air service, army air, army service, medical, dental, nursing, ordnance, electrical and mechanical engineers, chaplains, pay, legal service, provost, army education, or women's royal army corps.
Command and Administration—The Chief of General Staff exercises command and administration of the Army assisted in the performance of his functions by the general staff as well as the integrated staff of Defence Headquarters.
Organisation—In New Zealand the Army is organised into two commands, each with a functional responsibility nationwide, and is directly responsible to Defence Headquarters for the performance of its functions:
Home Command—Provides the home support for the Army in New Zealand. This involves the administration, maintenance, development and control of all Army land, buildings, equipment, vehicles, and training facilities; the preparation and conducting of training courses, promotion courses and examinations for all Army personnel; recruiting policy implementation; development of a progressive welfare policy for the Army; provision of financial support and advice as required.
(b) Field Force Command—Commands and administers those elements of the Army in New Zealand which have an operational role in the event of mobilisation, i.e., 1 Infantry Brigade Group, 3 Infantry Brigade Group, and Logistic Support Group.
Units and staff deployed overseas remain under national command.
Strength of the Army—The strength of the Army was as follows:
| Category | At 31 March 1972 | At 31 March 1973 | At 31 March 1974 |
|---|---|---|---|
| Regular Forces— | |||
| Officers (male and female) | 741 | 742 | 733 |
| Other ranks | 4,544 | 4,581 | 4,612 |
| RNZNC and NZWRAC (other ranks) | 163 | 200 | 208 |
| Total | 5,449 | 5,498 | 5,553 |
| Non-regular Forces— | |||
| Territorial Force (all ranks) | 11,405 | 3,155 | 4,903 |
| Officers Reserve | 864 | 601 | 616 |
| Class A Reserve Other ranks | 4,689 | 4,725 | 2,755 |
| Class B Reserve | 2,076 | 1,983 | 2,048 |
THE ROYAL NEW ZEALAND AIR FORCE—The Royal New Zealand Air Force was constituted as a separate armed service by the Air Force Act 1937 and its administration was vested in an Air Department which was responsible for military aviation and the regulation of civil aviation in New Zealand. With the passing of the 1964 Defence Act the Air Department was absorbed into the Ministry of Defence.
Command and Administration—The Chief of Air Staff exercises command and administration of the Royal New Zealand Air Force assisted in the performance of his functions by the air staff as well as the integrated staff of Defence Headquarters.
Organisation—The RNZAF consists of: (a) the Regular Air Force; (b) the Territorial Air Force; (c) the Air Force Reserve.
There are six RNZAF bases, all located in New Zealand. The RNZAF is divided into two groups namely, Operations Group which has responsibility for the operational functions of the RNZAF, and Support Group which is responsible for all RNZAF training and certain support functions, Headquarters Operations Group is at RNZAF, Auckland, and Headquarters Support Group at RNZAF, Wigram. In addition, the RNZAF provides support for the search and rescue organisations in New Zealand and the South Pacific area.
The operational units of the RNZAF comprise: a medium/short-range transport squadron based in Singapore and forming part of New Zealand force South-East Asia; maritime, long and medium range transport and helicopter squadrons based at RNZAF Auckland; and a ground attack squadron, a jet operation conversion squadron, and a communication transport squadron at RNZAF, Ohakea.
Technical Services—The technical branch of the RNZAF consists of aircraft, armament, and radio divisions. Technical direction of RNZAF engineering services is co-ordinated by Air Staff. Defence Headquarters. Specific levels of aircraft maintenance are assigned to bases and squadrons. A range of overhaul and repairs and some manufacture of aeronautical equipment is carried out at No. 1 Repair Depot, RNZAF Base, Woodbourne. A proportion of repair and overhaul work is contracted to civil industry in New Zealand and overseas.
Supply Support—Spares and equipment required by the RNZAF are provided through the support branch of Defence Headquarters, which is also responsible for the control and administration of catering and movements. The main sources of supply for technical spares equipment are the RAF, the USAF and the USN.
Strength of the Air Force—The strength of the RNZAF was as follows:
| Category | At 31 March 1972 | At 31 March 1973 | At 31 March 1974 |
|---|---|---|---|
| Regular Forces— | |||
| Offices (male and female) | 700 | 713 | 704 |
| Airmen (male and female) | 3,290 | 3,320 | 3,225 |
| WRNZAF—airwomen | 232 | 286 | 303 |
| Totals | 4,222 | 4,319 | 4,232 |
| Non-regular Forces— | |||
| Territorial Air Force | 116 | 118 | 142 |
| Active Reserve | 507 | 464 | 442 |
| General Reserve | 1,005 | 933 | 849 |
New Zealand Cadet Forces—A reorganisation of the non-regular forces, commenced in 1970, was embodied in Part III of the Defence Act 1971. The Act established the New Zealand Cadet Forces, in their own right and not as parts of the armed forces as before.
The Act authorises the Defence Council to raise and maintain elements of the sea cadets, school cadets and air training corps and also to allocate funds exclusively for the support of cadet activities as distinct from those of the armed forces. Civil sponsoring bodies for the cadet forces, recognized by the Act, which share responsibility for the corps with the Ministry of Defence are the Navy League of New Zealand, the Air Cadet League, and the Dominion Council of the Returned Services Association. The conditions and limitations of Government support given in the Act now show the cadet forces as a youth and leadership scheme operating under the auspices of the Ministry of Defence.
The strength of the New Zealand Cadet Forces as at 31 March 1974 was 9,460. There was a sea cadet corps of 15 open units and 9 school units, a school cadet corps of 24 school units and an air training corps of 41 open and 11 school units.
ARMED FORCES OVERSEAS: Five Power Defence Arrangements—The Anglo-Malaysian Defence Agreement, under which New Zealand had maintained forces in Malaysia as part of a Commonwealth Strategic Reserve, was terminated on 1 November 1971. It was replaced by the five power defence arrangements, by which Australia, New Zealand, and the United Kingdom separately concluded agreements with Malaysia and Singapore. Within the framework of these arrangements, and at the request of the governments of Malaysia and Singapore, the three first-mentioned nations have agreed to station elements of their armed forces in these countries. To facilitate effective control and direction and to ensure efficient and economical logistic support, these forces were grouped into an ANZUK force. However, the decision by Australia in 1973 to withdraw a substantial portion of its ground forces from the region provided New Zealand with the opportunity to establish a separate national headquarters for its forces in South-east Asia. As a result, on 31 January 1974 command of the New Zealand elements of the ANZUK force was transferred to a New Zealand commander. New Zealand's contribution to the stability of the area then comprised a frigate, an infantry battalion, an air transport squadron, and sundry supporting units.
United Nations Observers—At the request of the Secretary-General of the United Nations, New Zealand has provided military observers in United Nations truce supervisory operations in Kashmir since 1951 and in the Middle East since 1954. The number of observers in Kashmir has been four. except for the period of hostilities in mid-1965 when, for a short time, New Zealand provided nine officers. The number of observers in the Middle East has varied between two and seven. In 1973 there were five New Zealand observers in the area.
Mutual Assistance Overseas:Malaysia and Singapore—New Zealand has since 1964 undertaken a programme of defence aid to Malaysia and Singapore. Armed forces students from both countries are being trained in New Zealand.
Indonesia and Papua - New Guinea—New avenues are being explored for the establishment of bilateral co-operation. Indonesian officers have been given training in New Zealand whilst New Zealand dental officers have undertaken a series of lectures at the Armed Forces Dental Institute at Jakarta. New Zealand officers are also attached as instructors to the PNG Joint Services College at Lae.
Fiji—Apprenticeship and other trade training is provided for Fiji military forces personnel in New Zealand. In addition, New Zealand personnel have been attached to the Royal Fijian Military Forces to assist in the establishment of trade training schools and in the administration of the RFMF. Relief assistance in the form of RNZAF transport, construction materials, and several RNZE detachments was also given to Fiji and the Gilbert and Ellice Islands following Hurricane Bebe in November 1972.
Tonga—A New Zealand Army officer is seconded as commander of the Tonga Defence Force. Cadets and NCOs are given technical training and other courses of instruction at New Zealand Army schools. Officers from the marine detachment of the Tonga Defence Force have been given training relating to the operation and maintenance of fishery protection vessels.
Cook Islands—A combined Army, RNZAF, and Ministry of Works and Development team have studied the feasibility of reconstructing a harbour on the islands. As a result Army engineers, assisted by RNZAF transport, were deployed in June 1974 to reconstruct harbour facilities at Atiu.
Antarctica Support—New Zealand activities in Antarctica rely heavily on logistic support coordinated with the United States. The main defence contribution is related to the provision of RNZAF transport flights to McMurdo assisted by a mobile air movements team and Army cargo handlers. Both helicopter and transport aircrew are also assigned for duty with the United States forces.
Other Assistance in the Community: Hydrographic Survey—A survey completed in 1974 of the north-east coast of the North Island enabled all charts based on 1850 era surveys to be replaced. Other smaller surveys were carried out in Doubtful, Dusky, and Breaksea Sounds and Bluff Harbour.
Surveys of harbours, consequent upon major constructional work, were also carried out at Asau in Western Samoa and Avatiu in Rarotonga.
Fishery Protection—Five motor launches patrol the whole of New Zealand's east coast and also provide transport and logistic assistance to other Government departments, mainly to support wildlife surveys on off-shore islands.
Search and Rescue—All three services support the civil defence and search and rescue organisations. During the period March 1973 to April 1974 nearly 450 hours were flown by RNZAF aircraft on 60 search and rescue tasks. These included casualty flights from New Zealand to Rarotonga, Penrhyn Island, and Norfolk Island. The Army participated in 13 search and rescue operations during that period, while ships of the RNZN have also been instrumental in the rescue of small pleasure craft.
Miscellaneous—Other assistance provided to the community ranges from airborne surveillance of foreign fishing vessels to fire-fighting and co-operative tasks with the Forest Service and Meteorological Service; explosive ordnance disposal; relief aid to farmers; and participation in pageantry and ceremonial occasions.
STRENGTHS OF ARMED SERVICES IN WAR: South African War—Approximately 6,500 troops from New Zealand served in the South African War.
First World War, 1914-18—A total of 124,211 persons (including 91,941 volunteers) were called up for overseas and home service prior to 12 November 1918. Of these, 100,444 went overseas. This total comprised 98,950 troops serving with the New Zealand Expeditionary Forces in the European, Mediterranean, or Samoan areas; 550 nurses; and 944 others (including 211 British Army reservists, 541 naval personnel, and 192 Royal Flying Corps personnel). In addition, it was known that 3,370 (not included above) left New Zealand and enlisted in British and Australian forces, while others (exact numbers unknown) are known to have joined Canadian and South African forces.
At Armistice date in November 1918 New Zealand had over 56,000 troops overseas, and a further 10,000 were ready to embark or in training.
The troops provided for overseas service represented nearly 10 percent of the total population of New Zealand in 1914 and over 40 percent of the male population between the ages of 20 and 45 years. These percentages do not take into account New Zealanders who served in the British or Australian naval or military forces.
Second World War, 1939-45—Approximately 60,000 men volunteered for service in the New Zealand forces in the Second World War before conscription was introduced in July 1940.
The net intake of men to the armed forces—i.e., exclusive of transfers between the services and of re-entries—was 194,000, equivalent to 67 percent of the male population between the ages of 18 and 45 years. In addition, approximately 10,000 women served in the forces. It is estimated that approximately 140,000 persons served overseas.
A total of 104,988 Army personnel served overseas with the Second New Zealand Expeditionary Force, and, of these 99,343 (97,893 males and 1,450 females) left New Zealand on or before 15 August 1945, and 5,645 (5,491 males and 154 females) left New Zealand on or after 16 August 1945. (Some detailed tables are given on pages 269-271 of the 1956 issue of the Yearbook.)
CASUALTIES ON ACTIVE SERVICE—The following table gives particulars of casualties suffered on active service by members of the armed forces in the wars listed. For the Second World War the figures shown include New Zealand personnel serving with the Royal Navy and Royal Air Force. Deaths and injuries due to accidental causes while on active service are included in the figures of deaths and wounded respectively. The number shown as “missing” refers to the number so classified at the end of the period quoted.
| — | Deaths (Including Died as Prisoner of War) | Wounded and Injured | Prisoners of War | Wounded and Taken Prisoner of War | Interned | Missing | Total |
|---|---|---|---|---|---|---|---|
| South African War, 1899-1902 | 228 | 166 | - | - | - | - | 394 |
| First World War, 1914-18 (up to 12 November 1918) | 16,317 | 41,262 | 356 | - | - | 84 | 58,019 |
| Second World War, 1939-45 (up to 31 December 1946) | 11,625 | 15,749 | 7,218 | 1,251 | 149 | 46 | 36,038 |
| Jayforce (up to December 1948) | 11 | - | - | - | - | - | 11 |
| Korea (up to December 1954) | 39 | 81 | 1 | - | - | - | 121 |
| Malaya (up to September 1960) | 15 | 23 | - | - | - | - | 38 |
| Vietnam (up to 31 December 1972) | 35 | 187 | - | - | - | - | 222 |
AWARDS FOR GALLANTRY—Awards for gallantry made to New Zealand servicemen are shown in the following table.
| Award | Boer War | World War 1 | World War 2 | Korea | Malaya Borneo | Vietnam | Totals |
|---|---|---|---|---|---|---|---|
| Victoria Cross | 1 | 11 | 8 | - | - | - | 20 |
| Bar to V.C. | . | - | 1 | - | - | - | 1 |
| Distinguished Service Order | 8 | 141 | 197 | - | 1 | - | 347 |
| First Bar to D.S.O. | - | 8 | 28 | - | - | - | 36 |
| Second Bar to D.S.O. | - | - | 1 | - | - | - | 1 |
| Third Bar to D.S.O. | - | - | 1 | - | - | - | 1 |
| Distinguished Service Cross | - | - | 95 | 5 | 1 | - | 101 |
| First Bar to D.S.C. | - | - | 8 | 1 | - | - | 9 |
| Second Bar to D.S.C. | - | - | 1 | 1 | - | - | 1 |
| Military Cross | - | 530 | 256 | 11 | 5 | 10 | 812 |
| Bar to M.C. | - | 25 | 13 | - | - | - | 38 |
| Distinguished Flying Cross | - | - | 1,015 | - | 3 | 8 | 1,026 |
| First Bar to D.F.C. | - | - | 80 | - | - | - | 80 |
| Second Bar to D.F.C. | - | - | 4 | - | - | - | 4 |
| Distinguished Conduct Medal | 21 | 393 | 108 | 1 | - | 4 | 527 |
| Bar to D.C.M. | - | 4 | 1 | - | - | - | 5 |
| Conspicuous Gallantry Medal | - | - | 6 | - | - | - | 6 |
| Distinguished Service Medal | - | - | 35 | 2 | 1 | - | 38 |
| Military Medal | - | 2,066 | 592 | 7 | 3 | 4 | 2,672 |
| Bar to M.M. | - | 62 | 1 | - | - | - | 63 |
| Distinguished Flying Medal | - | - | 179 | - | - | - | 179 |
| Bar to D.F.M. | - | - | 1 | - | - | - | 1 |
PERSONS WITH OVERSEAS WAR SERVICE—Census statistics on overseas war service are now given.
| War | 1966 | 1971 | ||||
|---|---|---|---|---|---|---|
| Males | Females | Total | Males | Females | Total | |
| Overseas service— | ||||||
| Second World War | 143,360 | 5,758 | 149,118 | 133,166 | 7,317 | 140,483 |
| First World War | 34,300 | 787 | 35,087 | 25,014 | 912 | 25,926 |
| Japan, Korea, Malaya or Vietnam | .. | .. | .. | 21,610 | 345 | 21,955 |
War veterans at the 1971 census were concentrated in specific age groups: 34.9 percent of the veterans who served overseas in the First World War were aged 70-74 years and 63.0 percent were aged 75 years and over; 27.2 percent of the veterans who served overseas in the Second World War were aged 45-49 years; 29.9 percent were aged 50-54 years and 20.4 percent were aged 55-59 years.
PERSONS WITH WAR SERVICE IN NEW ZEALAND ONLY—In 1971 there were 53,265 males and 7,399 females in New Zealand who had been mobilised in the Second World War for at least 28 days in home service only; comparative figures in 1961 were 92,022 males and 8,318 females.
CIVIL DEFENCE—In 1959, a Ministry of Civil Defence was established within the framework of the Department of Internal Affairs, and three regional commissioners were appointed to implement Central Government policy within their regions. For civil defence purposes, the North Island was divided into two regions and the South Island formed a third region.
The Civil Defence Act 1962 put into legislative form the concept and machinery of a national civil defence scheme. It provided for the formation of national and regional civil defence committees, advisory planning committees, the appointment of a secretary for civil defence, and a director and deputy director of civil defence.
Various planning committees have been established and are responsible for formulating national civil defence plans for consideration by the National Civil Defence Committee prior to being submitted to the Minister of Civil Defence, who is given power under the Civil Defence Act to approve them as national plans.
These national plans indicate resources available, the particular requirements to be incorporated in regional and local authority plans, and basic procedures for action in a civil defence emergency for communications, fire fighting services, law and order, medical arrangements, public relations, supply and services, traffic control, transport, and welfare and evacuation. A plan for Government Action in Major Disaster outlines the role of Central Government and of individual Government departments.
The preparation of local civil defence plans and the establishment and training of an organisation to implement such plans and make them functional is the responsibility of local authorities. Every local authority is required by the Civil Defence Act to have an operational civil defence plan. The plan must be approved by the Ministry of Civil Defence and up-dated as changes in national plans or conditions in the area affect it.
The Ministry of Civil Defence assists local authorities by conducting training and other courses for their key personnel and also makes officers available to help them run their own courses. Training manuals and operational forms for use by local authorities are supplied by the ministry. The Government pays a $1 for $1 subsidy on certain categories of civil defence expenditure by local authorities. Examples are salaries of civil defence staff and cost of radio equipment, erection of civil defence headquarters, training equipment, first aid training, etc.
There is provision in the Civil Defence Act for the recruitment and training of civil defence police and traffic officers. During a civil defence emergency these recruits are employed on the more routine duties thus releasing the highly trained permanent personnel for more important duties related to the situation. The establishment of civil defence police and traffic officers are 3,500 and 2,000 respectively.
SECURITY INTELLIGENCE SERVICE—The New Zealand Intelligence Service Act 1969 gave statutory recognition to the Security Service which was established on 28 November 1956. Subject to the control of the Minister in charge of the service, functions of the New Zealand Security Intelligence Service are to obtain, correlate, and evaluate intelligence relevant to security and, as appropriate, to advise Ministers on matters relevant to security. It is not a function of the Security Intelligence Service to enforce measures for security. Offences under the Act include subversion, espionage, and sabotage. There is a commissioner of security appeals.
REGISTRATION OF LAND OWNERS—Practically all title to privately-owned land and interests in land in New Zealand is held under the land transfer system administered under the Land Transfer Act 1952. This system was introduced into New Zealand in 1870 and was based largely on the Torrens system of registration of title devised for South Australia.
This land transfer system provides a simple and cheap method of recording the transfer and other dealings with land and at the same time to ensure security of title by a system of State guarantee. The mechanics of recording dealings are provided by the creation of a register, each folio of which is an office duplicate of the owner's title. The folio or title has recorded on it full particulars of the proprietorship to the land, together with any changes which occur through transfer, death, or other devolution, and the encumbrances to which the land becomes subject. The cardinal principle of the Land Transfer Act is that the register is everything and that the purchaser gets, upon the registration of a transfer, an indefeasible title against the world.
When national or district schemes for drainage, irrigation, water supply, or sewerage which result in improvement to land are undertaken, statutory authority is customarily given to charge part of the cost against the land. These charges are recorded against the titles concerned.
Special procedures are necessary for the registration of dealings with Crown land and Maori land and these are contained in the Land Act 1948, the Maori Affairs Act 1953, and the various related Acts respectively.
The Joint Family Homes Act 1964 provides for settlements of land as “joint family homes” and wide use is made of this procedure year by year. (See Section 19.)
Certificates of Title Issued—The following table shows the number of certificates issued for the latest 12 years.
| Year Ended 31 March | Total |
|---|---|
| 1963 | 29,724 |
| 1964 | 30,076 |
| 1965 | 35,258 |
| 1966 | 39,760 |
| 1967 | 42,692 |
| 1968 | 46,118 |
| 1969 | 42,669 |
| 1970 | 37,525 |
| 1971 | 41,639 |
| 1972 | 39,270 |
| 1973 | 44,779 |
| 1974 | 45,932 |
MAORI LANDS—Before European settlement, all the land in the country was held by the various groups and tribes of the Maori people in accordance with their traditional customs and usages, and the land so held was described as Maori customary land. By the Treaty of Waitangi the exclusive rights to purchase such land was reserved to the Crown. Practically all of the land which was formerly Maori customary land has now been converted to other forms of title by one or other of the following processes:
Purchase or other acquisition by the Crown (from whom in turn the European colonists obtained land for farms, etc.).
The issue of a Crown grant to a Maori owner on the recommendation of the Maori Land Court.
The issue of a freehold order by the Maori Land Court in favour of the Maori or Maoris found entitled upon an investigation of title. This process was used instead of process (b) after the introduction of the land transfer system into New Zealand.
Land which was included in titles issued under processes (b) and (c) became known as Maori freehold land.
Maori freehold land becomes Crown land if all interests in it are purchased or otherwise acquired by the Crown, or becomes European land when bought or inherited by a person of less than half Maori blood, or is declared to be so by the Maori Land Court.
Maori Land Court—The Maori Land Court consists of a Chief Judge and such other judges as the Governor-General may from time to time appoint. It is a Court of Record and its general function is to deal with problems peculiar to multiple ownership of Maori lands including the partitioning and combining of titles for better utilisation, the effecting of exchanges, directing the holding of meetings of owners, and confirming or disallowing resolutions passed by such meetings, confirming sales, and making other miscellaneous orders.
The Maori Appellate Court consists of any two or more Judges of the Maori Land Court, provided that two Judges at least shall concur in every decision of the court. With certain exceptions, the Appellate Court determines appeals, whether on law or on fact, from all final orders of the Maori Land Court.
During 1973-74 the Maori Land Court conducted 75 sittings throughout New Zealand and dealt with some 8,863 applications, from which a total of 25,538 orders were made.
ACQUISITION OF LAND—Safeguards have been made for long-term planning in the use of land, whether publicly or privately owned, in order to ensure that it and its resources are used to the best advantage of the community as a whole. Legislation introduced in 1968 and 1969 (by amendment to the Land Settlement Promotion and Land Acquisition Act 1952) prevents, where there is an operative regional planning or proposed or operative district scheme, the acquisition by overseas interests of land of 4,000 sq metres or over designated or zoned as reserves for recreation or other purposes, and all islands or parts of islands within 150 kilometres of the mainland, and the Chatham Islands. The legislation covers rural and farm land of 2 hectares or over. Here a purchase may be approved if specified conditions, directed to ensuring beneficial use of the land from a national viewpoint, or permanent future residence, are met.
The court shall grant its consent where the purchaser or lessee is a person ordinarily resident in New Zealand, i.e., who has resided in New Zealand for 2 1/2 years and the court is satisfied that he intends to continue to reside in New Zealand. Where the purchaser or lessee is not a person ordinarily resident in New Zealand or is an overseas company, the court shall not grant its consent unless it is satisfied that the land is not required for any reserve purpose and that the land is not an island or forms part of the Chatham Islands. In the case of farm land, the court must be assured that the purchaser or lessee intends to conduct experimental or research work on the land which will benefit agricultural industries in New Zealand or the community generally, or that the land will be used for purposes other than agricultural with greater advantage to the community, or in the case of an individual that he intends to reside permanently in New Zealand and farm the land exclusively for his own use and benefit and has the ability and means to do this.
Part I of the Land Settlement Promotion and Land Acquisition Act authorises the Minister of Lands to take in certain circumstances any farm land that is suitable for settlement, and is, or when subdivided and developed will be, capable of substantially increased production.
Part II deals with the control of sales and also leases (for 3 years or more) of farm land to prevent undue aggregation. The consent of the court is required unless the purchaser or lessee owns no farm land, has no interest in any estate or trust owning from land, has not since the passing of the Act transferred any farm land to any person as trustee or created any trust in respect of farm land, and has entered into the transaction solely on his own behalf.
The Act prevents the purchase of farm land, without the consent of the court, by a trustee for any person under the age of 17 years, or the purchase by a company or trustee for a company to be formed where the shareholders are fewer than 10 in number and any member of such company is under the age of 17 years (or where shares will be held in trust for any person under that age at the date of the transaction).
LAND TRANSFERS—The following table shows transfers registered under the Land Transfer Act during the latest 11 years. (1 hectare = 2.47 acres.)
| Year Ended 31 March | Urban Properties | Rural Properties | All Properties: Total Consideration | ||||||
|---|---|---|---|---|---|---|---|---|---|
| Number | Area | Consideration | Freehold | Total Freehold and Leasehold | |||||
| Number | Area | Consideration | Number | Consideration | |||||
| hectares | hectares | ||||||||
| $(m) | (000) | $(m) | $(m) | $(m) | |||||
| 1964 | 51,942 | 6,706 | 299.1 | 7,269 | 525 | 111.0 | 7,894 | 120.8 | 419.9 |
| 1965 | 59,983 | 7,368 | 362.7 | 8,642 | 643 | 156.6 | 9,565 | 173.5 | 536.2 |
| 1966 | 61,581 | 7,426 | 394.0 | 9,281 | 631 | 185.3 | 9,927 | 198.6 | 592.6 |
| 1967 | 59,151 | 6,166 | 394.0 | 8,914 | 644 | 184.0 | 9,488 | 195.2 | 589.2 |
| 1968 | 55,820 | 5,710 | 390.5 | 7,566 | 451 | 141.2 | 8,105 | 151.4 | 541.8 |
| 1969 | 57,854 | 5,621 | 426.4 | 7,329 | 505 | 141.2 | 7,801 | 150.1 | 576.5 |
| 1970 | 63,728 | 6,506 | 530.7 | 8,480 | 574 | 184.1 | 8,896 | 193.7 | 724.4 |
| 1971 | 74,020 | 7,122 | 701.7 | 9,080 | 628 | 205.0 | 9,590 | 217.3 | 918.9 |
| 1972 | 76,543 | 7,442 | 786.8 | 9,106 | 514 | 190.0 | 9,499 | 198.6 | 985.4 |
| 1973 | 94,015 | 8,855 | 1,068.0 | 10,760 | 620 | 260.6 | 11,178 | 271.9 | 1,339.9 |
| 1974 | 110,732 | 10,862 | 1,641.4 | 14,494 | 897 | 470.9 | 15,064 | 491.6 | 2,133.0 |
Price levels as measured by the farm land sale prices index, continued to rise with the rate of increase in all districts being much greater than in 1972. The change in the average level of prices showed a 24.8 percent increase over the whole country.
For urban transfers, in the four main regions in 1973, the highest average sale prices for sections and houses were in Christchurch and Wellington respectively. The average sale prices for sections and houses respectively were as follows: Auckland $5,600 and $19,349, Wellington $5,852 and $20,510, Christchurch $6,386 and $16,755, Dunedin $2,798 and $12,210.
Urban Land Transfers—The following table shows urban land transfers by consideration group for March years.
| Consideration Group | Freehold | Leasehold | All Urban Transfers | ||||||
|---|---|---|---|---|---|---|---|---|---|
| Number | Total Consideration | Average Consideration | Number | Total Consideration | Average Consideration | Number | Total Consideration | Average Consideration | |
| $ | $(million) | $(000) | $(million) | $(000) | $(million) | $(000) | |||
| 1972-73 | |||||||||
| Under 2,000 | 10,891 | 53.1 | 1.2 | 330 | 0.3 | 1.0 | 11,221 | 13.4 | 1.2 |
| 2,000- 2,999 | 7,619 | 18.1 | 2.4 | 113 | 0.3 | 2.3 | 7,732 | 18.4 | 2.4 |
| 3,000- 3,999 | 5,879 | 20.0 | 3.4 | 96 | 0.3 | 3.3 | 5,975 | 20.2 | 3.4 |
| 4,000- 9,999 | 23,990 | 161.1 | 6.7 | 403 | 2.8 | 7.0 | 24,393 | 183.9 | 6.7 |
| 10,000- 19,999 | 32,882 | 456.2 | 13.9 | 527 | 7.1 | 13.5 | 33,409 | 463.3 | 13.9 |
| 20,000- 49,999 | 9,901 | 265.7 | 26.8 | 154 | 4.2 | 27.6 | 10,055 | 269.9 | 26.8 |
| 50,000-199,999 | 1,110 | 87.8 | 59.1 | 32 | 2.5 | 79.3 | 1,142 | 90.4 | 79.1 |
| 200,000 and over | 79 | 26.0 | 329.0 | 9 | 2.5 | 282.7 | 88 | 28.5 | 324.2 |
| All groups | 92,351 | 1,047.9 | 11.3 | 1,664 | 20.1 | 12.1 | 94,015 | 1,068.0 | 11.4 |
| 1973-74 | |||||||||
| Under 2,000 | 10,303 | 12.3 | 1.2 | 230 | 0.2 | 1.0 | 10,533 | 12.6 | 1.2 |
| 2,000- 2,999 | 6,685 | 15.9 | 2.4 | 120 | 0.3 | 2.4 | 6,805 | 15.2 | 2.4 |
| 3,000- 3,999 | 5,887 | 19.9 | 3.4 | 92 | 0.3 | 3.3 | 5,979 | 20.2 | 3.4 |
| 4,000- 9,999 | 23,153 | 151.1 | 6.5 | 418 | 2.8 | 6.8 | 23.571 | 153.9 | 6.5 |
| 10,000- 19,999 | 37,743 | 554.8 | 14.7 | 635 | 9.0 | 14.2 | 38,378 | 563.8 | 14.7 |
| 20,000- 49,999 | 22,883 | 631.8 | 27.6 | 195 | 5.4 | 27.9 | 23,078 | 637.2 | 27.6 |
| 50,000-199,999 | 2,192 | 175.4 | 80.0 | 48 | 4.1 | 85.6 | 2,240 | 179.6 | 80.2 |
| 200,000 and over | 138 | 55.0 | 398.7 | 10 | 2.8 | 283.7 | 148 | 57.9 | 390.9 |
| All groups | 108,984 | 1,616.3 | 14.8 | 1,748 | 25.1 | 14.3 | 110,732 | 1,641.4 | 14.8 |
In general, transactions included in the under $4,000 group would involve vacant sections, although many building sections are now priced above this level.
Urban land transfers involving consideration between 510,000 and $19,999 would be, in the main, residential properties, although there are many houses in the next highest group, particularly in the main urban areas.
The range of transactions involving $50,000 or above would represent mainly commercial and industrial properties.
The following table shows urban land transfers by land registration districts.
| Registered in Land Registration District | 1972-73 | 1973-74 | ||||
|---|---|---|---|---|---|---|
| Number | Area | Total Consideration | Number | Area | Total Consideration | |
| hectares | hectares | |||||
| (000) | $(million) | (000) | $(million) | |||
| North Auckland | 31,353 | 3.1 | 401.8 | 35,470 | 3.6 | 602.4 |
| South Auckland | 13,460 | 1.4 | 128.1 | 18,058 | 1.9 | 227.0 |
| Gisborne | 889 | 0.1 | 7.6 | 1,142 | 0.1 | 12.3 |
| Hawke's Bay | 3,356 | 0.4 | 33.9 | 4,011 | 0.6 | 54.2 |
| Taranaki | 2,023 | 0.2 | 20.0 | 2,938 | 0.3 | 34.8 |
| Wellington. | 17,799 | 1.5 | 232.9 | 19,877 | 1.7 | 331.2 |
| Marlborough | 1,015 | 0.1 | 8.6 | 1,325 | 0.1 | 14.9 |
| Nelson | 2,151 | 0.2 | 20.2 | 2,552 | 0.3 | 33.6 |
| Westland | 503 | 2.1 | 569 | 0.1 | 3.5 | |
| Canterbury | 13,186 | 1.2 | 141.5 | 14,818 | 1.4 | 218.6 |
| Otago | 5,567 | 0.5 | 48.4 | 6,521 | 0.6 | 71.9 |
| Southland | 2,703 | 0.3 | 23.1 | 3,451 | 0.3 | 37.0 |
| Totals | 94,015 | 8.9 | 1,068.0 | 110,732 | 10.9 | 1,641.4 |
The urban areas of Auckland are included in the North Auckland Land Registration District.
Rural Land Transfers—The following analysis shows transfers of rural freehold properties classified by size groups.
| Size Group (Acres)* | 1972-73 | 1973-74 | ||||
|---|---|---|---|---|---|---|
| Number | Area | Total Consideration | Number | Area | Total Consideration | |
| * 1 acre = 0.405 hectare. | ||||||
| hectares | hectares | |||||
| (000) | $(million) | (000) | $(million) | |||
| Under 30 | 5,950 | 19.6 | 79.5 | 7,828 | 26.3 | 136.0 |
| 30-49 | 581 | 9.4 | 12.7 | 793 | 12.7 | 21.7 |
| 50-99 | 1,159 | 34.1 | 32.0 | 1,538 | 45.3 | 54.1 |
| 100-149 | 754 | 36.9 | 27.3 | 1,077 | 52.9 | 49.1 |
| 150-249 | 886 | 68.7 | 35.3 | 1,173 | 92.0 | 62.8 |
| 250-499 | 776 | 112.6 | 36.3 | 1,126 | 160.7 | 70.9 |
| 500 and over | 654 | 338.8 | 37.5 | 989 | 506.6 | 76.4 |
| Totals | 10,760 | 620.1 | 260.6 | 14,494 | 896.6 | 470.9 |
The next table gives average consideration per acre by size group and weighted average price per acre of rural freehold land transfers for the latest 5 years. (The weighted average price is based on total acreages transferred during the period April 1953-March 1966.)
| Size Groups (Acres)* | 1969-70 | 1970-71 | 1971-72 | 1972-73 | 1973-74 |
|---|---|---|---|---|---|
| *1 acre = 0.405 hectare. | |||||
| $ | $ | S | $ | $ | |
| Under 30 | 1,300.01 | 1,422.64 | 1,370.26 | 1,640.82 | 2,091.16 |
| 30- 49 | 398.66 | 402.04 | 434.78 | 545.33 | 693.89 |
| 50- 99 | 305.54 | 339.34 | 328.55 | 380.32 | 483.01 |
| 100-249 | 209.13 | 211.06 | 215.72 | 240.24 | 312.67 |
| 250-499 | 119.77 | 121.15 | H2.09 | 130.53 | 178.60 |
| 500 and over | 39.15 | 41.46 | 42.29 | 44.78 | 61.06 |
| Weighted overall average price per hectare | 301.07 | 315.80 | 312.36 | 373.95 | 467.03 |
The following table shows all rural land transfers, freehold and leasehold, by land registration districts for the year ended 31 March 1974.
| Registered in Land Registration District | Freehold | Leasehold | Total | ||||||
|---|---|---|---|---|---|---|---|---|---|
| Number | Area | Consideration | Number | Area | Consideration | Number | Area | Consideration | |
| hectares (000) | $(million) | hectares (000) | $(million) | hectares (000) | $(million) | ||||
| North Auckland | 3,318 | 109.5 | 95.3 | 17 | 2.0 | 0.5 | 3,335 | 111.5 | 95.8 |
| South Auckland | 2,890 | 146.3 | 119.4 | 92 | 6.6 | 3.5 | 2,982 | 152.9 | 122.9 |
| Gisborne | 280 | 52.3 | 8.7 | 30 | 13.6 | 1.1 | 310 | 65.9 | 9.9 |
| Hawke's Bay | 717 | 52.2 | 24.7 | 35 | 3.8 | 1.5 | 752 | 56.0 | 26.2 |
| Taranaki | 772 | 48.7 | 25.3 | 63 | 7.6 | 2.5 | 835 | 56.2 | 27.8 |
| Wellington | 1,793 | 129.7 | 56.8 | 49 | 6.1 | 1.6 | 1,842 | 135.8 | 58.4 |
| Marlborough | 300 | 29.8 | 7.4 | 35 | 10.6 | 1.6 | 335 | 40.4 | 9.0 |
| Nelson | 514 | 26.9 | 10.3 | 44 | 4.0 | 0.7 | 558 | 30.9 | 11.0 |
| Westland | 99 | 7.6 | 1.3 | 26 | 5.0 | 0.5 | 125 | 12.6 | 1.8 |
| Canterbury | 1,916 | 136.3 | 68.9 | 99 | 20.3 | 4.2 | 2,015 | 156.6 | 73.1 |
| Otago | 910 | 82.3 | 22.9 | 32 | 8.6 | 1.2 | 942 | 90.9 | 24.1 |
| Southland | 985 | 75.1 | 29.8 | 48 | 6.8 | 1.9 | 1,033 | 81.8 | 31.7 |
| Totals | 14,494 | 896.6 | 470.9 | 570 | 95.1 | 20.8 | 15,064 | 991.6 | 491.6 |
GENERAL—Equitable land values are a basis for many of the relations of the Central Government and local authorities with the individual. In particular they are required in connection with the following: (a) the levying of land tax; (b) the apportionment of rating levies over contributory local authorities; (c) the levying of rates by local authorities; (d) the advancing of money on mortgage by Government departments and by trustees under the Trustee Act; (e) the assessing of stamp, estate, and gift duties; (f) the fixing of prices payable to the Crown or by the Crown for transfers of land.
SYSTEM AND PROCEDURE—The Government Valuation of Land Act 1896 set up a separate Government department charged with the duty of assessing the values of real estate for taxation and other purposes of the Central Government and for local rating purposes. The present law relating to the valuation of land is contained in the Valuation of Land Act 1951, and in the Land Valuation Proceedings Act 1948.
The work of the Valuation Department is directed by the Valuer-General, the actual work of valuing being done by district valuers and assistant valuers. The duty of a valuer is to examine each property and to estimate (a) the value of the land; (b) the value of the buildings (if any) and other improvements (if any) upon such land; and (c) the capital value of the property.
Valuers are enjoined not to strain after high values, not to accept special prices paid for land in exceptional circumstances, but to determine the value neither above nor below the fair selling value in view of the many and diverse purposes for which the values are used.
Generally, under the New Zealand law, the increased value attaching to any piece of land which is due to the successful working of other lands in the district, or to State or local authority expenditure on public works, or to the general prosperity and development of the country, forms portion of the “land value”.
“Improvements" on land are defined, with certain provisos, as any work done or materials used on or for the benefit of the land by any over or occupier resulting in an increase in the value of the land. With the introduction of land value in 1970 (in place of unimproved value) the term “improvements”, correctly speaking, includes only those items of work done or material used which result in structural additions to the property.
The “capital value” is, broadly speaking, the unencumbered market value of the land at date of valuation, and the “value of improvements” is the added value given by the “improvements”.
THE VALUATION ROLL—A valuation roll is prepared for each district over which a territorial local authority has rating jurisdiction, setting forth the ownership, description, and valuation of each property, including rates postponement and special rateable values where these are required to be determined.
Revision of Rolls—District valuation rolls are revised by the Valuer-General at intervals of not more than 5 years unless for good reason he decides otherwise.
The Supplementary Roll—There is, in addition to the district valuation roll for each district, a supplementary roll for that district. Generally, all special valuations of land made during the currency of a district roll for particular purposes—e.g., the granting of loans by Government departments or trustees on the security of lands, the assessment of stamp, gift, and estate duties—are entered on the supplementary roll.
Objections to Valuations—In the case of a revision of a district roll, the Valuer-General, any local authority, or any owner whose name appears on the roll, may object to any valuation thereon. Where a particular property only is revalued, only the owner has a right of objection. If, after the Valuer-General has reconsidered the matter, the objector is still dissatisfied he may ask for the objection to be heard by the Administrative Division of the Supreme Court.
ADMINISTRATIVE DIVISION OF THE SUPREME COURT—The Land Valuation Proceedings Act 1948 as amended in 1968, provides for objections under the Valuation of Land Act to be determined by the Administrative Division of the Supreme Court. In addition to its jurisdiction under the Land Valuation Proceedings Act 1948, the Division hears claims for compensation under the Public Works Act 1928 and determines values under the Land Settlement Promotion Act 1952. Land valuation committees for particular localities operate under the general jurisdiction of the Division. There is a right of appeal from a committee's decision to the court with a further right of appeal to the Court of Appeal in certain cases.
If any owner who has objected to a valuation made at a revision of a district roll is not satisfied with the value of the land as fixed by the Division's order, he may, within 14 days of the sealing of the order, give notice to the Valuer-General that he requires the capital value to be reduced to the value which he (the owner) considers to be the fair selling value as specified in his notice (but not less than the aggregate amount owing on mortgages or other charges on the land), or the land to be acquired on behalf of Her Majesty, or sold, at that value. There is also provision that if the Valuer-General is of the opinion that the value has been fixed by the Division at less than the capital value, he may, within 14 days after the sealing of the Division's order require the owner to consent to what he (the Valuer-General) considers is the fair capital value, and, failing such consent being given within 30 days after notice is delivered, he may, with the approval of the Governor-General in Council, acquire the property at that value on behalf of Her Majesty.
VALUATIONS IN RELATION TO RATING—The district valuation roll so long as it continues in force is by law the roll from which the valuation roll of every local authority rating on the capital or on the land value is framed.
The third major rating system is the annual (rental) value system, where the annual values are assessed by valuers appointed by the local authorities concerned. The Valuer-General may be so appointed. The annual value is defined as the rent at which a property would let from year to year reduced by 20 percent in the case of houses, buildings, and other perishable property, and by 10 percent in the case of land, but it may not be less than 5 percent of the value of the fee simple. A new valuation roll in this regard is prepared either annually or triennially.
Parts IV and V of the Rating Act 1967 provide for local authorities to grant applications for rates postponement in respect of certain residences in commercial and industrial zones and for farmlands in counties with valuations reflecting potential use for urban development. Rates postponement values are determined either under the Valuation of Land Act or the Rating Act, according to the system of rating in force. Special rateable values for non-conforming commercial or industrial land in residential or rural zones are also provided for in order that these classes of properties will not enjoy a rating advantage. Likewise special rateable values may be determined for rural or residential land or commercial or industrial areas, for single-unit dwellinghouses in areas where values are influenced by demand for multi-unit housing, and for “existing use” properties within the meaning of Section 36 of the Town and Country Planning Act 1953.
Part VI of the Rating Act provides for rating relief for farmlands subject to rates levied by borough (or city) councils, independent town councils, and county councils in respect of county towns. The Act provides that these local authorities may assess valuations for rating purposes for such farmlands lower than the normal rateable values.
Equalisation of Values—The Rating Act, Part IX, provides for an equitable adjustment of rates and of levies based on rateable values as between the several constituent districts comprising the district of an ad hoc local authority where those constituent districts have been revalued by the Valuer-General at different times. Provision is also made for equalisation to be done where the several ridings of a county have been revalued at different dates.
CAPITAL AND UNIMPROVED VALUES OF LAND—The figures in the following table show valuations over a long period of years for the whole of New Zealand; they are gross values and include the value not only of rateable properties but also of churches, schools, unoccupied Crown lands, and other lands exempt from local rating.
| At 31 March | Capital Value (Land and Improvements) | Unimproved Value of Land* |
|---|---|---|
*Included in previous column. †Includes the districts revalued after 1 March 1971 in the “land value” basis provided for by the Valuation of Land Amendment Act (No. 2) 1970, which came into effect on that date. | ||
| $(million) | ||
| 1878 | 199.1 | 125.1 |
| 1885 | 226.5 | .. |
| 1888 | 222.3 | 151.0 |
| 1891 | 244.4 | 151.7 |
| 1897 | 277.2 | 168.8 |
| 1902 | 309.6 | 189.7 |
| 1906 | 395.4 | 245.9 |
| 1907 | 473.3 | 299.4 |
| 1909 | 543.0 | 345.5 |
| 1911 | 586.2 | 368.1 |
| 1913 | 681.1 | 425.9 |
| 1915 | 742.1 | 461.4 |
| 1916 | 778.3 | 482.6 |
| 1917 | 810.9 | 502.2 |
| 1918 | 842.8 | 521.8 |
| 1919 | 891.1 | 552.0 |
| 1920 | 940.2 | 581.8 |
| 1921 | 1,037.2 | 635.3 |
| 1922 | 1,089.0 | 658.3 |
| 1923 | 1,106.8 | 661.6 |
| 1924 | 1,137.0 | 667.7 |
| 1925 | 1,174.7 | 678.6 |
| 1926 | 1,206.5 | 682.1 |
| 1927 | 1,236.5 | 683.0 |
| 1928 | 1,262.9 | 670.4 |
| 1929 | 1,301.8 | 689.5 |
| 1930 | 1,329.1 | 677.8 |
| 1931 | 1,335.6 | 663.3 |
| 1932 | 1,325.7 | 643.6 |
| 1933 | 1,307.4 | 629.1 |
| 1934 | 1,300.7 | 619.5 |
| 1935 | 1,275.2 | 602.3 |
| 1936 | 1,271.6 | 591.4 |
| 1937 | 1,264.5 | 575.7 |
| 1938 | 1,272.7 | 564.7 |
| 1939 | 1,305.8 | 565.6 |
| 1940 | 1,321.0 | 557.8 |
| 1941 | 1,346.2 | 555.1 |
| 1942 | 1,363.8 | 553.8 |
| 1943 | 1,368.4 | 553.8 |
| 1944 | 1,377.6 | 554.1 |
| 1945 | 1,394.7 | 555.0 |
| 1946 | 1,420.9 | 558.4 |
| 1947 | 1,492.8 | 568.5 |
| 1948 | 1,592.1 | 583.2 |
| 1949 | 1,778.5 | 614.3 |
| 1950 | 1,971.8 | 648.9 |
| 1951 | 2,225.5 | 698.3 |
| 1952 | 2,629.8 | 788.5 |
| 1953 | 3,064.7 | 899.6 |
| 1954 | 3,405.5 | 974.3 |
| 1955 | 4,136.6 | 1,158.2 |
| 1956 | 4,613.2 | 1,288.8 |
| 1957 | 4,992.7 | 1,395.1 |
| 1958 | 5,354.5 | 1,502.3 |
| 1959 | 5,664.5 | 1,610.6 |
| 1960 | 6,132.5 | 1,779.6 |
| 1961 | 6,497.4 | 1,905.7 |
| 1962 | 6,945.7 | 2,061.1 |
| 1963 | 7,373.6 | 2,212.1 |
| 1964 | 7,760.4 | 2,345.8 |
| 1965 | 8,459.2 | 2,644.5 |
| 1966 | 9,085.0 | 2,865.5 |
| 1967 | 9,836.1 | 3,184.2 |
| 1968 | 10,631.6 | 3,487.0 |
| 1969 | 11,349.7 | 3,705.2 |
| 1970 | 12,515.6 | 4,170.7 |
| 1971† | 13,305.7 | 4,489.0 |
| 1972† | 14,331.3 | 5,046.3 |
| 1973† | 15,657.2 | 5,704.1 |
| 1974† | 17,871.7 | 6,778.3 |
Between 1943 and 1950 values were stabilised through the operation of the Servicemen's Settlement and Land Sales Act 1943, and the increases shown in this period mainly reflect the writing into new valuations of increases which had occurred prior to 1943.
The lifting of land sales control on urban properties in 1950 and on rural properties in 1951 was reflected in the general revaluations.
In the following table the gross values and rateable values are analysed in more detail.
| As at 31 March | Gross Values | Rateable Values | ||
|---|---|---|---|---|
| Capital Value (Land and Improvements) | Unimproved Value of Land* | Capital Value (Land and Improvements) | Unimproved Value of Land* | |
*Included in previous column. †Includes the districts revalued after 1 March 1971 on the “land value” basis provided for by the Valuation of Land Amendment Act (No. 2) 1970, which came into effect on that date. | ||||
| $(million) | ||||
| Counties | ||||
| 1969 | 4,482.0 | 1,486.0 | 4,213.9 | 1,432.5 |
| 1970 | 4,855.1 | 1,586.2 | 4,564.1 | 1,525.5 |
| 1971† | 5,193.8 | 1,759.9 | 4,860.5 | 1,685.1 |
| 1972† | 5,516.6 | 2,085.8 | 5,176.8 | 2,015.6 |
| 1973† | 5,890.6 | 2,407.9 | 5,524.7 | 2,325.5 |
| 1974† | 7,014.1 | 3,123.1 | 6,584.2 | 3,011.3 |
| Cities and Boroughs | ||||
| 1969 | 6,839.0 | 2,212.6 | 6,232.0 | 2,047.3 |
| 1970 | 7,638.5 | 2,580.4 | 6,953.3.5 | 2,384.9 |
| 1971† | 8,088.0 | 2,724.8 | 7,379.1 | 2,527.4 |
| 1972† | 8,790.8 | 2,956.1 | 8,029.1 | 2,747.8 |
| 1973† | 9,741.9 | 3,291.6 | 8,910.8 | 3,051.9 |
| 1974† | 10,830.2 | 3,648.1 | 9,932.1 | 3,376.4 |
| Independent Town Districts | ||||
| 1969 | 28.7 | 6.6 | 26.2 | 6.3 |
| 1970 | 22.0 | 4.1 | 19.3 | 3.8 |
| 1971† | 23.8 | 4.4 | 20.7 | 4.0 |
| 1972† | 23.9 | 4.5 | 20.8 | 4.1 |
| 1973† | 24.7 | 4.6 | 21.7 | 4.3 |
| 1974† | 27.3 | 7.0 | 24.8 | 6.5 |
| Grand Totals | ||||
| 1969 | 11,349.7 | 3,705.2 | 10,472.1 | 3,486.1 |
| 1970 | 12,515.6 | 4,170.7 | 11,536.9 | 3,914.2 |
| 1971† | 13,305.6 | 4,489.1 | 12,260.3 | 4,216.5 |
| 1972† | 14,331.3 | 5,046.3 | 13,226.7 | 4,767.5 |
| 1973† | 15,657.2 | 5,704.1 | 14,456.2 | 5,381.7 |
| 1974† | 17,871.7 | 6,778.3 | 16,541.2 | 6,394.3 |
The fact that land valuations arc not continuously up-to-date has the effect in the preceding tables of delaying the appearance of other than the steepest movements and of reducing their apparent magnitudes.
With the present resources at the Valuation Department's disposal, an up-to-date revaluation of all properties in New Zealand would be an impossible task but by using the principle of valuation equalisation mentioned earlier, it is possible to compile up-to-date gross values by local body districts for the whole country. The gross capital value figures shown below have been compiled on the level of values as at 31 March 1973.
| Territorial Areas | Gross Capital Value |
|---|---|
| $(million) | |
| Counties | 7,779.6 |
| Boroughs and cities | 13,764.9 |
| Total | 21,544.5 |
A comparison of these figures with the gross values shown for the year ended 31 March 1973 given previously, illustrates the point that valuation statistics tend to have the effect of delaying the appearance of current movements in the property market.
The next table shows the percentage distribution of area and population as at 1 April 1972, and of rateable property values between the different types of local authority districts as at 31 March 1974.
| Local Authority District | Area | Population | Rateable Property Values | ||
|---|---|---|---|---|---|
| Capital Value | UV/LV | Value of Improvements | |||
| Percentage Distribution | |||||
| Counties | 99.1 | 30.7 | 39.8 | 47.1 | 35.2 |
| Boroughs | 0.9 | 68.9 | 60.0 | 52.8 | 64.6 |
| Town districts (independent) | - | 0.3 | 0.2 | 0.1 | 0.2 |
| Totals | 100.0 | 100.0 | 100.0 | 100.0 | 100.0 |
Particulars of values for each county, borough, and independent town district in considerable detail are contained in the Report on Local Authority Statistics.
VALUERS' REGISTRATION BOARD—The Valuers Act 1948 provides for the registration of land valuers and for some control of their work. There is a Registration Board under the chairmanship of the Valuer-General, which issues certificates for registration to all valuers and annual practising certificates to public valuers. The main objects of the Act are to secure a high standard of valuation work throughout the country and to encourage competent valuers. There were 1,103 registered valuers at 31 March 1974.
PORT DEVELOPMENT—In recent years the development of the container ship, the unitised cargo ship, the roll-on roll-off ship, and barge-carrying systems such as the “lash” (lighter aboard ship) system have brought about a world-wide revolution in the handling of maritime cargoes, and a new concept of the co-ordination of transport through the substitution of capital-intensive for labour-intensive operations. In this revolution New Zealand is fully involved.
A cargo-handling co-ordination committee serviced by the Marine Division of the Ministry of Transport is affiliated to an international association with a control office in the United Kingdom.
To ensure the control of harbour development a New Zealand Ports Authority has been established. Amongst its several functions is the fostering of an efficient and integrated ports system and, to that end, the preparation of a national ports plan.
Under this plan, harbour authorities must obtain the authority's approval for major capital projects, e.g., container cranes, storage sheds, tugs. Consents granted during the year ended 31 March 1974 involved developments costing $23 million.
A recently introduced feature in port development has been the introduction of offshore loading terminals (for bulk loading of ironsands) at Waverley near Wanganui, and Taharoa near Raglan.
The authority has designated Auckland and Wellington as the first container ports and both have installed containerised cargo facilities. There are also facilities at Port Chalmers. A container service to the United States began in August 1971 and to the United Kingdom in September 1972 from the ports of Auckland and Wellington. Port Chalmers is also included as one of the New Zealand container ports in one of the New Zealand - United States container runs. Authority has been granted for container development at Lyttelton.
CONTAINER TRAFFIC—Cellular container ships working at container terminals made 78 ship voyages for the year ended 30 September 1973 compared with 30 the previous year. They handled 577,230 tons of cargo (loading 307,822 tons, and unloading 269,408 tons), and averaged 5.31 gross days on the coast; in terms of 20 ft equivalents, 56,735 containers were handled.
In its assessment of future container traffic the New Zealand Ports Authority has projected the minimum number of container loads likely to be shipped in 1980 and 1990 as follows.
| Port | Projection Year | |||
|---|---|---|---|---|
| 1980 | 1990 | |||
| Exports | Imports | Exports | Imports | |
| Auckland | 53,000 | 41,000 | 63,400 | 40,000 |
| Wellington | 55,600 | 13,700 | 52,400 | 5,700 |
| South Island | 22,300 | 11,200 | 66,100 | 7,100 |
| Total container loads | 130,900 | 65,900 | 181,900 | 52,800 |
United Kingdom Trade—Associated Container Transportation in conjunction with the Australian National Line decided in 1971 that they would modify their existing container service between Europe and Australia to include calls at Auckland and Wellington. This service commenced in September 1972 and was initially operated by four container ships, Act 1, Act 2, Australian Endeavour, and Act 6. Early in 1974 a fifth ship, the 41,000 ton Remuera, joined the fleet, increasing the frequency of sailings from every 17 days to every 14. These five fully cellular vessels serve Auckland and Wellington, handling refrigerated and general cargo.
A supplementary refrigerated container service between Britain and South Island ports is being introduced by P. and O. (N.Z.) Ltd. Six of their conventional vessels now operating on this trade are being converted to handle a limited number of containers. Each ship will carry 26 containers on deck and will be equipped with their own travelling cranes and gantries to handle these containers. The service is designed primarily to be used in conjunction with the mechanical meat loaders at Timaru and Bluff. In 1974, a direct New Zealand to North Continent service was inaugurated by Hamburg-Sued. The Columbus Caribic is fully containerised and accepts both general and refrigerated cargo. Loading at Port Chalmers, Wellington, and Auckland, the ship discharges at Antwerp, Rotterdam, Hamburg/Bremen. A further two ships will join this trade in 1975 and early in 1976.
East Coast - North America Trade—All of New Zealand's East Coast - North America trade is carried by three container services operated by Columbus Line, Farrell Lines Inc., and Associated Container Transport Ltd. (A.C.T.). Columbus Line runs three cellular container ships serving Otago (Port Chalmers), Wellington, and Auckland, while Associated Container Transport Ltd.'s four ships provide a twice monthly service calling at Auckland and Wellington.
Farrell Lines Inc., a privately owned American-flag steamship company, runs four cellular container ships serving Auckland and Wellington.
Each of the container vessels operated by this Line has a service speed in excess of 22 knots, is 668 ft 6 in. long, has a 90-ft beam, and is equipped with a 70-ton conventional boom aft and a 30-ton crane forward. Both types of crane have an outreach of 20 ft from the maximum beam of the ship and enable heavy-lift cargo and containers to be handled where shore-side container facilities are unavailable. The container ships each has a capacity of 1,098, 20-ft container equivalents in a mixture of 20- and 40-ft containers. Of these, 228 are reefer containers capable of carrying over 4,300 tons of frozen beef, lamb, or dairy products a trip. Although more 40 ft units are appearing in container services the predominance of meat as a north-bound cargo means that a substantial number of 20-ft containers will always be needed*. There is 210,000 cu ft of space for non-containerised lift cargo.
The vessels feature a new system of refrigeration which uses liquid nitrogen to maintain deep-freeze temperatures within the insulated containers ashore and 10-below-zero cold in three holds to protect refrigerated cargoes at sea. These refrigerated holds can also be converted to carry non-refrigerated cargo. When a refrigerated container for export is received into the terminal a cylinder containing liquid nitrogen gas is connected to the container and by means of a thermostat control the gas is automatically injected as required and this maintains the cargo at the pre-set temperature. This system has the advantage of being completely independent of any power source which gives much greater flexibility regarding stacking areas in the terminal.
West Coast - North America Trade—A full container ship service to the West Coast of the United States is operated by the Columbus Line with three ships, the Columbus Canada, Columbus Capricorn, and Columbus California. The ships each carry approximately 450 containers and maintain a 24-day service. Ports serviced in New Zealand are Auckland, Wellington, and Port Chalmers.
The Pacific Far East Line company commenced its “lash” service between New Zealand (calling at Wellington and Auckland) and the West Coast of North America in May 1973, with the arrival of the Philippine Bear at Auckland. A 25-day service between the two areas is envisaged.
These ships are 820 ft in length, with a 100-ft beam and a net tonnage of 18,706 tons, and are capable of steaming at 23 knots. A mixture of lighters and containers are carried. The lighters (47 in total) are 61 1/2 ft long, 31 ft 2 in. wide, and 13 ft in depth, and have a 450-ton capacity. In addition, 540 containers can be carried. The ships carry their own cranes—a 550-ton lighter crane, a 30-ton container crane, and two 5-ton ship's store cranes—and are thus completely independent of shore equipment. Barges may therefore be left or picked up at any port without any special shore facilities being needed. Bulk, liquid, containerised, refrigerated, palletised, or large single-piece cargoes can be carried. The lighters float off the stern, either alongside a wharf or at anchorage, and the ship is able to be fully loaded or discharged within 24 hours.
*Frozen meat is a cargo of such high density and concentrated weight that it can only be shipped efficiently in 20-ft containers. Filling a 40-ft unit with this product would result in a load too heavy to be manageable. There are also difficulties in keeping the whole cargo frozen in a 40-ft container.
Scandinavian Trade—A new service commenced towards the end of 1972 which should result in 95 percent of New Zealand's trade with Scandinavia becoming containerised or unitised. A consortium of shipping lines trading under the name “ScaNZeal” has replaced three conventional freighters with three multi-purpose, part-container ships ("Scandia" ships). Each ship can carry 200 containers, 90 in special cells below deck and the remainder on deck. The rest of the cargo comprises unitised loads, such as wool, and there are also tanks for liquids. There is space for reefers and a special space for wet cargoes, such as hides, which are unsuitable for containers.
The three vessels have their own equipment and do not have to rely on port container cranes. As well as special 25-ton cranes for handling containers, they have 125-ton and 40-ton heavy-lift derricks, two 15-ton, two 10-ton, and two 5-ton derricks. One of the vessels, the Torrens, also has side doors for loading and discharge.
Unlike full container ships, the Scandia ships load conventional cargo and call at non-container ports, providing a more flexible service than container ships. ScaNZeal provides a 5-weekly service, calling at the ports of Auckland, Lyttelton, Dunedin, and Bluff, with occasional calls at Tauranga and Napier. The ships call at several ports in Denmark, Norway, Sweden, Northern Europe, and the Mediterranean Area.
Japanese Trade—The P. and O. group introduced a 6,300-ton unit load ship, the Zaida, to this service in March 1972 and a second unit load ship (the Zira) made a run early in 1973.
A feature of these ships is that freight is loaded through two sideports. An outboard conveyor at each sideport is fed with special pallets by fork-lift trucks working on the wharf. The pallets are conveyed automatically to an elevator which is pre-set to deliver the goods to one of four decks where the ship's own forklifts take the cargo to stowing positions. Provision is also made to carry 56 containers on deck, and a 25-ton crane makes the ship independent of shore facilities.
Trans-Tasman—During 1973-74 there was a record growth in trans-Tasman cargoes, the largest increases occurring in bulk cargoes such as wheat, sorghum for animal feeds, and gypsum. Roll-on roll-off cargoes from both Australia and New Zealand increased sharply. The Union Steam Ship Company, the largest shipping company in the trans-Tasman trade, operated both roll-on roll-off vessels and conventional cargo ships. Roll-on roll-off ships on the regular trans-Tasman run during 1973-74 included the Maheno, the Marama, the Union Sydney, the Wanaka, and the Union Wellington. Conventional cargo ships included the Abel Tasman, the Kaimiro, the Kaituna, the Union Aotearoa, the Union Australia, and the Union New Zealand.
Pacific Islands— Regular shipping services between New Zealand and the Pacific Islands in 1973-74 were mainly provided by the New Zealand Shipping Corporation, with the Moana Roa and the Lorena, and by the Union Steam Ship Company, with (among other ships) the container ship Union South Pacific, and the Luhesand.
Inter-island and Coastal Services—A regular ferry service across (he Cook Strait between Wellington and Picton, at the head of the Marlborough Sounds, is provided by rail ferries operated by the Railways Department. The ferries Aramoana and Aranui, which carry passengers and freight, normally make 25 round trips per week throughout the year. Two other ferries, the Arahanga and the Aratika, carry freight but have limited accommodation for truck drivers and others whose vehicles are being carried.
During the year ended 31 March 1974 the three ferries then in service (Aratika entered service in mid-1974) carried 551,640 ordinary passengers, 47,424 excursion passengers, 121,553 passengers motor vehicles, 5,372 lorries and trade cars, and 1,218,692 manifest tons of other goods. Gross revenue from the ferry service amounted to $12,778,937, resulting in a profit of $1,003,866.
Another roll-on roll-off ferry, the Rangatira, owned by the Union Steam Ship Company, operated a regular service between Wellington and Lyttelton, in the South Island. This service involved a considerable financial loss, and the Rangatira was eventually sub-chartered to the Ministry of Transport while the Government considered alternative vessels.
Most of the ships engaged in the coastal trade are relatively small, exceptions including the New Zealand Shipping Corporation's Coastal Trader and the occasional coastal voyages of the Union Steam Ship Company's trans-Tasman vessels carrying cars, sugar, or other cargoes. Coastal shipping trade includes the shipment of coal from Westport to Portland, the movement of newsprint from Mount Maunganui to the South Island, the cartage of cement, the Onehunga-Nelson trade, and shipping bulk cargoes out of Nelson.
Additional information to that contained in this section on port, cargo, and shipping statistics may be found in the Report on Transport Statistics, an annual publication of the Department of Statistics.
A special article in the 1974 Yearbook (pp. 1065-77) is related to New Zealand ports and ship developments.
NEW ZEALAND SHIPPING CORPORATION—In 1974 a Government-owned shipping corporation was set up to establish and operate shipping services as empowered by the Shipping Corporation of New Zealand Act 1973. The New Zealand Shipping Corporation formed a subsidiary called the New Zealand Shipping Line which (from, and in conjunction with, the Shaw Savill and Albion Company) purchased two ships of 12,227 tons, now known as N.Z. Waitangi and N.Z. Aorangi which carry 24 and 18 containers on deck respectively. These are engaged on New Zealand - United Kingdom trade.
The Corporation itself operates a number of ships engaged in the coastal and Pacific Islands trade. They include the Coastal Trader, a roll-on roll-off vessel on the Auckland - Lyttelton-Dunedin run; the Moana Roa and the Loren, both trading with the Pacific Islands; and the Bulknes, carrying aluminium ore for the Bluff smelter. In addition, the Corporation acts as operating agents for Shaw-Savill ships, with the exception of passenger liners.
PORT STATISTICS—Demands made on ports by overseas and coastal vessels are illustrated in the following table, which gives the total number and tonnage of all calls made each year.
| Year | Overseas Vessels | Coastal Vessels | Total | |||
|---|---|---|---|---|---|---|
| Number of Calls | Net Tonnage | Number of Calls | Net Tonnage | Number of Calls | Net Tonnage | |
| ton$(000) | tons(000) | tons(000) | ||||
| 1963 | 3,764 | 16,433 | 11,076 | 6,189 | 14,840 | 22,622 |
| 1964 | 3,568 | 15,690 | 10,653 | 7,022 | 14,221 | 22,711 |
| 1965 | 3,452 | 15,486 | 9,766 | 7,213 | 13,218 | 22,699 |
| 1966 | 3,605 | 16,783 | 9,427 | 8,063 | 13,032 | 24,845 |
| 1967 | 3,331 | 15,621 | 9,156 | 8,791 | 12,487 | 24,412 |
| 1968 | 3,497 | 16,538 | 8,704 | 8,632 | 12,201 | 25,170 |
| 1969 | 3,648 | 17,070 | 8,150 | 8,241 | 11,798 | 25,311 |
| 1970 | 3,757 | 17,258 | 7,671 | 8,322 | 11,428 | 25,580 |
| 1971 | 3,551 | 16,740 | 7,753 | 8,504 | 11,304 | 25,244 |
| 1972 | 3,770 | 18,967 | 7,980 | 9,779 | 11,750 | 28,746 |
| 1973 | 4,030 | 21,034 | 8,736 | 10,992 | 12,766 | 32,027 |
All Calls of Overseas Vessels—The following table shows for the 3 latest years the number of calls and net tonnage of overseas vessels arriving at New Zealand ports, either direct or coastwise.
| Port | 1971 | 1972 | 1973 | |||
|---|---|---|---|---|---|---|
| Number of Calls | Net Tonnage (000) of Vessels | Number of Calls | Net Tonnage (000) of Vessels | Number of Calls | Net Tonnage (000) of Vessels | |
| Bay of Islands | 37 | 232 | 29 | 183 | 23 | 137 |
| Whangarei | 131 | 1,563 | 134 | 1,612 | 132 | 1,727 |
| Auckland | 1,035 | 4,634 | 1,099 | 5,329 | 1,136 | 6,188 |
| Onehunga | 16 | 8 | 26 | 10 | 60 | 29 |
| Raglan | 2 | 1 | 2 | 1 | 1 | |
| Taharoa | - | - | 3 | 24 | 20 | 162 |
| Tauranga | 446 | 1,761 | 475 | 1,981 | 526 | 2,339 |
| Gisborne | 38 | 174 | 32 | 135 | 27 | 134 |
| Napier | 215 | 993 | 244 | 1,184 | 234 | 1,118 |
| Taranaki | 134 | 632 | 129 | 679 | 128 | 635 |
| Waverley | 7 | 65 | 17 | 173 | 17 | 173 |
| Wanganui | 5 | 7 | 6 | 8 | 2 | 2 |
| Wellington | 467 | 2,124 | 498 | 2,659 | 542 | 3,136 |
| Picton | 25 | 101 | 27 | 110 | 28 | 129 |
| Nelson | 103 | 490 | 111 | 523 | 115 | 617 |
| Westport | 9 | 7 | 10 | 8 | 21 | 21 |
| Greymouth | 1 | - | 5 | 3 | 7 | 5 |
| Lyttelton | 403 | 1,672 | 445 | 1,914 | 475 | 1,970 |
| Timaru | 113 | 555 | 117 | 559 | 111 | 542 |
| Oamaru | - | - | - | - | 5 | 2 |
| Otago | 197 | 884 | 191 | 980 | 210 | 962 |
| Bluff | 167 | 837 | 170 | 893 | 210 | 1,005 |
| Totals | 3,551 | 16,740 | 3,770 | 18,967 | 4,030 | 21,034 |
CARGO STATISTICS—With cargo statistics it should be noted that the term “ton” does not invariably denote a weight of 2,240 lb. It is practicable to obtain the actual weights involved for only a portion of the goods handled. In other cases close approximations are made by applying uniform formulas as to the number of bales, cases, sacks, etc., to the ton. A considerable portion of trading goods, however, is recorded in measurement tons, 40 cubic feet of space being regarded as the equivalent of a ton. As the practice is uniform, comparisons from year to year are not appreciably affected, nor are comparisons between ports, unless there is a radical difference in the class of trade carried on, in which case recourse should be had to consideration of items of trade. Since a much larger proportion of imports are in measurement tons, direct comparisons of tonnages of imports and exports are not always valid.
The following table gives a summary of the tonnage of cargo passing through all ports for the last 11 years. Cargoes handled by waterside workers comprise about two-fifths, with tonnages of 11.8 million tons in 1972 and 12.8 million tons in 1973. The charging and discharging of oil tankers has contributed about one-third to total tonnages in recent years, and other bulk cargoes are loaded and unloaded by special methods. Over half of coastal and trans-Tasman cargoes are handled by roll-on roll-off methods, in 1973, 2 million tons out of 3.9 million tons.
| Year | Inward* | Transhipments | Outward* | Total Tonnage† | ||
|---|---|---|---|---|---|---|
| Coastal | Overseas | Coastal | Overseas | |||
*Excluding transhipments. †Transhipments included twice. ‡Manifest tonnes (000) | ||||||
| manifest tons (000) | ||||||
| 1964 | 3,838 | 7,187 | 103 | 3,504 | 2,593 | 17,328 |
| 1965 | 4,945 | 7,181 | 85 | 4,688 | 2,574 | 19,558 |
| 1966 | 5,542 | 7,942 | 74 | 5,214 | 2,677 | 21,523 |
| 1967 | 5,407 | 6,887 | 52 | 5,105 | 2,927 | 20,431 |
| 1968 | 5,610 | 7,286 | 40 | 5,413 | 3,951 | 22,341 |
| 1969 | 5,664 | 7,527 | 34 | 5,448 | 4,599 | 23,305 |
| 1970 | 6,193 | 8,322 | 61 | 6,035 | 4,770 | 25,442 |
| 1971 | 6,228 | 8,478 | 81 | 6,048 | 5,293 | 26,209 |
| 1972 | 6,894 | 9,202 | 94 | 6,752 | 6,228 | 29,265 |
| 1973 | 7,394 | 10,767 | 94 | 6,790 | 7,423 | 32,561 |
| 1974‡ | 8,321 | 12,026 | 154 | 7,869 | 7,456 | 35,981 |
The 1974 figures in the previous table are in manifest tonnes, and therefore not directly comparable with earlier figures. Conversion of earlier figures to metric equivalents would not be meaningful for the reasons explained earlier. The “tonnes” used in 1974 were, in fact, a combination of measurement tonnes of 1 cubic metre and/or 1,000 kilogrammes.
With the rise of ports handling specialised cargoes and major ports mechanically handling bulk loads and goods in containers on and off cellular container ships, the pattern of cargo movements has changed rapidly. Technical developments in packaging (containers, pallets) and transport (bulk loading) has tended to concentrate mechanised handling of cargo through a few ports with the consequent displacement of the manual labour of waterside workers.
A summation of cargo movements through ports shows that total tonnage throughputs of New Zealand ports have more than doubled since 1962 largely as the result of the double handling of oil to and from the refinery, and the growth of exports of forest products. Tonnages of farm produce—butter, cheese, meat, wool, and fruit—have remained stable over the years but have dropped from 9.8 percent of total throughput in 1963 to 5 percent in 1973. The figures and percentages for different types of cargo are given in the following table. Transhipments have been included.
| Item | 1971 | 1972 | 1973 | 1974† |
|---|---|---|---|---|
*Mostly refrigerated, except wool. †Metric measure. Not directly comparable with earlier figure. | ||||
| Tons (000) | Tons (000) | Tons (000) | Tons (000) | |
| Inward cargo | 14,788 | 16,191 | 18,255 | 20,502 |
| Outward cargo | 11,422 | 13,074 | 14,306 | 15,479 |
| Total throughput | 26,209 | 29,265 | 32,561 | 35,981 |
| Farm Produce* | ||||
| Butter | 179 | 139 | 171 | 148 |
| Cheese | 101 | 99 | 91 | 80 |
| Meat, frozen | 717 | 731 | 741 | 680 |
| Wool | 343 | 378 | 321 | 285 |
| Fruit, fresh | 220 | 269 | 292 | 316 |
| Totals, farm produce | 1,560 | 1,616 | 1,616 | 1,508 |
| Percentage of throughput | 6.0 | 5.5 | 5.0 | 4.2 |
| Forest Products | ||||
| Totals—timber only | 2,160 | 2,186 | 2,278 | 1,726 |
| Percentage of throughput | 8.2 | 7.5 | 7.0 | 4.8 |
| Bulk Commodities | ||||
| Cement | 1,086 | 1,204 | 1,413 | 1.490 |
| Coal and coke | 307 | 347 | 304 | 282 |
| Grain | 260 | 419 | 356 | 291 |
| Fertilisers | 1,672 | 1,714 | 2,114 | 1,809 |
| Sand | 833 | 1,444 | 2,377 | 3,005 |
| Totals, bulk commodities | 4,217 | 5,128 | 6,564 | 6,877 |
| Percentage of throughput | 16.1 | 17.5 | 20.2 | 19.1 |
| Oil Products | ||||
| Totals, oil products | 9,486 | 10,531 | 10,663 | 11,874 |
| Percentage of throughput | 36.2 | 36.0 | 32.7 | 33.0 |
| Other Cargo | ||||
| Totals, other cargo | 8,787 | 9,804 | 11,440 | 13,996 |
| Percentage of throughput | 33.5 | 33.5 | 35.1 | 38.9 |
The next table shows for each port the total inward and outward cargo in 1973. Loadings of bunker fuels amounting to 453,705 tons are not included. A large proportion of the coastal movement concerns oil tankers working from the Whangarei refinery, while the movements of cars by tourists builds up the Wellington, Picton, and Lyttelton tonnages.
| Port | Inward* | Transhipments | Outward* | Total Tonnage† | ||
|---|---|---|---|---|---|---|
| Coastal | Overseas | Coastal | Overseas | |||
*Excluding transhipments. †Transhipments included twice. | ||||||
| manifest tons | ||||||
| Parengarenga | 4,581 | - | - | 70,762 | - | 75,343 |
| Houhora | 2,249 | - | - | - | - | 2,249 |
| Awanui | 16,759 | - | - | - | - | 16,759 |
| Mangonui | 8,625 | - | - | - | - | 8,625 |
| Whangaroa | 3,333 | - | - | - | - | 3,333 |
| Bay of Islands | 2,481 | - | - | 60 | 14,831 | 17,372 |
| Whangarei | 332,698 | 3,659,355 | - | 3,026,247 | 56,020 | 7,074,320 |
| Mangawhai | - | - | - | 6,989 | - | 6,989 |
| Auckland | 1,400,664 | 2,926,360 | 22,244 | 145,277 | 845,194 | 5,361,983 |
| Onehunga | 137,350 | 14,325 | 270 | 41,963 | 55,584 | 249,762 |
| Raglan | 40,767 | 984 | - | 25 | - | 41,776 |
| Taharoa | - | - | - | - | 891,260 | 891,260 |
| Thames | 878 | - | - | 2,456 | - | 3,334 |
| Tauranga | 568,770 | 427,333 | - | 25,487 | 2,040,524 | 3,062,114 |
| Gisborne | 18,836 | 1,028 | - | 6,579 | 47,263 | 73,706 |
| Napier | 316,440 | 346,386 | - | 4,281 | 416,916 | 1,084,023 |
| Taranaki | 249,254 | 399,277 | - | 192,681 | 156,470 | 997,682 |
| Waverley | - | - | - | - | 1,077,709 | 1,077,709 |
| Wanganui | 63,920 | 1,772 | - | 17 | - | 65,709 |
| Wellington | 1,638,852 | 1,222,094 | 55,847 | 1,356,944 | 398,035 | 4,727,619 |
| Picton | 1,208,209 | 1,242 | - | 804,760 | 30,313 | 2,044,524 |
| Nelson | 129,957 | 54,897 | 10 | 37,431 | 496,166 | 718,471 |
| Motueka | - | - | - | 80 | - | 80 |
| Tarakohe | 30,546 | - | - | 260,388 | - | 290,934 |
| Westport | 1,573 | 13,514 | - | 266,779 | 4,687 | 286,553 |
| Greymouth | 3,010 | 3,345 | - | 20,954 | - | 27,309 |
| Jackson Bay | - | - | - | 5,578 | - | 5,578 |
| Lyttelton | 665,095 | 816,112 | 13,515 | 378,213 | 177,537 | 2,063,987 |
| Chatham Islands | 5,845 | - | - | 1,193 | - | 7,038 |
| Timaru | 124,472 | 94,382 | - | 72,107 | 182,872 | 473,833 |
| Oamaru | 407 | 567 | - | 6,239 | 140 | 7,353 |
| Otago | 215,857 | 240,948 | 1,725 | 24,317 | 223,182 | 707,754 |
| Bluff | 197,821 | 542,995 | - | 29,959 | 307,820 | 1,078,595 |
| Half Moon Bay | 4,851 | - | - | 2,194 | - | 7,045 |
| Totals | 7,394,100 | 10,766,916 | 93,611 | 6,789,960 | 7,422,523 | 32,560,721 |
Transhipment—Cargo under this heading was 94,000 tons the same as for 1972. However, the port of Wellington showed an increase of 7,000 tons for the 1973 year.
Inward Overseas Cargo—The following table shows the tonnage of some major items of inward overseas cargo handled in 1973. Transhipments are included.
| Port | Iron and Steel | Machinery | Fertilisers | Motor Spirit, Kerosene | Oil, Other Mineral | Motor Vehicles and Parts | Gypsum, Plaster of Paris |
|---|---|---|---|---|---|---|---|
| manifest tons | |||||||
| Whangarei | 3 | - | 140,712 | - | 3,505,708 | - | 12,722 |
| Auckland | 397,210 | 89,286 | 391,384 | 401,868 | 14,972 | 308,992 | 73,126 |
| Tauranga | 16,459 | - | 234,395 | 50,035 | - | - | - |
| Gisborne | - | - | - | - | - | - | - |
| Napier | 12,846 | 913 | 282,304 | 9,406 | - | 319 | - |
| Taranaki | 4,669 | 14,557 | 364,666 | - | - | 1,845 | - |
| Wellington | 93,518 | 36,027 | 1,516 | 272,849 | 58,018 | 239,112 | 347 |
| Nelson | 241 | 201 | 9,979 | 4,888 | - | 18,651 | 11,884 |
| Westport | - | - | - | - | - | - | 13,202 |
| Lyttelton | 68,285 | 10,054 | 173,287 | 171,827 | 7,982 | 73,899 | 22,310 |
| Timaru | 665 | 906 | 79,358 | 6,951 | - | 1,757 | - |
| Otago | 17,502 | 2,838 | 107,567 | 23,756 | - | 6,200 | 6,088 |
| Bluff | 5,357 | 792 | 203,159 | 57 | - | 200 | - |
| All other ports | 540 | 403 | - | - | - | 953 | - |
| Totals | 617,295 | 155,977 | 1,988,327 | 941,637 | 3,586,680 | 651,928 | 139,679 |
| Port | Fresh Fruit | Grain | Sugar | Textiles | All Other Goods | Total |
|---|---|---|---|---|---|---|
| manifest tons | ||||||
| Whangarei | - | - | - | - | 210 | 3,659,355 |
| Auckland | 92,101 | 16,122 | 146,591 | 83,879 | 931,884 | 2,947,415 |
| Tauranga | - | 10 | - | - | 126,434 | 427,333 |
| Gisborne | - | - | - | - | 1,028 | 1,028 |
| Napier | - | - | - | 31 | 40,567 | 346,386 |
| Taranaki | - | - | - | - | 13,540 | 399,277 |
| Wellington | 6,484 | 1,132 | 61 | 31,721 | 507,609 | 1,248,394 |
| Nelson | - | - | 735 | 83 | 8,245 | 54,907 |
| Westport | - | - | - | - | 312 | 13,514 |
| Lyttelton | 25,915 | 1 | 2 | 22,795 | 242,839 | 819,196 |
| Timaru | 334 | - | - | - | 4,411 | 94,382 |
| Otago | 668 | - | - | 2,083 | 75,959 | 242,661 |
| Bluff | 1 | 3,012 | - | 27 | 330,390 | 542,995 |
| All other ports | 2,225 | - | 1,247 | 28 | 17,079 | 22,475 |
| Totals | 127,728 | 20,277 | 148,636 | 140,647 | 2,300,507 | 10,819,318 |
Outward Overseas Cargo—In the section dealing with the export trade it is pointed out that pastoral products make up over 80 percent by value of New Zealand's exports. The following table shows how the various ports participated in the handling of the volume of the main items in the outward overseas cargo, including transhipments, during 1973.
| Port | Butter | Cheese | Other Milk Products | Frozen and Preserved Meat | Hides and Skins | Tallow | Wool |
|---|---|---|---|---|---|---|---|
| manifest tons | |||||||
| Bay of Islands | 7,189 | - | - | 7,474 | 46 | - | - |
| Whangarei | 18,256 | - | 34,605 | 13 | - | 371 | - |
| Auckland | 34,987 | 13,086 | 208,044 | 158,634 | 21,242 | 19,657 | 51,795 |
| Onehunga | 365 | 89 | 842 | 1,832 | - | 580 | - |
| Tauranga | 69,520 | 5,579 | 163,193 | 789 | - | 1,702 | 2,618 |
| Gisborne | - | - | 26 | 10,403 | 28 | 699 | 1,957 |
| Napier | 31 | 114 | 11,532 | 100,500 | 13,699 | 13,960 | 60,142 |
| Taranaki | 27,946 | 45,749 | 18,059 | 31,459 | 2,015 | 4,785 | 2,846 |
| Wellington | 12,254 | 17,194 | 28,368 | 142,901 | 20,365 | 5,993 | 76,157 |
| Picton | - | - | - | 3,718 | 17 | 848 | 377 |
| Nelson | 264 | 2,096 | 892 | 2,837 | 112 | 637 | 101 |
| Lyttelton | - | 1,234 | 5,689 | 30,681 | 8,866 | 7,247 | 34,847 |
| Timaru | - | 967 | 122 | 91,780 | 2,913 | 5,895 | 18,421 |
| Otago | 54 | 913 | 333 | 40,609 | 4,142 | 4,395 | 29,736 |
| Bluff | - | 3,557 | 290 | 103,367 | 7,318 | 10,997 | 34,377 |
| All other ports | - | - | - | 137 | - | - | - |
| Totals | 170,866 | 90,578 | 471,995 | 727,134 | 80,763 | 77,766 | 313,369 |
| Port | Fresh Fruit | Beans and Peas | Paper, Newsprint, etc. | Timber, Softwood | Iron Sand | All Other Goods | Total |
|---|---|---|---|---|---|---|---|
| manifest tons | |||||||
| Bay of Islands | - | - | - | - | - | 122 | 14,831 |
| Whangarei | - | - | - | - | - | 2,775 | 56,020 |
| Auckland | 12,883 | 461 | 6,146 | 6,759 | 45 | 319,851 | 853,590 |
| Onehunga | 582 | 500 | 2,078 | 1,538 | 5 | 47,389 | 55,800 |
| Taharoa | - | - | - | - | 891,260 | - | 891,260 |
| Tauranga | 1,006 | - | 135,172 | 1,456,231 | - | 204,714 | 2,040,524 |
| Gisborne | 1,609 | - | - | 22,730 | - | 9,811 | 47,263 |
| Napier | 55,708 | 89 | 1 | 99,626 | - | 61,514 | 416,916 |
| Taranaki | - | - | - | 7,578 | - | 16,033 | 156,470 |
| Waverley | - | - | - | - | 1,077,709 | - | 1,077,709 |
| Wellington | 2,445 | 2,197 | 111 | 1,493 | - | 116,490 | 425,968 |
| Picton | 6,419 | - | - | 12,476 | - | 6,458 | 30,313 |
| Nelson | 69,775 | 648 | - | 415,398 | - | 3,406 | 496,166 |
| Lyttelton | 662 | 17,247 | 12 | 5,454 | - | 65,685 | 177,624 |
| Timaru | - | 15,412 | 3 | - | - | 47,359 | 182,872 |
| Otago | 6,048 | 154 | - | 103,279 | - | 33,519 | 223,182 |
| Bluff | - | 39 | - | 50,428 | - | 97,452 | 307,820 |
| All other ports | - | - | - | - | - | 4,690 | 4,827 |
| Totals | 157,137 | 36,747 | 143,523 | 2,182,990 | 1,969,019 | 1,037,268 | 7,459,155 |
PORTS AND SHIPPING IN THE FUTURE—The revolution in cargo handling brought about by containerisation and similar developments has already been mentioned. The effect on New Zealand within the next few years must be a major rationalisation of parts and shipping services. Containerisation involves major changes through the whole chain of cargo transportation and handling, and in road, rail, and port facilities and capabilities. It means fewer ships, but much bigger and faster ones carrying much greater tonnages. It has been estimated that, whereas in 1974 101 ships were employed in the trade between New Zealand and U.K.-Western Europe and that they made 139 northbound and 126 southbound voyages, in 1979 that trade will be handled by less than 30 ships making a total of 115 voyages. About 95 of these voyages will be handled by 20 container ships. In the U.K. trade, about 70 percent of northbound refrigerated cargo and 97 percent of general cargo will be containerised. On current planning, the shipping lines envisage that from 1979 onwards there will be an average service frequency of one ship every five days, each calling at two or three ports.
Larger faster ships will require further expansion of ports and land-based facilities. Present indications are that Auckland and Wellington will each require three container berths and three cranes. The Ports Authority has proposed that the South Island should also have two container ports—at Port Chalmers and Lyttelton—each with one berth and one crane. It has been estimated that loaded container volumes in the trade between New Zealand and U.K.-Western Europe in 1978 will total about $8,000 per annum—55,000 northbound and 33,000 southbound. Total container movements, involving loading, unloading, and the positioning of empties, will greatly exceed these figures and are estimated at about 196,000 per year.
MARINE OFFICERS' CERTIFICATES—The examinations for masters, mates, and engineers serving in the mercantile marine are conducted by the Marine Division of the Ministry of Transport, the regulations relating to these examinations being similar to those of the Department of Trade and Industry with such modifications as are necessitated by local conditions. The U.K. Department of Trade and Industry recognises the following certificates only as of Commonwealth validity: Extra Master, Master, First Mate, and Second Mate Foreign-going ships, First- and Second-class Steam and Motor Engineers. It is a condition of such recognition that candidates must possess service qualifications and pass examinations similar and not inferior to those prescribed by the Department of Trade and Industry. There are examinations for masters and mates, and for marine engineers in both the foreign-going and home trade.
SHIP SURVEY STATISTICS—The Marine Division of the Ministry of Transport carries out the survey of ships as required by the Shipping and Seamen Act 1952, and 1,152 certificates of survey were issued in 1973. The department is also required to issue certificates to vessels engaged in international voyages in accordance with the provisions of the International Convention for the Safety of Life at Sea 1960, to which New Zealand is a signatory. Also special surveys are made for seaworthiness after damage, for efficiency of equipment, and for tonnage measurement.
LIGHTHOUSE SERVICE—On headlands, capes, reefs, and shoals around the 6,968 kilometres of coastline there are 228 navigational aids. These aids comprise 25 manned lighthouses, 99 automatic lights, 74 day beacons, 14 navigational buoys, 3 fog signals, and 13 radio beacons, and represent a capital investment of $5 million approximately. Their provision, maintenance, and servicing is a responsibility of the Marine Division of the Ministry of Transport, and involves an expenditure of approximately $1 million annually. Lighthouse tenders, aircraft, helicopters, and road transport along with a number of workshops are used to provide the mariner with reliable navigational aids. Light dues collected from ships meet most of the running costs of the service.
The “Xenon gas” light installed on Tiritiri Matangi Island, the main coastal approach light tower to Auckland Harbour, is of 11 million candlepower, and is one of the most powerful in the Southern Hemisphere.
WRECKS—In the case of any wreck or shipping casualty in New Zealand waters a Superintendent of Mercantile Marine, or other person empowered by the Minister of Transport, institutes an inquiry into the cause and circumstances of such casualty. If necessary, a formal investigation is held by a magistrate, who has power to cancel or suspend the certificate of any officer from whose wrongful act or default damage has resulted.
Should any wreck occur on the coast, or in any river or lake, the Receiver of Wrecks for that district has the necessary authority to be used in the preservation of life and property.
Shipping incidents reported during the year ended 31 December 1973 are shown in the following table. It should be noted that the figures list all casualties including small craft.
| Type of Ship | Machinery, Breakdown, and Miscellaneous | Capsizing and Collisions | Stranding and Grounding | Foundering | Fire | Total |
|---|---|---|---|---|---|---|
| Passenger | 1 | 3 | - | - | - | 4 |
| Cargo | - | 3 | 4 | - | 1 | 8 |
| Fishing | 15 | 6 | 20 | 7 | 4 | 52 |
| Dredges, tugs, etc. | 1 | 1 | - | 1 | - | 3 |
| Pleasure craft | 27 | 26 | 11 | 12 | 6 | 82 |
| Totals | 44 | 39 | 35 | 20 | 11 | 149 |
Fishing boat accidents resulted in the loss of 14 vessels and 4 lives on the New Zealand coast, while 1 boat was lost on the coast of the Chatham Islands. A fire on board an overseas cargo vessel while berthed at Port Nelson resulted in the loss of life. Pleasure craft casualties resulted in 27 deaths.
PLEASURE CRAFT—The Census of Population and Dwellings 1971 revealed that 77,529 households (9.7 percent of all households) had one or more pleasure boats. Of such households, 50,971 were in main urban areas as shown in the following table.
| Urban Area | Households | Households with Boats* |
|---|---|---|
| *One or more. | ||
| Whangarei | 9,344 | 1,825 |
| Northern Auckland | 32,990 | 5,505 |
| Western Auckland | 24,008 | 3,338 |
| Central Auckland | 89,963 | 8,701 |
| Southern Auckland | 42,238 | 5,399 |
| Hamilton | 21,839 | 2,241 |
| Tauranga | 11,737 | 1,866 |
| Rotorua | 9,749 | 1,165 |
| Gisborne | 8,316 | 577 |
| Napier | 12,604 | 913 |
| Hastings | 12.998 | 957 |
| New Plymouth | 11,519 | 666 |
| Wanganui | 11,192 | 610 |
| Palmerston North | 16,427 | 944 |
| Upper Hutt Valley | 8,083 | 445 |
| Lower Hutt Valley | 26,061 | 1,736 |
| Porirua Basin | 11,339 | 964 |
| Wellington | 42,791 | 2,431 |
| Masterton | 5,458 | 351 |
| Nelson | 10,905 | 1,526 |
| Christchurch | 81,705 | 5,664 |
| Timaru | 8,589 | 492 |
| Dunedin | 32,843 | 1,927 |
| Invercargill | 14,140 | 728 |
| Totals of 24 urban areas | 556,838 | 50,971 |
| Percentage of total | 100.0 | 9.2 |
Means of propulsion of all 77,529 boats were as follows: outboard motor 35,101; inboard motor 18,651; inboard jet motor 1,494; sails and engine 1,180; sails 9,413; oars and paddles 10,645; other means and not specified 1,045.
RAILWAYS DEVELOPMENT—A network of railways extending over nearly 5,000 kilometres links almost all the principal centres of population in New Zealand and carries a large share of the passenger and freight traffic to and from the towns and cities. Practically all the railway services in the country are provided by the New Zealand Government Railways Department, using the title New Zealand Railways for trading purposes. The department also operates road services over more than 8,000 route kilometres of highways; and a rail and road vehicle and passenger ferry service across Cook Strait between Wellington and Picton. A total staff of almost 21,000 people is employed by the department.
Recent years have witnessed notable progress in development of the system and a steady increase in the carrying capacity of its main lines. Extensive use is being made of the latest developments in railway-transport technology, including diesel and electric traction, transistorised equipment for centralised traffic control, mechanised equipment for freight handling and track-maintenance work, and electronic data-processing machines to assist with accounting and statistical operations. Many new types of goods wagons have been and are being introduced, and numerous station buildings, goods sheds, bridges, etc., are being replaced by up-to-date structures in a continuing programme.
The largest railway construction project in recent years was completed with the opening in January 1971 of the 75-acre Te Rapa marshalling yard near Frankton. The massive yard is the first in New Zealand to have a semi-automatic hump-shunting system, while the refined electronic devices incorporated in the system make it also the most advanced. Designed initially to handle some 3,000 wagons a day, it will ultimately have a capacity to sort 5,000 daily.
A major project still in the course of construction is the 24-kilometre Kaimai Deviation, including a 9-kilometre tunnel through the Kaimai Hills, which will shorten the railway distance between the Waikato and the Bay of Plenty districts.
Also under construction is the 9-kilometre Mangaweka Deviation between Mangaweka and Utiku. This deviation which includes three tall bridges with a total length of 610 metres will eliminate a difficult section of the main trunk line which is very expensive to maintain and replace it with a low-maintenance, all-weather, high-speed route.
A loan of $4.13 million was drawn from the International Bank for Reconstruction and Development early in 1971 to assist a 6-year railway capital development programme. The loan was to meet the overseas content of the cost of wagons and workshops and signalling equipment due for delivery during the first 3 years of the new programme. This loan followed upon a I.B.R.D. loan of $36 million made available in 1965 to cover the overseas content of the cost of a rolling stock re-equipment programme which was completed in 1970 at a cost of $54 million.
BRIEF HISTORY—In 1860 a contract was let by the provincial government of Canterbury for the construction of a railway from Lyttelton to Christchurch, and the first portion of this line was opened on 1 December 1863*. A line from Invercargill to Bluff Harbour was opened on 5 February 1867, and meanwhile, in 1865, the Auckland Provincial Council had begun construction of a line from Auckland to Drury.
In 1870 the Central Government established an Immigration and Public Works Department which had as one of its main objects the building of a system of railways to open up the country for settlement. By 31 March 1880, 1,182 route miles of State-owned railways were open for traffic, and by 31 March 1900 more than 2,100 route miles in 10 separate sections were in use. The 369-mile trunk line between Christchurch and Invercargill was completed in January 1879, but it was November 1908 before the 426-mile North Island main trunk railway between Auckland and Wellington was ready for traffic throughout.
Other main lines were completed, to link most of the short isolated sections. The last line to be completed was that from Christchurch to Picton, in 1945. Since then, between 1950 and 1957, 63 miles of branch lines have been built in the North Island to serve the extensive man-made forests.
In 1957 the main highway between Blenheim and Nelson was deemed, for the purpose of calculating passenger fares and freight charges, to be a “notional railway” connected at Blenheim to the railway system.
* A special article in the 1963 issue of the Yearbook (pp. 1175-7195) outlined the first 100 years of railway development in New Zealand.
Over the years since the railways were first built, vast improvements have been made and many sections reconstructed at considerable expense to ease gradients, shorten distances, and reduce curvature. Several of these major railway deviations involved the boring of long tunnels, such as those on the Wellington-Tawa deviation, opened in June 1937; the Turakina-Okoia deviation, opened in December 1947; and the Rimutaka deviation between Upper Hutt and Featherston, opened in November 1955.
EXTENT OF THE SYSTEM—The total route length of railways vested in the New Zealand Government Railways Department and open for traffic at 31 March 1974 was 4,797 kilometres—2,610 kilometres in the North Island and 2,187 in the South Island. In addition, the Railways Department was working traffic over a further 7 kilometres of railways owned by other Government departments. Double line was worked over a total of 254 route kilometres, of which 208 kilometres were in the North Island.
A total of 100 route kilometres of railway electrified on the 1,500-volt direct current, overhead contact system was in use at 31 March 1974. The 14-kilometre Otira -Arthur's Pass section of the South Island transalpine line, including the Otira Tunnel, was electrified in 1923; the 11-kilometre Wellington - Johnsonville line in 1938; and the 39-kilometre Wellington - Paekakariki line in 1940. The first section of the Wellington - Hutt Valley electrification was brought into operation in 1953, and the last stage of this project, covering 35 route kilometres, was completed in July 1955. The 10-kilometre Christchurch - Lyttelton section, including the Lyttelton Tunnel was electrified in 1929 but changed to diesel traction in 1970.
RAILWAY CONSTRUCTION AND ENGINEERING—In most instances, Government railways in New Zealand were constructed by the Public Works Department, now the Ministry of Works and Development, and handed over to the Railways Department upon completion. Recent practice has been for the Ministry of Works and Development to construct the earthworks, bridges, tunnels, and buildings, and for the Railways Department to lay the tracks and install signals.
Track—All track is laid to a nominal gauge of 1,067 mm. The major routes arc laid with rails 85 or 91 lb per yard (42.2 or 45.1 kg/m) but these lines will be progressively relaid with rails weighing 50 kg per metre. Secondary and branch lines have generally been laid with rails weighing 55, 70, and 72 lb per yard (27.3, 34.7, and 35.7 kg/m) and the practice is to relay these lines with heavier rails from the main lines. Treated Pinus radiata sleepers, laid about 1,480 per kilometre, have gradually replaced Australian hardwood sleepers, and locally manufactured concrete sleepers are also being used on selected areas on the main routes. Track with fishplates and bolts at every joint is progressively replaced with rails welded at the joints on all major routes and on some secondary lines.
Bridges—To carry the railways across gorges, rivers, and streams in New Zealand, about 2,600 bridges and viaducts have been built with an aggregate length of 90 kilometres. The longest railway bridge is that over the Rakaia River, 55 kilometres south of Christchurch. Completed in 1939 to replace an original timber structure of the 1870s, it is 1,743 metres in length.
The highest viaduct is the Mohaka, completed in 1937 to carry the Napier - Gisborne railway 97 m above the bed of the Mohaka River. Twenty-one New Zealand railway viaducts altogether carry the rails more than 33 m above the streams they cross.
Tunnels—There are 183 railway tunnels, with an aggregate length of 85 kilometres in use, 107 in the North Island and 76 in the South Island. The two longest tunnels are the Otira (8.5 kilometres) on the Midland Line in the South Island, opened in 1923; and the Rimutaka (8.8 kilometres) on the Wairarapa line in the North Island, opened in 1955. Excluding city cube railways, these stand nineteenth and sixteenth respectively in a list of the world's longest railway tunnels. The Kaimai Tunnel, under construction on the Kaimai. Deviation, will be 8.8 kilometres long.
Cook Strait Rail/Air Freight Service—An air freight service across Cook Strait was commenced in February 1947; information on its operation is given in subsection 11D.
Cook Strait Rail Ferry Service—Two ferries carrying rail and road vehicles, and passengers, are operated by the Railways Department between Wellington and Picton. The Aramoana (4,160 tons) and Aranui (4,542 tons) are each designed to carry a maximum of 30 railway wagons, or about 85 motorcars, on the vehicle deck and a further 30 motorcars in an upper-deck garage. There is all-weather accommodation in lounges and cabins in each vessel for about 500 passengers, but it is possible to carry just over 1,000 passengers per ship on special occasions. Regular sailings with the Aramoana began in August 1962 and a two-ship timetable was introduced with the advent of the Aranui in June 1966. In November 1971 the Railways Department took over maritime operation of these ferries from the Union Steam Ship Company.
A third ferry, Arahanga, entered the service in December 1972, and a fourth vessel, Aratika, in September 1974. Both are of a larger design than the first two ferries and are designed for freight only, with limited accommodation for road truck drivers.
ROLLING STOCK:Passenger Cars—The first diesel railcars on New Zealand railways were placed in service in 1936. At 31 March 1973 a fleet of 36 was in use on passenger services.
Multiple-unit electric coaches were first introduced on the Johnsonville line in 1938. By 1956 a fleet of 49 motor coaches and 79 trailer coaches was in use on Wellington suburban train services. A typical three-coach set comprising one 450 kW motor coach and two trailer coaches weighs 98 tonnes unladen, measures 57.5 m overall, and scats 200 passengers. This stock can accelerate rapidly from stops and operates up to 80 km/hr in normal service.
Wagons—The Railways Department's fleet of goods and livestock wagons at 31 March 1974 totalled 29,775, with a total carrying capacity of 445,400 tonnes. In recent years thousands of new wagons have been introduced, including long, covered bogie wagons with wide doorways for mechanical loading of palletised freight, for use on express goods trains. Special-purpose wagons include those designed for log traffic, packaged timber, and bulk commodities such as cement, flour, plaster, heated tallow, sulphuric acid, and aluminium sulphate, and wagons for coal traffic for the Mission Bush steel mill. Many bogie flat-top wagons have also been built or modified for the ever-increasing volume of container traffic. In addition to the wagons owned by the department, another 249 privately-owned wagons are also in use, mainly for petrol and cement traffic.
SPECIAL SERVICES—A fast daytime express diesel railcar with hostess service was introduced between Wellington and Auckland in October 1968, running three times a week each way. In December 1972 the Blue Streak railcars used on this run were transferred to the Wellington - New Plymouth route. New Silver Fern diesel-electric railcars, fully air-conditioned, took over the Wellington-Auckland service, the frequency of which was doubled to six times a week.
Meanwhile, in December 1970, the Southerner diesel-powered express trains with refurbished cars and on-train buffet service were introduced between Christchurch and Invercargill, and in September 1971 two complete new air-conditioned sleeping-car trains were placed in service between Wellington and Auckland. These night Silver Star expresses provide the highest standard of passenger travel comfort on New Zealand Railways.
Another refurbished express train, the Endeavour, was placed in service between Wellington and Napier in November 1972. Buffet cars on the Southerner, Silver Star, and Endeavour provide light meal and refreshment services for passengers. The ordinary express trains between Wellington and Auckland are also being upgraded. This new service, expected to be ready in 1975, is to be called the Northerner.
MOTIVE POWER—From 1949 steam power was steadily replaced by diesel traction. All steam locomotives in the North Island were replaced by diesel locomotives by the end of 1967, and those in the South Island by 1971 with the exception of three retained for a Lumsden-Kingston tourist vintage train. In November 1972 15 “DX" diesel electric locomotives weighing 97 tonnes and with double the horsepower of the “DA" class locomotives were introduced to haul express trains between Wellington and Auckland.
The proportions of railway traffic moved by the different types of motive power are shown in the following table.
| Year Ended 31 March | Percentage of Total Traffic Moved by | ||||
|---|---|---|---|---|---|
| Steam Locomotives | Diesel Locomotives | Diesel Railcars | Electric Locomotives | Electric Multiple Units | |
| 1964 | 34.3 | 54.2 | 4.2 | 2.9 | 4.4 |
| 1965 | 30.3 | 58.3 | 3.8 | 2.9 | 4.2 |
| 1966 | 26.3 | 63.0 | 3.7 | 2.8 | 4.2 |
| 1967 | 21.8 | 67.6 | 3.7 | 2.8 | 4.1 |
| 1968 | 18.1 | 72.6 | 3.1 | 2.0 | 4.2 |
| 1969 | 8.4 | 83.7 | 2.7 | 1.1 | 4.1 |
| 1970 | 1.2 | 91.7 | 2.5 | 1.0 | 3.6 |
| 1971 | 0.8 | 92.5 | 2.4 | 0.8 | 3.5 |
| 1972 | 0.2 | 93.4 | 2.2 | 0.6 | 3.6 |
| 1973 | 0.1 | 94.3 | 1.9 | 0.5 | 3.2 |
| 1974 | 0.1 | 94.5 | 2.0 | 0.5 | 2.9 |
There were 285 main-line diesel-electric locomotives at 31 March 1974. and 14 electric locomotives apart from 278 diesel shunting locomotives.
REVENUE AND EXPENDITURE—Gross revenue and expenditure on the railways (including subsidiary services) are shown in the following table.
| Year Ended 31 March | Gross Revenue | Expenditure | Net Revenue |
|---|---|---|---|
*In addition, a 53rd week's revenue of $2,014,433 was taken into the department's accounts for the year ended 31 March 1969. Because there was no corresponding expenditure, this sum has not been included in the tabulated figures, in order to maintain comparability with previous years. The additional revenue became available because accounting procedures over the past few years had taken only 52 weeks' (364 days') revenue into account each year, and the additional days had now accumulated into a full week. †Deficit recovered from General Reserve. ‡Deficit met by National Development Loans. §Deficit recovered from vote: stabilisation. | |||
| $(thousand) | |||
| 1969 | 90,015* | 86,495 | 3,520* |
| 1970 | 99,729 | 94,121 | 5,607 |
| 1971 | 105,242 | 112,827 | -7,585† |
| 1972 | 122,368 | 126,696 | -4,328‡ |
| 1973 | 134,990 | 138,340 | -3,350‡ |
| 1974 | 152,179 | 160,832 | -8,653§ |
The chief items of expenditure for 1973-74 were: wages $101,996,210, locomotive fuel (including electricity), $3,295,482; stores and material, $22,554,852; depreciation, $11,909,430; miscellaneous, $21,076,130.
The revenue and expenditure for recent years, distinguishing between railway operation and other items, are given in the following table.
| Year Ended 31 March | Gross Revenue | Expenditure Net | Revenue or Loss | |||
|---|---|---|---|---|---|---|
| Railway Operation | Subsidiary Services, etc. | Railway Operation | Subsidiary Services, etc. | Railway Operation | Subsidiary Services, etc. | |
| *See footnote to preceding table. | ||||||
| $(thousand) | ||||||
| 1969 | 74,602 | 15,413 | 72,892 | 13,603 | +1,710 | +1,810* |
| 1970 | 83,194 | 16,535 | 79,836 | 14,286 | +3,358 | +2,249 |
| 1971 | 86,999 | 18,243 | 96,502 | 16,324 | -9,503 | +1,919 |
| 1972 | 101,296 | 21,072 | 107,277 | 19,419 | -5,981 | +1,653 |
| 1973 | 112,162 | 22,828 | 117,197 | 21,143 | -5,035 | +1,685 |
| 1974 | 125,789 | 26,390 | 135,363 | 25,469 | -9,574 | +921 |
The respective Island figures of revenue and expenditure for railway operation only (i.e., omitting subsidiary services) are given below for the 1973-74 year.
| Area | Revenue | Expenditure | Net Revenue or Loss | Ratio of Expenditure* to Revenue |
|---|---|---|---|---|
| $(thousand) | percent | |||
| North Island | 90,851 | 94,274 | -3,423 | 103.8 |
| South Island | 34,938 | 41,089 | -6,151 | 117.6 |
| Total | 125,789 | 135,363 | -9,574 | 107.6 |
The revenue and expenditure of the various subsidiary services conducted by the Railways Department is set out in the following table. Full working costs are charged against these services, and interest which is debited to road services and rail ferries is credited to miscellaneous receipts as revenue.
| Service | Revenue | Expenditure | ||||
|---|---|---|---|---|---|---|
| 1971-72 | 1972-73 | 1973-74 | 1971-72 | 1972-73 | 1973-74 | |
| *Accounting system changed by excluding ancillary lorry hire for rail operations. | ||||||
| $(thousand) | ||||||
| Advertising service | 331 | 355 | 319 | 251 | 268 | 272 |
| Departmental houses | 959 | 1,046 | 1,106 | 2,170 | 2,320 | 2,453 |
| Road services— | ||||||
| Passenger and goods | 10,396 | 9,932* | 10,250* | 10,393 | 10,003* | 10,969* |
| Cook Strait rail ferry service | 7,890 | 9,769 | 12,779 | 6,604 | 8,552 | 11,775 |
| Miscellaneous | 1,496 | 1,726 | 1,936 | - | - | - |
| Totals | 21,072 | 22,828 | 26,390 | 19,419 | 21,143 | 25,469 |
Revenue—In the following table the railway operating revenue is classified according to the class of traffic, etc., from which it was derived.
| Year Ended 31 March | Passenger Traffic | Goods, Livestock, and Parcels | Catering Services | Total |
|---|---|---|---|---|
| $(thousand) | ||||
| 1969 | 5,419 | 67,477 | 1,706 | 74,602 |
| 1970 | 5,672 | 75,709 | 1,813 | 83,194 |
| 1971 | 5,830 | 79,099 | 2,070 | 86,999 |
| 1972 | 7,010 | 92,018 | 2,268 | 101,296 |
| 1973 | 7,174 | 102,774 | 2,214 | 112,162 |
| 1974 | 7,501 | 115,820 | 2,468 | 125,789 |
The revenue from passenger fares and luggage during the year 1973-74 represented an expenditure on railway travel of $2.52 per head of mean population. The total railway operating revenue was equal to $42.33 per head.
Expenditure—The railway operating expenditure under various heads is now given.
| Year Ended 31 March | Maintenance of Way and Works | Maintenance of Rolling Stock | Locomotive Transportation | Traffic Transportation | Head Office and General Charges* | Catering Services | Total |
|---|---|---|---|---|---|---|---|
| *Includes superannuation subsidy. | |||||||
| $(thousand) | |||||||
| 1969 | 17,229 | 18,152 | 11,513 | 21,674 | 2,501 | 1,823 | 72,892 |
| 1970 | 19,278 | 20,478 | 11,833 | 23,475 | 2,856 | 1,916 | 79,836 |
| 1971 | 24,105 | 23,762 | 14,046 | 28,867 | 3,453 | 2,269 | 96,502 |
| 1972 | 26,712 | 24,588 | 15,600 | 32,617 | 5,282 | 2,478 | 107,277 |
| 1973 | 29,899 | 26,314 | 16,943 | 34,619 | 5,901 | 3,521 | 117,197 |
| 1974 | 32,573 | 32,234 | 19,455 | 40,130 | 6,915 | 4,056 | 135,363 |
Expenditure has been influenced by progressively higher rates of pay and improved conditions of employment.
Capital Expenditure—The expenditure on capital works and new equipment is set out in the following table.
| Item | 1972 | 1973 | 1974 |
|---|---|---|---|
| $(000) | $(000) | $(000) | |
| Plant and equipment | 1,742 | 2,198 | 792 |
| Works programme | 4,797 | 5,038 | 7,529 |
| Rolling stock | 10,282 | 11,714 | 6,565 |
| Motor vehicles | 1,548 | 1,029 | 819 |
| Rail ferries | 4,973 | 3,442 | 555 |
| Totals | 23,342 | 23,421 | 16,260 |
This capital expenditure has been met from the department's own depreciation reserves, National Development Loans, a loan granted by the International Bank for Reconstruction and Development, and overseas credit.
The relative proportions of capital funded from these sources were as follows:
| Source | 1972 | 1973 | 1974 | |||
|---|---|---|---|---|---|---|
| $(000) | percent | $(000) | percent | $(000) | percent | |
| Railway depreciation | 12,579 | 54 | 18,029 | 77 | 12,851 | 76 |
| National Development Loan | - | - | - | - | 1,514 | 9 |
| I.B.R.D. loan | 444 | 2 | 2,474 | 11 | - | - |
| Overseas credit | 10,319 | 44 | 2,918 | 12 | 1,896 | 12 |
| Totals | 23,342 | 100 | 23,421 | 100 | 16,261 | 100 |
RAIL PASSENGER TRAFFIC—The completion of the suburban railway electrification at Wellington in 1955 and the introduction of fast railcar services between 1955 and 1959 resulted in peak passenger patronage in 1961-62, but since then there has been a steady decline in passenger journeys in face of competition from other forms of transport.
The decline in non-suburban passenger traffic is attributable to the increased use of private cars and the development of air services. The operations of the department's Road Services Branch are outlined under another heading at the end of this section.
The following table sets out the numbers of rail passenger journeys and the corresponding receipts.
| Year Ended 31 March | Number of Journeys | Passenger Revenue | ||||
|---|---|---|---|---|---|---|
| Suburban | Non-suburban | Total | Suburban | Non-suburban | Total | |
| (000) | (000) | (000) | $(000) | $(000) | $(000) | |
| 1969 | 20,300 | 1,962 | 22,261 | 2,052 | 3,367 | 5,419 |
| 1970 | 19,183 | 1,848 | 21,031 | 2,181 | 3,491 | 5,672 |
| 1971 | 19,097 | 1,911 | 21,008 | 2,210 | 3,620 | 5,830 |
| 1972 | 18,335 | 1,780 | 20,116 | 2,794 | 4,216 | 7,010 |
| 1973 | 17,060 | 1,505 | 18,565 | 2,937 | 4,237 | 7,174 |
| 1974 | 17,212 | 1,732 | 18,944 | 2,966 | 4,535 | 7,501 |
GOODS AND LIVESTOCK TRAFFIC—The following table shows the volume of goods and livestock traffic in tonnes and tonne-kilometres, and the revenue received from goods, livestock, and parcels traffic consigned by rail.
| Year ended 31 March | Goods and Livestock Carried (excluding Parcels) | Total Revenue from Goods, Livestock, and Parcels Traffic | |||
|---|---|---|---|---|---|
| Tonnes | Net Tonne-kilometre | North Island | South Island | Total | |
| *Revenue from rail parcels traffic was $2,645,738 in 1972-73 and $2,913,416 in 1973-74. | |||||
| (000) | million | $(000) | $(000) | $(000) | |
| 1969 | 10,971 | 2,457.5 | 47,649 | 19,827 | 67,476 |
| 1970 | 11,778 | 2,741.6 | 54,210 | 21,499 | 75,709 |
| 1971 | 12,040 | 2,872.6 | 57,107 | 21,992 | 79,099 |
| 1972 | 11,492 | 2,776.9 | 66,327 | 25,691 | 92,018 |
| 1973 | 12,321 | 3,065.0 | 74,026 | 74,748 | 102,774* |
| 1974 | 13,378 | 3,627.5 | 82,921 | 32,899 | 115,820* |
RAIL FERRY TRAFFIC—Traffic statistics for the rail ferry service across Cook Strait between Wellington and Picton are given in the following table.
| Year ended 31 March | Number of Return Crossings | Total Passenger Journeys | Motor Vehicles (of all kinds) | Freight in Railway Wagons | ||
|---|---|---|---|---|---|---|
| Number | Manifest Tonnes | Deadweight Tonnes | Manifest Tonnes | |||
| 1969 | 1,032 | 372,984 | 76,067 | 386,420 | 427,801 | 690,827 |
| 1970 | 1,049 | 433,699 | 89,055 | 452,399 | 515,397 | 764,132 |
| 1971 | 996 | 447,215 | 90,533 | 459,908 | 506,297 | 698,958 |
| 1972 | 1,031 | 508,807 | 95,942 | 487,385 | 521,314 | 673,049 |
| 1973 | 1,319 | 545,407 | 109,816 | 557,865 | 627,934 | 826,945 |
| 1974 | 1,790 | 599,064 | 126,925 | 644,779 | 932,469 | 1,238,191 |
Financial statistics for the Cook Strait ferry service are as follows.
| Year Ended 31 March | Revenue | Expenditure, Total | ||||
|---|---|---|---|---|---|---|
| Passenger | Refreshment | Passengers Motor Vehicles | Goods (Rail and Road) | Total | ||
| $(000) | $(000) | $(000) | $(000) | $(000) | $(000) | |
| 1969 | 634 | 169 | 770 | 3,749 | 5,323 | 4,221 |
| 1970 | 720 | 202 | 893 | 4,076 | 5,891 | 4,495 |
| 1971 | 797 | 226 | 959 | 4,215 | 6,197 | 5,346 |
| 1972 | 1,114 | 305 | 1,212 | 5,259 | 7,890 | 6,604 |
| 1973 | 1,463 | 328 | 1,545 | 6,433 | 9,769 | 8,552 |
| 1974 | 1,634 | 387 | 1,828 | 8,930 | 12,779 | 11,775 |
The following diagram illustrates the traffic on the railways and road services.
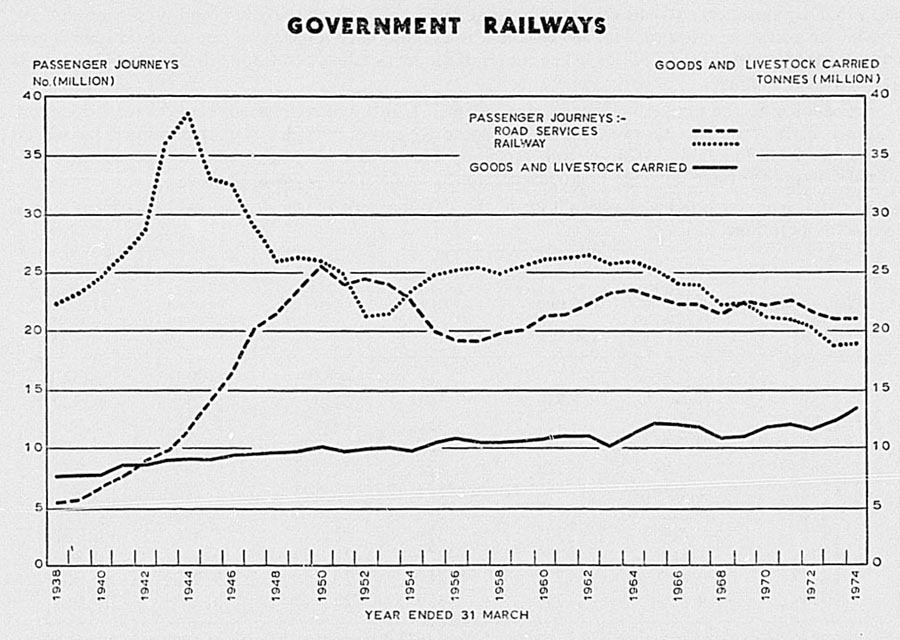
RAILWAY EMPLOYEES—The average number of persons employed by the State railways throughout the year ended 31 March 1974 was 20,835 (excluding 430 sea-going staff employed on the Cook Strait rail ferries), compared with 20,799 a year earlier.
ACCIDENTS AT LEVEL CROSSINGS—Accidents at level crossings with roads resulted in the death of 8 people and injury to 36 others in 1973-74; in the previous year 11 were killed and 63 injured. In furtherance of departmental policy, an additional 13 automatic road-crossing alarms were installed in 1973-74.
PRIVATE RAILWAYS—There are a number of short private railways in New Zealand, principally lines serving collieries and other industrial undertakings. There is a 7-mile line of the Ohai Railway Board, extending from Wairio (north-west of Invercargill) to coal mines at Ohai. The Whakatane Board Mills Ltd., in the North Island operates a 6 1/2-mile private line from Awakeri to their mill at Whakatane in the Bay of Plenty.
RAILWAY OPERATED ROAD SERVICES—There is a network of railway-operated road services the origin of which dates back to November 1926 when a bus service between Napier and Hastings was purchased. Others were acquired in the following years (notably the services within the Hutt Valley and between the Hutt Valley and Wellington in 1927 and 1928), but it was 1934 before the first long-distance coach service was taken over. The main development of the network took place between 1936 and 1951, when the route distance over which licences were held rose from 418 to 9,641 km. Now the Railways Department runs more than 25 percent of the total vehicle mileage of all licensed road passenger service operators in New Zealand (see section 11C), and maintains in its fleet more than 20 percent of all the vehicles used to provide road passenger services throughout the country. At 31 March 1974, the Railways Department's road services branch employed a staff of 1,510.
Suburban bus services at Auckland, Rotorua, Hastings, Hutt Valley, Wellington-Khandallah, Titahi Bay, Paraparaumu, and Dunedin, with a fleet of 251 vehicles at 31 March 1974, carried 13,275,672 passengers and earned a total revenue of $2,126,526. All the other road passenger services, both long and short distance, with 589 coaches, buses, and other vehicles, carried 7,670,956 passengers and earned a revenue of $7,374,597. The routes of the services in operation at 31 March 1974 covered 8,924 km of highway.
In addition to the road passenger services, a small number of road goods services were operated. Goods traffic on these services, for which some 87 motor vehicles were maintained, produced a further $748,744 in 1973-74. A Rail Ancillary Goods Service is operated by the department's Traffic Branch for the carriage of goods consigned to or from wayside stations.
The following selected statistics illustrate the development of the Railways Department's road services operations.
| Year Ended 31 March | Route Kilometres at 31 March* | Number of Passenger Vehicles at 31 March | Number of Other Vehicles at 31 March | Total Passenger Journeys | Total Passenger and Goods Revenue | Total Expenditure, Including Interest Charges |
|---|---|---|---|---|---|---|
*Route mileage for which licences are held. †From 1 April 1972 the cost of Rail Ancillary goods road service was no longer included in Road Services revenue and expenditure. | ||||||
| (000) | $(000) | $(000) | ||||
| 1951 | 9,641 | 749 | 301 | 24,091 | 4,216 | 4,320 |
| 1956 | 9,400 | 763 | 356 | 19,271 | 5.170 | 5,036 |
| 1961 | 9,258 | 735 | 332 | 21,370 | 5,674 | 5,638 |
| 1966 | 9,426 | 729 | 378 | 22,297 | 6,385 | 6,343 |
| 1969 | 9,524 | 765 | 372 | 22,585 | 7,208 | 7,241 |
| 1970 | 9,523 | 777 | 377 | 22,175 | 7,760 | 7,714 |
| 1971 | 9,561 | 776 | 379 | 22,633 | 8,521 | 8,787 |
| 1972 | 9,588 | 786 | 376 | 21,763 | 10,396 | 10,393 |
| 1973 | 9,612 | 778 | 360 | 20,866 | 9,932† | 10,003† |
| 1974 | 9,612 | 769 | 359 | 20,947 | 10,250† | 10,969† |
GENERAL—Capital investment in New Zealand's reading and road transport system exceeds that of all other forms of transport services. There are 90,000 kilometres of road and over 1.4 million motor vehicles, while the population census in 1971 revealed that there were 37,790 road transport drivers, 18,215 persons whose occupations involved carrying and cartage services, 37,277 persons occupied in the repair, servicing, and sale of motor vehicles and 8,604 persons engaged in motor-vehicle assembly and body building.
ROADS AND BRIDGES—Rising levels of investment in roads and road transport are a measure of the importance of motor vehicles in our modem environment. This form of transportation developed mainly because it permitted a way of life people desired and a form of travel which they found highly convenient, but investment levels have become so large and all-pervasive that they affect every corner of our social, economic, and political life. Furthermore, future economic development depends largely on the mobility of the motor vehicle. This mobility has been achieved by the development of an effective roading network and will be retained and improved only through progressive policies aimed at meeting future needs. For these reasons roads and road transport can be expected to play an increasingly important part in New Zealand's national development. In terms of tonne/kilometres of freight carried, road transport has doubled in the last 10 years and now comprises approximately half of total freight movement. Farm production, for example, relies heavily on road transport.
The cost of providing adequate roads in New Zealand as a proportion of annual investment is relatively high in comparison with other countries. The cost of construction varies considerably from place to place, depending upon topography, soil types, rainfall and availability of aggregate. While a road of 6 m sealed width can be built for $3,000 per kilometre in some places, a road of comparable standard can cost anything up to $30,000 per kilometre in less favourable localities.
Annual roading expenditure by central and local government now exceeds $100 million, or approximately 2.3 percent of gross national product. Maintenance comprises about one-third of the expenditure.
Because of its many swiftly-flowing rivers and streams and its inland gorges and deep ravines, New Zealand is faced with major bridging problems, which are perhaps different in character and more complex than those generally found elsewhere. A major programme of replacement and new construction has been under way for many years. In recent years expenditure from the National Roads Fund has resulted in over 8 km of new bridging being built each year; some 12 percent of expenditure is involved in bridging.
Motorways are expensive to construct and are justified only in areas of high traffic density. They require strong foundations and thick surfacings to stand up to the heavy, fast, and continuous traffic. They confer two great benefits—greatly increased traffic capacity and greater safety. The limited number of access points, designed to permit smooth and safe entrance and exit, and the complete absence of ordinary intersections, contribute substantially to safety and the uninterrupted, fast flow of traffic, which also reduces transport costs.
The Auckland motorway system is one of the largest engineering undertakings ever attempted in New Zealand and one which is changing the face of metropolitan Auckland. An indication of the size and complexity of motorway design is gained from the statement that the cost of the large dual interchange for the Auckland inner city part of the motorway system will be of the order of $20 million, including land purchase. The 1,500 m Thorndon overbridge on the Wellington Motorway is the largest bridge contract in the history of the Ministry of Works and Development.
Details of formed roads and streets at 31 March 1973 are given in the following table.
| Nature of Surface | Cities and Boroughs | Counties | Town Districts | Total | |
|---|---|---|---|---|---|
| County Roads | State Highways and Motorways | ||||
| km | |||||
| Paved and sealed | 9,320 | 24,114 | 10,187 | 151 | 43,772 |
| Metal or gravel | 750 | 42,091 | 1,098 | 56 | 43,995 |
| Unmetalled | 103 | 7,519 | - | 11 | 7,633 |
| Totals, formed roads | 10,173 | 73,724 | 11,285 | 219 | 95,400 |
There are 9,773 bridges of 7.6 m and over with a total length of 277,480 metres.
Auckland Harbour Bridge Traffic—From May 1959, when the toll bridge opened, to March 1974, Auckland harbour bridge has carried 182 million vehicles. In the 1973-74 year the bridge has a daily average of 60,958 vehicles crossing it: the highest daily figure being a record 79,613. With traffic totals continuing to grow it is estimated that the eight-lane facility will reach its ultimate carrying capacity in 1980. Traffic totals for March years are shown in the following table.
| Class of Vehicle | 1968-69 | 1969-70 | 1970-71 | 1971-72 | 1972-73* | 1973-74* |
|---|---|---|---|---|---|---|
| *From April 1972 one-way (northbound) toll collection was introduced and no specific vehicle analysis is now available for southbound traffic. | ||||||
| (thousand) | ||||||
| Cars | 12,385 | 13,976 | 15,630 | 17,318 | 9,522 | 10,348 |
| Motor cycles, etc. | 242 | 248 | 277 | 365 | 219 | 248 |
| Buses | 264 | 270 | 270 | 268 | 137 | 136 |
| Trucks | 465 | 505 | 519 | 543 | 301 | 339 |
| Non-revenue traffic | 204 | 154 | 141 | 126 | 63 | 60 |
| Southbound | .. | .. | .. | .. | 10,244 | 11,119 |
| Totals | 13,560 | 15,154 | 16,836 | 18,620 | 20,485 | 22,250 |
Christchurch-Lyttelton Road Tunnel—This tunnel was opened in 1964 and is approximately 2 kilometres long. There is an increasing volume of traffic using the Christchurch-Lyttelton road tunnel as shown in the following table for March years.
| Class of Vehicle | 1968-69 | 1969-70 | 1970-71 | 1971-72 | 1972-73 | 1973-74 |
|---|---|---|---|---|---|---|
| Cars | 931,669 | 991,400 | 1,081,664 | 1,223,844 | 1,330,097 | 1,447,385 |
| Motor cycles, etc. | 68,421 | 62,003 | 59,904 | 71,799 | 72,336 | 74,583 |
| Buses | 14,233 | 14,377 | 14,321 | 15,781 | 23,281 | 23,477 |
| Trucks | 182,970 | 200,505 | 215,929 | 218,373 | 245,506 | 256,612 |
| Non-revenue traffic | 33,206 | 34,138 | 36,148 | 35,302 | 37,380 | 39,379 |
| Totals | 1,230,499 | 1,302,423 | 1,407,966 | 1,565,099 | 1,708,600 | 1,841,436 |
ROADS ADMINISTRATION—The main statutes covering roads administration in New Zealand are the Public Works Act 1928, the Municipal Corporations Act 1954, the Counties Act 1956 and the National Roads Act 1953. Administration of the country's roading system is exercised by municipalities in respect of streets, by county councils in respect of county roads, and by the National Roads Board in respect of State highways.
The National Roads Board is charged with the responsibility of providing an adequate roading system balanced to meet the country's needs. The Board came into being in 1954 as the result of the passing of the National Roads Act. This same Act provided for the establishment of the National Roads Fund. Under the chairmanship of the Minister of Works and Development, the National Roads Board is an organisation of 10 members, representative of the private motorists, commercial vehicle owners, counties, municipalities, the Ministry of Works and Development, and Ministry of Transport. It is of interest to note that Government members are in a minority. The representative nature of the Board ensures that the widest possible background of knowledge and experience is brought to bear on roading matters. Essentially the Board is a politically orientated policy-making body,; it is required to think nationally and to act nationally. The most important functions of the Board are:
to administer the National Roads Fund.
to provide a roading system adequate for New Zealand's needs.
to advise Government on all matters concerning roading including the provision of finance.
to assist and advise local authorities on roading problems.
to undertake at intervals of not more than five years a comprehensive survey of the roading position in New Zealand.
The money in the National Roads Fund is derived from road taxation paid by the users, the private motorist and the commercial vehicle operator. Through this roads fund the money is returned to the road user in the form of safer, smoother, more economical travel. It is an inviolate fund. Under the legislation by which it was brought into operation on 1 April 1954, all taxation paid into it must be immediately available and be used for roading purposes. In effect the National Roads Act provided for an independent fund at the disposal of an independent board and removed the element of uncertainty associated with annual appropriation of funds through Parliament. Nevertheless opportunity is provided for Parliament to debate the Board's activities.
The National Roads Board can be likened to a board of directors with the Minister of Works and Development as chairman and Director of Roading as chief executive officer. The Board meets regularly once a month. Most of the business is conducted in open meeting with representatives of the press in attendance.
The Board employs no staff directly but the Ministry of Works and Development provides an engineering and administrative service for which it is paid 5 percent of total National Roads Board expenditure. The roading division of the Ministry of Works and Development carries out the executive functions of the Board and in servicing the Board calls on the specialist services of other divisions and branches of Ministry of Works and Development as required, e.g., bridge design, land purchase, accounts, legal, etc.
For State highways and motorways, the Board meets the full cost of construction and maintenance, while the maintenance and construction of county roads and municipal streets are subsidised by the Board. Some 92 percent of State highways are now sealed. The National Roads Board is the controlling authority for State highways. As the Board's agent, Ministry of Works and Development has responsibility for financial control and technical control. In certain cases, the Board has delegated its powers of construction and/or maintenance to local authorities.
In the case of county roads and municipal streets, responsibility lies with the local authority concerned. Apart from the question of standards on major works, there are no strings and no overriding control by Central Government.
Under the National Roads Act, in December of each year the Board is required to estimate its income for the following year and to make its primary allocations of funds expected to be available. At the present time there are three sectors and funds are allocated on the following basis: for counties—not less than 23 percent of motor revenue; for municipalities—not less than 16 percent of motor revenue; for State highways—not less than 50 percent of motor revenue; this leaving 11 percent of motor revenue for allocation to any or all of the above, at the discretion of the Board.
For purposes of roading administration, New Zealand is divided geographically into 22 roads districts and funds are allocated by the Board to each sector in each district as fairly and equitably as possible having regard to particular needs.
In each roads district there is an advisory body known as a District Roads Council. These councils are representative of the same interests as the Board itself. Although they have no executive powers, their recommendations concerning relative priorities have considerable influence on board decisions. In addition to its regular meetings the Board makes visits of inspection to several roads districts each year. These visits afford an opportunity for Board members to get a better appreciation of local problems, needs, and conditions through observation and discussion, and to maintain personal contact with District Roads Councils. The Board is thus able to keep in close touch with the roading problems of New Zealand, and is better able to discharge its responsibility of providing an adequate roading system balanced to meet the country's needs.
Finance—A National Roads Fund has been established within the Public Account, the revenue of the Fund being derived mainly from motor taxation with an annual contribution from the Government. Expenditure from the Fund is for the purpose of developing State highways to modern standards and of subsidising the roading programmes of local authorities.
Motor spirits tax of 18.10c per gallon (4c per litre) is paid into the National Roads Fund. An equivalent mileage tax is payable for diesel-powered motor vehicles: Quarterly licence fees under the Heavy Motor Vehicles Regulations range from $4.83 (not above 2 1/2 tons) to $63 (11 tons), with $7 for each additional ton above 11. The fees for farmers' trucks range from $2.67 on a corresponding basis. Heavy traffic fees, less the cost of collection, are paid into the National Roads Fund. Tax imposed under the Local Authorities (Petroleum Tax) Act 1970 (3c per gallon from February 1971) is not credited to the National Roads Fund.
Following is a statement of receipts and expenditure of the National Roads Fund for the latest three March years.
| Item | 1971-72 | 1972-73 | 1973-74 |
|---|---|---|---|
| Receipts— | $(000) | $(000) | $(000) |
| Petrol tax (net) | 73,033 | 78,493 | 85,302 |
| Mileage tax | 5,959 | 5,679 | 5,691 |
| Fees and charges— | |||
| Heavy traffic fees | 10,107 | 10,794 | 11,521 |
| Contribution from Consolidated Revenue Account | 10 | 3,000 | 700 |
| Miscellaneous receipts— | |||
| Repayments of plant purchases | 2 | 1 | - |
| Repayments of advances to local authorities | 5 | 5 | 6 |
| Rents | 497 | 627 | 747 |
| Sales of land and buildings | 271 | 110 | 101 |
| Interest on plant purchases | - | - | - |
| Bailey bridging hire | 7 | 5 | 53 |
| Interest on investments | 67 | 92 | 97 |
| Miscellaneous | 685 | 63 | 569 |
| Total receipts | 90,643 | 98,869 | 104,787 |
| Expenditure— | |||
| Highways maintenance | 14,357 | 15,705 | 16,702 |
| Highways construction | 32,648 | 37,964 | 35,913 |
| Local authority roading subsidies and grants | 35,243 | 41,115 | 41,136 |
| Local authorities advances | - | 65 | 6 |
| Administration and general expenses— | |||
| Ministry of Works administration | 4,190 | 4,995 | 4,027 |
| Fees and travelling expenses | 39 | 35 | 34 |
| Miscellaneous expenses | 515 | 816 | 818 |
| Bridging expenses— | |||
| Bailey bridging, etc. | 140 | 154 | 122 |
| Unauthorised expenditure | 6 | 9 | 3 |
| Total expenditure | 87,137 | 100,858 | 98,761 |
| Balance in Fund at end of year | 4,294 | 2,018 | 8,301 |
In the following table are shown the amounts which have been expended on State highways construction, renewal, or maintenance during the last five years. Maintenance figures include the cost of flood damage restoration when applicable.
| Class of Expenditure | 1969-70 | 1970-71 | 1971-72 | 1972-73 | 1973-74 |
|---|---|---|---|---|---|
| *Includes motorway structures. | |||||
| $(thousand) | |||||
| Construction and improvement | 22,735 | 26,385 | 25,974 | 29,352 | 27,037 |
| Bridges and other structures* | 5,913 | 4,738 | 6,674 | 8,612 | 8,879 |
| Maintenance, repairs, etc. | 12,167 | 14,014 | 14,357 | 15,705 | 16,702 |
| Totals | 40,815 | 45,137 | 47,005 | 53,669 | 52,615 |
State Highways—The National Roads Act provides for the declaration of roads as State highways with the approval of the Minister of Works and Development. In 1969, the National Roads Board reviewed the State highway system, and re-affirmed the principle that the network must continue to be based on the pattern of national development, needs of defence, and directness of route and main travel desire lines. The most important principles in designing a State highway system are that the total mileage of the system must be based on routes of primary importance; that routes must be equitably distributed in relation to the pattern of national development; and that routes must be confined to those which have characteristics in keeping with the function of the system.
Although urban development with its growing industrialisation is a predominant problem, the National Roads Board is also aware of the need for continued development of a fully effective inter-regional network with adequate rural feeder roads. Balanced development of the total network is essential if primary production is to increase and production costs are to be restrained.
Highway Standards—In order to qualify for highway subsidies local authorities are required to carry out works to a standard approved by the National Roads Board. Subsidies are not payable unless the approved standard is observed, although work of a higher standard may be undertaken provided that the additional expenditure involved is found by the local authorities concerned. From time to time the Board's standards are revised to meet the latest developments in highway practice and engineering design and also to cater for the requirements of increasing traffic. Roadmaking materials used in highway works are subject to standard tests.
Motorways—The Public Works Act makes provision for the declaration of motorways. Motorways provide efficient and economic means of communication, while the control of access and the total elimination of ribbon development will go far to improve road safety and prevent obsolescence.
The total length of motorways in use at 31 March 1974 was 114 km.
National Roading Expenditure—Details of New Zealand public roading expenditure financed from the National Roads Fund, the Consolidated Revenue Account, and local authority funds (both from revenue and loans) are summarised as follows:
| Item | 1972-73 | 1973-74 | ||
|---|---|---|---|---|
| $(000) | $(000) | $(000) | $(000) | |
| State highways expenditure | 53,669 | 52,615 | ||
| Subsidised highway, section 12A | 609 | 593 | ||
| County roading expenditure— | ||||
| From county funds | 19,744 | 19,984 | ||
| From National Roads Funds | 23,552 | 23,529 | ||
| From Consolidated Revenue Account (vote: “Roads”) | 2,387 | 45,683 | 2,026 | 45,539 |
| Municipal roading expenditure— | ||||
| From municipal funds | 24,226 | 24,462 | ||
| From National Roads Funds | 15,752 | 39,978 | 15,815 | 40,277 |
| 139,939 | 139,024 | |||
NOTE—Table above does not include subsidies paid under section 12A of the National Roads Act (to the Auckland Harbour Bridge Authority ($1,000,000) and the Christchurch Road Tunnel Authority ($200,000) plus $2,804 expended by the Ministry of Works and Development on the reinstatement of approaches after experimental works) which in total amounted to $1,202,804.
During the year ended 31 March 1974, 130 km of new sealing on highways were completed, giving an aggregate of 10,400 km sealed, or 92 percent of total highway length. New bridging totalled 2 kilometres.
Local Authority Roading—The National Roads Board pays a basic subsidy at the rate of $1.50 for each $2 that is spent by local authorities out of their own funds on such programmes of subsidised works as have been accepted for a financial year by the Board, and approves grants in special cases.
In recognition of the urgency and importance of the country's bridge renewal problem, the Board makes generous grants for local authority bridge replacements. Wooden bridges built 50 and 60 years ago, which have served the country well, continue to deteriorate at a greater rate than replacements can be built. In 10 years to March 1974 there have been 2,484 bridges completed, totalling 52,000 m.
For the year ended 31 March 1974 the following amounts were paid to local authorities from the National Roads Fund for roading.
| Local Authority | Subsidy | Grants | Total |
|---|---|---|---|
| $(thousand) | |||
| Municipalities | 10,178 | 5,628 | 15,807 |
| County councils (including road boards) | 13,348 | 10,150 | 23,499 |
| Totals | 23,526 | 15,778 | 39,306 |
Loan Assistance—To assist counties and municipalities with their planning the National Roads Board meets 30 percent of the cost of approved transportation surveys in urban areas. Plans have been completed or are in the course of preparation in all city areas with a population in excess of 30,000 people.
Needs studies have been made for county and municipal roading and the Board has carried out regional surveys to assess relative needs.
It is envisaged that more comprehensive and co-ordinated surveys will become necessary as development increases in complexity, and that the Board's criteria will need to extend further into the field of productive economics.
Development Roading—In addition to the expenditure on roading from the National Roads Fund, moneys are provided annually by the Consolidated Revenue Account (Vote Roads) for development of road construction. Under this heading subsidies are paid to local authorities for the construction of new roads giving access to farmlands being brought into production. This Vote also finances access roads to lands being prepared for farm settlement by the Lands and Survey and Maori and Island Affairs Departments, as well as certain new roading of a national development character.
New roads constructed for farm access are handed over to the care of local authorities, while national roading normally becomes the responsibility of the National Roads Board for maintenance as part of the State highway system.
Government roading expenditure from the Consolidated Revenue Account (Vote Roads) for the year ended 31 March 1974 was $2,026,079.
Overall Roading Expenditure—The following table shows the total expenditure on roading from all sources for the year ended 31 March 1974.
| National Roads Fund— | $(000) | $(000) |
| State highways | 52,615 | |
| Subsidies, etc. - local roading | 41,099 | |
| 93,714 | ||
| Consolidated Revenue Account (Vote Roads) | .. | 2,026 |
| Local authority funds— | ||
| Municipalities | 24,463 | |
| County councils | 19,985 | 44,448 |
| Total | 140,188 |
Roading expenditure over the latest 11 years is related to gross national product in the following table.
| Year Ended 31 March | Roading Expenditure: Central and Local Government | Total as Percentage of Gross National Product | ||
|---|---|---|---|---|
| Maintenance | Construction | Total | ||
| *Provisional. | ||||
| $(million) | percent | |||
| 1964 | 27.47 | 56.36 | 83.83 | 2.63 |
| 1965 | 27.67 | 58.82 | 86.49 | 2.48 |
| 1966 | 29.63 | 69.52 | 99.15 | 2.62 |
| 1967 | 31.34 | 67.48 | 98.82 | 2.52 |
| 1968 | 31.63 | 60.95 | 92.58 | 9 11 |
| 1969 | 36.09 | 66.20 | 102.29 | 2.38 |
| 1970 | 35.58 | 73.93 | 109.51 | 2.31 |
| 1971 | 39.59 | 79.46 | 119.05 | 2.19 |
| 1972 | 41.61 | 82.46 | 124.07 | 1.99 |
| 1973 | 45.74 | 95.40 | 141.14 | 2.00 |
| 1974 | 47.33* | 97.90* | 145.23* | 1.75* |
REGISTRATION AND LICENSING OF MOTOR VEHICLES—The amounts for initial registration fees are: motorcars, from $16 to $50 according to engine capacity; motor cycles, $10; power cycles, $6; light trucks, $30; heavy trucks, $50; trailers, $10; tractors, $2; traction engines, $10; and any other motor vehicles, $20. Annual licence fees are as follows: power cycles, $4; motor cycles, $6; motorcars and private station wagons, $10; traction engines, $3; trailers (not exceeding 2 tons laden weight), $6. Other fees include drivers' licences, $1; changes of ownership, $5; and dealers' licences (motor cycles, $6; any other motor vehicles, $10). All such fees, except those for drivers' licences which are payable to the local authorities, have been credited to the Consolidated Revenue Account since 1 July 1967.
The various types of motor vehicles licensed as at 31 March in each of the last five years are itemised below.
| Type of Vehicle | 1970 | 1971 | 1972 | 1973 | 1974 |
|---|---|---|---|---|---|
| Cars | 861,958 | 908,253 | 955,446 | 1,020,778 | 1,078,795 |
| Rental cars | 3,222 | 3,661 | 4,007 | 4,197 | 5,038 |
| Private taxicabs | 157 | 159 | 129 | 129 | 99 |
| Light goods service vehicles (i.e., gross laden weight 2 tons and under) | 101,814 | 110,385 | 117,441 | 122,485 | 129,863 |
| Heavy goods service vehicles (i.e., gross laden weight over 2 tons) | 69,663 | 71,377 | 73,184 | 72,169 | 70,264 |
| Contract vehicles | 1,594 | 1,182 | 1,139 | 1,117 | 1,109 |
| Omnibuses | 2,688 | 2,643 | 2,613 | 2,564 | 2,539 |
| Public taxicabs | 2,891 | 2,918 | 2,937 | 2,993 | 3,046 |
| Service coaches | 455 | 470 | 489 | 536 | 515 |
| Motorcycles | 29,176 | 32,099 | 39,326 | 47,476 | 60,493 |
| Power cycles | 18,826 | 20,974 | 23,614 | 24,950 | 26,655 |
| Totals, motor vehicles | 1,092,444 | 1,154,121 | 1,220,325 | 1,299,394 | 1,378,416 |
| Trailers, including trailers exempted from payment of annual licence fees and caravans | 211,539 | 224,667 | 238,798 | 256,281 | 279,650 |
| Dealers' cars | 3,636 | 3,709 | 4,047 | 4,131 | 4,182 |
| Dealers' motor cycles | 109 | 133 | 172 | 222 | 262 |
| Vehicles including cycles exempted from payment of annual licence fees (farm tractors, etc.) | 77,889 | 81,707 | 86,835 | 92,930 | 103,098 |
| Totals, all vehicles | 1,385,617 | 1,464,337 | 1,550,177 | 1,652,958 | 1,765,608 |
Motor vehicles exempted from the annual licence fee include a miscellaneous collection of machines such as farmers' motor vehicles used solely on the farm and only venturing on roads to proceed from one part of the farm to another, or from farm to garage for repair, etc., excavators, scoops, trench diggers, cranes, and logging trucks {used on private roads), etc.
The rate of increase in the number of motor vehicles has exceeded the rate of increase in population. The following table shows the changes in relationship between the number of licensed vehicles and population as at 31 March in the latest 12 years.
| As at 31 March | Number of Persons in Population per Car | Number of Persons in Population per Motor Vehicle (Excluding Trailers) |
|---|---|---|
| 1963 | 4.3 | 2.9 |
| 1964 | 4.1 | 2.8 |
| 1965 | 3.8 | 2.7 |
| 1966 | 3.7 | 2.6 |
| 1967 | 3.5 | 2.5 |
| 1968 | 3.4 | 2.5 |
| 1969 | 3.3 | 2.4 |
| 1970 | 3.3 | 2.4 |
| 1971 | 3.1 | 2.3 |
| 1972 | 3.0 | 2.2 |
| 1973 | 2.9 | 2.1 |
| 1974 | 2.8 | 2.0 |
The countries with fewest persons per motor vehicle are, in order, United States, Canada, Australia, and New Zealand, but the standard of vehicles is not uniform.
The next table shows the estimated total consumption of motor spirits in New Zealand, together with the quantity consumed by motor vehicles on public roads, for each year during the last 12 years. Statistics for diesel fuel used on public roads are not included. Diesel consumption in 1973, excluding electricity generation and bunker fuel, was 234 million gallons; it is estimated that road vehicles may have used about half this quantity.
| Calendar Year | Consumption of Motor Spirits | |
|---|---|---|
| By Motor Vehicles on Public Roads | Total Consumption | |
| (million litres) | ||
| 1962 | 1,150.2 | 1,358.0 |
| 1963 | 1,241.1 | 1,441.5 |
| 1964 | 1,340.6 | 1,544.4 |
| 1965 | 1,421.6 | 1,621.8 |
| 1966 | 1,517.5 | 1,699.5 |
| 1967 | 1,544.3 | 1,720.4 |
| 1968 | 1,566.6 | 3,740.7 |
| 1969 | 1,670.2 | 1,822.6 |
| 1970 | 1,736.2 | 1,893.9 |
| 1971 | 1,802.1 | 1,959.3 |
| 1972 | 1,921.9 | 2,071.9 |
| 1973 | 2,105.9 | 2,260.6 |
The following diagram illustrates the trend that has taken place in the number of motor vehicles licensed, and in the consumption of motor spirits by motor vehicles. Diesel-fuel consumption which has grown substantially in recent years, is not available. This influence should be recognised when analysing petrol consumption values.
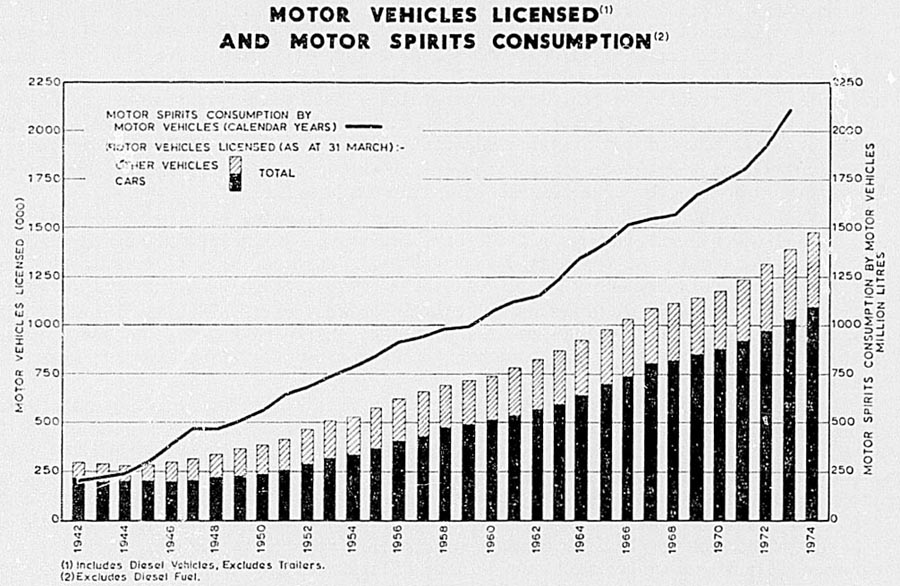
Estimates based on survey data collected during the New Zealand Transport Study indicated that the average travel in 1972 for passenger cars and light vehicles was 13,673 km; for heavy goods-service vehicles the average was 20,534 km; and for passenger-service vehicles the average was 27,859 km.
Registrations of new vehicles and those vehicles previously registered only in another country are as follows for the six latest years.
| Year Ended 31 March | Cars | Motor Cycles (Including Power Cycles) | Commercial Vehicles | Trailers and Caravans | Total Registrations |
|---|---|---|---|---|---|
| 1969 | 49,817 | 3,465 | 12,041 | 18,005 | 83,328 |
| 1970 | 57,019 | 4,242 | 18,007 | 17,720 | 96,988 |
| 1971 | 72,506 | 10,792 | 22,172 | 18,484 | 123,954 |
| 1972 | 80,069 | 18,694 | 25,942 | 20,823 | 145,528 |
| 1973 | 95,582 | 20,637 | 23,971 | 22,235 | 162,425 |
| 1974 | 100,817 | 32,167 | 24,258 | 32,414 | 189,656 |
ROAD TRANSPORT—The Transport Act 1962 is the main legislation governing road transport and the road transport operations of the Ministry of Transport; attendant regulations set out the rules of the road, the requirements as to motor vehicle equipment, and the obligations of motor drivers and owners and pedestrians.
Transport Licensing—Transport licensing is primarily an economic measure to achieve better coordination of road and rail transport and to prevent excessive competition and duplication of services within the road transport industry. Public passenger buses, taxicabs, rental vehicles, and harbour ferries can only be operated with a licence. A transport licence is also needed for the cartage of goods in the following circumstances:
When they are carried for hire or reward by means of a motor vehicle.
When they are carried in competition with the New Zealand Railways beyond specified distances whether for hire or reward or not, except with vehicles which together with their load, weigh 2 1/2 tons or less and farmers' vehicles with a payload of up to 5 tons.
Thus goods service licensing extends beyond the common carrier operating throughout the country and can include farmers and businesses carrying their own goods in their own vehicles, if these vehicles are over the laden weights or carrying the load prescribed above and they wish to operate them beyond certain distances.
In general, goods cannot be carried by road between places where a route is available which includes at least 40 miles of rail. However, certain commodities (particularly some foodstuffs) can be carried without this restriction up to 50, 75, or 100 miles, and for some goods, such as livestock, fresh meat, poultry, or fresh fish there is no restriction at all. In addition, this restriction ceases to apply where use of the railway would increase the journey by more than one-third of the shortest road route available. The licensing authorities (see below) may also grant exemption from the railway restriction in particular cases where this is in the public interest.
Apart from these exemptions in respect of competition with the railways, there is complete freedom from transport licensing for certain special or limited transport services.
New Zealand is divided into 17 transport licensing districts (including one harbour ferry district at Auckland) which arc administered by five full-time licensing authorities appointed by the Minister of Transport for terms of up to 5 years. They adjudicate on applications for a licence to enter the industry, on transfer or renewals of licences, and on changes to or withdrawals of transport services.
The factors to be considered in dealing with these applications are specified in the Transport Act 1962, and emphasis is placed on consideration of the public interest and of users of public transport. There is a right of appeal from the decisions of licensing authorities to the Transport Licensing Appeal Authority.
Charges for transport services do not come within the jurisdiction of the licensing authorities. Public bodies operating public passenger services fix their own charges; the Secretary for Transport all others. In every case there is a right of appeal to a Transport Charges Appeal Authority.
Both the Minister of Transport and licensing authorities have powers in respect of public inquiries into or reviews of transport services and licences. Reviews of taxicab services must be made at least every three years in the four main centres and in other centres with a population of more than 20,000.
In general, licences may be either continuous, seasonal, or temporary (not more than 14 days). However, all rental service licences have a duration of three years after which application must be made for their renewal.
Operations of Licensed Goods and Passenger Services—The following tables review the operations of licensed road transport services. The first of these tables gives the estimated overall figures concerning licensed road goods services for each of the five latest years ended 31 March.
| Road Goods Services | 1968-69 | 1969-70 | 1970-71 | 1971-72 | 1972-73† | |
|---|---|---|---|---|---|---|
*At 31 December. †Provisional. | ||||||
| Revenue | $(000) | 153,100 | 177,900 | 192,400 | 211,000 | 252,000 |
| Capital invested | $(000) | 114,900 | 127,400 | 136,000 | 138,000 | 172,000 |
| Vehicle-miles | (000) | 330,000 | 353,000 | 338,000 | 345,000 | 365,000 |
| Goods-service licences* | No. | 6,694 | 6,619 | 6,697 | 6,736 | 6,745 |
| Average revenue per vehicle-mile | c | 46.39 | 50.46 | 56.88 | 61.20 | 69.00 |
| Average miles per vehicle | No. | 16,421 | 17,190 | 17,093 | 17,482 | 18,000 |
The second table shows traffic data, revenue, and number of vehicles used by the road passenger services operating in New Zealand, and is inclusive of services in the four metropolitan transport districts, for each of the five latest years ended 31 March.
| Road Passenger Services | 1968-69 | 1969-70 | 1970-71 | 1971-72 | 1972-73* | |
|---|---|---|---|---|---|---|
*Provisional. †Not included are mixed passenger or school bus operators. | ||||||
| Traffic statistics— | ||||||
| Passengers carried | (000) | 171,148 | 153,346† | 149,934† | 146,000† | 160,277† |
| Vehicle-miles | (000) | 83,324 | 81,367 | 85,333 | 81,600 | 85,187 |
| Revenue | $(000) | 27,289 | 28,371 | 30,829 | 34,280 | 38,243 |
| Revenue per mile | c | 32.75 | 34.86 | 36.13 | 42.0 | 46.00 |
| Vehicles | No. | 3,919 | 3,804 | 3,971 | 3,523 | 3,750 |
Statistics on bus services run by the New Zealand Railways (included above) are given separately in Section 11B.
The following table sets out statistics of taxicab services for the five latest March years.
| Item | 1968-69 | 1969-70 | 1970-71 | 1971-72 | 1972-73† | |
|---|---|---|---|---|---|---|
*Includes private-hire taxicabs. At 31 December 1973 there were 2,953 public taxicab authorities issued by transport licensing authorities. †Provisional. | ||||||
| Estimated total capital invested in cabs | $(000) | 5,277 | 5,340 | 5,800 | 6,100 | 6,000 |
| Mileage run | (000) | 106,600 | 102,300 | 105,600 | 107,400 | 103,000 |
| Revenue | $(000) | 14,700 | 14,900 | 16,700 | 18,400 | 19,600 |
| Revenue per mile | c | 13.79 | 14.54 | 15.80 | 17.20 | 19.00 |
| Vehicles* | No. | 3,065 | 3,048 | 3,077 | 3,066 | 3,122 |
Statistics of the rental vehicle industry are set out in the following table for March years.
| Item | 1970 | 1971 | 1972 | 1973 | |
|---|---|---|---|---|---|
| *This is the number of vehicle authorities issued by transport licensing authorities, not necessarily the actual number of vehicles as at 31 December. | |||||
| Cars authorised | .. | 3,810 | 4,234 | 4,519 | 4,810 |
| Other vehicles authorised* | .. | 990 | 1,091 | 1,264 | 1,301 |
| Mileage run | (000) | 57,056 | 71,710 | 77,900 | 79,000 |
| Estimated total revenue | $(000) | 6,600 | 9,500 | 9,800 | 13,000 |
| Revenue per mile | c | 11.56 | 13.24 | 12.60 | 16.00 |
Household Motorcars—Availability of motorcars to households at the Census of 1971 is shown in the following table.
| Area | Total Households | Motor Cars Owned or Business Car Available for Use | |
|---|---|---|---|
| One | Two or More | ||
| Urban Area— | |||
| Whangarei | 9,344 | 5,252 | 2,179 |
| Northern Auckland | 32,990 | 18,006 | 8,152 |
| Western Auckland | 24,008 | 13,378 | 7,079 |
| Central Auckland | 89,963 | 42,219 | 20,831 |
| Southern Auckland | 42,238 | 22,693 | 11,706 |
| Hamilton | 21,839 | 11,977 | 6,066 |
| Tauranga | 11,737 | 7,008 | 3,033 |
| Rotorua | 9,749 | 5,234 | 2,577 |
| Gisborne | 8,316 | 4,575 | 1,842 |
| Napier | 12,604 | 6,994 | 2,974 |
| Hastings | 12,998 | 7,139 | 3,450 |
| New Plymouth | 11,519 | 6,463 | 2,656 |
| Wanganui | 11,192 | 6,219 | 2,477 |
| Palmerston North | 16,427 | 9,040 | 4,261 |
| Upper Hutt Valley | 8,083 | 4,776 | 1,905 |
| Lower Hutt Valley | 26,061 | 13,961 | 6,441 |
| Porirua Basin | 11,339 | 6,072 | 2,268 |
| Wellington | 42,791 | 21,198 | 8,225 |
| Masterton | 5,458 | 3,073 | 1,331 |
| Nelson | 10,905 | 6,353 | 2,759 |
| Christchurch | 81,705 | 42,902 | 21,468 |
| Timaru | 8,589 | 4,982 | 1,798 |
| Dunedin | 32,843 | 17,168 | 6,196 |
| Invercargill | 14,140 | 7,767 | 3,486 |
| Totals of 24 urban areas | 556,838 | 294,449 | 135,160 |
| Percentage of total | 100.0 | 52.9 | 24.3 |
| New Zealand total | 801,886 | 441,459 | 192,776 |
| Percentages of total | 100.0 | 55.1 | 24.0 |
Transport to Work—The following table from the 1971 Census of Population indicates the dependence of the labour force on road transport to work.
| Area | Drive Car, Van, or Truck | Passenger In Car, Van, or Truck | Bus | Cycle, Motor Cycle | Train | Total Actively Engaged* |
|---|---|---|---|---|---|---|
| *Includes persons who walk and fanners and others. | ||||||
| Urban Area— | ||||||
| Whangarei | 6,768 | 1,638 | 1,113 | 387 | 7 | 12,496 |
| Northern Auckland | 21,064 | 4,578 | 9,806 | 950 | 30 | 42,710 |
| Western Auckland | 19,246 | 3,813 | 5,280 | 812 | 599 | 34,477 |
| Central Auckland | 57,225 | 11,550 | 33,598 | 2,983 | 1,302 | 129,825 |
| Southern Auckland | 32,695 | 6,322 | 9,170 | 1,889 | 1,643 | 61,138 |
| Hamilton | 17,164 | 3,083 | 3,205 | 2,067 | 20 | 31,891 |
| Tauranga | 8,325 | 1,544 | 695 | 822 | 9 | 14,102 |
| Rotorua | 8,378 | 1,992 | 1,316 | 534 | 39 | 15,355 |
| Gisborne | 5,653 | 1,030 | 410 | 1,557 | 12 | 10,848 |
| Napier | 8,859 | 1,544 | 1,090 | 1,674 | 29 | 16,028 |
| Hastings | 9,091 | 1,562 | 638 | 2,371 | 8 | 17,241 |
| New Plymouth | 7,864 | 1,518 | 1,673 | 743 | 15 | 14,721 |
| Wanganui | 7,095 | 1,218 | 847 | 2,031 | 20 | 13,800 |
| Palmerston North | 11,723 | 1,997 | 1,158 | 3,347 | 20 | 22,823 |
| Upper Hutt Valley | 5,410 | 1,351 | 522 | 565 | 2,859 | 12,640 |
| Lower Hutt Valley | 17,269 | 4,191 | 4,901 | 1,046 | 6,766 | 39,484 |
| Porirua Basin | 6,006 | 2,156 | 1,456 | 180 | 6,032 | 17,338 |
| Wellington | 23,477 | 5,518 | 21,170 | 1,126 | 3,107 | 68,777 |
| Masterton | 3,778 | 773 | 241 | 777 | 48 | 7,286 |
| Nelson | 7,291 | 1,551 | 584 | 1,152 | 21 | 13,239 |
| Christchurch | 54,276 | 8,167 | 15,248 | 15,964 | 526 | 109,719 |
| Timaru | 5,457 | 845 | 800 | 1,129 | 5 | 10,452 |
| Dunedin | 20,037 | 4,374 | 7,814 | 1,463 | 861 | 43,083 |
| Invercargill | 10,217 | 3,037 | 1,690 | 1,748 | 15 | 19,495 |
| Totals of 24 urban areas | 374,368 | 75,352 | 124,425 | 47,317 | 23,993 | 778,968 |
| Percentages of total | 48.1 | 9.7 | 16.0 | 6.1 | 3.1 | 100.0 |
| New Zealand totals | 494,188 | 107,816 | 132,219 | 65,153 | 25,972 | 1,118,835 |
| Percentages of total | 44.2 | 9.6 | 11.8 | 5.8 | 2.3 | 100.0 |
TRAFFIC ACCIDENTS ON ROADS—Motor-vehicle accidents involving death or personal injury are required by law to be reported to the Police. For the year ended 31 December 1973, 15,571 such accidents, resulting in 843 fatalities and in injuries to 23,385 other people were reported. Comparative figures for 1972 and 1971 were (1971 figures being given in parentheses): number of accidents 14,654 (14,004); fatalities 713 (677); persons injured 22,315 (21,607). The increases must be related to the growing number of vehicles on the roads.
Details of the nature of road accidents for the calendar year 1973, which have been compiled by the Ministry of Transport, are set out in the following table.
| Nature of Accident | Fatal Accidents | Injury Accidents | Totals |
|---|---|---|---|
| Overtaking | 47 | 451 | 498 |
| Head-on collision (not overtaking) | 126 | 1,040 | 1,166 |
| Rear-end collision | 22 | 850 | 872 |
| Loss of control or running off road on straight | 77 | 1,509 | 1,586 |
| Loss of control or running off road while cornering | 167 | 2,404 | 2,571 |
| Collision with obstruction | 16 | 914 | 930 |
| At intersections— | |||
| Vehicles moving in same direction, one turning | 19 | 1,210 | 1,229 |
| Vehicles moving in opposite direction, one turning right | 27 | 1,006 | 1,033 |
| Vehicles crossing paths, not turning | 34 | 1,328 | 1,362 |
| Vehicles crossing paths, turning | 22 | 876 | 898 |
| Vehicles merging | 5 | 289 | 294 |
| Vehicle manoeuvring | 8 | 654 | 662 |
| Pedestrian crossing road | 123 | 1,808 | 1,931 |
| Pedestrian, other | 25 | 272 | 297 |
| Miscellaneous | 23 | 219 | 242 |
| Totals | 741 | 14,830 | 15,571 |
The age groups of drivers involved in accidents causing death or injury in 1973 are shown in the following table in relation to the numbers holding driving licences.
| Age Groups (Years) | Drivers Licensed* | Drivers Involved in Accidents | Percentage Involved in Accidents |
|---|---|---|---|
| *Approximate | |||
| Under 15 | - | 61 | ... |
| 15 | 8,200 | 569 | 6.9 |
| 16 | 20,000 | 1,168 | 5.8 |
| 17 | 29,900 | 1,581 | 5.3 |
| 18 | 34,800 | 1,618 | 4.7 |
| 19 | 38,100 | 1,526 | 4.0 |
| 20 | 40,200 | 1,366 | 3.4 |
| 21 to 25 | 220,900 | 4,335 | 2.0 |
| 26 to 30 | 195,000 | 2,360 | 1.2 |
| 31 to 35 | 168,000 | 1,881 | 1.1 |
| 36 to 40 | 136,200 | 1,438 | 1.1 |
| 41 to 45 | 129,400 | 1,446 | 1.1 |
| 46 to 50 | 127,200 | 1,181 | 0.9 |
| 51 to 55 | 108,500 | 984 | 0.9 |
| 56 to 60 | 91,600 | 781 | 0.9 |
| 61 to 65 | 78,300 | 601 | 0.8 |
| 66 to 70 | 44,600 | 398 | 0.9 |
| Over 70 | 47,000 | 399 | 0.9 |
| Unknown | - | 1,044 | - |
| Totals | 1,517,900 | 24,737 | 1.6 |
There were 19,300 persons on the register of disqualified drivers at 31 December 1973.
The ages of persons killed and injured in motor accidents is shown in the following table.
| Age Groups (Years) | Killed | Injured | ||||
|---|---|---|---|---|---|---|
| 1971 | 1972 | 1973 | 1971 | 1972 | 1973 | |
| Under 5 | 24 | 32 | 34 | 677 | 707 | 786 |
| 5-9 | 38 | 25 | 33 | 970 | 1,008 | 1,082 |
| 10-14 | 25 | 32 | 34 | 1,307 | 1,408 | 1,531 |
| 15-19 | 131 | 173 | 211 | 6,572 | 7,350 | 7,774 |
| 20-24 | 119 | 115 | 129 | 4,064 | 3,940 | 4,182 |
| 25-29 | 36 | 49 | 58 | 1,594 | 1,584 | 1,730 |
| 30-34 | 33 | 27 | 41 | 1,076 | 1,099 | 1,109 |
| 35-39 | 25 | 29 | 46 | 853 | 827 | 815 |
| 40-44 | 34 | 33 | 31 | 824 | 780 | 774 |
| 45-49 | 33 | 22 | 32 | 736 | 760 | 740 |
| 50-54 | 32 | 30 | 33 | 691 | 693 | 705 |
| 55-59 | 40 | 34 | 36 | 649 | 566 | 558 |
| 60-64 | 32 | 32 | 41 | 543 | 547 | 519 |
| 65-69 | 18 | 35 | 24 | 402 | 376 | 364 |
| 70 and over | 57 | 45 | 58 | 559 | 581 | 631 |
| Unknown age | - | - | 2 | 90 | 89 | 85 |
| Totals | 677 | 713 | 843 | 21,607 | 22,315 | 23,385 |
A classification of road users killed and injured during the calendar year 1973 is given in the following table.
| Type of Casualty | Killed | Seriously Injured | With Minor Injuries | Total |
|---|---|---|---|---|
| Driver of— | ||||
| Car | 236 | 2,525 | 4,188 | 6,949 |
| Rental car | 4 | 22 | 48 | 74 |
| Taxi | 1 | 14 | 14 | 29 |
| Van | 16 | 224 | 376 | 626 |
| Truck | 7 | 78 | 128 | 213 |
| Articulated truck | 2 | 11 | 17 | 30 |
| Bus | - | 5 | 8 | 13 |
| Other | 7 | 6 | 8 | 21 |
| Motor cyclist | 102 | 1,272 | 1,682 | 3,056 |
| Power cyclist | 4 | 183 | 283 | 470 |
| Passenger | 250 | 2,743 | 5,493 | 8,486 |
| Pillion rider | 24 | 239 | 565 | 828 |
| Cyclist | 30 | 290 | 728 | 1,048 |
| Pedestrian | 157 | 874 | 1,306 | 2,337 |
| Other | 3 | 17 | 28 | 48 |
| Totals | 843 | 8,513 | 14,872 | 24,228 |
Accident statistics for 7 latest calendar years are given in the following table.
| Calendar Year | Persons Killed | Killed per 10,000 Vehicles on Road | Persons Injured | Injured per 10,000 Vehicles on Road | Casualties (Killed and Injured) per 10,000 Vehicles |
|---|---|---|---|---|---|
| 1968 | 522 | 4.73 | 17,693 | 160.3 | 165.0 |
| 1969 | 570 | 5.00 | 18,726 | 164.3 | 169.3 |
| 1970 | 655 | 5.56 | 20,691 | 176.4 | 181.9 |
| 1971 | 677 | 5.45 | 21,607 | 173.9 | 179.3 |
| 1972 | 713 | 5.43 | 22,315 | 165.4 | 170.8 |
| 1973 | 843 | 5.86 | 23,385 | 160.0 | 165.9 |
| 1974 | 676 | 4.50 | 20,829 | 137.5 | 142.0 |
The following table shows motor accident death and injury rates in 1973 for New Zealand in comparison with other countries.
| Country | Persons Killed | Persons Injured | Killed per 10,000 Vehicles | Killed per 100,000 Population | Injured per 10,000 Vehicles | Injured per 100,000 Population |
|---|---|---|---|---|---|---|
| *1972 Data. | ||||||
| New Zealand | 843 | 23,385 | 5.9 | 27.9 | 160.0 | 760.8 |
| Australia | 3,675 | 95,077 | 6.5 | 27.9 | 168.8 | 721.0 |
| Great Britain | 7,407 | 346,325 | 4.6 | 13.2 | 214.9 | 619.2 |
| United States* | 56,300 | 5,190,000 | 4.7 | 27.0 | 425.5 | 2451.6 |
ROAD SAFETY: Enforcement of Traffic and other Laws—Traffic on roads in six cities and boroughs is controlled by local authorities. Elsewhere throughout the country it is controlled by the Ministry of Transport which is also responsible for traffic on motorways. In national emergencies or major disasters, all traffic control comes under the supervision of the Ministry of Transport.
In addition to regulation of traffic and standards of driving, traffic officers enforce the laws relating to heavy traffic, tyre pressures, and the allowable weights of vehicles and loads on different classes of road. They also enforce the legislation concerning the licensing of road transport services.
Traffic officers are not part of the Police and do not engage in criminal investigations. They form however, a uniformed and disciplined enforcement body and close liaison is maintained with the Police. Traffic officers have the power to arrest without warrant persons driving under the influence of drink or drugs, or being in charge of a motor vehicle while under the influence of drink or drugs and refusing to deliver ignition keys.
Persons giving a traffic or police officer good cause to suspect that they are driving after having consumed alcohol may be required to give a blood sample for analysis. An initial test with a breath-test device is used as a screening process. If a person is found to have a blood-alcohol concentration of 100 mg or more per 100 ml of blood he has committed an offence and is liable for prosecution.
Wearing of seat belts is now compulsory for drivers and front-seat passengers in most classes of vehicles registered after January 1955. Children under 15 years of age are exempt, and there are other exemptions for certain occupational groups and on medical grounds.
From 1 December 1973 it has been compulsory for all motor cyclists and pillion riders to wear safety helmets at all speeds.
Offences—Penalties are awarded by Courts for driving and other offences under the Transport Act 1962 and attendant regulations. There is also a system in operation whereby points are automatically registered according to a fixed scale against persons convicted of driving offences.
The Secretary for Transport has authority to suspend drivers' licences for 6 months where 100 or more demerit points are received in less than 1 year, or for 3 months where this number of points are received within 2 years. Official warnings are issued and compulsory interviews take place before these levels are reached.
Breaches of certain parking, speeding, and overloading laws are dealt with under an infringement system. A motorist is able to pay an infringement fee within a certain time and thus avoid court proceedings if he so desires. In 1974 provision was made for the infringement system to be extended to. certain other offences, which are not punishable by imprisonment.
Speed Limits—The maximum speed for highways generally is 50 miles an hour. However lower limits are prescribed for certain vehicles, e.g., 40 mph for heavy goods vehicles.
A general speed limit of 30 mph is fixed in cities, boroughs, town districts, or other localities declared to be closely populated districts. Areas with a speed limit of 40 mph may also be specified by the Minister of Transport; and limited speed zones may be established for which the maximum permitted speed may be either 50 mph or 30 mph depending on conditions and circumstances.
Inspection of Motor Vehicles—All vehicles using the roads must be inspected every six months to ensure that their mechanical and structural fitness is of a satisfactory standard. Most lightweight vehicles are required to have a warrant of fitness which can be issued at approved garages, or at testing stations operated by local authorities or the Ministry of Transport. All heavy vehicles, with minor exceptions, undergo a more exacting examination for a certificate of fitness, which, in respect of passenger service buses, has special regard for the safety and comfort of passengers. Taxicabs and rental vehicles also require a certificate of fitness.
The design and standard of construction of vehicles manufactured, assembled, or modified in New Zealand are also regulated to ensure safety.
Insurance—Under the Accident Compensation Act 1972 a motor vehicle scheme provides cover for everyone in respect of personal injury caused by motor accidents. There is a Motor Vehicle Fund financed by premiums paid with the annual licence fee. The legislation came into effect on 1 April 1974, replacing the compulsory third-party scheme previously operating.
Road Safety Education—Publicity directed towards road safety is earned out through the press, radio, and television and by means of posters, etc. Special road safety campaigns and traffic improvement courses are held from time to time. Great emphasis is placed on instruction in schools by uniformed road traffic instructors who visit all schools at least twice a year, and also lecture to teachers' colleges and other groups.
The New Zealand Defensive Driving Council provides a safety course for all licensed drivers.
Traffic safety advice is given to the Government by a permanent parliamentary select committee, by the Road Traffic Safety Research Council, and by a number of other bodies, including the 46 local road safety committees.
TRAFFIC OFFENCES—The following table shows the nature of the offences resulting in convictions during the latest three calendar years. The table covers only offences reported by officers of the Ministry of Transport; in addition traffic prosecutions are taken by the police, particularly for serious offences, following accidents or other police investigations. Some city councils employ their own traffic control staff and total convictions are therefore rather higher than shown. Convictions in Magistrates' Courts for the calendar year 1973 were, for instance, 204,379.
| Type of Offence | 1971 | 1972 | 1973 |
|---|---|---|---|
*Speeding infringement system commenced from July 1971. †Included in careless use of motor vehicle. ‡Included with other miscellaneous. §Failure to stop at compulsory stop sign. ||Included in failure to yield right of way. ¶Included in Probationary drivers offences. | |||
| (a) Accident promoting offences— | |||
| Driving or attempting to drive, while under the influence of drink or drugs | 299 | 295 | 373 |
| In charge of motor vehicle while under the influence of drink or drugs | 85 | 90 | 36 |
| Breath test blood-alcohol offences | 2,966 | 3,200 | 3,502 |
| Warrant of fitness offences | 10,682 | 9,758 | 12,637 |
| Certificate of fitness offences | 678 | 635 | 740 |
| Certificate of loading offences | 239 | 319 | 475 |
| Exceeding certificate of loading | 149 | 105 | 171 |
| Reckless driving | 142 | 126 | 164 |
| Driving in a dangerous manner | 480 | 618 | 661 |
| Driving at a dangerous speed | 596 | 701 | 814 |
| Driving without reasonable consideration | † | 418 | 577 |
| Careless use of a motor vehicle | 4,033 | 3,989 | 4,551 |
| Overtaking offences | 1,826 | 1,481 | 1,523 |
| Failure to keep to the left | 2,959 | 2,686 | 2,820 |
| Failure to yield right of way | 1,734 | 1,074 | 1,070 |
| Failure to stop in half clear road | 456 | 688 | 776 |
| Exceeding 30 mph | 21,237 | 11,652 | 12,922 |
| Exceeding 40 mph | 1,372 | 593 | 930 |
| Exceeding 55 mph | 3,857 | 1,430 | 1,746 |
| Exceeding 60 mph | 937 | 312 | 439 |
| Breaches of limited speed zone | 9 | 12 | 21 |
| Exceeding temporary speed limits | 585 | 1,273 | 823 |
| Exceeding bylaw, etc. | † | 149 | 325 |
| Failure to stop at traffic lights | § | 1,858 | 2,091 |
| Failure to stop at compulsory stop sign | 6,589 | 3,834 | 3,713 |
| Failure to give way at a give way sign | || | 612 | 660 |
| Failure to yield right of way at pedestrian crossing | 349 | 331 | 428 |
| Failure to stop or give way for siren | ‡ | 27 | 37 |
| Failure to comply with road signs | ‡ | 845 | 858 |
| Cycling offences | 943 | 501 | 374 |
| Pedestrian offences | 132 | 97 | 113 |
| Passenger offences | † | 99 | 109 |
| Horse traffic offences | ‡ | 9 | 2 |
| Motor cyclist exceeding 30 mph without safety helmet (rider or pillion) | 1,773 | 1,576 | 2,081 |
| Provisional motor cyclist exceeding 30 mph | ¶ | 202 | 147 |
| Exceeding 40 mph with trailer | 1,309 | 793 | 946 |
| Exceeding 40 mph with heavy motor vehicle | 579 | 148 | 183 |
| Exceeding 45 mph with pillion passenger | 533 | 504 | 498 |
| Exceeding 50 mph (omnibus) | 9 | 10 | 11 |
| Exceeding 50 mph by probationary driver | 648 | 249 | 6 |
| Exceeding other limits | 167 | 86 | 135 |
| Defective brakes | 467 | 598 | 580 |
| Lighting offences | 3,289 | 3,545 | 3,696 |
| Failure to dip lights | 155 | 167 | 142 |
| Mechanically defective or unsafe vehicle | 5,323 | 6,335 | 8,285 |
| Trailer offences | ‡ | 375 | 392 |
| Totals | 77,586 | 64,405 | 73,583 |
| (b) Non-accident promoting offences— | |||
| Failure to obey officer | ‡ | 779 | 868 |
| Failure to fulfil duties after accident | ‡ | 226 | 253 |
| Owner failing to supply information | 322 | 1,577 | 1,989 |
| Failure to pay parking infringement fee | 540 | 813 | 309 |
| Failure to pay overloading infringement fee | 21 | 160 | 67 |
| Failure to pay speeding infringement fee | 885 | 1,083 | |
| Heavy traffic licence not carried or no heavy traffic licence | 1,464 | 1,302 | 1,208 |
| Heavy traffic licence defaced or obscured | 9 | 78 | 81 |
| Exceeding heavy traffic licence | 935 | 1,112 | 1,384 |
| Mileage tax offences | ‡ | 176 | 58 |
| Driver's licence offences | 9,371 | 9,956 | 12,337 |
| Driving whilst disqualified | 788 | 742 | 891 |
| Probationary drivers offences | 1,581 | 879 | 454 |
| Vehicle licences and registration offences | 2,907 | 3,103 | 3,648 |
| Breaches of drivers' hours regulations | 21 | 86 | 31 |
| Over 100 demerit points | 32 | 44 | |
| Other miscellaneous offences | 5,720 | 175 | 245 |
| Safety belt offences | 99 | 1,144 | |
| Noisy motor vehicles | 1,734 | 1,563 | 2,019 |
| Emitting excessive smoke | 99 | 130 | 130 |
| Loading offences | 544 | 818 | 1,071 |
| Other nuisances | † | 71 | 115 |
| Conversion | ‡ | 1 | 1 |
| Aiding and abetting | 108 | 77 | 95 |
| Stock offences | ‡ | 16 | 22 |
| Other bylaw offences | ‡ | 20 | 41 |
| Unlicensed goods service | 43 | 94 | 90 |
| Breach of goods service licence | 118 | 449 | 703 |
| Exceeding rail restriction mileage | 58 | 91 | 124 |
| Unlicensed passenger service | 4 | 1 | 5 |
| Breach of passenger service licence | 2 | 9 | 4 |
| Rental vehicle offences | 28 | 45 | 40 |
| Taxicab offences | 10 | 15 | 19 |
| No vehicle authority of not carried | 125 | 172 | 258 |
| Other transport licensing offences | 227 | 179 | 265 |
| Totals | 26,779 | 25,931 | 31,096 |
| (c) Parking offences | 12,758 | 20,499 | 24,257 |
| Totals—all offences | 117,123 | 110,835 | 128,936 |
| (d) Notices issued for infringements | |||
| Parking | 131,629 | 199,749 | 248,719 |
| Speeding | 17,092* | 37,712 | 38,324 |
| Overloading | 1,818 | 2,447 | 6,032 |
URBAN PASSENGER SERVICES OPERATED BY LOCAL AUTHORITIES—The data provided in this section covers the whole of the urban passenger transport services operated by local authorities, and no account is taken of the various motor-bus services operated by the New Zealand Government Railways, or by any private enterprise.
In the last 20 years motor and trolley bus services have increased and electric tramways have been superseded. The last tramway system serving a city area was in Wellington, and this was terminated in May 1964. Wellington, however, still retains the only electric cable tram service now operating in New Zealand.
From 1 November 1969 to 31 March 1971 local authorities received grants from the Ministry of Transport of twice the amount of heavy traffic fees paid in relation to urban passenger service operations. From 1 September 1972 a grant equivalent to heavy traffic fees paid on urban passenger buses is being paid to all operators, municipal and private. In March 1974 the grant was increased to 200 percent of heavy traffic fees paid.
An Urban Transport Council has been established under the Transport Act with the function of administering Government assistance by way of loans and grants to urban public passenger transport operators, both public and private; and to encourage and conduct research into urban passenger transport and associated matters.
For the 1973-74 financial year the Council was granted $1 million by Central Government to provide capital loans or grants to the transport operators and they allocated $805,000 to local authorities (including New Zealand Railways) and $175,000 to private operators for this purpose.
Details of revenue and expenditure incurred by Local Authority passenger services only are given in the following table. In the latest year losses exceeded $5 million, with only Eastbourne Borough Council making a profit.
| Year Ended 31 March | Revenue | Average Fare per Passenger | Revenue per Km Run | Expenditure | Expenditure per Km Run | |||
|---|---|---|---|---|---|---|---|---|
| Passenger Fares | Total | Operating Expenses | Capital Charges | Total (incl. “Other”) | ||||
| $(000) | $(000) | c | c | $(000) | $(000) | $(000) | c | |
| Auckland— | ||||||||
| 1970 | 3,364 | 3,533 | 8.48 | 29.68 | 3,433 | 650 | 4,083 | 34.31 |
| 1971 | 3,7 | 3,972 | 9.40 | 33.20 | 3,944 | 638 | 4,583 | 38.30 |
| 1972 | 4,104 | 4,175 | 10.82 | 34.79 | 4,347 | 692 | 5,039 | 41.99 |
| 1973 | 6,381 | 6,939 | 13.02 | 30.86 | 7,584 | 600 | 8,184 | 36.41 |
| 1974 | 6,349 | 7,091 | 13.09 | 31.47 | 8,440 | 849 | 9,289 | 41.23 |
| Gisborne— | ||||||||
| 1970 | 59 | 63 | 10.71 | 20.93 | 60 | 8 | 68 | 22.66 |
| 1971 | 65 | 68 | 11.21 | 22.62 | 69 | 12 | 81 | 26.75 |
| 3972 | 71 | 75 | 13.13 | 26.15 | 68 | 12 | 79 | 27.88 |
| 1973 | 67 | 70 | 13.13 | 26.61 | 67 | 11 | 78 | 29.48 |
| 1974 | 75 | 81 | 14.83 | 30.84 | 78 | 18 | 95 | 36.20 |
| New Plymouth— | ||||||||
| 1970 | 135 | 143 | 5.86 | 17.77 | 158 | - | 173 | 21.52 |
| 1971 | 145 | 159 | 6.33 | 19.79 | 179 | - | 194 | 24.18 |
| 1972 | 156 | 160 | 7.05 | 19.90 | 212 | - | 227 | 28.20 |
| 1973 | 154 | 160 | 7.29 | 20.69 | 229 | - | 247 | 31.79 |
| 1974 | 165 | 167 | 7.96 | 21.99 | 244 | 20 | 264 | 34.71 |
| Palmerston North— | ||||||||
| 1970 | 95 | 99 | 9.68 | 17.68 | 96 | 18 | 113 | 20.23 |
| 1971 | 110 | 113 | 10.08 | 18.27 | 125 | 18 | 143 | 23.03 |
| 1972 | 119 | 123 | 10.95 | 18.45 | 153 | 33 | 186 | 27.94 |
| 1973 | 114 | 117 | 11.13 | 16.74 | 183 | 47 | 230 | 32.91 |
| 1974 | 108 | 110 | 11.28 | 14.57 | 212 | 58 | 270 | 35.93 |
| Eastbourne— | ||||||||
| 1970 | 152 | 166 | 14.03 | 22.82 | 129 | 34 | 164 | 22.45 |
| 1971 | 169 | 190 | 15.46 | 26.19 | 139 | 30 | 174 | 24.07 |
| 1972 | 177 | 190 | 16.46 | 25.43 | 152 | 31 | 189 | 25.35 |
| 1973 | 192 | 207 | 18.03 | 29.72 | 164 | 35 | 202 | 29.04 |
| 1974 | 209 | 223 | 19.80 | 31.76 | 180 | 39 | 221 | 31.49 |
| Wellington— | ||||||||
| 1970 | 2,034 | 2,080 | 7.65 | 31.63 | 2,463 | 418 | 2,881 | 43.81 |
| 1971 | 2,071 | 2,118 | 7.77 | 33.41 | 3,062 | 418 | 3,480 | 54.90 |
| 1972 | 2,468 | 2,522 | 9.31 | 38.84 | 3,621 | 404 | 4,025 | 62.00 |
| 1973 | 2,451 | 2,574 | 9.62 | 41.66 | 3,882 | 352 | 4,235 | 68.54 |
| 1974 | 2,671 | 2,712 | 11.16 | 47.81 | 4,157 | 349 | 4,506 | 79.43 |
| Christchurch— | ||||||||
| 1970 | 1,454 | 1,524 | 8.28 | 20.71 | 1,637 | 290 | 1,927 | 26.19 |
| 1971 | 1,580 | 1,707 | 9.24 | 23.34 | 1,987 | 110 | 2,097 | 28.68 |
| 1972 | 1,832 | 1,859 | 11.34 | 25.01 | 2,39 | 175 | 2,483 | 33.41 |
| 1973 | 1,789 | 1,857 | 11.47 | 24.98 | 2,495 | 230 | 2,724 | 36.66 |
| 1974 | 1,898 | 2,122 | 11.79 | 29.14 | 2,796 | 219 | 3,015 | 41.41 |
| Timaru— | ||||||||
| 1970 | 73 | 81 | 6.92 | 19.11 | 87 | 28 | 115 | 27.15 |
| 1971 | 79 | 90 | 6.74 | 21.77 | 97 | 28 | 125 | 30.15 |
| 1972 | 86 | 93 | 7.91 | 22.64 | 114 | 30 | 144 | 34.95 |
| 1973 | 85 | 95 | 7.77 | 21.86 | 127 | 34 | 160 | 36.80 |
| 1974 | 104 | 113 | 10.70.25 | 29 | 133 | 31 | 164 | 36.82 |
| Dunedin— | ||||||||
| 1970 | 766 | 802 | 8.05 | 30.25 | 863 | 188 | 1,051 | 39.63 |
| 1971 | 735 | 770 | 8.52 | 31.49 | 974 | 160 | 1,133 | 46.35 |
| 1972 | 962 | 997 | 11.37 | 38.23 | 1,143 | 155 | 1,298 | 49.78 |
| 1973 | 1,037 | 1,073 | 14.01 | 42.32 | 1,217 | 214 | 1,431 | 56.45 |
| 1974 | 1,054 | 1,091 | 14.70 | 44.04 | 1,287 | 119 | 1,406 | 56.74 |
| Invercargill— | ||||||||
| 1970 | 119 | 121 | 6.47 | 15.71 | 159 | 31 | 190 | 24.61 |
| 1971 | 119 | 122 | 6.79 | 16.20 | 192 | 32 | 224 | 29.63 |
| 1972 | 122 | 126 | 8.70x | 19.05 | 208 | 28 | 235 | 35.72 |
| 1973 | 126 | 131 | 9.24 | 20.22 | 223 | 29 | 252 | 38.88 |
| 1974 | 134 | 138 | 9.63 | 20.76 | 247 | 29 | 276 | 41.57 |
| Totals: All Services— | ||||||||
| 1970 | 8,251 | 8,613 | 8.16 | 26.85 | 9,085 | 1,665 | 10,765 | 33.56 |
| 1971 | 8,784 | 9,310 | 8.81 | 29.38 | 10,768 | 1,446 | 12,235 | 38.61 |
| 1972 | 10,098 | 10,319 | 10.47x | 32.14 | 12,326 | 1,559 | 13,907 | 43.32 |
| 1973 | 12,396 | 13.222 | 11.85 | 31.37 | 16,171 | 1,551 | 17,743 | 42.10 |
| 1974 | 12,766 | 13,848 | 12.43 | 33.33 | 17,773 | 1,731 | 19,508 | 46.95 |
Details of vehicles, kilometres run, and passengers carried are given in the following table.
| Year Ended 31 March | Vehicles | Kilometres Run | Passengers Carried | Passengers per Km Run | ||
|---|---|---|---|---|---|---|
| Trolley Buses | Motor Buses | Trolley Buses | Motor Buses | |||
*Includes 2 cable cars. †Includes cable car running (kilometres)-1969-70, 61,000; 1970-71, 59,000; 1972-71, 61,000; 1972-73, 50,000; 1973-74,48,000. | ||||||
| Auckland— | (000) | (000) | (000) | |||
| 1970 | 127 | 227 | 4,694 | 7,208 | 39,658 | 3.33 |
| 1971 | 126 | 216 | 4,707 | 7,259 | 39,386 | 3.29 |
| 1972 | 126 | 216 | 4,653 | 7,346 | 37,919 | 3.16 |
| 1973 | 126 | 430 | 4,541 | 17,939 | 49,000 | 2.18 |
| 1974 | 126 | 478 | 4,238 | 18,294 | 48,500 | 2.15 |
| Gisborne— | ||||||
| 1970 | - | 11 | - | 302 | 555 | 1.84 |
| 1971 | - | 10 | - | 303 | 578 | 1.91 |
| 1972 | - | 10 | - | 285 | 542 | 1.90 |
| 1973 | - | 10 | - | 264 | 511 | 1.93 |
| 1974 | - | 10 | - | 264 | 508 | 1.93 |
| New Plymouth— | ||||||
| 1970 | - | 22 | - | 806 | 2,305 | 2.86 |
| 1971 | - | 22 | - | 803 | 2,285 | 2.85 |
| 1972 | - | 22 | - | 805 | 2,216 | 2.75 |
| 1973 | - | 22 | - | 775 | 2,109 | 2.72 |
| 1974 | - | 22 | - | 761 | 2,070 | 2.72 |
| Palmerston North— | ||||||
| 1970 | - | 14 | - | 560 | 982 | 1.75 |
| 1971 | - | 14 | - | 621 | 1,092 | 1.76 |
| 1972 | - | 14 | - | 666 | 1,089 | 1.64 |
| 1973 | - | 18 | - | 700 | 1,023 | 1.46 |
| 1974 | - | 18 | - | 752 | 957 | 1.27 |
| Eastbourne— | ||||||
| 1970 | - | 19 | - | 729 | 1,083 | 1.49 |
| 1971 | - | 19 | - | 724 | 1,095 | 1.51 |
| 1972 | - | 19 | - | 746 | 1,076 | 1.44 |
| 1973 | - | 19 | - | 696 | 1,062 | 1.53 |
| 1974 | - | 19 | - | 702 | 1,054 | 1.50 |
| Wellington— | ||||||
| 1970 | 121* | 141 | 2,997* | 3,580 | 26,584 | 4.04 |
| 1971 | 121* | 135 | 3,073* | 3,267 | 26,639 | 4.20 |
| 1972 | 116* | 135 | 3,157* | 3,336 | 26,506 | 4.08 |
| 1973 | 117* | 135 | 2,652* | 3,526 | 25,466 | 4.12 |
| 1974 | 115* | 135 | 2,004* | 3,669 | 23,941 | 4.22 |
| Christchurch— | ||||||
| 1970 | - | 166 | - | 7,356 | 17,571 | 2.39 |
| 1971 | - | 166 | - | 7,315 | 17,095 | 2.34 |
| 1972 | - | 166 | - | 7,433 | 16,147 | 2.17 |
| 1973 | - | 167 | - | 7,432 | 15,603 | 2.10 |
| 1974 | - | 167 | - | 7,282 | 16,099 | 2.21 |
| Timaru— | ||||||
| 1970 | - | 13 | - | 423 | 1,051 | 2.49 |
| 1971 | - | 13 | - | 414 | 1,169 | 2.82 |
| 1972 | - | 13 | - | 413 | 1,089 | 2.64 |
| 1973 | - | 13 | - | 435 | 1,092 | 2.51 |
| 1974 | - | 13 | - | 446 | 972 | 2.18 |
| Dunedin— | ||||||
| 1970 | 54 | 43 | 1,164 | 1,489 | 9,511 | 3.59 |
| 1971 | 42 | 47 | 986 | 1,459 | 8,635 | 3.53 |
| 1972 | 42 | 47 | 868 | 1,740 | 8,461 | 3.24 |
| 1973 | 34 | 57 | 771 | 1,763 | 7,406 | 2.92 |
| 1974 | 17 | 67 | 504 | 1,973 | 7,167 | 2.89 |
| Invercargill— | ||||||
| 1970 | - | 23 | - | 771 | 1,834 | 2.38 |
| 1971 | - | 19 | - | 755 | 1,748 | 2.32 |
| 1972 | - | 19 | - | 659 | 1,404 | 2.13 |
| 1973 | - | 19 | - | 648 | 1,363 | 2.10 |
| 1974 | - | 19 | - | 664 | 1,392 | 2.10 |
| Totals: All Services— | ||||||
| 1970 | 302* | 679 | 8,855† | 23,222 | 101,133 | 3.15 |
| 1971 | 289* | 661 | 8,766† | 22,918 | 99,722 | 3.15 |
| 1972 | 284* | 661 | 8,677† | 23,429 | 96,448 | 3.00 |
| 1973 | 277* | 890 | 7,964 | 34,179 | 104,636 | 2.48 |
| 1974 | 258* | 948 | 6,746 | 34,807 | 102,661 | 2.47 |
The length of routes covered by the services are given in the following table.
| Area and Service | At 31 March | ||||
|---|---|---|---|---|---|
| 1970 | 1971 | 1972 | 1973 | 1974 | |
| Auckland— | kilometres | ||||
| Trolley bus | 93.08 | 93.08 | 93.08 | 93.08 | 65.34 |
| Motor bus | 249.45 | 249.45 | 249.45 | 652.04 | 600.61 |
| Gisborne— | |||||
| Motor bus | 28.97 | 28.97 | 27.36 | 28.97 | 28.97 |
| New Plymouth-Motor bus | 38.38 | 38.62 | 38.62 | 49.89 | 49.89 |
| Palmerston North— | |||||
| Motor bus | 127.94 | 134.38 | 135.18 | 144.84 | 144.84 |
| Eastbourne— | |||||
| Motor bus | 25.75 | 25.75 | 25.75 | 25.75 | 25.75 |
| Wellington— | |||||
| Trolley bus | 51.58 | 51.58 | 51.58 | 51.58 | 51.58 |
| Motor bus | 95.82 | 95.82 | 95.82 | 84.56 | 84.56 |
| Tram, cable | 0.62 | 0.62 | 0.62 | 0.62 | 0.62 |
| Christchurch— | |||||
| Motor bus | 265.52 | 266.02 | 266.73 | 266.73 | 267.48 |
| Timaru— | |||||
| Motor bus | 40.23 | 37.23 | 37.23 | 37.23 | 37.23 |
| Dunedin— | |||||
| Trolley bus | 40.63 | 36.36 | 28.04 | 32.41 | 22.75 |
| Motor bus | 71.51 | 51.92 | 75.18 | 80.85 | 90.50 |
| Invercargill— | |||||
| Motor bus | 43.45 | 45.06 | 45.06 | 45.06 | 45.06 |
GENERAL—New Zealand today ranks among the leading nations of the world in terms of use of air transport per head of population.
Jet services operate on the main trunk routes in the country. Air transport has become increasingly important between the North and South Islands and between main centres such as Auckland and Wellington. Agricultural aviation is a large and vital industry and general aviation continues to grow.
The promotion of tourism and the growth of international aviation have gone hand in hand. Air New Zealand operates over many Pacific routes in competition with other airlines and New Zealand has financed the construction of an international airport at Rarotonga in the Cook Islands.
DEVELOPMENT OF AVIATION—During the early 1920s an appreciable amount of air taxi and charter flying was carried out and the aero club movement began in 1927. The first registered company commenced services in 1934, on the route Inchbonnie - Hokitika - Franz Josef Glacier, on the West Coast of the South Island. Subsequent extensions of services up to the outbreak of war in September 1939 resulted in a network over most of New Zealand. During 1946 and 1947 the New Zealand National Airways Corporation absorbed all then existing scheduled commercial services, and by adding to the fleet of aircraft was able to commence new services.
Regular international air services did not begin before the Second World War despite a number of gallant pioneer flights. Tasman Empire Airways Ltd. (TEAL) was incorporated in New Zealand on 26 April 1940, following a formal inter-governmental agreement on air traffic rights across the Tasman Sea on 10 April 1940. The company's first operation commenced between Auckland and Sydney on 30 April 1940 with the flying boat Aotearoa.
In June 1950 the company took over the Auckland-Suva service from New Zealand National Airways Corporation. The Wellington-Sydney service was inaugurated on 3 October 1950 and the Christchurch-Melbourne service on 28 June 1951. With the withdrawal of flying boats from Tasman routes, the Wellington-Sydney service was temporarily discontinued in June 1954 and a new service from Christchurch to Sydney using Douglas DC6 aircraft was commenced in the following month. The same type of aircraft were also employed on the Auckland-Fiji route from June 1954. The first Lockheed Electra turboprop aircraft was brought into use on the trans-Tasman service in December 1959, and by March 1960 all TEAL services between Australia, New Zealand, and Fiji, were being operated by the company's fleet of three Electras.
It had become clear that the monopoly of the Tasman air traffic formerly reserved to TEAL could not be much longer maintained in New Zealand's interests and this fact, together with the spread of jet aircraft throughout the world, led to planning for the company to extend its services to the United States and elsewhere, for which purposes it would require large jet aircraft. In these new circumstances the Australian and New Zealand Governments agreed that New Zealand should purchase the Australian shareholding and thus become the sole owner of the company. In March 1961, an agreement to this effect was concluded and at the same time a bilateral air services agreement was negotiated between Australia and New Zealand whereby each country granted to the airline of the other rights to and beyond its territory. Subsequently, the New Zealand Government negotiated traffic rights for Air New Zealand in Honolulu, Los Angeles, Pago Pago, Hong Kong, Tahiti, Noumea, Kuala Lumpur, Singapore, and Fiji, in addition to the rights already obtained in Australia. (The change of name from TEAL to Air New Zealand was made on 1 April 1965.) Pure jet services to the United States, Singapore, and Hong Kong were inaugurated during 1965-66; prop-jet Electra services were retained for Wellington-Tasman flights until replaced by DC8 jet aircraft in June 1972. Services to Los Angeles are operated via Fiji, Honolulu, and Tahiti with DC10 aircraft.
The operations of Air New Zealand earn or save an estimated $45.4 million in overseas funds and make an important contribution to the country's external balance of payments. Air New Zealand made a profit of $4.1 million in 1973-74; the company's twentieth year of profitability. The company has three DC10 aircraft (with three more on order) and six DC8s. The revenue ($87.4 million) of Air New Zealand was derived in the following proportions: Passenger services 74.6 percent, freight and baggage 9.9 percent, charters 5.2 percent, mail 3.2 percent and other sources 7.1 percent. New Zealand custom provided the biggest share of the passenger and freight reserve, 40.7 percent, followed by Australia 23.4 percent, North America 17.4 percent, the United Kingdom and Europe 9.6 percent, the Far East 3.8 percent, and the Pacific Islands 3.8 percent.
AIR SERVICES—The major domestic air transport services are provided by National Airways Corporation, the national air carrier, which also wholly owns Safe Air Ltd., the air freight carrier. Mt. Cook Airlines provides essentially tourist services. Safe Air Ltd. provides a Cook Strait service and a Chatham Island service. Other regular secondary air services are provided by Air North Ltd. and Capital Air Services and at most aerodromes there are light aircraft operators licensed for air charter and air taxi services. Aero clubs and flying schools provide facilities for training and private flying. The agricultural aviation industry has continued to flourish and an increasingly significant role is being played by helicopters.
International air services are operated by New Zealand's own international airline, Air New Zealand Ltd., and other regular international air services are provided by BOAC, QANTAS, Pan American World Airways, American Airlines, and UTA French Airlines.
LEGISLATION—The principal legislation affecting civil aviation in New Zealand is the Civil Aviation Act 1964. This Act established the Department of Civil Aviation which later, under the Ministry of Transport Act 1968, became a Division of the Ministry of Transport. The principal functions of the Division are stated to be: (a) to promote and encourage the orderly and economic development of civil aviation; (b) to exercise such functions as may be necessary to ensure the safe operation of aircraft; (c) to initiate and carry out surveys into any aspect of civil aviation.
The Director of the Civil Aviation Division has statutory powers of his own in regulatory matters. The Ministry of Transport embraces also the New Zealand Meteorological Service and the Office of Air Accidents Investigation headed by the Chief Inspector of Air Accidents.
The Air Services Licensing Act 1951 made provision for the establishment of the Air Services Licensing Authority, a four-man independent body, with the primary function of receiving an determining applications for the grant, renewal, amendment, or transfer of air service licences. Under the Act, an air service licence is essential for any air transport or specified aerial work conducted for hire or reward. There is a right of appeal against the decisions of the Air Services Licensing Authority to the Air Services Appeal Authority. International air services are governed by intergovernmental air transport agreements and the International Air Services Licensing Act 1947.
In May 1966 most international airlines, including Air New Zealand, entered into what is known as the Montreal Agreement which also has provisions concerning the liabilities of international air carriers towards their passengers. As a result of the number of different conventions covering the subject there are different limits of liability for the death of a passenger depending on the routes over which the passenger has arranged to travel. The limits may be either US$6,000, US$12,000, US$42,000, or up to US$75,000. New Zealand has now signed the Guatemala Protocol to the Warsaw Convention which will introduce the concept of absolute liability with a limit of US$100,000.
The Carriage by Air Act 1967 governs the liabilities of domestic air carriers towards their passengers and consignors of goods. Briefly, it provides that an air carrier is liable for damage resulting from the death or personal injury of a passenger as a result of an accident unless the carrier can prove that it took all necessary measures to avoid the damage. The limit of liability is set at $42,000. However such liability does not extend to or include any passenger who at the time of the accident has cover in respect of the accident under the provisions of the Accident Compensation Act 1972.
The Airport Authorities Act 1966 empowers local authorities, with the consent of the Governor-General in Council, to establish, improve, operate, or manage airports. In pursuit of these objectives local authorities may enter into joint-venture agreements with the Crown.
Effect is given to the Tokyo Convention 1963 relating to offences committed on board aircraft, the Hague Convention 1970 relating to hijacking, and the Montreal Convention 1971 relating to aerial sabotage by the Aviation Crimes Act 1972 which came into full force by Order in Council on 12 March 1974.
AIR NAVIGATION SERVICES AND FACILITIES—The Civil Aviation Division of the Ministry of Transport is the responsible authority for the provision of all facilities for air navigation in New Zealand, its island territories, and the Cook Islands, and by delegation the facilities for flying operations in Western Samoa.
Air navigation facilities include a variety of electronic aids such as non-directional medium-frequency beacons (NDB), very high-frequency beacons (VOR), instrument landing systems (ILS), surveillance radar (SRE), precision approach radar (PAR), distance measuring equipment (DME), and also visual aids to navigation including visual glide slope indicators (VASI), high and low intensity approach, runway, and taxiway lights, aerodrome identification beacons, obstruction lights, hazard beacons, runway markings, cloud height measuring devices, wind strength and direction indicators, etc.
To assist the safe, orderly, and expeditious use of the air navigation system the Division provides a comprehensive ground services organisation comprising air traffic control units, communications services, crash-fire services, a search and rescue service, and ground safety organisations. Units of the ground services organisations are located at the majority of aerodromes served by regular scheduled air transport services in New Zealand and Pacific island territories operating from control towers and associated departmental buildings. In addition, control centres and communications centres are established at Auckland and Fiji for the conduct of international operations and at Wellington, Christchurch, and Dunedin to provide services to en-route aircraft throughout the entire country. A search and rescue service is provided from rescue co-ordination centres established by the Division whose responsibility it is to co-ordinate the effort and resources of military and civil agencies in the planning and direction of major search and rescue operations, whether air, land, or sea.
The Division maintains a flight supervision and standards service and conducts examinations and issues licences for all categories of aircrew and ground personnel. Specially equipped aircraft and qualified aircrew are continuously engaged on the checking and calibration of all air navigation facilities.
An Aeronautical Information Service prepares and publishes New Zealand Aeronautical Information and Notices to Airmen and, in collaboration with Lands and Survey Department, produces aeronautical maps and charts, etc.
An aeronautical training college is established at Christchurch International Airport where regular courses are conducted in air traffic control, meteorology, radio engineering, communications, and crash-fire procedure.
GOVERNMENT EXPENDITURE—A summary statement of operating and capital costs and recoveries of the Civil Aviation Division for years ended 31 March is now given.
| Item | Costs | Recoveries | ||||
|---|---|---|---|---|---|---|
| 1971-72 | 1972-73 | 1973-74 | 1971-72 | 1972-73 | 1973-74 | |
| Operating | $(000) | $(000) | $(000) | $(000) | $(000) | $(000) |
| Civil Aviation, New Zealand— | ||||||
| Regulatory and general | 1,440 | 1,610 | 1,927 | 163 | 166 | 224 |
| Airports | 167 | 228 | 80 | 57 | 58 | 56 |
| Airways | 7,733 | 8,971 | 9,961 | 4,414 | 4,532 | 4,852 |
| Civil Aviation, South Pacific territories | 343 | 256 | 424 | 3 | 5 | 14 |
| Totals | 9,683 | 11,065 | 12,392 | 4,637 | 4,761 | 5,146 |
| Capital | ||||||
| Civil Aviation, New Zealand— | ||||||
| Regulatory and general | 8 | 14 | 142 | - | 5 | 9 |
| Airports | 2,476 | 4,166 | 4,197 | 412 | 85 | 35 |
| Airways | 1,831 | 2,414 | 862 | - | - | 148 |
| Civil Aviation, South Pacific territories | 2,525 | 2,332 | 1,216 | - | - | - |
| Totals | 6,840 | 8,926 | 6,417 | 412 | 90 | 192 |
| Grand totals | 16,523 | 19,991 | 18,809 | 5,049 | 4,851 | 5,338 |
NATIONAL AIRWAYS CORPORATION—The major domestic air transport operator is the New Zealand National Airways Corporation which provides regular services to 23 centres throughout the North and South Islands.
The corporation's fleet consists of 7 Boeing 737s, 2 Vickers Viscount 807s, and 14 Fokker Friendships.
Statistics of operation of the National Airways Corporation for the 4 latest years are shown in the following table.
| Item | 1970-71 | 1971-72 | 1972-73 | 1973-74 |
|---|---|---|---|---|
| *Includes excess baggage. | ||||
| Revenue mileage flown | 10,405,121 | 10,478,028 | 9,962,329 | 12,157,472 |
| Revenue passengers carried— | ||||
| Schedule | 1,494,351 | 1,489,860 | 1,638,273 | 1,991,582 |
| Charter | 13,205 | 12,841 | 17,464 | 26,246 |
| Passenger-miles created (000)— | ||||
| Schedule | 568,787 | 609,195 | 634,344 | 720,587 |
| Charter | 7,500 | 6,863 | 8,362 | 13,661 |
| Revenue passenger-miles (000)— | ||||
| Schedule | 404,919 | 407,495 | 450,131 | 552,174 |
| Charter | 4,606 | 4,470 | 5,454 | 8,730 |
| Average passenger journey (miles) | 271 | 274 | 275 | 277 |
| Freight ton-miles (000)— | ||||
| Schedule | 6,383 | 6,607 | 8,025 | 9,565 |
| Charter | - | - | - | - |
| Mail ton-miles | 799,842 | 701,762 | 690,678 | 753,284 |
| Total revenue load factor | 67.12 | 63.74 | 66.91 | 70.69 |
| Revenue passenger load factor | 71.19 | 66.89 | 70.96 | 76.63 |
| Operating expenditure ($) | 27,997,606 | 32,442,054 | 34,120,818 | 40,643,269 |
| Operating profit ($) | 1,086,348 | 704.777 | 3,167,728 | 5,054,384 |
The corporation is charged under the National Airways Act 1945 “with establishing and operating national air transport services to meet the needs of the people of New Zealand”. The corporation has therefore sought constantly to improve the standard and scope of its service whilst keeping fares at a low level. The expansion achieved during recent years is indicated by the increase in revenue passenger-miles on scheduled services from 450 million in 1972-73 to 552 million in 1973-74.
FLYING OPERATIONS—The following table gives the summarised results of the operations of scheduled commercial air services.
| Year Ended | Hours Flown | Miles Flown (000) | Passengers | Freight lb (000)* | Mail lb (000) | Passenger-miles (000) | Freight Ton-miles* (000) | Mail Ton-miles (000) |
|---|---|---|---|---|---|---|---|---|
| March | ||||||||
| 1963 | 64,072 | 9,575 | 822,950 | 139,653 | 2,464 | 211,899 | 6,775 | 397 |
| 1964 | 64,445 | 9,887 | 873,246 | 115,784 | 2,552 | 228,209 | 6,243 | 394 |
| 1965 | 71,787 | 10,894 | 984,511 | 127,699 | 2,542 | 262,367 | 7,041 | 431 |
| 1966 | 78,853 | 11,969 | 1,113,363 | 151,169 | 2,815 | 296,629 | 8,160 | 453 |
| 1967 | 74,698 | 12,261 | 1,170,949 | 128,483 | 2,983 | 311,036 | 7,709 | 470 |
| 1968 | 75,582 | 12,196 | 1,173,116 | 104,022 | 3,708 | 310,631 | 7,376 | 646 |
| 1969 | 71,887 | 11,606 | 1,305,020 | 113,616 | 3,692 | 344,442 | 8,491 | 684 |
| 1970 | 66,810 | 11,797 | 1,478,785 | 150,157 | 4,191 | 391,395 | 9,615 | 754 |
| 1971 | 66,643 | 11,910 | 1,534,878 | 160,775 | 4,411 | 413,435 | 10,509 | 808 |
| December | ||||||||
| 1970 | 66,551 | 11,867 | 1,543,852 | 162,002 | 4,561 | 419,589 | 10,578 | 825 |
| 1971 | 67,800 | 12,265 | 1,544,758 | 155,313 | 3,978 | 417,748 | 10,872 | 720 |
| 1972 | 70,320 | 12,887 | 1,651,921 | 148,399 | 5,186 | 451,288 | 11,931 | 690 |
| 1973 | 77,774 | 14,285 | 2,005,460 | 140,162 | 5,615 | 554,188 | 13,412 | 745 |
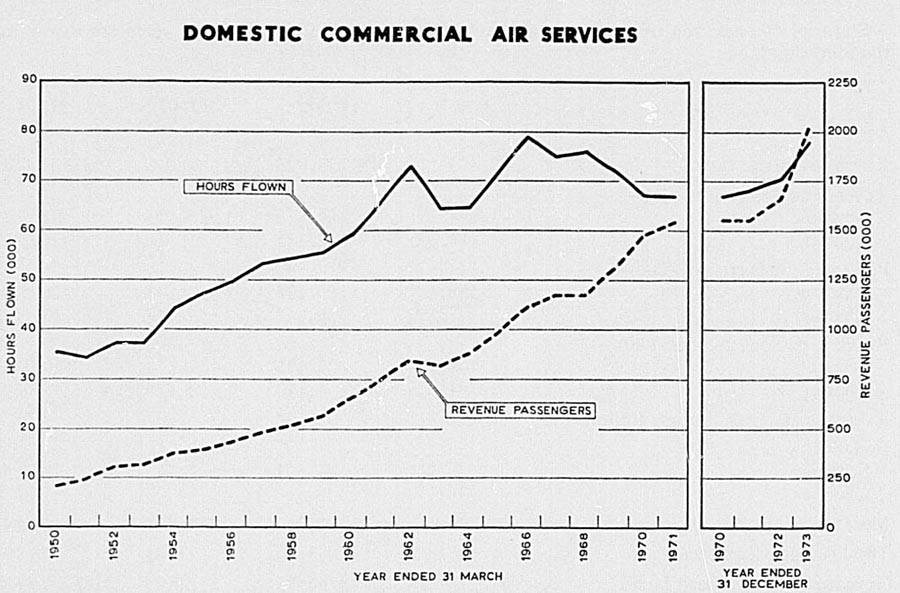
Cook Strait Rail/Air Freight Service—The New Zealand Railways Air Freight Service was commenced officially in February 1947 following a number of special inter-island freight nights which had been carried out by the Royal New Zealand Air Force at the request of the Railways Department to meet a shipping emergency. The service was conducted by the RNZAF, operating Dakota aircraft, until June 1947, when the service was handed over to the New Zealand National Airways Corporation, which continued to operate with Dakotas.
In 1950 the Railways Department decided to allow private enterprise the opportunity of tendering for the contract to run the service, and the successful tenderer was Safe Air Ltd. In 1972 this firm was absorbed by National Airways Corporation. The service is at present being maintained by five Bristol Freighter aircraft on a daily basis, the number of trips varying according to the amount of cargo offering. Some charter work has been undertaken in recent years.
Traffic statistics for this freight service for recent years are as follows. The drop from the peak figures of 1961-62 can be attributed in part to the operation of the rail-road ferry G.m.v. Aramoana across Cook Strait between Wellington and Picton from August 1962. There was further competition when the sister ship G.m.v. Aranui was introduced in 1966, and then G.m.v. Arahanga in December 1972 and G.m.v. Aratika in September 1974.
| Year Ended | Trips Flown | Hours Flown | Miles Flown | Freight lb (000) | Freight Ton-miles (000) | Passengers |
|---|---|---|---|---|---|---|
| March— | ||||||
| 1963 | 12,381 | 5,050 | 660,924 | 110,625 | 2,650 | 927 |
| 1964 | 10,588 | 4,265 | 560,130 | 87,656 | 2,067 | 809 |
| 1965 | 11,315 | 4,558 | 591,796 | 95,764 | 2,239 | 899 |
| 1966 | 13,182 | 5,894 | 778,501 | 116,870 | 2,993 | 1,500 |
| 1967 | 10,922 | 5,139 | 677,003 | 93,535 | 2,549 | 902 |
| 1968 | 8,537 | 4,167 | 557,846 | 69,354 | 2,170 | 531 |
| 1969 | 8,191 | 3,952 | 532,426 | 72,984 | 2,143 | 480 |
| 1970 | 15,898 | 6,337 | 849,437 | 108,685 | 3,434 | 413 |
| 1971 | 13,383 | 7,152 | 967,791 | 114,948 | 3,714 | 3,445 |
| December— | ||||||
| 1970 | 13,506 | 10,369 | 1,451,352 | 110,970 | 3,925 | 3,625 |
| 1971 | 13,229 | 9,377 | 1,310,918 | 108,629 | 4,027 | 3,113 |
| 1972 | 12,016 | 8,267 | 1,131,434 | 95,431 | 4,113 | 3,253 |
| 1973 | 9,793 | 7,413 | 1,053,487 | 75,725 | 3,632 | 3,625 |
AERIAL WORK—Aerial topdressing as a means of improving hill pastures and checking and preventing soil erosion was begun commercially in 1949. The industry developed rapidly and is now an established feature of the national economy. About half of the total fertiliser and lime applied to farms in New Zealand is spread by means of aircraft.
Aerial spraying (i.e., the release from the aircraft of agricultural chemicals in liquid form, such as insecticides and weedicides) has also been developed. The volume of this work has increased to more than 10 million gallons a year. A technical qualification is mandatory for pilots engaged in the application of all agricultural chemicals. The qualification is to ensure that pilots are familiar with the chemical properties and correct techniques in applying the agricultural chemicals, many of which are highly toxic.
A summary of aerial work operations follows.
| Item | Year Ended 31 December | |||
|---|---|---|---|---|
| 1970 | 1971 | 1972 | 1973 | |
| Hours flown | 111,554 | 108,246 | 134,657 | 159,140 |
| Number of operators | 76 | 79 | 79 | 83 |
| Material distributed— | ||||
| Fertiliser and lime (tons) | 855,863 | 817,391 | 1,105,355 | 1,314,717 |
| Seed (tons) | 1,667 | 1,396 | 1,619 | 2,656 |
| Spray (gallons) | 6,094,208 | 7,175,704 | 8,054,764 | 10,056,697 |
| Animal poison (tons) | 5,591 | 3,635 | 4,543 | 5,244 |
| Supplies (tons) | 1,057 | 3,777 | 1,527 | 5,000 |
| Fencing (tons) | 788 | 1,218 | 1,645 | 1,223 |
| Dusts (tons) | 45 | 28 | 19 | 67 |
| Prills (tons) | 224 | 184 | 92 | 118 |
| Miscellaneous (tons) | 3,472 | 2,507 | 2,978 | 2,489 |
INTERNATIONAL AIR SERVICES—New Zealand's own airline, Air New Zealand Ltd., provides services to Sydney, Melbourne, Brisbane, Hong Kong, Singapore, Norfolk Island, New Caledonia, Fiji, American Samoa, Rarotonga, Tahiti, Honolulu, and Los Angeles. Air New Zealand's fleet comprises six Douglas DC8s and six Douglas DC10s. Air New Zealand now operates international services to and through the new Cook Islands airport at Rarotonga.
Other services through New Zealand include: Pan American World Airways—from the United States to Auckland via Tahiti; through Honolulu and Pago Pago to Auckland; British Airways—twice weekly from the United Kingdom to Sydney and Auckland; Union de Transport Aeriens—weekly from Los Angeles via Tahiti to Auckland and beyond to Noumea; and QANTAS—a full range of trans-Tasman services linking with regional and United Kingdom services out of Sydney.
A minority financial interest is retained in the regional South Pacific operators: Polynesian Airlines Ltd. (PAL)—operating between Western Samoa, American Samoa, Tonga, Niue, and Nandi; and Air Pacific Ltd.—operating between Fiji, the British Solomons, the Gilbert and Ellice Islands, the New Hebrides, Western Samoa, Tonga, Nauru, and Port Moresby.
TOTAL TRAFFIC FOR OVERSEAS AIRLINES—Total traffic figures for overseas airlines operating to and from New Zealand, showing passenger movements, freight, and mail separately, are given in the following tables for calendar years.
| Routes | Passengers Entering New Zealand | Passengers Leaving New Zealand | Total Passengers | |||
|---|---|---|---|---|---|---|
| 1972 | 1973 | 1972 | 1973 | 1972 | 1973 | |
| Trans-Tasman— | ||||||
| Auckland-Sydney | 105,385 | 126,980 | 94,085 | 114,624 | 199,470 | 241,604 |
| Auckland-Melbourne | 24,430 | 37,642 | 22,099 | 34,124 | 46,529 | 71,766 |
| Auckland-Brisbane | 17,833 | 22,183 | 17,291 | 21,981 | 35,124 | 44,164 |
| Wellington-Sydney | 34,672 | 42,805 | 32,141 | 38,780 | 66,813 | 81,585 |
| Wellington-Melbourne | 9,111 | 11,956 | 9,204 | 11,881 | 18,315 | 23,837 |
| Wellington-Brisbane | 4,548 | 6,938 | 4,739 | 7,047 | 9,287 | 13,985 |
| Christchurch-Sydney | 47,935 | 57,733 | 50,169 | 58,250 | 98,104 | 115,983 |
| Christchurch-Melbourne | 22,658 | 28,917 | 23,587 | 29,135 | 46,245 | 58,052 |
| Totals | 266,572 | 335,154 | 253,315 | 315,822 | 519,887 | 650,976 |
| Pacific— | ||||||
| Long haul | 37,082 | 50,347 | 39,194 | 52,215 | 76,276 | 102,562 |
| Short haul | 68,554 | 83,344 | 66,679 | 77,990 | 135,233 | 161,334 |
| Totals | 105,636 | 133,691 | 105,873 | 130,205 | 211,509 | 263,896 |
| Routes | Revenue Freight Entering New Zealand | Revenue Freight Leaving New Zealand | Total Freight | |||
|---|---|---|---|---|---|---|
| 1972 | 1973 | 1972 | 1973 | 1972 | 1973 | |
| Trans-Tasman— | kg(000) | |||||
| Auckland-Sydney | 2,459 | 4,167 | 3,237 | 3,479 | 5,696 | 7,646 |
| Auckland-Melbourne | 599 | 1,059 | 595 | 877 | 1,194 | 1,936 |
| Auckland-Brisbane | 90 | 177 | 374 | 348 | 464 | 525 |
| Wellington-Sydney | 601 | 900 | 298 | 422 | 900 | 1,323 |
| Wellington-Melbourne | 144 | 201 | 155 | 258 | 300 | 459 |
| Wellington-Brisbane | 19 | 37 | 29 | 84 | 48 | 120 |
| Christchurch-Sydney | 771 | 1,008 | 782 | 788 | 1,553 | 1,796 |
| Christchurch-Melbourne | 221 | 307 | 261 | 375 | 482 | 682 |
| Totals | 4,907 | 7,856 | 5,734 | 6,631 | 10,641 | 14,487 |
| Pacific— | ||||||
| Long haul | 587 | 1,223 | 2,209 | 2,415 | 2,796 | 3,638 |
| Short haul | 366 | 678 | 1,841 | 2,105 | 2,208 | 2,784 |
| Totals | 953 | 1,902 | 4,050 | 4,521 | 5,004 | 6,422 |
| Routes | Mail Entering New Zealand | Mail Leaving New Zealand | Total Mail | |||
|---|---|---|---|---|---|---|
| 1972 | 1973 | 1972 | 1973 | 1972 | 1973 | |
| Trans-Tasman— | kilograms | |||||
| Auckland-Sydney | 440,563 | 452,891 | 169,574 | 170,430 | 610,137 | 623,321 |
| Auckland-Melbourne | 56,453 | 88,069 | 17,247 | 22,632 | 73,700 | 110,701 |
| Auckland-Brisbane | 14,972 | 16,158 | 8,690 | 9,411 | 23,662 | 25,569 |
| Wellington-Sydney | 122,993 | 133,394 | 77,150 | 75,381 | 200,143 | 208,775 |
| Wellington-Melbourne | 10,200 | 11,739 | 6,483 | 6,071 | 16,683 | 17,810 |
| Wellington-Brisbane | 446 | 237 | 313 | 648 | 759 | 885 |
| Christchurch-Sydney | 59,464 | 68,675 | 39,152 | 42,579 | 98,616 | 111,254 |
| Christchurch-Melbourne | 10,929 | 13,964 | 11,306 | 13,401 | 22,235 | 27,365 |
| Totals | 716,020 | 785,127 | 329,915 | 340,553 | 1,045,935 | 1,125,680 |
| Pacific— | ||||||
| Long haul | 202,963 | 264,681 | 117,642 | 163,503 | 320,605 | 428,184 |
| Short haul | 93,025 | 129,898 | 188,374 | 183,302 | 281,399 | 313,200 |
| Totals | 295,988 | 394,579 | 306,016 | 346,805 | 602,004 | 741,384 |
AIR FREIGHT—Air freight involves mostly exports and imports to and from Australia, and imports from United States and United Kingdom. Exports concern mainly made-up textiles, meat, fish, and live animals, notably racehorses. Imports air-freighted are mainly machinery, scientific instruments, pharmaceutical products, and textiles.
AIRPORT STATISTICS—The following table shows airport activities for the 2 latest years ended 31 March.
| Airport | Movements of Passenger Planes | Freighter Plane Movements | Passenger Arrivals and Departures | |||||
|---|---|---|---|---|---|---|---|---|
| International | Domestic | |||||||
| 1972-73 | 1973-74 | 1972-73 | 1973-74 | 1972-73 | 1973-74 | 1972-73 | 1973-74 | |
| *Those airports serviced by N.A.C., Safe Air, Air North, and Mount Cook Airlines not separately listed. | ||||||||
| Auckland | 6,616 | 7,207 | 20,490 | 22,583 | 1,230 | 1,626 | 1,235,714 | 1,516,239 |
| Blenheim | - | - | 2,603 | 4,141 | 9,164 | 8,430 | 63,112 | 72,248 |
| Christchurch | 1,670 | 1,878 | 18,441 | 21,071 | 3,665 | 4,650 | 838,215 | 993,089 |
| Dunedin | - | - | 8,315 | 8,666 | 316 | 582 | 182,962 | 217,501 |
| Gisborne | - | - | 6,008 | 5,933 | - | 2 | 62,094 | 70,938 |
| Hamilton | - | - | 5,856 | 5,232 | 96 | - | 85,592 | 109,369 |
| Invercargill | - | - | 5,339 | 5,347 | 4 | 176 | 93,191 | 109,079 |
| Napier | - | - | 7,029 | 7,339 | 14 | - | 98,319 | 123,733 |
| Nelson | - | - | 8,231 | 9,662 | 920 | 723 | 142,251 | 171,924 |
| New Plymouth | - | - | 3,773 | 4,534 | 10 | - | 71,306 | 89,591 |
| Palmerston North | - | - | 5,789 | 6,199 | 22 | 96 | 91,528 | 113,674 |
| Rotorua | - | - | 7,369 | 7,726 | - | - | 86,407 | 95,912 |
| Wellington | 1,290 | 1,331 | 32,099 | 36,545 | 12,498 | 11,220 | 1,024,860 | 1,206,807 |
| Other* | - | - | 44,531 | 52,871 | 98 | 116 | 357,909 | 430,372 |
| Total | 9,576 | 10,416 | 150,730 | 197,849 | 28,037 | 27,621 | 4,433,460 | 5,320,476 |
AERO CLUBS AND COMMERCIAL FLIGHT TRAINING ORGANISATIONS—The next table gives a summary of the training activities of aero clubs and other flying organisations.
| Calendar Year | Clubs* Operating | Membership | Aircraft in use | Hours Flown | Ab Initio Pupils Under Training | ||
|---|---|---|---|---|---|---|---|
| Associate | Flying | Dual | Solo | ||||
| *Other organisations included are given in parentheses. | |||||||
| 1970 | 40 (18) | 1,934 | 6,381 | 259 | 47,494 | 76,929 | 1,89 |
| 1971 | 41 (19) | 1,791 | 5,810 | 238 | 48,055 | 76,169 | 1,90 |
| 1972 | 38 (20) | 1,563 | 6,165 | 273 | 48,489 | 77,022 | 2,01 |
| 1973 | 37 (21) | 1,595 | 6,990 | 282 | 57,299 | 95,995 | 2,38 |
LICENCES—A summary of licences and certificates current at 31 March in the 5 latest years is given below.
| Type of Licence | 1970 | 1971 | 1972 | 1973 | 1974 |
|---|---|---|---|---|---|
| Flight Crew (ICAO) Type— | |||||
| Pilots licences— | |||||
| Student Pilot | 3,330 | 3,427 | 3,246 | 3,328 | 4,275 |
| Private Pilot | 2,837 | 3,146 | 2,802 | 3,409 | 3,752 |
| Commercial Pilot | 908 | 917 | 965 | 970 | 1,133 |
| Airline Transport Pilot | 397 | 409 | 417 | 428 | 422 |
| Pilot Licence Ratings— | |||||
| Instructor | 395 | 444 | 479 | 505 | 481 |
| Instrument | 548 | 559 | 601 | 666 | 675 |
| Compass | 27 | 23 | 24 | 23 | 21 |
| Chemical | 243 | 258 | 278 | 298 | 287 |
| Towing | 260 | 268 | 300 | 292 | 318 |
| Navigator Licences— | |||||
| Flight Navigator | 104 | 103 | 82 | 73 | 63 |
| Licences to Operate Radio Equipment in Aircraft— | |||||
| Flight Radio Operator | - | - | - | - | - |
| Flight Radio Telephone Operator Rating | 4,046 | 4,668 | 4,444 | 4,694 | 5,271 |
| Flight Engineer Licences— | |||||
| Flight Engineer | 61 | 71 | 74 | 84 | 95 |
| Other Licences, Certificates, etc.— | |||||
| Aircraft Maintenance Engineer Licences | 534 | 583 | 638 | 686 | 660 |
| Aircraft— | |||||
| Certificates of Registration | 1,077 | 1,120 | 1,156 | 1,219 | 1,402 |
| Aerodromes— | |||||
| Public Licences | 46 | 50 | 58 | 56 | 56 |
| Private | 46 | 50 | 50 | 52 | 58 |
| Authorised Places | 6 | 9 | 186 | 185 | 201 |
| Government Civil | 18 | 23 | 23 | 22 | 22 |
| Air Service Certificates | 55 | 68 | 67 | 64 | 67 |
CIVIL AIRCRAFT ACCIDENTS—Civil aircraft accidents are investigated by the Office of Air Accidents Investigation headed by the Chief Inspector of Air Accidents who has statutory powers of his own in respect of his investigative duties and responsibilities.
The following table shows accident rates per 10,000 hours flown in the various categories of flying activity. Private flying and gliding are not included.
| Operational Category | Average Rate for 5-Year Period | Rate 1972 | Rate 1973 | ||
|---|---|---|---|---|---|
| 1966-70 | 1967-71 | 1968-72 | |||
| Airlines | 0.02 | - | - | - | - |
| Non-scheduled, charter, and air taxi | 2.01 | 1.87 | 1.93 | 2.15 | 3.19 |
| Aerial work— | |||||
| All sectors | 4.33 | 4.20 | 3.76 | 2.75 | 3.27 |
| Agricultural aviation | 3.76 | 3.52 | 3.52 | 2.36 | 2.25 |
| Aero clubs and flying training schools | 2.83 | 2.82 | 2.71 | 2.36 | 2.12 |
| All categories | 2.54 | 2.50 | 2.35 | 1.94 | 2.21 |
The following table gives the total number of air accidents in 1973, with details of deaths and injuries. Of the 155 accidents reported, 65 were to aircraft engaged in aerial work. Six persons were killed and 4 seriously injured. The 33 accidents in aero clubs and flying training schools involved no fatalities but 7 persons were seriously injured. The 25 accidents in private-owner flying resulted in 2 fatalities, and the 10 accidents in non-scheduled, charter and air-taxi operations involved 10 pilots and 17 passengers, of whom 2 pilots and 2 passengers were killed and 1 pilot and 1 passenger sustained serious injuries. No accidents were reported to scheduled domestic or international airline services within New Zealand.
| Category | Number of Accidents | Injury | Accidents Per 10,000 Hours Flown | ||||
|---|---|---|---|---|---|---|---|
| Total | Fatal | Fatal | Serious | ||||
| Crew | Pass. | Crew | Pass. | ||||
| Airlines (all operations) | - | - | - | - | - | - | - |
| Non-scheduled, charter, air taxi | 10 | 3 | 2 | 2 | 1 | 1 | 3.19 |
| Aerial work— | |||||||
| Agricultural— | |||||||
| Fixed wing | 31 | 4 | 4 | - | 3 | - | 1.85 |
| Rotary wing | 10 | - | - | - | 1 | - | 6.87 |
| Other— | |||||||
| Fixed wing | 2 | - | - | - | - | - | 4.29 |
| Rotary wing | 22 | 1 | 1 | 1 | - | - | 18.06 |
| Aero clubs and flying training schools | 33 | - | - | - | 4 | 3 | 2.12 |
| Private-owner flying | 25 | 2 | 2 | - | - | - | |
| Gliding | 22 | - | - | - | 1 | - | |
| Totals | 155 | 10 | 9 | 3 | 10 | 4 | 2.34 |
Table of Contents
GENERAL—The main role of the New Zealand Post Office is to provide the nation with telecommunication and postal services, to operate a savings bank, and conduct agency services on behalf of Government.
HISTORICAL—With the arrival of Governor Hobson in 1840 the first post office proper was set up at Kororareka (now Russell). The same year saw the establishment of offices at other settlements in the north and at Port Nicholson (Wellington), and the beginnings of overland mail routes. By 1858, 73 post offices had been opened to provide communication services for the scattered settlers. In that year a Post Office Act was passed making the Post Office an independent department of State.
The system of communication by telegraph was inaugurated in the 1860s. A separate department, the Telegraph Department, was created by Act of Parliament in 1865 to take responsibility for the erecting of telegraph lines and the opening of morse telegraph offices. The North and South Islands were linked by telegraph cable in 1866 and by telephone cable in 1926.
The telegraph and postal services were amalgamated in 1881. Under the Post Office Act 1959, the name of the department became the Post Office, and the Minister's title became Postmaster-General.
A table in the Statistical Summary towards the back of Yearbook shows the growth of postal and telecommunication activities over the last 50 years.
POSTAL BUSINESS—At 31 March 1974 there were 1,438 post offices in New Zealand. The following table shows the numbers of articles posted in the latest 6 years.
| Year Ended 31 March | Letters and Postcards | Printed Papers, Commercial Papers. Newspapers, and Magazines | Parcels | Total |
|---|---|---|---|---|
| million | ||||
| 1969 | 279.9 | 279.2 | 15.8 | 574.9 |
| 1970 | 288.8 | 291.1 | 15.7 | 595.4 |
| 1971 | 311.4 | 286.1 | 17.3 | 614.8 |
| 1972 | 303.7 | 302.2 | 16.2 | 622.1 |
| 1973 | 314.6 | 314.2 | 16.0 | 644.8 |
| 1974 | 334.9 | 316.9 | 16.8 | 668.6 |
The average numbers of items posted in New Zealand per head of population during the year ended 31 March 1974 were: letters and postcards, 110.1; printed matter (printed papers, commercial papers, newspapers, and magazines), 104.1; parcels, 5.5.
Chartered air services are used to convey the bulk of surface mail between the North and South Islands.
There are 107,182 private boxes installed at 632 post offices.
Rural Mail Delivery—The rural delivery system enables country residents to obtain postal notes, money orders, and stamps, to register correspondence, and to collect or post their mail in boxes at or near their gates. The deliveries are generally performed by contractors who handle the mail in conjunction with the carriage of goods, and thus the rural mail delivery is in many areas the medium by which residents obtain their newspapers, bread, parcels, etc. Boxholders more than doubled in the 25 years to 1965 when they reached 75,000. At 31 March 1973 the total was 79,366 and at 31 March 1974 it was 82,104. The cost of the rural delivery service is $2.44 million a year.
Inland Airmails—On 16 March 1936 the first regular airmail services linking up larger centres of population were established between Palmerston North and Dunedin, and between Nelson, Blenheim, and Wellington. As air services increased in frequency and extent the airmail facilities were correspondingly expanded. The present network extends from Kaitaia to Invercargill.
The numbers of letters and parcels carried by air in New Zealand are now shown.
| Year Ended 31 March | Letters | Parcels |
|---|---|---|
| 1969 | 17,796,000 | 293,545 |
| 1970 | 22,887,000 | 304,791 |
| 1971 | 25,360,000 | 328,185 |
| 1972 | 26,031,000 | 279,803 |
| 1973 | 25,812,000 | 277,742 |
| 1974 | 28,138,000 | 311,938 |
Overseas Airmails: The weight of airmail dispatched from New Zealand is about 25.97 percent of the total amount of mail forwarded overseas each year. In 1973-74, 278,752 kg of letters, 198,647 kg of newspapers and packets, and 191,326 kg of parcels were posted by overseas airmail.
Trans-Tasman Air Services—The first flight of the regular trans-Tasman service linking Auckland and Sydney took place on 30 April 1940, connection being made at Sydney with the Empire service to London. The existing service provides for flights between New Zealand (Auckland, Wellington, and Christchurch) and Australia (Sydney, Melbourne, and Brisbane) with a frequency overall of at least one flight each day.
New Zealand - United Kingdom Air Service—This service is now operating daily to London, the transit time New Zealand to the United Kingdom being normally 1 to 2 days.
New Zealand-Hong Kong and Singapore Air Services—There is a twice-weekly direct service from Auckland to Hong Kong and a thrice-weekly service from Auckland to Singapore. Airmail to countries in the Far East is also dispatched to Sydney for reforwarding.
Trans-Pacific Services—The trans-Pacific service operating between New Zealand and North America commenced on 20 July 1940. Airlines now operate a daily service to the United States.
Pacific Island Services—Airmails are forwarded by New Zealand operated air services to the Cook Islands, Fiji, French Polynesia, Hawaii, New Caledonia, Norfolk Island, and American Samoa (Pago Pago). Local air services provide connections from Pago Pago or Nandi to the British Solomon Islands, the Gilbert and Ellice Islands, New Hebrides, Niue, Tonga, and Western Samoa.
Overseas Parcel Post—Particulars of overseas parcels received and dispatched in each of the latest 7 years are contained in the following table.
| Year Ended 31 March | Overseas Parcels Received | Overseas Parcels Dispatched | |||
|---|---|---|---|---|---|
| Number | Weight | Customs Duty | Number | Weight | |
| kg | $(000) | kg | |||
| 1968 | 533,164 | 2,150,141 | 1,252 | 365,459 | 918,443 |
| 1969 | 533,405 | 2,128,034 | 1,630 | 400,231 | 942,138 |
| 1970 | 554,722 | 2,178,624 | 1,626 | 418,392 | 977,122 |
| 1971 | 658,209 | 2,468,883 | 1,815 | 458,543 | 1,076,514 |
| 1972 | 672,009 | 3,242,046 | 1,863 | 476,942 | 1,173,020 |
| 1973 | 655,601 | 2,492,886 | 1,846 | 450,148 | 1,151,541 |
| 1974 | 686,888 | 3,313,828 | 2,212 | 444,931 | 1,179,840 |
Postal Mechanisation—The Wellington Postal Centre is extensively mechanised, a similar modern centre is being built at Christchurch, and another is also planned for Auckland.
MONEY ORDER AND POSTAL NOTE SERVICES—Details of these services are now given.
Money Orders—Inland postal money orders for amounts in excess of $7 (for lesser amounts postal notes are used) and telegraph money orders for any amount may be purchased to send money within New Zealand, the Cook Islands, and Niue Island. Postal money orders may also be issued in New Zealand for payment in 180 overseas countries and places, but overseas telegraph money order service is available only to Australia, Fiji, Great Britain and Northern Ireland, Norfolk Island, and Western Samoa.
For money orders issued for payment overseas there are two special rates of commission, one applying to Australia (and countries advised through Australia), Fiji, Norfolk Island, and Tonga and the other rate to all other countries, except the Cook Islands, Niue, and Western Samoa, for which the inland rate of commission applies. In addition to commission, telegraph fees are also payable for money order telegrams.
During 1973, 1,460,626 money orders were issued in New Zealand for a total of $47,112,000 and of these, 151,732 orders of a value of $3,225,519 were issued for payment overseas. Money orders issued overseas for payment in New Zealand in 1973 numbered 48,830 with a value of $1,197,527.
Postal Notes—Postal notes ranging from 10c to $2 and for $3, $4, and $5 are issued in New Zealand for payment within New Zealand, Niue, and the Cook. Islands.
Postal notes are negotiable, and their period of validity is unlimited. They are, therefore, a popular medium for making small inland remittances by post, and during the year ended 31 December 1974, 4,007,000 postal notes valued at $9,253,000 were purchased by the public.
British Postal Orders—These are both issued and paid in New Zealand. Denominations sold in this country are 5p, 7 1/2p, 10p, 12 1/2cp, 15p, 25p, 50p, 75p, £1 and £2 sterling. (In decimal currency, which has applied in the United Kingdom from 15 February 1971, 5 pence equals the previous 1 shilling.) Commission is payable. For all remittances in excess of £2 per day a permit is required.
As these orders are payable in several British Commonwealth countries they are a popular medium for making small postal remittances to overseas countries, particularly the United Kingdom.
During the year ended 31 March 1974 the Post Office sold 1,264,855 British postal orders valued at $3,293,644, and paid 145,985 orders valued at $607,085.
Gift Tokens—Post Office gift tokens were introduced on 15 December 1969 to enable people to buy savings gifts from the Post Office. They are issued free of commission in denominations of $1, $2, and $5. They may be credited to any type of Savings Bank account, or used to purchase bonus bonds or national development bonds. Gift tokens issued in the year ended 31 March 1974 amounted to $145,681.
POST OFFICE SAVINGS BANK—Details on the Post Office Savings Bank are given in Section 29, Banking and Currency.
TELEPHONE SERVICES—The following table indicates the growth of telephone installations (the figures are as at 31 March).
| Item | 1971 | 1972 | 1973 | 1974 |
|---|---|---|---|---|
| Main telephones— | ||||
| Automatic | 716,862 | 746,487 | 794,655 | 846,923 |
| Manual | 118,466 | 109,882 | 90,749 | 86,960 |
| Extension telephones | 420,613 | 441,800 | 466,217 | 503,511 |
| Public telephones | 4,751 | 4,918 | 4,990 | 5,132 |
| Private line telephones | 449 | 293 | 266 | 272 |
| Toll offices | 1,286 | 1,289 | 1,257 | 1,234 |
| Total telephones | 1,262,427 | 1,304,669 | 1,358,134 | 1,444,032 |
| Telephones (all types per 1,000 population) | 411 | 448 | 457 | 475 |
| Applicants awaiting installations | 15,426 | 13,382 | 15,319 | 22,568 |
| Number of toll calls | 67,856,888 | 64,803,473 | 67,072,087 | 73,905,370 |
About one-sixth of the main telephones are business telephones (in 1974 there were 153,986 business telephones). At 31 March 1974 there were 933,883 subscribers and 22,568 waiting applicants of whom about 47 percent were in the Auckland City and environs.
Thirty-three new automatic exchanges were brought into service during the year ended 31 March 1974; also substantial progress was made in the extension of free calling areas, thereby eliminating toll fees between outlying exchanges and their town or city centre; 7 more exchanges were provided with this service.
According to the latest comparative data available (January 1973), compiled by the American Telephone and Telegraph Co., New Zealand ranks fifth in the number of telephones per 100 of population, the leading countries being the United States of America (62.75), Sweden (59.29), Switzerland (53.95), Canada (49.98), and New Zealand (44.61).
A broadband toll link, comprising microwave, radio and co-axial cable systems, connects main centres from Whangarei to Dunedin.
A 5-year supply agreement has been entered into with Nippon Electric Co. Ltd. of Japan for the supply of crossbar automatic telephone switching equipment.
Subscriber Toll Dialling (STD) which will enable subscribers to dial direct to other automatic subscribers without the need to go through a toll operator is to be introduced into New Zealand telephone system progressively from 1975.
Free local telephone calling is provided in New Zealand, as distinct from charging for each local call as followed by many overseas administrations.
The following table shows the classifications of telephone exchanges and the annual rental rates for different classes of connection as from 1 October 1971.
| Class of Exchange | Class of Connection | Annual Rate Within Base-rate Area | |
|---|---|---|---|
| Business | Residential | ||
| Class I Automatic exchanges with more than 10,000 paying subscribers. | Individual | 134.75 | 61.10 |
| 2-party | 98.00 | 52.88 | |
| (Typical exchanges are Auckland, Christchurch, Dunedin, Hamilton, Invercargill, Palmerston North, and Wellington.) | 3-party | 93.10 | 51.70 |
| 4-party | 88.20 | 50.53 | |
| 5-party | 80.85 | 47.00 | |
| 6-10 party | 73.50 | 42.30 | |
| Class II Automatic exchanges with 3,001-10,000 paying subscribers | Individual | 128.63 | 61.10 |
| 2-party | 95.55 | 52.88 | |
| (Typical exchanges are Blenheim, Masterton, Levin, 3-party and Oamaru.) | 90.65 | 51.70 | |
| 4-party | 85.75 | 50.53 | |
| 5-party | 78.40 | 47.00 | |
| 6-10 party | 71.05 | 42.30 | |
| Class III Automatic exchanges with 2,001-3,000 paying subscribers. | Individual | 116.38 | 58.75 |
| 2-party | 91.88 | 50.53 | |
| (Typical exchanges are Alexandra, Marton, and Westport.) | 3-party | 86.98 | 49.35 |
| 4-party | 82.08 | 48.18 | |
| Manual exchanges with over 3,000 paying subscribers. | 5-party | 75.95 | 44.65 |
| (A typical exchange is Taupo.) | 6-10 party | 68.60 | 39.95 |
| Class IV Other exchanges affording continuous service. | Individual | 110.25 | 54.05 |
| (Typical exchanges are Hokitika, Picton, and Queenstown.) | 2-party | 85.75 | 47.00 |
| 3-party | 80.85 | 45.83 | |
| 4-party | 75.95 | 44.65 | |
| 5-party | 68.60 | 42.30 | |
| 6-10 party | 61.25 | 37.60 | |
| Class V Exchanges observing restricted hours of service. | Individual | 85.75 | 45.83 |
| (Typical exchanges are Kawhia and Waitotara.) | 2-party | 71.05 | 39.95 |
| 3-party | 66.15 | 38.78 | |
| 4-party | 63.70 | 36.43 | |
| 5-party | 58.80 | 34.08 | |
| 6-10 party | 56.35 | 32.90 | |
For stations located outside the boundary of the base rate or special rate area of an exchange a mileage is added to the rental, depending on the distance by line measurement from the base-rate or special rate boundary to the respective subscriber's station.
TELEGRAPH SERVICES:Telegrams—The downtrend in inland telegrams has continued. In the year to 31 March 1974 4.9 million telegrams were lodged compared with 5.0 million in the preceding year. Of these, 64 percent were lodged by telephone, 14 percent by telex, and only 22 percent handed in over Post Office counters. On the other hand, 48 percent were delivered by messenger, 41 percent telephoned to the addressee, and 11 percent telexed.
The public telegraph network comprises 120 teleprinter offices. These offices interwork through gentex (automatic circuit switching) augmented by point-to-point circuits between the major cities. Ninety-two percent of all telegrams incur only one transmission.
Telex Service:Telex—the international abbreviation for Teleprinter Exchange Service—-is a customer-to-customer service using page teleprinters. An international manual telex service for communicating with overseas subscribers commenced in New Zealand on 1 September 1960 with 16 subscribers. Service was then available with 23 overseas countries.
Automatic telex service was introduced in New Zealand on 13 May 1964 with 150 subscribers. This service absorbed the previous international connections and enabled all New Zealand telex subscribers to communicate with each other as well as with overseas telex subscribers. International service is now available with 155 countries. An important development in New Zealand's international telex service was the introduction in July 1968 of automatic subscriber-to-subscriber calling. Telex subscribers in New Zealand can now dial direct to subscribers in many countries including Australia. Britain, Canada, Fiji, Japan, and the United States, without the aid of the international operator. At 31 March 1974 there were 1,824 subscribers, an increase of 237 over the previous year.
The annual rental is $650 for a standard machine and $900 for a teleprinter equipped with a tape reperforator and transmitter. In the year to 31 March 1974 rentals totalled $1,434,034 and call revenue was $2,366,122.
Ancillary telex services include: Public telex booths at Auckland, Palmerston North, Wellington, Christchurch, and Dunedin, and a restricted public telex service (outward inland telex calls not available) at 10 other large centres—approximately 425 calls are handled each month, mostly international; teltex, which provides for the delivery, by telephone or messenger, of telex messages sent to any public telegraph delivery office, current volume over 15,000 per month; telexograms, the delivery of telegrams by telex from any teleprinter office in the public network to any telex subscriber.
Data Service—The use of computers in the commercial sector has created a need for facilities for transferring data from one point to another. The Post Office leases circuits for data transmission, leases data modems (200 and 600/1200 bauds) for use on leased lines, and provides a datel service for the exchange of data using the switched telephone networks, both local and toll. The datel service is restricted to speeds of 200, 600, or 1200 bauds.
Leased data circuits (speech grade) capable of speeds up to 4800 bauds are charged at $34.30 a mile per year and higher speed circuits range from $51.45 a mile for 7 kHz to $147 a mile for 48 kHz.
Data modems are charged between $100 and $175 depending on speed and type.
For datel service, a telephone must be leased especially for the purpose, and the use of a post office modem is mandatory. The rental for these is as for a business telephone connection, varying between $85.75 to $134.75 per year according to the class of the telephone exchange plus the rental for the modem. Where the toll service is used for data calls the ruling toll rates apply.
INTERNATIONAL TELECOMMUNICATIONS:Cable Links—Telegraphic communication overseas was first established between New Zealand and Australia by means of the Eastern Extension Telegraph Company's cable from Wakapuaka (Nelson) to Sydney in 1876, and between Auckland and Canada via Norfolk Island, Suva, and Fanning Island in 1902. In 1945, the Commonwealth's external telecommunications systems were brought under Government control and, in accordance with the Commonwealth Telegraphs Agreement 1948, the New Zealand Post Office purchased the assets in New Zealand of Cable and Wireless Ltd., the private company previously controlling these services, and took over the operation of the overseas cable services.
In July 1962 a new submarine cable with a capacity of 80 telephone channels was brought into operation between New Zealand and Australia as part of a Commonwealth round-the-world cable project. The cable was extended from New Zealand to Fiji in December 1962, and in December 1963 was further extended, via Hawaii, to Vancouver and across Canada by microwave to Montreal. At Montreal it links up with the trans-Atlantic telephone cables, to connect with Britain, and provide high-quality circuits for telephone, telegraph, and telex communication between New Zealand, Australia, Fiji, Canada, the United States of America, and Britain. This cable system links New Zealand with most of the world's major countries, and it was supplemented by the bringing into service in March 1967 of the South-East Asia Commonwealth Telephone Cable which extended the system from Australia to New Guinea, and (via Guam) to Malaysia, Hong Kong, and Singapore.
An additional high capacity trans-Tasman submarine cable, a joint New Zealand - Australia multi-million dollar project, is planned to be in use in 1976. To be known as “Tasman” the new cable will have a total capacity of 640 telephone circuits.
International Telephone Service—Telephone communication by cable, satellite and radio is now available to almost all countries of the world, as well as to Ross Dependency (Scott Base), Raoul Island, Chatham Islands, Campbell Island, passenger ships, and H.M. New Zealand and Australian warships.
An international Gateway telephone exchange in Auckland handles all New Zealand's outgoing and incoming international telephone calls. The international operators dial direct to subscribers in other countries, and overseas operators dial direct to subscribers on automatic telephone exchanges in New Zealand. Data transmission service is also available to some other countries through the telephone network.
International Telex Service—Telex service is available to many countries including, in most cases, the facility for subscribers to establish calls automatically.
International Telegraph Service—Telegrams are an important part of international communications and a world-wide service is available. Phototelegraph service is also available to a number of countries.
Satellite Communications—Because of the rapid increase in international telecommunication traffic, an earth station was opened in 1971 at Warkworth, near Auckland, for communicating with other countries via satellites in space.
In addition to providing additional international telecommunications facilities, the earth station makes live television relays practicable. The earth station works through a satellite over the Pacific Ocean.
International Radio Services—The first wireless-telegraph station in New Zealand for communicating with ships at sea was opened at Wellington on 26 July 1911.
In November 1953 a high-power radio transmitting station was opened at Himatangi providing at that time for direct New Zealand - United Kingdom radiotelephone and telegraph circuits. These circuits are now provided via cable, and satellite and the Himatangi radio station is used generally for services with places in the Pacific area to which there are no cable facilities. The receiving station complementary to Himatangi is Makara Radio.
Direct radio circuits are operated from New Zealand to Apia, Rarotonga, Niue, and Noumea. Communication is effected with outer islands in the Cook group by Rarotonga Radio through small feeder stations. Small stations in the Tokelau Islands communicate with Apia Radio.
Other principal stations under the control of the New Zealand Government are located at Auckland, Wellington, and Awarua on the New Zealand mainland, at Niue, and at Chatham Islands. Facilities are provided for the transmission of radiotelegrams to ships at sea, and special rates operate for vessels registered in New Zealand and Australia.
INLAND RADIO SERVICES—The use of mobile radiotelephone services continues to grow. Post Office very-high-frequency service available from 67 base stations meets the mobile communication requirements of 3,949 subscribers operating 29,985 mobile units. A miscellany of private and Government owner-operated stations provide mobile radiotelephone services through 2,524 base stations for a further 9,017 mobile units. Radiotelephone services continue to provide essential service for isolated communities which cannot reasonably be reached by landline—e.g., isolated settlers, alpine huts, etc. There is also a free radio-medical service for ships at sea and for lighthouses on the New Zealand coast for use in emergency. New licences were issued for radiotelephone stations in 1,195 small commercial and pleasure craft operating round the New Zealand coast bringing the total number of ships licensed to 8,156. There are 4,642 licensed amateur stations in New Zealand. These are intended to provide facilities for experimental communication between persons interested in radio science as a hobby, and are issued only to holders of amateur operators' certificates. In the Citizen radio service 1,352 new walkie-talkie sets were licensed making a total of 8,509 sets in use throughout the country. There are now 69,223 radio transmitting stations of all types licensed compared with 60,823 in 1973.
Direct radio circuits are operated between the New Zealand mainland and the Chatham Islands.
Smaller stations are established at certain lighthouses on the New Zealand coast and also on a number of adjacent islands. Marine radio beacons are operated at the lighthouses at Cape Reinga, Cuvier Island, Moko Hinau Island, East Cape, Portland Island, Stephens Island, Baring Head, Cape Campbell, The Brothers, Godley Head, Taiaroa Head, Dog Island, and Puysegur Point.
REVENUE—The revenue of the Post Office for the latest financial years is now shown.
| Item | 1970-71 | 1971-72 | 1972-73 | 1973-74 |
|---|---|---|---|---|
| $(000) | $(000) | $(000) | $(000) | |
| Postal revenue— | ||||
| Postages | 26,475 | 31,671 | 32,110 | 34,457 |
| Private box and bag rentals and rural mail delivery fees | 253 | 623 | 660 | 705 |
| Miscellaneous | 93 | 105 | 98 | 130 |
| 27,091 | 32,399 | 32,868 | 35,292 | |
| Telecommunications revenue— | ||||
| Telex | 1,628 | 2,386 | 3,161 | 3,787 |
| Telegraph | 4,082 | 4,659 | 5,229 | 5,292 |
| Tolls | 32,941 | 45,219 | 48,504 | 56,547 |
| Telephones | 52,454 | 71,569 | 82,292 | 87,629 |
| Overseas telecommunications | 6,018 | 7,434 | 8,582 | 11,356 |
| Radio | 299 | 352 | 364 | 446 |
| 97,422 | 131,619 | 148,132 | 165,057 | |
| Miscellaneous revenue— | ||||
| Fees from Government departments, etc. | 3,907 | 4,306 | 4,508 | 4,532 |
| Money order and postal note commission | 454 | 519 | 532 | 557 |
| Rents received | 291 | 286 | 325 | 325 |
| Other revenue | 693 | 714 | 509 | 493 |
| 5,345 | 5,825 | 5,874 | 5,907 | |
| Total revenue | 129,858 | 169,843 | 186,874 | 206,256 |
Revenue and expenditure for the latest 11 years are shown in the following table.
| Year Ended 31 March | Revenue | Expenditure |
|---|---|---|
| $(000) | $(000) | |
| 1964 | 70,183 | 70,068 |
| 1965 | 77,841 | 76,586 |
| 1956 | 86,962 | 84,890 |
| 1967 | 91,526 | 93,582 |
| 1968 | 106,607 | 100,781 |
| 1969 | 112,793 | 106,575 |
| 1970 | 119,499 | 117,087 |
| 1971 | 129,858 | 143,548 |
| 1972 | 169,843 | 169,495 |
| 1973 | 186,874 | 188,885 |
| 1974 | 206,256 | 212,495 |
CAPITAL—Capital expansion necessary to meet demand requires substantial provisions for new telecommunications systems and the replacement of those which have become obsolete. Accommodation to house this equipment, to provide post offices in newly developed areas, and to replace old and inadequate offices is an important part of Post Office capital development.
Capital expenditure on telecommunications development and buildings is financed partly by the Post Office, and partly from National Development Loans Account on which interest is paid at the rate of 5 percent. The interest payment amounted to $16.7 million in 1973-74.
In 1973-74, $33.0 million was spent on the development of telecommunications systems and $7.6 million on buildings. In addition, $2.5 million was invested in other assets such as motor vehicles, tools and plant, and office equipment. This expenditure was financed from Post Office resources, National Development Loans Account and capital equipment credit arrangements. The capital liability of the Post Office is now $357.9 million and liability under capital equipment credit arrangement is $1.0 million.
WORK PERFORMED FOR OTHER DEPARTMENTS—Because it has numerous small offices readily accessible to the public, the Post Office also undertakes agency work for other Government departments. Among the principal activities in this connection are the receipt and payment of moneys on behalf of the various departments, the more important of which are enumerated below.
Receipts—For the following departments: Education (examination fees, etc.), Health, Inland Revenue (land tax and income tax, under PAYE system), Lands and Survey, National Roads Board (special mileage tax on motor vehicles), Public Trust Office, State Advances Corporation (State rents, loan and interest repayments), Electricity (some electric-power receipts), Ministry of Transport, Tourist and Publicity, Valuation, Customs (collection of Customs duty and sales tax), Treasury (Government Superannuation, National Provident fund receipts, and motor vehicle registration and licence fees).
Payments—Departments of Social Welfare (social security benefits and war pensions, etc.), Health (refunds of medical expenses), Defence, Labour (subsidised wage payments), Public Trust Office, Police (witness warrants), Treasury (Government superannuation payments and miscellaneous payments for other departments), Ministry of Works and Development, and for Reserve Bank (interest warrants and coupons).
Other services performed by the Post Office are the issue of licences in respect of motor vehicles and radio apparatus, and assistance to the Marine and Civil Aviation Divisions of Ministry of Transport on radio matters. In some of the smaller centres postmasters act as registrars of births, deaths, and marriages, also as registrars of electors.
Other activities include the receipt of levies under the Motor Vehicle Accident Scheme as provided for under the Accident Compensation Act 1972, the issue of fishing and game licences on behalf of acclimatisation societies, organising and selling health stamps, and collecting television licence fees.
STAFF—Staff numbers at 31 March are shown in the following table.
| Classification | 1970 | 1971 | 1972 | 1973 | 1974 |
|---|---|---|---|---|---|
| Permanent staff | 26,912 | 27,665 | 27,888 | 28,518 | 29,169 |
| Temporary and non-classified staff | 4,244 | 4,694 | 4,585 | 4,647 | 5,483 |
| Total staff | 31,156 | 32,359 | 32,473 | 33,165 | 34,652 |
VEHICLES—The Post Office fleet as at 31 March 1974 consisted of 4,532 vehicles; 1,194 trucks, 2,063 vans, 1,269 cars, and 6 motor scooters. Of this fleet, 477 vehicles are used for hire to other departments, 3,036 for engineering construction work, and 1,019 on postal, telegram delivery, and other general work. The fleet travelled 40.6 million miles in the year ended 31 March 1974.
GENERAL—A restructuring of the radio and television broadcasting services began in 1973.
The plan provided for the establishment of two television channels and radio as three independent public corporations and the creation of a new central body to provide common services for all three. The guiding principles in the proposed restructuring were those of decentralisation, independence, and the introduction of competitive enterprise within publicly-owned broadcasting services. To advise the Government on the implementation of this plan the Minister, on 30 March 1973, appointed a committee, instructing it to draft by 31 July a report with associated legislation to establish both the principles and the formal means for introducing the new system. The report of the committee became the basis for new legislation.
The Broadcasting Act 1973 established the Broadcasting Council of New Zealand and abolished the New Zealand Broadcasting Authority. To replace the New Zealand Broadcasting Corporation from 1 April 1975, it also established three publicly-owned corporations—Radio New Zealand (to operate the radio broadcasting services), Television Service One (to operate a television service from Wellington and Dunedin for the whole of New Zealand), and Television Service Two (to establish and operate from Auckland and Christchurch a second television service for the whole of New Zealand). From their independent bases in policy, studios, staff, and revenues TV-1 and TV-2 produce competing services to the public.
All the corporations and the council are responsible to the public through Parliament and, to effect this, all will annually make a report and present their accounts to the Postmaster-General for presentation to Parliament, whereupon an opportunity will occur to debate both policy and performance. Not only are the corporations and the council creations of Parliament and servants of the public, they are also employing public resources which Parliament makes available. It is easy to recognise this character in licence fees which Parliament sets. But the same is just as true ultimately of advertising revenues which are earned by selling broadcasting time over scarce frequencies obtained by licence from the Postmaster-General. Indeed, the frequencies are themselves the subject of international negotiation. The corporations and the council have a plain duty to exercise responsibility in making the optimum use of these public revenues in serving the public interest.
BROADCASTING COUNCIL OF NEW ZEALAND—The creation of the Broadcasting Council makes explicit two general principles which have guided the thinking on reorganisation, responsibility and economy. New Zealand is too small a country, broadcasting revenues are too slim for all the needed developments, and the public interest in the efficient use of those revenues for extending the networks is too great, to permit any unnecessary duplication or waste of assets. Therefore all the services which can be rendered efficiently in common, and which do not in themselves affect the independent policy-setting and operations of the programme-producing corporations, are rendered by a joint body, the Broadcasting Council.
Because the common services are vital to all the corporations and connect with their policies and operations at many points, each of the corporations needs to be present at and be a part of the body which decides on the design, costing, and running of the common services. So the chairmen of all the corporations are ex-officio full members of the council. They also have with them their directors-general to put the operating viewpoints. The chairman and deputy chairman come from the three appointed members of the council of six persons.
The main functions of the Broadcasting Council are to encourage and promote the efficient carrying on and development by the operating corporations of broadcasting services; to transmit programmes received from corporation studios; to gather news and make it available to TV-1 and TV-2 and extend news sources in other countries; to ensure that as far as possible there is no simultaneous scheduling of like programmes, New Zealand programmes, news bulletins, and current affairs programmes broadcast by TV-1 and TV-2; to publish the New Zealand Listener; to be the owner of all land used by the corporations and make use of it available to them; to advise the Government as to the rates of licence fees, to receive the proceeds of the fees, and to distribute those proceeds among the council and the corporations; and to represent New Zealand's broadcasting interests at international broadcasting conferences.
The symphony orchestra is under the control of the council, which may delegate the management of it to Radio New Zealand as agent of the council.
The general powers of the council include the establishment, operation, and maintenance of transmitters and micro-wave links; the erection of buildings and structures for use in connection with broadcasting; the conduct or commissioning of technical and audience research surveys; the acquisition and disposal of land and buildings and personal property; the holding of shares in companies carrying on or intending to carry on broadcasting or the provision of programmes; the purchase of overseas programmes, and of rights to broadcast sporting events, on behalf of TV-1 and TV-2; and the promotion of policies and standards of training for broadcasting.
The results of surveys are to be made available to the corporations.
The council may also make rules regarding programme and technical matters which are applicable to both public and private stations.
Federation of Independent Commercial Broadcasters—In 1970, holders of warrants for private commercial radio stations formed a federation which was subsequently approved by the Broadcasting Authority in August 1971. The general objects of the federation are to conserve the rights and interests of the members in broadcasting.
RADIO—Radio New Zealand provides programmes for 51 medium-wave broadcasting stations, and 2 short-wave transmitters of the External Services Division, the latter having 19 assigned frequencies. Of these, 31 stations broadcast advertising material. No advertising is broadcast on Sundays, Christmas Day, or Good Friday. Stations 2YA, 1YA, 3YA, 4YA, and 4YW maintain a daily 24-hour service apart from shutdowns once a fortnight between the hours of 11.20 p.m. Sunday and 6 a.m. Monday (5a.m. in the case of 2YA). The shutdowns are staggered so that at least two of these stations are always on the air.
Coverage of Short-wave Service—Radio New Zealand broadcasts to the Pacific islands a daily home-service programme from 5 a.m. to 5.45 p.m. on one frequency and a special evening programme from 6 p.m. to 8.45 p.m. on two frequencies. Its transmission to Australia comprises a daily home-service programme from 8 a.m. to 5.45 p.m. on one frequency and a special evening programme from 9 p.m. to 11.45 p.m. on two frequencies. In addition to its large radio audience throughout the Pacific, Radio New Zealand has listeners as far distant as the United Kingdom, Sweden, France, the United States, and Japan. Radio New Zealand programmes illustrate many different aspects of life in this country.
Local Broadcasting—Whereas in many Commonwealth countries local broadcasting has only recently begun, in New Zealand it is in many ways the most important part of the national system. Local stations not only provide a wide range of entertainment programmes, but also play a valuable social role through new community services and participation in cultural activities. Decentralisation of administration enables local radio stations to be highly responsive to the communities they serve.
Broadcasts to Schools—Programmes are designed to aid teachers in meeting syllabus requirements particularly in the fields of science, social studies, music, and language. Twenty-three programmes a week are broadcast to children ranging from 4 to 13 years. The most popular programmes, dramatised stories for infants, are heard by more than 170,000 children. New developments to assist teachers in secondary schools include liberal studies programmes for sixth and seventh forms. Programmes are also broadcast by the Correspondence Schools.
Private Broadcasting Stations (Non-commercial)—One private non-commercial station operated by the Otago Radio Association Incorporated has been issued with a warrant and has been broadcasting since 1922. This station, located in Dunedin, operates from 1800 to 2230 hours on Wednesdays, Thursdays, and Saturdays and, on Sundays, from 0900 to 1200 and from 1800 to 2230 hours.
Private Broadcasting Stations (Commercial)—The first warrants for private commercial broadcasting stations were issued on 30 June 1970 to Radio Hauraki and Radio, both located in Auckland, and transmissions commenced on 26 September 1970 and 31 October 1970 respectively. Radio Waikato was issued with a warrant on 31 July 1970 and commenced transmission on 2 November 1970, followed by Radio Whakatane with a warrant dated 24 November 1970, commencing transmission on 30 June 1971 and Radio Otago with a warrant dated 8 June 1971, coming into operation on 20 November 1971. Later warrants enabled Radio Avon in Christchurch and Radio Windy in Wellington to commence operations late in 1973. Advertisements are not permitted to be broadcast on Sundays, Christmas Day, or Good Friday. If Anzac Day falls on other than a Sunday, advertisements are not permitted before 1300 hours.
TELEVISION—In August 1958 the Government decided that the 625-line system would be the standard for any television service in New Zealand.
In October 1958 approval was given to the then New Zealand Broadcasting Service to purchase equipment to enable technical investigations to be made. The Service began regular transmissions in Auckland in 1960, in Christchurch and Wellington in 1961, and in Dunedin in 1962.
In October 1969 the Minister of Broadcasting directed the Broadcasting Authority to carry out an inquiry into the extension of television services. Following extensive hearings in 1970, the authority recommended that the existing TV services be converted to colour transmission (using the PAL system). Colour telecasts began in a limited way in October 1973 but they are now available to over 90 percent of the population. Only some 10 percent of households are equipped to receive transmissions on colour TV sets.
Extension to Coverage—Coverage has been steadily extended to all areas of New Zealand. At March 1974, there were operating six 100 kW transmitters, one 50 kW, 12 of from 1 to 10 kW, and 120 installations of less than 1 kW. These transmitters provide coverage for 95 percent of the population.
Some 220 small units are operated by private individuals or societies, the latter receiving financial assistance. These small transmitters cover approximately 4 percent of the population.
Because of the nature of the terrain and the dispersal of population, the establishment of television has posed engineering problems not often met by other countries. The major areas which still require upgrading are Central Otago, North Taranaki, the King Country, Taupo, and Bay of Plenty.
Over 85 percent of homes in New Zealand are equipped with television sets.
Television Programmes—Film purchased overseas makes up about 70 percent of TV programmes. All stations are active in the presentation of New Zealand news. An analysis of TV programmes for the month of September 1971 showed that of the total hours telecast 26 percent were devoted to news, talks, and information programmes (including religion), 9 percent to variety, 22 percent to drama, 10 percent to comedy, 8 percent to adventure, mystery and westerns, 12 percent to children's programmes, 6 percent to cinema films, and 7 percent to sports. Four mobile outside telecast units have been in use since the beginning of 1963.
It is the policy of both TV-1 and TV-2 to increase the proportion of locally produced programmes.
ORCHESTRAS: Symphony Orchestra—Formed in 1946 as the National Orchestra, this is a full symphony orchestra widely known for the high standard of its public concerts as well as its performances over the air. Distinguished guest conductors and celebrity artists from other countries along with resident soloists and New Zealand choirs appear regularly with the orchestra. Free concerts for school children are an established part of its tour programme. The playing strength of the orchestra is approximately 85 players. This enables the Symphony Orchestra to undertake the complete symphonic repertoire.
During 1973-74, the orchestra presented a total of 75 concerts, and in 1974 undertook a tour of three Australian cities. It has been presented regularly on television besides maintaining its contributions to radio in the form of direct broadcasts and special studio productions, including significant and increasing attention to the work of New Zealand composers.
NEW ZEALAND LISTENER—Programmes and advance information for national television channels and radio stations are published in the weekly journal, the New Zealand Listener, first issued on 30 June 1939. The circulation of the Listener is now about 140,000. As well as containing programme information the Listener occupies a special place in New Zealand journalism as a leading periodical dealing with the current scene. It publishes interviews, talks, and discussions as well as fiction, poetry, and criticisms. Through its editorial and correspondence columns, the Listener provides a forum for serious public discussion on important New Zealand and overseas questions.
FINANCIAL STATISTICS—The following tables show the financial results of the principal activities of the New Zealand Broadcasting Corporation.
| Item | 1969-70 | 1970-71 | 1971-72 | 1972-73 | 1973-74 |
|---|---|---|---|---|---|
*Deficit. † Depreciation. | |||||
| $(thousand) | |||||
| Commercial Activities | |||||
| Income— | |||||
| Net revenue from advertising services and New Zealand Listener after deducting commission | 13,327 | 14,119 | 15,240 | 16,250 | 18,559 |
| Expenditure— | |||||
| Purchase of programmes | 2,192 | 2,799 | 3,305 | 3,419 | 4,179 |
| Operating costs, including programming, engineering, administrative, publishing, general running, and selling expenses | 8,391 | 10,111 | 11,165 | 11,666 | 13,361 |
| Provision of technical facilities and service | 1,092 | 1,103 | 996 | 934† | 866† |
| 11,676 | 14,013 | 15,466 | 16,019 | 18,406 | |
| Surplus before taxation | 1,651 | 106 | -226* | 231 | 153 |
| Provision for taxation | 711 | - | - | - | - |
| Surplus, commercial activities | 940 | 106 | -226* | 231 | 153 |
| Concert Activities— | |||||
| Net expenditure on orchestras and concert presentation | 692 | 771 | 920 | 822 | 1,047 |
| Non-Commercial Activities | |||||
| Income— | |||||
| Gross licence fees | 10,063 | 10,766 | 11,974 | 14,198 | 14,902 |
| Less Post Office collection charges | 720 | 836 | 916 | 970 | 1,028 |
| 9,343 | 9,930 | 11,058 | 13,228 | 13,874 | |
| Interest on investments | 290 | 315 | 200 | 216 | 220 |
| Miscellaneous receipts | 59 | 9 | 15 | 17 | 15 |
| 9,693 | 10,254 | 11,273 | 13,458 | 14,109 | |
| Expenditure— | |||||
| Purchase of programmes | 1,789 | 2,411 | 3,467 | 3,530 | 4,245 |
| Operating costs, including programming, engineering, administrative, and general running expenses | 4,278 | 5,043 | 5,365 | 5,880 | 7,089 |
| Depreciation provision | 1,942 | 1,945 | 1,681 | 643 | 606 |
| 8,010 | 9,399 | 10,513 | 10,053 | 11,940 | |
| Credit for provision of commercial, technical, and other facilities | 1,092 | 1,103 | 996 | - | - |
| 6,918 | 8,296 | 9,517 | 10,053 | 11,940 | |
| Net expenditure—Radio New Zealand | 134 | 199 | 179 | 175 | 194 |
| Surplus, non-commercial activities | 2,493 | 1,504 | 1,577 | 3,230 | 1,975 |
| Net surplus | 2,741 | 839 | 431 | 2,639 | 1,081 |
There have been two principal sources of revenue: licence fees and radio and television advertising. While licence fee revenue was credited to the accounts of the non-commercial stations and sales revenue to those of the commercial stations, a common fund was in fact operated, all revenue being available for the general purpose of broadcasting.
The costs of Broadcasts to Schools and Overseas Programme Exchange were included under “Purchase of Programmes” and “Operating Costs” of non-commercial activities.
Gross revenue from licence fees and from advertising for the latest 5 financial years is shown in the following table.
| Item | 1969-70 | 1970-71 | 1971-72 | 1972-73 | 1973-74 |
|---|---|---|---|---|---|
| $(thousand) | |||||
| Radio-licence fees | 2,063 | 2,140 | 1,161 | - | - |
| TV-licence fees | 8,000 | 8,625 | 10,812 | 14,196 | 14,902 |
| Radio advertising | 5,862 | 6,478 | 7,107 | 7,716 | 9,287 |
| TV advertising | 9,213 | 9,298 | 9,904 | 10,228 | 11,241 |
| Totals | 25,138 | 26,541 | 28,984 | 32,142 | 35,430 |
LICENCES—As from 1 October 1971 the radio licence, which stood at $3 a year, was abolished and the monochrome television licence raised from $13 a year to $20. A colour television licence fee of $35 was introduced on 1 November 1973. On 1 January 1975 licence fees were increased to $27 (monochrome) and $45 (colour).
The following table summarises licences for television receivers issued for districts. These districts correspond approximately to reception areas: Auckland includes Taupo; Wellington includes Taranaki, East Coast, Hawke's Bay, Nelson, and Marlborough; Christchurch includes West Coast and its southern boundary is the Waitaki River.
| At 31 March | Auckland | Wellington | Christchurch | Dunedin | Total* | Number of Sets Covered by Hirers' Licences† |
|---|---|---|---|---|---|---|
*Includes sets hired on ships, 40 in 1972. †Included in preceding figures. ‡Excludes hired sets. Includes 9,513 colour sets. §Includes 2,726 colour sets. | ||||||
| 1969 | 252,841 | 197,954 | 94,104 | 62,821 | 607,815 | 81,089 |
| 1970 | 256,962 | 209,001 | 97,402 | 64,160 | 627,617 | 91,697 |
| 1971 | 272,474 | 217,879 | 105,620 | 68,445 | 664,440 | 91,679 |
| 1972 | 294,361 | 224,785 | 107,010 | 69,996 | 696,192 | 100,442 |
| 1973 | 311,747 | 234,325 | 113,259 | 72,878 | 732,250 | 118,235 |
| 1974 | 263,271 | 203,267 | 101,876 | 62,757 | 631,171‡ | 123,452§ |
NEWSPAPERS—There are eight daily newspapers in the four main metropolitan areas with a total circulation of 746,000. In the smaller cities and provincial towns there are 33 daily newspapers with a total circulation of 317,000.
When circulation figures for daily newspapers are related to population figures, it is found that New Zealand has 376 copies per 1,000 inhabitants. The latest comparative figures for other countries include United Kingdom, 528; Australia, 321; Canada, 230; United States, 297; U.S.S.R., 347; Sweden, 534; Norway, 390; Denmark, 361; and France, 237. (Source: UN Statistical Yearbook.)
Statistics compiled from various sources disclose that from 1840 to 1940, altogether 468 newspapers (of all categories) were established in New Zealand. The acceleration of motor transport had a speedy and decisive effect on the small-town press. Many local papers which, by publishing once, twice, or three times a week, had been serving adequately the needs of a district and backblocks were unable to survive when city papers were able to reach remote settlements within a few hours of publication,offering to country dwellers such superior attractions as daily publication, full services of New Zealand and world news, sporting news, and attractive magazine features. Under the steady pressure of competition, mergers were effected in a number of provincial towns to reduce the quota of papers, generally to a single daily.
The circulation of all periodicals is not known, but for 147 periodicals (not including two national weeklies classified as newspapers) the circulation is 2,026,000. (These statistics are compiled from information gathered by the Association of New Zealand Advertisers.)
The total number of magazines, reviews, journals, and periodicals printed (but not necessarily all sold) in 1972-73 was 97,317,000 compared with 103,497,000 in 1971-72.
Advertising—The advertising revenue of newspapers and periodicals is shown in the following table, along with the selling value of the newspapers and periodicals at the factory door.
| Type of Publication | Advertising Revenue | Selling Value | ||||
|---|---|---|---|---|---|---|
| 1970-71 | 1971-72 | 1972-73 | 1970-71 | 1971-72 | 1972-73 | |
| $(000) | ||||||
| Newspapers, daily | 33,740 | 35,327 | 39,150 | 9,747 | 11,692 | 12,925 |
| Newspapers, other than daily | 3,657 | 4,459 | 4,868 | 4,212 | 4,306 | 5,015 |
| Magazines, journals, and periodicals | 2,088 | 2,388 | 2,593 | 2,618 | 2,675 | 3,507 |
LIBRARIES—New Zealand is fairly well served with libraries and the book stocks and circulation figures compare favourably with those of other English-speaking nations. In most centres the local authority maintains a public library.
Under the auspices of the New Zealand Library Association, a comprehensive system of inter-library co-operation has been developed, particularly in the use of resources by means of inter-library loans.
National Library of New Zealand—By the National Library Act 1965, the Alexander Turnbull Library, the General Assembly Library, and the National Library Service were combined to form the National Library of New Zealand.
A comprehensive collection of New Zealand material within the requirements of the Act is maintained by the Alexander Turnbull Library.
The National Library is responsible for maintaining and developing a central reference and lending collection, and for making its resources available to others libraries. On 31 March 1974 this collection comprised approximately 350,000 titles together with 50,000 volumes of periodicals.
Other functions are concerned with the national system of inter-library lending and national bibliographical projects. The National Union Catalogue records the non-fiction holdings of the major New Zealand libraries and now contains over 1,000,000 entries. The Union List of Serials in New Zealand Libraries, available in published form, is a similar record covering periodicals and other serial publications. The Index to New Zealand Periodicals, published annually, indexes significant articles from a wide range of New Zealand periodicals.
The library also acts as purchasing agent for most Government department libraries operating within the Public Account and provides a cataloguing, reference, and library advisory service for departments.
General Assembly Library—The General Assembly Library was established in 1858 and provides library services for Parliament. The chief librarian is guided by a committee of members of Parliament headed by the Speaker.
Since 1903 the library has been the depository for books, periodicals, etc., published in New Zealand. It receives regularly copies of all New Zealand newspapers and about 1,700 New Zealand periodicals. Back files of both are very extensive. It also has one of the largest collections in the country of books or pamphlets relating to New Zealand. Several New Zealand newspapers are indexed daily.
The library has its strongest collections in subjects necessary to provide information for members of Parliament in their legislative duties. These include economics, politics, administration and law. biography and history. It has a good collection of Government documents, mainly from English-speaking countries—particularly parliamentary papers and debates—as well as publications of international organisations such as United Nations, UNESCO, and the International Labour Office.
In all, the library holds about 355,000 volumes.
During the parliamentary recess, the library is open to the public on the recommendation of a member of Parliament.
Alexander Turnbull Library—The Alexander Turnbull Library in Wellington is a State research and reference library, bequeathed to the nation in 1918 by Alexander Horsburgh Turnbull (1868-1918).
The original bequest has now been increased to approximately 157,245 books, together with many thousands of manuscripts, totalling 570 metres; 21,524 paintings, of which 9,324 are originals; 13,370 maps; and an extensive photograph collection and over 7,000 reels of microfilm. Acquisitions increase steadily in number, by purchase and gift. The Turnbull material has been augmented by many important donations and bequests, including some entire collections.
The fields covered by the library fall into two main divisions. The Pacific collections (inclusive of Antarctica) are strongest in material relating to history, early voyaging, ethnology, and literature, with particular emphasis upon New Zealand publications and the work of New Zealand authors; the trustees of the National Library have decided that these holdings should be regarded as the comprehensive national collection of New Zealand material. The general or non-Pacific collections are primarily concerned with English literature, rare books, and the development of the art of printing. The Milton collection, which was of special concern to Turnbull himself, is of particular importance. There are about 10,000 volumes in the rare book collection of first editions of works in English literature, early printed books, examples of fine printing, and important historical and scientific works.
The library's extensive holdings of manuscript material include private archives relating to most aspects of New Zealand history. The library's resources of early paintings of historical and topographical interest are outstanding, as is the collection of photographs and negatives which has been built to about 240,000 pieces during the past 20 years.
The Alexander Turnbull Library is responsible for the compilation of the current and retrospective New Zealand National Bibliography.
Extension Division—This division has two parts:
(a) Country Library Service—The Country Library Service, founded in 1938, has been extended through regional offices in Hamilton, Palmerston North, and Christchurch for closer contact with participating libraries. Bulk loans of books are made free of charge to libraries controlled by local authorities, both borough and county, which operate a free library service locally and maintain it at a reasonable standard of efficiency. To towns where the population is less than 15,000, loans are made from book vans, special subject collections are sent, and thousands of books are supplied in response to requests for information and for individual titles. Libraries in towns with a greater population, excluding the main centres, also receive assistance. Their bulk loans are made direct from regional offices instead of, or in addition to, loans from book vans. Outside the boundaries of boroughs and town districts, groups of people may have books at the rate of $6 for 50 changed at regular intervals. Nine specially equipped vans, each carrying 1,600-2,000 books, travel over the whole territory.
Libraries obtaining books from the Country Library Service on 31 March 1974 included the following: free libraries, 155; county libraries and groups, 1,780; Ministry of Works, Electricity Department, New Zealand Forest Service camps, and lighthouses, 195; psychiatric and general hospitals and prisons and borstal institutions, 68. The number of books lent to these libraries totalled 434,476 and 123,704 books were lent on request and in loan collections during the year. An additional 27,337 books were lent on request from other divisions of the National Library.
(b) School Library Service—The School Library Service, established in 1941, is responsible for providing a wide and varied choice of books of high imaginative quality or technical excellence for children at all levels of ability and stages of development. The bookstock at 31 March 1974 totalled 2,425,467.
General exchanges of books for recreational reading are made by 13 district offices to State and private primary schools from Standard 1 upwards. An information and request service is available to teachers and pupils of primary and secondary schools. Public libraries which give free service to children and young people also receive circulating loans of books. Services to pre-school groups are given through local public libraries or direct from district offices.
For the year ended 31 March 1974, books exchanged totalled 963,003 and 1,170,490 books were provided through the information and request service.
Library School—Since 1946 the New Zealand Library School has offered to university graduates a full-time, 1-year course. It leads to a diploma and to library posts at the professional level. Some 651 students had successfully completed the course by the end of 1973 and in 1974 there were 38 New Zealand students. Students doing this course receive the same allowances as do students at teachers colleges. The school also conducts the block course for library assistants with University Entrance leading to the New Zealand Library Association Certificate and to library posts at the intermediate level. Students attend on a full-time basis, usually on leave with pay from their libraries, for three blocks of tuition spaced at intervals of about 9 months and each taking 4 weeks.
CENSUS OF LIBRARIES 1969—The quinquennial census of libraries for the year ended 31 March 1969 covered a total of 445 libraries, namely, 266 public libraries (including 56 suburban branches), 34 tertiary education libraries, the National Library, and 144 libraries of a technical nature.
Tertiary education libraries comprised the libraries of the 6 universities, with 3 libraries closely associated with them; libraries of 9 teachers training colleges; 1 agricultural college library; 10 libraries of theological colleges and 5 libraries of technical institutes. Libraries of secondary and primary schools were not covered in the census.
In the period 1964 to 1969 public library membership increased by 35 percent but circulation per member dropped at most libraries, both large and small. This could be due to the increased viewing of television. (License 1 television sets in the country increased from 144,000 at 31 December 1963 to 604,000 at 31 December 1968.) There was, on average, 26 issues per adult member and 16 issues per child member for the year 1968-69. There were in the public libraries 4.37 books to every member and on average these books circulated 5.12 times annually; thus members took out an average of 22.40 public library books a year. (This compares with 29.06 books for the year ended March 1964.) These circulation figures for public libraries were relatively high by international standards. Junior readers read four times as much fiction as non-fiction, while adults read three times as much.
The following are summarised tables of the results of the 1969 census. Full details containing the census data have been published in a separate report prepared by the Department of Statistics.
| Class of Library | Number of Libraries | Book Stock at 31 March 1969 | Circulation During Year | |||||
|---|---|---|---|---|---|---|---|---|
| Books* | Serials† | Pamphlets | Total | Items Lent Outside the Library | Items Lent to Other Libraries | Items Borrowed From Other Libraries | ||
*Microforms (films and cards), included in books. †Periodicals included in serials. ‡Excludes armed forces and institutional (penal, etc.) libraries which are included under public libraries. | ||||||||
| (thousand) | ||||||||
| National libraries | 1 | 3,484 | 179 | 11 | 3,673 | 2,539 | 12 | 4 |
| Libraries in universities, etc. | 34 | 1,505 | 314 | 6 | 1,825 | 1,134 | 13 | 21 |
| Special libraries— | ||||||||
| Learned societies and commercial interests | 61 | 167 | 196 | 19 | 382 | 54 | 4 | 4 |
| Government departments and associated organisations | 83‡ | 607 | 424 | 70 | 1,101 | 169 | 14 | 22 |
| Totals, special libraries | 144 | 774 | 620 | 89 | 1,483 | 224 | 18 | 26 |
| Grand totals | 179 | 5,763 | 1,112 | 105 | 6,981 | 3,897 | 43 | 51 |
| PUBLIC LIBRARIES—BOOK STOCK AT 31 MARCH 1969 | |||||||||||||||||
|---|---|---|---|---|---|---|---|---|---|---|---|---|---|---|---|---|---|
| Class of Public Library | Number of Library Systems | Own Stock | Total | For Reference Only (Included in own Stock) | Country Library Service Stock | ||||||||||||
| Adult | Junior | ||||||||||||||||
| Rental | Free Fiction | Free Non-fiction | Fiction | Non-fiction | |||||||||||||
| Adult | Junior | ||||||||||||||||
*191 library systems covering 266 libraries. †Includes Canterbury suburban pool stock, adult 19,722, junior 35,773. | |||||||||||||||||
| (thousand) | |||||||||||||||||
| In centres with an estimated population of— | |||||||||||||||||
| 50,000 and over | 7 | 316 | 238† | 830 | 256† | 98 | 1,737† | 61 | 2 | 1 | |||||||
| 20,000-49,999 | 16 | 99 | 180 | 333 | 153 | 48 | 813 | 31 | 25 | 7 | |||||||
| 10,000-19,999 | 18 | 34 | 73 | 93 | 62 | 16 | 278 | 3 | 21 | 10 | |||||||
| 5,000- 9,999 | 29 | 80 | 71 | 85 | 54 | 14 | 305 | 5 | 31 | 14 | |||||||
| 3,000- 4,999 | 35 | 71 | 65 | 39 | 33 | 6 | 213 | 2 | 22 | i3 | |||||||
| Under 3,000 | 58 | 104 | 54 | 27 | 22 | 5 | 213 | 1 | 26 | 9 | |||||||
| Sub-total | 163 | 703 | 681 | 1,408 | 581 | 186 | 3,559 | 102 | 128 | 53 | |||||||
| Armed forces and institutions | 28 | 28 | 54 | 73 | 3 | 1 | 159 | 2 | 5 | 2 | |||||||
| Grand totals | 191* | 732 | 735 | 1,481 | 584 | 187 | 3,718 | 104 | 132 | 55 | |||||||
| PUBLIC LIBRARIES—BOOKS: CIRCULATION AND USE | |||||||||||
|---|---|---|---|---|---|---|---|---|---|---|---|
| Public Library | Number of Libraries | Issues from Own Stock | Issues from Country Library Service Stock | Inter-library Loans | |||||||
| Adult | Junior | Total | Adult | Junior | Lent to Other Libraries | Borrowed from Other Libraries | |||||
| Rental | Free Fiction | Free Non-fiction | Periodicals | ||||||||
| *191 library systems covering 266 libraries. | |||||||||||
| (thousand) | |||||||||||
| In centres with an estimated population of— | |||||||||||
| 50,000 and over | 7 | 1,755 | 1,778 | 1,448 | 407 | 2,114 | 7,502 | - | - | 2 | 13 |
| 20,000-49,999 | 16 | 1,123 | 1,739 | 756 | 157 | 1,750 | 5,526 | 65 | 35 | 1 | 16 |
| 10,000-19,999 | 18 | 498 | 378 | 426 | 91 | 714 | 2,107 | 101 | 55 | - | 16 |
| 5,000- 9,999 | 29 | 676 | 320 | 356 | 51 | 553 | 1,955 | 137 | 82 | - | 19 |
| 3,000- 4,999 | 35 | 413 | 249 | 150 | 21 | 266 | 1,099 | 102 | 48 | - | 14 |
| Under 3,000 | 58 | 340 | 105 | 78 | 5 | 167 | 696 | 86 | 45 | - | 10 |
| Sub-total | 163 | 4,805 | 4,568 | 3,215 | 732 | 5,563 | 18,884 | 492 | 265 | 3 | 87 |
| Armed forces and institutions | 28 | 64 | 67 | 26 | 2 | 4 | 163 | 7 | 2 | - | 8 |
| Grand totals | 191* | 4,869 | 4,635 | 3,241 | 735 | 5,568 | 19,047 | 498 | 267 | 4 | 95 |
NOTE: Because of rounding, totals in the previous three tables may differ slightly from the sum of the individual items.
International Statistics on Libraries—The following tables compiled from published UNESCO and other statistics show New Zealand's position in relation to other English-speaking countries as regards library resources, borrowers, and book circulation.
| NATIONAL, UNIVERSITY, AND SPECIAL LIBRARIES | ||||||
|---|---|---|---|---|---|---|
| Country | Population (Million) | Year | Type of Data | Library Category | ||
| National | University | Special | ||||
| *Federal Government only. | ||||||
| New Zealand | 2.8 | 1,969 | Libraries | 1 | 34 | 144 |
| Volumes (000) | 3,673 | 1,824 | 1,483 | |||
| Australia | 11.6 | 1,966 | Libraries | 1 | 15 | .. |
| Volumes (000) | 1,000 | 4,241 | .. | |||
| Canada | 20.8 | 1,968 | Libraries | 1 | 79 | 580 |
| Volumes (000) | 400 | 22,106 | 5,613 | |||
| United Kingdom | 53.7 | 1,963 | Libraries | 3 | 478 | 1,177 |
| Volumes (000) | 11,000 | 27,688 | 14,850 | |||
| United States | 194.6 | 1,965 | Libraries | 3 | 2,204 | 354* |
| Volumes (000) | 21,100 | 263,500 | 26,794* | |||
| PUBLIC LIBRARIES | ||||||
|---|---|---|---|---|---|---|
| Country | Population (Million) | Year | Number of Libraries | Book Stock, Number of Volumes | Borrowers | Circulation, Number of Volumes |
| (000) | (000) | (000) | ||||
| New Zealand | 2.8 | 1,969 | 210 | 3,728 | 851 | 19,047 |
| Australia | 11.6 | 1,966 | 552 | 9,547 | 1,888 | .. |
| Canada | 20.8 | 1,968 | 855 | 21,635 | .. | .. |
| United Kingdom | 53.7 | 1,963 | 562 | 77,200 | .. | .. |
| United States | 194.6 | 1,965 | 1,113 | 201,138 | .. | .. |
CINEMAS—Statistics relating to cinemas are normally collected every alternate year. The survey of cinemas for the year ended 31 March 1973 covered 208 theatres, compared with 210 in 1971.
The extensive development of television since 1961 has influenced cinema patronage. Cinema attendances during the year 1972-73 were 1.2 million fewer than when the previous survey was made in 1970-71. The average annual number of admissions per head of mean population fell from 4.6 in 1970-71 to 4.0 in the latest survey.
The following table gives figures of cinema attendances and takings.
| Year | Theatres | Admissions | Gross Admission Takings | Average Admission Price* | Admissions Per Head of Mean Population |
|---|---|---|---|---|---|
| *Including amusement tax up to and including 1964-65. This tax was abolished as from June 1965. | |||||
| (000) | $(000) | c | No. | ||
| 1939-40 | 574 | 31,171 | 4,020 | 12.9 | 19.1 |
| 1944-45 | 551 | 35,420 | 5,476, | 14.6 | 21.3 |
| 1949-50 | 600 | 36,353 | 5,580 | 15.3 | 19.3 |
| 1956-57 | 578 | 37,596 | 8,966 | 23.8 | 17.1 |
| 1958-59 | 547 | 38,208 | 9,700 | 25.4 | 16.6 |
| 1960-61 | 545 | 40,632 | 10,792 | 26.6 | 17.0 |
| 1962-63 | 491 | 37,584 | 10,136 | 27.0 | 15.0 |
| 1964-65 | 397 | 26,026 | 8,180 | 31.4 | 10.0 |
| 1966-67 | 312 | 19,606 | 7,789 | 39.7 | 7.3 |
| 1968-69 | 227 | 14,308 | 6,614 | 46.2 | 5.2 |
| 1970-71 | 210 | 13,087 | 7,828 | 59.8 | 4.6 |
| 1972-73 | 208 | 11,870 | 9,855 | 83.0 | 4.0 |
The following statistics for the last three collections cover the operations of all classes of cinemas—viz, (a) those operating 6 days per week; (b) those operating on odd days per week; (c) circuit, or itinerant operators. The average number of screenings per week in these categories in 1970-71 were 12.3, 2.8, and 2.0 respectively.
| Item | 1968-69 | 1970-71 | 1972-73 |
|---|---|---|---|
| Cinemas— | |||
| Screenings 6 days per week | 130 | 120 | 134 |
| Screening odd days per week | 93 | 89 | 74 |
| Circuit | 4 | 1 | ... |
| Totals | 227 | 210 | 208 |
| Cinemas according to seating accommodation— | |||
| Other than circuits— | |||
| Under 200 | 17 | 10 | 16 |
| 200 and under 500 | 67 | 76 | 68 |
| 500 and under 1,000 | 115 | 103 | 105 |
| 1,000 and over | 24 | 20 | 19 |
| Circuit cinemas | 4 | 1 | ... |
| Totals | 227 | 210 | 208 |
| Seating accommodation (all cinemas) No. | 143,428 | 129,434 | 126,185 |
| Average seating capacity per cinema No. | 632 | 616 | 607 |
| Persons engaged— | |||
| Full time— | |||
| Males No. | 360 | 261 | 227 |
| Females No. | 333 | 190 | 226 |
| Part time— | |||
| Males No. | 422 | 425 | 405 |
| Females No. | 697 | 664 | 784 |
| Performances per year No. | 94,086 | 89,690 | 94,948 |
| Average attendance per performance No. | 152 | 146 | 125 |
Statistics on the commercial operation of theatres are given in the following table. These statistics relate only to cinemas, and do not purport to show employees, revenue, and expenditure of the motion picture industry as a whole. In particular, the full revenue and expenditure in connection with screen advertising, and also head office expenses of controlling companies (including such items as interest on debentures and mortgage charges), unless recovered from exhibitors, are not recorded in the statistics. The item “Rent” under “Theatre expenditure” does not represent the rental value of all theatres, but only the rent paid where theatres were leased or rented.
| Item | 1968-69 | 1970-71 | 1972-73 |
|---|---|---|---|
| *Includes drawings of working proprietors. | |||
| $(000) | |||
| Revenue— | |||
| Admission receipts (including amusement tax) | 6,614 | 7,828 | 9,855 |
| Screen advertising | 137 | 337 | 362 |
| Other receipts | 564 | 502 | 1,294† |
| Totals | 7,315 | 8,667 | 11,511 |
| Expenditure— | |||
| Salaries and wages* | 1,732 | 1,888 | 2,452 |
| Film hire | 2,188 | 2,640 | 3,212 |
| Advertising | 561 | 2,828 | 3,681 |
| Amusement tax | .. | ||
| Rent | 339 | ||
| Repairs and maintenance | 343 | ||
| Depreciation | 91 | ||
| Other expenses | 1,402 | ||
| Totals | 6,650 | 7,356 | 9,345 |
Classification by Statistical Areas—In the following table, cinemas have been classified by statistical areas; further information has been withheld in order to avoid disclosure of confidential information. The average attendance per performance in 1972-73 fell in all areas.
| Statistical Area | Population Estimate at 1 April 1973 | Cinemas | Seating Accommodation | Average Admission Charge | Admissions Per Head of Population | Performances For Year | Average Attendance per Performance | Average Seating Capacity per Hall |
|---|---|---|---|---|---|---|---|---|
| *Includes drawings of working proprietors, tin 1972-73 other receipts included a large increase in revenue from sales of confectionery and beverages not recorded in the two previous surveys. | ||||||||
| (000) | No. | No. of seats | c | No. | No. | No. | No. | |
| Northland | 97.4 | 9 | 4,383 | 67.3 | 3.1 | 2,922 | 102 | 487 |
| Central Auckland | 747.3 | 42 | 28,205 | 88.1 | 4.7 | 26,066 | 135 | 672 |
| South Auckland-Bay of Plenty | 442.4 | 41 | 20,423 | 71.2 | 3.6 | 13,832 | 115 | 498 |
| East Coast | 47.8 | 4 | 3,025 | 83.2 | 4.2 | 2,335 | 87 | 756 |
| Hawke's Bay | 138.3 | 6 | 4,125 | 84.0 | 3.1 | 3,604 | 120 | 688 |
| Taranaki | 101.9 | 9 | 5,205 | 77.2 | 3.6 | 3,553 | 103 | 578 |
| Wellington | 570.0 | 36 | 26,640 | 85.1 | 4.4 | 19,251 | 129 | 740 |
| Marlborough | 32.7 | 3 | 1,419 | 75.3 | 3.0 | 1,086 | 90 | 473 |
| Nelson | 70.0 | 6 | 3,868 | 76.4 | 3.2 | 2,208 | 102 | 645 |
| Westland | 22.5 | 5 | 2,360 | 76.4 | 3.2 | 927 | 78 | 472 |
| Canterbury | 412.4 | 27 | 14,686 | 85.9 | 3.7 | 10,530 | 146 | 544 |
| Otago | 183.0 | 13 | 7,151 | 84.0 | 3.8 | 5,587 | 125 | 550 |
| Southland | 108.9 | 7 | 4,695 | 80.4 | 3.1 | 3,047 | 112 | 671 |
| Totals | 2,974.7 | 208 | 126,185 | 83.0 | 4.0 | 94,948 | 125 | 607 |
Classification by Urban Areas—Statistics for the principal urban areas are as follows. Further information has been withheld in order to avoid disclosure of confidential information.
| Urban Area | Population Estimate at 1 Apr 1973 | Cinemas | Seating Accommodation | Admissions per Seat | Average Admission Charge | Admissions per Head of Population | Performances per Year | Average Attendance per Performance | Average Number of Seats Available per Performance | Estimated Proportion of Hall Capacity Filled per Performance |
|---|---|---|---|---|---|---|---|---|---|---|
| (000) | No. | No of seats | No. | c | No. | No. | No. | No. | Percent | |
| Northern Auckland | 698 | 36 | 26,655 | 129 | 88.8 | 4.9 | 24,852 | 139 | 839 | 16.6 |
| Western Auckland | ||||||||||
| Central Auckland | ||||||||||
| Southern Auckland | 319 | 18 | 15,525 | 112 | 87.1 | 5.4 | 11,525 | 150 | 931 | 16.1 |
| Upper Hutt Valley | ||||||||||
| Lower Hutt Valley | ||||||||||
| Porirua Basin | ||||||||||
| Christchurch | 286 | 13 | 8,995 | 142 | 88.5 | 4.5 | 7,985 | 161 | 808 | 19.9 |
| Dunedin | 112 | 7 | 4,859 | 124 | 86.4 | 5.3 | 4,735 | 127 | 686 | 18.5 |
| Totals | 1,416 | 74 | 56,034 | 126 | 88.1 | 5.0 | 49,097 | 144 | 841 | 17.1 |
Classification of Cinemas—The following table shows further statistics of cinemas classified by the number of screening days weekly. Data on the one circuit operator have had to be amalgamated to avoid disclosure of confidential information.
| Screening | Cinemas | Seating Accommodation | Paid Admissions | Average Admission Charge | Admission Takings | Film Hire | Film Hire as a Proportion of Admission Takings |
|---|---|---|---|---|---|---|---|
| No. | No. of seats | (000) | c | $(000) | $(000) | percent | |
| Six and 7 days per week | 134 | 99,557 | 11,002 | 85.0 | 9,352 | 3,078 | 32.9 |
| Fewer than 6 days per week | 74 | 26,628 | 868 | 57.9 | 502 | 134 | 26.6 |
| Totals | 208 | 126,185 | 11,870 | 83.0 | 9,855 | 3,212 | 32.6 |
| Screening | Persons Engaged | Performances for the Year | Average Number of paid Admissions per Performance | Average Number of Seats Available per Performance | Estimated Proportion of Hall Capacity Filled per Performance | |||
|---|---|---|---|---|---|---|---|---|
| Full Time | Part Time | |||||||
| Male | Female | Male | Female | |||||
| No. | No. | No. | No. | No. | No. | No. | percent | |
| Six and 7 days per week | 243 | 227 | 347 | 722 | 83,355 | 132 | 807 | 16.4 |
| Fewer than 6 days per week | 44 | 8 | 123 | 87 | 11,593 | 75 | 442 | 17.0 |
| Total | 287 | 235 | 470 | 809 | 94,948 | 125 | 763 | 16.4 |
Cinema Attendance in Principal Countries—The table below shows the number of admissions per head in the years quoted in a number of selected countries. These figures are taken from the United Nations Statistical Yearbook.
| Country | Year | Number of Admissions | |
|---|---|---|---|
| Total (Million) | Per Head | ||
| Australia | 1,966 | 38 | 3 |
| Canada | 1,966 | 99 | 5 |
| Denmark | 1,967 | 30 | 6 |
| France | 1,967 | 216 | 4 |
| Germany, West | 1,968 | 192 | 3 |
| Israel | 1,966 | 58 | 22 |
| Italy | 1,967 | 567 | 11 |
| Japan | 1,968 | 313 | 3 |
| New Zealand | 1968-69 | 14 | 5 |
| Norway | 1,966 | 19 | 5 |
| Russia (U.S.S.R.) | 1,968 | 4,715 | 20 |
| Spain | 1,968 | 358 | 11 |
| Sweden | 1,968 | 30 | 5 |
| Switzerland | 1,968 | 35 | 6 |
| United Kingdom | 1,968 | 237 | 4 |
| United States | 1,967 | 1,301 | 7 |
| Yugoslavia | 1,968 | 100 | 5 |
Table of Contents
GENERAL—Planning for economic development and growth covers a wide range of sectors, including agriculture, manufacturing, transport, forestry, building, mineral development, and energy production. Economic development in New Zealand is at present undergoing complex structural change with the rapidly growing manufacturing sector of increasing importance. This has strengthened the demand for land, both for industry and the associated urban development, a demand increasingly in conflict with agricultural use. Within the urban areas themselves competing demands for industrial, commercial, residential and recreational land have arisen as elements of each particular use have sought their most suitable available location. Left unchecked, these conflicts of interest could lead to unsatisfactory and uneconomic patterns of development. This has necessitated a planning framework within which competing demands can be resolved.
The desired rate of economic growth raised implications for planning the physical pattern of land use and development. Concern for the effect on the physical environment as a consequence of economic growth was recognised at the Physical Environment Conference held in May 1970 at which wide-ranging issues were discussed.
In recent years New Zealand has advanced to the stage of enacting advanced environmental legislation by world standards.
LAND USE—With over 26 million hectares of land and a population of just over 3 million, New Zealand has not in the past been conscious of the problems of resource utilisation experienced in the more closely settled countries. An extensive coastline (approximately 15,000 km), great variety of landscape and responsive soils, and a generally favourable climate at lower altitudes are some of the assets which, because of the small population, have been utilised without any serious detrimental effects on the social and economic fabric. In retrospect, however, it is apparent that some of the land and other resources have been wastefully exploited. Maori settlement brought significant ecological changes, largely through fires and hunting. The impact of European settlement was much greater, measured by the large areas of indigenous forest cover destroyed, the extensive native grasslands burnt for sheep grazing and ploughed for crops and sown pasture, the wetlands drained and reclaimed, the unsightly tailings left after gold mining, the increase in soil erosion and the general loss of wildlife habitats.
The growth and changing distribution of the population have been strongly influenced by the distribution of the most productive soils. In the nineteenth century, when the population was small, the ultimate results of preferential settlement of the best agricultural land were not appreciated. Generally, the most productive areas became the most prosperous when the towns within them grew, and it was at the expense of the most productive soils. Later, manufacturing and tertiary industries tended to be located in these towns because of the labour, markets, and services they offered.
Between 1949 and 1964 urbanisation claimed about 15,800 hectares of good farming land, and expansion up to 1984 will require another 30,000 hectares of land. Considering that the total area of good farming land includes approximately 8,300,000 hectares of first-class pastoral land and 500,000hectares of first-class cropping land and that agricultural production derives benefits from urbanisation, this is not considered a serious problem on a national scale. In certain localities, however, unrestricted urban expansion could have serious limiting effects on agricultural production in the future. The problem is most acute around Auckland, the population of which is now over 700,000, increasing at 3.5 percent a year, and therefore likely to double in 16 years. It is not possible to reverse the historical factors that have determined the present population distribution, but a national policy for the protection of the soils potentially most productive may be necessary. Economic growth was pursued with scant regard for its impact on the environment. Single and immediate use rather than balanced long-term use of resources tended to place the advocates of exploitation and protection in opposing camps.
The problem now is how to combine the economic and social pressures on soil, water, plant, and fauna resources with the maintenance of ecological and aesthetic qualities.
In New Zealand a traditional, and still largely current, attitude is to emphasise the desirability of preserving, at least in selected areas, the characteristic beauty of the landscape and providing access and facilities for recreation and enjoyment of such natural features. This emphasis has resulted in provision of extensive national parks and smaller reserves.
Development schemes causing modification of natural features can, in the planning stage, make provision for restraint, restoration, and even the addition of compensating amenities. The rate of development in New Zealand must make this an essential ingredient of planning. But it must be stressed that there will be no more completely unmodified or true wilderness country. Once it is destroyed wilderness is gone forever. Wilderness is extremely fragile, and soil erosion, degradation of vegetation, and destruction of animal species can come about through any alteration of the environment, even the most innocent access road.
Scientific investigations and research have reinforced the validity of the beliefs based on sentiment and aesthetics that there are dangers in any disturbance of natural equilibrium of air, water, soil, plants, animals, and stabilised land-forms, or in the pollution of any of them. Changes in the balance of dominance of even obscure organisms or a slowly declining water-table can be factors in the deterioration of countryside. It is essential to retain reference areas from which the changes in soils, plants, and animals resulting from man's activities can be assessed. A whole catchment will usually be the desirable minimum effective area.
Conservation, however, means much more than the preservation of scenic and scientific values. It implies the maintenance without diminution of the basic land resources on which New Zealand's economy and way of life are so largely based. Of these resources the most important are soil, water, and vegetation, the last both natural and induced, and both forests and grasslands. The concept of conserving soil, water, forest, and grassland resources is dynamic rather than static, and is generally agreed to embody the principle of preservation through wise use.
The problems are capable of solution provided there is a sufficient understanding by administrators and by the public of the importance and often the interdependence of the different values involved and of the ecological implications of any decision affecting land use. Conflicts between different demands on the countryside are inevitable, but with adequate planning and management they are mostly capable of resolution. For example, an agriculturally productive landscape can provide such rich and satisfying contacts with the diversity of nature that in many ways the man-made landscape based on agriculture or forestry need be little less interesting and satisfying than the wild one. Likewise, soil conservation practices not only restore vitality and health to the soil but also create pleasing patterns in the landscape.
Conservation thus viewed becomes more than a matter of mere aesthetic preference, and demands a more complex approach than the isolation of a few areas. If this basis is accepted the principles and practice of conservation as management of the total environment must have high priority in any plans for national development.
The total area of New Zealand, excluding the island territories in the Pacific, but including the minor islands since these form parts of land districts, is 26,870,000 hectares.
The broad grouping of land use is shown in the following table.
| Land Use | Hectares (million) |
|---|---|
| Occupied farm land— | |
| Improved grassland | 8.47 |
| Tussock and other native grassland | 5.06 |
| Total grassland | 13.53 |
| Land in field crops, gardens, and orchards | 0.41 |
| Plantations | 0.27 |
| Land in fern, scrub, and second growth | 4.55 |
| Standing bush | |
| Barren and unproductive land | |
| Total occupied farm land | 18.75 |
| Land in cities and boroughs | 0.24 |
| National parks, reserves, and domains | 2.61 |
| State forest land | 4.08 |
| Exotic forest owned by companies | 0.28 |
| Other land, including waste land such as mountains, bare rock, water surfaces, roads, etc. | 0.92 |
| Total land | 26.87 |
Land can now no longer be considered an abundant resource in New Zealand. Because this is so, there is increasing acceptance that where other compatible uses are feasible, it is not necessarily sound policy to devote land to a single or restricted use. However, the need is also becoming recognised to identify the dominant purpose for which land is most suited, so that the pressure for comprehensive land use does not negate the principle that land should be used basically for its most suitable purpose with other uses being encouraged only to the extent that they are compatible.
Land Use Advisory Council—The Land Use Advisory Council was established in 1972 with the task of developing criteria on which sound land use decisions can be made; and its order of reference requires it to have regard to physical, ecological, economic, social, environmental, and other relevant factors, and to determine means by which these factors may be more precisely defined.
The council includes departmental, farming, economic, scientific, and geographic interests, and although its decisions are primarily intended to guide the use of lands of the Crown, it is hoped that the criteria it lays down will be of assistance to all who are required to make land use decisions.
The Council has concerned itself with urban sprawl and its effect on rural land, the problems of the 10-acre subdivision, the protection of prime agricultural and horticultural land, the availability of basic land resource data for planning purposes, and the measures adopted by the Government for determining the use of its land. The experiences of a number of overseas countries in the land planning development, use and management fields have been studied and research activities in New Zealand have been noted. Consideration has been given to the various legitimate uses of the nation's land, including such non-producing use (in terms of food or goods) as recreation, soil conservation and water management, the preservation of wildlife, and historic and ecological management; and some thought has gone into the means for determining which use shall take priority in the event of these being two strong competing claims.
Too often land use has been determined on the basis of expediency, tradition, short-term economic considerations and other factors often unrelated to the real concerns of a sound national land use policy. Too often also, sufficient recognition has not been given to the need for preserving and enhancing the environment and for maintaining the conditions capable of supporting a quality of life, while providing the material means necessary to improve the national standard of living. New Zealand's economy and way of life are so largely based on the use of land that the maintenance of this resource must be a matter of national concern.
Land Inventory—The Department of Lands and Survey is building up a land inventory. The object of the inventory is to identify land tenure, land use, and land cover; and for other contributing agencies to produce more detailed data relating to other basic issues such as soils and geology as will enable a more realistic appraisal of the resources of an area to be achieved. The existence of this data should enable both local and national Government to plan with greater confidence.
The regular coverage of aerial photography by the Department of Lands and Survey provides a useful monitoring tool for changes in land use. New Zealand is hoping to participate in the Earth Resources satellite programme both as a monitor and a means of upgrading mapping data on small scales. The 5-yearly 1:100,000 urban flying programme will also assist local authorities to keep abreast of developments.
FRAMEWORK FOR PLANNING—Legislation for maintaining a balance between economic growth and the pattern of land use is contained in a number of enactments administered by various agencies.
Planning Legislation—The Physical Environment Conference in May 1970 concluded that the town and country planning legislation affords greater opportunities of control over the pattern of land use and development. The Town and Country Planning Act 1953 provides for the making and enforcement of regional and district planning schemes, and the detailed procedure to be followed in each case is amplified by the Town and Country Planning Regulations 1960. The Government administers the Act through the Minister of Works and Development who may delegate his authority to the Commissioner of Works.
Regional Planning—Regional planning authorities may be established under the Act and consist of representatives of the several councils whose districts are wholly or partly within the region. These authorities are now operating in the four main centres and in Northland and Marlborough.
Regional planning schemes must be preceded by a comprehensive survey of the natural resources of the areas concerned and of the present and potential uses and values of all lands in relation to public utilities or amenities. Regional schemes envisage the conservation and economic development of natural resources by classification of lands according to their best uses and by the co-ordination of all such public improvements, utilities, and amenities as are not limited to the territory of any one local authority.
Under the Town and Country Planning Act 1953, provision was made for regional planning schemes to be a guide and to co-ordinate with: (a) communications and transport facilities including provision of railways, arterial and regional traffic routes, public passenger service routes, harbour and navigable waterways and airports; (b) land use, including allocation of areas to be used for urban and rural development; (c) public utilities; (d) amenities, including parks, reserves, and preservation of places of historic or scenic interest or natural beauty; (e) staging of development.
The Town and Country Planning Act Review Committee (1973) recognised that the provisions as outlined in the Act for regional planning had been inadequate and commented that: “Key planning issues at regional level such as structuring and programming of development into efficient yet satisfying patterns and forms of amenities and services have seldom been dealt with successfully or even recognised as objectives”.
Moves towards adopting better regional planning studies are under way. Future planning policies, for example, involving urban growth strategies, land use and transportation, open space and recreation requirements are being developed by regional planning authorities.
Similar urban growth studies are being undertaken in other urban centres where there are at the moment no regional planning authorities. This work is being undertaken by both the local authorities concerned and the Ministry of Works and Development. The Local Government Act 1974 provides for multi-functional authorities for all regions of the country to replace many of the existing ad hoc authorities. One of their mandatory functions will be regional planning.
District Planning—Every district scheme under the Act is required to have for its general purpose the development of the area to which it relates (including where necessary the replanning and reconstruction of an area already built on) in such a way as will most effectively tend to promote and safeguard the health, safety, and convenience, the economic and general welfare of its inhabitants, and the amenities of every part of the area. The council of every city, borough, county, and independent town district must provide and maintain a district scheme whether or not a regional planning scheme including its district has been prepared or become operative. More than 90 percent of the population are living in areas where councils have brought down recommended, proposed, or operative district schemes.
Following recommendations made at the Physical Environment Conference, the Town and Country Planning Act was amended in November 1971, and required that planning authorities prior to a review becoming due to “. . . prepare a statement setting out the planning objective of the council responsible for the scheme to be incorporated in the review of the scheme and the policy to be pursued to achieve those objectives”. This gives an opportunity to integrate the different proposals by various authorities and have these included within the district scheme. Experience has shown that some of the best statements of policy have been those which have been open to public debate, though this is not mandatory.
National Planning—National planning has only been attempted in any comprehensive way since the 1969 National Development Conference.
The Town and Country Planning Act Review Committee looked at the possibility of national planning through the statutory planning framework and identified three areas of national priority; protection of coastal lands from unnecessary development, protection of arable land from urban encroachment, and the prevention of sporadic urban subdivision and development.
National planning for the preservation of the natural character of the coastal environment and of the margins of lakes and rivers and the protection of them from unnecessary subdivision and development involves the Department of Lands and Survey and the Ministry of Works and Development. Since 1966 the Department of Lands and Survey has been involved in coastal reserves acquisition which has increased with development of the coastal reserves surveys. These are carried out on a county basis and classify areas on the basis of their importance into areas of national, regional, or local significance. The Coastal Review Committee, which includes both departments, makes the final decision as to the selection and financial responsibility for particular reserves. In April 1972 the Government approved the terms of a national policy on coastal land as follows:
Recognition that coastal land is a resource of national importance but of fixed quantity justifying firstly, central as well as local government interest in how it is used; secondly, Central Government intervention when it is being misused; and thirdly, provision by Central Government of professional planning advice and funds for reserves;
Provisions of as wide a variety of active and passive recreational opportunity and experience as the coast is able to offer now and in the future including a wide range of types of recreational reserves and holiday accommodation;
Retention in sufficient quantity of the native coastal flora and fauna in its natural state as well as the unique and the typical in coastal scenery;
Establishment of a pattern of future land use which clearly defines the land needed for urban development in the next two decades and the land that should never be used for urban purposes;
Ensuring that any development of coastal land for urban and holiday purposes is in sympathy with the landscape and makes the most of each site's natural characteristics;
Recognition that the stability of a large proportion of coastal land depends on the efficiency of sand dune fixation and that unstable dune areas should not be subjected to a high level of recreational use.
The second matter of national importance in town planning is the avoidance of encroachment of urban development on, and the protection of, land having a high actual or potential value for the production of food. It has been estimated that about 9 percent of New Zealand's total land area, 2.4 million hectares, is suitable for arable farming and of this, 800,000 hectares comprise of soils capable of sustaining a high production of a wide range of crops. In 1972 cities, boroughs, town districts, and county towns covered an area of approximately 288,000 hectares, of which 165,000 hectares were in actual urban use. As has been noted above, most of New Zealand's towns are in areas of productive soils.
The third matter is the prevention of sporadic urban subdivision and development in rural areas. This is indicative of pressures which are now leading to a need for a more sophisticated approach to rural planning. Appropriate changes will include different methods of farming operation, increasing importance of commercial forestry, increases in tourism and recreation, mineral exploitation, and demand for some form of rural living.
RECREATIONAL LAND—Existing national parks and reserves are, for the most part, close to the centres of greatest and most rapidly growing population. Until recently little was done to secure in public ownership those areas where most New Zealanders take their holidays—by the water. Along the north and north-east coasts, where the climate is best and the population densest, many of the most desirable areas of coastline have already been subdivided, notably on the North Auckland, Bay of Plenty, and Coromandel coasts. Besides limiting public access, this can destroy scenic values. Similar considerations apply in respect of lakes, rocks, and offshore islands. In recent years the Crown has purchased a number of islands or parts of islands for reserve purposes. Some of these are grouped in the Hauraki Gulf and Marlborough Sounds Maritime Parks. Moves are being made to control subdivision in coastal and lakeshore areas.
Access along rivers 3 metres wide, lakes in excess of 8 hectares, and foreshores has usually been provided: on all alienations of Crown land since 1886, on private subdivision for towns near rivers or the sea coast since 1923, and on partitions of Maori land in counties since 1967.
The Land Act has provided since 1948 that around every lake with an area of 8 hectares or more there shall be laid off a strip not less than 1 chain in width.
New Zealand has some 24 percent of its land under forest. It is important that a forest cover should be maintained wherever it constitutes the most desirable form of land use. Forests meet a wide range of basic human needs—social, recreational, and spiritual, as well as economic.
New Zealand is fortunate in that a large area of native forests was set aside in the early days in reserves of various types (State forests, climatic reserves, scenery preservation reserves, reserves for the preservation of flora and fauna, and reserves for the growth and preservation of timber). As a result New Zealand is well endowed with forested wilderness and with other native forests having scenic, recreational, and wildlife values. Per head of population New Zealand probably has a larger area of forests of this type than any other developed country. Early land administrators laid the basis for a national park, a forest park, and a protection forestry system which is widely envied.
Policy in regard to recreational use of State forests has entered a positive phase in recent years. There has arisen fuller recognition of the appeal of the wild lands, particularly for the dweller in urban surroundings.
Many indigenous State forests offer scope for leisure pursuits in surroundings of great natural beauty—for study of wildlife (plant and animal); for strenuous travel through difficult country; and for the sports of shooting and fishing enthusiasts. Most of the attractive forested hill country is managed primarily for soil and water conservation; recreational use can be allowed in almost all such protection forests without interfering with the main management objectives. In fact, private hunting can be of benefit through its contribution in destroying wild animal pests. The New Zealand Forest Service is developing State forest parks in which management planning incorporates provision for recreation. Such provision includes: improvement of access from main roads to forest boundaries; clearing and maintaining tracks; erecting bridges; making camp sites and picnic places; and (sometimes in co-operation with tramping and alpine clubs) building and maintaining shelter huts, assets also of use to Forest Service personnel. Entry is unrestricted except that, in the interests of safety, persons carrying firearms require permits from the Forest Service.
The older exotic forests also offer the attractions that only a sylvan setting can provide and have the advantage of accessibility. In many places walks and picnic spots have been prepared for use by the public, and selected areas will be preserved from felling for their scenic value.
A topic which is related to forestry, parks, and reserves, is the protection and conservation of bush and trees within urban areas. Such protection is considered desirable since the trees contribute to the scenic and amenity qualities of an urban area. They also provide habitats for bird and animal life, encourage the cycling of water and nutrients, and assist with the control of erosion. A working party under the direction of the Minister for the Environment recently exploring the problems concerned with the protection of bush and trees, suggested that it could be effected by good local planning and public concern. The matter has been drawn to the attention of local authorities and legislation adopted to strengthen their powers to preserve trees and bush in subdivisions.
PLANNING AND MANAGEMENT OF MAJOR PARKS AND RESERVES—Planning of and for natural areas is proceeding at a far greater pace than ever before. The New Zealand Forest Service produces working plans for all State forests including forest parks; national park boards are preparing management plans for individual parks and a number are being produced for other reserves; coastal areas and scenic and allied reserves are being reviewed by the Department of Lands and Survey; and local and regional planning authorities are producing district or regional schemes.
In order to avoid the mistakes inherent in haphazard development, the National Parks Authority has for some years been encouraging national park boards to prepare management plans for their respective parks. These plans establish concepts and guidelines for the preservation and use of national parks, and afford the means by which park use and management can be reconciled with the preservation in perpetuity of the park's scenic beauty, and natural and historic features.
The concept of management planning is not confined to national parks. The Department of Lands and Survey is also applying the concept to reserves, domains, and recreation areas of all types. Major management plans and planning reports have been completed for the Waitangi National Trust and for Mount Maunganui, while work of this type continues for the country's two maritime parks, the Far North Coastal Park at Te Paki, and major areas of public recreation such as Lake Taupo, the Wanganui River, Waitaki Lakes, Rotorua, etc.
ENVIRONMENTAL AGENCIES—In addition to the Government departments with responsibilities for administering the diversity of legislation for the protection of the physical environment, there are several statutory authorities with responsibilities for the physical and social environment. Some of the more prominent of these are discussed below.
The Commission for the Environment—The ministerial portfolio for the environment and the Commission for the Environment were established in 1972. The Minister's role is to ensure that in all areas of Government activity at least equal attention is given to environmental as to economic or other considerations. To achieve this it is the Minister's responsibility to ensure that the Government has before it the best information available on the environmental aspects of projects and policies under consideration.
The commission, which is attached to the Prime Minister's Department for administrative purposes, functions as a small investigatory and advisory agency without executive or management responsibility. It undertakes studies for the Minister and makes recommendations. It co-ordinates the activities undertaken by other Government departments with responsibility for environmental issues, and in this capacity aims to assist in the development of policies designed to lead to sound physical and social environmental management.
A major responsibility of the commission is the auditing of the environmental impact reports now required to be prepared for any major activity proposed by a Government department, or seeking Government financial support. The process of auditing includes the study of submissions made by the public relating to a particular project. These procedures, known as the Environmental Protection and Enhancement Procedures, took full effect on 1 March 1974.
In dealing with its investigation of specific proposals subject to impact reports, it is the commission's responsibility to assess the worth of the measures proposed to safeguard the environment. The commission's audit is published.
Aside from its role under the impact reporting procedures, the commission is also able to draw attention to the need for research and action, in areas where environmental implications might otherwise be overlooked. This brings it closely into contact not only with other Government departments but with statutory bodies and citizen environmental groups. It is also able to assist community groups actively interested in the environment to make known their views to the agency concerned.
It is also a function of the Commission for the Environment to service the independent guardian groups established to advise the Government on the ways in which areas of important environmental interest should be safeguarded. Three such groups have been appointed—the Guardians of Lake Manapouri and Te Anau, the Guardians of the Rotorua Lakes, and the Guardians of Lake Wanaka (for the latter there is statutory authority in the Lake Wanaka Preservation Act). The objective of the guardian policy is to provide greater opportunities for local people to influence developments which could adversely affect significant natural assets and the membership of the groups also includes technical people who are able to make an expert contribution to the guardians' work.
The Environmental Council—The Environmental Council was established in 1970 following the Physical Environment Conference held in May of that year. The council was originally set up as a sector council of the National Development Council; as a result of the reorganisation of the planning machinery, the council now reports to the Cabinet Committee on Policies and Priorities through the Minister for the Environment.
The constitution of the council provides for 15 members, including the chairman who is not a serving Government official. Five Government departments are represented—Treasury, Health, New Zealand Forest Service, Works and Development, and Lands and Survey. Three positions are drawn from those with experience in municipal and county local government, and regional planning; the remaining six positions are filled by private citizens with knowledge and experience in environmental matters or appropriate qualifications.
The Council has no executive powers. Its terms of reference are:
To advise the Minister for the Environment on such matters as he may refer to it and on such matters as the council may arise itself on the state and trend of the environment and on measures to be taken to manage it.
To publish from time to time such information upon environmental problems as the council considers necessary to serve the public interest.
The main role of the council is to advise on general matters of policy and principal rather than to examine the environmental consequences of specific projects. It has, however, alluded to specific developments to illustrate its concerns. Examples of the policy issues in which the council has been involved are the need for national policies on the subdivision of coastal land, the use and management of coastal waters and the seabed, and the use and preservation of wetlands. Currently, the council is involved in questions relating to the formulation of a population policy and the environmental effects of energy production. It has produced an Urban Objectives Programme which is designed to provide guidelines for use by central and local government in the planning and development of urban areas.
Nature Conservation Council—The Nature Conservation Council was set up by statute in 1962. It can enquire into the effects of any proposed public or private works in areas of scenic, scientific, or recreational interest, and it makes recommendations to the Government through the Minister of Lands. The council examines certain mining applications, and it makes recommendations for reserves. Roading, harbour reclamations, native forests, and aspects of town and country planning also come within its scope. Although having access to Government information, it speaks with an independent voice, and is able to make public any of its reports or recommendations.
The council frequently advises non-Government conservation groups and co-ordinates their views. It also keeps the general public informed through its environmental publications, and through its sponsorship of the National Conservation Week each year.
CONTROL OF MINERAL EXPLOITATION—Mining has in the past left small portions of the landscape so scarred that their visual impact today suggests that mining in general produces only perpetual devastation. In fact most areas where mining has ceased need show no sign that they were ever mined.
To ensure that the land is maintained in a suitable condition, the Minister of Mines is empowered under the Mining Act 1971 to impose whatever conditions he thinks fit on a mining licence, and he may impose or vary these conditions at any time, even after the grant of the licence. Over public reserves and foreshore a condition may be attached in exchanging a prospecting licence for a mining licence that the licensee should provide a contribution towards a community asset.
Problems can occur where mineral exploitation takes place on freehold land. Local authorities have the necessary power to make regulations to control these activities, and they may use this power to maintain the long-term quality of the environment.
RE-AFFORESTATION MEASURES—In recent years the encouragement of afforestation on private land by loans and grants has begun to restore the balance of forests on induced grasslands. In addition the Forest Service has embarked on a large programme of revegetating eroded upland areas in important river catchments and also establishing dual-purpose forests where production of wood may be complementary to the protective nature of forests, for example in East Cape - Poverty Bay where 101,000 hectares will be planted over the next 40 years.
The New Zealand Forest Service prepares regional development plans for major timber supply regions throughout New Zealand, covering all forestry sectors. These plans set out the potential of the regions. For those forests under State control the Forest Service prepares regional management plans which describe and prescribe State forest activities in both indigenous and exotic production forests as well as protection forests in the mountains.
From the work of the national forest survey, the ecological survey now being carried out by the Forest Research Institute in the North Island, and the catchment condition and trend surveys carried out by the Protection Forestry Branch of the Forest Research Institute throughout New Zealand, the Forest Service has a good knowledge of the composition of State forests and of most major river catchments in all tenures.
BIOLOGICAL SURVEY—A significant recent development is the arrangement made for a botanist from DSIR to carry out a planned and systematic field biological survey of scenic and allied reserves throughout the country over the next 5 or 6 years. From data sheets and assessments for each reserve a register of protected species and community types can be compiled, with knowledge of their rarity and relative importance. The main requirement will be to document the kinds and quality of habitat in terms of plant cover.
SCIENTIFIC STUDY—About one-fifth of the staff of the Department of Scientific and Industrial Research is engaged on research on physical environment matters including ecological studies of national parks, investigations into beech forest ecosystems, and identification of marine animals and plankton. The department has undertaken bathymetric studies of lakes and the ocean floor around New Zealand. Basic geological, soil, and botanic surveys provide information for the land use surveys which guide urban development.
ENVIRONMENTAL PROTECTION BY INDUSTRY—Statistics on environmental protection have been obtained in the annual census of manufacturing industries and are shown in the following table for 1972-73.
| Industry Group | Expenditure on Environmental Protection | Percentage Environmental Expenditure of Net Output |
|---|---|---|
| $(000) | percent | |
| Food | 1,484 | 0.44 |
| Beverages | ||
| Tobacco | - | - |
| Textiles | 103 | 0.14 |
| Footwear, other wearing apparel, and made-up textile goods | 1 | - |
| Wood and cork products | 159 | 0.15 |
| Furniture and fixtures | ||
| Paper and paper products | 3,823 | 2.68 |
| Printing, publishing, etc. | ||
| Leather and leather products (except footwear and apparel) | 40 | 0.12 |
| Rubber products | ||
| Chemical and chemical products | 107 | 0.18 |
| Petroleum and coal products | 626 | 0.83 |
| Non-metallic mineral products, n.e.i. | ||
| Basic metal manufactures | 715 | 0.50 |
| Metal products | 107 | 0.08 |
| Machinery | ||
| Electrical machinery and appliances | ||
| Transport equipment | 79 | 0.06 |
| Miscellaneous products | ||
| Totals | 7,253 | 0.55 |
PROTECTION OF WATER RESOURCES—New Zealand uses about 400,000,000 gallons of water a day but requires even more to cope with the increasing demands of population and industrial growth.
Industrial use far exceeds domestic use: about 1,400 gallons of water are required to make steel worth $1, and 200 gallons are needed to produce paper worth $1. In order to get the large quantities of water demanded by our present way of life water supplies may need to be reused. Wastes must be so treated and purified before discharge into a river that the diluted effluent conforms to the standard required by water users closer to the river mouth.
The deterioration of the natural quality and the disturbance of the natural pattern of flow of water could limit utilisation for some purposes. To ensure that the quality of natural waters is maintained as a source of supply for human and animal consumption and as wildlife habitats and recreational areas, it is necessary that sedimentation, pollution and eutrophication be minimised. These problems have been particularly noticeable in the Taupo area. Preservation of the quality of water is crucial to the Taupo fishery, and to recreational and scenic values of the lake surroundings. In recent years, large-scale land development and increased population in the Taupo basin have sharply accelerated the rate of eutrophication of the lake. In an effort to reduce the nutrient inflow to a minimum, large reservations of peripheral land in natural cover have been proposed and generally accepted. As a further means of countering erosion and the inflow of nutrients, studies are being undertaken to establish guidelines for farming, forestry, and other uses outside the reserve areas.
The National Water and Soil Conservation Authority is a central policy-making body and, with the Soil Conservation and Rivers Control Council and the Water Resources Council, comprises the National Water and Soil Conservation Organisation. The authority is responsible for formulating general policy guidelines concerning water and soil conservation and each council has certain functions delegated to it.
Representation on the authority and council includes counties and municipalities catchment authorities, regional water boards, drainage and river boards, farming, manufacturing, and recreational interests, and appropriate Government departments.
Regional water boards and catchment authorities have been formed over much of the country. These local government bodies are responsible for putting the authority's policies into action. The allocation of water is the responsibility of the authority and the water boards. Broadly, the authority's functions involve developing and co-ordinating a national policy to ensure that the greatest local and national benefits are obtained from the use of the water.
The Water Resources Council, established in April 1972, is responsible for maintaining the quality of water at a satisfactory level. The council is classifying all rivers and coastal waters throughout New Zealand. These classifications are declarations of the minimum standards of quality at which the water is to be maintained in order to promote the conservation and best use of the water in the public interest.
The high rainfall and run-off factors in New Zealand have created drainage problems in many areas, particularly in low-lying sections of valleys, where river gradients are flat, and coastal areas. Drainage works are often carried out in conjunction with river-control schemes, in which case they must be properly co-ordinated with the river works, and may include floodgates and pumping stations. In the North Island, particularly, there are large areas of peat swamps that pose a special problem in development because of the danger of excessive shrinkage with overdrainage.
The topography and soils over most of the country generally favour high run-off as shown by both total annual river flows and peak flood discharges. There are, however, some areas in the North Island where flood peaks are greatly reduced by porous pumice soils, while on some river systems natural lake storage in headwaters helps to control flooding.
Since 1941 with the setting up of catchment authorities with their specialist staff, great progress has been made with river-control work throughout the country. Action was naturally focused first on the major river valleys where there has been a history of severe flood damage and where the property owners have been able to meet their share of the cost. Schemes are now in hand, or planned, for controlling the lower reaches of most of the major problem rivers.
There are still many rivers in New Zealand where major control schemes cannot be justified at the present time, but where a great many smaller, individual works are being carried out. Such works primarily serve to hold the river in check and prevent serious deterioration until such time as more comprehensive planning can be justified.
Most river-control works are carried out by catchment authorities or river boards, but some smaller works are also carried out by Ministry of Works and Development, counties, and drainage boards. The Soil Conservation and Rivers Control Council seeks to develop complete catchment control schemes where possible, to integrate river control work with water and soil conservation practice on the land area on individual river catchments.
The effective use and control of water depends on the availability of accurate long-term data on water movement. A regional system for collecting comprehensive data was initiated in 1959. The country is divided into 91 regions, based on similarity of slope, rock type, and precipitation. The data is collected and published by the representative catchment and the information is then used when applications for water rights are being considered.
The problem is one of restoring an erosion-resistant and water-absorbant combination of soil and vegetation, while ensuring that maximum permanent production is maintained or achieved under various systems of land use.
CONTROL OF SOIL EROSION—The changes in vegetation consequent on land development have been reflected in disturbed soil conditions in many parts of New Zealand. The protective, stabilising, and water-controlling combination of vigorous native vegetation, litter, and spongy soil has given way to a shallow-rooted, less protective carpet of grass on a compacted, impervious, and often exhausted soil. Soil erosion now occurs on more than 8 million hectares of hill country and mountain land, about one-third of the total area of New Zealand.
Successful techniques that have been developed to control erosion include spelling, control of burning and animal pests, oversowing, topdressing, strict grazing control, soil conservation fencing, stock-water ponds, gully control, contour ploughing, terraces, grassed waterways, and open and close tree planting. Cost-sharing rates are available to farmers carrying out these control practices.
Land classification is extensively used in New Zealand. Initially this technique involves making an inventory of the physical factors of slope, soil type, climate, vegetation, and erosion types and severity existing, either over a whole catchment or over an individual farm. This basic information then allows soil conservators to recommend the best treatment (conservation practices) and use of particular areas of land so as to ensure maximum permanent production from any one area.
Water and soil conservation farm plans are a vital means of helping landowners make the best use of their land and water resources. These plans involve the integration of conventional farm practices with those recommended under the land classification system.
A plan is formulated by a soil conservator and then discussed with the landowner concerned. The plan may then be adjusted to suit the landowners' ability to carry it out over several years.
A valuable aid in promoting water and soil conservation practices on farms has been the setting up of reserves and demonstration areas throughout the country. These areas are used to show local farmers in particular just how their problems can be overcome by the use of correct practices. Many of these areas also serve as research centres.
POLLUTION—Public concern for the preservation of the environment and for the recycling and conservation of resources has grown noticeably during recent years. Along with this the awareness of pollutants which affect the enjoyment of both the urban and rural areas has also increased. The problems of water pollution are being tackled by the Water Resources Council and the regional water boards; those of air pollution are being met by the provisions of the Clean Air Act 1972, while many local authorities have introduced bylaws to control noise problems in their areas. Within the territorial sea and harbours the Marine Pollution Act 1974 controls the discharge or dumping of oil or any other substance declared a pollutant.
Pollution of our rivers and lakes can be caused by soil erosion, farm run-off, industrial waste, or municipal sewage. The Water and Soil Conservation Act 1967 provides for the control of waste discharges but other forms of pollution require different approaches such as through changing land use practice. Sewage and farm run-off add nutrients to the water which, in some lakes, slow rivers or sheltered estuaries, has caused the excessive growth of microscopic and larger plants to the detriment of the water quality.
Waste disposal from cities, forestry, and the meat industry are the major contributors to pollution of the land. Urban waste disposal is largely by the sanitary land fill technique and most major cities are establishing tip sites planned to last up to 50 or 100 years several miles from the closest housing areas. Until recently large amounts of wood were left in the forest during logging or dumped near sawmills. Now much of this waste wood is chipped for use in pulp mills either within the country or overseas. Some effort is made to transform the waste from the 35 million livestock slaughtered each year into fertiliser but considerable quantities of it are still buried.
Organic chemical pesticides and herbicides are widely accepted as essential for efficient agriculture. Some 80 different herbicides and fungicides and 40 insecticides are in common use in New Zealand. The use of DDT on pastures has been banned and in 1973 the restrictions on the use of 2, 4, 5-T tightened in areas where there could be a danger of exposing the public to it.
Several divisions of the Department of Scientific and Industrial Research are concerned with monitoring pollution. The Chemistry Division conducts surveys of mercury contamination of fish and water, arising from geothermal outflows. Nitrate concentration in ground waters, and insecticides in water are measured, and checks are kept on heavy metals in foods. The Oceanographic Institute traced the biological effects of heated water discharges from thermal power stations. The Physics and Engineering laboratory participates in the Earth's Resources Technology Satellite programme. The department also assists such organisations as the Dairy Research Institute, the Meat Industry Research Institute, the Wool Research Organisation, and the Leather and Shoe Research Association, which are industrial research groups all supporting projects to reduce pollution and increase the use of by-products from their industrial processes which have in the past been wasted.
New Zealand's geographical shape and location is favourable to the dispersal of air pollutants. Some areas, such as Christchurch, do suffer from air pollution problems. The Clean Air Act 1972, the first part of which came into effect on 1 April 1973, establishes the principle of air pollution control on industry by the best practicable means. Provision is also made for the establishment of smokeless zones.
The Clean Air Council was established under the Clean Air Act 1972 to advise the Minister of Health on all aspects of air pollution. It advises local authorities on their work under the Act and co-ordinates the work of control authorities and voluntary organisations. It can publish reports from time to time, and is undertaking research work through four committees studying respectively clean air zones and domestic heating, motor vehicles and air pollution, rural pollution, and planning co-ordination.
GENERAL—There are 6 million hectares of Crown land which are held under lease or licence by individuals for farming or other purposes. Crown land permanently set aside for national parks, reserves, and domains comprises 2.6 million hectares. The Department of Lands and Survey is also developing 0.69 million hectares of land of which 0.49 million hectares is intended for subdivision and settlement as individual farms. Unoccupied Crown land can be broadly defined as land vested in the Crown which is not for the time being set aside for any public purpose, held by any person in fee simple or on lease or licence, or under development by the Department of Lands and Survey.
RESERVES AND NATIONAL PARKS: History—Land has been set aside for public purposes from the early years of colonial administration in New Zealand. The New Zealand Act 1840 (Imperial) authorised the disposal of land “to any persons, bodies, public or corporate, for the public uses of our subjects there resident or any of them”. Royal Instructions in 1840 to Governor Hobson elaborated on this and provided that such lands were not to be granted, conveyed or demised, or occupied by any private person or for any private purpose. A subsequent Royal Instruction dated 1846 and the New Zealand Company's Colonisation Act 1847 (Imperial) authorised the vesting of reserves in trust for public purposes or uses.
Scenic and historic reserves are controlled by scenic and historic boards, by local authorities, or by the Commissioner of Crown Lands for the district. A large number of honorary rangers help in the supervision of these reserves. The legislation governing these and all other reserves is the Reserves and Domains Act 1953. Once land has been reserved for a specific purpose, either by notice in the New Zealand Gazette or by deposit of a subdivisional plan, the purpose of the reservation can be changed or the reservation revoked only by the Minister of Lands.
Subdivision of land into residential sections is controlled by the local authority under the Municipal Corporations Act 1954 or the Counties Amendment Act 1961. Land is normally set aside as reserves, but the local authority may take a cash payment for reserve development. Local authorities are charged with ensuring that adequate provision is made on subdivision for reserves and with subsequent administration of reserves. The Crown is not bound by this legislation, but in practice refers its subdivisions to local bodies for approval and makes generous provision for reserves.
It was in 1887 that the three mountain peaks of Ruapehu, Ngauruhoe, and Tongariro were given to the nation by Te Heuheu Tukino and associated chiefs as “a national park for the benefit of everybody”. The gift area formed the nucleus of New Zealand's first national park—Tongariro—in 1894. The second national park—Egmont—was constituted by special legislation in 1900.
The first general legislation on national parks was enacted in 1928—this provided a uniform means of setting up and administering new parks. Under this legislation two new parks were established—Arthur's Pass in 1929 and Abel Tasman in 1942. Interest in national parks increased after the Second World War and a review of the administration led to the passing of the National Parks Act 1952. This made the Minister of Lands responsible to Parliament for national parks and laid the foundations for an integrated system of parks. Fiordland (part of which was first reserved in 1905) became a national park and five new parks were constituted—Mount Cook (1953), Urewera (1954), Nelson Lakes (1956), Westland (1960), and Mount Aspiring (1964).
The National Parks Act established the National Parks Authority consisting of the Director-General of Lands (chairman), the Assistant Director-General of Lands, the Secretary for Internal Affairs, the Director-General of Forests, the General Manager of the Tourist Hotel Corporation, three members appointed by the Minister of Lands on the recommendation of the Royal Forest and Bird Protection Society, the Federated Mountain Clubs of New Zealand and the Royal Society of New Zealand respectively, and two members appointed by the Minister of Lands to represent the national park boards, and one member appointed on the recommendation of the Minister of Tourism. The National Parks Authority is serviced by the Department of Lands and Survey.
Each national park is under the control of a National Park Board of which the Commissioner of Crown Lands for the district is chairman. Each board comprises not more than eight persons appointed by the Minister of Lands but in the case of Egmont and Tongariro special provisions exist regarding the appointment of members to the boards. In addition, boards within the vicinity of T.H.C. hotels include a member nominated by the Tourist Hotel Corporation. Salaried rangers in each park are responsible for development, protection, and interpretation, and their work is supplemented by the voluntary help of about 250 honorary rangers appointed from those whose interests bring them into the parks frequently or who live nearby. A voluntary body, “Friends of the Urewera National Park”, has been formed to support the work of the Urewera National Park Board.
DESCRIPTION—Ten national parks have been constituted in New Zealand covering 2,152,677 hectares or one-thirteenth of the country's land area. They are set aside as the law says “for the purpose of preserving in perpetuity as national parks, for the benefit and enjoyment of the public, areas of New Zealand that contain scenery of such distinctive quality or natural features so beautiful or unique that their preservation is in the national interest”. The National Parks Act requires that parks be administered and maintained so that they are preserved as far as possible in their natural state; that their value as soil, water, and forest conservation areas is maintained; that, as far as possible, native flora and fauna is preserved and introduced flora and fauna exterminated; and that, subject to restrictions necessary to preserve native flora and fauna or for the general welfare of the parks, the public has freedom of entry and access. There are five “special areas”: one set aside to protect the habitat of the takahe (notornis)—150,000 hectares of the 1,228,348 hectare Fiordland National Park; Sinbad Gully; the Solander Islands; Secretary Island also in Fiordland National Park; and an area set aside in the Mount Aspring National Park to protect a large nephrite boulder and its surrounds. The only restricted areas are the “special areas”.
Any form of development not provided for in the National Parks Act must be sanctioned by Act of Parliament. Permitted development includes the erection of houses for park rangers and huts for Government employees engaged in noxious animal destruction, the erection of huts by mountaineering, tramping, or other similar clubs, and the erection of ski tows and similar facilities. Appropriate commercial undertakings may operate in the parks under licence while boards controlling the parks may, with the consent of the Authority, establish camping grounds, huts, hostels, accommodation houses, or other buildings, and may help private enterprise in their establishment. “Wilderness areas” where development is restricted to access by foot-track are provided for in the Act and a number have been set aside. Virtually all the finance for parks is provided by the Government, but donations by private individuals or organisations are encouraged and earn $2 subsidy for $1 from the Government.
Three of the 10 national parks are in the North Island and seven in the South Island.
Urewera National Park (200,117 hectares), surrounds Lake Waikaremoana and contains the largest remaining forest area in the North Island. Kiwi, kaka, and most other native birds are found and the area is rich in Maori history. The bed of Lake Waikaremoana (5,210 hectares) is leased from the Maori owners and administered by the park board.
Tongariro National Park (70,087 hectares), includes the three volcanoes—Ruapehu, Ngauruhoe, and Tongariro—and is the ski-ing playground of the North Island.
Egmont National Park (33,527 hectares), contains one of the world's most symmetrical mountains and preserves forests within a 9-km radius. It varies from heavily-fested lower slopes to the bare scoria, rock, snow, and ice of the upper levels.
Abel Tasman National Park (19,171 hectares), contains coastal and elevated bush-clad country along the shores of Tasman Bay and includes off-shore islands and reefs. It has a broken coastline with many bays, coves, and beaches of golden sand.
Nelson Lakes National Park (57,256 hectares), is centred on the twin lakes of Rotoiti and Rotoroa and is surrounded by mountainous country with extensive beech forests on the lower slopes.
Arthur's Pass National Park (98,399 hectares), preserves an alpine and forested area straddling the Southern Alps.
Mount Cook and Westland National Parks (69,958 and 88,608 hectares), share a common boundary along the main divide of the Southern Alps. Westland includes forest and lake country and a small strip of sea coast as well as the Franz Josef and Fox Glaciers. Mount Cook contains most of New Zealand's highest mountains, including the highest—Mount Cook (3,764 m)—and includes the 29-km-long Tasman Glacier.
Mount Aspiring National Park (287,206 hectares), embraces the alpine region in north-west Otago and south Westland extending from the Haast Pass to the Routeburn area at the head of Lake Wakatipu and including Mount Aspiring (3,035 m).
Fiordland National Park (1,228,348 hectares), one of the world's largest national parks contains majestic scenery with fiords, mountains, forests, and lakes. It includes Lakes Manapouri and Te Anau while the road through the Homer Tunnel gives access to Milford Sound. The park is the only known habitat of the takahe (notornis) and the kakapo.
Scenic Reserves—Scenic reserves, of which there are 963 with a total area of 227,480 hectares, preserve native forest, and allow access by the public to other scenic features such as the sea coast, lakes, rivers, waterfalls, limestone caves, thermal areas, and scenic vantage points. Forest areas range from large tracts of remote forested land with considerable conservation value to small remnant areas in developed districts. Large scenic reserves have been set aside along main highways, but in general, barren mountainous regions not included in national parks remain Crown land.
There are 17 reserves in excess of 2,000 hectares as follows: Lewis Pass, Wanganui River, Buller Gorge, Rakeahua (Stewart Island), Lake Kaniere, Gouland Downs, South Cape (Stewart Island), Glenhope, Lake Brunner, Tennyson Inlet, Rahu (Reefton), Mangamuka Gorge, Tangarakau, Te Tapui (Cambridge), Pihanga, Waioeka Gorge, and John Coull Memorial Reserve (Wanganui River).
Among the best known reserves not in the preceding list are Trounson Kauri Park in North Auckland, Huka Falls, near Taupo, Hongi's Track, and various thermal areas near Rotorua, Waitomo Caves, Ball's Clearing in Hawke's Bay, Pelorus Bridge and Hundalee in Marlborough, the Summit Road Scenic Reserves and Peel Forest in Canterbury, Punakaiki and Lake Ianthe in Westland, and Forest Hill and Curio Bay in Southland.
In an endeavour to recreate the natural New Zealand scenery in an area where exotic trees, noxious weeds, and engineering development have intruded, the Department of Lands and Survey has established a plant nursery at Taupo where native trees and shrubs are being propagated for beautification of reserves in the Taupo basin.
There is provision in the Reserves and Domains Act 1953 for land to be declared private scenic reserves—this land remains in private ownership, but receives the protection of the Act. There are 2,124 hectares in 25 private scenic reserves and these include White Island, where grey faced and other petrels nest in large numbers, as well as about 3,000 pairs of gannets annually. The Pukeiti Rhododendron Trust area is a private scenic reserve near New Plymouth in native bush being planted with native trees as well as rhododendrons. One private reserve near Awaka provides, in an area of 550 hectares, shelter for native birds. Other large private scenic reserves are Moncrieff, near Nelson, and Makarora on the Haast Pass Road.
Historic Reserves—Seventy-eight areas of historic interest totalling 1,547 hectares are set aside as historic reserves and the Department of Lands and Survey co-operates closely in the administration and investigation of historic sites with the New Zealand Historic Places Trust. Historic reserves mark the landfall and landing places of early voyagers such as Tasman and Cook, the site of missionary Samuel Marsden's first sermon on New Zealand soil, sites of early fortifications, of engagements during the Maori wars, and buildings of historic value. (The Treaty House area at Waitangi, administered by the Waitangi National Trust, is not a historic reserve, in the strict sense.) Sites of Maori rock drawings and places of significance in New Zealand's early constitutional history are also preserved.
Bird Sanctuaries and Allied Reserves—Land is reserved for bird sanctuaries, for the preservation of flora and fauna, or some similar purpose in cases where the land provides a habitat for bird or plant life of such importance that some control on public access is desirable. Such areas are reserved under the Reserves and Domains Act 1953. In all there are 55 reserves in this category with a total area of 187,997 hectares. Some of them are maintained areas, but most are offshore, outlying, and sub-antarctic islands. Major areas of particular public interest include Little Barrier Island in Hauraki Gulf, the only known habitat of the stitch bird, and now part of the Hauraki Gulf Maritime Park: Cape Kidnappers gannet colony in Hawke's Bay; Kapiti Island off Wellington's west coast; the white heron colony in South Westland; and the Taiaroa Head albatross colony near Dunedin.
All of New Zealand's subantarctic islands, except for a small area surrounding the meteorological station on Campbell Island, are reserved for the preservation of flora and fauna and provide a habitat for marine mammals and millions of sea birds. As well as Campbell Island, the reserves include the Auckland Islands, Bounty Islands, Antipodes Islands, and Snares Islands. To the north of New Zealand, most of the land in the Kermadec Islands is similarly reserved.
A committee convened by the Department of Lands and Survey has been set up as an advisory body for the administration of the outlying island reserves.
Generally, access to reserves of this type is by permit only, a policy followed solely in the interests of preservation of the plant and bird life to ensure an absolute minimum of human interference to anything living and growing naturally there.
Hauraki Gulf Maritime Park—This park was established under the Hauraki Gulf Maritime Park Act in 1967. The park may include reserves of any type on or off the east coast of the North Island from Whangamata Harbour to Home Point at the northern end of Bland Bay. It includes such well-known islands as Motuihe, Rangitoto, Browns, Motutapu, Motuora, Poor Knights, Little Barrier, and part of Kawau containing the historic Mansion House. The park is controlled by a board of 10 members.
Marlborough Sounds Maritime Park—This park was established under the provisions of the Reserves and Domains Act 1953 and is administered by a 13-member board. The park provides for co-ordinated management of existing scenic, historic, recreation, and other public reserves located within the coastal region stretching from Cape Soucis in the west to Rarangi in the south-east. Appropriate island reserves are also included.
Wildlife Refuges and Sanctuaries—The Wildlife Act 1953 provides for the constitution of wildlife sanctuaries, these being areas devoted primarily as habitat areas for wildlife where the maximum degree of protection can be afforded. Restrictions are imposed on entry into the sanctuaries and certain prohibitions dealing with killing or disturbance of wildlife are imposed. The former game sanctuaries are now termed wildlife refuges. Occupiers of any land in wildlife refuges can be authorised to carry out certain operations necessary for the normal use of land.
Public Domains—Domains, of which there are 874 covering 22,311 hectares, provide districts with land for the recreational needs of the people as a whole. Many domains are designed primarily to provide for organised sport but there are a large number which preserve for public use attractive natural areas, particularly along the coastline, and provide facilities for camping. Some outstanding examples of coastal domains are Orewa, near Auckland, Ohope Beach, near Whakatane, Queen Elizabeth Park, near Wellington, Momorangi Bay in the Marlborough Sounds, Kaiteriteri and Pohara in the Nelson district, and Waikuku Beach in Canterbury. Universally known city domains are the Auckland Domain and Hagley Park, Christchurch. Native bush is protected on domain land.
Summary of Areas Reserved—The following table records the main classes of reservations at 31 March 1974.
| Type of Reservation | No. | Hectares |
|---|---|---|
*Includes 18 scenic and historic reserves totalling 240 hectares and 1 historic and recreation reserve of 4 hectares. †Excludes, bed of Lake Waikaremoana (5,210 ha) leased from Maori owners. | ||
| National parks | 10 | 2,152,677† |
| Scenic reserves (public) | 963 | 277,480 |
| Historic reserves (public) | 78* | 1,547 |
| Bird sanctuaries and allied reserves | 55 | 187,997 |
| Public domains | 874 | 22,311 |
ADMINISTRATION—Crown land is administered under the authority of the Land Act 1948. The Minister of Lands is charged with the administration of the Land Act, and his executive officer is the Director-General of Lands. New Zealand is divided into 12 land districts, the executive officer for each district being a Commissioner of Crown Lands.
The central authority under the Land Act is the Land Settlement Board consisting of the Minister of Lands (chairman), the Director-General of Lands (deputy chairman), the Secretary to the Treasury, the Director-General of Agriculture and Fisheries, the Valuer-General, a representative of the Rural Banking and Finance Corporation, the Assistant Director-General of Lands, the Fields Director of the Department of Lands and Survey, and not more than four other persons appointed by the Minister.
The Land Settlement Board is required to appoint one or more land settlement committees for each land district, and 20 of these committees have been set up. Each committee consists of three members with the Commissioner of Crown Lands for the land district as chairman and two private farmer members.
The Land Settlement Board, through the Department of Lands and Survey, disposes of Crown land for farming, residential, commercial, and industrial purposes. The demand for this land, particularly farm land, and for the other categories in and near to the main centres, is considerable. Disposals are offset to a certain extent by purchases of private land or the interests of lessees or licensees of Crown or Maori land.
DISPOSAL OF CROWN LAND—Crown land is normally offered to the public at valuation and the successful applicant decided by ballot, although in certain circumstances preferential allotment can be made. Any land may, however, be offered for disposal by tender at a minimum price or rental value or by public auction at an upset price.
Crown land may be acquired on the following tenures:
(1) Farm land, urban land, commercial, or industrial land—(a) On renewable lease; (b) for cash; (c) on deferred payments. A renewable lease is for a term of 33 years with a perpetual right of renewal for the same term and, except where otherwise provided for, with a right of acquiring the fee simple. Annual rent is reviewed at 11-yearly intervals.
(2) Pastoral land—(a) On pastoral lease for a term of 33 years with a perpetual right of renewal. for the same term, but with no right of acquiring the fee simple; (b) on pastoral occupation licence for a term not exceeding 21 years, with no right of renewal or of acquiring the fee simple.
(3) Short tenancies for grazing or other purposes for a term not exceeding 5 years.
Selections—The following table shows details of selections during the year 1973-74.
| Tenure | Number of Selectors | Total Area Selected | Purchase Price or Annual Charges |
|---|---|---|---|
*Licences on royalty basis only. Note—In previous years this table included Conversions of Tenure. | |||
| hectares | $(000) | ||
| Freehold | 356 | 4,867 | 666 |
| Renewable leases | 34 | 1,125 | 12 |
| Pastoral leases and licences | 4 | 2,609 | .. |
| Deferred-payment licences | 568 | 19,331 | 366 |
| Special leases (s. 67, Land Act) | 29 | 2,750 | 6 |
| Licences for removal of minerals* | 3 | - | - |
| Licences to occupy | 1,043 | 7,262 | 206 |
| Former Mining Tenures | 3 | 103 | - |
| Leases of endowment and other lands | 103 | 8,322 | 31 |
| Totals 1973-74 | 2,143 | 46,369 | 1,287 |
| Totals 1972-73 | 2,843 | 134,025 | 1,463 |
Leases and Licences—The following table shows the total number of leases and licences current as at 31 March 1974.
| Tenure | Leases and Licences | Area | Annual Rent | Annual Instalment* |
|---|---|---|---|---|
| *Including improvement loading. | ||||
| hectares | $ | $ | ||
| (000) | (000) | (000) | ||
| Renewable leases | 9,631 | 1,154 | 1,200 | 19 |
| Leases in perpetuity | 6,231 | 503 | 304 | .. |
| Pastoral leases and licences | 546 | 3,128 | 207 | 4 |
| Special leases (s. 67, Land Act) | 582 | 91 | 267 | 6 |
| Deferred-payment licences | 12,715 | 733 | .. | 3,953 |
| Misc. leases and licences | 1,310 | 2 | 4 | .. |
| Licences to occupy | 5,066 | 148 | 405 | .. |
| Leases of endowment and other lands | 2,939 | 163 | 191 | 4 |
| Totals 1973-74 | 39,020 | 5,922 | 2,578 | 3,986 |
| Totals 1972-73 | 40,558 | 5,978 | 2,657 | 3,154 |
Freeholdings—The following table shows the number of leases and licences freeholded, either for cash or on deferred payments.
| Method of Payment | Crown Lands | Endowment and Other Lands | Area | Purchase Price |
|---|---|---|---|---|
| No. | No. | hectares | $(000) | |
| Cash | 437 | .. | 20,595 | 1,171 |
| Deferred payments | 929 | .. | 213,366 | 12,032 |
| Totals 1973-74 | 1,366 | .. | 233,961 | 13,203 |
| Totals 1972-73 | 1,019 | 2 | 123,664 | 6,571 |
Further details on leases and licences may be obtained from the annual report of the Department of Lands and Survey, parliamentary paper C.1.
LAND DEVELOPMENT—The Land Settlement Board was constituted in 1948 to administer land policy and land development through the Department of Lands and Survey.
Development of land for settlement of farms includes clearing, cultivation, grassing, fencing, erection of buildings, installation of water supplies and completion of essential soil conservation measures. To consolidate pastures and to control regrowth of scrub and weeds, the land is farmed as part of the development process.
The major development districts are Southland with 141,346 hectares under development, Rotorua 78,571 hectares, North Auckland 71,567 hectares, and Te Kuiti 47,965 hectares.
An estimated 1,203 farms could eventually be made available from the 491,725 hectares on hand for development at 31 March 1974.
A programme of development is undertaken annually aimed at preparation of individual farm units for settlement by landless farmers. A total of 26 farms is planned for settlement in 1975, 35 in 1976, and 50 in 1977.
MARGINAL LAND DEVELOPMENT—The Marginal Lands Act 1950 assists farmers to restore, maintain, and increase production on marginal lands, by providing finance where it is not available through normal lending channels. It also provides help in amalgamation of uneconomic units either by financing farmers into additional land, or by purchase of land and allocation to adjoining holdings.
For the year ended 31 March 1974, the board granted 30 new loans and 93 additional advances totalling $2,283,204. In all, from the inception of the marginal lands scheme, 1,759 new loans have been approved, amounting to $34,878,790.
The Act is administered by the Marginal Lands Board comprising the Minister of Lands (Chairman), the Director-General of Lands (deputy Chairman), the Secretary to the Treasury, the Director-General of Agriculture and Fisheries, and four other persons appointed by the Minister.
To assist the board at local level, committees have been established in each land district consisting of a representative of the Department of Lands and Survey and of the Ministry of Agriculture and Fisheries, and a private farmer selected from a panel of such members appointed for each district by the board.
USE OF MAORI LAND—The term Maori land is a technical one, denoting ancestral land that has always been owned by Maori people. All except an insignificant portion of it is owned by defined people in defined proportions. All sales and some leases of such land still require ratification by the Maori Land Court.
In 1974 it was established that the area of land in New Zealand still designated Maori land comprised some 1,006,927 hectares. This excludes approximately 305,000 hectares of land owned by Maori Incorporations which is today officially classed as European Land.
Many Maori people own their own homes in urban areas and others own farm land purchased from non-Maoris that is designated, for record purposes, as “European” land.
The Maori Land Board has been constituted under the Maori Affairs Amendment Act 1974 to promote greater involvement in, and identification of the Maori owners with, land development activities. The board is assisted by district Maori land advisory committees.
MAORI LAND DEVELOPMENT—Although Maori land owners have access to the usual lending institutions, it is not easy to borrow money for land development unless mortgage security can be given, and multiplicity of ownership often prevents this. Under the Maori Affairs Act 1953, the Board of Maori Affairs, through Maori Affairs Department, may lend money for the development and settlement of Maori land. This procedure does not affect the legal ownership, but the rights of the owners are suspended and the board has the right to exclusive occupation of the land.
Policy is directed towards the settlement of Maori farmers on farms which will provide an adequate standard of living. Nine farmers were settled in the year ended 30 June 1973 and all told 2,400 Maori farmers have been settled with assistance from the Board of Maori Affairs.
At 30 June 1973 there were 110,113 hectares under development, of which 67,445 hectares were in grass. In addition, the Department of Lands and Survey was developing 36,000 hectares as agent of the Board of Maori Affairs. The total annual grassing programme is approximately 1,600 hectares.
There is a trend towards incorporation control of developed land; instead of the land being subdivided and settled, management is placed in the hands of an owners' committee and the land is farmed as one large station. The owners then receive an annual dividend payment according to the profitability of the undertaking.
Schemes for afforestation of Maori land unsuitable for development are also being implemented.
MAORI TRUSTEE—The Maori Trust Office was originally created to take over from the Public Trust Office the administration of certain Maori reserves and the administration of the estates of deceased Maoris and those under disability. The Maori Trust Office now forms part of the Department of Maori and Island Affairs and is headed by the Maori Trustee, comparable in status and functions with the Public Trustee. The control of most Maori Trustee activities has been decentralised by the delegation of wide powers to the District Officers of the Department of Maori and Island Affairs, who deal primarily with all Maori Trustee matters in their districts.
In addition to the administration of Maori reserves, situated mainly in Taranaki, and in Nelson, Greymouth, and other South Island localities, the Maori Trustee has the responsibility for the administration of large areas of Maori land elsewhere. Most of these lands are, like the Maori reserves, vested in the Maori Trustee, who is responsible for leasing them and distributing the proceeds to the owners.
The Maori Trustee has extensive lending powers used principally for the settlement and improvement of Maori land, for the establishment of Maoris in business, and for housing purposes. Most advances are made on the security of Maori land.
The following table is a summary of the assets and liabilities of the Maori Trustee as at 31 March in the latest three years.
| Item | As at 31 March | ||
|---|---|---|---|
| 1972 | 1973 | 1974 | |
| $(000) | |||
| Assets— | |||
| Cash | 265 | 452 | 461 |
| Investments— | |||
| Government securities | 6,678 | 6,579 | 6,884 |
| Local authority debentures | 643 | 654 | 656 |
| Mortgages, charges, and advances on overdraft | 4,816 | 4,505 | 4,803 |
| Land, buildings, and miscellaneous | 402 | 398 | 339 |
| Totals | 12,804 | 12,588 | 13,143 |
| Liabilities— | |||
| Amounts held for beneficiaries and sundry depositors | 7,813 | 7,971 | 8,106 |
| Reserves and Appropriation Account | 4,666 | 4,261 | 4,745 |
| Sundry creditors, etc. | 325 | 356 | 292 |
| Totals | 12,804 | 12,588 | 13,143 |
GENERAL—The Department of Lands and Survey is facing an increasing demand for engineering survey information on which to plan major construction works such as power projects, and roading and bridging programmes, and for topographical and cadastral information on which to plan future development of the country.
The department also provides survey control for the whole of New Zealand. This activity is a major statutory function of the department as control forms the framework on which all other surveys are based.
The department examines and approves all surveys of private lands carried out by registered private surveyors for the purpose of the Land Transfer Act 1952, and maintains complete records of these surveys.
The conversion of these plan records to microfilm aperture cards is now almost completed and investigations have begun for the development of a system of computer-based records required to meet the growing demands on the land survey and land title system.
The department is also becoming increasingly involved in land and resource planning activities and works closely with local authorities on town and country planning.
AERIAL PHOTOGRAPHY AND MAPPING—Extensive use is made of aerial photographs for other than purely mapping purposes. All types of land and engineering development investigations into geological resources, afforestation, and town and country planning are now based on data extracted from aerial photographs. The department is responsible for the maintenance of a complete library of aerial photographs, which are made available for all national purposes.
The department recently completed the photogrammetric mapping for topographical map coverage of the whole of New Zealand at a scale of 1:63,360, and mapping efforts are now being concentrated on a new basic metric topographic series. There is an increasing demand for topographical maps of all scales for land development, forestry, engineering, geological and soil survey, and other governmental purposes.
Mapping is also undertaken of islands and territory within the Ross Dependency, Antarctica, and within the South-west Pacific region.
An active programme of map production for a new edition of the New Zealand Atlas is currently underway.
MAPS—Map sales agencies are maintained at each of the district offices except Wellington and at the Head Office of the Department of Lands and Survey. In addition 529 private selling agents have been appointed throughout New Zealand and overseas. All maps for sale are listed in the Catalogue Of Maps published by the department.
Table of Contents
SOILS—Soil is a product of its environment—its composition depends on the parent ingredient, the climate, the length of time it has weathered, the topography, and the vegetation under which it has formed. The complex soil pattern of New Zealand is a result of the many different kinds of rock, and the various conditions under which the soils have formed.
New Zealand includes such extremes as the subtropical climate of North Auckland, the cold uplands of the alpine regions, and the semi-arid basins of Central Otago.
The country's topography is also varied—50 percent of the land is classifiable as steep, 20 percent is moderately hilly, and only 30 percent is rolling or flat.
The natural vegetation ranges from kauri forest to subalpine scrub, and from tussock grassland to broadleaf forest. From time to time, occurrences such as river floods on alluvial plains, sand drifts, or a volcanic ash eruption interrupt and alter the pattern of soil development.
Regional differences in New Zealand's soils result mainly from the effects of climate on topography. Soils develop more rapidly under high temperatures and a heavy rainfall. In New Zealand, distinct soil gradations are found, both from north to south and from west to east. These closely follow the isohyets (lines connecting places that receive the same amount of rain) on a climatic map.
A better understanding of the local soils has brought changes in the approach to land use. Improved methods of recognising and mapping soils have meant that different methods of farming can be adapted to the appropriate soil types. These developments have facilitated the conversion of large areas of “problem” land into good farms, and have made land use more efficient.
New Zealand soils can be divided into three main groups: zonal, intrazonal, and azonal. Zonal soils are those that have developed where they lie, under normal conditions. Variations within this broad group are caused by regional differences—in temperature and rainfall particularly. The standard (and most common) soils in New Zealand are the numerous subgroups of the yellow-brown earths. The intrazonal soils include those from less common parent materials and those influenced by ground water. The azonal soils are young soils which have recently been renewed by sediment, volcanic eruption, or erosion. They include recent soils of alluvium and volcanic ash, as well as steepland soils. They are modified by factors such as the instability of a particular area, or the length of time a soil has been developing.
Approach to Soil Management—The rapid increase in knowledge of the soils of New Zealand has brought about a change in approach to soil management. Soils have been mapped and their properties and uses determined. This has stimulated the rapid conversion of large areas of “problem” land into good farms and has raised land use to a new pitch of efficiency, which reflects the modern changes to farming as an up-to-date science.
Farmers have exploited the use of certified strains of grasses and clovers, phosphatic fertilisers, lime, and trace elements. The use of aircraft for topdressing and oversowing of grass is resulting in considerable improvements to hill pasture, with a consequent increase in carrying capacity and production.
New Zealand soils may be classified on a regional basis as follows.
| Region | Soils | Vegetation and Land Use |
|---|---|---|
| North Auckland Peninsula and Auckland region | Northern yellow-brown earths and podzols left by kauri forest. Loams and clays from volcanic rocks. Soft-rock uplands with volcanic outcrops. | Heavily forested (high rainfall and humidity). Patches of rich dairy land on formerly swampy organic soils. Some wool and store sheep. Dairying, fat lambs near Auckland. Patchy land use. |
| Bay of Plenty - Waikato -Thames - Hauraki Plains | Volcanic ash covers much of area. Most soils intrazonal or azonal. Yellow-brown pumice soils in Bay of Plenty. Peaty soils with high ground water on Hauraki Plains. | Intensively farmed dairying region. Land use almost entirely based on grass and clover, with great reliance on topdressing Some fat lambs. Extensive exotic forests in Bay of Plenty region. |
| Volcanic Plateau | Pumice soils, lacking in essential trace elements. Yellow-brown pumice soils from volcanic material. | Largely undeveloped scrub and native forest. Extensive exotic forests. Topdressing of former manuka and scrub area for farming. |
| East Coast | Southern and central yellow-brown earths. Patches of recent alluvial soils along rivers. Yellow-grey earths on rolling land south of Hawke Bay | Semi-extensive sheep farming (wool and store sheep). Intensive fat-lamb production on flat to rolling plains. Market gardens and orchards near Napier and Hastings. Some pip fruit. Pockets of dairying close to main ranges from Norsewood south. |
| Taranaki | Ring plain consists of yellow-brown loams, with granular clay from volcanic ash. Overlay of fertile ash and sediment from Mount Egmont. Soft-rock uplands away from coast. | Distinct contrast between rich, closely farmed dairying ring plain and inland country with its steep ridges mainly covered in second-growth forest or dense gorse, and severely eroded. |
| Manawatu - Horowhenua Coast Plain | Sand dunes and swampy hollows common along coast. Steepland yellow-brown earths inland. Extensive young soils from dune sands along coast. | Many hollows contain native flax (Phormium tenax). Pockets of dairying and fat-lamb production. |
| Nelson | Pockets of fertile, recent alluvial soils in yellow-grey and yellow-brown earths. | Orchards and market gardens. Hops and tobacco also grown on flat, rolling land. |
| Marlborough - Kaikoura Coast | Yellow-brown earths with pockets of alluvial soils. | Where land is developed, mainly sheep or cash cropping. |
| West Coast | Extensive grey podzols, with recent swamp soils on alluvial flats. | Mostly undeveloped scrub and native bush. Some dairying. |
| Canterbury Plains | Deep layer of fine sediment provides fertile soil for cereals and fodder crops, and makes good sheep pasture. Cash cropping on former swamp near Christchurch. | Very thick layer of gravel deposited by rivers—thickest and coarsest near mountains from which rivers flow. Soils range from stony gravel to fine silts. |
| Otago | High-country yellow-brown earths on ranges; yellow-grey earths, often stony, in basins. | Sheep farming for wool and fat lambs plus some cattle and some orchards. Irrigation necessary in low-rainfall area. |
| Southland and Fiordland | Southland Plain has extensive deposits of gravel and silt. Fiordland mostly subalpine gley soils and gley podzols. | Fat-lamb production in Southland. Fiordland agriculturally undeveloped and unproductive. Scenic attractions. |
NATURE OF FARMING—Most of the dairy farms are in lowland areas of the North Island, where naturally fertile or improved soils make for good grass growth. Approximately 90 percent of the total dairy stock in the country are grazed on the flat and undulating land of Northland, South Auckland - Bay of Plenty, Taranaki, and Wellington. Pastures of high feeding value form the basis of the industry and carrying capacity may be as high as 2.5 cows per hectare, and annual production as high as 400-450 kg of milkfat per hectare. The main winter supplementary feed is hay and silage made from the surplus spring and early summer growth of the pastures. In most of the dairying areas fat-lamb raising is also undertaken, particularly in the Waikato and the Bay of Plenty.
On the less steep country, particularly in the North Island where there is surface-sown grassland, both store sheep and cattle are raised.
Sheep fattening farms are generally located on land which is of high fertility, either naturally or produced by topdressing. Country of this type is usually flat to undulating in topography, and tends to be concentrated on the coastal plains and river valleys of both islands, e.g., the Waikato basin, the Poverty Bay flats, the Hawke's Bay, Manawatu, Canterbury, and Southland plains. In the North Island it is normal to rely on pasture as a sole diet, while in the drier areas of the South Island it is necessary to grow special crops, such as rape, for fattening lambs, and in colder areas to grow crops for supplementing the ewe flock feeding over the winter.
Fattening farms vary considerably in area and in the size of flock carried. A flock of 1,000-1,200 ewes is commonly regarded as a 1-man unit. The average range in carrying capacity is from 7 to 15 ewes wintered to the hectare. Lambing percentages are variable but average from 100 to 120 lambs per 100 ewes mated. The aim of the farmer is to sell a high proportion of these lambs, fat off their mothers, at carcass weights around 12-16 kg for the United Kingdom market. In the North Island, cattle are normally purchased in the spring to control excess pasture growth and are fattened, if possible, by the autumn. On some properties, store wether lambs from the hill-breeding flocks may also be brought in for fattening. The amount of meat produced on fattening farms averages about 130-155 kg per hectare.
Hill country sheep farming covers extensive areas in both islands. The stock carried consists of a mixed-age flock of breeding ewes, ewe hoggets for replacements, and rams. Where part of the property is of poor quality, wethers may also be carried. Products sold are wool (which usually represents 50 percent or more of the total farm income), some fat wether lambs, store lambs for fattening and, of most importance, breeding ewes which are purchased by fat-lamb farmers.
A large proportion of the beef cattle are also run on hill-country properties.
On the plains and downlands of Canterbury and in parts of Marlborough, Otago, and Southland, where the climate and soils are suitable, arable mixed fanning is a feature. Approximately 92 percent of New Zealand's wheat, oats, and barley areas are in these districts. On the majority of the cereal-producing farms sheep and lambs are also fattened.
OCCUPIED LAND: Tenure—The tenure of occupied land at 30 June 1972 by size of holding is given in the following table.
| Size of Holding | No. of Holdings | Freehold | Crown Land, Leases and Licences | Land Leased from | Other | Total Land Occupied | |
|---|---|---|---|---|---|---|---|
| Private Individuals | Trustees, Companies, etc. | ||||||
| (ha) | ha (000) | ha (000) | ha (000) | ha (000) | ha (000) | ha (000) | |
| Under 5 | 2,730 | 8 | - | - | - | - | 9 |
| 5- | 9 | 2,728 | 17 | 1 | 1 | 1 | 20 |
| 10- 14 | 1,860 | 18 | 1 | 2 | 1 | .. | 23 |
| 15- 19 | 1,432 | 21 | 1 | 2 | 1 | .. | 25 |
| 20- 29 | 3,145 | 63 | 5 | 6 | 3 | .. | 78 |
| 30- 39 | 3,407 | 100 | 8 | 7 | 4 | 1 | 120 |
| 40- 49 | 4,460 | 162 | 12 | 12 | 6 | 1 | 198 |
| 50- 59 | 3,502 | 158 | 16 | 12 | 6 | 1 | 193 |
| 60- 79 | 5,880 | 327 | 36 | 24 | 16 | 2 | 406 |
| 80- 99 | 4,703 | 340 | 34 | 26 | 16 | 2 | 418 |
| 100- 149 | 7,234 | 705 | 98 | 50 | 34 | 3 | 890 |
| 150- 199 | 5,156 | 677 | 140 | 39 | 35 | 5 | 896 |
| 200- 299 | 6,167 | 1,109 | 265 | 58 | 59 | 65 | 1,497 |
| 300- 399 | 2,995 | 744 | 198 | 42 | 43 | 5 | 1,033 |
| 400- 599 | 2,892 | 1,006 | 258 | 57 | 69 | 11 | 1,401 |
| 600- 799 | 1,320 | 614 | 203 | 32 | 51 | 7 | 908 |
| 800- 999 | 782 | 466 | 170 | 25 | 25 | 8 | 693 |
| 1,000-1,199 | 442 | 322 | 116 | 18 | 23 | 54 | 484 |
| 1,200-1,999 | 877 | 798 | 429 | 32 | 65 | 22 | 1,347 |
| 2,000-3,999 | 544 | 649 | 717 | 28 | 63 | 35 | 1,491 |
| 4,000 and over | 533 | 914 | 5,761 | 36 | 92 | 98 | 6,901 |
| Total | 62,789 | 9,222 | 8,470 | 510 | 616 | 212 | 19,030 |
Farm Type—Land usage and occupation at 30 June 1972 by farm type is shown in the following table.
| Farm Type | No. of Holdings | Grassland and Lucerne | Land Prepared for Crops Fruit, or Nursery | Plantation of Exotic Trees | Tussock or Danthonia Used for Grazing | Other Land on Holding | Total Area of Holdings¶ |
|---|---|---|---|---|---|---|---|
*Seventy-five percent or more of gross income is derived from stated activity. †From 51 to 74 percent of gross income is derived from first-named activity and between 20 and 40 percent from second activity. ‡More than 50 percent of gross income is derived from stated activity. §Two or more activities of roughly equal proportions, one of which is cropping. ||Two or more activities of roughly equal proportions. ¶Because of rounding off, the total of individual items does not always add to total for group. | |||||||
| ha (000) | ha (000) | ha (000) | ha (000) | ha (000) | ha (000) | ||
| Dairy* | 16,747 | 1,032.8 | 11.0 | 4.1 | 39.3 | 124.0 | 1,211.2 |
| Sheep* | 11,770 | 1,937.0 | 90.2 | 11.0 | 2,200.2 | 534.2 | 4,772.7 |
| Beef* | 5,119 | 448.2 | 4.0 | 3.9 | 330.1 | 300.4 | 1,086.6 |
| Pig* | 393 | 8.2 | 1.0 | - | 1.1 | 1.9 | 12.2 |
| Cropping* | 1,109 | 28.7 | 32.1 | 0.2 | 1.7 | 3.1 | 65.7 |
| Dairy, with sheep† | 507 | 59.2 | 1.3 | 0.2 | 6.9 | 11.9 | 79.5 |
| Dairy, with beef† | 1,538 | 140.4 | 1.2 | 0.9 | 9.1 | 34.0 | 185.6 |
| Dairy, with other† | 504 | 28.1 | 1.7 | 0.6 | 1.8 | 4.9 | 37.1 |
| Sheep, with dairy† | 178 | 21.1 | 0.7 | 0.1 | 1.6 | 3.2 | 26.7 |
| Sheep, with beef† | 6,443 | 2,002.6 | 42.0 | 4.2 | 1,523.9 | 633.8 | 4,213.4 |
| Sheep, with cropping† | 1,451 | 211.7 | 47.9 | 1.4 | 34.4 | 10.2 | 305.5 |
| Sheep, with other† | 280 | 39.1 | 2.8 | 0.1 | 22.9 | 16.2 | 81.1 |
| Beef, with dairy† | 224 | 20.3 | 0.2 | 0.2 | 1.0 | 6.9 | 28.5 |
| Beef, with sheep† | 1,864 | 484.9 | 4.9 | 2.9 | 197.5 | 171.2 | 861.5 |
| Beef, with other† | 180 | 10.8 | 1.4 | 0.1 | 2.0 | 1.4 | 15.8 |
| Cropping, with sheep† | 741 | 66.4 | 37.1 | 0.4 | 5.1 | 3.5 | 112.5 |
| Cropping, with other† | 152 | 6.0 | 5.0 | - | 0.5 | 1.2 | 12.8 |
| Stud farming† | 456 | 34.6 | 2.2 | 0.2 | 2.3 | 2.6 | 42.0 |
| Mixed livestock|| | 6,057 | 1,560.8 | 17.5 | 7.7 | 600.9 | 478.3 | 2,665.2 |
| General mixed farming§ | 2,161 | 268.5 | 71.2 | 2.0 | 45.2 | 28.6 | 415.5 |
| Market gardening | 1,275 | 11.3 | 11.7 | - | 4.8 | 2.9 | 30.7 |
| Orchard‡ | 1,881 | 6.9 | 13.0 | 0.5 | 6.6 | 3.5 | 30.6 |
| Tobacco‡ | 297 | 6.2 | 2.0 | 0.4 | 1.9 | 5.8 | 16.4 |
| Plantation | 380 | 4.9 | 0.2 | 476.2 | 9.5 | 704.1 | 1,194.8 |
| Other farming | 1,082 | 32.2 | 3.4 | 22.7 | 8.1 | 1,460.6 | 1,527.0 |
| Total | 62,789 | 8,470.9 | 405.8 | 546.9 | 5,058.1 | 4,548.5 | 19,030.4 |
Land usage and occupation at 30 June 1972 by statistical area is given in the following table.
| Statistical Area | No. of Holdings | Grassland and Lucerne | Crops, Fruit, or Nursery | Plantations of Exotic Trees | Tussock or Danthonia Used for Grazing | Total Area of Holdings* | ||
|---|---|---|---|---|---|---|---|---|
| Established Before 30/6/71 | Established During Year Ended 30/6/72 | Area Prior to 31/3/71 | Planted in 1972 Season | |||||
| *Including “other”. | ||||||||
| ha (000) | ha (000) | ha (000) | ha (000) | ha (000) | ha (000) | ha (000) | ||
| Northland | 5,283 | 590.7 | 8.3 | 2.5 | 18.5 | 2.4 | 63.4 | 992.1 |
| Central Auckland | 4,622 | 285.0 | 2.6 | 6.3 | 15.5 | 1.3 | 15.5 | 408.0 |
| South Auckland - Bay of Plenty | 14,432 | 1,617.7 | 24.4 | 20.8 | 290.3 | 10.3 | 77.6 | 2,837.6 |
| East Coast | 1,431 | 532.3 | 5.3 | 8.0 | 9.2 | 1.8 | 41.1 | 696.7 |
| Hawke's Bay | 3,941 | 866.1 | 15.8 | 16.4 | 20.7 | 2.3 | 63.4 | 1,201.4 |
| Taranaki | 4,435 | 401.3 | 3.8 | 2.6 | 2.6 | 0.3 | 17.0 | 541.3 |
| Wellington | 7,206 | 1,332.2 | 21.2 | 29.7 | 24.1 | 1.3 | 188.9 | 1,956.8 |
| North Island | 41,350 | 5,625.3 | 81.6 | 86.4 | 380.7 | 19.6 | 466.9 | 8,634.1 |
| Marlborough | 1,192 | 153.9 | 25.5 | 8.1 | 5.4 | 0.9 | 481.1 | 932.2 |
| Nelson | 2,098 | 125.6 | 4.7 | 7.7 | 48.0 | 2.7 | 89.7 | 924.8 |
| Westland | 620 | 62.8 | 2.3 | 0.7 | 6.7 | 0.9 | 37.3 | 844.8 |
| Canterbury | 8,207 | 874.7 | 124.3 | 195.6 | 39.5 | 1.6 | 1,597.3 | 3,163.2 |
| Otago | 4,548 | 691.7 | 39.7 | 58.4 | 26.9 | 1.5 | 1,984.5 | 3,159.3 |
| Southland | 4,774 | 631.4 | 27.2 | 49.0 | 11.4 | 1.0 | 401.5 | 1,371.7 |
| South Island | 21,439 | 2,540.1 | 223.7 | 319.4 | 138.0 | 8.6 | 4,591.3 | 10,396.3 |
| New Zealand | 62,789 | 8,165.5 | 305.4 | 405.8 | 518.7 | 28.2 | 5,058.3 | 19,030.4 |
FARM EMPLOYMENT SURVEY—A survey of farm employment was made by the Department of Statistics for the last week in June 1970. The survey covered 55,395 holdings; it excluded 4,101 holdings where there were no working owners, etc., nor any employees. The total of 59,496 holdings represented a coverage of 91 percent of all farm holdings. There were 7,670 females in the total of 65,607 working owners, etc., and 4,860 females in the total of 33,639 employees. Also family assistance was listed as 6,108 unpaid males and 10,120 unpaid females.
| Farm Type | Holdings | Working Owners | Working Leaseholders | Sharemilkers | Employees | ||
|---|---|---|---|---|---|---|---|
| Owning Herd | Not Owning Herd | Permanent | Casual | ||||
*First named predominant. †Either predominant. | |||||||
| Principally dairy | 16,962 | 16,907 | 845 | 3,622 | 1,755 | 5,677 | 443 |
| Principally sheep | 11,659 | 11,737 | 546 | 6 | 5 | 5,301 | 1,783 |
| Principally beef | 2,232 | 2,256 | 135 | 5 | 4 | 404 | 92 |
| Dairy and sheep* | 942 | 1,062 | 59 | 76 | 70 | 527 | 74 |
| Dairy and beef* | 851 | 1,016 | 43 | 85 | 48 | 345 | 28 |
| Sheep and dairy* | 401 | 452 | 18 | 23 | 18 | 187 | 47 |
| Sheep and beef* | 8,458 | 8,130 | 404 | 7 | 6 | 6,949 | 1,165 |
| Beef and dairy* | 228 | 238 | 22 | 10 | 10 | 58 | 11 |
| Beef and sheep* | 1,231 | 1,240 | 54 | - | - | 802 | 169 |
| Mixed livestock | 1,914 | 2,084 | 86 | 63 | 61 | 984 | 222 |
| Sheep and cropping† | 2,710 | 2,805 | 132 | - | - | 1,221 | 448 |
| Principally cropping | 1,260 | 1,224 | 127 | - | 1 | 451 | 196 |
| General mixed farming | 1,855 | 2,045 | 91 | 6 | 16 | 1,056 | 312 |
| Market farms and gardens | 1,350 | 1,750 | 93 | - | - | 593 | 277 |
| Other | 3,342 | 3,972 | 126 | 5 | 6 | 2,424 | 1,393 |
| Totals | 55,395 | 56,918 | 2,781 | 3,908 | 2,000 | 26,979 | 6,660 |
In June 1972 there were 129,412 persons working on farms. Of these, 67,191 were working owners, leaseholders, and sharemilkers; 33,501 were permanent paid employees; 11,845 unpaid family members working permanently on the farm; 10,371 paid casual employees; and 6,504 casual unpaid members of the family. The farm labour force included 25,968 women and girls, making up 21 percent of the total.
Of the 62,789 productive farm holdings included in the survey, 20,323 (32 percent) were worked only by owners, leaseholders, or sharemilkers.
CAPITAL EXPENDITURE ON FARMS—An annual survey of capital formation in the farming industry is made by the Department of Statistics. For the year ended 31 March 1972 capital expenditure was recorded for only two-thirds (41,811) out of the 62,789 farms and plantations surveyed.
Capital expenditure on farms during the year ended 31 March 1972, according to farm types and also by statistical areas, is set out in the following table.
| Farm Type and Statistical Area | Number of Holdings | Capital Expenditure | ||||
|---|---|---|---|---|---|---|
| Building Construction | Motor Vehicles and Trailers | Tractors and Farm Machinery | Improvements and Development | Total Expenditure | ||
| $(m) | ||||||
| Principally dairy | 13,655 | 11.5 | 11.6 | 11.2 | 8.3 | 42.4 |
| Principally sheep | 13,682 | 7.8 | 9.2 | 7.6 | 13.6 | 38.4 |
| Principally beef | 4,182 | 3.2 | 2.9 | 2.0 | 3.6 | 11.6 |
| Principally cropping | 1,102 | 0.9 | 0.6 | 1.5 | 0.6 | 3.5 |
| Principally pig | 226 | 0.3 | 0.2 | 0.1 | 0.1 | 0.7 |
| Principally stud | 252 | 0.4 | 0.2 | 0.2 | 0.3 | 1.0 |
| Mixed livestock | 4,409 | 3.7 | 3.4 | 5.1 | 5.8 | 17.9 |
| General mixed | 1,652 | 0.9 | 1.1 | 2.4 | 1.1 | 5.5 |
| Poultry | 260 | 0.8 | 0.2 | 0.2 | 0.1 | 1.2 |
| Market gardens | 656 | 0.8 | 0.8 | 1.0 | 0.5 | 3.3 |
| Orchard | 1,004 | 1.3 | 0.7 | 0.9 | 0.5 | 3.3 |
| Tobacco | 184 | 0.2 | 0.1 | 0.2 | 0.1 | 0.5 |
| Nursery | 68 | 0.1 | 0.1 | 0.1 | 0.1 | 0.4 |
| Plantation | 120 | 0.6 | 0.6 | 0.2 | 3.2 | 4.6 |
| Others | 359 | 0.4 | 0.3 | 0.4 | 0.5 | 1.5 |
| Totals | 41,811 | 32.8 | 32.2 | 32.8 | 38.2 | 135.9 |
| Northland | 3,617 | 2.8 | 3.0 | 2.6 | 3.9 | 12.3 |
| Central Auckland | 2,840 | 2.9 | 2.2 | 2.0 | 1.8 | 9.0 |
| South Auckland-Bay of Plenty | 9,855 | 9.1 | 8.7 | 7.0 | 9.7 | 34.5 |
| East Coast | 883 | 0.8 | 0.5 | 0.6 | 1.6 | 3.5 |
| Hawke's Bay | 2,704 | 2.4 | 2.2 | 4.2 | 3.2 | 12.0 |
| Taranaki | 3,052 | 2.2 | 2.3 | 2.1 | 1.6 | 8.2 |
| Wellington | 4,609 | 2.7 | 3.7 | 2.8 | 3.8 | 13.0 |
| Totals, North Island | 27,560 | 23.1 | 22.6 | 21.2 | 25.6 | 92.4 |
| Marlborough | 805 | 0.6 | 0.5 | 0.6 | 0.8 | 2.5 |
| Nelson | 1,275 | 1.1 | 0.7 | 0.9 | 1.3 | 4.0 |
| Westland | 392 | 0.3 | 0.3 | 0.4 | 0.6 | 1.7 |
| Canterbury | 5,490 | 3.9 | 3.3 | 5.4 | 3.9 | 16.6 |
| Otago | 2,984 | 1.9 | 2.3 | 2.2 | 2.7 | 9.1 |
| Southland | 3,305 | 1.8 | 2.5 | 2.1 | 3.2 | 9.6 |
| Totals, South Island | 14,251 | 9.7 | 9.5 | 11.7 | 12.6 | 43.5 |
| Totals, New Zealand | 41,811 | 32.8 | 32.2 | 32.8 | 38.1 | 135.9 |
FENCING—Approximately 805,000 kilometres of fencing, with a replacement value of over $400 million, controls New Zealand's sheep and cattle population. The annual expenditure on fencing is upwards of $20 million.
GROSS FARMING INCOME AND VOLUME OF FARM PRODUCTION—Gross farming income is the value of the gross output of fanning at the “farm gate” before any deduction is made for the expenses of farm operation. A description of this statistical series was given in the 1966 and earlier issues of the Yearbook.
The following table shows the value of gross farming income. The second part of this table gives the percentage contributions of each group to total gross farming income. In compiling farm income, allowance is made for changes in the numbers of livestock from year to year valued at market prices.
| Year | Group | Total (Gross Farming Income) | ||||||
|---|---|---|---|---|---|---|---|---|
| Grain and Field Crops | Horticulture. Poultry, and Bees | Wool | Mutton and Lamb | Beef | Dairying | Pigs | ||
*Provisional †Excludes $49.5 million paid to farmers under the stock retention incentive scheme during the years ended 31 March 1972 and 1973. | ||||||||
| $(million) | ||||||||
| 1938-39 | 9.4 | 12.6 | 18.5 | 24.4 | 13.1 | 56.7 | 4.8 | 139.5 |
| 1955-56 | 32.2 | 41.6 | 143.0 | 111.5 | 36.8 | 176.9 | 12.4 | 554.4 |
| 1960-61 | 42.3 | 50.4 | 158.3 | 109.1 | 55.0 | 184.5 | 14.3 | 613.9 |
| 1962-63 | 43.3 | 37.1 | 180.5 | 107.8 | 68.8 | 180.5 | 16.0 | 654.0 |
| 1963-64 | 50.0 | 62.4 | 230.1 | 131.3 | 74.4 | 198.3 | 17.1 | 763 6 |
| 1964-65 | 48.7 | 69.6 | 172.9 | 166.9 | 87.1 | 229.4 | 17.5 | 792.1 |
| 1965-66 | 51.1 | 76.0 | 193.6 | 166.9 | 95.7 | 251.8 | 17.4 | 852.5 |
| 1966-67 | 58.6 | 79.9 | 162.7 | 140.4 | 103.9 | 261.4 | 17.3 | 824.2 |
| 1967-68 | 66.9 | 79.9 | 131.6 | 155.8 | 121.6 | 242.5 | 19.6 | 817.9 |
| 1968-69 | 74.1 | 86.5 | 155.8 | 168.5 | 141.8 | 237.5 | 21.4 | 885.6 |
| 1969-70 | 60.0 | 87.2 | 139.4 | 188.3 | 176.7 | 217.3 | 24.9 | 893.8 |
| 1970-71 | 76.6 | 98.2 | 132.9 | 164.7 | 195.7 | 739.5 | 27.3 | 934.9 |
| 1971-72x | 93.2 | 113.6 | 161.4 | 175.1 | 195.7 | 358.5 | 28.2 | 1,125.7† |
| 1972-73* | 93.7 | 126.7 | 347.7 | 325.6 | 294.8 | 315.3 | 29.8 | 1,533.6† |
| Percentages of Total Gross Farming Income | ||||||||
| 1938-39 | 6.7 | 9.0 | 13.3 | 17.5 | 9.4 | 40.6 | 3.5 | 100.0 |
| 1955-56 | 5.8 | 7.5 | 25.8 | 20.1 | 6.7 | 31.9 | 2.2 | 100 0 |
| 1960-61 | 6.9 | 8.2 | 25.8 | 17.8 | 8.9 | 30.1 | 2.3 | 100.0 |
| 1962-63 | 6.6 | 8.7 | 27.6 | 16.5 | 10.5 | 27.6 | 2.5 | 100.0 |
| 1963-64 | 6.6 | 8.2 | 30.1 | 17.2 | 9.7 | 26.0 | 2.2 | 100.0 |
| 1964-65 | 6.1 | 8.8 | 21.8 | 21.1 | 11.0 | 29.0 | 2.2 | 100.0 |
| 1965-66 | 6.0 | 8.9 | 22.7 | 19.6 | 11.2 | 29.6 | 2.0 | 100.0 |
| 1966-67 | 7.1 | 9.7 | 19.8 | 17.0 | 12.6 | 31.7 | 2.1 | 100.0 |
| 1967-68 | 8.1 | 9.8 | 16.1 | 19.0 | 14.9 | 29.7 | 2.4 | 100.0 |
| 1968-69 | 8.4 | 9.8 | 17.6 | 19.0 | 16.0 | 26.8 | 2.4 | 100.0 |
| 1969-70 | 6.7 | 9.7 | 15.6 | 21.1 | 19.8 | 24.3 | 2.8 | 100.0 |
| 1970-71 | 8.2 | 10.5 | 14.3 | 17.6 | 20.9 | 25.6 | 2.9 | 100.0 |
| 1971-72x | 8.3 | 10.1 | 14.3 | 15.6 | 17.4 | 31.8 | 2.5 | 100.0 |
| 1972-73* | 6.1 | 8.3 | 22.7 | 21.2 | 19.2 | 20.6 | 1.9 | 100.0 |
The following diagram shows farming income for the farming groups.
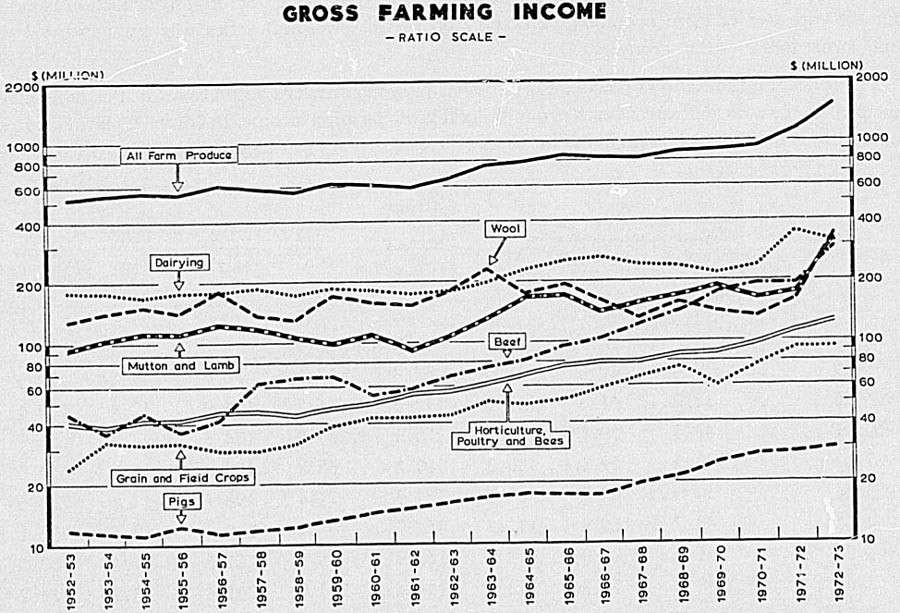
INDEXES OF VALUE AND VOLUME OF FARM PRODUCTION—Index numbers have been compiled showing the movements in value of gross farming income and volume of farm production, both in total and for component groups. The value of gross farming income is measured at prices current in each particular year. For the compilation of index numbers of volume of farm production, computations have been made for each year showing what the aggregate annual values would have been had the 1938-39 prices been constant throughout the period. From the resultant aggregates, index numbers have been compiled which measure the movements in the volume of production (for, since prices were assumed to be constant, volume is the only variable factor in the aggregates). In the following table index numbers of value and volume on the base: 1938-39 (=100) are given, and these give a clearer idea of the extent of year-to-year change.
| Year | Grain and Field Crops | Horticulture, Poultry, and Bees | Wool | Mutton and Lamb | Beef | Dairying | Pigs | All Farm Produce |
|---|---|---|---|---|---|---|---|---|
| *Provisional. | ||||||||
| INDEX NUMBERS OF VALUE | ||||||||
| 1938-39 | 100 | 100 | 100 | 100 | 100 | 100 | 100 | 100 |
| 1955-56 | 343 | 330 | 769 | 457 | 279 | 313 | 258 | 397 |
| 1960-61 | 449 | 400 | 851 | 448 | 417 | 326 | 296 | 440 |
| 1962-63 | 462 | 452 | 970 | 442 | 521 | 319 | 333 | 468 |
| 1963-64 | 532 | 495 | 1,238 | 538 | 564 | 350 | 354 | 547 |
| 1964-65 | 517 | 552 | 929 | 684 | 661 | 405 | 365 | 567 |
| 1965-66 | 544 | 603 | 1,046 | 684 | 731 | 444 | 363 | 611 |
| 1966-67 | 623 | 634 | 879 | 575 | 793 | 461 | 360 | 591 |
| 1967-68 | 718 | 633 | 709 | 637 | 926 | 428 | 405 | 586 |
| 1968-69 | 795 | 686 | 839 | 689 | 1,080 | 419 | 443 | 634 |
| 1969-70 | 644 | 691 | 750 | 770 | 1,346 | 384 | 514 | 640 |
| 1970-71 | 822 | 778x | 715 | 674 | 1491x | 423x | 566x | 670 |
| 1971-72x | 1,000 | 900 | 869 | 716 | 1,490 | 633 | 585 | 807 |
| 1972-73* | 1,005 | 1,004 | 1,871 | 1,332 | 2,245 | 557 | 616 | 1,099 |
| Year | Grain and Field Crops | Horticulture, Poultry, and Bees | Wool | Mutton and Lamb | Beef | Dairying | Pigs | All Farm Produce |
|---|---|---|---|---|---|---|---|---|
| *Provisional. | ||||||||
| INDEX NUMBERS OF VOLUME | ||||||||
| 1938-39 | 100 | 100 | 100 | 100 | 100 | 100 | 100 | 100 |
| 1955-56 | 108 | 169 | 143 | 152 | 150 | 131 | 87 | 139 |
| 1960-61 | 179 | 176 | 183 | 199 | 172 | 143 | 92 | 166 |
| 1962-63 | 195 | 225 | 197 | 211 | 208 | 144 | 110 | 178 |
| 1963-64 | 215 | 249 | 194 | 219 | 195 | 149 | 111 | 184 |
| 1964-65 | 202 | 260 | 196 | 221 | 206 | 158 | 101 | 189 |
| 1965-66 | 219 | 279 | 222 | 228 | 209 | 167 | 91 | 200 |
| 1966-67 | 231 | 288 | 222 | 246 | 235 | 167 | 80 | 207 |
| 1967-68 | 279 | 291 | 225 | 256 | 250 | 165 | 90 | 213 |
| 1968-69 | 315 | 294 | 227 | 256 | 272 | 168 | 80 | 218 |
| 1969-70 | 250 | 319 | 224 | 264 | 306 | 152 | 92 | 213 |
| 1970-71 | 301 | 349 | 228 | 253 | 317 | 149 | 106 | 217 |
| 1971-72x | 331 | 375 | 220 | 274 | 288 | 162 | 97 | 228 |
| 1972-73* | 314 | 374 | 211 | 269 | 338 | 155 | 79 | 224 |
Final figures for 1971-72 show that increases occurred in the value index for all but the beef group. These increases resulted in a substantial rise of 20.4 percent in the index for all farm produce. Although there were decreases in the volume index for three groups—wool, beef, and pigs—the index for all farm produce increased by 5.1 percent.
Provisional estimates of the value index for 1972-73 show that returns from all groups except dairying increased, resulting in an estimated rise of 36.2 percent in the index for all farm produce. In the volume index for 1972-73 the only group in which the index increased was the beef group. The volume index for all farm produce is estimated to have declined by 1.8 percent. This index has increased in every year since 1938-39, except the years 1969-70 and 1972-73. In both these years the decreases can be attributed to the severe droughts that occurred.
Over the 34-year period, the average annual compound rate of increase in the volume series has been 2.4 percent. For the latest 5 years the average annual compound rate of increase has been 1.0 percent.
The following table shows, in quinquennial periods, the proportions of gross farming income derived from exports of farm produce and from local consumption. A description of the methods of estimation was given in the 1967 and earlier issues of the Yearbook.
| Gross Farming Income | 1941-42 to 1945-46 | 1946-47 to 1950-51 | 1951-52 to 1955-56 | 1956-57 to 1960-61 | 1961-62 to 1965-66 | 1966-67 to 1970-71 |
|---|---|---|---|---|---|---|
| Derived— | percent | |||||
| From exports | 67 | 71 | 70 | 68 | 65 | 63 |
| From New Zealand consumption | 33 | 29 | 30 | 32 | 35 | 37 |
| Totals | 100 | 100 | 100 | 100 | 100 | 100 |
DAIRY PRODUCTION—The next table shows the estimated production and utilisation of milkfat during each of the last six seasons. (Source: New Zealand Dairy Board.)
| Utilisation of Milkfat | 1968-69 | 1969-70 | 1970-71 | 1971-72 | 1972-73 | 1973-74‡ |
|---|---|---|---|---|---|---|
*Includes small quantities of creamery fat used in whey buttermaking. †Including residual fat in skim milk from home separation. ‡Provisional. | ||||||
| tonnes(000) | ||||||
| Creamery buttermaking* | 220.2 | 194.3 | 190.1 | 203.0 | 193.1 | 176.6 |
| Cheesemaking | 38.1 | 39.8 | 43.0 | 41.4 | 39.8 | 35.1 |
| Whole-milk products | 8.5 | 9.8 | 10.6 | 13.6 | 13.7 | 16.1 |
| Total | 266.8 | 243.9 | 243.7 | 258.0 | 246.6 | 227.8 |
| Residual fat in skim-milk products | 2.9 | 2.5 | 2.5 | 2.8 | 2.3 | 2.1 |
| Total processed by dairy factories | 269.7 | 246.4 | 246.3 | 260.8 | 248.9 | 229.9 |
| Consumed as milk, cream, or ice cream | 20.1 | 20.7 | 21.1 | 21.6 | 22.1 | 22.4 |
| Fed to stock† | 7.9 | 8.0 | 8.9 | 9.0 | 9.0 | 8.6 |
| Wastage | 3.0 | 2.8 | 2.8 | 2.9 | 2.8 | 2.8 |
| Total production “at pail” | 300.7 | 277.9 | 279.1 | 294.3 | 282.8 | 263.7 |
Production by dairy factories during the last six seasons is set out in the following table.
| Product | 1968-69 | 1969-70 | 1970-71 | 1971-72 | 1972-73 | 1973-74† |
|---|---|---|---|---|---|---|
*Creamery and whey combined, production of the latter running at slightly more than 1 percent. †Provisional. | ||||||
| tonnes(000) | ||||||
| Butter* | 271.3 | 239.8 | 232.8 | 248.9 | 242.0 | 218.5 |
| Cheese | 97.6 | 100.2 | 107.9 | 104.3 | 101.1 | 89.0 |
| Skim-milk powder | 135.6 | 112.3 | 124.9 | 197.0 | 189.2 | 194.1 |
| Casein, acid | 65.1 | 58.8 | 48.1 | 35.6 | 39.9 | 30.1 |
| Casein, rennet | 3.7 | 4.2 | 7.6 | 4.7 | 6.4 | 5.1 |
| Buttermilk powder | 24.1 | 20.9 | 19.0 | 22.5 | 22.4 | 19.0 |
| Condensed and powdered whole milk | 17.3 | 23.4 | 25.5 | 38.4 | 35.0 | 50.3 |
| Lactose | 8.7 | 8.8 | 9.2 | 10.0 | 9.1 | 8.0 |
| Totals | 623.4 | 568.4 | 575.0 | 661.4 | 645.1 | 614.1 |
The butter produced in New Zealand is of a salted type and, because the cows are fed almost entirely on grass, it has a high carotene content which makes it yellower than the butter from countries where cows are fed indoors for much of the year. Most of the cheese exported is a cheddar. Milk powders include those made from whole milk or from separated milk and buttermilk, by-products of buttermaking. Lactose is made from whey, a by-product of cheesemaking. At one time skim milk, buttermilk, and whey were almost entirely fed to pigs, but in recent years more has been dried to produce powder.
The following table gives estimates, derived by the New Zealand Dairy Board, of the average milkfat production per cow “at the pail”.
| Year | Dairy Cows in Milk | Average Production per Cow† |
|---|---|---|
* Provisional. †Including an allowance for cows milked on small holdings not covered by the annual farm census. | ||
| (000) | kg | |
| 1963-64 | 2,011 | 131 |
| 1964-65 | 2,032 | 136 |
| 1965-66 | 2,088 | 140 |
| 1966-67 | 2,131 | 138 |
| 1967-68 | 2,232 | 129 |
| 1968-69 | 2,304 | 130 |
| 1969-70 | 2,321 | 120 |
| 1970-71 | 2,239 | 125 |
| 1971-72 | 2,200 | 133 |
| 1972-73 | 2,190 | 129 |
| 1973-74* | 2,140 | 121 |
Herd sizes have increased as suppliers with small herds have ceased production and as dairy farms have been amalgamated. The number of suppliers to dairy factories and milkfat production per supplier is shown in the following table. (Source: N.Z. Dairy Board.)
| Season | Suppliers* at 31 December | Average size of Herd† | Milk fat per Supplier |
|---|---|---|---|
*Does not include town milk suppliers (about 1,800). †Average area of dairy farms estimated at 63 hectares. | |||
| kg | |||
| 1963-64 | 31,700 | 67 | 8,600 |
| 1964-65 | 29,700 | 70 | 9,700 |
| 1965-66 | 27,900 | 76 | 10,400 |
| 1966 67 | 26,300 | 80 | 10,P00 |
| 1967-68 | 25,700 | 86 | 10,700 |
| 1968-69 | 25,000 | 92 | 11,500 |
| 1969-70 | 23,700 | 97 | 11,000 |
| 1970-71 | 21,900 | 100 | 11,700 |
| 1971-72 | 20,800 | 102 | 13,000 |
| 1972-73 | 20,000 | 105 | 12,900 |
| 1973-74 | 19,580 | 108 | 12,700 |
Tanker collection of milk by the dairy factories began in 1951. By 1960 55 percent of the milkfat supplied to dairy factories was received as milk (instead of cream as previously); this increased to 79 percent by 1966 and in 1973-74 was 97 percent. In 1971-72 there were 922 tankers and trailers; they travelled 26.4 million kilometres, collecting daily from 16,501 suppliers.
The following diagram shows the progress of the dairy industry over a long period of years.
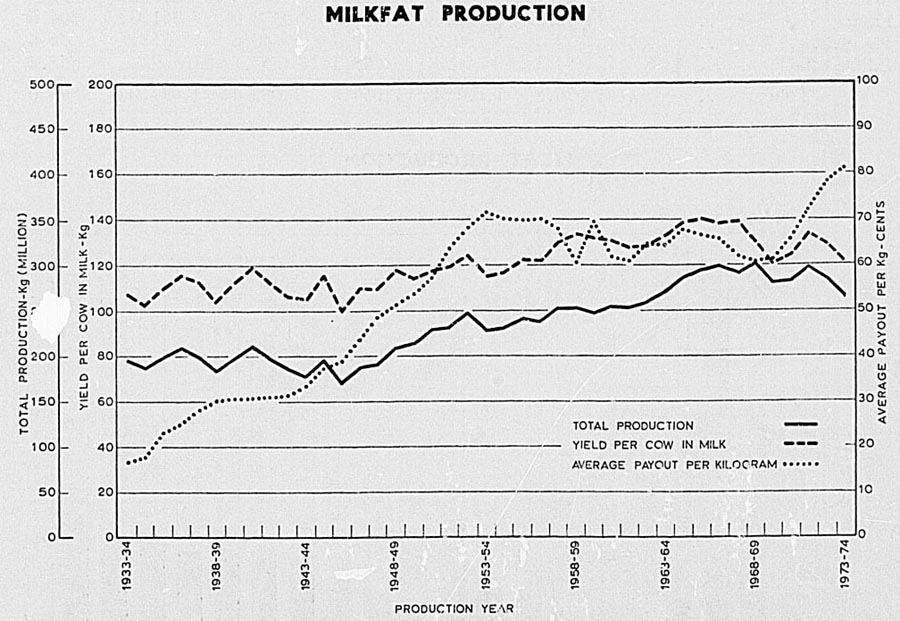
The New Zealand Dairy Board of 13 members functions under the Dairy Board Act 1961. Apart from two Government representatives, all are producer members—three are appointed by the New Zealand Co-operative Dairy Company, eight are elected by other dairy companies, with voting proportionate to the quantity of milkfat received by those companies from their suppliers in six geographically-defined wards.
The Dairy Board's work is divided broadly into two sections; one concerned with the development of the dairy industry and the other with marketing of dairy produce. (This latter activity is described in Section 21A, Marketing of Farm Products.) It is a further function of the board to promote the bobby calf and pig industries.
The Dairy Board has the broad function of linking manufacturing plans and growth with export market requirements. It is responsible by statute for the purchase and sale of export dairy products and for the development, in all respects, of the dairy industry. Since the board is the sole purchaser of produce for export, this purchasing power helps to link manufacturing plans with commercial reality.
MILK PRODUCTION—The administration and organisation of the town milk supply is the responsibility of the New Zealand Milk Board (see Section 21A).
During the year ended August 1973, town milk suppliers provided 142.2 million gallons of milk. Of this, 104.4 million gallons went to the treatment stations and eventually reached the consumer in the form of 86.6 million gallons of pasteurised milk and 1.8 million gallons of sweet cream. The balance of the total production went to dairy factories (36.3 million gallons), to the manufacture of ice cream, yoghurt, and cottage-cheese (1.4 million gallons), and for sale as raw milk (85,914 gallons).
MEAT PRODUCTION—The following table shows in summary form production of meat. Figures are shown at bone-in weights for years ended September.
| Product | 1968-69 | 1969-70 | 1970-71 | 1971-72 | 1972-73 | 1973-74* |
|---|---|---|---|---|---|---|
| *Estimated. | ||||||
| tonnes(000) | ||||||
| Beef | 349.7 | 366.7 | 372.1 | 389.6 | 423.8 | 377.9 |
| Veal | 26.7 | 26.1 | 21.1 | 20.3 | 21.7 | 26.8 |
| Mutton | 199.9 | 199.9 | 204.9 | 195.8 | 215.1 | 192.9 |
| Lamb | 362.8 | 362.6 | 358.9 | 378.9 | 341.0 | 304.6 |
| Pig meat | 37.0 | 39.2 | 42.3 | 40.6 | 35.3 | 34.4 |
| Edible offal | 54.2 | 56.9 | 55.3 | 57.1 | 60.2 | 53.4 |
| Totals | 1,030.3 | 1,051.4 | 1,054.5 | 1,082.4 | 1,097.0 | 990.0 |
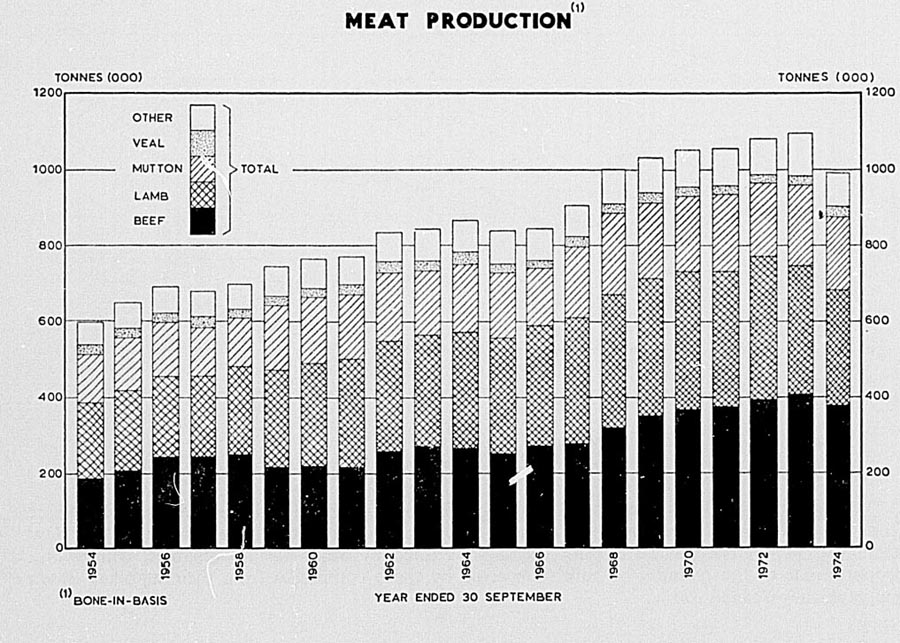
PRODUCTION FOR EXPORT—Production of meat for export is shown in the following table.
| Product | 1970-71 | 1971-72 | 1972-73 | 1973-74 |
|---|---|---|---|---|
| *Including cuts. | ||||
| tonnes(00) | ||||
| Beef— | ||||
| Chilled | 0.7 | 0.7 | 1.4 | 1.8 |
| Bone-in | 11.0 | 8.3 | 5.1 | 2.4 |
| Boneless | 131.8 | 137.0 | 161.2 | 130.1 |
| Cuts | 28.9 | 31.7 | 30.4 | 26.7 |
| Veal* | 7.5 | 8.0 | 7.8 | 10.0 |
| Mutton— | ||||
| Wether* | 4.5 | 2.8 | 2.8 | 1.9 |
| Ewe | 104.4 | 97.8 | 118.7 | 112.1 |
| Lamb | 308.0 | 307.7 | 273.0 | 235.2 |
| Lamb cuts | 26.7 | 39.7 | 32.4 | 35.1 |
| Pork | 0.7 | 0.3 | 0.1 | 0.2 |
| Offal | 57.7 | 60.7 | 65.2 | 54.5 |
| Totals | 681.9 | 695.0 | 698.3 | 610.0 |
There is considerable potential for expansion in lamb and mutton processing given adequate labour and plant and, in the case of lamb, some change in market requirements. Cutting and boning add significantly to the value of meat otherwise exported in carcass form and, in addition, there is a substantial freight saving.
The total number of lambs killed during the season ended September 1973 was 26,789,000, a 4.2 percent fall on the previous years total of 27,948,000. Sheep slaughterings reached a record total of 11,099,000 compared with 9,378,000 the previous season, while cattle slaughterings (excluding vealers), at 2,044,000 compared with 1,784,000 in 1971-72, also continued to rise.
The following table gives livestock slaughter statistics at meat export works and abattoirs omitting killings on farms and in rural slaughterhouses.
| Animals | 1969-70 | 1970-71 | 1971-72 | 1972-73 | 1973-74 |
|---|---|---|---|---|---|
*Excludes lambs. †Excludes calves. | |||||
| (000) | |||||
| Lambs | 27,434 | 27,118 | 28,842 | 26,683 | 22,992 |
| Ewes | 1,105 | 7,033 | 6,736 | 8,635 | 7,116 |
| Other sheep | 1,965 | 2,237 | 1,876 | 1,687 | 1,645 |
| Totals, sheep* | 9,070 | 9,270 | 8,612 | 10,322 | 8,761 |
| Claves (up to 60 lbs) | 1,199 | 985 | 979 | 972 | 1,152 |
| Vealers (61-350 lbs) | 109 | 89 | 78 | 88 | 92 |
| Heifers | 212 | 216 | 201 | 216 | 248 |
| Steers | 650 | 663 | 719 | 737 | 649 |
| Cows | 828 | 766 | 619 | 820 | 675 |
| Bulls | 132 | 170 | 234 | 258 | 217 |
| Totals, cattle† | 1,930 | 1,903 | 1,849 | 2,119 | 1,881 |
| Pigs | 806 | 901 | 878 | 751 | 747 |
About two-thirds of lambs tailed are killed during the season, and some 90 percent of the lamb meat is exported.
Meat consumed in New Zealand represents approximately one-third of total production; quantities per head are shown in section 24, Consumption of Food.
Producer Control—The principle of producer control of the export meat industry was established in 1922. A system was created in which the processing and exporting companies—public, private, and co-operative—worked under the overall direction of the Meat Producers Board. This system over the years has given the producer a choice of the people he did business with and a choice of methods of selling his stock. That choice for the producer meant that he obtained full benefit from a competitive situation. The system has also given the producer, through his representatives on the Meat Producers Board, the chance to influence through sales promotion the sale of his meat right down to the retail shops half a world distant. The board has controlled shipping to place supplies and has advertised widely, especially in Britain; it controls its own system of grading export meat; and it is general spokesman for the industry. The activities of the Meat Producers Board were the subject of a special article in the 1973 issue of the Yearbook.
The Meat Producers Board, the Wool Board, and the Wool Marketing Corporation are in the position of having to make not only long-term decisions but also to meet day-to-day situations as they occur. This they do with the aid of their own technical staff and through an economic service which is in close and constant contact with the sheep farming industry throughout New Zealand.
WOOL PRODUCTION—New Zealand holds third place in the world as a producer of wool, and second place as an exporter. Production is mainly of cross-bred wool.
A major feature of the 1973-74 season was a sharp decline in market prices for wool from a peak early in the season only exceeded during the Korean war boom of the early 1950s, to levels at the end of the season which were the lowest in almost 2 years.
The following table shows for the last 11 seasons the total wool production (greasy basis), the movement in the average price per kilogram of wool (greasy basis), and the estimated total value of wool production (obtained by valuing the production estimate at the overall price per kilogram of greasy wool sold at auction).
| Season Ended 30 June | Total Wool Production (Greasy Basis) | Average Price Per Kilogram (Greasy Basis) | Estimated Value or Total Wool Production |
|---|---|---|---|
| tonnes(000) | cents | $(m) | |
| 1964 | 279 | 101.17 | 283.0 |
| 1965 | 283 | 77.40 | 218.8 |
| 1966 | 315 | 76.46 | 241.0 |
| 1967 | 322 | 64.77 | 208.4 |
| 1968 | 330 | 50.42 | 166.5 |
| 1969 | 332 | 61.86 | 205.3 |
| 1970 | 328 | 56.48 | 185.3 |
| 1971 | 334 | 53.42 | 178.4 |
| 1972 | 322 | 66.46 | 214.2 |
| 1973 | 309 | 143.96 | 444.5 |
| 1974 | 285 | 139.19 | 396.4 |
On account of lack of information on changes in stocks of wool on farms, the above figures of production should not be taken as precise measures of actual production in each season.
Wool Used by Local Mills—Wool purchases by local mills have been showing an upward trend in recent years. The quantity taken in 1974 was over twice the quantity five years earlier. As a customer for New Zealand wool, the home market in 1974 was second only to the United Kingdom. Local consumption in recent years is shown in the following table.
| Year Ended 30 June | Quantity Used (Greasy Basis) |
|---|---|
| tonnes (000) | |
| 1964 | 9.2 |
| 1965 | 10.1 |
| 1966 | 10.6 |
| 1967 | 10.2 |
| 1968 | 11.3 |
| 1969 | 14.6 |
| 1970 | 17.4 |
| 1971 | 21.9 |
| 1972 | 24.8 |
| 1973 | 29.7 |
| 1974 | 33.7 |
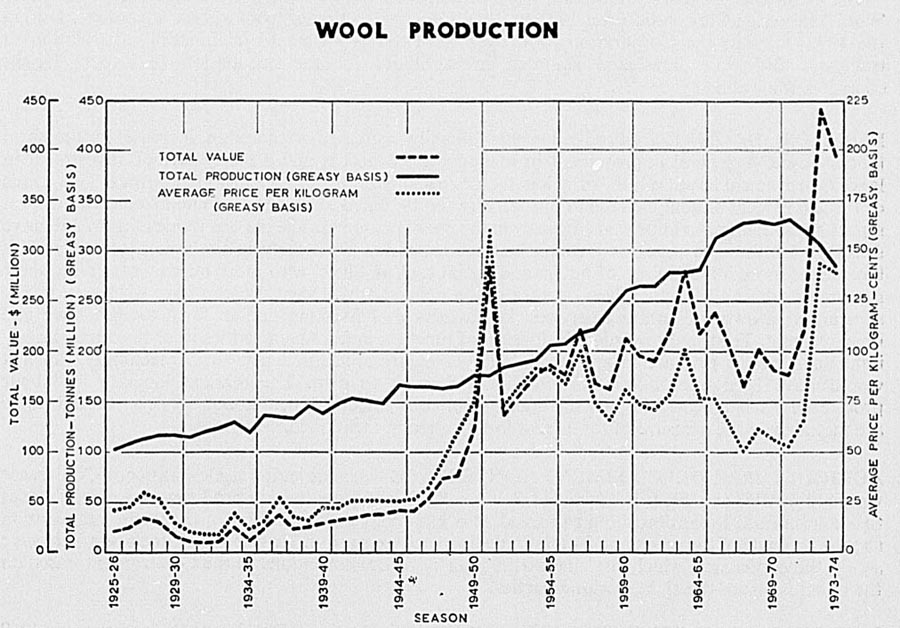
The New Zealand Wool Board was set up under the Wool Industry Act 1944. There are eight members—six elected representatives of sheep farmers and two Government-appointed members. The Director-General of Agriculture and Fisheries is an associate member. The board's functions are: to promote the use of New Zealand wool; to promote scientific or industrial research into all aspects of the industry: to undertake joint projects with the Meat and/or Dairy Boards which may benefit the wool production industry; and to advise Government on the affairs of the industry. The board may exercise further functions in production and marketing, through regulation. Income is derived from three sources, namely, from a levy on all wool, either exported or processed in New Zealand; from interest earnings on funds held by the Wool Board; arid from the Government. For the 1974-75 season the levy was 3 percent of sale value. The Government meets one-half of the costs of wool research in New Zealand.
More than four-fifths of the board's income is contributed to the work of the International Wool Secretariat. In 1973-74 this contribution amounted to $9.6 million, of which $4.8 million was met by a Government grant. The IWS is a partnership of the wool boards of four grower countries—New Zealand, Australia, South Africa, and Uruguay. Its functions are the promotion of wool in consuming markets often in conjunction with manufacturers and retailers; technical service to manufacturers; quality control of manufacturers licensed to use the Woolmark and Woolblendmark trade marks; and research and product development. The International Wool Secretariat has its headquarters in London and branches in 25 consuming countries.
In New Zealand the board's staff are engaged in local promotion of wool, technical service and quality control to the local industry, and technical promotion overseas. It has a shearing instruction service and staff engaged in packaging, wool transport, wool handling, and economics and marketing research.
The Wool Research Organisation, established in 1960 at Lincoln, Christchurch, conducts fundamental research into wool chemistry, physics, and biosynthesis. It carries out applied research in scouring, new products processing and manufacturing performance, and fibre measurement. In November 1971, a pilot manufacturing plant was completed to aid in the applied research field, especially in the processing of crossbred wool.
The New Zealand Wool Marketing Corporation was established from 1 December 1972 by the Wool Marketing Corporation Act 1972 to develop the marketing of wool to best advantage. During the 1973-74 year, the Corporation took over from the Wool Board its functions in relation to transport and wool flow, and assumed responsibility for the negotiation of export freight contracts for wool.
FARM PRODUCTIVITY—Production has steadily increased without an increase in the farm labour force. A general improvement in management practices and a heavy rate of investment in land improvement have been the principal factors responsible for the expansion of output. Two-thirds of the 2.6 percent annual increase in output between 1920 and 1960 was attributed to increased farm inputs and one-third to improved efficiency in the use of resources. The pattern is one of more intensive farming, for the area used for farming has not expanded since early in the present century. This has meant more intensive use of public and social capital. Since, with more intensive farming, there is a greater demand for any given operation in a defined area, recent decades have witnessed a very substantial growth of contract services for farmers in harvesting and in farm maintenance and improvement. The trend towards this division of function in farming activities was, of course, largely influenced by the production and availability of highly specialised new farm machinery which it would have been uneconomic for individual farmers to own. The marked increase in labour productivity has reflected in part this increase in contracted off-farm labour services, though these are included in the measure" of total farm inputs already mentioned.
AGRICULTURAL DEVELOPMENT CONFERENCE—An Agricultural Development Conference was held in 1963 and 1964. It was called as a result of the feeling in both producer and official circles that agricultural expansion should proceed at a more rapid rate and that a thorough examination should be made of the economic factors impeding such expansion. Targets in livestock numbers were set by the conference, which also made a number of recommendations to the Government based on the conclusions of the eight working parties.
NATIONAL DEVELOPMENT CONFERENCE—At the National Development Conference in 1969 the targets established by the Agricultural Development Conference were reviewed after working parties had examined commodity developments, capital requirements, and manpower requirements of farming. Further projections were made to 1972-73 and to 1978-79. In addition to pastoral production, agriculture was extended to include grains and seeds and horticulture. For the period ending 1978-79, the total agricultural contribution to national earnings was projected to increase by 5.1 percent annually. This required an increase in livestock numbers at a rate of 2.6 percent a year,reaching 111 million ewe equivalents in 1972-73, and 130 million ewe equivalents in 1978-79. At a further National Development Conference in March 1972 the planning period was extended to 1981-82. The earnings from agriculture in current money value were projected to increase from $942 million in the base year 1969-70 to $1,949 million in 1981-82.
In the event stock numbers had stabilised at around 100 million ewe equivalents by 1972-73 but the level of receipts reached $1,333 million in that season compared with the target figure of $1,137 million.
AGRICULTURAL PRODUCTION COUNCIL—This council was set up following a recommendation of the Agricultural Development Conference in 1964. It comprises the Minister of Agriculture and Fisheries (chairman), the Director-General of Agriculture and Fisheries (deputy-chairman), the Dominion President, Federated Farmers of New Zealand (Inc.), the chairmen of the three producer boards (Dairy, Meat, and Wool), the Secretary to the Treasury, and the Secretary of Industries and Commerce. As a result of a review in 1973-74 the chairman of the Horticulture Committee was added to the membership of the council.
The Agricultural Production Council is now responsible to the Cabinet Committee on Policy and Priorities through the Minister of Agriculture and Fisheries. The council's role remains unchanged from that obtaining as a sector council of the former National Development Council, although the standing committee structure has been disbanded except for horticulture.
The council has 22 District Agricultural Advisory Committees which bring together at local level all the organisations which service agriculture in that region. These committees review the progress of agriculture in their district; identify factors limiting production and propose remedial measures; ensure that farmers and their advisers are fully aware of development incentives and concessions and the availability and terms of finance; and keep the council advised of local problems and circumstances.
MINISTRY OF AGRICULTURE AND FISHERIES—The Ministry of Agriculture and Fisheries was formed in 1972 by grafting the fisheries management and research divisions of the former Marine Department on to the Department of Agriculture. The principal functions of the ministry are: to promote and to encourage the development of all phases of the agricultural, pastoral, and horticultural industries in New Zealand, including the stock, poultry, fruit, vegetable, flax (Phormium tenax), tobacco, hops, and honey production industries, with a view to maintaining and improving the quality of the products derived from those industries and increasing the production of those products; and to promote, control and encourage the marketing and sale of those products.
The Ministry of Agriculture and Fisheries provides a service of which the main object is the advancement of the interests of agriculture and fisheries. Under a Director-General of Agriculture and Fisheries there are Divisions of Animal Health, Meat, Dairy, Advisory Services, Agricultural Research, Fisheries Research, Fisheries Management, Economics, and Administration. Though the service is primarily advisory, the ministry administers a number of Acts and regulations.
Animal Health—The major objective of the Animal Health Division is to improve health through control measures and inspection services. The division's veterinarians examine animals and certify them as suitable for export; they maintain surveillance and quarantine procedures which reduce the risk of introducing foreign diseases with import of animals and animal products. The division operates quarantine stations for imported livestock. Five regional animal health laboratories are operated by the division and provide diagnostic support to practitioners and veterinarians of other divisions of the ministry. It also operates a national reference laboratory for infectious diseases and for diagnostic tests of imported and exported animals. A central brucellosis laboratory services the national brucellosis testing scheme.
The division is associated with the Pest Destruction Council through district pest destruction boards, in the destruction of rabbits, hares, opossums, and wallabies.
Meat—The Meat Division is responsible for the inspection of stock intended for slaughter at abattoirs and export meatworks and for the later inspection of the carcasses. It is also responsible for the standard of hygiene at these establishments as well as in export and domestic meat packing houses, rural slaughterhouses, game packing houses, and export fish packing houses. Veterinary certificates for meat, game, and fish exported are given by veterinary staff of the division, and meat-inspection staff are responsible for grading meat for local consumption produced at abattoirs and they supervise the grading of meat for local consumption at export meatworks.
Dairy Produce—Instruction in the manufacture of all dairy products is given by the Dairy Division. Dairy produce is inspected and graded before shipment and on arrival in United Kingdom. The division is responsible also for the registration of town-supply farm dairies and provides technical advice on market milk treatment. Laboratories at Auckland, New Plymouth, Mount Maunganui, Wellington, and Hamilton provide comprehensive examination of dairy products as a background to quality control. All dairy farms are visited regularly by farm dairy instructors. Dairy advisory officers give specialist advice at farms and dairy factories. The division licenses and registers dairy factories and approves their design, general suitability and economic justification.
Advisory Services to Farmers—The Advisory Services Division provides advisory services to farmers and horticulturalists and undertakes the various activities such as plant diagnostic, quarantine, testing, and field inspection services needed to meet the ministry's responsibilities under the Plants Act 1970.
Graduate advisory officers, servicing districts containing about 700 farmers, are backed by specialists in the fields of agricultural engineering, animal husbandry, and farm economics. Extension work operates through individual farm visits, groups techniques, and the mass media. There are four commercial demonstration farms at Kaikohe, Wairoa, Hindon, and Te Anau, and co-operative demonstration projects are undertaken on selected farms.
Outside its extension work, this division is responsible for certification and testing of herbage and cereal seeds, and the Flock House and Telford Farm Training Institutes at Bulls and Balclutha.
Poultry farmers also receive specialist advice.
The advisory service extends to commercial producers of pip, stone, citrus, and subtropical fruits, vegetables, berry fruits, cut flowers, nursery stock, grapes and wine, bees and honey, and to a limited extent, hops and tobacco. It covers all aspects of production—soil management, disease and pest control, and crop production and handling. Advisory officers demonstrate and adapt research results in districts for all horticultural crops and beekeeping. Experimental and demonstration areas are sited at Kerikeri and Manutuke (citrus). More emphasis is being given to commercial horticultural units to assist producers to improve the profitability of their holdings.
Horticultural inspectors inspect commercial plant nurseries, market gardens, and orchards for plant pests and diseases to restrict their spread. They advise producers on dates for picking, and give instruction in grading and packing fruit for export and local markets. They also inspect fruit, vegetables, and plant material for export from New Zealand. All pip fruit delivered to the New Zealand Apple and Pear Marketing Board for local and export markets is inspected by horticultural inspectors. An orange-quality testing service is provided for the Citrus Marketing Authority and a honey-grading service for the Honey Marketing Authority. All honey for export is inspected before certificates are issued.
Information is supplied for marketing organisations in the form of seasonal forecasts of production. Periodic surveys are made of orchards, market gardens, and nurseries.
Agricultural Research—All research stations of the ministry are under the control of the Director of Agricultural Research, with headquarters at Ruakura. Directors of Animal Research, Soil Research, and Field Research are all stationed at Ruakura. Irrigation research is done at Winchmore, and other research establishments are at Whatawhata (near Hamilton), which specialises in hill-country research, and at Invermay. Research work on animal diseases is centred largely at Wallaceville under a director. Horticultural research is centred at Levin and viticultural research at Te Kauwhata. Research activities are more fully discussed in Section 7B, Science and Scientific Services.
Economics—The Economics Division deals with all aspects of agricultural policy including international trade and trade negotiations in relation to agriculture, international quality standards, liaison with international agencies, the analysis of national production and marketing policies, and the general economic position of farmers. Other functions include the economic appraisal of projects associated with agricultural development and resource use and the economics of the fishing industry.
Port Agriculture Service—The Port Agriculture Service is a uniformed branch of the ministry under the control of a superintendent directly responsible to the Director-General. Its chief responsibility is to prevent the introduction into New Zealand of serious animal and plant diseases and pests. Officers of this service are located at ports and international airports, and deal with all items of concern to agriculture from overseas.
Pasture Grasses—Researches and experiments in regard to pasture grasses are regular features of the activities of both the Ministry of Agriculture and Fisheries and the Department of Scientific and Industrial Research. These experiments, which extend right on to individual farms throughout New Zealand, and are conducted in co-operation with the farmers themselves, are wide in their application, and cover all the major phases of pasture management, dealing in particular with such items as pasture mixtures, suitability as to soil types, methods of establishment and management, the efficient use of fertilisers, etc.
TOPDRESSING—Topdressing with artificial fertilisers has been an important factor in the intensification of grassland farming. Most New Zealand soils need fertilisers, especially phosphates. Superphosphate has been produced in New Zealand in increasing quantities since the 1880s, using rock phosphates from Nauru and Ocean Islands; Christmas Island is now an increasingly important source of supply. Over the years there has been a marked changeover from straight superphosphate as the principal fertiliser for grassland and crops—usual variants are serpentine superphosphate or aerial superphosphate, or a mixture of superphosphate with potash, additional sulphur or a trace element. Production of chemical fertilisers in 1973-74 totalled 2,533,000 tonnes compared with 2,502,000 tonnes in 1972-73. Approximately half of the sown grassland receives fertiliser annually, with about half the fertilised area covered by aerial distribution; about one-third of the quantity is distributed by aeroplanes from 8,000 airstrips. Total expenditure on topdressing of farm land comes to about $50 million annually, including fertiliser transport and application costs. New Zealand occupies less than 0.3 percent of the world's land area, yet this country uses 2 percent of the world's fertiliser production.
Achievement of the increased rate of development recommended by the Agricultural Development Conference is estimated to require an annual increase of fertiliser usage of about 7 percent. The greater input will be needed because, as production develops, fertilisers will be used on more difficult country and on land on which production has already been intensified.
The use of lime to correct soil acidity and increase the availability of trace elements grew steadily from 1890 to a peak of 1.5 million tonnes in 1945. Since then the usage has dropped to less than 1 million tonnes annually; there is now a more judicious application of lime and a greater use of trace elements, such as molybdenum, according to proved soil needs.
The following table gives particulars of areas of grassland topdressed during the latest 6 years.
| Year* | Area Topdressed | Quantity of Fertiliser and Lime Spread | ||||
|---|---|---|---|---|---|---|
| Fertiliser Only | Lime Only | Fertiliser and Lime Together | Total Area Topdressed | By Ordinary Means | By Aeroplanes | |
| *Year ended 31 January to 1970 and 30 June thereafter. | ||||||
| ha (000) | ha (000) | ha (000) | ha (000) | tonnes(000) | tonnes(000) | |
| 1967 | 4,800.8 | 140.7 | 568.7 | 5,510.2 | 1,864.8 | 1,038.7 |
| 1968 | 4,345.1 | 131.7 | 472.3 | 4,949.1 | 1,682.6 | 854.1 |
| 1969 | 4,508.0 | 137.5 | 477.3 | 5,122.8 | 1,755.3 | 833.0 |
| 1970 | 4,853.8 | 165.4 | 632.9 | 5,652.1 | 2,003.8 | 951.3 |
| 1971 | 4,758.3 | 171.8 | 695.7 | 5,625.8 | 2,218.9 | 930.4 |
| 1972 | 4,758.7 | 187.5 | 741.7 | 5,688.0 | 2,189.6 | 1,020.2 |
Though topdressing in the past was practically confined to sown grasses on the flat and gently undulating country, the application of fertilisers to the surface-sown hill-country pastures in increasing quantities from aircraft has followed from the development of commercial aerial top-dressing operations since 1949. Further information in this connection is contained in Section 11D.
IRRIGATION—Most of New Zealand soils have a seasonal moisture deficiency and require irrigation to reach their maximum productivity. Many soils presently farmed under dry land conditions are capable of substantially increased production under irrigation.
In Central Otago the Ida Valley scheme serving an area of 5,000 hectares was completed in 1917. The Upper Waitaki serving an area of 2,000 hectares was completed in 1970 and construction of the Lower Waitaki scheme to serve 14,000 hectares is proceeding.
In Canterbury work is in progress on the Morven-Glenavy scheme north of the Waitaki River to serve an area of 9,700 hectares.
Major irrigation schemes are financed, constructed, and operated by the Government.
Charges for water supplied to farms are fixed so than over a period of 40 years the revenue should meet the costs of operation and maintenance or periodic renewal of items of capital works, and of interest on one-quarter of the capital cost of the scheme.
In addition to these large, Government-controlled schemes, irrigation is used on single farms or orchards in many parts of New Zealand, in particular, in Hawke's Bay, Nelson, and Marlborough. Water is generally drawn from underground sources, or pumped from rivers and drains, and applied by spraying.
The Ministry of Works and Development is extending its activities for the investigation, design, and construction of new irrigation schemes, including the co-ordination of other Government and local agencies. To qualify as an approved scheme an irrigation proposal must, in general, include a minimum of four farm businesses and an area to be irrigated of not less than 400 ha. and also meet agreed engineering and benefit/cost standards.
Approved irrigation schemes are financed on a basis of the Government's providing the full capital cost of all off-farm works and approved fixed on-farm works, and half of the cost of off-farm distribution works within the irrigable area to be recovered. The Rural Banking and Finance Corporation takes security for the full capital cost of approved fixed on-farm works. Two-thirds of the cost is recovered by way of mortgage and one-third is treated as a suspensory loan. The loan will be written off at the expiration of 7 years.
Approved irrigation development not qualifying as a scheme will qualify for Rural Banking and Finance Corporation loans of 100 percent with interest and capital repayments deferred, if necessary, during the initial 4 years of development.
Local irrigation committees have been set up to reappraise all existing schemes and, through the National Water and Soil Conservation Authority, to advise the Minister of Works and Development on upgrading, operation, and maintenance. There are also official irrigation committees for each of the seven Ministry of Works districts. These district committees are convened and chaired by the district commissioner of works and include representatives of Ministry of Agriculture and Fisheries, Rural Banking and Finance Corporation and regional water boards. Other members may be co-opted if and when required.
The area and type of land irrigated during the year ended 30 June 1972 are analysed by statistical area in the following table.
| Statistical Area | No. of Holdings | Grassland | Commercial | Other Crops | Other Land | Total | |
|---|---|---|---|---|---|---|---|
| Fruit | Vegetables | ||||||
| ha | ha | ha | ha | ha | ha | ||
| Northland | 171 | 1,266 | 337 | 112 | 20 | 66 | 1,801 |
| Central Auckland | 230 | 1,031 | 98 | 888 | 34 | 4 | 2,055 |
| South Auckland— | |||||||
| Bay of Plenty | 182 | 1,597 | 83 | 48 | 58 | 27 | 1,813 |
| East Coast | 53 | 191 | 78 | 149 | 25 | 6 | 449 |
| Hawke's Bay | 416 | 1,376 | 1,314 | 763 | 100 | 47 | 3,600 |
| Taranaki | 68 | 945 | 2 | 9 | 12 | - | 968 |
| Wellington | 252 | 2,458 | 94 | 644 | 98 | 2 | 3,296 |
| North Island | 1,372 | 8,864 | 2,006 | 2,613 | 347 | 152 | 13,982 |
| Marlborough | 161 | 1,326 | 243 | 273 | 792 | 54 | 2,688 |
| Nelson | 512 | 1,260 | 576 | 514 | 1,647 | 15 | 4,012 |
| Westland | 1 | 12 | - | - | - | - | 12 |
| Canterbury | 1,513 | 44,159 | 452 | 1,674 | 12,302 | 483 | 59,070 |
| Otago | 970 | 50,908 | 1,446 | 220 | 1,206 | 658 | 54,438 |
| Southland | 19 | 571 | - | 42 | 60 | - | 673 |
| South Island | 3,176 | 98,236 | 2,717 | 2,723 | 16,007 | 1,210 | 120,893 |
| New Zealand | 4,548 | 107,100 | 4,723 | 5,336 | 16,354 | 1,362 | 134,875 |
SUBSIDIES, GRANTS, ETC.—For many years a number of grants and subsidies have been paid to the farming industry and allied organisations from public funds.
The following table shows the pattern of major payments in recent years.
| Subsidy, Grant, etc. | 1969-70 | 1970-71 | 1971-72 | 1972-73 | 1973-74 | 1974-75* |
|---|---|---|---|---|---|---|
| *Estimates. | ||||||
| $(000) | ||||||
| Lime transport assistance | 88 | 128 | 241 | 456 | 572 | 525 |
| Fertiliser transport subsidy | 5,579 | 7,050 | 8,945 | 12,480 | 11,649 | 10,250 |
| Flood and drought relief | 477 | 3,541 | 313 | 192 | 951 | 300 |
| Weedicide and pesticide subsidy | 3,259 | 4,022 | 4,701 | 5,416 | 2,479 | - |
| Eradication of bovine tuberculosis and brucellosis— | ||||||
| Compensation for condemned animals, loss of production payments, hardship payments, and incidental costs | 1,272 | 1,396 | 2,132 | 3,604 | 2,985 | 3,000 |
| Agricultural pests control | 1,899 | 2,104 | 2,269 | 2,535 | 2,728 | 2,915 |
| Subsidies to nassella tussock boards | 172 | 190 | 224 | 740 | 588 | 607 |
| Subsidies to county councils under the Noxious Weeds Act | 204 | 304 | 161 | |||
| Agricultural Engineering Institute | 125 | 142 | 190 | 223 | 276 | 311 |
| Herd Improvement Council | 97 | 97 | 111 | 120 | 132 | 147 |
| National Hydatids Council | 105 | 106 | 120 | 152 | 201 | 208 |
| Veterinary Services Council | 42 | 48 | 43 | 44 | 57 | 70 |
| Fertiliser price subsidy | - | 5,366 | 13,134 | 19,092 | 8,814 | 9,300 |
| Special Assistance Fund | - | 9,786 | 185 | - | 3 | 3,564 |
| Dairy diversion scheme (beef) | - | 1,134 | 2,049 | 281 | - | - |
| Stock drench subsidy | - | - | 3,591 | 5,152 | 3,097 | - |
| Aerial application of fertiliser and lime subsidy | - | - | 497 | 1,104 | 432 | - |
| Grant to New Zealand Wool Board | - | - | 3,812 | 4,163 | 4,400 | 2,880 |
| Stock retention incentive | - | - | - | 11,871 | 36 | 4 |
| Grants to Dairy Products Development Centre | - | - | - | 75 | 340 | 175 |
Animal Remedies Subsidy—A subsidy was introduced in June 1971 to reduce the cost to farmers of stock drenches. It was terminated in June 1973.
Lime Subsidy—Since 30 November 1959 a subsidy on lime transport has been paid to farmers applying lime to newly developed land which is lime responsive, has not previously been limed, and which is cultivated and sown for the first time; or, if it cannot be cultivated, which receives its first dressing of lime. The rates of subsidy are 3.7c per tonne-kilometre for the first 100 km and 1.2c per tonne-kilometre thereafter.
Fertiliser Price Subsidy—A uniform subsidy of $5 per ton ex-works on all fertiliser was introduced on 6 July 1970. It was increased to $7.50 per tonne in June 1971. From June 1973 it applied to the first 30 tonnes only. From 1 July 1974 a subsidy of $18.25 per tonne has been paid on all fertiliser bought by farmers, without restriction on quantity.
Fertiliser Transport Subsidy—From 1965 there has been a subsidy on the transport of fertiliser (excluding lime). The subsidy is 4.4c per tonne-kilometre for distances up to 30 km, 3.7c per tonne-kilometre between 30 and 160 km, and 2c per tonne-kilometre over 160 km.
Other Items—Most of the remaining items represent attempts to deal with specific problems, such as the eradication of bovine tuberculosis, which are of importance to the whole community but the handling of which would impose a serious burden on individuals or small groups, and the cost of the Government contribution towards running particular organisations, such as the Agricultural Engineering Institute.
In January 1975 the Government announced a scheme of special assistance to farmers. Up to $15 million was made available for wool income stabilisation and up to $35 million for meat income stabilisation. The wool support was to enable a minimum price of 93c a kilogram to apply to wool sold in the 1974-75 season; the meat support involved an extra $1 a lamb on lambs sold to export houses in the 1974-75 season and also a supplement of 60c a lamb on lambs sold by store-stock producers. The ex-factory price of superphosphate was stabilised until the end of the 1975-76 season. Subsidies applied to fertilisers spread between 24 January 1975 and 1 July 1975.
FARM MACHINERY—The following table gives details of farm machinery for those items where comparison is available. The figures relate to holdings of 4 hectares and over.
| Type of Machine | 1960 | 1965 | 1969 | 1970 | 1971 |
|---|---|---|---|---|---|
| Agricultural tractors | 78,415 | 89,431 | 95,421 | 95,502 | 96,666 |
| Milking machines | 36,721 | 32,887 | 29,108 | 27,930 | 25,793 |
| Shearing stands | 61,637 | 65,918 | 71,271 | 71,055 | 72,669 |
| Pick-up balers | 7,932 | 10,247 | 12,380 | 12,618 | 12,926 |
| Side delivery rakes | 21,953 | 24,178 | 25,439 | 25,378 | 25,064 |
| Harvesters— | |||||
| Forage | 1,200 | 4,280 | 5,370 | 5,403 | 5,451 |
| Header | 4,746 | 5,289 | 5,692 | 5,724 | 5,591 |
| Electric fence units | 54,707 | 63,970 | 69,387 | 70,140 | 74,583 |
| Field mowers | .. | .. | 52,175 | 52,005 | 51,008 |
| Ploughs | .. | .. | 42,951 | 42,101 | 41,392 |
| Disc harrows | .. | .. | 33,762 | 32,979 | 32,499 |
The figures show a continuation of the trend towards more intensive mechanisation of farm work that has been in evidence over a considerable period.
Milking Machines—Information concerning milking machines on farms was first collected in 1919, in which year there were 7,577 plants recorded. Since that year the use of milking machines has expanded rapidly. Of the 1,905,534 cows in milk on 31 January 1952, 1,799,375, or 94 percent, were milked by machine. At the end of January 1971 there were 25,793 milking machine plants in use, with a total of 199,887 sets of cups, compared with 27,930 machines and 205,268 sets of cups at 31 January 1970.
Agricultural Tractors—The classes of tractors on farm holdings outside borough boundaries at 31 January 1971 are given in the following table.
| Type | 1970 | 1971 |
|---|---|---|
| Diesel oil— | ||
| Crawler | 7,597 | 7,607 |
| Wheel | 43,260 | 46,313 |
| Totals | 50,857 | 53,920 |
| Petrol or kerosene— | ||
| Crawler | 5,946 | 4,959 |
| Wheel | 38,699 | 37,787 |
| Totals | 44,645 | 42,746 |
GENERAL—Crops grown in New Zealand are in general sufficient to meet domestic needs for agricultural products, apart from tropical and subtropical products such as tea, sugar, cotton, etc.
Local requirements of all the important fruits and berries grown in temperate zones are met by New Zealand orchard production. Citrus fruits arc grown in the subtropical northern portion of the North Island (although in addition substantial quantities of oranges are imported), and grapes are cultivated in certain localities. There is a substantial export trade in apples and pears.
Potato and onion production is normally adequate.
Wheat production fluctuates in relation to price incentives and imports are sometimes necessary.
Animals can be grazed in open pasture for the full 12 months of the year, but the winter growth of grass, except in certain favoured localities, requires to be supplemented in order to keep stock in good condition during the colder months, and in some districts supplementary fodders are necessary in the drier summer months. Hay and silage crops are grown almost exclusively on the farms where they are consumed, though some districts specialise in the growing of certain other supplementary fodder crops. The bulk of the supplementary fodders other than grass and clover, hay, and silage, is grown in the South Island, since the colder climate necessitates more extensive supplementary feeding than in the North Island.
The renewal and extension of pastures require the annual supply of very considerable quantities of grass seed. There is an appreciable export trade in some species of grass seeds.
GEOGRAPHIC DISTRIBUTION—Grain growing is localised to a considerable extent, the Canterbury statistical area, with its fertile plains, supplying more than half of New Zealand's wheat yield, about half of the oats threshed, and over half of the barley yield. In recent years, however, the North Island has grown higher proportions of wheat and barley crops.
Maize growing is largely confined to certain portions of the East Coast (notably Cook County) and South Auckland - Bay of Plenty areas. The growing of peas for threshing is carried out extensively in Canterbury, and to a lesser extent in Marlborough and Wellington, Canterbury alone producing nearly three-quarters of the total yield. About two-thirds of the area closed off for production of grass seed is in the Canterbury district.
The Canterbury statistical area also produces a large proportion of the commercial potato crop, followed by Wellington statistical area, while the growing of potatoes for the early market is of importance in a few relatively frost-free areas, particularly Pukekohe, near Auckland. The Pukekohe district also provides the Auckland area with a considerable portion of its vegetable requirements as well as being the main onion-growing area of the Island. Wellington City draws most of its vegetable supplies from the Otaki and Levin districts, while Ohakune, in the centre of the North Island, with climate and soils suitable for the production of cabbages and broccoli, supplies both Auckland and Wellington with these vegetables Hastings has become a centre for the canning and processing of many vegetables.
In the South Island market gardening is carried on near the cities, and on the rich soils near Christ-church over 405 hectares are devoted to this purpose; also to the immediate south of Oamaru and on the Taieri Plains just south of Dunedin there are other areas aggregating more than 405 hectares. Nelson also produces considerable quantities of fresh and processed vegetables, most of which are marketed in Wellington.
Commercial orchards in New Zealand are largely confined to certain areas suited by climatic and soil conditions. The Nelson and Hawke's Bay districts are notable for their apple and pear orchards, a high percentage of the crops from these districts normally being exported, Central Otago is well suited to the growing of stone fruits, notably apricots. Hawke's Bay and Nelson are also noted for their peach production. In certain particularly warm areas of the North Island with suitable soils citrus fruits are grown, the principal areas being Kerikeri, in Northland; Tauranga, in the Bay of Plenty; and Gisborne.
Grape growing is of importance near Auckland and in Hawke's Bay, and to a lesser extent in South Auckland. Tobacco growing is confined to the Nelson district, hop growing also being concentrated in this area.
The area devoted to each of the principal crops in the 1970-71 season and the percentage distributions for each crop for the North and South Islands are given in the following table.
| Crop | Total Area | Central and South Auckland* | East Coast - Hawke's Bay | Taranaki-Wellington | North Island† | Marlborough-Nelson | Canterbury | Otago-Southland | South Island† |
|---|---|---|---|---|---|---|---|---|---|
*Including Bay of Plenty. †Including other areas (Northland in North Island, Westland in South Island). | |||||||||
| hectares | Percentage of total crop area | ||||||||
| For threshing— | |||||||||
| Wheat | 97,528 | 0.1 | 1.7 | 4.8 | 6.6 | 0.8 | 66.6 | 26.0 | 93.4 |
| Oats | 22,140 | 0.4 | 0.7 | 2.4 | 3.5 | 1.5 | 59.5 | 35.4 | 96.5 |
| Barley | 81,378 | 3.0 | 7.0 | 19.4 | 29.7 | 4.8 | 55.1 | 10.4 | 70.3 |
| Maize | 11,982 | 39.8 | 52.5 | 2.9 | 96.8 | 1.6 | 1.6 | - | 3.2 |
| Peas (not canning) | 22,533 | 0.1 | 2.6 | 6.8 | 9.5 | 4.4 | 82.6 | 3.5 | 90.5 |
| Oats— | |||||||||
| For chaff, hay, or silage | 8,730 | 3.2 | 1.4 | 7.3 | 12.6 | 4.2 | 37.4 | 46.4 | 87.4 |
| Fed off, cut green, abandoned | 17,114 | 1.7 | 1.4 | 3.7 | 7.1 | 9.0 | 63.8 | 19.8 | 2.9 |
| Root crops— | |||||||||
| Potatoes | 8,287 | 20.4 | 8.1 | 26.8 | 55.9 | 2.9 | 32.4 | 8.8 | 44.1 |
| Swedes | 57,450 | 12.0 | 1.4 | 7.1 | 20.7 | 1.3 | 13.9 | 63.3 | 79.3 |
| Turnips | 75,291 | 6.4 | 3.3 | 7.0 | 17.3 | 4.1 | 49.9 | 28.4 | 82.7 |
| Vegetable crops for processing | 9,674 | 0.8 | 58.1 | 1.0 | 60.2 | 9.1 | 30.5 | 0.2 | 39.8 |
| Vegetable crops for market | 5,242 | 37.9 | 14.1 | 15.4 | 74.0 | 5.2 | 11.1 | 9.7 | 26.0 |
| Green fodder— | |||||||||
| Rape | 20,159 | 0.9 | 7.1 | 2.6 | 10.7 | 4.8 | 59.1 | 25.4 | 89.3 |
| Kale (including chou moellier) | 34,562 | 8.0 | 14.2 | 22.5 | 45.2 | 1.7 | 12.3 | 40.9 | 54.8 |
| Other fodder crops | 17,939 | 14.1 | 8.4 | 13.6 | 37.0 | 3.2 | 35.6 | 23.8 | 63.0 |
| Grasses, clover and lucerne for seed | 1 92,794 | 0.3 | 3.7 | 3.5 | 7.6 | 4.7 | 72.8 | 14.9 | 92.4 |
| Grasses and clovers for hay or silage | 510,267 | 41.9 | 5.1 | 19.3 | 73.1 | 2.9 | 9.3 | 13.8 | 26.9 |
| Lucerne for hay or silage | 88,049 | 9.4 | 4.1 | 3.0 | 16.8 | 7.4 | 52.4 | 23.4 | 83.2 |
| Commercial orchards | 11,451 | 28.0 | 26.9 | 1.3 | 61.4 | 20.3 | 4.4 | 13.9 | 38.6 |
| Market gardens | 9,198 | 36.5 | 16.3 | 15.4 | 72.2 | 7.5 | 10.9 | 9.4 | 27.8 |
Detailed statistics of crops are contained in the report Agricultural Statistics issued annually by the Department of Statistics. Unless otherwise stated, the statistics quoted in this subsection relate to holdings of 2 acres (approx 1 hectare) from 1970-71 and to holdings of 10 acres (4.05 hectares) and over for earlier years situated outside borough boundaries or in rural areas of municipalities.
GRAIN AND SEED CROPS—Details of areas for threshing, total yields, and yields per hectare of the principal grain and seed crops during recent years are set out in the following table.
| Year | Wheat | Oats | Barley | Maize | Peas |
|---|---|---|---|---|---|
| Areas for threshing (hectares) | |||||
| 1964-65 | 74,461 | 15,690 | 35,222 | 3,919 | 11,024 |
| 1969-70 | 108,394 | 21,008 | 56,080 | 8,089 | 24,500 |
| 1970-71 | 97,528 | 22,141 | 81,378 | 11,982 | 22,533 |
| 1971-72 | 106,596 | 16,374 | 96,263 | 14,806 | 22,454 |
| 1972-73 | 107,690 | 15,079 | 73,750 | 12,858 | 21,390 |
| Total yields (tonnes) | |||||
| 1964-65 | 250,333 | 45,244 | 105,912 | 23,538 | 23,898 |
| 1969-70 | 287,212 | 57,712 | 174,445 | 58,623 | 49,601 |
| 1970-71 | 325,646 | 59,752 | 259,320 | 101,177 | 51,856 |
| 1971-72 | 389,156 | 49,457 | 335,490 | 116,225 | 57,519 |
| 1972-73 | 376,111 | 44,965 | 285,261 | 117,507 | 59,733 |
| Yields, per hectare (tonnes) | |||||
| 1964-65 | 3.36 | 2.87 | 3.01 | 6.01 | 2.17 |
| 1969-70 | 2.65 | 2.75 | 3.11 | 7.25 | 2.02 |
| 1970-71 | 3.34 | 2.70 | 3.19 | 8.44 | 2.30 |
| 1971-72 | 3.65 | 3.02 | 3.49 | 7.85 | 2.56 |
| 1972-73 | 3.49 | 2.98 | 3.50 | 9.13 | 2.79 |
The following table which gives the number of holdings and total area sown during the 1971-72 season shows cereal cropping being carried on by various farm types. The areas includes threshed, fed off, and crop abandoned.
| Farm Type | Wheat | Oats | Barley | Maize | ||||
|---|---|---|---|---|---|---|---|---|
| Number of Holdings | Area sown (ha) | Number of Holdings | Area sown (ha) | Number of Holdings | Area sown (ha) | Number of Holdings | Area sown (ha) | |
*75 percent or more of gross income is derived from stated activity. †From 51 to 74 percent of gross income is derived from first named activity and between 20 and 40 percent from second activity. ‡More than 50 percent of gross income is derived from stated activity. §Two or more activities of roughly equal proportions. ||Two or more activities of roughly equal proportions one of which is cropping. | ||||||||
| Dairy farming* | 51 | 301 | 162 | 629 | 373 | 2,159 | 574 | 2,430 |
| Dairy with sheep† | 18 | 135 | 29 | 112 | 45 | 256 | 12 | 37 |
| Dairy with other† | 26 | 244 | 37 | 218 | 110 | 868 | 115 | 777 |
| Sheep farming* | 1,577 | 17,390 | 1,415 | 11,619 | 1,479 | 16,095 | 30 | 303 |
| Sheep with dairy† | 25 | 242 | 19 | 71 | 24 | 182 | 5 | 32 |
| Sheep with beef† | 471 | 5,843 | 495 | 4,932 | 877 | 9,687 | 86 | 673 |
| Sheep with cropping† | 1,147 | 22,300 | 487 | 5,142 | 980 | 14,277 | 38 | 453 |
| Sheep with other† | 50 | 751 | 45 | 294 | 73 | 704 | 4 | 15 |
| Beef farming* | 15 | 180 | 30 | 195 | 117 | 838 | 66 | 715 |
| Beef with other† | 43 | 504 | 55 | 447 | 193 | 2,173 | 98 | 956 |
| Cropping* | 463 | 11,208 | 132 | 1,277 | 602 | 9,917 | 236 | 3,689 |
| Cropping with other† | 676 | 19,081 | 212 | 2,561 | 679 | 12,206 | 86 | 1,393 |
| Pig farming‡ | 14 | 110 | 13 | 80 | 101 | 992 | 26 | 237 |
| Stud livestock farming | 23 | 365 | 69 | 476 | 67 | 547 | 15 | 133 |
| Mixed livestock§ | 144 | 1,420 | 208 | 1,297 | 520 | 4,454 | 137 | 1,146 |
| General mixed farming|| | 1,271 | 27,498 | 487 | 4,805 | 1,524 | 24,288 | 297 | 4,462 |
| Other farming | 38 | 313 | 45 | 219 | 144 | 1,368 | 76 | 477 |
| Totals | 6,052 | 107,885 | 3,940 | 34,374 | 7,908 | 101,011 | 1,901 | 17,928 |
WHEAT—The 1973 wheat harvest, although large by New Zealand standards, amounting to 348,000 tonnes from 98,745 hectares (12.8 million bushels from 244,000 acres), fell short of requirements and the Wheat Board found it necessary to import four shipments of Australian wheat, amounting to 20,983 tonnes (771,000 bushels). A 50-year series is given in the Statistical Summary towards the end of the Yearbook.
The following diagram shows the fluctuations that have occurred in the area sown in wheat, together with the total yield and the average yield per acre.
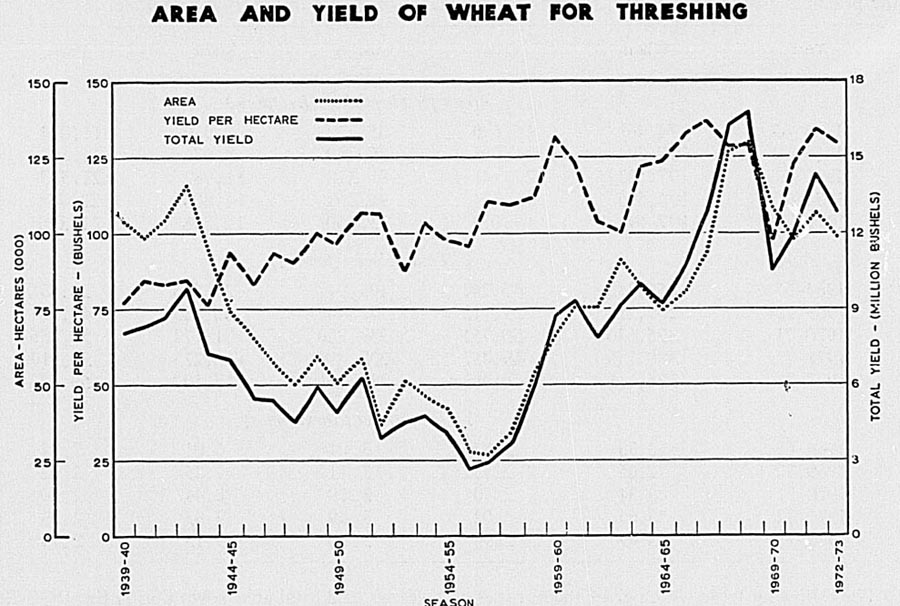
Wheat Board—Control of the importation of wheat and flour and of the distribution of both imported and locally produced wheat rests with the Wheat Board. The operations of this board, which consists of representatives of flourmillers, wheat growers, bakers, the poultry industry, the grain seed and produce business, and the Department of Trade and Industry, with the Minister of Trade and Industry as chairman and a deputy chairman having no direct association with any of the interested industries, are governed by the Wheat Board Act 1965.
All New Zealand milling wheat is purchased from farmers by the Wheat Board through the agency of the grain merchants acting as brokers for the board. The board is responsible for the distribution of imported poultry wheat in the North Island; in the South Island poultry wheat is not controlled. Its functions also include arrangements for the processing of wheat and the sale of flour to merchants, bakers, pastrycooks, grocers, and others.
The annual consumption of wheat in New Zealand approximates 354,120 tonnes—some 283,300 tonnes being required for flour and cereal foods, and the balance for poultry food and seed. Research is assisted by a levy on wheat and flour on recommendation of the Wheat Research Committee.
MAIZE—Maize is principally grown on the East of the North Island, Hawke's Bay, and South Auckland - Bay of Plenty. For many years, the area that was sown in maize remained steady at between 5,000 and 6,000 hectares. (About half the crop was grown for grain, and the other half for green feed.) In recent seasons, the area sown has greatly increased, partly as a result of the introduction of improved hybrid maize varieties. The yield of grain threshed has doubled. Maize is used principally as poultry feed, but smaller amounts arc used to feed pigs and other stock.
BARLEY—Barley is used mainly in the manufacture of stock feeds, and for malting. The production of barley is increasing steadily, mainly because of the growing demand for stock feeds.
OATS—Most of the oats are grown for threshing and green feed and not for chaff. From the grain milled, 3,500 tonnes of rolled oats and 2,340 of oatmeal and proprietary oaten foods.
VEGETABLES—The production of the main vegetables for the fresh market is shown in the following table for the latest 5 years; production for processing is also shown for 1973.
| Vegetable | 1969 | 1970 | 1971 | 1972 | 1973 | 1973 (Processed) |
|---|---|---|---|---|---|---|
| *Production for fresh market is outdoor plus glasshouse; production for processing is outdoor only. | ||||||
| tonnes | ||||||
| Asparagus | 260 | 290 | 292 | 400 | 437 | 1,524 |
| Beans, green | 1,042 | 1,147 | 834 | 931 | 955 | 8,128 |
| Beetroot | 2,409 | 2,041 | 1,023 | 1,674 | 1,524 | 2,845 |
| Brussel sprouts | 1,156 | 1,251 | 1,864 | 1,723 | 1,829 | 305 |
| Cabbages | 32,689 | 30,894 | 28,107 | 28,177 | 28,449 | 437 |
| Carrots | 29,069 | 30,756 | 22,958 | 24,057 | 27,433 | 6,604 |
| Cauliflower | 27,153 | 26,290 | 23,366 | 23,099 | 23,369 | 569 |
| Kumaras | 7,376 | 8,225 | 6,866 | 7,582 | 8,332 | - |
| Lettuce | 16,187 | 14,128 | 13,012 | 14,619 | 15,749 | - |
| Onions | 36,251 | 31,462 | 31,464 | 34,454 | 36,984 | 1,930 |
| Parsnips | 7,637 | 6,711 | 3,880 | 3,956 | 4,369 | 10 |
| Peas | 772 | 581 | 390 | 438 | 376 | 42,674 |
| Sweet corn | 649 | 602 | 1,013 | 1,523 | 1,727 | 24,385 |
| Tomatoes* | 20,338 | 22,282 | 22,094 | 21,776 | 22,780 | 26,417 |
| Celery | 4,887 | 3,764 | 3,919 | 4,044 | 4,674 | 305 |
There has been a marked increase in recent years in the quantity and variety of crops grown for processing. The quick-freezing industry has expanded rapidly and so have other forms of processing, such as canning, freeze-drying, and the manufacture of prepared foods. The Heretaunga plains, around Hastings, support a diversified processing industry and produce over half of New Zealand's processed vegetables.
Peas are the main crop, followed by tomatoes, sweet corn, green beans, and asparagus.
The following table shows, for 1970, vegetable growing areas by number and locality.
| Locality | Market Gardens | Growing only Process Crops | Total Vegetable Growers | Area of Garden | Area used for Process Crops | Total Area |
|---|---|---|---|---|---|---|
| (ha) | (ha) | (ha) | ||||
| Auckland-Northland | 398 | - | 398 | 4,289 | 67 | 4,356 |
| Bay of Plenty - Waikato | 123 | - | 123 | 659 | - | 659 |
| Palmerston North | 372 | - | 372 | 2,168 | 2 | 2,170 |
| Wanganui | ||||||
| Wairarapa | ||||||
| Hawke's Bay - Gisborne | 225 | 991 | 1,216 | 708 | 8,248 | 8,956 |
| Nelson-Marlborough | 98 | 205 | 303 | 330 | 1,496 | 1,826 |
| Canterbury | 269 | 305 | 574 | 1,594 | 2,608 | 4,202 |
| Otago | 87 | - | 87 | 927 | - | 927 |
| Totals | 1,572 | 1,501 | 3,073 | 10,675 | 12,421 | 23,096 |
The Ministry of Agriculture and Fisheries estimates that 3,000 vegetable producers were cultivating a total area of 24,000 hectares during the year ended 31 October 1973. Included in this figure were some 14,000 hectares of vegetables for processing.
POTATOES—The production of potatoes is usually adequate to meet the home market.
Under the Potato Growing Industry Act 1950 a Potato Board was established consisting of seven members, three of whom are representative of the growers on an elective basis, three nominated by the New Zealand Grain, Seed, and Produce Merchants' Federation (Incorporated), and one an officer of the Public Service acting in an advisory capacity.
The principal function of the board is to ensure that adequate supplies of main-crop potatoes are available for consumption in New Zealand, and for that purpose to enter into contracts with growers for the growing of main-crop potatoes. The Act provides that the board may impose a levy not exceeding $3 per ton on main-crop potatoes sold by growers, the proceeds of which are to be applied by the board in payment of charges, etc., for which it may become liable in the exercise of its functions.
The board undertakes to compensate contract growers for any declared unsold number one grade contract produce held by growers at the end of the season. For the 1972-73 season the rate was $20 per tonne in the South Island and $24 per tonne in the North Island.
Potato yields have risen to such an extent that a population of 3 million is now supplied from the same acreages as were 1 3/4 million people 20 years earlier. Most of this increased production has been achieved through new varieties and better farming practice based on research results.
Figures for area and yield of potatoes for the latest 6 years are as follows.
| Year | Area | Total Yield | Yield per Hectare |
|---|---|---|---|
| hectares | tonnes | tonnes | |
| 1966-67 | 8,020 | 187,357 | 23.36 |
| 1967-68 | 9,517 | 235,835 | 24.78 |
| 1968-69 | 10,132 | 256,350 | 25.30 |
| 1969-70 | 9,928 | 253,204 | 25.50 |
| 1970-71 | 8,287 | 209,927 | 25.23 |
| 1971-72 | 7,905 | 219,970 | 27.83 |
ONIONS—Areas in, and yields of, onions for the latest 6 years are as follows.
| Year | Area | Total Yield | Yield per Hectare |
|---|---|---|---|
| hectares | tonnes | tonnes | |
| 1966-67 | 790 | 24,300 | 30.75 |
| 1967-68 | 788 | 24,147 | 30.64 |
| 1968-69 | 1,021 | 30,897 | 30.26 |
| 1969-70 | 879 | 25,958 | 29.53 |
| 1970-71 | 1,041 | 29,614 | 28.45 |
| 1971-72 | 968 | 25,604 | 26.45 |
HOME VEGETABLE PRODUCTION—At the 1971 Census of Population and Dwellings a question was asked on home vegetable production. As shown in the following table one-third of households grew potatoes and one-half grew other vegetables.
| Statistical Area | Total Households | Potatoes Grown (All or Part) | Other Vegetables Grown (All or Part) |
|---|---|---|---|
| Northland | 25,002 | 9,277 | 13,721 |
| Central Auckland | 202,059 | 30,812 | 65,764 |
| South Auckland - Bay of Plenty | 109,424 | 40,025 | 60,745 |
| East Coast | 12,209 | 4,761 | 6,159 |
| Hawke's Bay | 37,148 | 13,621 | 19,899 |
| Taranaki | 27,936 | 14,828 | 19,539 |
| Wellington | 157,268 | 39,297 | 71,671 |
| Totals, North Island | 571,046 | 152,621 | 257,498 |
| Marlborough | 8,716 | 4,550 | 6,240 |
| Nelson | 19,332 | 9,100 | 13,238 |
| Westland | 6,085 | 2,632 | 3,488 |
| Canterbury | 116,068 | 58,828 | 75,214 |
| Otago | 52,064 | 26,927 | 32,603 |
| Southland | 28,375 | 20,608 | 21,772 |
| Totals, South Island | 230,640 | 122,645 | 152,555 |
| New Zealand | 801,686 | 275,266 | 410,053 |
| Percentages of total | 100.0 | 34.3 | 51.1 |
LINSEED—Most of the linseed is grown under contract for the production of linseed oil and about 3,500 hectares are sown each year. The oil is extracted mainly for use in paints, and the residue provides a valuable concentrate for stock food.
SEED CERTIFICATION—The Ministry of Agriculture and Fisheries operates a seed certification scheme covering the more important herbage species, cereals, brassicas, and potatoes. Bred varieties of these species are produced by the Grasslands and the Crop Research Division of the DSIR. These are then reproduced under the control of the Ministry of Agriculture and Fisheries which releases them as Breeder's seed which in turn produces Basic seed. The final stages in the multiplication of certified seed are known as 1st and 2nd Generation seeds. Basic and Certified seed, 1st and 2nd Generation, are sold through the usual commercial channels.
GRASS SEED—The areas of grass, clover, and lucerne crops harvested for seed, distinguishing the principal varieties, are given in the following table.
| Crop | 1967-68 | 1963-69 | 1969-70 | 1970-71 | 1971-72 |
|---|---|---|---|---|---|
*Includes Ariki ryegrass. †Ariki from 1968-69. | |||||
| hectares | |||||
| Ryegrass— | |||||
| Perennial | 20,312* | 18,153 | 24,851 | 48,433 | 21,962 |
| Italian | 1,944 | 2,868† | |||
| Short Rotation (H.1.) | 6,857 | 5,483 | |||
| Red clover (including cowgrass) | 4,811 | 5,787 | 15,316 | 26,449 | 15,529 |
| White clover | 10,527 | 13,082 | |||
| Lucerne | 4,700 | 4,807 | 3,679 | 5,427 | 2,355 |
| Cocksfoot | 3,888 | 3,995 | 8,866 | 12,484 | 9,345 |
| Chewings fescue | 1,195 | 565 | |||
| Crested dogstail | 3,212 | 3,802 | |||
| Other grasses and clovers | 3,746 | 4,948 | |||
| Totals | 61,192 | 63,490 | 52,712 | 92,793 | 49,191 |
Quantities (in dressed weights) of grass and clover seeds treated by machine dressing plants for the latest 2 years are given below. (1 bushel equals approximately 9.1 kg.)
| Type of Seed | Unit | Year Ended 31 October | |
|---|---|---|---|
| 1972 | 1973 | ||
| Ryegrass— | |||
| Perennial | bush | 1,223,947 | 936,344 |
| Short rotation | bush | 260,383 | 160,686 |
| Italian (and western wolths) | bush | 300,449 | 92,094 |
| Ariki | bush | 248,504 | 191,447 |
| Tama | bush | 88,697 | 290,375 |
| Chewings fescue | kg | 110,934 | 73,714 |
| Brown top | kg | 151,500 | 62,673 |
| Crested dogstail | kg | 1,652,554 | 1,279,920 |
| Cocksfoot | kg | 1,095,392 | 939,742 |
| Timothy | kg | 342,640 | 251,854 |
| Prairie grass | kg | 47,627 | 34,551 |
| Yorkshire fog | kg | 16,312 | 4,428 |
| White clover | kg | 3,155,999 | 3,623,471 |
| Suckling clover | kg | 42,220 | 53,640 |
| Suckling white mixture | kg | 129,220 | 135,344 |
| Cowgrass (including broad red) | kg | 474,035 | 356,277 |
| Montgomery red clover | kg | 223,008 | 122,865 |
| Lucerne | kg | 376,236 | 345,088 |
| Mixtures and other grasses and clovers | kg | 70,809 | 108,623 |
| Rape | kg | 248,627 | 247,821 |
| Kale (including chou moellier) | kg | 512,687 | 431,764 |
Large quantities of grass and clover seed have been exported during recent years, especially to the United Kingdom, Australia, and the United States of America. Details of the volume fad value of exports during recent years will be found in Section 22b of this issue.
ORCHARDS AND THE FRUIT INDUSTRY—Whereas pip and stone fruits are grown commercially throughout New Zealand, citrus and subtropical fruits are largely confined to the coastal strip from North Auckland through the Bay of Plenty to Gisborne, where the climate is suitably mild.
During 1973, the Ministry of Agriculture and Fisheries made its fifth comprehensive survey of commercial orchards throughout New Zealand. The following table compares the areas of the various recorded in the 1968 and 1973 surveys. Because the 1973 survey did not take into account 1973 tree plantings and removals, it in effect gave the situation as at the end of 1972. Similarly the 1968 survey gave the situation as at the end of 1967. The main producing areas for the various fruits are also given.
| Fruit | 1968 | 1973 | Main Districts |
|---|---|---|---|
| hectares | |||
| Pip Fruit— | |||
| Apples | 4,075 | 4,930 | Nelson, Hawke's Bay. |
| Pears | 623 | 566 | Hawke's Bay, Nelson. |
| Stone Fruits— | |||
| Apricots | 452 | 595 | Otago. |
| Cherries | 66 | 105 | Otago, Marlborough. |
| Nectarines | 121 | 262 | Otago, Hawke's Bay. |
| Peaches | 1,385 | 1,314 | Hawke's Bay, Auckland, Otago. |
| Plums | 335 | 362 | Hawke's Bay, Auckland. |
| Citrus— | |||
| Grapefruit | 139 | 435 | Bay of Plenty. |
| Lemons | 126 | 164 | Bay of Plenty. |
| Mandarins | 107 | 201 | Bay of Plenty, Northland. |
| Oranges (sweet) | 270 | 362 | Northland, Poverty Bay. |
| Tangelos | 80 | 223 | Bay of Plenty, Northland, Poverty Bay. |
| Subtropicals— | |||
| Kiwifruit (Chinese Gooseberries) | 133 | 720 | Bay of Plenty. |
| Passionfruit | 26 | 28 | Bay of Plenty, Poverty Bay. |
| Tamarillos | 147 | 208 | Northland, Bay of Plenty. |
Fruit and Crop Disposal—Estimated production and methods of disposal of the various fruit crops in 1973 follow. For comparison, 1968 figures are shown in parentheses.
| Fruit | Disposal | Processing | Total Production | |
|---|---|---|---|---|
| Export (fresh) | Local Market (fresh) | |||
| Pip Fruit | tonnes | |||
| Apples | 72,000 | 49,600 | 21,900 | 143,500 |
| (42,100) | (55,000) | (16,100) | (113,200) | |
| Pears | 3,400 | 10,700 | 6,700 | 20,800 |
| - | (3,400) | (11,500) | (4,700) | (19,600) |
| Stone Fruit— | ||||
| Apricots | - | 4,630 | 2,400 | 7,030 |
| - | (3,290) | (1,620) | (4,910) | |
| Cherries | - | 520 | 50 | 570 |
| - | (400) | (30) | (430) | |
| Nectarines | - | 2,330 | 20 | 2,350 |
| - | (1,250) | (10) | (1,260) | |
| Peaches | - | 14,080 | 10,770 | 24,850 |
| - | (12,790) | (9,310) | (22,100) | |
| Plums | - | 4,380 | 640 | 5,020 |
| - | (2,570) | (300) | (2,870) | |
| Citrus Fruit— | - | - | tonnes | |
| Grapefruit | - | 2,130 | 2,730 | 4,860 |
| - | 0,700) | (1,650) | (3,350) | |
| Lemons | - | 1,220 | 1,450 | 2,670 |
| - | (1,830) | (1,290) | (3,120) | |
| Sweet oranges | - | 1,960 | 380 | 2,340 |
| - | (1,060) | (-) | (1,060) | |
| Mandarins | - | 1,110 | - | 1,110 |
| - | (530) | (-) | (530) | |
| Tangelos | - | 1,380 | 180 | 1,560 |
| - | (250) | (-) | (250) | |
| Subtropicals— | ||||
| Kiwi fruit (Chinese gooseberries) | 1,300 | 2,230 | 120 | 3,650 |
| (270) | (1,490) | (70) | (1,830) | |
| Tamarillos | 20 | 2,150 | 50 | 2,220 |
| (10) | (1,620) | (-) | (1,630) | |
| Passionfruit | - | 110 | 110 | 220 |
| (-) | (100) | (60) | (160) | |
BERRYFRUIT GROWING—Berryfruits are grown commercially throughout New Zealand the following table gives the estimated areas of the various berryfruits. The main producing areas are also shown.
| Fruit | 1970 | 1973 | Main Districts |
|---|---|---|---|
| hectares | |||
| Strawberries | 226 | 181 | Auckland. |
| Raspberries | 329 | 250 | Nelson, Canterbury. |
| Boysenberries | 106 | 143 | Nelson, Hawke's Bay, Bay of Plenty |
| Loganberries | 9 | 7 | Wairarapa, South Canterbury. |
| Blackcurrants | 62 | 137 | Canterbury, Dunedin. |
| Gooseberries | 20 | 17 | Wairarapa, Horowhenua. |
Estimated production and disposal of the various berryfruits is given in the following table.
| Fruit | Market (Fresh) | Processing | Total Production | |||
|---|---|---|---|---|---|---|
| 1969-70 | 1972-73 | 1969-70 | 1972-73 | 1969-70 | 1972-73 | |
*Including 480 tonnes exported. †Including 510 tonnes exported. | ||||||
| tonnes | ||||||
| Strawberries | 3,050 | 2,830 | 1,530 | 570 | 4,580 | 3,400* |
| Raspberries | 670 | 720 | 790 | 1,380 | 1,460 | 2,100† |
| Boysenberries | 190 | 340 | 260 | 690 | 450 | 1,030 |
| Loganberries | 70 | 30 | 10 | 20 | 50 | 50 |
| Blackcurrants | 90 | 150 | 120 | 210 | 210 | 360 |
| Gooseberries | 170 | 120 | - | 10 | 170 | 130 |
The raspberry is the only berryfruit for which there is a statutory marketing scheme.
District marketing committees were established in Nelson in 1940, and in Canterbury and Otago in 1950. A central Council of Raspberry Growers was created by the Raspberry Marketing Regulations 1950 to co-ordinate marketing by the three district committees.
GRAPE GROWING AND WINE PRODUCTION—In 1973 the Ministry of Agriculture and Fisheries estimated the national area in vineyards at 2,250 hectares, mainly in the regions Auckland, Northland, Waikato, Poverty Bay, Hawke's Bay, and Marlborough. A precise survey of the viticultural industry is scheduled for 1975.
There were some 140 grape and 20 fruit winemakers. Grape wine production in 1973 had increased almost 70 percent to 263,000 hectolitres (1 hectolitre = 100 litres) as compared with 1970. For the same period fruit wine production increased 30 percent. Wine exports to date have not been significant.
The 1973 total vineyard production of grapes was estimated at 25,000 tonnes.
The 1973 estimated area in commercial glasshouse vineries was 53,000 square metres producing some 200 tonnes of select dessert grapes. There is a small but expanding trade in select glasshouse grapes to the northern hemisphere.
NURSERIES—The number of nurseries registered, which excludes those producing seedlings, perennials, and bulbs, and those operated by Government and local authorities, at 31 December 1973, totalled 733 and covered 1,317 hectares.
APPLES AND PEARS—A summary of the activities of the New Zealand Apple and Pear Marketing Board appears in Section 21. Over 700 orchardists consistently sell apples and pears to the board. Over 75 percent of the total crop received comes from Nelson and Hawke's Bay.
The following table shows the quantities of the main varieties of fresh apples and pears received by districts by the Apple and Pear Marketing Board during the 1972-73 season.
| Variety | Hawke's Bay | Nelson | Other Districts | Total |
|---|---|---|---|---|
| Apples— | bushel cases (000) | |||
| Granny Smith | 928 | 499 | 365 | 1,792 |
| Stunner Pippin | 209 | 652 | 193 | 1,054 |
| Golden Delicious | 182 | 396 | 101 | 679 |
| Delicious | 102 | 304 | 157 | 563 |
| Red Delicious | 230 | 93 | 66 | 389 |
| Jonathan | 11 | 310 | 66 | 387 |
| Dougherty | 125 | 98 | 32 | 255 |
| Cox's Orange | 65 | 243 | 61 | 369 |
| Richared | 69 | 27 | 26 | 122 |
| Gravenstein | 10 | 102 | 10 | 122 |
| Others | 142 | 126 | 165 | 433 |
| Total apples | 2,073 | 2,850 | 1,242 | 6,165 |
| Pears— | ||||
| Williams Bon Chretien | 79 | 32 | 111 | |
| Winter Cole | 120 | 74 | 26 | 220 |
| Winter Nelis | 79 | 19 | 38 | 136 |
| Packham's Triumph | 31 | 54 | 9 | 94 |
| Others | 53 | 32 | 12 | 107 |
| Total pears | 283 | 258 | 117 | 658 |
Exports of apples and pears in the 1972-73 season totalled 4,657,000 bushels.
HOPS—Practically the whole of the hop gardens are located in Waimea county. Production per hectare (approximately 2.47 acres) usually ranges between 1,300 kg and 1,700 kg. The total crop produced in the 1973 season was 348,391 kg (50,654 kg for export) compared with 413,640 kg (35,460 kg for export) in 1972. About 98 percent of the crop is now picked by machines.
A Hop Marketing Committee of six members (one Government and five producer) was established by the Hop Marketing Regulations 1939 to regulate and control the marketing either locally or overseas of all hops produced in New Zealand and to assist the industry generally.
TOBACCO—Tobacco is grown mainly in the Motueka district, Most of the tobacco produced is flue-cured, producing a yellow-leaf tobacco which is largely used for the manufacture of cigarettes, the balance, air-cured, being used mainly in the manufacture of smoking mixtures and pipe tobacco, Some 3,460 tonnes of raw tobacco leaf was imported during 1972-73 and 4,087 tonnes during 1973-74.
With the following particulars relating to tobacco production, it should be noted that the figures relate to the total commercial tobacco production and not merely to holdings of 10 acres (approximately 4.05 hectares) or over situated outside borough boundaries. (Source: New Zealand Tobacco Board.)
| Season | Number of Growers | Area Planted* | Production | Estimated Value of Crop |
|---|---|---|---|---|
| *Contract area amended after planting operations completed. | ||||
| hectares | kg(000) | $(000) | ||
| 1967-68 | 526 | 2,064 | 2,791 | 3,562 |
| 1968-69 | 523 | 2,050 | 3,449 | 4,917 |
| 1969-70 | 506 | 2,033 | 3,248 | 4,641 |
| 1970-71 | 464 | 1,979 | 3,888 | 6,071 |
| 1971-72 | 411 | 1,876 | 3,327 | 5,619 |
| 1972-73 | 353 | 1,739 | 3,045 | 5,819 |
The production figures represent the weight of the leaf purchased from growers before redrying. Flue-cured leaf accounted for 97 percent and air-dried leaf for 3 percent of the 1972-73 crop.
LINEN FLAX—There is a strong demand for all linen fibre produced in New Zealand from a local manufacturer of twine who uses this kind of fibre in the making of twine for closing bags and bales, for rolling meat, and for other purposes which require a twine made from a strong durable fibre.
In the spring of 1973, 90.65 hectares of flax were sown, as compared with 179.69 hectares in 1972. In recent years the industry has been faced with a problem of insufficient acreage on which to base a modern processing plant, due to inadequate returns to flaxgrowers. However, following discussions between the Minister of Trade and Industry, the directors of the Linen Flax Corporation, and growers, in December 1973, it was announced that the industry would be restructured and financial assistance provided for the provision of barns and drying facilities and, eventually, the installation of a complete new fibre processing plant at the Geraldine factory.
Production from the Linen Flax Corporation factory at Geraldine in recent years has been as follows.
| Product | 1971 | 1972 | 1973 |
|---|---|---|---|
| tonnes | |||
| Straw processed | 1,040 | 1,093 | 816 |
| Scutched fibre | 102 | 109 | 97 |
| Seed | 104 | 114 | 88 |
| Tow | 33 | 45 | 42 |
| Linmeal | 59 | 79 | 55 |
GENERAL—Agriculture is a dynamic industry upon which much of New Zealand's prosperity depends. It has the capacity to expand provided the circumstances are favourable for development. The lines of development are influenced by overseas prices received for farm products in the form of meat, wool, butter, cheese, milk powder, casein, etc. Although there is a time-lag associated with livestock breeding, the livestock numbers are an indication of the response of farmers to financial incentives, although weather factors, such as drought, are also involved.
Livestock numbers over a 50-year period are shown in the historical tables near the back of the book.
A feature of recent years has been the continued upward trend in beef cattle numbers, in contrast to fluctuations in numbers of other livestock.
New Zealand has more than 24 times as many animals as people: this ratio is probably not exceeded in any country in the world. Grasslands have been developed to the extent that the best dairy farms can carry one cow to the acre, and the best sheep farms can support up to 10 sheep to the acre throughout the year.
The first sheep stations in the 1840s were stocked with Merinos from Australia. During the 1850s and 1860s several English breeds of sheep were imported, notably Southdowns, Leicesters, Lincolns, and Romneys. In 1855 there were 761,700 sheep in the country; by 1870 there were 9,700,000. Until 1882, the year of the successful introduction of cargo refrigeration when mutton and lamb exports were sent to London, the Merino and its crosses were predominant, because the only sheep products of any importance for export were wool and a little tallow, obtained by boiling down carcasses. Then the Merino was superseded in the North Island by breeds more suited to the climate and conditions. Today the flock sheep of the North Island are nearly all predominantly of Romney blood. In the South Island, Merino blood in varying degree continued to play an important part in the flock structure but are now restricted to the foothills of the Southern Alps, while Corriedales are more profitable in the better hill country, and crossbreeds and long-woolled British breeds at lower levels.
In 1851 there were 193,000 cattle in New Zealand and by 1897 the number had reached 1,138,000. Cattle raising and fattening are usually associated with hill-country sheep farming and fat-lamb farming respectively, and beef stock are grazed chiefly in the North Island. The most popular breed of beef cattle is now the Aberdeen Angus, (74.5 percent) with Herefords (6.3 percent) and Shorthorns (5.4 percent) next in number.
The growth of dairy herds was related to the availability of refrigeration for the export of butter from 1882, and the development of butter and cheese factories. There were 300,000 dairy cows by 1897, 185,000 of them in the North Island and 115,000 in the South Island. Now the North Island has more than 11 times as many dairy cows as the South Island. Estimates of breeds in 1970-71 were: Jersey, 74 percent; Friesian, 22 percent; Ayrshire, 3 percent; Shorthorn, 1 percent.
In the following table, livestock numbers are shown by farm-type category as at 30 June 1972.
| Farm Type | Beef Cattle | Dairy Cattle | Sheep | Pigs |
|---|---|---|---|---|
*75 percent or more of gross income is derived from stated activity. †From 51 to 74 percent of gross income is derived from first named activity and between 20 and 40 percent from second activity. ‡Two or more activities of roughly equal proportions. §Two or more activities of roughly equal proportions, one of which is cropping. ||Does not include sheep on livestock farms under one hectare or those within borough boundaries. | ||||
| (000) | ||||
| Beef farming* | 664 | 41 | 738 | 3 |
| Beef with sheep† | 549 | 10 | 2,691 | 1 |
| Beef with dairy† | 24 | 21 | 18 | 1 |
| Beef with other† | 19 | 2 | 33 | 1 |
| Dairy farming* | 176 | 2,508 | 342 | 78 |
| Dairy with sheep† | 18 | 66 | 335 | 4 |
| Dairy with beef | 90 | 240 | 115 | 11 |
| Dairy with other† | 6 | 61 | 15 | 33 |
| Sheep farming* | 688 | 23 | 21,083 | 7 |
| Sheep with beef† | 1,444 | 19 | 17,563 | 4 |
| Sheep with cropping† | 39 | 3 | 2,577 | 3 |
| Sheep with dairy† | 6 | 12 | 187 | 1 |
| Sheep with other† | 16 | 1 | 430 | 3 |
| Pig farming* | 4 | 8 | 15 | 168 |
| Pig with other† | 4 | 8 | 12 | 48 |
| Mixed livestock farming‡ | 1,346 | 222 | 10,298 | 86 |
| General mixed farming§ | 155 | 21 | 2,724 | 14 |
| Other farming | 96 | 22 | 1,520 | 11 |
| Totals | 5,344 | 3,288 | 60,696|| | 477 |
Figures as at 30 June 1973 gave a total of 5,765,266 for beef cattle (of which, breeding cows and heifers totalled 1,981,589 compared with 1,907,208 the previous year), and a total of 3,158,905 for dairy cattle, of which 2,087,608 (compared with 2,147,991 the previous year) were dairy cows in milk.
The 1964 Agricultural Development Conference set a target of an increase in livestock numbers of 3.5 percent a year and the National Development Conference in 1969 revised the rate to 2.6 percent a year.
The 1973 figures showed a 7.9 percent increase in beef cattle, but the total of dairy cattle decreased by 4.0 percent. The beef cattle herd has been increasingly supplemented in recent years by dairy-bred cattle reared for beef production, as indicated by the declining calf kill.
The dairying and beef-production industries are both largely concentrated in the North Island which has 83 percent of the total cattle and 92 percent of the dairy stock. Localising the dairying industry still further, it is found that 66 percent of the milking cows of New Zealand are in the northern half of the North Island. Taranaki and Wellington districts between them account for one-quarter of the total dairy cows in milk.
Beef cattle are fairly evenly spread over the North Island, except Taranaki and areas close to Auckland.
Taking the number of beef breeding cows 2 years old and over as a guide to beef production, South Auckland - Bay of Plenty and Wellington statistical areas easily lead with 36 percent of the New Zealand total between them. Hawke's Bay is next, followed by East Coast and Northland in that order. These five districts together depasture 69 percent of breeding cows.
Northland, Central Auckland, and South Auckland-Bay of Plenty statistical areas account for 42 percent of the pig population and Wellington and Taranaki for 26 percent. The number of pigs kept in the Nelson and Canterbury areas has increased considerably in recent years and 18 percent of the pig population is now in these areas. Tanker collection of whole milk from dairy farms has reduced the rearing of pigs as a sideline; major developments have taken place in the rearing of grain-fed pigs in large units.
Sheep farming is more evenly distributed between the North and South Islands. The statistical areas of major importance are Canterbury, Wellington, South Auckland - Bay of Plenty, Southland, Otago, and Hawke's Bay, in that order, these six districts accounting for 85 percent of the total sheep population in 1971.
The following table shows the distribution of livestock at 30 June 1972.
| Statistical Area | Dairy Cows and Heifers Two Years Old and Over (In Milk) | Beef Breeding Cows Two Years Old and Over | Total Cattle | Breeding Sows | Total Pigs | Sheep Shorn* | Lambs Shorn* | Lambs Tailed* | |
|---|---|---|---|---|---|---|---|---|---|
| *Sheep and lambs shorn during 1971-72 and lambs tailed during year ended 31 January 1973. | |||||||||
| Northland | (000) | 272 | 182 | 934 | 4 | 25 | 1,686 | 799 | 1,053 |
| Percent | 12.66 | 9.54 | 10.82 | 6.67 | 5.24 | 2.91 | 4.51 | 2.59 | |
| Central Auckland | (000) | 185 | 59 | 521 | 6 | 58 | 1,075 | 403 | 628 |
| Percent | 8.61 | 3.09 | 6.03 | 10.00 | 12.16 | 1.86 | 2.27 | 55 | |
| South Auckland - Bay of Plenty | (000) | 954 | 381 | 2,626 | 14 | 116 | 8,393 | 3,884 | 411 |
| Percent | 44.41 | 19.97 | 30.42 | 23.42 | 24.32 | 14.51 | 21.91 | 13.32 | |
| East Coast | (000) | 7 | 185 | 429 | 1 | 4 | 2,361 | 1,116 | 1,533 |
| Percent | 0.32 | 9.70 | 4.97 | 1.67 | 0.84 | 4.08 | 6.29 | 3.78 | |
| Hawke's Bay | (000) | 42 | 262 | 776 | 2 | 12 | 6,808 | 2,731 | 4,784 |
| Percent | 1.95 | 13.69 | 8.99 | 3.33 | 2.52 | 11.77 | 15.40 | 11.78 | |
| Taranaki | (000) | 332 | 45 | 704 | 7 | 64 | 1,455 2.52 | 640 | 950 |
| Percent | 15.45 | 2.36 | 8.15 | 11.67 | 13.42 | - | 3.61 | 2.34 | |
| Wellington | (000) | 198 | 309 | 1,175 | 9 | 61 | 8,997 | 3,764 | 5,921 |
| Percent | 9.21 | 16.20 | 13.61 | 15.00 | 13.00 | 15.56 | 21.23 | 14.58 | |
| North Island | (000) | 1,989 | 1,422 | 7,165 | 43 | 341 | 30,775 | 13,337 | 20,280 |
| Percent | 92.60 | 74.57 | 83.00 | 71.67 | 71.49 | 53.21 | 75.22 | 49.93 | |
| Marlborough | 15 | 42 | 127 | 2 | 17 | 1.370 | 212 | 855 | |
| Percent | 0.69 | 2.20 | 1.47 | 3.33 | 3.56 | 2.37 | 1.19 | 2.11 | |
| Nelson | (000) | 35 | 32 | 140 | 2 | 19 | 697 | 228 | 420 |
| Percent | 1.63 | 1.67 | 1.62 | 3.33 | 3.98 | 1.20 | 1.29 | 1.03 | |
| Westland | (000) | 18 | 25 | 93 | - | 1 | 179 | 48 | 122 |
| Percent | 0.84 | 1.31 | 1.08 | - | 0 21 | 0.31 | 0.27 | 0.30 | |
| Canterbury | (000) | 46 | 151 | 454 | 9 | 67 | 9,654 | 1,298 | 7,295 |
| Percent | 2.14 | 7.91 | 5.26 | 15.00 | 14.05 | 16.69 | 7.32 | 17.96 | |
| Otago | (000) | 22 | 135 | 351 | 2 | 16 | 7,211 | 763 | 5,192 |
| Percent | 1.02 | 7.07 | 4.07 | 3.33 | 3.35 | 12.47 | 4.30 | 12.78 | |
| Southland | (000) | 23 | 101 | 303 | 2 | 16 | 7,950 | 1,845 | 6,450 |
| Percent (000) | 1.07 | 5.29 | 3.51 | 3.33 | 3.35 | 13.75 | 10.41 | 15.88 | |
| South Island | 159 | 485 | 1.468 | 17 | 136 | 27,061 | 4,393 | 20,334 | |
| Percent | 7.40 | 25.43 | 17.00 | 28.33 | 28.51 | 46.79 | 24.78 | 50.07 | |
Detailed statistics of livestock are contained in the annual report Agricultural Statistics. This publication also contains the summary tables from parliamentary paper C. 5A (formerly H. 23), which is a statistical analysis of the annual sheep returns.
SHEEP—The following table analyses categories of sheep and gives a broad classification of stud and other groups.
| At 30 June | Rams | Wethers | Breeding Ewes | Dry Ewes | Hoggets | Total | ||
|---|---|---|---|---|---|---|---|---|
| Ram | Wether | Ewe | ||||||
| thousands | ||||||||
| Totals | ||||||||
| 1970 | 992 | 1,767 | 42,911 | 432 | 329 | 2,591 | 11,253 | 60,276 |
| 1971 | 985 | 1,732 | 43,017 | 490 | 309 | 2,037 | 10,342 | 58,912 |
| 1972 | 1,029 | 1,584 | 44,152 | 426 | 343 | 2,400 | 10,949 | 60,883 |
| 1973 | 937 | 1,223 | 41,017 | 361 | 313 | 2,248 | 10,585 | 56,684 |
| 1974 | 910 | 1,275 | 40,366 | 316 | 298 | 2,009 | 10,710 | 55,883 |
| Stud Sheep (Entered in Flock Book) | ||||||||
| 1962 | 25 | - | 508 | 7 | 183 | - | 196 | 918 |
| 1967 | 19 | - | 529 | 6 | 215 | - | 215 | 985 |
| 1972 | 19 | - | 557 | 5 | 210 | - | 225 | 1,016 |
| Sheep of a Distinctive Breed but Not Entered in Flock Book | ||||||||
| 1962 | 834 | 2,012 | 29,035 | 450 | 75 | 2,289 | 7,280 | 41,975 |
| 1967 | 919 | 2,479 | 37,184 | 337 | 92 | 2,533 | 10,254 | 53,798 |
| 1972 | 912 | 1,441 | 37,622 | 376 | 105 | 1,988 | 8,818 | 51,262 |
| Crossbred Sheep | ||||||||
| 1962 | 41 | 269 | 4,402 | 93 | 9 | 436 | 846 | 6,096 |
| 1967 | 42 | 225 | 3,695 | 36 | 11 | 287 | 952 | 5,248 |
| 1972 | 97 | 143 | 5,974 | 45 | 28 | 412 | 1,905 | 8,604 |
The 1972 classification of breeds shows that of the 60,882,719 sheep in New Zealand, 40,019,022 (65.73 percent) were Romneys and 8,604,020 (14.13 percent) were crossbreeds. The remainder were composed principally of Corriedale 4,405,591, half-bred 2,537,007, Merino 1,132,905, and Southdown 1,061,539.
Following several years of steady increase, the size of the average flock fell in 1973. A classification of numbers of flocks by size of flock is now given for the latest 5 years.
| Size of Flocks | 1969 | 1970 | 1971 | 1972 | 1973 |
|---|---|---|---|---|---|
| 1- 99 | 5,201 | 5,067 | 5,027 | 4,629 | 5,131 |
| 100- 199 | 2,240 | 2,168 | 2,145 | 1,920 | 1,973 |
| 200- 499 | 4,567 | 4,347 | 4,202 | 3,617 | 3,886 |
| 500- 999 | 5,781 | 5,473 | 5,245 | 5,254 | 4,895 |
| 1,000- 1,499 | 6,131 | 5,745 | 5,461 | 5,274 | 5,054 |
| 1,500- 1,999 | 5,567 | 5,363 | 5,150 | 5,059 | 4,802 |
| 2,000- 2,499 | 3,586 | 3,595 | 3,541 | 3,734 | 3,315 |
| 2,500- 4,999 | 5,118 | 5,335 | 5,273 | 5,775 | 5,331 |
| 5.000- 9,999 | 1,133 | 1,188 | h195 | 1,301 | 1,196 |
| 10,000 and over | 262 | 280 | 276 | 263 | 257 |
| Total flocks | 39,586 | 38,561 | 37,515 | 36,826 | 35,840 |
| Average flock size | 1,514 | 1,563 | 1,570 | 1,653 | 1,582 |
CATTLE—Numbers of cattle at 30 June of the three latest available years are now given by categories.
| Category | 1971 | 1972 | 1973 |
|---|---|---|---|
*Heifers not yet in milk, and cows not in milk during season but intended to be used again for dairying. †One and two year old heifers in calf included in cows in milk during season. ‡Includes bobby calves (40,000 in 1972; 13,542 in 1973). §Includes cows culled from dairy (71,225 in 1973). | |||
| Dairy stock— | |||
| Cows and heifers, two years old and over— | |||
| Cows in milk during season | 2,361,599 | 2,147,991 | 2,087,608 |
| Others* | 69,458 | 57,680 | 45,692 |
| Heifers— | |||
| One and two years old | 285,086† | 487,765 | 476,027 |
| Under one year old | 395,477 | 469,090 | 463,203 |
| Bulls and calves intended for dairy breeding | 86,547 | 86,491 | 72,833 |
| Totals, dairy stock‡ | 3,198,167 | 3,289,017 | 3,158,905 |
| Beef stock— | |||
| Breeding cows and heifers, two years old and over | 1,688,669 | 1,907,208 | 1,981,589 |
| Cows, two years old and over, not used for breeding | 136,284 | 205,855 | 113,231 |
| Heifers— | |||
| One and under two years old | 517,641 | 560,931 | 617,355 |
| Under one year old | 641,692 | 690,825 | 767,185 |
| Steers and bulls of all ages | 1,812,060 | 1,978,977 | 2,214,681 |
| Totals, beef stock | 4,796,346 | 5,343,796 | 5,765,266§ |
| Totals, cattle | 7,994,513 | 8,592,813 | 8,924,171 |
A feature of dairy farming in recent years has been the move to the amalgamation of farms to provide more economic units. The Rural Banking Corporation provided the following annual amounts of capital for farm amalgamations: 1968-69, $6.1 million; 1969-70, $16.3 million, 1970-71, $20.4 million; 1971-72, $22.8 million; 1972-73, $28.2 million; and 1973-74, $11.9 million. The 1974—75 figure was expected to be in the vicinity of $6 million.
The following table shows the number of holdings with dairy cows in milk, grouped according to size of herd in milk. The trend towards amalgamation has resulted in larger herds on individual holdings.
| As at 31 Jan. | Holdings | Total Holdings with 10 or more Cows in Milk | |||||||||
|---|---|---|---|---|---|---|---|---|---|---|---|
| With 10-39 Cows | With 40-49 Cows | With 50-59 Cows | With 60-69 Cows | With 70-79 Cows | With 80-89 Cows | With 90-99 Cows | With 100-149 Cows | With 150-199 Cows | With 200 and Over | ||
| *Entries for 1972 are number of holdings for herd group sizes according to total dairy cattle on holding as at 30 June. | |||||||||||
| 1960 | 9,046 | 4,215 | 4,199 | 3,986 | 2,915 | 2,148 | 1,289 | 3,353 | 31,151 | ||
| 1970 | 2,389 | 1,215 | 1,526 | 1,916 | 2,86 | 2,398 | 2,227 | 9,960 | 23,817 | ||
| 1971 | 2,349 | 932 | 1,145 | 1,459 | 1,662 | 2,036 | 1,937 | 10,895 | 22,415 | ||
| 1972* | 2,350 | 606 | 644 | 808 | 877 | 1,021 | 1,248 | 6,813 | 4,676 | 4,306 | 23,349 |
PIGS—Pig numbers fell in the late sixties as farmers began increasingly to supply whole milk to dairy factories instead of separating off the skim milk, which was frequently used to feed pigs.
| At 31 January | Breeding Sows One Year Old and Over | Other Pigs of All Ages (Including Boars) | Total Pigs |
|---|---|---|---|
| *At 30 June. | |||
| 1969 | 69,223 | 484,165 | 553,388 |
| 1970 | 73,204 | 504,721 | 577,925 |
| 1971* | 78,839 | 473,440 | 552,279 |
| 1972* | 60,319 | 416,670 | 476,989 |
| 1973* | 57,633 | 418,209 | 475,842 |
Particulars as to pig breeds collected in 1950 showed that the principal distinctive breeds were Berkshire (6.6 percent) and Tamworth (5.5 percent), but over 80 percent of the pigs in New Zealand were classified as crossbreeds.
DOGS—The count of dogs registered during the year ended 31 March 1973 showed that there were 230,730 dogs registered in counties, 97,439 in cities and boroughs, and 1,015 in town districts. Unregistered dogs and those up to 6 months old are not included in these figures.
POULTRY—For many years the traditional backyard flock of fowls has been declining in popularity, and the trend has been towards large flocks kept on poultry farms and other commercial establishments. At the 1971 Census, 91,869 households were recorded as owning fowls. This total, which represented 11.5 percent of all households, was little more than half the total 20 years earlier, at the 1951 Census.
In 1970-71 there were 2,823 registered poultry runs forming the basic commercial units of the industry. Of these, 1,524 flocks had fewer than 201 fowls, 218 ranged from 201 to 500 fowls, 158 from 501 to 1,000 fowls, 731 from 1,001 to 5,000 fowls and 192 flocks exceeded 5,000 fowls. There were 4,224,195 birds in these flocks.
The commercial groups sell their eggs through licensed egg floors and are therefore mainly responsible for supplying eggs to retail shops in the cities and larger towns.
Commercial poultry farms are distributed over both Islands, but there are concentrations around Auckland, Christchurch, and Oamaru. The poultry industry does not cater for overseas markets, though limited quantities of frozen egg pulp, surplus to local requirements, are exported.
Reference to the field covered by the Egg Marketing Authority is given in Section 21 of this Yearbook.
The following table shows eggs handled by licensed distributors for years ended 30 June.
| Year | Eggs |
|---|---|
| doz (m) | |
| 1962-63 | 31.0 |
| 1963-64 | 33.0 |
| 1964-65 | 32.7 |
| 1965-66 | 36.0 |
| 1966-67 | 38.3 |
| 1967-68 | 39.4 |
| 1968-69 | 39.9 |
| 1969-70 | 45.4 |
| 1970-71 | 51.0 |
| 1971-72 | 51.1 |
| 1972-73 | 50.9 |
| 1973-74 | 53.4 |
The establishment of “take-away” chicken shops throughout New Zealand and high beef prices has led to increased chicken-meat consumption. Production increased from 13 million to 18 million birds during the 1973-74 year and further expansion is planned. Limited grain supplies in New Zealand in mid-1974 curbed this rate of expansion, though imports of sorghum from Australia enabled the broiler industry to continue at this high level of production in 1973-74.
Poultry meat production for June years is shown in the following table.
| Year | Birds |
|---|---|
| NOTE: All figures are estimates. These have been obtained by a survey of the largest producers, and allowance has been made for other smaller producers. | |
| million | |
| 1962-63 | 2.8 |
| 1964 | 3.0 |
| 1965 | 4.0 |
| 1966 | 5.0 |
| 1967 | 5.5 |
| 1968 | 5.5 |
| 1969 | 6.5 |
| 1970 | 8.0 |
| 1971 | 10.0 |
| 1972 | 11.0 |
| 1973 | 12.5 |
| 1974 | 18.7 |
BEES—The rich pasture lands of New Zealand and some bush areas are favourable for apiculture and the production of high-grade honey, although more intensive farming methods and land development have eliminated many sources of nectar for the bees.
Production for the year ended 31 May 1974 was estimated at 5,740 tonnes of honey and 80,240 kilograms of commercial beeswax. Most of the honey is consumed in New Zealand.
Following is a summary of registrations under the Apiaries Act 1969 at 31 May 1973.
| Group | 1-5 | 6-50 | 51-250 | 251-600 Hives | 601-1000 | 1000+ | Total |
|---|---|---|---|---|---|---|---|
| Beekeepers | 2,308 | 859 | 195 | 72 | 77 | 48 | 3,559 |
| Apiaries | 2,739 | 1,783 | 1,818 | 1,447 | 3,561 | 4,036 | 15,384 |
| Hives established | 6,000 | 14,498 | 25,130 | 24,002 | 56,049 | 82,265 | 207,944 |
Only 197 beekeepers were completely dependent on honey production and beekeeping for their livelihood.
GENERAL—Trees are among New Zealand's valuable assets, with growth favoured by temperate climate and generally adequate rainfall and soil conditions. Until the early nineteenth century extensive evergreen forests covered some two-thirds of the land area of New Zealand, the remaining third being the low-rainfall zones in the east of the South Island (carrying only tussock grasses) and the rocky mountain tops above 1,100-1,400 metres. Because of the abundance, use of timber during the early days of European settlement was wasteful, and in clearing land for farms large areas of native forest were felled and burnt in the interests of land development. There was little regard for conservation, and clearing of the forests extended well beyond the limits now considered desirable. The kauri forests of the far north were almost destroyed by logging and subsequent burning, and the areas of rimu forest in both islands were heavily depleted. It was not until towards the end of the nineteenth century that the need to conserve forests of the high mountain watersheds was recognised, and by the early 1900s national parks and scenic and climatic reserves amounting to just under 1 million hectares had been set aside as permanent forest; the area has since grown to over 2 million hectares (see Section 13).
Today, apart from the national parks, about 4 million hectares of land, valuable either for timber production or for forest growth that is vital to soil and water conservation, has been constituted State forest. The country's timber resources have been built up by afforestation with introduced species, mainly conifers, which produce usable wood in 25-30 years, a much shorter time than the slow-growing indigenous species. State plantations now have an area of about 323,000 hectares, and planting by private interests has contributed an almost equal area. The output of timber from the exotic forests now greatly surpasses that from the indigenous forests, in which cutting is restricted. The exotic species are also the basis of a flourishing pulp and paper industry and an export trade in logs.
The following table shows the present area of forested land in relation to other categories of land.
| Type of Land | Area | Percentage of Total Area |
|---|---|---|
| *1 hectare = 2.47 acres. | ||
| (million hectares)* | ||
| Total forested land | 6.3 | 23.2 |
| Pasture and arable land | 13.5 | 50.0 |
| Other non-forested land | 6.6 | 25.5 |
| Minor islands | 0.1 | 0.3 |
| Lakes, rivers, etc. | 0.3 | 1.0 |
| Total area | 26.8 | 100.0 |
FORESTS TODAY—More than three-quarters of the forest area is classed as unmerchantable. This is mainly Crown-owned indigenous forest which, because it covers much of the remote and mountainous high-rainfall country, has as its primary function soil protection and water regulation. The limited production possibilities it offers must be subordinated to its protective role.
Of the 6.2 million hectares of indigenous forests that remain, only some 0.8 million hectares are merchantable by today's standards for sawmilling. Despite the greatly increased use of exotic timber the indigenous forests are being depleted at the rate of 5,000 hectares a year, primarily for sawn timber.
Merchantable forests also include almost all the planted (exotic) forests, about half of which were established and are owned privately or by local authorities. There are 607,000 hectares of productive exotic forest, over half of which is in the Bay of Plenty - Taupo region, where very large plantings were made from 1923 to 1936. The distribution of the planted forests was influenced mainly by availability of cheap undeveloped land at that time.
The exotic conifers, particularly radiata pine, have high growth rates, ease of establishment and ease of re-establishment on cut-over areas, and they produce wood that has many uses. Plantings of such trees are being extended and developed to provide for increasing domestic and export demand.
The distribution by area of forest land is shown in the table below.
| Forested Land | Indigenous Forests | Exotic Forests | All Forests |
|---|---|---|---|
| hectares (thousand) | |||
| State forest | 2,993 | 343 | 3,336 |
| National parks and reserves | 1,550 | - | 1,550 |
| Unoccupied Crown land | 361 | - | 361 |
| Other tenures | 1,342 | 308 | 1,650 |
| Totals | 6,246 | 651 | 6,897 |
BOTANICAL COMPOSITION OF FORESTS: Indigenous Forests—These can be broadly grouped into podocarp/broad-leaved forest (which includes kauri forest) and beech forest, but there are also many subgroups and transition zones.
Podocarp/broad-leaved forests are found at all latitudes in the three main islands, more particularly those of the north and of the warm wet lowlands and lower mountain slopes, and there is a general increase in luxuriance and in numbers of species from south to north. This type of forest has suffered severely by destruction in land clearing or from heavy logging. There are still some large areas on steep country, such as the Ureweras, but these are essentially protection forests. Fairly extensive areas in the centre of the North Island and on the West Coast of the South Island contain most of the remaining indigenous softwood supplies. Otherwise, the remaining forest of this type consists of pockets, some of which may be worked out in a few decades.
The principal podocarp is rimu (Dacrydium cupressinum) and important secondary ones are totara (Podocarpus totara), matai (P. spicatus), and miro (P. ferrugineus). Important species at higher elevations are Hall's totara (P. hallii) and kaikawaka (Libocedrus bidwillii). Kahikatea (Podocarpus dacrydioides), once common on low-lying swampy river silts now cleared for farming, is becoming scarce. The smaller podocarps of the silver pine group (Dacrydium biforme, D. colensoi, and D. intermedium) are dominant in bog forests occupying limited areas in the central North Island and scattered widely over the South Island although concentrated largely on the West Coast, where they are largely cut over for posts and sleepers.
The main broad-leaved species associated with the podocarps are kamahi (Weinmannia racemosa), rata (Metrosideros umbellata and M. robusta), and tawa (Beilschmiedia tawa) in the North Island and western Nelson.
Kauri forests are found in Northland. In them, kauri (Agathis australis) either occurs frequently or is locally dominant—otherwise they are akin to the podocarp/broad-leaved forest, though with many additional hardwoods. They have been almost destroyed by logging and fire and only limited stands now remain.
Beech forests, in which one or more of the southern beech (Nothofagus) species are dominant, are the forests of the south, of the mountains, and of the dry lowlands; but the species are absent from some localities where their presence might be expected, e.g., Mt. Egmont, the region 160 km south of the Taramakau River in Westland, and Stewart Island. In the main, these forests are protection forests, but there are large areas in accessible regions that have been cut over and are regenerating, and others that have not yet been logged and will be reserved for sustained-yield management or replacement by fast-growing exotics.
Scrub and second-growth broad-leaved species occupy much of the land now classified as forest. There were, before European settlement, limited transition areas carrying manuka (Leptospermum scoparium and L. ericoides) between tussock grassland and forest proper. With deliberate destruction by fire of much tussock and forest these manuka belts have extended, and manuka even occupies extensive areas of destroyed forest remote from its own original stands. In this respect it is important, for it is often a stage in succession back to forest proper.
Exotic Forests—Introduced species of pines form the bulk of the large and valuable exotic-forest estate, and among these radiata pine (Pinus radiata) is the supreme all-purpose tree. Radiata pine grows rapidly in New Zealand (reaching saw-log size in 25-30 years), produces a large volume of usable wood, and is remarkably adapted to a variety of sites. Other major species are Douglas fir (Pseudotsuga menziesii), Corsican pine (Pinus nigra (laricio)), and ponderosa pine (P. ponderosa).
The largest exotic forests are in the centre of the North Island; medium and small plantations are distributed throughout most of the country. Radiata pine constitutes about half the area of State plantations and about 90 percent of private plantations.
MANAGEMENT OF STATE FORESTS—The management activities of the Forest Service are directed towards: protecting, conserving, and, where possible, perpetuating the remaining indigenous forests of the country; creating an exotic forest estate large enough and sufficiently diverse to supply the future needs of New Zealand in timber and other forest produce and to provide for large exports.
Spreading awareness among the general public of the human and physical environment has brought the management of remaining indigenous forests under critical examination. To manage forest land on the basis of optimum use, dominant forest values (whether they are of protection, amenity, production, or otherwise) must be identified and defined. Recognising forest zones is a sound basis for reconciling numerous objectives. Important non-production values are identified first in forest zoning, namely soil and water conservation, biological significance, scenic appeal, and potential for recreation, Wood production values are considered subsequently.
In relation to the approximately 4 million hectares of State forest administered by the New Zealand Forest Service, conservation embraces: the husbanding of indigenous forests yielding timber needed for special purposes, but which are difficult to perpetuate and must therefore be used as sparingly as possible; the management in selected areas of less silviculturally difficult forests, such as Westland terrace rimu, beech, in Southland and north Westland, and kauri in North Auckland, on a sustained yield basis; the creation and management of exotic forests on a sustained yield basis for the production of wood for a wide range of uses; the establishment or maintenance in a healthy state of protective vegetation on hill and mountain land to preserve soil and to control stream channel aggradation; the protection of exotic and indigenous forest against fire, disease, and noxious animals for the maintenance of: a supply of exotic and indigenous wood, a vegetative cover to preserve soil and water values, a habitat for wildlife, and scenic and other amenity values in perpetuity; the legal reservation of selected forest types as forest sanctuaries and scenic reserves; the use of exotic and indigenous forest for recreational and other purposes, including spiritual enjoyment, where this is not incompatible with essential timber production or soil and water conservation.
Indigenous Production Forests—Conservation measures in indigenous production forests involve restriction of the annual cut, rigid insistence on full utilisation, and block sales of carefully measured standing timber. Substantial long-term reserves have also been set aside to ensure the continued supply of high-quality indigenous timber and to safeguard resources against the unlikely event that a major catastrophe should befall the exotic forest estate.
Increasing interdependence between forests and a wider recognition of the social and economic benefits derived from indigenous and exotic forests in regional development emphasise the necessity for planning all forest operations on a regional basis. Stability in output is being sought by the practice of replanting logged areas with exotic species, combined where possible with the planting of adjacent areas of open country. By this means a sustained yield, part exotic and part indigenous, can be achieved.
The ecology of the natural forest associations and the silvicultural characteristics of the individual species are being studied. Past work has shown the importance of preserving a forest climate. Carefully conducted selection logging of terrace rimu forests in south Westland provides a favourable forest environment for the regeneration and growth of rimu.
In many districts, forests of mixed podocarps and tawa have been logged for rimu, leaving tawa behind. Recently, however, tawa has been found useful as a hardwood pulp and in the Bay of Plenty is being used for this purpose.
The kauri forests, now only remnants, are owned principally by the State. Management of them has the objective of perpetuating kauri as a species in the interests of science and public enjoyment, in natural stands and as managed forests. Large representative areas of mature and immature kauri have been set aside as sanctuaries, programmes of research and artificial establishment intensified, and the annual cut reduced to the lowest level consistent with economic, social, and legal constraints.
The prospects of improving and perpetuating the beech forests on a sustained-yield basis are good. Both the major species, red and silver beech, when given the right conditions, will regenerate freely; both grow sufficiently rapidly to produce saw logs in 100-130 years; and both show their best development on sites that are unsuitable for agriculture. Many large areas of beech forests are still intact and, in the case of red beech, there are extensive stands of pole forest which have originated after fire, wind throw, or mining activities. Against these favourable circumstances must be set the presence in many localities of red deer, the browsing of which may check or even prevent effective regeneration.
A survey has been undertaken into the extent and distribution of beech forests in Nelson, northern Westland, and western Southland that may be suitable for production of saw logs and hardwood pulp. Care is being given to the consideration of areas that must be reserved for soil and water conservation or for scenery and recreation, and any forests utilised will be managed on a sustained-yield basis or replaced in part by fast-growing exotics. Details of the proposed management and use of these beech forests are given in the publication Utilisation of South Island Beech Forests (parliamentary paper C.4, 1971). Permanent production is envisaged from some 300,000 hectares of lower altitude beech forest in Nelson, Westland, and Southland conservancies. (There are 3.5 million hectares of beech forest in the South Island.) The Forest Service is conscious of the need to preserve major environmental values in perpetuity.
In early 1974 the Government called for proposals to use beech forests for major pulp industries, although any utilisation proposals are not likely to be effective until 1976. The Southland scheme would take in 50,000 hectares of beech of which 14,020 hectares would be regenerated in beech and 36,000 hectares in exotic species. On the West Coast, the proposal is that 230,000 hectares of beech and other native trees would be converted, of which 100,000 hectares would be replanted in beech.
Exotic Forests—State exotic forests date from 1896, when an Afforestation Branch of the Lands Department was formed and forest-tree nurseries were established at Tapanui and Eweburn in the South Island and at Rotorua in the North Island. Planting began in 1898 and proceeded slowly until 1922, by which time 19,000 hectares had been established. From 1923 to 1936 there was a boom in afforestation, with no less than 150,000 hectares planted by the State and 120,000 hectares by commercial companies. After the boom period planting continued on a more modest scale, but in 1961 State planting was increased and the Government provided for financial inducements to encourage planting by private landholders and local authorities—with the aim of doubling the exotic-forest estate by the end of the century. The annual rate of State planting has more than quadrupled since then (4,000 hectares in 1961, over 17,000 hectares in 1974).
Now that the stage of large-scale utilisation has been reached, there are opportunities to increase productivity by correcting the deficiencies in the distribution of age classes, replacing unthrifty plantations, and improving the quality of the trees, and, at the same time, meeting the demand for forest products and ensuring continuity of supplies. The diversity of products now marketable permits utilisation of trees of a wide range of sizes and aids the operations needed in management practice.
Present policy is to concentrate new exotic forests in areas where there is scope for building up integrated wood-based industries to supply New Zealand markets and material for export. The planted forests (both State and private) already supply over 85 percent of the total wood production and in the future will supply much more.
Stabilisation of Sand Dunes—This aspect of the Forest Service's work has a twofold objective: the stabilisation of dunes for the protection of agricultural and pastoral land, and the establishment of production forests. The Forest Service plants marram grass, sows lupin, and later establishes trees on certain protective zones. Seven schemes are in operation—at Aupouri, Mangawhai, Woodhill, Waiuku, Tainui-Kawhia, Waitarere, and Santoft—embracing a total area of approximately 52,000 hectares. About 23,000 hectares of trees have been planted.
A most successful co-operative venture is under way in two Northland localities, where the Crown has leased large areas of coastal sand dunes (adjacent to Aupouri and Woodhill forests) for stabilisation and afforestation.
Protection Forests—The vegetation of the mountainous areas—forest, scrub, and subalpine grassland—is of the highest importance to the welfare of New Zealand, for many of the rivers that bring water to low-lying farmlands or provide the domestic water supply of cities and towns have their headwaters in the mountainous back country. The mountains receive frequent heavy falls of rain and are mostly formed of rocks that erode easily when exposed to heavy rain and other climatic effects.
The blanket of montane vegetation absorbs much of the rainfall and, by protecting the soil and stabilising unconsolidated rocky slopes, prevents soil and rock from reaching streams and altering their flow characteristics. Settled flood plains can be protected by a combination of river-training works and maintenance of a good cover of vegetation on catchments to ensure the most stable stream flow possible.
Excluding forest parks, the Forest Service controls over 2 million hectares of protection forest land, and its main function here is to maintain the protective vegetation in good condition. The greatest threat is from the large numbers of browsing animals that were introduced many years ago which, in the absence of natural enemies and limiting climate, have multiplied excessively. Consequently the first step in the effective management of these areas is control of these animals. Environmental forestry rangers are trained in field biology, in field geology, and in watershed and range management. They make careful observations of the effects of browsing animals on the vegetation to gauge if control operations have been intensive enough to allow adequate vegetation response.
The Environmental Forestry Division of the Forest Service works in close association with the Forest Research Institute's Protection Forestry Division which investigates such features as the condition and trends of vegetation, alpine climate, rates of erosion, the possibility of introducing new forest and scrub species into badly depleted areas, and changes in animal populations and methods of control.
Recreation in State Forests—Nearly 1 million hectares of State forest are being developed as forest parks which, although primarily protection forests, will also provide recreation facilities. (Recreation in State forests is also discussed in Section 13, Land Use and Resources Development.)
Safeguarding Forests and Timber:Fire Prevention—Fire is the greatest single menace to forests; within a few hours it can destroy a valuable timber crop or undo the work of decades in building up a soil and vegetation balance. Indigenous forests are fairly fire resistant but can become flammable in drought conditions; and severely burnt indigenous forest usually means a destroyed forest because many of the species are difficult to regenerate. Without doubt, however, the major risk occurs in the plantations of exotic conifers.
The fire-protection organisation of the Forest Service operates over the entire country, covering State forests, forests on other Crown lands, scenic reserves, national parks, and all other State areas. A fire-fighting service is maintained wherever the department has fire-fighting responsibilities and well equipped fire-fighting crews can be brought into action at short notice and controlled through a radio network. Aerial fire-detection patrols operate when and where required, and aerial fire fighting, in the form of helicopters fitted with special buckets, has been adapted to deal with fire outbreak in high country and like inaccessible areas. When weather or other conditions are such as to present in the Forest Service's opinion a severe hazard which, by the spreading of forest or rural fires, may endanger life and property, the Forest Service can take charge of an area so endangered by the declaration of a regional fire emergency.
Noxious Animal Control—Under the Noxious Animals Act 1956 the Forest Service is responsible for the control of deer, goats, chamois, pigs, and other introduced wild animals on all lands where the damage they cause is detrimental co the welfare of the country. On State forest and unoccupied Crown land the Forest Service also deals with opossum and wallaby control; but on pastoral land control of these two animals comes under the Agricultural Pests Destruction Council.
The widespread populations of many of these animals have a serious effect on the regeneration of forest trees and ground-cover vegetation, in production as well as in protection forests. The natural forest floor of ferns, mosses, and shrubs has been extensively damaged by such ground-browsing animals as deer and goats, while simultaneously the upper storey is adversely affected by the canopy-feeding opossum.
Damage by deer and opossums in commercial exotic forests has made it necessary to extend control measures into these forests.
Control of Insects and Disease—In conjunction with private enterprise the Forest Service has organised joint spraying operations for the control of the pine needle blight Dothistroma pini. Aerial spraying of a copper fungicide is an inexpensive and effective means of dealing with the disease. Increasing research is being directed towards the debilitating effect of Swiss needle cast (Phaeocryptopus gaeumannii) on the growth of Douglas fir.
Pathologists and entomologists of the Forest Research Institute make a continuous study of diseases and insects harmful to forests and timber. Observers of the institute's forest biology survey maintain a constant watch on the forests and woodlots and shelter belts to detect incipient epidemics in time for effective control measures to be taken; and much information is accumulated which helps to elucidate the relationships between the organisms and the forests.
Timber Inspection and Quarantine—Forest Service timber inspection and quarantine cover all sawn, hewn, and natural round timber, wooden packing, and ship's dunnage entering or leaving the country.
FINANCE OF STATE ACTIVITIES—At present more money is being spent on the establishment and tending of forests than is obtained in revenue. Expenditure by way of general administration of forestry has been met in full from taxation, as distinct from the development of State forests which is financed from national development loans.
Sources of finance are shown in the following table.
| Source | 1969-70 | 1970-71 | 1971-72 | 1972-73 | 1973-74 |
|---|---|---|---|---|---|
| $(000) | |||||
| Consolidated Revenue Account expenditure | 8,155 | 9,772 | 4,122 | 4,946 | 5,746 |
| Less receipts | 168 | 170 | 143 | 128 | 68 |
| Required from Consolidated Revenue Account | 7,987 | 9,602 | 3,979 | 4,818 | 5,678 |
| Works and Trading Account expenditure | 23,748 | 25,918 | 37,278 | 43,829 | 52,016 |
| Less receipts | 21,397 | 23,678 | 26,717 | 30,007 | 40,795 |
| Loan moneys required | 2,351 | 2,240 | 10,561 | 13,822 | 11,221 |
| Net finance required from Government funds | 10,338 | 11,842 | 14,540 | 18,640 | 16,899 |
PRIVATE FORESTRY:Private Forest Estate—Forest holdings other than State forests (New Zealand Forest Service) and those on other Crown lands amount to 308,000 hectares. Of the 19,600 hectares of this established during 1973, 7,000 hectares was added under the Forestry Encouragement Loan and Forestry Encouragement Grants Schemes (local authorities and private persons) and the rest mostly by the larger forest-owning companies.
Extension Services—An increasing awareness among landowners of the value of forestry as a profitable form of land use, stimulated by the various direct and indirect incentives given by Government, and the activities of farm forestry associations established throughout the country have resulted in a marked increase in extension forestry work. Loans have been approved for 392 projects, and grants for 919 schemes, covering a gross area of over 75,000 hectares. A growing number of partnerships, syndicates, and small companies are being formed to acquire land and develop small forests with assistance from the grants scheme.
Forest Taxation—The value of standing trees does not increase any assessment for land tax, death duties, and local body rates and, since 1949, concessions have been made in connection with income tax.
Forestry Encouragement Finance—Under the Forestry Encouragement Act 1962 the Government may grant loans to local authorities towards the cost of establishing and tending new plantations and the tending of those already in existence. For private landholders there has since 13 April 1970 been a scheme in the form of a grant equal to 50 percent of the qualifying costs of establishing and developing new approved forests.
FOREST UTILISATION: Removals of Roundwood—By the 1930s the easy abundance of indigenous timber had gone, whereas some of the exotic forests had reached the stage where harvesting could begin. By 1939, of the 1,700,000 cubic metres per annum of roundwood for industrial use, some 280,000 cubic metres came from the exotic forests. By 1948 the total annual removals of roundwood had gone up to 2,300,000 cubic metres with 820,000 cubic metres from the exotic forests. The exotic forests are now by far the more important source of wood and in 1974 they supplied 7,790,000 cubic metres, or 89 percent of the total supply from exotic and indigenous forests.
The table below shows the quantities of timber produced by the forests of New Zealand to supply the forest industries, which comprise 417 sawmills, eight plywood and veneer plants, two particle board mills, six pulp and paper mills, and a pulp and fibreboard mill. This roundwood production does not include firewood.
| Year Ended 31 March | Indigenous Wood | Exotic Wood | Total |
|---|---|---|---|
| thousand cubic metres | |||
| 1951 | 1,665.0 | 1,161.0 | 2,826.0 |
| 1956 | 1,577.3 | 1,925.5 | 3,502.8 |
| 1961 | 1,557.4 | 3,214.0 | 4,771.4 |
| 1966 | 1,234.6 | 4,627.0 | 5,861.6 |
| 1970 | 1,033.6 | 6,781.9 | 7,815.5 |
| 1971 | 1,013.7 | 7,181.2 | 8,194.9 |
| 1972 | 948.6 | 7,016.9 | 7,965.5 |
| 1973 | 889.1 | 7,353.8 | 8,242.9 |
| 1974 | 918.7 | 7,790.5 | 8,709.2 |
Sawn-timber Production—Radiata pine and other pines account for about 88 percent of the total cut of exotics; Douglas fir provides most of the remainder. Less than a quarter of the country's timber requirement comes from the indigenous forests, and this proportion must inevitably fall as cutting is gradually reduced to the point where a small sustained yield of indigenous timber can be maintained.
The table below gives the production of rough-sawn timber for selected years.
| Year Ended 31 March | Softwoods | Hardwoods | Grand Total | ||||
|---|---|---|---|---|---|---|---|
| Indigenous | Exotic | Total | Indigenous | Exotic | Total | ||
| thousand cubic metres | |||||||
| 1921 | 684 | 24 | 708 | 17 | 2 | 19 | 727 |
| 1926 | 791 | 17 | 808 | 24 | 2 | 26 | 834 |
| 1931 | 491 | 31 | 522 | 21 | - | 21 | 543 |
| 1936 | 588 | 80 | 668 | 24 | - | 24 | 692 |
| 1941 | 654 | 127 | 781 | 26 | - | 26 | 807 |
| 1946 | 533 | 229 | 762 | 45 | 7 | 52 | 814 |
| 1951 | 710 | 451 | 1,161 | 76 | 9 | 85 | 1,246 |
| 1956 | 649 | 720 | 1,369 | 101 | 7 | 108 | 1,477 |
| 1961 | 677 | 925 | 1,602 | 76 | 9 | 85 | 1,687 |
| 1966 | 517 | 1,192 | 1,709 | 73 | 5 | 78 | 1,787 |
| 1970 | 413 | 1,336 | 1,749 | 52 | 5 | 57 | 1,806 |
| 1971 | 399 | 1,404 | 1,803 | 45 | 5 | 50 | 1,853 |
| 1972 | 366 | 1,329 | 1,695 | 47 | i | 54 | 1,749 |
| 1973 | 340 | 1,402 | 1,742 | 40 | 5 | 45 | 1,787 |
| 1974 | 341 | 1,668 | 2,009 | 40 | 5 | 45 | 2,054 |
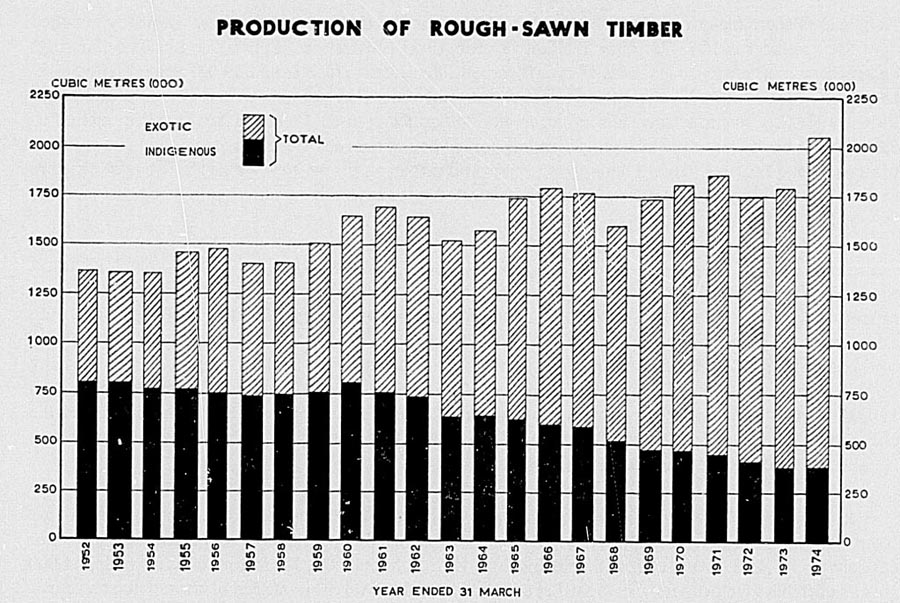
The following table gives details of timber production by species for the past 5 years.
| Species | Year Ended 31 March | ||||
|---|---|---|---|---|---|
| 1970 | 1971 | 1972 | 1973 | 1974 | |
| thousand cubic metres | |||||
| Rimu and miro | 326 | 325 | 303 | 281 | 288 |
| Matai | 35 | 27 | 18 | 18 | 17 |
| Totara | 14 | 12 | 10 | 9 | 7 |
| Kahikatea | 35 | 30 | 30 | 28 | 26 |
| Tawa | 24 | 17 | 23 | 15 | 11 |
| Beech | 26 | 27 | 23 | 24 | 27 |
| Other indigenous | 5 | 5 | 6 | 4 | 5 |
| Totals, indigenous | 465 | 443 | 413 | 380 | 381 |
| Exotic pines | 1,189 | 1,265 | 1,167 | 1,234 | 1,470 |
| Douglas fir | 130 | 124 | 144 | 157 | 177 |
| Eucalypts | 5 | 3 | 3 | 4 | 5 |
| Other exotic | 16 | 15 | 20 | 10 | 21 |
| Totals, exotic | 1,340 | 1,407 | 1,334 | 1,405 | 1,673 |
| Totals (all species) | 1,805 | 1,850 | 1,747 | 1,785 | 2,054 |
Wood-chip Industry—Two wood-chip mills in the Nelson region (one beginning production in 1969, the other in 1971) produce wood chips solely for Japan. Their role is to utilise standing trees unsuitable for sawn-timber production in order to allow replanting with more productive species and to provide a market for forest and sawmill residues.
In 1972 export of wood chips from Mt. Maunganui began. At Christchurch a chip mill has started production, and loading machinery has been installed at Lyttelton, where exports are expected to have started by early 1975. Export of wood chips from Port Chalmers is still under consideration.
Pulp and Paper Industry—The total value of output of the pulp and paper industry reached over $100 million in 1973-74. Over the last 13 years total production of pulp (the basic commodity) has risen at an average annual rate of over 7 percent. Production rose from 239,000 tonnes in 1958-59 to 858,000 tonnes in 1973-74. During the same period total wood consumption in the pulp and paper industry (which includes sawmills of integrated plants) increased from 1,100,000 cubic metres to 3,000,000 cubic metres. The industry is mainly concentrated near the big exotic forests on the volcanic plateau of the North Island. There are six pulp and paper plants in New Zealand, five of which are in the North Island. Of these five, four are integrated with sawmills to utilise fully the total input of wood. The six companies are:
Tasman Pulp and Paper Co.—This company was formed in 1952 to utilise timber from Kaingaroa State Forest. Practical assistance and financial backing were given by the Government, which is represented on the board of directors. The company's plant is at Kawerau, Bay of Plenty. The pulp and paper mill began operation late in 1955 and the sawmill early in 1956. The annual rated capacity of the sawmill is 100,000 cubic metres of sawn timber on the basis of one shift a day, while the capacity of the pulp and paper plant is 220,000 tonnes of newsprint, 109,000 tonnes of chemical pulp, and 186,000 tonnes of mechanical pulp. A new pulp mill began operation in July 1974. It increases the company's production of chemical pulp by 105,000-160,000 tonnes a year. A third newsprint machine is expected to be commissioned in mid-1975.
N.Z. Forest Products Ltd.—This public company utilises over 906,000 cubic metres of timber a year from its own pine forests and also small quantities of hardwood (tawa) from State forests. Plant capacity is 197,000 tonnes of kraft, printing, and writing paper, 570,000 tonnes of kraft pulp, 54,000 tonnes of defibrated pulp for fibreboard production, and 118,000 cubic metres of sawn timber a year—on a one-shift basis. The company is equipped to convert 24,000 cubic metres of timber into wooden cases and to produce 7,800,000 cubic metres of veneer, 12,000,000 square metres of fibreboard, and 38,000,000 multi-wall paper bags annually. The integrated pulp mill, paper mill, sawmill and veneer lathe is at Kinleith near Tokoroa: the fibreboard, multi-wall paper bag, and wooden case mills and plants are in Auckland. The company is also a joint owner, with Australian Paper Mills Ltd. of Australia, in Fibre Products N.Z. Ltd., a firm which makes over 13 million moulded fruit trays a year. N.Z. Forest Products Ltd. have installed a plant to increase chemical-pulp production by 200,000 tonnes a year and an additional paper machine for the production of 100,000 tonnes of industrial papers. An extension to the multi-wall bag plant is expected to come into operation during 1976.
Whakatane Board Mills Ltd., a subsidiary of N.Z. Forest Products Ltd., operates two paper-board machines with an annual production capacity of 77,000 tonnes. The company manufactures its own mechanical and semi-chemical pulp, and is self-sufficient for more than 90 percent of its raw materials; it also uses considerable quantities of waste paper. The company owns its own radiata pine forest at Matahina and hauls the logs 42 kilometres to the mill by road. An associated company, Whakatane Timber Mills Ltd., has its modern sawmill located near the board mill to take the larger logs from the forest. A third paperboard machine is being established and is expected to start production in 1976.
Caxton Paper Mills Ltd. makes tissue and various lightweight papers adjacent to the Tasman Pulp and Paper Co.'s plant at Kawerau. The mill has a capacity of 30,000 tonnes annually.
New Zealand Paper Mills Ltd., at Mataura, has been in operation for more than 80 years. Its three machines produce a wide range of papers from fine tissues to heavy krafts, as well as paper felt, pressings, and manilas for special trade requirements. The mills have been modernised to enable production to be diversified and substantially increased. The company produces a small amount of mechanical pulp, which supplements purchased supplies of New Zealand - made sulphate pulp, imported sulphite pulp, and waste paper. Annual production capacity is 16,000 tonnes of kraft and other papers.
Carter Oji Kokusaku Pan Pacific Ltd.—In 1969 the Government invited tenders for the processing of 9 million cubic metres of wood from Kaingaroa State Forest. After examining the proposals received, the Government awarded the sale of roughly two-thirds of the volume to Carter Consolidated Ltd. This led to the formation of the company, which has built an integrated sawmill and refiner groundwood mill at Whirinaki in the Napier district. This project, which is geared to the Japanese market, began producing wood pulp in March 1973. Present productive capacity is expected to be about 120,000 tonnes of refiner groundwood pulp and 70,000 cubic metres of sawn timber annually. Expansion plans announced will increase pulp production to about 200,000 tonnes a year. Production of newsprint is also planned from about 1980.
H. Baigent and Sons Ltd. has announced its intention to establish a refiner groundwood pulp mill in the Nelson area, to begin production within three years. Expansion to include the manufacture of newsprint is planned for the plant later.
The basic products of the pulp and paper industry are mechanical and chemical pulp, which are converted into such products as newsprint, kraft, and other paper, paperboard, and fibreboard.
The following table gives the production of pulp in New Zealand.
| Year Ended 31 March | Wood Pulp | |
|---|---|---|
| Chemical* | Mechanical† | |
*Chemical pulp includes semi-chemical pulp. †Mechanical pulp includes ground-wood pulp and defibrated pulp. | ||
| tonnes | ||
| 1940 | - | 220 |
| 1945 | - | 15,682 |
| 1950 | - | 21,782 |
| 1955 | 43,897 | 30,043 |
| 1960 | 142,304 | 104,364 |
| 1965 | 196,127 | 206,636 |
| 1968 | 256,494 | 224,709 |
| 1969 | 259,093 | 234,682 |
| 1970 | 316,888 | 244,980 |
| 1971 | 317,074 | 258,948 |
| 1972 | 317,998 | 262,627 |
| 1973 | 339,502 | 260,543 |
| 1974 | 465,300 | 392,689 |
Almost all mechanical pulp is used in the manufacture of paper, paperboard, and fibreboard, but there is a deliberate surplus of chemical pulp for export. (See table on trade in pulp and paper.)
Production figures for paper in New Zealand are as follows.
| Year Ended 31 March | Newsprint | Other Printing and Writing Paper | Other Paper and Paperboard | Total Paper and Paperboard |
|---|---|---|---|---|
| tonnes | ||||
| 1940 | - | .. | 13,079 | 13,079 |
| 1945 | - | .. | 20,949 | 20,949 |
| 1950 | - | .. | 22,136 | 22,136 |
| 1955 | - | .. | 40,917 | 40,917 |
| 1960 | 77,301 | .. | 86,954 | 164,255 |
| 1965 | 187,266 | 12,059 | 116,779 | 316,104 |
| 1970 | 207,403 | 21,022 | 217,551 | 445,976 |
| 1971 | 213,907 | 29,685 | 218,267 | 461,859 |
| 1972 | 218,010 | 23,078 | 227,675 | 468,763 |
| 1973 | 213,221 | 23,629 | 216,585 | 453,435 |
| 1974 | 217,831 | 31,175 | 285,129 | 534,135 |
The rise of production of pulp and pulp products is clearly shown in the following graphs.
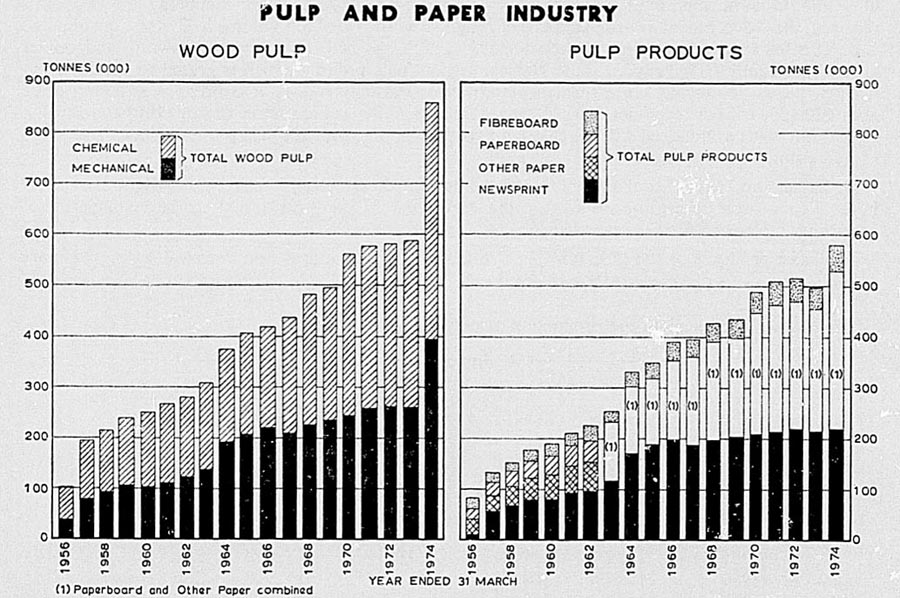
Wood-based Panel Products Industries:Plywood—Eight factories manufacture plywood, and the total output for the year ended 31 March 1974 was 30,100 cubic metres. Total production of veneer in the industry in 1973-74 was 37,800 cubic metres.
Radiata pine has become increasingly important as a species for peeler log supply because of the demand for industrial plywood and now constitutes about 60 percent of total peeler log production. Now that the indigenous forests have become depleted, the production of peeler logs for veneer and plywood manufacture is regarded by the Forest Service as having a first claim on the State forests; hence, in its own logging activities the Forest Service aims at producing the maximum amount of peeler logs, and has recently also adopted a policy of requiring sawmillers logging State indigenous forests to reserve logs suitable for peeling and divert them to the veneer factories.
Fibreboard—Although fibreboard is manufactured from wood pulp, it is by end use a panel product. Production started in 1943 and has increased steadily since. A new mill is planned for Canterbury and should be in production in 1975.
Particle Board—Particle board is manufactured from roundwood and sawmill residues. There is a rapidly expanding domestic market for this product for interior panelling and flooring as well as furniture manufacture.
Waferboard—In 1973 the Fletcher Timber Co. obtained long-term cutting rights in Tairua and Maramarua State Forests to supply a proposed waferboard plant at Kopu, near Thames. Construction of the plant is now well advanced and production is expected to start in 1975.
Production of plywood, veneer, fibreboard, and particle board is shown in the following table.
| Year Ended 31 March | Veneer | Plywood | Particle Board | Fibreboard |
|---|---|---|---|---|
| cubic metres | tonnes | |||
| 1950 | - | 10,900 | - | 13,700 |
| 1960 | 25,000 | 19,100 | 900 | 25,200 |
| 1970 | 30,100 | 24,400 | 24,600 | 40,200 |
| 1971 | 36,100 | 25,700 | 34,700 | 44,400 |
| 1972 | 39,300 | 29,100 | 36,800 | 45,500 |
| 1973 | 31,800 | 27,100 | 44,300 | 44,700 |
| 1974 | 37,800 | 30,100 | 85,800 | 45,500 |
Production of Round and Split Produce—Considerable quantities of native timbers have been used in the past to meet the needs for mining, fencing timbers, and firewood, and for a proportion of sleeper, pole, and bridge-timber requirements. A 1968 survey showed that a total of 7 million fence posts of all types was used: 4jr million of these were wooden, almost all being thinnings or small-diameter logs from exotic plantations.
Wood Preservation—In the year ended 31 March 1973, 43 percent of all sawn timber produced was preservative treated; by world standards the proportion treated is very high, partly because of the relative ease with which otherwise non-durable exotic softwoods such as radiata pine can be treated.
Features of the preservation industry are: the very wide use in house building of timber treated by diffusion or vacuum-pressure methods with water-borne preservative at low retentions to prevent insect borer attack: the wide dispersal of small treating plants specialising in such treatment; and the quality-control function exercised by the Timber Preservation Authority.
Timber Preservation Authority specifications prescribe the preservative treatments for different service conditions. For treatment of exterior timbers against decay multi-salt preservatives (essentially solutions of copper, chromium, and arsenic compounds) at high loadings are widely used, but oil-type preservatives (e.g., creosote) are also acceptable. The usual method of application of multi-salt preservatives is by vacuum pressure, but such variations as the oscillating-pressure method (OPM), the Lowry process, and the alternating-pressure method (APM) have been introduced. Oil-based preservatives are applied by pressure, hot and cold bath, and cold soak and are used for poles, posts, and sleepers. For timber out of contact with the ground and protected from the weather lighter treatment with water-soluble preservatives is acceptable.
The following table shows the quantities of sawn timber treated.
| Year | Open Tank | Diffusion Impregnation* | Pressure Impregnation | Total |
|---|---|---|---|---|
| *Mainly boron. | ||||
| cubic metres | ||||
| 1954-55 | 125 | 16,479 | 145,083 | 161,687 |
| 1959-60 | 71 | 167,277 | 249,743 | 417,091 |
| 1964-65 | 330 | 313,819 | 335,958 | 650,107 |
| 1969-70 | 446 | 307,360 | 404,694 | 712,500 |
| 1970-71 | 19 | 329,001 | 387,824 | 716,844 |
| 1971-72 | 119 | 281,912 | 380,913 | 662,944 |
| 1972-73 | 8 | 291,649 | 476,793 | 768,450 |
In addition, 246,074 cubic metres of other timber, such as sleepers, poles and fence posts, was treated by one of the preservation methods in 1972-73.
OVERSEAS TRADE—Forest products are growing in importance as earners of overseas funds. For the year ended June 1973 exports of forest products were valued at about $90 million; Japan was the largest customer, taking 46 percent, mainly in the form of pulp and paper, and Australia was the next largest, taking 39 percent, mainly pulp and paper. For the same period, imports of forest products into New Zealand were valued at $27 million.
Timber Exports—There is an established market in Australia for radiata pine and Douglas fir sawn timber. Japan is taking mainly logs, but the market there for our sawn radiata pine is expanding. Exports of sawn timber to the Pacific Islands are increasing. Only special categories of indigenous timbers are permitted for export, and these are strictly regulated.
Timber Imports—Durable Australian hardwoods are still imported for use as large poles, cross-arms, wharf, bridge, and constructional timbers, etc. The demand for Douglas fir, redwood, and western red cedar from North America for structural uses, exterior joinery, and weatherboards continues. Other imports are normally limited to tropical hardwoods and sapele for the furniture trade and specialty purposes.
Pulp and Paper Exports—A steadily increasing export market for both pulp and paper is developing mainly to Australia. Chemical sulphate pulp is the only type exported in quantity. Newsprint comprises 85 percent of all paper exports.
Pulp and Paper Imports—Short-fibred pulp and special papers still need to be imported. These two items constitute about half of the value of our total forest products imports.
| VALUE OF EXTERNAL TRADE IN FOREST PRODUCTS | ||||
|---|---|---|---|---|
| Year Ended 30 June | Wood Products | Pulp | Paper and Paper Products | All Forest Products |
| Imports ($000, c.d.v.) | ||||
| 1968 | 4,219 | 1,341 | 7,591 | 13,151 |
| 1969 | 5,006 | 1,178 | 9,851 | 16,035 |
| 1970 | 7,294 | 1,610 | 11,346 | 20,250 |
| 1971 | 6,228 | 2,376 | 12,514 | 21,118 |
| 1972 | 5,658 | 1,684 | 11,418 | 18,760 |
| 1973 | 13,337 | 1,852 | 12,098 | 27,287 |
| Exports ($000, f.o.b.) | ||||
| 1968 | 16,895 | 6,195 | 18,201 | 41,291 |
| 1969 | 29,145 | 7,484 | 20,771 | 57,400 |
| 1970 | 36,834 | 7,286 | 22,214 | 66,334 |
| 1971 | 42,795 | 9,394 | 20,494 | 72,683 |
| 1972 | 46,097 | 11,268 | 24,621 | 81,986 |
| 1973 | 54,570 | 14,099 | 21,060 | 89,729 |
The following tables give New Zealand's imports and exports of timber for the last 6 years.
| TIMBER IMPORTS BY CATEGORIES | |||||||
|---|---|---|---|---|---|---|---|
| Year Ended 30 June | Sawn Timber | Sleepers | Logs and Poles | ||||
| Hardwoods | North American Softwoods* | Oak | Other | Total | |||
| *Douglas fir, redwood, and cedar. | |||||||
| cubic metres (thousands) | |||||||
| 1968 | 11 | 20 | 0.2 | 12.0 | 43 | 0.2 | 11 |
| 1969 | 10 | 19 | - | 11.0 | 40 | - | 8 |
| 1970 | 10 | 31 | 0.5 | 12.0 | 53 | - | 11 |
| 1971 | 10 | 15 | 0.2 | 13.0 | 39 | - | 14 |
| 1972 | 9 | 13 | - | 9.0 | 32 | - | 8 |
| 1973 | 19 | 19 | - | 1.9 | 40 | - | 8 |
NOTE—Figures have been adjusted to include items not given in board feet in published statistics.
| TIMBER EXPORTS BY CATEGORIES | ||||||||
|---|---|---|---|---|---|---|---|---|
| Year Ended 30 June | Indigenous Timber | Radiata Pine | Douglas Fir | Other Exotics | Total Exotics | Total, All Sawn Timber | Logs and Poles | |
| Sawn | Cases | |||||||
| NOTE—Small quantities of roundwood are included in the exports. | ||||||||
| cubic metres (thousands) | ||||||||
| 1968 | 6.0 | 116 | 6 | 25 | 0.5 | 148 | 153 | 1,223 |
| 1969 | 11.0 | 165 | 8 | 57 | 0.9 | 2 | 242 | 1,515 |
| 1970 | 9.0 | 185 | 5 | 62 | 1.7 | 255 | 264 | 1,801 |
| 1971 | 13.0 | 197 | 3 | 58 | 13.0 | 270 | 283 | 1,824 |
| 1972 | 7.0 | 181 | - | 66 | 13.0 | 259 | 266 | 1,872 |
| 1973 | 7.0 | 163 | - | 67 | 12.0 | 242 | 248 | 1,954 |
The following table gives New Zealand's external trade in pulp and paper for the last 6 years.
| Year Ended 30 June | Wood Pulp | Fibreboard* | Paper and Paperboard | ||
|---|---|---|---|---|---|
| Newsprint | Other Paper and Paperboard† | Total | |||
*In 1,000 square feet. †Excludes manufactures of paper and paperboard; values include minor items for which no quantities are given. Basis for valuation: exports—free on board at port of shipment imports—c.d.v. in country of origin. | |||||
| Imports (tonnes) | |||||
| 1968 | 15,054 | 3.1 | 399 | 22,655 | 23,054 |
| 1969 | 11,392 | 15.2 | 982 | 21,562 | 22,555 |
| 1970 | 13,343 | 3.0 | 551 | 23,628 | 24,179 |
| 1971 | 17,531 | 11.5 | 502 | 24,699 | 25,201 |
| 1972 | 12,920 | 3.9 | 360 | 27,363 | 27,723 |
| 1973 | 13,580 | 2.9 | 567 | 32,770 | 33,337 |
| Exports (tonnes) | |||||
| 1968 | 75,535 | 578.1 | 127,198 | 11,733 | 138,931 |
| 1969 | 89,138 | 1,962.8 | 123,297 | 18,455 | 141,751 |
| 1970 | 82,118 | 1,423.6 | 121,526 | 31,302 | 152,828 |
| 1971 | 96,145 | 1,619.2 | 111,441 | 19,744 | 131,185 |
| 1972 | 114,262 | 2,239.5 | 130,936 | 23,616 | 154,552 |
| 1973 | 141,521 | 2,495.7 | 122,972 | 35,752 | 158,723 |
RESEARCH—Since 1947 all forestry and forest-products research administered by the Forest Service has been undertaken or co-ordinated by its Forest Research Institute, Rotorua. In addition, the Department of Scientific and Industrial Research, the universities, and private industrial organisations undertake research into certain aspects.
The Forest Research Institute has three research divisions. They are:
Production Forestry Division—This division is responsible for research into all aspects of growing trees and diseases and insect pests of forest trees. It is subdivided into two branches—Forest Management Branch, which includes: economics of silviculture; forest establishment; forest mensuration; genetics and tree improvement; and indigenous silviculture, and Forest Sciences Branch, which includes: forest entomology; forest pathology; soils and site productivity; tree physiology; and forest biology survey.
Forest Products Division—This division is responsible for research into the properties of timber and the various uses of wood. It has a close relationship with the timber and building industry and is represented on committees associated with building standards, timber preservation, etc. Its fields of research are: adhesives and composite wood products; pulp and paper; timber drying; timber engineering; wood chemistry; wood preservation; wood quality; and wood structure and formation.
Protection Forestry Division—This division is based at Rangiora, near Christchurch. It is responsible for research into the functioning of trees and other vegetation as a protective cover for the high country and the problems of maintaining and restoring that cover in spite of climatic conditions and the depredations of noxious animals. It is also responsible for research into the biology and control of introduced animals which are declared noxious in terms of the Wildlife Act 1953. Its research fields are: animal research; hydrology and climatology; plant ecology; watershed (conditions and trends) survey; and watershed rehabilitation.
All research work is reviewed regularly by three research advisory committees, one for each division. They advise on research needs and help maintain sound and balanced research programmes.
The institute employs 106 scientists, 178 technicians, and a substantial administrative and servicing staff. It has a large research nursery and a tree improvement trial area within its grounds, and has established research trials of both exotic and indigenous forest trees in the North Island and in the South Island. It maintains a continuous exchange of scientific information with other research organisations in New Zealand and throughout the world and provides opportunities for senior research fellowships and the exchange of scientists under reciprocal exchange schemes.
To build up a permanent skilled-labour force, the Forest Service now recruits each year about 80 youths 16 to 18 years of age. These junior woodsmen receive a 2-year course of basic training in the practical skills of forestry at one of the woodsman schools at Kaingaroa, Golden Downs, Berwick, or Aupouri, followed by a third year of advanced training given in small groups in selected forests.
Through the Forestry Training Centre at Rotorua courses are regularly offered in timber grading, seasoning and treatment of timber, and other forestry operations. The Timber Industry Training Centre at Rotorua provides courses for the industry in saw doctoring, sawmilling, and timber machining. Short grading courses for local industry representatives are also held in other centres.
After a lapse of some 35 years, professional education for forestry in New Zealand recommenced at the University of Canterbury in 1970. The basic course leading to the degree B.For.Sc. (with or without honours) extends over 4 years, comprising two intermediate years of pure science followed by 2 years of professional classes. Persons selected as forester trainees are granted bursaries to complete the degree course.
EMPLOYMENT—In 1973 the total number of persons employed in the forestry sector comprised 2.1 percent of the total labour force, and the forest industries employed 10 percent of the industrial labour force. Because the major manufacturing units are logically located near their raw material supplies, there is a concentration of employment near the largest forest areas. This is seen in the central North Island, where over half the country's exotic forests are located and where one-quarter of the regional labour force is engaged in forest industries. In fact the forest industries have had a very marked effect on regional development. The current prosperity and the fast growth of population in the Rotorua - Bay of Plenty area is due in no small measure to the expansion of the forest industries. Apart from the expansion of the established towns such as Rotorua, the industrial development of N.Z. Forest Products Ltd., Tasman Pulp and Paper Co. Ltd., and Caxton Paper Mills Ltd. led to the establishment of a completely new town—Kawerau—and the rapid growth of another— Tokoroa. The development of these industrial complexes has also stimulated other industries, especially transport, vehicle repair, and building and construction. Similarly the expansion of exports of forest products was partly responsible for the increased tonnages that have passed through the ports of Tauranga and Napier over the last decade.
The following table shows the number of employees and working proprietors in the forest industries at 15 April 1973. The industry classification has been revised. Total employment reached 26,531 in 1960, 30,835 in 1965, and 34,930 in 1973. (Source: Department of Labour.)
| At 15 April | Forestry* | Logging† | Sawmilling‡ | Timber Merchanting | Pulp, Paper, and Paperboard | Others§ | Total |
|---|---|---|---|---|---|---|---|
*Includes silviculture, nurseries, etc. †Includes felling, cutting, and haulage. ‡Includes planing mills and plywood and veneer mills. §Includes other wood industries, manufacture of furniture and fittings, wooden and cane containers, and wood and cork products. | |||||||
| 1973 | 3,479 | 2,866 | 7,647 | 3,670 | 4,319 | 18,475 | 40,456 |
THE OUTLOOK—The State owns 75 percent of the remaining indigenous timber and about half of the 0.6 million hectares of exotic forest. It makes sales, usually of standing timber but in some cases of logs, from both types of forest to the timber industry. Owing to the poor prospects of sustained yield from most of the indigenous forests, the policy is to ration the cut to spread the resources over as long a period as practicable. Their contribution to timber supply will inevitably diminish but it is hoped that it will remain a source of special purpose timbers for several decades. The exotic forests are renewable and are managed for sustained yield. Their full possibilities have not yet been reached but owing to the irregularity of past planting programmes their composition is far from ideal and there are problems over maintaining a steady rate of expansion of output.
The large area of exotic forest in private ownership has arisen for the most part from speculative planting in the 1920s and 1930s. Most of the forests then established have since come under the control of industrial companies, which are utilising them and managing them, in several cases, to ensure regular and permanent supplies for their major wood-using factories. The other privately-owned indigenous forests are subject to uncontrolled exploitation and are expected to be exhausted at no distant date.
Long-term industrial expansion will require a continuing increase in the area of the nation's exotic forests (the Forestry Development Conference 1969 recommended a minimum annual new planting programme of 28,300 hectares which, if maintained for the next 18 years, should give the country a total exotic forest area of 1.1 million hectares by 1990). Increased production up to the end of the century would be based for the most part on existing forest resources and would be sustained thereafter by the additional planting proposed.
New Zealand's forest industries are favourably placed in regard to the basic requirement for expansion—wood supplies from exotic forests, which will increase over the next 30 years. Efficient processing is well established, providing a good basis for further expansion; projections indicate that demand for forest products will grow both at home and abroad, particularly for paper. In many countries wood supplies are inadequate for their needs, hence they must import.
Planning must encompass management and utilisation of the forests and any necessary extension of them; requirements in manpower with the necessary skills; requirements in finance; analyses of market development; and requirements in research to develop new products and more efficient techniques.
The Forestry Development Council set up in 1969 is working towards co-operation in national planning to rationalise the forestry sector's future development; its membership includes representatives from Government and industry.
A second Forestry Development Conference has been held with two meetings, one in November 1974 and another in May 1975, to reassess New Zealand's forestry resources and productive capability.
General—Food from the sea figured prominently in the diet of the Polynesian inhabitants of New Zealand for over a thousand years. And although fish was also important to white settlers, it is only within the last decade that fishing has attained status as a significant industry.
Whalers and sealers were the first Europeans to tap the potential of New Zealand waters and in 1844 whale oil and other products were fetching more than £50,000 on London markets.
Fishing existed as a way of life for more than a century until 1945, when the Government of the day introduced a system of restrictive licensing of fishing vessels which provided for the vessels to land catches only at the port of registration. Surplus was exported, but never steadily, and in 1962 a Parliamentary Select Committee was appointed to examine the prevailing restrictive licensing system and review practices. It recommended the abolition of the system, which had restricted the expansion and diversification of the industry.
At this time there was a mounting world-wide demand for protein foods. Russian and Japanese fishing boats were penetrating into the hitherto unexploited south-west Pacific, including New Zealand waters, where of the 42 food fishes known to be caught locally, only 7 were being marketed regularly.
Restrictive licensing was abolished in 1964 and the Fishing Industry Board was established to help promote the industry. Since then fisheries have expanded at an accelerating rate.
The continental shelf, which extends out to a depth of approximately 160 metres, is fairly narrow. Though in some areas, such as the Taranaki Bight, it extends for a considerable distance offshore and in others, such as the south-west of the South Island, it is almost contiguous with the coast line, its average width is approximately 19 kilometres.
In 1966, following the increasing encroachment of overseas shipping vessels into the waters of the continental shelf, a 14 km fishing zone beyond the 5 km territorial limit was introduced, and a later agreement with Japan resulted in Japanese fishing boats being phased out completely from the fishing zone by the end of 1970. The effect was to conserve more fish stocks for New Zealand fishermen.
The establishment of new industrial plant principally for export of quality wetfish, regular supplies, development of attractive packaging, and the introduction of Government quality standards and control are now resulting in expanding export markets.
Advantage has been taken of free access to the Australian market, which is New Zealand's principal outlet for wetfish. Increasing use has been made of air transport and regular sailings of roll-on, roll-off vessels.
Stimulated by the impetus of the 1962 Select Committee, which had recommended freeing the industry from restriction, and with Government assistance, the industry has not only expanded, but begun diversifying into rock oyster and mussel production and begun to employ different catching methods to land tuna and other pelagic species, which represent a large untapped resource in New Zealand waters.
Resources and Fishing Methods—Trawling and Danish seining are the principal methods of taking demersal or bottom-dwelling fish, which form the basis of New Zealand's fishing industry. These two methods accounted for 67 percent and just under 12 percent respectively of the total wet fish catch in 1973. Lines and set nets accounted for another 15 percent. Other methods used are purse seining and trolling, employed in fishing for pelagic or surface-dwelling fish, which form a small, though increasing, proportion of the total wetfish catch.
Between 1964 and 1973 production of fin fish increased from 29,924 tonnes to 43,349 tonnes and the value of all fish exports increased from $4.1 million to over $20 million.
The biggest stimulus to the export industry has been the development of the rock lobster fishery, exports of which have flourished after a demand for frozen tails arose in the United States from 3948 onwards. In 1962 rock lobster landings totalled 4,501 tonnes. Five years later landings had risen to 8,078 tonnes and in 1968 jumped to 10,909 tonnes valued at $7,433,006. This was the peak year of a fishery in the Chatham Islands, where prolific rock lobster grounds had been discovered. Total landings began to taper off to a more stable level in 1971.
Fishing Grounds—There are 36 trawl fishing ports, including 16 of major importance. These are located fairly evenly around the coastline, with trawlers having access to the whole Continental Shelf. The boundary of the shelf occurs at about the 200 metres isobath, which is the maximum depth normally fished by trawlers.
Boats work throughout the year, with no marked seasonal fluctuations. A full-time trawler averages between 100 and 160 days at sea a year, but there are regional variations due to climatic differences.
Trawling is more intensive along eastern coasts, but the fishery on western coasts is increasing, especially in the South Island.
Vessels—Steam trawlers are mostly between 30 and 40 metres in length with a crew of about 10. Motor trawlers are much smaller, but since 1945 their average size has increased from 12 to 16 metres and 16 to 26 gross tons. Engine power has risen from an average of 40 bhp to 150 bhp.
North Island boats are generally larger than those of the South Island. At Auckland and Gisborne average size approaches 20 metres and 200 bhp, and at Lyttelton and Timaru boats average 14 metres.
Crews number between one and three, with the national average about 2.5.
The National Development Conference of 1968 set a target for the fishing industry of $25 million by 1978, including an export target of $7 million for pelagic or surface schooling fish.
At the time of the conference pelagic fish amounted to only 15 percent of the total fishing catch here, whereas they comprise 60 percent of the world catch. By 1971 the percentage of pelagic species in the total New Zealand catch was 21 percent. However, most of these were still trawl caught.
Species landed have been barracouta, trevally, tuna, kingfish, kahawai, mackerel, and pilchard. Of these, barracouta, trevally, and tuna have been exported: 780 tonnes in 1971, compared with 305 tonnes in 1968. Tuna landings in 1968 were 18 tonnes; these rose to 242 tonnes in 1971. Tuna fishing has been pursued in recent seasons by commercial fishermen in the Bay of Plenty and off the Taranaki Bight in the North Island.
New Zealand landing figures offer no real indication of the total potential harvest of the seas in the south-west Pacific, but the presence of Japanese and Russian fleets suggests that there are substantial resources which are, as yet, not overfished. The extent to which the New Zealand industry will participate in fishing this area depends upon the economic outlets for the fish and the availability of capital for investment in large all-weather vessels capable of fishing down to 500 fathoms (914 metres). One Auckland firm has commissioned a new fishing vessel costing $500,000 for purse seine netting of surface schooling fish. Practical research has been undertaken by a United States fishing company under a special arrangement with the New Zealand Government on a fifty-fifty cost basis, United States purse seiner being used to investigate the practical catching of tuna, mackerel, and other pelagic species.
Fisheries Management—Responsibility for the optimum development of fisheries rests with two divisions of the Ministry of Agriculture and Fisheries, the Fisheries Research and Fisheries Management Divisions.
The research programme is headquartered in Wellington, with freshwater centres also in Christ-church and Rotorua. The 42-metre, deep sea research vessel James Cook is used extensively all around New Zealand, and the 19-metre Ikatere mainly for inshore studies in north eastern waters. Virtually all the major New Zealand demersal and pelagic fish species are being studied by the Research Division. A typical end-product is the mathematical model established for the East Cape tarakihi fishery. Shellfish teams also study rock lobsters (life history investigations), dredge and rock oyster (tagging and breeding cycle studies), and mussels (growth rates and other aspects, in various locations).
The 27-metre technological vessel, W. J. Scott, based at Nelson, undertakes various gear tests and explanatory fishing. Among long-standing programmes are management of the Foveaux Strait dredge oyster fishery, rock lobster investigations in Otago, Southland, and Fiordland, elephant fish studies in the Canterbury Bight, toheroa surveys and a study of the shellfish industry in Golden and Tasman Bays.
Development until recent years has in the main been influenced by a traditionally small and highly selective domestic market which has not encouraged diversification in processing methods for fish which did not meet the normal domestic demand for a white fleshed, bland, non-oily, relatively bone-free type of fish.
Generally, fisheries development involves two important factors. First, where a demand develops for a particular type of fish and this stimulates a search for this fish. The demand may be in export fields (e.g., squid) or it may be for local supply (e.g., prawns). The second factor is new treatment and packaging of a resource which has not previously found favour in the traditional fresh fish market in New Zealand (e.g., mackerel).
There are changes in the world-wide demand for fish as the more popular species reach the point of over-exploitation. Thus fish species which in the past had little or no value on either the domestic or the export market are now acquiring a new value internationally. The time is very appropriate for the expansion and development of certain types of fisheries but a great deal will depend upon the economics of these operations.
The governing legislation for the fishing industry is the Fisheries Act 1908, which is administered by the Ministry of Agriculture and Fisheries. The Territorial Sea and Fishing Zone Act 1965 redefined the 5-km territorial seas and introduced a 15-km fishing zone beyond the territorial limit.
Fishing Industry Board—This board was established in 1964 under the Fishing Industry Board Act. Since then there have been great improvements in the quality of fish products and their presentation and in the wider use of less popular fish species. There have been new developments in fishing vessel design and construction; fishing gear and catching methods; in the catching of under-utilised species; in fish farming; in processing, packaging, and marketing; in food technological research; in technical education; in co-operation within the industry.
A levy of approximately 1 percent of the landed value offish came into force on 1 January 1965, and provides finance for the board's activities. The board through its committees investigates local supply and marketing, export development, technical education, tuna development, and fishing demonstrations.
Fishing Industry Finance Committee—In 1965 the Government arranged to guarantee mortgages and make loans through the Rural Banking and Finance Corporation to purchase new, fully-equipped fishing vessels. In October 1970 loans and guarantees became available for development of rock oyster farms, and also loans for cool stores for fish. Up to 31 March 1974, loans totalling $2,947,400 had been approved for 94 new or used fishing vessels, 6 rock oyster farms, 2 flake ice plants, and other miscellaneous projects.
Fisheries Development Council—The Fisheries Development Council, set up in June 1970, was discontinued in June 1974, and most of its functions taken over by the Fishing Industry Board and Government departments. Reviews of the fishing industry's progress will be undertaken by the Ministry with the continued advice and assistance of the former council's target advisory group.
The fishing industry export targets are shown in the following table.
| Category | 1971 Actual | Targets | |||
|---|---|---|---|---|---|
| 1973 | 1975 | 1978 | 1981 | ||
*Based on fanning. †If investigations prove this resource. ‡Targets are speculative as utilisation of resource has yet to be commenced. Note: Target figures embody an assumption that export prices will rise annually by 3.5 percent. | |||||
| $(million) | |||||
| Fin fish (demersal) | 3.66 | 3.69 | 5.28 | 8.06 | 13.02 |
| Fin fish (pelagic) | 0.31 | 1.48 | 3.96 | 11.73† | 19.52† |
| Rock lobster | 13.47 | 10.47 | 11.29 | 13.93 | 16.27 |
| Dredge oysters* | - | - | - | 0.29 | 0.82 |
| Rock oysters | 0.10 | 0.12 | 0.39 | 0.73 | 1.30 |
| Mussels | 0.01 | 0.12 | 0.26 | 0.44 | 1.14 |
| Paua | 1.48 | 0.62 | 0.66 | 0.73 | 1.14 |
| Other shellfish | 0.22 | - | - | - | - |
| Eels | 1.03 | 0.87 | 1.32 | 2.20 | 4.06 |
| Trout | - | - | - | 0.59 | 0.97 |
| Seaweed‡ | - | 0.12 | 0.26 | 0.44 | 0.82 |
| Totals | 20.28 | 17.49 | 23.41 | 39.14 | 59.06 |
SPECIES OF FISH—Of the many kinds of excellent edible fish, the most important is the snapper (Chrysophrys auratus), which is the principal species in the catch (mainly by trawl) in the north-western part of the South Island, the west coast of the North Island, and the east coast of the North Island to just south of East Cape; next in importance is tarakihi (Cheilodactylus macropterus), which is taken mainly by trawlers working off the east coast of the North Island and in smaller quantities off the coasts of the South Island. The groper or hapuku (Polyprion oxygeneios) is caught on lines in the deeper water from North Cape to Stewart Island, but principally in Cook Strait and on the rocky parts of the east coast of the South Island, while the blue cod (Parapercis colias) is the staple line-caught product of the southern line fisheries, particularly about Foveaux Strait, Stewart Island, and at Chatham Islands. The flounder and sole (Pleuronectidae) occur in the more shallow and sheltered waters. Rock lobster (crayfish) are fished mainly at the Chatham Islands and around the south-west of the South Island.
The most productive grounds are in relatively shallow waters, and most of the fishing is carried on at depths of less than 80 fathoms. Depths of over 100 fathoms occur at a comparatively short distance from the coast. The principal methods of fishing are long-lining for groper (hapuku), ling, kingfish, and snapper; hand-lining for blue cod; trawling and Danish seining, by which flounders, snapper, tarakihi, gurnard, John Dory, and a variety of other fish are taken. In bays and estuaries set-nets and drag nets are used for flounders, snapper, and mullet.
Pelagic Fisheries—Blue mackerel, Scomber japonicus (Cuvier and Valenciennes), and jack or horse mackerel, Trachurur declivis, are taken by purse seining. The smaller pelagic species include the pilchard, Sardinops neopilchardus (Steindachner), sprat, Sprattus antipodum Hector, and the anchovy, Engraulis australis (White).
Arripis trutta, the New Zealand kahawai, which forms the basis of a commercial fishery in Australia, schools at the surface in substantial numbers in our waters and is being caught in increasing quantities.
Of the larger, oceanic-pelagic species, the southern bluefin tuna, Thunnus maccovii, is found from the far north of New Zealand to the south of the South Island in summer. Though hardly exploited commercially by local fishermen, it is fished off-shore by Japanese long-line vessels, particularly to the east and west of the North Island.
Albacore, Thunnus adalunga, skipjack, Katsuwonus pelanis, and yellowfin, Neothunnus macropterus are species under investigation.
CATCH—The amount of fish landed annually by the trawler fleet has increased continuously from 6,488 tonnes in 1936 to 29,816 tonnes in 1971.
Composition of the catches is extremely varied and most species are landed whole. About 40 species are landed, but many only in small quantities. Four strongly dominant species contribute 69 percent of the total trawl landings. These are snapper 24 percent, tarakihi 17 percent, trevally 18 percent, and red gurnard 30 percent.
In some individual fishing areas one or two species predominate. The trawl fishery in Hauraki Gulf is largely a snapper fishery, tarakihi is the chief species in the East Cape and eastern Cook Strait areas, and sole, red cod, and elephant fish predominate on the east coast of the South Island.
The catch in landed weight and value is shown in the following table.
| Class | 1970 | 1971 | 1972 | 1973 | ||||
|---|---|---|---|---|---|---|---|---|
| tonnes (000) | $ (000) | tonnes (000) | $ (000) | tonnes (000) | $(000) | tonnes (000) | $(000) | |
| *Excluding fishmeal and oil and whitebait. | ||||||||
| Snapper | 12.8 | 1,801 | 14.1 | 2,157 | 13.2 | 2,174 | 14.1 | 2,601 |
| Trevally | 4.2 | 301 | 5.9 | 468 | 6.0 | 477 | 4.9 | 428 |
| Tarakihi | 5.2 | 759 | 5.2 | 792 | 4.3 | 699 | 3.8 | 683 |
| Gurnard | 3.7 | 360 | 3.3 | 321 | 2.2 | 230 | 3.7 | 430 |
| Eels | 0.9 | 116 | 1.4 | 213 | 2.1 | 360 | 1.3 | 263 |
| Barracouta | 0.8 | 31 | 1.1 | 46 | 1.4 | 76 | 2.8 | 182 |
| Hapuku | 1.5 | 465 | 1.3 | 508 | 1.1 | 457 | 1.3 | 588 |
| Elephant fish | 1.1 | 388 | 1.4 | 458 | 1.1 | 344 | 1.0 | 373 |
| Moki | 1.0 | 107 | 0.9 | 103 | 0.8 | 100 | 0.8 | 128 |
| Flounder | 1.1 | 493 | 0.9 | 406 | 0.0 | 437 | 0.7 | 477 |
| Kingfish | 0.5 | 77 | 0.6 | 94 | 0.6 | 88 | 0.7 | 110 |
| Mackerel | 0.3 | 10 | 0.6 | 25 | 0.6 | 24 | 0.7 | 36 |
| Sole | 1.2 | 404 | 10 | 352 | 0.5 | 229 | 0.9 | 474 |
| Other | 6.4 | 1,133 | 6.4 | 1,210 | 5.5 | 1,124 | 8.1 | 1,774 |
| Totals, wet fish | 40.6 | 6,425 | 44.0 | 7,153 | 40.1 | 6,819 | 44.8 | 8,546 |
| Rock lobster | 6.5 | 8,052 | 5.7 | 9,432 | 4.6 | 8,145 | 4.8 | 9,488 |
| Oysters (dredge and rock) | 9.2 | 1,437 | 9.4 | 1,776 | 8.3 | 1,628 | 10.6 | 2,101 |
| Mussels | 1.0 | 74 | 1.2 | 79 | 2.4 | 148 | 2.4 | 210 |
| Paua | 0.6 | 119 | 1.5 | 370 | 0.7 | 197 | 0.8 | 241 |
| Other shellfish | 0.8 | 154 | 2.0 | 327 | 2.0 | 368 | 3.3 | 674 |
| Other, inch whale oil* | 0.1 | 4 | 0.1 | 5 | 0.1 | 4 | 0.1 | 42 |
| Totals, all fish | 58.8 | 16,265 | 63.8 | 19,142 | 58.3 | 17,309 | 66.7 | 21,302 |
The value of fisheries products is shown in the following diagram.
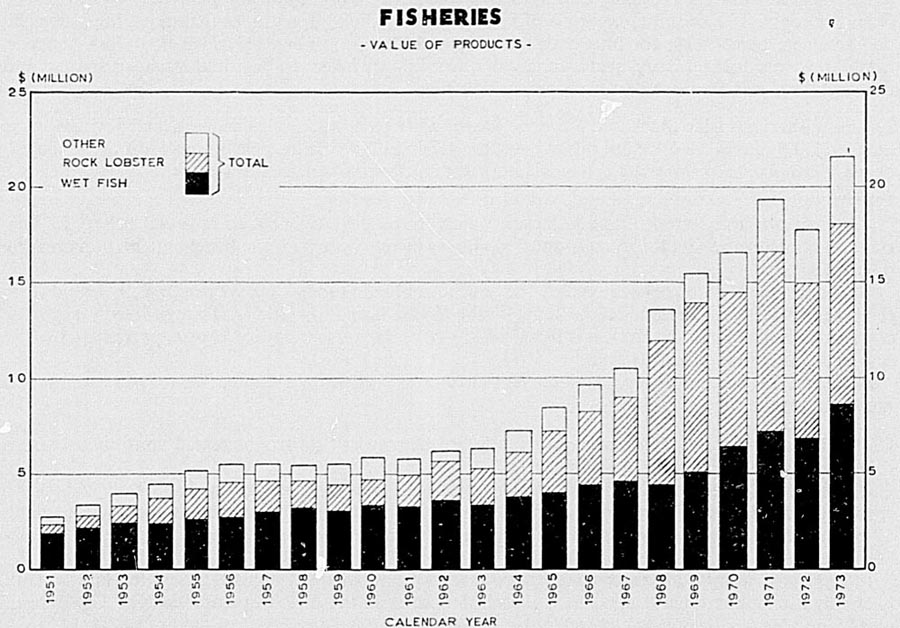
In 1973 there was an improvement in export realisations for wet fish brought about by reducing catches in most parts of the world and increased prices for meat and other alternative protein foods. It is unfortunate for New Zealand producers that when international prices moved in their favour they have been unable to catch sufficient quantities of fish to offset their increased costs with increased earnings.
The long-term economics and profitability of the industry continue to cause concern. Fishing effort has increased but there, is a trend toward a decline in yield per unit of effort. The cost of running vessels has increased enormously, largely because of price rises on petroleum products. The capital cost of plant and equipment, much of it imported, for new or modernised fishing vessels, has skyrocketed. An 18-metre steel vessel costing $90,000 in 1968 cost over $200,000 in 1974. New and more expensive gear is also required. Relatively little is known about the fishing resources that are available for utilisation and it is becoming increasingly important, on account of the high cost of capital investment in the fishing industry, to know more positively the extent and nature of New Zealand's resources for future planning and development to be rational and economic.
MAIN FISHING PORTS—Auckland and neighbouring Manukau continue their leadership of New Zealand fishing ports. These two centres registered 12,584 tonnes of wetfish, of the record 1973 New Zealand total wetfish catch of 44,760 tonnes. Nelson, in third place, is the fastest growing fishing centre; its 1973 wetfish catch, of 4,065 tonnes was 38 percent higher than in 1972. The wide dispersion of the industry is seen in the number of ports reporting catches of over 500 tonnes—21 in 1973, up from 16 in 1972.
FOREIGN FISHING ACTIVITY—The types of fishing being practised by foreigners are, as far as the Fishing Industry Board is aware:
Long lining for tuna, mainly by Japanese vessels, but quite possibly by other nations such as Korea.
Trawling by large vessels, mainly Japanese and Russian.
Squid fishing by Japanese vessels.
In 1972 five Japanese trawlers operating in New Zealand waters caught 18,000 tons of mackerel and 17,000 tons of barracouta out of a total catch of around 49,000 tons.
EXPORTS—A. table showing quantities and values of the principal classes of fishery products exported during each of the latest 3 years is set out below. Rock lobsters, or crayfish, are exported mainly to the United States; for other fish the main markets are Australia and Japan. New Zealand's exports of fish and fish products now go to over 25 countries.
| Commodity | Quantity | Value (f.o.b.) | ||||
|---|---|---|---|---|---|---|
| 1971 | 1972 | 1973 | 1971 | 1972 | 1973 | |
| tonnes | $(000) | |||||
| Rock lobster (crayfish) and tails | 2,323 | 1,735 | 1,746 | 13,468 | 11,200 | 10,669 |
| Fish, fresh or frozen | 8,312 | 11,153 | 10,993 | 4,899 | 6,671 | 7,093 |
| Fish meal | 142 | - | 20 | 25 | - | 3 |
| Other, including smoked and canned | 1,260 | 1,576 | 1,376 | 1,911 | 2,535 | 2,332 |
| Totals | 12,037 | 14,464 | 14,145 | 20,303 | 20,406 | 20,097 |
The 1973 figures may be compared with the “target” figures in a previous table.
CONSUMPTION—The following table shows the annual per head consumption of fish products and the permissible mercury levels in selected countries.
| Country and Period | Per Head Consumption (Edible Weight) | Permissible Mercury Level |
|---|---|---|
| *This is one-tenth of the lowest-level likely to cause ill-effects. | ||
| lb | ppm | |
| Japan (1969) | 67.6 | 1.0 |
| Denmark (1966-68) | 45.9 | 1.0 |
| Sweden (1969-70) | 45.9 | 1.0 |
| Norway (1968-69) | 45.1 | 1.2 |
| United Kingdom (1968-69) | 20.9 | 1.0 |
| New Zealand (1969) | 15.3 | 0.5* |
| Australia (1968-69) | 14.5 | 0.5 |
| Italy (1968-69) | 12.9 | 0.7 |
| Netherlands (1968-69) | 12.1 | 1.0 |
| United States (1971) | 11.2 | 0.5 |
OYSTER BEDS—The principal oyster beds around the coast of New Zealand are those situated in Foveaux Strait, between South and Stewart Islands, and the rock-oyster beds on the east and west coasts of the Auckland peninsula. During the 1972 season 115,090 sacks of oysters were dredged from Foveaux Strait, compared with 100,039 sacks in 1970.
In addition to the four Government experimental rock-oyster farms, a further 70 farms are. in production in Northland and the Hauraki Gulf and an additional 70 leases for farms have been granted. This new industry is in the process of changing from tray to stick cultivation assisted by a large-scale Government spat-stick catching programme.
Rock oysters produced from farms in 1973 totalled 9,558 bags.
ROCK LOBSTERS—Rock lobster, or marine crayfish, occur off many parts of the New Zealand coast. Part of the catch of rock lobster is sold in local markets for domestic consumption and part is exported as frozen rock lobster tails and whole crays.
With the development of the export of frozen rock lobster tails to the United States of America and the productive fishing in the Chatham Islands, the catch of rock lobster increased until 1968. The boom period, however, has now passed and the aim of all concerned is to ensure that this valuable fishery stabilises to provide regular supplies for overseas and local markets.
| Year | Production (Whole) | Exports | ||
|---|---|---|---|---|
| Quantity | Value | Quantity | Value | |
| tonnes | $(000) | tonnes | $(000) | |
| 1966 | 6,553 | 3,844 | 1,799 | 4,619 |
| 1967 | 8,078 | 4,320 | 2,497 | 6,363 |
| 1968 | 10,910 | 7,433 | 3,188 | 12,729 |
| 1969 | 8,896 | 8,861 | 2,953 | 14,235 |
| 1970 | 6,465 | 8,052 | 2,716 | 12,432 |
| 1971 | 5,677 | 9,432 | 2,323 | 13,468 |
| 1972 | 4,573 | 8,144 | 1,735 | 11,200 |
| 1973 | 4,771 | 9,488 | 1,746 | 10,669 |
BIG-GAME FISHING—Swordfish (striped and black marlin, and occasionally broadbill), mako shark, and other big-game fish occur principally off the east coast of the Auckland Provincial District, and attract both New Zealand and visiting big-game fishermen. The principal centres for this sport are Whangaroa, Russell (Bay of Islands), Whitianga (Mercury Bay), Whakatane and Tauranga, where specially designed and equipped launches in charge of experienced men may be hired. The season lasts from December to May, the best months usually being February and March. The record black marl in swordfish (976 lb) was caught off the Bay of Islands.
To preserve this very important fishery the Fisheries (General) Regulations 1950 prohibit the taking of swordfish by other than rod and line, and stipulate that the line be not heavier than No. 39 linen thread line. In addition, a limit bag of not more than four fish per boat per day has been imposed.
In the 1973 season (from November to June), big-game fish caught included 9 black marlin, 101 striped marlin, 12 blue marlin, 455 mako shark.
PAUA—Relatively few years ago paua was, strictly speaking, a non-commercial shellfish. Maoris have traditionally taken paua as a regular item of diet, but it was largely unutilised for food by the pakeha until very recent years. Even now it is only a small item in the retail sales of fish in New Zealand. The recent change in the demand for paua has come about in the context of the ban on the export of unprocessed meat, which would have been processed overseas, since some New Zealand canners have solved the problems of bleaching and canning the meat to produce an article acceptable at substantial prices in, primarily, South-east Asian markets.
A close season for paua from 1 February to 31 May each year was introduced in 1972. Further information is available in the Report of the Fishing Industry Committee 1970-72, parliamentary paper 1.14, 1972.
WHITEBAIT—This fishing is based on Galaxias species which, so far as is known, is not taken on a commercial scale in the other countries where it occurs. Whitebait fishery is carried on in the tidal reaches of many rivers, from August to November in the North Island and from September to November in the South Island. The most productive fishing grounds are near the mouths of the rivers of the West Coast of the South Island and in the lower reaches of the Waikato River. Normally the whitebait fishery gives employment to over 300 regular fishermen, and a greater number of part-time fishers. With improved transport from the more remote rivers, in which aeroplanes have played an important part, a substantial whitebait industry has been developed, particularly on the West Coast of the South Island. The 1973 season for the West Coast of the South Island showed a total of about 45 tonnes.
FRESHWATER FISHERIES: Acclimatised Species—These include quinnat salmon, brown and rainbow trout, and perch. The local administration and management of these species is delegated to acclimatisation societies and to the Department of Internal Affairs for the Rotorua and Taupo fishing districts and for the Southern Lakes Acclimatisation District, where it acts as an acclimatisation society. The Ministry of Agriculture and Fisheries assists with management investigations, and provides technical advice. It also conducts research, on behalf of acclimatisation societies.
A fishing licence is required for the taking of acclimatised fish. The estimated revenue from angling licences in a season is $300,000.
Indigenous Species—Eels are the only indigenous species of which a significant commercial harvest is taken from New Zealand's freshwaters. The catch of “wild” eels dropped sharply in 1973 to 1,286 tonnes compared with 2,069 tonnes in 1972. However, several companies are now engaged in farming eels.
Research—The research programme includes provision for continued limnological studies of the Rotorua lakes. Sources of nutrients, the principal causes of eutrophication, are still under study as is the bottom fauna. Studies of the correlation between trophic status of lakes and the population density and condition of sport fish is being undertaken. Work on whitebait fisheries and stream faunas is continuing in order to determine productivity levels and fish behaviour.
Studies on adult quinnat salmon are to be published and work on fry and smolts is being initiated. In addition work on trout and their inter-relationship to salmon in South Island rivers is being commenced.
Additional work is to be done on the occurrence of trace elements, particularly mercury, lead, zinc, cadmium, and copper, in shellfish from a variety of sea areas, in order to determine the naturally-occurring levels of these elements. New work is planned on parasites and diseases of freshwater fish.
GENERAL—New Zealand had a significant and valuable mineral industry based on gold last century. It opened up large areas of the country, and earned as much as 75 percent of all export earnings in the record year of 1873. Since then, gold mining has almost disappeared, and has given place to the less glamorous mineral enterprises centred around coal, aggregate for roads, sand, limestone, and clay.
With the developments of the last decade the mineral industry has begun to contribute substantially to New Zealand's overseas funds by exports, and may increase the small contribution that has developed by replacement of essential imports. Mineral exploration is extremely costly, and the ultimate results and returns are uncertain, but it reached a high level in 1969, 1970, and 1971. Though no major mines have yet resulted, the impetus given to the mineral industry has continued. Overseas mining and oil companies are investing large sums of high-risk capital in New Zealand, local companies are investing lesser sums, and both are being assisted by local partners. There are major returns in such fields as iron and steel, and natural gas and condensate, and there are good probabilities for china clay and sulphur. Encouraging potential exists for oil, base metals, gold, silver phosphate, and asbestos.
The “5-year plan” approved by the Government in 1964 stressed the necessity for increased basic scientific work in geology, geophysics, geochemistry, and mineral processing. The additional staff engaged by the Department of Scientific and Industrial Research speeded the production of geological and geophysical maps and increased the potential for analysis and laboratory-scale processing tests. This stimulated additional activity in the private sector.
New Zealand looked hopefully towards smelting her extensive ironsand deposits for more than a century. Some of the richest deposits were found at Waikato Heads in an old raised beach deposit, 135 ft above present sea level, that extended well inland under the Waiuku State Forest. These sands are bound together by clay and are brown rather than black at the ground surface.
Mineral engineers and metallurgists in the 1950s and 1960s investigated the best methods of concentrating the titanomagnetic ore from the raw sand, and of recovering the minerals ilmenite and zircon that may prove useful by-products in the future. Smelting tests in overseas furnace types, using New Zealand coal, were carefully observed, and the quality of the resulting steel was found by metallurgists to be particularly high. The sand is now the basic raw material fed to the steel mill at Glenbrook.
Ilmenite, which is a source of titanium oxide used in the paint and other industries, occurs extensively in the beaches of the west coast of the South Island in association with monazite, gold and zircon. A reconnaissance survey by the Department of Scientific and Industrial Research indicated reserves of over 50 million tonnes of ilmenite-bearing sands, and subsequent work by New Zealand and Australian companies has indicated considerable reserves in the Westport and Barrytown areas. The Department of Scientific and Industrial Research has carried out extensive laboratory work aimed at producing a synthetic rutile from these rather low-grade (46% Ti02) ilmenites. The companies concerned have also carried out both concentration and beneficiation studies with encouraging results. The main obstacle to the development of this mineral is now in marketing rather than in treatment.
During the Second World War the Department of Scientific and Industrial Research conducted exploration for sources of high-melting-point waxes at the request of the British Government, and successfully located promising sources in Chatham Island peat deposits. As a result of renewed commercial interest in such waxes, possibilities now exist for production of commercial waxes from these peats, and more recently comparable waxes have been located in the lignites of Otago and Southland.
The Department of Scientific and Industrial Research is now carrying out research in processing methods that might produce saleable products from these minerals. Laboratory-scale work has investigated a range of solvent systems, and different extraction techniques. Larger-scale work is also being done on the production of bulk samples of wax for further analysis and evaluation. Thus successful commercial development will involve co-operation between industry and the Department of Scientific and Industrial Research.
Many recent non-metallic mineral developments are proving viable. The successful establishment of a chinaware industry, based on New Zealand china clays, has been followed by the establishment of a pilot plant that could lead to an export industry of those clays as industrial fillers.
Silica sands are now used for fibreglass and window glass manufacture, as well as for glassware.
Coal is still required in large quantity for the steel industry and for power generation, and the production of high-quality limestone, aggregate, sand, and brick clay has doubled in the last decade.
The Mineral Resources Council, established as the sector council on minerals for the National Development Council, keeps under review all aspects of mineral development.
MINERAL PRODUCTION—In New Zealand non-metallic minerals such as coal, clay, limestone, and dolomite are both economically and industrially as important as metallic ores. Over 90 percent of the value of the present mineral production is represented by coal and limestone, together with sand, rock, and gravel for roads, ballast, building, and construction. The value of aggregate and sand production now exceeds that of coal, and has therefore become the highest of any mineral in New Zealand. The quarrying industry,, which produces about 27 million tons of aggregate and sand and 3 million tons of limestone annually is of prime importance. Substantial increases in mineral exports have taken place since 1972 with the shipment to Japan of ironsand concentrates from Waverley and Taharoa on the west coast of the North Island.
The following table shows the production of metals and minerals from mines and quarries. The values are assessed at pit mouth or quarry.
| Mineral | 1972 | 1973 | ||
|---|---|---|---|---|
| Quantity Tonnes Unless Otherwise Stated | Value | Quantity Tonnes Unless Otherwise Stated | Value* | |
* Based on selling price of product ex mine (or equivalent). † Based on overall price realised at State coal mines (73 percent of total production). ‡ Includes a high percentage of CO2. The value refers to amount sold after CO2 extraction. § Includes stockpile increases in 1973 of 61,031 tonnes at Waipipi and 67,472 tonnes at Taharoa. | ||||
| Fuels | $(000) | $(000) | ||
| Coal | 2,181,253 | 14,062 | 2,468,427 | 16,588† |
| Petroleum Condensate—Kapuni | 177,683m3 | 2,820 | 205,146m3 | 3,438 |
| Petroleum Crude—Moturoa | 146m3 | 3 | - | - |
| Natural Gas—Kapuni | 353.30 x 10⁶m3 | 1,541 | 419.78 x 10⁵m3‡ | 1,872 |
| LPG Gas—Kapuni | - | - | 1,383m3 | 24 |
| Metals | ||||
| Gold | 420.24kg | 732 | 343.5 kg | 791 |
| Silver | 973.23kg | 46 | 1,529.7 kg | 75 |
| Cadmium | 14,033 kg | 23 | 4,327 kg | 9 |
| Copper | 123 | 85 | 43 | 43 |
| Iron Ore | 358 | 3 | 466 | 4 |
| Ironsand/Export | 1,239,003 | 4,463 | 2,030.388§ | 7,268 |
| Local | 141,258 | 674 | 150,776 | 549 |
| Tungsten Ore | 13 | 29 | 1.7 | 4 |
| Zinc | 1,656 | 280 | 605 | 184 |
| Lead | 1,157 | 223 | 319 | 95 |
| Non-metallics | ||||
| Bentonite | 20 | 14 | 1,031 | 28 |
| Clay for bricks, tiles, etc. | 206 | 269 | 2,021 | 348 |
| Clay for pottery, etc. | 9,488 | 117 | 9,218 | 176 |
| Diatomi | 4,996 | 182 | 4,501 | 170 |
| Dimension stone | 23,406 | 163 | 36,547 | 266 |
| Dolomite | 1,874 | 211 | 15,713 | 301 |
| Greenstone | 5,430 kg | 12 | 4,294 kg | 9 |
| Limestone for agriculture | 1,540,443 | 3,301 | 1,698,122 | 3,544 |
| Limestone for industry | 123,193 | 357 | 238,315 | 921 |
| Limestone and marl for cement | 1,467,031 | 941 | 1,783,033 | 1,617 |
| Magnesite | 960 | 18 | 1,155 | 28 |
| Parlite | 2,540 | 4 | 1,599 | 3 |
| Pumice | 129,605 | 72 | 56,909 | 66 |
| Rock for harbour work | 625,326 | 428 | 803,010 | 538 |
| Salt | 59,436 | 385 | 101.500 | 447 |
| Sand, rock, gravel, etc., for building aggregate | 6,464,543 | 10,767 | 6,660,232 | 12,294 |
| Sand, rock, gravel, etc., for roads and ballast | 21,245,755 | 21,043 | 22,591,859 | 23,195 |
| Sand for industry | 104,864 | 166 | 39,324 | 66 |
| Serpentine | 96,175 | 241 | 73,726 | 262 |
| Silica sand | 110,069 | 327 | 124,405 | 389 |
| Totals | .. | 64,003 | .. | 75,611 |
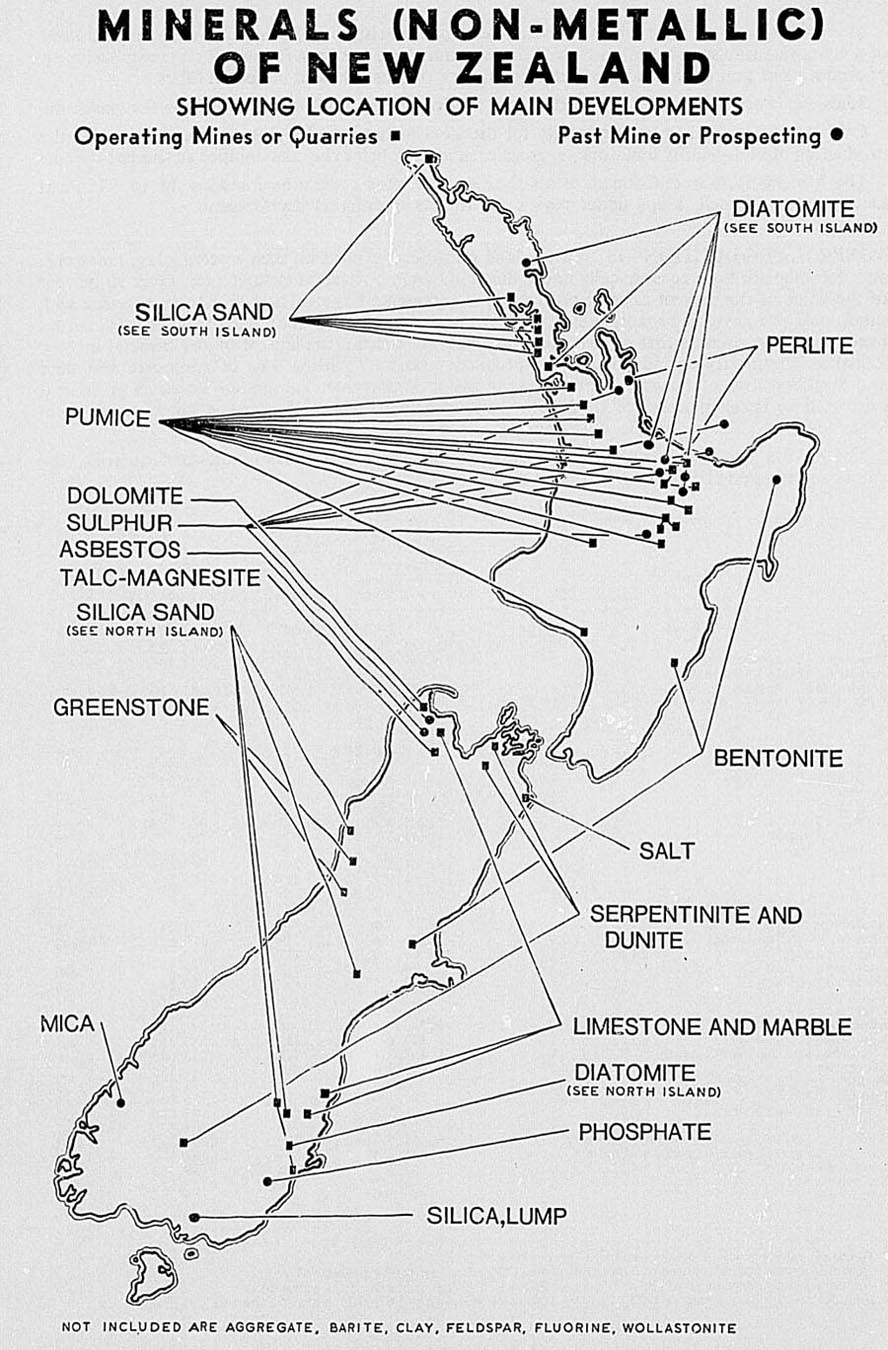
The following summary figures are the mineral industry export targets in constant 1969-70 prices unprocessed as set by the Mineral Resources Council.
| Item | 1969-70 | 1972-73 | 1975-76 | 1978-79 | 1981-82 |
|---|---|---|---|---|---|
| All minerals and metal ores— | $(million) | ||||
| Assured | 0.4 | 5.6 | 12.6 | 12.6 | 12.6 |
| Probable | - | - | 3.3 | 6.5 | 13.0 |
The 1972-73 exports figure comprises ironsands, lead-zinc ores, scheelite, and pumice. The 1978-79 figure is based on confirmed ironsand contracts, and the prospects of coal, clay, and ilmenite.
The corresponding additional figures for import savings (i.e., for selected minerals which would otherwise need to be imported) and for total production (i.e., Mines Statement totals plus geo-thermal steam including exports and domestic production of aggregate, limestone, coal, etc.) are as follows.
| Item | 1969-70 | 1972-73 | 1975-76 | 1978-79 | 1981-82 |
|---|---|---|---|---|---|
| Import saving— | $(million) | ||||
| Assured | 1.7 | 5.0 | 7.0 | 10.5 | 11.9 |
| Probable | - | - | - | - | 15.0 |
| Round total | 1 1/2 | 5 | 7 | 10 | 27 |
| Total mineral production | 52.6 | 64 | 79 | 88 | 115 |
LEGISLATION—Legislative control of mineral production is contained in the Atomic Energy Act 1945, the Coal Mines Act 1925, the Iron and Steel Industry Act 1959, the Mining Act 1971, the Quarries Act 1944, the Petroleum Act 1937, and the Continental Shelf Act 1964. The administrative agency is the Mines Department.
COAL—Coal in New Zealand has for many years been mined in certain well defined areas, outside which no coal is known to exist in any significant quantities. The major coalfields, with the class of coal found in each, are—
Bituminous Coal (Coking): Greymouth, Westport (Buller Coalfields), Reefton (Garvey Creek).
Sub-bituminous Coal (Non-coking):s Waikato (including North Taranaki), Otago (Kaitangata), Southland (Ohai), Reefton.
Lignite (Non-coking Low Grade): Southland (Mataura).
Coal Utilisation and Research—Coal utilisation and research is being fostered by the New Zealand Coal Research Association. Finance for the Association's activities is raised by a levy of 7.5 cents a ton made by coal wholesalers, including State coal mines, and a Government grant.
Fuel Technology Service—The Mines Department and the Coal Research Association have established a fuel technology service in Auckland, Palmerston North, Christchurch, and Dunedin to advise industrial and domestic consumers on the efficient use of coal.
Survey of Coal Resources—Investigation of coal resources is now being carried out in three phases: (i) mainly geological and chemical activities; (ii) detailed topographical surveys and shallow prospecting by means of cuts, pits, and hand drilling; (iii) investigations by deep-core drilling. For detailed information concerning geology, coal type, rank, and extent of the coalfields, those interested are referred to Geological Survey Bulletins Nos. 17, 45, 51, 56, and 59, and for an overall picture to Economic Geology of New Zealand, Volume 4, Eighth Commonwealth Mining and Metallurgical Congress, procurable from the Government Printer, Wellington.
A fresh estimate of the coal resources of New Zealand prepared in 1974 was based on information obtained by the Mines Department and the Geological Survey. The classification accepted—"measured”, “indicated”, and “inferred”—is that used by the United States Bureau of Mines and also accepted in the Commonwealth Mineral Resources Survey issued by the British Commonwealth of Nations Scientific Liaison Offices, London. These terms are simply defined as follows.
“Measured coal” is coal for which tonnage is computed from dimensions revealed in outcrops, trenches, workings, and drill holes and for which the grade is computed from the results of detailed sampling. The sites for inspection, sampling, and measurements are so closely spaced and the geologic character is defined so well that the size, shape, and content are well established.
(2) “Indicated coal” is coal for which tonnage and grade are computed partly from specific measurements, samples, or production data and partly from projection for a reasonable distance on geologic evidence. The sites available for inspection, measurement, and sampling are too widely or otherwise inappropriately spaced to outline the coal completely or to establish its grade throughout.
“Inferred coal” is coal for which quantitative estimates are based largely on broad knowledge of the geological character of the deposit and for which there are few, if any, samples or measurements. The estimates are based on an assumed continuity or repetition for which there is geologic evidence; this evidence may include comparison with deposits of similar type. Bodies that are completely concealed may be included if there is specific geologic evidence of their presence.
The categories of coal resources refer only to the probability of their existence and may be applied either to coal in the ground or to recoverable coal.
The following table sets out the estimated recoverable reserves, which total 836 million tons. (Much of what was formerly included as inferred is now regarded as speculative.)
| Locality | Measured Recoverable | Indicated Recoverable | Inferred Recoverable |
|---|---|---|---|
| *Additional coal is likely to exist in the Mataura area, but further tonnage would be speculative | |||
| Bituminous | tonnes (000) | ||
| Buller | 33,027 | 4,703 | 11,400 |
| Murchison | - | 10 | 1,600 |
| Garvey Creek | 395 | 2,080 | 4,000 |
| Reefton | 670 | 1,400 | 11,500 |
| Greymouth | 2,012 | 15,500 | 28,000 |
| Pike River | - | - | 15,000 |
| Shag Point | - | 10 | 50 |
| 36,104 | 23,703 | 71,550 | |
| Sub-bituminous | |||
| Waikato (includes Maramarua, Huntly, Rotowaro, Glen Massey, Whatawhata) | 132,910 | 54,730 | 86,300 |
| Kawhia | 350 | 550 | 7,000 |
| Mangapehi | - | - | 10,000 |
| Taranaki (includes Tatu, Ohura, Waitawhera, Mokau) | 200 | 300 | 62,700 |
| Retaruke | - | - | 6,000 |
| Collingwood | 100 | 100 | 100 |
| Heaphy River | - | - | 1,000 |
| Charleston | 1,130 | 3,900 | 5,000 |
| Punakaiki | 90 | 70 | 2,000 |
| Reefton (includes Inangahua, Fletcher Creek) | 75 | 1,000 | 6,000 |
| Kaitangata | 800 | 250 | 250 |
| Ohai | 3,700 | 5,700 | 50,000 |
| Orepuki | - | - | 1,000 |
| 139,355 | 66,600 | 237,350 | |
| Lignites | |||
| Canterbury | 120 | - | 2,000 |
| North Otago | 240 | - | 2,000 |
| Central Otago | 240 | - | 15,000 |
| South Otago (includes Green Island, Kaitangata) | 4,980 | 12,800 | 42,700 |
| Pomahaka | - | - | 60,000 |
| Southland (including Mataura Valley*) | 5,000 | 4,300 | 111,600 |
| 10,580 | 17,100 | 233,300 | |
| Totals | 186,039 | 107,403 | 542,200 |
One of the biggest potential uses for coal is for electricity generation.
There is likely to be a smaller number of larger, mechanised underground mines. Coal mining will become less labour-intensive.
There are three coal areas of major future significance—Waikato, Butler and Southland.
Waikato has measured and indicated resources of low/moderate-ash low-sulphur sub-bituminous coal of 188 million tons—one-fifth of it opencast. Inferred resources, which are at present being drilled, are an additional 86 million tons. Production costs range from $4$ 1/2 to $7 per ton. Sufficient reserves are known to supply a 1,000 MW power station, plus the steel industry's projected requirements. Further work to increase measured and indicated reserves is currently being undertaken for proposed additional thermal station capacity. The Waikato coalfield is well placed to serve Auckland industrial development, and coal is railed to the Bay of Plenty for the pulp and paper industry. New Zealand Steel's development programme anticipated an increased demand of 500,000 tons a year by 1983.
Main markets for Waikato coal are electric power generation, dairy factories, paper mills, freezing works, carbonisation, central heating, brick and tile manufacturing, cement and lime works, general industries, and domestic heating.
Buller has measured and indicated resources of low/moderate-ash, low/high-sulphur bituminous coal amounting to 40 million tons, three-quarters of it opencast, but only 7 million tons of it low-ash and low-sulphur. Inferred reserves amount to 12 million tons. The significant fact is the high proportion (about 30 million tons) of opencast, and therefore low-cost ($5 per ton) coal.
Southland essentially comprises the Ohai and Mataura Valley coalfields. Ohai contains over 100 million tons of Waikato-type coal, mostly inferred, but has little significance because the principally domestic market is likely to decrease. Mataura is important because of its proximity or ready access to the Bluff industrial area, and because the reserves of moderate-ash, low-sulphur coal are large, and potentially cheap ($2 per ton) and open-castable. Because the flat-lying seams seldom outcrop, and there are relatively few drillholes, there is potential for a very large speculative tonnage of coal to be present in addition to the inferred recoverable reserves. Future potential uses possibly include power generation.
Coal Consumption—Coal has always been important in New Zealand's mineral industry, and had a higher production value than any other mineral between the First and Second World Wars, but usage has slumped in recent years.
The approximate distribution of coal consumption during each of the latest 6 years is shown in the following table. The total quantity is based on actual production in each year plus imports and minus exports.
The major users over a period and forward estimates are set out in the following table.
| User | 1946-50 (Average) | 1960 | 1971-73 | 1978 | Estimated | |
|---|---|---|---|---|---|---|
| 1985 Low | 1985 High | |||||
| NOTE—In 1973 itself, coal sales amounted to 2,422,000 tons, principally because sales for electricity generation were 200,000 tons above the 3-year average. | ||||||
| Tons(000) | ||||||
| Household | 600 | 540 | 280 | 220 | 140 | 180 |
| Railways | 565 | 219 | - | - | - | 80 |
| Gas works | 315 | 277 | 100 | 80 | - | - |
| Dairy factories | 200 | 288 | 265 | 300 | 200 | 300 |
| Meat works | 155 | 155 | 105 | 150 | 100 | 150 |
| Cement and lime | 110 | 168 | 250 | 300 | 300 | 350 |
| Shipping | 75 | 9 | - | - | - | - |
| Electricity generation | 70 | 601 | 600 | 1,200 | 2,200 | 2,500 |
| Pulp and paper | 50 | 121 | 80 | 150 | 100 | 200 |
| Steel | - | - | 70 | 200 | 300 | 500 |
| Other factories | 280 | 267 | 150 | 100 | 60 | 90 |
| Other consumers (hospitals schools, central heating) | 380 | 273 | 310 | 350 | 400 | 500 |
| 2,800 | 2,918 | 2,210 | 3,050 | 3,800 | 4,850 | |
Summary of Operations—The following table summarises coal-mining operations.
| Year | Output | Persons Ordinarily Employed | |||||
|---|---|---|---|---|---|---|---|
| Underground | Opencast | Total | Underground Mines | Opencast Mines | Total | ||
| Surface | Underground | ||||||
| tonnes(000) | |||||||
| Prior to 1969 | .. | .. | 173,193 | .. | .. | .. | .. |
| 1969 | 1,255 | 1,108 | 2,363 | 671 | 1,594 | 331 | 2,596 |
| 1970 | 1,178 | 1,208 | 2,386 | 619 | 1,353 | 325 | 2,297 |
| 1971 | 946 | 1,178 | 2,124 | 509 | 1,093 | 334 | 1,936 |
| 1972 | 788 | 1,393 | 2,181 | 470 | 883 | 311 | 1,664 |
| 1973 | 799 | 1,670 | 2,469 | 427 | 792 | 336 | 1,555 |
| Totals | .. | .. | 184,716 | .. | .. | .. | .. |
In 1973 the State operated 13 of the 16 underground mines in operation, and these produced 658,353 tonnes of coal; 11 of the 33 opencast mines were operated by the State and they produced 1,129,006 tonnes of coal. The loss on operations of State coal mines in 1973 was $1,330,009 without charging interest on loan capital. This was the lowest trading loss of State coal mines since 1957, and their highest production ever achieved.
While State coal mines have ensured that they have the capacity to meet a considerably increased demand in 1974, it is questionable that a high rate of increase in demand will continue, apart from predictable increases required by power stations and other major uses.
Derived Products—Low temperature carbonisation works, using the Lurgi Process, at Rotowaro, 110 km south of Auckland, produced during 1973, 15,105 tonnes of carbonettes, 2,122,365 litres of tar and oil, and 19,942 tonnes of char from 55,720 tonnes of slack coal, which was part of the output from local State mines.
Mercer Power Station—This station, of 180,000 kW capacity, if working at full capacity, can burn up to 700,000 tonnes of coal a year. Two-thirds of the coal is provided from the Kopuku opencast coalfield about 11 km distant from the station, and the remainder from the Huntly coalfield.
Huntly Power Station—Following delays in coming to an agreement on the price of natural gas, it has been decided to build a 1,000 MW coal-fired station at Huntly, the first unit (250 MW) of which is scheduled to be commissioned in April 1978. Investigations have confirmed the existence of a large underground coalfield sufficient to provide fuel for the station.
PETROLEUM AND NATURAL GAS—Prospecting and mining for petroleum in New Zealand is governed by the Petroleum Act 1937, the Petroleum Regulations 1939, and the Continental Shelf Act 1964. These give the Minister of Mines the jurisdiction to grant petroleum prospecting and mining licences on (a) land and in marine areas including territorial waters, and (b) the continental shelf; for the former there are 317 current prospecting licences covering 135,615 square kilometres and for the latter 33 licences covering 997,129 square kilometres.
Activity in the search for petroleum is being maintained. Geological and geophysical work (including seismic surveys) is being conducted by several licence holders in various areas throughout New Zealand.
Gas from the Kapuni field is treated for the removal of carbon dioxide and piped between Auckland and Wellington. It is used mainly as a premium household fuel although some will be used for the generation of electricity and for industry. Gas reserves are estimated to be sufficient for 25 years. Condensate from Kapuni provides some of the feedstock for the Whangarei refinery.
The Natural Gas Corporation Act 1967 established a corporation to purchase, transport, and market natural gas. Construction of the 377 miles of 8| in. trunk pipeline was completed and natural gas came into use in 1970 in nine North Island centres—Auckland, Hamilton, New Plymouth, Hawera, Wanganui, Palmerston North, Levin, Hutt Valley, and Wellington. (See Section 20c.)
In 1969 the Maui gas field was discovered off the Taranaki coast 33 miles from Opunake. It was subsequently found to extend over an area of 765 square kilometres (295 square miles) placing it among the 20 largest gas fields in the world. The recoverable economic reserves of the field are estimated to amount to about five million cubic feet of high quality methane gas. In addition, oil condensate from the field is likely to supply from 10 to 15 percent of the feedstock requirements for refining in New Zealand.
In April 1973 the Government and the Shell-BP-Todd consortium reached an agreement for the joint development of the main gas field. A gas contract, for 30 years, has been signed providing for the sale to the Crown of the gas which will be used for electric power generation. The first commercial deliveries of the gas are scheduled for October 1978 and it will be used to fuel the New Plymouth power station and stations in Huntly and Auckland. The Ministry of Works and Development will design and build the pipe lines to carry the natural gas to New Plymouth and Auckland.
DEVELOPMENT OF MAUI FIELD—Construction of the Maui field off-shore and associated on-shore facilities will take place in two distinct stages. It is planned that construction of the first stage will be completed in 1978 at a total cost, estimated in terms of 1972 values, of $92.5 million. This stage of construction involves the installation of a single, three-deck platform structure at the Maui 3 location, with a potential gas delivery capacity of 600 million cu ft a day, as well as the laying off-shore of a 24-in. diameter gas pipeline and a 10-in. diameter condensate pipeline.
The second and final stage of construction is currently planned to take place during the period 1979-83 at an estimated cost (in terms of 1972 values) of $78.5 million. This stage could consist of installing a single platform structure with a gas delivery capacity of 300 million cu ft a day at the Maui 1 location and the installation off-shore of a 20-in. diameter gas pipeline and a 10-in. diameter condensate/crude pipeline. The condensate/crude pipeline may be connected with the then existing Maui 3 platform condensate pipeline.
Both cost estimates provide for expenditure to be incurred in constructing on-shore processing facilities as well as the necessary condensate/crude stabilisation plant and pipeline to New Plymouth.
The total length of the main on-shore pipeline will be approximately 245 miles. The diameter of the pipeline will be 34 in. as far as New Plymouth where it will reduce to 30 in. The diameter will be further reduced to 24 in. at the first Auckland power station lateral joint.
Pipeline consultants employed by the Government have estimated the on-shore gas transmission system would cost approximately $92.6 million in 1972 values. This investment would be spread over the period 1975 to 1988. The costs to be incurred during the 1980s largely consists of expenditure on the construction of the compressor stations.
A broad breakdown of the total costs involved in the development of the Maui field as currently estimated, is as follows:
| Item | Cost |
|---|---|
| Off-shore: | $(m) |
| (a) Platforms, submarine pipeline, and development drilling | 133.0 |
| (b) Off-shore production facilities and on-shore production facilities | 38.0 |
| (c) Land pipeline and base facilities | |
| (d) Other expenditure (including insurance, administration and contingency fees) | |
| On-shore: | |
| (e) Pipeline gas transmission system | 92.6 |
| Total | 263.6 |
IRON RESOURCES—New Zealand's largest resources of potential iron ore are contained in the black sands of the western beaches—from Westport southwards in the South Island and from Wanganui to Muriwai in the North Island. Titanomagnetite sands make up most of the black sands in the North Island, but from Waikato Heads northwards the beach deposits also contain ilmenite in varying proportions. In the South Island beach sands, ilmenite is the chief iron-bearing material. These beach sands have been estimated to contain some 800 million tons of titanomagnetite, with a further 8.6 million tons of ilmenite in the North Island and 43 million tons in the South Island.
A process has been developed whereby the titanomagnetite sands can be smelted on a large scale economically to produce a good grade of steel. A steelworks has been constructed at Glenbrook, 58 km south of Auckland, by New Zealand Steel Ltd., and the plant began production late in 1969 using ironsand deposits from the North Head of the Waikato River, 19 km away. Production of steel billets from ironsand commenced in November 1969.
There has been a small annual production of iron ore from the Onekaka deposits and certain small deposits in the North Auckland district, for use in gas purification, the preparation of stock licks, and in the brickmaking industry.
Near Waverley, 32 km north of Wanganui, an ironsands mining unit produces titanomagnetite concentrates for direct export to Japan through off-shore bulk-loading facilities and in 1973 some 1,008,231 tonnes were exported. N.Z. Steel Ltd. has developed a similar undertaking at Taharoa, near Kawhia, and shipments of concentrate to Japan began in October 1972, and 893,655 tonnes were exported in 1973.
URANIUM—In 1955 uranium-bearing minerals were discovered in the Buller Gorge. These deposits occur in steep, broken country which is heavily covered with bush. The area is subject to heavy rainfall and access is difficult. Prospecting work, however, has been disappointing and, so far, ore has not been found rich and extensive enough to be worked economically at present price levels. Interest is being maintained in the investigation of these areas.
The Atomic Energy Amendment Act 1957 amended the Atomic Energy Act 1945 by adding several new provisions designed to encourage the search for and production of uranium or other substances which may be used for the production of atomic energy.
GOLD—The gold-mining industry, which in its early stages contributed greatly to the progress and settlement of New Zealand, declined in importance with the exhaustion of the more accessible alluvial-gold deposits and of ore from the zones of enrichment. Annual production is now almost confined to one dredge at Taramakau on the west coast of the South Island. However, the increase in the price of gold has stimulated prospecting in Coromandel, Nelson, Westland and Central Otago.
SILVER—Formerly most of the locally produced silver exported from New Zealand was obtained from the refinement of bullion from the quartz mines of the Hauraki goldfields, where gold and silver were found alloyed. Recent production in the area was contained in the lead sulphide concentrates exported to Japan. A small quantity of silver is won by the West Coast gold dredges.
TUNGSTEN—The principal ore of tungsten in New Zealand is scheelite, though a little wolfram is found in Otago and Stewart Island, but not in economic quantities.
The scheelite-bearing quartz-veins are generally small and broken, while the scheelite is most erratically distributed in the veins, with the greatest concentration of scheelite situated close to the surface or at shallow depth. Access and transport present difficulties, and production costs are relatively high. Although the price of tungsten ores has improved, scheelite mining is on a small scale. Mining is confined to the Glenorchy and Macrae's Flats fields in Otago.
COPPER—Production of 43 tonnes in 1973 was from the Tui mine, near Te Aroha, but this mine closed in October 1973. Small mines have been worked in Northland in the past, at Parakao (where the carbonite and oxite ore was used as a fertilizer additive) and Pupuke. Prospecting has been carried out at a number of localities, but no significant deposits have been discovered. Further work is being done, chiefly on the Coromandel Peninsula.
MANGANESE—Manganese ores are found in many localities, chiefly in the older sedimentary rocks. Prior to 1960 there was some production from deposits at Bombay, Moumoukai, and Otau, all in the Auckland district. Deposits are, however, generally small and shallow and capable of producing only limited tonnages of ore.
MERCURY—Cinnabar, the principal ore of mercury, is widely distributed in New Zealand, but only in a few localities is it found in quantities of economic importance. The most promising deposits of mercury ore in New Zealand are those of the Puhipuhi district and further investigation work has been carried out in this area.
LEAD AND ZINC—An ore-bearing reef of lead and zinc was mined near Te Aroha, producing lead-copper sulphide and zinc sulphide concentrates for export to Japan, but the mine closed in 1973.
TIN—Cassiterite in the form of “stream tin” occurs in small deposits near Port Pegasus, Stewart Island, and these have been worked to some extent.
PLATINUM—Platinum occurs in several places, associated generally with gold in gravel, but quantities produced have been insignificant.
SILICA—At Parengarenga, in northern Northland, there are large deposits of pure quartz (silica) sand. Over 70,000 tons from here and 10,000 tons from Mt. Somers in Canterbury, are used each year, mainly for glass manufacture.
There are lump silica deposits in Southland of a high quality suitable for the production of ferro-silicon and probably silicon metal.
DIATOMITE—Diatomite is a light powdery material used as a source of silica and as a filtering agent. It is worked in the Rotorua-Taupo volcanic zone and at Middlemarch, Otago.
BENTONITE—Production of bentonite continued at Coalgate in Canterbury for applications such as foundries and pelletising stock food. A new drilling grade meeting A.P.I, specifications is being used on oil rigs in the Taranaki area. Export shipments were sent for iron ore pelletising in Tasmania, as well as to Japan and Taiwan.
HALLOYSITE—Halloysite is a clay used as a filler in the paper industry, and for ceramics. It has been mined in Northland since the Second World War. Though nearly all production is for local consumption, possible expansion of the existing small existing export market is being investigated.
SULPHUR—Prospecting proved a 6 million ton deposit of sulphur at Rotokaua in the Taupo area in 1968. The deposit is mixed with pumice and work on the development of a separation process is continuing. A pilot plant operation recently started producing some sulphur for commercial use.
PERLITE—Perlite is a volcanic glass expanded by heating; it is used as an insulator and in lightweight concrete. There are deposits in the Rotorua-Taupo area, and others are being prospected on Great Barrier Island.
ASBESTOS—Chrysotile asbestos occurs at several points in the massive serpentines of Nelson and Otago but the only deposits of importance so far located are those of Upper Takaka in the Nelson district. In 1955 production of asbestos was resumed after a temporary cessation but was discontinued in 1963. Current work is aimed at finding a market for the high proportion of very short fibre found in the ore. Deposits found in north-west Otago (Pyke River) have not yet been found to be commercial, and access is difficult.
PHOSPHATE—The occurrence of phosphate has been reported from many localities in New Zealand but so far the deposits of Clarendon and Milburn have proved to be the only ones of economic importance and the more favourable sections of the deposits have been exhausted. Prospecting is continuing on promising sea-floor deposits in the Chatham rise area.
SERPENTINE—Serpentine is a magnesium-rich rock used as a fertiliser additive. Deposits are being mined at Piopio, near Te Kuiti, and North Cape, in the North Island, and Lee Valley, Collins Valley and Mossburn, in the South Island. To the end of 1973, 2,839,023 tonnes had been mined, including 73,726 in 1973.
GREENSTONE—The mineral nephrite, the “pounamu” of the Maori, a deep-green semi-transparent mineral with dark opaque patches, more popularly known as one of the varieties of “greenstone”, occurs as rounded aggregations in the talc or talc-serpentine rocks of the Griffin Range of north Westland. The principal supply was obtained from the gravels of the Arahura and Taramakau Rivers, and from gold-sluicing claims of the Kumara district. At the present time the main source of supply is from a deposit of greenstone boulders in Olderog Creek, a tributary of the Arahura River. The boulders are reduced in size by a portable diamond trepan saw and airlifted by helicopter. Some of this has been cut and polished in New Zealand for personal and other small ornaments; the remainder has been exported. With the decline in sluicing operations this mineral has been in short supply.
The best-known occurrences of lowenite, the serpentine variety of greenstone, are in Fiordland, but are not systematically or commercially exploited.
KAURI GUM—Production of kauri gum has been at a comparatively low level in recent years. The quantity exported annually is now less than 100 tons. Prospecting north of Kaitaia has given encouraging results, however.
PEAT WAX—There are an estimated 10,000 acres of moorland peat on the Chatham Islands with an average thickness of 14 feet. This peat contains peat wax derived from a particular plant which grew in the area. The peat wax is being investigated for commercial application in carbon paper, polishes, varnishes, cosmetics, and explosives. Similar investigations are taking place with deposits in Central Otago.
SALT—At Lake Grassmere, in Marlborough, salt is being produced by the solar evaporation of sea water. The low rainfall, long hours of sunlight, and the wind conditions make this locality the most suitable one in New Zealand for this purpose. Salt was first harvested in 1952.
Production of salt in the latest 6 years is shown in the following table.
| Year | Salt Produced | Value |
|---|---|---|
| tonnes | $(000) | |
| 1968 | 55,880 | 1,155 |
| 1969 | 49,294 | 464 |
| 1970 | 52,790 | 364 |
| 1971 | 43,261 | 393 |
| 1972 | 59,436 | 385 |
| 1973 | 101,500 | 447 |
STATE AID TO MINING—State aid to mining in New Zealand is given in several forms—viz (a) geological survey and bulletins; (b) detailed investigation of the occurrence and development of economic minerals; (c) schools of mines; (d) financial aid to prospecting and for access roads to mining fields; (e) research by Chemistry Division of the Department of Scientific and Industrial Research.
Geological Survey—Imperative to long-term assessment of New Zealand's mineral resources is an understanding of the country's geology. In New Zealand almost all Government geological work is carried out by the New Zealand Geological Survey, a scientific institution founded in 1865, which since 1926 has been a branch of the Department of Scientific and Industrial Research. Mines, Works, and other Government departments consult the Geological Survey on geological problems, and do not themselves maintain a geological staff.
The survey's principal work is to prepare geological maps of New Zealand and to determine the country's geological structure and geological history. Along with this, the survey studies and helps to assess the country's mineral deposits, geothermal steam, and underground water resources, and gives advice on geological problems encountered in State and private civil engineering projects, such as the construction of hydro-electric dams, bridges, tunnels, roads, and building foundations..
The Geological Survey has issued regional geological maps on a scale of 1 mile to the inch, covering about one-third of the country. Maps (scale 1:250,000), informally known as the “Four mile” series, are available for the whole country. One-mile maps and bulletins will continue to be issued at intervals for areas of special economic or scientific importance. The first sheets of a new detailed series of maps, at 1:25,000 scale, have been issued. They cover Hamilton City and parts of Auckland. Surveys are currently in progress to produce similar maps for Wellington, Christchurch, and Dunedin. Geological mapping has also been carried out in New Zealand's island territories and in the Ross Dependency. In 1972 a new 1:1,000,000 map was published of each of the North and South Islands.
Mineral Resources Surveys Generally—The Economic Geology Section of Geological Survey is responsible for the investigation of potentially valuable deposits, coupled with closer study of the changing overseas economic emphasis. The work is largely concerned with the implementation of the Mineral Resources Council's recommended programme. A new inventory of New Zealand's minerals is now available, and a publication Industrial Minerals and Rocks, containing articles of interest to engineers, mining companies, and local bodies, is produced annually. Field studies are made by the geologists, and laboratory examination of ores by the petrology specialists. Chemical analysis is usually done by the Chemistry Division, Department of Scientific and Industrial Research. The Petrology Section makes free identification of rocks and minerals forwarded by Mines Department, prospectors, and others.
Metallic Minerals—In earlier years, when gold was of major importance, the survey reported on all major goldfields. Deposits of ores of iron, copper, tungsten, manganese, chrome, uranium, aluminium, and other metals have also been investigated over the years, and the survey took complete responsibility for the raw material geological investigations for the new steel industry. Geological Survey has recently completed detailed surveys of the ilmenite-zircon-gold sand deposits near Westport, of the important mineralisation areas in north-west Nelson, of a disseminated low-grade copper deposit at Coppermine Island off Whangarei, and of scheelite lodes at Glenorchy in Otago.
Coal—Coal is still New Zealand's most important mineral, apart from constructional materials, and mapping the coalfields in detail has been one of the survey's major undertakings in economic geology. Work has proceeded in co-operation with Mines Department and with the Coal Research Association. Detailed maps and bulletins on Greymouth, Reefton, Kaitangata, and Ohai coalfields have been published, while those for the Waikato field will be the next to be issued. Although the mapping of the coalfields is largely complete, survey geologists continue to help with the large number of day-to-day problems in the coalfields and undertake constant revision. A major revision, involving presentation in map form, of coal estimates is currently being made.
Oil—The Government does not undertake oil exploration. Oil companies, however, draw on survey maps and bulletins for basic information about the country's stratigraphy and geological structure which enables them to narrow down areas deserving more detailed examination. Close and mutually beneficial co-operation has usually developed between survey geologists and paleontologists and those of oil companies. Copies of oil company reports and maps continue to be deposited with the Government in terms of the Petroleum Act 1937. The Geological Survey is the national repository of collections of rocks, fossils, and drill cores collected by the oil companies, and has appointed a petroleum geologist to the staff who advises company geologists on all oil regions.
Paleontological and stratigraphic information by the survey helped the search for oil in Taranaki, which was rewarded by the discovery and development of large reservoirs of natural gas at Kapuni and more recently off shore in the Maui field. The collections of fossils and drill cores held from earlier Taranaki oil-exploration bores greatly helped prediction of the type, age, and thickness of strata the drills would penetrate. Geological Survey micro-paleontologists are assisting oil companies in interpreting the stratigraphic progress of off-shore oil wells and provided a complete service for many recent drill-holes, both on shore and off shore.
Constructional Materials and Other Non-metallic Minerals—As far as is possible with the staff available, the survey advises Ministry of Works and local authority engineers, contractors, and other users on where rock materials for road metal, aggregate, building stone, sand, etc., can be obtained. Marl, limestone, and pozzolana for cement manufacture, perlite, bentonite, clays, talc, mica, and magnesite are other non-metallic minerals in the utilisation of which the survey has played a part. Current aid to industry given by the survey, includes detailed projects on north-west Nelson deposits of wollastonite, asbestos, dolomite, and talc magnesite; the limestone resources of Auckland and Otago have been assessed recently; North Auckland sands and halloysite clays have been the subject of recent New Zealand Geological Survey publications.
CENSUS OF MINING AND QUARRYING—A census of mining and quarrying was taken for the production year 1968-69. Statistics for that year are shown in the following table.
| Item | Type of Mining or Quarrying | Total, incl. Part-Time Operating | |||
|---|---|---|---|---|---|
| Sand, Gravel, Rock, etc. | Limestone | Coal | Other, Including Clay | ||
| *One owner may operate several mines, e.g., the Government operates many coal mines. | |||||
| Type of organisation*— | |||||
| Registered company | 197 | 59 | 26 | 32 | 392 |
| Individual or partnership or co-operative | 58 | 16 | 34 | 12 | 168 |
| Government or local authority | 101 | 1 | 2 | 2 | 140 |
| Totals | 356 | 76 | 62 | 46 | 700 |
| Nature of business— | |||||
| Underground mines operated | - | - | 64 | 11 | 76 |
| Surface mines or quarries operated | 917 | 87 | 37 | 64 | 1,332 |
| Productive bores | - | - | - | 3 | 3 |
| Totals | 917 | 87 | 101 | 78 | 1,411 |
| Employment— | |||||
| Average number of persons engaged (excludes working proprietors) | 1,864 | 276 | 2,742 | 239 | 5,283 |
| Salaries and wages paid (includes bonuses, overtime, etc.) persons engaged $(000) | 4,923 | 669 | 7,635 | 696 | 14,011 |
| Overtime hours worked h(000) | 489 | 34 | 35 | 53 | 615 |
| Number of working proprietors | 69 | 15 | 96 | 15 | 244 |
| Production (values as at quarry floor or mine head)— | |||||
| Sand, gravel, rock, clay, etc. $(000) | 19,958 | 58 | - | 65 | 20,373 |
| Limestone $(000) | 28 | 2,428 | - | 15 | 2,527 |
| Coal $(000) | 64 | - | 12,874 | - | 12,943 |
| Other $(000) | 1 | 54 | 8 | 3,074 | 3,245 |
| Totals, values $(000) | 20,052 | 2,540 | 12,882 | 3,154 | 39,086 |
| Production volumes— | |||||
| Sand, gravel, rock, clay, etc. cu. metres(000) | 14,077 | 31 | - | 38 | 14,594 |
| Limestone tonnes(000) | 20 | 1,585 | - | 8 | 1,669 |
| Coal tonnes(000) | 24 | - | 2,324 | 2,349 | |
HISTORICAL DEVELOPMENT—The function of the early manufacturing industries in New Zealand was to supply locally the immediate needs of the small scattered communities for food, clothing, building materials, and home furnishings and to provide shipping with ropes, spars, and repairs. These handicraft activities grew into factories as the settlements expanded and as there developed more opportunities for the organisation and specialisation of labour, and for the more complex processing of domestic or imported raw materials. Flour mills, flax mills, ropewalks, and sawmills appeared in the early eighteen forties followed by breweries, brick kilns, cooperages in the mid forties and, later in that decade, lime kilns, ship and boat yards, soap and candle works, and tanneries.
By 1867, the first year in which statistics of factory production were collected in conjunction with the population census, manufacturing establishments included grain mills, breweries, biscuit factories, a bone-manure works, brick and tile yards and potteries, candle and soap works, coachbuilding workshops, fellmongeries, tanneries, wool-scouring works, flax works, aerated water and cordial factories, iron and brass foundries, lime kilns, malt kilns, engineering workshops, a patent slip, a petroleum works, rope and cordage works, sawmills, sash and door factories, ship and boat yards, and a woollen mill. The factories of this period were still primarily concerned with the satisfaction of the needs of the limited local markets.
The development boom of the eighteen seventies, the rapid rise in population, and the better communications between internal markets encouraged further factory expansion. There was to some extent a natural protection from overseas competition in the high freight rates on imports. Other factors which assisted in this expansion were the admission of certain raw materials free of duty, the imposition of a tariff on some finished goods, and the granting of bounties for new factories by central and provincial governments. These were followed by protection by way of tariff in 1888 when the home market was shrinking and capital and labour were beginning to leave the colony. Footwear and clothing factories, machinery, and metal industries were protected by this tariff. A wider protective Customs tariff was imposed in 1895. During the depressed years of the eighteen eighties low wage costs enabled some New Zealand manufacturers to export their products, but this was partly attributable also to the special suitability of some New Zealand products, such as farm implements, to the needs of other developing communities overseas.
The first shipment of refrigerated meat in 1882 opened the way for the establishment and growth of the meat-freezing and butter and cheese industries. Ten years after this first shipment, 21 meat-freezing works and 104 butter and cheese factories had been established.
The recovery from the long depression, the resumption of large-scale immigration at the beginning of the present century, the spectacular development of meat-freezing and dairy factories, and the breaking in of new land, especially in the North Island, all contributed to the revival of a strong internal demand which stimulated manufacturing growth.
Auckland early established itself as the dominant manufacturing province in New Zealand, but in the general prosperity following the gold boom of the sixties, there was a spectacular increase in manufacturing activity in Otago, which led Auckland until the nineties. Canterbury was the next most important manufacturing province. Today, however, Auckland has clearly re-established its predominance and is followed by Wellington and Canterbury.
With the rising population and increased export income during the first decade of this century, manufacturing continued to expand at a steady rate. The growth continued to be concentrated on industries processing farm products for export and those supplying the more simple goods, housing materials and equipment, repairs, and supplies for farmers. In this period the electrical, wire-work, sheet-metal, and motor-vehicle industries had their beginnings.
Developments in the nineteen twenties included the expansion of the vehicle industry (particularly motor and cycle assembly), sawmilling, and the metalworking, furnishings, and apparel industries. These developments carried forward the tendency for industries processing farm products to be less dominating in value of production and employment compared with other types of industry
During the depression of the nineteen thirties the total volume of factory output declined with the contraction of New Zealand's export income and the drop in internal demand. While prices fell the output of factories processing farm products rose, but not sufficiently to offset the loss in volume from other manufacturing industries. The rapid fall in purchasing power caused the farmer to produce more, but the impact of the depression on the factories processing “non-farm” materials meant a heavy reduction in the output of consumer goods, building materials, and agricultural and dairy machinery and implements. By 1934-35, however, the volume of factory production had been restored to the 1929-30 level.
Apart from metalworking and vehicle factories, which had improved their position significantly, industry emerged from the depression in much the same pattern as before.
The recovery of manufacturing after the depression was primarily the result of better export prices, more public development, and an expansionist monetary policy, all of which resulted in the re-engagement of most of the unemployed.
There had been little time for any protective effect of exchange control and import selection to stimulate industrial expansion between the date these measures were introduced (December 1938) and the outbreak of war in September 1939. It was the war and its shortages which changed the manufacturing pattern and gave great encouragement to industrial development. The engineering and apparel industries, which contributed so much to war needs, made the greatest progress.
Production expanded in response to the need to replace imports that the United Kingdom and other countries could no longer supply and to provide uniforms, weapons, equipment, and provisions for New Zealand and allied armed forces.
One protective effect of the war and post-war periods and their restricted supply of imports was that domestic industry was often enabled to attain its optimum (New Zealand) output quickly without a difficult competitive struggle with imports.
Post-war Development—The pattern of New Zealand industry changed again from 1949-50 with the exemption from import control of many items. Factory expansion was sustained by a high level of internal demand, by a widening of the range of products, and to some extent by the restriction of imports for a short period of exchange control. In this period the volume of production in the food, footwear, other wearing apparel, and made-up textile goods groups increased slowly in response to population growth, while leather industry production fell as a result of competition from imports and synthetics. Spectacular increases in production came from new developments in the pulp and paper and the rubber industries. However, as in past years it was the engineering factories that contributed most to the growth of manufacturing after 1949-50 The expansion in this field was stimulated especially by increasing mechanisation on farms, the high level of investment in New Zealand, the rising demand for consumer durables, and the increased imports of motor vehicle components.
The growth in production has been assisted by increases in manpower engaged and capital investment in new buildings and machinery.
Successive annual increases in the volume of production took place in the following years: 1961-62, 5.3 percent; 1962-63, 4.5 percent; 1963-64, 10.8 percent; 1964-65, 12.8 percent; 1965-66, 7.0 percent; 1966-67, 5.5 percent. However in 1967-68 there was a decrease of 1.3 percent. Later annual increases have been: 1968-69, 3.1 percent; 1969-70, 12.3 percent; 1970-71, 5.1 percent; 1971-72, 4.3 percent; 1972-73, 6.2 percent.
The greater use of machinery in manufacturing during the last 20 years is illustrated also by the continuing rise in the average horsepower employed for each person engaged in manufacturing. In 1950-51 the average was 3.48 horsepower; in 1960-61, 4.85 horsepower; and in 1970-71, 6.33 horsepower. This expansion has been facilitated by developments in electric power generation and industrial techniques.
The value of factory production in recent years has been: 1969-70, $2,995 million; 1970-71, $3,407 million; 1971-72, $3,873 million; 1972-73, $4,608 million. Value added in manufacture has been 1969-70, $867 million; 1970-71, $996 million; 1971-72, $1,129 million; 1972-73, $1,302 million.
About 26 percent of males and 22 percent of females in the labour force are directly engaged in manufacturing.
Small factories continue to be typical of manufacturing in New Zealand. Some 60 percent of the factories employ 10 or fewer people, a reflection of the fact that, partly as a result of the geographical configuration of the country, many factories supply small local markets. At the other end of the scale, only 1.6 percent of factories had staff in excess of 200. The majority of the smallest manufacturing units are involved in the production of transport equipment, machinery, and wood products, while the largest plants are engaged in the manufacture of food and paper. The trend is towards larger manufacturing units.
Some of the major industries are mentioned later in this section. Others include wire drawing and galvanising; the production of copper tube, wire rope, aluminium cable, and telephone and underground power cable: the manufacture of TV tubes, 11 kV switchgear, electric hoists, electric motor starters, and fractional horsepower electric motors, as well as electronic controls for a variety of equipment. The manufacture of transport equipment and machinery has expanded to cover turbo-prop top-dressing aircraft, utility farm vehicles, bicycles, pneumatic and steel-tyred road rollers, self-propelled hydraulically operated excavators, post-hole diggers, and hydraulic equipment and attachments. Further items now made in New Zealand include oil-fired kilns, control valves, thermostats, press brakes, disc brake pads, high-speed twist drills and numerous others. In the chemical and allied industries, New Zealand factories produce PVC compounds and dry blends, besides such PVC products as sheeting, flooring, roofing, and rainwater goods; a range of formaldehyde resins used in the manufacture of adhesives and related products; acrylic emulsions and compounds; many industrial and domestic chemical materials including synthetic detergents; and various weed killers and insecticides. The packaging industry makes moulded pulp products as well as several types of plastic film, the most recent projects involving cast polypropylene and the manufacture of irradiated polyethylene ('shrink film'). Textured synthetic yarns, warp-knitted and foam-backed fabrics have been added to the products of the textile industry in recent years. An oil refinery and sheet glassworks have been in operation for some years. Gin and whisky distilleries have been established and brandy has been produced experimentally.
RECENT MAJOR DEVELOPMENTS—The following paragraphs summarise certain of the major industrial developments which have recently taken place.
Pulp and Paper—New Zealand Forest Products Ltd. opened a new kraft pulp mill at Kinleith early in February 1973. The new mill, operating 24 hours a day, 7 days a week, will double pulp output from 210,000 tons to 420,000 tons. The company's No. 6 paper machine began operating about the end of the first quarter of 1973. The major increases in pulp and paper production are part of a 5-year expansion project which is the largest undertaken by an individual company in New Zealand's industrial history.
The expansion programme undertaken by Tasman Pulp and Paper Co. Ltd., Kawerau, is also well advanced. The kraft pulp mill expansion has raised output from 105,000 tons a year to 230,000 tons, of which 100,000 tons will be exported. The company's third newsprint machine, expected to be in production late in 1975, will increase total newsprint production to 345,000 tons a year.
Caxton Paper Mills Ltd., Kawerau, has recently extended its pulp-making plant and has installed a third machine for the production of tissue grades for domestic and overseas markets.
The new mill constructed by Carter Oji Kokusaku Pan Pacific Ltd., at Whirinaki, near Napier, commenced production in March 1973. The mill's entire output, consisting of sawn timber and refiner groundwood pulp, is being exported to the two Japanese companies which hold 40 percent of the equity in the Whirinaki mill, the remaining 60 percent being held by Carter Holt Holdings Ltd. The refiner groundwood pulp mill has an initial annual capacity of 120,000 tons.
Particle Board—New Zealand Particle Board Ltd. commenced production in October 1972. With an annual output of 30 million square feet on a 3/4 inch basis, the establishment of the Kumeu plant means a doubling of the country's output. A new complex is being built at Kopu, near Thames.
Steel—New Zealand Steel Ltd. was formed in July 1965 and began production at Glenbrook. south of Auckland, of a range of galvanised coil and sheet from imported black coil in November 1968. The company is meeting the full domestic demand for these galvanised products and production is increasing annually.
Commercial operation of the iron-making plant commenced in March 1970, using indigenous ironsands. Considerable problems of equipment and operation have been met and full production has not yet been achieved. The designed capacity of the plant is 150,000 tons annually.
Production of black and galvanised steel pipe and tube from the $4 million mill has been increasing since the plant was commissioned in 1971. Production capacity of the mill is 40,000 tons a year.
The plant is currently producing steel ingots, billets, flat and corrugated galvanised sheet, black pipe and rectangular hollow sections, and galvanised pipe.
Aluminium—New Zealand Aluminium Smelters Ltd. was formed following the signing of an agreement by the New Zealand Government, Comalco Industries Pty. Ltd., of Australia, Showa Denko KK, and Sumitomo Chemical Co. Ltd., of Japan. Construction of the primary aluminium smelter at Tiwai Point, near Bluff, was completed early in 1971. The first furnace was commissioned in April 1971. The smelter is now producing at the rate of 110,000 tons a year, and at this level represents an investment of approximately $100 million. Adjacent to the Bluff smelter is a special mill which early in 1972 commenced production of aluminium electrical conductor redraw rod..
An aluminium semi-fabricating industry is well established, making a wide range of extrusions, rolling mill products and fabricated items.
Aircraft Manufacture—In March 1973 rationalisation of the aviation manufacturing industry took effect with the amalgamation of separate industry units into a single company; Aerospace Industries Ltd. Substantial financial and technical participation by the National Airways Corporation and Air New Zealand is intended.
During the restructuring of the industry, major orders have been placed by the Australian and Thai Governments for New Zealand-produced training aircraft.
Electronics Manufacture—The New Zealand electronics industry now numbers some 60 individual companies with a total estimated output for 1972 of more than $17 million. There is a marked tendency to move away from the production of consumer goods to that of more sophisticated industrial medical and testing instruments, often of New Zealand origin and design.
Colour Television—Colour transmission from existing television stations commenced on 31 October 1973. Initial demand for colour receivers exceeded the limited immediate supply from the four production units but productive capacity is being stepped up.
Motor Vehicles—During 1973, two new vehicle assembly plants were commissioned in the Auckland area by the Ford Motor Co. (N.Z.) Ltd. and Nissan Motor Distributors Ltd. Construction continued on Todd Motors Ltd's new plant at Porirua, currently the largest single vehicle assembly plant in New Zealand.
The new transmission and chassis component plant of the Ford Motor Co. (N.Z.) Ltd. at Wiri was officially opened in November 1973. Assisted by provisions of the New Zealand-Australia Free Trade Agreement, this facility is intended to supply total New Zealand and Australian needs for several components used in Ford's production of light and medium passenger cars.
Specialist production of sports cars and racing cars has commenced on a limited scale for export.
TRENDS IN INDUSTRIAL DEVELOPMENT: Rationalisation of Production—This trend has resulted partly from an attempt to gain improved economies of scale. Some rationalisation has followed mergers and takeovers within New Zealand when, for example, two or more factories each making a wide range of goods have been able to concentrate on narrower complementary ranges, maintaining reasonable consumer choice while increasing the throughput of individual products.
Overseas Investment—The major objectives in supervising overseas investment are to ensure that New Zealand's natural and human resources are developed to the benefit of New Zealand and also that overseas investment contributes to the maintenance of a satisfactory rate of economic growth in New Zealand. Investment of overseas capital is usually accompanied by specialised skills and technical advances and these are strongly associated with New Zealand's industrial expansion and rationalisation.
Indigenous Resources—The trend towards the development and expansion of resource-based industries previously mentioned is of considerable significance. Traditionally, the only substantial resource-based New Zealand industries have been those engaged in processing farm products, meat, milk, and wool. Apart from these industries, in the period of almost 20 years following the end of the Second World War, the growth of manufacturing industry was, in the main, dependent on imported materials and components. The radio and television industry is a good example of growth of this type, and others are to be found in the domestic appliance, petroleum products, and engineering industries.
The turning point in the use of indigenous resources came with the developments in the forest industry where expansion has reached almost boom proportions during recent years. The industry is now a major earner of overseas exchange, the principal exports being pulp, paperboard, newsprint, and other papers. Logs, sawn timber, chips, and processed building boards are also sold overseas in substantial quantities.
New industries based on New Zealand's mineral resources are being established. A steel manufacturing plant is now smelting indigenous ironsands. Future prospects include the establishment of industries based on ilmenite beachsands occurring on the west coast of the South Island, Southland silica deposits, and a mineral wax industry based on Chatham Islands peat and Otago lignite deposits. The Kapuni natural gas field is in commercial production, and in the second quarter of 1973 negotiations were concluded between the oil companies and the Government for the development of the Maui offshore field, which is even larger than the Kapuni reserves. Developments based on farm produce continue to take place, one example being the manufacture of dried lucerne pellets for export.
EXPORT EARNINGS—Goods manufactured in New Zealand are finding more outlets in overseas markets. Export receipts for all manufactured goods (excluding forestry and dairy products) in 1974 totalled $195.3 million compared with $143.6 million the previous year and $91.2 million in 1971. Part of the increase can be attributed to the growth in sales of aluminium ingot.
REGIONAL DEVELOPMENT—Increasing attention has been paid in recent years to the regional aspects of the development of New Zealand and especially to the differing rates of growth of population, employment, and industry between regions.
Recognising this, the Government has now given regional development an important place in its planning. Initially, emphasis is to be given to the development of industry in a number of priority regions in order to provide employment opportunities and restrain the outflow of population from these regions. Regional development councils are being established in such areas to recommend to the Government on the types of regional assistance required in particular cases. Such assistance to industry may include loans, bank guarantees, freight subsidies, and assistance with housing and labour training. (See Section 25E).
AIDS TO DEVELOPMENT—Described very briefly below are some of the bodies which provide assistance of various types to manufacturing industry.
Development Finance Corporation—Established as an independent body in 1964, the Corporation provides a source of financial assistance for new or expanding industries. Borrowers would normally be engaged in the production and related fields, such as manufacturing or serving of basic industry. Extractive industries, such as fishing, forestry, and mining, are also eligible for assistance. The corporation is now a wholly Government owned development bank.
Industrial Research and Development Grants Scheme—This scheme was established in 1969 to encourage increased industrial research and development. Grant payments for the 1970-71 year were $202,117, for 1971-72 $749,175, for 1972-73 $1,156,506, and for 1973-74, $1,246,799.
Productivity Centre—A Productivity Centre was established within the Department of Trade and Industry in January 1973 to promote improved productivity in New Zealand's manufacturing and servicing industry. It is pursuing an active nationwide programme in close co-operation with interested organisations to help firms make better use of their resources by using specific productivity techniques.
The programme of the centre is guided broadly by a 10-member Productivity Advisory Council. Members represent both Government and private sectors, providing the council with a wide range of practical experience and close links with other bodies concerned with productivity improvement.
The centre offers a variety of services to industry:
Interfirm comparisons, which highlight areas within individual firms requiring remedial attention, are sponsored and costs subsidised in selected cases. Twelve major industry groups, involving more than 600 firms, participated in the centre's interfirm comparison programme during 1974.
The establishment of self-sustaining productivity groups is promoted by the centre. Some 20 groups, which enable representatives of diversified local industries to examine and exchange productivity ideas and experience that will benefit their individual enterprises, were operating at the end of 1974.
Companies and organisations are assisted with setting up productivity improvement teams. These teams harness the ideas, knowledge, and ability already existing in an organisation to improve productivity.
The centre organises workshop sessions and seminars on specific management topics, particularly in centres where few formal management education facilities exist.
Extension services to industry are provided by industry liaison officers based at the Auckland, Wellington, Christchurch, and Dunedin offices of the Department of Trade and Industry. These officers are available to help diagnose the existence and extent of practical problems in individual companies at the invitation of management, and to channel to them advice and assistance from the wide range of financial, technological, managerial, and other facilities available in the public and private sectors.
Literature is distributed by the centre including general information material, a newsletter, a technical series, and a directory of advisory services.
In addition the centre's programme includes general publicity to ensure widespread understanding of the benefits of productivity, research, and investigation into productivity measurement and incentives, and liaison with productivity organisations overseas.
New Zealand Export/Import Corporation—Established early in 1974. the corporation has a responsibility for co-ordinating and expanding overseas trading opportunities. By providing assistance to small companies which lack the resources or skills to go into the export field, the corporation enables New Zealand to compete in many lines of goods which formerly could not be marketed economically.
Other Bodies—Also providing assistance to industry are the Industrial Design Council and Inventions Development Authority. A number of liaison committees have been established to promote development in particular fields of industry: these include the Advisory Committee on the Heavy Engineering Industry, and the Electronics Advisory Committee. Several bodies exist principally to promote exports: the Engineering Export Association of New Zealand Inc. continues to be prominent in this field, while the Export Guarantee Office facilitates the export of manufactured goods by removing some of the financial uncertainties involved in export trade.
There are also several bodies providing technical and advisory services for industry. Further details of these organisations are to be found under Section 7, Education and Science.
RESEARCH AND DEVELOPMENT—Engagement in research and development by industry groups is shown in the following table for 1972-73.
The statistics include milk processing, bread bakeries, ready-mix concrete; these 3 industries are usually left out of published “Industry Group Totals” in order to maintain comparability with statistics of previous years.
| Industry Group | Persons Engaged on Research and Development | Persons on Research and Development to Total Persons Engaged | Expenditure on Research and Development | Percentage Research and Development Expenditure of Net Output |
|---|---|---|---|---|
| No. | percent | $(000) | percent | |
| Food (includes milk processing and bread bakeries) | 137 | 0.29 | 1,580 | 0.51 |
| Beverages | 8 | 0.24 | 57 | 0.15 |
| Tobacco manufactures | 2 | 0.17 | ||
| Textiles | 31 | 0.21 | 293 | 0.41 |
| Footwear, other wearing apparel, and made-up textile goods | 43 | 0.16 | 278 | 0.34 |
| Wood and cork products (except furniture) | 29 | 0.20 | 181 | 0.23 |
| Furniture and fixtures | 16 | 0.26 | 106 | 0.37 |
| Paper and paper products | 46 | 0.48 | 483 | 0.80 |
| Printing, publishing, etc | 8 | 0.05 | 50 | 0.06 |
| Leather and leather products (except foot-wear and apparel) | 13 | 0.52 | 69 | 0.65 |
| Rubber products | 29 | 0.76 | 593 | 2.55 |
| Chemicals and chemical products | 187 | 2.54 | 1,196 | 2.00 |
| Petroleum and coal products | 5 | 0.76 | 36 | 0.26 |
| Non-metallic mineral products, n.e.i. (includes ready-mix concrete) | 42 | 0.48 | 292 | 0.47 |
| Basic metal manufactures | 9 | 0.21 | 843 | 0.59 |
| Metal products (except machinery and transport equipment) | 104 | 0.54 | ||
| Machinery (except electrical) | 191 | 1.14 | 932 | 1.07 |
| Electrical machinery and appliances | 167 | 1.61 | 1,234 | 2.69 |
| Transport equipment | 54 | 0.40 | 525 | 0.69 |
| Miscellaneous products | 62 | 0.59 | 505 | 0.92 |
| All groups | 1,183 | 0.50 | 9,251 | 0.70 |
SCOPE OF STATISTICS—The statistics of industrial production collected annually by the Department of Statistics cover registered factories employing at least two persons (including the working proprietor) engaged in the manufacture, assembly, repair, or treatment of articles.
Bread bakeries and ready-mixed concrete establishments were surveyed as separate industries for the first time for 1962-63, but they have been excluded from group and national totals to maintain comparability with previous years. Milk processing plants have been surveyed as a separate industry since 1968-69 and have also been excluded from group and national totals for the same reason.
Commencing with the 1968-69 production year, paper bag and paper sack manufacturers as well as plastic manufacturers were surveyed as separate industries.
Industrial activities not covered by the survey of the Department of Statistics set out in this section are: cake and pastry kitchens; boot repairers; bespoke tailors; dressmakers; milliners; abattoirs; railway workshops; naval dockyard; all one-man factories.
In addition, commencing with the 1971-72 census, the motor vehicle repair industry has been excluded from manufacturing activities and is now being covered in the Census of Distribution. Consequently, all manufacturing “time-series” statistics have been adjusted to exclude the statistics of that industry.
The year covered by these statistics is generally the year ending 31 March, but factories are permitted to furnish returns covering their financial year most closely corresponding to this period. In the case of the important semi-primary industries—butter, cheese, and other milk products, and meat freezing and preserving—the years correspond with the production seasons ending in May and September respectively.
GENERAL SUMMARY—The factory production table in the Statistical Summary section of this volume gives a long time-series of leading statistics.
Following an increase of 4.3 percent in volume in 1971-72 there was an increase of 6.2 percent in 1972-73. The total value of depreciation was $4,608 million in 1972-73 or 18.9 percent more than the 1971-72 total of $3,874 million. Net output increased by 15.1 percent from $1,131 million in 1971-72 to $1,302 million in the latest year and manufacturers surplus increased by 22.8 percent (from $316 million to $387 million). The number of persons engaged, including working proprietors, was 235,615, an increase of 3,191 or 1.4 percent on the total of 232,424 in 1971-72. Total salaries and wages paid (including drawings of working proprietors) during 1972-73 amounted to $875.2 million compared with $780.3 million in the previous year. This was an increase of 12.2 percent.
Factory statistics by local authority administrative areas showing the number of establishments and accompanying main statistics are published in Statistics of Industrial Production available in Government bookshops.
The following table gives the main statistics by statistical areas for the year 1972-73.
| Statistical Area | Establishments | Persons Engaged | Salaries and Wages Paid | Cost of Materials | Value of Production | Net Output (Net Value Added) |
|---|---|---|---|---|---|---|
| No. | No. | $(000) | ||||
| Northland | 186 | 4,371 | 16,976 | 140,951 | 188,498 | 30,558 |
| Central Auckland | 2,499 | 81,190 | 296,704 | 784,858 | 1,391,340 | 434,076 |
| South Auckland-Bay of Plenty | 852 | 24,075 | 94,690 | 349,140 | 564,948 | 130,801 |
| East Coast | 75 | 2,525 | 8,721 | 32,494 | 49,227 | 12,946 |
| Hawke's Bay | 264 | 10,042 | 37,996 | 165,753 | 240,398 | 54,755 |
| Taranaki | 228 | 6,751 | 27,229 | 138,753 | 191,834 | 37,472 |
| Wellington | 1,428 | 44,243 | 162,480 | 516,337 | 850,581 | 246,121 |
| Marlborough | 78 | 1,400 | 4,970 | 11,918 | 19,573 | 6,808 |
| Nelson | 177 | 3,432 | 12,271 | 38,089 | 63,576 | 16,745 |
| Westland | 58 | 1,023 | 3,629 | 8,590 | 16,067 | 5,240 |
| Canterbury | 1,193 | 36,358 | 130,344 | 328,680 | 572,021 | 182,971 |
| Otago | 400 | 13,271 | 45,174 | 125,166 | 225,533 | 75,747 |
| Southland | 230 | 6,934 | 34,063 | 143,790 | 234,155 | 67,620 |
| Totals | 7,668 | 235,615 | 875,247 | 2,784,519 | 4,607,751 | 1,301,861 |
Information as to the character of organisation of the establishments engaged in factory production during 1972-73 is given in the following table. Co-operative associations are characteristic of certain industries engaged in the processing of farm products, mainly butter and cheese manufacturing.
| Character of Organisation | Establishments | Persons Engaged | Salaries and Wages Paid | Cost of Materials Used or Operated Upon | Value of Manufactures or Products | Net Output | |
|---|---|---|---|---|---|---|---|
| Total | Per Establishment | ||||||
| No | No. | $(m) | $(m) | $(m) | $(m) | ($) | |
| Private registered company | 5,868 | 145,556 | 517 | 1,456 | 2,486 | 755 | 128,664 |
| Public registered company | 881 | 77,592 | 310 | 977 | 1,676 | 488 | 553,916 |
| Individual | 419 | 1,821 | 5 | 7 | 16 | 7 | 16,706 |
| Partnership | 258 | 2,011 | 6 | 11 | 23 | 9 | 34,884 |
| Co-operative association | 188 | 5,807 | 25 | 323 | 380 | 29 | 154,255 |
| Local authority and State | 54 | 2,828 | 12 | 11 | 27 | 13 | 240,741 |
| Totals | 7,668 | 235,615 | 875 | 2,785 | 4,608 | 1,302 | 169,797 |
In the next table the statistics for the year 1972-73 are reclassified by employment districts.
| Employment District | Factories | Persons Engaged | Salaries and Wages | Cost of Materials | Value of Production | Net Output (Net Value Added) Total | Net Output (Net Value Added) | ||
|---|---|---|---|---|---|---|---|---|---|
| Males | Females | Males | Females | ||||||
| *These areas are no longer official factory districts but have been retained in these statistics at the request of users. | |||||||||
| No. | No. | No. | $(000) | $(000) | $(000) | $(000) | $(000) | percent | |
| Whangarei | 186 | 3,696 | 675 | 15,420 | 1,556 | 140,951 | 188,498 | 30,558 | 2.3 |
| Auckland | 2,499 | 55,342 | 25,848 | 240,196 | 56,508 | 784,858 | 1,391,340 | 434,076 | 33.3 |
| Hamilton | 481 | 9,857 | 2,425 | 40,071 | 4,974 | 218,144 | 308,234 | 61,439 | 4.7 |
| Tauranga | 158 | 2,037 | 763 | 7,957 | 1,532 | 46,129 | 65,683 | 13,641 | 1.0 |
| Rotorua | 212 | 7,854 | 1,135 | 37,697 | 2,456 | 84,484 | 191,017 | 55,717 | 4.3 |
| Gisborne | 73 | 1,888 | 627 | 7,398 | 1,289 | 32,448 | 49,128 | 12,909 | 1.0 |
| Napier | 115 | 2,402 | 848 | 10,258 | 1,885 | 58,276 | 88,206 | 21,738 | 1.7 |
| Hastings | 129 | 5,252 | 1,282 | 22,318 | 2,763 | 102,289 | 145,552 | 32,048 | 2.5 |
| New Plymouth | 224 | 4,940 | 1,079 | 21,386 | 2,272 | 124,675 | 172,515 | 33,436 | 2.6 |
| Wanganui | 157 | 2,940 | 1,042 | 13,098 | 1,912 | 53,419 | 84,233 | 22,965 | 1.8 |
| Palmerston North | 332 | 6,511 | 2,587 | 25,863 | 4,912 | 122,057 | 182,199 | 44,662 | 3.4 |
| Masterton | 93 | 1,961 | 884 | 8,418 | 1,763 | 37,987 | 58,818 | 14,531 | 1.1 |
| Lower Hutt | 352 | 12,348 | 4,764 | 54,985 | 11,454 | 250,245 | 394,520 | 106,162 | 8.2 |
| Wellington | 521 | 7,996 | 4,214 | 34,926 | 9,532 | 71,962 | 156,883 | 62,846 | 4.8 |
| Totals, North Island | 5,532 | 125,024 | 48,173 | 539,991 | 104,805 | 2,128,286 | 3,476,826 | 946,730 | 72.7 |
| Blenheim | 78 | 1,045 | 355 | 4,232 | 738 | 11,918 | 19,573 | 6,808 | 0.5 |
| Nelson | 154 | 2,512 | 572 | 9,785 | 1,185 | 36,028 | 57,679 | 14,328 | 1.1 |
| Greymouth | 81 | 1,120 | 251 | 4,351 | 579 | 10,650 | 21,964 | 7,657 | 0.6 |
| Christchurch | 1,016 | 22,488 | 9,112 | 92,922 | 18,668 | 252,186 | 463,123 | 156,771 | 12.1 |
| Ashburton* | 48 | 1,138 | 360 | 4,931 | 773 | 15,355 | 25,667 | 7,629 | 0.6 |
| Timaru | 126 | 2,750 | 498 | 11,941 | 1,059 | 60,841 | 82,867 | 18,520 | 1.4 |
| Oamaru* | 38 | 1,225 | 279 | 4,874 | 603 | 16,948 | 28,094 | 8,804 | 0.7 |
| Dunedin | 365 | 8,347 | 3,432 | 32,726 | 7,021 | 108,516 | 197,803 | 66,994 | 5.1 |
| Invercargill | 230 | 6,361 | 573 | 32,446 | 1,617 | 143,790 | 234,155 | 67,620 | 5.2 |
| Totals, South Island | 2,136 | 46,986 | 15,432 | 198,207 | 32,244 | 656,232 | 1,130,925 | 355,131 | 27.3 |
| Totals, New Zealand | 7,668 | 172,010 | 63,605 | 738,199 | 137,049 | 2,784,519 | 4,607,751 | 1,301,861 | 100.0 |
A further summary of the operations of factories is given below for the three latest years. Statistics for the motor vehicle repairs industry are now excluded from the figures in this and subsequent time series tables.
| Item | 1970-71 | 1971-72 | 1972-73 | |
|---|---|---|---|---|
| Number of establishments | 7,600 | 7,783 | 7,668 | |
| Persons engaged | 229,104 | 232,424 | 235,615 | |
| Production costs— | ||||
| Salaries, wages | $(000) | 676,017 | 780,308 | 875,247 |
| Materials | $(000) | 2,014,555 | 2,288,578 | 2,784,519 |
| Other expenses | $(000) | 423,195 | 489,841 | 560,517 |
| Total costs | $(000) | 3,113,767 | 3,558,728 | 4,220,283 |
| Value of production | $(000) | 3,407,419 | 3,874,287x | 4,607,751 |
| Manufacturers' surplus | $(000) | 293,652 | 315,559 | 387,468 |
| Net output (net value added) | $(000) | 995,724 | 1,130,677x | 1,301,861 |
| Overtime worked by wage earners | h(000) | 38,043 | 37,547 | 40,365 |
| Volume index for industry: Base 1956-57 | (=1000) | 2,410 | 2,513 | 2,669 |
| Premises and plant— | ||||
| Value at end of year— | ||||
| Land and buildings | $(000) | 773,972 | 871,594 | 974,484 |
| Plant, machinery, and equipment | $(000) | 465,304 | 565,353 | 659,588 |
| Transport equipment | $(000) | 36,026 | 40,174 | 43.797 |
| Capital expenditure during year— | ||||
| Land and buildings | $(000) | 49,464 | 65,203 | 65,872 |
| Plant, machinery, and equipment | $(000) | 104,593 | 167,297 | 184,463 |
| Transport equipment | $(000) | 17,603 | 19,734 | 21,344 |
| Coal consumption as fuel | tonnes(000) | 864 | 882 | 908 |
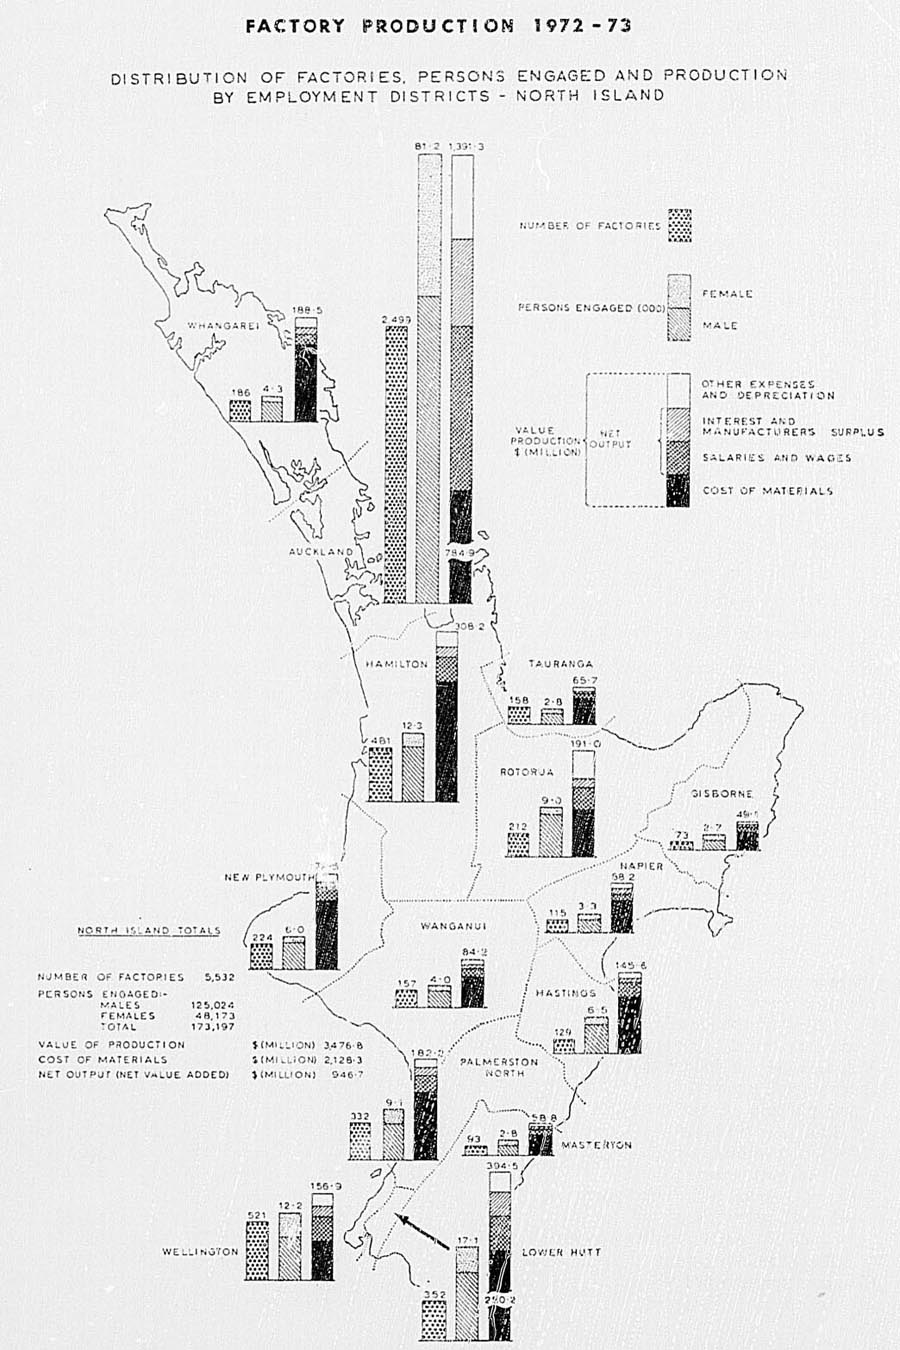
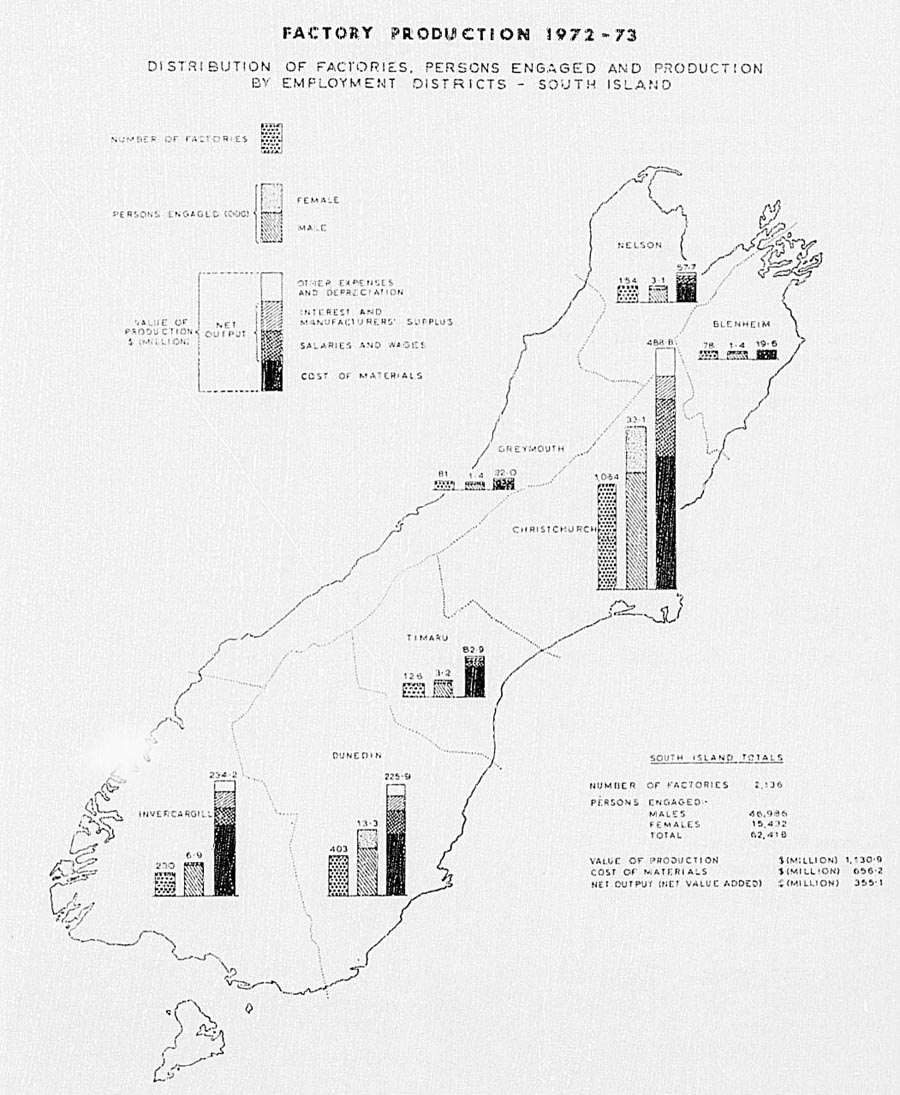
The following table gives a summary of some of the principal production statistics for the year 1972-73 classified by individual industries. Totals for the industrial groups to which these industries belong are also shown.
| Industry | Establishments | Persons Engaged | Salaries and Wages Paid | Value of Production | Net Output (Net Value Added) |
|---|---|---|---|---|---|
| Food Manufacturing Industries | No. | No. | $(000) | ||
| Meat freezing and preserving | 48 | 27,317 | 133,332 | 844,675 | 195,797 |
| Ham and bacon curing | 41 | 1,370 | 4,901 | 33,066 | 7,992 |
| Sausage casings | 8 | 259 | 979 | 3,679 | 1,357 |
| Ice cream | 19 | 519 | 1,699 | 13,591 | 3,759 |
| Butter, cheese, and milk powder | 161 | 4,728 | 20,346 | 345,727 | 21,780 |
| Fruit and vegetable preserving | 27 | 3,327 | 10,424 | 49,845 | 14,299 |
| Fish preserving | 41 | 630 | 1,992 | 14,668 | 3,608 |
| Grain milling | 33 | 857 | 2,843 | 32,978 | 6,232 |
| Biscuits | 8 | 1,375 | 3,899 | 19,092 | 6,540 |
| Cocoa, chocolate, and sugar confectionery | 43 | 2,287 | 6,418 | 30,100 | 10,374 |
| Feeds for animals and fowls | 48 | 577 | 2,227 | 29,138 | 5,343 |
| Food preparations, n.e.i. | 55 | 2,068 | 7,061 | 71,458 | 12,917 |
| Totals | 532 | 45,314 | 196,120 | 1,488,018 | 290,000 |
| Beverage Industries | |||||
| Winemaking | 69 | 567 | 1,832 | 14,483 | 3,028 |
| Distilling, rectifying, and blending of spirits | 5 | 146 | 544 | 3,330 | 1,038 |
| Brewing of ale and stout, and malting | 14 | 1,551 | 7,729 | 55,646 | 20,333 |
| Aerated waters and cordials | 48 | 1,042 | 3,281 | 14,711 | 5,254 |
| Totals | 136 | 3,306 | 13,386 | 88,170 | 29,653 |
| Tobacco Manufactures | |||||
| Tobacco, cigars, and cigarettes | 5 | 1,191 | 4,091 | 31,580 | 8,721 |
| Manufacture of Textiles | |||||
| Woolscouring | 28 | 1,075 | 4,747 | 183,610 | 6,673 |
| Woollen milling | 21 | 4,347 | 13,853 | 46,955 | 16,792 |
| Other spinning and weaving mills | 29 | 3,166 | 11,893 | 48,084 | 17,427 |
| Phormium flax | |||||
| Hosiery and other knitting mills | 84 | 5,225 | 14,918 | 57,569 | 21,197 |
| Linen flax | 1 | 27 | 77 | 114 | 59 |
| Textiles, n.e.i. | 32 | 1,247 | 5,041 | 39,410 | 9,217 |
| Totals | 195 | 15,087 | 50,529 | 375,741 | 71,363 |
| Manufacture of Footwear, Other Wearing Apparel, and Made-up Textiles | |||||
| Leather gloves and apparel | 11 | 180 | 441 | 1,560 | 552 |
| Men's and boys' outerwear | 106 | 3,482 | 7,980 | 22,486 | 9,531 |
| Women's and girls' outerwear | 252 | 5,620 | 12,128 | 41,449 | 15,689 |
| Underclothing | 38 | 1,576 | 3,343 | 11,114 | 4,048 |
| Hats, caps, and millinery | 25 | 296 | 657 | 1,681 | 663 |
| Neckties | 4 | 161 | 417 | 1,832 | 646 |
| Corsetry | 28 | 1,440 | 3,373 | 11,067 | 6,079 |
| Shirts and pyjamas | 46 | 2,185 | 4,452 | 13,010 | 5,188 |
| Wearing apparel, n.e.i. | 140 | 5,690 | 12,215 | 39,406 | 15,012 |
| Fur coats and necklets | 22 | 154 | 396 | 1,191 | 566 |
| Footwear (other than rubber) | 101 | 4,979 | 14,085 | 40,618 | 16,911 |
| Canvas goods | 44 | 510 | 1,361 | 4,938 | 1,965 |
| Made-up textiles (other than wearing apparel) | 83 | 1,296 | 3,167 | 13,796 | 4,563 |
| Totals | 900 | 27,569 | 64,015 | 204,148 | 81,413 |
| Manufacture of Wood and Cork (Except Manufacture of Furniture) | |||||
| Sawmills | 300 | 5,682 | 21,529 | 81,380 | 30,772 |
| Planing mills and timber preservation | 152 | 2,137 | 7,819 | 50,040 | 12,618 |
| Joinery | 388 | 4,455 | 16,737 | 58,872 | 22,876 |
| Wooden containers | 27 | 362 | 1,312 | 5,204 | 1,551 |
| Plywood and veneer | 13 | 1,027 | 4,148 | 18,267 | 7,199 |
| Wood products, n.e.i. | 87 | 886 | 3,245 | 11,006 | 4,493 |
| Totals | 967 | 14,549 | 54,790 | 224,769 | 79,509 |
| Manufacture of Furniture and Fixtures | |||||
| Furniture | 364 | 5,271 | 18,363 | 58,284 | 24,710 |
| Mattresses | 18 | 567 | 1,748 | 8,523 | 2,801 |
| Venetian blinds | 17 | 243 | 777 | 3,476 | 1,067 |
| Totals | 399 | 6,081 | 20,888 | 70,283 | 28,578 |
| Manufacture of Paper and Paper Products | |||||
| Pulp, paper, and paperboard | 6 | 4,213 | 23,004 | 105,221 | 31,394 |
| Cardboard boxes, cartons, and containers | 43 | 2,394 | 8,328 | 49,847 | 13,574 |
| Paper bags and paper sacks | 15 | 816 | 3,003 | 18,913 | 4,394 |
| Paper products, n.e.i. | 46 | 2,074 | 6,475 | 39,248 | 10,962 |
| Totals | 110 | 9,497 | 40,810 | 213,229 | 60,324 |
| Printing, Publishing, and Allied Industries | |||||
| Printing and publishing | 96 | 7,776 | 31,996 | 80,687 | 45,949 |
| Job and general printing | 359 | 7,239 | 25,001 | 71,923 | 32,835 |
| Service industries for printing trade | 61 | 764 | 3,114 | 6,486 | 3,806 |
| Totals | 516 | 15,779 | 60,111 | 159,096 | 82,590 |
| Manufacture of Leather and Leather Products (Except Footwear) | |||||
| Tanning | 18 | 1,087 | 3,780 | 20,769 | 5,688 |
| Fellmongery | 7 | 98 | 377 | 2,781 | 626 |
| Leather goods | 97 | 1,330 | 3,411 | 10,439 | 4,304 |
| Totals | 122 | 2,515 | 7,568 | 33,989 | 10,618 |
| Manufacture of Rubber Products | |||||
| Motor vehicle tyres and tubes | 3 | 1,213 | 6,860 | 23,440 | 9,460 |
| Rubber goods (other than motor vehicle | |||||
| tyres and tubes) | 32 | 2,032 | 7,980 | 21,460 | 9,243 |
| Vulcanising and tyre retreading | 63 | 581 | 2,133 | 10,635 | 4,491 |
| Totals | 98 | 3,826 | 16,973 | 55,535 | 23,194 |
| Manufacture of Chemicals and Chemical Products | |||||
| Chemical fertilisers | 15 | 1,156 | 5,915 | 71,549 | 14,797 |
| Vegetable and animal oils and fats | 22 | 425 | 1,812 | 10,412 | 3,466 |
| Ink | 10 | 328 | 1,229 | 5,006 | 2,180 |
| Soap | 11 | 547 | 1,866 | 11,366 | 4,205 |
| Paint and varnish | 35 | 932 | 3,610 | 25,600 | 6,655 |
| Pharmaceuticals, toilet goods, and cosmetics | 36 | 1,501 | 4,271 | 30,701 | 10,132 |
| Chemical products, n.e.i. | 88 | 2,459 | 8,495 | 56,801 | 18,315 |
| Totals | 217 | 7,348 | 27,198 | 211,436 | 59,750 |
| Manufacture of Products of Petroleum and Coal | |||||
| Petroleum and coal products | 18 | 399 | 1,993 | 91,562 | 11,351 |
| Bituminous paving and roofing materials | 28 | 257 | 1,033 | 8,735 | 2,244 |
| Totals | 46 | 656 | 3,026 | 100,297 | 13,595 |
| Manufacture of Non-metallic Mineral Products (Except Products of Petroleum and Coal) | |||||
| Structural clay products | 32 | 883 | 3,338 | 9,949 | 5,330 |
| Pottery, china, and earthenware | 11 | 945 | 2,924 | 6,727 | 4,177 |
| Cement | 4 | 683 | 3,328 | 20,255 | 8,927 |
| Glass and glass products | 49 | 2,086 | 8,749 | 26,149 | 12,240 |
| Concrete products | 201 | 2,346 | 8,618 | 36,259 | 16,135 |
| Lime | 83 | 320 | 1,171 | 6,825 | 2,362 |
| Fibrous plaster | 40 | 242 | 865 | 2,257 | 1,007 |
| Non-metallic mineral products, n.e.i. | 20 | 818 | 3,759 | 21,028 | 6,435 |
| Totals | 440 | 8,323 | 32,751 | 129,450 | 56,614 |
| Basic Metal Industries | |||||
| Basic metal industries | 108 | 4,226 | 19,959 | 144,233 | 34,208 |
| Manufacture of Metal Products (Except Machinery and Transport Equipment) | |||||
| Sheet-metal working | 232 | 6,716 | 25,032 | 95,795 | 35,948 |
| Wire working | 58 | 943 | 3,416 | 18,093 | 5,440 |
| Nail making | 6 | 157 | 618 | 4,657 | 1,088 |
| Electroplating and metal polishing | 81 | 949 | 3,609 | 9,046 | 4,679 |
| Metal products, n.e.i. | 551 | 10,540 | 40,915 | 152,683 | 60,314 |
| Totals | 928 | 19,305 | 73,589 | 280,275 | 107,469 |
| Manufacture, Assembly, and Repair of Machinery (Except Electrical Machinery) | |||||
| Agricultural and pastoral machinery | 187 | 1,596 | 5,739 | 31,580 | 9,132 |
| Machinery, n.e.i. | 624 | 15,157 | 60,124 | 191,795 | 78,334 |
| Totals | 811 | 16,753 | 65,863 | 223,375 | 87,466 |
| Manufacture of Electrical Machinery, Apparatus, Appliances, and Supplies | |||||
| Range making | 7 | 1,085 | 3,592 | 13,277 | 4,616 |
| Radio and television assembly and manufacture | 20 | 2,036 | 6,046 | 25,641 | 6,512 |
| Electrical machinery, appliances, n.e.i. and repairs | 313 | 7,221 | 24,988 | 98,535 | 34,692 |
| Totals | 340 | 10,342 | 34,626 | 137,453 | 45,820 |
| Manufacture of Transport Equipment | |||||
| Boat building and ship repairing | 116 | 1,875 | 7,727 | 20,944 | 9,413 |
| Motor vehicle assembly | 17 | 5,786 | 22,685 | 213,930 | 38,097 |
| Motor body building | 79 | 1,589 | 5,785 | 18,934 | 7,545 |
| Aircraft manufacture, maintenance and repair | 48 | 2,543 | 11,828 | 23,370 | 12,959 |
| Perambulators | 8 | 148 | 419 | 1,415 | 482 |
| Transport equipment, n.e.i. | 45 | 1,532 | 5,488 | 19,372 | 7,651 |
| Totals | 313 | 13,473 | 53,931 | 297,965 | 76,148 |
| Miscellaneous Manufacturing Industries | |||||
| Optical, surgical, and dental, etc., equipment | 34 | 381 | 1,404 | 4,028 | 1,964 |
| Jewellery | 94 | 803 | 2,723 | 8,350 | 3,737 |
| Brushes and brooms | 9 | 433 | 1,274 | 5,039 | 2,032 |
| Toys and sports goods | 33 | 919 | 2,685 | 7,595 | 3,419 |
| Plastics | 206 | 6,090 | 21,537 | 91,768 | 34,741 |
| Manufacturing industries, e.i.n. | 109 | 1,849 | 5,400 | 21,930 | 8,934 |
| Totals | 485 | 10,475 | 35,023 | 138,709 | 54,828 |
| Grand Totals | 7,668 | 235,615 | 875,247 | 4,607,751 | 1,301,861 |
ESTABLISHMENTS AND EMPLOYEES—In recent years the shortage of labour in the principal centres has resulted in branch factories and workrooms being opened in secondary towns to tap the labour resources in those areas.
The following table shows the number of factories in each statistical area.
| Statistical Area | Number of Factories | ||||
|---|---|---|---|---|---|
| 1968-69 | 1969-70 | 1970-71 | 1971-72 | 1972-73 | |
| Northland | 180 | 176 | 179 | 185 | 186 |
| Central Auckland | 2,380 | 2,417 | 2,435 | 2,496 | 2,499 |
| South Auckland - Bay of Plenty | 847 | 849 | 840 | 874 | 852 |
| East Coast | 78 | 75 | 74 | 79 | 75 |
| Hawke's Bay | 283 | 280 | 263 | 274 | 264 |
| Taranaki | 244 | 244 | 240 | 233 | 228 |
| Wellington | 1,514 | 1,495 | 1,464 | 1,462 | 1,428 |
| Marlborough | 72 | 73 | 75 | 82 | 78 |
| Nelson | 186 | 193 | 183 | 180 | 177 |
| Westland | 67 | 59 | 56 | 59 | 58 |
| Canterbury | 1,145 | 1,170 | 1,160 | 1,210 | 1,193 |
| Otago | 415 | 407 | 396 | 404 | 400 |
| Southland | 256 | 248 | 235 | 245 | 230 |
| Totals | 7,667 | 7,686 | 7,600 | 7,783 | 7,668 |
An analysis of the 1972-73 totals by industrial groups in the various statistical areas is given in the next table.
| Industry Group | Northland | Central Auckland | South Auckland - Bay of Plenty | East Coast | Hawke's Bay | Taranaki | Wellington |
|---|---|---|---|---|---|---|---|
| Number of Factories 1972-73 | |||||||
| Food | 14 | 104 | 73 | 7 | 20 | 46 | 78 |
| Beverages | 5 | 57 | 13 | 2 | 15 | 4 | 12 |
| Tobacco manufactures | - | 1 | - | - | 1 | - | 1 |
| Textiles | - | 75 | 6 | 2 | 6 | 1 | 49 |
| Footwear, other wearing apparel, and made-up textile goods | 10 | 404 | 68 | 5 | 17 | 12 | 197 |
| Wood and cork products (except furniture) | 41 | 157 | 196 | 16 | 45 | 45 | 131 |
| Furniture and fixtures | 5 | 152 | 36 | 1 | 15 | 10 | 68 |
| Paper and paper products | - | 42 | 6 | 3 | 2 | 1 | 29 |
| Printing, publishing etc. | 9 | 156 | 46 | 4 | 18 | 8 | 150 |
| Leather and leather products (except footwear and apparel) | 1 | 49 | 4 | 1 | 5 | 2 | 15 |
| Rubber products | 1 | 24 | 12 | 2 | 4 | 5 | 22 |
| Chemicals and chemical products | 2 | 94 | 15 | 1 | 5 | 5 | 48 |
| Petroleum and coal products | 1 | 10 | 3 | - | - | 2 | 17 |
| Non-metallic mineral products, n.e.i. | 35 | 83 | 48 | 7 | 23 | 13 | 66 |
| Basic metal manufactures | - | 46 | 8 | 1 | 1 | 2 | 20 |
| Metal products (except machinery and transport equipment) | 13 | 384 | 84 | 6 | 29 | 18 | 163 |
| Machinery (except electrical) | 29 | 202 | 132 | 6 | 26 | 33 | 150 |
| Electrical machinery and appliances | 8 | 113 | 43 | 5 | 14 | 9 | 60 |
| Transport equipment | 9 | 111 | 35 | 5 | 10 | 4 | 45 |
| Miscellaneous products | 3 | 235 | 24 | 1 | 8 | 8 | 107 |
| Totals | 186 | 2,499 | 852 | 75 | 264 | 228 | 1,428 |
| Number of Factories 1972-73 | |||||||
| Food | 15 | 16 | 5 | 79 | 38 | 37 | 532 |
| Beverages | 2 | 7 | 2 | 9 | 7 | 1 | 136 |
| Tobacco manufactures | - | 2 | - | - | - | - | 5 |
| Textiles | - | 2 | - | 34 | 16 | 4 | 195 |
| Footwear, other wearing apparel, and made-up textile goods | 4 | 6 | 2 | 133 | 36 | 6 | 900 |
| Wood and cork products (except furniture) | 17 | 49 | 31 | 152 | 51 | 36 | 967 |
| Furniture and fixtures | 2 | 6 | 1 | 76 | 21 | 6 | 399 |
| Paper and paper products | - | 1 | - | 17 | 5 | 4 | 110 |
| Printing, publishing, etc. | 5 | 8 | 4 | 70 | 29 | 9 | 516 |
| Leather and leather products (except footwear and apparel) | 2 | - | - | 28 | 6 | 9 | 122 |
| Rubber products | 1 | 2 | 1 | 20 | 3 | 1 | 98 |
| Chemicals and chemical products | 1 | 4 | - | 26 | 13 | 3 | 217 |
| Petroleum and coal products | - | - | - | 9 | 4 | - | 46 |
| Non-metallic mineral products, n.c.i. | 4 | 22 | 4 | 76 | 25 | 34 | 440 |
| Basic metal manufactures | - | 1 | - | 23 | 2 | 4 | 108 |
| Metal products (except machinery and transport equipment) | 3 | 17 | 2 | 146 | 42 | 21 | 928 |
| Machinery (except electrical) | 11 | 14 | 3 | 122 | 48 | 35 | 811 |
| Electrical machinery and appliances | - | 7 | - | 53 | 23 | 5 | 340 |
| Transport equipment | 8 | 11 | - | 48 | 15 | 12 | 313 |
| Miscellaneous products | 3 | 2 | 3 | 72 | 16 | 3 | 485 |
| Totals | 78 | 177 | 58 | 1,193 | 400 | 230 | 7,668 |
The number of factories and persons engaged are shown together in the following table, classified by industrial groups. Persons engaged include proprietors actively participating in their own businesses but exclude all persons engaged in selling and distribution. Figures for persons engaged refer to the average number over the whole year.
| Industry Group | Number of Factories | Number of Persons Engaged | ||||
|---|---|---|---|---|---|---|
| 1970-71 | 1971-72 | 1972-73 | 1970-71 | 1971-72 | 1972-73 | |
| Food | 545 | 541 | 532 | 42,973 | 44,353 | 45,314 |
| Beverages | 129 | 137 | 136 | 2,992 | 3,152 | 3,306 |
| Tobacco manufactures | 5 | 5 | 5 | 1,169 | 1,200 | 1,191 |
| Textiles | 199 | 197 | 195 | 15,639 | 15,528 | 15,087 |
| Footwear, other wearing apparel, and made-up textile goods | 935 | 925 | 900 | 28,896 | 28,570 | 27,569 |
| Wood and cork products (except furniture) | 981 | 982 | 967 | 14,687 | 14,289 | 14,549 |
| Furniture and fixtures | 415 | 407 | 399 | 5.454 | 5,639 | 6,081 |
| Paper and paper products | 113 | 114 | 110 | 9,220 | 9,174 | 9,497 |
| Printing, publishing, etc. | 509 | 512 | 516 | 15,737 | 15,603 | 15,779 |
| Leather and leather products (except footwear and apparel) | 112 | 115 | 122 | 2,385 | 2,474 | 2,515 |
| Rubber products | 116 | 109 | 98 | 3,960 | 3,867 | 3,826 |
| Chemicals and chemical products | 222 | 224 | 217 | 7,041 | 7,343 | 7,348 |
| Petroleum and coal products | 53 | 52 | 46 | 687 | 679 | 656 |
| Non-metallic mineral products, n.e.i. | 469 | 457 | 440 | 8,701 | 8,641 | 8,323 |
| Basic metal manufactures | 110 | 110 | 108 | 3,320 | 3,878 | 4,226 |
| Metal products (except machinery and transport equipment) | 848 | 923 | 928 | 17,770 | 18,355 | 19,305 |
| Machinery (except electrical) | 790 | 835 | 811 | 16,432 | 15,895 | 16,753 |
| Electrical machinery and appliances | 313 | 343 | 340 | 10,018 | 9,997 | 10,342 |
| Transport equipment | 283x | 305 | 313 | 12,391 | 13,248 | 13,473 |
| Miscellaneous products | 453 | 490 | 485 | 9,632 | 10,539 | 10,475 |
| Totals | 7,600x | 7,783 | 7,668 | 229,104 | 232,424 | 235,615 |
Persons engaged are shown in the table below for the year 1972-73 classified into working proprietors, managerial and clerical, professional, and technical staff, and wage earners.
| Industry Group | Working Proprietors, Managers, Clerical, Professional, Technical | Wage-earning Employees | All Persons Engaged | ||||
|---|---|---|---|---|---|---|---|
| Males | Females | Males | Females | Males | Females | Total | |
| Food | 4,909 | 1,444 | 33,313 | 5,648 | 38,222 | 7,092 | 45,314 |
| Beverages | 535 | 257 | 2,082 | 432 | 2,617 | 689 | 3,306 |
| Tobacco manufactures | 127 | 76 | 424 | 564 | 551 | 640 | 1,191 |
| Textiles | 1,134 | 629 | 7,368 | 5,956 | 8,502 | 6,585 | 15,087 |
| Footwear, other wearing apparel, and made-up textile goods | 1,487 | 1,214 | 3,790 | 21,078 | 5,277 | 22,292 | 27,569 |
| Wood and cork products (except furniture) | 1,917 | 417 | 11,959 | 256 | 13,876 | 673 | 14,549 |
| Furniture and fixtures | 699 | 284 | 4,322 | 776 | 5,021 | 1,060 | 6,081 |
| Paper and paper products | 1,153 | 383 | 6,214 | 1,747 | 7,367 | 2,130 | 9,497 |
| Printing, publishing, etc. | 2,078 | 1,560 | 9,311 | 2,830 | 11,389 | 4,390 | 15,779 |
| Leather and leather products (except footwear and apparel) | 255 | 106 | 1,165 | 989 | 1,420 | 1,095 | 2,515 |
| Rubber products | 470 | 137 | 2,616 | 603 | 3,086 | 740 | 3,826 |
| Chemicals and chemical products | 1,485 | 718 | 3,476 | 1,669 | 4,961 | 2,387 | 7,348 |
| Petroleum and coal products | 191 | 34 | 395 | 36 | 586 | 70 | 656 |
| Non-metallic mineral products, n.e.i. | 1,254 | 350 | 6,168 | 551 | 7,422 | 901 | 8,323 |
| Basic metal manufactures | 853 | 193 | 3,065 | 110 | 3,918 | 308 | 4,226 |
| Metal products (except machinery and transport equipment) | 2,909 | 962 | 13,616 | 1,818 | 16,525 | 2,780 | 19,305 |
| Machinery (except electrical) | 2,657 | 743 | 12,805 | 548 | 15,462 | 1,291 | 16,753 |
| Electrical machinery and appliances | 1,562 | 595 | 5,526 | 2,659 | 7,088 | 3,254 | 10,342 |
| Transport equipment | 2,010 | 460 | 9,990 | 1,013 | 12,000 | 1,473 | 13,473 |
| Miscellaneous products | 1,544 | 676 | 5,176 | 3,079 | 6,720 | 3,755 | 10,475 |
| Totals | 29,229 | 11,243 | 142,781 | 52,362 | 172,010 | 63,605 | 235,615 |
Further information is given in the following table on persons engaged in 1972-73. Totals in each industrial group are shown by statistical areas.
| Industry Group | Northland | Central Auckland | South Auckland - Bay of Plenty | East Coast | Hawke's Bay | Taranaki | Wellington |
|---|---|---|---|---|---|---|---|
| Food | 1,766 | 8,479 | 4,477 | 1,726 | 5,050 | 2,892 | 6,336 |
| Beverages | 29 | 1,402 | 332 | 35 | 280 | 35 | 432 |
| Tobacco manufactures | - | 92 | - | - | 666 | - | 359 |
| Textiles | - | 4,887 | 78 | 162 | 605 | 15 | 3,117 |
| Footwear, other wearing apparel, and made-up textile goods | 374 | 11,223 | 2,436 | 96 | 429 | 725 | 5,485 |
| Wood and cork products (except furniture) | 384 | 2,647 | 5,136 | 94 | 419 | 380 | 1,332 |
| Furniture and fixtures | 23 | 3,239 | 284 | 4 | 212 | 69 | 598 |
| Paper and paper products | - | 3,508 | 3,569 | 28 | 80 | 3 | 1,267 |
| Printing, publishing, etc. | 214 | 5,387 | 940 | 152 | 577 | 318 | 4,524 |
| Leather and leather products (except footwear and apparel) | 4 | 973 | 41 | 10 | 41 | 41 | 414 |
| Rubber products | 9 | 818 | 102 | 14 | 28 | 25 | 978 |
| Chemicals and chemical products | 87 | 3,149 | 361 | 7 | 187 | 241 | 1,991 |
| Petroleum and coal products | 178 | 135 | 56 | - | - | 5 | 218 |
| Non-metallic mineral products, n. e. i. | 727 | 3,208 | 520 | 33 | 179 | 82 | 946 |
| Basic metal manufactures | - | 2,193 | 57 | 5 | 2 | 474 | 357 |
| Metal products (except machinery and transport equipment) | 107 | 10,019 | 1,037 | 24 | 431 | 299 | 3,569 |
| Machinery (except electrical) | 247 | 6,033 | 2,292 | 80 | 462 | 744 | 3,229 |
| Electrical machinery and appliances | 35 | 3,663 | 636 | 21 | 264 | 323 | 2,059 |
| Transport equipment | 174 | 4,043 | 1,141 | 31 | 45 | 46 | 4,850 |
| Miscellaneous products | 13 | 6,092 | 5S0 | 3 | 85 | 34 | 2,182 |
| Totals | 4,371 | 81,190 | 24,075 | 2,525 | 10,042 | 6,751 | 44,243 |
| Industry Group | Marlborough | Nelson | Westland | Canterbury | Otago | Southland | Total, N.Z. |
|---|---|---|---|---|---|---|---|
| Food | 451 | 846 | 61 | 5,910 | 3,682 | 3,638 | 45,314 |
| Beverages | 19 | 50 | 77 | 377 | 212 | 26 | 3,306 |
| Tobacco manufactures | - | 74 | - | - | - | - | 1,191 |
| Textiles | - | 34 | - | 3,738 | 2,253 | 198 | 15,087 |
| Footwear, other wearing apparel, and made-up textile goods | 265 | 150 | 121 | 5,224 | 993 | 48 | 27,569 |
| Wood and cork products (except furniture) | 78 | 506 | 570 | 1,928 | 516 | 559 | 14,549 |
| Furniture and fixtures | 6 | 80 | 3 | 1,241 | 281 | 41 | 6,081 |
| Paper and paper products | - | 19 | - | 524 | 175 | 324 | 9,497 |
| Printing, publishing, etc. | 96 | 186 | 55 | 1,990 | 1,045 | 295 | 15,779 |
| Leather and leather products (except footwear and apparel) | 9 | - | - | 610 | 297 | 75 | 2,515 |
| Rubber products | 2 | 4 | 7 | 1,817 | 19 | 3 | 3,826 |
| Chemicals and chemical products | 20 | 80 | - | 671 | 438 | 116 | 7,348 |
| Petroleum and coal products | - | - | - | 53 | 11 | - | 656 |
| Non-metallic mineral products, n.e.i. | 56 | 412 | 29 | 1,498 | 416 | 217 | 8,323 |
| Basic metal manufactures | - | 3 | - | 366 | 75 | 694 | 4,226 |
| Metal products (except machinery and transport equipment) | 14 | 242 | 12 | 2,570 | 795 | 186 | 19,305 |
| Machinery (except electrical) | 134 | 103 | 66 | 2,212 | 796 | 355 | 16,753 |
| Electrical machinery and appliances | - | 26 | - | 2,497 | 772 | 46 | 10,342 |
| Transport equipment | 182 | 603 | - | 1,918 | 344 | 96 | 13,473 |
| Miscellaneous products | 68 | 14 | 22 | 1,214 | 151 | 17 | 10,475 |
| Totals | 1,400 | 3,432 | 1,023 | 36,358 | 13,271 | 6,934 | 235,615 |
The sex distribution among the persons engaged shows a considerable preponderance of males— in 1972-73 for every female engaged, there were three males. In the smaller districts there are few industries employing female labour to any great extent. The male preponderance is considerably smaller in the four main districts, where female labour is in great demand mainly on account of the importance of the clothing and textile industries. In 2 industrial groups the number of females exceeded the number of males—viz., the tobacco group where there were 126 females to every 100 males, and the footwear, other wearing apparel, and made-up textiles group where there were 421 females per 100 males. Individual industries in the other groups with more females than males were— biscuits; cocoa, chocolate, and sugar confectionery; hosiery and other knitting mills; leather goods; and pharmaceuticals, toilet goods, and cosmetics. The table on the previous page shows the average number of males and females engaged according to industry groups for the year 1972-73.
Further information is available in the table below on the extent to which females were engaged in factories in New Zealand for 1972-73. This table gives by statistical areas the number of males per 100 females engaged, and the total persons engaged per 1,000 of population.
| Statistical Area | Males | Females | Total | Number of Males per 100 Females | Total Population at 1 April 1973 | Total Persons Engaged per 1,000 of Population |
|---|---|---|---|---|---|---|
| Northland | 3,696 | 675 | 4,371 | 548 | 97,400 | 45 |
| Central Auckland | 55,342 | 25,848 | 81,190 | 214 | 747,339 | 109 |
| South Auckland - Bay of Plenty | 19,748 | 4,327 | 24,075 | 456 | 442,400 | 54 |
| East Coast | 1,898 | 627 | 2,525 | 303 | 47,800 | 53 |
| Hawke's Bay | 7,827 | 2,215 | 10,042 | 353 | 138,300 | 73 |
| Taranaki | 5,643 | 1,108 | 6,751 | 493 | 101,900 | 66 |
| Wellington | 30,870 | 13,373 | 44,243 | 231 | 570,000 | 78 |
| Marlborough | 1,045 | 355 | 1,400 | 294 | 32,700 | 43 |
| Nelson | 2,780 | 652 | 3,432 | 426 | 70,000 | 49 |
| Westland | 852 | 171 | 1,023 | 498 | 22,500 | 45 |
| Canterbury | 26,388 | 9,970 | 36,358 | 265 | 412,420 | 88 |
| Otago | 9,560 | 3,711 | 13,271 | 258 | 183,000 | 73 |
| Southland | 6,361 | 573 | 6,934 | 1,110 | 108,900 | 64 |
| All areas | 172,010 | 63,605 | 235,615 | 270 | 2,974.659 | 79 |
A classification of the establishments, according to the number of persons engaged, is now given.
| Year | Factories With Persons Engaged Numbering— | Total | ||||
|---|---|---|---|---|---|---|
| 10 or Under | 11-20 | 21-50 | 51-100 | Over 100 | ||
| Number of Factories | ||||||
| 1959-60 | 3,770 | 1,368 | 1,011 | 294 | 266 | 6,709 |
| 1964-65 | 4,190 | 1,488 | 1,159 | 388 | 329 | 7,554 |
| 1969-70 | 4,085 | 1,499 | 1,240 | 490 | 372 | 7,686 |
| 1970-71 | 3,927 | 1,495 | 1,287 | 489 | 402 | 7,600 |
| 1971-72 | 4,109 | 1,451 | 1,323 | 492 | 408 | 7,783 |
| 1972-73 | 3,984 | 1,446 | 1,322 | 504 | 412 | 7,668 |
| Number of Persons Engaged | ||||||
| 1959-60 | 19,490 | 20,135 | 31,226 | 20,517 | 65,410 | 156,778 |
| 1964-65 | 20,834 | 21,685 | 36,391 | 26,653 | 86,432 | 191,995 |
| 1969-70 | 20,722 | 22,089 | 39,031 | 34,762 | 103,504 | 220,108 |
| 1970-71 | 20,028 | 22,184 | 40,643 | 34,685 | 111,564 | 229,104 |
| 1971-72 | 21,171 | 21,373 | 41,669 | 34,717 | 113,494 | 232,424 |
| 1972-73 | 20,896 | 21,216 | 41,367 | 35,398 | 116,738 | 235,615 |
The classification according to the number of persons engaged shows clearly that, judged by the standards of highly industrialised communities, the average size of the industrial unit in New Zealand is small. Factories employing 10 persons or under accounted for 53 percent of the total number of factories in 1972-73.
SALARIES AND WAGES—The figures relating to the amounts paid as salaries and wages include amounts paid as bonuses and for overtime, also amounts drawn in lieu of salary by working proprietors. The amounts received by male and female employees (inclusive of all groups—executive, clerical, professional and technical, and wage earning), and the average amount received per employee of each sex, are set out below.
| Year | Males | Females | Both Sexes | |||
|---|---|---|---|---|---|---|
| Total | Average | Total | Average | Total | Average | |
| $(000) | $(000) | $(000) | $ | |||
| 1963-64 | 284,698 | 2,154 | 53,944 | 1,095 | 338,642 | 1,867 |
| 1964-65 | 318,881 | 2,278 | 59,911 | 1,151 | 378,792 | 1,973 |
| 1965-66 | 352,279 | 2,397 | 66,502 | 1,183 | 418,781 | 2,061 |
| 1966-67 | 380,429 | 2,531 | 71,304 | 1,236 | 451,733 | 2,172 |
| 1967-68 | 382,936 | 2,574 | 71,239 | 1,278 | 454,175 | 2,221 |
| 1968-69 | 409,493 | 2,700 | 73,966 | 1,320 | 483,459 | 2,328 |
| 1969-70 | 473,140 | 2,957 | 86,464 | 1,439 | 559,604 | 2,542 |
| 1970-71 | 570,124 | 3,444 | 105,893 | 1,667 | 676,017 | 2,951 |
| 1971-72 | 656,927 | 3,898 | 123,381 | 1,932 | 780,308 | 3,357 |
| 1972-73 | 738,199 | 4,292 | 137,049 | 2,155 | 875,247 | 3,715 |
The averages shown relate to all persons engaged, irrespective of age, industry, status, and personal occupation, and year-to-year comparisons may also be affected by changes in any of these factors. The figures do, however, give an indication of the increased earnings of factory workers in recent years.
The amount of salaries and wages paid in each industrial group and in all industries during the latest three years is given hereunder.
| Industry Group | Salaries and Wages Paid | ||
|---|---|---|---|
| 1970-71 | 1971-72 | 1972-73 | |
| $(000) | |||
| Food | 150,337 | 170,789 | 196,120 |
| Beverages | 9,667 | 11,538 | 13,386 |
| Tobacco manufactures | 3,042 | 3,697 | 4,091 |
| Textiles | 42,125 | 47,774 | 50,529 |
| Footwear, other wearing apparel, and made-up textile goods | 53,405 | 60,480 | 64,015 |
| Wood and cork products (except furniture) | 44,536 | 48,871 | 54,790 |
| Furniture and fixtures | 15,034 | 17,582 | 20,887 |
| Paper and paper products | 32,270 | 37,047 | 40,810 |
| Printing, publishing, etc. | 46,282 | 53,353 | 60,112 |
| Leather and leather products (except footwear and apparel) | 5,888 | 6,689 | 7,568 |
| Rubber products | 13,288 | 15,419 | 16,973 |
| Chemicals and chemical products | 20,591 | 24,258 | 27,199 |
| Petroleum and coal products | 2,458 | 2,824 | 3,026 |
| Non-metallic mineral products, n.e.i. | 26,440 | 29,991 | 32,751 |
| Basic metal manufactures | 12,497 | 15,787 | 19,959 |
| Metal products (except machinery and transport equipment) | 54,886 | 64,554 | 73,589 |
| Machinery (except electrical) | 51,949 | 58,267 | 65,863 |
| Electrical machinery and appliances | 26,811 | 31,058 | 34,626 |
| Transport equipment | 38,355 | 48,038 | 53,931 |
| Miscellaneous products | 26,155 | 32,291 | 35,023 |
| Totals | 676,017 | 780,308 | 875,247 |
In the following table an analysis is made of the 1972-73 totals of salaries and wages paid according to statistical areas in which the industries were carried on.
| Industry Group | Northland | Central Auckland | South Auckland - Bay of Plenty | East Coast | Hawke's Bay | Taranaki | Wellington |
|---|---|---|---|---|---|---|---|
*To avoid disclosure of details of individual establishments, figures have been included in those for miscellaneous products. † Net total without figures from other groups to avoid disclosure of details. ‡Including amounts drawn by working proprietors. | |||||||
| Salaries and Wages Paid 1972-73‡ | |||||||
| $(000) | |||||||
| Food | 7,390 | 35,335 | 19,300 | (*) | 20,109 | 13,692 | 27,879 |
| Beverages | (*) | 6,049 | 1,422 | (*) | 1,045 | (*) | 1,671 |
| Tobacco manufactures | - | (*) | - | - | (*) | - | (*) |
| Textiles | - | 17,069 | (*) | (*) | 2,492 | (*) | 10,303 |
| Footwear, other wearing apparel, and made-up textile goods | 829 | 27,608 | 4,655 | 190 | 933 | 1,640 | 12,873 |
| Wood and cork products (except furniture) | 1,241 | 10,376 | 19,784 | 324 | 1,513 | 1,333 | 5,041 |
| Furniture and fixtures | 68 | 11,781 | 904 | (*) | 744 | 213 | 2,024 |
| Paper and paper products | - | 12,506 | 19,547 | (*) | (*) | (*) | 4,378 |
| Printing, publishing, etc. | 799 | 20,897 | 3,410 | (*) | 2,131 | 1,292 | 17,348 |
| Leather and leather products (except footwear and apparel) | (*) | 2,871 | (*) | (*) | (*) | (*) | (*) |
| Rubber products | (*) | 3,857 | 346 | (*) | 104 | 84 | 4,750 |
| Chemicals and chemical products | (*) | 11,036 | 1,558 | (*) | (*) | (*) | 7,180 |
| Petroleum and coal products | (*) | (*) | (*) | - | - | (*) | 870 |
| Non-metallic mineral produces, n.e.i. | (*) | 13,079 | 1,912 | 119 | 643 | 296 | 3,647 |
| Basic metal manufactures | - | 10,796 | 227 | (*) | (*) | (*) | 1,353 |
| Metal products (except machinery and transport equipment) | 396 | 39,950 | 3,880 | 89 | 1,570 | 883 | 12,720 |
| Machinery (except electrical) | 946 | 25,180 | 9,250 | (*) | 1,535 | 2,915 | 12,399 |
| Electrical machinery and appliances | 121 | 11,743 | 2,002 | 75 | 919 | (*) | 7,472 |
| Transport equipment | (*) | 15,897 | 4,202 | 123 | 159 | (*) | 20,359 |
| Miscellaneous products | 5,185 | 20,674 | 2,290 | 7,802 | 4,099 | 4,882 | 10,215 |
| Totals | 16,976 | 296,704 | 94,690 | 8,721 | 37,996 | 27,229 | 162,480 |
| Food | 1,976 | 3,104 | (*) | 26,714 | 14,162 | 20,077 | 196,120 |
| Beverages | (*) | 129 | (*) | (*) | 816 | (*) | 13,386 |
| Tobacco manufactures | - | (*) | - | - | - | 4,090 | |
| Textiles | - | (*) | - | 12,560 | 6,442 | 797 | 50,529 |
| Footwear, other wearing apparel, and made-up textile goods | 598 | 330 | (*) | 11,926 | 2,049 | (*) | 64,015 |
| Wood and cork products (except furniture) | 254 | 1,828 | 2,192 | 7,248 | 1,767 | 1,890 | 54,790 |
| Furniture and fixtures | (*) | 240 | (*) | 3,958 | 793 | 122 | 20,887 |
| Paper and paper products | - | (*) | - | 1,796 | 474 | (*) | 40,810 |
| Printing, publishing, etc. | (*) | (*) | (*) | 7,400 | 3,950 | 1,149 | 60,112 |
| Leather and leather products (except footwear and apparel) | (*) | - | - | 1,923 | 915 | 261 | 7,568 |
| Rubber products | (*) | (*) | (*) | 7,621 | (*) | (*) | 16,973 |
| Chemicals and chemical products | (*) | (*) | - | 2,417 | 1,551 | (*) | 27,199 |
| Petroleum and coal products | - | - | - | (*) | 49 | (*) | 3,026 |
| Non-metallic mineral products, n.e.i. | (*) | (*) | (*) | 5.391 | 1,731 | 786 | 32,751 |
| Basic metal manufactures | - | (*) | - | 1,314 | (*) | (*) | 19,959 |
| Metal products (except machinery and transport equipment) | (*) | 850 | (*) | 9,555 | 2,884 | 733 | 73,589 |
| Machinery (except electrical) | 458 | 366 | (*) | 8,288 | 2,714 | 1,331 | 65,863 |
| Electrical machinery and appliances | - | 83 | - | 8,250 | (*) | 155 | 34,626 |
| Transport equipment | 712 | (*) | - | 7,965 | 1,386 | 374 | 53,931 |
| Miscellaneous products | 972 | 5,341 | 1,437 | 6,018 | 3,490 | 6,389 | 35,023 |
| Totals | 4,970 | 12,271 | 3,629 | 130,344 | 45,174 | 34,063 | 875,247 |
A further analysis of salaries and wages paid is given in the table below for 1972-73, and shows the amounts paid to working proprietors, managers, clerical, professional and technical staff, and those paid to other employees, i.e., wage earners. As mentioned earlier, drawings in lieu of salaries are included for proprietors actively engaged in the business. Males and females are distinguished throughout.
The following statement shows the average earnings of males and females for the past 10 years.
| Years | Proprietors Actively Engaged | Managers, Overseers | Accountants, Clerks | Professional, Technical | Wage-earning Employees | Totals | ||||||
|---|---|---|---|---|---|---|---|---|---|---|---|---|
| Males | Females | Males | Females | Males | Females | Males | Females | Males | Females | Males | Females | |
| Average Salary or Wage | ||||||||||||
| $ | $ | $ | $ | $ | $ | $ | $ | $ | $ | $ | $ | |
| 1963-64 | 2,369 | 1,450 | 3,290 | 1,863 | 2,2131 | 1,220 | 2,566 | 1,381 | 2,030 | 1,063 | 2,154 | 1,095 |
| 1964-65 | 2,513 | 1,467 | 3,484 | 1,972 | 2,334 | 1,293 | 2,696 | 1,437 | 2,146 | 1,115 | 2,278 | 1,151 |
| 1965-66 | 2,709 | 1,651 | 3,653 | 2,031 | 2,434 | 1,344 | 2,799 | 1,514 | 2,260 | 1,142 | 2,397 | 1,183 |
| 1966-67 | 2,743 | 1,630 | 3,856 | 2,070 | 2,588 | 1,404 | 2,896 | 1,551 | 2,386 | 1,192 | 2,561 | 1,236 |
| 1967-68 | 2,570 | 1,547 | 3,873 | 2,060 | 2,699 | 1,445 | 3,021 | 1,621 | 2,423 | 1,233 | 2,574 | 1,278 |
| 1968-69 | 2,817 | 1,626 | 4,065 | 2,060 | 2,767 | 1,525 | 3,244 | 1,744 | 2,540 | 1,265 | 2,700 | 1,320 |
| 1969-70 | 3,139 | 1,724 | 4,408 | 2,270 | 3,104 | 1,662 | 3,553 | 1,878 | 2,789 | 1,380 | 2,957 | 1,439 |
| 1970-71 | 3,420 | 2,006 | 5,074 | 2,580 | 3,450 | 1,966 | 4,005 | 2,119 | 3,264 | 1,595 | 3,444 | 1,667 |
| 1971-72 | 3,977 | 2,161 | 5,683 | 3,109 | 4,006 | 2,229 | 4,005 | 2,458 | 3,692 | 1,853 | 3,898 | 1,932 |
| 1972-73 | 4,357 | 2,698 | 6,385 | 3,488 | 4,323 | 2,521 | 5,057 | 2,829 | 4,048 | 2,056 | 4,292 | 2,155 |
| Industry Group | Working Proprietors, Managers, Clerical Professional, Technical | Wage-earning Employees | All Persons Engaged | ||||
|---|---|---|---|---|---|---|---|
| Male | Female | Male | Female | Male | Female | Total | |
| Salaries and Wages Paid 1972-73 | |||||||
| $(000) | |||||||
| Food | 26,659 | 3,773 | 153,192 | 12,496 | 179,851 | 16,269 | 196,120 |
| Beverages | 2,792 | 688 | 8,956 | 950 | 11,748 | 1,638 | 13,385 |
| Tobacco manufactures | 730 | 201 | 1,799 | 1,361 | 2,529 | 1,562 | 4,091 |
| Textiles | 6,413 | 1,588 | 29,775 | 12,754 | 36,188 | 14,342 | 50,529 |
| Footwear, other wearing apparel, and made-up textile goods | 8,358 | 3,390 | 12,951 | 39,316 | 21,309 | 42,706 | 64,015 |
| Wood and cork products (except furniture) | 10,120 | 1,039 | 43,085 | 546 | 53,205 | 1,585 | 54,790 |
| Furniture and fixtures | 4,063 | 721 | 14,463 | 1,641 | 18,526 | 2,362 | 20,887 |
| Paper and paper products | 7,577 | 1,169 | 28,353 | 3,711 | 35,930 | 4,880 | 40,810 |
| Printing, publishing, etc. | 11,043 | 3,767 | 38,686 | 6,615 | 49,729 | 10,382 | 60,112 |
| Leather and leather products (except footwear and apparel) | 1,376 | 276 | 3,892 | 2,023 | 5,268 | 2,299 | 7,568 |
| Rubber products | 2,436 | 370 | 12,785 | 1,382 | 15,221 | 1,752 | 16,973 |
| Chemicals and chemical products | 7,954 | 1,858 | 14,101 | 3,285 | 22,055 | 5,143 | 27,199 |
| Petroleum and coal products | 1,134 | 105 | 1,706 | 81 | 2,840 | 186 | 3,026 |
| Non-metallic mineral products. n.e.i. | 6,446 | 935 | 24,115 | 1,255 | 30,563 | 2,190 | 32,751 |
| Basic metal manufactures | 4,870 | 539 | 14,293 | 257 | 19,163 | 796 | 19,959 |
| Metal products (except machinery and transport equipment) | 16,291 | 2,484 | 50,789 | 4,025 | 67,080 | 6,509 | 73,589 |
| Machinery (except electrical) | 14,202 | 1,826 | 48,383 | 1,452 | 62,585 | 3,278 | 65,862 |
| Electrical machinery and appliances | 7,853 | 1,516 | 19,812 | 5,445 | 27,665 | 6,961 | 34,626 |
| Transport equipment | 11,547 | 1,303 | 38,214 | 2,867 | 49,761 | 4,170 | 53,931 |
| Miscellaneous products | 8,342 | 1,842 | 18,643 | 6,196 | 26,985 | 8,038 | 35,023 |
| Totals | 160,205 | 29,389 | 577,994 | 107,660 | 738,199 | 137,049 | 875,247 |
MOTIVE POWER—A supply of cheap motive power is a material element in industrial development. New Zealand industries were formerly handicapped in this respect, long railway hauls and, in some instances, sea carriage being involved in the transport of coal from the mines to the factories. The development of the country's electric power resources (as described in Section 20A) has been a major factor in industrial growth, especially as the rates compare very favourably with those in more highly industrialised countries.
The following table shows the number and aggregate horsepower of each class of engine used in factories.
| Class of Engine | 1968-69 | 1969-70 | 1970-71 | 1971-72 | 1972-73 | |
|---|---|---|---|---|---|---|
| Electric | No. | 247,447 | 256,629 | 264,523 | 274,616 | 285,454 |
| hp | 1,362,783 | 1,461,336 | 1,521,349 | 1,587,346 | 1,691,418 | |
| Steam | No. | 196 | 175 | 178 | 167 | 162 |
| hp | 12,462 | 11,820 | 11,596 | 10,592 | 11,446 | |
| Petrol and light oil | No. | 838 | 869 | 822 | 842 | 766 |
| hp | 18,854 | 21,584 | 20,392 | 21,123 | 26,231 | |
| Heavy oil | No. | 168 | 160 | 148 | 158 | 148 |
| hp | 12,929 | 10,971 | 10,405 | 10,853 | 8,505 | |
| Other | No. | 54 | 80 | 215 | 196 | 200 |
| hp | 2,373 | 1,618 | 3,174 | 2,766 | 3,399 | |
| Totals | No. | 248,703 | 257,913 | 265,886 | 275,979 | 286,730 |
| hp | 1,409,401 | 1,507,329 | 1,566,916 | 1,632,680 | 1,740,999 | |
The figures relating to horsepower represent the rated horsepower of engines ordinarily in use for driving factory plant. Steam boilers and engines for generating electric power in own works are excluded.
The following table shows the types and rated horsepower of engines ordinarily in use in the various industries during 1972-73.
| Industry Group | Rated Horsepower of Engines in Use | |||||
|---|---|---|---|---|---|---|
| Electric | Steam | Petrol and Light Oil | Heavy Oil | Other | Total | |
| Food | 374,164 | 2,749 | 1,404 | 1,702 | 14 | 380,033 |
| Beverages | 24,886 | 123 | 78 | 3 | 15 | 25,105 |
| Tobacco manufactures | 4,313 | - | - | - | - | 4,313 |
| Textiles | 67,817 | 248 | 6 | - | - | 68,071 |
| Footwear, other wearing apparel, and made-up textile goods | 19,983 | 17 | 1 | 11 | 5 | 20,017 |
| Wood and cork products (except furniture) | 179,382 | 1,968 | 4,022 | 3,299 | 186 | 188,857 |
| Furniture and fixtures | 20,655 | 4 | - | - | - | 20,659 |
| Paper and paper products | 344,728 | 15 | 164 | 160 | 54 | 345,121 |
| Printing, publishing, etc. | 32,703 | - | 100 | 710 | - | 33,513 |
| Leather and leather products (except footwear and apparel) | 11,543 | 15 | 2 | - | 58 | 11,618 |
| Rubber products | 36,447 | 181 | 4 | - | - | 36,632 |
| Chemicals and chemical products | 85,476 | 163 | 381 | 67 | 334 | 86,421 |
| Petroleum and coal products | 22,361 | 5,558 | 1,129 | - | 120 | 29,168 |
| Non-metallic mineral products, n.e.i. | 119,267 | 275 | 3,059 | 1,505 | 427 | 124,533 |
| Basic metal manufactures | 86,177 | - | 174 | - | 7 | 86,358 |
| Metal products (except machinery and transport equipment) | 79,775 | 46 | 1,702 | 486 | 85 | 82,094 |
| Machinery (except electrical) | 71,846 | 16 | 3,490 | 177 | 209 | 75,738 |
| Electrical machinery and appliances | 25,117 | - | 21 | 27 | 1 | 25,166 |
| Transport equipment | 36,382 | 8 | 10,386 | 358 | 181 | 47,315 |
| Miscellaneous products | 48,396 | 60 | 108 | - | 1,703 | 50,267 |
| Totals | 1,691,418 | 11,446 | 26,231 | 8,505 | 3,399 | 1,740,999 |
CONSUMPTION OF COAL—During the year 1972-73, 957,000 tonnes of New Zealand coal were used in industries covered by the statistics of factory production. Comparable figures for the 2 previous years were: 1970-71, 908,000 tonnes and 1971-72, 926,000 tonnes. It is important to note that the factory production statistics exclude the activities of the gas-making industry and electrical generation and supply stations. These two industries used 98,436 and 616,863 tonnes of coal respectively in 1972-73.
The following table shows for the year 1972-73 the consumption of coal by industrial groups.
| Industry Group | Tonnes of Coal Used |
|---|---|
| Food | 440,556 |
| Beverages | 11,817 |
| Tobacco manufactures | - |
| Textiles | 35,528 |
| Footwear, other wearing apparel, and made-up textile goods | 1,689 |
| Wood and cork products (except furniture) | 855 |
| Furniture and fixtures | 11 |
| Paper and paper products | 69,978 |
| Printing, publishing, etc. | 113 |
| Leather and leather products (except footwear and apparel) | 3,875 |
| Rubber products | 18,413 |
| Chemicals and chemical products | 12,092 |
| Petroleum and coal products | 47,768 |
| Non-metallic mineral products, n.e.i. | 279,567 |
| Basic metal manufactures | 30,906 |
| Metal products (except machinery and transport equipment) | 483 |
| Machinery (except electrical) | 231 |
| Electrical machinery and appliances | - |
| Transport equipment | 10 |
| Miscellaneous products | 2,709 |
| Total | 956,601 |
Approximately 80 percent of the amount of coal used is accounted for in three groups: food, paper and paper products, and non-metallic mineral products. Individual industries using more than 10,000 tonnes of coal in 1972-73 were as follows.
| Industry | Coal Used |
|---|---|
| tonnes | |
| Milk products | 308,000 |
| Cement | 246,000 |
| Meat freezing and preserving | 123,000 |
| Pulp, paper and paperboard | 70,000 |
| Petroleum and coal products | 48,000 |
| Basic metal industries | 30,000 |
| Woollen milling | 19,000 |
| Structural clay products | 17,000 |
| Lime | 13,000 |
| Motor tyres and tubes | 12,000 |
| Brewing ale and stout | 11,000 |
MATERIALS—The value of materials used does not afford a very satisfactory basis of comparison as between one industry or industrial group and another, for the reason that the changes wrought during the process of manufacture vary considerably in degree. An example of the wide differences which may occur in the ratio of cost of materials to value of goods produced will be seen in the food group and the wood and cork products (except furniture) group. The values shown for materials used include the cost of containers and packing but exclude fuel costs.
Totals for the latest year show that the cost of materials used in food manufacture was $1,086 million, and the goods produced were valued at $1,488 million, while the materials used in the manufacture of wood and cork products cost $113 million and finished goods produced were valued at $225 million.
The cost of materials used in each industrial group and in all industries for each of the latest 3 years was as follows.
| Industry Group | Cost of Materials Used | ||
|---|---|---|---|
| 1970-71 | 1971-72 | 1972-73 | |
| $(000) | |||
| Food | 741,702 | 895,593 | 1,086,164 |
| Beverages | 30,654 | 35,134 | 43,976 |
| Tobacco manufactures | 17,798 | 18,648 | 20,105 |
| Textiles | 141,107 | 162,111 | 274,167 |
| Footwear, other wearing apparel, and made-up textile goods | 90,101 | 93,747 | 104,290 |
| Wood and cork products (except furniture) | 98,133 | 101,829 | 112,974 |
| Furniture and fixtures | 26,881 | 29,232 | 35,016 |
| Paper and paper products | 85,967 | 92,027 | 102,191 |
| Printing, publishing, etc. | 40,918 | 42,815 | 47,763 |
| Leather and leather products (except footwear and apparel) | 12,448 | 13,114 | 20,097 |
| Rubber products | 23,143 | 22,673 | 22,720 |
| Chemicals and chemical products | 100,920 | 111,047 | 127,971 |
| Petroleum and coal products | 66,928 | 73,919 | 81,591 |
| Non-metallic mineral products, n.e.i. | 31,478 | 35,794 | 41,397 |
| Basic metal manufactures | 53,011 | 56,669 | 84,764 |
| Metal products (except machinery and transport equipment) | 104,488 | 115,132 | 135,778 |
| Machinery (except electrical) | 89,689 | 98,368 | 108,234 |
| Electrical machinery and appliances | 65,632 | 66,701 | 74,690 |
| Transport equipment | 146,212 | 170,223 | 199,903 |
| Miscellaneous products | 47,345 | 53,802 | 60,728 |
| Totals | 2,014,555 | 2,288,578 | 2,784,519 |
A large proportion of the total cost of materials is accounted for by the food group, which includes the primary produce processing industries dealing with meat freezing and preserving and the manufacture of butter, cheese, and other milk products. In the latest year, for example, the cost of materials used by this group, $1,086 million, represented 39 percent of the total cost of materials used by all industries, $2,785 million. For this reason, variations in the prices received for primary produce have a very marked effect on this total.
PRODUCTS—The value of products is based upon the valuation of goods at the factory door. It is the selling value at the factory to customers of all goods made or processed during the year after deducting all costs of selling and distribution.
In making use of the gross value of products it must be borne in mind that the figures include the value of raw materials operated upon, which value in recent years constitutes approximately three-fifths of the value of products. Where the products of one industry—for example, sawmilling—are treated again in other industries, such as furniture making, joinery, etc., part of the value of the timber shown as products of the former industry appears again as the materials of the latter industry and enters into the value of furniture and joinery made. Duplication of this kind is found in many industries.
The following table shows the gross value of production for each industrial group and for all industries.
| Industry Group | Value of Production | ||
|---|---|---|---|
| 1970-71 | 1971-72 | 1972-73 | |
| $(000) | |||
| Food | 1,015,664 | 1,233,534 | 1,488,018 |
| Beverages | 68,310 | 76,386 | 88,170 |
| Tobacco manufactures | 26,489 | 28,499 | 31,580 |
| Textiles | 223,938 | 254,890 | 375,741 |
| Footwear, other wearing apparel, and made-up textile goods | 172,745 | 185,913 | 204,148 |
| Wood and cork products (except furniture) | 188,073 | 198,376 | 224,769 |
| Furniture and fixtures | 51,345 | 58,386 | 70,283 |
| Paper and paper products | 186,494 | 194,659 | 213,229 |
| Printing, publishing, etc. | 132,235 | 142,159 | 159,096 |
| Leather and leather products (except footwear and apparel) | 23,551 | 25,572 | 33,989 |
| Rubber products | 50,993 | 52,912 | 55,535 |
| Chemicals and chemical products | 167,773 | 183,040 | 211,436 |
| Petroleum and coal products | 84,496 | 90,709 | 100,297 |
| Non-metallic mineral products, n.e.i. | 101,904 | 111,419 | 129,450 |
| Basic metal manufactures | 81,395 | 96,260 | 144,233 |
| Metal products (except machinery and transport equipment) | 213,779 | 240,646 | 280,275 |
| Machinery (except electrical) | 182,486 | 200,814 | 223,375 |
| Electrical machinery and appliances | 117,088 | 123,166 | 137,453 |
| Transport equipment | 215,250 | 254,762 | 297,965 |
| Miscellaneous products | 103,413 | 122,185 | 138,709 |
| Totals | 3,407,419 | 3,874,287 | 4,607,751 |
A similar analysis by statistical areas, but limited to the year 1972-73, is now given.
| Industry Group | Northland | Central Auckland | South Auckland - Bay of Plenty | East Coast | Hawke's Bay | Taranaki | Wellington |
|---|---|---|---|---|---|---|---|
| Value of Production 1972-73 | |||||||
| $(000) | |||||||
| Food | 76,050 | 263,172 | 236.967 | (*) | 113,946 | 126,440 | 201,443 |
| Beverages | (*) | 41,217 | 7,094 | (*) | 6,857 | (*) | 10,407 |
| Tobacco manufactures | - | (*) | (*) | - | (*) | - | (*) |
| Textiles | - | 112,907 | (*) | (*) | 39,222 | (*) | 75,689 |
| Footwear, other wearing apparel, and made-up textile goods | 2,342 | 92,086 | 15,117 | 479 | 3,118 | 4,561 | 38,865 |
| Wood and cork products (except furniture) | 5,363 | 44,243 | 83,440 | 1,379 | 8,084 | 4,571 | 20,750 |
| Furniture and fixtures | 179 | 40,739 | 3,196 | (*) | 1,944 | 506 | 6,590 |
| Paper and paper products | - | 67,737 | 95,981 | (*) | (*) | (*) | (*) |
| Printing, publishing, etc. | 1,563 | 60,306 | 8,774 | (*) | 5,206 | 2,491 | 43,502 |
| Leather and leather products (except footwear and apparel) | (*) | 12,125 | (*) | (*) | (*) | (*) | 4,483 |
| Rubber products | (*) | 13,039 | 2,075 | (*) | 531 | 373 | 15,552 |
| Chemicals and chemical products | (*) | 76,790 | 17,852 | (*) | (*) | (*) | 50,976 |
| Petroleum and coal products | (*) | (*) | (*) | - | - | (*) | 14,483 |
| Non-metallic mineral products, n.e.i. | (*) | 49,134 | 7,707 | 442 | 3,461 | 1,176 | 14,887 |
| Basic metal manufactures | - | 87,893 | 564 | (*) | (*) | (*) | 5,608 |
| Metal products (except machinery and transport equipment) | 1,902 | 146,771 | 16,186 | 417 | 10,223 | 3,389 | 51,153 |
| Machinery (except electrical) | 2,578 | 89,162 | 24,970 | (*) | 6,371 | 9,551 | 38,925 |
| Electrical machinery and appliances | 327 | 47,939 | 6,123 | 202 | 3,033 | (*) | 28,949 |
| Transport equipment | (*) | 58,750 | 22,986 | 370 | 607 | (*) | 163,367 |
| Miscellaneous products | 98,194 | 87,329 | 15,915 | 45,938 | 37,796 | 38,775 | 64,951 |
| Totals | 188,498 | 1,391,340 | 564,948 | 49,227 | 240,398 | 191,834 | 850,581 |
| Industry Group | Marlborough | Nelson | Westland | Canterbury | Otago | Southland | Total |
|---|---|---|---|---|---|---|---|
*To avoid disclosure of details of individual establishments, figures have been included in those for miscellaneous products. † Net total without figures from other groups to avoid disclosure of details | |||||||
| Value of Production 1972-73 | |||||||
| $(000) | |||||||
| Food | 11,003 | 18,642 | (*) | 161,314 | 102,821 | 133,701 | 1,488,018 |
| Beverages | (*) | (*) | (*) | (*) | 5,688 | (*) | 88,170 |
| Tobacco manufactures | - | (*) | - | - | - | - | 31,580 |
| Textiles | - | (*) | - | 73,478 | 30,217 | 28,412 | 375,741 |
| Footwear, other wearing apparel, and made-up textile goods | 1,767 | 1,013 | (*) | 38,174 | 5,373 | (*) | 204,148 |
| Wood and cork products (except furniture) | 924 | 7,745 | 8,632 | 26,334 | 6,784 | 6,519 | 224,769 |
| Furniture and fixtures | (*) | 655 | (*) | 13,301 | 2,712 | 358 | 70,283 |
| Paper and paper products | - | (*) | - | 11,833 | 2,077 | (*) | 213,229 |
| Printing, publishing, etc. | (*) | (*) | (*) | 19,941 | 11,301 | 2,554 | 159,096 |
| Leather and leather products (except footwear and apparel) | (*) | - | - | 8,432 | 4,679 | 2,247 | 33,989 |
| Rubber products | (*) | (*) | (*) | 22,862 | (*) | (*) | 55,535 |
| Chemicals and chemical products | (*) | (*) | - | 15,411 | 10,100 | (*) | 211,436 |
| Petroleum and coal products | - | - | - | (*) | 482 | - | 100,297 |
| Non-metallic mineral products, n.e.i. | (*) | (*) | (*) | 17,331 | 7,157 | 3,156 | 129,450 |
| Basic metal manufactures | - | (*) | - | 4,201 | (*) | (*) | 144,233 |
| Metal products (except machinery and transport equipment) | (*) | 2,874 | (*) | 33,746 | 10,526 | 2,784 | 280,275 |
| Machinery (except electrical) | 1,409 | 1,121 | (*) | 33,231 | 10,262 | 4,524 | 223,375 |
| Electrical machinery and appliances | - | 277 | - | 34,940 | (*) | 408 | 137,453 |
| Transport equipment | 1,867 | (*) | - | 27,015 | 3,413 | 861 | 297,965 |
| Miscellaneous products | 2,603 | 31,249 | 7,435 | 30,476 | 11,940 | 48,632 | 138,709 |
| Totals | 19,573 | 63,576 | 16,067 | 572,021 | 225,533 | 234,155 | 4,607,751 |
NET OUTPUT (NET VALUE ADDED)—This consists of the rewards to the factors of production, i.e., salaries and wages, interest on borrowed capital, and manufacturers' surplus. These three items are the components of national income or its companion aggregates net national and net domestic output. Net output (net value added) replaces the former added value which consisted of the difference between the value of production and the cost of materials.
The following table covering the manufacturing industry demonstrates how each concept is arrived at.
| Components | 1968-69 | 1969-70 | 1970-71 | 1971-72 | 1972-73 |
|---|---|---|---|---|---|
| *National income at factor cost plus factor payments to rest of world. | |||||
| $(million) | |||||
| Value of production | 2,645.8 | 2,994.8 | 3,407.4 | 3,872.9 | 4,607.8 |
| Less Costs of materials | 1,591.0 | 1,791.4 | 2,014.6 | 2,228.6 | 2,784.5 |
| Added value | 1,054.8 | 1,203.4 | 1,392.8 | 1,584.3 | 1,823.3 |
| Less Other expenses | 224.5 | 255.1 | 306.6 | 354.4 | 406.8 |
| Less Depreciation charges | 73.2 | 81.2 | 90.5 | 100.6 | 114.5 |
| Net output (Net value added) | 757.1 | 867.1 | 995.7 | 1,129.3 | 1,301.9 |
| percent | |||||
| Contribution of manufacturing industry to net domestic output (income)* | 18.7 | 19.3 | 21.0 | 20.8 | 21.0 |
The next table on net output for 1972-73 classifies factories into several net output groupings, giving a general picture of size distribution.
| Group | Establishments | Persons Engaged | Salaries and Wages Paid | Cost of Materials Used | Value of Production | Net Output | |
|---|---|---|---|---|---|---|---|
| Total | Per Person Engaged | ||||||
| Net Output | No. | No. | $(000) | $(000) | $(000) | $(000) | $ |
| Under 5,000 | 156 | 394 | 974 | 1,904 | 3,122 | 526 | 1,335 |
| 5,000- 9,999 | 449 | 1,251 | 3,483 | 5,065 | 10,310 | 3,489 | 2,789 |
| 10,000-19,999 | 1,190 | 4,883 | 15,137 | 23,668 | 48,477 | 17,539 | 3,592 |
| 20,000-29,999 | 936 | 5,805 | 18,831 | 31,606 | 63,091 | 23,128 | 3,984 |
| 30,000-39,999 | 726 | 6,135 | 20,116 | 36,501 | 70,940 | 25,354 | 4,132 |
| 40,000-99,999 | 2,052 | 30,308 | 98,212 | 238,894 | 418,356 | 131,337 | 4,333 |
| 100,000-199,999 | 1,002 | 30,066 | 99,128 | 348,595 | 545,140 | 140,522 | 4,674 |
| 200,000-499,999 | 684 | 41,127 | 139,615 | 459,918 | 752,044 | 211,108 | 5,133 |
| 500,000-999,999 | 233 | 29,105 | 103,087 | 347,332 | 572,728 | 160,509 | 5,515 |
| 1,000,000-1,999,999 | 119 | 28,019 | 105,068 | 326,534 | 558,867 | 168,642 | 6,019 |
| 2,000,003-4,999,999 | 59 | 29,803 | 132,665 | 318,756 | 605,736 | 183,891 | 6,338 |
| 5,000,000 and over | 62 | 28,719 | 138,932 | 645,745 | 958,939 | 230,815 | 8,037 |
| 7,668 | 235,615 | 875,247 | 2,784,519 | 4,607,751 | 1,301,861 | 5,525 | |
The analysis of net output (net value added) for 1972-73 by statistical areas now follows.
| Industry Group | Northland | Central Auckland | South Auckland - Bay of Plenty | East Coast | Hawke's Bay | Taranaki | Wellington |
|---|---|---|---|---|---|---|---|
*To avoid disclosure of details of individual establishments, figures have been included in those for miscellaneous products. † Net total without figures from other groups to avoid disclosure of details. | |||||||
| Net Output 1972-73 | |||||||
| $(000) | |||||||
| Food | 8,179 | 46,928 | 23,398 | (*) | 23,646 | 16,874 | 41,278 |
| Beverages | (*) | 12,705 | 2,424 | (*) | 2,128 | (*) | 4,774 |
| Tobacco manufactures | - | (*) | - | - | (*) | - | (*) |
| Textiles | - | 26,282 | (*) | * | 3,608 | (*) | 15,571 |
| Footwear, other wearing apparel, and made-up textile goods | 933 | 36,875 | 6,059 | 213 | 1,250 | 1,838 | 15,646 |
| Wood and cork products (except furniture) | 1,868 | 14,631 | 30,409 | 508 | 2,278 | 1,725 | 7,187 |
| Furniture and fixtures | 74 | 16,500 | 1,307 | (*) | 912 | 227 | 2,574 |
| Paper and paper products | - | 20,349 | 26,188 | (*) | (*) | (*) | 6,953 |
| Printing, publishing, etc. | 919 | 28,721 | 4,844 | (*) | 2,729 | 1,614 | 23,611 |
| Leather and leather products (except footwear and apparel) | (*) | 4,301 | (*) | (*) | (*) | (*) | (*) |
| Rubber products | (*) | 5,041 | 733 | (*) | 212 | 132 | 6,769 |
| Chemicals and chemical products | (*) | 24,979 | 3,469 | (*) | (*) | (*) | 14,817 |
| Petroleum and coal products | (*) | (*) | (*) | - | - | (*) | 2,523 |
| Non-metallic mineral products, n.e.i. | (*) | 22,293 | 3,215 | 233 | 1,445 | 604 | 6,077 |
| Basic metal manufactures | - | 15,350 | 273 | (*) | (*) | (*) | 1,852 |
| Metal products (except machinery and transport equipment) | 664 | 56,722 | 6,303 | 143 | 2,484 | 1,359 | 19,646 |
| Machinery (except electrical) | 1,253 | 34,611 | 11,032 | (*) | 2,522 | 3,878 | 15,872 |
| Electrical machinery and appliances | 158 | 15,074 | 2,324 | 95 | 1,168 | (*) | 9,565 |
| Transport equipment | (*) | 19,585 | 5,500 | 223 | 213 | (*) | 35,292 |
| Miscellaneous products | 16,512 | 33,129 | 3,325 | 11,531 | 10,159 | 9,221 | 16,114 |
| Totals | 30,558 | 434,076 | 130,801 | 12,946 | 54,755 | 37,472 | 246,121 |
| Food | 3,023 | 3,372 | (*) | 40,120 | 32,616 | 41,462 | 290,000 |
| Beverages | (*) | (*) | (*) | (*) | 2,260 | (*) | 29,653 |
| Tobacco manufactures | - | (*) | - | - | - | - | 8,721 |
| Textiles | - | (*) | - | 15,724 | 7,521 | 924 | 71,363 |
| Footwear, other wearing apparel, and made-up textile goods | 691 | 369 | (*) | 14,808 | 2,289 | (*) | 81,411 |
| Wood and cork products (except furniture) | 348 | 2,310 | 3,042 | 10,362 | 2,344 | 2,495 | 79,509 |
| Furniture and fixtures | (*) | 340 | (*) | 5,374 | 1,070 | 156 | 28,579 |
| Paper and paper products | - | (*) | - | 2,890 | 636 | (*) | 60,325 |
| Printing, publishing, etc. | (*) | (*) | (*) | 11,188 | 5,306 | 1,575 | 82,591 |
| Leather and leather products (except footwear and apparel) | (*) | - | - | 2,507 | 1,259 | 558 | 10,618 |
| Rubber products | (*) | (*) | (*) | 9,883 | (*) | (*) | 23,194 |
| Chemicals and chemical products | (*) | (*) | - | 4,543 | 2,444 | (*) | 59,750 |
| Petroleum and coal products | - | - | - | (*) | 101 | - | 13,595 |
| Non-metallic mineral products, n.e.i. | (*) | (*) | (*) | 7,284 | 3,302 | 1,192 | 56,614 |
| Basic metal manufactures | - | (*) | (*) | 1,588 | (*) | (*) | 34,208 |
| Metal products (except machinery and transport equipment) | (*) | 1,258 | (*) | 13,299 | 4,455 | 1,026 | 107,469 |
| Machinery (except electrical) | 560 | 467 | (*) | 11,204 | 3,630 | 1,796 | 87,466 |
| Electrical machinery and appliances | - | 88 | - | 12,162 | (*) | 165 | 45,820 |
| Transport equipment | 876 | (*) | - | 9,050 | 1,675 | 434 | 76,148 |
| Miscellaneous products | 1,310 | 8,540 | 2,199 | 10,985 | 4,836 | 15,836 | 54,828 |
| Totals | 6,803 | 16,745 | 5,240 | 182,971 | 75,747 | 67,620 | 1,301,861 |
The development of factory production in New Zealand is clearly portrayed in the following diagram, which also shows the relationship between cost of materials, net output, and value of production.
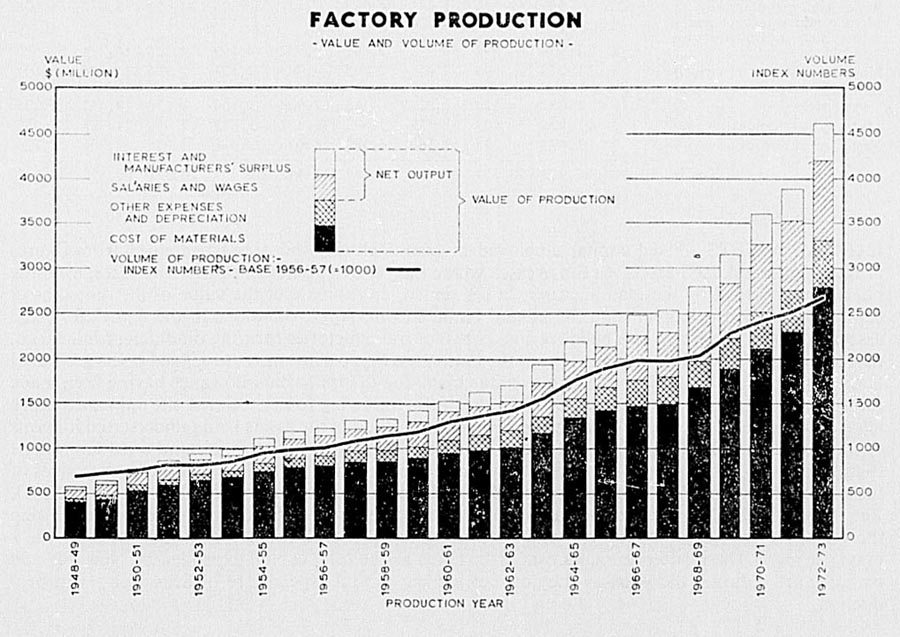
EXPENSES OF OPERATION—Total operating costs of factories for the year 1972-73 amounted to $4,220 million, of which salaries and wages accounted for $875 million, cost of materials for $2,785 million, and other expenses for $561 million, while value of production totalled $4,608 million.
The table below shows the principal items comprised in the figure for expenses of operation, other than salaries and wages and costs of materials, by industry groups for the year 1972-73.
| Industry Group | Coal | Electricity | Coke, Gas, Oils, etc. | Insurance | Interest on Loans, etc. | Depreciation | Rent | Repairs and Maintenance | Other | Total |
|---|---|---|---|---|---|---|---|---|---|---|
| $(000) | ||||||||||
| Food | 4,568 | 8,771 | 5,985 | 5,591 | 6,417 | 29,007 | 3,913 | 22,505 | 31,515 | 118,271 |
| Beverages | 114 | 597 | 529 | 656 | 1,469 | 3,647 | 395 | 1,661 | 6,940 | 16,009 |
| Tobacco manufactures | - | 131 | 40 | 169 | 176 | 846 | 65 | 447 | 1,057 | 2,931 |
| Textiles | 445 | 2,053 | 1,119 | 1,324 | 2,089 | 7,166 | 1,960 | 4,819 | 11,326 | 32,301 |
| Footwear, other wearing apparel, and made-up textile goods | 30 | 850 | 126 | 948 | 1,187 | 2,646 | 3,416 | 1,754 | 8,677 | 19,634 |
| Wood and cork products (except furniture) | 6 | 2,267 | 667 | 2,669 | 2,037 | 5,213 | 1,844 | 6,479 | 13,141 | 34,322 |
| Furniture and fixtures | - | 350 | 41 | 612 | 486 | 921 | 1,195 | 692 | 2,878 | 7,174 |
| Paper and paper products | 690 | 5,713 | 2,798 | 2,259 | 1,992 | 13,153 | 1,137 | 6,820 | 18,144 | 52,706 |
| Printing, publishing, etc. | 1 | 991 | 182 | 1,085 | 1,351 | 5,715 | 2,596 | 2,501 | 15,671 | 30,094 |
| Leather and leather products (except footwear and apparel) | 36 | 197 | 134 | 226 | 274 | 555 | 316 | 491 | 1,318 | 3,547 |
| Rubber products | 178 | 873 | 465 | 478 | 141 | 1,981 | 358 | 1,532 | 3,754 | 9,761 |
| Chemicals and chemical products | 141 | 1,336 | 584 | 1,278 | 1,271 | 5,783 | 879 | 4,760 | 8,955 | 24,986 |
| Petroleum and coal products | - | 492 | 159 | 306 | 52 | 1,206 | 193 | 922 | 1,832 | 5,163 |
| Non-metallic mineral products, n.e.i. | 3,900 | 2,611 | 2,595 | 1,130 | 1,395 | 6,163 | 615 | 6,145 | 8,281 | 32,834 |
| Basic metal manufactures | 321 | 3,859 | 2,219 | 1,335 | 10,767 | 7,472 | 375 | 4,022 | 5,657 | 36,028 |
| Metal products (except machinery and transport equipment) | 8 | 1,936 | 894 | 2,318 | 2,497 | 6,952 | 4,199 | 4,325 | 16,394 | 39,525 |
| Machinery (except electrical) | 6 | 1,278 | 596 | 2,086 | 2,165 | 4,709 | 2,221 | 2,706 | 14,076 | 29,841 |
| Electrical machinery and appliances | - | 1,053 | 320 | 877 | 783 | 2,908 | 1,130 | 1,513 | 9,143 | 17,725 |
| Transport equipment | - | 1,125 | 508 | 1,455 | 1,472 | 3,842 | 1,119 | 2,068 | 11,798 | 23,387 |
| Miscellaneous products | 23 | 1,473 | 395 | 1,162 | 1,122 | 4,666 | 2,411 | 2,688 | 10,336 | 24,276 |
| Totals | 10,469 | 37,953 | 20,354 | 27,964 | 39,145 | 114,549 | 30,339 | 78,851 | 200,893 | 560,517 |
CAPITAL ASSETS—Fixed capital employed in manufacturing industry is obtained from figures of manufacturers' fixed assets. In those cases where the factory premises, or in some cases, even the plant, is not owned by the manufacturer, but is rented, an estimate of the value of the rented asset has been obtained by capitalising the annual rental shown. Approximations in the figures for fixed assets are also made where one building houses two or more factories carrying on different industries, necessitating an apportionment as between the industries. In most instances, too, fixed assets are stated at their book value, and this may be an overstatement due to insufficient allowance having been made for depreciation, obsolescence, etc., or an understatement owing to appreciated site value, excessive allowance for depreciation, or currency depreciation resulting in the assets being understated in terms of their present earning capacity or replacement cost. It is necessary to bear in mind these limitations to the accuracy of the figures of fixed assets appearing in the following table which shows the values of these assets for each of the last 3 years together with an analysis by principal industries for 1972-73. For the year 1972-73 information is also shown by industry groups of the amounts expended during the year by way of capital additions and alterations, together with totals for all industries for the 2 previous years. These latter amounts cannot be taken as the total capital expended by New Zealand manufacturers during the year, as they do not include capital expenditure of firms not yet in production.
| Industry Group | Capital Additions and Alterations During the Year | Value at End of Year (Including Estimated Value of Rented Assets) | ||||
|---|---|---|---|---|---|---|
| Land and Buildings | Plant, Machinery and Equipment | Total | Land and Buildings | Plant, Machinery and Equipment | Total | |
| $(000) | ||||||
| Totals— | ||||||
| 1970-71 | 49,464 | 104,593 | 154,057 | 773,972 | 465,304 | 1,239,276 |
| 1971-72 | 65,203 | 167,297 | 232,500 | 871,594 | 565,353 | 1,436,947 |
| 1972-73— | ||||||
| Food | 17,881 | 33,588 | 51,469 | 219,715 | 147,324 | 367,039 |
| Beverages | 2,786 | 5,535 | 8,321 | 28,660 | 19,388 | 48,048 |
| Tobacco manufactures | 201 | 1,473 | 1,674 | 3,560 | 4,662 | 8,222 |
| Textiles | 1,469 | 7,757 | 9,226 | 46,686 | 33,622 | 80,308 |
| Footwear, other wearing apparel, and made-up textile goods | 1,400 | 2,394 | 3,794 | 50,409 | 15,962 | 66,371 |
| Wood and cork products (except furniture) | 2,106 | 7,439 | 9,545 | 50,660 | 27,590 | 78,250 |
| Furniture and fixtures | 817 | 779 | 1,596 | 22,013 | 3,823 | 25,836 |
| Paper and paper products | 11,346 | 55,132 | 66,478 | 63,091 | 106,387 | 169,478 |
| Printing, publishing, etc. | 2,390 | 6,515 | 8,905 | 60,165 | 32,701 | 92,866 |
| Leather and leather products (except footwear and apparel) | 523 | 755 | 1,278 | 7,036 | 2,486 | 9,522 |
| Rubber products | 1,129 | 3,592 | 4,721 | 14,063 | 10,874 | 24,937 |
| Chemicals and chemical products | 5,306 | 7,199 | 12,505 | 52,709 | 24,434 | 77,143 |
| Petroleum and coal products | 182 | 942 | 1,124 | 6,784 | 7,355 | 14,139 |
| Non-metallic mineral products, n.e.i. | 1,638 | 4,892 | 6,530 | 33,449 | 25,334 | 58,783 |
| Basic metal manufactures | 2,441 | 16,726 | 19,167 | 51,530 | 96,687 | 148,217 |
| Metal products (except machinery and transport equipment) | 2,893 | 9,489 | 12,382 | 85,427 | 33,153 | 118,580 |
| Machinery (except electrical) | 1,993 | 6,212 | 8,205 | 55,204 | 20,412 | 75,616 |
| Electrical machinery and appliances | 1,134 | 2,929 | 4,063 | 31,357 | 11,077 | 42,434 |
| Transport equipment | 6,747 | 5,053 | 11,800 | 47,317 | 12,821 | 60,138 |
| Miscellaneous products | 1,491 | 6,061 | 7,552 | 44,648 | 23,498 | 68,146 |
| Totals, 1972-73 | 65,872 | 184,463 | 250,335 | 974,484 | 659,588 | 1,634,073 |
MANUFACTURERS' STOCKS—The following table gives results of the quarterly surveys. In presenting the results, the chief seasonal industries—meat processing and dairy products manufacture—have been segregated to assist in the interpretation of movements in stock holdings. The heading “Materials” includes work in progress, fuel, and miscellaneous supplies.
| As at 31 March | Total Stocks | Percentage Change in Stocks at Annual Intervals | Stocks Seasonally Adjusted | Percentage Change in Stocks Seasonally Adjusted at Quarterly Intervals | ||||||
|---|---|---|---|---|---|---|---|---|---|---|
| Materials Finished Goods | Total | Materials Finished Goods | Total | Materials Finished Goods | Materials Finished Goods | Total | Materials Finished Goods | Materials Finished Goods | ||
| $(m) | percent | $(m) | percent | |||||||
| Including Primary Produce Processing Industries | ||||||||||
| 1966 | 262.0 | 174.7 | 436.7 | +15.3 | +17.3 | +16.2 | ... | ... | ... | ... |
| 1967 | 284.5 | 196.9 | 481.4 | +8.6 | +12.7 | +10.2 | ... | ... | ... | ... |
| 1968 | 283.3 | 243.8 | 527.1 | -0.4 | +23.9 | +9.5 | ... | ... | ... | ... |
| 1969 | 314.2 | 252.7 | 566.9 | +10.9 | +3.6 | +7.5 | ... | ... | ... | ... |
| 1970 | 347.7 | 274.9 | 622.6 | +10.7 | +8.8 | +9.8 | ... | ... | ... | ... |
| 1971 | 397.1 | 314.1 | 711.3 | +14.2 | +14.3 | +14.2 | ... | ... | ... | ... |
| 1972 | 445.2 | 335.4 | 780.7 | +12.1 | +6.8 | +9.8 | ... | ... | ... | ... |
| 1973 | 444.8 | 381.4 | 826.3 | -0.1 | +13.7 | +5.8 | ... | ... | ... | ... |
| 1974 | 577.1 | 428.2 | 1,005.3 | +29.7 | +12.3 | +21.7 | ... | ... | ... | ... |
| Excluding Primary Produce Processing Industries | ||||||||||
| 1966 | 251.6 | 97.5 | 349.1 | +16.3 | +9.1 | +14.2 | 249.9 | 99.3 | +3.7 | +0.3 |
| 1967 | 273.3 | 112.9 | 386.2 | +8.6 | +15.8 | +10.6 | 271.4 | 115.0 | +2.4 | +1.5 |
| 1968 | 272.4 | 134.3 | 406.7 | -0.3 | +19.0 | +5.3 | 270.5 | 136.8 | +0.6 | +2.9 |
| 1969 | 302.5 | 145.0 | 447.5 | +11.0 | +8.0 | +10.0 | 300.4 | 147.8 | +6.0 | +1.8 |
| 1970 | 334.6 | 166.2 | 500.8 | +10.6 | +14.6 | +11.9 | 330.6 | 170.3 | +1.7 | +6.2 |
| 1971 | 383.3 | 178.3 | 561.7 | +14.6 | +7.3 | +12.2 | 381.4 | 179.9 | +1.4 | +2.8 |
| 1972 | 427.6 | 207.3 | 634.9 | +11.6 | +16.3 | +13.0 | 425.2 | 208.9 | +2.5 | +2.9 |
| 1973 | 429.8 | 206.4 | 636.2 | +0.5 | -0.4 | +0.2 | 426.7 | 207.9 | +1.0 | +0.1 |
| 1974 | 560.9 | 213.1 | 774.0 | +30.5 | +3.2 | +21.7 | 556.2 | 214.5 | +11.4 | +2.1 |
More detailed information on stocks is given in the next table showing by industry groups comparative stock figures at the end of March.
| Industry Group | Stocks at 31 March | Percentage Change in Stocks 31 March 1973 to 31 March 1974 | |||||||
|---|---|---|---|---|---|---|---|---|---|
| 1973 | 1974 | ||||||||
| Materials Finished Goods | Total | Materials Finished Goods | Total | Materials Finished Goods | Total | Total | Materials Finished Goods | Total | |
| $(million) | percent | ||||||||
| Primary Produce Processing Industries— | |||||||||
| Meat freezing, ham, bacon and casings | 11.79 | 140.25 | 152.04 | 13.05 | 163.42 | 176.47 | +10.7 | +16.5 | +16.1 |
| Dairy | 3.28 | 34.78 | 38.06 | 3.10 | 51.64 | 54.74 | -5.5 | +48.5 | +43.8 |
| Totals | 15.07 | 175.04 | 190.11 | 16.16 | 215.06 | 231.21 | +7.2 | +22.9 | +21.6 |
| Other food | 39.04 | 38.15 | 77.19 | 38.74 | 38.64 | 77.38 | -0.8 | +1.3 | +0.2 |
| Beverages | 9.52 | 8.78 | 18.30 | 12.14 | 9.32 | 21.46 | +27.5 | +6.2 | +17.3 |
| Tobacco manufactures | 17.55 | - | 17.55 | 18.50 | - | 18.50 | +5.4 | - | +5.4 |
| Textiles | 34.13 | 14.50 | 48.62 | 43.13 | 12.68 | 55.81 | +26.4 | -12.6 | +14.8 |
| Clothing | 21.16 | 10.48 | 31.64 | 34.52 | 11.41 | 45.93 | +63.1 | +8.9 | +45.2 |
| Footwear | 5.95 | 2.08 | 8.03 | 8.98 | 1.94 | 10.92 | +50.9 | -6.7 | +36.0 |
| Wood manufactures | 14.08 | 12.92 | 27.00 | 18.32 | 13.88 | 32.21 | +30.1 | +7.4 | +19.3 |
| Furniture and fixtures | 8.84 | 1.35 | 10.19 | 10.82 | 0.96 | 11.77 | +22.4 | -28.9 | +15.5 |
| Paper and products | 26.14 | 15.39 | 41.53 | 29.61 | 18.85 | 48.46 | +13.3 | +22.5 | +16.7 |
| Printing, publishing | 16.45 | 3.62 | 20.07 | 17.51 | 4.10 | 21.61 | +6.4 | +13.3 | +7.7 |
| Leather and products | 8.40 | 2.54 | 10.94 | 9.82 | 3.46 | 13.28 | +16.9 | +36.2 | +21.4 |
| Rubber products | 6.84 | 7.29 | 14.13 | 10.68 | 8.26 | 18.94 | +56.1 | +13.3 | +34.0 |
| Chemicals and products | 30.10 | 21.87 | 51.97 | 41.26 | 22.47 | 63.73 | +37.1 | +2.7 | +22.6 |
| Petroleum, coal products | 3.48 | 2.11 | 5.60 | 3.53 | 2.34 | 5.87 | +1.4 | +10.9 | +4.8 |
| Non-metallic mineral products | 9.87 | 13.95 | 23.82 | 12.24 | 12.62 | 24.86 | +24.0 | -9.5 | +4.4 |
| Basic metal products | 18.26 | 3.79 | 22.06 | 19.20 | 3.93 | 23.13 | +5.1 | +3.7 | +4.9 |
| Metal products | 36.99 | 15.01 | 52.00 | 49.94 | 13.06 | 63.00 | +35.0 | -13.0 | +21.2 |
| Machinery | 35.75 | 8.38 | 44.14 | 48.56 | 9.68 | 58.24 | +35.8 | +15.5 | +31.9 |
| Electrical products | 29.51 | 10.03 | 39.54 | 43.98 | 8.23 | 52.22 | +49.0 | -17.9 | +32.1 |
| Transport equipment | 42.62 | 3.30 | 45.92 | 60.28 | 5.11 | 65.39 | +41.4 | +54.8 | +42.4 |
| Miscellaneous | 15.09 | 10.82 | 25.91 | 29.19 | 12.15 | 41.35 | +93.4 | +12.3 | +59.6 |
| Totals | 429.77 | 206.38 | 636.15 | 560.94 | 213.10 | 774.04 | +30.5 | +3.3 | +21.7 |
| Grand totals, all manufacturing industries | 444.85 | 381.41 | 826.26 | 577.10 | 428.16 | 1,005.26 | +29.7 | +12.3 | +21.7 |
VALUE AND VOLUME INDICES—The next table gives index numbers of added value, value of production, and volume of production.
| Production Year | Added Value | Value of Production | Volume of Production |
|---|---|---|---|
| Base: 1956-57 (=1000) | |||
| 1956-57 | 1,000 | 1,000 | 1,000 |
| 1957-58 | 1,096 | 1,071 | 1,070 |
| 1958-59 | 1,164 | 1,092 | 1,131 |
| 1959-60 | 1,292 | 1,168 | 1,175 |
| 1960-61 | 1,392 | 1,252 | 1,290 |
| 1961-62 | 1,544 | 1,330 | 1,359 |
| 1962-63 | 1,639 | 1,386 | 1,420 |
| 1963-64 | 1,858 | 1,590 | 1,574 |
| 1964-65 | 2,045 | 1,807 | 1,776 |
| 1965-66 | 2,335 | 1,962 | 1,901 |
| 1966-67 | 2,469 | 2,044 | 2,006 |
| 1967-68 | 2,535 | 2,088 | 1,980 |
| 1968-69 | 2,734 | 2,297 | 2,041 |
| 1969-70 | 3,119, | 2,600 | 2,292 |
| 1970-71 | 3,610, | 2,958 | 2,410 |
| 1971-72 | 4,110, | 3,363, | 2,513 |
| 2972-73 | 4,726, | 4,000, | 2,669 |
The table which follows sets out, by industry groups, index numbers of value of production, net output, and volume of production. It is not possible to arrive at volume of production index numbers for all the groups, for technical reasons, and consequently some have been omitted, but the total index number for the year is calculated in such a way as to include the groups which cannot be assessed separately. The index is based on 1956-57 (=1000).
| Industry Group | Value of Production | Net Output (Net Value Added) | Volume of Production | |||
|---|---|---|---|---|---|---|
| 1971-72 | 1972-73 | 1971-72 | 1972-73 | 1971-72 | 1972-73 | |
| (*)Indices not available for the groups, but allowed for in compiling total index. | ||||||
| Food | 2,612 | 3,151, | 3,975, | 4,867, | 1,835 | 1,902 |
| Beverages | 3,684, | 4,253, | 4,414, | 4,501, | 2,005 | 2,045 |
| Tobacco manufactures | 2,346 | 2,600 | 2,968 | 3,488, | 1,988 | 2,112 |
| Textiles | 4,215, | 6,213, | 5,331, | 5,804, | 4,233, | 4,609, |
| Footwear, other wearing apparel, and made-up textile goods | 2,355 | 2,586 | 2,603 | 2,826 | 1,614 | 1,698 |
| Wood and cork products (except furniture) | 2,718 | 3,079, | 2,764 | 3,241, | 1,569 | 1,649 |
| Furniture and fixtures | 2,815 | 3,388, | 2,796 | 3,393, | (*) | (*) |
| Paper and paper products | 4,360, | 4,776, | 5,565, | 5,555, | 3,616, | 3,735, |
| Printing, publishing, etc. | 3,405, | 3,811, | 3,614, | 4,045, | 2,365 | 2,479 |
| Leather and leather products (except foot-wear and apparel) | 3,126, | 4,155, | 4,026, | 4,450, | 1,738 | 1,963 |
| Rubber products | 2,504 | 2,628 | 3,118, | 3,247, | 2,686 | 2,656 |
| Chemicals and chemical products | 3,386, | 3,912, | 3,748, | 4,456, | 2,503 | 2,747 |
| Petroleum and coal products | 18,796 | 20,783 | 11,186 | 13,568 | (*) | (*) |
| Non-metallic mineral products, n.e.i. | 3,007, | 3,493, | 3,338, | 3,899, | 2,087 | 2,276 |
| Basic metal manufactures | 14,240 | 21,336 | 11,269 | 16,968 | (*) | (*) |
| Metal products (except machinery and transport equipment) | 5,760, | 6,709, | 5,852, | 6,653, | (*) | (*) |
| Machinery (except electrical) | 3,847, | 4,279, | 4,358, | 4,904, | (*) | (*) |
| Electrical machinery and appliances | 5,759, | 6,427, | 6,006, | 6,583, | 4,236, | 4,599, |
| Transport equipment | 3,742, | 4,377, | 3,639, | 4,303, | (*) | (*) |
| Miscellaneous products | 10,309 | 11,703 | 10,591 | 12,045 | 3,350, | 3,610, |
| All Groups | 3,363, | 4,000, | 4,072, | 4,688, | 2,513 | 2,669 |
OVERTIME—Details of overtime worked in factories by wage-earning employees are summarised in the tables given, which show, by industry groups, the hours worked during the latest 3 years.
| Industry Group | Total Overtime Hours Worked by Wage Earners (Both Male and Female) | ||
|---|---|---|---|
| 1970-71 | 1971-72 | 1972-73 | |
| (000) | |||
| Food | 9,890 | 9,297 | 10,793 |
| Beverages | 688 | 706 | 826 |
| Tobacco manufactures | 309 | 290 | 268 |
| Textiles | 2,864 | 2,705 | 2,447 |
| Footwear, other wearing apparel, and made-up textile goods | 1,085 | 998 | 1,062 |
| Wood and cork products (except furniture) | 1,979 | 2,267 | 2,460 |
| Furniture and fixtures | 675 | 866 | 815 |
| Paper and paper products | 2,076 | 2,022 | 1,162 |
| Printing, publishing, etc. | 2,156 | 1,591 | 1,534 |
| Leather and leather products (except footwear and apparel) | 249 | 253 | 233 |
| Rubber products | 733 | 581 | 627 |
| Chemicals and chemical products | 1,098 | 1,048 | 1,092 |
| Petroleum and coal products | 96 | 92 | 96 |
| Non-metallic mineral products, n.e.i. | 1,892 | 1,781 | 2,041 |
| Basic metal manufactures | 747 | 847 | 934 |
| Metal products (except machinery and transport equipment) | 3,237 | 3,393 | 3,713 |
| Machinery (except electrical) | 3,110 | 2,889 | 3,610 |
| Electrical machinery and appliances | 1,366 | 1,223 | 1,360 |
| Transport equipment | 2,362x | 2,557 | 3,296 |
| Miscellaneous products | 1,432 | 2,140 | 1,998 |
| Totals | 38,043x | 37,547 | 40,365 |
The next table shows, by industry groups, the hours of overtime worked during 1972-73 by males and females separately. The averages given are calculated on the basis of the total number of wage earners engaged irrespective of the number who actually worked overtime.
| Industry Group | Total Overtime Hours Worked by Wage Earners | Average Overtime Hours Worked by All Wage Earners | ||
|---|---|---|---|---|
| Males | Females | Males | Females | |
| (000) | (000) | |||
| Food | 10,007 | 786 | 300 | 139 |
| Beverages | 795 | 30 | 382 | 71 |
| Tobacco manufactures | 157 | 111 | 370 | 197 |
| Textiles | 2,069 | 378 | 281 | 63 |
| Footwear, other wearing apparel, and made up textile goods | 377 | 684 | 100 | 32 |
| Wood and cork products (except furniture) | 2,434 | 26 | 204 | 102 |
| Furniture and fixtures | 779 | 36 | 180 | 46 |
| Paper and paper products | 952 | 209 | 153 | 102 |
| Printing, publishing, etc. | 1,338 | 195 | 144 | 69 |
| Leather and leather products (except footwear and apparel) | 191 | 42 | 164 | 43 |
| Rubber products | 585 | 42 | 224 | 70 |
| Chemicals and chemical products | 1,008 | 85 | 290 | 51 |
| Petroleum and coal products | 93 | 3 | 236 | 78 |
| Non-metallic mineral products, n.e.i. | 1,972 | 69 | 320 | 125 |
| Basic metal manufactures | 927 | 7 | 303 | 60 |
| Metal products (except machinery and transport equipment) | 3,466 | 247 | 255 | 136 |
| Machinery (except electrical) | 3,500 | 110 | 273 | 201 |
| Electrical machinery and appliances | 1,102 | 258 | 199 | 47 |
| Transport equipment | 2,986 | 309 | 299 | 305 |
| Miscellaneous products | 1,796 | 202 | 347 | 66 |
| All groups | 336,535 | 3,830 | 256 | 73 |
SUMMARY OF OPERATIONS—The following table, by assembling data from previous pages, affords an analysis of production costs in 1972-73, together with the value of production for each industry group and for all industries. In addition, by virtue of the complete details collected annually of the cost structure of goods produced in manufacturing industries, it is possible to give information on the surplus available to manufacturers prior to payment of dividends, taxation, and other appropriations. The only exception occurs in the case of co-operative dairy companies, which do not purchase milk and cream in the way that other manufacturers purchase raw materials. They collect the milk and cream from their shareholders, process it, and pay out to these shareholders the whole of the profits of the sales of the products, less amounts paid to reserves. Manufacturing surplus shown by these companies is therefore confined to the amount of these transfers to reserves and any undistributed profits.
In quite a number of cases, articles produced are transferred at cost to separate selling departments and warehouses, or to retail stores run by the same company or establishment. Where this is apparent, the company concerned is asked to substitute a commercial value for its production. The same procedure holds where a company controls more than one factory, and transfers the products of one to the other for further processing. It must be recognised that estimated values have to be accepted in many transactions of this type.
| Industry Group | Production Costs | Value of Production | Manufacturing Surplus | |||
|---|---|---|---|---|---|---|
| Salaries and Wages | Cost of All Materials Used | Other Expenses of Operation | Total | |||
| $(000) | ||||||
| Food | 196,120 | 1,086,164 | 118,271 | 1,400,555 | 1,488,018 | 87,463 |
| Beverages | 13,386 | 43,976 | 16,009 | 73,371 | 88,170 | 14,799 |
| Tobacco manufactures | 4,091 | 20,105 | 2,931 | 27,126 | 31,580 | 4,454 |
| Textiles | 50,529 | 274,167 | 32,301 | 356,997 | 375,741 | 18,745 |
| Footwear, other wearing apparel, and made-up textile goods | 64,015 | 104,290 | 19,634 | 187,939 | 204,148 | 16,210 |
| Wood and cork products (except furniture) | 54,790 | 112,974 | 34,322 | 202,087 | 224,769 | 22,682 |
| Furniture and fixtures | 20,887 | 35,016 | 7,174 | 63,077 | 70,283 | 7,205 |
| Paper and paper products | 40,810 | 102,191 | 52,706 | 195,707 | 213,229 | 17,522 |
| Printing, publishing, etc. | 60,112 | 47,763 | 30,094 | 137,968 | 159,096 | 21,128 |
| Leather and leather products (except footwear and apparel) | 7,568 | 20,097 | 3,547 | 31,213 | 33,989 | 2,776 |
| Rubber products | 16,973 | 22,720 | 9,761 | 49,455 | 55,535 | 6,080 |
| Chemicals and chemical products | 27,199 | 127,971 | 24,986 | 180,156 | 211,436 | 31,280 |
| Petroleum and coal products | 3,026 | 81,591 | 5,163 | 89,780 | 100,297 | 10,517 |
| Non-metallic mineral products, n.e.i. | 32,751 | 41,397 | 32,834 | 106,983 | 129,450 | 22,467 |
| Basic metal manufactures | 19,959 | 84,764 | 36,028 | 140,751 | 144,233 | 3,482 |
| Metal products (except machinery and transport equipment) | 73,589 | 135,778 | 39,525 | 248,892 | 280,275 | 31,383 |
| Machinery (except electrical) | 65,863 | 108,234 | 29,841 | 203,937 | 223,375 | 19,437 |
| Electrical machinery and appliances | 34,626 | 74,690 | 17,725 | 127,041 | 137,453 | 10,412 |
| Transport equipment | 53,931 | 199,903 | 23,387 | 277,220 | 297,965 | 20,745 |
| Miscellaneous products | 35,023 | 60,728 | 24,276 | 120,027 | 138,709 | 18,683 |
| Totals | 875,247 | 2,784,519 | 560,517 | 4,220,283 | 4,607,751 | 387,469 |
LIST OF CERTAIN COMMODITIES PRODUCED IN RECENT YEARS—The following is a list of certain commodities produced in New Zealand during the latest 4 years.
| Commodity | 1969-70 | 1970-71 | 1971-72 | 1972-73 | |
|---|---|---|---|---|---|
| *Includes mattress bases. | |||||
| Toasters | No. | 77,283 | 94,787 | 70,555 | 80,118 |
| Irons | No. | 64,902 | 81,824 | 98,693 | 52,817 |
| Radiators, electric | No | 222,679 | 293,838 | 230,288 | 235,146 |
| Washing machines (clothes) | No. | 47,374 | 55,491 | 62,543 | 103,729 |
| Refrigerators (home, commercial, and freezers) | No. | 106,818 | 117,076 | 120,912 | 149,778 |
| Electric ranges | No. | 55,709 | 55,195 | 60,449 | 54,777 |
| Electric rangettes | No. | 2,688 | 3,034 | ||
| Radios, including radiograms, etc. | No. | 112,039 | 117,443 | 140,461 | 128,392 |
| Television sets | No. | 44,956 | 48,893 | 38,852 | 33,739 |
| Blankets, woollen | Pairs | 205,000 | 253,000 | 269,000 | 288,000 |
| Floor coverings (textile top coverings) | sq m(000) | 6,474 | 7,198 | 8,039 | 8,644 |
| Mattresses— | |||||
| Innerspring— | |||||
| Single | No. | 96,920 | *218,853 | 139,348 | *285,038 |
| Double | No. | 40,132 | |||
| Soft filled— | |||||
| Single | No. | 35,274 | 45,998 | 46,574 | 49,954 |
| Double | No. | 9,813 | 7,229 | 6,301 | |
| Infants | No. | 13.152 | 14,113 | 11,712 | |
| Commodity | 1969-70 | 1970-71 | 1971-72 | 1972-73 | |
|---|---|---|---|---|---|
| Venetian blinds | No. | 62,591 | 60,348 | 55,061 | 57,641 |
| Roller (Holland) blinds | No. | 174,937 | 255,840 | 219,074 | 266,033 |
| Newspapers produced— | |||||
| Dailies | thousand | 332,945 | 341,855 | 341,417 | 343,993 |
| Other than dailies | thousand | 57,893 | 77,807 | 78,584 | 84,913 |
| Hot-water bottles | No. | 277,000 | 326,615 | 269,000 | .. |
| Soap— | |||||
| Toilet | tonnes | 4,958 | 21,331 | 20,508 | 19,856 |
| Bar | tonnes | 3,731 | |||
| Powder and flake | tonnes | 13.021 | |||
| Household and industrial cleaners— | |||||
| Synthetic detergents— | |||||
| Powders and pastes | tonnes | 5,109 | 7,876 | 7,252 | 3,623 |
| Liquid | litres(000) | 12,702 | 15,256 | 16,043 | 15,952 |
| Other cleaners, etc.— | |||||
| Powders and pastes | tonnes | 1,641 | 1,643 | 2,572 | 8,292 |
| Liquid | litres(000) | 2,550 | 2,059 | 2,618 | 4,078 |
| Paints and enamels | litres(000) | 17,111 | 16,961 | 17,561 | 19,170 |
| Lacquers | litres(000) | 1,722 | 1,850 | 1,877 | 2,091 |
| Dentifrices | tonnes | 1,128 | 1,155 | 1,191 | 1,100 |
| Furniture and floor polish | tonnes | 1,234 | 1,151 | 1,047 | 1,237 |
| Shoe polishes and cleaners | tonnes | 273 | 266 | 194 | |
| Water heaters | |||||
| — Under 10 gallons | No. | 10,495 | 9,937 | 4,333 | 9,484 |
| 10 gallons and over | No. | 37,439 | 37,107 | 40,661 | 54,297 |
| Sinks: stainless steel | No. | 31,204 | 49,129 | 48,950 | 53,997 |
| Sink tops: stainless steel | No. | 18,427 | 26,898 | 27,688 | 30,877 |
| Wheelbarrows | No. | 24,738 | 34,768 | 31,329 | 27,772 |
| Lawnmowers (mostly motor) | No. | 78,217 | 60,948 | 59,366 | 74,799 |
| Prams, pushchairs, strollers— | |||||
| Cane (inc. dolls) | No. | 1,313 | 2,133 | 1,419 | 1,032 |
| Other than cane (inc. dolls) | No. | 30,285 | 36,416 | 40,552 | 37,236 |
DETAILS OF CERTAIN PRINCIPAL INDUSTRIES—The principal statistics regarding leading factory industries for the last 3 years available are set out in the following pages. Fuller details are given in the annual Statistics of Industrial Production.
| Item | 1970-71 | 1971-72 | 1972-73 | |
|---|---|---|---|---|
*In addition 1,501,000 bundles were produced in the sausage casings industry in 1970-71, 1,456,000 bundles in 1971-72, and 1,536,000 bundles in 1972-73. † Includes products of establishments classified in other industries. *Includes products of establishments classified in other industries. *Includes chocolate sold for further manufacturing purposes. † Includes products of establishments classified in other industries. *Includes two factories responsible for drying and shredding of green tobacco leaf. *Includes production by establishments classified in other industries. *Other principal products withheld to avoid disclosure of figures for individual establishments. *Combined in order to prevent disclosure of confidential information. *Principal products shown for this industry include the production of establishments classified in other industries. †Effective running footage. *Includes production of establishments in other industries. *Principal products shown for these industries include the production of establishments classified in other industries. †Combined in order to prevent disclosure of confidential information. *Includes production of establishments classified in other industries. | ||||
| Meat Freezing and Preserving | ||||
| Number of establishments | 43 | 46 | 48 | |
| Persons engaged | No. | 25,283 | 24,975 | 27,817 |
| Production costs— | ||||
| Salaries, wages | $(000) | 81,597 | 104,160 | 133,332 |
| Materials | $(000) | 365,821 | 360,029 | 594,151 |
| Other expenses | $(000) | 36,916 | 43,546 | 57,740 |
| Totals | $(000) | 484,334 | 507.736 | 785,224 |
| Value of production | $(000) | 502,094 | 519,156 | 844,675 |
| Net output (net value added) | $(000) | 100,973 | 118,122 | 195,797 |
| Overtime worked by wage earners | h(000) | 7,001 | 7,026 | 6,974 |
| Volume index. Base: 1956-57 (=1000) | 1,671 | 1,646 | 1,746 | |
| Principal products— | ||||
| Meat— | ||||
| Lamb carcasses | No.(000) | 25,061 | 24,954 | 24,270 |
| tonnes(000) | 324 | 337 | 309 | |
| Mutton carcasses | No.(000) | 6,557 | 6,441 | 7,470 |
| tonnes(000) | 132 | 118 | 141 | |
| Boned mutton | tonnes(000) | 8 | 7 | 13 |
| Mutton and lamb pieces | tonnes(000) | 16 | 29 | 28 |
| Beef quarters, bone in | tonnes(000) | 34 | 34 | 40 |
| Beef cuts | tonnes(000) | 61 | 68 | 69 |
| Boneless beef | tonnes(000) | 99 | 99 | 118 |
| Bobby veal | tonnes(000) | 8 | 7 | 8 |
| Other veal | tonnes(000) | 2 | 2 | .. |
| Pork | tonnes(000) | 16 | 14 | 12 |
| Edible offals | tonnes(000) | 51 | 51 | 52 |
| By-products— | ||||
| Runners (not processed) | No.(000) | 5,250 | 5,196 | .. |
| Casings* | bundles(000) | 6,629 | 6,299 | 6,779 |
| Woolly sheepskins | No.(000) | 354 | 552 | 833 |
| Pelts | No.(000) | 34,216 | 34,219 | 34,736 |
| Cow hides | No.(000) | 900 | 854 | 609 |
| Ox and bull hides | No.(000) | 633 | 651 | 1,100 |
| Bobby calf hides | No.(000) | 1,235 | 1,075 | 955 |
| Other calf hides | No.(000) | 53 | 46 | 33 |
| Wool | kg(000) | 37,753 | 36,741 | 36,274 |
| Boiling-down products— | ||||
| Tallow | tonnes(000) | 97 | 81 | 85 |
| Neatsfoot oil† | litres(000) | 668 | 570 | 614 |
| Manures and stock meals†— | ||||
| Meatmeal | tonnes(000) | 24 | 11 | 22 |
| Meat and bone meal | tonnes(000) | 57 | 58 | 72 |
| Other meals | tonnes(000) | 8 | 2 | 12 |
| Bonedust | tonnes(000) | 3 | 8 | 11 |
| Blood manure | tonnes(000) | 5 | ||
| Blood and bone | tonnes(000) | 18 | 17 | 14 |
| Other manure | tonnes(000) | - | ||
| Ham and Bacon Curing | ||||
| Number of establishments | 35 | 40 | 41 | |
| Persons engaged | No. | 1,273 | 1,319 | 1,370 |
| Production costs— | ||||
| Salaries, wages | $(000) | 3,503 | 4,261 | 4,901 |
| Materials | $(000) | 17,379 | 18,375 | 22,388 |
| Other expenses | $(000) | 2,023 | 2,513 | 2,761 |
| Totals $(00) | 22,905 | 25,149 | 30,050 | |
| Value of production | $(000) | 25,507 | 27,921 | 33,066 |
| Net output (net value added) | $(000) | 6,155 | 7,100 | 7,992 |
| Overtime worked by wage earners | h(000) | 285 | 307 | 315 |
| Volume index. Base: 1956-57 (=1000) | 988 | 1,023 | 1,063 | |
| Pigs dealt with— | ||||
| Carcasses | No.(000) | 287 | 273 | 245 |
| Cost | $(000) | 10,366 | 10,851 | 12,675 |
| Principal products— | ||||
| Ham and bacon | tonnes | 12,518 | 12,315 | 11,534 |
| Pork | tonnes | 202 | 274 | 220 |
| Smallgoods | tonnes | 15,996 | 18,469 | 20,826 |
| Lard (edible) | tonnes | 300 | 313 | 183 |
| Lard (inedible) | tonnes | |||
| Butter, Cheese, and Other Milk Products | ||||
| Number of establishments— | ||||
| Butter and cheese | 141 | 161 | 153 | |
| Other milk products | 64 | 8 | 8 | |
| Persons engaged | No. | 4,675 | 4,606 | 4,728 |
| Production costs— | ||||
| Salaries, wages | $(000) | 14,982 | 17,667 | 20,346 |
| Materials | $(000) | 226,664 | 348,758 | 297,616 |
| Other expenses | $(000) | 21,171 | 26,525 | 26,913 |
| Totals | $(000) | 21,171 | 26,525 | 26,913 |
| Totals | $(000) | 262,817 | 392,950 | 344,876 |
| Value of production | $(000) | 263,360 | 393,807 | 345,727 |
| Net output (net value added) | $(000) | 16,378 | 19,343 | 21,780 |
| Overtime worked by wage earners | h(000) | 565 | 544 | 1,420 |
| Volume index. Base: 1956-57 (=1000) | 1,318 | 1,403 | 1,367 | |
| Milkfat used— | ||||
| For creamery butter | kg(000) | 190,209 | 202,116 | 191,316 |
| For cheesemaking | kg(000) | 42,454 | 42,458 | 40,843 |
| For whey buttermaking— | ||||
| Recoveries from own whey | kg(000) | 1,386 | 784 | 891 |
| Whey fat purchased | kg(000) | 1,778 | 1,883 | 1,571 |
| Second grade creamery milkfat | kg(000) | 88 | 61 | 151 |
| Total for whey butter | kg(000) | 3,253 | 2,728 | 2,612 |
| Principal products— | ||||
| Creamery butter | tonnes | 230,989 | 244,369 | 234,148 |
| Whey butter | tonnes | 3,290 | 3,107 | 3,046 |
| Cheese | tonnes | 106,434 | 105,618 | 101,350 |
| Condensed and evaporated milk, and | ||||
| whole and blended milk powder | tonnes | 27,771 | 40,107 | 43,779 |
| Skim-milk powder | tonnes | 135,748 | 203,465 | 188,826 |
| Buttermilk powder | tonnes | 21,130 | 24,546 | 22,490 |
| Casein | tonnes | 54,954 | 39,792 | 44,425 |
| Ice Cream | ||||
| Number of establishments | 18 | 18 | 19 | |
| Persons engaged | No. | 530 | 574 | 519 |
| Production costs— | ||||
| Salaries, wages | $(000) | 1,402 | 1,643 | 1,699 |
| Materials | $(000) | 6,098 | 6,712 | 7,975 |
| Other expenses | $(000) | 1,800 | 1,929 | 1,971 |
| Totals | $(000) | 9,300 | 10,285 | 11,645 |
| Value of production | $(000) | 10,480 | 12,430 | 13,591 |
| Net output (net value added) | $(000) | 2,601 | 3,936 | 3,759 |
| Overtime worked by wage earners | h(000) | 84 | 106 | 105 |
| Volume index Base: 1956-57 (= 1000) | 2,473 | 2,518 | 2,679 | |
| Main materials used— | ||||
| Ice-cream mixture | tonnes} | 2,499 | 2,704 | 3,152 |
| Butter | tonnes | |||
| Skim-milk powder | tonnes | 1,672 | 1,302 | 1,406 |
| Sugar | tonnes | 5,120 | 5,127 | 5,423 |
| Principal products— | ||||
| Bulk ice cream | litres(000) | 14,152 | 14,870 | 15,449 |
| Ice cream, cartoned, wrapped, chocolate-coated, etc. | litres(000) | 27,760 | 28,621 | 35,020 |
| Frozen confections, ice lollies, etc. | litres(000) | 7,188 | 7,290 | 2,883 |
| Grain Milling | ||||
| Number of establishments | 35 | 35 | 33 | |
| Persons engaged | No. | 875 | 872 | 857 |
| Production costs— | ||||
| Salaries, wages | $(000) | 2,410 | 2,623 | 2,843 |
| Materials | $(000) | 23,393 | 23,657 | 24,238 |
| Other expenses | $(000) | 2,327 | 2,595 | 2,734 |
| Totals | $(000) | 28,131 | 28,875 | 29,814 |
| Value of production | $(000) | 30,565 | 31,447 | 32,978 |
| Net output (net value added) | $(000) | 4,996 | 5,404 | 6,232 |
| Overtime worked by wage earners | h(000) | 124 | 123 | 129 |
| Volume index. Base: 1956-57 (= 1000) | 1,536 | 1,521 | 1,556 | |
| Main materials used— | ||||
| Wheat | tonnes(000) | 278 | 275 | 283 |
| Oats | tonnes(000) | 13 | 10 | |
| Principal products— | ||||
| Flour | tonnes(000) | 200 | 191 | 209 |
| Wholemeal, wheatmeal* | tonnes(000) | 6 | 5 | 5 |
| Bran and pollard | tonnes(000) | 56 | 57 | 59 |
| Breakfast cereals— | ||||
| Oatmeal, rolled oats | tonnes(000) | 5 | 5 | 4 |
| Other (including cereals in biscuit, flake | ||||
| and puff form)* | tonnes(000) | 11 | 11 | 5 |
| Biscuits | ||||
| Number of establishments | 8 | 7 | 8 | |
| Persons engaged | No. | 1,363 | 1,349 | 1,375 |
| Production costs— | ||||
| Salaries, wages | $(000) | 2,990 | 3,472 | 3,899 |
| Materials | $(000) | 8,599 | 9,420 | 10,103 |
| Other expenses | $(000) | 2,107 | 2,392 | 2,552 |
| Totals | $(000) | 13,696 | 15,283 | 16,554 |
| Value of production | $(000) | 15,328 | 17,010 | 19,092 |
| Net output (net value added) | $(000) | 4,750 | 5,287 | 6,540 |
| Overtime worked by wage earners | h(000) | 297 | 319 | 344 |
| Volume index. Base: 1956-57 (= 1000) | 1,500 | 1,566 | 1,689 | |
| Main materials used— | ||||
| Flour | tonnes | 13,522 | 14,518 | |
| Sugar | tonnes | 5,288 | 5,788 | 6,376 |
| Chocolate | tonnes | 1,418 | 1,335 | 1,344 |
| Margarine, lard, confectionery fat | tonnes | 3,667 | 3,944 | 4,109 |
| Biscuits manufactured | tonnes | 23,666 | 24,808 | 25,352 |
| Cocoa, Chocolate, and Sugar Confectionery | ||||
| Number of establishments | 44 | 46 | 43 | |
| Persons engaged | No. | 2,330 | 2,347 | 2,287 |
| Production costs— | ||||
| Salaries, wages | $(000) | 5,008 | 6,000 | 6,418 |
| Materials | $(000) | 14,186 | 16,023 | 16,347 |
| Other expenses | $(000) | 3,048 | 3,121 | 3,608 |
| Totals | $(000) | 22,242 | 25,144 | 26,374 |
| Value of production | $(000) | 24,383 | 28,646 | 30,100 |
| Net output (net value added) | $(000) | 7,284 | 9,596 | 10,374 |
| Overtime worked by wage earners | h(000) | 382 | 380 | 335 |
| Volume index. Base: 1956-57 (= 1000) | 1,661 | 1,852 | 1,913 | |
| Main materials used— | ||||
| Sugar | tonnes | 13,540 | 14,066 | 14,525 |
| Cocoa butter | tonnes | 627 | 532 | 658 |
| Glucose | tonnes | 4,405 | 4,508 | 4,721 |
| Nuts | tonnes | 2,102 | 2,391 | 3,115 |
| Confectionery manufactured— | ||||
| Chocolate and chocolate-coated* | tonnes | 11,263 | 12,024 | 12,433 |
| Sugar | tonnes | 9,293 | 10,604 | 11,824 |
| Potato crisps and sticks† | tonnes | 1,463 | 2,097 | 1,992 |
| Fruit and Vegetable Preserving | ||||
| Number of establishments | 27 | 24 | 27 | |
| Persons engaged | No. | 2,903 | 2,934 | 3,327 |
| Production costs— | ||||
| Salaries, wages | $(000) | 7,458 | 8,515 | 10,424 |
| Materials | $(000) | 22,450 | 23,379 | 28,936 |
| Other expenses | $(000) | 8,069 | 8,159 | 7,829 |
| Totals | $(000) | 37,978 | 40,054 | 47,189 |
| Value of production | $(000) | 39,258 | 41,246 | 49,845 |
| Net output (net value added) | $(000) | 9,815 | 10,918 | 14,299 |
| Overtime worked by wage earners | h(000) | 688 | 810 | 684 |
| Volume index. Base: 1956-57 (= 1000) | 3,547, | 3,530, | 3,912, | |
| Main materials used— | ||||
| Fruit (fresh) | tonnes | 45,318 | 31,846 | 43,298 |
| Vegetables and tomatoes | tonnes | 85,412 | 91,676 | 117,081 |
| Sugar | tonnes | 8,912 | 7,783 | 9,036 |
| Principal products— | ||||
| Fruit (canned, bottled) | tonnes | 23,537 | 17,011 | 22,409 |
| Vegetables (canned) | tonnes | 19,888 | 17,163 | 18,615 |
| Vegetables (dehydrated, freeze dry, quick | ||||
| frozen) | tonnes | 31,871 | 36,690 | 39,433 |
| Pickles and sauces† | litres(000) | 5,886 | 5,635 | 6,743 |
| Jams, jellies, and conserves | tonnes | 4,471 | 4,282 | 4,150 |
| Brewing of Ale and Stout, and Malting | ||||
| Number of establishments | 15 | 15 | 14 | |
| Persons engaged | No. | 1,483 | 1,551 | 1,551 |
| Production costs— | ||||
| Salaries, wages | $(000) | 5,839 | 6,877 | 7,729 |
| Materials | $(000) | 18,275 | 20,868 | 25,824 |
| Other expenses | $(000) | 6,744 | 8,395 | 10,046 |
| Totals | $(000) | 30,858 | 36,141 | 43,598 |
| Value of production | $(000) | 43,848 | 47,903 | 55,646 |
| Net output (net value added) | $(000) | 19,220 | 19,110 | 20,333 |
| Overtime worked by wage earners | h(000) | 567 | 578 | 638 |
| Volume index. Base: 1956-57 (= 1000) | 1,557 | 1,624 | 1,721 | |
| Main materials used— | ||||
| Malt | tonnes | 40,188 | 41,458 | 43,401 |
| Hops | tonnes | 372 | 365 | 358 |
| Sugar | tonnes | 11,198 | 11,371 | 12,108 |
| Beer produced for sale | litres(000) | 336,881 | 346,991} | 354,484 |
| Stout produced for sale | litres(000) | 1,677 | 1,818 | |
| Wine Making (Wineries with annual production of 5,000 gallons or more) | ||||
| Number of establishments | 61 | 69 | 69 | |
| Persons engaged | No. | 455 | 496 | 567 |
| Production costs— | ||||
| Salaries, wages | $(000) | 1,232 | 1,447 | 1,832 |
| Materials | $(000) | 5,754 | 6,688 | 9,341 |
| Other expenses | $(000) | 1,447 | 2,041 | 2,685 |
| Totals | $(000) | 8,433 | 10,176 | 13,858 |
| Value of production | $(000) | 9,930 | 11,592 | 14,483 |
| Net output (net value added) | $(000) | 3,028 | 3,310 | 3,028 |
| Overtime worked by wage earners | h(000) | 36 | 56 | 72 |
| Main materials used— | ||||
| Fresh grapes | tonnes | 17,702 | 20,378 | 28,974 |
| Sugar | tonnes | 9,593 | 10,248 | 11,172 |
| Fortifying spirits | litres(000) | 959 | 977 | 1,327 |
| Sales— | ||||
| Table wines | litres(000) | 5,519 | 7,660 | 10,451 |
| Dessert wines | litres(000) | 12,474 | 12,656 | 12,519 |
| Spirits (Distilling, Rectifying and Blending) | ||||
| Number of establishments | 4 | 5 | 5 | |
| Persons engaged | No. | 118 | 143 | 146 |
| Production costs— | ||||
| Salaries, wages | $(000) | 351 | 515 | 544 |
| Materials | $(000) | 1,208 | 1,574 | 1,719 |
| Other expenses | $(000) | 445 | 557 | 626 |
| Totals | $(000) | 2,005 | 2,645 | 2,889 |
| Value of production | $(000) | 2,418 | 3,118 | 3,330 |
| Net output (net value added) | $(000) | 783 | 1,007 | 1,039 |
| Overtime worked by wage earners | $(000) | 10 | 8 | 9 |
| Products— | ||||
| Gin | litres(000) | 2,504 | 2.837 | 2,964 |
| Vodka | litres(000) | 609 | 695 | 832 |
| Geneva | litres(000) | 77 | 95 | 105 |
| Aerated Waters and Cordials | ||||
| Number of establishments | 49 | 48 | 48 | |
| Persons engaged | No. | 936 | 962 | 1,042 |
| Production costs— | ||||
| Salaries, wages | $(000) | 2,246 | 2,699 | 3,281 |
| Materials | $(000) | 5,417 | 6,004 | 7,093 |
| Other expenses | $(000) | 2,036 | 2,350 | 2,653 |
| Totals | $(000) | 9,699 | 11,053 | 13,027 |
| Value of production | $(000) | 12,113 | 13,772 | 14,711 |
| Net output (net value added) | $(000) | 4,829 | 5,653 | 5,254 |
| Overtime worked by wage earners | h(000) | 75 | 63 | 106 |
| Volume index. Base: 1956-57 (1000) | 2,244 | 2,426 | 2,536 | |
| Main materials used— | ||||
| Sugar | tonnes | 11,166 | 11,020 | 13,118 |
| Fruit extracts and juices | litres(000) | 486 | 600 | 600 |
| Aerated waters made | litres(000) | 73,133 | 79,982 | 83,801 |
| Cordials made | litres(000) | 3,555 | 3,587 | 4,887 |
| Tobacco, Cigars, and Cigarettes | ||||
| Number of establishments | 5* | 5* | 5* | |
| Persons engaged | No. | 1,169 | 1,200 | 1,191 |
| Production costs— | ||||
| Salaries, wages | $(000) | 3,042 | 3,697 | 4,091 |
| Materials | $(000) | 17,798 | 18,648 | 20,105 |
| Other expenses | $(000) | 2,203 | 2,594 | 2,931 |
| Totals | $(000) | 23,043 | 24,939 | 27,126 |
| Value of production | $(000) | 26,489 | 28,499 | 31,580 |
| Net output (net value added) | $(000) | 6,554 | 7,421 | 8,721 |
| Overtime worked by wage earners | h(000) | 309 | 290 | 268 |
| Volume index. Base: 1956-57 (= 1000) | 1,955 | 1,988 | 2,112 | |
| Tobacco leaf used in manufacture | tonnes | 6,246 | 6,243 | 6,472 |
| Cigarettes made | million | 5,252 | 5,367 | 5,708 |
| Tobacco made | tonnes | 1,086 | 1,017 | 1,018 |
| Woollen Milling | ||||
| Number of establishments | 21 | 23 | 21 | |
| Persons engaged | No. | 4,485 | 4,425 | 4,347 |
| Production costs— | ||||
| Salaries, wages | $(000) | 11,118 | 13,116 | 13,853 |
| Materials | $(000) | 15,538 | 17,389 | 22,737 |
| Other expenses | $(000) | 5,756 | 8,015 | 8,122 |
| Totals | $(000) | 32,412 | 38,520 | 44,712 |
| Value of production | $(000) | 35,220 | 39,858 | 46,955 |
| Net output (net value added) | $(000) | 14,460 | 15,089 | 16,792 |
| Overtime worked by wage earner | h(000) | 893 | 770 | 682 |
| Volume index. Base: 1956-57 (= 1000) | 3,161, | 3,391, | 3,883, | |
| Main materials used— | ||||
| Wool fibres— | ||||
| Greasy and slipe wool | kg(000) | 10,088 | 9,972 | 9,755 |
| Scoured wool | kg(000) | 1,021 | 1,238 | 1,068 |
| Tops, noils | kg(000) | 461 | 1,178 | 1,159 |
| Woollen and worsted yarn | kg(000) | 408 | ||
| Non-wool fibres | kg(000) | 1,004 | 1,149 | 1,680 |
| Principal products— | ||||
| Woollen cloth | sq m(000) | 2,632 | 1,877 | 1,211 |
| Worsted cloth | sq m(000) | 1,088 | 920 | 843 |
| Flannel | sq m(000) | 87 | 76 | 53 |
| Blankets | pairs(000) | 253 | 269 | 288 |
| Rugs | No.(000) | 96 | 96 | 72 |
| Yarn produced for sale or transfer— | ||||
| Fingering | kg(000) | 1,050 | 1,061 | 1,170 |
| Machine knitting | kg(000) | 1,494 | 2,293 | 2,470 |
| Hosiery and Other Knitting Mills | ||||
| Number of establishments | 84 | 86 | 84 | |
| Persons engaged | No. | 5,572 | 5,604 | 5,225 |
| Production costs— | ||||
| Salaries, wages | $(000) | 13,178 | 14,549 | 14,918 |
| Materials | $(000) | 26,964 | 28,766 | 29,413 |
| Other expenses | $(000) | 6,571 | 7,882 | 7,707 |
| Totals | $(000) | 46,714 | 51,197 | 52,038 |
| Value of production | $(000) | 51,060 | 55,455 | 57,569 |
| Net output (net value added) | $(000) | 18,170 | 19,693 | 21,197 |
| Overtime worked by wage earners | h(000) | 485 | 480 | 501 |
| Volume index. Base: 1956-57 (= 1000) | 3,638, | 3,854, | 3,973, | |
| Clothing | ||||
| Number of establishments | 680 | 668 | 639 | |
| Persons engaged | No. | 21,357 | 21,153 | 20,450 |
| Production costs— | ||||
| Salaries, wages | $(000) | 37,264 | 41,753 | 44,565 |
| Materials | $(000) | 65,053 | 66,019 | 73,566 |
| Other expenses | $(000) | 10,509 | 11,608 | 12,393 |
| Totals | $(000) | 112,826 | 119,380 | 130,524 |
| Value of production | $(000) | 121,129 | 127,898 | 142,045 |
| Net output (net value added) | $(000) | 46,296 | 51,072 | 56,855 |
| Overtime worked by wage earners | h(000) | 518 | 439 | 520 |
| Volume index. Base: 1956-57 | (= 1000) | 1,480 | 1,511 | 1,629 |
| Footwear | ||||
| Number of establishments | 101 | 101 | 101 | |
| Persons engaged | No. | 5,368 | 5,294 | 4,979 |
| Production costs— | ||||
| Salaries, wages | $(000) | 12,069 | 13,973 | 14,085 |
| Materials | $(000) | 16,673 | 17,668 | 18,717 |
| Other expenses | $(000) | 4,484 | 5,018 | 5,268 |
| Totals | $(000) | 33,227 | 36,659 | 38,070 |
| Value of production | $(000) | 36,231 | 39,680 | 40,618 |
| Net output (net value added) | $(000) | 15,297 | 17,249 | 16,911 |
| Overtime worked by wage earners | h(000) | 489 | 382 | 355 |
| Volume index. Base: 1956-57 (= 1000) | 1,878 | 1,848 | 1,773 | |
| Main materials used— | ||||
| Upper leather | sq m(000) | 1,036 | 958 | 890 |
| Sole leather | kg(000) | 803 | 551 | 434 |
| Synthetic soling material | kg(000) | 966 | 924 | 855 |
| Ready-made soles—leather, rubber, and other | pair(000) | 3,823 | 3,509 | 2,522 |
| Ready-made heels—leather, rubber, wood, and other | pair(000) | 2,490 | 1,984 | 1,615 |
| Felt | sq m(000) | 8 | 6 | 77 |
| Crepe rubber | kg(000) | 145 | 185 | 242 |
| Sawmills | ||||
| Number of establishments | 327 | 312 | 300 | |
| Persons engaged | No. | 5,743 | 5,541 | 5,682 |
| Production costs— | ||||
| Salaries, wages | $(000) | 17,744 | 19,094 | 21,529 |
| Materials | $(000) | 31,202 | 34,030 | 35,005 |
| Other expenses | $(000) | 14,100 | 15,241 | 16,407 |
| Totals | $(000) | 63,047 | 68,365 | 72,941 |
| Value of production | $(000) | 70,623 | 74,910 | 81,380 |
| Net output (net value added) | $(000) | 25,062 | 26,352 | 30,772 |
| Overtime worked by wage earners | h(000) | 716 | 666 | 918 |
| Volume index. Base: 1956-57 (= 1000) | 1,320 | 1,279 | 1,310 | |
| Rough-sawn timber produced | ft bm(000) | 771,855 | 740,475 | 756,581 |
| Planing Mills and Timber Preservation | ||||
| Number of establishments | 162 | 155 | 152 | |
| Persons engaged | No. | 2,381 | 2,098 | 2,137 |
| Production costs— | ||||
| Salaries, wages | $(000) | 6,886 | 6,856 | 7,819 |
| Materials | $(000) | 29,351 | 27,593 | 32,372 |
| Other expenses | $(000) | 4,797 | 4,812 | 5,484 |
| Totals | $(000) | 41,034 | 39,261 | 45,675 |
| Value of production | $(000) | 44,407 | 42,900 | 50,040 |
| Net output (net value added) | $(000) | 10,633 | 10,815 | 12,618 |
| Overtime worked by wage earners | h(000) | 322 | 332 | 313 |
| Dressed timber produced— | ||||
| Floorboards | ft bm(000) | 28,481 | 13,110 | 12,933 |
| Weatherboards | ft bm(000) | 16,209 | 11,755 | 12,324 |
| Other | ft bm(000) | 127,623 | 119,407 | 149,062 |
| Joinery | ||||
| Number of establishments | 367 | 388 | 388 | |
| Persons engaged | No. | 4,249 | 4,436 | 4,455 |
| Production costs— | ||||
| Salaries, wages | $(000) | 12,770 | 15,286 | 16,737 |
| Materials | $(000) | 25,801 | 27,429 | 30,068 |
| Other expenses | $(000) | 4,549 | 5,570 | 6,427 |
| Totals | $(000) | 43,120 | 48,286 | 53,233 |
| Value of production | $(000) | 46,429 | 52,384 | 58,872 |
| Net output (net value added) | $(000) | 16,463 | 19,897 | 22,876 |
| Overtime worked by wage earners | h(000) | 439 | 695 | 687 |
| Principal products— | ||||
| Flush panel doors | No. | 477,043 | 452,953 | 561,472 |
| Shop and office fittings | $(000) | 3,049 | 4,228 | 4,340 |
| Pre-cut building parts | $(000) | 4,363 | 4,746 | 7,278 |
| Other joinery work | $(000) | 26,615 | 29,823 | 32,565 |
| Furniture | ||||
| Number of establishments | 380 | 372 | 364 | |
| Persons engaged | No. | 4,727 | 4,888 | 5,271 |
| Production costs— | ||||
| Salaries, wages | $(000) | 13,197 | 15,460 | 18,363 |
| Materials | $(000) | 21,649 | 23,413 | 27,898 |
| Other expenses | $(000) | 4,336 | 5,043 | 6,107 |
| Totals | $(000) | 39,181 | 43,916 | 52,368 |
| Value of production | $(000) | 42,323 | 48,368 | 58,284 |
| Net output (net value added) | $(000) | 16,634 | 20,274 | 24,710 |
| Overtime worked by wage earners | h(000) | 572 | 775 | 672 |
| Pulp, Paper, and Paperboard | ||||
| Number of establishments | 6 | 6 | 6 | |
| Persons engaged | No. | 3,943 | 4,028 | 4,213 |
| Production costs— | ||||
| Salaries, wages | $(000) | 17,649 | 20,866 | 23,004 |
| Materials | $(000) | 32,763 | 33,602 | 35,681 |
| Other expenses | $(000) | 31,367 | 33,342 | 39,501 |
| Totals | $(000) | 81,779 | 87,809 | 98,185 |
| Value of production | $(000) | 97,689 | 99,715 | 105,221 |
| Net output (net value added) | $(000) | 34,393 | 33,995 | 31,394 |
| Overtime worked by wage earners | h(000) | 932 | 985 | 1,158 |
| Volume index. Base: 1956-57 (=1000) | 3,537, | 3,477, | 3,487, | |
| Principal products— | ||||
| Newsprint | tonnes | 213,914 | 217,999 | 213,230 |
| Other paper | tonnes | 174,720 | 166,701 | 162,140 |
| Paperboard | tonnes | 72,079 | 70,857 | 72,097 |
| Fibreboard | sq m(000) | 11,219 | 11,571 | 11,694 |
| Wood pulp for sale | tonnes | 131,181 | 132,250 | 151,496 |
| Cardboard Boxes, Cartons, and Paper Bags | ||||
| Number of establishments | 59 | 61 | 58 | |
| Persons engaged | No. | 3,329 | 3,212 | 3,210 |
| Production costs— | ||||
| Salaries, wages | $(000) | 9,639 | 10,401 | 11,351 |
| Materials | $(000) | 35,769 | 37,853 | 43,050 |
| Other expenses | $(000) | 6,186 | 6,810 | 8,217 |
| Totals | $(000) | 51,594 | 55,065 | 62,618 |
| Value of production | $(000) | 66,177 | 61,308 | 68,760 |
| Net output (net value added) | $(000) | 17,356 | 17,560 | 17,968 |
| Overtime worked by wage earners | h(000) | 824 | 747 | 801 |
| Paper used in manufacture | tonnes | 58,105 | 64,779 | 73,888 |
| Cardboard | tonnes | 38,030 | 42,207 | 40,683 |
| Corrugated and laminated paperboard | tonnes | 25,495 | 21,519 | 26,371 |
| Cardboard boxes, cartons, made* | $(000) | 39,977 | 43,124 | 45,989 |
| Paper bags and paper sacks, made* | $(000) | 9,040 | 9,987 | 11,861 |
| Printing and Publishing | ||||
| Number of establishments | 85 | 95 | 96 | |
| Persons engaged | No. | 7,773 | 7,746 | 7,776 |
| Production costs— | ||||
| Salaries, wages | $(000) | 23,715 | 28,045 | 31,996 |
| Materials | $(000) | 15,512 | 16,421 | 18,081 |
| Other expenses | $(000) | 14,019 | 15,598 | 17,157 |
| Totals | $(000) | 53,246 | 60,064 | 67,235 |
| Value of production | $(000) | 66,075 | 72,572 | 80,687 |
| Net output (net value added) | $(000) | 36,904 | 40,967 | 45,949 |
| Overtime worked by wage earners | h(000) | 614 | 662 | 699 |
| Volume index. Base: 1956-57 (=1000) | 1,866 | 1,884 | 1,925 | |
| Newsprint used | tonnes | 84,873 | 86,655 | 90,847 |
| Other paper used | tonnes | 5,834 | 5,310 | 5,523 |
| Job and General Printing | ||||
| Number of establishments | 364 | 357 | 359 | |
| Persons engaged | No. | 7,176 | 7,047 | 7,239 |
| Production costs— | ||||
| Salaries, wages | $(000) | 20,013 | 22,356 | 25,001 |
| Materials | $(000) | 24,234 | 25,180 | 28,271 |
| Other expenses | $(000) | 8,724 | 9,884 | 11,603 |
| Totals | $(000) | 52,971 | 57,420 | 64,875 |
| Value of production | $(000) | 60,638 | 63,587 | 71,923 |
| Net output (net value added) | $(000) | 28,293 | 29,210 | 32,835 |
| Overtime worked by wage earners | h(000) | 1,466 | 849 | 770 |
| Volume index. Base: 1956-57 (= 1000) | 3,060, | 3,029, | 3,265, | |
| Newsprint used | tonnes | 5,547 | 5,999 | 6,148 |
| Other paper used | tonnes | 30,710 | 30,632 | 33,327 |
| Cardboard used | tonnes | 7,732 | 6,985 | 7,184 |
| Tanning | ||||
| Number of establishments | 14 | 18 | 18 | |
| Persons engaged | No. | 959 | 1,029 | 1,087 |
| Production costs— | ||||
| Salaries, wages | $(000) | 2,928 | 3,335 | 3,780 |
| Materials | $(000) | 7,042 | 7,495 | 13,093 |
| Other expenses | $(000) | 1,459 | 1,818 | 2,163 |
| Totals | $(000) | 11,428 | 12,648 | 19,036 |
| Value of production | $(000) | 12,920 | 14,755 | 20,769 |
| Net output (net value added) | $(000) | 4,512 | 5,558 | 5,688 |
| Overtime worked by wage earners | h(000) | 158 | 153 | 153 |
| Volume index. Base: 1956-57 | (= 1000) | 1,724 | 1,762 | 1,974 |
| Principal products*— | ||||
| Leather— | ||||
| Hide— | ||||
| Bends | kg(000) | 674 | 697 | 663 |
| Shoulders | kg(000) | 249 | 248 | 537 |
| Bellies | kg(000) | 210 | 200 | |
| Chrome and other sides | sq m(000) | 861 | 917 | 960 |
| Tanned woolly skins | sq m(000) | .. | 585 | 643 |
| Rubberware | ||||
| Number of establishments | 34 | 35 | 35 | |
| Persons engaged | No. | 3,151 | 3,255 | 3,245 |
| Production costs— | ||||
| Salaries, wages | $(000) | 10,935 | 13,363 | 14,841 |
| Materials | $(000) | 18,929 | 18,317 | 18,355 |
| Other expenses | $(000) | 6,372 | 6,331 | 7,963 |
| Totals | $(000) | 36,236 | 38,011 | 41,158 |
| Value of production | $(000) | 40,271 | 42,319 | 44,900 |
| Net output (net value added) | $(000) | 15,131 | 17,854 | 18,703 |
| Overtime worked by wage earners | h(000) | 592 | 457 | 508 |
| Volume index. Base: 1956-57 (= 1000) | 2,414 | 2,573 | .. | |
| Main materials used— | ||||
| Natural rubber | kg(000) | 6,330 | 6,860 | 6,977 |
| Synthetic rubber | kg(000) | 10,547 | 10,291 | 10,644 |
| Latex | $(000) | 837 | 787 | 622 |
| Principal products— | ||||
| Pneumatic tyres (all types) | No.(000) | 1,688 | 1,660 | 1,926 |
| Tubes (all types) | No.(000) | 1,198 | 1,100 | 1,338 |
| Processed rubber | kg(000) | 5,635 | 5,315 | 6,556 |
| Milking rubberware | $(000) | 2,106 | 2,167 | 1,814 |
| Ready-made soles and heels | ||||
| Mats and floor coverings | ||||
| Hot water bottles | ||||
| Chemical Fertilisers | ||||
| Number of establishments | 15 | 15 | 15 | |
| Persons engaged | No. | 1,173 | 1,184 | 1,156 |
| Production costs— | ||||
| Salaries, wages | $(000) | 4,603 | 5,170 | 5,915 |
| Materials | $(000) | 35,723 | 40,885 | 49,413 |
| Other expenses | $(000) | 6,012 | 6,550 | 7,531 |
| Totals | $(000) | 46,338 | 52,605 | 62,859 |
| Value of production | $(000) | 51,201 | 58,173 | 71,549 |
| Net output (net value added) | $(000) | 9,762 | 10,971 | 14,797 |
| Overtime worked by wage earners | h(000) | 376 | 399 | 334 |
| Volume index. Base: 1956-57 (= 1000) | 1,884 | 2,080 | 2,503 | |
| Main materials used— | ||||
| Rock phosphate | tonnes(000) | 976 | 1,039 | 1,283 |
| Serpentine rock | tonnes(000) | 64 | 68 | 103 |
| Sulphur | tonnes(000) | 203 | 238 | 246 |
| Carbonate of lime | tonnes(000) | 103 | 118 | 140 |
| Sulphate of ammonia | tonnes(000) | 17 | 17 | 26 |
| Potash | tonnes(000) | 159 | 178 | 237 |
| Principal products— | ||||
| Serpentine superphosphate and mixtures | tonnes(000) | 155 | 154 | 224 |
| Basic and reverted superphosphate and mixtures | tonnes(000) | 41 | 42 | 47 |
| Straight superphosphate and mixtures | tonnes(000) | 1,591 | 1,747 | 1,895 |
| Aerial superphosphate and mixtures | tonnes(000) | 97 | 122 | 282 |
| Other (including ground rock) | ||||
| Superphosphate content of above | tonnes(000) | 1,624 | 1,695 | 2,009 |
| Soap Manufacture | ||||
| Number of establishments | 13 | 11 | 11 | |
| Persons engaged | No. | 523 | 545 | 547 |
| Production costs— | ||||
| Salaries, wages | $(000) | 1,516 | 1,709 | 1.866 |
| Materials | $(000) | 5,949 | 6,169 | 5,742 |
| Other expenses | $(000) | 1,569 | 1,723 | 1,657 |
| Totals | $(000) | 9,035 | 9,601 | 9,265 |
| Value of production | $(000) | 10,823 | 11,204 | 11,366 |
| Net output (net value added) | $(000) | 3,609 | 3,674 | 4,205 |
| Overtime worked by wage earners | h(000) | 102 | 92 | 100 |
| Volume index. Base: 1956-57 (= 1000) | 1,634 | 1,606 | 1,578 | |
| Main materials used— | ||||
| Tallow | tonnes | 12,692 | 12,645 | 11,503 |
| Other oils and fats | tonnes | |||
| Soda ash | tonnes | 2,394 | 2,433 | 2,348 |
| Perfumes | $(000) | 436 | 498 | |
| Principal products— | ||||
| Soap— | ||||
| Bar | tonnes | 21,331 | 20,508 | 19,856 |
| Toilet | tonnes | |||
| Powder and flake. | tonnes | |||
| Soft | tonnes* | |||
| Other | tonnes | |||
| Sandsoap | tonnes | |||
| Candles | tonnes | 157 | 173 | 166 |
| Paint and Varnish | ||||
| Number of establishments | 33 | 36 | 35 | |
| Persons engaged | No. | 908 | 951 | 932 |
| Production costs— | ||||
| Salaries, wages | $(000) | 2,730 | 3,294 | 3,610 |
| Materials | $(000) | 13,932 | 15,298 | 16,447 |
| Other expenses | $(000) | 2,113 | 2,358 | 2,584 |
| Totals | $(000) | 18,775 | 20,949 | 22,641 |
| Value of production | $(000) | 21,951 | 23,448 | 25,600 |
| Net output (net value added) | $(000) | 5,981 | 5,885 | 6,655 |
| Overtime worked by wage earners | h(000) | 88 | 113 | 146 |
| Volume index. Base: 1956-57 (= 1000) | 1,590 | 1,628 | 1,763 | |
| Main materials used— | ||||
| White lead | tonnes | .. | .. | 167 |
| Titanium dioxide (in terms of 100 %TiO2) | tonnes | 4,597 | 5,619 | 5,449 |
| Other pigments and extenders | tonnes | 8,343 | 10,059 | 8,433 |
| Linseed oil | litres(000) | 1,386 | 1,487 | 1,568 |
| Solvents | litres(000) | 10,833 | 11,701 | 12,656 |
| Resins | tonnes | 6,347 | 6,667 | 7,972 |
| Principal products— | ||||
| Paints and enamels | litres(000) | 16,961 | 17,561 | 19,170 |
| Lacquers | litres(000) | 1,850 | 1,877 | 2,091 |
| Varnishes | litres(000) | 1,368 | 1,605 | 1,746 |
| Pharmaceuticals, Toilet Goods, and Cosmetics* | ||||
| Number of establishments | 39 | 37 | 36 | |
| Persons engaged | No. | 1,509 | 1,557 | 1,501 |
| Production costs— | ||||
| Salaries, wages | $(000) | 3,306 | 3,951 | 4,271 |
| Materials | $(000) | 14,212 | 15,740 | 17,845 |
| Other expenses | $(000) | 2,255 | 2,532 | 2,854 |
| Totals | $(000) | 19,774 | 22,223 | 24,970 |
| Value of production | $(000) | 25,433 | 26,546 | 30,701 |
| Net output (net value added) | $(000) | 9,076 | 8,389 | 10,132 |
| Overtime worked by wage earners | h(000) | 74 | 98 | 80 |
| Principal products— | ||||
| Pharmaceutical products | ||||
| Toilet preparations and cosmetics— | ||||
| Dentifrices | $(000) | 8,114 | 9,752 | 11,943 |
| Cosmetic creams and lotions | $(000) | 1,212 | 1,253 | 1,109 |
| Hair dressing | $(000) | 4,650 | 4,711 | 4,390 |
| Powder, face and talcum | $(000) | 1,091 | 1,125 | 957 |
| Lipstick | $(000) | 584 | 598 | 475 |
| Structural Clay Products | ||||
| Number of establishments | 34 | 35 | 32 | |
| Persons engaged | No. | 1,070 | 983 | 883 |
| Production costs— | ||||
| Salaries, wages | $(000) | 3,329 | 3,303 | 3,338 |
| Materials | $(000) | 1,301 | 1,532 | 1,625 |
| Other expenses | $(000) | 2,968 | 3,090 | 3,255 |
| Totals | $(000) | 7,598 | 7,925 | 8,218 |
| Value of production | $(000) | 8,619 | 8,657 | 9,949 |
| Net output (net value added) | $(000) | 4,524 | 4,199 | 5,330 |
| Overtime worked by wage earner | h(000) | 273 | 243 | 296 |
| Volume index. Base: 1956-57 (= 1000) | 1,145 | 1,122 | 991 | |
| Clay used— | ||||
| Purchased | tonnes(000) | 61 | 69 | 121 |
| From own quarry | tonnes(000) | 237 | 218 | 144 |
| Principal products— | ||||
| Building bricks excluding hollow blocks | No.(000) | 29,594 | 26,620 | 27,670 |
| Glazed pipes and fittings— | ||||
| 4 in. and below | metres(000)† | 1,837 | 1,911 | 1,541 |
| Over 4 in. but not exceeding 6 in. | metres(000)† | 185 | 192 | 127 |
| Above 6 in. | metres(000) | .. | ||
| Field tiles and fittings— | ||||
| 4 in. and below | metres(000)† | 2,440 | 2,298 | 2,429 |
| Over 4 in. but not exceeding 6 in. | metres(000)† | 419 | 458 | 420 |
| Above 6 in. | metres(000)† | 35 | 28 | 42 |
| Pottery, China, and Earthenware | ||||
| Number of establishments | 10 | 10 | 11 | |
| Persons engaged | No. | 966 | 966 | 945 |
| Production costs— | ||||
| Salaries, wages | $(000) | 2,525 | 2,726 | 2,924 |
| Materials | $(000) | 1,199 | 1,356 | 1,198 |
| Other expenses | $(000) | 954 | 1,714 | 1,611 |
| Totals | $(000) | 4,679 | 5,796 | 5,732 |
| Value of production | $(000) | 6,497 | 6,768 | 6,727 |
| Net output (net value added) | $(000) | 4,422 | 4,014 | 4,177 |
| Overtime worked by wage earners | h(000) | 240 | 201 | 149 |
| Cement | ||||
| Number of establishments | 5 | 4 | 4 | |
| Persons engaged | No. | 683 | 664 | 683 |
| Production costs— | ||||
| Salaries, wages | $(000) | 2,448 | 2,675 | 3,328 |
| Materials | $(000) | 2,127 | 2,365 | 3,056 |
| Other expenses | $(000) | 6,562 | 7,063 | 8,594 |
| Totals | $(000) | 11,137 | 12,103 | 14,978 |
| Value of production | $(000) | 15,784 | 16,405 | 20,255 |
| Net output (net value added) | $(000) | 7,289 | 7,190 | 8,927 |
| Overtime worked by wage earners | h(000) | 273 | 265 | 339 |
| Volume index. Base: 1956-57 (= 1000) | 1,707 | 1,760 | 2,072 | |
| Principal materials— | ||||
| Limestone | tonnes(000) | 695 | 7,741, | 1,619 |
| Clay, marl, cement rock | tonnes(000) | 777 | 657 | |
| Gypsum | tonnes(000) | 33 | 31 | |
| Cement made | tonnes(000) | 821 | 838 | 987 |
| Concrete Products | ||||
| Number of establishments | 215 | 216 | 201 | |
| Persons engaged | No. | 2,425 | 2,412 | 2,346 |
| Production costs— | ||||
| Salaries, wages | $(000) | 6,950 | 7,849 | 8,618 |
| Materials | $(000) | 11,617 | 12,989 | 14,129 |
| Other expenses | $(000) | 4,982 | 5,784 | 6,309 |
| Totals | $(000) | 23,549 | 26,622 | 29,056 |
| Value of production | $(000) | 28,643 | 32,418 | 36,259 |
| Net output (net value added) | $(000) | 12,301 | 13,972 | 16,135 |
| Overtime worked by wage earners | h(000) | 487 | 485 | 580 |
| Volume index. Base: 1956-57 (=1000) | 1,829 | 1,909 | 2,085 | |
| Materials used— | ||||
| Portland cement | tonnes(000) | 150 | 161 | 160 |
| Sand, shingle | tonnes(000) | 601 | 623 | 621 |
| Reinforcing | tonnes(000) | 15 | 15 | 14 |
| Marble chips | tonnes(000) | 12 | 10 | 3 |
| Pumice | cu m(000) | 44 | 63 | 103 |
| Principal products*— | ||||
| Fencing posts | No.(000) | 972 | 821 | 749 |
| Telegraph and power poles | No.(000) | 26 | 27 | 25 |
| Housing bricks and blocks | No.(000) | 26,989 | 31,796 | 36,454 |
| Pipes | tonnes | 160,575 | 150,009 | 200,008 |
| Prestressed concrete beams | metres | 3,851 | ||
| Plywood and Veneer | ||||
| Number of establishments | 16 | 13 | 13 | |
| Persons engaged | No. | 1,197 | 1,071 | 1,027 |
| Production costs— | ||||
| Salaries, wages | $(000) | 3,834 | 3,841 | 4,148 |
| Materials | $(000) | 6,257 | 6,158 | 7,302 |
| Other expenses | $(000) | 2,818 | 3,165 | 3,925 |
| Totals | $(000) | 12,909 | 13,164 | 15,375 |
| Value of production | $(000) | 15,429 | 15,072 | 18,267 |
| Net output (net value added) | $(000) | 6,631 | 5,920 | 7,199 |
| Overtime worked by wage earners | h(000) | 327 | 394 | 355 |
| Volume index. Base: 1956-57 (= 1000) | 3,017, | 3,080, | 3,533, | |
| Species of logs used— | ||||
| Rimu | ft(000) (H. Dahl) | 4,755 | 6,413 | 7,185 |
| Radiata pine | ft(000) (H. Dahl) | 40,153 | 48,740 | 47,582 |
| Other | ft(000) (H. Dahl) | 12,067 | 2,919 | 2,988 |
| Veneer produced (1/16 in basis) | sq m(000) | 19,688 | 21,140 | 23,277 |
| Plywood made (3/16 in. basis) | sq m(000) | 4,819 | 5,451 | 6,204 |
| Particle board | sq m(000) | 2,756 | 3,111 | 3,587 |
| Range Making* | ||||
| Number of establishments | 6 | 6 | 7 | |
| Persons engaged | No. | 1,082 | 1,100 | 1,085 |
| Production costs— | ||||
| Salaries, wages | $(000) | 2,831 | 3,443 | 3,592 |
| Materials | $(000) | 5,229 | 6,091 | 6,899 |
| Other expenses | $(000) | 1,760 | 1,680 | 1,831 |
| Totals | $(000) | 9,820 | 11,214 | 12,322 |
| Value of production | $(000) | 10,559 | 11,811 | 13,277 |
| Net output (net value added) | $(000) | 3,605 | 4,104 | 4,616 |
| Overtime worked by wage earners | h(000) | 206 | 188 | 169 |
| Volume index. Base: 1956-57 (=1000) | 2,058 | 2,084 | 2,323 | |
| Principal products— | ||||
| Domestic electric ranges | No.† | 58,229 | 60,449 | 54,777 |
| Domestic electric rangettes | No.† | |||
| Radio and Television Assembly and Manufacture* | ||||
| Number of establishments | 20 | 21 | 20 | |
| Persons engaged | No. | 2,164 | 2,003 | 2,036 |
| Production costs— | ||||
| Salaries, wages | $(000) | 5,230 | 5,617 | 6,046 |
| Materials | $(000) | 12,272 | 13,707 | 15,962 |
| Other expenses | $(000) | 2,500 | 2,624 | 3,323 |
| Totals | $(000) | 20,003 | 21,948 | 25,330 |
| Value of production | $(000) | 21,335 | 23,044 | 25,641 |
| Net output (net value added) | $(000) | 6,708 | 6,934 | 6,512 |
| Overtime worked by wage earners | h(000) | 127 | 110 | 166 |
| Volume index. Base: 1956-57 (=1000) | 4,544, | 4,572, | 4,763, | |
| Principal products— | ||||
| Radios— | ||||
| Car and portable | No.† | 101,396 | 119,592 | 113,537 |
| Table | No.† | |||
| Radiograms | No. | 16,211 | 20,869 | 14,855 |
| Television sets | No. | 48,893 | 38,852 | 33,739 |
| Motor-vehicle Assembly | ||||
| Number of establishments | 16 | 15 | 17 | |
| Persons engaged | No. | 4,961 | 5,488 | 5,786 |
| Production costs— | ||||
| Salaries, wages | $(000) | 14,385 | 19,215 | 22,685 |
| Materials | $(000) | 119,245 | 137,941 | 165,606 |
| Other expenses | $(000) | 7,082 | 9,669 | 10,912 |
| Totals | $(000) | 140,712 | 166,824 | 199,203 |
| Value of production | $(000) | 150,235 | 177,265 | 213,930 |
| Net output (net value added) | $(000) | 24,065 | 29,825 | 38,097 |
| Overtime worked by wage earners | h(000) | 1,183 | 1,299 | 2,098 |
| Volume index. Base: 1956-57 (=1000) | 1,789 | 1,889 | 2,022 | |
| Vehicles assembled— | ||||
| Cars and station wagons | No. | 56,556 | 59,590 | 72,389 |
| Vans and buses | No. | 9,391 | 12,996 | 8,320 |
| Trucks and tractors | No. | 8,261 | 8,040 | 4,908 |
| Motor-body Building | ||||
| Number of establishments | 78 | 81 | 79 | |
| Persons engaged | No. | 1,716 | 1,725 | 1,589 |
| Production costs— | ||||
| Salaries, wages | $(000) | 4,652 | 5,529 | 5,785 |
| Materials | $(000) | 8,455 | 8,907 | 9,462 |
| Other expenses | $(000) | 1,702 | 2,061 | 2,197 |
| Totals | $(000) | 14,809 | 16,496 | 17,444 |
| Value of production | $(000) | 15,657 | 17,453 | 18,934 |
| Net output (net value added) | $(000) | 5,681 | 6,727 | 7,545 |
| Overtime worked by wage earners | h(000) | 180 | 153 | 207 |
| Main materials— | ||||
| Timber | ft bm(000) | 1,941 | 1,678 | 1,702 |
| Plywood | sq ft(000) | 1,224 | 1,189 | 1,622 |
| Paints and oils | litres(000) | 168 | 168 | 177 |
| Iron and steel | tonnes(000) | 8 | 7 | 5 |
| Trimmings | $(000) | 387 | 381 | 445 |
| Hardware | $(000) | 1,104 | 1,138 | 1,005 |
| Glassware | $(000) | 190 | 195 | 187 |
| Motor bodies built— | ||||
| Buses | No. | 137 | 146 | 148 |
| Vans | No. | 383 | 485 | 456 |
| Trucks— | ||||
| Cabs | No. | 116 | 118 | 97 |
| Trays | No. | 779 | 698 | 923 |
| Caravans | No. | 2,887 | 3,123 | 3,062 |
| Sheet-metal Working | ||||
| Number of establishments | 234 | 238 | 232 | |
| Persons engaged | No. | 7,067 | 6,820 | 6,716 |
| Production costs— | ||||
| Salaries, wages | $(000) | 21,337 | 23,990 | 25,032 |
| Materials | $(000) | 42,007 | 44,791 | 45,797 |
| Other expenses | $(000) | 11,867 | 13,419 | 14,996 |
| Totals | $(000) | 75,211 | 82,200 | 85,825 |
| Value of production | $(000) | 84,864 | 92,822 | 95,795 |
| Net output (net value added) | $(000) | 31,747 | 35,527 | 35,94§ |
| Overtime worked by wage earners | h(000) | 1,218 | 1,368 | 1,277 |
| Volume index. Base: 1956-57 (= 1000) | 3,835, | 4,262, | 4,269, | |
| Metal Products, n.e.i. | ||||
| Number of establishments | 473 | 535 | 551 | |
| Persons engaged | No. | 8,791 | 9,517 | 10,540 |
| Production costs— | ||||
| Salaries and wages | $(000) | 27,742 | 33,632 | 40,915 |
| Materials | $(000) | 49,954 | 57,294 | 73,811 |
| Other expenses | $(000) | 14,089 | 15,809 | 19,893 |
| Totals | $(000) | 91,785 | 106,735 | 134,619 |
| Value of production | $(000) | 104,423 | 121,273 | 152,683 |
| Net output (net value added) | $(000) | 41,186 | 49,248 | 60,313 |
| Overtime worked by wage earners | h(000) | 1,631 | 1,630 | 2,019 |
| Agricultural and Pastoral Machinery | ||||
| Number of establishments | 171 | 188 | 187 | |
| Persons engaged | No. | 1,407 | 1,502 | 1,596 |
| Production costs— | ||||
| Salaries, wages | $(000) | 4,020 | 4,936 | 5,739 |
| Materials | $(000) | 16,441 | 20,414 | 20,032 |
| Other expenses | $(000) | 1,849 | 2,325 | 2,646 |
| Totals | $(000) | 22,310 | 27,675 | 28,418 |
| Value of production | $(000) | 25,117 | 29,681 | 31,580 |
| Net output (net value added) | $(000) | 7,020 | 7,183 | 9,132 |
| Overtime worked by wage earners | h(000) | 150 | 147 | 204 |
| Plastics | ||||
| Number of establishments | 168 | 195 | 206 | |
| Persons engaged | No. | 5,192 | 5,957 | 6,090 |
| Production costs— | ||||
| Salaries, wages | $(000) | 15,391 | 19,618 | 21,537 |
| Materials | $(000) | 29,727 | 34,576 | 40,684 |
| Other expenses | $(000) | 11,413 | 14,426 | 17,033 |
| Totals | $(000) | 56,531 | 68,620 | 79,254 |
| Value of production | $(000) | 63,874 | 77,484 | 91,768 |
| Net output (net value added) | $(000) | 23,185 | 29,262 | 34,741 |
| Overtime worked by wage earners | h(000) | 1,095 | 1,778 | 1,637 |
| Machinery, n.e.i. | ||||
| Number of establishments | 619 | 647 | 624 | |
| Persons engaged | No. | 15,025 | 14,393 | 15,157 |
| Production costs— | ||||
| Salaries wages | $(000) | 47,929 | 53,331 | 60,124 |
| Materials | $(000) | 73,248 | 77,954 | 88,201 |
| Other expenses | $(000) | 21,389 | 24,369 | 27,195 |
| Totals | $(000) | 142,566 | 155,654 | 175,519 |
| Value of production | $(000) | 157,370 | 171,133 | 191,795 |
| Net output (net value added) | $(000) | 64,380 | 70,540 | 78,334 |
| Overtime worked by wage earners | h(000) | 2,960 | 2,742 | 3,406 |
| Principal products*— | ||||
| Washing machines | No. | 55,491 | 62,543 | 103,729 |
| Refrigerators (home, commercial, and freezers) | No. | 117,076 | 120,912 | 149,778 |
| Industrial machinery— | ||||
| Mining, quarrying | $(000) | 1,918 | 2,758 | 2,062 |
| Road construction | $(000) | 4,760 | 4,822 | .. |
| Logging, sawmilling, woodworking | $(000) | 4,288 | 5,483 | 4,422 |
| Refrigeration | $(000) | 5,915 | 7,255 | 7,903 |
| Heating, air-conditioning | $(000) | 7,812 | 8,186 | 5,661 |
| Dairy factory | $(000) | 3,226 | 3,585 | 4,681 |
| Pumping | $(000) | 2,593 | 2,545 | 4,126 |
| Other | $(000) | 21,237 | 27,310 | 14,457 |
| Lawnmowers—hand and power | No. | 60,948 | 59,366 | 74,799 |
| Repairs to machinery | $(000) | 29,555 | 31,229 | 24,522 |
| Petroleum and Coal Products | ||||
| Establishments | No. | 18 | 18 | 18 |
| Persons engaged | No. | 394 | 392 | 399 |
| Production costs— | ||||
| Salaries and wages | $(000) | 1,516 | 1,778 | 1,993 |
| Materials | $(000) | 62,658 | 69,558 | 76,569 |
| Other expenses | $(000) | 3,492 | 4,263 | 3,649 |
| Totals | $(000) | 67,666 | 75,599 | 82,211 |
| Value of production | $(000) | 76,570 | 83,032 | 91,562 |
| Net output (net value added) | $(000) | 10,425 | 9,217 | 11,351 |
| Overtime worked by wage earners | h(000) | 46 | 47 | 54 |
| Principal products— | ||||
| Premium gasoline | litres(million) | 1,231.8 | 1,214.7 | 1,477.2 |
| Regular gasoline | litres(million) | 414.6 | 382.9 | 318.5 |
| Automotive gasoil | litres(million) | 661.1 | 615.5 | 709.4 |
| Marine diesel oil | litres(million) | 103.8 | 89.3 | 99.0 |
| Light fuel oil | litres(million) | 247.6 | 278.3 | 278.3 |
| Heavy fuel oil | litres(million) | 442.2 | 537.6 | 598.3 |
| Export fuel oil | litres(million) | 59.1 | 22.5 | 15.9 |
| Bunker fuel | litres(million) | 78.4 | 90.7 | 100.1 |
| Bitumen | litres(million) | 116.0 | 103.4 | 116.4 |
| Power station fuel | litres(million) | 138.3 | 106.3 | 172.6 |
NOTE—More detailed information on individual industries is given in the annual Statistics of Industrial Production obtainable from Government bookshops, or alternatively available for reference at major public libraries.
Details of individual industries for the year later than in the preceding tables are given in supplements to the Monthly Abstract of Statistics. Also in the same publication up-to-date monthly or quarterly production totals are given in the tables.
ECONOMIC IMPORTANCE OF BUILDING AND CONSTRUCTION INDUSTRY—The industry makes a fairly large contribution to total national output. It supplies between 40 and 45 percent of gross domestic capital formation. A percentage analysis of building permits by sectors of ownership and types of building is as follows for 1973-74.
| Type of Building | Central Government | Public Corporations | Local Government | Private Sector | Total |
|---|---|---|---|---|---|
| Percent | |||||
| Houses and flats | 2.4 | - | 0.6 | 58.3 | 61.3 |
| Hostels and boarding houses | 0.3 | - | - | 0.4 | 0.7 |
| Hotels, motels, etc. | - | 0.1 | 1.8 | 1.9 | |
| Hospitals | 1.2 | - | - | 0.3 | 1.5 |
| Education buildings | 5.2 | - | - | 0.3 | 5.5 |
| Shops, restaurants, taverns | - | - | 0.3 | 3.4 | 3.7 |
| Office and administrative | 0.7 | 0.6 | 0.5 | 6.1 | 7.9 |
| Warehouses | 0.1 | - | 0.5 | 3.5 | 4.1 |
| Factories, powerhouses, etc | 0.6 | - | 0.2 | 7.9 | 8.7 |
| Social, cultural, recreational | - | - | 0.3 | 1.3 | 1.6 |
| Farm | 0.1 | - | - | 1.6 | 1.7 |
| Miscellaneous | 0.5 | 0.3 | 0.3 | 0.4 | 1.5 |
| All building | 11.1 | 0.9 | 2.8 | 85.3 | 100.0 |
Permits issued for residential buildings (houses and flats) have increased fairly steadily in line with increasing population. On the other hand, investment in residential buildings as a proportion of total investment in buildings of all types declined steadily in the 1960s, but has recovered in the 1970s. Development of a more complex and sophisticated economy is emphasised by the growth in factories, commercial buildings, office blocks, motels, hotels, technical institutes, universities, etc.
In June 1966 the Government introduced a building programme under the Economic Stabilisation Act in terms of which the issue of building permits for works of an estimated value of more than $60,000 could be deferred for periods of up to 3 years. These building controls were removed on 8 March 1968. Regulations came into force on 7 October 1968 requiring construction work costing more than $20,000 to be registered with the Building Projects Registration Authority at the working drawing stage.
Building programming was reintroduced on 27 April 1970 and intensified in October 1970 as one of several measures to deal with growing pressure on the economy. It operates as an extension of the registration scheme by preventing local authorities from issuing permits for buildings costing more than $60,000 without the consent of the Minister of Works and Development.
In May 1974 restrictions were introduced whereby permits for single unit houses above 1,500 sq ft and for flats above 1,000 sq ft could be deferred for a period of up to 18 months. The restrictions were relaxed early in 1975.
Within the residential field a trend has developed away from houses to flats. Whereas new flat units comprised 5.5 percent of all residential units built in 1960-61, the percentage rose to 40.7 for 1973-74. The greatest demand for flats has been in the main urban centres, Auckland and Wellington. Many flats are merely two or more one-storey units on the one section, thus making greater use of serviced sections and achieving a saving in costs. This construction is popular with builders and finds a ready market, particularly with people of retiring age.
The industry employs 7 to 8 percent of the total labour force on “on-site” works, and its position as a large market for goods from other sectors also strongly influences employment in these sectors. For example, the concrete and other non-metallic mineral products industry in the manufacturing sector employs up to 6,000 workers and the metal products industry approximately 39,000 workers. In the forestry sector, builders' woodwork has over 5,000 workers, and sawmilling and plywood 12,000. In varying degrees these industries and others rely on the building and construction industry to absorb their output. The off-site supply services provide about 65 percent of the value of the work put in place.
The characteristic of the industry with its relatively high proportion of short-term construction (mainly dwellings) is reflected in the structure of firms. Over 80 percent of on-site building firms employ fewer than six persons, are usually under-capitalised, and tend to rely on extended credit from suppliers. Hence effective planning of the housing sector on a longer-term basis is important to the stability of the industry.
Even if sufficient development finance was made available over the next few years, the real resources of the building industry—in terms of labour, skills and materials—are not sufficient to increase output in the housing sector without a major restructuring of the industry and diversion of resources from other types of building.
The main current problem is not so much the need to transfer building resources as to overcome a more basic resource restraint caused by a shortage of serviced sections.
This problem has no short-term solution because it involves the extension of local authority bulk services which have been delayed by lack of loan finance, and the supply of more concrete and asbestos cement pipes from local industries already working at full capacity.
The Government has expanded its State rental programme, but the Building Industry Advisory Council believes it will be some years before the new impetus in the state rental programme has much impact on the large and urgent waiting list for State rental units.
Although tighter liquidity and reduced availability of mortgage finance affected building demand in 1973-74, and growth in new demand showed signs of slowing, building activity remained at high levels compared with recent years.
Decreases, however, occurred in hospitals, educational buildings, and in the commercial sector. These decreases reflected partly the pressure on resources or the problem of obtaining tenderers in the Government sector when industry demand was buoyant, and partly in initiating longer-term work because of the effect of stabilisation regulations on the tendering and contracting procedures.
BUILDING INDUSTRY ADVISORY COUNCIL—There is a Building Industry Advisory Council. Its functions have become: (a) advice to Government through the Minister of Works and Development on matters affecting the building and construction industry; (b) maintenance of an overall and continuing review of the industry and advice to the industry on the likely effects of building trends. In December 1973 it produced a comprehensive report entitled Stability in the Building and Construction Industry.
The membership of the council consists of six representatives from sectors of the industry, namely contractors, architects, professional engineers, workers, and suppliers, plus one representative each from Treasury and Ministry of Works and Development. Members have been appointed by the Minister of Works and Development on the recommendation of organisations within the building industry.
HOUSING COMMISSION—A Commission of Inquiry into Housing met in 1970 to reappraise and establish future long-term requirements of housing. It reported in May 1971 (parliamentary paper H.51). It recommended that planning should be on the basis that about 300,000 new dwellings will be needed in the decade to December 1980 and stated that an increased demand for high-rise flats could be expected in Auckland and Wellington when strata title legislation was enacted. More town houses and terraced houses in central urban areas were advocated.
A National Housing Commission has been appointed to follow up recommendations of the Commission of Inquiry.
The commission consists of four members appointed by the Minister of which one is Chairman, the Secretary to the Treasury, the Director-General and an Assistant Director-General of the Housing Corporation. The present appointed members comprise the Chairman (a solicitor with an extensive local body housing background), a company director with wide land development and building experience, an architect, and the general manager of a lending institution.
The functions of the commission are primarily to advise the Minister on all matters relating to the provision of dwellings in New Zealand and to inquire into and to keep under review, the housing needs of the people of New Zealand. In addition, it is charged with assisting in the co-ordination of all persons, bodies, and agencies, both public and private, concerned with housing in New Zealand and to promote co-operation between them.
TRENDS IN AVERAGE COSTS—The following table illustrates trends in the cost of building activity over a period. (Source: Ministry of Works and Development.)
| Type of Building | Cost at End of Year | ||||||
|---|---|---|---|---|---|---|---|
| 1950 | 1955 | 1960 | 1965 | 1970 | 1973 | 1974 | |
| $ | $ | $ | $ | $ | $ | $ | |
| State rental house (976 sq ft) | 4,344 | 5,164 | 5,528 | 6,164 | 7,450 | 12,195 | 13,710 |
| Buildings (reinforced concrete) of similar size and type | 50.200 | 57,600 | 64,200 | 73,400 | 96,000 | 136,000 | 157,700 |
CENSUS OF BUILDING AND CONSTRUCTION—The latest census of the activities of the building and construction industry shows that the total value of work done in the production year 1968-69 was $814 million compared with $704 million 5 years earlier. If subcontracts and other identifiable intra-industry transactions are deducted, the value of work done became $697 million for 1968-69 and $612 million for 1963-64. The recession in the building and construction industry and the economy generally during 1968 was reflected in the census results for 1968-69.
The reduced activity in the industry in 1968-69 was also reflected in the capital expenditure of the industry. In 1963-64 expenditure by the industry on capital goods for its own use, such as plant and machinery, motor vehicles, and land and buildings, was $40 million; in 1968-69, despite higher prices, it was only $36 million.
Of the total production for 1968-69 of $814 million, $537 million or 66 percent was represented by work on buildings (involving construction, alteration, repair, maintenance, or demolition); $138 million was for work on roads, railways, bridges, tunnels, dams, drains, wharves, and jetties; $27 million was land drainage, sewerage, river protection, irrigation works, water supply, and well drilling; $24 million was for earthmoving, reclamation, site development, aerodromes, and airstrips; $2 million was for the removal of overburden from mines and quarries; and of the remaining $86 million, the most important components were power development, and work on transmission and telecommunication lines.
One of the main purposes of this 5-yearly Census of Building and Construction was to examine the structure of the industry. Of the total gross output of $814 million in 1968-69, private firms were responsible for output to the value of $637 million both as main and subcontractors. Government departments used their own staff for a value output of $101 million, while local authorities did work to the value of $61 million on their own behalf. Private owner-builders not normally engaged in building and construction undertook $15 million of their own building work.
Of the total output of private firms, $192 million in 1968-69 was done on behalf of the Government and local authorities compared with $141 million in 1963-64.
PRIVATE CONTRACTORS—The business of private contractors in building and construction in 1968-69 is summarised in the following table. Further information is given in Building end Construction 1968-69, report of the Department of Statistics (available at Government bookshops).
| Nature of Business | Units | Persons Engaged | Salaries and Wages | Working Proprietors | Materials | Value of Work Done | ||
|---|---|---|---|---|---|---|---|---|
| As Main Contractor | As Sub-Contractor | Total | ||||||
| No. | No. | $(m) | No. | $(m) | $(m) | $(m) | $(m) | |
| Building contractor | 4,579 | 23,987 | 59.3 | 3,452 | 133.2 | 338.0 | 15.5 | 353.5 |
| Civil engineering contractor | 398 | 7,890 | 27.2 | 118 | 30.7 | 92.9 | 9.7 | 102.6 |
| Shop and office fitter | 30 | 148 | 0.4 | 11 | 1.2 | 1.4 | 0.9 | 2.3 |
| Electrical contractor | 876 | 3,571 | 8.7 | 395 | 17.5 | 16.9 | 16.7 | 33.6 |
| Plumber and drainlayer | 1,255 | 3,929 | 9.4 | 833 | 24.1 | 22.3 | 21.9 | 44.1 |
| Painter | 1,171 | 3,055 | 7.3 | 1,074 | 5.5 | 11.6 | 8.1 | 19.7 |
| Plasterer | 299 | 1,105 | 2.8 | 239 | 2.2 | 2.0 | 5.3 | 7.4 |
| Roofing contractor | 64 | 620 | 1.5 | 18 | 5.6 | 1.1 | 7.7 | 8.8 |
| Bricklayer | 333 | 950 | 2.4 | 279 | 4.1 | 2.2 | 6.7 | 8.9 |
| Glazier | 92 | 688 | 1.6 | 16 | 4.5 | 2.7 | 4.9 | 7.7 |
| Flooring contractor | 112 | 369 | 0.9 | 56 | 2.5 | 1.9 | 2.8 | 4.7 |
| Earth mover | 211 | 1,061 | 2.9 | 112 | 1.0 | 9.7 | 1.8 | 11.5 |
| Road sealer | 35 | 407 | 1.1 | 9 | 2.3 | 4.4 | 1.0 | 5.4 |
| Other | 291 | 2,621 | 7.2 | 110 | 10.3 | 14.6 | 12.1 | 26.7 |
| Totals | 9,746 | 50,401 | 132.8 | 6,722 | 244.5 | 521.8 | 115.2 | 637.0 |
HOUSING—In national development planning it was projected that 4.88 percent of the gross national product in 1978-79 (instead of 4.3 percent as in 1968-69) should be absorbed by the building of new houses and flats.
Over 400,000 of the present 850,000 dwellings (that is, nearly half of the total housing stock) have been built since the National Housing Conference in 1953. The standard house is about 1,030 sq ft in area, is single-storeyed, and normally built of timber; fittings are of a reasonably high standard, especially in the kitchen. It now costs over $14,000 to build, and stands on a section costing more than $4,000 on average. Flats, many of them units of only one storey, average about 900 sq ft in area and cost $10,000 to build.
Approximately 90 percent of the dwellings completed annually are built for private home ownership, with most of the balance being erected by Government agencies for rental purposes. Since the war there has been no significant housing built for private rental, but some rental flats are created by conversion of existing dwellings. Accelerated property cost increases have made it difficult for persons on modest incomes to finance their way into home ownership. For this reason, and because of increased immigration, unsatisfied demand for State rental house has risen. Early in 1975 the Government made special provision for release of sections and loans to assist in the purchase of private sections.
Since 1937 the State, using the services of private contractors, has been building rental dwellings. At March 1974, 75,768 of these houses and flats had been built and since 1950, 26,035 of them had been sold to the occupiers. Rental dwellings are let to applicants in difficult housing circumstances. Some 436 houses were also built by the State in 1973-74 for the accommodation of Government employees.
Under the Urban Renewal and Housing Improvement Act 1945 local authorities can take action to rebuild decadent central city areas. Urban renewal schemes are in progress at Auckland, Wellington, and Christchurch, assisted with Government finance. On a limited basis, loans are available to private houseowners to renovate old houses in defined areas of the four main centres.
The Unit Titles Act 1972 made provision for a new type of ownership of units in a multi-unit development. Individual owners are entitled to a legal estate in their respective units and can sell or transfer a unit without requiring the consent of other owners as is the case where a block of shares in a flat-owning company provides the right to a flat.
GOVERNMENT CAPITAL ASSISTANCE ON NEW HOUSING-The following table gives the Government's total capital assistance on new housing in the latest 3 years and includes both direct expenditure by Government departments and money advanced by way of mortgages and loans by the Housing Corporation and the Department of Maori Affairs, and amounts advanced in capitalisation of family benefits payable under social security. Expenditure on new housing by hospital boards, education boards, etc., is not included.
| Expenditure | 1971-72 | 1972-73 | 1973-74 |
|---|---|---|---|
| $(000) | |||
| Land purchase and development, State house construction, etc. | 10,984 | 12,925 | 20,710 |
| Expenditure by Housing Corporation for other departments | 2,964 | 4,256 | 4,724 |
| Department of Maori Affairs | 5,158 | 6,827 | 8,913 |
| Department of Lands and Survey | 251 | 312 | 484 |
| Advances for new urban houses | 45,779 | 77,772 | 84,742 |
| Advances for new rural houses | 2,204 | 1,615 | 1,043 |
| Loans to local authorities for rural housing, pensioners' housing, etc. | 5,351 | 7,739 | 10,982 |
| Subsidies paid to local authorities, religious, and welfare organisations for housing of elderly | 1,103 | 1,326 | 6,197 |
| Advances under capitalisation of family benefits | 6,653 | 6,881 | 7,020 |
| Totals | 80,446 | 119,652 | 144,815 |
HOUSES AND FLATS COMPLETED—Statistics of completions are given in the following table; they include flats created by conversion of existing dwellings. The statistics are dependent on the supply of information by local authorities and indications are that they have been understated.
| Year Ended 31 March | Government | Private and Local Authority† | Total New Houses and Flats | Flats Created by Conversion‡ | Total Housing Units | |
|---|---|---|---|---|---|---|
| State Rental | Govt. Tenancies* | |||||
*Includes Education and Hospital Boards. †City, borough and county councils, etc., comprising pensioner units, staff housing, etc. ‡Additional dwelling units created by conversion of existing buildings, e.g., one house converted into two flats. | ||||||
| 1968 | 1,489 | 609 | 20,441 | 22,500 | 720 | 23,300 |
| 1969 | 1,534 | 328 | 19,140 | 21,000 | 760 | 21,800 |
| 1970 | 1,241 | 487 | 20,400 | 22,100 | 670 | 22,800 |
| 1971 | 1,194 | 623 | 20,400 | 22,240 | 720 | 22,900 |
| 1972 | 661 | 357 | 21,400 | 22,400 | 680 | 23,100 |
| 1973 | 765 | 412 | 26,300 | 27,400 | 560 | 28,000 |
| 1974 | 650 | 436 | 30,800 | 31,900 | 650 | 32,600 |
The Building Industry Advisory Council has estimated that the higher net migration inflows in recent years have increased housing requirements to the extent that over 35,000 new units a year are required for the next few years, but recognises that tighter liquidity and rising costs may reduce effective demand by up to 30 percent.
DEMOLITIONS—According to notifications received, the totals of dwellings demolished in recent years have been: 1968-69, 1,654; 1969-70, 2,188; 1970-71, 2,474; 1971-72, 2,279; 1972-73, 2,525; 1973-74, 2,900.
BUILDING PERMITS—The prime source of these statistics is building permits issued by local authorities. To enable a complete picture of building activity to be shown, construction commenced by Government departments, hospitals, education and harbour boards are included, even though permits may not actually be taken out.
The value shown represents in the majority of instances the total contract price or estimated cost of the building. A permit for a large building may involve work spread over several years whereas in the permit statistics the value is shown entirely for the year or month in which the permit is issued. This qualification applies more particularly to large buildings.
The value placed on a building for the purposes of the permit is usually less than the actual cost. This applies particularly to large new buildings which take a considerable time to complete. In these cases the final cost, owing to wage increases, rising costs of materials, etc., may be greater than originally estimated. These rises are not apparent in building permit figures.
The values of building permits for the latest 6 years are analysed by types of building in the following table. Permits cover alterations and additions as well as new buildings. Government and other buildings not requiring building permits are included.
| Type of Building | Year Ended 31 March | |||||
|---|---|---|---|---|---|---|
| 1969 | 1970 | 1971 | 1972 | 1973 | 1974 | |
*Includes ancillary buildings. †Includes alterations and additions. ‡Includes powerhouses from April 1973. | ||||||
| Dwellings | $(million) | |||||
| Houses | 147.6 | 156.0 | 168.7 | 182.1 | 259.6 | 378.6 |
| Flats | 27.4 | 36.6 | 47.4 | 64.3 | 106.1 | 166.1 |
| Alterations and additions | 27.1 | 28.6 | 35.3 | 40.2 | 49.4 | 67.6 |
| Other Buildings† | ||||||
| Hostels, boardinghouses | 17.3 | 22.9 | 20.5 | 17.0 | 23.4 | 6.3 |
| Hotels, motels, etc.* | 19.2 | |||||
| Hospitals and nursing homes* | 13.2 | 11.7 | 26.2 | 25.0 | 21.2 | 16.1 |
| Education buildings* | 36.6 | 32.7 | 33.0 | 35.1 | 64.9 | 54.7 |
| Shops, restaurants, taverns | 56.2 | 62.0 | 67.9 | 62.9 | 108.5 | 37.5 |
| Office and administrative | 78.1 | |||||
| Warehouses | 40.3 | |||||
| Factories‡ | 30.2 | 41.5 | 46.1 | 54.1 | 51.1 | 88.0 |
| Social, cultural, and recreational | 39.9 | 56.1 | 68.5 | 57.9 | 61.6 | 15.4 |
| Farm | 16.8 | |||||
| Miscellaneous buildings | 14.6 | |||||
| All buildings | 395.4 | 448.0 | 513.6 | 538.8 | 745.9 | 999.3 |
In the following table the numbers of permits for new houses and flats over a period of 11 years are shown along with permit values.
| Year Ended 31 March | Permits for New Dwelling Units | Value of New Houses | Value of New Flats | Value of Other New Buildings* | Total Value All Buildings (Including Alterations and Additions) | |
|---|---|---|---|---|---|---|
| Houses | Flats | |||||
| *Permits issued for new buildings erected on sites where there were already one or more existing buildings were previously classified as “alterations and additions”; now they are included in the classification of new buildings. | ||||||
| $(million) | $(million) | $(million) | $(million) | |||
| 1964 | 18,388 | 3,375 | 123.7 | 16.1 | .. | 294.6 |
| 1965 | 19,895 | 5,462 | 138.8 | 26.5 | .. | 357.7 |
| 1966 | 20,257 | 5,675 | 149.1 | 27.3 | 124.9 | 381.7 |
| 1967 | 18,777 | 5,269 | 147.8 | 28.3 | 138.2 | 391.5 |
| 1968 | 16,779 | 4,586 | 137.0 | 24.6 | 103.5 | 330.3 |
| 1969 | 17,421 | 4,896 | 147.4 | 27.4 | 149.2 | 395.4 |
| 1970 | 16,990 | 6,094 | 156.0 | 36.6 | 182.0 | 448.0 |
| 1971 | 16,230 | 7,449 | 168.6 | 47.4 | 186.2 | 513.6 |
| 1972 | 15,577 | 8,756 | 182.1 | 64.3 | 193.3 | 538.8 |
| 1973 | 19,916 | 12,857 | 259.6 | 106.1 | 254.0 | 745.9 |
| 1974 | 23,582 | 16,152 | 378.6 | 166.1 | 294.7 | 999.3 |
The average permit value for houses and flats in 1973-74 was $13,708, compared with $11,160 in 1972-73, $10,126 in 1971-72, and $9,123 in 1970-71.
The preceding table includes flats on an individual basis.
The following diagram illustrates building-permit figures for new houses and flats.
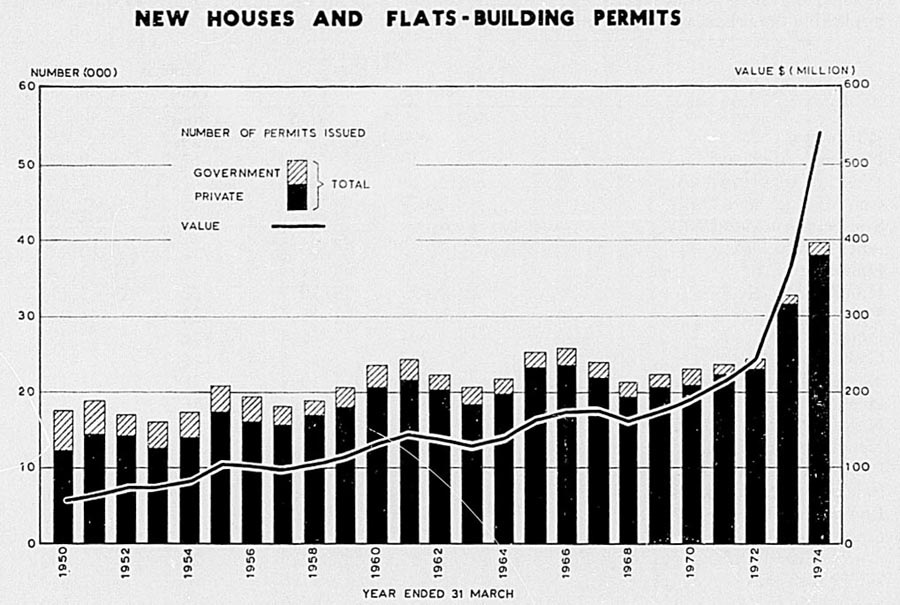
Sector of Ownership—Permit values for the main groupings of building activity are analysed below according to sector of ownership.
| Sector of Ownership | Houses and Flats | Schools and Hospitals | Factories | ||||||
|---|---|---|---|---|---|---|---|---|---|
| 1971-72 | 1972-73 | 1973-74 | 1971-72 | 1972-73 | 1973-74 | 1971-72 | 1972-73 | 1973-74 | |
| $(million) | |||||||||
| Central Government | 10.3 | 11.2 | 23.9 | 34.7 | 63.3 | 63.8 | 1.0 | 1.4 | 6.2 |
| Public corporations | - | - | - | - | - | - | 1.0 | - | - |
| Local government | 3.8 | 7.4 | 5.9 | 22.4 | 14.1 | 0.5 | 0.6 | 0.4 | 2.4 |
| Private enterprise | 31.9 | 34.7 | 39.3 | 0.2 | 1.1 | 1.3 | 51.5 | 49.0 | 79.2 |
| Households* | 240.6 | 361.9 | 543.4 | 3.0 | 7.6 | 5.2 | - | - | 0.1 |
| Sector of Ownership | Commercial Buildings | Miscellaneous | All Buildings | ||||||
|---|---|---|---|---|---|---|---|---|---|
| 1971-72 | 1972-73 | 1973-74 | 1971-72 | 1972-73 | 1973-74 | 1971-72 | 1972-73 | 1973-74 | |
| *Including non-profit organisations. | |||||||||
| $(million) | |||||||||
| Central Government | 9.4 | 23.2 | 7.1 | 9.1 | 11.6 | 8.8 | 64.5 | 110.7 | 109.8 |
| Public corporations | 0.5 | 0.4 | 6.1 | 2.8 | 0.6 | 2.7 | 4.3 | 1.1 | 8.8 |
| Local government | 3.0 | 3.3 | 13.2 | 13.0 | 13.6 | 6.9 | 42.8 | 39.0 | 29.0 |
| Private enterprise | 49.4 | 81.2 | 128.3 | 36.2 | 44.6 | 39.0 | 169.1 | 210.5 | 287.1 |
| Households* | 0.7 | 0.5 | 1.2 | 13.8 | 14.5 | 14.9 | 258.1 | 384.6 | 564.6 |
GEOGRAPHICAL LOCATIONS—The following table shows for urban areas and statistical divisions. building permit values and dwelling completions for the March year 1973-74. Where applicable the urban areas are included in the relevant statistical division.
| Area | New Houses and Flats | Total (All Permits) | ||
|---|---|---|---|---|
| Number | Value | Value | Dwelling Completions | |
| *Figures for completions of dwellings arc rounded to indicate that exact numbers arc not available and are dependent on notifications from local authorities. | ||||
| $(m) | $(m) | |||
| Whangarei U.A. | 600 | 8.0 | 14.5 | 450 |
| Northern Auckland U.A. | 3,313 | 50.3 | 67.2 | 2,870 |
| Western Auckland U.A. | 2,181 | 29.2 | 42.7 | 1,610 |
| Central Auckland U.A. | 2,839 | 34.5 | 98.5 | 2,330 |
| Southern Auckland U.A. | 4,008 | 56.1 | 89.6 | 3,190 |
| Auckland S. Div. | 13,095 | 180.2 | 312.8 | 10,440 |
| Hamilton U.A. | 1,862 | 21.9 | 37.5 | 1,710 |
| Hamilton S. Div. | 2,493 | 30.7 | 53.2 | 2,190 |
| Tauranga U.A. | 1,129 | 15.6 | 24.1 | 1,020 |
| Rotorua U.A. | 694 | 9.4 | 16.3 | 750 |
| Gisborne U.A. | 237 | 3.6 | 6.7 | 220 |
| Napier U.A. | 792 | 10.7 | 16.3 | 420 |
| Hastings U.A. | 588 | 8.0 | 19.3 | 470 |
| Napier-Hastings S. Div. | 1,432 | 19.6 | 37.4 | 920 |
| New Plymouth U.A. | 629 | 9.7 | 15.9 | 490 |
| Palmerston North U.A. | 811 | 10.9 | 20.8 | 720 |
| Palmerston North S. Div. | 1,018 | 14.1 | 26.4 | 890 |
| Lower Hutt U.A. | 967 | 14.6 | 26.1 | 920 |
| Upper Hutt U.A. | 534 | 8.3 | 16.2 | 530 |
| Porirua Basin U.A. | 786 | 14.6 | 21.1 | 600 |
| Wellington U.A. | 1,509 | 21.6 | 70.3 | 980 |
| Wellington S. Div. | 4,355 | 67.0 | 145.5 | 3,560 |
| Wanganui U.A. | 325 | 4.4 | 10.0 | 160 |
| Masterton U.A. | 162 | 2.2 | 4.2 | 120 |
| Nelson U.A. | 465 | 6.0 | 11.4 | 440 |
| Christchurch U.A. | 3,631 | 42.1 | 75.1 | 2,990 |
| Christchurch S. Div. | 4,036 | 47.9 | 85.5 | 3,260 |
| Timaru U.A. | 273 | 4.0 | 9.0 | 160 |
| Dunedin U.A. | 725 | 10.9 | 23.9 | 630 |
| Dunedin S. Div. | 758 | 11.4 | 24.9 | 650 |
| Invercargill U.A. | 550 | 7.1 | 13.0 | 400 |
| Totals New Zealand | 39,734 | 544.7 | 999.3 | 31,900 |
WORK PUT IN PLACE—The Department of Statistics makes a survey of building work put in place. In contrast to the statistics based on building permits, these figures show the gross value of actual work done. It should be noted that there are varying time lags between the issue of the building permit and the commencement of building. The actual work for which a permit is issued can be extended over a number of time periods. Also, the total value of this work may differ considerably from the value estimated on the building permit.
| Year Ended 31 March | Dwellings | ||||
|---|---|---|---|---|---|
| New Houses and Flats | Alterations and Additions | Total | |||
| Government | Other | Total | |||
| $(million) | |||||
| Value of Work Put in Place§ | |||||
| 1969 | 12.4 | 155.3 | 167.7 | 28.2 | 195.8 |
| 1970 | 14.9 | 174.9 | 189.8 | 30.4 | 220.2 |
| 1971 | 12.9 | 202.0 | 214.9 | 34.5 | 249.3 |
| 1972 | 9.0 | 228.6 | 237.6 | 39.8 | 277.4 |
| 1973 | 11.4 | 311.8 | 323.2 | 48.3 | 371.5 |
| 1974 | 14.5 | 428.4 | 442.9 | 60.2 | 503.1 |
| Year Ended 31 March | Other Buildings* | Grand Total | ||||||
|---|---|---|---|---|---|---|---|---|
| Hotels, Boarding-houses† | Hospitals† | Factories | Commercial Buildings | Schools† | Miscellaneous‡ | Total | ||
*Includes alterations and additions. †And ancillary buildings. ‡Includes churches, sports, and entertainment buildings. §Value of work actually put in place. | ||||||||
| $(million) | ||||||||
| Value of Work Put in Place§ | ||||||||
| 1969 | 13.5 | 15.0 | 32.5 | 47.8 | 21.1 | 34.3 | 164.2 | 360.1 |
| 1970 | 19.7 | 12.3 | 34.4 | 59.3 | 25.3 | 49.5 | 200.5 | 420.7 |
| 1971 | 23.1 | 15.1 | 53.1 | 66.7 | 32.2 | 67.8 | 258.1 | 507.4 |
| 1972 | 21.2 | 19.4 | 51.3 | 71.1 | 39.1 | 55.7 | 257.8 | 535.2 |
| 1973 | 21.5 | 26.8 | 52.5 | 81.0 | 44.8 | 62.7 | 289.3 | 660.8 |
| 1974 | 25.0 | 19.1 | 74.4 | 122.1 | 45.4 | 50.2 | 336.1 | 839.2 |
EMPLOYMENT—The level of employment in the building and construction industrial group as shown in the Department of Labour's half-yearly survey has varied considerably during the last 10 years. The labour force rose from 56,000 in 1963 to 64,000 in 1966. There was a sharp decline in 1968 when the labour force fell to approximately 59,300, but a rise was experienced in 1969 and 1970. The total at April 1971 was 69,500, at April 1973 it was 71,400, and at April 1974 it was 74,800. Employment in the building of houses and flats fell from 15,600 in 1961 to 13,100 in 1970 and to 11,500 in 1971 but rose again to 13,000 by April 1973, and 14,500 by April 1974. Part of the decline in the “on site” labour force was believed to be due to “off site” supply industries providing a greater proportion of work done through prefabrication and process working. The average “working life” in the industry has been estimated by the Building Industry Advisory Council at about 10 years.
BUILDING MATERIALS—The following table shows the production of principal building materials for the latest 11 years.
| Production Year | Rough-sawn Timber* | Dressed Timber (from Rough-sawn) | Building Sheet† | Plywood | Wall-board‡ | Paints, etc. | ||
|---|---|---|---|---|---|---|---|---|
| Paints and Enamels | Varnishes | Lacquers | ||||||
*Source: New Zealand Forest Service, for years ended 31 March. †Asbestos cement and cement sheet. ‡Includes fibrous plasterboard. | ||||||||
| cubic metre$(000) | square metres(000) | litres(000) | ||||||
| 1962-63 | 1,518 | 378 | 2,630 | 4,777 | 15,827 | 14,074 | 573 | 1,337 |
| 63-64 | 1,572 | 363 | 2,797 | 4,916 | 15,678 | 15,097 | 618 | 1,573 |
| 64-65 | 1,737 | 417 | 2,900 | 5,037 | 17,927 | 16,529 | 627 | 1,682 |
| 65-66 | 1,786 | 436 | 3,215 | 5,260 | 18,355 | 16,443 | 714 | 1,568 |
| 66-67 | 1,764 | 415 | 3,122 | 5,307 | 16,821 | 16,561 | 755 | 1,659 |
| 67-68 | 1,592 | 391 | 3,030 | 3,764 | 17,704 | 16,525 | 872 | 1,455 |
| 68-69 | 1,729 | 407 | 3,262 | 4,768 | 18,773 | 16,961 | 1,073 | 1,664 |
| 69-70 | 1,805 | 381 | 3,355 | 5,121 | 20,306 | 17,889 | 1,327 | 1,723 |
| 70-71 | 1,851 | 458 | 3,866 | 4,823 | 21,068 | 18,284 | 1,368 | 1,850 |
| 71-72 | 1,747 | 380 | 3,169 | 5,455 | 22,212 | 19,793 | 1,605 | 1,877 |
| 72-73 | 1,785 | 411 | 3,666 | 6,208 | 23,797 | 19,169 | 1,746 | 2,091 |
| Production Year | Concrete Roofing Tiles | Bricks and Blocks | Drainpipes, Salt Glazed, 6 in. and Below | Cement | ||
|---|---|---|---|---|---|---|
| Building Bricks, Clay | Concrete | |||||
| Bricks | Blocks | |||||
| *In millions of effective running feet. | ||||||
| No. (million) | tonnes(000) | |||||
| 1962-63 | 9.4 | 46.8 | 1.4 | 12.2 | 3.06 | 663.7 |
| 1963-64 | 9.8 | 50.2 | 0.8 | 16.0 | 5.82* | 766.2 |
| 1964-65 | 8.8 | 51.7 | 0.8 | 19.5 | 6.95* | 799.1 |
| 1965-66 | 5.9 | 52.4 | 0.4 | 25.5 | 6.89* | 854.6 |
| 1966-67 | 5.2 | 50.8 | 0.6 | 24.2 | 7.33* | 872.8 |
| 1967-68 | 4.8 | 42.5 | 0.1 | 23.5 | 6.93* | 784.9 |
| 1968-69 | 7.1 | 40.3 | 0.1 | 22.2 | 6.86* | 786.7 |
| 1969-70 | 6.2 | 36.1 | 0.2 | 28.5 | 7.72* | 804.9 |
| 1970-71 | 7.0 | 29.6 | .. | 26.5 | 6.63* | 821.3 |
| 1971-72 | 8.8 | 26.6 | .. | 31.8 | 6.88* | 837.8 |
| 1972-73 | .. | 27.7 | .. | 36.5 | 5.47* | 986.2 |
HOUSING FINANCE—The chief agency providing finance for housing in New Zealand is the Housing Corporation, a wholly Government-owned institution described in detail in Section 30b. For the year ended 31 March 1974 the Housing Corporation authorised loans valued at $95.6 million for new urban dwellings. Of the 13,225 housing loans authorised, 3,192 were authorised for the purchase of existing houses. Other important sources of housing finance are building societies, life assurance offices, and trustee savings banks.
The Family Benefits (Home Ownership) Act 1964 provides for payment in a lump sum of the social security family benefit, the capitalised benefit to be applied towards the provision of a family home, for essential alterations, or for repayment of encumbrances on a family home. The scheme became operative on 1 April 1959. Benefits in respect of any number of children may be capitalised provided the aggregate advance does not exceed $2,000. Family benefit advances totalling $124 million were authorised up to 31 March 1974 by the Housing Corporation to applicants holding eligibility certificates issued by the Social Security Commission.
The Housing Corporation operates two Housing Mortgage Guarantee Schemes in respect of housing loans on first mortgage granted by approved lenders, including trustee lenders, where the amount advanced does not exceed 90 percent of value. Under the first scheme, which is confined to approved institutional lenders, the corporation guarantees the amount lent above the institution's normal lending limit (usually two-thirds of value). The second scheme, for which any lender may qualify, provides for the guarantee of the full amount of the loan advanced. Fees are charged according to the amount guaranteed and the degree of risk. The loans must be for the purpose of building, buying, altering, or refinancing a house or flat.
Home lay-by accounts in the Post Office Savings Bank and trustee and private savings banks qualify for subsidy, and home ownership accounts qualify for subsidy and preferential loan finance (see section 29).
COST OF HOUSES AND SECTIONS—Freehold section and house costs in building proposals financed by the Corporation in the four areas of greatest housing demand in March 1973 and March 1974 were as follows:
| Centre | March | Sections | Houses | ||
|---|---|---|---|---|---|
| Number | Average Cost | Number | Average Contract Price | ||
| Auckland | 1,973 | 90 | 2,777 | 94 | 13,798 |
| 1,974 | 87 | 5,480 | 100 | 16,165 | |
| Hamilton | 1,973 | 23 | 2,515 | 26 | 12,217 |
| 1,974 | 27 | 3,500 | 27 | 14,966 | |
| Wellington | 1,973 | 77 | 3,689 | 89 | 15,361 |
| 1,974 | 52 | 4,905 | 45 | 18,095 | |
| Christchurch | 1,973 | 57 | 3,305 | 61 | 11,414 |
| 1,974 | 26 | 7,770 | 41 | 13,986 | |
| New Zealand | 1,973 | 475 | 2,874 | 474 | 12,609 |
| 1,974 | 372 | 5,450 | 377 | 15,230 | |
Statistics compiled by the Valuation Department from sales in the major urban areas for the 1973 year gave the average sale price of sections as $4,962, the average sale price of houses as $17,126, and the average sale price of owner-occupier fiats as $16,506. (Source: parliamentary paper G.26, 1974.)
URBAN HOUSE PROPERTY AND SECTION PRICE INDEX—This index is designed to measure changes in the average level of prices paid for house properties and sections sold during each half-year. Variations in the average age of properties transferred, as an indicator of the average quality of such properties, are eliminated in the index methodology in order to arrive at a valid index of price level changes.
It is a combined series for 17 centres. (Base: Calendar year 1973 (=1000).)
| Six Months Ended | House Properties | Sections |
|---|---|---|
| 1963—Jun | 429 | .. |
| Dec | 442 | .. |
| 1964—Jun | 449 | .. |
| Dec | 464 | 402 |
| 1965—Jun | 483 | 424 |
| Dec | 494 | 447 |
| 1966—Jun | 506 | 464 |
| Dec | 523 | 486 |
| 1967—Jun | 530 | 504 |
| Dec | 532 | 512 |
| 1968—Jun | 536 | 519 |
| Dec | 546 | 539 |
| 1969—Jun | 562 | 557 |
| Dec | 574 | 594 |
| 1970—Jun | 596 | 597 |
| Dec | 626 | 626 |
| 1971—Jun | 665 | 647 |
| Dec | 695 | 688 |
| 1972—Jun | 750 | 729 |
| Dec | 806 | 782 |
| 1973—Jun | 918 | 905 |
| Dec | 1,082 | 1,095 |
| 1974—Jun | 1,322 | 1,456 |
| Dec | 1,443 | 1,642 |
HOUSE MORTGAGES—Most of the housing advances made by institutions are in the form of table mortgages, being made initially for terms of usually over 20 years at the Housing Corporation, about 15 years at building societies and about 10 years at the private savings banks. The general experience of these institutions is that most house mortgages are redeemed in 7 to 12 years, seldom running the full term. Interest rates and the methods of calculating them vary from one institution to another. Some institutions prefer to lend on new houses, others cater for the purchase of older dwellings.
The value of house mortgages outstanding to major lending institutions is shown in the following table prepared by the Monetary and Economic Council.
| Lending Institutions | At 31 March 1965 | At 31 March 1972 |
|---|---|---|
*Average for previous calendar year. †Estimated. | ||
| $(m) | $(m) | |
| Housing Corporation | 426 | 581 |
| Building societies | 126*† | 228*† |
| Trustee banks | 57† | 134† |
| Life insurance companies | 126† | 202 |
| Private savings banks | ... | 19 |
| Trading banks | 22 | 21 |
| Total | 757 | 1,185 |
There are no accurate statistics available for the value of the stock of housing mortgages outstanding from non-institutional sources. Undoubtedly the value is considerable, and it may well exceed the total of mortgages outstanding from the savings banks and building societies.
ROLE OF LOCAL AUTHORITIES—The housing policy of the Government includes the provision of loans to local authorities through the Housing Corporation for pensioner, rural, and community housing, including urban renewal.
Housing of the Elderly—-Since 1951 Government has encouraged local authorities to meet the housing needs of elderly persons rather than provide such accommodation itself. To this end a scheme of subsidies was introduced, the balance of the cost being found by way of a loan to the local body with interest at 3 1/2 percent and a term up to 40 years on a table basis. The combination of subsidy and low interest rate is directed at keeping rents within reasonable levels—the current maxima are $5 and $6 for single and double units respectively.
The policy is administered by the Housing Corporation, which establishes the need for pensioner accommodation in a particular locality, provides technical services, and administers the loan and subsidy. The subsidy offered is up to 100 percent of the total cost of the units, including land and land development, less the amount of loan which remains at a maximum of $3,500 per unit.
The amount of subsidy approved in 1973-74 was $6,197,396 to provide housing for 950 persons. Since the inception of the policy in 1951, subsidy assistance has totalled $20,850,686 for the accommodation of 8,976 persons.
Rural Housing—The Rural Housing Act 1939 has as its object the provision of more houses on farm properties. Loans are made to county councils (and other local bodies within whose boundaries farmlands are situated) for readvancing to farmers for the erection of, or additions or alterations to, dwellings. The Housing Corporation is responsible for the supervision and general administration of the Act. Persons receiving loans (700 in 1973-74) are principally owners of economic farms.
Community Housing—The Housing Corporation has authority to grant loans for general housing purposes, i.e., for the benefit of the community in general. Proposals must involve a definite scheme for the erection of not less than three houses. The substantial proportion of assistance provided has been in the metropolitan areas (e.g., in Wellington the city council's building programme has been largely financed from this source). The emphasis is on moderate-cost accommodation.
Urban renewal is also financed by the Housing Corporation. The area concerned must first be declared a reclamation area; any loss on land purchase and demolition is eligible for a Government subsidy. The Freeman's Bay scheme in Auckland and the Nairn Street project in Wellington are examples.
Since 1960 over $19.2 million has been authorised for community housing and urban renewal schemes.
Provision has been made by the Government for an annual amount of $7 million for local authority urban renewal projects and residential land purchase and development. This recognises the need to curb urban sprawl and to bring more people into inner city areas, close to employment, health services, and other amenities.
Borough councils are authorised under the Municipal Corporations Act to provide loans for housing purposes, to subdivide for such purposes any land vested in a council and not held by it in trust for any particular purpose other than housing; and to sell or lease allotments for housing purposes. Local authorities may also apply to the Local Authorities Loans Board for blanket authorities for the purchase of land for subdivision for housing purposes. Local authorities are encouraged to play a prominent part in the housing of their citizens.
MAORI HOUSING—In addition to the facilities of the Housing Corporation, financial assistance towards the building of houses, including the purchase of building sites, additions, repairs to existing dwellings, and for the purchase of houses, is available to Maoris and other Polynesians under the Maori Housing Act 1935.
The Maori Affairs Department also arranges for the construction of the houses in many cases and provides a free plan service. Finance through the department up to set loan limits, rebated interest rate, and capitalisation of family benefits, is similar to loans granted by the Housing Corporation. Where the applicant does not qualify for special interest concessions the finance is made available at an interest rate of 5 5/8 percent.
All applications for State tenancies are dealt with by the Housing Corporation, although assistance with applications is often given by the department's staff.
From the inception of the scheme to 31 March 1974, the department has provided finance to enable 16,500 families to build new houses and 894 to purchase existing houses. Also, 8,173 advances have been made for additions and repairs to houses and other buildings.
The Government has also provided accommodation for single young Maori people in urban areas. It has built rental flats for girls in Auckland, Wellington, Christchurch, and Whangarei. It has provided hostels for boys at Auckland and Christchurch and by the provision of subsidy has encouraged church organisations to establish hostels in a number of cities. Through the agency of the Maori Trustee, hostel and flat accommodation for both boys and girls has been provided in many of the main centres. In these ways the accommodation needs of over 1,000 young Maori people are now being met, many of whom are enrolled on the department's vocational training courses operated in conjunction with the technical institutes.
Flats for elderly Maoris have also been provided in semi-rural areas in close association with local marae.
WELFARE ORGANISATIONS: Hostels for Young People—Since 1951, religious and welfare organisations have been assisted to establish hostels for young people by subsidies of establishment costs. As from November 1973, the subsidy has been 80 percent, with a limit of $5,000 per young person accommodated. The purpose is to assist young men and women who are living away from their homes in order to study or undertake employment and find it difficult to obtain suitable living accommodation. Subsidies of 50 percent may also be granted for authorised improvements to existing hostels, and 75 percent for fire protection work as required by the local authority.
Since the policy commenced, subsidies totalling $1,910,927 had been approved up to 31 March 1974, to assist in providing hostel accommodation for 1,471 young people, and for upgrading purposes.
Government also helps with substantial subsidies for university halls of residence established by religious and welfare agencies. Administration is handled by the University Grants Committee.
STATE HOUSE CONSTRUCTION—State rental houses and flats have been built since March 1937. These are allocated to tenants on the basis of income and need. Since 1950 there has been an income limit on applicants for tenancies for these dwellings. In 1973 the income limit was removed and a points system of priorities substituted.
The Housing Corporation acquires and develops land to provide sites for houses and flats and arranges contracts for their construction. These activities are covered by the Housing Act 1955.
The totals of rental units completed and handed over for occupation in the latest 11 years are shown in the following table. Up to 31 March 1974 there were 75,768 units completed.
| Year | Rental Units |
|---|---|
| 1963-64 | 1,562 |
| 1964-65 | 1,622 |
| 1965-66 | 1,334 |
| 1966-67 | 1,469 |
| 1967-68 | 1,489 |
| 1968-69 | 1,534 |
| 1969-70 | 1,241 |
| 1970-71 | 1,194 |
| 1971-72 | 661 |
| 1972-73 | 765 |
| 1973-74 | 650 |
Planning of New Urban Areas—Such has been the demand for State development in Auckland and Wellington that it has been necessary to acquire large areas of land in these metropolitan areas, which, when developed over a number of years, has resulted in the creation of new towns. These have been comprehensively planned, and developed sites have been made available for central commercial, industrial, and administrative areas as well as civic and neighbourhood amenities. At present the three existing instances of development at this scale are Porirua City, near Wellington, and Otara and Mangere townships within Manukau City, south of Auckland.
In accordance with continuing Government policy, the planning of these towns and State development generally has recognised the need to conserve land and gain as much return from the installation of municipal services as possible. For these reasons, particular attention has been paid to subdivisional pattern and, where appropriate, medium-density housing to an acceptable level has been introduced. In addition, a measure of building of medium and high-density residential accommodation has been undertaken in inner city areas in Auckland and Wellington.
Further substantial areas of land have been acquired in the Albany Basin in Auckland for future development. A planning exercise, aimed at achieving the integration of State with private housing in the Albany area and the creation of a high standard of urban environment is currently being undertaken by local authority and departmental officers. Commencement of land development is timed for late 1974 or 1975. A large-scale development is also planned for Rolleston, south of Christchurch.
Recognising the need for social diversification in State developed areas it is now policy to make 50 percent of the sections available for sale to the public for private housing.
State Services Housing—State Services houses are houses for Government departments and the armed forces. The total number of such houses erected by the Housing Corporation to 31 March 1974 was 13,906. This includes houses built at the sites of major construction jobs, such as electric power schemes.
Finance—The cost of the State housing programme, including the acquisition and development of land, is financed from the Housing Construction vote in the Works and Trading Account, i.e., out of national development loan moneys.
The following table shows the annual expenditure from the Housing Construction vote.
| Year Ended 31 March | State Housing | State Services | Land Purchase and Development. | Administration and General | Total |
|---|---|---|---|---|---|
| $(000) | |||||
| 1964 | 10,764 | 72 | 3,960 | 1,840 | 16,636 |
| 1965 | 10,102 | 122 | 3,352 | 1,886 | 15,462 |
| 1966 | 9,394 | 136 | 3,292 | 1,864 | 14,686 |
| 1967 | 11,234 | 124 | 2,784 | 1,898 | 16,040 |
| 1968 | 10,865 | 123 | 2,769 | 1,922 | 15,680 |
| 1969 | 9,849 | 89 | 3,292 | 1,890 | 15,120 |
| 1970 | 10,276 | 134 | 3,264 | 2,036 | 15,710 |
| 1971 | 8,803 | - | 2,395 | 2,104 | 13,302 |
| 1972 | 6,551 | - | 2,435 | 1,998 | 10,984 |
| 1973 | 7,903 | - | 2,527 | 2,495 | 12,925 |
| 1974 | 8,999 | - | 9,028 | 2,683 | 20,710 |
The next table shows the annual total expenditure by the Housing Corporation in house construction in the latest 6 years.
| Year | Vote, “Housing Construction” | On Behalf Of Other Departments* | Total | ||
|---|---|---|---|---|---|
| Construction Land Purchase and Development, Administration | On Behalf of Other Departments (Charged Direct) | Total | |||
| *Expenditure on behalf of other departments charged meantime to vote, “Housing Construction”. | |||||
| $(000) | |||||
| 1968-69 | 15,031 | 89 | 15,120 | 1,807 | 16,928 |
| 1969-70 | 15,576 | 134 | 15,710 | 3,592 | 19,302 |
| 1970-71 | 13,302 | - | 13,302 | 3,899 | 17,201 |
| 1971-72 | 10,984 | - | 10,984 | 2,964 | 13,948 |
| 1972-73 | 12,925 | - | 12,925 | 4,256 | 17,181 |
| 1973-74 | 20,710 | - | 20,710 | 4,724 | 25,434 |
Room Content of Units (State Houses and State Services Housing)—The types of units according to number of bedrooms in units built during the 2 latest years, also the totals from 1937 to date, are shown in the following table.
| Number of Bedrooms | 1972-73 | 1973-74 | Totals to Date | |||
|---|---|---|---|---|---|---|
| Number of Units | Percentage of Total | Number of Units | Percentage of Total | Number of Units | Percentage of Total | |
| One bedroom or bed-sitting room | 43 | 3.8 | 57 | 5.8 | 4,947 | 5.5 |
| Two bedrooms | 103 | 9.0 | 64 | 6.5 | 25,597 | 28.5 |
| Three bedrooms | 784 | 68.7 | 726 | 73.2 | 51,722 | 57.7 |
| Four or more bedrooms | 211 | 18.5 | 144 | 14.5 | 7,408 | 8.3 |
| Totals | 1,141 | 100.0 | 991 | 100.0 | 89,674 | 100.0 |
Sheathing Materials Used (Corporation Houses and State Services Housing)—The sheathing materials used in the number of units built in the 2 latest years, also the totals from 1937 to date, are shown in the following table.
| Materials | 1972-73 | 1973-74 | Totals to Date |
|---|---|---|---|
| Weatherboards | 272 | 245 | 49,901 |
| Brick veneer | 212 | 175 | 15,435 |
| Concrete block veneer | 277 | 273 | 6,720 |
| Other sheathing including cement products | 380 | 298 | 17,618 |
| Totals | 1,141 | 991 | 89,674 |
Land Acquisition and Development—During 1973-74 a total of 307 developed unit sites were purchased as a charge against the Housing Construction vote, also 3,255 acres of undeveloped land estimated ultimately to yield 8,803 unit sites. In the same period, 1,036 fully-serviced house unit sites were developed on land already held. Land acquisition was stepped up in 1973 and 1974.
Corporation Rental Housing Tender Prices—The following table shows typical tender prices being accepted in the four main centres at the end of the last 11 financial years for similar types of three-bedroom State rental houses of equivalent floor space. In each case the house is a typical single unit on a flat section, built in weatherboards with a tiled roof. The price includes drainage, fencing, paths, toolshed, revolving clothes line, and letterbox. The cost of the section is not included. The figures in parentheses represent the cost per square foot.
| Year | Auckland | Wellington | Christchurch | Dunedin | ||||
|---|---|---|---|---|---|---|---|---|
| *The 1973-74 prices include the cost of carports not built in the previous years. | ||||||||
| $ | $ | $ | $ | $ | $ | $ | $ | |
| 1963-64 | 6,306 | (6.01) | 6,330 | (6.03) | 5,686 | (5.42) | 6,234 | (5.94) |
| 1964-65 | 6,726 | (6.41) | 6,888 | (6.56) | 6,104 | (5.81) | 6,632 | (6.32) |
| 1965-66 | 6,942 | (6.61) | 7,178 | (6.83) | 6,434 | (6.12) | 6,758 | (6.42) |
| 1966-67 | 6,894 | (6.58) | 7,372 | (7.03) | 6,488 | (6.19) | 6,990 | (6.67) |
| 1967-68 | 6,366 | (6.06) | 6,830 | (6.50) | 6,273 | (5.97) | 6,586 | (6.27) |
| 1968-69 | 6,753 | (6.43) | 7,264 | (6.92) | 6,669 | (6.35) | 7,124 | (6.78) |
| 1969-70 | 7,184 | (6.84) | 7,675 | (7.30) | 6,759 | (6.43) | 7,661 | (7.29) |
| 1970-71 | 8,304 | (7.90) | 8,603 | (8.19) | 7,566 | (7.20) | 8,836 | (8.41) |
| 1971-72 | 10,021 | (9.54) | 10,613 | (10.11) | 8,698 | (8.28) | 10,236 | (9.74) |
| 1972-73 | 11,185 | (10.65) | 12,000 | (11.42) | 10,530 | (10.03) | 11,825 | (11.26) |
| 1973-74* | 14,146 | (13.47) | 15,250 | (14.52) | 14,057 | (13.38) | 15,091 | (14.38) |
JOINT FAMILY HOMES—The Joint Family Homes Act 1964 makes provision for a form of ownership by which a family home will belong not to the husband and wife separately but to both of them so that it may pass to the survivor on the death of one of them. It is possible to settle flats as family homes. There are substantial benefits resulting from settlement under the Act. In the event of claims by creditors or an assignee in bankruptcy, the property is protected up to a sum of $10,000. Further, on the death of one of the spouses there is an exemption from estate duty. Settlements under the Act are exempt from gift and stamp duty.
Under the Family Benefits (Home Ownership) Act 1964 there is a condition attaching to capitalisation of the benefits that the home, if not in the sole name of the wife be settled as a joint family home.
Joint family homes under the Joint Family Homes Act registered for the last 11 years are shown in the following table.
| Year Ended 31 March | Homes Settled |
|---|---|
| 1964 | 13,056 |
| 1965 | 13,224 |
| 1966 | 14,149 |
| 1967 | 12,738 |
| 1968 | 13,278 |
| 1969 | 14,040 |
| 1970 | 14,545 |
| 1971 | 16,118 |
| 1972 | 15,232 |
| 1973 | 16,925 |
| 1974 | 20,710 |
CENSUS INFORMATION: Nature of Dwelling—The following table shows the nature of dwellings at the censuses at 1966 and 1971.
| Nature of Dwelling | Numbers | Percentage of Total Inhabited Dwellings | ||
|---|---|---|---|---|
| 1966 | 1971 | 1966 | 1971 | |
| Inhabited dwellings— | ||||
| Permanent private dwellings— | ||||
| Private house | 626,580 | 682,003 | 86.5 | 84.2x |
| Private house, partly sublet | 1,162 | 5,234 | 0.2 | 0.6 |
| Flat | 74,999 | 105,459 | 10.4 | 13.0 |
| Dwellings combined with shop, rooms attached to offices, etc. | 5,820 | 4,736 | 0.8 | 0.6 |
| Bach | 7,484 | 4,173 | 1.0 | 0.5 |
| Other | 59 | 81 | .. | .. |
| Totals | 716,104 | 801,686 | 98.8x | 9.0 |
| Mobile and temporary dwellings— | ||||
| Mobile residence (including caravans) | 1,035 | 994 | 0.1 | 0.1 |
| Other (including tents) | 134 | 75 | - | - |
| Totals | 1,169 | 1,069 | 0.2x | 0.1 |
| Non-private dwellings— | ||||
| Hotel, boardinghouse, apartment house, hostel | 5,317 | 3,976 | 0.7 | 0.5 |
| Public or private hospital | 533 | 740 | 0.1 | 0.1 |
| Educational institution | 209 | 384 | x | |
| Other | 1,112 | 1,982 | 0.2 | 0.2 |
| Totals | 7,171 | 7,082 | 1.0 | 0.9 |
| Grand totals, inhabited dwellings | 724,444 | 809,837x | 100.0 | 100.0 |
| Uninhabited dwellings— | ||||
| Occupants temporarily away | 14,979 | 18,116 | .. | .. |
| Untenanted dwelling | 26,272 | 26,184 | .. | .. |
| Holiday residence | 29,534 | 32,446 | .. | .. |
| Totals | 70,785 | 76,746 | .. | .. |
| Building— | ||||
| Dwellings in course of erection | 10,667 | 9,182 | .. | .. |
In 1971 the average number of occupants per permanent private dwelling was 3.38, compared with 3.52, 5 years earlier.
Unoccupied dwellings are restricted to buildings intended for human habitation, e.g., houses, flats, cottages, etc., and the category omits unoccupied caravans, tents, etc.; it also excludes unoccupied dwellings which are both deserted and dilapidated.
Rents—The average weekly rent for unfurnished five-roomed dwellings is given in the following table for selected cities with the largest numbers of rental dwellings in 1971. State rental houses are included in the figures and would have a moderating effect on the rents. The average weekly rent for the 47,305 unfurnished five-roomed dwellings in New Zealand was $8.43.
| City | Number of Five-roomed Dwellings Let | Average Weekly Rent |
|---|---|---|
| Auckland | 2,217 | 10.77 |
| Manukau | 1,548 | 9.01 |
| Hamilton | 1,358 | 9.23 |
| Gisborne | 495 | 8.42 |
| Napier | 672 | 8.79 |
| Hastings | 544 | 8.56 |
| New Plymouth | 601 | 9.06 |
| Wanganui | 721 | 8.01 |
| Palmerston North | 1,058 | 9.14 |
| Lower Hutt | 1,523 | 9.65 |
| Porirua | 1,929 | 8.50 |
| Wellington | 1,256 | 13.41 |
| Christchurch | 2,459x | 9.73 |
| Timaru | 505 | 8.68 |
| Dunedin | 1,254 | 8.49 |
| Invercargill | 737 | 10.03 |
The numbers and average weekly rents according to the number of rooms in all rented dwellings and also in flats separately are shown in the following table. (These are also from the 1971 Census.)
| Nature of Dwelling | Number of Rooms | Total, Including Other | |||||
|---|---|---|---|---|---|---|---|
| 1 | 2 | 3 | 4 | 5 | 6 | ||
| *Including not specified furnishing. | |||||||
| All Dwellings (including flats) | Number | ||||||
| Furnished | 1,055 | 5,490 | 8,259 | 7,538 | 5,775 | 2,238 | 32,328 |
| Unfurnished | 2,978 | 10,399 | 23,890 | 38,809 | 47,305 | 12,742 | 143,078 |
| Partly furnished | 742 | 3,613 | 6,025 | 5,560 | 4,289 | 1,791 | 23,443 |
| All rented dwellings* | 4,976 | 20,222 | 39,475 | 53,885 | 59,569 | 17,361 | 206,465 |
| Weekly Rent | |||||||
| Furnished | 10.12 | 12.39 | 13.67 | 14.21 | 14.01 | 17.56 | 14.03 |
| Unfurnished | 5.03 | 8.62 | 10.70 | 9.54 | 8.43 | 9.36 | 9.22 |
| Partly furnished | 8.63 | 11.51 | 12.43 | 13.13 | 12.98 | 14.36 | 12.71 |
| All rented dwellings | 6.67 | 10.15 | 11.54 | 10.53 | 9.29 | 10.93 | 10.35 |
| Nature of Dwelling | Number of Rooms | Total, Including Other | |||||
|---|---|---|---|---|---|---|---|
| 1 | 2 | 3 | 4 | 5 | 6 | ||
| *Including not specified furnishing. | |||||||
| Flats | Number | ||||||
| Furnished | 837 | 4,849 | 6,391 | 4,112 | 1,458 | 586 | 18,870 |
| Unfurnished | 2,773 | 8,633 | 16,383 | 13,228 | 3,392 | 616 | 46,033 |
| Partly furnished | 582 | 3,090 | 4,658 | 2,925 | 773 | 237 | 12,592 |
| All rented flats* | 4,366 | 17,118 | 28,083 | 20,691 | 5,724 | 1,468 | 79,521 |
| Weekly Rent | |||||||
| Furnished | 10.90 | 12.79 | 14.65 | 16.77 | 19.21 | 22.08 | 15.21 |
| Unfurnished | 5.00 | 8.96 | 12.02 | 12.49 | 11.29 | 12.85 | 11.09 |
| Partly furnished | 9.06 | 11.94 | 13.03 | 14.40 | 15.45 | 17.36 | 13.15 |
| All rented flats* | 6.70 | 10.57 | 12.77 | 13.60 | 13.89 | 17.33 | 12.37 |
Rents per week in 1971 for unfurnished dwellings are shown in the following table. State rental houses are included; the pattern of their rents is indicated by the statistics for Porirua Basin.
| Area | Under $10 | $10 and Under $12.50 | $12.50 and Under $15 | $15 and Under $17.50 | $17.50 and Under $20 | $20 and Over | Total Including Not Specified Rent |
|---|---|---|---|---|---|---|---|
| Urban Area | |||||||
| Whangarei | 797 | 394 | 290 | 95 | 8 | 14 | 1,611 |
| Northern Auckland | 1,571 | 644 | 507 | 891 | 222 | 288 | 4,151 |
| Western Auckland | 1,085x | 373x | 428x | 475x | 68x | 67 | 2,514x |
| Central Auckland | 9,659x | 2,843x | 2,707x | 4,136x | 1,014x | 1,363x | 21,891x |
| Southern Auckland | 3,653 | 757 | 1,083 | 1,300 | 197 | 237 | 7,284 |
| Hamilton | 2,228 | 610 | 788 | 473 | 68 | 82 | 4,300 |
| Tauranga | 687 | 382 | 322 | 261 | 48 | 49 | 1,763 |
| Rotorua | 787 | 326 | 422 | 282 | 36 | 26 | 1,894 |
| Gisborne | 1,059 | 291 | 112 | 64 | 8 | 12 | 1,563 |
| Napier | 1,440 | 397 | 220 | 177 | 21 | 26 | 2,290 |
| Hastings | 1,323 | 517 | 303 | 115 | 12 | 18 | 2,317 |
| New Plymouth | 1,144 | 376 | 142 | 173 | 65 | 48 | 1,956 |
| Wanganui | 1,487 | 379 | 68 | 43 | 3 | 12 | 2,001 |
| Palmerston North | 2,209 | 603 | 394 | 324 | 55 | 57 | 3,678 |
| Upper Hutt Valley | 452 | 148 | 215 | 472 | 94 | 76 | 1,473 |
| Lower Hutt Valley | 3,668 | 936 | 339 | 461 | 214 | 371 | 6,033 |
| Porirua Basin | 3,413 | 682 | 194 | 126 | 59 | 107 | 4,600 |
| Wellington | 2,384 | 1,148 | 822 | 1,188 | 634 | 1,193 | 7,407 |
| Masterton | 639 | 238 | 75 | 58 | 5 | 9 | 1,028 |
| Nelson | 687 | 413 | 171 | 55 | 6 | 13 | 1,358 |
| Christchurch | 7,604 | 2,817 | 1,753 | 1,234 | 319 | 287 | 14,088 |
| Timaru | 1,052 | 350 | 77 | 34 | 12 | 33 | 1,565 |
| Dunedin | 3,778 | 851 | 341 | 073 | 61 | 75 | 5,425 |
| Invercargill | 972 | 496 | 209 | 182 | 74 | 55 | 1,996 |
| Totals of 24 Urban Areas | 53,778x | 16,966x | 11,982x | 12,892x | 3,303x | 4,518x | 104,186x |
| Percentages of total | 51.6 | 16.3 | 11.5 | 12.4 | 3.2 | 4.3 | 100.0 |
| New Zealand totals | 84,433x | 22,243x | 13,277x | 13,608x | 3,439x | 4,733x | 143,078x |
| Percentages of total | 59.0 | 15.5 | 9.3 | 9.5 | 2.4 | 3.3 | 100.0 |
Tenure of Dwelling—The following table classifies the inhabited permanent private dwellings according to tenure.
| Tenure | 1966 | 1971 | ||
|---|---|---|---|---|
| Permanent Private Dwellings | Percent of Total Specified | Permanent Private Dwellings | Percent of Total Specified | |
| Renting or leasing | 177,429 | 24.9 | 206,465 | 25.9 |
| Free dwelling provided with job | 35,387 | 5.0 | 34,683 | 4.4 |
| Loaned without payment | 7,919 | 1.1 | 13,171 | 1.7 |
| Owned with table mortgage | 213,807 | 30.0 | 247,582 | 31.1 |
| Owned with flat mortgage | 80,885 | 11.3 | 82,151 | 10.3 |
| Unspecified mortgage | 226 | - | ... | ... |
| Owned without mortgage | 197,085 | 27.7 | 212,374 | 26.7 |
| Not specified | 3,366 | ... | 5,260 | ... |
| Totals | 716,104 | 100.0 | 801.686 | 100.0 |
In the following table the tenure of inhabited permanent private dwellings in 1971 is related to the occupational status of the head of the household.
| Occupational Status of Head of Household | Tenure | Total Dwellings† | |||
|---|---|---|---|---|---|
| Renting or Leasing | Rent Free* | Owned | |||
| With Mortgage | Without Mortgage | ||||
*Includes free dwelling with job, and dwellings loaned without payment. †Includes dwellings where tenure unspecified. | |||||
| Employer | 5,074 | 3,229 | 32,417 | 15,448 | 56,686 |
| Worker on own account | 6,385 | 4,699 | 30,095 | 15,549 | 57,231 |
| Wage or salary earner | 154,716 | 32,246 | 236,535 | 75,348 | 501,009 |
| Unemployed | 1,504 | 169 | 903 | 679 | 3,291 |
| Assisting relative | 7 | 13 | 13 | 15 | 48 |
| Not specified | 302 | 39 | 138 | 73 | 648 |
| Totals, actively engaged | 167,988 | 40,395 | 300,101 | 107,112 | 618,913 |
| Retired | 11,954 | 3,180 | 12,314 | 60,768 | 89,169 |
| Full-time student | 3,075 | 130 | 347 | 158 | 3,731 |
| Housewife | 21,979 | 3,918 | 15,942 | 42,711 | 85,477 |
| Other | 1,469 | 231 | 1,029 | 1,625 | 4,396 |
| Totals, not actively engaged | 38,477 | 7,459 | 29,632 | 105,262 | 182,773 |
| Total heads | 206,465 | 47,854 | 329,733 | 212,374 | 801,686 |
In the following table the tenure of the preceding dwellings in 1971 is related to the income level of the head of the household.
| Income Group of Head of Household | Total Households | Tenure | |||
|---|---|---|---|---|---|
| Renting or Leasing | Rent Free* | Owned | |||
| With Mortgage | Without Mortgage | ||||
*Includes free dwelling with job, and dwellings loaned without payment. †Includes cases where income of head of household was not specified. | |||||
| $ | Percentage of Households | ||||
| Under 600 | 127,509 | 25.5 | 4.5 | 17.4 | 52.7x |
| 600-1,399 | 46,863 | 26.5 | 6.5 | 21.3 | 45.7 |
| 1,400-2,199 | 75,635 | 31.9 | 9.8 | 27.4 | 30.9 |
| 2,200-2,999 | 161,766 | 32.8 | 7.9 | 38.7a | 20.5 |
| 3,000-3,999 | 179,883 | 26.6 | 5.1 | 52.4 | 15.9 |
| 4,000-7,999 | 170,618 | 18.8 | 4.8 | 59.3 | 17.1 |
| 8,000 and over | 30,204 | 8.0 | 4.4 | 59.0 | 28.6 |
| Totals† | 801,686 | 25.9 | 6.0 | 41.4 | 26.7 |
Amenities of Dwellings—The following tables present the various amenities, as at the 1971 Census, which were used by the occupants of permanent private dwellings.
| Amenity | Households Not Shared | Percentage Not Shared | Households Shared | Percentage Shared |
|---|---|---|---|---|
| Flush toilet | 776,230 | 96.9 | 2,411 | 0.3 |
| Television set | 678,414 | 84.7 | 383 | - |
| Telephone | 685,278 | 85.6 | 2,028 | 0.3 |
| Washing machine | 725,618 | 90.6 | 8,070 | 1.0 |
| Refrigerator | 771,979 | 96.4 | 560 | 0.1 |
| Deep freezer | 345,923 | 43.2 | 227 | - |
| Motor mower | 518,900 | 64.8 | 2,250 | 0.3 |
| Clothes dryer | 215,113 | 26.9 | 1,180 | 0.1 |
| Means of Cooking | Households | Percentage |
|---|---|---|
| Electric | 694,068 | 86.6 |
| Gas, including rock gas | 66,662 | 8.3 |
| Wood, coke, coal | 38,624 | 4.8 |
| Other (including combination) | 1,122 | 0.1x |
| No means | 253 | .. |
| Not specified | 957 | 0.1 |
| Totals | 801,686 | 100.0 |
| Principal Means of Heating | Households | Percentage |
| Electricity | 338,142 | 42.2 |
| Oil | 44,548 | 5.6 |
| Wood, coke, coal | 401,065 | 50.0 |
| Gas, including rock gas | 11,421 | 1.4 |
| Other | 781 | 0.1 |
| Not specified | 5,729 | 0.7 |
| Totals | 801,686 | 100.0 |
| Type of Hot Water Service | Households | Percentage |
|---|---|---|
| Electric | 717,202 | 89.5 |
| Gas | 21,702 | 2.7 |
| Other | 55,853x | 7.0 |
| No hot water service | 4,000 | 0.5 |
| Not specified | 2,929 | 0.4x |
| Totals | 801,686 | 100.0 |
| Type of Water Supply | Households | Percentage |
| Piped public or private supply | 742,961 | 92.7 |
| Rainwater tanks | 58,237x | 7.3 |
| No water laid on | 417x | 0.1x |
| Not specified | 71 | - |
| Totals 801,686 | 100.0 |
New questions asked at the 1971 Census revealed that 79 percent of households (634,233x) had motorcars available for use (24 percent (192,774) with two or more cars), while nearly 10 percent (77,529) owned or had an interest in pleasure boats, and 4 percent (35,581) owned or had an interest in a holiday residence.
In the following table the possession of selected household amenities is related to the income of the head of the household in 1971.
| Income of Head of Household | Total Households | Amenities Not Shared with Other Households | ||||||
|---|---|---|---|---|---|---|---|---|
| Refrigerator | Clothes Dryer | Telephone | Washing Machine | Deep Freeze | Television | Motor Mower | ||
| *Including cases where income of the head of the household was no specified. | ||||||||
| Percentages | ||||||||
| Under 600 | 127,509 | 91.6 | 11.5 | 78.4 | 78.0 | 22.3 | 76.3 | 50.2 |
| 600-1,399 | 46,863 | 94.1 | 15.7 | 83.3 | 84.1 | 30.3 | 76.1 | 54.6 |
| 1,400-2,199 | 75,635 | 94.7 | 19.5 | 80.8 | 87.2 | 36.4 | 78.8 | 58.5 |
| 2,200-2,999 | 161,766 | 96.3 | 23.9 | 81.3 | 91.4 | 41.5 | 83.9 | 63.7 |
| 3,000-3,999 | 179,883 | 98.0 | 30.5 | 87.3 | 95.0 | 48.6 | 88.2 | 69.4 |
| 4,000-7,999 | 170,618 | 98.9 | 39.2 | 93.9 | 96.8 | 56.9 | 91.5 | 74.9 |
| 8,000 and over | 30,204 | 99.4 | 54.2 | 98.5 | 97.8 | 70.2 | 93.9 | 81.6 |
| Totals* | 801,686 | 96.3 | 26.8 | 85.5 | 90.5 | 43.1 | 84.6 | 64.7 |
Materials of Outer Walls—The following table gives an analysis showing the materials of which the outer walls of inhabited permanent private dwellings were constructed. Flats are included individually and not as blocks. Therefore part of the increase, for instance, in brick and concrete construction, is accounted for by a lesser number of buildings than indicated by the increase in number of dwelling units.
| Number of Dwellings | Material of Outer Walls | |||
|---|---|---|---|---|
| 1956 | 1961 | 1966 | 1971 | |
| Wood | 411,370 | 431,318 | 455,213 | 454,266 |
| Stone | 1,121 | 2,456 | 8,910 | 1,540 |
| Concrete, including concrete blocks | 17,869 | 22,510 | 28,347 | 32,832 |
| Concrete and wood | 1,087 | 2,039 | 3,093 | 7,621 |
| Brick, including hollow brick | 47,420 | 65,171 | 94,100 | 123,766 |
| Brick and wood | 3,332 | 6,157 | 8,818 | 15,438 |
| Brick and other material | 3,455x | 7,065x | 6,297x | 16,670 |
| Wood and iron | 3,721 | 3,314 | 2,507 | 6,651 |
| Iron | 3,862 | 3,083 | 2,554 | 2,711 |
| Proprietary wallboards of asbestos type | 28,862x | 50,955x | 56,025x | 47,976 |
| Roughcast | 28,445x | 25,958x | 37,283x | 66,784 |
| Other materials | 5,135x | 12,903 | 11,172x | 24,553 |
| Not specified | 7,373 | 778 | 1,785 | 878 |
| Totals | 563,052 | 633,707 | 716,104x | 801,686 |
Houses and flats with outer walls constructed of concrete, brick, and roughcast increased both in number and as a percentage of the total between 1966 and 1971, thus continuing the post-war trend.
Materials for Roofs—Most dwellings (70.8 percent) in 1971 were roofed with sheet or corrugated iron with tiles the next popular choice (23.0 percent).
Numbers of Rooms and Occupants—The following table classifies inhabited permanent private dwellings in 1971 according to the number of rooms and the number of occupants.
| Number of Rooms | Number of Occupants | |||||||||
|---|---|---|---|---|---|---|---|---|---|---|
| 1 | 2 | 3 | 4 | 5 | 6 | 7 | 8 and Over | Total Dwellings | Average Per Dwelling | |
| 1 | 5,080 | 756 | 179 | 80 | 28 | 8 | 8 | 2 | 6,141 | 1.26 |
| 2 | 13,447 | 9,044 | 2,141 | 922 | 331 | 147 | 61 | 49 | 26,142 | 1.72 |
| 3 | 20,410 | 25,068 | 10,112 | 5,923 | 2,870 | 1,580 | 861 | 991 | 67,815 | 2.41 |
| 4 | 31,294 | 56,646 | 27,236 | 20,485 | 10,282 | 4,820 | 2,223 | 2,519 | 155,505 | 2.75 |
| 5 | 25,947 | 72,662 | 54,503 | 68,442 | 48,141 | 23,837 | 9,252 | 7,256 | 310,040 | 3.62 |
| 6 | 9,821 | 29,803 | 23,688 | 28,739 | 23,143 | 14,093 | 7,028 | 6,686 | 143,001 | 3.95 |
| 7 | 2,520 | 8,404 | 7,619 | 9,635 | 8,742 | 5,647 | 2,747 | 2,453 | 47,767 | 4.18 |
| 8 | 779 | 2,817 | 2,623 | 3,456 | 3,255 | 2,251 | 1,099 | 1,035 | 17,315 | 4.32 |
| 9 | 272 | 927 | 965 | 1,175 | 1,153 | 791 | 474 | 415 | 6,172 | 4.42 |
| 10 | 136 | 433 | 395 | 475 | 435 | 358 | 195 | 186 | 2,613 | 4.39 |
| 11 and over | 96 | 316 | 292 | 300 | 307 | 228 | 136 | 140 | 1,815 | 4.40 |
| Not specified | 3,487 | 4,678 | 2,515 | 2,324 | 1,767 | 1,092 | 646 | 851 | 17,360 | 3.30 |
| Totals | 113,289 | 211,554 | 132,268 | 141,956 | 100,454 | 54,852 | 24,730 | 22,583 | 801,686 | 3.38 |
Of the total number of dwellings (where number of rooms was specified) 608,546, or 77.6 percent had either 4, 5 or 6 rooms and of these 382,204 were occupied by either 2, 3 or 4 persons.
The number of dwellings with only 1 occupant increased from 89,384 in 1966 to 113,289 in 1971 a rise of 26.7 percent; those living alone in dwellings of 3 rooms rose from 14,828 to 20,410; those in 4 rooms from 24,996 to 31,294; and those in 5 rooms from 21,399 to 25,947.
TENANCY—Under the Rent Appeal Act 1973 administered by the Department of Labour, rent appeal boards have been appointed to determine on application by either a landlord or tenant the equitable rent for dwellinghouses. The amounts to be paid for rent in advance and as a bond are limited by the Act. The Tenancy Act 1955 governs rents and conditions of possession of certain private tenancies in existence before 18 November 1961. All private tenancies since that date and all business premises without exception are no longer governed by the Act. Where the Act applies, a landlord or tenant may apply to a rents officer or the Magistrate's Court to fix a fair rent, effect certain repairs, prevent oppressive conduct or have the tenancy freed from controls under the Act. It is estimated that 8,800 tenancies are protected by this Act.
Table of Contents
SOURCES OF ENERGY—The main source of the energy we now use is the sun. Radiation energy (sunlight) falling on the earth is absorbed by it and mostly re-radiated out into space. The fraction of this energy retained is absorbed by vegetation and converted by photosynthesis into chemical energy which is essential for the life process. Most of the residues from the life process are oxidised by the atmosphere and lose their accessible chemical energy storage ability but some, by movement of the earth's crust causing the exclusion of oxygen and the passage of millions of years, resulted in the formation of the hydrocarbon fuels of coal, oil, and natural gas. Such chemical fuels are clearly finite in extent and the marginal cost of finding and extracting them increases as the supplies are less readily available. The existence of the hydrocarbon fuels has been known to man for thousands of years but it is only in the last hundred years or so that the technology has become available to extract and use the energy usefully and cheaply, particularly in the internal combustion engine, thus stimulating the demand for energy.
The second source we identify as originating in the “mechanics” of the world—tide, wind, and water power. Each of these sources requires a rather restrictive set of physical conditions for extracting useful amounts of energy and is highly capital intensive, so that although operating costs are low, the resource requirements for construction are high and the physical limitations of siting, etc., limit the amount of energy we can expect from this source.
The third source originates from the internal heat of the earth—a residue of its formation. In theory, this source of geothermal power is available all over the world but in practice exploitation has been limited to a few natural sites where the earth's crust is particularly thin thus reducing the capital cost of extraction very significantly.
The fourth source arises from the structure of matter itself. The “cement” of the atomic nucleus is energy and the rebuilding of the nucleus can be made to provide a surplus of energy. The nucleus of the heavy element uranium can readily be restructured in this way by the fission process. Restructuring the other way by building heavier elements is possible using deuterium in the fusion process. Supplies of deuterium in the world are found in sea water and are therefore virtually boundless in extent; however, large amounts of energy are required to release energy in fusion and the technology is not yet available to do it, even on a laboratory scale.
Of our main present-day primary fuels only hydro-electricity and geothermal power are renewed year by year; their use will continue to expand but they cannot alone be expected to meet the increasing demand of home and industry.
Nobody can say with any certainty what is the total quantity of any of the fossil fuels in the ground; further discoveries are being made all the time and further information becomes available about deposits already known to exist. But there is now a belief that oil and natural gas reserves may not last very long if demand continues to grow as it has been doing. Until 3 or 4 years ago most experts believed (or acted as though they believed) that oil supplies would last for as far ahead as it was necessary to worry about, and prices were low relative to the potential value of the product. But now there has been a great swing of opinion. An increasing number of producing countries are adopting conservationist policies and most countries are tending to raise their prices.*
RISING ENERGY DEMAND—The supply of energy in one form or another is basic to our way of life. Economics and availability help determine the nature of the satisfaction of the energy demand, but it is also conditioned by community thinking in social and environmental terms. Growth of energy demand on the scale we have come to expect is not essential for our survival or physical (or mental) well-being, but mainly for the continued pursuit of that rather elusive concept “a higher standard of living”. If energy prices move up to a much higher level relative to prices generally, consumers have the choice of either making do with less energy and less goods and services that use up a lot of energy or doing without other commodities.
*Hutber and Forster in Resources and Population, Academic Press, 1973.
The annual consumption of energy over the next 10 years will be unprecedented in New Zealand's history. The demand for electricity alone can be taken as an example. In the 1974 report of the Committee to Review Power Requirements it is estimated that electricity generation will have to grow from more than 18,000 GW hours in 1973-74 to nearly 39,000 GW hours by 1983-84—more than double. Peak power demand over the same period will also more than double, from just over 3,500 MW to nearly 7,700 MW.
The estimated capital expenditure on the generating plant necessary to achieve this output totals $1,554 million spent over the next 10 years. This estimate was made in the 1974 report of the Planning Committee on Electrical Power Development. To the figures for electrical energy must be added the requirements for other forms of energy and the cost of producing them. There are estimates for the next 10 years, which is a relatively short period. A continual review is being made so that a rolling plan can be formulated. Already planners are looking in detail at subsequent years, and giving general consideration to the demand and supply of energy to the end of the century. An immense increase in the demand for energy of all types is being experienced in all developed countries and is causing everyone to reconsider the question of available resources and how they can best be used to meet the demand. Advanced technology is enabling mankind to utilise energy that was unobtainable as recently as 10 years ago.
There are two reasons for reviewing energy resources on a continuous basis. First, our traditional source of energy is limited, but we are discovering new sources, and so the supply scene is changing. Secondly, the cost of producing and supplying energy from various sources changes, as do consumer preferences. The second point can be best illustrated by looking at our own experience in New Zealand over the last 30 or 40 years. Prior to the Second World War coal provided most of the energy required for domestic and industrial use. Oil was mainly used in the transportation field or for lubrication, the major role of electricity was for lighting, and manufactured gas was largely used as a cheap form of energy for heating and cooking. What has happened in recent years is that the fuels with a high labour content in the cost of supply have moved up in price, whereas those with a low labour content have moved down, and this has steadily improved their competitive position. As a consequence, coal has lost its dominant position. In 1950 coal still held 50 percent of the New Zealand market, but by 1972 its share had dropped to 17 percent. Oil has increased from 38 percent to 59 percent in the same period and electricity has more than doubled its share from 10 percent to 22 percent. In 1972 the total of manufactured and natural gases accounted for about 2 percent of the market.
Looking ahead to about 1981, the ratios for consumer energy in New Zealand are expected to be: coal, about 12 percent; oil. 52 percent; electricity, 29 percent; and natural gas, 6 percent, with manufactured gas still about 1 percent. It is interesting to note that although gas supplies only about 7 percent of the market, this represents more than a threefold increase on present consumption. But more than the ratios will change; our demand for energy will also increase rapidly. Countries such as ours are relatively large users of energy, and the experience of the United Kingdom, the United States, and other developed countries indicates that as gross national product increases so does the per capita consumption of energy. The estimated annual increase in consumption, averaged over the next 10 years, is about 3.5 percent for oil and an even higher rate for electricity. In practical terms, by 1975 the annual increase in demand for electricity had reached about 350 MW. By 1985, just 10 years later, it could be round about 550 MW, which is almost equal to an additional Benmore power station each year.
At present the installed hydro system totals about 3,500MW and another 2,200 MW is expected to be installed in the next 10 years. There is some potential in geothermal fields and investigations are under way to assess these.
Fossil fuels will need to be used to a greater extent for electricity generation in the future. Our hydro resources in the North Island are almost fully exploited apart from the station on the Motu River and some potential on some other rivers, although this is not very great. In the South Island there is still potential in the Clutha River, but this, apart from the Upper Waitaki, which is now being developed, is about the only remaining hydro power of significance.
Large reserves of natural gas have been discovered at Kapuni and are presently being distributed to nine North Island gas undertakings as a premium fuel. Another gas field, more than 10 times the size of the Kapuni field, has been discovered off the coast, and an oil refinery has been built at Marsden.
Re-appraisal and new investigations of the coal reserves in the Waikato, West Coast, and Southland are continuing.
Nuclear power must be considered as a source of energy in the future, although the decision to develop the Maui natural gas field has delayed this prospect. Natural gas will be available from the Maui field from late 1978; at present approximately 75 percent of total natural gas reserves, less gas field condensate, is tentatively committed to electricity generation.
Methods for the direct conversion of solar energy to useful heat or electricity are now being actively developed but their widespread use is presently hindered by the high cost of equipment.
Changes in social attitudes and a heightened interest in protecting our environment have far-reaching implications in the production, supply, and use of energy.
During the 120 years which coal has been mined in New Zealand it has had varying fortunes as an energy resource. Between the 1850s and the 1940s coal grew to be the most widely used source of energy in the country, accounting for more than 50 percent of the primary energy market and included the railways, many gasworks, and a large share of industrial and domestic energy users amongst its customers.
In the last 30 years, however, coal has declined in importance as an energy source to the point where it now accounts for 17 percent of the primary energy market.
Despite periods of heavy demand coal's proportionate contribution to New Zealand's primary energy needs has been declining for over 50 years, as the following table on the shares of primary energy shows.
| Primary Energy | 1924 | 1934 | 1944 | 1954 | 1964 | 1974 |
|---|---|---|---|---|---|---|
| percent | ||||||
| Coal | 93 | 72 | 66 | 47 | 35 | 17 |
| Hydro electricity | 1 | 4 | 7 | 10 | 15 | 18 |
| Petroleum | 6 | 24 | 27 | 42 | 50 | 62 |
| Natural gas | 3 | |||||
| Totals | 100 | 100 | 100 | 100 | 100 | 100 |
Technological change, consumer preference for cleaner and more convenient fuels, and the relative prices of different energy forms have all played their part in turning consumers away from coal to electricity, oil, and, in recent years, natural gas.
Until 1973 there seemed to be no difficulty in meeting the incremental demand for energy from a mixture of hydro electricity and the fossil fuels of oil and natural gas and New Zealand had been moving into a position of increasing dependence on an imported fuel.
Earlier misgivings over the future of oil were fully substantiated in October 1973 when members of the Organisation of Arab Petroleum Exporting Countries announced that they were going to reduce production.
This whole exercise illustrated quite dramatically that oil was no longer a reliable form of energy in terms of supply.
At the same time it became more expensive. Between 1 January 1973 and 1 January 1974, the members of the Organisation of Petroleum Exporting Countries (OPEC) increased the posted price for Arabian light crude from US$2.59 per barrel to US$11.65.
These events have created an economic climate for coal which it has not enjoyed for decades. However, the increase in the price of oil does not necessarily open up a wide range of market opportunities for coal. In those areas of the North Island reticulated for natural gas, this form of energy will remain a strong competitor. It is also possible that while the price of electricity is kept at a low level large energy consumers in the industrial sector may convert from oil to electricity where it is feasible to do so.
Some industries may choose to remain on oil despite price increases, simply because very often expenditure on energy is a relatively small part of the total cost of production and even a large increase does not significantly affect overall costs. Where the energy input is large, increased costs are often passed on to the consumer in the form of higher prices.
Nevertheless, it remains that for the first time in many years the opportunity exists for coal to win back a significant share of the primary energy market. The promotion of the use of coal can be regarded firstly as a matter of economics and secondly as a means of reducing the country's dependence on imported fuels.
MINISTRY OF ENERGY RESOURCES—A Ministry of Energy Resources was provided for by legislation in 1972. It is the function of the ministry to advise the Government on policies that will ensure the effective and efficient production, supply, and use of all forms of energy in New Zealand, bearing in mind the need to conserve resources. The Ministry of Energy Resources advises the Government on an overall energy policy and also provides an independent view on proposals concerning the production, supply, and use of energy in all its forms in both the public and the private sectors.
One of the difficulties in policy-making in the energy sector has been the lack of information relating to it. The Fuel and Power Committee of the National Development Conference pointed out, for example, that there was a lack of information on consumer preference and on consumer demand characteristics, and so the ministry is charged with developing and maintaining a coordinated information service on the production, supply, distribution, and use of energy. The Energy Resources Commission, which was set up as an interim body prior to the establishment of the ministry, began work on the development of a matrix on energy supply and use in New Zealand. The gaps in statistics have been pinpointed and work is going ahead to fill in these gaps. The administration of the Gas Council has been transferred from the New Zealand Electricity Department to the Ministry.
The role of the Ministry of Energy Resources, lies in its advisory capacity to the Government. While the ministry does not have the power to decide what shall be conserved and what used, it does have the role of analysing all courses of action available and presenting the costs, economic, social, and environmental of each alternative. Conservation does not mean just conservation of the environment of physical resources such as coal or gas, but includes technical and monetary resources. It is well recognised that, in order to make a sound decision on which of several alternatives to follow, an assessment is necessary of the cost of each of these. Only then is it practical to weigh up the relative merit of various proposals.
While the community demands increasing amounts of energy it is not always happy about the various adverse effects, whether in the end use of the fuel or in the production of it—for example coal fires for domestic use or the construction of thermal power stations near cities. The growth of the energy industry is inextricably tied up with the desire for higher standards of living.
Any material benefits cause natural disturbances to some degree or other and it is necessary to strike a balance between the benefits and any adverse consequences. Hydro sites are now limited and the best involve quite drastic changes in the areas nearby. Supplies of fossil fuels are not everlasting and concern is expressed in some quarters at the nuclear alternative. Concern about the wasteful use of resources in the face of increasing demand for comfort and convenience by affluent societies has led to various proposals for encouraging conservation of energy rather than accept its unlimited and unrestricted use.
ASSESSING DEMAND—The continuance of a reliable supply of energy at a reasonable cost is essential to both the economic growth of this country and the enjoyment of a higher standard of living. If the supply were to fall short of the demand, even for brief periods, the disruptions caused to both domestic and non-domestic users would be strongly resented. In the non-domestic field these would involve considerable economic waste.
Developed countries seem to need about a 0.8 to 0.9 percent growth in energy for each 1 percent increase in gross national product—the rate which New Zealand has maintained since the Second World War with short-term variations.
Energy consumption in New Zealand has been rising fairly steadily since 1951 by about 3.7 percent a year.
Comparative statistics on per-head consumption by geographical areas in 1971 are shown in the following table.
| Geographical Area | Energy Consumption Per Head |
|---|---|
| kWh | |
| New Zealand | 22,600 |
| Australia | 43,600 |
| North America | 88,500 |
| Developing countries | 2,800 |
| World | 15,400 |
New Zealand has an abnormally low ratio of energy consumption to gross national product, which reflects the agricultural basis of the economy. More rapid industrial development would accelerate energy consumption per head. Apart from the aluminium and steel smelters, the manufacturing industries are not heavy consumers of electricity. In fact, consumption is mainly concentrated in only four areas—food processing, forest products, cement, and fertiliser manufacture. In 1970 these industries used 88 percent of all coal, 63 percent of the fuel oil, 53 percent of the coke and gas, and 47 percent of the electricity consumed in manufacturing industries. (The net output of these same industries was valued at less than 28 percent of the total.)
About 50 percent of electricity generated is used domestically which is a reflection of the country's high standard of living combined with low industrialisation.
The following table sets out energy supply and demand for 1973-74.
| Item | Solid | Oil | Gas | Electricity | Total |
|---|---|---|---|---|---|
*Kapuni condensate. †The energy used by the energy producing industries and the energy losses in producing, refining, and transporting fuels. Included here is oil refineries' own use and losses, natural gas production, treatment, transport (compressor fuel) and distribution losses, and all electricity transmission losses. It does not include the losses incurred in transforming fuels such as in gas manufacture or thermal electricity generation. ‡Estimated. | |||||
| (000 Terajoules) | |||||
| Supply | |||||
| Indigenous primary | 60.1 | 7.4* | 12.8 | 55.1 | 135.4 |
| Imports | - | 200.6 | - | - | 200.6 |
| Secondary production | 2.1 | - | 1.3 | 10.1 | 13.5 |
| Gross supply | 62.2 | 208.0 | 14.1 | 65.2 | 349.5 |
| Deductions | |||||
| Exports | 0.8 | - | - | - | 0.8 |
| International transport use | - | 17.6 | - | - | 17.6 |
| Use in electricity generation | 19.6 | 16.2 | 3.9 | - | 39.7 |
| Use in synthetic fuel production (gasworks) | 4.0 | 0.5 | - | - | 4.5 |
| Consumption by energy sector and losses† | - | 10.6 | 4.5 | 7.8 | 22.9 |
| Non-energy use (bitumen) | - | 5.1 | - | - | 5.1 |
| Total deductions | 24.4 | 50.0 | 8.4 | 7.8 | 90.6 |
| Net supply | 37.6 | 158.3 | 5.7 | 57.4 | 259.0 |
| Demand‡ | |||||
| Industry | 23.3 | 48.8 | 3.5 | 21.6 | 97.2 |
| Transport | - | 95.0 | - | 0.1 | 95.1 |
| Commercial | 7.3 | 10.3 | 1.0 | 8.9 | 27.5 |
| Domestic | 7.0 | 4.2 | 1.2 | 26.8 | 39.2 |
| Total usage | 37.6 | 158.3 | 5.7 | 57.4 | 259.0 |
It seems that the demand for energy tends to be unresponsive to price changes; that substitution between the various forms of energy is limited largely to heating and is further limited by the cost of equipment required by the user; that waste of energy where it exists, would be difficult to eliminate except possibly by the insulation of houses; that the scope for reducing or “ironing out” peak loads at particular times of the day or particular seasons is limited.
The large increases in crude oil prices announced by the producing countries in October and December 1973 have resulted in substantial changes in the future prospects for the use of all fuels. Preliminary revised assessments forecast the likely usage in primary energy terms as follows:
| Source | 1973-74 | 1980-81 | 1985-86 |
|---|---|---|---|
| Joules x 101 5 | |||
| Oil | 208 | 218 | 223 |
| Coal | 60 | 75 | 104 |
| Primary electricity | 55 | 79 | 91 |
| Natural gas | 13 | 98 | 187 |
| Totals | 336 | 470 | 605 |
ENERGY USES—The following table gives a summary of uses of oil. (Usage of electricity, coal and gas is discussed in the respective subject matter sections.) About two-thirds of the oil, and therefore about 40 percent of total energy supplies, is used in internal combustion engines.
| Agency | 1973-74 |
|---|---|
| Percent | |
| Motor vehicles | 39.6 |
| Aircraft (internal) | 2.8 |
| International transport | 8.9 |
| Electricity generation | 8.2 |
| Other users | 40.5 |
Electricity and gas supply are discussed in succeeding sub-sections, while coal and natural gas are dealt with in Section 17—Minerals. The oil refinery statistics covered in Section 18—Manufacturing and statistics of imports of oil and petrol are given in Section 22c.
The market shares of the various energy resources for 1974-75 are estimated as follows by the Ministry of Energy Resources.
| Source | Industry and Commerce | Transport | Households | Thermal Electricity Generation |
|---|---|---|---|---|
| Percent | ||||
| Oil | 33.5 | 100.0 | 9.5 | 58.0 |
| Coal | 28.0 | - | 15.0 | 36.0 |
| Natural gas | 4.0 | - | 1.5 | 6.0 |
| Manufactured gas | 1.0 | - | 1.0 | - |
| Electricity | 33.5 | - | 73.0 | - |
| Totals | 100.0 | 100.0 | 100.0 | 100.0 |
The proportion of thermal electricity based on oil will fall after 1974-75 as both coal and natural gas are used more extensively. By 1982 these inputs are planned to provide over 80 percent of thermal electricity generation.
A report of May 1974 by the Monetary and Economic Council includes a survey of energy supplies and of energy pricing.
Substantial increases in prices of oil products took place in early 1974. Electricity prices had been stabilised for some years up to mid-1975 but were then permitted to rise.
Coal prices have had only a slow upward trend.
EXPENDITURE PATTERN—Expenditure on various forms of energy in New Zealand is about $526 million annually which represents about 7 percent of the gross national product. Of the total expenditure about 35 percent is spent on electricity, about 60 percent on oil products, 3 percent on coal and 2 percent on gas. Over the whole energy sector about $154 million is spent in new capital formation each year, about 94 percent for electricity. While the figures show expenditure on electricity is high, the volumes of energy are quite different. While the percentages of fixed capital formation and gross domestic expenditure are not large, the rate of increase of energy use, particularly electricity, is well above the annual increase in gross national product. This will mean that, if present trends continue, an increasing demand will be made on resources of money, manpower, and materials to satisfy the market for electricity.
Petroleum Products—Petrol accounts for about half of New Zealand's total consumption of petroleum products. In the year ended December 1973, New Zealand used a total of 1,206 million gallons of petroleum products. The following table shows the proportions of this total by the various products and the total in millions of gallons in each case.
| Product | Gallons (million) | Percentage |
|---|---|---|
| Aviation gasoline | 9.2 | 0.8 |
| Aviation turbine fuel | 50.1 | 4.2 |
| Motor gasoline (petrol) | 498.3 | 41.3 |
| Gasifier distillate | 3.5 | 0.3 |
| Kerosene | 7.1 | 0.6 |
| Automotive gas oil | 259.6 | 21.5 |
| Marine diesel fuel | 19.9 | 1.6 |
| Fuel oils | 306.5 | 25.4 |
| Lubricants | 14.4 | 1.2 |
| Bitumen | 27.2 | 2.3 |
| Chemical and other petroleum products | 10.5 | 1.0 |
| Totals | 1,206.3 | 100.0 |
Nearly all of New Zealand's petroleum supplies are derived either directly (at the Marsden Point refinery) or indirectly (at overseas refineries) from Middle East crude oil, with 83 percent coming from Kuwait in 1973. Locally refined production catered for about three-quarters of the demand in 1973. Most of the aviation fuel comes from Australia, and other lubricants, kerosene, chemicals, and detergents are imported from the Middle East, Australia, and Singapore.
From every 44 gallons of crude oil passed through the Marsden Point refinery is normally produced 18.04 gallons of petrol, 9.24 gallons of diesel fuel, 15.40 gallons of fuel oil and 1.32 gallons of bitumen. About 41 percent of its annual output is petrol, 19 percent is diesel, 37 percent light and heavy fuel oils and 3 percent is bitumen.
GENERAL—New Zealand's natural resources of lakes and fast-flowing rivers have been systematically harnessed for hydro-electric development, providing a relatively cheap source of energy which is continually replenished by nature. New Zealand's dependence on hydro-electric generation is similar to that of Canada, but Norway and Sweden generate proportionately more of their electricity from water sources. Hydro energy provides over 80 percent of the national electricity supply with 8 percent coming from geothermal energy and the balance from fossil fuels—coal, oil, and natural gas.
An important factor governing future plans for electric power development is that the remaining hydro potential is mainly in the lower half of the South Island and the preponderance of population in the North Island. In 1965 the inter-island transmission link began transmitting electricity from Benmore to Haywards, but this link is limited in capacity and in any case by the end of the century the South Island consumers are likely to require all the output from hydro generation in the South Island.
At Wairakei, in New Zealand's thermal region, natural steam is being used to drive the turbines. Coal is being used at Meremere steam station south of Auckland. A large station has been built at New Plymouth to use as fuel either natural gas or oil, and a large gas and coal-fired station is being built at Huntly.
An oil-fired steam station has operated since 1967 at Marsden, near Whangarei, and gas turbines have been generating at Otahuhu since mid-1968. Until the use of nuclear power about 1990, most future North Island stations will be steam stations using natural gas, oil, and coal. Because of the effect on the environment by way of air pollution and the transfer of heat to natural waters used to cool the condensers, environmental impact reports are required for projected schemes.
HISTORICAL DEVELOPMENT—Electricity supply in New Zealand was pioneered by local bodies and private enterprise. Reefton had hydro-electric supply as early as 1888, and Wellington in the following year opened a water-powered plant, using water from the city mains, but later switched to steam generation. Auckland and Christchurch, using steam-generating stations, and Dunedin, using hydro plant, all had supplies extensively developed before the advent of Government supply. Many smaller communities also had local supply, mostly produced from local steam stations, although in some cases hydro plant was installed to take advantage of local water resources.
The first Government station was opened at Lake Coleridge in 1914, and its capacity was increased in four stages up to 1930. In the North Island the Government purchased the Waihi Goldmining Company's station at Horahora on the Waikato River. This station was enlarged and by 1927 was supplying power as far north as Henderson and Takapuna. Mangahao station near Shannon was completed in 1925; one of the Waikaremoana stations (Tuai) and Arapuni both began operating in 1927. Between 1920 and 1930 the capacity of the State generating system grew by 135,590 kW and the number of consumers in New Zealand increased from 58,449 to 284,235. In the early 1920s steam stations were still producing up to 60 percent of the total electricity but by the 1930s they produced as little as 1 percent in some years, as they were gradually relegated to standby stations.
In the 1930s the Waitaki hydro station was commissioned and the Government acquired two small hydro stations—Arnold from the Grey Electric Power Board and Monowai from the Southland Power Board. With the latter the Government also took over the responsibility for distribution in Southland.
In spite of the difficulties, capacity was increased during the war years. Some existing stations extended, and new ones opened at Piripaua (the second Waikaremoana station), at Cobb in north-west Nelson and, towards the end of the war, at Highbank in Canterbury. Gates were built in 1941 to control the outflow from Lake Taupo.
After the war plans were pushed ahead for the development of the potential of the principal power source in the North Island, the Waikato River. Work had proceeded on Karapiro, the second Waikato station, during the war and its first power was produced in 1947 (the old Horahora station was submerged in the lake formed behind the dam). In 1952 Maraetai, the largest station on the Waikato, began producing electricity, and in 1956 Whakamaru was completed, followed by Atiamuri in 1958. Both Ohakuri and Waipapa stations began operating in 1961 and Aratiatia station in 1964.
Development in other areas included the commissioning of Kaitawa, the third Waikaremoana station, in 1948, and the installation of further machines at Waitaki. Control works were built at Lakes Pukaki and Tekapo to ensure an adequate water supply to the Waitaki station in the winter. Incorporated in the control works at Lake Tekapo is a single machine power station which was commissioned in 1951. The largest station built up to that time in New Zealand began operating at Roxburgh on the Clutha River in 1956. Meanwhile work proceeded on the Benmore station which was completed in 1966. Another station on the Waitaki, at Aviemore, located between the Waitaki and Benmore stations, began operating in July 1968.
Matahina on the Rangitaiki River in the Bay of Plenty produced its first electricity in January 1967..
The Manapouri scheme uses the waters of Lakes Manapouri and Te Anau, taking advantage of the 600-ft head between Manapouri and the sea. Intakes at the West Arm of Manapouri lead the water into vertical penstocks to the turbines 700 ft underground and it is discharged into Deep Cove at Doubtful Sound through a 6-mile tunnel.
A large proportion of Manapouri's output supplies the Bluff aluminium smelter and the remainder is fed into the national grid. Four generators began operating in 1969 and the remaining three in 1971 to give a total installed capacity of 700MW.
The Manapouri scheme was the subject of an agreement between the Government and Comalco in 1960 but subsequent agreements were negotiated in 1963, 1966, and 1969. As the land concerned lies within Fiordland National Park the agreement required statutory authority which was conferred in the Te Anau - Manapouri Development Act 1963. Under the 1969 agreement the Government built the power station and is building the Te Anau control works and the Mararoa Dam at Manapouri. This work is scheduled to be finished in 1975.
The actual formula devised for Comalco to pay for the electricity has varied between agreements and remains complicated; Comalco pays for the capacity to supply electricity, not for the electricity itself, plus the operating costs of that capacity; the price is based on capital charges. A sinking fund for the civil engineering works covers 80 years while the fund for equipment allows for a depreciation period of 40 years.
The 1966 agreement provided that Lake Manapouri be raised from its natural level of 583 ft above sea level to an operating level of 610-620 ft while the minimum lake level was set at 575.5 ft. Consequent on a campaign by conservationists opposed to the raising of the lake level the Government appointed a commission in 1970 to inquire into the proposal. The dam at Mararoa to control Lake Manapouri is now being built on a narrow base to control the lake within a normal range of levels. Lake Te Anau which feeds Lake Manapouri through the Upper Waiau River is to be controlled at natural levels between 653.6 and 663 ft by a dam near its outlet.
The purpose, planning, and the development of the Manapouri project are fully described in parliamentary paper D.7, 1967, as well as the Report of the Commission to Inquire into the Proposal to Raise the Level of Lake Manapouri for the Purpose of Generating Electricity (parliamentary paper D.8, 1970) and a report by the Institute of Economic Research on the Manapouri-Bluff Project commissioned by Comalco and published in October 1971.
The installed capacity of Maraetai power station on the Waikato River was doubled by the building of a second powerhouse for five additional machines which were commissioned in 1970-71. The yearly output from Maraetai has not been increased although useful peak-time capacity has been added.
Thermal Generation—The first thermal station built by the New Zealand Electricity Department came into operation in 1958 at Meremere beside the Waikato River, 40 miles south of Auckland This station burns coal which is transported from the Maramarua opencast mines by aerial cableway, and from the Huntly mines by road and rail.
At Wairakei, a few miles north of Taupo, geothermal steam has been harnessed for the generation of electricity. The first machine began producing electricity in 1958 and the last machine (the thirteenth) was installed in 1963. Bores which are 4, 6, and 8 in. in diameter have been drilled to depths varying between 570 ft and 4,000 ft.
Marsden power station was commissioned in 1967 using oil from the nearby refinery, and at Otahuhu gas turbines went into service in 1968.
The 600 MW thermal station at New Plymouth produced its first electricity in 1974 and is scheduled to attain its full capacity early in 1976. Until the Maui natural gas wells off the coast of Taranaki begin production, the energy source will be 750,000 tons of imported bunker oil a year. A chimney 650 ft high has been built to disperse the hot gas.
Construction Projects:Hydro—A catchment area of more than 1,000 square miles in the central volcanic uplands of the North Island is being tapped for hydro-electric power development. Known as the Tongariro scheme, this complex development involves drawing upon the headwaters of certain rivers and tributaries, and diverting part of their flow from one watershed to another. In February 1971, southerly flowing waters of the Wanganui catchment were diverted to flow north to feed into Lake Taupo. A 20,000-ft tunnel connects Lake Rotoaira with the power house at Tokaanu. When the whole project is completed by 1975 it will increase the capacity of the eight existing power stations on the Waikato River by about 18 percent. Also included in the scheme is a 200 MW power station being built at Tokaanu. The total output from the development will be equivalent to one-third of the present output from the Waikato stations.
Late in 1973 approval was given for the construction of the 100 MW Rangipo power station to develop the head in the Tongariro River between the Moawhango Tunnel outfall and the Poutu intake; this extension of the Tongariro scheme provides continuity for the work force built up at Turangi.
In July 1968 Government approved in principle the total development of the Upper Waitaki Valley for hydro-electric use. The scheme involves controlling the outflows of Lakes Tekapo and Pukaki and to a limited extent Lake Ohau, and directing the stored waters through canals to four power stations named Tekapo B, Ohau A, Ohau B, and Ohau C; the diverted waters will eventually reach the Waitaki River at Lake Benmore. The total capacity of the new stations will be about 850 megawatts; also the extra storage provided by the scheme will allow the output from existing Waitaki stations to be increased. Work began with the construction of a township at Twizel, and on the Tekapo B project, which should be completed by late 1976.
Thermal—Agreement was reached late in 1973 between the oil consortium and the Government on the development of the Maui off-shore natural gas field. The first stage to be completed in 1978 involves the installation of a platform structure at the Maui 3 location and the laying off-shore of a 24-inch diameter gas pipeline and a 10-inch diameter condensate pipeline. Part of the natural gas delivery of 600 million cubic feet a day will be used to feed four thermal power stations, one of them being the New Plymouth station
One natural-gas-fired power station of 1,400 MW is proposed in the Auckland area and a second of 1,050 MW south of Auckland. A 1,000 MW station is being built at Huntly, the first unit (250 MW) of which is scheduled to be commissioned in April 1978. Investigations by the Mines Department over the years have confirmed the existence of a large underground coal-field sufficient to provide fuel for such a station, but natural gas from the Maui field is to be used for one or more of the generating units.
Preparations are being made for a 220 MW gas turbine station and another of 220 MW at Whirinaki, near Napier. Stratford will burn gas, and Whirinaki, oil, and both are to be operational by 1976. Approval was given in November 1972 for a further two generating units of 50 MW to be added to Otahuhu gas turbine station. These are designed to run on distillate oil and will come into operation about April 1976. Construction of an oil-fired intermediate load station, Marsden B station, was approved on 30 July 1974 and first power is scheduled for April 1978.
The guaranteed market for gas for electricity generation has made the development of the Maui field, with the recovery of the associated valuable condensate, an economically viable proposition. This guaranteed gas demand involves a progressive increase in annual consumption until a maximum level is reached in the mid 1980s. At this level, about 17,600 GWh of electricity could be produced annually from gas-fired power station plant of 3,300 MW capacity. Some idea of the magnitude of this output can be gauged from the fact that these figures are roughly equivalent to electrical energy consumption and peak demand for the whole of New Zealand for the 1972-73 year.
The conclusion of this long-term fuel contract of 30 years' duration will fix the pattern of major base-load thermal power station development for some years and could mean that New Zealand can defer the introduction of nuclear power stations until at least the late 1980s.
Upper Clutha Hydro-electric Development—The Government has approved in principle the proposals of the Clutha Development Commission for the building of six dams over a period of 15 years on the Upper Clutha and Kawarau Rivers to produce 1,490 megawatts, or in total twice the generating capacity of Manapouri. Two dams will be built in the Cromwell Gorge and two further dams will be built on the Upper Clutha River above Cromwell. The final two dams will be built on the Kawarau River which drains Lake Wakatipu and joins the Clutha River at Cromwell.
INTER-ISLAND TRANSMISSION—In 1965, at the same time as Benmore power station was commissioned, the transmission systems of the North and South Islands were linked by a high-voltage direct-current transmission line and undersea cables. It was considered more economical to transmit electricity from the lower half of the South Island which has abundant hydro resources, rather than develop less attractive North Island schemes or build extra thermal stations.
This scheme not only involved the laying of submarine cables for 25 miles in Cook Strait, but also the construction of a 354 mile, 500 kV direct-current transmission line from Benmore to Fighting Bay on the southern side of Cook Strait, and from Oteranga Bay on the northern side to Haywards substation; complex converting equipment had also to be installed at each end of the system. Considerable world-wide interest has been shown in this scheme, which was the largest of its type outside the USSR. The World Bank made a loan of $23.2 million to meet the overseas costs of this project.
As output from the Waitaki River development will fall off during the filling of Lake Pukaki, it may be necessary for energy to be transmitted from the North Island, so conversion work to enable transmission in both directions through the cable is planned for completion by April 1976.
PLANNING FOR ELECTRIC POWER—Forward planning is continually under review by a series of specialised committees. The Committee to Review Power Requirements considers estimates for 5 years ahead from the Electrical Supply Authorities Association and projects demand for a further 5 years. Peak power forecasts are also derived from the basic energy forecasts.
The personnel of this committee, representing the generating and distributing portions of the electrical industry, together with the Department of Statistics, Treasury, and this year the Ministry of Energy Resources, apply a wider judgment on long-run considerations to frame forecasts for the 10-year period. The independent forecast prepared by the Department of Statistics provides a valuable comparison with the work done in the industry.
Forecasting electricity demand would be one of the longest-term planning processes in New Zealand. It is of critical importance to the electrical industry and the economy of the country. The long sequences of events in providing generating plants spanning about 7 years is today lengthening by a more critical appraisal of their environmental impact. If demand estimates are low, or plant is not ready on time, a difficult supply situation results. On the other hand, if estimates are high, a premature commitment of resources and capital can materially affect what is available for other national development and social programmes.
A Planning Committee on Electrical Power Development in New Zealand, which consists of members of the New Zealand Electricity Department, Ministry of Works, Ministry of Energy Resources, Treasury, and supply authority representatives, considers the findings of the Review Committee in relation to the construction of stations to meet power requirements.
The Planning Committee recommends what projects it considers should be proceeded with, and when, in order to meet the estimated needs. The review and planning reports are submitted to the Minister of Electricity who tables them in the House of Representatives.
Estimates made in 1974 by the Power Planning Committee of progressive generation were as follow (in million kWh): 1974-75, 20,303; 1975-76, 22,099; 1976-77, 24,042; 1977-78, 25,707; 1978-79, 28,190; 1979-80, 30,222; 1980-81, 32,090; 1981-82, 34,093; 1982-83, 36,669; 1983-84; 38,963.
There has been a great upsurge in the consumption of electric power. Power generated to meet the demand doubled between 1962 and 1972 to reach 15,194 million kilowatt hours a year. In the same period generating capacity of power plants has more than doubled to reach 4.21 million kilowatts. Projected power requirements are expected to more than double again by 1982 to reach 30,599 million kilowatt hours. The projected average annual growth rate is about 7 percent. To meet the estimated power needs the generating capacity must be increased to 7.5 million kilowatts by 1982.
An important aspect of long-term trends is the steadily increasing share of electricity consumption by commerce and industry. For the first time in New Zealand, household consumption, at 49 percent in 1972-73, was less than half of the electricity consumption. By 1980 the household consumption is forecast to be down to 45 percent of the total. As the increasing proportion of electricity consumption provides the motive power in commerce and industry, the consumption of electricity becomes more closely related to industrial and commercial output of goods and services. The pulp and paper industry is contributing to major industrial loads.
In addition, electricity provides for many public services such as transport, communications, water supply, and sewerage that make urban life possible. The Committee to Review Power Requirements is concerned when making forecasts that adequate provision is included for the unimpeded growth of these productive and service activities in the future.
It is recognised that there is scope for reducing the rate of national electricity consumption if the majority of houses were thermally insulated, even in the roof only.
FINANCE FOR ELECTRICITY—Up to 1964 some $765 million had been expended in generation transmission, and distribution, of which Government share was $555 million. By 1974 the capital invested by the Government had risen to $1,323 million and with the further expenditure by the electrical supply authorities on distribution, the total capital outlay had increased to $1,762 million. The provision of sufficient generating capacity to meet the forecast electricity requirements will involve expenditure by Government of $1,544 million to 1984. Further capital expenditure will be necessary for the strengthening of both the New Zealand Electricity Department's transmission network and electrical supply authorities' distribution systems.
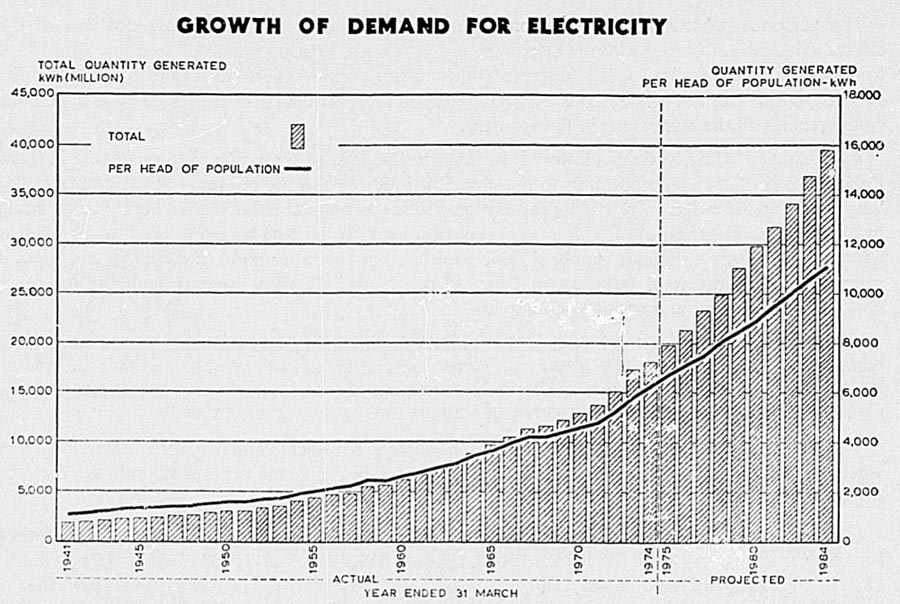
LEGISLATION—Under the Electricity Act 1968 the New Zealand Electricity Department is responsible for preparing plans to meet the expected demand for electric power and for controlling the State generating and transmission systems. In general, hydraulic investigation and civil engineering are carried out by the Ministry of Works to the requirements of the New Zealand Electricity Department. The New Zealand Electricity Department is responsible for the overall functional design of each station, detailed design and installation of all turbines, generators, and associated electrical and mechanical equipment, for the design and installation of equipment at substations, for the survey, design, and construction of transmission lines, and for the operation and maintenance of the networks which supply electricity in bulk to the distributing authorities.
ELECTRIC POWER BOARDS AND SUPPLY AUTHORITIES—Under the Electric Power Boards Act 1925, boards control constituted electric power districts. Of the 39 electric power boards actually functioning at 31 March 1974, 15 had generating stations of a total rated generating capacity of 51,946 kW. There were also 22 municipal electric supply authorities, 6 of them having generating stations of a total rated generating capacity of 783,65 kW, and two county councils. New Zealand Electricity Department acts as the distributing authority for Southland while Rotorua is controlled by an area Electric Authority. The licensed areas under the control of the boards and other authorities cover almost all the inhabited parts of the country. More than 99 percent of New Zealand's population enjoy the benefits of electricity in the home; only a few thousand people in the more isolated and less accessible parts of the country lack this amenity.
The supply of electricity to the remote areas presents difficulties because of the high cost of reticulation in relation to the revenue from power sold. A Rural Reticulation Council can make a levy of up to 1/2 percent of the gross revenue of all supply authorities and Government-owned electrical undertakings to subsidise the annual cost of supply in remote areas. The Rural Reticulation Council was set up under the Electricity Act 1945, and up to 31 March 1974, had approved subsidies of 9,869 route miles of line to supply some 15,340 consumers. At this date, 9,612 miles of line were completed and 15,126 consumers connected. The total capital expenditure was estimated at $17,487,985 and the subsidy paid for the year amounted to $458,938.
PUBLIC SUPPLY STATIONS—The following table covers all stations whose output is fully or partially available to the public supply system as at 31 March 1974, their installed capacity, static head where applicable, and annual energy generation. Stations are State-owned unless otherwise indicated.
| Station | Installed capacity at 31 March 1974 | Static Head | Annual Energy Generation Year Ended 31 March 1974 | Annual Load Factor | |
|---|---|---|---|---|---|
| Number of Units | MW | ||||
*Owned by Dunedin City Council. †Owned by other supply authorities and industries. ‡Excludes capacity of generating plant owned and operated by industries. §New station. ||Operation restricted by Upper Waitaki construction. ¶New station being commissioned. | |||||
| metres | million | percent | |||
| Hydro | kWh | ||||
| Arapuni | 8 | 157.8 | 53 | 718.2 | 52.46 |
| Aratiatia | 3 | 90.0 | 34 | 278.5 | 37.72 |
| Atiamuri | 4 | 84.0 | 25 | 246.8 | 35.62 |
| Karapiro | 3 | 90.0 | 30 | 473.7 | 57.17 |
| Mangahao | 5 | 19.2 | 23 | 93.5 | 50.58 |
| Maraetai | 10 | 360.0 | 61 | 738.2 | 24.60 |
| Matahina | 2 | 72.0 | 61 | 227.9 | 35.07 |
| Ohakuri | 4 | 112.0 | 35 | 337.9 | 33.57 |
| Tokaanu§ | 4 | 200.0 | 208 | 176.7 | 11.33 |
| Waikaremoana— | |||||
| Kaitawa | 2 | 32.0 | 135 | 110.0 | 39.64 |
| Piripaua | 2 | 40.0 | 113 | 143.7 | |
| Tuai | 3 | 52.0 | 206 | 222.8 | |
| Waipapa | 3 | 51.0 | 16 | 219.9 | 40.43 |
| Whakamaru | 4 | 100.0 | 38 | 447.3 | 48.67 |
| Arnold | 2 | 3.1 | 13 | 21.5 | 74.34 |
| Aviemore | 4 | 220.0 | 37 | 880.3 | 41.80 |
| Benmore | 6 | 540.0 | 92 | 2,166.8 | 43.86 |
| Cobb | 6 | 32.0 | 594 | 138.5 | 46.43 |
| Coleridge | 9 | 34.5 | 149 | 121.9 | 38.34 |
| Highbank | 1 | 25.2 | 101 | 72.2 | 38.06 |
| Manapouri | 7 | 700.0 | 177 | 3,840.3 | 74.65 |
| Monowai | 3 | 6.0 | 47 | 30.0 | 57.06 |
| Roxburgh | 8 | 320.0 | 46 | 1,538.8 | 52.72 |
| Tekapo|| | 1 | 25.2 | 30 | 91.2 | 38.40 |
| Waitaki | 7 | 105.0 | 21 | 461.0 | 47.12 |
| Waipori* | 11 | 65.2 | 360 | 131.5 | - |
| Auxiliary† | 60 | 54.4 | - | 221.8 | - |
| Sub-totals | .. | 3,590.6 | .. | 14,150.9 | .. |
| Thermal | |||||
| Marsden | 2 | 240.0 | 1,119.3 | 54.72 | |
| Meremere | 7 | 210.0 | 1,226.5 | 77.56 | |
| New Plymouth ¶ | 1 | 120.0 | 1.6 | - | |
| Otahuhu | 4 | 180.0 | 429.4 | 34.61 | |
| Wairakei | 13 | 192.4 | 1,161.9 | 89.26 | |
| Auxiliary†‡ | 12 | 10.4 | 24.8 | - | |
| Sub-totals | .. | 952.8 | 3,963.8 | .. | |
| Totals | 4,543.4 | 18,114.4 | .. | ||
The next table summarises general statistics of all supply authorities.
| Item | 1971-72 | 1972-73 | 1973-74 | |
|---|---|---|---|---|
*Excluding stocks and materials. †Calculated on revenue from retail sales only. | ||||
| Establishments | 93 | 91 | 92 | |
| Kilowatts of prime movers | kW (000) | 4,367 | 4,434 | 5,171 |
| Materials used— | ||||
| Coal | tons | 405,281 | 607,119 | 807,228 |
| Light oil | gals (000) | 3,879 | 1,790 | 16,875 |
| Heavy oil | gals (000) | 24,327 | 55,492 | 71,625 |
| Natural gas | BTU's (m) | 452,080 | 2,910,728 | 3,431,716 |
| Persons engaged | No. | 12,599 | 13,088 | 13,289 |
| Salaries and wages— | ||||
| (charged to operations and management) | $(000) | 42,106 | 44,918 | 49,984 |
| (charged to capital) | $(000) | 9,249 | 12,653 | 14,140 |
| Capital Expenditure*— | ||||
| During year (net outlay) | $(m) | 107.0 | 140.7 | 128.0 |
| To date | $(m) | 1,457.7 | 1,596.4 | 1,724.4 |
| Generation and Sales— | ||||
| Generation per head of mean population | kWh | 5,282 | 5,983 | 6,047 |
| Retail sales per head of mean population | kWh | 4,558 | 5,226 | 5,324 |
| Retail sales per customer (domestic) | kWh | 7,375 | 7,821 | 7,662 |
| Revenue per unit sold (retail sales)† | cents | 1.243 | 1.183 | 1,190 |
REVENUE AND EXPENDITURE—Financial operations of all supply authorities are summarised.
| Item | 1971-72 | 1972-73 | 1973-74 |
|---|---|---|---|
| *These figures represent transfers within the electrical supply industry and therefore do not represent additional revenue or expenditure to the industry. | |||
| Revenue— | $(000) | ||
| Gross revenue (including bulk sales and standby charges, excluding rates) | 262,037 | 287,040 | 302,108 |
| Revenue from bulk sales to supply authorities | 95,551 | 105,540 | 108,278 |
| Net revenue (excluding rates, bulk sales, and standby charges) | 166,177 | 181,500 | 193,830 |
| Expenditure— | |||
| Operating (including cost of energy purchased in bulk) | 135,490 | 153,564 | 168,294 |
| Cost of energy purchased in bulk* | 95,860 | 105,540 | 108,278 |
| Operating (excluding cost of energy purchased in bulk) | 39,630 | 48,024 | 60,016 |
| Management, etc. | 24,477 | 27,648 | 29,439 |
| Capital charges | 85,635 | 90,836 | 99,019 |
| Total annual expenditure (excluding cost of energy purchased in bulk) | 149,742 | 166,308 | 188,474 |
| Surplus | 16,435 | 15,191 | 5,356 |
GENERATION—Means of generation of electrical energy for public supply is given in the following table.
| Year Ended 31 March | Generated by Means of— | |||
|---|---|---|---|---|
| Hydro | Steam | Oil and Gas | Total | |
| million kWh | ||||
| 1968-69 | 10,360.8 | 1,818.9 | 5.4 | 12,185.1 |
| 1969-70 | 10,189.7 | 2,709.1 | 26.8 | 12,925.6 |
| 1970-71 | 11,265.7 | 2,365.5 | 74.5 | 13,705.7 |
| 1971-72 | 12,969.7 | 2,135.0 | 89.0 | 15,193.7 |
| 1972-73 | 14,109.4 | 2,922.1 | 222.0 | 17,253.5 |
| 1973-74 | 14,150.9 | 3,534.0 | 429.5 | 18,114.4 |
The following table sets out generation by supply authorities and disposal. The excess generation of certain local factories, which is bought in for public supply, is given in the column “other sources”.
| Year Ended 31 March | Generated for Public Supply | Sold Retail | Non-productive | |||
|---|---|---|---|---|---|---|
| N.Z. Electricity Department | Supply Authorities | Other Sources | Total | |||
| million kWh | ||||||
| 1969 | 11,831 | 329 | 25 | 12,185 | 10,454 | 1,732 |
| 1970 | 12,603 | 301 | 21 | 12,926 | 11,069 | 1,856 |
| 1971 | 13,360 | 329 | 17 | 13,706 | 11,745 | 1,960 |
| 1972 | 14,830 | 346 | 17 | 15,194 | 13,112 | 2,082 |
| 1973 | 16,838 | 392 | 23 | 17,253 | 15,031 | 2,223 |
| 1974 | 17,736 | 353 | 25 | 18,114 | 15,947 | 2,167 |
SALES—The following table gives a classification of power retailed according to the various purposes for which it was sold. In this table “domestic” includes domestic water-heating units.
| Year Ended 31 March | Domestic | Industrial | Commercial | Farming | Street Lighting | Rail and Bus Traction | Total | Number of Consumers |
|---|---|---|---|---|---|---|---|---|
| million kWh | ||||||||
| 1969 | 5,992 | 4,312 | 93 | 48 | 10,445 | 1,080,749 | ||
| 1970 | 6,187 | 4,740 | 97 | 45 | 11,069 | 1,086,703 | ||
| 1971 | 6,454 | 2,911 | 1,905 | 331 | 100 | 44 | 11,745 | 1,109,577 |
| 1972 | 6,811 | 3,739 | 2,065 | 350 | 103 | 44 | 13,112 | 1,129,375 |
| 1973 | 7,389 | 4,861 | 2,260 | 374 | 106 | 41 | 15,031 | 1,154,271 |
| 1974 | 7,440 | 5,642 | 2,360 | 362 | 104 | 39 | 15,947 | 1,182,469 |
The following diagram portrays the growth in the use of electric power, and shows also the principal purposes for which the power was employed.
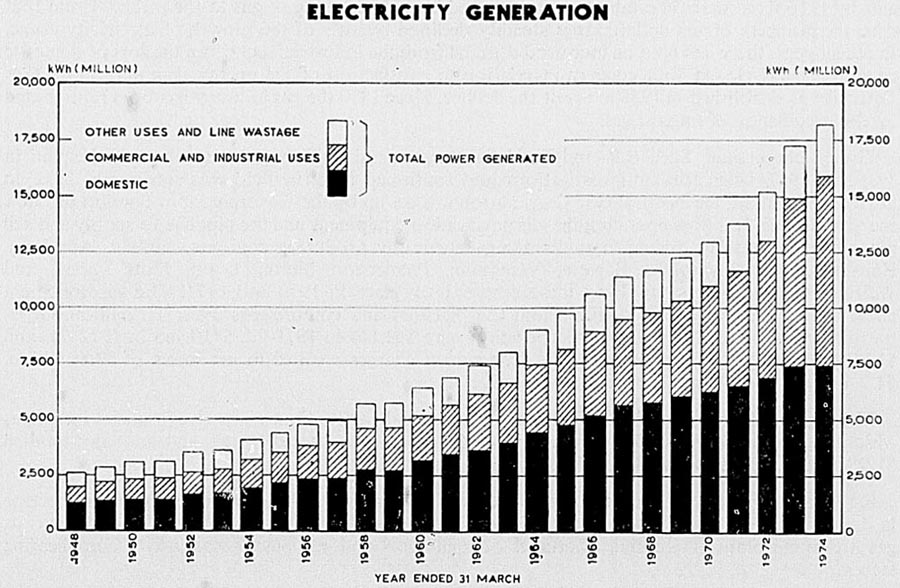
The distribution of the expenditure per unit sold retail is given hereunder.
| Expenditure | 1969-70 | 1970-71 | 1971-72 | 1972-73 | 1973-74 |
|---|---|---|---|---|---|
| cents | cents | cents | cents | cents | |
| Operating expenses | 0.277 | 0.295 | 0.302 | 0.320 | 0.374 |
| Miscellaneous expenses | 0.144 | 0.170 | 0.187 | 0.183 | 0.187 |
| Capital charges | 0.698 | 0.690 | 0.653 | 0.604 | 0.621 |
| Totals | 1.119 | 1.156 | 1.142 | 1.107 | 1.182 |
The revenue per unit sold in 1973-74 was, by categories: Domestic 1.141 cents; commercial 2.101 cents; industrial 0.81 cents; farming 1.959 cents; public lighting 1.827 cents; railway traction 1.346 cents.
Consumer Research—A survey of household electricity consumption was carried out in 1972 by the Department of Statistics on behalf of the New Zealand Electricity Department and the Electrical Supply Authorities of New Zealand. Results showed that 79 percent of all households used only electricity for cooking purposes; 73 percent used only electricity for water heating; and 30 percent used only electricity for home heating. (This was a small sample survey.)
Most electrical energy in households is consumed in water heating, space heating, and cooking in that order. Other appliances add considerably to the material quality of life, but consume little energy by comparison.
GENERAL—Gas was produced from coal as an early source of light and heating in New Zealand and by 1916 there were 56 establishments engaged in the marketing of gas to the public. From that date the numbers of gas undertakings steadily declined because of the growth of electricity usage. In recent years there has been an increased demand from the industrial sector but the loss of domestic consumers was viewed with concern in relation to satisfaction of the energy demand, and a Gas Council was established in 1958 to arrest the decline. Since 1970 the gas industry has been rejuvenated by the reticulation of natural gas.
The oil consortium, Shell B.P. and Todd Oil Services Ltd., discovered natural gas at Kapuni in 1959. In 1967, when further investigations had confirmed that the field was sufficiently large to justify exploitation, the Natural Gas Corporation was set up by the Government to develop this new energy resource. It is now operating the gas purification equipment and the pipeline to supply and sell gas along the pipeline routes to undertakings previously producing coal gas, namely, Auckland, Hamilton, New Plymouth, Hawera, Wanganui, Palmerston North, Levin, Hutt Valley, and Wellington. Natural gas supply to these centres took place in 1970 and 1971. The gas treatment plant at Kapuni cost over $5 million and the pipelines and compressors over $16 million. Gross trading profits of the Natural Gas Corporation were $62,144 in 1971-72, $719,966 in 1972-73, and $1,800,000 in 1973-74, but interest and depreciation charges resulted in net losses of $2.8 million, $2.2 million, and $1.3 million in the respective years.
Those gasworks not receiving a piped supply of natural gas continue to receive financial incentives which are provided by the Gas Council; in 1973-74 subsidies on coal prices and gas sales totalled $1,987,000 compared with $818,879 in 1972-73.
Restrictions on electricity usage in the winters of 1973 and 1974 led to an unprecedented increase in demand but this could not be met until the Natural Gas Corporation completed extensions to its gas treatment plant at Kapuni. Shortages of appliances and equipment was also a complicating factor.
GAS INDUSTRY—In 1973-74 there were 14 gasworks producing and distributing coal gas, oil gas, and water gas, 4 operating in the North Island and 11 in the South Island; and 9 gas undertakings distributing natural gas ex the pipeline operated by the Natural Gas Corporation of New Zealand; all 9 undertakings operate in the North Island.
The following table combines the production of natural gas and manufactured gas showing the total gas energy available and how disposal was effected.
| Production | 1972-73 | 1973-74 |
|---|---|---|
| Therms (000) | ||
| Natural gas produced | 93,745 | 112,615 |
| Manufactured gas produced | 12,025 | 12,001 |
| Total production | 105,770 | 124,616 |
| Less losses | 15,540x | 16,096 |
| Quantity available | 90,230 | 108,519 |
| Distribution losses | 18,637x | 21,807 |
| Sales— | ||
| Domestic | 10,648 | 10,885 |
| Industrial and commercial | 60,946 | 75,827 |
| Total gas disposal | 90,230 | 108,519 |
The following table shows the retail consumers and the prices per therm of gas of all manufactured and natural gas distributed by gasworks, gas-undertakings and the Natural Gas Corporation. The table excludes the bulk sales of natural gas for the generation of electricity.
| Item | 1970-71 | 1971-72 | 1972-73 | 1973-74 | |
|---|---|---|---|---|---|
| Consumers— | |||||
| North Island | No. | 77,369 | 73,640 | 73,252 | 74,493 |
| South Island | No. | 37,444 | 35,954 | 33,856 | 31,874 |
| Total New Zealand | No. | 114,813 | 109,594 | 107,108 | 106,367 |
| Gas Sales— | |||||
| North Island | therms(000) | 17,097 | 25,519 | 34,076 | 43,496 |
| $(000) | 4,844 | 5,647 | 6,655 | 7,681 | |
| South Island | therms(000) | 8,330 | 8,132 | 8,499 | 8,509 |
| $(000) | 2,308 | 2,439 | 2,697 | 2,715 | |
| Totals New Zealand | therms(000) | 25,427 | 33,651 | 42,575 | 52,005 |
| $(000) | 7,151 | 8,086 | 9,352 | 10,396 | |
| Average price of gas to consumer per therm— | |||||
| Domestic | 0.28 | 0.33 | 0.33 | 0.34 | |
| Industrial and commercial | 0.20 | 0.18 | 0.16 | ||
| Average consumption of gas per consumer | therms | 221.5 | 307.1 | 397.5 | 488.9 |
The next table summarises the main statistics of the industry for the last 4 years. Because of the introduction of natural gas nine establishments are now only distributors. The natural gas production plant at Kapuni is not included in these statistics. Approximately half of its production is used for electricity generation.
PRODUCTION AND DISTRIBUTION OF MANUFACTURED GAS BY GASWORKS—The table which follows shows the production of coal gas, oil gas, and water gas during the latest 4 years; the amounts available for distribution and how distribution was effected. The figures relate to the 14 gasworks operating in New Zealand as well as the 9 gas undertakings during the changeover from manufactured gas to natural gas.
| Item | 1970-71 | 1971-72 | 1972-73 | 1973-74 |
|---|---|---|---|---|
| Therms(000) | ||||
| Production— | ||||
| Manufactured by gasworks— | ||||
| Coal gas | 12,917 | 9,184 | 8,517 | 8,180 |
| Oil gas | 10,378 | 3,049 | 3,112 | 3,414 |
| Water gas | 817 | 1,099 | 395 | 407 |
| Quantity manufactured | 24,112 | 13,332 | 12,025 | 12,001 |
| Less gas used for internal consumption | 176 | 115 | 95 | 111 |
| Manufactured gas available for distribution | 23,936 | 13,217 | 11,929 | 11,890 |
| Distribution— | ||||
| Distribution losses | 3,527 | 2,039 | 2,110 | 2,057 |
| Sales—Domestic | 20,409 | 4,314 | 3,609 | 3,430 |
| Industrial and commercial | 6,863 | 6,211 | 6,403 | |
| Total distribution by gasworks | 23,936 | 13,217 | 11,929 | 11,890 |
The next table summarises the main statistics, for the last 4 years, of the 14 gasworks.
| Item | 1970-71 | 1971-72 | 1972-73 | 1973-74 | |
|---|---|---|---|---|---|
| Establishments | No. | 15 | 15 | 15 | 14 |
| Persons engaged— | |||||
| Managerial, accountant, and clerks— | |||||
| Males | No. | 75 | 76 | 74 | 72 |
| Females | No. | 42 | 38 | 36 | 38 |
| Professional and technical— | |||||
| Males | No. | 20 | 19 | 18 | 18 |
| Females | No. | – | – | – | – |
| Wage earners— | |||||
| Males | No. | 335 | 322 | 309 | 300 |
| Females | No. | 5 | 5 | 4 | 3 |
| Totals | No. | 477 | 460 | 441 | 431 |
| Overtime worked by wage earners | hrs(000) | 66 | 62 | 56 | 64 |
| Operating expenditure— | |||||
| Salaries and wages paid— | |||||
| Managerial, accountants, and clerks— | |||||
| Males | $(000) | 265 | 311 | 334 | 363 |
| Females | $(000) | 73 | 81 | 88 | 107 |
| Professional and technical— | |||||
| Males | $(000) | 71 | 74 | 77 | 91 |
| Females | $(000) | - | - | - | - |
| Wage earners— | |||||
| Males | $(000) | 1,010 | 1,159 | 1,187 | 1,319 |
| Females | $(000) | 10 | 10 | 9 | 5 |
| Total salaries and wages | $(000) | 1,427 | 1,635 | 1,695 | 1,885 |
| Costs of materials used, etc. | $(000) | 1,982 | 2,003 | 2,268 | 2,329 |
| Other expenditure, including interest and depreciation | $(000) | 744 | 795 | 931 | 979 |
| Total operating expenditure | $(000) | 4,153 | 4,433 | 4,894 | 5,193 |
| Revenue— | |||||
| Product sales | $(000) | 3,443 | 3,471 | 3,752 | 3,846 |
| Subsidies | $(000) | 667 | 773 | 1,133 | 1,349 |
| Other revenue (net) | $(000) | 132 | 136 | 178 | 205 |
| Total revenue | $(000) | 4,242 | 4,381 | 5,063 | 5,400 |
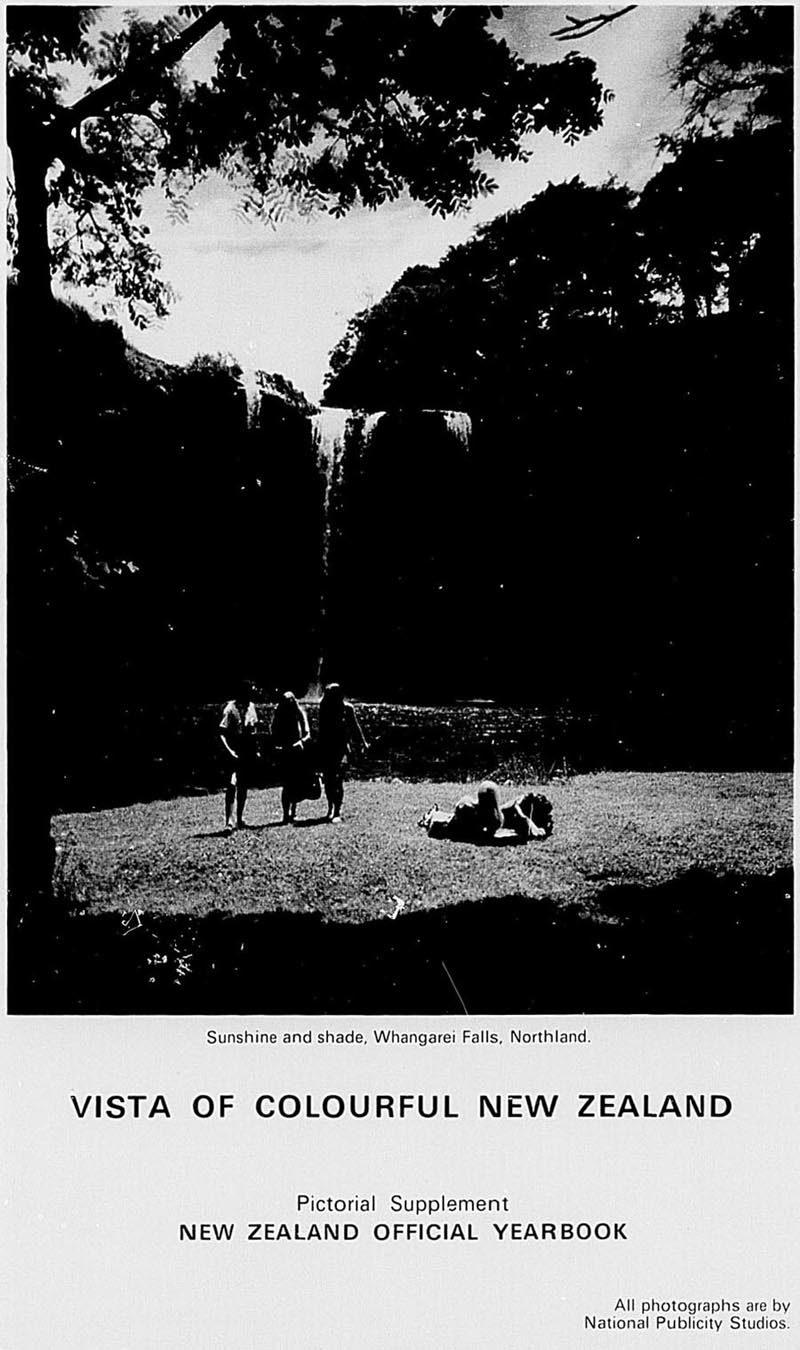
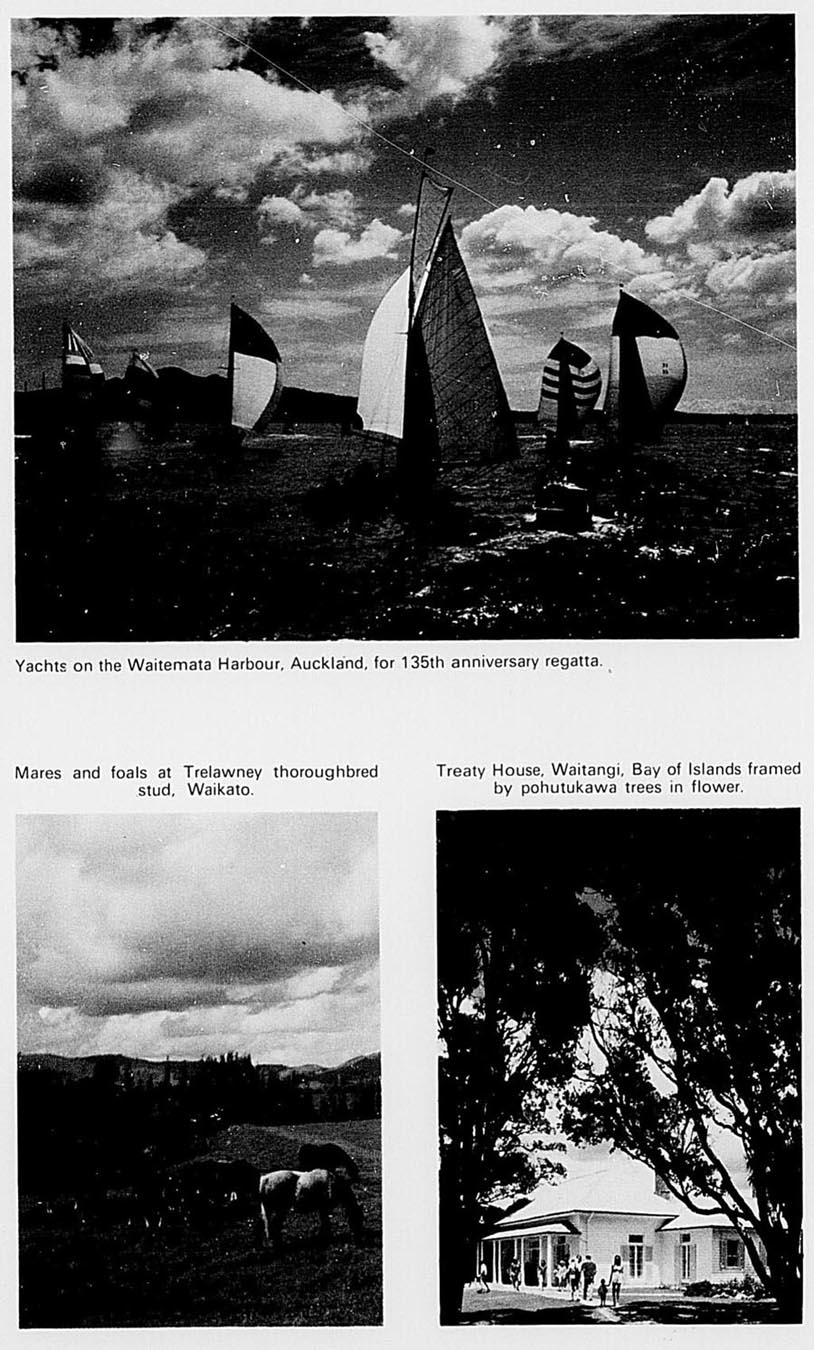
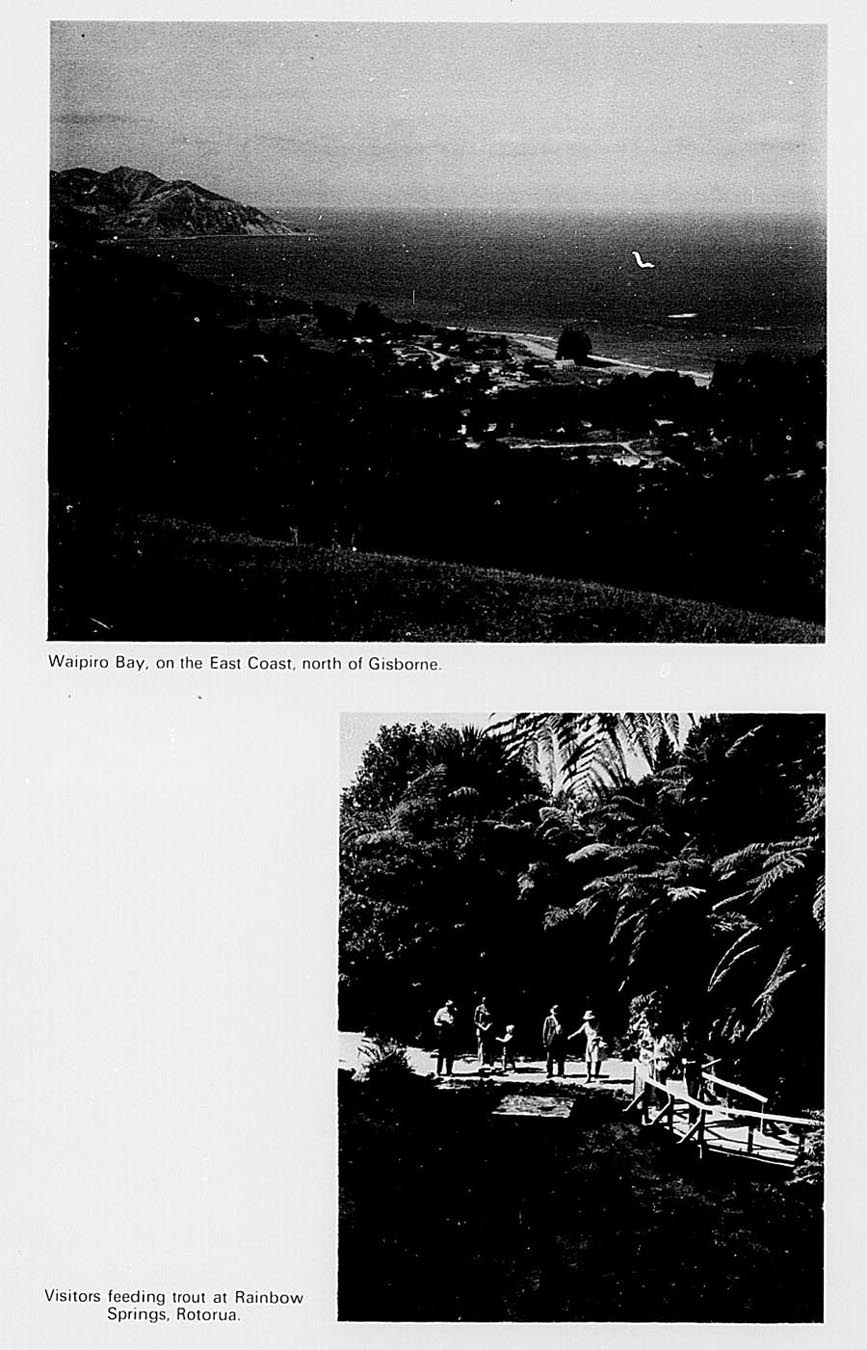
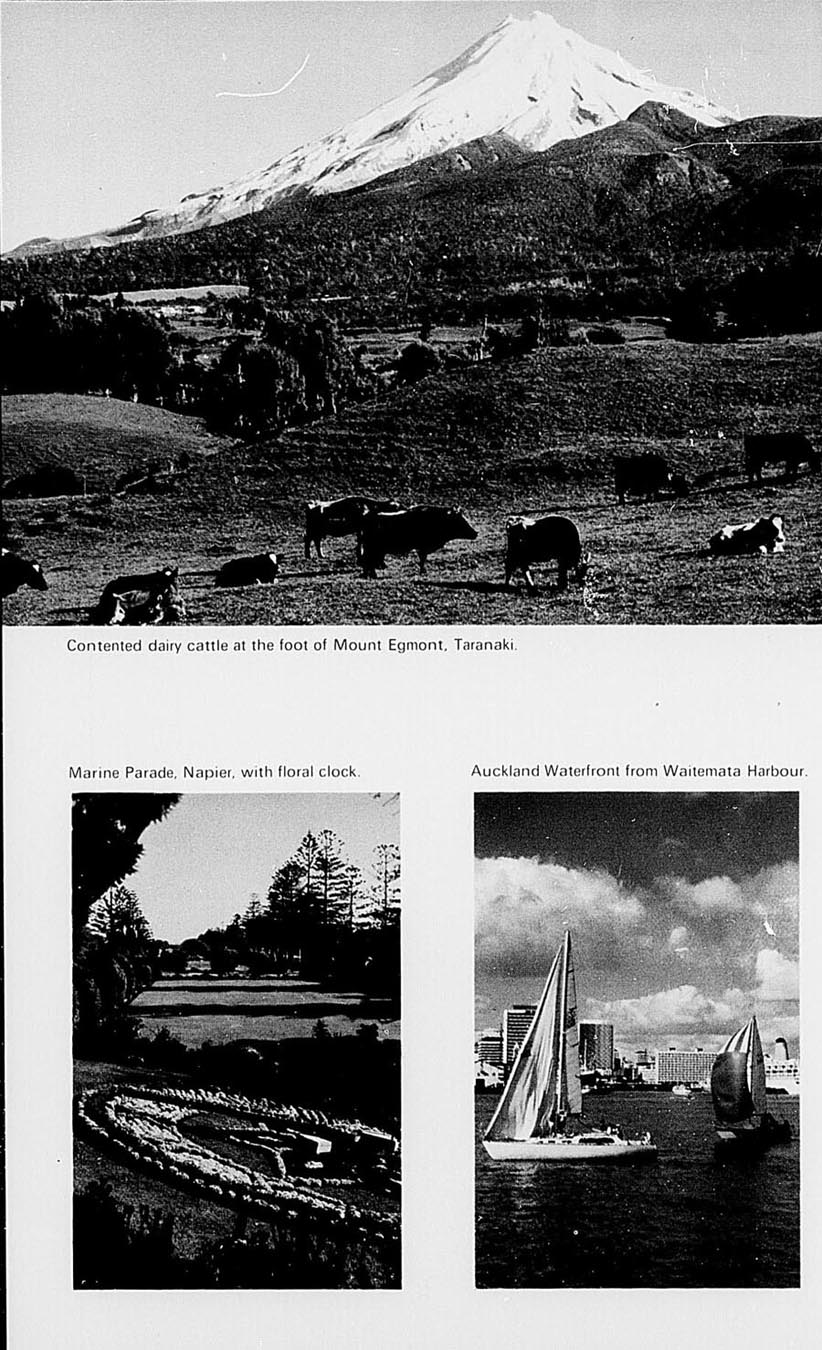
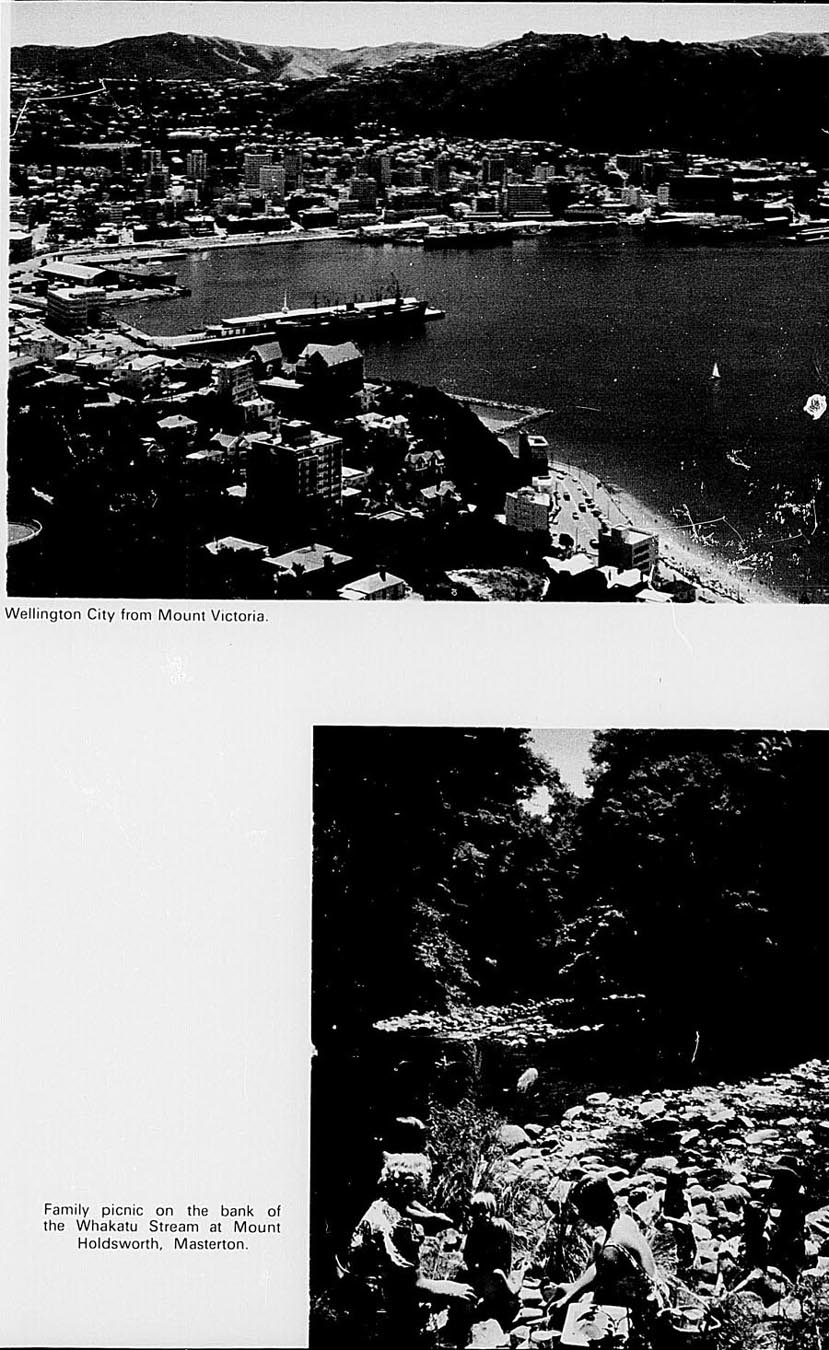
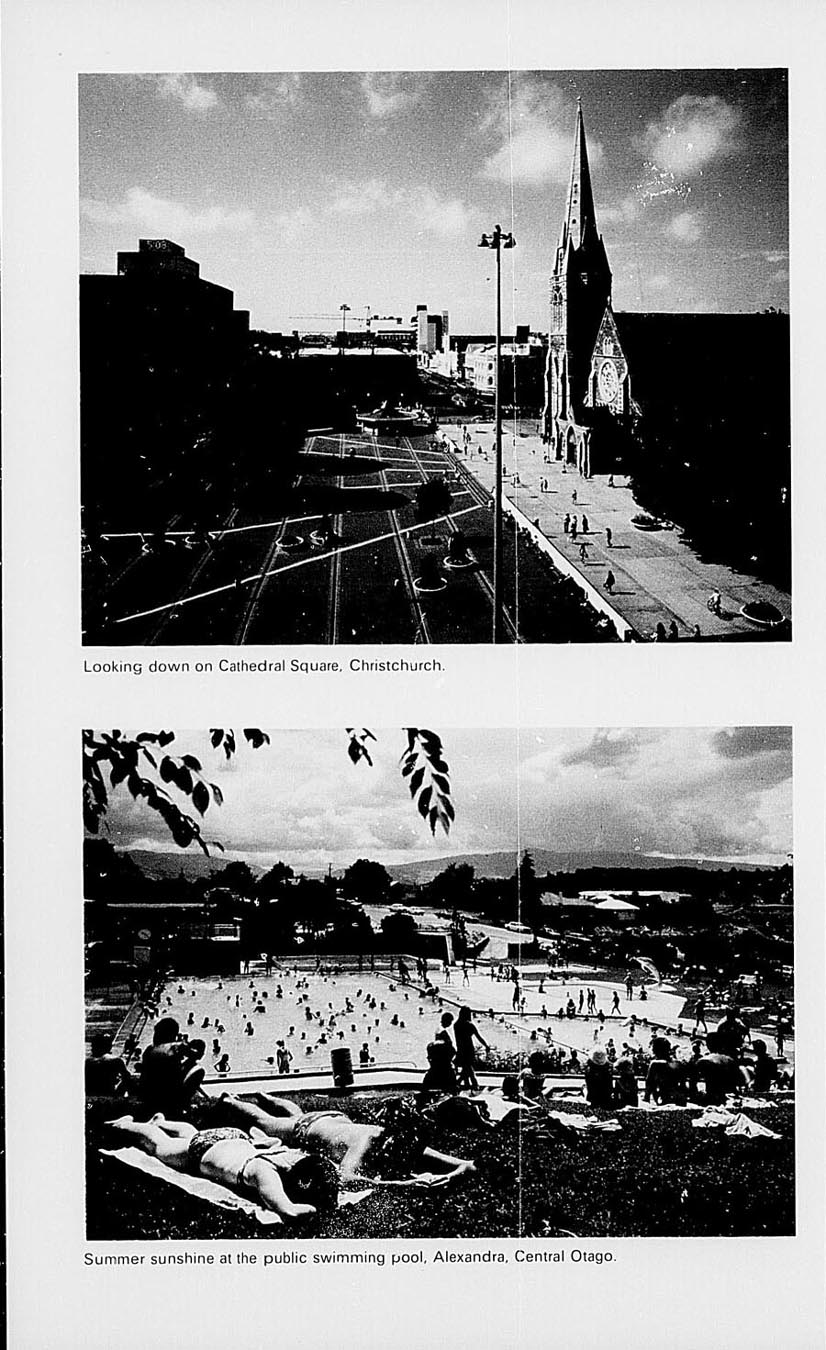
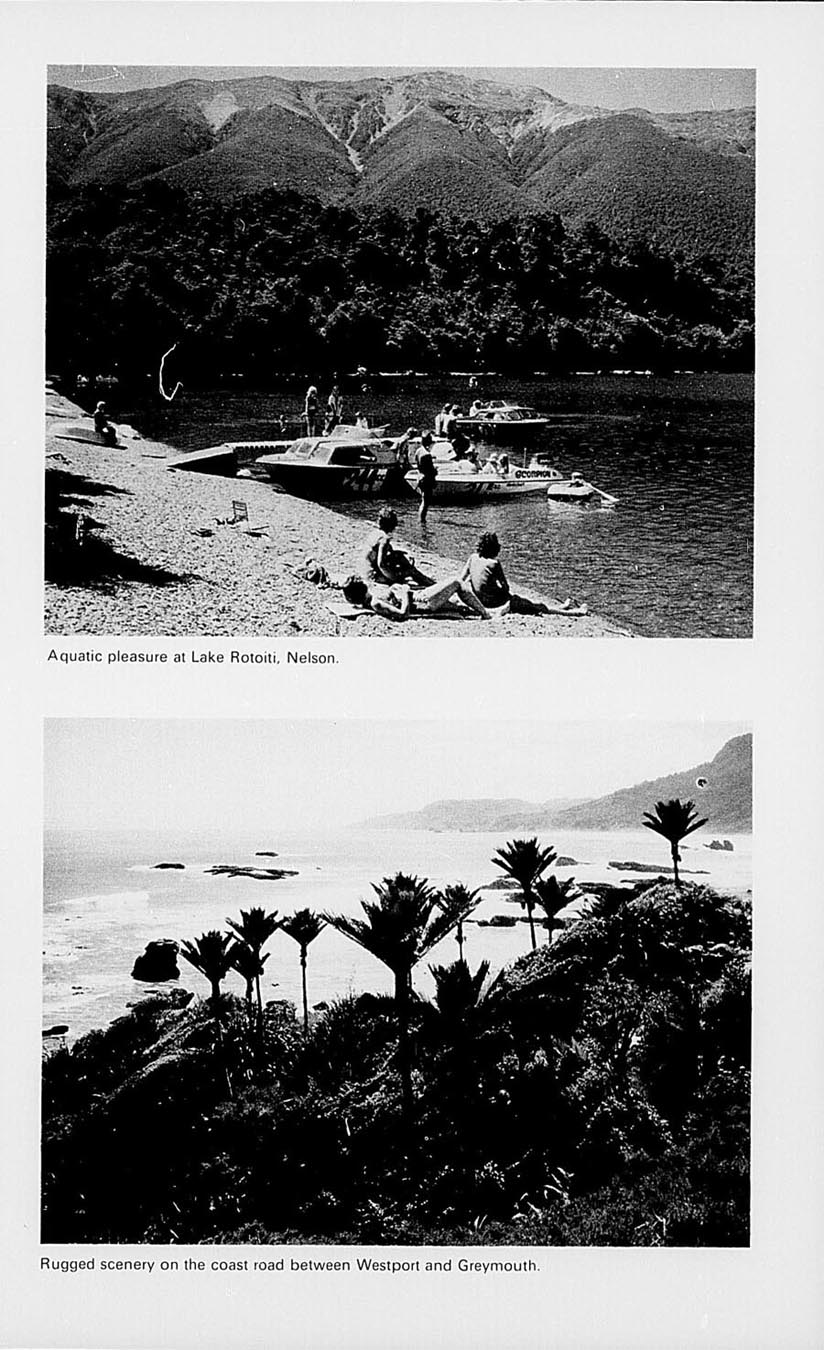
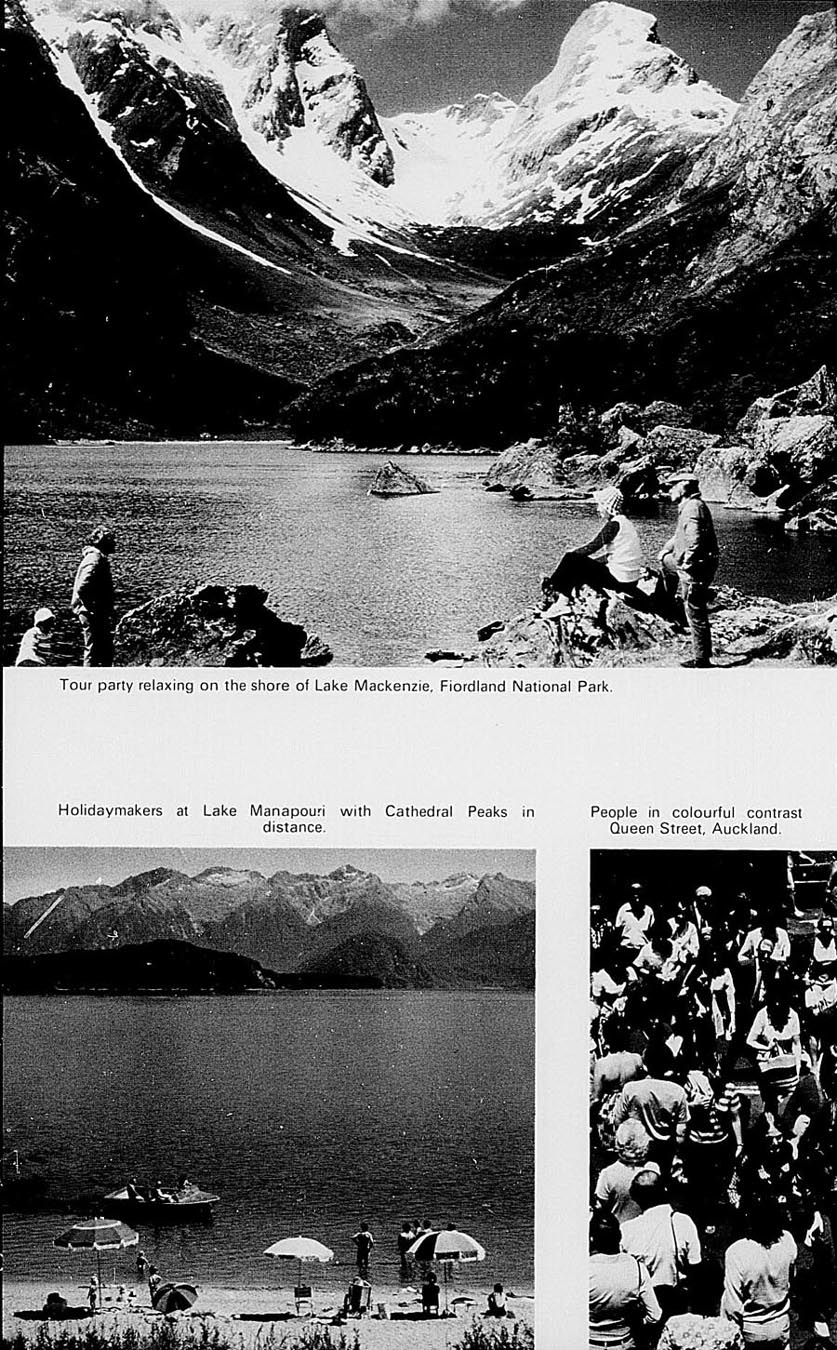
DISTRIBUTION OF NATURAL GAS BY GAS UNDERTAKINGS—The following table shows the amount of natural gas purchased and available for distribution by gas undertakings, and how distribution was effected over the last 4 years.
| Item | 1970-71 | 1971-72 | 1972-73 | 1973-74 |
|---|---|---|---|---|
| Purchases— | ||||
| Purchased by gas undertakings | 13,916 | 33,022 | 43,989 | 54,733 |
| Less— | ||||
| Internal consumption by gas undertakings | 51 | 159 | 737 | 498 |
| Quantity available for distribution | 13,865 | 32,863 | 43,252 | 54,236 |
| Distribution— | ||||
| Distribution losses | 8,846 | 14,864 | 15,306 | 16,707 |
| Sales— | ||||
| Domestic | 5,019 | 5,508 | 7,039 | 7,455 |
| Industrial and commercial | 12,491 | 20,907 | 30,074 | |
| Total distribution | 13,865 | 32,863 | 43,252 | 54,236 |
The next table summarises for the lastest 4 years the main statistics of the 9 gas undertakings.
| Item | 1970-71 | 1971-72 | 1972-73 | 1973-74 | |
|---|---|---|---|---|---|
*Included in managerial, etc., to avoid disclosure of individual details. †Total only shown to avoid disclosure of confidential information. | |||||
| Establishments | No. | 9 | 9 | 9 | 9 |
| Persons engaged— | |||||
| Managerial, accountants, and clerks— | |||||
| Males | No. | 151 | 130 | 148 | 148 |
| Females | No. | 68 | 48 | 71 | 77 |
| Professional and technical— | |||||
| Males | No. | 50 | 45 | 46 | 56 |
| Females | No. | 1 | 1 | 1 | 3 |
| Wage earners— | |||||
| Males | No. | 329 | 358 | 328 | 320 |
| Females | No. | - | 7 | 4 | 1 |
| Totals | No. | 599 | 589 | 598 | 605 |
| Overtime worked by wage earners | No. | 90 | 108 | 107 | 142 |
| Operating expenditure— | |||||
| Salaries and wages paid— | |||||
| Managerial, accountants, and clerks— | |||||
| Males | $(000) | 556 | 564 | 600 | 690 |
| Females | $(000) | 146 | 110 | 175 | 209 |
| Professional and technical— | |||||
| Males | $(000) | 175 | 162 | 178 | 235 |
| Females | $(000) | 12 | |||
| Wage earners— | |||||
| Males | $(000) | 1,222 | 1,411 | 1,288 | 1,548 |
| Females | $(000) | 12 | 6 | * | |
| Totals, salaries and wages | $(000) | 2,100 | 2,259 | 2,247 | 2,695 |
| Costs of purchased natural gas | $(000) | 631 | 1,495 | 1,980 | 2,475 |
| Costs of other materials used, etc. | $(000) | 1,648 | 508 | 143 | 112 |
| Other expenditure, including interest and depreciation | $(000) | 740 | 1,457 | 1,734 | 1,469 |
| Total operating expenditure | $(000) | 5,119 | 5,719 | 6,104 | 6,751 |
| Revenue | |||||
| Products sales | $(000) | 4,473 | 4,978 | 6,275† | 7,385† |
| Subsidies | $(000) | 320 | 64 | ||
| Other revenue (net) | $(000) | 76 | 271 | ||
| Total revenue | $(000) | 4,870 | 5,313 | 6,275 | 7,385 |
Table of Contents
DEPENDENCE ON AGRICULTURAL AND PASTORAL EXPORTS—Products of animal origin average annually over 75 percent of the total value of New Zealand exports, and agricultural exports of grass seed and fruit can be added to raise even higher the value of exports of farm produce. New Zealand is the largest exporter in the world of butter and (in some years) of meat, and is also one of the leading exporters of wool and cheese.
The following table of exports by value indicates the relative importance of farm products.
| Year Ended 30 June | Dairy Produce | Meat | Wool | Hides, Pelts, and Skins | Total Exports* | ||||
|---|---|---|---|---|---|---|---|---|---|
| Butter | Cheese | Milk Powder, etc. | Casein | Total (including Other) | |||||
*Of New Zealand produce. †Provisional. ‡Amended figures. | |||||||||
| $(million) | |||||||||
| 1969 | 114.8 | 42.6 | 23.1 | 21.7 | 204.7 | 309.4 | 212.4 | 55.4 | 968.9 |
| 1970 | 109.7 | 44.3 | 31.1 | 25.8 | 213.8 | 368.9 | 204.2 | 48.7 | 1,064.5 |
| 1971 | 113.9 | 48.0 | 34.1 | 30.2 | 228.9 | 390.8 | 187.8 | 50.6 | 1,108.1 |
| 1972 | 183.9 | 66.3 | 76.5 | 25.4 | 355.2 | 399.0 | 228.6 | 62.2 | 1,346.6 |
| 1973† | 135.1‡ | 79.4 | 87.0 | 22.0 | 326.1‡ | 539.8 | 424.2 | 96.4 | 1,753.7‡ |
| 1974† | 107.2 | 61.8 | 130.6 | 28.6 | 330.7 | 534.8 | 363.4 | 67.2 | 1,744.7 |
The countries of destination for some of the main exports for 1972-73 are shown in the following table on a percentage basis.
| Country of Destination | Butter | Cheese | Lamb | Beef and Veal | Mutton | Wool |
|---|---|---|---|---|---|---|
| United Kingdom | 70.8 | 69.0 | 74.7 | 8.2 | 5.3 | 17.4 |
| United States | 0.97 | 12.0 | 4.0 | 66.7 | - | 7.3 |
| Japan | 4.37 | 7.4 | 2.8 | 3.5 | 73.6 | 12.8 |
| Canada | 5.05 | - | 2.1 | 9.1 | 0.2 | 0.5 |
| France | - | - | 0.6 | 0.3 | 0.3 | 7.7 |
| Belgium | - | - | 0.5 | 0.2 | 0.2 | 7.2 |
| West Germany | 0.04 | 0.2 | 2.0 | 0.1 | 0.2 | 7.7 |
| Italy | - | - | 1.1 | 0.1 | 0.1 | 3.8 |
| Other | 19.5 | 11.4 | 10.6 | 11.7 | 20.1 | 35.6 |
| Totals | 100.0 | 100.0 | 100.0 | 100.0 | 100.0 | 100.0 |
The United Kingdom has always been New Zealand's main export market for farm products. Until Britain joined the European Economic Community the British consumer had virtually unrestricted availability of New Zealand supplies of butter, cheese, and lamb as a result of the mutually advantageous trading arrangements made between Britain and New Zealand over a long period, which reflected close political and economic connections between their people and governments.
GENERAL MARKETING SITUATION: Meat—Most meat produced in the world is supplied to domestic markets, and only about 8 percent of world output enters into international trade. Among the few countries with significant levels of exports are Australia, New Zealand, Argentina, the Netherlands, Denmark, and the Irish Republic. The chief flows of trade are to Western Europe, in particular the United Kingdom (which accounts for over one-quarter of world trade) and, more recently, the United States and Japan. The United Kingdom continues to be by far the largest market for lamb; New Zealand's lamb exports are heavily dependent on this market. With the Common Market countries, the pattern of trade has been greatly affected by the beef and veal regulations of the common agricultural policy.
For some years New Zealand has made a drive for supplementary markets for its increased production and now lists over 100 countries as buyers of its meat. Of these three may be regarded as major markets. They are the United Kingdom which is currently taking about 75 percent of New Zealand's lamb; Japan, which is taking about 60 percent of New Zealand's export mutton production; North America (United States and Canada) which is taking about 80 percent of the beef and veal exports. In the late 1950s a strong demand developed in the United States for manufacturing grades of beef. This was a result of changes in the composition of the American beef herd which in the main is grain-fed and carries more fat than the consumer requires. The trimmings need to be supplemented with the lean-type beef that New Zealand (and Australia among others) can provide. From 1968 to 1972 New Zealand producers and exporters had to contend with what is termed a “voluntary quota agreement” which applied to all United States imports of fresh, chilled, or frozen meat except lamb. Under this system New Zealand, along with other suppliers, agreed to restrict the tonnage of quota meats shipped for arrival in the United States during the calendar year to a pre-set quota figure. If any country exceeded its quota a trigger point could be reached forcing the United States administration to introduce a global quota. Because of the shortage of beef in the United States and rising prices, restrictions on imports were suspended in July 1972.
Imports into the United States of some classes of fresh, chilled, or frozen meat are shown in the following table. (Source: Commonwealth Secretariat.)
| Country of Export | Beef and Veal | Mutton and Lamb | ||||||
|---|---|---|---|---|---|---|---|---|
| 1970 | 1971 | 1972 | 1973 | 1970 | 1971 | 1972 | 1973 | |
| tonnes(000) | ||||||||
| New Zealand | 110 | 109 | 121 | 132 | 10 | 6 | 9 | 10 |
| Australia | 239 | 226 | 305 | 316 | 27 | 26 | 33 | 8 |
| Canada | 35 | 35 | 26 | 25 | - | - | - | - |
| Republic of Ireland | 31 | 29 | 14 | 10 | - | - | - | - |
| Mexico | 36 | 36 | 37 | 30 | - | - | - | - |
| Other countries | 62 | 64 | 87 | 96 | - | - | - | - |
| Total imports | 513 | 499 | 590 | 609 | 37 | 32 | 42 | 18 |
| United States production | 9,999 | 10,076 | 10,272 | 9,700 | 245 | 247 | 241 | 228 |
Canada is New Zealand's second biggest customer for beef and veal. Shipments in the year ended September 1974 totalled 25,600 tonnes compared with 21,800 tonnes in the preceding year.
In Japan there is a demand for mutton which is used mainly for processing into sausage-type foods. Shipments in the year ended September 1974, including that to South Korea which is processed and reshipped to Japan totalled 62,000 tonnes compared with 73,000 tonnes in the preceding year. Iran has now become a customer for mutton.
It has been the policy of the Meat Board to diversify exports of lamb. The initiative for this was associated partly with the likelihood of Britain joining the EEC (which has been now realised and brought with it the possibility of a more comprehensive system of protection than the present tariff), but also because of the need to cushion continued dependence on only one market.
In 1960 there was established the Meat Export Development Company, an organisation charged with the responsibility of the orderly development of New Zealand lamb marketing in the United States and Canada. All New Zealand lamb sales to these countries are controlled by this company whose directorate is composed of nominees of the New Zealand Meat Producers Board and representatives of the freezing companies. The head office of the company (known as Devco or Medco) is in Wellington while the North American operations are controlled from Toronto.
There is a Market Development Committee which consists of representatives of the Meat Board and the meat export trade. Each year, the committee sets a percentage of lamb exports to be sold in markets other than the United Kingdom, and it levies exporters 2.2c a kg on the shortfall below the target figure. When the scheme was instituted in the 1966-67 season, the development target was 10 percent. This was gradually increased to 22 percent for the 1971-72 and 1972-73 seasons. In March 1973, the scheme was suspended for the remainder of the season when it became apparent that there would be a marked drop in lamb supplies in the United Kingdom. The 1973-74 and 1974-75 targets were set at 23 percent and 29 percent respectively.
In 1971 the United Kingdom imposed levies on all imports of beef and veal and, more importantly for New Zealand, lamb and mutton. The purpose of the levies was ostensibly to bring about an overall increase in the price of meat in Britain and thereby reduce the burden of deficiency payments imposed upon the British Treasury. The first stage of the lamb levy, namely £9.33 a ton, was introduced on 1 July 1971, and this was increased to £18.67 a ton on 1 January 1972. The proposed third and final stage of the levy was abandoned in November 1972 following representations by New Zealand.
On 1 January 1974 Britain began phasing in the EEC Common Customs Tariff rate of 20 percent on sheep-meat.
By July 1977 the import levy of 0.83 new pence per lb on lamb will be phased out and the EEC Common External Tariff of 20 percent phased in. How this is being done is set out below.
| Date | Import Levy | Common External Tariff |
|---|---|---|
| U.K.p | % | |
| 1973 | 0.83 | - |
| Jan 1974 | 0.50 | 8 |
| Jan 1975 | 0.33 | 12 |
| Jan 1976 | 0.17 | 16 |
| Jul 1977 | - | 20 |
The levy on mutton is half that on lamb.
Major lamb markets outside the United Kingdom and North America in the 1973-74 season, despite trade impediments in some countries to developing the trade, were Japan (5,700 tonnes), Greece (5,100 tonnes), Iraq (3,700 tonnes), Iran (3,300 tonnes), Jordan (3,200 tonnes), West Germany (3,200 tonnes), the Netherlands (1,800 tonnes), and Italy (1,300 tonnes).
Wool—New Zealand is one of the largest exporters of wool in the world. Most of the wool is auctioned in New Zealand and buyers come from all the main importing countries to make their purchases of wool. A small percentage of wool produced is shipped to England for sale. Prices fluctuate according to the demand for wool. After a period of relative price stability dating back to the early 1950s, demand slackened in late 1966 and prices remained low for the next 4 years. Following a recovery which reached a peak toward the end of 1973 the market again declined sharply although not to the low levels of the late 1960s. The threat of competition from synthetic materials is such that the International Wool Secretariat is actively promoting advertising, merchandising, and research.
World wool production increased steadily until 1968-69, particularly in Australia, New Zealand, and the Soviet Union. This growth reflected improvements both in carrying capacity per acre (number of sheep) and in wool production per sheep. Of the increase, probably over two-thirds stemmed from the upward trend in sheep population and the remainder from improved output per head of sheep. Since the 1968-69 record level, world production has shown a downward trend although New Zealand production reached its highest level to date in the 1970-71 season. It is expected that the downward trend will be reversed in 1974-75. Since the Second World War there has been no significant change in the broad geographical distribution of production which remains concentrated in Australia, New Zealand, Argentina, South Africa, and Uruguay—all of which export on a large scale—and in the United States and the Soviet Union, neither of whose clips enters the international market to any significant extent. These countries account for 75 percent of world production; of the world total Australia alone produces 33 percent, and with New Zealand, Argentina, and South Africa some 52 percent.
The distribution of wool production does not, of course, coincide exactly with the distribution of the sheep population, since the production of wool or yield per sheep varies considerably. While there is undoubtedly scope for improvement in a number of the lower yielding countries, the yields, are determined by the type of pasture, breed of sheep, average age of flock, and age of sheep at slaughter. Variations in yield between countries, therefore, do not necessarily reflect variations in efficiency but rather differences in pastoral conditions and objectives in farming.
Sheep numbers and wool production for selected countries are shown in the following table. (Source: Commonwealth Secretariat.)
| Country | Woolled Sheep | Wool Production | |||||
|---|---|---|---|---|---|---|---|
| 1970 | 1971 | 1972* | 1970-71 | 1971-72 | 1972-73* | ||
*Provisional. †Revised series; previously included some non-woolled sheep. | |||||||
| (million) | tonnes(000) greasy | ||||||
| Australia | 180.1 | 178.3 | 163.9 | 889 | 870 | 770 | |
| New Zealand | 60.3 | 58.9 | 59.2 | 334 | 322 | 309 | |
| Argentina | 44.3 | 42.7 | 39.0 | 200 | 189 | 194 | |
| South Africa† | 32.5 | 30.3 | 29.1 | 123 | 113 | 107 | |
| Uruguay | 19.9 | 16.0 | 18.0 | 78 | 54 | 60 | |
| United States | 20.3 | 19.6 | 18.7 | 85 | 82 | 77 | |
| United Kingdom | 26.1 | 26.0 | 26.9 | 47 | 48 | 47 | |
| U.S.S.R. | 130.7 | 138.0 | 139.9 | 419 | 429 | 419 | |
| Whole world | 952.0 | 951.0 | 932.0 | 2,756 | 2,681 | 2,566 | |
The major importing countries for raw wool are shown in the following table. (Source: Commonwealth Secretariat.)
| Country of Import | 1969 | 1970 | 1971 | 1972 | 1973 |
|---|---|---|---|---|---|
| tonnes(000) | |||||
| Belgium | 96.8 | 95.3 | 75.6 | 69.3 | 53.4 |
| France | 161.3 | 158.5 | 171.1 | 164.6 | 121.5 |
| Italy | 135.8 | 126.9 | 104.3 | 120.8 | 84.6 |
| Japan | 315.8 | 320.5 | 307.8 | 348.1 | 315.7 |
| United Kingdom | 234.3 | 205.6 | 160.5 | 207.1 | 150.8 |
| United States | 113.2 | 91.5 | 72.8 | 55.7 | 34.5 |
| West Germany | 109.5 | 98.4 | 111.3 | 115.7 | 58.9 |
Dairy Produce—In recent years the whole nature of world dairy trade has changed. There are now four main dairy exporters, namely New Zealand, EEC, Australia, and Canada, in that order of magnitude, who provide about four-fifths of all exports. Poland, the Soviet Union, and a number of other countries export relatively smaller quantities.
The change on the importing side is far more significant, and nowadays about two-thirds of international trade flows to the less affluent countries of Asia, Latin America, and Africa, in that order.
The Dairy Board exports annually about 600,000 tonnes of manufactured dairy products, of which about 250,000 tonnes will go to the affluent countries in Europe, North America, and Japan and 350,000 tonnes to the rest of the world, with a heavy emphasis on South-east Asia and Latin America.
Trade in the developing countries is in some ways more secure than the others because of their dependence on our supplies and because Governments are in many cases positively involved. They cannot risk a stoppage which would affect people's food, jobs, and public health programmes, and sometimes the development of local dairy production as well.
Nevertheless international dairy trade remains marginal in character and it is still vulnerable to fluctuations from external causes whether these be climatic, commercial, or political. New Zealand now relies on the United Kingdom for less than half the value of its dairy export exchange earnings, although the United Kingdom remains the principal market for butter.
Industrial countries have a tendency to express social and political policies towards their farmers through price support mechanisms; high prices which are fixed with little regard to commercial reality encourage production but discourage consumption, thus creating surpluses. Disposal of these surpluses at cut rates, with Government support, in such free markets as have existed, has further limited the opportunities for profitable diversification.
New Zealand has had minimal success in GATT or in other international organisations in its attempts to negotiate improved conditions of access for agricultural products in developed countries apart from Britain. New Zealand has maintained strong and consistent pressure in international councils to achieve a stable balance between supply and demand in international trade, particularly in agricultural products. A significant step was made in 1971 when the EEC undertook in the Luxembourg Agreement “to make every effort to promote the conclusion of an international agreement on dairy produce; and to pursue a trade policy which will not frustrate New Zealand's efforts to diversify”. In 1970, the GATT minimum international selling price for skim-milk powders of US $180 a tonne was established and since then has been progressively raised to a level of US $350 a tonne. In 1971 negotiations for the establishment of minimum prices for butter and anhydrous milkfat continued until, in 1973, agreement was reached to establish a minimum price for anhydrous milkfat of US $680 per tonne.
In 1970 total world production of butter by 26 of the main producing countries of the world amounted to 4.3 million tons. In the same year world exports by 16 of the leading exporters amounted to about 739,000 tons, that is, only about 17.2 percent of world production entered into international trade. However, since trade between the member states of the EEC does not enter international trade as such, this percentage is in effect considerably lower. Of this quantity 388,400 tons came onto the United Kingdom market. Total international trade in butter outside Europe is relatively small in relation to total world production and relatively small surpluses in large producing countries when exported via subsidies can have a disproportionate effect on world trade.
The following tables compare production and exports of butter, cheese, and skim-milk powder by selected countries. (Sources: Commonwealth Secretariat; United States Department of Agriculture.)
| PRODUCTION | ||||||||||||
|---|---|---|---|---|---|---|---|---|---|---|---|---|
| Country | Butter | Cheese | Skim-milk Powder | |||||||||
| 1970 | 1971 | 1972 | 1973 | 1970 | 1971 | 1972 | 1973 | 1970 | 1971 | 1972 | 1973 | |
*Twelve months ended 30 June of following year. †Twelve months ended 31 May of following year. | ||||||||||||
| tonnes(000) | ||||||||||||
| Australia* | 203 | 195 | 185 | 175 | 78 | 81 | 93 | 96 | 92 | 93 | 118 | 142 |
| Canada | 149 | 130 | 132 | 114 | 75 | 87 | 87 | 86 | 164 | 137 | 156 | 140 |
| Denmark | 131 | 123 | 136 | 146 | 111 | 120 | 131 | 127 | 31 | 32 | 52 | 53 |
| France | 483 | 474 | 539 | 555 | 781 | 819 | 869 | 893 | 642 | 688 | 688 | 730 |
| Ireland, Republic of | 73 | 76 | 76 | 84 | 28 | 33 | 46 | 41 | 53 | 52 | 82 | 119 |
| Netherlands | 121 | 126 | 165 | 169 | 270 | 298 | 318 | 326 | 95 | 85 | 125 | 120 |
| New Zealand† | 233 | 249 | 242 | 219 | 108 | 104 | 101 | 89 | 125 | 197 | 189 | 194 |
| United Kingdom | 64 | 66 | 95 | 96 | 131 | 162 | 184 | 181 | 94 | 109 | 169 | 156 |
| United States | 517 | 522 | 510 | 429 | 999 | 1,077 | 1,181 | 1,203 | 655 | 643 | 561 | 439 |
| West Germany | 494 | 462 | 485 | 510 | 222 | 230 | 249 | 252 | 344 | 337 | 432 | 460 |
| EXPORTS | ||||||||||||
|---|---|---|---|---|---|---|---|---|---|---|---|---|
| Country | Butter | Cheese | Skim-milk Powder | |||||||||
| 1970 | 1971 | 1972 | 1973 | 1970 | 1971 | 1972 | 1973 | 1970 | 1971 | 1972 | 1973 | |
*Twelve months ended 30 June of following year. †Including donations shipped overseas. | ||||||||||||
| Australia* | 71 | 36 | 58 | 38 | 36 | 33 | 30 | 38 | 50 | 42 | 48 | 94 |
| Canada | 2 | – | – | – | 18 | 15 | 10 | 5 | 135 | 109 | 52 | 121 |
| Denmark | 87 | 77 | 87 | 100 | 68 | 70 | 75 | 84 | 47 | 59 | 67 | - |
| Finland | 29 | 20 | 19 | 12 | 21 | 21 | 20 | 23 | – | – | – | 6 |
| France | 98 | 59 | 27 | 172 | 98 | 129 | 158 | 160 | 268 | 226 | 172 | 227 |
| Ireland, Republic of | 46 | 32 | 38 | 49 | 24 | 28 | 26 | 39 | 38 | 43 | 36 | 125 |
| Netherlands | 103 | 92 | 97 | 161 | 173 | 180 | 184 | 210 | 25 | 11 | 14 | 48 |
| New Zealand* | 194 | 185 | 172 | 160 | 93 | 88 | 95 | 70 | 126 | 155 | 161 | 216 |
| United Kingdom | 2 | 2 | 3 | 13 | 3 | 3 | 4 | 6 | 22 | 31 | 44 | 114 |
| United States | – | 39 | 19 | 2 | 3 | 3 | 3 | 3 | 189† | 162† | 128† | 8† |
| West Germany | 30 | 73 | 19 | 115 | 52 | 58 | 64 | 82 | 143 | 209 | 191 | 201 |
Much of the exports of Denmark, France, Netherlands, and West Germany are transfers within the European Economic Community and as such do not really enter into international trade.
In the United Kingdom market for butter and cheese entering under Protocol 18 of the Luxembourg Agreement from 1 February 1973 New Zealand was guaranteed a c.i.f. price of £361 a ton for butter and £312 a ton for cheese. In 1973 monetary compensatory amounts became available and these went some way towards compensating New Zealand for the decline in the sterling value of the c.i.f. price In November 1974 the EEC agreed to a rise of 18 percent in the prices New Zealand gets for its butter and cheese exports to Britain. The adjustment was based on New Zealand's claim that inflation and rising freight and production costs had severely eroded returns to New Zealand farmers.
Skim-milk Powder—The world production of skim-milk powder has expanded over recent years. The skim-milk powder output of 11 West European countries and Australia, New Zealand, Canada, and the United States totals about 2.5 million tonnes. World demand is buoyant, stimulated by a growing number of milk recombining plants in Asia, South America, Africa, and the Caribbean. Much of the world trade in skim-milk powder is covered by pricing arrangements set well in advance of delivery.
In recent years, New Zealand's exports to South-east Asia and Central and South America have increased heavily with the growth in trade to milk recombining plants. New Zealand's share in the growth, especially in South-east Asia, has been due to three main advantages over other suppliers—nearness to the market, regularity as a supplier, and ability to supply the specialised range of skim-milk powders required to produce reconstituted milk.
Casein—Lactic casein, which is produced from skim milk is being put to an increasing range of uses. It is used as high-grade protein in sausage and other food fillings, as the bulk material for various types of pharmaceutical drugs, and in the manufacture of coatings for high quality paper. New Zealand is the largest exporter of casein, with much of the production going to the United States, Japan, and EEC countries.
The chief countries exporting and importing casein are shown in the following table. (Source: Commonwealth Secretariat.)
| Country of Export | 1970 | 1971 | 1972 | 1973 |
|---|---|---|---|---|
| *Years ended 30 June of following year. | ||||
| tonnes(000) | ||||
| New Zealand* | 69.5 | 42.1 | 27.8 | |
| Australia* | 26.9 | 29.8 | 15.0 | |
| France | 11.4 | 15.0 | 16.6 | 18.9 |
| Argentina | 7.1 | 6.9 | 8.7 | 8.6 |
| Poland | 4.9 | 7.4 | 10.5 | |
| Country of Import | 1,970 | 1,971 | 1,972 | 1,973 |
| United States | 56.9 | 43.9 | 44.1 | 46.9 |
| Japan | 25.7 | 24.6 | 20.8 | 19.5 |
| West Germany | 16.6 | 17.1 | 12.3 | 11.3 |
| United Kingdom | 8.1 | 7.6 | 4.2 | 4.7 |
| Italy | 11.4 | 9.0 | 8.7 | 7.9 |
Since 1970 there has been a world decline in the availability of liquid skim milk for casein manufacture, due to the higher return available from the alternative manufacture of skim-milk powder. New Zealand has attempted to maintain supplies of casein, but fluctuations in prices and availability of casein have caused some industrial users to shift to substitutes.
On the other hand there has been an increase in demand for casein and casein derivatives for edible uses.
Diversification of Markets—New Zealand's dairy exports to markets outside the United Kingdom have steadily increased. In 1955, only 13 percent of the value of New Zealand's total dairy exports went to countries outside the United Kingdom. By 1970 this had risen to 27 percent, but in 1972 54 percent of the exchange earned from dairy exports came from markets outside the United Kingdom. The greatest increases have been in anhydrous milkfat and skim-milk powder to South-east Asia and Central and South America, in cheese to Japan and the Caribbean, and in casein to the United States, Japan, and Europe. It is expected that the future long-term growth in markets for New Zealand produce will be predominantly outside the United Kingdom, although New Zealand will remain heavily dependent on the United Kingdom as a bulk outlet for her milkfat products.
The following table shows the changing direction of New Zealand's dairy exports over the last 5-year period for June years.
| Product | 1968-69 | 1970-71 | 1972-73 | Percentage to United Kingdom | |||||
|---|---|---|---|---|---|---|---|---|---|
| United Kingdom | All Markets | United Kingdom | All Markets | United Kingdom | All Markets | 1968-69 | 1970-71 | 1972-73 | |
| tonnes(000) | percent | ||||||||
| Butter, milkfat | 186.9 | 206.4 | 160.0 | 191.4 | 127.1 | 174.8 | 90.6 | 83.6 | 72.7 |
| Cheese | 70.3 | 87.7 | 67.8 | 92.5 | 59.9 | 91.2 | 80.2 | 73.3 | 65.7 |
| Milk powder | 19.9 | 131.9 | 7.6 | 157.6 | 2.2 | 200.8 | 15.1 | 4.8 | 1.1 |
| Casein | 5.2 | 50.7 | 5.9 | 70.3 | 2.4 | 29.5 | 10.3 | 8.4 | 8.1 |
| All products | 282.3 | 476.7 | 241.3 | 511.8 | 191.6 | 496.3 | 59.2 | 47.2 | 38.6 |
EUROPEAN ECONOMIC COMMUNITY—The Rome Treaty establishing the European Economic Community (EEC) came into force on 1 January 1958. The member countries were Belgium, France, West Germany, Luxembourg, Italy, and the Netherlands. These countries entered into negotiations which resulted in the abolition of customs duties within the Common Market on 1 July 1968. On the same date the separate customs tariff of the six countries gave way to a single tariff—the common customs tariff of the Community. By that date also much of the common agricultural policy was in operation, although some final negotiations had still to take place. The Common Agricultural Policy, with its high internal prices supported at the Community frontier by variable levies, and its export subsidies, has encouraged the production of surpluses, most notably of dairy products, while reducing consumption.
The danger facing New Zealand was that should Britain, in joining the EEC, accept the common agricultural policy without special arrangements to protect the major items of New Zealand's agricultural trade with Britain, the pastoral industries in particular and the economy in general would be severely damaged.
Before the formal negotiations between Britain and the EEC commenced, the New Zealand Government engaged in discussions with the British Government and listed the requirements which were regarded as necessary to safeguard New Zealand's vital interests. These requirements were as follows:
That New Zealand should be able to continue to sell at remunerative prices the quantities of butter and cheese for which it currently received assured access to the British market.
That guarantees of access should not terminate with the transitional period, but that there should be a continuing arrangement subject to periodic review.
That, in the event of the Community adopting a common regulation for sheepmeats, New Zealand should continue to have access for lamb sales on a satisfactory basis.
When the formal negotiations opened in June 1970, the British Government accepted this “statement of claim” for dairy products as the basis for their submission to the Community. In respect of lamb, no negotiations with the EEC were scheduled because of the absence of a common Community regulation. The New Zealand Government accordingly sought from the United Kingdom an understanding that they would not agree to the introduction of a sheepmeats policy which would damage New Zealand's interests.
Negotiations between Britain and the Community formally opened on 21 July 1970. However it was not until a decisive negotiating session held in Luxembourg from 21-23 June 1971 that Britain succeeded in negotiating a special arrangement for New Zealand butter and cheese.
The special arrangement was subsequently incorporated in Protocol 18 to the Treaty of Accession of the applicant countries (United Kingdom, Denmark, and Ireland) to the EEC.
1. The United Kingdom is authorised, as a transitional arrangement, to import from New Zealand certain quantities of butter and cheese on the following terms.
2. The quantities referred to in paragraph 1 shall be:
(a) in respect of butter, for the first five years:
| 1973, 165,811 metric tons |
| 1974, 158,902 metric tons |
| 1975, 151,994 metric tons |
| 1976, 145,085 metric tons |
| 1977, 138,176 metric tons |
(b) in respect of cheese:
| 1973, 68,580 metric tons |
| 1974, 60,960 metric tons |
| 1975, 45,720 metric tons |
| 1976, 30,480 metric tons |
| 1977, 15,240 metric tons |
The Council, acting by a qualified majority on a proposal from the Commission, may make adjustments between those quantities of butter and cheese, provided that the tonnage expressed as milk equivalent corresponding to the total quantities laid down for those two products for the year in question remains unaltered.
3. The quantities of butter and cheese specified in paragraph 2 shall be imported into the United Kingdom at a price, the observance of which must be guaranteed at the c.i.f. stage by New Zealand. That price shall be fixed at a level which enables New Zealand to realise a price representing the average price obtained by that country on the United Kingdom market during 1969, 1970, 1971, and 1972.
4. The products imported into the United Kingdom in accordance with the provisions of this Protocol may not become the subject of intra-Community trade or of re-exportation to third countries.
1. Special levies shall be applied to imports into the United Kingdom of the quantities of butter and cheese specified in Article 1. Article 55 (1) (b) of the Act of Accession shall not be applicable.
2. The special levies shall be fixed on the basis of the c.i.f. price referred to in Article 1 (3) and of the market price of the products in question within the United Kingdom, at a level such as to allow the quantities of butter and cheese to be effectively marketed without prejudicing the marketing of Community butter and cheese.
The Council, acting by a qualified majority on a proposal from the Commission, shall adopt the measures necessary for implementing Articles 1 and 2.
The Community shall continue its efforts to promote the conclusion of an international agreement on milk products so that as soon as possible conditions on the world market may be improved.
1. The Council shall, during 1975, review the situation as regards butter in the light of prevailing conditions and of supply and demand developments in the major producing and consuming countries of the world, particularly in the Community and in New Zealand. During that review, among the considerations to be taken into account shall be the following:
progress towards an effective world agreement on milk products to which the Community and other important producing and consuming countries would be parties;
the extent of New Zealand's progress towards diversification of its economy and exports, it being understood that the Community will strive to pursue a commercial policy which does not run counter to this progress.
2. Appropriate measures to ensure the maintenance after 31 December 1977 of exceptional arrangements in respect of imports of butter from New Zealand, including the details of such arrangements, shall be determined by the Council acting unanimously on a proposal from the Commission in the light of that review.
3. After 31 December 1977, the exceptional arrangements laid down for imports of cheese may no longer be retained.
The pricing arrangements under the Protocol (Article 1:3) are not regarded as satisfactory by New Zealand.
Continued Access—In March 1975 the Common Market heads of government agreed to continued access for New Zealand butter for 3 years after 1977 with regular price adjustments taking into account prices paid to the EEC's own farmers and rising production costs in New Zealand and increased freight rates. The EEC Commission is drawing up details in accordance with the agreement.
The way was also left open for Britain to negotiate protected imports of New Zealand cheese after 1977.
The EEC has not yet implemented a common agricultural policy for sheepmeats. This reflects the low consumption in most member countries. The comparative importance of Britain's sheepmeat consumption suggests that Britain should play an important part in developing sheepmeat policy in the enlarged community. It would be severely detrimental to New Zealand if the effect of any such policy were to restrict access and reduce overall net returns from the sale of lamb to an enlarged EEC. It can be expected that Britain will wish to ensure that imports from these countries, in particular New Zealand on which it is heavily dependent, will not be curtailed.
UNITED KINGDOM MARKET: Dairy Produce—New Zealand's important position in the supply of butter, cheese, and milk powder to the United Kingdom market is illustrated in the following table, showing imports into the United Kingdom, by country of export. Domestic production of butter in the United Kingdom is relatively small in comparison with total supplies. Domestic cheese supplies, on the other hand, are comparatively large, as is also the domestic output of milk powder. (Source: Commonwealth Secretariat.)
| Country of Export | Butter | Cheese | Milk Powder | ||||||||
|---|---|---|---|---|---|---|---|---|---|---|---|
| 1938 | 1971 | 1972 | 1973 | 1938 | 1971 | 1972 | 1973 | 1971 | 1972 | 1973 | |
| tonnes(000) | |||||||||||
| New Zealand | 132 | 146 | 118 | 132 | 83 | 71 | 64 | 48 | 7 | 4 | 1 |
| Australia | 91 | 33 | 28 | 13 | 12 | 7 | 3 | 1 | - | - | - |
| Denmark | 120 | 70 | 71 | 74 | 1 | 10 | 11 | 14 | 2 | ||
| Ireland, Republic of | 30 | 36 | 38 | 25 | 23 | 37 | 19 | 5 | 4 | ||
| Netherlands | 37 | 17 | 17 | 61 | 10 | 17 | 19 | 20 | 2 | 3 | 4 |
| Other countries | 104 | 76 | 74 | 14 | 42 | 37 | 30 | 17 | 11 | 12 | 6 |
| Total Imports | 484 | 373 | 344 | 332 | 148 | 168 | 151 | 137 | 40 | 24 | 17 |
| United Kingdom production | 20 | 66 | 94 | 97 | 44 | 156 | 183 | 181 | 150 | 209 | 192 |
The following table shows the comparative figures for consumption of butter and margarine in the United Kingdom. (Source: Commonwealth Secretariat.)
| Product | 1938 | 1966 | 1967 | 1968 | 1969 | 1970 | 1971 | 1972 | 1973 |
|---|---|---|---|---|---|---|---|---|---|
| kilogram per head | |||||||||
| Butter | 10.9 | 9.1 | 9.3 | 8.8 | 8.7 | 8.5 | 7.9 | 7.0 | 7.6 |
| Margarine | 4.5 | 5.4 | 5.3 | 5.1 | 5.4 | 5.4 | 5.9 | 6.5 | 5.8 |
Meat—The following table shows the imports of meat into the United Kingdom from the principal countries, by country of export. (Source: Commonwealth Secretariat.)
| Country of Export | Mutton and Lamb | Beef and Veal | All Meats* | ||||||||
|---|---|---|---|---|---|---|---|---|---|---|---|
| 1938 | 1971 | 1972 | 1973 | 1938 | 1971 | 1972 | 1973 | 1971 | 1972 | 1973 | |
| *Including pig-meat, offal, bacon and ham. | |||||||||||
| tonnes(000) | |||||||||||
| New Zealand | 187 | 310 | 294 | 239 | 53 | 14 | 13 | 14 | 353 | 333 | 280 |
| Australia | 97 | 33 | 31 | 23 | 117 | 31 | 67 | 86 | 85 | 123 | 135 |
| Argentina | 46 | - | - | - | 360 | 39 | 64 | 59 | 39 | 64 | 59 |
| Denmark | - | - | - | - | - | 1 | 1 | - | 293 | 264 | 263 |
| Ireland, Republic of | 6 | 9 | 3 | 1 | - | 106 | 80 | 48 | 173 | 145 | 80 |
| Other countries | 16 | 2 | 3 | 2 | 69 | 62 | 53 | 63 | 164 | 177 | 164 |
| Total Imports | 352 | 354 | 331 | 265 | 598 | 253 | 278 | 270 | 1,105 | 1,106 | 981 |
| United Kingdom production | 214 | 230 | 219 | 236 | 614 | 953 | 909 | 876 | 1,985 | 2,197 | 2,130 |
THE ORGANISATION OF MARKETING—In a country such as New Zealand which is very dependent upon overseas trade, the efficient organisation of marketing of primary produce takes on a special importance.
Marketing Authorities—Since about 1950 the principle has been accepted that producers should be predominantly responsible for the marketing of their products. The major statutes under which specific marketing authorities operate are the Dairy Board Act 1961, the Meat Export Control Act 1921-22 and the Amendment Acts 1956 and 1971 (for the Meat Producers Board), and the Meat Export Prices Act 1955, the Wool Marketing Corporation Act 1972, the Milk Act 1967, the Apple and Pear Marketing Act 1948, and the Primary Products Marketing Act 1953 (safeguards citrus fruit, honey, and eggs).
Dairy Produce—The New Zealand Dairy Board acquires and markets all New Zealand butter, cheese, milk powder, and casein intended for export, and regulates the marketing of butter and cheese in New Zealand. The New Zealand Dairy Board is a statutory authority operating under the Dairy Board Act 1961 and acts as the administrative body for the industry and as its export marketing agency. Of the board's members, 11 are elected by the co-operative companies and 2 are appointed by the Government. The board acquires all export dairy products from the manufacturing companies, sells the goods overseas, and returns the proceeds, less marketing costs, to the companies.
The board sells its products throughout the world, and is currently exporting to over 90 countries. Sales are made in the United Kingdom through the board's own sales organisation. In other markets, the board sells through local agents, or in the case of some buyers it sells direct, on a contract basis. Increasingly the board is posting its own personnel overseas in key markets as liaison representatives and where warranted, subsidiary trading companies have been established.
Meat—The New Zealand Meat Producers Board was constituted in 1922 under the provisions of the Meat Export Control Act 1921-22 to protect the national and producers' interests. The board obtains funds by the imposition of a levy on all meat exported (except canned meats and offals), the levy being 0.165c per kilogram until October 1973 when it was raised to 0.77c per kilogram.
Funds from the levy totalled $3.7 million in the year ended September 1974. This was below the expected total budgeted for the year because of a shortfall in production and the suspension by the board of the levy on beef and veal for 3 months, to give producers a higher return for their stock. As a consequence just under $0.5 million was advanced from the industry reserve account to finance its activities.
The board's main responsibilities are:
Meat export licensing;
The grading, storage, and shipment of meat;
Market research;
The promotion of New Zealand meat;
Improvement in the quality of New Zealand meat.
The board has engaged in most activities in the export trade in the interests of the producer. It is the mechanism through which policy in the interests of the trade is formulated.
Prior to 1971 the board's power to participate in the purchase and sale of meat in any country outside New Zealand was limited under the terms of the Act to the establishment of markets in those countries where no substantial market for New Zealand meat previously existed and to the expansion and maintenance of those markets. An amendment to the Act passed in October 1971 extended the board's power to enable it to buy any meat derived from sheep and sell in or export to any country. There is provision for this to be extended by Order in Council to cover meat derived from any other stock; the board's previous powers with regard to the sale of these meats in developing markets has been maintained. A sizeable proportion of lambs slaughtered for export were purchased by the board in the 1971-72 season, and again in the 1974-75 season, the board used its powers to buy and sell both lamb and mutton.
The board has had a major influence on meat marketing policy through the regulation of shipments, control over quality, and the development of markets through promotion in which it is investing some $3 million a year.
In its market support activities the board is the only organisation in the world promoting the sale of meat on a genuinely international scale. To this end it has established in its major markets a network of market consultants assisting the board through its overseas offices which are in London, New York, Tokyo and Brussels. The board established an office in Brussels in October 1972, partly for developing the European market and partly for purposes of safeguarding the position of New Zealand meat with Britain joining the EEC.
While the trade has retained the role of direct marketing, the administrative and promotional work of the board has served to ensure that the long-term interests of the industry are not ignored. This function embraces all activities in moving meat from producer to consumer in the quickest and most efficient manner with due regard to the stability of prices and markets.
A Pork Industry Council functions under the Pork Industry Act 1974. Its principal functions are to promote and organise the orderly development of the pork industry; to assist in the marketing of pigs; to maintain and improve quality; to increase production; to promote efficiency; to ensure a supply of foodstuffs for pigs.
Wool—The Wool Marketing Corporation was established from 1 December 1972 by the Wool Marketing Corporation Act 1972. The corporation is a grower-controlled authority which has as its object to obtain, in the interest of growers, the best possible long-term returns for New Zealand wool. It will do this by developing a marketing system suited to the requirements of the world's textile industry, by marketing New Zealand wool to the best advantage in competition with other textile fibres, and by bringing about efficiencies in the handling and distribution of wool. It is empowered to acquire the whole of the wool clip, but 60 percent majority at a referendum of wool-growers is necessary before this part of the Act can be brought into force.
Apples and Pears—Apples and pears are purchased from growers by the New Zealand Apple and Pear Marketing Board. This board was set up in 1948, in terms of the Apple and Pear Marketing Act 1948, to acquire and market the apple and pear crop. Under the Apple and Pear Marketing Amendment Act 1967 there has been set up an Apple and Pear Prices Authority whose function it is to determine each season the average price to be paid for apples and pears. This price is a New Zealand average, and within it prices to growers vary for the different varieties, grades, and sizes. Most apples and pears of standard grade are purchased by the board with private sales by growers limited by regulations. Growers may sell direct to consumers in lots of not more than two cases, or with permission of the board, to retailers in specified localities. Manufacturers may be licensed by the board to purchase their requirements direct from growers (although in some cases the board itself purchases fruit and resells it to the factory). Growers may also be permitted by the board to sell at municipal markets established under the Municipal Corporations Act 1954.
The board decides what proportion of the fruit is to remain in New Zealand and what proportion to be exported, and arranges for the storage and release of varieties according to their condition keeping capacity, in order to make fruit available for as long a period as possible during the year. board determines the wholesale prices at which fruit is sold in New Zealand by authorised wholesalers to retailers. If in any season the total receipts from sales of fruit by the board exceed the amount which the board is required to pay to growers in accordance with the declared average price, surplus, after deduction of costs and expenses incurred by the board is apportioned between a reserve fund and the growers. The board may distribute up to 50 percent of the surplus among growers, or such greater proportions as the Minister approves. The balance is added to the reserve fund. If sales in any season realise less than the amount the board is required to pay, the deficiency is met from the reserve fund. The reserve fund, which has been built up from profits derived almost solely from exports, has been invested in a chain of modern cool stores and mechanical equipment designed for the improved handling of fruit.
Financial results for recent seasons are shown in the following table.
| Season | Profit or Loss | Board's Share | Growers' Share | Reserve Fund at End of Season |
|---|---|---|---|---|
| *Retained by board to offset previous seasons' losses. | ||||
| $(000) | $(000) | $(000) | $(000) | |
| 1962-63 | — 139 | — 139 | - | 2,489 |
| 1963-64 | —1,248 | —1,248 | - | 1,241 |
| 1964-65 | 439 | 439* | - | 1,680 |
| 1965-66 | —1,823 | —1,823 | - | — 143 |
| 1966-67 | 1,365 | 1,365 | - | 1,222 |
| 1967-68 | 501 | 394 | 107 | 1,616 |
| 1968-69 | 961 | 753 | 208 | 2,369 |
| 1969-70 | —1,410 | —1,410 | - | 959 |
| 1970-71 | 293 | 169 | 124 | 1,128 |
| 1971-72 | —2,631 | —2,631 | - | —1,503 |
| 1972-73 | 2,652 | 2,410 | 242 | 906 |
| 1973-74 | —4,103 | —4,103 | - | —3,197 |
Potatoes—The Potato Board, with equal representation of growers and merchants and an officer of the Public Service as an advisory member, was established by the Potato Growing Industry Act 1950. Its principal function is to ensure that an adequate supply of main-crop potatoes shall be available for consumption. Its powers include the making of contracts between growers and the board for main-crop potatoes, and the appointment of wholesalers authorised to purchase from growers and to sell potatoes in respect of which contracts have been made with the board. In June 1956 the Government announced that it would guarantee the overdraft of the Potato Board to enable the board to guarantee a certain schedule of minimum prices to contract growers for any potatoes unsold at the end of the season. The purpose is to encourage the growing of an adequate supply of potatoes.
Milk—The New Zealand Milk Board was set up in 1953. It operates the national milk scheme and engages in other activities for the purpose of ensuring an adequate supply and efficient distribution of milk. The legislation is contained in the Milk Act 1967.
The board may make a levy on milk to finance its operations but while a subsidy on milk is payable from the Consolidated Revenue Account the rate of levy requires the approval of the Minister of Agriculture and Fisheries.
Retail prices are fixed by Order in Council. The price for the milk to the producer is fixed by the Minister of Agriculture and Fisheries after consultation with the Milk Board. Intermediate margins, such as those for pasteurising and bottling milk and to vendors for its delivery, are fixed by the Milk Prices Authority. The total cost at the present time exceeds the amount paid by the consumers, the balance being met by subsidy. It is the function of the Milk Board to administer the whole town milk scheme on behalf of the Government which, however, retains a direct interest by virtue of the substantial sum paid in subsidy.
Eggs—The Egg Marketing Authority, which was established in 1953, consists of eight members—five producer members of the New Zealand Poultry Board and three Government representatives. The principal function of the authority is to regulate and control the marketing and distribution of eggs and egg pulp in New Zealand and elsewhere in accordance with the regulations, to ensure as far as possible sufficient supplies of eggs and their equitable distribution in the general interests of producers and consumers.The New Zealand Egg Marketing Authority operates principally through licensed distributors in the various districts who, on commission, receive and resell eggs or, as directed by the authority, manufacture egg pulp for the use of bakers and pastrycooks. Eggs are subject to price control. A subsidy, at present at the rate of 3.33c per dozen, is paid by the Government in respect of eggs received at authorised egg floors (as the licensed distributors are known). This is to offset floor charges and distribution costs which would otherwise be passed on to the consumers.
Imported Citrus Fruits and Bananas—The importation and marketing of imported citrus fruits, bananas, pineapples and grapes are the responsibility of a registered company, Fruit Distributors Ltd., representing trade interests. The operations of the company are defined and restricted by an agreement between it and the Government. There are two Government members on the company's board of directors.
New Zealand Lemons and Oranges—The Citrus Marketing Authority was established in 1953 to market fresh lemons, either directly or through agents, throughout New Zealand and to process unmarketable but otherwise sound fruit into by-products, such as fruit juice and lemon peel. The authority has a membership of six, five of whom are nominees of the New Zealand Citrus Council and represent the producers, and one appointed by the Minister of Agriculture and Fisheries as the Government member who also protects the interests of consumers.
The Citrus Marketing Authority controls the assembly and distribution of New Zealand lemons, and also New Zealand grown sweet oranges. The entire output of fruit, which comes under the jurisdiction of the authority, is sold at agreed prices to Fruit Distributors Ltd. The authority operates processing and packing facilities at Kerikeri, Tauranga and Gisborne.
Honey—The Honey Marketing Authority, set up in 1953, undertakes the packing and marketing, within New Zealand and for export, of all honey supplied to it. Beekeepers have the option of supplying the authority, selling to private packers, or packing and marketing their own honey.
A levy on honey sold locally other than by the authority is payable to the authority at the rate of 0.834c per pound. The funds derived from this levy are administered by the authority for the benefit of the honey-producing industry generally.
The authority comprises four members elected by beekeepers, and one member appointed as Government representative. One of the functions of the Government representative is to watch the interests of the consumer.
Prices and sales of honey are set out in the following table\.
| Item | 1968-69 | 1969-70 | 1970-71 | 1971-72 | 1972-73 | |
|---|---|---|---|---|---|---|
| Payment to producers | cents per kg | 24.98 | 24.83 | 29.06 | 37.86 | 44.59 |
| Average selling price— | ||||||
| New Zealand | cents per kg | 49.83 | 50.03 | 55.04 | 61.65 | 64.03 |
| Overseas | cents per kg | 45.60 | 38.57 | 36.25 | 51.42 | 76.14 |
| Sales— | ||||||
| New Zealand | tonnes | 1,029 | 949 | 846 | 726 | 550 |
| Overseas | tonnes | 231 | 516 | 1,012 | 1,383 | 1,826 |
TRANSPORT AND OVERSEAS MARKETS—Farm products form the bulk of New Zealand's exports and it comes to hand for shipment in seasonal cycles. These are most pronounced for lamb, and apples and pears, but apply also to a marked extent to mutton, beef, wool, and related produce. Butter, cheese, and other dairy produce become available throughout the year but production is considerably higher in the 6 months October to March than in the remainder of the year. The peak season for all the animal products is much the same, being roughly November to May, while there is a shorter concentrated season for fruit in March and April.
This seasonality presents shipping problems in the marketing process. In addition, the bulk of the commodities are perishable and require continuous refrigeration throughout the period of at least 2 to 3 months between production and consumption. The demand for shipping space lags a little behind the season, generally building up in January and declining in June. A realisation of the demands that increased production was making on transport, storage, handling, and shipping services led in 1964 to the setting up of an Exports and Shipping Council, an independent body whose main purpose is to improve the efficiency and economy of New Zealand export trade as it relates to transport services. Shipping received special attention as shipping costs absorb a substantial portion of market realisations.
The council is representative of producer boards, freezing companies, transport interests, harbour boards, the Associated Chambers of Commerce, the Federation of Labour, and the Manufacturers' Federation. It was successful in bringing into effect many of the recommendations of the streamlining report on ports, shipping, transport, and other services, produced as a result of consultations between the producer boards and the main shipping lines.
PRICES FOR FARM PRODUCTS: Wool—Under the Wool Marketing Corporation Act 1972, the Wool Marketing Corporation continues to operate a Minimum Prices Plan which was first introduced in 1952. The corporation prepares a table of minimum prices which becomes effective by agreement with the Minister of Agriculture and Fisheries. Where trade bids for any wool offered at auction fail to reach the minimum price the corporation may either, purchase the wool at minimum price, let it be sold to the highest trade bidder, or purchase the wool at a price less than the minimum price. In the latter two cases the corporation, out of its funds, supplements the sale price to the minimum price level. (The Wool Commission from 1967 to 1972 paid out to farmers in supplementation of market prices an amount of $10 million, of which $8.7 million was paid out in the 1967-68 season).
Apart from the Minimum Prices Plan, the Wool Marketing Corporation is empowered to purchase wool at any price level and has often done so where it considers bids have not reached a reasonable level in view of prevailing market conditions. Considerable quantities of wool were purchased under this provision in 1966-67 and again in 1974-75.
The following table shows weight, sale value and average value per kilogram of greasy wool sold at auction. The last column shows the average minimum price to growers set by the Wool Marketing Corporation, or its predecessor, the Wool Commission.
| Season | Greasy Wool Sold at Auction | Total Sale Value | Sale Value per Kilogram | Average Minimum Price per Kilogram |
|---|---|---|---|---|
| *See latest statistical information. | ||||
| Tonnes (000) | (million) | c | c | |
| 1958-59 | 184.29 | 122.1 | 66.27 | 60.63 |
| 1959-60 | 185.61 | 132.2 | 82.03 | 60.63 |
| 1960-61 | 190.92 | 141.6 | 74.12 | 60.63 |
| 1961-62 | 192.05 | 138.2 | 71.98 | 60.63 |
| 1962-63 | 201.44 | 158.5 | 78.70 | 60.63 |
| 1963-64 | 196.81 | 199.1 | 101.17 | 60.63 |
| 1964-65 | 201.03 | 155.6 | 77.40 | 64.31 |
| 1965-66 | 230.97 | 176.6 | 76.46 | 64.31 |
| 1966-67 | 242.13 | 156.9 | 64.77 | 66.14 |
| 1967-68 | 244.85 | 123.4 | 50.42 | 55.12 |
| 1968-69 | 234.28 | 144.9 | 61.81 | 49.05 |
| 1969-70 | 224.12 | 126.6 | 56.48 | 49.05 |
| 1970-71 | 218.22 | 116.6 | 53.42 | 46.30 |
| 1971-72 | 209.02 | 139.0 | 66.46 | 46.00 |
| 1972-73 | 196.21 | 282.5 | 143.96 | 50.00 |
| 1973-74 | 195.13 | 271.6 | 139.19 | 70.00 |
| 1974-75 | * | * | * | 93.00 |
In the next table details of a wool price index on base: average over all sales 1963-64 season (=1000) are given. This index has been compiled in an attempt to eliminate all but the price factor in movements of average wool values.
| Season | Index Numbers* Base: 1963-64 (= 1000) |
|---|---|
| *Based on price on floor, clean. | |
| 1951-52 | 749 |
| 1952-53 | 840 |
| 1953-54 | 903 |
| 1954-55 | 886 |
| 1955-56 | 832 |
| 1956-57 | 985 |
| 1957-58 | 750 |
| 1958-59 | 663 |
| 1959-60 | 812 |
| 1960-61 | 745 |
| 1961-62 | 731 |
| 1962-63 | 788 |
| 1963-64 | 1,000 |
| 1964-65 | 780 |
| 1965-66 | 775 |
| 1966-67 | 683 |
| 1967-68 | 533 |
| 1968-69 | 650 |
| 1969-70 | 603 |
| 1970-71 | 560 |
| 1971-72 | 693 |
| 1972-73 | 1,464 |
| 1973-74 | 1,423 |
Dairy Produce—Basic prices (then known as guaranteed prices) were introduced in 1936 for butter and cheese. The present legislative authority for the fixing of purchase prices for all dairy produce which the Dairy Board acquires for export is the Dairy Board Act 1961, as amended by the Dairy Board Amendment Act 1972. Under the Act, the Dairy Products Prices Authority fixes the prices to be paid by the board for butter. This price for butter sets the basic price for milk fat. The prices paid for other dairy produce acquired by the board are set by the board, after consultation with the authority.
The price paid for cheese is based broadly on three components. The first component is the value of the fat, which is based on the basic price of butter.
The second component is the value of the solids-not-fat component of cheese, which is worked out under the new s.n.f. (solids-not-fat) formula. Adjustments are also made for by-products.
The third component is manufacturing costs.
The objective of the cheese price is to ensure that suppliers of whole milk for manufacture into cheese will, on average, receive a return closely related to the average return they would have received had the milk been manufactured into butter, buttermilk powder, and skim-milk powder or casein. A similar objective exists for suppliers of whole milk for manufacture into whole-milk powder, and other product mixes.
The main purposes of the 1972 amendment was to introduce the new s.n.f. formula for payment for solids-not-fat products, including the s.n.f. portion of cheese. What the formula does is to limit the difference between the returns for the solids-not-fat products to 6.61c per kilogram of milk fat in the original whole milk (i.e., 3c per pound milk fat) at the factory stage.
Overseas realisations determine purchase prices. The price for butter may not vary by more than 5 percent from the price fixed for the previous season. This, in turn, also limits the movement in the price paid for the fat component of cheese, and for other products containing fat, such as frozen cream, anhydrous milk fat (a.m.f.), and whole-milk powder.
The main Dairy Industry Trading Account at the Reserve Bank, which receives the proceeds from the fat products, may be in surplus or deficit if the overseas realisations are different from the guaranteed price for milk fat set by the butter price.
When this account is in surplus, the Dairy Board may authorise the distribution of up to 50 percent of any surplus achieved in a trading year; part or all of the balance may also be distributed if the Minister of Agriculture and Fisheries agrees. When the trading account is in deficit, this deficit is charged against the Dairy Industry Reserve Account.
Realisations from other products such as milk powders with less than 14 percent fat and casein are put into pool accounts. All of these proceeds, after payment of selling and administrative expenses, are paid out to dairy companies, after the application of the s.n.f. formula. There is a partial linkage between the pools accounts and the Dairy Industry Trading Account through the cheese price.
The following table gives the prices in cents per kilogram of product paid by the Dairy Board to companies for the main products acquired for export. These are f.o.b. realisations to companies, except for casein, which is a factory door realisation.
| Season Ended 31 May | Creamery Butter (Finest Grade 93-93 1/2 pt) | Cheese (First Grade 92-92 1/2 pt) | Spray Skim-milk Powder (Finest) | Acid Casein (Industrial) |
|---|---|---|---|---|
*These extra amounts are surplus payments expressed on a product basis. †Interim final prices. | ||||
| cents per kilogram | ||||
| 1964-65 | 57.09 | 36.00 | ||
| 1.51* | 0.74* | |||
| 1965-66 | 57.10 | 39.29 | ||
| 1966-67 | 57.06 | 39.37 | ||
| 1967-68 | 54.21 | 37.57 | ||
| 1968-69 | 54.39 | 37.08 | ||
| 1969-70 | 54.70 | 38.65 | 15.63 | 38.89 |
| 1970-71 | 57.43 | 44.80 | 22.22 | 42.73 |
| 2.17* | 1.08* | |||
| 1971-72 | 60.30 | 56.88 | 41.51 | 65.10 |
| 10.85* | 5.40* | |||
| 1972-73 | 63.32 | 59.48 | 34.35 | 76.88 |
| 2.75* | 1.36* | |||
| 1973-74 | 63.32 | 68.21† | 44.49 | 107.61† |
| 1974-75 | 66.49 | |||
The prices quoted in the preceding table for butter and cheese were designed to enable dairy companies to pay to suppliers the following amounts in cents per kilogram of milkfat used for butter or cheese manufacture (columns 1 and 2). Also given is the actual net revenue per kilogram of milk fat supplied achieved by companies for the main products. The figures for spray skim-milk powder and acid casein are for milkfat in the original wholemilk from which the liquid skim milk was derived.
| Season Ended 31 May | Butter-making | Cheese-making | Actual Average Net Revenue | |||
|---|---|---|---|---|---|---|
| (Basic Price) | (Final Price) | Butter-making | Cheese-making | Spray Skim-milk Powder | Acid Casein | |
*Estimate only. NOTES—(1) The basic price for buttermaking is on a farm gate fat in cream basis up to and including 1971-72. All other figures are on a factory stage basis (i.e., milk and cream collection costs must be paid out from these amounts). (2) Columns (1) and (2) do not include surplus payments. These are price structure calculations. (3) Columns (3) and (4) do include the surplus payments shown below: | ||||||
| cents per kilogram of milk fat | ||||||
| 1964-65 | 62.28 | 75.14 | 66.02 | 79.76 | ||
| 1965-66 | 62.28 | 82.88 | 64.11 | 84.25 | ||
| 1966-67 | 62.28 | 82.95 | 63.79 | 84.10 | 18.82 | |
| 1967-68 | 58.62 | 77.27 | 59.91 | 77.70 | 16.16 | 20.64 |
| 1968-69 | 58.62 | 71.91 | 60.22 | 74.11 | 10.33 | 17.92 |
| 1969-70 | 58.62 | 74.10 | 60.08 | 75.12 | 13.40 | 17.17 |
| 1970-71 | 61.40 | 83.64 | 65.80 | 89.43 | 25.32 | 19.08 |
| 1971-72 | 64.04 | 110.69 | 79.26 | 124.87 | 58.69 | 32.32 |
| 1972-73 | 70.90 | 116.65 | 74.21 | 119.96 | 46.01 | 39.40 |
| 1973-74 | 70.57 | 132.45 | 70.57* | 132.45* | 61.88* | 55.27* |
| 1974-75 | 73.23 | |||||
| Cents per kilogram milk fat | |
|---|---|
| (4) From 1972-73 buttermaking basic prices include revenue items. | |
| 1963-64 | 2.76 |
| 1964-65 | 1.84 |
| 1970-71 | 2.65 |
| 1971-72 | 13.23 |
| 1972-73 | 3.31 |
Most milk fat is now collected by tankers. Only 17 percent of suppliers supply cream and they make up an even smaller proportion of total milk fat supply, i.e., 7 percent.
The main product mixes obtained from whole milk are:
| Cheese | Butter |
| Whey butter | Buttermilk powder |
| Separated whey | Skim-milk powder or casein (acid or rennet) |
| Whole milk powder | Anhydrous milk fat |
| Butter | Buttermilk powder |
| Skim-milk powder or casein |
Production of dairy factories is shown in Section 14A—Farming.
Town Milk Supply—The objects of the New Zealand Milk Board are the provision of an adequate supply of milk of good quality for human consumption and the organisation of the town milk industry on an economic basis. The board arranges supply contracts with milk producer companies for all districts, reports to Government on the adequacy of the town milk producer price, makes recommendations to Government or reports to the Milk Prices Authority, as the case may be, as to national margins for pasteurising, bottling, distribution, and other aspects of price fixation, fixes local allowances for cartage and such special distribution allowances as may be necessary, makes financial adjustments with all those in the industry to see that they get the prices or allowances to which they are entitled, and in doing so pays out subsidy on behalf of Government.
The following table shows production and sales of town milk under the control of the New Zealand Milk Board.
| Year Ended 31 August | Production | Quantity on Which Town Milk Price Paid | Volume of Town Sales Price per | Gallon Paid to Producers | Government Subsidy Gallon |
|---|---|---|---|---|---|
| litres(m) | c | c | |||
| 1,964 | 546.2 | 398.3 | 325.6 | 5.334 | 3.2284 |
| 1,965 | 575.7 | 407.3 | 336.0 | 5.708 | 3.7718 |
| 1,966 | 597.0 | 421.7 | 345.5 | 6.061 | 4.2333 |
| 1,967 | 628.0 | 434.0 | 345.4 | 6.067 | 4.3842 |
| 1,968 | 627.4 | 436.1 | 345.1 | 5.728 | 4.0067 |
| 1,969 | 634.4 | 436.2 | 352.7 | 5.407 | 3.6854 |
| 1,970 | 633.7 | 441.5 | 365.0 | 5.538 | 4.3281 |
| 1,971 | 618.1 | 458.2 | 375.9 | 6.312 | 5.9007 |
| 1,972 | 657.0 | 471.9 | 382.3 | 8.564 | 8.9182 |
| 1,973 | 646.6 | 484.4 | 394.2 | 8.358 | 9.2212 |
| 1974 § | 640.6 | 503.9 | 410.2 | 8.981 | 10.6781 |
The town milk industry has converted to the metric system and bottles of 600 ml, 300 ml, and 150 ml have been progressively introduced.
Meat—The Imported Meat Trade Association in the United Kingdom compiles weekly London wholesale meat prices, the basis of quotation being “ex-hooks to retailers at Smithfield market”. The next table gives prices for New Zealand lamb at the end of the last week in March. Approximately 35 percent of the value of all New Zealand exports of frozen and chilled meat is generally accounted for by lamb, and the 8-12.5 kg and 13-16 kg prime grades quoted in the table usually account for approximately 20 percent and 35 to 40 percent respectively of all lamb carcasses exported.
| End of Last Week in March | Prime Grade | Y Grade | |||
|---|---|---|---|---|---|
| 8 to 12.5 kg | 13 to 16 kg | 16.5 to 19 kg | 8 to 12.5 kg | 13 to 16 kg | |
| cents per kilogram equivalent | |||||
| 1,970 | 58.9-60.8 | 58.9-60.8 | 56.0 | 58.9-59.8 | 58.9-59.8 |
| 1,971 | 70.5 | 66.1 | 58.0 | 64.2 | 58.4 |
| 1,972 | 76.7 | 71.0 | 67.0 | 71.7 | 67.0 |
| 1,973 | 94.6-96.6 | 94.6-96.6 | 92.8 | 93.7-94.6 | 95.5-96.1 |
| 1,974 | 107.7 | 106.6 | 97.2 | 99.0 | 99.0 |
| 1,975 | 118.9-120.9 | 114.9-116.9 | 107.0-109.0 | 114.9-118. | 9 112.9-114.9 |
Schedule Prices—A schedule of buying prices is issued each week by the meat operators in New Zealand. The producers have a choice on how to sell their export meat. They can sell on schedule, on owner's account, on a pool account system, on the basis of prices received from a nominated ship, on the hoof, or they can sell through a producer co-operative.
At the beginning of the 1971-72 season the New Zealand Meat Producers Board considered that the opening price schedules for lamb announced by the meat operators were not high enough in relation to expected market returns. Accordingly the board, after obtaining an amendment to the Meat Export Control Act to permit it to purchase and market lamb, issued its own schedule of prices. The board purchased 12.5 million lambs, about half the total export lamb kill, mainly in the first half of the season. As the season progressed overseas prices picked up, exporters were able to exceed the board's schedule (many had done so right through), and the board ceased purchasing. The board made a profit of about $8 million. Because of low prices being offered to producers for their stock, the board again in the 1974-75 season used its statutory powers to set its own schedule, this time for both lamb and mutton, and has announced a guaranteed minimum schedule for beef for the 1975-76 season. Minimum prices were also set by the board in December 1974 for all grades of export beef for the remainder of the 1974-75 season. In March 1975 the board implemented a scheme, worked out in conjunction with the Meat Exporters Council, whereby the trade would resume responsibility for the marketing of all export beef, with the board offering producers a higher level of minimum prices by supplementing actual market returns.
The opening schedules for the last four seasons are given below. The prices quoted are for dressed weights “on the hooks” at freezing works. The prices for lambs, wethers, and ewes are for bare meat only with an additional payment being made for both wool and pelt.
| OPENING SCHEDULE PRICES | |||||
|---|---|---|---|---|---|
| Class of Meat | 1970-71 | 1971-72 | 1972-73 | 1973-74 | 1974-75 |
| *New Zealand Meat Producers Board schedule prices. | |||||
| cents per kg | |||||
| Lamb— | |||||
| N.I. Prime (13.0-16.0 kg) | 46.1 | 27.3* | 47.0 | 69.7 | 44.4 |
| S.I. Prime (13.0-16.0 kg) | 46.1 | 27.3* | 44.8 | 69.7 | 42.4 |
| Wethers—Prime (22.5-26.0 kg) | 19.0 | 16.5 | 22.0 | NQ | 14.0* |
| Ewes—Prime (22.5-26.0 kg) | 11.0 | 13.2 | 16.5 | 41.9 | 14.0* |
| Beef (N.I.)— | |||||
| Chiller steer (221-270 kg) | 49.6 | 52.9 | 63.9 | 78.0 | 39.0 |
| Chiller heifer (221-270 kg) | 47.4 | 45.2 | 61.7 | 76.0 | 37.0 |
| G.A.Q. cow (over 140 kg) | 45.2 | 48.5 | 58.4 | 72.0 | 34.0 |
| Manufacturing cow, steer, and heifer (over 140 kg) | 44.1 | 45.2 | 51.8 | 68.0 | 26.0 |
| Manufacturing bull (181-*260 kg) | 50.7 | 51.8 | 58.4 | 81.0 | 38.0 |
Minimum Prices for Export Meat—The institution of a system of minimum prices for meat exported from New Zealand was provided for by the Meat Export Prices Act 1955. A Meat Export Prices Committee was established, and consists of two members of the Meat Board, the Secretary to the Treasury, the Director-General of Agriculture and Fisheries, and a chairman nominated by agreement between the Government and the producers. A schedule of minimum prices is fixed at the beginning of the season. Regard must be paid by the committee to the average level of the prices received for each class of meat during the preceding three seasons, the ruling level of minimum prices, and the committee may have regard to the market trend and future prospects for the sale of meat, prices ruling for other farm products, and the general level of costs, prices, and wages in New Zealand.
The following table gives the minimum prices for years ended 30 September for the North Island.
| Class of Meat | Basic Grade of Meat | 1971-72 | 1972-73 | 1973-74 | 1974-75 |
|---|---|---|---|---|---|
| cents per kg | |||||
| Lamb | Prime 13-16 kg | 30.9 | 35.3 | 35.3 | 35.3 |
| Wether mutton | Prime 22.5-26 kg | 16.5 | 17.6 | 17.6 | 17.6 |
| Ewe mutton | Prime 22.5-26 kg | 12.1 | 13.2 | 13.2 | 13.2 |
| Chilled beef | Chiller 221-270 kg | 37.5 | 41.9 | 41.9 | 41.9 |
| Steer and heifer quarterbeef | Chiller 221-270 kg | 37.5 | 41.9 | 41.9 | 41.9 |
| Quarter cow beef | G.A.Q. 140 kg and over | 30.9 | 35.3 | 35.3 | 35.3 |
| Manufacturing cow, ox, and heifer | 140 kg and over boned out | 44.1 | 48.5 | 48.5 | 48.5 |
| Manufacturing bull | 181-260 kg value | 44.1 | 48.5 | 48.5 | 48.5 |
| Veal (sides or quarters) | Under 127 kg | 30.9 | 35.3 | 35.3 | 35.3 |
| Porkers | Prime 27-45 kg | 35.3 | 37.5 | 37.5 | 37.5 |
| Baconers | Prime 50-64 kg | 35.3 | 37.5 | 37.5 | 37.5 |
Deficiency Payments—Payments are made from the Meat Industry Reserve Account when the f.o.b. equivalents of the prices paid to farmers fall below the minimum price determined for any class of meat in the week to which the schedule relates.
FARM INDUSTRY RESERVES—Farm industry reserves were built up during the Second World War when, in furtherance of the Government's stabilisation policy, farmers agreed that increases in overseas realisations for meat and dairy produce be paid into special funds for later use for the benefit of the industry concerned. The wool reserve account (now the capital funds of the Wool Marketing Corporation) arose in the main from the profits derived from the sale of wartime surplus stocks, and in part from a contributory charge levied on wool sold at that time, much of it was used to buy in wool in 1966-67 but this was all resold by 1972. These operations were described in detail in the 1973 issue of the Yearbook. About half of the meat industry reserve was used to purchase lambs in 1971-72 to provide a higher price schedule, but was recovered from the ensuing marketing of the meat. The meat industry and wool reserve accounts were both drawn on again in 1974-75.
The following table shows the balances in the various farm industry reserve accounts at given dates.
| Year | Dairy Account at 31 May | Meat Industry Reserve Account at 30 Sep | Wool Corporation Account at 30 June |
|---|---|---|---|
*Most of this was invested in wool stocks. † About three-fifths was represented by wool stocks. ‡About two-fifths was represented by wool stocks. §$15 million was contributed to the sheep retention scheme in 1972. | |||
| $(000) | |||
| 1,964 | - 7,130 | 89,482 | 71,897 |
| 1,965 | - 373 | 90,940 | 72,800 |
| 1,966 | - 578 | 93,497 | 73,709 |
| 1,967 | -11,191 | 95,296 | 70,700* |
| 1,968 | -12,844 | 97,337 | 59,630* |
| 1,969 | -16,001 | 98,192 | 55,835* |
| 1,970 | -20,123 | 100,786 | 52,200† |
| 1,971 | -20,123 | 102,666 | 48,197‡ |
| 1,972 | +13,834 | 87,327§ | 52,353 |
| 1,973 | +18,418 | 88,592 | 54,745 |
| 1,974 | +11,776 | 93,558 | 55,900 |
GENERAL—Domestic trade embraces retail and wholesale trade and part of the services field. The trend of retail trade is one of the most perceptive barometers of economic activity as it constitutes a large proportion of personal expenditures on consumer goods and services.
The fifth of New Zealand's 5-yearly Censuses of Distribution was for the year ended 31 March 1973. It covered wholesale trade; retail trade; selected service trades; the hotels, motels, taverns, and restaurant group; motor vehicle trades including repairs and servicing; laundries and drycleaners; and cinemas.
This 5-yearly census provides the basis for the quarterly and monthly surveys of retail and wholesale trade which provide valuable economic indicators on the condition of the economy. Results from some of these surveys are given later in this section.
CENSUS OF DISTRIBUTION 1973—The Census of Distribution for 1972-73 revealed aggregate retail sales of $4,314 million, or average turnover of $128,100 by each of the 33,700 retail stores included in the census.
In the following table the main retail trade figures from the latest two censuses are set out. To allow for comparisons, a number of store-types surveyed only in the latest census have been omitted.
| Item | 1968 | 1973 | Percentage Increase |
|---|---|---|---|
| Number of retail stores | 29,331 | 30,586 | 4.3 |
| Sales ($ million) | 2,099.7 | 3,968.7 | 89.0 |
| Average sales per store ($) | 71,600 | 129,800 | 81.3 |
| Labour force— | |||
| Paid employees | 103,254 | 147,628 | 43.0 |
| Total | 137,251 | 188,321 | 37.2 |
| Salaries and wages paid ($ million) | 181.1 | 376.3 | 107.8 |
Some comparisons between the results of the 1968 and 1973 Censuses are shown by store-type group in the following tables. As in the previous table, store-types surveyed for the first time in 1973 have been omitted. The first shows sales and numbers of stores.
| Store-type Group | Retail Stores | Total Sales | Average Sales | |||
|---|---|---|---|---|---|---|
| 1968 | 1973 | 1968 | 1973 | 1968 | 1973 | |
| Food and drink— | Number | $ (million) | $ (000) | |||
| Packaged | 9,915 | 8,881 | 499.3 | 752.5 | 50.4 | 84.7 |
| Consumed | 4,077 | 4,134 | 198.3 | 364.7 | 48.6 | 88.2 |
| Apparel | 4,119 | 4,565 | 168.1 | 273.4 | 40.8 | 59.9 |
| Furniture | 1,578 | 1,659 | 118.0 | 213.0 | 74.8 | 128.4 |
| Automotive sales | 1,344 | 2,108 | 292.3 | 1,054.9 | 217.5 | 500.4 |
| Hardware | 1,008 | 1,093 | 119.4 | 195.3 | 118.4 | 178.7 |
| Chemists, etc | 1,167 | 1,193 | 58.5 | 97.1 | 50.1 | 81.4 |
| Miscellaneous | 6,123 | 6,953 | 645.9 | 1,017.6 | 105.5 | 146.4 |
| Totals | 29,331 | 30,586 | 2,099.7 | 3,968.7 | 71.6 | 129.8 |
In the previous table the store-type group, “Food and drink—consumed”, included restaurants, licensed hotels, taverns, chartered clubs, cafeterias, coffee bars, milk bars, fish and chip shops, and similar eating establishments.
The store-type group, “Automotive sales”, included sales of cars, motor cycles, parts, and accessories, but not petrol and oil sales or garage work, servicing, and maintenance.
In the following table retail sales are shown by method of purchase as recorded at the 1973 Census. Figures given in parentheses are in each case the percentage of total sales. A survey of hire purchase is carried out at quarterly intervals, and some results from this are given later in this section.
| Store-type Group | Cash | Charge Accounts | Hire Purchase | Budget, Store Credit, etc. | Layby | Other | Total Sales |
|---|---|---|---|---|---|---|---|
| *Receipts by chemists for dispensing charge claimed from the Department of Health were included under “cash” in 1968 and under “Other” in 1973. | |||||||
| Food and drink— | $ (million) | ||||||
| Packaged | 646.9 | 105.3 | - | 0.2 | - | 0.1 | 752.5 |
| (86.0) | (14.0) | - | - | - | - | (100.0) | |
| Consumed | 333.7 | 28.9 | - | - | - | 2.3 | 364.8 |
| (91.5) | (7.9) | - | - | - | (0.6) | (100.0) | |
| Apparel | 222.2 | 34.3 | 0.6 | 4.6 | 10.3 | 1.4 | 273.4 |
| (81.3) | (12.5) | (0.2) | (1.7) | (3.8) | (0.5) | (100.0) | |
| Furniture | 64.2 | 101.0 | 45.8 | 0.9 | 1.0 | - | 213.0 |
| (30.2) | (47.4) | (21.5) | (0.4) | (0.5) | - | (100.0) | |
| Automotive | 522.3 | 300.4 | 227.1 | 0.6 | 0.2 | 4.4 | 1,054.9 |
| (49.5) | (28.5) | (21.5) | (0.1) | - | (0.4) | (100.0) | |
| Hardware | 44.1 | 142.5 | 1.0 | 7.1 | 0.6 | 0.1 | 195.3 |
| (22.6) | (73.0) | (0.5) | (3.6) | (0.3) | - | (100.0) | |
| Chemists, etc. | 52.7 | 7.0 | - | 0.1 | - | 37.3* | 97.1 |
| (54.3) | (7.2) | - | (0.1) | - | (38.4) | (100.0) | |
| Miscellaneous | 449.3 | 474.1 | 50.5 | 26.6 | 7.3 | 9.8 | 1,017.6 |
| (44.1) | (46.6) | (5.0) | (2.6) | (0.7) | (1.0) | (100.0) | |
| Total, of all groups | 2,335.3 | 1,193.6 | 325.0 | 40.0 | 19.5 | 55.3 | 3,968.7 |
| (58.8) | (30.1) | (8.2) | (1.0) | (0.5) | (1.4) | (100.0) | |
The following table deals only with those store-types first surveyed in the 1973 Census which were omitted in the previous table.
| Newly-surveyed Store Types | Number of Stores | Total Sales | Average Sales per Store | Labour Force at 15 April 1973 | Salaries and Wages Paid | |
|---|---|---|---|---|---|---|
| Paid Employees | Total | |||||
| $(m) | $ (000) | $ (m) | ||||
| Food and drink (packaged)— | ||||||
| Milk vendors | 1,079 | 25.0 | 23.2 | 2,200 | 3,752 | 1.2 |
| Food and drink (consumed)— | ||||||
| Caterers | 180 | 9.6 | 53.2 | 1,616 | 1,931 | 2.1 |
| Licensed motels | 20 | 5.6 | 279.7 | 670 | 690 | 1.5 |
| Totals | 200 | 15.2 | 76.0 | 2,286 | 2,621 | 3.6 |
| Automotive— | ||||||
| Service stations | 1,545 | 220.5 | 142.7 | 7,267 | 9,715 | 21.6 |
| Caravan and trailer dealers | 55 | 10.3 | 186.6 | 129 | 206 | 0.4 |
| Powered boats and accessories dealers | 90 | 16.0 | 177.3 | 418 | 530 | 1.3 |
| Totals | 1,690 | 246.7 | 146.0 | 7,814 | 10,451 | 23.2 |
| Hardware— | ||||||
| Timber merchants .. | 102 | 45.2 | 443.1 | 1,543 | 1,633 | 5.3 |
| Concrete and cement products | 53 | 17.7 | 334.0 | 585 | 639 | 1.9 |
| Totals | 155 | 62.9 | 405.8 | 2.128 | 2,272 | 7.1 |
| Miscellaneous— | ||||||
| other miscellaneous | 12 | 0.5 | 41.7 | 29 | 41 | 0.1 |
| Totals, newly-surveyed store types | 3,136 | 350.3 | 111.7 | 14,457 | 19,137 | 35.2 |
The next table shows labour force figures as at 9 April 1968 and 15 April 1973 and the salaries and Wages paid during the year.
| Store-type Group | Labour Force | Salaries and Wages Paid* | ||||
|---|---|---|---|---|---|---|
| Paid Employees | Total | |||||
| 1968 | 1973 | 1968 | 1973 | 1968 | 1973 | |
| *Includes overtime payments, bonuses, etc. | ||||||
| Numbers | $ (million) | |||||
| Food and drink— | ||||||
| Packaged | 19,345 | 22,560 | 33,313 | 37,028 | 30.4 | 46.6 |
| Consumed | 14,116 | 29,578 | 19,789 | 35,998 | 23.6 | 66.8 |
| Apparel | 10,239 | 12,955 | 14,194 | 17,830 | 16.1 | 27.4 |
| Furniture | 6,327 | 7,615 | 7,648 | 9,359 | 13.0 | 23.5 |
| Automotive sales | 6,384 | 22,471 | 7,586 | 24,821 | 13.7 | 72.8 |
| Hardware | 5,664 | 6,164 | 6,568 | 7,376 | 11.7 | 18.6 |
| Chemists, etc. | 3,535 | 4,187 | 4,564 | 5,628 | 6.4 | 10.0 |
| Miscellaneous | 37,644 | 42,098 | 43,589 | 50,281 | 66.3 | 110.6 |
| Totals | 103,254 | 147,628 | 137,251 | 188,321 | 181.1 | 376.3 |
Geographical Distribution of Retail Trade—Details of retail trade by statistical areas in 1973 are shown in the following table.
| Statistical Area | Estimated Population at 31 March 1973 | Number of Retail Stores | Total Sales | Average Sales | Purchases | |
|---|---|---|---|---|---|---|
| Per Store | Per Head of Population | |||||
| (000) | $(m) | $ (000) | $ (m) | |||
| Northland | 97.4 | 1,120 | 132.5 | 118 | 1,361 | 101.6 |
| Central Auckland | 747.3 | 8,136 | 1,064.5 | 131 | 1,424 | 796.4 |
| South Auckland-Bay of Plenty | 442.4 | 5,264 | 693.8 | 132 | 1,568 | 531.3 |
| East Coast | 47.8 | 454 | 61.8 | 136 | 1,294 | 47.2 |
| Hawkes Bay | 138.3 | 1,621 | 198.2 | 122 | 1,433 | 151.0 |
| Taranaki | 101.9 | 1,185 | 152.4 | 129 | 1,495 | 117.2 |
| Wellington | 570.0 | 6,298 | 848.8 | 135 | 1,489 | 633.1 |
| North Island | 2,145.1 | 24,078 | 3,152.2 | 131 | 1,469 | 2,377.8 |
| Marlborough | 32.7 | 394 | 44.0 | 112 | 1,344 | 33.3 |
| Nelson | 70.0 | 884 | 95.4 | 108 | 1,362 | 71.2 |
| Westland | 22.5 | 355 | 31.0 | 87 | 1,377 | 23.2 |
| Canterbury | 412.4 | 4,451 | 566.1 | 127 | 1,373 | 431.6 |
| Otago | 183.0 | 2,262 | 254.5 | 112 | 1,390 | 191.1 |
| Southland | 108 9 | 1,276 | 171.0 | 134 | 1,570 | 128.5 |
| South Island | 829.5 | 9,622 | 1,161.8 | 121 | 1,401 | 878.9 |
| New Zealand | 2,974.7 | 33,700 | 4,314.0 | 128 | 1,450 | 3,256.7 |
In 1973 the principal centres of population (urban areas) included 68 percent of New Zealand's population, but contained 69 percent of all retail stores, with almost 74 percent of total retail turnover.
| Urban Areas | Estimated Population at 31 March 1973 | Number of Retail Stores | Total Sales | Average Sales | Purchases | |
|---|---|---|---|---|---|---|
| Per Store | Per Head of Population | |||||
| (000) | $ (m) | $ (000) | $ (m) | |||
| Whangarei | 35.4 | 455 | 66.5 | 146 | 1,879 | 50.8 |
| North Auckland | 123.9 | 1,225 | 130.0 | 106 | 1,050 | 98.8 |
| Western Auckland | 99.1 | 729 | 82.9 | 114 | 837 | 63.3 |
| Central Auckland | 289.7 | 4,155 | 585.6 | 141 | 2,022 | 429.3 |
| Southern Auckland | 185.4 | 1,473 | 204.1 | 139 | 1,101 | 156.9 |
| Hamilton | 87.8 | 1,073 | 176.2 | 164 | 2,007 | 132.9 |
| Tauranga | 44.4 | 656 | 73.9 | 113 | 1,665 | 56.7 |
| Rotorua | 43.4 | 530 | 89.1 | 168 | 2,055 | 66.2 |
| Gisborne | 31.2 | 364 | 54.9 | 151 | 1,761 | 42.0 |
| Napier | 46.4 | 550 | 66.2 | 120 | 1,427 | 49.7 |
| Hastings | 48.2 | 586 | 81.4 | 139 | 1,688 | 62.0 |
| New Plymouth | 40.7 | 519 | 74.9 | 144 | 1,840 | 55.9 |
| Palmerston North | 59.8 | 729 | 108.1 | 148 | 1,809 | 81.1 |
| Upper Hutt Valley | 33.0 | 268 | 34.5 | 129 | 1,045 | 26.2 |
| Lower Hutt Valley | 94.9 | 957 | 126.4 | 132 | 1,333 | 95.8 |
| Porirua Basin | 52.0 | 297 | 39.5 | 133 | 758 | 29.8 |
| Wellington | 139.4 | 1,792 | 281.3 | 157 | 2,018 | 202.2 |
| Wanganui | 38.0 | 508 | 61.3 | 121 | 1,612 | 46.2 |
| Masterton | 20.6 | 282 | 39.6 | 140 | 1,921 | 30.2 |
| Nelson | 39.8 | 512 | 64.6 | 126 | 1,621 | 48.3 |
| Christchurch | 285.9 | 3,153 | 404.1 | 128 | 1,413 | 303.8 |
| Timaru | 29.5 | 397 | 57.0 | 143 | 1,929 | 45.3 |
| Dunedin | 112.4 | 1,334 | 161.9 | 121 | 1,440 | 121.1 |
| Invercargill | 52.3 | 702 | 112.8 | 161 | 2,158 | 84.6 |
| Totals | 2,033.2 | 23,246 | 3,176.7 | 137 | 1,562 | 2,379.2 |
The next table gives the number of stores and value of sales or turnover for boroughs with over 4,000 population not included in the 24 main urban areas of the preceding table.
| Boroughs | Estimated Population at 31 March 1973 | Number of Retail Stores | Total Sales | Average Sales | Purchases | |
|---|---|---|---|---|---|---|
| Per Store | Per Head of Population | |||||
| $ (000) | $ (000) | $ | $ (000) | |||
| Dargaville | 4,160 | 99 | 13,806 | 139 | 3,319 | 10,973 |
| Pukekohe | 8,040 | 164 | 25,574 | 156 | 3,181 | 19,893 |
| Huntly | 5,290 | 95 | 13,320 | 140 | 2,518 | 10,636 |
| Cambridge | 6,680 | 122 | 14,408 | 118 | 2,157 | 11,188 |
| Ngaruawahia | 4,080 | 57 | 3,713 | 65 | 910 | 2,650 |
| Te Awamutu | 7,060 | 166 | 22,790 | 137 | 3,228 | 17,635 |
| Morrinsville | 4,440 | 127 | 21,649 | 170 | 4,876 | 17,645 |
| Te Kuiti | 4,850 | 108 | 12,754 | 118 | 2,630 | 9,562 |
| Taumarunui | 6,710 | 118 | 17,203 | 146 | 2,564 | 13,431 |
| Thames | 5,870 | 129 | 15,066 | 117 | 2,567 | 11,858 |
| Matamata | 4,190 | 118 | 14,426 | 122 | 3,443 | 11,353 |
| Putaruru | 4,620 | 100 | 13,266 | 133 | 2,871 | 10,394 |
| Taupo | 11,900 | 198 | 25,335 | 128 | 2,129 | 19,565 |
| Whakatane | 10,250 | 187 | 29,085 | 156 | 2,838 | 22,572 |
| Kawerau | 7,670 | 56 | 7,953 | 142 | 1,037 | 6,212 |
| Wairoa | 5,540 | 105 | 14,490 | 138 | 2,616 | 11,228 |
| Dannevirke | 5,600 | 128 | 15,012 | 117 | 2,681 | 11,515 |
| Waitara | 5,320 | 68 | 6,635 | 98 | 1,247 | 5,172 |
| Stratford | 5,380 | 105 | 15,716 | 150 | 2,921 | 12,436 |
| Hawera | 8,210 | 175 | 28,712 | 164 | 3,497 | 22,578 |
| Feilding | 9,980 | 156 | 20,520 | 132 | 2,056 | 15,714 |
| Marton | 4,670 | 90 | 13,462 | 150 | 2,883 | 10,511 |
| Levin | 13,850 | 221 | 28,458 | 129 | 2,055 | 21,957 |
| Blenheim | 15,600 | 236 | 32,446 | 137 | 2,080 | 24,698 |
| Westport | 4,880 | 96 | 9,037 | 94 | 1,852 | 6,647 |
| Greymouth | 7,750 | 171 | 18,810 | 110 | 2,427 | 14,419 |
| Rangiora | 5,150 | 91 | 13,161 | 145 | 2,556 | 10,238 |
| Ashburton | 13,700 | 188 | 32,517 | 173 | 2,374 | 26,042 |
| Oamaru | 13,050 | 219 | 28,603 | 131 | 2,192 | 22,000 |
| Balclutha | 4,710 | 82 | 14,587 | 178 | 3,097 | 11,537 |
| Gore | 8,880 | 164 | 27,489 | 168 | 3,097 | 21,352 |
Types of Retail Stores—In 1972-73, approximately 42 out of every 100 retail establishments dealt in food and drink, either for home preparation and consumption (for example, the bulk of the commodities sold by butchers, bakers, grocers, milk vendors, and so forth) or for consumption on the premises when the establishment was a restaurant, hotel, cafeteria, milk bar, or similar. Total sales of food and drink amounted to $1,152.5 million, almost 27 percent of total retail turnover.
In the following table, leading results of the 1973 Census of Distribution are given by both store-type groups and store-types. Unlike the store-type tables given earlier in this section, the following table includes store-types surveyed for the first time in 1973.
| Store Type | Number of Stores | Sales or Turnover | Average Turnover per Store | Total Trading Income | Purchases | Total Trading Expenditure | Cost of Goods Sold as percentage of Turnover* |
|---|---|---|---|---|---|---|---|
*Cost of goods sold is equivalent to purchases during the year plus stocks at start less stocks at close. † Builders' hardware stores, excluding stores selling timber and constructional materials. | |||||||
| $ (m) | $ (000) | $ (m) | $ (m) | $ (m) | Percent | ||
| Food and drink (packaged)— | |||||||
| Baker and pastry-cook, cake shop | 570 | 20.2 | 35.4 | 20.4 | 10.9 | 18.1 | 53.8 |
| Butcher, delicatessen, poulterer | 1,778 | 125.6 | 70.7 | 126.1 | 90.4 | 116.7 | 71.7 |
| Grocer and dairy | 4,983 | 507.4 | 101.8 | 508.8 | 426.7 | 484.9 | 83.5 |
| Confectioner | 122 | 3.3 | 26.8 | 3.3 | 1.8 | 2.9 | 55.7 |
| Fish shop (wet fish) | 210 | 7.8 | 37.1 | 7.8 | 4.9 | 6.7 | 62.8 |
| Fruiterer, greengrocer | 898 | 38.5 | 42.9 | 38.6 | 28.3 | 33.9 | 73.5 |
| Milk vendor | 1,079 | 25.0 | 23.2 | 25.4 | 15.2 | 19.5 | 60.6 |
| Wine shop, independent bottle store | 271 | 39.0 | 144.0 | 39.3 | 27.1 | 34.1 | 68.1 |
| Other food and drink (packaged) | 49 | 10.7 | 218.6 | 10.9 | 8.9 | 10.2 | 82.6 |
| Totals | 9,960 | 777.5 | 78.1 | 780.4 | 614.2 | 727.1 | 78.5 |
| Food and drink (consumed)— | |||||||
| Licensed restaurant | 129 | 15.3 | 119.0 | 15.6 | 6.9 | 14.7 | 44.5 |
| Hotel, tavern, chartered club | 1,392 | 255.9 | 183.8 | 259.7 | 140.3 | 240.3 | 54.6 |
| Unlicensed restaurant, tearoom, coffee house, cafeteria | 1,204 | 42.7 | 35.4 | 42.8 | 22.7 | 38.1 | 53.0 |
| Takeaway food bar, milk bar, fish and chip shop | 1,387 | 45.9 | 33.1 | 46.0 | 28.8 | 40.0 | 62.3 |
| Other food and drink (consumed) | 200 | 15.2 | 75.8 | 15.3 | 6.5 | 13.8 | 42.3 |
| Totals | 4,312 | 375.0 | 87.0 | 379.4 | 205.2 | 346.8 | 54.4 |
| Apparel— | |||||||
| Footwear | 744 | 48.6 | 65.3 | 48.8 | 33.9 | 44.7 | 68.9 |
| Draper | 911 | 61.4 | 67.4 | 61.7 | 43.7 | 57.9 | 68.9 |
| Hosiery, lingerie, children's clothing, wool, corsets, millinery, and haberdashery | 738 | 22.3 | 30.2 | 22.4 | 15.8 | 21.0 | 68.6 |
| Dress and coat shop | 1,358 | 69.5 | 51.2 | 69.8 | 49.7 | 65.6 | 69.3 |
| Men's and boys' clothier | 742 | 69.4 | 93.5 | 69.7 | 48.4 | 63.7 | 68.4 |
| Other apparel | 72 | 2.2 | 30.7 | 2.3 | 1.2 | 1.9 | 52.4 |
| Totals | 4,565 | 273.4 | 59.9 | 274.6 | 192.8 | 254.9 | 68.7 |
| Furniture— | |||||||
| Furniture store | 482 | 81.2 | 168.5 | 84.6 | 58.1 | 76.5 | 69.1 |
| Floor coverings and soft furnishings | 348 | 41.2 | 118.5 | 41.5 | 31.9 | 40.6 | 72.0 |
| Household appliance store | 599 | 74.6 | 124.5 | 78.9 | 52.1 | 74.0 | 68.4 |
| Radios, television, etc. | 230 | 15.9 | 69.3 | 16.4 | 10.9 | 15.4 | 64.6 |
| Totals | 1,659 | 213.0 | 128.4 | 221.3 | 153.1 | 206.4 | 69.1 |
| Automotive— | |||||||
| Service station (oil, petrol, accessories sales predominant) | 1,545 | 220.5 | 142.7 | 221.8 | 175.6 | 212.8 | 79.2 |
| Motor vehicles (including motor cycles) | 1,436 | 985.4 | 686.2 | 992.0 | 832.2 | 955.5 | 83.8 |
| Parts and accessories (including tyres and batteries) | 536 | 65.0 | 121.3 | 65.3 | 44.2 | 61.8 | 66.4 |
| Other automotive | 281 | 30.7 | 109.3 | 31.3 | 23.9 | 29.4 | 75.9 |
| Totals | 3,798 | 1,301.6 | 342.7 | 1,310.4 | 1,075.9 | 1,259.5 | 82.0 |
| Hardware— | |||||||
| Domestic hardware, crockery, glass and china | 332 | 20.4 | 61.4 | 20.6 | 14.8 | 19.4 | 70.0 |
| Paint, varnish, and wallpaper | 238 | 25.7 | 108.1 | 26.4 | 18.8 | 24.9 | 71.5 |
| Builders hardware (†) | 214 | 62.4 | 291.6 | 63.4 | 46.8 | 57.7 | 74.1 |
| Timber and building materials | 294 | 137.9 | 468.9 | 145.2 | 101.6 | 130.8 | 72.8 |
| Other hardware | 170 | 11.9 | 69.8 | 12.3 | 7.8 | 11.3 | 63.7 |
| Totals | 1,248 | 258.2 | 206.9 | 268.0 | 189.8 | 244.2 | 72.4 |
| Chemicals Chemist | 1,160 | 93.3 | 80.5 | 93.7 | 64.4 | 85.7 | 67.3 |
| Other chemicals | 33 | 3.8 | 115.4 | 4.4 | 3.0 | 4.1 | 78.0 |
| Totals | 1.1 | 97.1 | 81.4 | 98.2 | 67.3 | 89.8 | 67.7 |
| Miscellaneous— | |||||||
| General store | 687 | 129.5 | 188.5 | 131.6 | 108.4 | 126.2 | 83.1 |
| Department and variety store | 379 | 292.6 | 772.0 | 302.2 | 210.5 | 284.9 | 70.6 |
| Toys, novelties, etc. | 370 | 16.5 | 44.7 | 16.7 | 10.7 | 14.8 | 64.9 |
| Bookseller, newsagent, and stationer | 1,264 | 83.8 | 66.3 | 86.3 | 60.0 | 79.6 | 70.2 |
| Electrical goods | 104 | 13.5 | 130.1 | 13.9 | 8.8 | 13.1 | 65.0 |
| Florist | 273 | 5.7 | 20.8 | 5.7 | 2.9 | 4.9 | 50.6 |
| Jeweller | 537 | 23.8 | 44.3 | 23.9 | 15.3 | 21.7 | 60.6 |
| Pawnbroker and secondhand dealer | 344 | 21.7 | 63.0 | 21.9 | 16.6 | 21.2 | 74.0 |
| Seedsman and nurseryman | 262 | 11.3 | 43.2 | 11.4 | 6.3 | 10.2 | 54.7 |
| Tobacconist | 505 | 13.7 | 27.2 | 14.0 | 10.2 | 12.2 | 73.7 |
| Leather goods and harness | 144 | 6.0 | 41.8 | 6.0 | 4.0 | 5.7 | 64.7 |
| Music and record store | 133 | 12.1 | 90.8 | 12.5 | 8.3 | 11.8 | 66.3 |
| Office supplies store | 111 | 27.0 | 243.2 | 27.2 | 13.4 | 23.7 | 52.3 |
| Sports goods dealer | 276 | 18.8 | 68.3 | 18.9 | 13.7 | 17.8 | 69.7 |
| Agricultural machinery and farm equipment | 177 | 53.6 | 302.6 | 54.7 | 38.5 | 51.2 | 67.9 |
| Photographic dealer | 131 | 7.2 | 55.3 | 7.3 | 5.0 | 6.9 | 67.9 |
| Sewing machine dealer | 117 | 8.2 | 70.3 | 8.4 | 5.1 | 7.6 | 61.3 |
| Other miscellaneous | 1,151 | 272.9 | 237.1 | 290.2 | 220.7 | 272.0 | 79.5 |
| Totals | 6,965 | 1,018.1 | 146.2 | 1,052.9 | 758.5 | 985.5 | 73.2 |
| Grand Totals | 33,700 | 4,314.0 | 128.0 | 4,385.3 | 3,256.7 | 4,114.2 | 74.5 |
The following table shows the number of retail stores handling particular commodity groups and the total sales of each commodity group during the year ended 31 March 1973.
| Commodity Group | Number of Stores Handling Commodities | Total Sales of Commodity |
|---|---|---|
| No. | $ (m) | |
| Groceries (excluding processed meat, fish, smallgoods, etc.) | 6,546 | 367.3 |
| Fresh and frozen fish (including molluscs, etc.) | 2,236 | 12.3 |
| Fresh fruit and vegetables | 5,106 | 74.3 |
| Fresh and frozen meat | 5,202 | 154.3 |
| Processed (other than tinned) meat, fish, bacon, ham, small-goods, etc. | 4,690 | 31.6 |
| Bread, cakes, and pastries | 5,983 | 48.7 |
| Milk, cream, yoghurt | 5,562 | 36.2 |
| Cooked take-away food, fish and chips, hamburgers, etc. | 1,999 | 34.8 |
| Beer, wine, and spirits | 1,985 | 254.2 |
| Confectionery, ice cream, soft drinks, snack foodstuffs, etc. | 8,692 | 90.4 |
| Meals consumed on premises and separately charged | 1,750 | 64.1 |
| Cigarettes, tobacco, and tobacconists' sundries | 10,292 | 94.3 |
| Drapery, millinery, haberdashery, soft furnishings, bedding, household textiles | 2,939 | 98.5 |
| Women's, girls', and infants clothing and accessories | 3,343 | 160.6 |
| Furniture (including mattresses, blinds, etc.) | 1,216 | 78.3 |
| Floor coverings (including carpets, lino, floor tiles, etc.) | 856 | 56.1 |
| Footwear—men's and boys' | 1,911 | 25.1 |
| Footwear—women's, girls', and infants' | 1,744 | 39.8 |
| Men's and boys' clothing and accessories | 2,362 | 109.4 |
| TV sets, parts, and accessories (excluding rental sets) | 1,219 | 14.5 |
| Radios, record players, tape recorders, etc. | 1,319 | 22.4 |
| Musical instruments, records, sheet music, etc. | 773 | 16.0 |
| Domestic refrigerators and freezers | 1,181 | 26.2 |
| Commodity Group | Stores Handling Commodities | Total Sales of Commodity |
|---|---|---|
| No. | $ (m) | |
| Washing machines, stoves, household heating and ventilation appliances, etc. | 1,285 | 29.6 |
| Sewing and knitting machines, parts, etc. | 566 | 10.0 |
| Other household appliances and accessories (including vacuum cleaners, motor mowers, toasters, food mixers, electric blankets, etc.) | 2,067 | 32.5 |
| Domestic hardware (including kitchenware, china, glassware, cutlery, garden tools, etc.) | 2,621 | 52.8 |
| Wallpaper and glass | 589 | 15.0 |
| Timber (including joinery and fencing) | 698 | 91.2 |
| Wood-based panel products (e.g., hardboard, softboard, plywood) | 341 | 21.6 |
| Cement, clay, plaster, and concrete products, sand and gravel, bricks, tiles, pipes, etc. | 579 | 36.9 |
| Paints and varnishes | 1,354 | 24.9 |
| Plumbing supplies | 435 | 6.0 |
| Electrical supplies (builders) | 467 | 12.9 |
| Hand tools (including electrical) | 1,000 | 11.5 |
| Other builders' hardware and materials (including structural steel, metal joinery, etc.) | 834 | 55.3 |
| Motorcars and station wagons—new | 775 | 323.6 |
| Motorcars and station wagons—used | 1,520 | 335.9 |
| Trucks, vans, buses, and other vehicles except motor cycles—new | 511 | 67.4 |
| Trucks, vans, buses, and other vehicles except motor cycles—used | 620 | 31.8 |
| Motor cycles and motor scooters—new | 266 | 16.7 |
| Tyres and tubes (including stock retreads and recaps) | 2,665 | 43.7 |
| Motor vehicle parts and accessories (including batteries) | 3,067 | 136.4 |
| Motor spirit (not including diesel fuel) | 3,095 | 170.1 |
| Diesel fuel | 1,490 | 6.8 |
| Lubrication oil | 2,472 | 12.1 |
| Caravans and trailers (including fixtures and fittings) | 210 | 12.2 |
| Boats, outboard and inboard motors, parts, etc. | 366 | 19.3 |
| Agricultural machinery and implements (including tractors, parts, and accessories) | 815 | 67.6 |
| Industrial machinery and equipment (including fork lifts, machine tools, parts, etc.) | 268 | 36.3 |
| Office and business machines and equipment, parts and accessories | 186 | 22.5 |
| Fertilisers and manures | 775 | 48.1 |
| Grain, bulk seed, feed, and. fodder | 627 | 69.4 |
| Medical and pharmaceutical goods | 1,299 | 25.0 |
| Stock remedies | 543 | 11.6 |
| Agricultural chemicals | 586 | 13.7 |
| Toiletries, cosmetics, perfumes, etc. | 3,066 | 39.3 |
| Prescription medicines (including dispensing and payments from Department of Health) | 1,162 | 39.4 |
| Photographic equipment, accessories, and supplies (including projectors, enlargers, chemicals, and film) | 1,144 | 10.5 |
| Souvenirs and novelties | 1,340 | 12.7 |
| Travel goods, briefcases, handbags, etc., of leather or plastic | 712 | 8.3 |
| Sports goods and requisites, camping equipment, toys, games etc. | 1,851 | 36.2 |
| Watches, clocks, jewellery, precious stones | 1,393 | 24.8 |
| Seeds, plants, and other garden supplies (excluding garden tools) | 1,224 | 15.8 |
| Books, stationery, newspapers, magazines, greeting cards, etc. | 4,247 | 92.0 |
| Secondhand goods, antiques, etc. | 615 | 32.1 |
CENSUS OF DISTRIBUTION 1968—Some statistics of retail trade, most wholesale trade data, and the data on services covered by the census were not available from the 1973 Census of Distribution in time for inclusion in this section (although some details may be given in the Latest Statistical Information section at the back of the Yearbook.) The following information was derived from the previous (1968) census in this 5-yearly series.
The number of multiple stores engaged in retail trade in 1968 represented only 13 percent of the total stores, but accounted for 37 percent of the total turnover. A multiple store is defined as one of a group of four or more under common ownership.
| Store-type Group | Number of Stores | Turnover During 1967-68 | Stocks at | |
|---|---|---|---|---|
| Start of Year (April 1967) | Close of Year (March 1968) | |||
| Multiple Stores | ||||
| $(000) | $(000) | $(000) | ||
| Food and drink | 1,190 | 136,275 | 6,563 | 7,344 |
| Apparel | 612 | 39,897 | 11,918 | 12,884 |
| Furniture | 320 | 36,157 | 8,177 | 7,892 |
| Automotive | 140 | 91,564 | 15,644 | 14,482 |
| Hardware | 202 | 64,646 | 15,066 | 14,860 |
| Chemists, etc. | 28 | 2,835 | 356 | 347 |
| Miscellaneous | 1,268 | 402,035 | 82,353 | 83,958 |
| Totals | 3,760 | 773,409 | 140,078 | 141,767 |
| Other Stores | ||||
| Food and drink | 12,802 | 561,299 | 30,633 | 32,525 |
| Apparel | 3,507 | 128,198 | 40,433 | 42,615 |
| Furniture | 1,258 | 81,842 | 19,796 | 19,721 |
| Automotive | 1,204 | 200,723 | 27,019 | 27,779 |
| Hardware | 806 | 54,747 | 13,595 | 14,085 |
| Chemists, etc. | 1,139 | 55,632 | 9,514 | 10,054 |
| Miscellaneous | 4,855 | 243,857 | 48,651 | 51,666 |
| Totals | 25,571 | 1,326,298 | 189,642 | 198,445 |
The following table shows average turnover and average labour force per establishment, turnover per unit of labour force and per head of population, and the approximate number of times stock was turned over each year as recorded by store-type group at the 1968 census.
| Store-type Group | Average Turnover per Establishment | Average Labour Force per Establishment | Average Turnover per Unit of Labour Force | Turnover per Head of Population | Number of Times Stock Turned Over per Annum |
|---|---|---|---|---|---|
| Food and drink | 49,855 | 3.8 | 13,136 | 253.19 | 18.8 |
| Apparel | 40,810 | 3.4 | 11,843 | 61.01 | 3.2 |
| Furniture | 74,777 | 4.8 | 15,429 | 42.83 | 4.2 |
| Automotive | 217,475 | 5.6 | 38,530 | 106.09 | 6.9 |
| Hardware | 118,445 | 6.5 | 18,178 | 43.34 | 4.2 |
| Chemists, etc. | 50,101 | 3.9 | 12,811 | 21.22 | 5.9 |
| Miscellaneous | 105,486 | 7.1 | 14,818 | 234.44 | 4.9 |
| All retail stores | 71,587 | 4.7 | 15,298 | 762.12 | 6.4 |
Wholesale Trade 1968—The following table shows the distribution of wholesale trade by statistical areas and by main location groups. The figures in parentheses are in each case the percentage of total.
| Area | Population at 31 March 1968 | Number of Stores | Purchases During 1967-68 | Turnover During 1967-68 | Stocks at Close of Year (March 1968) |
|---|---|---|---|---|---|
| (000) | $ (000) | $ (000) | $ (000) | ||
| Statistical Areas | |||||
| Northland | 94.7 | 68 | 16,676 | 20,048 | 2,111 |
| (3.4) | (1.8) | (1.4) | (1.3) | (0.9) | |
| Central Auckland | 644.1 | 1,079 | 401,086 | 517,612 | 80,716 |
| (23.4) | (28.6) | (32.9) | (32.6) | (33.7) | |
| South Auckland - Bay of Plenty | 403.9 | 296 | 77,531 | 102,263 | 12,010 |
| (14.7) | (7.8) | (6.3) | (6.4) | (5.0) | |
| East Coast | 47.1 | 46 | 8,441 | 10,706 | 1,194 |
| (1.7) | (1.2) | (0.7) | (0.7) | (0.5) | |
| Hawke's Bay | 128.3 | 143 | 28,202 | 35,618 | 4,676 |
| (4.6) | (3.8) | (2.3) | (2.2) | (1.9) | |
| Taranaki | 101.2 | 90 | 21,854 | 27,700 | 3,938 |
| (3.7) | (2.4) | (1.8) | (1.7) | (1.6) | |
| Wellington | 537.1 | 999 | 365,111 | 487,961 | 74,611 |
| (19.5) | (26.4) | (29.9) | (30.7) | (31.1) | |
| Marlborough | 30.2 | 34 | 4,719 | 6,579 | 946 |
| (1.1) | (0.9) | (0.4) | (0.4) | (0.4) | |
| Nelson | 68.3 | 67 | 14,156 | 17,524 | 2,344 |
| (2.5) | (1.8) | (1.2) | (1.1) | (1.0) | |
| Westland | 24.1 | 19 | 4,484 | 5,675 | 640 |
| (0.9) | (0.5) | (0.4) | (0.4) | (0.3) | |
| Canterbury | 386.0 | 573 | 180,553 | 235,396 | 36,849 |
| (14.0) | (15.2) | (14.8) | (14.8) | (15.4) | |
| Otago | 183.2 | 256 | 68,925 | 88,359 | 15,122 |
| (6.6) | (6.8) | (5.6) | (5.5) | (6.3) | |
| Southland | 106.9 | 108 | 27,704 | 35,168 | 4,556 |
| (3.9) | (2.8) | (2.3) | (2.2) | (1.9) | |
| Totals, all wholesale stores | 2,755.1 | 3,778 | 1,219,441 | 1,590,608 | 239,713 |
| (100.0) | (100.0) | (100.0) | (100.0) | (100.0) | |
| Location Groups | |||||
| Main urban areas (including Hutt urban area) | 1,235.0 | 2,494 | 914,812 | 1,201,317 | 190,544 |
| (44.8) | (66.0) | (75.0) | (75.5) | (79.5) | |
| Secondary urban areas (excluding Hutt urban area) | 505.8 | 880 | 244,396 | 310,740 | 40,676 |
| (18.4) | (23.3) | (20.1) | (19.5) | (17.0) | |
| Smaller centres, other urban and rural | 1,014.3 | 404 | 60,234 | 78,550 | 8,493 |
| (36.8) | (10.7) | (4.9) | (5.0) | (3.5) | |
| Totals, all wholesale stores | 2,755.1 | 3,778 | 1,219,441 | 1,590,608 | 239,713 |
| (100.0) | (100.0) | (100.0) | (100.0) | (100.0) | |
The following table shows details of wholesale establishments by store-type groups in 1968.
| Store-type Group | Number of Stores | Number of Paid Employees on 9 April 1968 | Total Labour Force on 9 April 1968 | ||
|---|---|---|---|---|---|
| Males | Females | Total | |||
| Food and drink | 867 | 7,774 | 2,599 | 10,373 | 10,894 |
| Apparel | 369 | 1,564 | 930 | 2,494 | 2,759 |
| Furniture | 271 | 1,331 | 504 | 1,835 | 2,004 |
| Automotive | 358 | 3,527 | 922 | 4,449 | 4,543 |
| Hardware | 481 | 4,540 | 967 | 5,507 | 5,713 |
| Chemicals | 161 | 1,714 | 668 | 2,382 | 2,412 |
| Miscellaneous | 1,271 | 10,243 | 3,437 | 13,680 | 14,355 |
| Totals, all wholesale stores | 3,778 | 30,693 | 10,027 | 40,720 | 42,680 |
| Store-type Group | Average Labour Force per Store | Salaries and Wages Paid During 1967-68 | Turnover During 1967-68 | Average Turnover per Unit of Labour Force | Stocks at Close of Year (March 1968) |
|---|---|---|---|---|---|
| $(000) | $(000) | $(000) | |||
| Food and drink | 12.6 | 22,266 | 462,937 | 42,495 | 36,168 |
| Apparel | 7.5 | 5,858 | 106,258 | 38,513 | 19,813 |
| Furniture | 7.3 | 4,255 | 81,758 | 40,797 | 13,762 |
| Automotive | 12.7 | 9,743 | 207,097 | 45,586 | 33,389 |
| Hardware | 11.8 | 12,585 | 171,404 | 30,002 | 34,496 |
| Chemicals | 15.0 | 5,560 | 93,611 | 38,118 | 16,535 |
| Miscellaneous | 11.3 | 30,881 | 467,544 | 32,570 | 85,550 |
| Totals, all wholesale stores | 11.3 | 91,147 | 1,590,608 | 37,268 | 239,713 |
A classification by size of turnover shows that stores with under $40,000 turnover numbered 704 (18.6 percent), but accounted for only $13,980,000, or 09 percent of turnover. At the other end of the scale a total turnover of $882,865,000 (55.5 percent) was accounted for by only 376 stores (10.0 percent), which had a turnover of $1,000,000 or more.
| Amount of Total Turnover | Number of Stores | Number of Paid Employees on 9 April 1968 | Total Labour Force on 9 April 1968 | Salaries and Wages Paid During 1967-68 | Turnover During 1967-68 | Stocks at Close of Year (March 1968) | ||
|---|---|---|---|---|---|---|---|---|
| Males | Females | Total | ||||||
| $(000) | $(000) | $(000) | ||||||
| Under 10,000 | 149 | 64 | 52 | 116 | 309 | 156 | 838 | 218 |
| 10,000- 19,999 | 201 | 188 | 182 | 370 | 598 | 578 | 2,896 | 471 |
| 20,000- 39,999 | 354 | 596 | 335 | 931 | 1,265 | 1,708 | 10,246 | 1,911 |
| 40,000-99,999 | 763 | 2,398 | 889 | 3,287 | 3,773 | 6,754 | 51,660 | 9,666 |
| 100,000-199,999 | 627 | 2,881 | 968 | 3,849 | 4,134 | 8,327 | 89,109 | 17,254 |
| 200,000-499,999 | 890 | 7,199 | 2,089 | 9,288 | 9,577 | 21,669 | 269,909 | 49,441 |
| 500,000-599,999 | 122 | 1,401 | 378 | 1,779 | 1,809 | 4,117 | 63,772 | 11,365 |
| 600,000-799,999 | 183 | 2,544 | 820 | 3,364 | 3,401 | 7,818 | 122,793 | 21,901 |
| 800,000-999,999 | 113 | 1,778 | 427 | 2,205 | 2,225 | 5,161 | 96,521 | 13,824 |
| 1,000,000 and over | 376 | 11,644 | 3,887 | 15,531 | 15,589 | 34,859 | 882,865 | 113,664 |
| Totals, all wholesale stores | 3,778 | 30,693 | 10,027 | 40,720 | 42,680 | 91,147 | 1,590,608 | 239,713 |
The following table shows a commodity analysis of wholesale trade.
| Commodity Group | Turnover During 1967-68 | |
|---|---|---|
| Amount | Percent of Total | |
| $(000) | ||
| Groceries and small goods (including butter, bacon, etc.) | 206,377 | 13.0 |
| Meat (uncooked) | 37,583 | 2.4 |
| Fish (uncooked) | 35 | 0.6 |
| Fruit and vegetables | 57,326 | 3.6 |
| Other foods (bread, cakes, pastry, etc.) | 40,380 | 2.5 |
| Milk, ice cream, confectionery, soft drinks, etc. | 46,870 | 2.9 |
| Beer, wine, and spirits | 65,971 | 4.1 |
| Tobacco, cigarettes, and tobacconists' sundries | 63,304 | 4.0 |
| Medical and pharmaceutical goods | 45,609 | 2.9 |
| Toiletries and cosmetics | 17,634 | 1.1 |
| Men's and boys' wear | 30,154 | 1.9 |
| Women's, girls', and infants' wear | 39,914 | 2.5 |
| Drapery, dress-piece goods, millinery, haberdashery, etc. | 43,561 | 2.7 |
| Footwear | 18,653 | 1.2 |
| Furniture, beddings, soft furnishings, and household textiles | 29,645 | 1.9 |
| Floor coverings | 28,323 | 1.8 |
| Television sets and parts | 7,681 | 0.5 |
| Radios, radiograms, record players, and tape recorders | 4,433 | 0.3 |
| Musical instruments (including records) | 1,994 | 0.1 |
| Other household appliances and electrical goods | 40,595 | 2.5 |
| Domestic hardware, cutlery, china, glassware | 31,226 | 2.0 |
| Builders' hardware and materials (excluding timber, bricks, and roofing tiles) | 63,740 | 4.0 |
| Books, stationery, newspapers, etc. | 27,191 | 1.7 |
| Motor vehicles | 118,911 | 7.5 |
| Motor-vehicle parts and accessories (excluding petrol and oil) | 89,352 | 5.6 |
| Jewellery (including watches, clocks, and precious stones) | 9,601 | 0.6 |
| Coal, coke, and firewood | 16,320 | 1.0 |
| Sports goods (including toys and games) | 13,827 | 0.9 |
| Fertilisers and manures | 23,335 | 1.5 |
| Grain, bulk seed, and fodder | 29,059 | 1.8 |
| Florists' goods, seeds, plants, and garden supplies | 5,836 | 0.4 |
| Industrial machinery (heavy and electrical) | 54,551 | 3.4 |
| Agricultural machinery | 15,630 | 1.0 |
| Office machinery and equipment | 4,285 | 0.3 |
| Other machinery, machine tools, and hand tools, etc. | 43,088 | 2.7 |
| Leather, luggage, and harness | 9,139 | 0.6 |
| Paint, glass, and wallpaper | 29,163 | 1.8 |
| Photographic supplies and equipment | 7,173 | 0.4 |
| Plumbing equipment and piping | 33,482 | 2.1 |
| Printers' supplies, paper and inks | 11,000 | 0.7 |
| Rubber goods (excluding tyres and tubes) | 10,618 | 0.7 |
| Professional and scientific equipment | 7,213 | 0.5 |
| Other | 100,923 | 6.3 |
| Totals, wholesale commodities | 1,590,605 | 100.0 |
Service Establishments—Only a selected group of services was included in the Census of Distribution 1968. These were grouped in three broad divisions; personal, business and community, and other services.
Of the total number of service establishments, 81 percent provided services only, and in the remainder some secondary form of trading was also carried on.
Services covered by the census totalled 3,653 establishments of which 2,629, or 72 percent, were in the North Island and 1,024, or 28 percent, in the South Island.
The principal centres of population (urban areas) contained 74 percent of service establishments with 88 percent of the total turnover of such establishments.
The following table gives details of numbers and location of those services covered by the census in 1968.
| Item | Personal Services | Business and Community Services | Other Services | Total | |
|---|---|---|---|---|---|
| Number of establishments | No. | 2,696 | 264 | 693 | 3,653 |
| Sales or turnover during 1967-68 | $(000) | 44,265 | 27,046 | 11,471 | 82,782 |
| Location of establishments— | |||||
| Main urban areas (including Hutt urban area) | No. | 1,230 | 179 | 325 | 1,734 |
| Secondary urban areas (excluding Hutt urban area) | No. | 723 | 50 | 179 | 952 |
| Smaller centres | No. | 358 | 23 | 87 | 468 |
| Other urban | No. | 284 | 7 | 56 | 347 |
| Rural | No. | 101 | 5 | 46 | 152 |
| Paid employees on 9 April 1968— | |||||
| Males | No. | 4,343 | 851 | 879 | 6,073 |
| Females | No. | 9,816 | 440 | 178 | 10,434 |
| Totals | No. | 14,159 | 1,291 | 1,057 | 16,507 |
| Total labour force on 9 April 1968 | No. | 17,046 | 1,560 | 1,823 | 20,429 |
| Salaries and wages paid during 1967-68 | $(000) | 16,545 | 3,506 | 2,077 | 22,128 |
Service establishments are further analysed in the following table.
| Amount of Total Turnover | Number of Establishments | Number of Paid Employees on 9 April 1968 | Total Labour Force 9 April 1968 | Salaries and Wages Paid During 1967-68 | Turnover During 1967-68 | ||
|---|---|---|---|---|---|---|---|
| Males | Females | Total | |||||
| $(000) | $(000) | ||||||
| Under 2,000 | 267 | 3 | 41 | 44 | 324 | 29 | 350 |
| 2,000- 3,999 | 652 | 45 | 326 | 371 | 1,046 | 331 | 1,943 |
| 4,000- 5,999 | 649 | 61 | 625 | 686 | 1,359 | 636 | 3,216 |
| 6,000- 9,999 | 744 | 210 | 969 | 1,179 | 2,015 | 1,223 | 5,702 |
| 10,000- 19,999 | 666 | 748 | 1,218 | 1,966 | 2,736 | 2,434 | 9,189 |
| 20,000- 39,999 | 359 | 1,091 | 1,187 | 2,278 | 2,698 | 3,036 | 10,021 |
| 40,000- 99,999 | 199 | 1,260 | 1,506 | 2,766 | 2,951 | 4,068 | 12,017 |
| 100,000-199,999 | 54 | 786 | 1,391 | 2,177 | 2,218 | 2,737 | 7,481 |
| 200,000 and over | 63 | 1,869 | 3,171 | 5,040 | 5,082 | 7,633 | 32,863 |
| Totals | 3,653 | 6,073 | 10,434 | 16,507 | 20,429 | 22,128 | 82,782 |
The nature of the service establishments covered in the Census of Distribution 1968 is shown in the following table. It should be recognised that there are many other types of services.
| Nature of Service | Number of Stores or Agencies |
|---|---|
| Personal services— | |
| Cleaner (office, window, shop) | 237 |
| Funeral director and undertaker | 105 |
| Hairdresser and beauty salon | 1,715 |
| Laundry, drycleaner, carpet cleaner, dyer | 374 |
| Photographer (portrait and commercial) | 265 |
| Total | 2,696 |
| Community and business services— | |
| Advertising agency | 85 |
| Chiropodist | 28 |
| Commercial artist | 93 |
| Private rental library and book club | 58 |
| Total | 264 |
| Other services— | |
| Bicycle repairer | 13 |
| Blacksmith | 85 |
| Footwear repairer | 191 |
| Carpet fitter and sewer | 54 |
| Electrical repair shop | 173 |
| Gunsmith and locksmith | 14 |
| Tool repairer and sharpener | 50 |
| Watch and clock repairer | 113 |
| Total | 693 |
| Grand total | 3,653 |
Turnover figures for the major service establishments covered were as follows: advertising agencies, $24.8 million; laundries and drycleaners, $16.1 million; hairdressers and beauty salons, $12.0 million; office cleaners, etc., $8.4 million; photographers, $4.3 million; funeral directors, $3.4 million; electrical repairers, $4.6 million; commercial artists, $2.0 million; carpet fitters, $1.9 million; blacksmiths, $1.8 million; footwear repairers, $1.5 million; watch repairers, $0.8 million; tool repairers, $0.6 million.
The following table shows details of total services provided by retail and service establishments for the above groupings.
| Type of Service | Number of Establishments Handling Service Specified | Turnover During 1967-68 |
|---|---|---|
| Personal service provided by establishments classified as— | $(000) | |
| Service establishments | 2,696 | 43,237 |
| Retail stores | 716 | 3,160 |
| Totals, personal services | 3,412 | 46,398 |
| Community and business services provided by establishments classified as— | ||
| Service establishments | 264 | 27,004 |
| Retail stores | 88 | 272 |
| Totals, community and business services | 352 | 21,216 |
| Other services provided by establishments classified as— | ||
| Service establishments | 693 | 9,533 |
| Retail stores | 1,892 | 13,107 |
| Totals, other services | 2,585 | 22,640 |
| Grand totals, all services | 6,349 | 96,314 |
QUARTERLY SURVEY OF RETAIL TRADE—A quarterly sample survey of retail trade was made by the Department of Statistics until the December quarter 1969, but was replaced by a monthly sample survey in January 1970 and the results of this sample are aggregated to obtain quarterly figures.
The present sample survey excludes certain types of retail stores which were included in the Census of Distribution 1968; these store types are hotels, chartered clubs, wine and spirit merchants, and the complete automotive group. Besides the above exclusions, for purposes of the sample survey some changes in the grouping of store types apply. It is important to note the exclusion of motor vehicle sales, which became fairly volatile, firstly as a result of the easing of import controls and, later, as a result of changes in the incidence of sales tax and of the general economic situation.
The following table gives quarterly sales and also stocks at 31 March for store-type groups.
| Quarter Ended | Butcher, Poulterer, etc. | Grocer | Other Food and Drink | Footwear | Other Apparel | Furniture and Soft Furnishings | Household Appliances, Electrical Goods, Radios, etc. | Hardware, Builders' Hardware, Paints, etc. | Chemist | General, Department, and Variety | Other | All Groups |
|---|---|---|---|---|---|---|---|---|---|---|---|---|
| $(million) | ||||||||||||
| Retail Sales | ||||||||||||
| 1970— | ||||||||||||
| Mar | 27.0 | 91.5 | 56.1 | 7.6 | 37.7 | 19.0 | 18.5 | 31.4 | 14.3 | 55.7 | 108.9 | 467.6 |
| Jun | 29.8 | 94.5 | 55.5 | 10.4 | 49.0 | 24.4 | 22.3 | 34.2 | 15.0 | 68.8 | 111.9 | 515.9 |
| Sep | 29.8 | 98.6 | 56.1 | 8.7 | 44.0 | 23.5 | 21.8 | 35. | 317.1 | 63.8 | 113.4 | 512.1 |
| Dec | 31.0 | 111.9 | 64.1 | 12.0 | 55.6 | 27.8 | 24.4 | 41.6 | 20.9 | 88.3 | 127.8 | 605.3 |
| 1971— | ||||||||||||
| Mar | 27.7 | 102.7 | 60.4 | 9.0 | 41.7 | 23.1 | 19.5 | 34.9 | 16.6 | 62.1 | 112.7 | 510.3 |
| Jun | 30.2 | 106.0 | 60.0 | 12.8 | 53.5 | 25.0 | 21.0 | 36.3 | 16.9 | 76.3 | 114.8 | 553.0 |
| Sep | 31.6 | 111.4 | 61.7 | 9.8 | 48.6 | 27.8 | 21.0 | 38.1 | 18.9 | 70.9 | 119.5 | 559.1 |
| Dec | 32.3 | 123.5 | 70.2 | 13.2 | 60.0 | 30.0 | 22.6 | 43.8 | 23.3 | 94.4 | 138.8 | 652.2 |
| 1972— | ||||||||||||
| Mar | 30.2 | 115.0 | 66.7 | 9.7 | 47.5 | 26.1 | 20.4 | 39.5 | 19.6 | 69.2 | 123.6 | 567.5 |
| Jun | 32.0 | 116.0 | 65.3 | 13.4 | 59.2 | 32.0 | 23.4 | 41.2 | 20.7 | 86.1 | 126.4 | 615.6 |
| Sep | 33.3 | 123.7 | 68.1 | 10.2 | 55.4 | 35.5 | 23.7 | 43.0 | 22.1 | 83.3 | 132.9 | 631.3 |
| Dec | 35.7 | 138.2 | 76.5 | 13.6 | 68.3 | 39.0 | 27.9 | 49.2 | 27.5 | 106.7 | 164.0x | 746.6x |
| 1973— | ||||||||||||
| Mar | 35.0 | 131.1 | 74.8 | 10.9 | 54.9 | 35.0 | 24.4 | 46.4 | 24.5 | 79.6 | 151.3 | 667.7x |
| Jun | 38.7 | 133.0 | 75.4 | 14.4 | 69.5 | 40.0 | 28.8 | 47.6 | 24.1 | 96.3 | 150.1 | 718.1x |
| Sep | 40.9 | 136.0 | 79.4 | 12.1 | 67.5 | 47.4 | 31.2 | 51.2 | 25.7 | 95.5 | 163.0 | 749.9 |
| Dec | 43.8 | 154.9 | 91.2 | 16.4 | 81.3 | 56.7 | 38.3 | 62.2 | 33.3 | 130.5 | 205.3 | 913.9 |
| 1974. | ||||||||||||
| Mar | 38.1 | 143.7 | 87.8 | 12.7 | 67.6 | 45.8 | 34.4 | 53.0 | 27.7 | 97.6 | 184.5 | 792.9 |
| Jun | 40.5 | 147.3 | 89.0 | 16.0 | 82.1 | 56.2 | 41.3 | 51.9 | 29.1 | 116.6 | 182.9 | 852.7 |
| Sep | 38.8 | 158.8 | 92.8 | 14.1 | 78.5 | 60.8 | 46.7 | 58.7 | 32.1 | 113.4 | 187.9 | 882.6 |
| Dec | 39.2 | 183.2 | 102.8 | 18.6 | 91.2 | 61.0 | 53.1 | 67.3 | 40.4 | 142.5 | 229.1 | 1,028.4 |
| Retail Stocks at 31 March | ||||||||||||
| 1969 | 1.3 | 25.8 | 6.0 | 13.3 | 52.9 | 16.2 | 19.1 | 29.0 | 10.6 | 46.1 | 85.6 | 305.9 |
| 1970 | 1.4 | 28.7 | 6.4 | 14.5 | 57.7 | 18.2 | 19.2 | 30.5 | 12.0 | 55.6 | 92.8 | 337.1 |
| 1971 | 1.6 | 30.0 | 7.0 | 15.7 | 62.5 | 20.8 | 18.3 | 33.0 | 13.3 | 63.0 | 98.0 | 363.0 |
| 1972 | 1.2 | 30.7 | 7.2 | 17.4 | 70.0 | 23.3 | 19.8 | 36.0 | 14.7 | 68.1 | 106.3 | 394.6 |
| 1973 | 1.4 | 33.5 | 7.8 | 17.1 | 72.4 | 25.5 | 21.4 | 37.2 | 16.6 | 69.1 | 106.4 | 408.5 |
| 1974 | 1.6 | 37.8 | 9.2 | 18.3 | 82.8 | 35.1 | 23.9 | 37.9 | 19.1 | 85.6 | 136.3 | 487.6 |
Retail Trade Statistics Adjusted for Seasonal Fluctuations and for Price and Population Changes—To facilitate direct comparisons between quarterly figures, seasonally adjusted values of retail trade turnover have been prepared. To do this, seasonal adjustment factors were calculated representing, for each quarter, an average over several years of the ratio of sales in this quarter to the trend value for the quarter (the trend values being calculated as appropriately centred moving averages).
A special price index has been prepared for the purpose of deflating the retail sales figures to give a series in dollars of constant purchasing power—i.e., the adjusted series shows the changes in the real volume of retail sales. The principal source of the prices used for this index are the commodity prices used in the Consumers' Price Index. The prices have been appropriately weighted and the whole index expressed on the base: year ended 31 March 1958 (=1000), so that application of the index to the original figures, both before and after seasonal correction, gives series in constant 1957-58 dollars.
The results of these calculations and adjustments are shown in the following table for all store types.
| Quarter Ended | In Current's | In Constant 1957-58's | ||||
|---|---|---|---|---|---|---|
| As Recorded | Seasonally Adjusted | Before Seasonal Adjustment | Seasonally Adjusted | |||
| Value | Index Number* | Value | Index Number* | |||
*Base: Average quarterly values during the year ended March 1958 = 1000. †Provisional. | ||||||
| Total Sales | ||||||
| $(m) | $(m) | $(m) | $(m) | |||
| 1970—Mar | 467.6 | 491.2 | 2,008 | 334.4 | 351.2 | 1,436 |
| Jun | 515.9 | 523.8 | 2,141 | 363.2 | 368.7 | 1,507 |
| Sep | 512.1 | 534.3 | 2,184 | 352.4 | 367.6 | 1,503 |
| Dec | 605.3 | 545.2 | 2,228 | 401.7 | 361.8 | 1,479 |
| 1971—Mar | 510.3 | 541.2 | 2,212 | 334.5 | 354.7 | 1,450 |
| Jun | 553.0 | 559.2 | 2,286 | 350.5 | 354.0 | 1,447 |
| Sep | 559.2 | 581.1 | 2,376 | 350.2 | 364.0 | 1,488 |
| Dec | 652.2 | 586.8 | 2,399 | 400.0 | 359.9 | 1,471 |
| 1972—Mar | 567.5 | 604.4 | 2,471 | 341.8 | 364.0 | 1,489 |
| Jun | 615.6 | 621.0 | 2,539 | 369.4 | 372.8 | 1,524 |
| Sep | 631.3 | 652.1 | 2,666 | 375.1 | 387.5 | 1,584 |
| Dec | 746.6 | 673.5 | 2,754 | 440.4 | 397.1 | 1,624 |
| 1973—Mar | 667.7 | 711.7 | 2,910 | 382.7 | 407.9 | 1,668 |
| Jun | 718.1 | 729.7 | 2,983 | 403.3 | 409.9 | 1,676 |
| Sep | 749.9 | 773.3 | 3,161, | 408.7 | 421.3 | 1,722 |
| Dec | 913.9 | 821.4 | 3,358, | 493.6 | 443.9 | 1,815 |
| 1974—Mar | 792.9 | 841.9 | 3,442, | 419.6 | 445.4 | 1,821 |
| Jun | 852.7 | 871.5 | 3,563, | 443.5 | 453.4 | 1,854 |
| Sep | 882.6 | 907.6 | 3,711, | 446.2 | 459.1 | 1,877 |
| Dec | 1,028.4 | 923.0 | 3,773, | 503.4 | 451.9 | 1,847 |
| Sales per Head of Population | ||||||
| 1970—Mar | 166.42 | 174.81 | 1,605 | 118.99 | 124.99 | 1,148 |
| Jun | 183.36 | 186.18 | 1,710 | 129.10 | 131.07 | 1,204 |
| Sep | 181.79 | 189.66 | 1,742 | 125.07 | 130.49 | 1,198 |
| Dec | 213.28 | 192.10 | 1,764 | 141.54 | 127.51 | 1,171 |
| 1971—Mar | 178.64 | 189.48 | 1,740 | 117.09 | 124.17 | 1,140 |
| Jun | 193.54 | 195.71 | 1,797 | 122.67 | 123.91 | 1,138 |
| Sep | 195.47 | 203.14 | 1,865 | 122.42 | 127.26 | 1,169 |
| Dec | 226.19 | 203.49 | 1,869 | 138.72 | 124.75 | 1,146 |
| 1972—Mar | 195.01 | 207.70 | 1,907 | 117.47 | 125.10 | 1,149 |
| Jun | 211.75 | 213.58 | 1,961 | 127.02 | 128.22 | 1,177 |
| Sep | 216.65 | 223.83 | 2,055 | 128.74 | 133.00 | 1,221 |
| Dec | 253.77 | 228.92 | 2,102 | 149.69 | 134.98 | 1,239 |
| 1973—Mar | 225.00 | 239.80 | 2,202 | 128.93 | 137.45 | 1,262 |
| Jun | 241.83 | 245.76 | 2,257 | 135.84 | 138.05 | 1,268 |
| Sep | 252.14 | 260.01 | 2,388 | 137.42 | 141.67 | 1,301 |
| Dec | 304.12x | 273.35x | 2510x | 164.27x | 147.72x | 1,356 |
| 1974—Mar | 261.25 | 277.40 | 2,547 | 138.26 | 146.77 | 1,348 |
| Jun | 280.96 | 287.16 | 2,637 | 146.12 | 149.41 | 1,372 |
| Sep | 290.55 | 298.78 | 2,744 | 146.88 | 151.11 | 1,388 |
| Dec† | 334.78 | 300.47 | 2,759 | 163.88 | 147.11 | 1,351 |
Information on quarterly sales is presented graphically in the following diagrams.
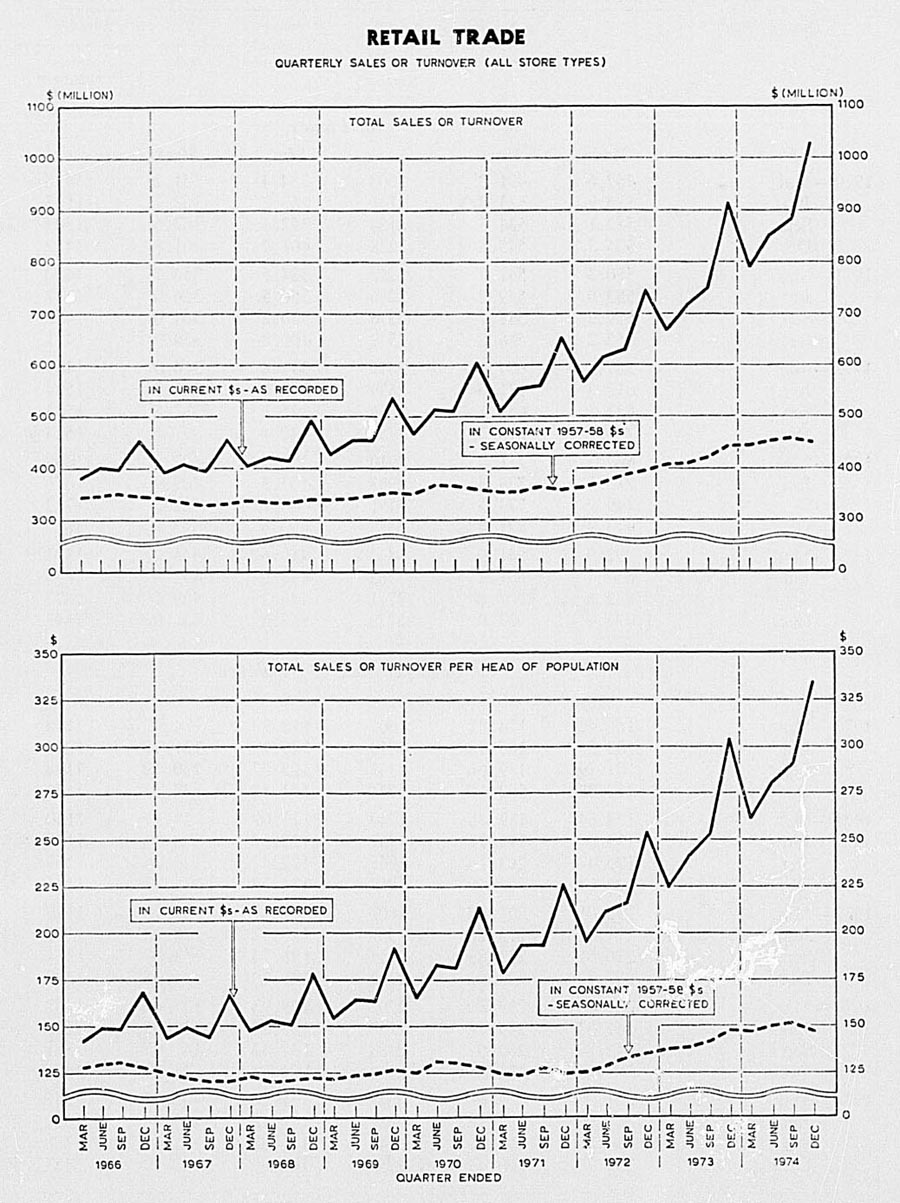
QUARTERLY SURVEY OF WHOLESALE TRADE—In this survey stores are classified by store-type group according to the predominant type of commodity sold. The store-type figures therefore do not cover only sales of goods normally associated with the type of store listed, as there are many wholesale stores which handle a wide variety of commodities.
It should be noted that this survey has altered coverage of wholesale store types as compared with the coverage of the Censuses of Distribution. For this reason, and because of the lack of uniformity in the trading year for which firms supplied census returns, care should be exercised when comparing the survey statistics with the censuses.
Certain stores (about a third of the food and drink group) which by nature of their business have a low ratio of stock to total turnover, have been omitted to facilitate collection and compilation of data.
The following table shows, by store-type group, the values of sales during the quarter.
| Quarter | Food and Drink | Apparel | Furniture | Automotive | Hardware | Chemicals | General Merchants | Machinery (Agricultural, Heavy Electrical and Industrial) |
|---|---|---|---|---|---|---|---|---|
| $ (million) | ||||||||
| 1970—Mar | 120.0 | 41.0 | 24.4 | 89.6 | 60.5 | 34.5 | 25.5 | 35.4 |
| Jun | 118.9 | 46.3 | 30.5 | 111.3 | 67.9 | 35.6 | 28.4 | 39.2 |
| Sep | 127.4 | 47.1 | 35.0 | 111.2 | 70.6 | 36.1 | 34.2 | 42.6 |
| Dec | 149.4 | 51.1 | 36.4 | 104.3 | 72.1 | 40.8 | 37.6 | 40.8 |
| 1971—Mar | 137.9 | 47.2 | 27.6 | 97.4 | 66.6 | 37.1 | 29.0 | 40.1 |
| Jun | 141.7 | 50.0 | 31.5 | 106.7 | 67.1 | 40.9 | 30.1 | 39.6 |
| Sep | 142.7 | 54.8 | 33.2 | 111.5 | 68.9 | 36.5 | 34.3 | 43.4 |
| Dec | 163.1 | 49.7 | 33.2 | 130.2 | 71.4 | 42.1 | 35.9 | 47.1 |
| 1972—Mar | 145.3 | 49.5 | 28.4 | 118.6 | 72.1 | 40.5 | 28.1 | 40.5 |
| Jun | 144.2 | 50.6 | 34.6 | 143.8 | 75.4 | 38.1 | 31.3 | 42.2 |
| Sep | 149.9 | 55.7 | 33.9 | 138.2 | 81.0 | 44.3 | 37.9 | 45.1 |
| Dec | 171.5 | 55.0 | 43.0 | 152.4 | 89.0 | 45.5 | 40.7 | 53.5 |
| 1973—Mar | 162.6 | 53.6 | 36.8 | 150.8 | 90.0 | 43.9 | 36.0 | 52.3 |
| Jun | 165.6 | 63.9 | 44.3 | 155.5 | 94.9 | 46.5 | 42.4 | 50.5x |
| Sep | 172.5 | 70.8 | 52.7 | 167.6 | 103.5 | 50.4 | 44.6 | 61.6 |
| Dec | 194.2 | 73.0 | 55.0 | 184.9 | 109.0 | 57.9 | 48.5 | 62.8x |
| 1974—Mar | 174.9 | 68.5 | 49.6 | 156.9 | 107.7 | 55.9 | 45.4 | 61.2 |
| Jun | 181.0 | 78.0 | 60.5 | 165.5 | 119.0 | 58.0 | 49.5 | 61.2 |
| Sep | 195.7 | 79.2 | 75.2 | 189.7 | 133.7 | 55.0 | 60.1 | 76.5 |
| Dec | 225.2 | 84.3 | 69.9 | 173.7 | 125.7 | 57.0 | 59.3 | 76.9 |
| Quarter | Electrical Supplies | Paper and Stationery | Grains and Seeds | Rubber, Leather, and Canvas Goods | Office Printers' and Photographic Supplies | Other | All Group |
|---|---|---|---|---|---|---|---|
| 1970—Mar | 15.0 | 17.6 | 7.7 | 6.2 | 7.2 | 34.3 | 518.9 |
| Jun | 17.6 | 17.7 | 8.4 | 7.6 | 7.5 | 36.0 | 572.8 |
| Sep | 18.0 | 18.7 | 9.4 | 7.9 | 8.3 | 37.5 | 604.0 |
| Dec | 20.4 | 19.4 | 7.9 | 8.0 | 11.1 | 44.6 | 643.8 |
| 1971—Mar | 18.9 | 19.1 | 7.6 | 7.3 | 9.5 | 35.5 | 580.7 |
| Jun | 24.1 | 17.6 | 8.7 | 8.1 | 10.3 | 46.4 | 622.6 |
| Sep | 23.6 | 20.0 | 10.3 | 8.7 | 11.5 | 42.7 | 642.0 |
| Dec | 24.9 | 20.8 | 8.1 | 8.6 | 11.5 | 58.9 | 705.4 |
| 1972—Mar | 16.3 | 20.9 | 8.6 | 7.5 | 10.1 | 47.7 | 634.0 |
| Jun | 21.8 | 20.5 | 8.3 | 8.9 | 9.8 | 51.2 | 680.8 |
| Sep | 25.5 | 22.2 | 9.7 | 10.0 | 10.5 | 55.7 | 719.6 |
| Dec | 23.3 | 22.2 | 8.8 | 10.2 | 12.9 | 67.0 | 794.9 |
| 1973—Mar | 24.7 | 24.0 | 10.5 | 10.2 | 12.4 | 57.0 | 764.9 |
| Jun | 28.7 | 24.3 | 11.0 | 11.1 | 12.8 | 65.2 | 816.8 |
| Sep | 42.6 | 27.1 | 12.7 | 12.2 | 13.3 | 67.3 | 898.8 |
| Dec | 34.2 | 27.3 | 10.9 | 12.2 | 15.7 | 88.9 | 974.3 |
| 1974—Mar | 28.8 | 27.9 | 12.4 | 11.6 | 14.5 | 66.3 | 881.5 |
| Jun | 34.6 | 28.2 | 12.9 | 12.8 | 15.9 | 73.3 | 950.5 |
| Sep | 44.2 | 35.1 | 15.5 | 13.5 | 16.8 | 82.1 | 1,072.3 |
| Dec | 42.8 | 33.1 | 12.5 | 11.5 | 22.1 | 89.5 | 1,083.4 |
For firms excluded from the continuing survey, the value of sales recorded in the Census of Distribution 1968 was $218.6 million, or 13.7 percent of total wholesale turnover.
INSTALMENT CREDIT TRADING—Instalment credit trading in New Zealand has been growing steadily in recent years in common with other developed countries. This growth generally is explained by common causes, including an increasing social acceptance and the development of borrowing facilities. There is an increasing tendency for consumer durables to be purchased on credit. Instalment credit allows high-priced goods to be acquired as opportunity or desire dictates, with less reference to the immediate cash position. Some people welcome the discipline of monthly credit repayments as a means of saving. Consumer credit is provided either by retailers or finance companies. A major activity of the finance companies is the financing of motor vehicles on hire-purchase; the Reserve Bank collects statistics in this field. A report by the Tariff and Development Board on instalment credit trading, published as parliamentary paper H.49, 1968, is a useful reference.
Though international comparative statistics are usually open to qualification in this field, instalment credit outstanding per head at 31 December 1965 (in NZ$) was: United States, 250; Canada, 206; Australia, 102; United Kingdom, 50; New Zealand, 40; West Germany, 26; France, 22. (The term instalment credit covers hire-purchase agreements, credit sales agreements, and budget accounts.) Source—parliamentary paper H.49, 1968.
The Hire Purchase Act 1971 is the governing legislation in New Zealand.
Regulations to control hire-purchase trade have existed since 22 July 1955. Restrictions in recent years are now set out.
| Commodity | Date Effective | Minimum Deposit (Percent) | Maximum Repayment Period (Months) | |
|---|---|---|---|---|
| *Reduced by 3 months from 6 December 1968, except television sets. | ||||
| New motorcars and light trucks | 7 Sep | 1,972 | 50 | 24 |
| 4 Sep | 1,974 | 60 | 12 | |
| Secondhand cars and light trucks | 17 May | 1,968 | 50 | 18* |
| 7 Sep | 1,972 | 50 | 24 | |
| 4 Sep | 1,974 | 60 | 18 | |
| Motor cycles | 17 May | 1,968 | 33 1/3 | 18* |
| 7 Sep | 1,972 | 33 1/3 | 24 | |
| 4 Sep | 1,974 | 60 | 12 | |
| Furniture and furnishings | 22 Mar | 1,968 | 10 | 24* |
| 19 Sep | 1,969 | 10 | 24 | |
| 28 Mar | 1,972 | 10 | 30 | |
| Other consumer goods | 19 Sep | 1,969 | 10 | 24 |
| 28 Oct | 1,970 | 15 | 24 | |
| 28 Mar | 1,972 | 10 | 30 | |
A limited quarterly survey of hire-purchase trade is made by the Department of Statistics. It includes selected merchandising firms and finance corporations and for the 1967-68 March year surveyed business was estimated to cover 72 percent of hire-purchase sales recorded in the 1968 Census of Distribution. Only sales covered by the regulations governing hire-purchase are included in the quarterly survey. Credit sales, charge accounts, laybys, and other forms of instalment or credit selling covered by the Census of Distribution, and shown in an earlier table in this section are not included in the quarterly figures. The following table shows the value of goods sold on hire-purchase as recorded by the businesses in the survey.
| Quarter | Motor Vehicles | Plant and Machinery | Television Sets | Other Household and Personal Goods | Total Sold on H.P. | Total Owing Under H.P. Agreements* | Percentage of Payments Overdue* | ||||||||
|---|---|---|---|---|---|---|---|---|---|---|---|---|---|---|---|
| Sold on H.P. | Cash Payments | H.P. Financial | Sold on H.P. | Cash Payments | H.P. Financial | Sold on H.P. | Cash Payments | H.P. Financial | Sold on H.P. | Cash Payments | H.P. Financial | ||||
| *As at end of quarter. | |||||||||||||||
| $(m) | % | ||||||||||||||
| 1971— | |||||||||||||||
| Mar | 32.2 | 16.6 | 15.6 | 5.8 | 1.3 | 4.5 | 0.4 | 0.1 | 0.3 | 8.4 | 1.6 | 6.8 | 46.7 | 112.8 | 3.1 |
| Jun | 29.4 | 14.8 | 14.6 | 7.3 | 1.7 | 5.6 | 0.5 | 0.1 | 0.4 | 9.6 | 1.4 | 8.2 | 46.8 | 115.4 | 3.0 |
| Sep | 37.9 | 19.8 | 18.1 | 7.7 | 2.7 | 5.0 | 0.4 | 0.1 | 0.3 | 9.7 | 1.5 | 8.1 | 55.7 | 122.9 | 3.1 |
| Dec | 41.6 | 21.6 | 20.0 | 10.0 | 3.4 | 6.6 | 0.4 | 0.1 | 0.3 | 12.1 | 1.9 | 10.2 | 64.1 | 131.0 | 3.3 |
| 1972— | |||||||||||||||
| Mar | 36.2 | 18.3 | 17.9 | 9.3 | 2.9 | 6.4 | 0.4 | 0.1 | 0.3 | 9.2 | 1.3 | 7.9 | 55.1 | 129.9 | 3.5 |
| Jun | 40.5 | 21.3 | 19.2 | 8.3 | 2.7 | 5.6 | 0.5 | 0.1 | 0.4 | 12.2 | 1.8 | 10.4 | 61.6 | 143.8 | 3.3 |
| Sep | 43.2 | 22.3 | 20.9 | 8.4 | 2.3 | 6.1 | 0.5 | 0.1 | 0.4 | 9.9 | 1.4 | 8.5 | 61.9 | 140.3 | 3.2 |
| Dec | 51.7 | 26.4 | 25.3 | 10.3 | 2.7 | 7.6 | 0.4 | 0.1 | 0.3 | 14.2 | 2.1 | 12.1 | 76.6 | 153.4 | 3.1 |
| 1973— | |||||||||||||||
| Mar | 49.2 | 25.2 | 24.1 | 10.4 | 2.7 | 7.7 | 0.4 | 0.1 | 0.3 | 10.5 | 1.5 | 9.0 | 70.4 | 158.7 | 2.9 |
| Jun | 46.4 | 23.2 | 23.1 | 8.9 | 2.0 | 6.9 | 0.4 | 0.1 | 0.4 | 12.2 | 1.7 | 10.5 | 67.9 | 157.7 | 2.7 |
| Sep | 51.8 | 25.8 | 26.1 | 13.5 | 3.2 | 10.3 | 0.6 | 0.1 | 0.5 | 12.8 | 1.8 | 11.0 | 78.8 | 177.9 | 2.4 |
| Dec | 61.6 | 29.9 | 31.8 | 14.0 | 3.0 | 11.1 | 1.2 | 0.2 | 0.9 | 17.1 | 2.8 | 14.3 | 94.0 | 192.9 | 2.6 |
| 1974— | |||||||||||||||
| Mar | 50.3 | 24.9 | 25.4 | 8.8 | 2.4 | 6.4 | 1.1 | 0.2 | 0.9 | 12.8 | 1.9 | 10.8 | 73.0 | 192.6 | 2.7 |
| Jun | 52.0 | 27.0 | 24.9 | 9.6 | 3.1 | 6.5 | 1.6 | 0.3 | 1.3 | 13.3 | 2.1 | 11.3 | 76.5 | 195.8 | 2.8 |
| Sep | 52.7 | 27.9 | 24.8 | 9.3 | 3.0 | 6.3 | 2.0 | 0.4 | 1.6 | 14.2 | 2.3 | 11.9 | 78.1 | 195.5 | 3.0 |
| Dec | 43.1 | 25.5 | 17.6 | 10.4 | 3.4 | 7.1 | 2.1 | 0.5 | 1.6 | 14.5 | 2.5 | 12.0 | 70.1 | 190.8 | 3.3 |
The average amount covered by hire-purchase agreements in the quarter ended 31 December 1974 was: motor vehicles, $1,350; machinery, $7,954; television sets, $519; other household and personal goods, $104.
Table of Contents
GENERAL—New Zealand has always been heavily dependent on overseas trade for its development and progress. Today the value of New Zealand's overseas trade as a proportion of gross national product is among the highest in the world. In the early days of colonisation the infant farming industry found a ready market in Australia for basic foodstuffs such as potatoes, grain, butter, and cheese. Timber and gold temporarily constituted a sizeable proportion of exports, but the most consistent export was wool, which made up 22 percent of the value of exports in 1853, when statistics were first compiled. In the 1870s it accounted for over half the value; from 1880 to 1898 its share was from 40 percent to 50 percent. From 1899 to 1964 wool consistently earned one-third of New Zealand's export receipts; since then the proportion has progressively declined, and in 1972 wool made up only 21 percent of exports by value.
Real and lasting diversification of the exports of farm products was made possible by the introduction of refrigerated ships in 1882. This accentuated the development of New Zealand's economy as a complement to the United Kingdom economy, to the benefit of both. The proportion of New Zealand's total exports going to the United Kingdom grew from 70 percent in 1860 to 77 percent in 1900, and reached 88 percent in 1940. At first, exports of frozen meat increased more rapidly than those of butter and cheese; the early emphasis was on frozen mutton and lamb, with beef and veal becoming more significant later. The great expansion of exports of dairy produce occurred after 1900, and was encouraged by the centralised factory production of butter. From 1913 onwards pastoral products have continued to account for over 80 percent of total exports of New Zealand goods. The proportion in the year ended June 1974 was 83 percent.
New Zealand's heavy dependence on the United Kingdom market continued into the post-Second World War era. From about the beginning of the 1960s the increasing emphasis on diversification away from this dependence has been reflected in the growth of beef exports to the United States, of mutton and forest products exports to Japan, of lamb exports to Greece, the United States and, Canada; the establishment of a rapidly growing trade in meat and dairy produce with the developing countries of South-east Asia and Latin America; the expansion of trade with Australia under NAFTA and with other South Pacific countries; and the growth of secondary industry within New Zealand to supplement agriculture as a source of export earnings as well as to supply the domestic market.
Britain's entry into the European Economic Community has in recent years lent special importance to New Zealand's efforts in the field of economic diplomacy. Although the terms of the special arrangement concerning the importation of New Zealand butter and cheese into Britain were decided at Luxembourg in June 1971, this was preceded by an intensive programme of official contacts and representations both in Britain and in the countries of the Common Market. New Zealand's diplomatic and trade posts in Europe were strengthened to handle this work and, over the years, a programme of visits to New Zealand was organised for Ministers, senior officials, and journalists directly concerned with developments in the Common Market.
An important development affecting New Zealand's future trading relations with Britain and Europe arose in March 1974 when a new Labour Government was elected in Britain on the pledge to renegotiate the terms of Britain's terms of entry into the EEC. Of particular significance to New Zealand was the British Government's objective of seeking improved conditions of access for certain foodstuffs, including dairy products and meat from the Commonwealth. Following discussions with New Zealand, Britain submitted renegotiation proposals to a meeting of EEC Heads of Government in Dublin on 10 March 1975 making specific reference to New Zealand dairy products, and the EEC Commission was invited to submit a proposal for continuation of the special arrangement for dairy products beyond 1977 with suitable adjustment of prices. (See Section 21A—Marketing of Farm Produce.)
Access into the North American market is vitally important. New Zealand's trade with the United States has been circumscribed in the past by various quantitative restrictions imposed on beef, mutton, veal, and dairy products. The quantitative restrictions on beef, veal, and mutton apply from time to time, although the situation is reviewed every quarter, as provided by law. New Zealand's exports of dairy products are, however, still subject to a formidable array of quota controls.
New Zealand's economic and trade relations with Japan have become steadily closer. The volume of bilateral trade has increased and consultations between the two Governments at the Ministerial and the official level on international trade and economic matters have been extended considerably. New Zealand participation in EXPO 1970 involved a major publicity and trade promotion campaign which proved most successful. Continued efforts have been made to improve access for New Zealand agricultural exports and, although little progress has been made, it is hoped that the growing demands of the Japanese consumer can be reconciled with the need to support the domestic agricultural sector. Beef sales, however, were suspended in January 1974 following the freezing of the global import quota.
The newly-independent nations of the Pacific have attracted particular attention since the formation in 1971 of the South Pacific Forum. There is now much more awareness of the scope for closer trade relations with and between the Islands, and New Zealand has taken several initiatives in this direction.
At the same time our diplomatic and trading links across the Pacific, with the countries of Latin America, have been extended and a significant volume of trade has developed. Now that New Zealand has established embassies in Peru and Chile, a thorough examination is being made of ways to increase trade with the area. Credits have been extended to both Peru and Chile and these have undoubtedly helped build up our trade.
Activity in the trade field has included other countries of the Pacific Basin. From April 1970 New Zealand has extended 5 annual trade credits totalling $3.25 million to Indonesia.
New Zealand's trade relations with Australia have always been close but recent years have witnessed unprecedented growth in two-way trade. This applies in particular to manufactured goods. The New Zealand - Australia Free Trade Agreement, which commenced operation in 1966, has been an important factor in this expansion.
There has been a marked expansion of New Zealand's overseas markets in countries bordering on the Pacific. For example, exports made to Japan have shown a marked increase from $6.2 million in 1953 to $248 million in the June year 1974. About 45 percent of the exports to Japan in the year ended June 1974 were meat (mainly mutton), timber and wool; other principal commodities were dairy products, casein, iron ore and concentrates, and aluminium.
The sudden increase in world oil prices had greatly increased the revenues of Middle East oil-producing countries, thus presenting new market opportunities for New Zealand. Substantial sales of meat have been made to Iran and Iraq. Dairy products have also been sold to Iraq.
The value of New Zealand's overseas trade in relation to national income is among the highest in a ranking of countries of the world.
Except for the growth of trade in timber and pulp and paper products, the composition of New Zealand's exports today does not vary greatly from that of pre-war years. Of recent years from 70-80 percent of the total value of exports is still derived from wool, meat, and dairy produce. Exports of manufactured goods (including those based on agriculture, forestry, and fishing) have risen sharply in recent years; but the steady growth of trade in meat, dairy produce, and wool has meant that the proportions as compared with total New Zealand exports today have remained constant over several decades.
The following table shows the changing pattern of external trade by countries of destination and origin. The percentages are based on value data only, exports f.o.b. and imports c.d.v.
| Year | United Kingdom | Australia | Japan | United States | Other Countries |
|---|---|---|---|---|---|
| *Provisional. | |||||
| Exports* | |||||
| percent | |||||
| 1860 | 70 | 27 | .. | - | 3 |
| 1870 | 52 | 46 | - | .. | 2 |
| 1880 | 75 | 21 | .. | 2 | 2 |
| 1890 | 75 | 15 | .. | 6 | 4 |
| 1900 | 77 | 14 | .. | 6 | 3 |
| 1910 | 84 | 9 | .. | 3 | 4 |
| 1920 | 74 | 5 | .. | 16 | 5 |
| 1930 | 80 | 3 | .. | 5 | 12 |
| 1940 | 88 | 3 | .. | 4 | 5 |
| 1950 | 66 | 3 | .. | 10 | 21 |
| 1960 | 53 | 4 | .. | 13 | 30 |
| June Year | |||||
| 1970 | 36 | 8 | 10 | 15 | 30 |
| 1971 | 34 | 9 | 9 | 17 | 31 |
| 1972 | 31 | 8 | 10 | 15 | 35 |
| 1973* | 27 | 7 | 13 | 15 | 38 |
| 1974* | 21 | 10 | 14 | 17 | 38 |
| Imports* | |||||
| percent | |||||
| 1860 | 56 | 42 | .. | 1 | 1 |
| 1870 | 58 | 36 | .. | 1 | 5 |
| 1880 | 56 | 31 | .. | 4 | 9 |
| 1890 | 67 | 17 | .. | 6 | 10 |
| 1900 | 61 | 17 | .. | 10 | 12 |
| 1910 | 62 | 14 | .. | 8 | 16 |
| 1920 | 48 | 17 | .. | 18 | 17 |
| 1930 | 47 | 8 | .. | 18 | 27 |
| 1940 | 47 | 16 | .. | 12 | 25 |
| 1950 | 60 | 12 | .. | 7 | 21 |
| 1960 | 43 | 18 | .. | 10 | 29 |
| June Year | |||||
| 1970 | 30 | 21 | 8 | 13 | 28 |
| 1971 | 29 | 21 | 10 | 12 | 28 |
| 1972 | 28 | 23 | 11 | 10 | 27 |
| 1973* | 24 | 25 | 13 | 11 | 27 |
| 1974* | 19 | 24 | 13 | 12 | 32 |
TRADE RELATIONS WITH THE UNITED KINGDOM—The preceding table shows that the United Kingdom has remained the predominant market for New Zealand's exports and the second biggest supplier of her imported goods. The British consumer for a long time enjoyed virtually unrestricted availability of New Zealand butter, cheese, and lamb as a result of trading arrangements reflecting traditional economic, political, and cultural bonds between the people and governments of the two countries.
Under the terms of the New Zealand - United Kingdom Trade Agreements of 1932, 1959, and 1966, New Zealand received duty free and unrestricted access to the United Kingdom market for most of its agricultural exports. New Zealand's agricultural industry was thus encouraged to specialise in the production, especially for the British market, of pastoral products which the country's climate, resources, and skills have enabled it to produce with unmatched economic efficiency.
In return for providing an assured market for this New Zealand produce, Britain obtained an assured source of reasonably priced food in war and peace, valuable preferences in the sale of manufactured goods in the New Zealand market, and considerable earnings from the provision of shipping, insurance, and other services related to the two-way trade between the countries.
In recent years the United Kingdom's share of New Zealand's export trade has gradually declined. This decline was given impetus by New Zealand's increased efforts to diversify her export products and markets in view of British moves towards joining the EEC. Thus in 1950 the United Kingdom took 66 percent of New Zealand's exports, but by the year ended June 1974 its share had fallen to 21 percent. However, the United Kingdom is still New Zealand's main export market, taking the bulk of our lamb and butter exports (77 percent, and 55 percent, respectively, in the 1973-74 year), and about one-sixth of our wool and a quarter of our cheese.
Entry into the EEC, involving assumption of obligations under the community's common agricultural policy, required Britain to terminate the 1959 and 1966 trade agreements with New Zealand on 31 January 1973, and to begin to phase in the common customs tariff and other EEC policies affecting the import of goods from those countries. In consequence, New Zealand is to phase out by 1 July 1977 the tariff preferences currently given to imports from Britain.
DIVERSIFICATION—Britain's prospective entry into the EEC also caused an intensification of New Zealand's efforts to develop new markets for its exports and to broaden the range of its export commodities. Progress in diversification by the dairy industry is reflected in the fact that dairy export receipts from markets outside Britain rose to 64 percent of the total in 1974, compared with 57 percent the previous year. An important factor in the diversification effort is the greater exchange of views and co-operation between the principal dairy exporters, in particular New Zealand, and the EEC, which in 1973 has generally operated the EEC dairy export policy in a constructive way.
Reference has been made earlier to the important structural changes taking place in New Zealand's export trade and, in particular, the growing importance of manufactured exports and of new markets, especially in the Pacific basin region.
North America—The United States is New Zealand's second largest market after Britain, and the major market for beef and veal, taking 69.1 percent of our total exports of these commodities in the year ended 30 September 1974. Trade has been circumscribed in the past by various quantitative restrictions on beef, veal, mutton, and dairy products. The quantitative restrictions on beef, veal, and mutton were lifted for the whole of 1973 and 1974, although the situation is reviewed every quarter as provided by law. New Zealand's exports of dairy products are still subject to a formidable array of quota controls, but in 1973 and 1974 New Zealand was able to take advantage of emergency import quotas for cheese, milk powder, and butter.
New Zealand's exports to Canada have increased steadily from $10.6 million in the year ended June 1967 to $52 million in the year ended June 1974. Beef is our main export to Canada, followed by butter, sausage casings, lamb, wool, sheepskins, milk powder, apples, carpets, and textile yarns. New Zealand's main objective in the trade policy field is to obtain permanent access for dairy products. In July 1973 New Zealand and Canada agreed in an exchange of letters to continue tariff preferences on the same general basis as those derived from their trade agreements with Britain prior to the termination of these agreements on 1 February 1973 because of Britain's entry into the European Economic Community. The July 1973 agreement included undertakings against increasing duties against each other, and for maintenance of margins of preference. In August 1974 Canada introduced import quotas on beef for an initial period of 1 year. New Zealand's main objectives in the trade policy field are to have the quotas removed and to obtain permanent access for dairy products.
Japan—Exports to Japan have shown a marked increase from $6.2 million in 1953 to $248 million in the year ended June 1974. About 45 percent of the exports in the year ended June 1973 were meat (mainly mutton), timber, and wool; other principal commodities were dairy products, aluminium, and ironsand. Continued efforts are being made to improve access for New Zealand's agricultural exports. Although trade barriers remain in the important meat and dairy sectors, New Zealand has recently benefited from significant import openings which have occurred for beef and butter as a result of rapidly increasing consumer demands for Western-style foodstuffs.
South Pacific—The newly-independent nations of the Pacific have attracted particular attention in recent years and in 1971 New Zealand and Australia, with the Cook Islands, Fiji, Nauru, Tonga, and Western Samoa, formed the South Pacific Forum. There is now much more awareness of the scope for closer trade relations with and between the Islands, and New Zealand has taken several initiatives in this direction, including the establishment of a Pacific Islands handicraft scheme in September 1973. This scheme provides for duty free entry for specified quantities of handicrafts from Fiji, Western Samoa, Nauru, Tonga, and Papua - New Guinea, the latter having observer status in the South Pacific Forum.
Latin America—Our diplomatic and trading links with the countries of Latin America have been extended and a substantial and increasing volume of trade has developed in the last 3 years. New Zealand has established embassies in Peru and Chile, and trade credits have been extended to these countries which have helped build up trade especially in mutton and dairy products. Other new markets in this region include Mexico, Cuba, and Brazil.
Asia—Activity in trade diversification has included other countries of the Pacific Basin. Since April 1970 New Zealand has extended four annual trade credits totalling $2.5 million to Indonesia. In April 1973 the Minister of Overseas Trade visited China, Korea, and Japan for official talks. Following New Zealand's recognition of the People's Republic of China in December 1972, and the establishment of a New Zealand Embassy in Peking, a trade agreement was signed in October 1973. The agreement included provision for a joint trade committee to discuss and promote the expansion of mutual trade.
Exports to China have increased significantly, from $4 million in the year ended June 1970 to $17 million in the year ended June 1974.
Eastern Europe—Government and businessmen have continued their efforts to increase and diversify trade with the socialist countries of Europe, whose purchases from New Zealand have traditionally been mainly wool and hides and skins. In the year ended 30 June 1974, the U.S.S.R. was New Zealand's eighth largest export market by value, but in this period bought only the single commodity, wool. However, later in 1974 the U.S.S.R. bought a large parcel of 36,000 tonnes of mutton. The U.S.S.R. has made similar large purchases sporadically over the last few years.
During a visit to Moscow in 1973, the Minister of Overseas Trade signed a protocol to the 1963 New Zealand - U.S.S.R. Trade Agreement, establishing a joint trade commission to promote the growth of mutual trade. The first meeting of the commission took place in Wellington at the end of 1974 and included business as well as Government representatives. Meetings of the commission are to take place at least every 2 years, alternatively in Wellington and Moscow. The setting-up of New Zealand embassies and trade posts in Moscow and Vienna is now facilitating our trade development in Eastern Europe.
In February 1975 the Prime Minister visited Romania and Yugoslavia for discussions on the development of trade relations between New Zealand and these two countries. While in Yugoslavia the Prime Minister signed a trade agreement under which the two countries accord each other most favoured nation treatment in all matters relating to trade.
Middle East—Substantial increases in oil reserves have given a sudden impetus to the economies of the producing countries in the Middle East, thus presenting the prospect of new market opportunities for New Zealand in that region. Substantial sales of meat have been made to Iran, and of meat and dairy products to Iraq. Official and business contacts with the region have increased markedly since the visit of the then Minister of Finance to Iran in January 1974, and of the New Zealand Government goodwill mission to other Middle East states in February 1974. New Zealand and Iranian economic missions exchanged visits in 1974 and the Minister of Overseas Trade visited Tehran briefly for official talks in June 1974. During the visit to New Zealand in September 1974 of the Shahanshah of Iran a trade agreement was signed with the purpose of expanding trade between New Zealand and Iran, and setting up a joint commission for trade and economic development which will meet every year. The New Zealand embassy in Tehran, established in January 1975, will give further impetus to the development of this trade. In February 1975 the Minister of Agriculture visited Saudi Arabia and Iran for discussions which included trade topics.
Australia—New Zealand's trade relations with Australia have always been close, but recent years have witnessed unprecedented growth in two-way trade, particularly in manufactured goods. The 1965 New Zealand - Australia Free Trade Agreement (NAFTA) has been an important factor in this expansion. A number of projects for co-operation in industrial development, including the motor vehicle industry, have been developed and there has been increased co-operation in implementing the Memorandum of Understanding on Defence Supply signed in 1970.
NAFTA—The New Zealand - Australia Free Trade Agreement was signed on 31 August 1965 and came into effect on 1 January 1966. The main aim of the agreement, which runs for an initial period of 10 years, is “to further the development of the area and the use of the resources of the area by promoting a sustained and mutually beneficial expansion of trade”.
The central element of the agreement is its list of goods (Schedule A) on which duties are progressively reduced and bound at free in the tariffs of both countries. The agreement also contains general provisions governing the conduct of trade between Australia and New Zealand covering such matters as dumping, the maintenance of import restrictions, the encouragement of industrial rationalisation between the two countries, and the holding of consultations on a regular basis and for specific purposes.
The original Schedule A contained some 990 items. Since then a further 799 items have been added to give a total of 1,789 at 1 January 1975. On inclusion in Schedule A, goods free of duty are bound at free; goods with duties not exceeding 5 percent become free; duties of between 5 and 10 percent are halved and eliminated 2 years later; and duties of more than 10 percent are reduced by one-fifth on inclusion and by a further fifth every 2 years. There is provision for either quicker or slower reduction of duties where agreed to by both countries. Schedule A trade represents about 50 percent of total trans-Tasman trade.
There has been some reluctance on the part of manufacturers in both countries to accept inclusion of their products in Schedule A because of the resulting exposure to unrestricted competition. Accordingly, in November 1973 it was agreed to establish a series of new arrangements (Schedules B, C, and D), which provide for partial participation in the free trade provisions of the agreement, for example, by way of duty free quotas or partial elimination of duties. A number of joint panels have been set up by New Zealand and Australian industries to study the possibility of using the new partial free trade arrangements as a basis for developing industries on a complementary basis through reciprocal trade.
Complementary development of trade has been encouraged since 1967 by reciprocal concessions under trading arrangements between firms in New Zealand and Australia under Article 3:7 of NAFTA. Approvals for such inter-firm arrangements totalled $49 million in the June year 1974, and new trade since 1967 under this type of arrangement has a value of about $90 million. The new partial free trade arrangements, while not replacing the old arrangements, will offer wider opportunities, will not be limited to specific firms, and should encourage co-operation on an industry wide basis as well as co-operation between individual firms. The advantages of co-operation accompanied by the complementary development of industries are obvious; they include specialisation and longer production runs to supply the whole NAFTA area as one market. The reciprocal advantages available under the new schedules will encourage such complementary developments; in addition, in agreed circumstances, the two governments have decided to protect each other's production against competition from other sources.
Continued development of the concept of reducing tariffs within the NAFTA area as a preferential free trade area was the aim of an interim agreement on tariff rates and preferences concluded by a ministerial exchange of letters on 7 May 1973. This agreement preserves to the fullest possible extent for each country the benefits of the British preferential tariff system which formerly derived from the trade agreements both countries had with the United Kingdom prior to British entry into the EEC on 1 February 1973. The basic features are undertakings not to increase tariffs against each other, while maintaining agreed minimum margins of tariff preference over imports from non-preferential countries. In addition, the agreement makes clear the intention of both Australia and New Zealand to set tariffs against each other on manufactured goods at the lowest possible level consistent with protection of domestic production, while permitting reasonable competition from the NAFTA partner. Since 30 September 1974 the agreement has been extended by ministerial exchanges of letters. In due course it is expected that New Zealand and Australia will conclude a longer-term agreement taking account of progress in the GATT multilateral trade negotiations this year; the effects of British entry into the EEC; and the operation of this new interim agreement. It is also intended that the terms of the interim agreement should be taken into consideration in formulating any future long-term agreement between the two countries.
A number of special industry bodies have been established within the NAFTA framework to promote trade in particular products. Among these is the Joint Consultative Council on Forest Industries set up in 1967. The council produced a report on the forest resources, consumption, production, imports, and exports up to the year 2010 in 1970, which is regularly updated. Other industry bodies deal with trade in peas and beans and sawmill products, while a Joint Committee on Dairy Products has met in 1972 and 1973. The committee's terms of reference are, inter alia, to review trends in production, consumption, and exports in the two countries; to consider production and marketing policies with particular reference to exports to third countries; to study marketing opportunities in respect of new products and new markets; and to explore ways of furthering cooperation between the industries of the two countries.
Trans-Tasman trade statistics are given in the following table.
| June Year | N.Z. Imports from Australia (NZ$Million) | N.Z. Exports* to Australia (NZ$Million) | Value of Trade Imbalance with Australia (NZ$Million) | Ratio of Imbalance in Australia's Favour |
|---|---|---|---|---|
*Including re-exports. †Provisional. | ||||
| 1970 | 197.9 | 87.3 | -110.6 | 1:2.27 |
| 1971 | 225.5 | 96.1 | -129.4 | 1:2.35 |
| 1972 | 267.3 | 112.8 | -154.5 | 1:2.37 |
| 1973† | 320.9 | 130.3 | -190.6 | 1:2.46 |
| 1974† | 449.3 | 171.8 | -277.5 | 1:2.62 |
TRADE BY AREAS—The distribution of New Zealand's overseas trade by broad groupings is given in the following table (excluding gold and current coin).
| Year Ended June | Sterling Area | Dollar Area | European Economic Community (Excl. U.K. and Ireland, Rep. of) | European Free Trade Association (Excluding United Kingdom) | Other Countries |
|---|---|---|---|---|---|
| *Provisional. | |||||
| Percentage of Total Export Trade (f.o.b.) | |||||
| 1965 | 60.30 | 14.94 | 16.43 | 0.93 | 7.40 |
| 1966 | 54.93 | 16.29 | 15.99 | 0.81 | 11.98 |
| 1967 | 54.15 | 18.47 | 11.99 | 0.70 | 14.69 |
| 1968 | 55.89 | 19.56 | 10.73 | 0.70 | 13.12 |
| 1969 | 52.29 | 20.40 | 12.47 | 0.67 | 14.18 |
| 1970 | 50.24 | 21.18 | 11.34 | 0.79 | 16.44 |
| 1971 | 50.67 | 21.78 | 10.89 | 0.62 | 16.05 |
| 1972 | 48.61 | 20.18 | 10.91 | 0.59 | 19.71 |
| 1973* | 41.80 | 19.73 | 12.99 | 0.65 | 24.83 |
| 1974* | 38.27 | 22.32 | 10.82 | 0.62 | 27.96 |
| Sterling Area | Dollar Area | European Economic Community (Excl. U.K. and Ireland, Rep. of) | European Free Trade Association (Excluding United Kingdom) | Other Countries |
|---|---|---|---|---|
| Percentage of Import Trade(c.d.v.) | ||||
| 65.03 | 15.80 | 6.63 | 2.90 | 9.64 |
| 65.64 | 15.87 | 6.86 | 2.26 | 9.37 |
| 64.12 | 17.30 | 7.65 | 2.32 | 8.61 |
| 61.95 | 16.20 | 7.37 | 2.69 | 11.79 |
| 60.89 | 16.44 | 8.26 | 2.72 | 11.69 |
| 60.45 | 17.69 | 7.70 | 2.13 | 12.02 |
| 58.87 | 16.65 | 9.18 | 2.22 | 13.18 |
| 60.87 | 13.72 | 8.52 | 2.68 | 14.19 |
| 58.06 | 14.76 | 8.38 | 2.39 | 16.41 |
| 54.64 | 12.21 | 9.86 | 2.41 | 17.90 |
The direction of external trade is shown graphically in the following diagram.
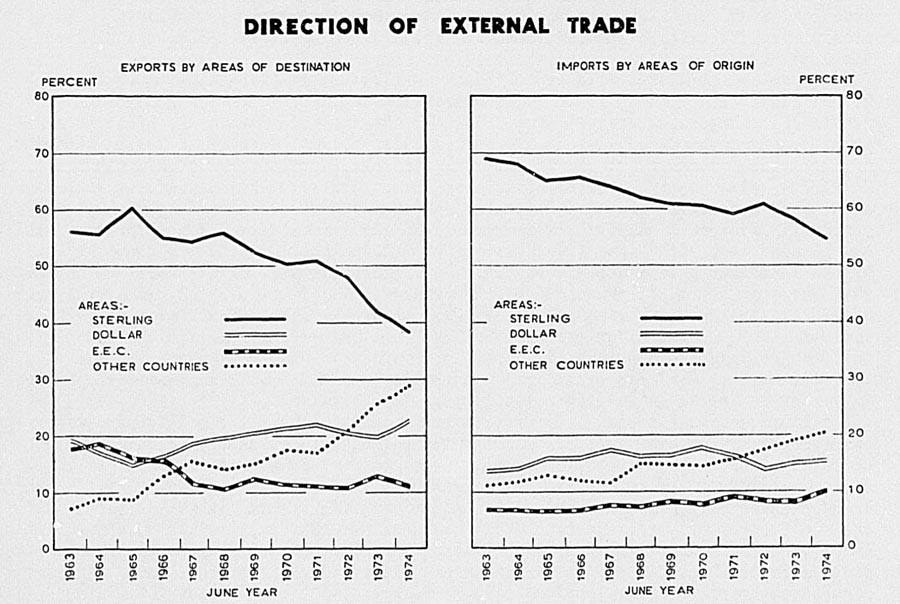
TRADE PER HEAD—Trade per head of population is affected, not only by the volume of trade but also by the value, i.e., the prices received for exports and the cost of imports.
The following table shows the value, per head of population, of New Zealand's trade over the last 11 years.
| Year Ended June | Exports (f.o.b.) | Imports (c.i.f.) | Total Trade |
|---|---|---|---|
| *Provisional. | |||
| $ | $ | $ | |
| 1964 | 286.72 | 269.91 | 556.63 |
| 1966 | 288.54 | 298.13 | 586.67 |
| 1967 | 268.57 | 300.32 | 568.89 |
| 1968 | 299.04 | 245.91 | 544.95 |
| 1969 | 357.56 | 308.32 | 665.88 |
| 1970 | 388.31 | 359.92 | 748.23 |
| 1971 | 398.19 | 406.57 | 804.76 |
| 1972 | 475.93 | 428.87 | 904.80 |
| 1973* | 606.22 | 463.52 | 1,069.74 |
| 1974* | 593.50 | 668.74 | 1,262.24 |
INTERNATIONAL COMPARISON OF RELATIVE VALUE OF TRADE—For New Zealand exports of goods are of greater importance to the national economy than is the case for most other countries. (Many other countries have a greater proportional income from the exports of services such as travel, investment, insurance, and shipping activities.)
In the following table the values of the exports of goods (excluding services) for some of the main trading countries are given as a percentage of the gross domestic product, and also the value of total external trade in goods in 1973 per head of population, using c.i.f. valuations for imports.
| (Source: United Nations Statistical Office.) | |||
|---|---|---|---|
| Country | Export of Goods as Percentage of Gross Domestic Product | Value of External Trade per Head | |
| 1972 | 1973 | 1973 | |
*Exports include a large volume of goods originating in inland Europe passing through ports. †Fiscal year beginning 1 April. ‡Fiscal year beginning 1 July. §1970. | |||
| percent | (NZ)$ | ||
| Netherlands | 37* | 40* | 2,510 |
| Belgium and Luxembourg | 44* | 3,087 | |
| Switzerland | 23 | 23 | 2,301 |
| Norway | 22 | 25 | 1,943 |
| New Zealand | 20† | 22† | 1,136 |
| Sweden | 21 | 1,975 | |
| Canada | 19 | 21 | 1,547 |
| Austria | 19 | 19 | 1,162 |
| percent | (NZ)$ | ||
| West Germany | 18 | 19 | 1,386 |
| France | 13 | 980 | |
| Israel | 16 | 15 | 955 |
| United Kingdom | 16 | 874 | |
| Italy | 16 | 16 | 642 |
| Australia | 15‡ | 868 | |
| Japan | 10 | 9 | 489 |
| South Africa | 13 | 13 | 251 |
| Argentina | 7§ | 159 | |
| United States | 4 | 5 | 465 |
VISIBLE BALANCE OF TRADE—In the following table the c.i.f. valuation of imports has been used to establish the visible balance of trade. Gold and specie totals are excluded.
| June Year | Visible Excess of Exports |
|---|---|
| *Provisional. | |
| $(000) | |
| 1964-65 | 17,711 |
| 1965-66 | -25,489 |
| 1966-67 | -85,984 |
| 1967-68 | 145,782 |
| 1968-69 | 136,210 |
| 1969-70 | 79,463 |
| 1970-71 | -23,809 |
| 1971-72 | 135,973 |
| 1972-73* | 420,650 |
| 1973-74* | -226,614 |
Visible trade is not the only factor to be taken into account in considering the balance of payments between countries (see Section 25b). A statement of New Zealand's overseas exchange transactions is given in Section 29, Banking and Currency.
TRADE STATISTICS—Provisional trade data are published in a supplement to the Monthly Abstract of Statistics fairly soon after the period to which they relate. A publication entitled External Trade of New Zealand (Country Analyses) is also published.
Annual volumes are also published by the Department of Statistics, the latest available issues being Exports January-June 1972 and Imports January-June 1972. Part A Commodity by Country and Part B Country by Commodity.
New Zealand has used the Standard International Trade Classification (Revised) as from 1 July 1962, for classifying external trade for statistical purposes; from the same date this classification was put into effect for recording the external trade of the Cook Islands and Niue. The SITC order was also adopted on 1 July 1962 as the Customs Tariff classification, but a move to the Brussels Tariff Nomenclature was made on 1 July 1967
Provisional values of imports and exports are set out in the following table.
| Period | 1971-72 | 1972-73 | 1973-74 | ||||||
|---|---|---|---|---|---|---|---|---|---|
| Exports (including Reexports) f.o.b. | Imports | Exports (including Reexports) f.o.b. | Imports | Exports (including Reexports) f.o.b. | Imports | ||||
| c.d. Value | c.i.f. Value | c.d. Value | c.i.f. Value | c.d. Value | c.i.f. Value | ||||
| $(million) | |||||||||
| Month of July | 114.9 | 107.2 | 115.8 | 111.8 | 94.2 | 101.1 | 124.1 | 152.4 | 162.7 |
| 2 months ended August | 237.5 | 203.4 | 219.1 | 219.1 | 199.3 | 213.6 | 279.2 | 283.8 | 303.7 |
| 3 months ended September | 312.8 | 303.1 | 326.5 | 345.5 | 284.2 | 306.0 | 419.7 | 414.9 | 444.3 |
| 4 months ended October | 402.0 | 390.6 | 419.3 | 447.7 | 389.4 | 419.6 | 565.7 | 555.7 | 596.2 |
| 5 months ended November | 478.1 | 490.0 | 525.1 | 558.4 | 511.1 | 548.0 | 678.8 | 694.6 | 747.9 |
| 6 months ended December | 584.5 | 579.6 | 621.4 | 707.4 | 615.6 | 659.4 | 833.5 | 821.3 | 884.5 |
| 7 months ended January | 707.5 | 665.4 | 715.3 | 844.6 | 726.7 | 778.3 | 977.5 | 978.8 | 1,056.8 |
| 8 months ended February | 853.2 | 756.6 | 813.1 | 1,034.2 | 827.5 | 886.3 | 1,141.4 | 1,124.0 | 1,215.3 |
| 9 months ended March | 967.2 | 860.5 | 925.2 | 1,254.9 | 941.4 | 1,009.0 | 1,316.0 | 1,269.2 | 1,377.2 |
| 10 months ended April | 1,110.1 | 950.5 | 1,022.6 | 1,412.5 | 1,033.0 | 1,106.7 | 1,497.9 | 1,428.6 | 1,553.5 |
| 11 months ended May | 1,240.4 | 1,056.2 | 1,135.8 | 1,595.5 | 1,153.2 | 1,234.0 | 1,639.1 | 1,637.9 | 1,785.9 |
| 12 months ended June | 1,376.6 | 1,150.3 | 1,235.9 | 1,787.0 | 1,276.2 | 1,366.3 | 1,787.6 | 1,842.3 | 2,014.2 |
Valuation of Exports—It has always been the practice to record exports at free-on-board (f.o.b.) values, except during the Second World War when wool exports were valued at appraisal prices. Most meat and dairy produce exports are consigned for sale on overseas markets, and necessarily valued, on export, at the f.o.b. equivalent of the prices ruling at that time in the markets to which they are consigned. Price changes may occur in these markets before the actual sale of the produce. The exports recorded relate to goods on vessels which have cleared their final port of call in New Zealand during the period.
Valuation of Imports—From July 1962, with the introduction of the Standard International Trade Classification, Revised, statistics on the c.i.f. basis (cost including freight and insurance) became available at item level.
The proportional difference between the two figures of valuation now made available—viz, c.d.v. and c.i.f.—varies from period to period depending on: (1) the make-up of imports in the different periods, (2) differential charges in import prices and in freight rates, (3) differences between domestic and export prices in the exporting countries, and (4) price fluctuations between dates of purchases and of shipping. In all the tables imports are now shown at c.d.v., unless otherwise specified in respect of particular tables.
The trade figures for imports are compiled from the imports entries passed by the Customs Department. Generally the imports entries are not passed until the goods are available for discharge from the wharf.
Annual Statistics—For trade statistics a June year has been adopted since 1 July 1962 and this accords fairly well with the farm production year.
The statistics of external trade given in this section (comprising the three subsections) do not include the trade of the Cook Islands, Niue, and the Tokelau Islands; statistics for these territories are given in Section 36 of this Yearbook.
The following table gives the values of the export and import trade for years ended June and December. The movement of specie is not included in these figures and gold is excluded.
| Year | Exports (including Re-exports)f.o.b. | Imports | |
|---|---|---|---|
| c.d.v. | c.i.f. | ||
| *Provisional. | |||
| Year ended June $(million) | |||
| 1965 | 742.2 | 662.7 | 724.5 |
| 1966 | 767.3 | 729.4 | 792.8 |
| 1967 | 727.2 | 752.2 | 813.2 |
| 1968 | 820.5 | 622.9 | 674.7 |
| 1969 | 989.1 | 799.2 | 852.9 |
| 1970 | 1,086.7 | 944.3 | 1,007.2 |
| 1971 | 1,131.7 | 1,070.6 | 1,155.5 |
| 1972 | 1,375.0 | 1,152.7 | 1,239.0 |
| 1973* | 1,787.0 | 1,276.2 | 1,366.3 |
| 1974* | 1,787.6 | 1,842.3 | 2,014.2 |
| 1965 | 729.2 | 703.8 | 766.7 |
| 1966 | 780.0 | 722.4 | 787.0 |
| 1967 | 727.1 | 672.4 | 725.6 |
| 1968 | 920.9 | 749.0 | 805.3 |
| 1969 | 1,082.5 | 843.0 | 898.9 |
| 1970 | 1,093.7 | 1,038.3 | 1,111.8 |
| 1971 | 1,200.4 | 1,097.4 | 1,184.5 |
| 1972 | 1,504.6 | 1,188.8 | 1,276.3 |
| 1973* | 1,913.1 | 1,482.0 | 1,591.5 |
| 1974* | 1,733.8 | 2,355.0 | 2,615.1 |
The following table shows for the June year 1973 the values of merchandise exports to, and imports from, each of the countries trading with New Zealand.
| TRADE BY COUNTRIES, YEAR ENDED JUNE 1973* | |||
|---|---|---|---|
| Country | Exports f.o.b. | Imports c.d.v. | |
| New Zealand Produce | Total | By Country of Origin | |
*Provisional. †Does not include statistics for that part of China known as Taiwan. ‡Became members of EEC from 1 January 1973. | |||
| Sterling Area Countries— | $(000) | ||
| Associated States in Eastern Caribbean | 488 | 488 | 1 |
| Australia | 118,333 | 130,252 | 320,909 |
| Bahamas | 546 | 548 | 26 |
| Bahrain | 140 | 140 | 6,017 |
| Bangladesh | 1,261 | 1,275 | 1,862 |
| Barbados | 2,629 | 2,629 | 18 |
| Bermuda | 2,112 | 2,125 | - |
| British Honduras | 1 | 1 | 1 |
| British Solomon Islands | 344 | 362 | 64 |
| British Virgin Islands | 11 | 11 | - |
| Brunei | 39 | 40 | - |
| Cayman Islands | 1 | 1 | - |
| Cyprus | 2,241 | 2,241 | 18 |
| Fiji | 15,460 | 17,680 | 3,542 |
| Gambia | 2 | 2 | - |
| Ghana | 1,664 | 1,664 | 2,299 |
| Gibraltar | 27 | 27 | - |
| Gilbert and Ellice Islands | 206 | 232 | 2,513 |
| Guyana | 38 | 38 | 114 |
| Hong Kong | 15,089 | 15,511 | 20,009 |
| India | 6,462 | 6,475 | 10,930 |
| Ireland, Republic of‡ | 3,536 | 3,564 | 601 |
| Jamaica | 9,777 | 9,777 | 1,405 |
| Jordan | 707 | 707 | - |
| Kenya | 452 | 455 | 545 |
| Kuwait | 343 | 343 | 28,598 |
| Malawi | 158 | 159 | 92 |
| Malaysia | 16,033 | 16,087 | 8,086 |
| Malta, including Gozo | 431 | 431 | 25 |
| Mauritius and Dependencies | 959 | 967 | 113 |
| Montserrat | 32 | 32 | - |
| Namibia (South West Africa) | 13 | ||
| Nauru | 256 | 258 | 4,917 |
| New Hebrides Cond | 1,598 | 1,737 | 141 |
| New Zealand Re-imports | - | - | 2,142 |
| Nigeria | 347 | 351 | 41 |
| Norfolk Island | 624 | 671 | 2 |
| Pakistan | 1,100 | 1,103 | 709 |
| Papua and New Guinea | 1,719 | 1,778 | 769 |
| Pitcairn Island | 14 | 19 | - |
| Qatar and Trucial Sheikdoms | 38 | 38 | - |
| St. Helena, Ascension, etc. | 3 | 3 | - |
| Seychelles | 7 | 7 | - |
| Sierra Leone | 3 | 4 | - |
| Singapore | 12,564 | 13,334 | 8,440 |
| South Africa | 6,650 | 6,701 | 4,372 |
| Sri Lanka (Ceylon) | 3,518 | 3,518 | 3,627 |
| Swaziland | 13 | 13 | 1 |
| Tanzania (incl. Zanzibar and Pemba) | 183 | 184 | 1,855 |
| Tonga | 2,095 | 2,278 | 474 |
| Trinidad and Tobago | 6,326 | 6,329 | 75 |
| Uganda | 18 | 18 | 401 |
| United Kingdom‡ | 477,873 | 479,148 | 303,914 |
| Western Samoa | 4,695 | 5,218 | 1,275 |
| Yemen, Democratic Republic | 1 | 1 | 93 |
| Zambia | 449 | 451 | 1 |
| Totals, Sterling Area | 719,615 | 737,424 | 741,052 |
| EFTA Countries— | |||
| Austria | 574 | 574 | 2,291 |
| Iceland | 7 | 10 | -- |
| Norway | 1,896 | 1,944 | 2,102 |
| Portugal | 4,067 | 4,077 | 1,059 |
| Sweden | 3,096 | 3,154 | 12,275 |
| Switzerland and Liechtenstein | 1,745 | 1,786 | 12,742 |
| Totals, EFTA | 11,385 | 11,545 | 30,469 |
| EEC Countries (Excluding United Kingdom and Ireland‡)— | |||
| Belgium and Luxembourg | 42,418 | 42,423 | 7,096 |
| Denmark‡ | 2,503 | 2,522 | 3,736 |
| France and Monaco | 61,559 | 61,588 | 12,837 |
| Germany, Federal Republic of (West) | 50,732 | 51,252 | 50,988 |
| Italy and San Marino | 31,684 | 31,717 | 16,225 |
| Netherlands | 39,462 | 39,557 | 16,043 |
| Totals, EEC | 228,358 | 229,059 | 106,925 |
| Dollar Area— | |||
| American Samoa | 3,162 | 3,411 | 11 |
| Antarctic Territory (U.S.) | 2 | 3 | - |
| Bolivia | - | - | 35 |
| Canada | 42,236 | 42,388 | 34,631 |
| Colombia | 156 | 156 | 1,690 |
| Costa Rica | 269 | 269 | 9 |
| Dominican Republic | 107 | 107 | 2,288 |
| Ecuador | 5 | 5 | 2,472 |
| El Salvador | 129 | 129 | - |
| Guam | 1,919 | 1,920 | - |
| Guatemala | 1 | 1 | - |
| Haiti | 1 | 1 | - |
| Honduras | - | - | 1 |
| Liberia | 14 | 14 | - |
| Mexico | 2,662 | 2,663 | 958 |
| Nicaragua | 1 | 1 | - |
| Panama Canal Zone | 944 | 944 | - |
| Panama Republic | 159 | 159 | - |
| Philippines | 18,656 | 18,803 | 546 |
| Puerto Rico | 401 | 401 | 72 |
| Ryukyu Islands, etc. | 813 | 813 | - |
| U.S. Trust Terrs, in Pacific | 52 | 52 | - |
| United States | 271,590 | 274,716 | 145,670 |
| Venezuela | 1,044 | 1,048 | - |
| Totals, Dollar Area | 344,324 | 348,005 | 188,381 |
| Other Countries— $(000) | |||
| Afghanistan | 23 | 23 | 1 |
| Algeria | 7 | 7 | 1 |
| Angola incl. Cabinda | 6 | 6 | 324 |
| Arab Republic of Egypt | 148 | 148 | 3 |
| Argentina | 91 | 91 | 152 |
| Brazil | 202 | 229 | 2,014 |
| Bulgaria | 304 | 304 | 18 |
| Burma | 255 | 267 | 267 |
| Cameroon | 148 | 148 | - |
| Chile | 17,447 | 17,448 | 212 |
| China† | 5,953 | 5,953 | 6,923 |
| China (Taiwan) | 9,282 | 9,284 | 3,058 |
| Comoro Islands | - | - | - |
| Congo People's Republic (Brazzaville) | - | - | 25 |
| Cuba | - | - | 2 |
| Czechoslovakia | 3,033 | 3,035 | 1,784 |
| Dahomey | 56 | 56 | - |
| Ethiopia | 14 | 15 | 3 |
| Finland | 966 | 966 | 736 |
| French Guiana | 148 | 148 | - |
| French Polynesia | 5,512 | 5,961 | 48 |
| Gabon | - | - | 2 |
| Germany, East | 3,979 | 3,980 | 492 |
| Greece | 38,116 | 38,116 | 113 |
| Guadeloupe | 242 | 242 | - |
| Hungary | 916 | 916 | 225 |
| Indonesia | 4,262 | 4,297 | 1,777 |
| Iran | 5,740 | 5,740 | 9,776 |
| Iraq | 244 | 244 | 273 |
| Israel | 243 | 251 | 500 |
| Ivory Coast | 1 | 1 | 4 |
| Japan | 230,282 | 230,868 | 166,788 |
| Khmer Republic (Cambodia) | 3 | 4 | - |
| Korea Democratic Republic | 647 | 647 | 2 |
| Korea, Republic of | 5,585 | 5,585 | 1,454 |
| Laos | 176 | 199 | - |
| Lebanon | 223 | 223 | 11 |
| Macao | - | - | 6 |
| Malagasy Republic | 169 | 169 | 27 |
| Martinique | 270 | 270 | - |
| Mauritania | 9 | 9 | - |
| Mongolian People's Republic | - | - | 6 |
| Morocco | 98 | 98 | 15 |
| Mozambique | 1,764 | 1,764 | 310 |
| Nepal | 76 | 76 | 1 |
| Netherlands Antilles | 965 | 965 | 78 |
| New Caledonia | 4,098 | 4,177 | 1 |
| Oman | 35 | 35 | - |
| Peru | 16,269 | 16,269 | 52 |
| Paraguay | 11 | 11 | 1 |
| Poland | 16,853 | 16,853 | 425 |
| Reunion | 1 | 1 | 1 |
| Rhodesia (Southern) | - | - | - |
| Romania | 568 | 568 | 128 |
| Rwanda | - | - | 8 |
| Saudi Arabia | 424 | 424 | 6,345 |
| Senegal | 189 | 189 | 7 |
| Somalia | 9 | 9 | - |
| Spain | 5,970 | 5,975 | 1,925 |
| Sudan | 7 | 7 | 40 |
| Surinam | 10 | 10 | - |
| Syria | 695 | 695 | 22 |
| Thailand | 9,545 | 9,661 | 1,030 |
| Togo | 31 | 31 | - |
| Tunisia | 26 | 26 | - |
| Turkey | 101 | 101 | 122 |
| U.S.S.R. | 30,192 | 30,192 | 946 |
| Union of Arab Emirates (U.A.E.) | 188 | 188 | - |
| Uruguay | 108 | 108 | - |
| Vietnam Democratic Republic | 13 | 13 | 1 |
| Vietnam, Republic of | 1,187 | 1,187 | - |
| Wallis and Futuna Is. | 264 | 268 | - |
| Yemen | 2 | 2 | 891 |
| Yugoslavia | 12,159 | 12,159 | 99 |
| Zaire Republic (Congo Kinshasa) | 69 | 69 | 37 |
| Totals, Other Countries | 436,627 | 437,977 | 209,509 |
| Totals, All Countries | 1,740,309 | 1,764,010 | 1,276,336 |
| Passengers' purchases at duty-free stores | 251 | 5,299 | - |
| Ships' stores | 9,946 | 14,563 | - |
| Destination Optional | 4,137 | 4,137 | - |
| Grand totals | 1,754,643 | 1,788,009 | 1,276,336 |
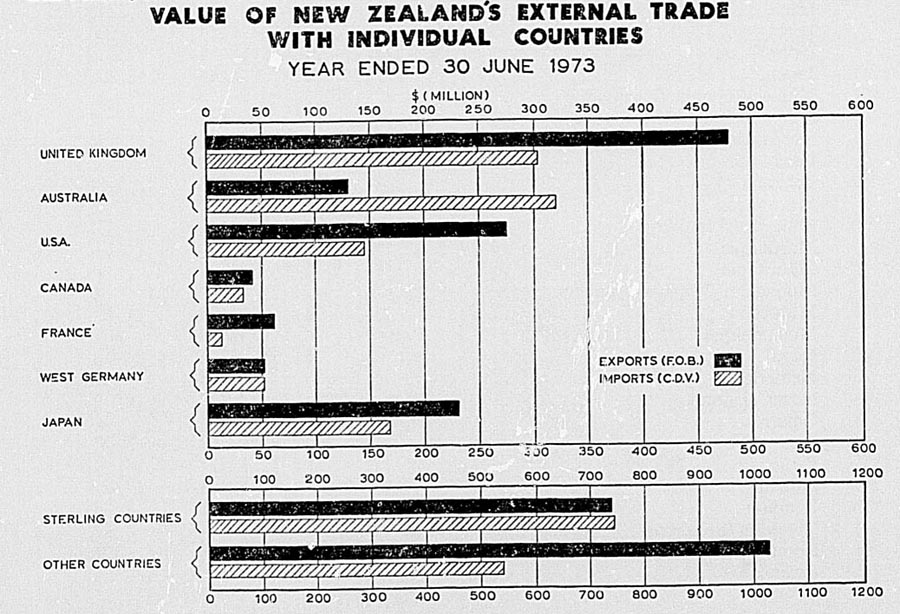
The next table shows the values of New Zealand's trade with several groupings of countries.
| Year Ended June | Exports (including Re-exports) f.o.b. (Excluding Ships' Stores) | Imports c.d.v. | Exports (including Re-exports) f.o.b. (Excluding Ships' Stores) | Imports c.d.v. | ||
|---|---|---|---|---|---|---|
| According to Country of Origin | According to Country of Purchase | According to Country of Origin | According to Country of Purchase | |||
*Provisional. †Belgium, Luxembourg, Denmark, France and Monaco, West Germany, Italy, and Netherlands. ‡Austria, Iceland, Norway, Portugal, Sweden, and Switzerland. | ||||||
| $(million) | ||||||
| Sterling Area | Dollar Area | |||||
| 1967 | 390.0 | 482.3 | 495.0 | 133.0 | 130.2 | 132.8 |
| 1968 | 454.2 | 385.9 | 399.8 | 158.9 | 100.9 | 106.3 |
| 1969 | 511.1 | 486.6 | 507.7 | 199.3 | 131.4 | 132.6 |
| 1970 | 540.2 | 570.8 | 597.5 | 227.7 | 167.1 | 165.4 |
| 1971 | 566.3 | 631.5 | 664.0 | 243.5 | 175.9 | 171.9 |
| 1972 | 660.1 | 700.9 | 736.9 | 274.1 | 159.2 | 154.0 |
| 1973* | 737.4 | 741.1 | 348.0 | 188.4 | ||
| 1974* | 672.6 | 1,006.6 | 392.3 | 280.0 | ||
| EEC Countries† | EFTA Countries‡ | |||||
| 1967 | 86.4 | 57.5 | 54.5 | 5.1 | 17.4 | 15.8 |
| 1968 | 87.2 | 45.9 | 43.1 | 5.7 | 16.8 | 14.7 |
| 1969 | 121.8 | 66.0 | 63.0 | 6.5 | 21.7 | 18.8 |
| 1970 | 121.9 | 72.8 | 69.5 | 8.5 | 20.1 | 16.7 |
| 1971 | 121.7 | 98.3 | 93.1 | 6.9 | 23.8 | 19.6 |
| 1972 | 148.2 | 98.2 | 92.5 | 8.0 | 30.9 | 27.0 |
| 1973* | 229.1 | 160.9 | 11.5 | 30.5 | ||
| 1974* | 190.1 | 181.7 | 10.9 | 44.3 | ||
VOLUME INDEX OF EXTERNAL TRADE—For the index of the volume of external trade, both the import and the export series are linked chain series with changing (price) weighting patterns, each year being calculated on base previous year and then linked on. This revised series is described in a supplement to the Monthly Abstract of Statistics May 1972.
Exports—Base: Year Ended June 1971 (=1000)
| June Year | Butter | Cheese | Dairy Produce | Meat | Wool | Meat, Wool, and By-products | All Pastoral and Dairy Produce | All Groups |
|---|---|---|---|---|---|---|---|---|
| *Provisional. | ||||||||
| 1963 | 862 | 1,020 | 777 | 771 | 852 | .. | .. | 712 |
| 1964 | 949 | 970 | 843 | 775 | 836 | .. | .. | 737 |
| 1965 | 980 | 1,038 | 901 | 753 | 785 | .. | .. | 733 |
| 1966 | 1,003 | 1,067 | 916 | 711 | 907 | .. | .. | 760 |
| 1967 | 1,053 | 1,137 | 991 | 745 | 750 | .. | .. | 756 |
| 1968 | 1,054 | 1,088 | 977 | 856 | 886 | .. | .. | 860 |
| 1969 | 1,065 | 951 | 969 | 924 | 1,025 | .. | .. | 946 |
| 1970 | 1,019 | 977 | 1,017 | 991 | 1,014 | .. | .. | 997 |
| 1971 | 1,000 | 1,000 | 1,000 | 1,000 | 1,000 | 1,000 | 1,000 | 1,000 |
| 1972 | 973 | 958 | 1,016 | 1,032 | 1,071 | 1,047 | 1,041 | 1,048 |
| 1973* | 898 | 1,032 | 993 | 1,085 | 994 | 1,045 | 1,041 | 1,064 |
| 1974* | 842 | 752 | 1,007 | 916 | 738 | 840 | 889 | 949 |
Imports—Base: Year Ended June 1971 (= 1000)
| June Year | Petroleum and Products | Textile Yarn, Fabrics, etc. | Iron and Steel | Machinery Other than Electric | Electric Machinery Apparatus | Transport Equipment | All Groups |
|---|---|---|---|---|---|---|---|
| *Provisional. | |||||||
| 1963 | 870 | 787 | 807 | 602 | 654 | 676 | 701 |
| 1964 | 992 | 901 | 927 | 742 | 963 | 945 | 833 |
| 1965 | 1,062 | 915 | 963 | 766 | 990 | 1,006 | 865 |
| 1966 | 825 | 986 | 1,114 | 1,004 | 882 | 1,085 | 940 |
| 1967 | 992 | 981 | 1,036 | 968 | 1,092 | 1,286 | 964 |
| 1968 | 845 | 831 | 798 | 669 | 703 | 647 | 725 |
| 1969 | 929 | 898 | 956 | 710 | 752 | 830 | 824 |
| 1970 | 1,009 | 966 | 991 | 861 | 818 | 1,096 | 934 |
| 1971 | 1,000 | 1,000 | 1,000 | 1,000 | 1,000 | 1,000 | 1,000 |
| 1972 | 994 | 1,060 | 833 | 1,028 | 957 | 1,370 | 1,027 |
| 1973* | 1,100 | 1,095 | 974 | 1,077 | 1,040 | 1,251 | 1,102 |
| 1974* | 1,324 | 1,557 | 1,306 | 1,366 | 1,319 | 1,536 | 1,406 |
IMPORT AND EXPORT CONTROL AND EXCHANGE ALLOCATION—To ensure that overseas debt services would be met and sufficient funds be available for essential imports, there have been import control and export licences regulations since December 1938.
The Import Control Regulations 1938 prohibited the import of goods except under a licence or an exemption. The Export Licences Regulations 1938 provided (with minor exceptions) that an export licence had to be obtained before goods could be exported. In addition, the requirement of an export permit was introduced by the Export Prohibition Emergency Regulations 1939, which have since been replaced by the Export Prohibition Regulations 1953. The Import Control Regulations 1973 require that, except for exempted goods (which comprise over two-thirds of private imports), a written licence, or a written permit granted by the Minister of Trade and Industry is necessary for all imports.
Export Control—Three classes of export licences are provided for, viz, particular, general, and purchaser's. The particular licence applies to an occasional shipment, the general licence is issued to exporters who make regular or frequent shipments, while the purchaser's licence applies to those cases where goods have been purchased in New Zealand for export and credits have been established from overseas funds (e.g., wool purchases). A condition of the issue of any export licence is that the overseas exchange earned must be sold to a New Zealand bank for New Zealand currency.
Whereas the purpose of the Export Licences Regulations 1966 is to ensure that all foreign exchange earned is sold to the New Zealand banking system, the Export Prohibition Regulations 1953 control the export of essential goods in short supply, of goods on which subsidies have been granted, and of goods shipped to strategic destinations.
The Export Incentive Scheme introduced in 1962 enabled import licences to be made available to all manufacturers who manufacture for export or who undertake to do so. Import licences issued under the scheme are either replacement, assistance, or bonus licences. A manufacturer already holding a licence, or entitlement to a licence for raw materials or components may obtain a replacement licence to the value of the licensed imported content of the goods exported, produced for export, or in the course of manufacture against confirmed overseas orders. Assistance licences will be granted either in the case of confirmed overseas orders where production has not been commenced, or when a manufacturer not holding overseas orders makes a declaration of intention to export and shows that active steps to open up an export market have been taken. Bonus licences are available to manufacturers who have actually exported; they may obtain licences for raw materials or components either of the same kind and value as those used in the manufacture of the exported goods, or of a different kind provided that the latter have a basic allocation and that the grant is not likely to affect adversely the efficient operation of an existing New Zealand industry. Bonus licences are in addition to licences issued as replacement or assistance licences. Once a bonus licence has been granted the materials or components may be used to manufacture goods for sale either overseas or in New Zealand as the manufacturer decides.
Import Selection—Before 1973 administration of import licensing policy was the joint responsibility of the Customs Department and the Department of Trade and Industry. On 2 April 1973 the Department of Trade and Industry assumed sole responsibility for licensing administration in terms of the Trade and Industry Amendment Act 1973.
Import provisions are published in an annual Import Licensing Schedule. Summaries of changes in the schedules and import policies in general up to the period 1972-73 are contained in earlier issues of the Yearbook.
In most cases, the 1973-74 Import Licensing Schedule provided for a level of licensed imports at 110 percent of the previous year's allocation. A lower allocation was provided in some instances where it was felt that domestic capital and labour resources had been under-utilised because of imports.
Although the token licence scheme was continued the allocation of certain token licences was reviewed to ensure that they had been used for the purpose of giving a variety of imports and had not been concentrated on a few items. As a result of this review steps were taken to ensure that token licences are used for a wide range of goods both in price and type. No additional provision was made for licences to be issued under the new importers scheme.
The Budget in June 1973 announced that with certain exceptions, basic and token licences issued on an ad valorem basis with an allocation of 100 or 110 percent would be increased by 5 percent.
In September 1973 a list of goods was published for which an additional $70 million import provision had been made to ease supplies and safeguard against shortages. Licences issued were to be on a “once only” basis and on the condition that the goods must be shipped prior to 31 March 1974. Provision was also made for new importers to apply over a range of selected items.
Import licence allocations were increased by one-fifth in value for the year from 1 July 1974. It was recognised that overseas inflation had greatly affected the price of imports. About 30 percent of New Zealand's imports by value are under import licence control; these include most consumer goods and cars. Uncontrolled imports comprise mostly raw materials, semi-processed goods, and capital equipment. Some items were added to the exempt list in the 1974-75 schedule, but it also has been used to protect local industry in the case of some other items, notably some textiles.
The broad policy of the schedule was to promote the maximum use of domestic resources and steady industrial expansion, while at the same time recognising the need for choice and variety for the user at all levels. The token licence scheme which was introduced many years ago to maintain, during periods of severe import licensing restrictions, long-standing trading ties with overseas companies, was discontinued. The need for this special scheme had disappeared, but existing token licences were converted to basic licences in the 1974-75 Import Licensing Schedule.
TARIFF AND DEVELOPMENT BOARD—The Tariff and Development Board was established under the Tariff and Development Board Act 1961. The Board was constituted on 1 June 1962 and since then has comprised between four and eight members. The Board has the functions, when so requested by the Minister of Customs, the Minister of Trade and Industry, or the Minister of Overseas Trade, to inquire into and report on revisions of the Customs Tariff, having regard to the trade and commerce, and the farming, manufacturing, and distributing industries of New Zealand and also the interests of consumers.
In 1974 the Board conducted 29 inquiries to consider the levels of protection on a wide range of goods.
The main products involved were glass; pumps, fans and blowers; adhesives; gramophone records and tapes; salt; unwrought aluminium; perfumery preparations; and paint.
At the request of the Minister of Overseas Trade, the Board in 1974 inquired into and reported on the question of whether certain goods should be added to Schedule A of the New Zealand - Australia Free Trade Agreement. The goods on which public inquiries were held were: needle loom felt; shower drainage pans; stoppers; poultry incubators; ball point pens; plastic powders; and socket head screws.
Emergency Protection Authorities—The Tariff and Development Amendment Act 1967 made provision for the appointment of Emergency Protection Authorities. The Minister of Customs, the Minister of Trade and Industry, or the Minister of Overseas Trade may, where it appears to the Minister that urgent action may be necessary to protect a New Zealand industry in relation to imports of goods, request an Authority to undertake an inquiry in relation to the importation of such goods and to report to the Minister on the following matters:
Whether urgent action is necessary to protect that industry in relation to the importation of such goods; and
If such action is considered necessary, the nature of the protection that is considered by the Authority to be appropriate in all circumstances, and the extent and duration of such protection.
An Authority which undertakes an inquiry is required to report back to the appropriate Minister not later than 30 days after the date on which he received the request for the inquiry. If the Authority considers that urgent action should be taken to protect the industry, it may recommend to the Minister that protection be effected by either or both of the following measures:
The imposition of a temporary Customs duty.
The temporary restriction of the importation of such goods.
When the Authority so recommends, action may be taken within the terms of the Customs Act 1966, to impose a temporary protective Customs duty or within the terms of the Trade and Industry Act 1956 to impose a restriction on importation. However the matter must have first been referred to the Tariff and Development Board for its consideration before any temporary protection is imposed. There are limits placed on the duration of temporary protection which is regarded as “holding action” pending the completion of the Tariff and Development Board's inquiries.
The Emergency Protection Authority was established in 1968 and by 31 December 1974 had undertaken 167 inquiries. Most of these inquiries arose following the receipt of objections to proposals to exempt goods from import licensing. After considering the Authority's reports the Government imposed temporary duties in 37 cases, and retained import licensing in a further 39 cases. In twelve cases temporary protection was reimposed. Temporary protection was not granted in the 79 remaining instances.
TRADE COMMISSIONER SERVICE—Facilities for the promotion of overseas trade are provided by the Department of Trade and Industry through the service of 32 Trade Commissioner posts— Athens, Bangkok, Bonn, Brisbane, Brussels, Canberra, Djakarta, Hong Kong, Kuala Lumpur, Lima, London, Los Angeles, Melbourne, Montreal, Moscow, New Delhi, New York, Noumea, Paris, Peking, Perth, Rome, San Francisco, Santiago, Singapore, Suva, Sydney, Tokyo, Trinidad, Vancouver, Vienna and Washington. While this representation is modest in comparison with other countries, it reflects the country's interest in the desirability of diversifying export markets. In addition, some Air New Zealand overseas managers act as trade correspondents of the Department of Trade and Industry. At present there are Air New Zealand correspondents in Tahiti, American Samoa, and Honolulu. Most Trade Commissioners have appropriate diplomatic or consular status in the countries to which they are accredited.
While the selling of goods in overseas markets is basically the responsibility of New Zealand exporters, the Trade Commissioner can be of considerable help in conducting market surveys and supplying information on import and exchange restrictions, Customs duty, sales tax, normal sources of supply (local production and imported), marketing methods, freight rates, statutory or customary requirements for packing, labelling, etc., and reliable importers in his territory. He may also assist New Zealand importers to locate new sources of supply of essential commodities. New Zealand businessmen travelling overseas may be saved much time and trouble by enlisting in advance the services of the Trade Commissioner, whose knowledge of local conditions and whose connections with businessmen and Government officials in his territory enable him to give valuable advice. His task is made easier if he is given adequate notice of the visit.
The Trade Commissioner keeps a careful watch on the pattern of New Zealand trade with his territory and reports on significant changes. Where imports from New Zealand are affected, for example, by a new interpretation of an agricultural inspection regulation, or by the imposition of import restrictions, the Trade Commissioner is often called upon to make representations at the official level.
Trade Commissioners are also engaged in numerous other activities, some of which are representing New Zealand at international conferences, reporting on economic and industrial developments in their territories, acting on behalf of Government departments in the procurement of stores, payment of accounts, etc., and maintaining liaison where they are stationed with business and Government circles.
Businessmen may write for information direct to the New Zealand Trade Commissioner in the country concerned but, where convenient, it is preferred that requests be made through the Department of Trade and Industry in New Zealand, which is often able to give preliminary advice and assistance.
The addresses of overseas representatives are listed in Section 39, Official.
TRADE PROMOTION—A Trade Promotion Council was set up in March 1962 as a co-ordinating and advisory agency in a concerted continuous New Zealand trade drive and in September 1969, it accepted an invitation to act as a sector council of the National Development Council. The council advises in the exploration of new or potential markets including trade surveys and missions; the coordination of promotional schemes, trade fairs, and publicity; and the improvement of facilities, both within New Zealand and overseas, which may assist exporters. Export seminars for businessmen have been conducted by the Department of Trade and Industry in major cities. To date eight annual series have been held covering both the advantages of exporting and the techniques required for success. Contacts with exporters and prospective exporters have been continued by the work of export liaison officers, who travel widely in New Zealand, explaining the facilities and incentives that are available to exporters.
The Export Guarantee Office operates under the Export Guarantee Act 1964. As an offshoot of the State Insurance Office it insures exports, including contracts insured under the national interest provisions of the Act. In 1974 it insured exports valued at $143 million compared with $180 million in 1973. Since its inception the office has insured exports to the value of approximately $720 million.
Export-Import Corporation—A corporation has been established under the New Zealand Export-Import Corporation Act 1973 to engage in overseas trade and act on behalf of any manufacturers, producers, exporters, and importers who request it to do so, including the Government. It also undertakes trade promotion. Capital to the amount of $2 million has been made available from the National Development Loans Account.
GENERAL—The growth and diversification of the New Zealand economy are heavily dependent on increasing exports to pay for rising imports of goods needed by industry and a growing population, as well as to provide for large payments for “invisibles” in the form of services. Overseas trade is the lifeblood of the economy. (See Section 25e, National Development Council for projections of exports to meet growth requirements.)
In New Zealand copies of export entries are forwarded to the Department of Statistics for processing and analysis and the regular publication of export statistics. Exports are valued in New Zealand currency “free on board at the port of shipment”. Where goods are not sold till arrival at their destination, values are assessed at current prices at time of shipment. Meat and dairy-produce exports are valued like other commoditie's, on the basis of overseas realisation, not on the basis of the prices payable to producers under the internal purchasing procedures.
The ultimate destination of the goods is distinguished as far as practicable, but it is impossible to discover what proportion of the exports is intended for home consumption in the country of destination. A distinction is made between exports of New Zealand produce and re-exports of imported goods.
Since 1 July 1962, the Standard International Trade Classification (Revised) has been used in classifying export trade.
MAIN EXPORTS—The following table gives total exports of New Zealand produce and re-exports (excluding gold and current coin) for the latest 9 June years and the main commodity groups.
| Year Ended June | Meat and Meat Preparations | Dairy Products | Hides, Skins, and Pelts | Wool | |||
|---|---|---|---|---|---|---|---|
| Butter | Cheese | Casein | Total* | ||||
| f.o.b. value $(million) | |||||||
| 1966 | 196.7 | 109.6 | 41.7 | 20.0 | 195.4 | 40.0 | 231.9 |
| 1967 | 205.0 | 109.4 | 45.1 | 18.6 | 205.4 | 33.6 | 174.1 |
| 1968 | 260.7 | 112.2 | 47.4 | 18.1 | 210.3 | 39.8 | 158.2 |
| 1969 | 309.4 | 114.8 | 42.6 | 21.7 | 204.7 | 55.4 | 212.4 |
| 1970 | 368.9 | 109.7 | 44.3 | 25.8 | 213.9 | 48.7 | 204.2 |
| 1971 | 390.8 | 113.9 | 48.0 | 30.2 | 228.9 | 50.6 | 187.8 |
| 1972 | 399.0 | 183.9 | 66.3 | 25.4 | 355.2 | 62.2 | 228.6 |
| 1973† | 539.8 | 135.1 | 79.4 | 22.0 | 326.1 | 96.4 | 424.2 |
| 1974† | 534.8 | 107.2 | 61.8 | 28.6 | 330.7 | 67.2 | 363.4 |
| Year Ended June | Sausage Casings | Tallow | Fruit and Vegetables | Pulp, Paper, and Paper-board | Total* | Re-exports | Total Exports |
|---|---|---|---|---|---|---|---|
*Including commodities not listed. †Provisional. | |||||||
| f.o.b. value $(million) | |||||||
| 1967 | 12.0 | 6.8 | 10.7 | 16.6 | 717.6 | 9.6 | 727.2 |
| 1968 | 9.9 | 6.9 | 13.8 | 23.9 | 804.6 | 15.8 | 820.5 |
| 1969 | 10.9 | 6.5 | 16.6 | 27.0 | 968.9 | 20.2 | 989.1 |
| 1970 | 14.0 | 9.0 | 21.6 | 28.3 | 1,064.5 | 22.2 | 1,086.7 |
| 1971 | 14.1 | 10.1 | 21.3 | 28.2 | 1,108.1 | 23.6 | 1,131.7 |
| 1972 | 15.4 | 8.9 | 23.1 | 33.8 | 1,346.6 | 28.3 | 1,375.0 |
| 1973† | 13.9 | 9.6 | 30.8 | 36.4 | 1,753.7 | 33.3 | 1,787.0 |
| 1974† | 16.6 | 13.9 | 35.9 | 51.8 | 1,744.7 | 42.8 | 1,787.6 |
The commodity groups shown above normally account for more than 80 percent of their total value of merchandise exports.
The relative importance of dairy produce, meat, and wool as the main individual constituents of New Zealand's export trade have varied considerably, as is seen from the figures in the preceding table. In the preceding subsection is set out a table of volume index numbers for these commodities. A table showing the export price index numbers and terms of trade is given in Section 23, Prices.
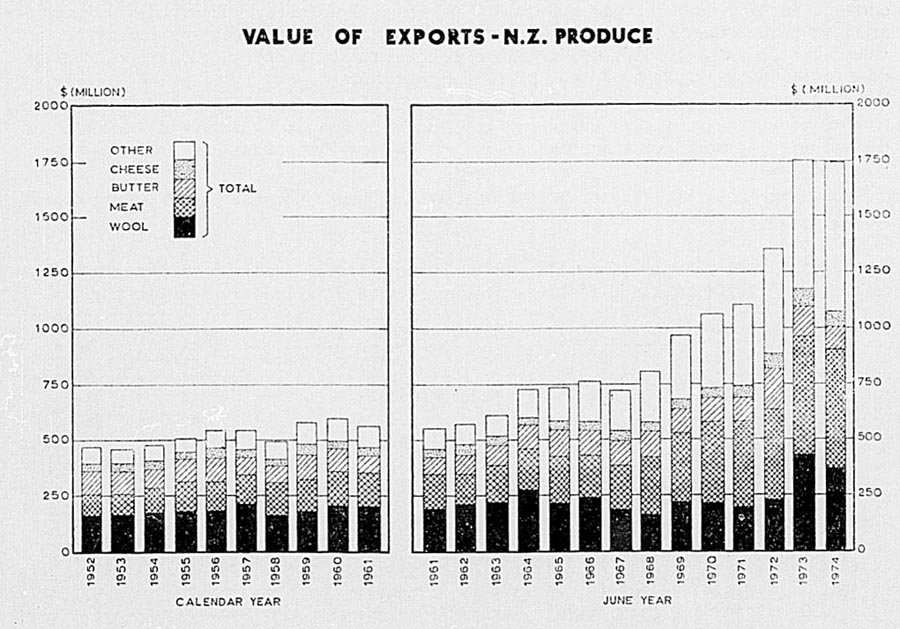
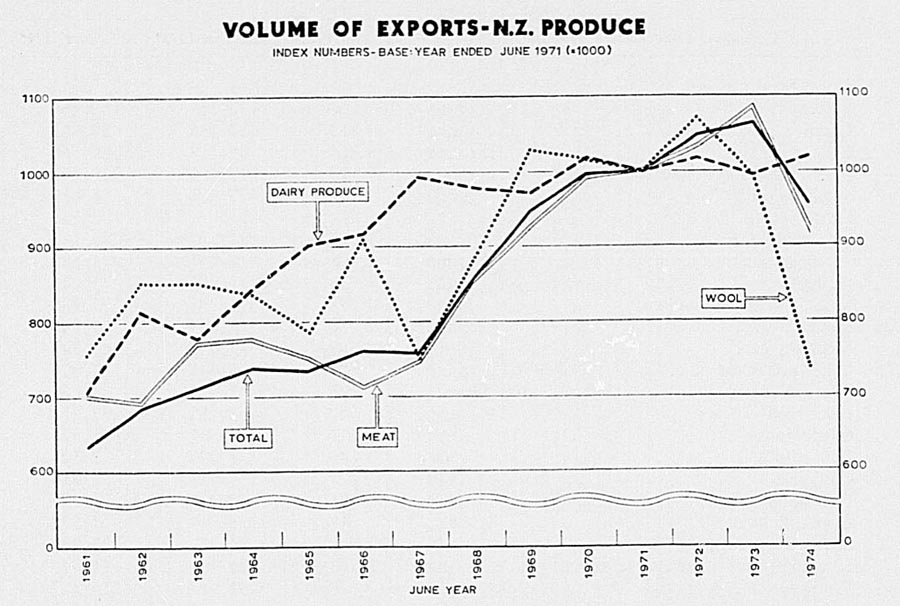
Exports of pastoral products usually average over 80 percent. For the June years 1973 and 1974 exports of pastoral products were 82 percent and 78 percent respectively.
Of exports other than pastoral the principal ones of economic significance for the June years 1973 and 1974 were: logs of radiata pine ($30.3 m and $26.0 m), fish and fish products ($19.8 m and $19.0 m), newsprint ($16.2 m and $14.5 m), sawn timber ($10.6 m and $13.4 m), wood pulp ($14.1 m and $25.6 m), apples ($12.8 m and $12.8 m), grass and clover seeds ($6.5 m and $8.9 m).
Quantity figures of exports of the principal items of New Zealand produce are next given for the 3 latest years, while the Statistical Summary, towards the end of the book, shows the figures for some of the more important commodities for the last 50 years.
| Commodity (New Zealand Produce) | June Year 1972 | June Year 1973* | June Year 1974* | |
|---|---|---|---|---|
| *Provisional. | ||||
| Mining products— | ||||
| Pumice | tonne | 561 | 622 | 611 |
| Cement | tonne | 694 | 13,873 | 8,062 |
| Fishery products— | ||||
| Fish, fresh and frozen. | tonne | 10,613 | 11,638 | 10,180 |
| Crayfish | tonne | 1,987 | 1,644 | 1,679 |
| Fish oils and fish-liver oils litre | 26,057 | 25,562 | 41,027 | |
| Forest products— | ||||
| Kauri gum | tonne | 12 | 6 | 2 |
| Timber— | ||||
| Logs, radiata pine | (000) cu m | 1,760 | 1,735 | 1,064 |
| Sawn | (000) cu m | 267 | 248 | 245 |
| For cases in shooks | cu m | 3,447 | 1,394 | 1,585 |
| Wood pulp | tonne | 113,030 | 141,521 | 232,006 |
| Newsprint | tonne | 130,924 | 122,971 | 103,099 |
| Building board | (000) sq m | 2,237 | 2,496 | 744 |
| Plywood | (000) sq m | 651 | 557 | 713 |
| Pastoral products— | ||||
| Butter | tonne | 187,860 | 172,248 | 159,464 |
| Casein | tonne | 42,113 | 27,796 | 39,965 |
| Cheese | tonne | 88,464 | 95,414 | 69,544 |
| Milk, dried and condensed | tonne | 191,925 | 197,415 | 278,348 |
| Sugar of milk | tonne | 8,116 | 7,864 | 6,619 |
| Eggs— | ||||
| In shell | (doz) | 185,025 | 94,270 | 240,781 |
| Not in shell | tonne | 2,998 | 4,217 | 1,889 |
| Honey | tonne | 1,734 | 1,816 | 1,026 |
| Meat, frozen and chilled | tonne | 674,673 | 690,733 | 572,780 |
| Meat, canned | tonne | 2,556 | 2,463 | 1,840 |
| Meat extract | kg | 238,387 | 72,087 | 45,743 |
| Other preserved meat | tonne | 1,685 | 1,705 | 1,098 |
| Sausage casings (000) hanks | 8,175 | 7,324 | 7,262 | |
| Liver meal | kg | 543,940 | 453,715 | 337,718 |
| Cattlehides | (000) | 1,619 | 1,689 | 1,571 |
| Horsehides | No. | 3,849 | 2,006 | 2,306 |
| Calfskins | (000) | 877 | 927 | 916 |
| Deerskins | (000) | 96 | 121 | 95 |
| Opossum skins | (000) | 517 | 1,240 | 1,572 |
| Sheepskins and pelts | (000) | 37,928 | 34,711 | 27,995 |
| Horsehair and other coarse animal hair | kg | 18,143 | 26,291 | 64,049 |
| Wool | tonne | 312,370 | 287,917 | 214,213 |
| Lard | kg | 3,048 | 1,321 | 319 |
| Edible tallow | tonne | 2,970 | 259 | 190 |
| Edible Stearine | tonne | 282 | 83 | 25 |
| Inedible tallow | tonne | 66,681 | 76,376 | 53,823 |
| Neatsfoot oil | tonne | 448 | 751 | 532 |
| Live cattle | No. | 3,765 | 7,568 | 8,832 |
| Live sheep | No. | 208 | 9,072 | 98,235 |
| Live horses | No. | 1,519 | 1,559 | 1,866 |
| Agricultural products— | ||||
| Barley | kg (000) | 10,981 | 39,769 | 12 |
| Apples | tonne | 58,072 | 66,781 | 61,245 |
| Pears | tonne | 2,571 | 2,732 | 2,636 |
| Hops | kg | 56,220 | 51,802 | 29,413 |
| Potatoes | tonne | 4,449 | 10,597 | 11,158 |
| Onions | tonne | 10,517 | 14,283 | 15,550 |
| Canned vegetables | tonne | 2,952 | 1,654 | 2,200 |
| Frozen vegetables | tonne | 9,943 | 19,269 | 15,826 |
| Peas, food | tonne | 18,300 | 28,479 | 25,505 |
| Peas, seed | tonne | 12,089 | 10,406 | 11,379 |
| Seeds, grass and clover | tonne | 11,640 | 15,962 | 9,370 |
| Seeds, other | tonne | 725 | 568 | 444 |
| Miscellaneous— | ||||
| Biscuits | tonne | 3,300 | 2,430 | 2,280 |
| Ale, beer, stout | litre (000) | 3,567 | 3,868 | 3,765 |
| Sugar | kg | 927,447 | 613,133 | 616,994 |
| Drinking chocolate | tonne | 4,965 | 5,625 | 2,359 |
| Cigarettes | kg | 129,834 | 165,674 | 204,111 |
| Cut tobacco | kg | 62,388 | 65,267 | 72,186 |
| Textile waste | kg | 845,837 | 541,036 | 616,295 |
| Soaps | tonne | 963 | 1,277 | 1,225 |
| Chamois leather | sq m | 46,097 | 44,992 | 48,243 |
The values of the principal exports are given in the following table.
| Commodity (New Zealand Produce) | June Year 1972 | June Year 1973* | June Year 1974* |
|---|---|---|---|
| *Provisional. | |||
| $(000) | $(000) | $(000) | |
| Mining products— | |||
| Pumice | 20 | 21 | 23 |
| Cement | 17 | 270 | 150 |
| Other | 87 | 118 | 1,222 |
| Totals | 124 | 410 | 1,395 |
| Fishery products— | |||
| Fish, fresh and frozen | 6,205 | 7,184 | 6,846 |
| Fish, other | 2.662 | 2,537 | 1,732 |
| Crayfish | 12,947 | 10,070 | 10,438 |
| Fish oils, fish-liver oils | 62 | 14 | 20 |
| Totals | 21,876 | 19,805 | 19,017 |
| Forest products— | |||
| Kauri gum | 10 | 7 | 2 |
| Timber— | |||
| Logs, radiata pine | 28,541 | 30,271 | 25,952 |
| Sawn | 10,565 | 10,600 | 13,408 |
| For cases in shooks | 226 | 94 | 110 |
| Wood pulp | 11,285 | 14,100 | 25,573 |
| Newsprint | 16,461 | 16,194 | 14,539 |
| Other paper and paperboard | 4,730 | 4,863 | 10,956 |
| Building board | 1,190 | 1,211 | 487 |
| Plywood | 593 | 434 | 651 |
| Other | 1,581 | 3,910 | 8,303 |
| Totals | 75,183 | 81,682 | 99,982 |
| Pastoral products— | |||
| Butter | 183,922 | 135,071 | 107,152 |
| Casein | 25,384 | 22,042 | 28,556 |
| Cheese | 66,324 | 79,400 | 61,805 |
| Milk, dried and condensed | 76,494 | 86,964 | 130,644 |
| Sugar of milk | 2,130 | 2,076 | 1,669 |
| Other dairy produce | 3,119 | 2,641 | 2,543 |
| Eggs— | |||
| In shell | 81 | 40 | 104 |
| Not in shell | 855 | 1,124 | 938 |
| Honey | 796 | 1,288 | 900 |
| Meat, frozen and chilled | 393,504 | 534,608 | 530,387 |
| Meat, canned | 3,681 | 3,619 | 3,366 |
| Meat extract | 630 | 252 | 109 |
| Other preserved meat | 1,189 | 1,321 | 986 |
| Sausage casings | 15,380 | 13,913 | 16,607 |
| Liver meal | 118 | 110 | 115 |
| Cattlehides | 12,539 | 25,185 | 17,818 |
| Calfskins | 1,660 | 3,243 | 3,114 |
| Deerskins | 353 | 656 | 483 |
| Opossum skins | 595 | 2,021 | 3,869 |
| Sheepskins and pelts | 46,857 | 64,716 | 41,291 |
| Wool | 228,639 | 424,173 | 363,410 |
| Inedible offals (including dried blood) | 6,104 | 6,710 | 6,194 |
| Edible tallow | 516 | 53 | 54 |
| Edible Stearine | 49 | 14 | 4 |
| Inedible tallow | 8,394 | 9,586 | 13,797 |
| Neatsfoot oil | 94 | 134 | 123 |
| Live cattle | 1,377 | 2,885 | 3,925 |
| Live sheep | 32 | 352 | 1,978 |
| Live horses | 6,415 | 7,070 | 9,077 |
| Other | 3,485 | 7,116 | 7,184 |
| Totals | 1,090,713 | 1,438,383 | 1,358,204 |
| Agricultural products— | |||
| Barley | 467 | 1,968 | 1 |
| Apples | 10,436 | 12,838 | 12,773 |
| Pears | 442 | 530 | 531 |
| Hops | 79 | 75 | 41 |
| Potatoes | 424 | 776 | 1,280 |
| Onions | 938 | 1,558 | 2,278 |
| Canned vegetables | 988 | 771 | 1,012 |
| Frozen vegetables | 2,599 | 5,012 | 4,715 |
| Peas, food | 2,248 | 3,373 | 5,999 |
| Peas, seed | 1,603 | 1,452 | 1,725 |
| Seeds, grass and clover | 4,433 | 6,523 | 8,867 |
| Other seeds | 665 | 626 | 888 |
| Other | 3,787 | 7,838 | 7,101 |
| Totals | 29,103 | 43,340 | 47,213 |
| Miscellaneous— | |||
| Biscuits | 2,474 | 1,699 | 3,792 |
| Ale, beer, stout | 679 | 726 | 803 |
| Sugar | 182 | 134 | 165 |
| Soups | 166 | 295 | 402 |
| Drinking chocolate | 2,805 | 2,674 | 1,141 |
| Infant and invalid food (cereal) | 10 | 26 | 17 |
| Cigarettes | 585 | 739 | 971 |
| Cut tobacco | 206 | 250 | 301 |
| Textile waste | 177 | 213 | 345 |
| Soaps | 369 | 530 | 699 |
| Scrap metal | 957 | 1,027 | 2,259 |
| Dairy machinery | 5,563 | 2,084 | 1,446 |
| Chamois leather | 184 | 180 | 216 |
| Vitamins and concentrates | 29 | 20 | 23 |
| Other | 119,220 | 159,497 | 208,351 |
| Totals | 129,605 | 170,094 | 218,931 |
| Totals;, New Zealand produce (excluding gold | 1,346,614 | 1,753,714 | 1,744,741 |
| Gold (excluded from above) | 9 | 122 | 347 |
In the following fable exports (excluding re-exports) are summarised according to the Sections and Divisions of the Standard International Trade Classification (Revised).
| Exports, New Zealand Produce—-Section and Division | June Year 1973* | June Year 1974* |
|---|---|---|
| *Provisional. | ||
| Section 0, Food and Live Animals | ||
| $(000) | $(000) | |
| Div. 00 Live animals | 10,380 | 15,061 |
| Div. 01 Meat and meat preparations | 539,800 | 534,849 |
| Div. 02 Dairy products and eggs | 305,240 | 303,186 |
| Div. 03 Fish and fish preparations | 19,787 | 18,982 |
| Div. 04 Cereals and cereal preparations | 5,936 | 2,216 |
| Div. 05 Fruit and vegetables | 30,757 | 35,866 |
| Div. 06 Sugar and sugar preparations | 3,758 | 2,913 |
| Div. 07 Coffee, tea, cocoa, spices, and manufactures thereof | 5,192 | 3,618 |
| Div. 08 Feeding stuff for animals (not including unmilled cereals) | 7,911 | 10,324 |
| Div. 09 Miscellaneous food preparations | 1,788 | 2,006 |
| Totals, Section 0 | 930,550 | 929,020 |
| Section 1. Beverages and Tobacco | ||
| Div. 11 Beverages | 898 | 1,039 |
| Div. 12 Tobacco and tobacco manufactures | 1,024 | 1,300 |
| Totals, Section 1 | 1,922 | 2,339 |
| Section 2. Crude Materials, Inedible, Except Fuels | ||
| Div. 21 Hides, skins, and fur skins, undressed | 96,391 | 67,207 |
| Div. 22 Oil seeds, oil nuts, and kernels | 9 | 34 |
| Div. 23 Crude rubber, including synthetic and reclaimed | ||
| Div. 24 Wood and cork | 44,781 | 47,663 |
| Div. 25 Pulp and waste paper | 14,154 | 25,818 |
| Div. 26 Textile fibres (not manufactured into yarn, thread, or fabrics) and waste | 425,865 | 364,872 |
| Div. 27 Crude fertilisers and crude minerals, excluding coal, petroleum, and precious stones | 327 | 334 |
| Div. 28 Metalliferous ores and metal scrap | 7,586 | 16,396 |
| Div. 29 Animal and vegetable crude materials, n.e.s. | 31,157 | 37,702 |
| Totals, Section 2 | 620,269 | 560,028 |
| Section 3. Mineral Fuels, Lubricants and Related Materials | ||
| Div. 32 Coal, coke, and briquettes | 357 | 134 |
| Div. 33 Petroleum and petroleum products | 9,505 | 7,448 |
| Div. 34 Gas | - | 2 |
| Totals, Section 3 | 9,862 | 7,584 |
| Section 4. Animal and Vegetable Oils and Fats | ||
| Div. 41 Animal oils and fats | 10,046 | 15,796 |
| Div. 42 Vegetable oils and fats, unprocessed | 4 | 4 |
| Div. 43 Animal and vegetable oils and fats, processed | 368 | 418 |
| Totals, Section 4 | 10,418 | 16,218 |
| Section 5. Chemicals | ||
| Div. 51 Chemical elements and compounds | 2,342 | 2,092 |
| Div. 52 Mineral tar and crude chemicals from coal, petroleum, and natural gas | 3 | 2 |
| Div. 53 Dyeing, tanning, and colouring materials | 759 | 744 |
| Div. 54 Medicinal and pharmaceutical products | 2,222 | 2,993 |
| Div. 55 Essential oils and perfume materials, toilet, polishing, and cleansing preparations | 1,694 | 2,000 |
| Div. 56 fertilisers, manufactured | 43 | 143 |
| Div. 57 Explosives and pyrotechnic products | 57 | 46 |
| Div. 58 Plastic materials, regenerated cellulose, artificial resins | 1,431 | 1,919 |
| Div. 59 Miscellaneous chemical materials and products | 25,864 | 33,202 |
| Totals, Section 5 | 34,415 | 43,140 |
| Section 6. Manufactured Goods Classified by Material | ||
| Div. 61 Leather, leather manufactures, n.e.i., and dressed furs | 6,851 | 8,322 |
| Div. 62 Rubber manufactures, n.e.s. | 1,513 | 1,942 |
| Div. 63 Wood and cork manufactures (excluding furniture) | 6,232 | 6,209 |
| Div. 64 Paper, paperboard, and manufactures thereof | 24,559 | 28,654 |
| Div. 65 Textile yarn, fabrics, made-up articles, and related products | 20,412 | 25,462 |
| Div. 66 Non-metallic mineral manufactures, n.e.s. | 3,536 | 3,040 |
| Div. 67 Iron and steel | 9,051 | 5,277 |
| Div. 68 Non-ferrous metals | 25.393 | 42,423 |
| Div. 69 Manufactures of metal | 6,392 | 8,598 |
| Totals, Section 6 | 103,739 | 129,927 |
| Section 7. Machinery and Transport Equipment | ||
| Div. 71 Machinery other than electric | 11,683 | 13,601 |
| Div. 72 Electric machinery, apparatus, and appliances | 12,993 | 18,067 |
| Div. 73 Transport equipment | 4,516 | 7,429 |
| Totals, Section 7 | 29,192 | 39,098 |
| Section 8. Miscellaneous Manufactured Articles | ||
| Div. 81 Sanitary, plumbing, heating and lighting fixtures, and fittings | 614 | 680 |
| Div. 82 Furniture and fixtures | 1,386 | 2,227 |
| Div. 83 Travel goods, handbags, and similar articles | 772 | 859 |
| Div. 84 Clothing | 2,454 | 3,001 |
| Div. 85 Footwear | 432 | 620 |
| Div. 86 Professional, scientific and controlling instruments; photographic and optical goods, watches and clocks | 971 | 1,373 |
| Div. 89 Miscellaneous manufactured articles, n.e.s. | 6,572 | 8,506 |
| Totals, Section 8 | 13,201 | 17,267 |
| Section 9. Commodities and Transactions not Classified According to Kind | ||
| Goods under $20 in value | 48 | 46 |
| Other | 98 | 75 |
| Totals, Section 9 | 146 | 121 |
| Total New Zealand produce exports | 1,753,714 | 1,744,741 |
| Re-exports | 33,275 | 42,822 |
| Grand total, merchandise exports | 1,786,989 | 1,787,563 |
| Exports of gold (excluded from above) | 122 | 347 |
DESTINATION OF NEW ZEALAND EXPORTS—The United Kingdom has been New Zealand's principal trading partner for over 100 years. The proportion of our exports (including re-exports) going to the United Kingdom market in the years prior to the Second World War was between 70 and 80 percent of the total value of all exports. With the growing diversification of our markets in recent years the proportion of New Zealand's export going to this market has fallen and by the June year 1973 represented only 27 percent of the total value of exports to all countries, compared with 31 percent for June year 1972.
In recent years trade has been recorded with over 100 countries each year.
TOTAL EXPORTS TO INDIVIDUAL COUNTRIES—The following table gives exports (including re-exports but excluding gold, current coin, passengers' purchases, and ships' stores) to each country for the 3 latest June years.
| Country | June Year 1972 | June Year 1973* | June Year 1974* |
|---|---|---|---|
*Provisional. †Does not include statistics for that part of China known as Taiwan. | |||
| $(000) | $(000) | $(000) | |
| Sterling Area | |||
| Associated States in Eastern Caribbean | 988 | 488 | 962 |
| Australia | 112,812 | 130,252 | 171,789 |
| Bahamas | 827 | 548 | 555 |
| Bahrain | 31 | 140 | 297 |
| Barbados | 3,024 | 2,629 | 2,684 |
| Bermuda | 2,108 | 2,125 | 2,536 |
| British Solomon Islands | 480 | 362 | 556 |
| Brunei | 16 | 40 | 49 |
| Cyprus | 2,373 | 2,241 | 2,590 |
| Fiji | 14,588 | 17,680 | 20,253 |
| Ghana | 1,019 | 1,664 | 2,101 |
| Gilbert and Ellice Islands | 259 | 232 | 270 |
| Guyana | 58 | 38 | 185 |
| Hong Kong | 8,936 | 15,511 | 17,247 |
| India | 6,006 | 6,475 | 4,260 |
| Ireland, Republic of | 3,202 | 3,564 | 4,589 |
| Jamaica | 11,626 | 9,777 | 10,748 |
| Jordan | 320 | 707 | 2,979 |
| Kenya | 1,089 | 455 | 346 |
| Kuwait | 360 | 343 | 792 |
| Malawi | 128 | 159 | 278 |
| Malaysia | 15,790 | 16,087 | 18,412 |
| Malta | 32 | 431 | 507 |
| Mauritius and Dependencies | 922 | 967 | 1,027 |
| Montserrat | 39 | 32 | 18 |
| Nauru | 388 | 258 | 159 |
| New Hebrides | 1,045 | 1,737 | 1,729 |
| Nigeria | 404 | 351 | 503 |
| Norfolk Island | 526 | 671 | 779 |
| Pakistan | 1,264 | 1,103 | 945 |
| Papua, etc. | 2,558 | 1,778 | 2,229 |
| Pitcairn Island | 27 | 19 | 23 |
| Qatar and Trucial Sheikdoms | 203 | 38 | 116 |
| Seychelles | 10 | 7 | 5 |
| Sierra Leone | 2 | 4 | 2 |
| Singapore | 13,401 | 13,334 | 14,456 |
| South Africa | 14,320 | 6,701 | 3,120 |
| Sri Lanka (Ceylon) | 3,814 | 3,518 | 553 |
| Tanzania | 319 | 184 | 42 |
| Tonga | 2,190 | 2,278 | 2,961 |
| Trinidad and Tobago | 7,771 | 6,329 | 6,473 |
| Uganda | 116 | 18 | 26 |
| United Kingdom | 419,572 | 479,148 | 365,790 |
| Western Samoa | 4,724 | 5,218 | 5,526 |
| Zambia | 323 | 451 | 795 |
| Others | 85 | 1,333 | 350 |
| Totals, sterling countries | 660,095 | 737,424 | 672,611 |
| EFTA | |||
| Austria | 250 | 574 | 448 |
| Iceland | 10 | - | |
| Norway | 1,492 | 1,944 | 1,016 |
| Portugal | 1,781 | 4,077 | 4,005 |
| Sweden | 2,654 | 3,154 | 2,645 |
| Switzerland and Liechtenstein | 1,824 | 1,786 | 2,813 |
| Totals, EFTA countries | 8,001 | 11,545 | 10,926 |
| EEC | |||
| (Excluding United Kingdom and Ireland, Republic of) | |||
| Belgium and Luxembourg | 31,548 | 42,423 | 35,789 |
| Denmark | 1,648 | 2,522 | 1,818 |
| France and Monaco | 41,824 | 61,588 | 37,802 |
| Germany, Federal Republic of (West) | 34,645 | 51,252 | 41,046 |
| Italy and San Marino | 18,460 | 31,717 | 26,835 |
| Netherlands | 20,076 | 39,557 | 46,848 |
| Totals, EEC countries | 148,201 | 229,059 | 190,138 |
| Dollar Area | |||
| American Samoa | 3,411 | 2,793 | 2,555 |
| Canada | 40,139 | 42,388 | 52,436 |
| Colombia | 15 | 156 | 696 |
| Costa Rica | 1 | 269 | 863 |
| Dominican Republic | 572 | 107 | 451 |
| El Salvador | 8 | 129 | 278 |
| Guam | 2,743 | 1,920 | 1,031 |
| Guatemala | 1 | 1 | 10 |
| Liberia | 12 | 14 | 4 |
| Mexico | 2,121 | 2,663 | 8,999 |
| Panama Canal Zone | 597 | 944 | 825 |
| Panama Republic | 71 | 159 | 1,465 |
| Philippines | 14,188 | 18,803 | 25,907 |
| Puerto Rico, etc. | 732 | 401 | 3 |
| Ryukyu Islands, etc. | 1,714 | 813 | 621 |
| U.S. Trust Territories in Pacific | 128 | 52 | 179 |
| United States of America | 207,842 | 274,716 | 295,343 |
| Venezuela | 397 | 1,048 | 447 |
| Others | 11 | 10 | 200 |
| Totals, dollar area | 274,085 | 348,005 | 392,315 |
| Other Countries | |||
| Arab Republic of Egypt | 241 | 188 | 217 |
| Argentina | 70 | 91 | 331 |
| Brazil | 91 | 229 | 8,275 |
| Bulgaria | 355 | 304 | 877 |
| Burma | 321 | 267 | - |
| Chile | 13,094 | 17,448 | 17,738 |
| China† | 1,708 | 5,953 | 16,952 |
| China (Taiwan) | 3,529 | 9,284 | 8,882 |
| Czechoslovakia | 1,848 | 5,035 | 5,517 |
| Finland | 645 | 966 | 945 |
| French Guiana | 142 | 148 | 217 |
| French Polynesia | 4,804 | 5,961 | 6,086 |
| Germany, Democratic Republic of | 2,140 | 3,980 | 5,744 |
| Greece | 20,422 | 38,116 | 21,658 |
| Guadeloupe | 304 | 242 | 138 |
| Hungary | 283 | 916 | 415 |
| Indonesia | 2,511 | 4,297 | 5,541 |
| Iran | 2,047 | 5,740 | 17,018 |
| Iraq | 162 | 244 | 1,759 |
| Israel | 35 | 251 | 111 |
| Japan | 130,651 | 230,868 | 248,798 |
| Korea, Republic of | 2,334 | 5,585 | 9,609 |
| Laos | 9 | 199 | 244 |
| Lebanon | 147 | 223 | 424 |
| Martinique | 225 | 270 | 294 |
| Morocco | 152 | 98 | 31 |
| Mozambique | 1,814 | 1,764 | 1,084 |
| Nepal | 88 | 76 | 248 |
| Netherlands Antilles | 1,262 | 965 | 1,402 |
| New Caledonia | 4,620 | 4,177 | 3,924 |
| Oman | 91 | 35 | 174 |
| Peru | 21,155 | 16,269 | 13,715 |
| Poland | 6,025 | 16,853 | 21,302 |
| Romania | 190 | 568 | 278 |
| Saudi Arabia | 210 | 424 | 832 |
| Spain | 3,173 | 5,975 | 5,705 |
| Sudan | 64 | 7 | 3 |
| Syria | 401 | 695 | 934 |
| Thailand | 7,763 | 9,661 | 9,233 |
| Tunisia | 128 | 26 | - |
| Turkey | 521 | 101 | 147 |
| U.S.S.R. | 25,356 | 30,192 | 38,146 |
| Uruguay | 23 | 108 | 248 |
| Vietnam, Republic of | 36 | 1,187 | 2,053 |
| Wallis and Futuna Islands | 216 | 268 | 190 |
| Yugoslavia | 3,041 | 12,159 | 11,984 |
| Others | 3,240 | 1,568 | 1,990 |
| Totals, other countries | 267,689 | 437,977 | 491,414 |
| Totals, all countries | 1,358,071 | 1,764,010 | 1,757,405 |
| Ships' stores | 12,053 | 14,563 | 15,305 |
| Passengers | 4,832 | 5,299 | 9,387 |
| Destination optional | - | 4,137 | 6,558 |
| Grand totals | 1,374,956 | 1,788,009 | 1,788,655 |
The table which follows shows for each of the last 7 June years, the percentage of total exports (excluding gold, current coin, passengers' purchases, and ships' stores) taken by each of the principal countries trading with New Zealand.
| Country | June Year 1968 | June Year 1969 | June Year 1970 | June Year 1971 | June Year 1972 | June Year 1973* | June Year 1974* |
|---|---|---|---|---|---|---|---|
*Provisional †Iceland included in EFTA from 1970. | |||||||
| STERLING AREA— | percent | ||||||
| Australia | 7.11 | 7.70 | 8.12 | 8.60 | 8.31 | 7.38 | 9.78 |
| Fiji | 0.71 | 0.78 | 0.82 | 1.11 | 1.07 | 1.00 | 1.15 |
| Hong Kong | 0.31 | 0.38 | 0.43 | 0.60 | 0.66 | 0.88 | 0.98 |
| Jamaica | 0.64 | 0.40 | 0.41 | 0.68 | 0.86 | 0.55 | 0.61 |
| Malaysia | 0.83 | 0.65 | 0.68 | 0.71 | 1.16 | 0.91 | 1.05 |
| Singapore | 0.73 | 0.86 | 0.81 | 0.85 | 0.99 | 0.76 | 0.82 |
| Trinidad and Tobago | 0.44 | 0.39 | 0.41 | 0.49 | 0.57 | 0.36 | 0.37 |
| United Kingdom | 43.31 | 39.16 | 35.90 | 34.41 | 30.89 | 27.16 | 20.81 |
| Other | 1.81 | 1.97 | 2.63 | 3.17 | 4.09 | 2.80 | 2.70 |
| Totals, sterling countries | 55.89 | 52.29 | 50.24 | 50.66 | 48.61 | 41.80 | 38.27 |
| EFTA— | |||||||
| Austria | 0.02 | 0.07 | 0.03 | 0.02 | 0.03 | 0.03 | |
| Norway | 0.10 | 0.14 | 0.11 | 0.11 | 0.11 | 0.11 | 0.06 |
| Portugal | 0.23 | 0.15 | 0.17 | 0.16 | 0.13 | 0.23 | 0.23 |
| Sweden | 0.24 | 0.26 | 0.24 | 0.19 | 0.20 | 0.18 | 0.15 |
| Switzerland | 0.13 | 0.11 | 0.20 | 0.13 | 0.13 | 0.10 | 0.16 |
| Iceland† | † | † | - | - | - | - | - |
| Totals, EFTA countries | 0.70 | 0.67 | 0.79 | 0.62 | 0.59 | 0.65 | 0.62 |
| EEC (excluding U.K. and Ireland, Republic of)— | |||||||
| Belgium and Luxembourg | 1.41 | 1.97 | 1.98 | 2.28 | 2.32 | 2.40 | 2.04 |
| Denmark | 0.21 | 0.19 | 0.23 | 0.18 | 0.12 | 0.14 | 0.10 |
| France | 3.26 | 3.76 | 2.67 | 2.47 | 3.08 | 3.49 | 2.15 |
| Germany, Federal Republic | 2.59 | 2.94 | 2.76 | 2.71 | 2.55 | 2.91 | 2.34 |
| Italy | 1.91 | 2.21 | 2.21 | 1.72 | 1.36 | 1.80 | 1.53 |
| Netherlands | 1.35 | 1.39 | 1.50 | 1.52 | 1.48 | 2.24 | 2.67 |
| Totals, EEC countries | 10.73 | 12.47 | 1.1.34 | 10.89 | 10.91 | 12.99 | 10.82 |
| Country | June Year 1968 | June Year 1969 | June Year 1970 | June Year 1971 | June Year 1972 | June Year 1973* | June Year 1974* |
|---|---|---|---|---|---|---|---|
*Provisional. †Iceland included in EFTA from 1970. ‡Does not include statistics for that part of China known as Taiwan. | |||||||
| DOLLAR AREA— | percent | ||||||
| Canada | 1.30 | 1.68 | 4.22 | 2.88 | 2.96 | 2.40 | 2.98 |
| Philippines | 0.74 | 0.72 | 0.61 | 0.82 | 1.04 | 1.07 | 1.47 |
| U.S.A. | 17.01 | 17.37 | 15.48 | 17.25 | 15.30 | 15.57 | 16.81 |
| Other | 0.51 | 0.63 | 0.87 | 0.83 | 0.88 | 0.69 | 1.06 |
| Totals, dollar countries | 19.56 | 20.40 | 21.18 | 2i.78 | 20.18 | 19.73 | 22.32 |
| OTHER— | |||||||
| China‡ | 0.70 | 0.38 | 0.38 | 0.15 | 0.13 | 0.34 | 0.96 |
| Greece | 0.48 | 0.63 | 0.79 | 1.10 | 1.50 | 2.16 | 1.23 |
| Japan | 8.39 | 9.00 | 9.82 | 9.19 | 9.62 | 13.09 | 14.16 |
| Peru | 0.49 | 0.24 | 0.38 | 0.62 | 1.56 | 0.92 | 1.21 |
| Spain | 0.31 | 0.46 | 0.42 | 0.18 | 0.23 | 0.34 | 0.32 |
| U.S.S.R. | 0.72 | 1.19 | 1.57 | 1.60 | 1.87 | 1.71 | 2.17 |
| Others | 2.02 | 2.27 | 3.04 | 3.16 | 4.80 | 6.27 | 7.90 |
| Totals, other countries | 13.12 | 14.18 | 16.44 | 16.05 | 19.71 | 24.83 | 27.96 |
| Totals, all countries | 100.00 | 100.00 | 100.00 | 100.00 | 100.00 | 100.00 | 100.00 |
The principal destinations of New Zealand's exports of merchandise (including re-exports) are given in the table below.
| June Year | United Kingdom | Canada | Australia | France and Monaco | Germany Fed. Rep. of (West) | United States | Other Countries* | Total Merchandise Exports |
|---|---|---|---|---|---|---|---|---|
*Including ships' stores, passengers' duty free purchases, and destination optional. †Provisional. | ||||||||
| $(million) | ||||||||
| 1965 | 374.8 | 10.6 | 34.6 | 33.9 | 29.8 | 93.6 | 165.2 | 742.2 |
| 1966 | 339.0 | 9.6 | 36.4 | 40.4 | 26.2 | 107.5 | 208.2 | 767.3 |
| 1967 | 314.8 | 10.6 | 35.2 | 24.8 | 20.5 | 114.2 | 207.1 | 727.2 |
| 1968 | 352.0 | 10.5 | 57.8 | 26.5 | 21.0 | 138.2 | 214.4 | 820.5 |
| 1969 | 382.7 | 16.4 | 75.3 | 36.8 | 28.7 | 169.8 | 279.4 | 989.1 |
| 1970 | 386.0 | 45.3 | 87.3 | 28.7 | 29.7 | 166.5 | 343.1 | 1,086.7 |
| 1971 | 384.7 | 32.2 | 96.1 | 27.6 | 30.3 | 192.8 | 368.0 | 1,131.7 |
| 1972 | 419.6 | 40.1 | 112.8 | 41.8 | 34.6 | 207.8 | 518.1 | 1,375.0 |
| 1973† | 479.1 | 42.4 | 130.3 | 61.6 | 51.3 | 274.7 | 748.7 | 1,787.0 |
| 1974† | 365.8 | 52.4 | 171.8 | 37.8 | 41.0 | 295.3 | 824.4 | 1,787.6 |
The statistics quoted in the foregoing table indicate the destination of New Zealand exports as recorded on the Customs documents. In some instances the ultimate destination of exports is not known at the time of export, such goods being entered as exported to the country to which they are being shipped. This applies more particularly to wool, considerable quantities of which are shipped to the United Kingdom, and in normal times subsequently re-exported to the Continent. It should be observed, however, that in all instances where the final destination is known at the time of export, the exports are credited to that destination in the New Zealand trade statistics.
A further point of some importance is the fact that an appreciable quantity of wool is exported on an “optional” basis—United Kingdom, option Continent. In these cases, however, subsequent information is received as to the actual destination of the goods, and the entries are amended.
It will be realised, therefore, that the actual final destinations of New Zealand exports may vary appreciably from the classification shown in the table. For these reasons it is probable that exports to Continental countries are normally somewhat higher than the figures indicate; conversely, exports to the United Kingdom for retention in that country are lower than the totals quoted in the table.
In the following table figures are given for the value of New Zealand's export trade to European countries. This table shows the importance of wool as the chief commodity in New Zealand's trade with Europe.
| Country | June Year | |||||
|---|---|---|---|---|---|---|
| 1969 | 1970 | 1971 | 1972 | 1973* | 1974* | |
| *Provisional. | ||||||
| $(000) | ||||||
| Austria | 179 | 779 | 316 | 250 | 574 | 448 |
| Belgium and Luxembourg | 19,304 | 21,292 | 25,529 | 31,548 | 42,423 | 35,789 |
| Bulgaria | 50 | 264 | 797 | 355 | 304 | 877 |
| Czechoslovakia | 1,014 | 2,776 | 1,636 | 1,848 | 3,035 | 5,517 |
| Denmark | 1,825 | 2,454 | 1,975 | 1,648 | 2,522 | 1,818 |
| Finland | 784 | 1,003 | 873 | 645 | 966 | 945 |
| France and Monaco | 36,781 | 28,682 | 27,648 | 41,824 | 61,588 | 37,802 |
| Germany, Federal Republic of (West) | 28,734 | 29,682 | 30,297 | 34,645 | 51,252 | 41,046 |
| Germany, East | 1,093 | 667 | 1,573 | 2,140 | 3,980 | 5,744 |
| Greece | 6,191 | 8,468 | 12,290 | 20,422 | 38,116 | 21,658 |
| Hungary | 194 | 859 | 150 | 283 | 916 | 415 |
| Italy | 21,591 | 23,724 | 19,228 | 18,460 | 31,717 | 26,835 |
| Netherlands | 13,611 | 16,113 | 17,014 | 20,076 | 39,557 | 46,848 |
| Norway | 1,326 | 1,198 | 1,180 | 1,492 | 1,944 | 1,016 |
| Poland | 2,103 | 3,129 | 3,274 | 6,025 | 16,853 | 13,715 |
| Portugal | 1,499 | 1,798 | 1,832 | 1,781 | 4,077 | 4,005 |
| Spain | 4,538 | 4,475 | 1,962 | 3,173 | 5,975 | 5,705 |
| Sweden | 2,493 | 2,592 | 2,108 | 2,654 | 3,154 | 2,645 |
| Switzerland | 1,035 | 2,150 | 1,459 | 1,824 | 1,786 | 2,813 |
| Turkey | 25 | 53 | 48 | 521 | 101 | 147 |
| U.S.S.R. | 11,669 | 16,934 | 17,925 | 25,356 | 30,192 | 38,146 |
| Yugoslavia | 1,679 | 3,720 | 2,140 | 3,041 | 12,159 | 11,984 |
| Totals | 157,717 | 172,812 | 171,255 | 220,011 | 353,191 | 305,918 |
| percent | ||||||
| Percentage of total New Zealand exports taken by European countries | 16.14 | 16.07 | 15.32 | 16.20 | 20.02 | 17.41 |
| $(000) | ||||||
| Value of wool exported to European countries | 106,928 | 102,056 | 99,515 | 127,747 | 226,635 | 203,437 |
| percent | ||||||
| Percentage of wool exports to total exports to European countries (value basis) | 67.80 | 59.06 | 58.11 | 58.06 | 64.17 | 66.53 |
| Percentage of total New Zealand wool exports taken by European countries (value basis) | 50.35 | 49.97 | 52.98 | 55.87 | 53.40 | 55.94 |
DESTINATION OF MAIN EXPORTS—The table which follows shows quantities and values of the principal exports of New Zealand produce sent to various destinations during the latest June years.
| Country to Which Exported | June Year 1970 | June Year 1971 | June Year 1972 | |||
|---|---|---|---|---|---|---|
| Quantity | Value | Quantity | Value | Quantity | Value | |
| †Excludes that part of China known as Taiwan. | ||||||
| Wool (Greasy, Slipe, and Scoured) | ||||||
| tonnes | $(000) | tonnes | $(000) | tonnes | $(000) | |
| Australia | 4,581 | 3,748 | 7,003 | 5,296 | 7,879 | 6,394 |
| Bulgaria | 449 | 263 | 1,351 | 757 | 261 | 197 |
| Belgium and Luxembourg | 30,012 | 17,214 | 33,665 | 19,173 | 34,566 | 23,859 |
| Canada | 2,502 | 1,970 | 1,675 | 1,341 | 1,818 | 1,540 |
| China† | 3,892 | 2,414 | 1,279 | 768 | 1,767 | 1,276 |
| Czechoslovakia | 4,810 | 2,676 | 3,116 | 1,600 | 2,754 | 1,756 |
| Denmark | 1,854 | 1,637 | 1,257 | 990 | 1,043 | 889 |
| Finland | 465 | 399 | 541 | 435 | 302 | 242 |
| France and Monaco | 30,135 | 18,126 | 26,399 | 15,376 | 29,670 | 20,416 |
| Germany, East | 1,065 | 667 | 2,494 | 1,573 | 3,119 | 2,139 |
| Germany, Federal Republic of (West) | 20,552 | 15,441 | 20,789 | 15,181 | 22,112 | 17,630 |
| Greece | 4,624 | 4,147 | 7,962 | 6,889 | 10,137 | 9,940 |
| Ireland, Republic of | 1,905 | 1,322 | 2,626 | 1,835 | 2,974 | 2,133 |
| Italy | 18,452 | 13,032 | 12,638 | 8,233 | 11,689 | 8,415 |
| Japan | 31,562 | 24,346 | 27,246 | 19,351 | 22,466 | 17,309 |
| Mexico | 496 | 297 | 903 | 531 | 763 | 518 |
| Netherlands | 7,343 | 4,491 | 13,002 | 7,280 | 14,271 | 9,265 |
| Norway | 865 | 809 | 805 | 669 | 650 | 565 |
| Poland | 4,323 | 2,777 | 5,110 | 3,241 | 7,185 | 5,075 |
| Portugal | 2,851 | 1,716 | 3,025 | 1,723 | 2,261 | 1,561 |
| South Africa | 1,125 | 985 | 1,163 | 963 | 1,271 | 1,093 |
| Spain | 2,203 | 1,413 | 1,015 | 585 | 1,659 | 1,177 |
| Sweden | 1,256 | 1,102 | 884 | 737 | 813 | 775 |
| U.S.S.R. | 19,454 | 12,837 | 20,747 | 13,317 | 27,453 | 21,232 |
| United Kingdom | 62,769 | 41,140 | 56,404 | 34,027 | 65,353 | 45,246 |
| United States | 35,269 | 22,916 | 32,931 | 20,621 | 30,178 | 21,550 |
| Yugoslavia | 4,004 | 2,957 | 2,367 | 1,635 | 3,043 | 2,264 |
| Other countries | 4,233 | 3,380 | 5,096 | 3,722 | 4,912 | 4,182 |
| Totals | 303,050 | 204,222 | 293,494 | 187,850 | 312,370 | 228,639 |
| Frozen and Chilled Beef and Veal | ||||||
| tonnes | $(000) | tonnes | $(000) | tonnes | $(000) | |
| American Samoa | 286 | 242 | 303 | 293 | 334 | 362 |
| Bahamas | 46 | 37 | 67 | 53 | 94 | 102 |
| Barbados | 1,449 | 902 | 1,403 | 950 | 1,750 | 1,493 |
| Belgium and Luxembourg | 38 | 23 | 685 | 599 | 460 | 402 |
| Bermuda | 886 | 889 | 1,035 | 1,162 | 955 | 1,291 |
| Canada | 46,778 | 35,379 | 27,847 | 22,647 | 28,319 | 26,767 |
| Cyprus | 381 | 289 | 490 | 466 | 658 | 727 |
| Fiji | 38 | 72 | 51 | 91 | 85 | 137 |
| France and Monaco | 59 | 65 | 156 | 186 | 233 | 284 |
| French Polynesia | 1,407 | 1,703 | 1,521 | 1,949 | 1,480 | 2,156 |
| Germany, Federal Republic of (West) | 23 | 17 | 28 | 31 | 62 | 91 |
| Greece | 44 | 26 | 56 | 39 | - | - |
| Guam | 1,210 | 1,116 | 1,173 | 1,168 | 1,645 | 1,954 |
| tonnes | $(000) | tonnes | $(000) | tonnes | $(000) | |
| Hong Kong | 688 | 812 | 1,040 | 1,322 | 1,073 | 1,718 |
| Italy | - | - | 88 | 70 | 31 | 20 |
| Jamaica | 1,513 | 997 | 1,980 | 1,393 | 2,687 | 2,197 |
| Japan | 3,389 | 2,536 | 3,349 | 2,603 | 4,054 | 3,492 |
| Korea | 844 | 601 | 453 | 315 | 10 | 12 |
| Malaysia | 382 | 388 | 176 | 211 | 109 | 170 |
| Netherlands | 307 | 302 | 814 | 892 | 798 | 861 |
| Netherlands Antilles | 325 | 276 | 308 | 308 | 685 | 804 |
| New Caledonia | 225 | 231 | 7 | 5 | 11 | 12 |
| Philippines | 318 | 375 | 510 | 654 | 611 | 773 |
| Puerto Rico | 826 | 762 | 991 | 1,026 | 693 | 707 |
| Ryukyu Islands, etc. | 619 | 765 | 573 | 690 | 1,176 | 1,541 |
| Singapore | 2,398 | 2,267 | 2,067 | 2,309 | 1,555 | 2,193 |
| Sweden | 111 | 190 | 86 | 163 | 316 | 628 |
| Switzerland | 1,196 | 1,302 | 772 | 834 | 654 | 711 |
| Tonga | 48 | 23 | 35 | 18 | 85 | 41 |
| Trinidad and Tobago | 2,097 | 1,616 | 2,327 | 1,923 | 2,549 | 2,490 |
| United Kingdom | 14,229 | 10,237 | 17,143 | 15,569 | 11,627 | 11,959 |
| United States | 89,314 | 85,721 | 108,568 | 106,987 | 114,871 | 116,767 |
| Other countries | 6,232 | 4,084 | 4,755 | 3,488 | 5,723 | 4,310 |
| Totals | 177,704 | 154,244 | 180,858 | 170,414 | 185,390 | 187,173 |
| Frozen Lamb | ||||||
| tonnes | $(000) | tonnes | $(000) | tonnes | $(000) | |
| Australia | 135 | 66 | 3 | 2 | 5 | 3 |
| Barbados | 381 | 159 | 424 | 205 | 485 | 226 |
| Belgium and Luxembourg | 643 | 298 | 553 | 278 | 894 | 425 |
| Bermuda | 336 | 235 | 372 | 289 | 285 | 219 |
| Canada | 1,601 | 1,003 | 2,313 | 1,384 | 3,674 | 2,297 |
| Cyprus | 1,154 | 513 | 823 | 364 | 1,854 | 830 |
| Fiji | 876 | 309 | 899 | 327 | 852 | 316 |
| France and Monaco | 134 | 103 | 129 | 87 | 1,106 | 720 |
| French Polynesia | 295 | 208 | 295 | 221 | 299 | 228 |
| Germany, Federal Republic of (West) | 1,814 | 853 | 3,072 | 1,404 | 3,729 | 1,707 |
| Greece | 9,043 | 3,807 | 10,462 | 4,608 | 21,387 | 9,653 |
| Hong Kong | 463 | 203 | 523 | 249 | 654 | 329 |
| Italy | 852 | 498 | 1,282 | 714 | 1,514 | 828 |
| Jamaica | 174 | 111 | 253 | 193 | 299 | 214 |
| Japan | 5,702 | 2,731 | 3,826 | 2,022 | 4,995 | 2,547 |
| Malaysia | 493 | 212 | 232 | 92 | 333 | 149 |
| Netherlands | 1,183 | 533 | 2,034 | 968 | 2,383 | 1,145 |
| Singapore | 884 | 379 | 754 | 351 | 496 | 230 |
| Switzerland | 618 | 308 | 423 | 228 | 1,384 | 737 |
| Tonga | 710 | 121 | 838 | 154 | 936 | 182 |
| Trinidad and Tobago | 383 | 200 | 299 | 167 | 551 | 317 |
| United Kingdom | 275,427 | 132,753 | 287,357 | 139,853 | 281,724 | 122,992 |
| tonnes | $(000) | tonnes | $(000) | tonnes | $(000) | |
| United States | 11,614 | 6,839 | 8,443 | 5,444 | 7,395 | 4,857 |
| Western Samoa | 811 | 140 | 1,019 | 174 | 1,059 | 225 |
| Zambia | 347 | 137 | 174 | 73 | 384 | 167 |
| Other countries | 3,285 | 1,561 | 2,268 | 1,332 | 3,547 | 1,885 |
| Totals | 319,358 | 154,280 | 329,567 | 161,182 | 342,224 | 153,430 |
| Frozen Mutton | ||||||
| tonnes | $(000) | tonnes | $(000) | tonnes | $(000) | |
| Australia | - | - | - | - | ||
| Barbados | 108 | 22 | 131 | 32 | 128 | 42 |
| Belgium and Luxembourg | 165 | 44 | 226 | 77 | 247 | 107 |
| Canada | 671 | 293 | 1,504 | 877 | 333 | 168 |
| Cyprus | 207 | 65 | 456 | 170 | 967 | 401 |
| Fiji | 474 | 129 | 349 | 98 | 415 | 120 |
| France and Monaco | 170 | 44 | 152 | 43 | 342 | 152 |
| French Polynesia | 24 | 17 | 13 | 7 | 43 | 22 |
| Germany, Federal Republic of (West) | 446 | 103 | 686 | 161 | 383 | 101 |
| Greece | 187 | 38 | 936 | 195 | 1,562 | 341 |
| Jamaica | 1,779 | 463 | 2,056 | 604 | 3,216 | 864 |
| Japan | 83,392 | 19,621 | 51,523 | 13,924 | 65,744 | 16,424 |
| Netherlands | 342 | 88 | 507 | 138 | 429 | 166 |
| Papua and New Guinea | 369 | 97 | 183 | 49 | 224 | 61 |
| Peru | - | - | - | - | 3,785 | 994 |
| Singapore | 191 | 45 | 87 | 20 | 132 | 43 |
| Tonga | 98 | 18 | 42 | 8 | 93 | 18 |
| Trinidad and Tobago | 227 | 63 | 402 | 136 | 434 | 162 |
| United Kingdom | 19,952 | 4,638 | 22,841 | 5,589 | 14,068 | 1,323 |
| United States | 20 | 12 | 43 | 31 | 112 | 48 |
| Western Samoa | 84 | 16 | 67 | 14 | 78 | 18 |
| Other countries | 11,081 | 2,776 | 13,541 | 3,117 | 11,953 | 3,088 |
| Totals | 119,987 | 28,593 | 95,745 | 25,291 | 104,689 | 24,661 |
| Frozen Pork | ||||||
| tonnes | $(000) | tonnes | $(000) | tonnes | $(000) | |
| Belgium and Luxembourg | 33 | 43 | 9 | 12 | 9 | 15 |
| Fiji | 26 | 22 | 74 | 57 | 102 | 86 |
| France and Monaco | 107 | 137 | 219 | 272 | 379 | 543 |
| French Polynesia | 55 | 53 | 52 | 53 | 37 | 37 |
| Germany, Federal Republic of (West) | 157 | 103 | 157 | 117 | 126 | 108 |
| Guam | - | - | - | - | 48 | 40 |
| Japan | 152 | 126 | 18 | 17 | 11 | 17 |
| Nauru | 7 | 5 | - | - | - | - |
| Netherlands | 9 | 6 | 21 | 17 | 21 | 17 |
| New Caledonia | 55 | 45 | 22 | 18 | 13 | 12 |
| Singapore | 18 | 11 | 14 | 10 | 17 | 13 |
| United Kingdom | - | - | 7 | 2 | 46 | 39 |
| Other countries | 62 | 47 | 58 | 44 | 95 | 83 |
| Totals | 683 | 598 | 651 | 619 | 903 | 1,011 |
| Other Frozen Meat | ||||||
| tonnes | $(000) | tonnes | $(000) | tonnes | $(000) | |
| Australia | 30 | 23 | 28 | 14 | 18 | 14 |
| Canada | 445 | 258 | 363 | 245 | 179 | 174 |
| Cyprus | 71 | 44 | 51 | 34 | 136 | 68 |
| France and Monaco | 2,916 | 2,309 | 2,599 | 2,020 | 3,111 | 2,293 |
| French Polynesia | 257 | 214 | 176 | 139 | 150 | 130 |
| Germany, Federal Republic of (West) | 2,273 | 2,908 | 2,584 | 3,194 | 3,625 | 4,525 |
| Greece | 142 | 26 | 527 | 178 | 382 | 112 |
| Hong Kong | 271 | 86 | 360 | 128 | 162 | 53 |
| Italy | 168 | 98 | 286 | 195 | 259 | 211 |
| Jamaica | 1,199 | 508 | 960 | 468 | 1,312 | 575 |
| Japan | 935 | 559 | 1,079 | 680 | 1,431 | 812 |
| Netherlands | 432 | 552 | 528 | 618 | 531 | 542 |
| Netherlands Antilles | 192 | 86 | 229 | 125 | 244 | 122 |
| Philippines | 230 | 37 | 133 | 21 | 325 | 51 |
| Singapore | 262 | 128 | 188 | 96 | 8 | 89 |
| Sweden | 309 | 429 | 362 | 435 | 435 | 448 |
| Trinidad and Tobago | 310 | 146 | 156 | 84 | 668 | 311 |
| United Kingdom | 28,635 | 16,778 | 28,732 | 18,057 | 25,957 | 14,779 |
| United States | 514 | 536 | 565 | 639 | 615 | 617 |
| Other countries | 1,213 | 814 | 1,049 | 858 | 1,408 | 1,068 |
| Totals | 40,803 | 26,540 | 40,965 | 28,228 | 41,129 | 26,995 |
| Canned and Other Preserved Meats | ||||||
| tonnes | $(000) | tonnes | $(000) | tonnes | $(000) | |
| American Samoa | 496 | 519 | 85 | 131 | 42 | 76 |
| Fiji | 289 | 262 | 289 | 282 | 257 | 325 |
| French Polynesia | 190 | 218 | 326 | 400 | 269 | 461 |
| Gilbert and Ellice Islands | 103 | 105 | 98 | 109 | 96 | 135 |
| Italy | 344 | 68 | 289 | 63 | 17 | 4 |
| Jamaica | 183 | 123 | 136 | 97 | 43 | 19 |
| Japan | 167 | 45 | 35 | 16 | 448 | 238 |
| Nauru | 118 | 130 | 120 | 146 | 144 | 210 |
| Papua and New Guinea | 128 | 102 | 74 | 55 | 23 | 26 |
| Philippines | 28 | 12 | 112 | 49 | 41 | 6 |
| Tonga | 199 | 168 | 185 | 176 | 102 | 128 |
| United Kingdom | 1,390 | 1,189 | 1,324 | 1,483 | 1,230 | 1,763 |
| Other countries | 919 | 539 | 1,073 | 612 | 744 | 699 |
| Totals | 4,553 | 3,481 | 4,145 | 3,619 | 3,457 | 4,091 |
| Butter | ||||||
| tonnes | $(000) | tonnes | $(000) | tonnes | $(000) | |
| American Samoa | 106 | 68 | 108 | 70 | 117 | 100 |
| Bahamas | 253 | 146 | 366 | 215 | 632 | 547 |
| Barbados | 255 | 143 | 258 | 154 | 341 | 303 |
| Bermuda | 289 | 131 | 313 | 159 | 337 | 285 |
| Canada | 17 | 11 | 3 | 3 | ||
| Chile | - | - | - | - | 6,607 | 6,267 |
| Cyprus | 36 | 20 | 80 | 49 | 193 | 170 |
| Fiji | 956 | 551 | 756 | 506 | 920 | 818 |
| French Polynesia | 209 | 139 | 208 | 138 | 251 | 236 |
| Germany, Federal Republic of (West) | 340 | 190 | 287 | 176 | 172 | 188 |
| Ghana | 31 | 18 | 5 | 3 | 585 | 566 |
| Guyana | 17 | 7 | 12 | 6 | - | - |
| Hong Kong | 400 | 208 | 390 | 213 | 467 | 401 |
| India | 106 | 69 | 1 | 1 | 2 | 2 |
| Jamaica | 2,102 | 1,300 | 3,283 | 2,132 | 4,371 | 3,850 |
| Japan | 44 | 23 | 113 | 58 | 1,655 | 1,871 |
| Malaysia | 265 | 121 | 677 | 462 | 3,923 | 3,681 |
| Mexico | 1,925 | 820 | 2,457 | 1,111 | 1,350 | 1,392 |
| Netherlands Antilles | 177 | 105 | 234 | 142 | 302 | 266 |
| Nigeria | 6 | 3 | - | - | 6 | 6 |
| Panama Canal Zone | 152 | 121 | 122 | 103 | 145 | 150 |
| Panama Republic | 824 | 670 | 182 | 140 | 10 | 10 |
| Peru | 5,146 | 2,256 | 8,201 | 3,644 | 9,863 | 9,984 |
| Philippines | 1,353 | 685 | 1,377 | 665 | 2,074 | 1,980 |
| Singapore | 1,865 | 757 | 1,887 | 1,002 | 2,923 | 2,550 |
| South Africa | - | - | 7,874 | 4,876 | 8,965 | 7,272 |
| Sri Lanka (Ceylon) | 360 | 175 | 457 | 218 | 431 | 320 |
| Thailand | 1,168 | 557 | 127 | 421 | 1,759 | 1,715 |
| Tonga | 132 | 86 | 124 | 81 | 121 | 102 |
| Trinidad and Tobago | 1,314 | 740 | 1,245 | 765 | 1,414 | 1,211 |
| United Kingdom | 176,378 | 98,662 | 160,031 | 94,711 | 134,304 | 134,215 |
| United States | 795 | 389 | 847 | 645 | 185 | 217 |
| Western Samoa | 149 | 96 | 185 | 121 | 174 | 148 |
| Other countries | 866 | 491 | 641 | 929 | 3,256 | 3,094 |
| Totals | 198,021 | 109,747 | 194,464 | 113,926 | 187,860 | 183,922 |
| Cheese | ||||||
| tonnes | $(000) | tonnes | $(000) | tonnes | $(000) | |
| Ass. States in Eastern Caribbean | 179 | 109 | 214 | 131 | 212 | 168 |
| Australia | 1,153 | 805 | 1,156 | 868 | 1,211 | 1,047 |
| Barbados | 565 | 248 | 734 | 343 | 757 | 429 |
| Belgium and Luxembourg | 224 | 108 | - | - | - | - |
| Bermuda | 114 | 48 | 151 | 67 | 153 | 85 |
| Cyprus | 76 | 37 | 114 | 56 | 151 | 96 |
| Fiji | 53 | 25 | 68 | 32 | 68 | 42 |
| French Polynesia | 107 | 71 | 104 | 72 | 114 | 99 |
| Germany, Federal Republic of (West) | 636 | 295 | 346 | 172 | 196 | 157 |
| Guyana | - | - | - | - | - | - |
| Hong Kong | 52 | 26 | 84 | 43 | 107 | 63 |
| Italy | - | - | ||||
| Jamaica | 1,449 | 521 | 3,401 | 1,297 | 2,727 | 1,430 |
| Japan | 7,027 | 3,007 | 6,816 | 2,870 | 8,308 | 4,188 |
| Malaysia | 24 | 12 | 14 | 7 | 11 | 6 |
| Netherlands | 37 | 17 | 127 | 59 | 194 | 140 |
| Philippines | 55 | 16 | 708 | 332 | 1,089 | 637 |
| Singapore | 252 | 113 | 187 | 89 | 147 | 83 |
| South Africa | 4 | 3 | 1,877 | 1,046 | 3,529 | 2,733 |
| Trinidad and Tobago | 2,152 | 760 | 2,185 | 807 | 2,415 | 1,362 |
| United Kingdom | 69,099 | 33,005 | 67,959 | 34,782 | 60,708 | 48,604 |
| United States | 6,988 | 4,914 | 6,146 | 4,804 | 5,965 | 4,663 |
| Other countries | 336 | 202 | 294 | 172 | 403 | 289 |
| Totals | 90,582 | 44,342 | 92,681 | 48,050 | 88,464 | 66,324 |
| Milk (Dried, Condensed, etc.) | ||||||
| Barbados | 499 | 75 | 548 | 103 | 464 | 147 |
| Canada | 1,069 | 277 | 956 | 242 | 982 | 351 |
| Chile | 998 | 112 | 3,993 | 957 | 15,804 | 6,695 |
| China (Taiwan) | 4,330 | 669 | 3,709 | 798 | 3,002 | 1,473 |
| Denmark | 87 | 9 | 406 | 72 | - | - |
| Fiji | 968 | 286 | 973 | 321 | 1,014 | 458 |
| French Polynesia | 233 | 69 | 214 | 73 | 174 | 68 |
| Hong Kong | 476 | 75 | 688 | 142 | 669 | 303 |
| India | 5,991 | 753 | 8,790 | 1,643 | 13,437 | 5,587 |
| Indonesia | 1,422 | 235 | 2,625 | 629 | 3,283 | 1,211 |
| Italy | - | - | 2,000 | 446 | - | - |
| Jamaica | 1,905 | 280 | 6,470 | 1,173 | 7,195 | 2,239 |
| Japan | 34,276 | 4,350 | 17,631 | 3,287 | 18,690 | 7,577 |
| Kuwait | 743 | 150 | 315 | 77 | 506 | 248 |
| Malaysia | 25,784 | 4,638 | 22,670 | 4,924 | 25,313 | 9,586 |
| Mauritius | 1,296 | 300 | 1,186 | 343 | 719 | 401 |
| Mozambique | 1,136 | 177 | 1,107 | 228 | 2,010 | 652 |
| Pakistan | 8,373 | 1,195 | 1,395 | 258 | 1,431 | 678 |
| Peru | 12,014 | 1,854 | 16,914 | 3,233 | 27,240 | 10,158 |
| Philippines | 19,418 | 2,932 | 22,916 | 4,590 | 17,318 | 6,583 |
| Ryukyu Islands, etc. | 1,482 | 163 | 127 | 15 | 244 | 98 |
| Singapore | 9,336 | 1,551 | 7,772 | 1,482 | 8,516 | 3,075 |
| South Africa | 30 | 5 | 512 | 104 | 916 | 436 |
| South Vietnam | 656 | 116 | 1 | 30 | 17 | |
| Sri Lanka (Ceylon) | 4,675 | 1,444 | 3,966 | 1,274 | 6,112 | 3,143 |
| Thailand | 11,069 | 1,763 | 15,125 | 2,976 | 14,136 | 4,723 |
| Trinidad and Tobago | 1,964 | 655 | 4,890 | 1,458 | 4,174 | 1,747 |
| United Kingdom | 29,957 | 6,149 | 7,508 | 1,938 | 4,459 | 2,158 |
| Western Samoa | 253 | 82 | 265 | 91 | 305 | 147 |
| Venezuela | 1,015 | 149 | 303 | 51 | 304 | 146 |
| Other countries | 2,895 | 578 | 4,477 | 1,124 | 13,479 | 6,389 |
| Totals | 184,351 | 31,092 | 160,451 | 34,052 | 191,925 | 76,494 |
| Casein | ||||||
| tonnes | $(000) | tonnes | $(000) | tonnes | $(000) | |
| Canada | 498 | 193 | 690 | 300 | 571 | 569 |
| France and Monaco | 3,508 | 1,529 | 3,525 | 1,614 | 1,111 | 547 |
| Germany, Federal Republic of (West) | 9,845 | 4,339 | 11,201 | 4,860 | 8,371 | 3,866 |
| India | - | - | 8 | 4 | 2 | 2 |
| Italy | 4,014 | 1,778 | 3,474 | 1,598 | 777 | 378 |
| Japan | 12,791 | 5,113 | 16,703 | 7,122 | 11,355 | 6,276 |
| Netherlands | 2,663 | 1,161 | 2,932 | 1,316 | 1,595 | 736 |
| Spain | 1,094 | 473 | 1,059 | 467 | 487 | 216 |
| Sweden | 900 | 372 | 1,015 | 452 | 279 | 152 |
| United Kingdom | 5,578 | 2,321 | 5,790 | 2,624 | 2,391 | 1,529 |
| United States | 19,225 | 7,664 | 20,193 | 8,560 | 14,225 | 10,601 |
| Other countries | 1,874 | 809 | 2,944 | 1,285 | 948 | 511 |
| Totals | 61,989 | 25,755 | 69,534 | 30,202 | 42,113 | 25,384 |
| Burma | - | - | 76 | 9 | - | - |
| China† | - | - | 87 | 16 | - | - |
| Fiji | 2 | 15 | 3 | 46 | 7 | |
| France | - | - | - | - | 143 | 19 |
| Hong Kong | 123 | 19 | 141 | 27 | 61 | 12 |
| India | 129 | 16 | - | - | - | - |
| Japan | 536 | 69 | 3 | 1 | 725 | 96 |
| Kenya | 806 | 135 | 399 | 76 | 1,311 | 245 |
| Malaysia | 449 | 68 | 142 | 27 | 107 | 23 |
| Singapore | 751 | 126 | 405 | 77 | 76 | 16 |
| Tanzania | 509 | 73 | 270 | 49 | 36 | 6 |
| United Kingdom | 658 | 101 | 340 | 69 | 255 | 54 |
| Other countries | 171 | 24 | 176 | 36 | 210 | 37 |
| Totals | 4,134 | 632 | 2,056 | 389 | 2,970 | 516 |
| Inedible Tallow | ||||||
| tonnes | $(000) | tonnes | $(000) | tonnes | $(000) | |
| Australia | 663 | 92 | 500 | 94 | 122 | 20 |
| Burma | - | - | 51 | 6 | 1,017 | 157 |
| China† | 937 | 139 | 2,691 | 442 | 2,850 | 387 |
| Fiji | 798 | 130 | 849 | 151 | 1,004 | 158 |
| France and Monaco | 6,042 | 735 | 8,236 | 1,269 | 9,017 | 950 |
| Germany, Federal Republic of (West) | 107 | 13 | 128 | 14 | 1,053 | 110 |
| India | 428 | 57 | - | - | - | - |
| Japan | 12,362 | 1,594 | 17,598 | 2,720 | 7,990 | 987 |
| Kenya | 3,522 | 472 | 519 | 80 | 2,731 | 427 |
| Malaysia | 1,409 | 185 | 2,300 | 368 | 420 | 63 |
| Mauritius | 1,568 | 152 | 1,802 | 241 | 1,427 | 172 |
| Mozambique | 2,724 | 300 | 2,682 | 419 | 3,261 | 458 |
| Netherlands | 8,637 | 965 | 5,202 | 695 | 6,120 | 680 |
| Philippines | 853 | 93 | 2,225 | 343 | 2,013 | 267 |
| Singapore | 747 | 99 | 1,257 | 203 | 1,825 | 235 |
| South Africa | 2,527 | 256 | 1,141 | 162 | 3,189 | 401 |
| Sri Lanka (Ceylon) | 1,135 | 138 | 394 | 67 | 716 | 108 |
| Trinidad and Tobago | 1,296 | 145 | 259 | 44 | - | - |
| United Kingdom | 14,839 | 1,860 | 10,455 | 1,603 | 12,979 | 1,577 |
| Other countries | 7,676 | 957 | 5,170 | 827 | 8,947 | 1,236 |
| Totals | 68,271 | 8,381 | 63,460 | 9,747 | 66,681 | 8,394 |
| Cattle and Horse Hides | ||||||
| Australia | 129 | 48 | 294 | 103 | 287 | 123 |
| China† | - | - | - | - | 59 | 24 |
| Denmark | 226 | 73 | 218 | 74 | 197 | 79 |
| Germany, Federal Republic of (West) | 2,165 | 763 | 1,210 | 368 | 1,542 | 583 |
| Greece | 804 | 333 | 809 | 297 | 659 | 290 |
| Italy | 12,458 | 4,521 | 15,815 | 5,412 | 16,173 | 6,422 |
| Japan | 5,454 | 2,209 | 4,742 | 1,768 | 3,369 | 1,393 |
| Netherlands | 1,771 | 685 | 911 | 310 | 1,222 | 452 |
| Norway | 534 | 180 | 600 | 188 | 823 | 311 |
| Poland | - | - | 59 | 33 | 1,308 | 643 |
| Spain | 647 | 214 | 1,311 | 371 | 1,048 | 360 |
| United Kingdom | 858 | 314 | 421 | 134 | 1,148 | 476 |
| Yugoslavia | 1,928 | 615 | 1,336 | 417 | 1,724 | 712 |
| Other countries | 1,028 | 398 | 812 | 296 | 1,646 | 709 |
| Totals | 28,004 | 10,352 | 28,537 | 9,769 | 31,206 | 12,578 |
| Calf and Kid Skins | ||||||
| tonnes | $(000) | tonnes | $(000) | tonnes | $(000) | |
| Australia | 56 | 33 | 16 | 6 | ||
| France and Monaco | 297 | 263 | 128 | 87 | 171 | 127 |
| Germany, Federal Republic of (West) | 180 | 182 | 100 | 72 | 194 | 127 |
| Italy | 701 | 737 | 1,696 | 1,148 | 827 | 636 |
| Japan | 599 | 488 | 254 | 162 | 274 | 208 |
| Netherlands | 176 | 162 | 161 | 91 | 60 | 40 |
| Spain | 845 | 748 | 48 | 19 | 309 | 242 |
| United Kingdom | 75 | 66 | 159 | 115 | 161 | 135 |
| United States | 30 | 32 | 1 | 1 | 15 | 14 |
| Other countries | 327 | 178 | 427 | 169 | 236 | 131 |
| Totals | 3,287 | 2,889 | 2,991 | 1,871 | 2,248 | 1,660 |
| Sheepskins (With Wool) | ||||||
| tonnes | $(000) | tonnes | $(000) | tonnes | $(000) | |
| France and Monaco | 1,403 | 547 | 1,712 | 575 | 1,781 | 746 |
| Italy | 389 | 186 | 110 | 44 | 118 | 49 |
| Netherlands | 56 | 30 | 35 | 20 | - | - |
| Portugal | - | - | - | - | - | - |
| Spain | 303 | 147 | 319 | 104 | 447 | 214 |
| United Kingdom | 670 | 293 | 449 | 219 | 209 | 113 |
| Other countries | 159 | 92 | 83 | 48 | 132 | 67 |
| Totals | 2,980 | 1,294 | 2,710 | 1,011 | 2,687 | 1,189 |
| Sheepskins (Without Wool) | ||||||
| Australia | 1 | 8 | 7 | 91 | 16 | 275 |
| Belgium and Luxembourg | 132 | 2,150 | 219 | 3,133 | 286 | 4,350 |
| Canada | 8 | 69 | 21 | 233 | 50 | 761 |
| Finland | 41 | 351 | 36 | 210 | 21 | 218 |
| France and Monaco | 376 | 3,562 | 443 | 4,902 | 955 | 13,340 |
| Germany, Federal Republic of (West) | 55 | 466 | 24 | 178 | 32 | 395 |
| Italy | 130 | 1,838 | 81 | 977 | 57 | 847 |
| Netherlands | 321 | 5,348 | 225 | 3,133 | 230 | 3,657 |
| Spain | 102 | 1,125 | 19 | 183 | 64 | 592 |
| United Kingdom | 726 | 8,626 | 692 | 8,524 | 516 | 7,979 |
| United States | 807 | 7,682 | 1,161 | 15,255 | 808 | 12,777 |
| Other countries | 50 | 428 | 24 | 274 | 46 | 478 |
| Totals | 2,751 | 31,652 | 2,952 | 37,101 | 3,082 | 45,668 |
| Sausage Casings | ||||||
| hanks | hanks | hanks | ||||
| (000) | $(000) | (000) | $(000) | (000) | $(000) | |
| Australia | 46 | 97 | 12 | 25 | 65 | 136 |
| Canada | 2,490 | 3,805 | 1,870 | 2,899 | 2,688 | 4,358 |
| Germany, Federal Republic of (West) | 479 | 970 | 504 | 1,200 | 575 | 1,270 |
| Japan | 193 | 413 | 237 | 572 | 364 | 921 |
| United Kingdom | 3,110 | 5,829 | 3,096 | 6,037 | 2,627 | 4,749 |
| United States | 1,140 | 2,419 | 1,351 | 2,973 | 1,549 | 3,346 |
| Yugoslavia | 40 | 93 | 22 | 56 | 29 | 64 |
| Other countries | 147 | 346 | 166 | 341 | 279 | 536 |
| Totals | 7,646 | 13,972 | 7,259 | 14,102 | 8,175 | 15,380 |
| Apples (Fresh Whole Fruit) | ||||||
| tonnes | $(000) | tonnes | $(000) | tonnes | $(000) | |
| Belgium and Luxembourg | 3,546 | 586 | 5,434 | 901 | 5,798 | 1,020 |
| Canada | 3,263 | 520 | 2,196 | 363 | 2,166 | 385 |
| Fiji | 306 | 45 | 316 | 52 | 381 | 62 |
| Finland | 693 | 115 | 491 | 81 | 445 | 80 |
| French Polynesia | 295 | 45 | 271 | 45 | 344 | 57 |
| Germany, Federal Republic of (West) | 4,649 | 769 | 4,992 | 825 | 6,328 | 1,217 |
| Hong Kong | 1,084 | 167 | 1,461 | 242 | 1,729 | 300 |
| Ireland, Republic of | 1,527 | 253 | 1,361 | 225 | 1,669 | 299 |
| New Caledonia | 313 | 47 | 303 | 50 | 293 | 48 |
| Norway | 680 | 113 | 757 | 125 | 855 | 153 |
| Philippines | 163 | 27 | 82 | 14 | - | - |
| Singapore | 917 | 136 | 445 | 74 | 698 | 119 |
| Sweden | 853 | 141 | 272 | 45 | 916 | 164 |
| United Kingdom | 31,737 | 5,178 | 29,518 | 4,849 | 29,782 | 5,322 |
| United States | 2,587 | 421 | 2,180 | 360 | 4,599 | 838 |
| Venezuela | 1,129 | 170 | 1,002 | 166 | 339 | 60 |
| Other countries | 854 | 133 | 1,063 | 179 | 1,723 | 310 |
| Totals | 54,597 | 8,863 | 52,143 | 8,595 | 58,064 | 10,434 |
| Seeds (Grass and Clover) | ||||||
| Australia | 2,371 | 939 | 1,322 | 653 | 2,137 | 766 |
| Chile | 671 | 261 | 551 | 257 | 330 | 97 |
| France and Monaco | 1,357 | 513 | 1,548 | 711 | 1,566 | 727 |
| Germany, Federal Republic of (West) | 283 | 141 | 509 | 357 | 563 | 332 |
| Ireland, Republic of | 261 | 125 | 578 | 228 | 916 | 253 |
| Italy | 85 | 39 | 84 | 37 | 321 | 87 |
| Japan | 162 | 107 | 145 | 118 | 216 | 133 |
| Netherlands | 143 | 78 | 191 | 131 | 341 | 175 |
| South Africa | 261 | 66 | 37 | 9 | 30 | 7 |
| United Kingdom | 2,044 | 1,135 | 4,340 | 2,099 | 4,653 | 1,587 |
| United States | 67 | 47 | 39 | 68 | 56 | 56 |
| Uruguay | - | - | - | - | 41 | 22 |
| Other countries | 234 | 125 | 375 | 230 | 470 | 191 |
| Totals | 7,939 | 3,576 | 9,719 | 4,896 | 11,640 | 4,433 |
| Peas (Food), Including Frozen | ||||||
| tonnes | $(000) | tonnes | $(000) | tonnes | $(000) | |
| Australia | 2,050 | 690 | 1,965 | 843 | 4,782 | 1,620 |
| Belgium and Luxembourg | 1,453 | 101 | 2,445 | 158 | 1,315 | 104 |
| Fiji | 425 | 52 | 657 | 80 | 800 | 97 |
| Hong Kong | 328 | 65 | 635 | 111 | 677 | 142 |
| Japan | 4,805 | 589 | 7,240 | 804 | 2,011 | 383 |
| Netherlands | 575 | 43 | 1,347 | 101 | 881 | 69 |
| Singapore | 464 | 83 | 816 | 132 | 511 | 89 |
| South Africa | 2,193 | 205 | 4,148 | 464 | 5,064 | 513 |
| United Kingdom | 8,906 | 1,229 | 4,440 | 340 | 5,548 | 418 |
| United States | 639 | 51 | 386 | 29 | 480 | 42 |
| Other countries | 2,385 | 448 | 4,038 | 438 | 2,975 | 325 |
| Totals | 24,222 | 3,556 | 28,118 | 3,499 | 25,044 | 3,803 |
| Peas (Seed) | ||||||
| tonnes | $(000) | tonnes | $(000) | tonnes | $(000) | |
| Australia | 4,350 | 540 | 3,127 | 404 | 5,263 | 722 |
| Fiji | 196 | 16 | 51 | 5 | 253 | 23 |
| France and Monaco | 167 | 20 | 139 | 16 | 151 | 21 |
| Germany Federal Republic of (West) | 911 | 117 | 267 | 32 | 772 | 89 |
| Italy | 20 | 3 | 154 | 18 | 338 | 42 |
| Japan | 529 | 55 | 1 | 47 | 5 | |
| Netherlands | 456 | 58 | 260 | 31 | 481 | 61 |
| South Africa | 548 | 62 | 59 | 8 | 617 | 72 |
| United Kingdom | 4,113 | 547 | 4,773 | 616 | 3,775 | 523 |
| Other countries | 313 | 41 | 126 | 17 | 391 | 45 |
| Totals | 11,603 | 1,458 | 8,958 | 1,146 | 12,089 | 1,603 |
| Wood Pulp and Waste Paper | ||||||
| tonnes | $(000) | tonnes | $(000) | tonnes | $(000) | |
| Australia | 73,184 | 6,268 | 82,842 | 7,788 | 86,770 | 8,554 |
| Japan | 985 | 106 | 2,816 | 291 | 1,558 | 138 |
| Philippines | 5,208 | 567 | 6,450 | 781 | 17,007 | 1,805 |
| Other countries | 4,314 | 354 | 7,114 | 640 | 9,831 | 885 |
| Totals | 83,691 | 7,294 | 99,222 | 9,499 | 115,166 | 11,382 |
| Timber (Sawn Conifer) | ||||||
| cum(000) | $(000) | cu m(000) | $(000) | cu m(000) | $(000) | |
| Australia | 1,241 | 5,156 | 103 | 4,360 | 104 | 4,384 |
| Japan | 82 | 1,998 | 89 | 2,368 | 95 | 2,714 |
| New Caledonia | 13 | 771 | 14 | 982 | 11 | 693 |
| Tonga | 1 | 60 | 2 | 142 | 3 | 186 |
| United Kingdom | 8 | 439 | 33 | 934 | 16 | 469 |
| Western Samoa | 3 | 170 | 3 | 175 | 5 | 349 |
| Other countries | 14 | 737 | 19 | 1,048 | 26 | 1,439 |
| Totals | 246 | 9,331 | 263 | 10,010 | 262 | 10,233 |
| Sawlogs and Veneer Logs (Conifer) | ||||||
| cum(000) | $(000) | cu m(000) | $(000) | cu m(000) | $(000) | |
| Australia | 1 | 14 | - | - | - | - |
| Japan | 1,741 | 23,233 | 1,755 | 25,296 | 1,797 | 29,127 |
| Korea, Republic of | 51 | 671 | 51 | 705 | 34 | 537 |
| Other countries | - | 15 | - | - | - | - |
| Totals | 1,793 | 23,933 | 1,806 | 26,001 | 1,831 | 29,664 |
| Fish (Other than Canned) | ||||||
| tonnes | $(000) | tonnes | $(000) | tonnes | $(000) | |
| Australia | 3,143 | 2,180 | 4,394 | 3,064 | 3,813 | 2,556 |
| France and Monaco | 78 | 240 | 113 | 80 | 172 | 168 |
| Japan | 959 | 461 | 1,164 | 602 | 3,123 | 1,778 |
| Netherlands | 149 | 93 | 417 | 228 | 785 | 563 |
| United States | 2,313 | 10,403 | 2,228 | 11,204 | 2,675 | 12,461 |
| Western Samoa | 97 | 22 | 116 | 31 | 153 | 46 |
| Other countries | 1,085 | 1,035 | 1,777 | 1,709 | 2,062 | 1,843 |
| Totals | 7,824 | 14,433 | 10,209 | 16,919 | 12,783 | 19,415 |
| Newsprint | ||||||
| tonnes | $(000) | tonnes | $(000) | tonnes | $(000) | |
| Australia | 117,472 | 15,509 | 107,204 | 13,597 | 127,554 | 16,105 |
| Philippines | 1,456 | 108 | 917 | 70 | 928 | 69 |
| Singapore | 1,166 | 83 | 861 | 63 | 375 | 28 |
| Thailand | - | - | - | - | 46 | 5 |
| Other countries | 1,430 | 145 | 2,460 | 299 | 2,022 | 254 |
| Totals | 121,525 | 15,845 | 111,442 | 14,028 | 130,924 | 16,46 |
EXPORTS BY PORTS—The following table shows for the latest June years the value of total exports, including re-exports, according to the ports at which goods were loaded for export.
| Port | Year Ended June | |||||
|---|---|---|---|---|---|---|
| 1967 | 1968 | 1969 | 1970 | 1971 | 1972 | |
| $(million) | ||||||
| Whangarei | 22.5 | 32.3 | 34.8 | 36.9 | 38.0 | 48.2 |
| Auckland | 233.2 | 249.2 | 277.8 | 318.0 | 309.6 | 375.9 |
| Hamilton | -- | -- | -- | -- | -- | 0.2 |
| Tauranga | 29.7 | 46.9 | 72.1 | 89.7 | 116.8 | 177.6 |
| Gisborne | 7.1 | 7.1 | 9.4 | 10.7 | 12.3 | 9.5 |
| Napier | 72.1 | 83.2 | 105.6 | 113.8 | 130.6 | 128.5 |
| Taranaki | 67.5 | 73.7 | 79.8 | 84.6 | 91.5 | 99.0 |
| Wanganui | -- | -- | 0.1 | -- | -- | 2.6 |
| Palmerston North | -- | -- | 0.1 | -- | -- | -- |
| Wellington | 85.9 | 99.9 | 115.5 | 124.3 | 116.8 | 180.2 |
| Picton | 2.5 | 3.8 | 4.3 | 3.5 | 4.2 | 3.6 |
| Nelson | 5.8 | 8.3 | 12.9 | 13.6 | 14.2 | 18.7 |
| Greymouth | -- | -- | 0.1 | -- | -- | -- |
| Lyttelton | 60.6 | 64.1 | 80.2 | 85.1 | 81.5 | 83.9 |
| Timaru | 34.7 | 47.7 | 61.5 | 61.6 | 67.5 | 68.6 |
| Oamaru | -- | -- | -- | -- | -- | -- |
| Otago | 40.0 | 29.4 | 38.1 | 40.3 | 41.8 | 62.3 |
| Bluff | 65.5 | 74.6 | 96.8 | 104.3 | 106.7 | 116.1 |
| Totals | 727.2 | 820.5 | 989.1 | 1,086.7 | 1,131.7 | 1,375.0 |
Auckland occupies a commanding position in the export trade of New Zealand, usually about one-third of all exports being dispatched from that port. Wellington occupies second place, with approximately one-eighth of the trade. As will be seen from the above table, the order of the other ports varies from year to year. The general rise in the value of exports through Tauranga is attributed to the pulp, paper, and timber industries of the district.
RE-EXPORTS—Until recent years the forwarding trade of New Zealand has never been of great significance. In latest years, passengers duty-free purchases, ships' and international aircraft stores, make up between one-fifth and one-third of the total re-exports. The balance is made up principally of miscellaneous stores sent to the Pacific Islands and goods returned or re-sold to the United Kingdom and Australia.
Particulars of re-exports are contained in the next table. Specie is not included in the figures.
| Year Ended June | Re-exports |
|---|---|
| *Provisional. | |
| $(000) | |
| 1963 | 7,563 |
| 1964 | 8,844 |
| 1965 | 8,512 |
| 1966 | 10,454 |
| 1967 | 9,601 |
| 1968 | 15,838 |
| 1969 | 20,219 |
| 1970 | 22,195 |
| 1971 | 23,628 |
| 1972 | 28,342 |
| 1973* | 33,366 |
| 1974* | 42,773 |
The destinations of this re-export trade for the latest June years are shown in the following table.
| Country | June Year | |||
|---|---|---|---|---|
| 1971 | 1972 | 1973 | 1974* | |
| *Provisional. | ||||
| $(thousand) | ||||
| Australia | 8,251 | 9,510 | 11,919 | 12,502 |
| Fiji | 1,963 | 2,088 | 2,220 | 3,014 |
| Hong Kong | 167 | 136 | 422 | 632 |
| Malaysia | 73 | 49 | 55 | 60 |
| Papua and New Guinea | 33 | 116 | 59 | 74 |
| Singapore | 293 | 551 | 770 | 647 |
| South Africa | 65 | 148 | 51 | 61 |
| Tonga | 98 | 210 | 183 | 217 |
| United Kingdom | 1,202 | 1,412 | 1,275 | 1,572 |
| Western Samoa | 339 | 456 | 523 | 463 |
| Germany, Federal Republic of (West) | 393 | 550 | 520 | 647 |
| Netherlands | 206 | 102 | 95 | 128 |
| Canada | 92 | 177 | 151 | 300 |
| Philippines | 23 | 42 | 147 | 59 |
| United States | 2,052 | 2,963 | 3,126 | 3,672 |
| Brazil | - | - | 27 | 13 |
| Indonesia | 44 | 143 | 35 | 140 |
| Japan | 223 | 331 | 586 | 504 |
| Other countries | 1,340 | 1,018 | 1,538 | 1,851 |
| Ships' stores | 3,311 | 3,739 | 4,617 | 7,289 |
| Passengers goods | 3,459 | 4,601 | 5,048 | 8,931 |
| Totals (excluding gold and current coin) | 23,628 | 28,342 | 33,366 | 42,773 |
EXPORTS TO COOK, NIUE, AND TOKELAU ISLANDS—Trade with the Cook, Niue, and Tokelau Islands is not included in external trade statistics. The values of exports to the islands are summarised below.
| Year Ended June | Exports |
|---|---|
| *Provisional | |
| $(000) | |
| 1965 | 3,020 |
| 1966 | 2,846 |
| 1967 | 2,796 |
| 1968 | 3,461 |
| 1969 | 3,590 |
| 1970 | 5,024 |
| 1971 | 6,995 |
| 1972 | 5,923 |
| 1973* | 5,466 |
| 1974* | 6,889 |
Further particulars regarding the trade of the islands will be found in Section 38.
GENERAL—Statistics of imports are compiled from entries passed to the Customs and are usually quoted on the valuation basis c.d.v. (current domestic value in the country of export at the time of shipment). However, in certain tables the value c.i.f. (cost including insurance and freight) is also given. Import values are expressed in terms of New Zealand currency, and import totals do not include fold and current coin, except where expressly stated.
Reference should be made to Section 22A for details of the systems of valuation of imports as now used in these tables. Section 22A also gives a summary of import totals for recent years and index numbers of the volume of import trade.
IMPORT CONTROL—Reference to import control is made in Section 22A.
CLASSIFICATION OF IMPORTS—The following table classifies imports by Sections of the Standard International Trade Classification (Revised). It illustrates the great variety of imports which New Zealand receives in exchange for its relatively limited range of exports.
| Year Ended June | Imports (c.d.v.) | |||||
|---|---|---|---|---|---|---|
| Food and Live Animals | Beverages and Tobacco | Crude Materials, Inedible, Except Fuels | Mineral Fuels, Lubricants and Related Materials | Animal and Vegetable Oils and Fats | Chemicals | |
| *Provisional. | ||||||
| $(thousand) | ||||||
| 1964 | 48,627 | 7,003 | 27,530 | 47,819 | 1,105 | 55,450 |
| 1965 | 35,469 | 7,745 | 31,028 | 51,691 | 1,088 | 65,379 |
| 1966 | 37,117 | 8,146 | 34,954 | 39,945 | 1,273 | 80,238 |
| 1967 | 31,384 | 8,407 | 36,680 | 44,863 | 1,143 | 77,674 |
| 1968 | 31,961 | 8,649 | 31,811 | 48,042 | 1,351 | 76,766 |
| 1969 | 34,317 | 10,554 | 43,689 | 56,248 | 1,415 | 102,861 |
| 1970 | 45,212 | 8,666 | 51,396 | 59,094 | 1,709 | 116,345 |
| 1971 | 55,312 | 12,237 | 47,354 | 60,625 | 2,586 | 134,804 |
| 1972 | 58,583 | 12,873 | 44,939 | 66,593 | 2,743 | 142,790 |
| 1973* | 62,575 | 15,434 | 53,744 | 76,666 | 2,790 | 167,958 |
| 1974* | 85,838 | 19,762 | 77,027 | 169,997 | 7,869 | 246,859 |
| Imports (c.d.v.) | |||||
|---|---|---|---|---|---|
| Year Ended June | Manufactured Goods Classified Chiefly by Material | Machinery and Transport | Miscellaneous Manufactured Articles | Commodities and Transactions not Classified According to Kind | Total Merchandise Imports |
| *Provisional. | |||||
| $(thousand) | |||||
| 1964 | 187,870 | 217,960 | 41,481 | 2,523 | 637,368 |
| 1965 | 195,223 | 230,983 | 42,226 | 1,833 | 662,667 |
| 1966 | 216,289 | 263,403 | 46,825 | 1,236 | 729,426 |
| 1967 | 210,863 | 290,908 | 46,357 | 3,926 | 752,206 |
| 1968 | 182,032 | 196,382 | 43,633 | 2,280 | 622,908 |
| 1969 | 233,280 | 254,905 | 59,557 | 2,371 | 799,197 |
| 1970 | 271,612 | 319,713 | 66,552 | 4,027 | 944,324 |
| 1971 | 296,296 | 370,811 | 77,228 | 13,314 | 1,070,567 |
| 1972 | 285,775 | 444,503 | 84,081 | 9,857 | 1,152,736 |
| 1973* | 315,882 | 465,480 | 100,677 | 15,043 | 1,276,249 |
| 1974* | 492,157 | 597,549 | 132,351 | 12,855 | 1,842,263 |
The next table gives fuller details of imports according to sections and divisions for the latest June years.
| Section and Division S.I.T.C., Revised | June Year 1973* | June Year 1974* | ||
|---|---|---|---|---|
| c.d.v. | c.i.f. | c.d.v. | c.i.f. | |
| *Provisional. | ||||
| Section 0. Food and Live Animals— | ||||
| $(thousand) | ||||
| Div. 00 Live animals | 3,527 | 4,002 | 5,187 | 5,785 |
| " 01 Meat and meat preparations | 1,717 | 1,896 | 4,409 | 4,792 |
| " 02 Dairy products and eggs | 276 | 295 | 477 | 499 |
| " 03 Fish and fish preparations | 4,778 | 5,207 | 9,289 | 10,070 |
| " 04 Cereals and cereal preparations | 1,696 | 1,824 | 12,391 | 14,885 |
| " 05 Fruits and vegetables | 16,901 | 20,765 | 20,327 | 25,740 |
| " 06 Sugar and sugar preparations | 18,727 | 20,538 | 17,241 | 19,596 |
| " 07 Coffee, tea, cocoa, spices, and manufactures thereof | 12,916 | 15,868 | 13,027 | 15,942 |
| " 08 Feeding stuff for animals (not including unmilled cereals) | 233 | 315 | 750 | 728 |
| " 09 Miscellaneous food preparations | 1,803 | 1,802 | 2,740 | 2,730 |
| Totals, Section 0 | 62,575 | 72,513 | 85,838 | 100,767 |
| Section 1. Beverages and Tobacco— | ||||
| Div. 11 Beverages | 8,588 | 8,927 | 11,710 | 12,591 |
| " 12 Tobacco and tobacco manufactures | 6,846 | 7,564 | 8,051 | 8,734 |
| Totals, Section 1 | 15,434 | 16,491 | 19,762 | 21,325 |
| Section 2. Crude Materials, Inedibles, Except Fuels— | ||||
| Div. 21 Hides, skins, and fur skins, undressed | 1,655 | 1,802 | 1,708 | 1,812 |
| " 22 Oil seeds, oil nuts, and oil kernels | 1,953 | 2,143 | 5,784 | 6,502 |
| " 23 Crude rubber, including synthetic and reclaimed | 7,154 | 7,874 | 12,741 | 14,371 |
| " 24 Wood and cork | 4,361 | 6,048 | 9,379 | 12,304 |
| " 25 Pulp and waste paper | 1,853 | 2,149 | 1,784 | 2,181 |
| " 26 Textile fibres (not manufactured into yarn, thread, or fabrics) and waste | 10,559 | 11,736 | 16,125 | 17,814 |
| " 27 Crude fertilisers and crude minerals, excluding coal, petroleum and precious stones | 18,620 | 33,416 | 19,732 | 33,981 |
| " 28 Metalliferous ores and metal scrap | 1,996 | 2,264 | 2,248 | 2,675 |
| " 29 Animal and vegetable crude materials, n.e.i. | 5,593 | 5,981 | 7,525 | 7,946 |
| Totals, Section 2 | 53,744 | 73,412 | 77,027 | 99,584 |
| Section 3. Mineral Fuels, Lubricants, and Related Materials— | ||||
| Div. 32 Coal, coke, and briquettes | 432 | 656 | 249 | 512 |
| " 33 Petroleum and petroleum products | 76,105 | 96,386 | 169,640 | 203,408 |
| " 34 Gas | 129 | 188 | 108 | 152 |
| Totals, Section 3 | 76,666 | 97,229 | 169,997 | 204,072 |
| Section 4. Animal and Vegetable Oils and Fats— | ||||
| Div. 41 Animal oils and fats | 56 | 71 | 252 | 298 |
| " 42 Vegetable oils and fats, unprocessed | 2,454 | 2,823 | 6,358 | 6,948 |
| " 43 Animal and vegetable oils and fats, processed, and waxes of animal or vegetable origin | 280 | 328 | 1,260 | 1,389 |
| Totals, Section 4 | 2,790 | 3,222 | 7,869 | 8,634 |
| Section 5. Chemicals— | ||||
| Div. 51 Chemical elements and compounds | 50,242 | 54,600 | 78,533 | 88,963 |
| " 52 Mineral tar and crude chemicals from coal, petroleum, and natural gas | 460 | 524 | 823 | 966 |
| " 53 Dyeing, tanning, and colouring materials | 9,795 | 10,006 | 14,848 | 16,129 |
| " 54 Medicinal and pharmaceutical products | 32,924 | 29,337 | 39,429 | 35,483 |
| " 55 Essential oils and perfume materials; toilet, polishing, and cleansing preparations | 5,596 | 5,637 | 7,634 | 8,197 |
| " 56 Fertilisers, manufactured | 14,586 | 18,427 | 17,328 | 23,153 |
| " 57 Explosives | 1,511 | 1,424 | 2,322 | 2,183 |
| " 58 Plastic materials, regenerated cellulose, artificial resins | 36,569 | 37,561 | 65,721 | 73,129 |
| " 59 Miscellaneous chemical materials and products | 16,275 | 18,147 | 20,221 | 22,920 |
| Totals, Section 5 | 167,958 | 175,662 | 246,859 | 271,124 |
| Section 6. Manufactured Goods Classified Chiefly by Material— | ||||
| Div. 61 Leather, leather manufactures, n.e.i., and dressed furs | 1,742 | 1,843 | 2,565 | 2,734 |
| " 62 Rubber manufactures, n.e.i. | 12,103 | 11,711 | 20,346 | 20,493 |
| " 63 Wood and cork manufactures (excluding furniture) | 3,421 | 3,960 | 7,833 | 9,300 |
| " 64 Paper, paperboard, and manufactures thereof | 13,919 | 15,428 | 22,179 | 25,657 |
| " 65 Textile yarn, fabrics, made-up articles and related products | 112,189 | 119,751 | 181,388 | 195,042 |
| " 66 Non-metallic mineral manufactures, n.e.i. | 16,061 | 17,948 | 22,698 | 25,866 |
| " 67 Iron and steel | 83,796 | 89,011 | 129,493 | 143,028 |
| " 68 Non-ferrous metals | 32,711 | 31,882 | 54,966 | 55,073 |
| " 69 Manufacture of metals | 39,940 | 40,982 | 50,688 | 52,353 |
| Totals, Section 6 | 315,882 | 332,516 | 492,157 | 529,549 |
| Section 7. Machinery and Transport Equipment— | ||||
| Div. 71 Machinery other than electric | 194,155 | 198,747 | 249,353 | 261,653 |
| " 72 Electric machinery, apparatus, and appliances | 77,352 | 77,923 | 104,347 | 107,245 |
| " 73 Transport equipment | 193,973 | 201,002 | 243,849 | 262,208 |
| Totals, Section 7 | 465,480 | 477,673 | 597,549 | 631,106 |
| Section 8. Miscellaneous Manufactured Articles— | ||||
| Div. 81 Sanitary, plumbing, heating, lighting fittings, and fixtures | 1,282 | 1,407 | 2,552 | 2,864 |
| " 82 Furniture and fixtures | 567 | 664 | 991 | 1,140 |
| " 83 Travel goods, handbags, and similar articles | 235 | 249 | 357 | 383 |
| " 84 Clothing | 3,931 | 4,224 | 5,104 | 5,499 |
| " 85 Footwear | 2,216 | 2,405 | 2,924 | 3,191 |
| " 86 Professional, scientific and controlling instruments: photographic and optical goods, watches, and clocks | 37,643 | 35,746 | 51,244 | 48,871 |
| " 89 Miscellaneous manufactured articles, n.e.i. | 54,803 | 57,595 | 69,179 | 72,747 |
| Totals, Section 8 | 100,677 | 102,290 | 132,351 | 134,695 |
| Section 9. Commodities and Transactions Not Classified According to Kind | 15,043 | 15,331 | 12,855 | 13,320 |
| Grand totals, merchandise imports | 1,276,249 | 1,366,340 | 1,842,263 | 2,014,177 |
DIRECTION OF IMPORT TRADE—The United Kingdom has been the chief supplier of New Zealand imports since the eighties of last century. Prior to that the main supply was from Australia. In the years following the Second World War, the proportion of the import trade received from the United Kingdom rose from 47.8 percent in 1946 to a maximum of 60.1 percent in 1950. Since 1950 there has been an overall decline, and for the June years 1973 and 1974, only 23.8 percent and 19.1 percent, respectively, of imports came from that source. The trade with Australia from 1950 to 1956 was between 10 and 15 percent of the total. In 1957 and 1958, however, it rose to 17 percent, and in 1959 and 1960 to 18 percent. In the years ended June 1973 and 1974, 25.1 percent and 24.4 percent, respectively, of imports came from Australia. Japan is becoming an important trading partner; in the last 2 years, 13.1 percent and 13.5 percent, respectively, of imports came from that source.
The principal changes in the direction of the import trade are illustrated in the table in Section 22A giving the percentages received from the various currency areas.
The table which follows shows imports (valuation c.d.v.) during the latest 11 years from the United Kingdom, Australia, and the United States.
| Year Ended June | Country Where Purchased | Country of Origin | Total Merchandise Imports | ||||
|---|---|---|---|---|---|---|---|
| United Kingdom | Australia | U.S.A. | United Kingdom | Australia | U.S.A. | ||
| *Provisional. | |||||||
| $(million) | |||||||
| 1964 | 259 | 132 | 57 | 247 | 133 | 59 | 637 |
| 1965 | 262 | 132 | 78 | 242 | 128 | 75 | 663 |
| 1966 | 289 | 143 | 75 | 278 | 135 | 84 | 729 |
| 1967 | 291 | 150 | 101 | 275 | 143 | 97 | 752 |
| 1968 | 208 | 141 | 75 | 188 | 133 | 68 | 623 |
| 1969 | 267 | 172 | 102 | 243 | 158 | 100 | 799 |
| 1970 | 300 | 220 | 123 | 279 | 198 | 123 | 944 |
| 1971 | 329 | 252 | 127 | 310 | 225 | 130 | 1,071 |
| 1972 | 346 | 300 | 115 | 329 | 267 | 117 | 1,153 |
| 1973* | 304 | 321 | 146 | 1,276 | |||
| 1974* | 351 | 449 | 225 | 1,842 | |||
The next table gives imports on a c.d.v. basis by countries of origin for the latest June years.
| Country | June Year 1972 | June Year 1973* | June Year 1974* |
|---|---|---|---|
*Provisional. †Does not include statistics for that part of China known as Taiwan. | |||
| Sterling Area— | $(000) | $(000) | $(000) |
| Australia | 267,288 | 320,909 | 449,313 |
| Bahamas | 30 | 26 | 186 |
| Bahrain | 5,829 | 6,017 | 11,122 |
| British Solomon Islands | 46 | 64 | 64 |
| Brunei | 3,300 | - | - |
| Democratic Yemen | 179 | 93 | - |
| Fiji | 2,759 | 3,542 | 735 |
| Ghana | 1,684 | 2,299 | 3,119 |
| Gilbert and Ellice Islands | 4,414 | 2,513 | 2.580 |
| Guyana | 56 | 114 | 33 |
| Hong Kong | 19,294 | 20,009 | 40,780 |
| India | 12,356 | 10,930 | 14,821 |
| Ireland, Republic of | 621 | 601 | 832 |
| Jamaica | 464 | 1,405 | 2,652 |
| Kenya | 446 | 545 | 793 |
| Kuwait | 20,823 | 28,598 | 57,595 |
| Malawi | 57 | 92 | 145 |
| Malaysia | 5,116 | 8,086 | 11,750 |
| Malta, including Gozo | 31 | 25 | 25 |
| Mauritius and Dependencies | 124 | 113 | 1 |
| Nauru | 5,295 | 4,917 | 4,685 |
| New Hebrides Cond. | 64 | 141 | 158 |
| New Zealand Re-imports | 1,756 | 2,142 | 2,532 |
| Nigeria | 81 | 41 | 21 |
| Pakistan | 3,064 | 709 | 2,003 |
| Papua and New Guinea | 586 | 769 | 1,616 |
| Singapore | 4,218 | 8,440 | 31,568 |
| South Africa | 3,179 | 4,372 | 5,990 |
| Sri Lanka (Ceylon) | 4,354 | 3,627 | 3,054 |
| Tanzania (incl. Pemba) | 1,236 | 1,858 | 2,099 |
| Tonga | 515 | 474 | 801 |
| Trinidad and Tobago | 52 | 75 | 107 |
| Uganda | 1,226 | 401 | 562 |
| United Kingdom | 329,013 | 303,914 | 350,921 |
| Western Samoa | 1,274 | 1,275 | 2,873 |
| Other | 41 | 1,916 | 1,060 |
| Totals | 700,871 | 741,052 1 | ,006,597 |
| E.F.T.A.— | |||
| Austria | 1,925 | 2,291 | 3,630 |
| Iceland | - | - | 1 |
| Norway | 2,720 | 2,102 | 5,702 |
| Portugal | 1,022 | 1,059 | 1,552 |
| Sweden | 13,703 | 12,275 | 15,581 |
| Switzerland and Liechtenstein | 11,503 | 12,742 | 17,857 |
| Totals | 30,873 | 30,469 | 44,324 |
| E.E.C. (Excluding United Kingdom and Ireland, Republic of)— | |||
| Belgium and Luxembourg | 6,398 | 7,096 | 13,505 |
| Denmark | 4,111 | 3,736 | 5,319 |
| France and Monaco | 11,292 | 12,837 | 18,115 |
| Germany, Federal Republic of (West) | 49,308 | 50,988 | 86,767 |
| Italy and San Marino | 15,442 | 16,225 | 29,541 |
| Netherlands | 11,696 | 16,043 | 28,418 |
| Totals | 98,246 | 106,925 | 181,666 |
| Dollar Area— | |||
| $(000) | $(000) | $(000) | |
| Canada | 36,489 | 34,631 | 44,665 |
| Colombia | 1,267 | 1,690 | 260 |
| Costa Rica | 19 | 9 | 3 |
| Dominican Republic | 1,719 | 2,288 | 3,925 |
| Ecuador | 1,508 | 2,472 | 2,859 |
| Mexico | 1,084 | 958 | 1,689 |
| Philippines | 419 | 546 | 1,452 |
| United States | 116,650 | 145,670 | 224,984 |
| Other | 19 | 119 | 138 |
| Totals | 159,175 | 188,381 | 279,976 |
| Other Countries— | |||
| Angola incl. Cabinda | 217 | 324 | 583 |
| Argentina | 37 | 152 | 458 |
| Brazil | 2,106 | 2,014 | 4,504 |
| Bulgaria | 25 | 18 | 25 |
| Central African Republic | 41 | - | 80 |
| Chile | 147 | 212 | 402 |
| China† | 5,312 | 6,923 | 14,301 |
| China (Taiwan) | 1,337 | 3,058 | 6,572 |
| Congo People's Republic (Brazzaville) | - | 25 | - |
| Czechoslovakia | 1,418 | 1,784 | 2,835 |
| Finland | 797 | 736 | 5,491 |
| French Polynesia | 27 | 48 | 29 |
| Germany, East | 318 | 492 | 725 |
| Greece | 70 | 113 | 231 |
| Hungary | 138 | 225 | 542 |
| Indonesia | 1,108 | 1,777 | 1,824 |
| Iran | 10,576 | 9,776 | 18,594 |
| Iraq | 266 | 273 | 249 |
| Israel | 259 | 500 | 744 |
| Ivory Coast | 12 | 4 | - |
| Japan | 123,668 | 166,788 | 248,047 |
| Korea, Republic of | 864 | 1,454 | 7,684 |
| Morocco | 14 | 15 | 10 |
| Mozambique | 201 | 310 | 412 |
| Netherlands Antilles | 26 | 78 | 115 |
| New Caledonia | 1 | 54 | |
| Peru | 34 | 52 | 58 |
| Poland | 407 | 425 | 628 |
| Romania | 106 | 128 | 520 |
| Saudi Arabia | 3,699 | 6,345 | 4,621 |
| Spain | 1,757 | 1,925 | 3,276 |
| Sudan | 26 | 40 | 13 |
| Syria | 14 | 22 | 31 |
| Thailand | 1,080 | 1,030 | 1,719 |
| Turkey | 197 | 122 | 124 |
| U.S.S.R. | 1,099 | 946 | 1,817 |
| Yemen | 663 | 891 | 1,727 |
| Yugoslavia | 405 | 99 | 340 |
| Zaire Republic (Congo Kinshasa) | 26 | 37 | 119 |
| Other | 72 | 349 | 192 |
| Totals | 163,571 | 209,509 | 329,700 |
| Grand Totals | 1,152,736 | 1,276,336 | 1,842,263 |
On a country of origin basis the following table shows for the latest 7 June years the percentage of the value (c.d.v.) of total New Zealand imports.
| Country | June Year 1968 | June Year 1969 | June Year 1970 | June Year 1971 | June Year 1972 | June Year 1973* | June Year 1974* |
|---|---|---|---|---|---|---|---|
*Provisional. †Iceland included in EFTA from 1970. ‡Does not include statistics for that part of China known as Taiwan. | |||||||
| Sterling Area— | |||||||
| percent | |||||||
| Australia | 21.33 | 19.81 | 20.95 | 21.06 | 23.19 | 25.14 | 24.39 |
| Bahrain | 0.06 | 0.21 | 0.39 | 0.42 | 0.51 | 0.47 | 0.60 |
| Fiji | 0.11 | 0.31 | 0.10 | 0.29 | 0.24 | 0.28 | 0.04 |
| Ghana | 0.33 | 0.13 | 0.29 | 0.19 | 0.15 | 0.18 | 0.17 |
| Hong Kong | 2.09 | 1.72 | 1.89 | 1.74 | 1.67 | 1.57 | 2.21 |
| India | 0.94 | 1.11 | 0.90 | 0.64 | 1.07 | 0.86 | 0.80 |
| Malaysia | 0.75 | 0.83 | 0.68 | 0.52 | 0.44 | 0.63 | 0.64 |
| Nauru | 0.66 | 0.77 | 0.67 | 0.52 | 0.46 | 0.39 | 0.25 |
| Singapore | 0.29 | 0.38 | 0.32 | 0.16 | 0.37 | 0.66 | 1.71 |
| South Africa | 0.38 | 0.49 | 0.42 | 0.31 | 0.28 | 0.34 | 0.33 |
| Sri Lanka (Ceylon) | 0.71 | 0.62 | 0.47 | 0.34 | 0.38 | 0.28 | 0.17 |
| United Kingdom | 30.16 | 30.47 | 29.55 | 28.95 | 28.54 | 23.81 | 19.05 |
| Western Samoa | 0.22 | 0.16 | 0.15 | 0.14 | 0.11 | 0.10 | 0.16 |
| Other† | 3.92 | 3.89 | 3.67 | 3.73 | 3.40 | 3.35 | 4.12 |
| Totals | 61.95 | 60.89 | 60.45 | 58.99 | 60.80 | 58.06 | 54.64 |
| E.F.T.A.— | |||||||
| Austria | 0.12 | 0.11 | 0.15 | 0.17 | 0.17 | 0.18 | 0.20 |
| Iceland | † | † | -- | -- | -- | -- | -- |
| Norway | 0.17 | 0.19 | 0.14 | 0.20 | 0.24 | 0.16 | 0.31 |
| Portugal | 0.08 | 0.08 | 0.07 | 0.06 | 0.09 | 0.08 | 0.08 |
| Sweden | 1.30 | 1.17 | 0.77 | 0.79 | 1.19 | 0.96 | 0.85 |
| Switzerland | 1.20 | 1.16 | 0.99 | 1.02 | 1.00 | 1.00 | 0.97 |
| 2.69 | 2.72 | 2.13 | 2.22 | 2.68 | 2.39 | 2.41 | |
| E.E.C. (excluding U.K. and Ireland, Republic of)— | |||||||
| Belgium and Luxembourg | 0.44 | 0.52 | 0.47 | 0.63 | 0.56 | 0.56 | 0.73 |
| Denmark | 0.30 | 0.23 | 0.26 | 0.26 | 0.36 | 0.29 | 0.29 |
| France and Monaco | 0.83 | 0.83 | 0.83 | 1.03 | 0.98 | 1.01 | 0.98 |
| Germany, Fed. Rep. of (West) | 3.38 | 4.23 | 3.89 | 4.59 | 4.28 | 3.99 | 4.71 |
| Italy | 1.34 | 1.39 | 1.26 | 1.34 | 1.34 | 1.27 | 1.60 |
| Netherlands | 1.07 | 1.05 | 1.02 | 1.32 | 1.01 | 1.26 | 1.54 |
| Totals | 7.37 | 8.26 | 7.70 | 9.18 | 8.52 | 8.38 | 9.86 |
| Dollar Area— | |||||||
| Canada | 4.74 | 3.81 | 3.97 | 3.58 | 3.17 | 2.71 | 2.42 |
| U.S.A. | 10.97 | 12.47 | 13.04 | 12.13 | 10.12 | 11.41 | 12.21 |
| Other | 0.49 | 0.16 | 0.68 | 0.72 | 0.52 | 0.63 | 0.56 |
| Totals | 16.20 | 16.44 | 17.69 | 16.43 | 13.81 | 14.76 | 15.20 |
| Other Countries— | |||||||
| China‡ | 0.46 | 0.62 | 0.46 | 0.42 | 0.46 | 0.54 | 0.78 |
| Czechoslovakia | 0.21 | 0.19 | 0.19 | 0.17 | 0.12 | 0.14 | 0.15 |
| Indonesia | 0.11 | 0.13 | 0.17 | 0.08 | 0.10 | 0.14 | 0.10 |
| Iran | 1.57 | 1.27 | 1.21 | 0.84 | 0.92 | 0.77 | 1.01 |
| Japan | 8.25 | 8.08 | 8.27 | 10.30 | 11.16 | 13.07 | 13.46 |
| Netherlands, Antilles | 0.02 | 0.01 | 0.01 | 0.01 | |||
| Saudi Arabia | 0.58 | 0.62 | 0.53 | 0.42 | 0.32 | 0.50 | 0.25 |
| Other | 0.59 | 0.76 | 1.19 | 0.93 | 1.11 | 1.26 | 2.14 |
| Totals | 11.79 | 11.69 | 12.02 | 13.18 | 14.19 | 16.41 | 17.90 |
| Grand Totals | 100.00 | 100.000 | 100.00 | 100.0 | 1.00 | 100.00 | 100.00 |
ORIGIN OF PRINCIPAL IMPORTS—The table which follows shows details of principal commodity imports by country of origin for years ended June 1971 and 1972. C.d.v. basis of valuation is used.
| ORIGIN OF PRINCIPAL IMPORTS | ||
|---|---|---|
| Commodity and Countries of Origin | Value of Imports | |
| 1970-71 | 1971-72 | |
| *Does not include statistics for that part of China known as Taiwan. | ||
| $(000) | ||
| Oranges— | ||
| Australia | 1,499 | 1,352 |
| All countries | 1,965 | 2,488 |
| Bananas— | ||
| Costa Rica | - | - |
| Ecuador | 1,284 | 1,505 |
| Tonga | 75 | 101 |
| Western Samoa | 127 | 153 |
| All countries | 1,534 | 1,807 |
| Dried Fruits— | ||
| Australia | 3,490 | 4,437 |
| U.S.A. | 1,256 | 1,077 |
| All countries | 5,248 | 5,986 |
| Whisky— | ||
| United Kingdom | 2,312 | 2,622 |
| All countries | 2,600 | 3,054 |
| Tobacco— | ||
| (Unmanufactured)— | ||
| South Africa | 335 | 148 |
| U.S.A. | 4,942 | 3,766 |
| All countries | 6,075 | 5,064 |
| Rubber (Crude and Synthetic)— | ||
| Canada | 366 | 215 |
| France and Monaco | 196 | 281 |
| Malaysia | 3,008 | 2,542 |
| United Kingdom | 276 | 295 |
| U.S.A | 1,191 | 716 |
| All countries | 7,085 | 6,629 |
| Wood (Shaped or Simply Worked)— | ||
| Australia | 720 | 806 |
| Canada | 414 | 439 |
| Ghana | 661 | 378 |
| U.S.A | 814 | 601 |
| All countries | 3,136 | 2,549 |
| Pulp and Waste Paper— | ||
| Canada | 413 | 232 |
| Finland | 177 | - |
| Germany, Fed. Rep. | 3 | 2 |
| Sweden | 9 | 20 |
| All countries | 2,376 | 1,684 |
| Wool and Other Animal Hair— | ||
| Australia | 1,545 | 851 |
| United Kingdom | 1,101 | 669 |
| All countries | 2,676 | 1,577 |
| Sugar (not refined)— | ||
| Australia | 2,934 | 2,764 |
| Fiji | 2,796 | 2,507 |
| All countries | 11,206 | 18,441 |
| Natural Phosphates— | ||
| Australia | 2,651 | 2,957 |
| Gilbert and Ellice Islands | 2,165 | 4,413 |
| Nauru | 5,539 | 5,295 |
| U.S.A | ||
| All countries | 10,357 | 12,667 |
| Raw Coffee— | ||
| Brazil | 1,770 | 1,741 |
| Papua/New Guinea | 470 | 517 |
| Tanzania | 605 | 567 |
| Uganda | 1,903 | 1,200 |
| All countries | 5,301 | 4,479 |
| Cocoa— | ||
| Ghana | 1,399 | 1,226 |
| Netherlands | 635 | 507 |
| All countries | 2,306 | 1,964 |
| Tea— | ||
| India | 269 | 295 |
| Sri Lanka (Ceylon) | 3,407 | 4,116 |
| All countries | 4,182 | 5,381 |
| Petroleum Spirit— | ||
| Australia | 2,686 | 3,252 |
| Iran | 2,982 | 2,423 |
| Malaysia | 16 | - |
| People's Democratic Republic of Yemen | 467 | 92 |
| Singapore | 386 | 376 |
| Venezuela | - | - |
| All countries | 8,227 | 10,364 |
| Kerosene— | ||
| Australia | 3,691 | 4,786 |
| Iran | 840 | 652 |
| People's Democratic Republic of Yemen | 816 | 85 |
| Singapore | - | 139 |
| All countries | 6,138 | 6,306 |
| Lubricating Oils and Greases— | ||
| Australia | 3,484 | 2,893 |
| United Kingdom | 406 | 413 |
| U.S.A | 405 | 529 |
| All countries | 4,419 | 3,945 |
| Organic Chemicals— | ||
| Australia | 5,386 | 5,816 |
| Germany, Fed. Rep. | 2,054 | 1,621 |
| Japan | 3,277 | 2,564 |
| United Kingdom | 4.723 | 4,309 |
| U.S.A | 6,665 | 5,928 |
| All countries | 24,917 | 22,953 |
| Inorganic Chemicals— | ||
| Australia | 2,997 | 11,307 |
| Germany, Fed. Rep. | 981 | 878 |
| Japan | 1,916 | 2,604 |
| United Kingdom | 2,320 | 2,095 |
| U.S.A. | 2,129 | 2,163 |
| All countries | 12,501 | 22,226 |
| Medicinal and Pharmaceutical Products— | ||
| Australia | 8,012 | 7,948 |
| Germany, Fed. Rep. | 2,251 | 2,686 |
| Switzerland | 2,913 | 3,316 |
| United Kingdom | 9,895 | 9,359 |
| U.S.A. | 2,527 | 3,109 |
| All countries | 27,866 | 28,951 |
| Sulphur (Other Than Sublimed, etc.)— | ||
| Canada | 2,390 | 2,976 |
| U.S.A. | 1,240 | 121 |
| All countries | 3,684 | 3,165 |
| Plastic Materials, Regenerated Cellulose, and Artificial Resins— | ||
| Australia | 6,304 | 5,599 |
| Germany, Fed. Rep. | 3,31 J | 2,092 |
| Japan | 5,319 | 4,736 |
| United Kingdom | 7,359 | 6,243 |
| U.S.A. | 4,832 | 4,309 |
| All countries | 30,390 | 26,057 |
| Rubber Tyres and Tubes— | ||
| United Kingdom | 825 | 1,116 |
| U.S.A. | 725 | 837 |
| All countries | 2,428 | 3,492 |
| Paper and Paperboard— | ||
| Australia | 1,628 | 2,254 |
| Japan | 1,673 | 1,767 |
| United Kingdom | 3,875 | 3,331 |
| U.S.A. | 1,264 | 1,310 |
| All countries | 10,083 | 10,604 |
| Textile Yarn and Thread— | ||
| Australia | 3,272 | 3,305 |
| Hong Kong | 3,117 | 2,796 |
| Japan | 1,549 | 1,726 |
| United Kingdom | 4,064 | 4,296 |
| All countries | 14,475 | 15,649 |
| Cotton Fabrics Suitable for Manufacture of Apparel— | ||
| $(000) | ||
| Australia | 682 | 451 |
| China* | 922 | 1,636 |
| Hong Kong | 4,375 | 4,244 |
| Japan | 3,056 | 3,247 |
| United Kingdom | 571 | 515 |
| U.S.A. | 548 | 788 |
| All countries | 11,936 | 13,560 |
| Cotton Furnishing and Household Fabrics— | ||
| Hong Kong | 2,956 | 3,744 |
| India | 811 | 948 |
| United Kingdom | 1,308 | 1,092 |
| All countries | 7,719 | 8,877 |
| Manufactured Fertilisers— | ||
| Canada | 2,032 | 1,548 |
| Germany, Fed. Rep. | 905 | 955 |
| U.S.A. | 2,839 | 3,552 |
| All countries | 7,331 | 7,891 |
| Woven Fabrics of Synthetic Fibres— | ||
| Australia | 1,372 | 1,339 |
| Japan | 9,873 | 11,886 |
| United Kingdom | 1,188 | 1,222 |
| U.S.A. | 743 | 716 |
| All countries | 15,836 | 19,015 |
| Woven Fabrics of Regenerated Artificial Fibres— | ||
| Japan | 1,582 | 1,957 |
| United Kingdom | 2,555 | 2,019 |
| U.S.A. | 458 | 320 |
| All countries | 7,068 | 6,866 |
| Knitted or Crocheted Fabrics— | ||
| Australia | 720 | 1,055 |
| Hong Kong | 2,212 | 1,267 |
| United Kingdom | 1,364 | 1,620 |
| U.S.A. | 223 | 169 |
| All countries | 5,321 | 5,869 |
| Household Linens— | ||
| China* | 219 | 281 |
| Hong Kong | 726 | 616 |
| India | 167 | 250 |
| Japan | 475 | 400 |
| United Kingdom | 394 | 251 |
| U.S.A. | 126 | 126 |
| All countries | 2,544 | 2,579 |
| Glass— | ||
| Netherlands | 486 | 172 |
| United Kingdom | 2,319 | 2,079 |
| U.S.A. | 635 | 308 |
| All countries | 4,567 | 3,626 |
| Bars and Rods of Iron or Steel— | ||
| Australia | 3,315 | 2,872 |
| Canada | 995 | 376 |
| United Kingdom | 1,300 | 1,056 |
| All countries | 7,459 | 5,279 |
| Woven Woollen Fabrics— | ||
| Australia | 850 | 450 |
| United Kingdom | 2,867 | 1,930 |
| All countries | 4,349 | 2,798 |
| Woven Jute Fabrics— | ||
| India | 2,103 | 3,252 |
| United Kingdom | 166 | 100 |
| All countries | 2,788 | 3,784 |
| Universals, Plates, and Sheets of Iron or Steel— | ||
| Australia | 8,223 | 6,929 |
| Japan | 18,967 | 23,661 |
| United Kingdom | 4,215 | 4,533 |
| All countries | 33,299 | 37,011 |
| Hoop and Strip of Iron or Steel— | ||
| Australia | 939 | 984 |
| Japan | 750 | 1,009 |
| United Kingdom | 1,227 | 708 |
| All countries | 3,350 | 3,019 |
| Iron and Steel Wire— | ||
| Australia | 2,354 | 2,079 |
| United Kingdom | 2,094 | 1,595 |
| All countries | 5,627 | 4,594 |
| Tubes, Pipes, and Fittings of Iron or Steel— | ||
| Australia | 6,588 | 3,627 |
| United Kingdom | 3,768 | 4,298 |
| All countries | 12,218 | 9,493 |
| Copper and Copper Alloys— | ||
| Australia | 12,906 | 9,975 |
| Canada | 1,950 | 1,039 |
| United Kingdom | 2,834 | 2,353 |
| All countries | 17,894 | 13,577 |
| Aluminium and Aluminium Alloys— | ||
| Australia | 4,378 | 5,174 |
| Canada | 7,373 | 3,913 |
| United Kingdom | 620 | 670 |
| U.S.A. | 962 | 748 |
| All countries | 15,098 | 11,176 |
| Nails, Screws, Nuts, Bolts, etc., of Iron, Steel, Copper— | ||
| Australia | 880 | 781 |
| United Kingdom | 1,422 | 1,356 |
| All countries | 3,394 | 3,380 |
| Angles, Shapes and Sections of Iron or Steel— | ||
| Australia | 3,499 | 2,307 |
| Japan | 3,656 | 1,436 |
| United Kingdom | 1,865 | 1,668 |
| All countries | 10,267 | 5,562 |
| Aircraft Engines— | ||
| United Kingdom | 739 | 441 |
| U.S.A. | 3,114 | 3,699 |
| All countries | 3,893 | 4,192 |
| Internal Combustion Engines, Not Aircraft— | ||
| Australia | 785 | 1,090 |
| Canada | 1,873 | 1,530 |
| United Kingdom | 4,558 | 3,684 |
| U.S.A. | 4,419 | 2,755 |
| All countries | 13,546 | 10,521 |
| Agricultural Machinery and Appliances— | ||
| Germany, Fed. Rep. | 427 | 295 |
| United Kingdom | 1,612 | 1,036 |
| U.S.A. | 498 | 405 |
| All countries | 3,557 | 2,493 |
| Tractors— | ||
| Italy | 1,051 | 714 |
| Japan | 1,042 | 710 |
| United Kingdom | 8,000 | 8,645 |
| U.S.A. | 3,383 | 2,823 |
| All countries | 14,569 | 14,005 |
| Office Machines— | ||
| Germany, Fed. Rep. | 626 | 585 |
| Japan | 1,599 | 1,779 |
| United Kingdom | 2,981 | 4,208 |
| U.S.A. | 2,517 | 1,900 |
| All countries | 9,924 | 11,213 |
| Metalworking Machinery— | ||
| Australia | 562 | 752 |
| Germany, Fed. Rep. | 1,007 | 1,524 |
| Japan | 627 | 328 |
| United Kingdom | 2,971 | 3,825 |
| U.S.A | 672 | 547 |
| All countries | 7,114 | 9,445 |
| Textile Machinery— | ||
| Germany, Fed. Rep. | 2,318 | 1,282 |
| United Kingdom | 4,239 | 3,224 |
| U.S.A | 431 | 334 |
| All countries | 9,765 | 7,188 |
| Cutlery— | ||
| Australia | 942 | 964 |
| Japan | 464 | 474 |
| United Kingdom | 1,128 | 963 |
| All countries | 3,242 | 3,095 |
| Excavating, Levelling, Boring, etc., Machinery— | ||
| United Kingdom | 2,113 | 1,994 |
| U.S.A | 4,063 | 2,268 |
| All countries | 7,647 | 6,180 |
| Pumps and Centrifuges— | ||
| Australia | 2,849 | 4,275 |
| United Kingdom | 4,336 | 4,106 |
| U.S.A. | 2,072 | 1,569 |
| All countries. | 12,385 | 14,490 |
| Mechanical Handling Equipment— | ||
| United Kingdom | 4,551 | 4,035 |
| U.S.A | 2,290 | 2,347 |
| All countries | 12,110 | 9,728 |
| Ball, Roller, and Needle Roller Bearings— | ||
| Sweden | 429 | 470 |
| United Kingdom | 2,094 | 2,059 |
| U.S.A. | 619 | 492 |
| All countries | 4,548 | 4,301 |
| Taps, Cocks, Valves— | ||
| Australia | 1,149 | 1,111 |
| United Kingdom | 2,081 | 2,336 |
| U.S.A | 794 | 621 |
| All countries | 4,833 | 5,152 |
| Transmission Shafts and Cranks— | ||
| $(000) | ||
| Australia | 911 | 1,001 |
| United Kingdom | 2,526 | 2,734 |
| U.S.A. | 1,171 | 1,096 |
| All countries | 5,355 | 6,053 |
| Electrical Power Machinery and Switchgear— | ||
| Australia | 3,480 | 3,692 |
| Germany, Fed. Rep. | 1,367 | 481 |
| Italy | 259 | 526 |
| Japan | 3,330 | 3,723 |
| Sweden | 956 | 1,059 |
| Switzerland | 463 | 482 |
| United Kingdom | 11,027 | 13,310 |
| U.S.A. | 1,456 | 1,206 |
| All countries | 24,010 | 27,179 |
| Printing and Bookbinding Machinery— | ||
| Germany, Fed. Rep. | 1,029 | 2,308 |
| United Kingdom | 2,032 | 1,421 |
| U.S.A. | 1,510 | 1,399 |
| All countries | 5,866 | 6,106 |
| Electrical Measuring and Controlling Apparatus— | ||
| United Kingdom | 2,416 | 2,585 |
| U.S.A. | 1,031 | 950 |
| All countries | 4,813 | 5,312 |
| Telecommunications Equipment— | ||
| United Kingdom | 8,088 | 8,683 |
| U.S.A. | 528 | 308 |
| All countries | 12,881 | 11,260 |
| Railway Vehicles— | ||
| Australia | 260 | 192 |
| Canada | 4 | 2 |
| Japan | 192 | 2,870 |
| United Kingdom | 364 | 354 |
| All countries | 1,459 | 7,895 |
| Motorcars— | ||
| Australia | 25,691 | 50,276 |
| France and Monaco | 1,920 | 1,682 |
| Germany, Fed. Rep. | 2,677 | 1,540 |
| Italy | 1,763 | 2,124 |
| Japan | 3,578 | 11,449 |
| United Kingdom | 40,702 | 40,114 |
| All countries | 76,922 | 107,633 |
| Lorries, Trucks, and Vans— | ||
| Australia | 6,601 | 6,175 |
| United Kingdom | 17,863 | 16,617 |
| All countries | 29,488 | 28,479 |
| Aircraft— | ||
| United Kingdom | 393 | 1,321 |
| U.S.A. | 1,398 | 4,729 |
| All countries | 5,046 | 6,905 |
| Ships and Boats— | ||
| Hong Kong | - | - |
| United Kingdom | 2,405 | 15,026 |
| All countries | 2,501 | 18,199 |
| Equipment for Distributing Electricity— | ||
| Australia | 1,403 | 1,150 |
| United Kingdom | 2,564 | 2,045 |
| All countries | 4,867 | 4,092 |
| Watches and Clocks— | ||
| Germany, Fed. Rep. | 519 | 521 |
| Switzerland | 1,177 | 1,245 |
| United Kingdom | 603 | 536 |
| All countries | 3,806 | 4,023 |
| Photographic Films, Plates, and Paper (Not Developed Cinematographic Film)— | ||
| Australia | 3,650 | 3,939 |
| United Kingdom | 1,264 | 1,152 |
| All countries | 7,552 | 7,651 |
| Clothing— | ||
| Australia | 351 | 423 |
| Hong Kong | 445 | 522 |
| United Kingdom | 1,385 | 1,304 |
| All countries | 3,006 | 3,195 |
| Printed Books and Pamphlets— | ||
| Australia | 3,076 | 3,828 |
| United Kingdom | 7,254 | 8,120 |
| U.S.A. | 2,722 | 3,231 |
| All countries | 14,795 | 17,695 |
| Newspapers and Periodicals— | ||
| Australia | 2,123 | 1,187 |
| United Kingdom | 1,672 | 901 |
| U.S.A. | 877 | 421 |
| All countries | 4,753 | 2,558 |
QUANTITIES OF PRINCIPAL ITEMS IMPORTED—The following table shows the quantities imported during June years of a large number of the principal items.
| Item | Unit of Quantity | Year Ended 30 June | |||
|---|---|---|---|---|---|
| 1971 | 1972 | 1973* | 1974* | ||
| *Provisional. | |||||
| Fish, canned, and fish preparations | tonne | 4,798 | 3,119 | 3,733 | 5,573 |
| Wheat, unmilled | tonne | 82,719 | 46,788 | - | 51,363 |
| Rice | tonne | 5,021 | 4,964 | 6,024 | 6,122 |
| Oranges | tonne | 14,510 | 16,694 | 16,040 | 17,040 |
| Bananas | tonne | 22,171 | 24,549 | 30,072 | 34,967 |
| Fruit— | |||||
| Dried | tonne | 9,713 | 10,389 | 10,577 | 9,095 |
| Canned | tonne | 6,436 | 7,315 | 7,875 | 7,492 |
| Desiccated coconut. | tonne | 1,282 | 1,319 | 1,482 | 1,341 |
| Edible nuts | tonne | 1,142 | 1,146 | 1,334 | 1,516 |
| Sugar | tonne | 167,765 | 196,232 | 148,193 | 179,437 |
| Coffee, raw | tonne | 7,012 | 6,532 | 4,968 | 5,126 |
| Tea | tonne | 6,668 | 8,032 | 8,330 | 7,471 |
| Cocoa | tonne | 4,047 | 4,109 | 6,130 | 4,329 |
| Wine | litre (000) | 1,547 | 2,039 | 2,306 | 2,751 |
| Whisky | proof litre (000) | 2,224 | 2,293 | 2,582 | 3,608 |
| Tobacco, unmanufactured | tonne | 3,378 | 2,895 | 3,460 | 4,087 |
| Synthetic and artificial fibres | tonne | 3,204 | 2,996 | 5,073 | 5,2 |
| Woven fabrics— | |||||
| Synthetic fibres | sq metre (000) | 24,270 | 31,722 | 40,283 | 58,493 |
| Artificial fibres | sq metre (000) | 10,323 | 9,514 | 9,286 | 13,233 |
| Yarn and thread of silk, rayon, and synthetic fibres | tonne | 2,564 | 2,787 | 3,207 | 4,649 |
| Yarn of wool and animal hair | tonne | 101 | 226 | 79 | 215 |
| Meat wraps, cotton | tonne | 1,978 | 2,036 | 1,681 | 2,133 |
| Textile fabrics coated with plastic | sq metre (000) | 1,361 | 1,898 | 3,703 | 4,895 |
| Bags, sacks, wool packs | doz (000) | 610 | 632 | 549 | 338 |
| Cotton yarn and thread | tonne | 3,790 | 3,460 | 3,407 | 5,025 |
| Cotton fabrics, woven, unbleached | sq metre (000) | 7,795 | 8,963 | 6,638 | 12,246 |
| Cotton canvas and duck | sq metre (000) | 1,427 | 1,480 | 1,221 | 2,133 |
| Cotton fabrics suitable for the manufacture of apparel | |||||
| Flannelette, winceyette, diaper cloth. | sq metre (000) | 7,873 | 8,332 | 8,104 | 13,723 |
| Other kinds | ” | 21,419 | 22,965 | 26,241 | 39,217 |
| Cotton furnishing and household fabrics | ” | 21,369 | 24,455 | 15,805 | 30,479 |
| Woven silk fabrics | ” | 149 | 145 | 125 | 155 |
| Woven woollen fabrics | ” | 2,451 | 1,523 | 1,049 | 1,216 |
| Woven linen, ramie, and hemp fabrics | "5 | 1,300 | 1,136 | 1,200 | 1,408 |
| Woven jute fabrics | ” | 22,115 | 26,320 | 24,956 | 28,093 |
| Rubber | tonne | 20,305 | 21,378 | 23,091 | 31,173 |
| Timber, sawn | cu metre | 38,834 | 31,204 | 39,589 | 64,565 |
| Wood and paper pulp | tonne | 17,531 | 12,920 | 13,854 | 11,521 |
| Nitrate of soda | tonne | 139 | 381 | 1,417 | 1,103 |
| Fertilisers, phosphatic | tonne (000) | 998 | 1,173 | 1,112 | 1,102 |
| Gypsum, crude | tonne | 105,287 | 104,380 | 127,503 | 199,219 |
| Sulphur | tonne | 190,027 | 181,093 | 261,646 | 243,939 |
| Salt | tonne | 31,019 | 27,158 | 26,316 | 44,077 |
| Asbestos | ” | 8,338 | 6,713 | 8,812 | 7,117 |
| Petroleum, crude | tonne (000) | 1,912 | 1,946 | 2,260 | 2,473 |
| Petroleum, partly refined | ” | 1,041 | 825 | 913 | 804 |
| Motor spirit | litre (000) | 322,204 | 400,701 | 347,377 | 753,274 |
| Distillate fuels | ” | 229,270 | 254,636 | 295,639 | 509,633 |
| Kerosene and white spirit | ” | 262,204 | 248,952 | 312,494 | 332,441 |
| Lubricating oils and preparations | ” | 61,668 | 53,677 | 61,401 | 70,840 |
| Cream of tartar and substitutes | tonne | 6,966 | 4,140 | 5,132 | 5,701 |
| Acids | ” | 1,904 | 2,057 | 2,639 | 5,058 |
| Caustic soda | ” | 11,369 | 12,825 | 13,080 | 10,855 |
| Carbonate of soda | ” | 21,538 | 33,403 | 22,957 | 37,102 |
| Calcium carbide | ” | 3,551 | 3,193 | 3,527 | 2,870 |
| Sulphate of ammonia | tonne | 21,094 | 19,402 | 56,639 | 44,426 |
| Potash | ” | 198,127 | 180,106 | 257,988 | 301,418 |
| Pig iron and ingots | tonne | 27,132 | 9,534 | 37,823 | 26,205 |
| Bars and rods of iron or steel | ” | 78,056 | 30,713 | 32,175 | 49,562 |
| Angles, shapes and sections of iron or steel | ” | 82,415 | 43,128 | 55,606 | 80,580 |
| Universals, plates and sheets of iron or steel | ” | 219,540 | 267,327 | 318,668 | 398,066 |
| Hoops and strip of iron or steel | tonne | 12,735 | 13,094 | 16,221 | 21,960 |
| Rails of iron or steel— | |||||
| fish plates, etc. | tonne | 14,794 | 10,644 | 11,631 | 11,021 |
| Iron and steel wire | ” | 23,8311 | 17,928 | 19,614 | 33,814 |
| Tubes, pipes, and fittings of iron or steel | ” | 51,614 | 35,219 | 30,411 | 40,844 |
| Silver and platinum not fully worked | gram (000) | 38,316.4 | 36.473.8 | 45,051 | 65,193 |
| Copper and copper alloys | tonne | 12,473 | 10,573 | 11,463 | 15,386 |
| Aluminium and aluminium alloys | ” | 22,766 | 16,331 | 5,235 | 7,995 |
| Lead and lead alloys | ” | 4,122 | 7,040 | 6,136 | 7,635 |
| Finished structural parts and constructions | ” | 12,370 | 14,172 | 10,920 | 4,225 |
| Wire products | ” | 4,924 | 4,392 | 4,642 | 6,095 |
| Nails, screws, nuts, bolts, etc. | ” | 2,750 | 3,247 | 3,093 | 3,435 |
| Hand, tools | doz(000) | 471.6 | 482.4 | 544.6 | 754.6 |
| Knives, kitchen and table | ” | 99.5 | 103.0 | 75.7 | 117.7 |
| Spoons and forks | ” | 207.4 | 239.7 | 273.8 | 435.0 |
| Internal combustion engines (not aircraft) | number | 106,361 | 79,031 | 105,606 | 149,589 |
| Agricultural mowers— | |||||
| crops, lawn, weed, scrub cutting | ” | 2,156 | 1,744 | 1,325 | 1,844 |
| Agricultural harvesters and threshers— | |||||
| forage, tobacco | ” | 122 | 210 | 176 | 280 |
| Earthmoving machines | ” | 305 | 255 | 375 | 1,366 |
| Typewriting, calculating, and accounting machines | ” | 30,628 | 37,599 | 40,887 | 127,686 |
| Domestic sewing machines | ” | 42,162 | 38,915 | 45,142 | 55,767 |
| Electric motors— | |||||
| Under 1 bhp | ” | 409,311 | 398,053 | 428,446 | 412,154 |
| 1 bhp and over | ” | 23,838 | 16,733 | 20,078 | 25,374 |
| Sparking plugs | (000) | 436 | 476 | 599 | 675 |
| Tractors | number | 4,580 | 4,271 | 5,231 | 5,872 |
| Motorcars— | |||||
| Unassembled | ” | 58,008 | 65,738 | 69,427 | 74,220 |
| Assembled | ” | 13,414 | 22,144 | 16,959 | 30,175 |
| Lorries, trucks, buses, vans, etc.— | |||||
| Unassembled | ” | 20,997 | 20,892 | 11,165 | 13,428 |
| Assembled | ” | 204 | 741 | 301 | 2,217 |
| Motor cycles | ” | 15,476 | 19,739 | 26,095 | 40,452 |
| Bicycles | ” | 7,183 | 7,739 | 7,715 | 15,593 |
| Rubber tyres and tubes (excl. bicycle) | tonne | 1,458 | 2,160 | 4,281 | 8,850 |
| Plywood | sq metre | 134,638 | 145,964 | 351,125 | 1,528,636 |
| Newsprint paper | tonne | 511 | 359 | 547 | 7,546 |
| Printing and writing paper— | |||||
| Machine made, not processed | ” | 5,187 | 4,865 | 4,631 | 6,435 |
| Impregnated, coated, or printed | ” | 7,882 | 8,094 | 9,406 | 13,613 |
| Machine-made paper and paperboards n.e.s. | ” | 3,191 | 3,117 | 3,492 | 5,861 |
| Greaseproof paper, etc. | ” | 2,104 | 1,960 | 1,569 | 2,014 |
| Wallpaper | rolls (000) | 46.1 | 47.2 | 58.0 | 67.2 |
| Linoleum and similar floor coverings | sq metre (000) | 768.5 | 700.2 | 1,408.2 | 937.9 |
| Carpets and carpeting of or with wool | ” | 2.5.4 | 36.6 | 18.5 | 66.2 |
| Glass plate and sheet | sq metre | 954,094 | 780,163 | 1,001,828 | 1,445,508 |
| Tableware and toilet pottery | tonne | 1,142 | 1,310 | 1,213 | 934 |
| Footwear | doz pr(000) | 85.0 | 97.8 | 103.9 | 132.2 |
| Cameras, photographic | (000) | 104.7 | 94.7 | 157.5 | 172.5 |
| Watches | (000) | 265.0 | 249.9 | 220.0 | 344.1 |
| Clocks, other than electric | ” | 269.4 | 315.0 | 313.1 | 421.2 |
| Electric clocks | ” | 39.5 | 37.1 | 56.6 | 111.5 |
| Electric capacitors | ” | 18,225 | 14,880 | 19,074 | 51,634 |
| Insulated wires and cables | tonne | 1,979 | 2,015 | 2,027 | 2,150 |
| Telephone handsets. | (000) | 90.4 | 91.9 | 23.7 | 27.3 |
| Electric accumulators | ” | 32.4 | 35.3 | 55.1 | 74.6 |
| Electric lamp bulbs and tubes | " | 7,650.8 | 6,740.4 | 9,013.5 | 13,027.9 |
| Thermionic, etc., valves and tubes | ” | 1,778 | 1,764 | 1,819 | 2,925 |
| Crystal valves | ” | 5,998 | 4,487 | 8,366 | 19,389 |
CLASSIFICATION OF IMPORTS BY END-USE—In the following table imports are classified by end-use in the form of economic categories. The classification involves some arbitrary decisions but it is adapted to practical purposes and the comparability of the time series has useful economic applications.
| Class of Goods Imported† | Year Ended 30 June | ||||
|---|---|---|---|---|---|
| 1970 | 1971 | 1972 | 1973* | 1974* | |
*Provisional. †For more detailed list of items included under each heading see relevant table in Monthly Abstract of Statistics. | |||||
| $(million) | |||||
| Finished Capital Goods | 132.3 | 164.2 | 187.7 | 205.6 | 273.8 |
| Agricultural machinery and plant | 21.4 | 20.3 | 18.6 | 23.3 | 27.2 |
| Industrial machinery and plant | 42.2 | 53.6 | 78.4 | 69.2 | 82.4 |
| Construction machinery and plant | 3.3 | 6.2 | 4.9 | 11.0 | 20.4 |
| Transport and communication items | 13.9 | 18.9 | 24.6 | 27.3 | 43.4 |
| Other complete items | 51.5 | 65.3 | 61.1 | 74.7 | 100.4 |
| Components and Materials for Capital Goods | 119.0 | 149.7 | 137.1 | 138.7 | 185.9 |
| For agricultural machinery and plant | 7.0 | 7.2 | 5.6 | 6.8 | 8.8 |
| For industrial machinery and plant | 13.1 | 14.8 | 16.2 | 16.4 | 23.3 |
| For construction machinery and plant | 0.9 | 1.1 | 1.5 | 1.8 | 2.1 |
| For transport and communications items | 42.0 | 50.3 | 51.6 | 46.4 | 54.4 |
| For building, construction, roads | 6.3 | 10.6 | 10.0 | 9.0 | 13.8 |
| For other capital items | 49.7 | 65.6 | 52.1 | 58.3 | 83.5 |
| Finished Goods and Components | |||||
| (Classed as consumption or capital according to type of buyer) | 130.2 | 157.5 | 206.1 | 219.0 | 280.8 |
| Complete transport items | 19.5 | 29.6 | 60.6 | 49.4 | 73.8 |
| Parts for transport items | 69.7 | 77.7 | 96.2 | 114.3 | 137.0 |
| Other complete items | 16.3 | 18.7 | 18.0 | 22.5 | 28.7 |
| Parts for other items | 24.7 | 31.4 | 31.2 | 32.8 | 41.3 |
| Consumer Goods | 241.0 | 250.2 | 308.3 | 344.6 | 515.4 |
| Finished consumer goods | 116.0 | 136.6 | 152.4 | 177.1 | 257.7 |
| Components for consumer goods | 125.1 | 143.6 | 156.0 | 167.6 | 257.7 |
| Materials Used in the Production Process and Items Unable to be Separately Classified Elsewhere | 365.5 | 391.0 | 389.6 | 443.5 | 746.8 |
| Stores Used Only for Defence | 19.1 | 13.0 | 10.2 | 14.9 | 11.4 |
| Totals | 1,007.2 | 1,155.5 | 1,239.0 | 1,366.3 | 2,014.2 |
| Finished Capital Goods | 13.1 | 14.2 | 15.2 | 15.1 | 13.6 |
| Agricultural machinery and plant | 2.1 | 1.8 | 1.5 | 1.7 | 1.4 |
| Industrial machinery and plant | 4.2 | 4.6 | 6.3 | 5.1 | 4.1 |
| Construction machinery and plant | 0.3 | 0.5 | 0.4 | 0.8 | 1.0 |
| Transport and communications items | 1.4 | 1.6 | 2.0 | 2.0 | 2.2 |
| Other complete items | 5.1 | 5.7 | 4.9 | 5.5 | 5.0 |
| Components and Materials for Capital Goods | 11.8 | 13.0 | 11.1 | 10.2 | 9.2 |
| For agricultural machinery and plant | 0.7 | 0.6 | 0.5 | 0.5 | 0.4 |
| For industrial machinery and plant | 1.3 | 1.3 | 1.3 | 1.2 | 1.2 |
| For construction machinery and plant | 0.1 | 0.1 | 0.1 | 0.1 | 0.1 |
| For transport and communications items | 4.2 | 4.4 | 4.2 | 3.4 | 2.7 |
| For building, construction, roads | 0.6 | 0.9 | 0.8 | 0.7 | 0.7 |
| For other capital items | 4.9 | 5.7 | 4.2 | 4.3 | 4.2 |
| Finished Goods and Components | |||||
| (Classed as consumption or capital according to type of buyer) | 12.9 | 13.6 | 16.6 | 16.0 | 13.9 |
| Complete transport items | 1.9 | 2.6 | 4.9 | 3.6 | 3.7 |
| Parts for transport items | 6.9 | 6.7 | 7.8 | 8.4 | 6.8 |
| Other complete items | 1.6 | 1.6 | 1.5 | 1.6 | 1.4 |
| Parts for other items | 2.5 | 2.7 | 2.5 | 2.4 | 2.1 |
| Consumer Goods | 23.9 | 24.3 | 24.9 | 25.2 | 25.6 |
| Finished consumer goods | 11.5 | 11.8 | 12.3 | 13.0 | 12.8 |
| Components for consumer goods | 12.4 | 12.4 | 12.6 | 12.3 | 12.8 |
| Materials Used in the Production Process and Items Unable to be Separately Classified Elsewhere | 36.3 | 33.8 | 31.4 | 32.5 | 37.1 |
| Stores Used Only for Defence | 1.9 | 1.1 | 0.8 | 1.1 | 0.6 |
| Totals | 100.0 | 100.0 | 100.0 | 100.0 | 100.0 |
IMPORTS BY PORTS—In 1971 New Zealand had 17 ports of entry for Customs purposes—ten in the North Island and seven in the South Island. The following table gives the total value of imports of merchandise for the several ports of entry. The value of overseas cargo landed at other ports is included with the appropriate port of entry. Basis of valuation is c.d.v.
| Port | June Year 1968 | June Year 1969 | June Year 1970 | June Year 1971 | June Year 1972 |
|---|---|---|---|---|---|
| $(thousand) | |||||
| Whangarei | 33,491 | 37,315 | 36,982 | 43,359 | 43,955 |
| Auckland | 269,058 | 345,966 | 418,284 | 473,792 | 525,894 |
| Hamilton | 2,166 | 2,752 | 3,877 | 4,285 | 5,223 |
| Tauranga | 9,109 | 7,641 | 8,047 | 12,276 | 11,866 |
| Gisborne | 644 | 829 | 818 | 610 | 588 |
| Napier | 14,841 | 17,169 | 18,642 | 21,715 | 20,650 |
| Taranaki | 10,024 | 15,478 | 16,352 | 17,160 | 18,857 |
| Wanganui | 990 | 1,130 | 1,214 | 1,400 | 1,419 |
| Palmerston North | 2,318 | 2,901 | 4,340 | 3,998 | 4,918 |
| Wellington | 169,549 | 222,266 | 271,201 | 306,508 | 318,829 |
| Picton | 530 | 238 | 254 | 390 | 395 |
| Nelson | 4,374 | 5,500 | 6,208 | 9,614 | 8,817 |
| Greymouth | 475 | 405 | 404 | 511 | 3,471 |
| Lyttelton | 71,341 | 102,163 | 114,606 | 117,358 | 129,598 |
| Timaru | 3,426 | 3,297 | 3,586 | 2,436 | 3,178 |
| Otago | 20,462 | 24,927 | 28,905 | 29,131 | 28,908 |
| Bluff | 10,110 | 9,220 | 10,606 | 26,024 | 26,170 |
| Totals | 622,908 | 799,197 | 944,324x | 1,070,567 | 1,152,736 |
Almost three-quarters of the total imports usually come in by way of Auckland or Wellington. Lyttelton occupies third place and with the advent of the oil refinery plant at Whangarei this port has now reached fourth place in importance, followed by Otago.
Imports by air have been credited to the port in whose district the overseas airport is located. Thus goods which came in through Mangere Airport were included in the Auckland figures, imports through Wellington Airport and Ohakea in the Wellington figures, and through Christchurch Airport in the Lyttelton figures. The value of imports by air, the commodities and their countries of origin are listed in a supplement to the Monthly Abstract of Statistics.
GOODS SHIPPED FROM COOK, NIUE, AND TOKELAU ISLANDS—Trade with the Cook Islands, Tokelau Islands, and Niue is not included in the export and import totals for New Zealand. The following table shows the movement of goods from these islands to New Zealand. Particulars of the trade of the islands with other countries will be found in the section dealing with New Zealand territory overseas.
| June Year | Value of Goods |
|---|---|
| $(000) | |
| 1965 | 1,867 |
| 1966 | 1,582 |
| 1967 | 1,564 |
| 1968 | 1,656 |
| 1969 | 1,852 |
| 1970 | 2,659 |
| 1971 | 2,664 |
| 1972x | 2,531 |
| 1973* | 2,803 |
| 1974* | 3,167 |
The values of principal goods brought to New Zealand from the Cook, Niue, and Tokelau Islands during the latest available June years were as follows:
| Item | Year Ended 30 June | ||
|---|---|---|---|
| 1972 | 1973* | 1974* | |
| *Provisional. | |||
| $ | $ | $ | |
| Oranges, whole fruit | 47,181 | 6,828 | 18 |
| Tangerines and mandarins, whole fruit | 27,658 | 23,942 | 68,811 |
| Lemons, grapefruit, etc., whole fruit | 6,943 | 5,323 | 11,721 |
| Bananas | 127,443 | 40,549 | 118,210 |
| Honey | 12,353 | 6,690 | 11,786 |
| Citrus fruit juices | 733,579 | 823,734 | 1,009,417 |
| Pineapple juice | 186,562 | 100,123 | 101,079 |
| Preserved fruit | 337,781x | 193,698 | 231,349 |
| Fresh tomatoes | 581 | 2,556 | 2,444 |
| Arrowroot, etc. | 10,416 | 430 | 5,880 |
| Copra | 183,920x | 63,417 | 346,465 |
| Wood manufactures (not furniture) | 30,565x | 35,188 | 30,618 |
| Textile clothing (not knitted, etc.)— | |||
| Men's and boys' outer garments | 524,033 | 797,715 | 830,326 |
| Women's and girls' outer garments | 3,763 | 7,794 | 2,257 |
| Men's and boys' undergarments | 124,880 | 187,186 | 210,326 |
| Women's, girls' and infants' undergarments | - | - | 1,838 |
| Basketwork, wickerwork, etc. | 2,287x | 1,986 | 3,688 |
| Compressed gas cylinders, etc. | 18,569 | 17,883 | 11,039 |
| Other miscellaneous items | 152,485x | 488,409 | 169,672 |
| Totals | 2,531,348x | 2,803,451 | 3,166,944 |
THE TARIFF—The objects of the Customs Tariff are as follows:
The collection of revenue.
The development of New Zealand industries.
The maintenance and extension of markets for New Zealand's exports.
The implementation of New Zealand's tariff commitments in multilateral and bilateral trade agreements.
Harmonisation with New Zealand's external political objectives including the provision of assistance to developing countries.
HISTORICAL BACKGROUND—New Zealand's first Customs Ordinance was proclaimed in 1841 with the objective of raising revenue and to some extent giving preference to goods of British origin. The prevailing economic philosophy in the latter half of the nineteenth century was directed at free trade but a tariff revision in 1895 was aimed at protecting a small range of industries. Subsequent revisions in the early part of this century which continued this practice, eliminated some duties on items which entered into the cost of living of those residing in urban areas, and extended further British preferences.
The Ottawa Agreement of 1932 stemmed from a recognition that policies had tended to become protective. In return for concessions from the United Kingdom including duty-free entry for practically all New Zealand products (see Section 21A—Marketing of Farm Produce) New Zealand agreed to restrict the use of the tariff for purely protective purposes and to give further preference to British goods. In 1934 a Tariff Commission submitted a report which conformed broadly to the principles of the Ottawa Agreement and reduced the protection for New Zealand industries in some cases. Thus, the acceptance of the Tariff Commission's recommendations reflected the fact that New Zealand placed its economic emphasis on primary production, the market for which was mainly in the United Kingdom.
In November 1957 the Board of Trade completed a comprehensive review of the structure of the tariff and reported to Government. The board's recommendations were taken into account when a revised tariff was introduced on 1 July 1962 based on the Standard International Trade Classification. A new tariff based on the Brussels Tariff Nomenclature was introduced on 1 July 1967.
Consequent to the United Kingdom's entry into the European Economic Community a further revised tariff was introduced on 1 July 1974 to phase out the preferences on goods of United Kingdom origin. This tariff provided separate rates for British preferential countries (the United Kingdom of Great Britain and Northern Ireland, the Isle of Man, the Channel Islands, and the Republic of Ireland), other preferential rates of duty in favour of Australia, Canada, Malaysia, other Commonwealth countries, and developing countries, and a normal tariff rate.
The rates of Customs and excise duty enforced in New Zealand are set out in the publication entitled the Customs Tariff of New Zealand available from the Government Printer, Wellington.
GENERAL AGREEMENT ON TARIFFS AND TRADE (GATT)—New Zealand was one of the original members of the General Agreement on Tariffs and Trade reached in Geneva in 1947 and has since taken an active part in the work of the GATT in attaining its general objective of reducing barriers to trade and providing a forum for the discussion and settlement of international trade problems and disputes.
The majority of the world's trading nations have now become contracting parties to the GATT and entitled to most-favoured-nation treatment. The non-discriminatory provisions within the GATT assist New Zealand to at least some degree in promoting its objective in seeking the right to trade on a multilateral basis.
The results of the tariff negotiations which took place in 1947 and on subsequent occasions are embodied in schedules to the General Agreement and are applied multilaterally so that New Zealand receives the benefit of reductions made by all participants and, conversely, accords reciprocal concessions to all other contracting parties. These concessions are of two kinds—actual reductions in duty rates and bindings on duties against increase.
Developments have, however, tended to whittle away most of the trading advantages which countries relying heavily on agricultural exports might reasonably expect to get from GATT membership. There has been a growing disparity between the benefits accruing under GATT to the industrialised nations and the far less tangible advantages it provides for primary producing countries such as New Zealand. This has been due principally to the maintenance of quantitative restrictions on agricultural products by most of the large industrialised countries as an aspect of their policies of agricultural protectionism.
The Kennedy Round of negotiations which was concluded in June 1967 has not corrected this imbalance although New Zealand did obtain improved access and some tariff concessions on a limited range of products exported to some GATT countries in compensation for a reduction in rates of duty of up to 50 percent on a number of items. A new round of multilateral trade negotiations was initiated in Tokyo in September 1973. Although progress towards obtaining its objective of further reducing trade barriers has been slow, New Zealand has taken an active part in restating its interest in promoting liberalised trade in agricultural products.
PREFERENCES AND OTHER BILATERAL TRADE AGREEMENTS—New Zealand maintains preferences in favour of Commonwealth and developing countries and has accepted certain contractual obligations on a reciprocal basis under various trade agreements. These are discussed below.
United Kingdom—The Ottawa Agreement of 1932 which was important until recent years in defining New Zealand's relationship with the United Kingdom was modified by a New Zealand - United Kingdom Trade Agreement signed in Wellington in August 1959 and a subsequent “Record of Understanding” signed on 24 November 1966.
A radical change in New Zealand's trade and tariff policy was necessitated by the United Kingdom's decision to enter into the European Economic Community on 1 January 1973 and the effect of this action on New Zealand's exports to that country. The tariff preferences accorded to British goods in the New Zealand market are accordingly being phased out in four steps which began on 1 July 1974 and which will be completed by 30 June 1977. Some exceptions to this phasing arrangement are made for certain classes of goods such as plant and raw materials not produced in New Zealand. For such goods preferences were eliminated in one step on 1 July 1974.
Australia—An agreement, completed in April 1933 and confirmed by the Trade Agreement (New Zealand and Australia) Ratification Act of that year, came into operation on 1 December 1933, and remains in force until terminated by either party.
Under the agreement each country grants to the goods of the other the benefits of its British preferential tariff, except with regard to certain classes of goods, enumerated in the Schedules to the agreement, on which special rates are fixed.
The agreement provided for lower duties than those prescribed under Australia's British preferential tariff on many classes of New Zealand products entering Australia, including fresh and frozen fish and fish pastes; dried peas; fresh, smoked, and preserved meats; onions; lucerne seed; wine; furs; hats; caps; floor rugs; various agricultural and dairying implements; whale oil; casein; sugar of milk; and timber.
Minor modifications have been made to the Schedules of the agreement from time to time, but they remain substantially the same as originally negotiated.
The agreement must be read subject to the 1965 Free Trade Agreement with Australia.
The setting up of an Australian - New Zealand Consultative Committee on Trade was agreed on by the Australian and New Zealand Governments in August 1960.
The New Zealand - Australia Free Trade Agreement which came into force on 1 January 1966 provides for periodic reduction and ultimate elimination of duties on the goods listed in a schedule to the agreement when such goods qualify for admission into either country as the produce or manufacture of the other country. This agreement modifies or supersedes some of the provisions of the 1933 agreement, and, in particular, 1933 agreement rates which were higher than the equivalent British preferential rates were to be reduced to the British preferential level not later than 1 January 1974.
The goods listed in Schedule A to the agreement cover 60 percent of the imports from Australia and include forest products (timber, pulp, packaging materials, plywood and veneers), petroleum products, meat, fish, cheese, lead, zinc and other metals, copper rods and bars, wool, and some machinery and chemicals. The first review of the NAFTA resulted in the addition of further items to Schedule A, the duty reductions on which entered into force on 1 January 1968 at the same time as the second stage reductions on the original Schedule A items. As a result of subsequent reviews further items have been added to Schedule A on 1 January and 1 July in 1969, 1970,1971, and 1972.
The agreement provides for reviews of trade between the two countries with a view to progressive inclusion of additional items within the agreement. The agreement is to remain in force for 10 years and thereafter shall remain in force unless terminated 180 days after appropriate notice is given by one country and the prescribed consultations between the two countries have been held.
On 7 May 1973 an exchange of letters took place between the New Zealand and Australian Governments. Among the mutual agreements reached was a general undertaking not to increase the duties and margins of preference on each others goods beyond those existing on 31 January 1973.
Canada—Reciprocal trade arrangements between Canada and New Zealand are governed by an agreement negotiated in 1932, and this agreement remains in force until terminated by either party.
Under the terms of the agreement sausage casings, hides and skins, wool, apples, seeds, kauri gum, and phormium fibre are amongst the New Zealand products admitted free of duty. Certain other items such as butter, cheese, mutton, and lamb are admitted at rates of duty lower than the British preferential tariff.
On 26 July 1973 an exchange of letters took place between the New Zealand and Canadian Governments. Among the mutual agreements reached was a general undertaking not to increase the duties and margins of preference on each others goods beyond those levels existing on 31 January 1973.
Malaysia—A trade agreement between Malaysia and New Zealand was signed in February 1961 by which each country accords preferential rates of duty to the other. Both countries agreed to guarantee minimum margins of tariff preference which apply to certain important items in each other's trade.
Other Commonwealth Countries—Although there was no contractual obligation to do so, in the revised tariff effective from 1 July 1974 New Zealand has maintained preferences in favour of other Commonwealth countries using as a basis the preferential rate established for Canada in terms of the New Zealand - Canada Exchange of Letters dated 26 July 1973.
Developing Countries—New Zealand has responded to the recommendation of the United Nations Committee on Trade and Development (UNCTAD) that developed countries introduce Generalised Systems of Preference in favour of developing nations. Special developing country rates were incorporated in the Customs tariff as from 1 January 1972. In the revised tariff effective from 1 July 1974 margins of preference are accorded developing countries in comparison with the normal rate in 445 cases, including 321 items where the preferential rate has been set at Free.
OTHER TRADE OBLIGATIONS—New Zealand is also a party to certain commercial treaties, conventions and arrangements with countries outside the Commonwealth resulting from direct negotiations with the countries concerned. In practice, some of the earlier arrangements (which generally provided for reciprocal most-favoured-nation tariff treatment) became superseded by New Zealand's accession to the General Agreement on Tariffs and Trade. Trade agreements which are still operative include those with: Switzerland (1938 and since extended to Liechtenstein in 1956); Federal Republic of Germany (1959); Japan (1958, amended 1962); the Union of Soviet Socialist Republics (1963); the Polish People's Republic (1965); Republic of Korea (1967); People's Republic of Bulgaria (1968); Republic of the Philippines (1968); Socialist Republic of Romania (1969); Hungarian People's Republic (1970); People's Republic of China (1973).
These agreements contain, in the main, provision for non-discriminatory treatment, the facilitation of trade and the treatment of foreign exchange for trade purposes.
ELIGIBILITY OF GOODS FOR TARIFF PREFERENTIAL RATES—In order to qualify for entry at preferential rates imported goods must meet certain origin requirements before they can be deemed to be the produce or manufacture of the countries entitled to the preferences. The provisions are contained in the Customs Regulations 1968 as amended. In general, with minor variations, they include the following:
Goods wholly the produce of such countries.
(b) Goods wholly manufactured in such countries from unmanufactured raw materials and/or from one or more of the imported partly manufactured materials which are enumerated in the regulations.
Goods partly manufactured in such countries, provided that the final process of manufacture has been performed in such countries, and also that the expenditure in material produced in such countries and/or other items of factory or works cost incurred in such countries in respect of each article is not less than half of the factory or works cost of the article in its finished state.
TARIFF REVIEW—Recognising that the tariff is outdated and requires restructuring if it is to fulfil its proper role in the development of industry in August 1972 Government announced an intention to carry out a review over a 5-year period using the Tariff and Development Board. The review involved the consideration of items within five phases, progressing from raw materials and unfinished goods to semi-manufactured and finally to manufactured products.
CUSTOMS DUTIES—As the rates of duty on goods vary according to their country of origin as well as their classification, the tariff is printed in “multi-column” form listing rates of duty under (a) the British preferential tariff, applying to goods from the United Kingdom and the Republic of Ireland; (b) other preferential rates, chiefly those applicable to goods from Australia, Canada, other Commonwealth and developing countries; (c) the normal tariff, applying to goods from other countries.
Duty is generally calculated according to ad valorem rates; but specific duties are also prescribed in a number of items and in some cases a combination of ad valorem and specific rates are used.
EXCISE DUTIES—Excise duty is a tax on certain commodities manufactured in New Zealand. Duties on major commodities are as follows.
Beer—From 1 July 1974 the excise duty on beer became $13.20 per 100 litres where the specific gravity does not exceed 1,036 advancing by 36.66c. per 100 litres for every unit of specific gravity above 1,036. The specific gravity of distilled water at 15.6°C is taken as 1,000, and the specific gravity of the worts is determined in relation thereto.
Tobacco—The following table sets out the rates of excise duty on tobacco from 1 July 1974.
| Description | Rate of Duty | |
|---|---|---|
| Cigarettes— | $ | |
| Exceeding in weight 1.134 kg per 1,000 | per kg | 10.49 |
| Not exceeding in weight 1.134kg per 1,000 | per 1,000 | 11.90 |
| Cigars and snuff | per kg | 6.57 |
| Other manufactured tobacco | per kg | 7.80 |
Sugar—There was an excise duty of $18.66 per ton on sugar manufactured in New Zealand but this was abolished in February 1972.
Alcohol—Excise duties were formerly levied direct on certain manufactures, the preparation of which involved the use of a considerable proportion of spirits. In lieu of excise duty on the finished manufactured article, however, a special schedule of duties has been provided since 1921 on alcohol used in manufacturing these articles in licensed warehouses. The present rates are: on alcohol used in manufacture: perfumed spirits, $0.80c per proof litre; toilet preparations, $0.75c; culinary and flavouring essences, $0.44c; medicinal preparations containing more than 50 percent of proof spirit, $0.10c per proof litre. In similar medicinal preparations containing not more than 50 percent, the alcohol used is duty-free.
Distilleries—Excise duty on gin, geneva, schnapps, vodka, and other basically derived white spirit liquors approved by the Minister of Customs, which are produced by two rectifying and compounding distilleries, is at the rate of $2.97 per proof litre. The excise duty on whisky made or distilled in New Zealand is $2.915 per proof litre.
CUSTOMS REVENUE—Revenue from Customs and excise duties is shown in the following table.
| Year Ended 31 March | Excise Duties | Other Excise and Customs Duties | Total Excise and Customs Duties | |||
|---|---|---|---|---|---|---|
| Beer | Spirits | Tobacco | Sugar | |||
| *Includes gross motor spirits duty credited to Consolidated Revenue Account. | ||||||
| $(000) | ||||||
| 1969 | 35,826 | 6,660 | 48,570 | 2,410 | 61,733* | 155,199* |
| 1970 | 37,282 | 7,180 | 50,173 | 2,470 | 59,695* | 156,800* |
| 1971 | 39,653 | 7,230 | 57,397 | 2,546 | 71,702* | 178,528* |
| 1972 | 40,700 | 7,667 | 69,531 | 2,381 | 77,695 | 197,974 |
| 1973 | 41,901 | 8,230 | 72,199 | - | 87,910 | 210,240 |
| 1974 | 44,674 | 9,465 | 71,603 | - | 120,096 | 245,838 |
Motor spirits duty paid into the National Roads Fund has been excluded from Customs duties, but motor spirits duty paid into the Consolidated Revenue Account until 31 March 1971 is included in “Other Excise and Customs Duties”.
Customs revenue as a proportion of taxation is discussed in the section on Central Government finance.
INTERNATIONAL COMMODITY AGREEMENTS: SUGAR—New Zealand's annual requirement of sugar is some 165,000 tons. Some two-thirds of this amount are usually imported from Australia with most of the remainder from Fiji. In recent years additional cargoes have been bought from Cuba, Taiwan, Colombia, and the Dominican Republic.
World trade in sugar takes place largely under the terms of a number of special arrangements such as the United States sugar quota, the Soviet Union's agreement with Cuba and the Commonwealth Sugar Agreement. Until 1973, New Zealand's sugar had been bought according to a 1957 Memorandum of Understanding agreed between New Zealand and the parties to the Commonwealth Sugar Agreement—New Zealand is not a member of the agreement itself. This understanding simply determined the quantity New Zealand would buy from Commonwealth suppliers at 75,000 tons.
The price at which New Zealand bought sugar however was the world price, the “London daily price”, subject to a small adjustment in the case of the 75,000 tons bought under the Memorandum of Understanding.
Before 1957 New Zealand's purchases of sugar were governed by the 1951 Exchange of Letters between the New Zealand and British Governments. Under this exchange which was to operate from 1953 to 1958 inclusive the Ministry of Food agreed to supply 75,000 tons annually to New Zealand at a price negotiated by Britain and Commonwealth exporting countries. This arrangement proved unsatisfactory from New Zealand's point of view because in many years the Commonwealth negotiated price was higher than the world price. The arrangements under the exchange were terminated prematurely and replaced by the memorandum in 1957.
The Commonwealth Sugar Agreement will terminate at the end of 1974 as part of the phasing out of Commonwealth trading arrangements resulting from the United Kingdom's entry into the EEC.
New Zealand has been a member of the International Sugar Agreements of 1958 and 1968. These agreements incorporated mechanisms that regulated the supply and price of sugar on world markets. Under the agreements exporters undertook to regulate their sales on the free market according to agreed quotas while importers were to restrict their purchases from non-members during times when sugar prices remained within the range specified in the agreement. The 1968 agreement terminated in 1973 and the United Nations Conference on Trade and Development (UNCTAD) convened a conference to negotiate a new agreement. Against a background of record free market sugar prices (moving from around £75 per ton at the end of 1972 to over £200 per ton at the beginning of 1974), agreement on appropriate indicator prices proved impossible to find and the conference settled for a consultative form of agreement without control measures of any kind. Work is proceeding within the consultative organisation on the drawing up of a new agreement containing economic clauses.
Coffee—New Zealand was a party to the International Coffee Agreement of 1968 which had replaced an earlier agreement of 1962. The 1968 agreement expired in September 1973 and early in that year negotiations took place to draw up a new agreement. An impasse had been reached however between producing and consuming countries on prices which proved impossible to solve; as a result a purely administrative agreement came into force, lacking any control measures that were the essential feature of the 1968 agreement.
The 1968 agreement had relied for its operation on a system of export and import controls by means of documents of origin and export stamps.
Cocoa—At the end of 1972 the United Nations Cocoa Conference succeeded in drawing up an International Cocoa Agreement which had been subject of negotiation for the best part of a decade. The agreement entered into force in June 1973 and New Zealand adhered to it shortly after that date.
The International Cocoa Agreement incorporates features common to other commodity agreements but, unlike the former International Coffee and Sugar Agreements, depends largely for the stabilising of prices on the operation of a buffer stock. Cocoa beans would be bought into the buffer stock at times of low prices and sold when prices pass an agreed maximum level.
The agreement entered into force at a time when world cocoa prices were rising steeply, reaching record levels by the latter part of 1973. As a result the buffer stock has not come into operation.
CONSUMER PROTECTION—The Control of Prices Act 1947 established a Price Tribunal with the general duties and functions of fixing prices for goods and services, investigating complaints, maintaining a survey of prices and services, and taking legal or other measures where necessary. Most of these functions were delegated to the Secretary of Trade and Industry and his senior officers.
Under the proposed Commerce Act the control of prices will become the responsibility of a Commerce Commission. The Commerce Commission will replace both the Price Tribunal and the Trade Practices and Prices Commission.
The Secretary of Trade and Industry is to be given original jurisdiction to fix, subject to a right of appeal to the Commission, prices of goods and services which are subject to price control. Collective pricing practices and individual resale price maintenance agreements will be subjected to strict control. Provisions relating to profiteering will be strengthened.
Part IV of the Commerce Act will replace the provisions of the Control of Prices Act 1947. While many of the provisions of this Part closely follow provisions of that Act there are a number of important differences. Besides providing for goods and services to be placed under price control provision is also made for regulations to be made placing goods and services under price restraint.
Substantial jurisdictional changes have also been made. The Secretary of Trade and Industry will replace the Price Tribunal, as constituted by the previous Act, as the original price fixing authority in respect of the determination of the prices of controlled goods and services. Decisions will take the form of price orders or special approvals as previously. The Commerce Commission will sit as a judicial authority for the determination of appeals from decisions of the Secretary.
Decisions of the Secretary are to be made following investigations by him, upon receipt of an application in accordance with procedures set out in the Act. Provision is also made for the Secretary to review prices on his own motion with the consent of the Minister of Trade and Industry. Before making a determination in respect of an application or following a review on his own motion, the Secretary will be required to fulfil certain duties which accord applicants the benefit of the rules of natural justice which applied under the previous judicial jurisdiction.
Where requested to do so by the Minister, the Commission will be able however to exercise original jurisdiction in the determination of prices. At any such inquiry the Secretary is to be represented. Provision will be made where appropriate for the representation of consumer class interests.
The Minister of Trade and Industry publishes a Positive List of Controlled Goods and Services, which specifies the goods and services subject to price control. There is provision for other goods and services to be subject to a certain form of pricing restraint.
The Secretary of Trade and Industry makes price orders fixing the prices that may be charged or received for particular goods or services, and gives to interested parties the reasons for his decisions.
Criteria considered by the Secretary or the Commission in dealing with pricing matters include: the cost of production and distribution of the goods concerned; the ability of the applicant to absorb costs; profit margins and return on capital; stable internal prices; improvements in productivity and efficiency; market competition and subsidies or import protection given.
It should be observed that certain prices controlled under other legislation did not come within the scope of the Control of Prices Act 1947. For example, maximum and minimum prices of motor spirits are fixed by Order in Council (on the recommendation of the Minister of Trade and Industry) under the Motor Spirits (Regulation of Prices) Act 1933. Milk and cream prices are set by Order in Council on the recommendation of the New Zealand Milk Board under the Milk Act 1944.
Subject to limited exceptions, both goods and services were subject to regulations which came into force on 1 April 1972 under the Economic Stabilisation Act 1948.
The Price Justification Scheme was revoked and under the new system a number of items were added to the positive list of the Control of Prices Act. This augmented list was called Category A.
The regulations provided that in general the Price Tribunal or other pricing authorities would not allow adjustments to be made for increased costs (including wages and salaries) unless they accorded with criteria strictly defined in the regulations.
Goods and services not subject to direct control became known as Category B items. Prices for such goods and services could not be increased except to recover actual costs determined in accordance with the criteria laid down.
As long as the criteria were fully observed in fixing prices, notification and formal approval of increases were not required.
However, firms with a turnover exceeding $1,000,000 a year were required to make quarterly reports of all price increases and other firms could be required to do so.
All margins continued to be frozen unless it could be demonstrated to the satisfaction of the pricing authority that strict adherence to them would prejudice the viability of a business.
On 22 March 1973 the Government announced further price control measures. These comprised (a) A freeze on mutton and lamb and fish until prices could be fixed by the Department of Trade and Industry; (b) A rollback of sheepmeat prices by 2c a pound applied when the freeze was lifted on 9 April and prices were held at that level with State subsidies to wholesalers until April 1974; (c) The fixing of maximum retail prices, which were to be displayed on the package, for certain manufactured and processed goods—initially essential foodstuffs, footwear and clothing but eventually the whole range of goods normally sold in supermarkets; (d) The bringing of apples and pears under full price control; (e) A bar on auctioneering firms or their subsidiaries from bidding at their own auctions and setting artificially high fruit and vegetable prices.
Firm and wide-ranging price regulations, covering manufacturers' prices, distributive margins, and service charges, were introduced in November 1973. The Stabilisation of Prices Regulations 1973, which incorporated most of the previous legislation into one document, contained the following main points.
Manufacturers were asked to absorb increases in overhead costs without passing them on in price. They were also limited in the extent to which they could pass on wage increases. Moreover, they were restricted, by reference to their past profit performance, in the profits they could take and therefore in the prices they could charge.
Wholesalers and retailers were required to roll back distributive margins in four major distributive trades and, maximum retail mark-ups, which applied to their products, were set at a lower level.
Suppliers of some important services had their charges frozen, while other services were subject to a notification procedure and were also required to absorb certain cost increases.
Apart from some amendments, the current list of goods subject to direct price control, that is to say Category A items, continued. Manufacturers of other goods were able to recover higher material costs by price increases, but were required to absorb all increased overheads and also an additional 4 percent of wage increases incurred after 15 June 1973. Wage rises because of equal pay were excepted. This superseded a budget provision which allowed manufacturers to recover the first 5 percent of any wage increases since 15 June 1973. Manufacturers of goods outside Category A, with sales of more than $5500,000 in the last financial year, had to notify the Department of Trade and Industry of any proposed price increases. If there was no objection from the department within 28 days the price increases could be implemented.
Other manufacturers had to abide by the same rules as to the passing on of costs. While their price rises did not need to be notified, there were regular checks by the department to ensure that the rules were being observed.
The department would also examine whether a manufacturer could absorb all or part of the price increase because of his current profit levels. There were profit criteria clearly set out in the regulations and these were to be taken into account in assessing a manufacturers' capacity to absorb costs.
The criteria were: his taxable profit as a percentage of turnover, averaged over the past 4 years; a taxable profit of more than 12 1/2 percent of turnover; his taxable profit as a percentage of total funds (shareholders' funds and longer-term loans), averaged over the past 4 years.
The department was to continue to examine the ability of any manufacturer to absorb any cost increases.
In service industries, charges for the labour and overhead elements in services such as motor vehicles repairs, home maintenance, and appliances repairs were frozen. These charges were to be released from the freeze when satisfactory rates had been established by the department.
Services were broken in two categories:
Group 1 services where the charge for the total service was specifically determined by the supplier (for example, dry-cleaning charges).
Group 2 services, where the charge was determined according to the materials used and the hours taken to perform the service (for example, motor vehicle repairs).
Suppliers of both types of services were permitted to increase charges only to cover admissible increased costs, except for the group which was frozen. Some cost increases automatically had to be absorbed.
Where a supplier of Group 1 services had a turnover in excess of $250,000 or in the case of a supplier of Group 2 services had a work force of 10 or more persons, then that supplier had to notify the department of any proposed increases in charges and wait the prescribed 28 days before implementing them.
The department was to examine the ability of any supplier of services to absorb cost increases.
Importers', wholesalers', and retailers' margins were also controlled.
Maximum wholesale and retail margins for all goods which were included in the first step of the maximum retail price marking scheme, were also included in the regulations.
Most of the previous pricing ordinances were consolidated into one document, so that they were as simple as comprehensive legal drafting could make them. In order to inform consumers and traders about the operation of the procedures an explanatory booklet was issued.
The Stabilisation of Prices Regulations, which were brought down in November 1973, expired on 30 June 1974. The system applying from 1 July 1974 simplified previous procedures while maintaining control over practically all goods and services, with further restraints on profits in new areas.
Trade Practices—Part II of the Commerce Act incorporates, with substantial amendments, most of the provisions of the Trade Practices Act 1958.
The Commerce Commission may make orders if it finds certain practices to be contrary to the public interest. Other trade practices are prohibited unless approved by the Commission. Certain prohibited practices are offences.
A trade practice is contrary to the public interest, if in the opinion of the Commission, it has the effect of maintaining certain costs, prices, or profits at an unreasonably high level. Collective pricing agreements need to be approved.
Consumer Information—The basic aims of the Consumer Information Act 1969 are for informative labelling and marking of goods, and for the prevention of deceptive or misleading packaging, labelling and advertising. The Act has general application to goods, including services, but the majority of the sections exclude foods, drugs, and medical devices as these are dealt with by the Department of Health under the food and drug legislation. There are provisions dealing with misleading advertising, misleading packaging, and false representations as to prices, and all goods packaged in New Zealand must show the name and address of the packager on the label. Provision is made for other specific packaging and labelling requirements, including the declaration on the label of the quantitative contents of the package—to be stipulated from time to time by the publication of notices in the Gazette or by regulations made by Order in Council.
CONSUMER COUNCIL—The Consumer Council, whose functions are to protect and promote the interests of consumers of goods and services, was established in 1959 and reconstituted under the Consumer Council Act 1966. The Council consists of 12 members appointed solely on the basis of personal qualifications by a representative appointments committee. The Secretary of Trade and Industry, the Director-General of the Department of Scientific and Industrial Research, and the Director-General of Health are also members.
The council lays down the policies to be followed by the staff of Consumers' Institute. It has appointed three District Consumer Committees and encourages the formation of local consumer associations. Citizens are invited to become members of the institute on payment of an annual subscription of $4. Membership was 122,600 at 31 July 1974. Subscriptions provide 70 percent of the institute's finance; the rest comes from Government grants.
The institute's work includes comparative tests and surveys of consumer goods and services, research into and advice on legislative and financial matters, consumer education, and advice on and investigation into complaints.
Subscribing members receive the institute's monthly publication Consumer. A separate $3 subscription entitles members to receive the quarterly Consumer Review, which covers financial and welfare matters. In addition the institute prepares teaching notes for schools, books on various subjects, and a weekly radio broadcast.
The Consumer Council is a council member of the International Organisation of Consumers Unions, and co-operates with and assists other consumer organisations throughout the world.
MONETARY AND ECONOMIC COUNCIL—A Monetary and Economic Council was established under the Monetary and Economic Council Act 1961 to report on the extent to which stability in prices and other economic objectives are being achieved. In its first reports the council dealt with the economic situation and the longer-term problems of slow growth and instability, and subsequent reports have dealt largely with the current economic situation and outlook.
PRICE STATISTICS—Actual prices of many goods and services at various levels are collected periodically by the Department of Statistics. The fields covered are retail prices, wholesale prices, farm input prices, export prices, import prices, share prices, and wool prices. In the case of retail, wholesale, and farm input prices, direct inquiry is made; export and import prices (or strictly, unit values) are mainly derived from trade statistics, share prices from records of the stock exchanges, and wool prices from the New Zealand Wool Marketing Corporation. In addition, average prices of many materials and products of manufacture are available from the statistics of industrial production. Some retail prices are shown later in this Section, and a wider coverage is published in the annual Report on Prices, Wages, and Labour Statistics; the chief use made of the prices collected is in the compilation of price index numbers. These are, fundamentally, weighted averages of price ratios, the weighting being so arranged that the index numbers give a general indication of price movements in the field covered. The usual technique employs fixed weights with, however, provision for revision of the weighting pattern at suitable intervals.
CONSUMERS PRICE INDEX—The Consumers Price Index (CPI) records changes in the prices of the goods and services included in the pattern of purchases which households make; it thus provides the best possible measure of the effect of changes in retail prices on the average household budget. Index series of retail prices have a long history in New Zealand, starting with a food and rent index for the four chief centres back to 1891, and increasing in comprehensiveness both as to commodity and geographical coverage over successive revisions since that time. The most recent revisions to the CPI were made in 1949, 1955, 1965, and 1974 (the 1974 revision, which was first used in calculating the January 1975 monthly food index, is the subject of a special article near the back of this Yearbook).
The tables in the present section relate to the Consumers Price Index (1965 Revision) as used previous to January 1975. The salient features of this index may be summarised as follows:
The basic formula used was that of Laspeyres in its aggregative form.
The index related primarily to urban and country-town dwellers living as families.
About 90 percent of personal expenditure was covered.
The number of items regularly priced was 535.
The base was: 1962-63 consumption costed at 1965 prices.
The sources of group and commodity weights were: (1) Census of Distribution 1962—63;
industrial or factory statistics; (3) import and export data; and (4) extension of regularly compiled statistics of consumable goods. Where considered desirable the base weight assigned to selected items was broadened to allow for expenditure on kindred items not selected for pricing.
Prices were collected by field officers in 25 centres, including 2 combined areas.
A scientific sample of rented houses and flats was selected.
Special techniques were employed for costs of owner-occupiers, for prices of seasonal fruits, vegetables, and eggs, and for transport charges.
Index numbers were compiled for all food and its subgroups at monthly intervals, and for all other groups and subgroups at quarterly intervals.
Index numbers were published for the 4 chief centres and 10 larger centres individually. Combined index numbers were published for these two groupings and also for six smaller North Island centres and five smaller South Island centres. Each centre and grouping of centres was shown on its own base and on a common, all-centres, base.
(1) To provide a continuous series the pre-revision all-groups index was converted to a 1965 base.
Costs of the following items were, for various reasons, outside the scope of the index: hotel accommodation, licensed and private; air transport; legal fees; commissions on sales, other than those incurred in the erection of house properties; gambling; church and charitable donations; private and boarding school fees; instalment credit interest and similar financial charges; personal accident insurance; photographers' charges; wages of domestic servants, jobbing gardeners, etc.; fees to chiropractors, herbalists, chiropodists, etc.; sundry licences (marriage, dog, etc.); direct taxation; savings, including amortisations of capital debts, investments, and life insurance; spirits and wine; jewellery and florists' goods; durable goods other than replacements; and private holiday transport.
In general the index assumed a constant pattern of expenditure for all centres, whether large cities or provincial centres, whether with warm or cool climates, etc. In transportation, however, the index compromised by setting up a constant base expenditure on transport for all centres, but allowing a varying dissection between the various modes of transport from centre to centre, according to local circumstances. Consequently there were no true “each on all” indexes for transportation, but “each on each” indexes could be used to produce “all on all” indexes. ("Each on all" means an index for an individual centre which uses as base the average for all centres, etc.)
A Consumers Price Index Revision Advisory Committee was set up in June 1971 under the chairmanship of the Government Statistician to investigate changes that should be made to the index. It reported in September 1971. Its recommendations in parliamentary paper H. 40 were accepted in June 1972 and the revised index commenced to operate early in 1975.
The revised Consumers Price Index retains its basic objective of providing a multi-purpose indicator of retail price changes of those goods and services which are purchased by New Zealand residents living in New Zealand, and substantially retains the previous group and sub-group structure.
The weights in the revised Consumers Price Index are based on the pattern of expenditure of the population covered by the index rather than on what is consumed by them.
Data to revise and update the Consumers Price Index are to be obtained mainly from continuing household expenditure surveys. These are to be supplemented and tested by additional data on housing, national consumption, production, and expenditure.
The selection of goods and services to be priced—inevitably only a small percentage of goods and services can be priced—has been widened to include more fields of expenditure and more pricing outlets. This reflects more adequately both the expenditure patterns of all New Zealand residents living in New Zealand and the movement in prices of consumer goods and services.
Consumers Price Index (1965 Revision)—The tables which follow relate to the Consumers Price Index (1965 Revision) only.
The first table supplies all-groups index numbers and index numbers of individual groups and subgroups for 25 centres combined. The group and subgroup weights are also shown as percentages of the base expenditure.
| CONSUMERS' PRICE INDEX—(ALL GROUPS)—TWENTY-FIVE CENTRES COMBINED | |||||||
|---|---|---|---|---|---|---|---|
| Base: Weighted average twenty-five centres, 1965 (= 1000) | |||||||
| Period | Food | Housing | Household Operation | Apparel | Transportation | Miscellaneous | All Groups |
| Groups— | |||||||
| Percentages of base expenditure | 30.09 | 17.99 | 11.21 | 13.12 | 9.44 | 18.15 | 100.00 |
| Calendar year— | |||||||
| 1965 | 1,000 | 1,000 | 1,000 | 1,000 | 1,000 | 1,000 | 1,000 |
| 1968 | 1,126 | 1,177 | 1,105 | 1,071 | 1,170 | 1,167 | 1,137 |
| 1969 | 1,180 | 1,245 | 1,140 | 1,119 | 1,218 | 1,235 | 1,193 |
| 1970 | 1,258 | 1,327 | 1,186 | 1,199 | 1,280 | 1,336 | 1,271 |
| 1971 | 1,373 | 1,428 | 1,304 | 1,356 | 1,463 | 1,491 | 1,403 |
| 1972 | 1,438 | 1,561 | 1,394 | 1,444 | 1,584 | 1,605 | 1,500 |
| 1973 | 1,599 | 1,735 | 1,460 | 1,544 | 1,657 | 1,689 | 1,623 |
| 1974 | 1,784 | 1,984 | 1,568 | 1,726 | 1,861 | 1,825 | 1,803 |
| Quarter ended— | |||||||
| 1973—31 Mar | 1,512 | 1,669 | 1,425 | 1,496 | 1,630 | 1,637 | 1,562 |
| 30 Jun | 1,577 | 1,711 | 1,453 | 1,527 | 1,651 | 1,676 | 1,605 |
| 30 Sep | 1,624 | 1,753 | 1,473 | 1,558 | 1,669 | 1,712 | 1,642 |
| 31 Dec | 1,685 | 1,807 | 1,490 | 1,594 | 1,679 | 1,731 | 1,681 |
| 1974—31 Mar | 1,730 | 1,866 | 1,507 | 1,638 | 1,747 | 1,753 | 1,723 |
| 30 Jun | 1,758 | 1,935 | 1,547 | 1,689 | 1,802 | 1,781 | 1,765 |
| 30 Sep | 1,811 | 2,016 | 1,592 | 1,758 | 1,889 | 1,853 | 1,831 |
| 31 Dec | 1,837 | 2,119 | 1,627 | 1,820 | 2,005 | 1,913 | 1,892 |
| Period | Food | Housing | Household Operation | |||||
|---|---|---|---|---|---|---|---|---|
| Fruits and Vegetables | Meant, Fish, and Poultry | Other Foods and Eggs | Rent | Home Ownership | Fuel and Light | Home Furnishings | Domestic Supplies and Services | |
| Subgroups— | ||||||||
| Percentage of base expenditure | 5.89 | 9.22 | 14.98 | 5.50 | 12.49 | 2.82 | 5.59 | 2.80 |
| Calendar year— | ||||||||
| 1965 | 1,000 | 1,000 | 1,000 | 1,000 | 1,000 | 1,000 | 1,000 | 1,000 |
| 1968 | 1,138 | 1,101 | 1,136 | 1,166 | 1,182 | 1,160 | 1,060 | 1,140 |
| 1969 | 1,103 | 1,222 | 1,185 | 1,224 | 1,254 | 1,173 | 1,119 | 1,148 |
| 1970 | 1,180 | 1,348 | 1,233 | 1,285 | 1,346 | 1,179 | 1,184 | 1,197 |
| 1971 | 1,384 | 1,429 | 1,333 | 1,351 | 1,461 | 1,215 | 1,306 | 1,387 |
| 1972 | 1,374 | 1,522 | 1,411 | 1,498 | 1,590 | 1,251 | 1,401 | 1,526 |
| 1973 | 1,447 | 1,913 | 1,467 | 1,638 | 1,777 | 1,295 | 1,492 | 1,564 |
| 1974 | 1,772 | 2,080 | 1,606 | 1,818 | 2,057 | 1,381 | 1,622 | 1,650 |
| Quarter ended— | ||||||||
| 1973—31 Mar | 1,381 | 1,714 | 1,438 | 1,600 | 1,699 | 1,262 | 1,450 | 1,539 |
| 30 Jun | 1,470 | 1,849 | 1,451 | 1,621 | 1,750 | 1,290 | 1,482 | 1,560 |
| 30 Sep | 1,448 | 1,985 | 1,471 | 1,654 | 1,797 | 1,313 | 1,505 | 1,571 |
| 31 Dec | 1,488 | 2,102 | 1,507 | 1,678 | 1,864 | 1,316 | 1,530 | 1,586 |
| 1974—31 Mar | 1,670 | 2,109 | 1,520 | 1,722 | 1,929 | 1,340 | 1,549 | 1,592 |
| 30 Jun | 1,749 | 2,098 | 1,552 | 1,774 | 2,006 | 1,375 | 1,594 | 1,628 |
| 30 Sep | 1,825 | 2,079 | 1,640 | 1,857 | 2,085 | 1,394 | 1,647 | 1,682 |
| 31 Dec | 1,844 | 2,036 | 1,711 | 1,921 | 2,206 | 1,413 | 1,699 | 1,699 |
| Period | Apparel | Transportation | Miscellaneous | |||||
|---|---|---|---|---|---|---|---|---|
| Clothing | Footwear | Public Transport | Private Transport | Tobacco and Alcohol | Other Supplies | Other Services | All Groups | |
| Subgroups— | ||||||||
| Percentage of base expenditure | 10.91 | 2.21 | 2.38 | 7.06 | 7.64 | 5.66 | 4.85 | 100.00 |
| Calendar year— | ||||||||
| 1965 | 1,000 | 1,000 | 1,000 | 1,000 | 1,000 | 1,000 | 1,000 | 1,000 |
| 1968 | 1,067 | 1,090 | 1,104 | 1,193 | 1,159 | 1,154 | 1,193 | 1,137 |
| 1969 | 1,113 | 1,144 | 1,140 | 1,244 | 1,213 | 1,224 | 1,284 | 1,193 |
| 1970 | 1,192 | 1,234 | 1,189 | 1,311 | 1,328 | 1,330 | 1,354 | 1,271 |
| 1971 | 1,355 | 1,364 | 1,443 | 1,470 | 1,475 | 1,467 | 1,546 | 1,403 |
| 1972 | 1,440 | 1,466 | 1,609 | 1,575 | 1,533 | 1,607 | 1,714 | 1,500 |
| 1973 | 1,538 | 1,573 | 1,668 | 1,654 | 1,560 | 1,685 | 1,898 | 1,623 |
| 1974 | 1,722 | 1,749 | 1,829 | 1,872 | 1,596 | 1,779 | 2,240 | 1,803 |
| Quarter ended— | ||||||||
| 1973—31 Mar | 1,491 | 1,521 | 1,640 | 1,626 | 1,547 | 1,654 | 1,757 | 1,562 |
| 30 Jun | 1,519 | 1,566 | 1,666 | 1,646 | 1,547 | 1,675 | 1,881 | 1,605 |
| 30 Sep | 1,553 | 1,582 | 1,676 | 1,667 | 1,572 | 1,697 | 1,950 | 1,642 |
| 31 Dec | 1,588 | 1,623 | 1,690 | 1,676 | 1,572 | 1,713 | 2,003 | 1,681 |
| 1974—31 Mar | 1,637 | 1,641 | 1,751 | 1,746 | 1,571 | 1,719 | 2,080 | 1,723 |
| 30 Jun | 1,684 | 1,716 | 1,761 | 1,816 | 1,572 | 1,744 | 2,154 | 1,765 |
| 30 Sep | 1,752 | 1,787 | 1,890 | 1,889 | 1,600 | 1,782 | 2,335 | 1,831 |
| 31 Dec | 1,814 | 1,849 | 1,912 | 2,037 | 1,641 | 1,872 | 2,390 | 1,892 |
The average level of consumer prices rose by 11.1 percent in 1974, compared with a rise of 8.2 percent the year before. Although price increases were recorded in all main groups of the index the major contributions to the overall result came from the home ownership, other foods, clothing, fruit and vegetables, miscellaneous services, meat and fish, and private transport subgroups.
The following diagram shows the movement in consumers' price index numbers.
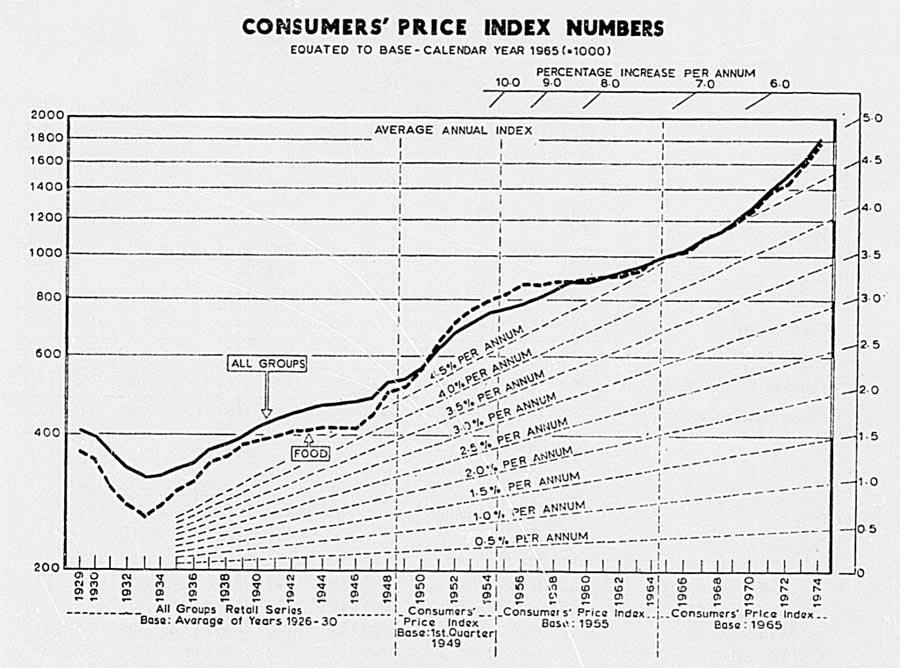
The following tables distinguish individual centres and groupings of centres, but the subgroup indexes are omitted. Attention is called, however, to the two-fold method of presentation: in the first table current prices in each centre are compared with prices in the same centre during the base period; in the second, current prices in each centre are compared with average prices over all the 25 centres in the base period.
Where the base is the individual centre, the index numbers are specially designed to show price movements in each centre. Vertical comparisons can also be made but they will show the relative amount of price movements in respective centres, not relative current price levels. In the second method, where the base is average prices over the 25 centres, horizontal or vertical comparisons may be made to compare relative price levels. However, these index numbers do not indicate how much dearer or cheaper it is to live in one centre or another, but only how much higher or lower retail price levels are in one centre than another. The construction of the index assumes the same consumption habits in all centres, regardless of size, climate, etc.
| CONSUMERS' PRICE INDEX—ANNUAL GROUP INDEX NUMBERS FOR INDIVIDUAL CENTRES AND GROUPINGS OF CENTRES | ||||||||||||
|---|---|---|---|---|---|---|---|---|---|---|---|---|
| Base: Weighted average each centre and grouping, separately, 1965 (=1000) | ||||||||||||
| Centre | Food | Housing | Household Operation | Apparel | ||||||||
| 1965 | 1973 | 1974 | 1965 | 1973 | 1974 | 1965 | 1973 | 1974 | 1965 | 1973 | 1974 | |
| Auckland | 1,000 | 1,581 | 1,749 | 1,000 | 1,767 | 2,047 | 1,000 | 1,472 | 1,574 | 1,000 | 1,562 | 1,744 |
| Wellington-Hutt | 1,000 | 1,589 | 1,781 | 1,000 | 1,714 | 1,938 | 1,000 | 1,492 | 1,592 | 1,000 | 1,589 | 1,777 |
| Christchurch | 1,000 | 1,618 | 1,793 | 1,000 | 1,757 | 2,051 | 1,000 | 1,472 | 1,591 | 1,000 | 1,536 | 1,716 |
| Dunedin | 1,000 | 1,557 | 1,737 | 1,000 | 1,776 | 2,007 | 1,000 | 1,429 | 1,557 | 1,000 | 1,544 | 1,739 |
| Four chief centres | 1,000 | 1,588 | 1,764 | 1,000 | 1,753 | 2,017 | 1,000 | 1,471 | 1,580 | 1,000 | 1,560 | 1,744 |
| Hamilton | 1,000 | 1,639 | 1,845 | 1,000 | 1,676 | 1,898 | 1,000 | 1,405 | 1,509 | 1,000 | 1,522 | 1,712 |
| Tauranga | 1,000 | 1,563 | 1,760 | 1,000 | 1,736 | 2,013 | 1,000 | 1,472 | 1,558 | 1,000 | 1,501 | 1,673 |
| Rotorua | 1,000 | 1,610 | 1,795 | 1,000 | 1,806 | 2,081 | 1,000 | 1,436 | 1,572 | 1,000 | 1,536 | 1,705 |
| Napier-Hastings | 1,000 | 1,630 | 1,845 | 1,000 | 1,779 | 2,041 | 1,000 | 1,469 | 1,571 | 1,000 | 1,512 | 1,677 |
| New Plymouth | 1,000 | 1,603 | 1,817 | 1,000 | 1,755 | 1,987 | 1,000 | 1,452 | 1,573 | 1,000 | 1,485 | 1,672 |
| Wanganui | 1,000 | 1,636 | 1,833 | 1,000 | 1,721 | 1 | 1,000 | 1,440 | 1,527 | 1,000 | 1,566 | 1,760 |
| Palmerston North | 1,000 | 1,608 | 1,793 | 1,000 | 1,789 | 2,078 | 1,000 | 1,462 | 1,560 | 1,000 | 1,524 | 1,709 |
| Nelson | 1,000 | 1,668 | 1,881 | 1,000 | 1,731 | 1,985 | 1,000 | 1,494 | 1,609 | 1,000 | 1,513 | 1,699 |
| Timaru | 1,000 | 1,579 | 1,768 | 1,000 | 1,594 | 1,778 | 1,000 | 1,436 | 1,537 | 1,000 | 1,475 | 1,674 |
| Invercargill | 1,000 | 1,561 | 1,728 | 1,000 | 1,651 | 1,820 | 1,000 | 1,403 | 1,519 | 1,000 | 1,567 | 1,743 |
| Ten larger centres | 1,000 | 1,614 | 1,812 | 1,000 | 1,722 | 1,961 | 1,000 | 1,440 | 1,546 | 1,000 | 1,521 | 1,704 |
| Six smaller North Island centres | 1,000 | 1,603 | 1,788 | 1,000 | 1,726 | 1,958 | 1,000 | 1,456 | 1,561 | 1,000 | 1,532 | 1,704 |
| Five smaller South Island centres | 1,000 | 1,607 | 1,788 | 1,000 | 1,637 | 1,820 | 1,000 | 1,492 | 1,615 | 1,000 | 1,555 | 1,741 |
| Twenty-five centres combined | 1,000 | 1,599 | 1,784 | 1,000 | 1,735 | 1,984 | 1,000 | 1,460 | 1,568 | 1,000 | 1,544 | 1,726 |
| Centre | Transportation | Miscellaneous | All Groups | ||||||
|---|---|---|---|---|---|---|---|---|---|
| 1965 | 1973 | 1974 | 1965 | 1973 | 1974 | 1965 | 1973 | 1974 | |
| Auckland | 1,000 | 1,703 | 1,895 | 1,000 | 1,704 | 1,847 | 1,000 | 1,636 | 1,818 |
| Wellington-Hutt | 1,000 | 1,674 | 1,927 | 1,000 | 1,682 | 1,829 | 1,000 | 1,629 | 1,815 |
| Christchurch | 1,000 | 1,655 | 1,836 | 1,000 | 1,692 | 1,839 | 1,000 | 1,631 | 1,816 |
| Dunedin | 1,000 | 1,722 | 1,945 | 1,000 | 1,693 | 1,831 | 1,000 | 1,617 | 1,798 |
| Four chief centres | 1,000 | 1,688 | 1,895 | 1,000 | 1,695 | 1,840 | 1,000 | 1,631 | 1,815 |
| Hamilton | 1,000 | 1,634 | 1,840 | 1,000 | 1,696 | 1,817 | 1,000 | 1,614 | 1,794 |
| Tauranga | 1,000 | 1,636 | 1,819 | 1,000 | 1,675 | 1,806 | 1,000 | 1,606 | 1,790 |
| Rotorua | 1,000 | 1,634 | 1,821 | 1,000 | 1,674 | 1,785 | 1,000 | 1,630 | 1,811 |
| Napier-Hastings | 1,000 | 1,625 | 1,820 | 1,000 | 1,669 | 1,787 | 1,000 | 1,627 | 1,810 |
| New Plymouth | 1,000 | 1,636 | 1,846 | 1,000 | 1,694 | 1,819 | 1,000 | 1,616 | 1,802 |
| Wanganui | 1,000 | 1,622 | 1,854 | 1,000 | 1,698 | 1,824 | 1,000 | 1,627 | 1,804 |
| Palmerston North | 1,000 | 1,600 | 1,803 | 1,000 | 1,706 | 1,819 | 1,000 | 1,628 | 1,809 |
| Nelson | 1,000 | 1,644 | 1,852 | 1,000 | 1,709 | 1,860 | 1,000 | 1,643 | 1,837 |
| Timaru | 1,000 | 1,637 | 1,834 | 1,000 | 1,649 | 1,776 | 1,000 | 1,570 | 1,739 |
| Invercargill | 1,000 | 1,618 | 1,804 | 1,000 | 1,686 | 1,832 | 1,000 | 1,587 | 1,474 |
| Ten larger centres | 1,000 | 1,626 | 1,828 | 1,000 | 1,688 | 1,813 | 1,000 | 1,616 | 1,795 |
| Six smaller North Island centres | 1,000 | 1,628 | 1,830 | 1,000 | 1,675 | 1,804 | 1,000 | 1,613 | 1,786 |
| Five smaller South Island centres | 1,000 | 1,616 | 1,807 | 1,000 | 1,663 | 1,804 | 1,000 | 1,603 | 1,772 |
| Twenty-five centres combined | 1,000 | 1,657 | 1,861 | 1,000 | 1,689 | 1,825 | 1,000 | 1,623 | 1,803 |
| Base: Weighted average twenty-five centres, 1965 (=1000) | ||||||||||||
|---|---|---|---|---|---|---|---|---|---|---|---|---|
| Centre | Food | Housing | Household Operation | Apparel | ||||||||
| 1965 | 1973 | 1974 | 1965 | 1973 | 1974 | 1965 | 1973 | 1974 | 1965 | 1973 | 1974 | |
| Auckland | 1,014 | 1,603 | 1,774 | 1,114 | 1,968 | 2,280 | 995 | 1,465 | 1,567 | 1,013 | 1,582 | 1,766 |
| Wellington-Hutt | 1,012 | 1,608 | 1,802 | 1,182 | 2,026 | 2,292 | 979 | 1,460 | 1,558 | 999 | 1,587 | 1,775 |
| Christchurch | 1,002 | 1,622 | 1,798 | 926 | 1,626 | 1,898 | 1,001 | 1,474 | 1,593 | 990 | 1,520 | 1,698 |
| Dunedin | 1,012 | 1,576 | 1,758 | 895 | 1,590 | 1,797 | 1,023 | 1,462 | 1,592 | 1,010 | 1,560 | 1,757 |
| Four chief centres | 1,011 | 1,605 | 1,783 | 1,061 | 1,806 | 2,141 | 996 | 1,466 | 1,574 | 1,004 | 1,567 | 1,752 |
| Hamilton | 985 | 1,614 | 1,817 | 967 | 1,622 | 1,836 | 964 | 1,355 | 1,455 | 985 | 1,499 | 1,685 |
| Tauranga | 1,021 | 1,596 | 1,797 | 1,104 | 1,916 | 2,222 | 972 | 1,432 | 1,515 | 1,004 | 1,508 | 1,681 |
| Rotorua | 1,002 | 1,613 | 1,798 | 1,011 | 1,825 | 2,103 | 1,004 | 1,442 | 1,579 | 993 | 1,525 | 1,693 |
| Napier-Hastings | 962 | 1,569 | 1,776 | 912 | 1,622 | 1,861 | 1,036 | 1,523 | 1,628 | 1,006 | 1,522 | 1,687 |
| New Plymouth | 979 | 1,569 | 1,778 | 926 | 1,625 | 1,840 | 984 | 1,429 | 1,548 | 995 | 1,477 | 1,663 |
| Wanganui | 973 | 1,592 | 1,784 | 813 | 1,399 | 1,575 | 981 | 1,412 | 1,497 | 994 | 1,557 | 1,750 |
| Palmerston North | 979 | 1,574 | 1,755 | 918 | 1,643 | 1,908 | 980 | 1,433 | 1,529 | 1,019 | 1,552 | 1,742 |
| Nelson | 955 | 1,592 | 1,796 | 931 | 1,611 | 1,847 | 971 | 1,451 | 1,563 | 1,005 | 1,520 | 1,706 |
| Timaru | 993 | 1,569 | 1,756 | 1,017 | 1,622 | 1,808 | 1,022 | 1,467 | 1,571 | 1,005 | 1,482 | 1,681 |
| Invercargill | 1,024 | 1,599 | 1,769 | 953 | 1,573 | 1,734 | 1,042 | 1,462 | 1,583 | 1,008 | 1,580 | 1,758 |
| Ten larger centres | 985 | 1,591 | 1,785 | 951 | 1,637 | 1,864 | 993 | 1,430 | 1,535 | 1,000 | 1,522 | 1,705 |
| Six smaller North Island centres | 1,022 | 1,607 | 1,792 | 915 | 1,580 | 1,792 | 1,030 | 1,500 | 1,607 | 981 | 1,503 | 1,672 |
| Five smaller South Island centres | 986 | 1,585 | 1,764 | 897 | 1,469 | 1,633 | 1,022 | 1,525 | 1,650 | 994 | 1,545 | 1,730 |
| Twenty-five centres combined | 1,000 | 1,599 | 1,784 | 1,000 | 1,735 | 1,984 | 1,000 | 1,460 | 1,568 | 1,000 | 1,544 | 1,726 |
| Centre | Transportation | Miscellaneous | All Groups | ||||||
|---|---|---|---|---|---|---|---|---|---|
| 1965 | 1973 | 1974 | 1965 | 1973 | 1974 | 1965 | 1973 | 1974 | |
| Auckland | 1,000 | 1,703 | 1,895 | 999 | 1,701 | 1,845 | 1,026 | 1,678 | 1,865 |
| Wellington-Hutt | 1,000 | 1,674 | 1,927 | 1,019 | 1,713 | 1,863 | 1,037 | 1,689 | 1,882 |
| Christchurch | 1,000 | 1,655 | 1,836 | 998 | 1,688 | 1,835 | 986 | 1,608 | 1,790 |
| Dunedin | 1,000 | 1,722 | 1,945 | 983 | 1,665 | 1,801 | 986 | 1,594 | 1,772 |
| Four chief centres | 1,000 | 1,688 | 1,895 | 1,001 | 1,697 | 1,842 | 1,015 | 1,655 | 1,841 |
| Hamilton | 1,000 | 1,634 | 1,840 | 993 | 1,684 | 1,804 | 982 | 1,586 | 1,762 |
| Tauranga | 1,000 | 1,636 | 1,819 | 999 | 1,673 | 1,804 | 1,022 | 1,641 | 1,830 |
| Rotorua | 1,000 | 1,634 | 1,821 | 1,016 | 1,700 | 1,813 | 1,005 | 1,638 | 1,820 |
| Napier-Hastings | 1,000 | 1,625 | 1,820 | 994 | 1,660 | 1,777 | 977 | 1,589 | 1,767 |
| New Plymouth | 1,000 | 1,636 | 1,846 | 996 | 1,688 | 1,812 | 977 | 1,579 | 1,761 |
| Wanganui | 1,000 | 1,622 | 1,854 | 997 | 1,693 | 1,819 | 955 | 1,554 | 1,722 |
| Palmerston North | 1,000 | 1,600 | 1,803 | 993 | 1,693 | 1,806 | 978 | 1,592 | 1,769 |
| Nelson | 1,000 | 19,644 | 1,852 | 989 | 1,690 | 1,839 | 969 | 1,593 | 1,780 |
| Timaru | 1,000 | 1,637 | 1,834 | 1,010 | 1,666 | 1,794 | 1,006 | 1,579 | 1,749 |
| Invercargill | 1,000 | 1,618 | 1,804 | 991 | 1,671 | 1,815 | 1,003 | 1,591 | 1,752 |
| Ten larger centres | 1,000 | 1,626 | 1,828 | 996 | 1,682 | 1,806 | 985 | 1,592 | 1,768 |
| Six smaller North Island centres | 1,000 | 1,628 | 1,830 | 1,009 | 1,691 | 1,821 | 988 | 1,594 | 1,764 |
| Five smaller South Island centres | 1,000 | 1,616 | 1,807 | 995 | 1,655 | 1,796 | 978 | 1,568 | 1,733 |
| Twenty-five centres combined | 1,000 | 1,657 | 1,861 | 1,000 | 1,689 | 1,825 | 1,000 | 1,623 | 1,803 |
Retail Prices—New Zealand retail prices (weighted average prices over 25 centres) at 15 November 1974 of a number of the commodities which enter into the Consumers Price Index are shown hereunder.
| Commodity | Unit | Price |
|---|---|---|
| cents | ||
| Potatoes, main crop | lb | 12.95 |
| Potatoes, new | lb | 14.33 |
| Apples | lb | 22.27 |
| Cabbage | lb | 14.10 |
| Carrots | lb | 21.16 |
| Onions | lb | 17.79 |
| Oranges | lb | 24.01 |
| Peaches, canned | 29 on tin | 48.69 |
| Peas, frozen | 30 oz pkt | 58.68 |
| Beef, porterhouse steak | lb | 109.85 |
| Beef, prime rib | lb | 67.66 |
| Beef, rump steak | lb | 98.69 |
| Beef, blade steak | lb | 72.74 |
| Beef, mince | lb | 53.22 |
| Beef, corned silverside | lb | 76.41 |
| Sausages, beef | lb | 42.01 |
| Hogget, cut leg, knuckle end | lb | 62.02 |
| Hogget, forequarter | lb | 36.01 |
| Hogget, chops, middle loin | lb | 60.51 |
| Pork, leg, whole | lb | 97.14 |
| Pork, chops, middle loin | lb | 99.51 |
| Tripe | lb | 39.38 |
| Sheep's liver | lb | 55.14 |
| Sheep's tongue | each lb | 7.53 |
| Ham, cooked, sliced | lb | 200.21 |
| Bacon, side | lb | 145.86 |
| Tarakihi fillets | lb | 89.28 |
| Groper (hapuku) pieces | lb | 87.57 |
| Sole or flounder, gutted | lb | 73.13 |
| Smoked fish | lb | 82.24 |
| Salmon, fancy pink | 7 3/4 oz tin | 83.22 |
| Milk, fresh delivered | pint | 3.79 |
| Butter | lb | 32.60 |
| Cheese, tasty rindless | lb | 74.10 |
| Milk powder, full cream | 2 1/2 lb tin | 162.96 |
| Bread | 28 oz loaf | 15.24 |
| Flour | 25 lb bag | 176.84 |
| Oatmeal, pre-cooked | 3 lb pkt | 67.22 |
| Prepared breakfast food | 24 oz pkt | 38.10 |
| Rice | lb | 30.03 |
| Sugar | 6 lb | 73.09 |
| Honey | 1 lb ctn | 54.90 |
| Jam, apricot | 14 oz tin | 34.84 |
| Tea | 1/2 lb pkt | 39.56 |
| Cocoa | 1/1 lb pkt | 41.38 |
| Coffee, pure, ground loose | lb | 116.90 |
| Coffee, instant | 4 oz jar | 84.10 |
| Salt, polythene wrapped | 5 lb bag | 31.78 |
| Baked beans | 16 oz tin | 33.18 |
| Tomato sauce | 10 oz bbl | 30.87 |
| Tomato soup | 11 oz tin | 19.98 |
| Aerated water | 10 oz btl | 11.62 |
| Ice-cream, vanilla | pint block | 27.65 |
| Eggs, standard (in carton) | Dozen | 77.85 |
| Chocolate (tablet) | 6 oz | 41.32 |
| Weekly rent, unfurnished dwelling | Each dwelling | 12.61 |
| Concrete blocks | per 100 | 33.61 |
| Wallpaper | Roll | 2.43 |
| Paint | Gal tin | 13.09 |
| Weekly costs of owner-occupancy of dwellings—Rates | Each dwelling | 2.31 |
| Coal domestic | 1/4 ton | 8.74 |
| Electric current (incl. water heating) | 510 kwh per month | 5.86 |
| Gas, domestic 1600 cu ft (7.2 therms Nat. Gas) | per month | 3.35 |
| Kerosene, domestic use | Gal | 0.52 |
| Fuel, oil domestic heating, delivered | Gal | 0.43 |
| Refrigerator 9.25 cu ft | Each | 245.40 |
| Washing machine, semi-automatic, spin dry | Each | 299.39 |
| Vacuum cleaner | Each | 75.00 |
| Radio, table model | Each | 52.44 |
| Radio, transistor, portable | Each | 60.67 |
| Television set 24* consolette | Each | 381.99 |
| Electric radiator | Each | 50.28 |
| Electric fry pan | Each | 39.40 |
| Electric jug | Each | 22.25 |
| Electric toaster | Each | 12.96 |
| Electric iron, dry | Each | 22.17 |
| Electric blanket | Each | 19.31 |
| Electric hand drill | Each | 20.13 |
| Lawnmower, hand type | Each | 47.58 |
| Lawnmower, rotary type | Each | 245.92 |
| Piano, upright | Each | 792.68 |
| Perambulator | Each | 83.71 |
| Dining room suite | Each | 146.74 |
| Cocktail cabinet | Each | 190.05 |
| Tallboy | Each | 47.01 |
| Child's cot | Each | 44.42 |
| Lounge suite | Each | 376.82 |
| Bedstead | Each | 39.42 |
| Mattress, innerspring, 4' 6 inch | Each | 111.67 |
| Mattress, foam rubber, 4' 6 inch | Each | 76.90 |
| Venetian blinds, 72 in. wide 54 in. drop | Each | 46.71 |
| Alarm clock | Each | 11.09 |
| Carpet, broadloom | Yard | 45.06 |
| Doormat, coir | Each | 2.61 |
| Drapery—Blankets, single, all wool | Pair | 28.55 |
| Sheets, single | Pair | 9.12 |
| Pillow, kapok | Each | 2.34 |
| Towel, turkish | Each | 3.08 |
| Tea towel, linen | Each | 1.04 |
| Plate, 10 in. replacement type | Each | 0.76 |
| Tea set, 21 piece, bone china | Set | 27.35 |
| Knives, table, stainless | 1/2 doz | 8.43 |
| Forks, table, E.P.N.S. | 1/2 doz | 8.22 |
| Preserving jars, glass, quart 8" seals and rings | Doz | 2.87 |
| Casserole dish | Each | 4.85 |
| Piedish, enamel 11” | Each | 0.75 |
| Mixing bowl, stainless steel, 8” | Each | 3.38 |
| Saucepan, 8" aluminium | Each | 9.69 |
| Dustbin—standard size | Each | 7.12 |
| Broom | Each | 4.71 |
| Scrubbing brush | Each | 0.85 |
| Bucket, plastic, 2 gallon | Each | 1.40 |
| Hammer, carpenters, steel shaft | Each | 5.73 |
| Plane | Each | 7.79 |
| Spade, garden | Each | 8.74 |
| Soap powder | 40 oz pkt | 0.69 |
| Detergent, plastic container | 19 1/2 oz | 0.53 |
| Household cleaning paste | Standard tin | 0.36 |
| Disinfectant | 110 ml. | 0.42 |
| Fly spray | 12 flu. oz. can | 1.10 |
| Boot polish | 2 3/4" tin | 0.21 |
| Floor polish | 8 oz tin | 0.58 |
| Electric light bulb 100 watt | Each | 0.37 |
| Torch, battery, dry cell | Each | 0.14 |
| Telephone rental, private (main exchange) | 1 year | 59.94 |
| Telegram, 15 words | Each | 0.44 |
| Postage, letter (first class surface) | Each | 0.04 |
| Dry cleaning, men's 2-piecc suit | Per suit | 1.91 |
| Laundering sheets | 6 single | 1.43 |
| Men's Raincoat, (terylene- mixture or similar) | Each | 48.38 |
| Parka, unlined | Each | 16.39 |
| Raincoat, nylon | Each | 8.06 |
| Hat, felt | Each | 11.61 |
| Suit, worsted, readymade, two piece | Each | 85.87 |
| Sports coat, worsted, ready-made | Each | 61.71 |
| Trousers, sports | Pair | 23.46 |
| Trousers, jeans | Pair | 7.02 |
| Shirt, business | Each | 9.96 |
| Shirt, brushed cotton | Each | 4.24 |
| Cardigan, all wool | Each | 20.35 |
| Bathing trunks, Bri-nylon | Each | 5.18 |
| Pyjamas, flannelette | Pair | 6.61 |
| Singlet, athletic | Each | 1.77 |
| Socks | Pair | 2.09 |
| Handkerchiefs | Each | 0.43 |
| Women's suit, coat and skirt, ready-made | Each | 65.07 |
| Coat, woollen, winter | Each | 67.90 |
| Raincoat, lightweight, proofed | Each | 37.34 |
| Frock, summerweight, house | Each | 14.04 |
| Skirt, winterweight | Each | 21.11 |
| Slacks, tailored, ready made | Pair | 14.91 |
| Cardigan, all wool | Each | 15.75 |
| Wool hand knitting | 1 oz | 0.42 |
| Women's Swimsuit, bri-nylon | Each | 17.35 |
| Nightdress, nylon | Each | 7.34 |
| Nightdress, winterweight | Each | 5.67 |
| Underslip, nylon | Each | 5.24 |
| Panties, cotton | Pair | 2.87 |
| Vest, silk and wool | Each | 1.68 |
| Women's Brassiere, cotton | Each | 4.37 |
| Corset, lycra | Each | 19.04 |
| Panty hose | Pair | 1.45 |
| Umbrella, nylon | Each | 5.94 |
| Boys' Raincoat, cotton | Each | 16.36 |
| Blazer | Each | 21.61 |
| Trousers, shorts, worsted | Pair | 7.67 |
| Shirt, cotton, college style | Each | 4.99 |
| Shirt, T-shirt, cotton | Each | 2.31 |
| Pullover, woollen | Each | 9.04 |
| Socks | Pair | 1.89 |
| Girls' Gym frock | Each | 18.06 |
| Frock, summer uniform | Each | 12.70 |
| Blouse, college, cotton | Each | 5.12 |
| Pyjamas, winceyette | Pair | 3.91 |
| Panties, interlock | Pair | 1.07 |
| Sockettes | Pair | 1.03 |
| Infants' Nursery squares | Doz. | 9.15 |
| Baby's vest | Each | 0.99 |
| Baby wool | 1 oz | 0.43 |
| Piece goods, tweed velour coating | Yard | 6.50 |
| Viyella | Yard | 2.91 |
| Sail cloth | Yard | 1.02 |
| Dress, pattern | Each | 1.00 |
| Men's Boots, heavy | Pair | 20.47 |
| Shoes, light | Pair | 21.10 |
| Sandshoes | Pair | 3.15 |
| Jandals (thongs) | Pair | 1.90 |
| Slippers, leather | Pair | 9.24 |
| Shoe repairs, 1/2 soled and heeled | Pair | 5.38 |
| Women's Shoes, heavy | Pair | 14.92 |
| Shoes, light | Pair | 16.51 |
| Slippers, felt | Pair | 4.24 |
| Shoe repairs, cemented leather sole, heel tip and toe plates | Pair | 3.91 |
| Boy's Football boots | Pair | 12.45 |
| Shoes, heavy | Pair | 10.25 |
| Gumboots | Pair | 5.77 |
| Girls' Shoes, school | Pair | 8.11 |
| Shoes light | Pair | 8.32 |
| Infants' Shoes, plastic sole | Pair | 2.37 |
| Petrol - 96 octane | Gal. | 0.69 |
| Bicycle, men's sports roadster | Each | 78.80 |
| Bicycle tyre | Each | 3.74 |
| Bicycle tube | Each | 1.88 |
| Cigarettes | Pkt of 20 | 0.44 |
| Tobacco, cigarette | 2 oz. pkt | 0.78 |
| Aspirin | Pkt of 25 | 0.23 |
| Toothbrush | Each | 0.35 |
| Toothpaste, large tube | Per tube | 0.39 |
| Toilet soap, bath size tablet | Each | 0.18 |
| Toilet paper | Per 3 rolls | 0.44 |
| Razor blades, stainless steel | Pkt of 5 | 0.71 |
| Electric razor | Each | 25.38 |
| Baby talcum powder | Small tin | 0.43 |
| Attache case, fibre | Each | 6.55 |
| Brief case, leather | Each | 27.99 |
| Suitcase, large | Each | 18.17 |
| Men's watch wristlet | Each | 52.79 |
| Newspaper daily | Each | 0.06 |
| Library subscription | Per book | 0.15 |
| Popular book paper back | Each | 1.21 |
| Writing pad | Each | 0.22 |
| Pencil, black lead | Each | 0.08 |
| Developing and printing black and white film | Per film | 0.84 |
| Camera film, colour | Each | 3.79 |
| Tricycle, child's | Each | 50.39 |
| Teddy bear | Each | 10.14 |
| Junior engineering construction set | Each | 5.68 |
| Tennis racquet | Each | 15.16 |
| Tennis balls | Pair | 1.02 |
| Bowls, outdoor | Set of 4 | 55.38 |
| Rifle | Each | 41.93 |
| Ammunition .303 | Box of 20 | 5.69 |
| Optometritss' fees, full examination and spectacles with case | Each | 28.93 |
| Dental extraction | Each | 5.56 |
| Dental filling | Each | 3.98 |
| Dentures | Set | 119.75 |
| Medical (excess over Social Security) Private general hospital | Per day | 14.51 |
| Cinema admission | Scat | 1.07 |
| Football admission | Each | 0.44 |
| Football club subscription | Each | 4.86 |
| Tennis club subscription | Each | 15.12 |
| Television licence | Each | 20.00 |
| Haircut, men | Each | 0.94 |
| Haircut, women | Each | 1.24 |
| Hairset | Each | 2.52 |
| Permanent wave | Each | 10.10 |
| Watch, repair fee | Each | 8.07 |
| Funeral - burial | Each | 375.21 |
| Funeral - cremation | Each | 337.19 |
International Comparisons—The table following provides a comparison of retail prices between New Zealand and certain other countries. All the prices have been converted into New Zealand currency and the Imperial liquid and dry measures have been adopted as the basis for common units of quantity.
Prices shown for the United States of America do not include sales tax. A similar table of wholesale prices is shown later. Currency conversion basis: Australia, A$1=NZ$1.04; Great Britain, £1=NZ$1.6454; South Africa, 1 Rand=NZ$1.04; United States, US$1=NZ67.709c; Canada, $1 = NZ68.13c.
| INTERNATIONAL COMPARISON OF RETAIL PRICES OF BASIC FOODSTUFFS | ||||||
|---|---|---|---|---|---|---|
| (At December 1974 in New Zealand currency) | ||||||
| Item | Unit | New Zealand (Average 25 Centres) | Australia (Sydney) | Great Britain* (London) | South Africa (Cape Town) | United States (Average 56 Cities)* |
* November (Great Britain): October (U.S.A.) † 1 3/4 lb. †† Cake flour. ‡ At price for 3 lb lots. ‡‡ Mixed coffee. § Loose. ¶ Sirloin. ψ Hogget. p 29 oz. Sources: Australia: Commonwealth Statistician. Great Britain: New Zealand High Commissioner. South Africa: Bureau of Census and Statistics. U.S.A.: Bureau of Labor. | ||||||
| cents | cents | cents | cents | cents | ||
| Bread | 2 lb | 15.3† | 39.4 | 23.1† | 17.9 | 54.6 |
| Hour | 25 lb | 177.4 | 308.1 | 226.1‡ | 292.5†† | 385.2 |
| Tea | lb | 81.7 | 80.0 | 60.5 | 100.6 | .. |
| Coffee | lb | 117.4§ | .. | 107.7 | 75.4‡‡ | 100.9 |
| Sugar | lb | 12.2 | 10.3 | 17.6 | 8.2 | 32.0 |
| Milk (fresh) | pint | 3.8 | 20.6 | 9.8 | 12.7 | 14.9 |
| Butter | lb | 32.6 | 65.6 | 40.0 | 64.3 | 72.4 |
| Cheese | lb | 74.3 | 69.1 | 71.2 | 82.5 | 109.6 |
| Bacon | lb | 148.4 | 153.7 | 112.7 | 98.8 | 108.7 |
| Prunes | lb | 55.6 | .. | 51.0 | 65.8 | .. |
| Canned peaches | 30 oz tin | 48.3p | 42.9 | 51.0 | 43.6 | |
| Beef, rib roast | lb | 65.9 | 74.7 | .. | 108.0¶ | 126.2 |
| Mutton, leg | lb | 60.6ψ | 72.0 | .. | 111.4 | .. |
| Pork— | ||||||
| Leg | lb | 97.3 | 114.5 | 85.4 | 77.8 | .. |
| Chops | lb | 100.0 | 108.1 | 149.5 | 78.9 | 124.2 |
| Margarine | lb | 67.3 | 56.7 | 39.1 | 43.9 | 60.0 |
Comparisons in annual movement of Consumer Price Indexes of selected countries are given in the following table. (The base is calendar year 1965 = 1000.)
| Year | New Zealand | Australia | Canada | France (Paris) | Japan | United Kingdom | United States |
|---|---|---|---|---|---|---|---|
| 1964 | 967 | 962 | 976 | 972 | 929 | 955 | 984 |
| 1965 | 1,000 | 1,000 | 1,000 | 1,000 | 1,000 | 1,000 | 1,000 |
| 1966 | 1,028 | 1,030 | 1,037 | 1,023 | 1,051 | 1,039 | 1,030 |
| 1967 | 1,090 | 1,062 | 1,074 | 1,057 | 1,092 | 1,065 | 1,059 |
| 1968 | 1,137 | 1,091 | 1,119 | 1,107 | 1,150 | 1,115 | 1,104 |
| 1969 | 1,193 | 1,123 | 1,169 | 1,177 | 1,213 | 1,176 | 1,163 |
| 1970 | 1,271 | 1,167 | 1,208 | 1,244 | 1,308 | 1,251 | 1,232 |
| 1971 | 1,403 | 1,237 | 1,242 | 1,312 | 1,388 | 1,368 | 1,284 |
| 1972 | 1,500 | 1,310 | 1,302 | 1,393 | 1,451 | 1,466 | 1,327 |
| 1973 | 1,623 | 1,434 | 1,400 | 1,496 | 1,622 | 1,600 | 1,410 |
| 1974 | 1,803 | 1,651 | 1,553 | 1,700 | 2,014 | 1,858 | 1,566 |
WHOLESALE PRICES INDEX—The present Wholesale Prices Index was described in a special supplement to the October 1959 issue of the Monthly Abstract of Statistics under the title Index Numbers of Wholesale Prices. A brief summary of the salient features of this revision appeared in the 1960 Yearbook (pages 992-994).
This index is not a single wholesale prices index, but a series of price index numbers related to broad groupings of the inter-industry transactions distinguished in the department's input-output tables for the New Zealand economy. Thus each of the index numbers relates to a group of commodity transactions occurring at certain price levels between defined sectors in the economy. Capital goods as well as goods for current consumption or usage are represented in the various commodity flows.
Wholesale Prices Index Numbers—The table which follows is divided into two parts; the first covers “input” prices and the second “output” prices. Within the first part of the table there is a breakup into goods for industrial use (analysed by sector destinations), for consumption, and for export. In each flow imported goods are distinguished from locally produced goods. In this part of the table all prices are inclusive of sales tax and excise duties and net of subsidies; the prices for exports marketed overseas are the prices in these markets brought to an f.o.b. basis, i.e., their “input” prices to other countries.
In the second part of the table the broad producing sectors are distinguished. Here the prices of their outputs are used. They are taken before the addition of sales and excise duties or the deduction of subsidies. The prices for export meat and dairy products are those payable to producers under the different stabilisation and minimum export-meat-prices schemes.
The primary produce processing industries group comprises the two major industries, meat export works and dairy factories, processing farm products mainly for export.
The expression base for the index is the calendar year 1958.
| WHOLESALE PRICES INDEX | |||||||||||||
|---|---|---|---|---|---|---|---|---|---|---|---|---|---|
| Base: 1958 (= 1000) | |||||||||||||
| Index Numbers of Commodity Prices by Sectors of Destination* | |||||||||||||
| Calendar Year | Prices Paid for Commodities Used by | Other Countries (Exported) | All Commodities | ||||||||||
| Domestic Industry | Consumers | Domestic Industry and Consumers | |||||||||||
| Imported | Home Produced | Total | Imported | Home Produced | Total | Imported | Home Produced | Total | Imported | Home Produced | Total | ||
*The prices used in this table are those payable by the using or consuming sectors, i.e., including indirect taxation and net after subsidies; the export prices are NZ f.o.b. equivalent of overseas market prices. †This consists of manufacturing industries (excluding primary produce processing industries), building and construction, transport and communication, wholesale and retail trade, banking and finance, and public utilities and services. ‡Other than Primary Produce Processing Industries. §Includes wholesale and retail trade, banking and finance, and public utilities and services. ||Provisional. | |||||||||||||
| 1958 | 1,000 | 1,000 | 1,000 | 1,000 | 1,000 | 1,000 | 1,000 | 1,000 | 1,000 | 1,000 | 1,000 | 1,000 | 1,000 |
| 1964 | 1,039 | 1,071 | 1,060 | 1,037 | 1,088 | 1,076 | 1,038 | 1,077 | 1,065 | 1,259 | 1,038 | 1,116 | 1,097 |
| 1965 | 1,058 | 1,111 | 1,093 | 1,054 | 1,111 | 1,097 | 1,057 | 1,111 | 1,094 | 1,184 | 1,057 | 1,126 | 1,109 |
| 1966 | 1,075 | 1,131 | 1,113 | 1,076 | 1,124 | 1,113 | 1,075 | 1,129 | 1,113 | 1,159 | 1,075 | 1,135 | 1,120 |
| 1967 | 1,104 | 1,123 | 1,117 | 1,143 | 1,198 | 1,185 | 1,114 | 1,148 | 1,138 | 1,042 | 1,114 | 1,125 | 1,122 |
| 1968 | 1,238 | 1,174 | 1,195 | 1,287 | 1,263 | 1,269 | 1,250 | 1,204 | 1,218 | 1,144 | 1,250 | 1,191 | 1,206 |
| 1969 | 1,299 | 1,245 | 1,263 | 1,322 | 1,317 | 1,318 | 1,305 | 1,269 | 1,280 | 1,224 | 1,305 | 1,259 | 1,271 |
| 1970 | 1,392 | 1,306 | 1,334 | 1,375 | 1,408 | 1,400 | 1,388 | 1,340 | 1,355 | 1,234 | 1,388 | 1,318 | 1,335 |
| 1971 | 1,496 | 1,395 | 1,429 | 1,483 | 1,539 | 1,525 | 1,493 | 1,444 | 1,459 | 1,382 | 1,493 | 1,430 | 1,446 |
| 1972λ | 1,597 | 1,511 | 1,540 | 1,571 | 1,612 | 1,603 | 1,591 | 1,546 | 1,559 | 1,867 | 1,591 | 1,615 | 1,609 |
| 1973|| | 700 | 1,807 | 1,772 | 1,652 | 1,745 | 1,723 | 1,689 | 1,786 | 1,757 | 2,324 | 1,689 | 1,903 | 1,849 |
| 1974|| | 2,019 | 1,840 | 1,899 | 1,939 | 1,920 | 1,925 | 2,000 | 1,867 | 1,907 | 1,931 | 2,000 | 1,881 | 1,911 |
| Calendar Year | Prices Paid for Commodities Used by Domestic Industry | |||||||||
|---|---|---|---|---|---|---|---|---|---|---|
| Primary Industries | Primary Produce Processing Industries | All Other Industries† | ||||||||
| Imported | Home Produced | Total | Imported | Home Produced | Total | Imported | Home Produced | |||
| Farming | All Other Industries | Total | ||||||||
| 1958 | 1,000 | 1,000 | 1,000 | 1,000 | 1,000 | 1,000 | 1,000 | 1,000 | 1,000 | 1,000 |
| 1964 | 999 | 967 | 1,030 | 997 | 995 | 1,049 | 1,047 | 1,043 | 1,107 | 1,078 |
| 1965 | 1,028 | 1,149 | 1,056 | 1,091 | 1,059 | 1,091 | 1,090 | 1,061 | 1,122 | 1,094 |
| 1966 | 1,046 | 1,261 | 1,106 | 1,162 | 1,088 | 1,075 | 1,075 | 1,077 | 1,141 | 1,113 |
| 1967 | 1,068 | 1,162 | 1,147 | 1,139 | 1,133 | 1,003 | 1,007 | 1,107 | 1,175 | 1,144 |
| 1968 | 1,154 | 1,058 | 1,210 | 1,134 | 1,256 | 1,084 | 1,089 | 1,245 | 1,236 | 1,240 |
| 1969 | 1,213 | 1,120 | 1,243 | 1,184 | 1,258 | 1,196 | 1,198 | 1,308 | 1,292 | 1,299 |
| 1970 | 1,309 | 1,210 | 1,287 | 1,257 | 1,249 | 1,219 | 1,220 | 1,402 | 1,371 | 1,385 |
| 1971 | 1,381 | 1,287 | 1,369 | 1,336 | 1,406 | 1,256 | 1,260 | 1,508 | 1,491 | 1,499 |
| 1972 | 1,472 | 1,443 | 1,448 | 1,450 | 1,592 | 1350x | 1358x | 1,609 | 1,617 | 1,614 |
| 1973 | 1,545 | 2,004 | 1,552 | 1,746 | 1,647 | 1,826 | 1,820 | 1,716 | 1,803 | 1,764 |
| 1974 | 1,883 | 2,078 | 1,693 | 1,894 | 1,867 | 1,734 | 1,738 | 2,035 | 1,876 | 1,947 |
| Calendar Year | Prices Paid for Commodities Used by Domestic Industry | ||||||
|---|---|---|---|---|---|---|---|
| Manufacturing Industries‡ | Building and Construction | ||||||
| Imported | Other Manufacturing Industries | All Other Industries | |||||
| Total | Imported | Home Produced | Total | ||||
| 1958 | 1,000 | 1,000 | 1,000 | 1,000 | 1,000 | 1,000 | 1,000 |
| 1964 | 1,043 | 1,080 | 1,181 | 1,085 | 1,070 | 1,095 | 1,086 |
| 1965 | 1,044 | 1,084 | 1,172 | 1,084 | 1,096 | 1,141 | 1,124 |
| 1966 | 1,063 | 1,092 | 1,209 | 1,105 | 1,110 | 1,171 | 1,149 |
| 1967 | 1,091 | 1,163 | 1,154 | 1,125 | 1,149 | 1,203 | 1,183 |
| 1968 | 1,250 | 1,231 | 1,224 | 1,239 | 1,284 | 1,254 | 1,265 |
| 1969 | 1,322 | 1,298 | 1,301 | 1,311 | 1,349 | 1,298 | 1,316 |
| 1970 | 1,407 | 1,376 | 1,331 | 1,381 | 1,508 | 1,420 | 1,452 |
| 1971 | 1,500 | 1,478 | 1,409 | 1,473 | 1,649 | 1,608 | 1,623 |
| 1972 | 1,601 | 1,605 | 1,640 | 1,611 | 1,755 | 1,696 | 1,717 |
| 1973|| | 1,704 | 1,722 | 2,120 | 1,806 | 1,845 | 1,792 | 1,812 |
| 1974|| | 2,043 | 1,898 | 1,898 | 1,971 | 2,076 | 1,988 | 2,020 |
| Calendar Year | Prices Paid for Commodities Used by Domestic Industry | |||||
|---|---|---|---|---|---|---|
| Transport and Communication | Other Industries§ | |||||
| Imported | Home Produced | Total | Imported | Home Produced | Total | |
| 1958 | 1,000 | 1,000 | 1,000 | 1,000 | 1,000 | 1,000 |
| 1964 | 1,017 | 1,054 | 1,027 | 1,034 | 1,086 | 1,071 |
| 1965 | 1,072 | 1,072 | 1,072 | 1,083 | 1,103 | 1,097 |
| 1966 | 1,073 | 1,082 | 1,076 | 1,108 | 1,106 | 1,107 |
| 1967 | 1,096 | 1,111 | 1,100 | 1,137 | 1,187 | 1,173 |
| 1968 | 1,189 | 1,148 | 1,178 | 1,213 | 1,246 | 1,237 |
| 1969 | 1,227 | 1,186 | 1,216 | 1,252 | 1,288 | 1,273 |
| 1970 | 1,307 | 1,254 | 1,292 | 1,309 | 1,370 | 1,353 |
| 1971 | 1,430 | 1,358 | 1,410 | 1,415 | 1,481 | 1,463 |
| 1972 | 1,536 | 1,427 | 1,506 | 1,499 | 1,553 | 1,539 |
| 1973|| | 1,720 | 1,483 | 1,655 | 1,571 | 1,645 | 1,625 |
| 1974|| | 2,081 | 1,599 | 1,950 | 1,877 | 1,756 | 1,789 |
| Index Numbers of Commodity Prices by Sector of Origin* | ||||||||
|---|---|---|---|---|---|---|---|---|
| Calendar Year | Prices Received for Commodities Produced in New Zealand | |||||||
| Output of | Used by | |||||||
| Farming | Other Primary Industries | Primary Produce Processing Industries | Other Manufacturing Industries | Public Utilities | All Domestic Industry† | Industry and Consumers | Other Countries (Exported) | |
*The prices used in this part of the table are those receivable by producers, i.e., before addition of indirect taxation or deduction of consumer or user subsidies; prices for dairy produce and meat are those payable to producers under the schemes to stabilise returns from year to year. †Comprises the outputs of the five sectors mentioned in this part of the table. ‡Provisional. | ||||||||
| 1958 | 1,000 | 1,000 | 1,000 | 1,000 | 1,000 | 1,000 | 1,000 | 1,000 |
| 1964 | 1,111 | 1,186 | 1,071 | 1,096 | 1,094 | 1,099 | 1,078 | 1,166 |
| 1965 | 1,113 | 1,231 | 1,095 | 1,109 | 1,106 | 1,112 | 1,114 | 1,106 |
| 1966 | 1,118 | 1,286 | 1,117 | 1,126 | 1,116 | 1,126 | 1,133 | 1,105 |
| 1967 | 1,027 | 1,327 | 1,046 | 1,158 | 1,178 | 1,102 | 1,134 | 994 |
| 1968 | 1,053 | 1,431 | 1,143 | 1,230 | 1,292 | 1,167 | 1,191 | 1,086 |
| 1969 | 1,119 | 1,486 | 1,236 | 1,296 | 1,298 | 1,235 | 1,258 | 1,161 |
| 1970 | 1,144 | 1,531 | 1,273 | 1,384 | 1,308 | 1,290 | 1,328 | 1,163 |
| 1971 | 1,201 | 1,700 | 1,340 | 1,512 | 1,322 | 1,382 | 1,430 | 1,222 |
| 1972 | 1,420 | 1,791 | 1,607 | 1,629 | 1,386 | 1,555 | 1,538 | 1,613 |
| 1973‡ | 2,000 | 1,875 | 1,917 | 1,772 | 1,427 | 1,862 | 1,786 | 2,112 |
| 1974‡ | 1,811 | 2,039 | 1,797 | 1,919 | 1,465 | 1,850 | 1,869 | 1,789 |
| COMPARISON OF WHOLESALE PRICES OF CERTAIN COMMODITIES | |||||
|---|---|---|---|---|---|
| (At November 1974 in New Zealand currency) | |||||
| For currency conversion basis see page 661 | |||||
| Item | Unit | New Zealand* | Canada | Great Britain | United States |
* Priced once each quarter. Sources: Canada: Prices and Price Indexes - Dominion Bureau of Statistics. Great Britain: wheat and oats - Ministry of Agriculture, Fisheries, and Food: butter and cheese—New Zealand Dairy Board: motor spirits - Department of Trade and Industry. U.S.A.: Survey of Current Business. | |||||
| $ | $ | $ | $ | ||
| Wheat | bushel | 1.625 | 4.741 | 3.136 | 4.315 |
| Oats | bushel | 1.450 | 1.887 | 1.877 | .. |
| Flour | short ton | 91.036 | .. | .. | 197.965 |
| Sugar | cwt | 12.197 | 60.208 | .. | 47.041 |
| Butter | lb | 0.310 | 0.693 | 0.457 | 0.539 |
| Cheese | lb | 0.460 | .. | 0.568 | 0.736 |
| Motor spirit | gallon | 0.599 | .. | 0.844 | .. |
Fanning Costs Price Indexes—There are now three farming costs price indexes being calculated. These cover sheep farming, dairy farming, and all farming.
These indexes are designed to measure price movements only as they would affect a fixed quantity and pattern of materials and services used by the farmers in each category.
The base is the year ended June 1971 (=1000).
It is emphasised that these indexes are not cost of production indexes, i.e., they do not purport to measure the actual total costs of running a farm, but only measure the movements in prices paid for commodities and services used by farmers.
Full descriptions of these indexes were published in supplements to the Monthly Abstract of Statistics; the sheep farming index in the September 1973 issue; the dairy farming index in the October 1973 issue; and the all farming index in the March 1974 issue.
The index values for the all farming index since the base period, year ended June 1971, are set out below.
| Item | Percentage of Base Expenditure | Year Ended June | |||
|---|---|---|---|---|---|
| 1971 | 1972 | 1973 | 1974† | ||
*Excludes depreciation 9.63 percent. †Provisional. | |||||
| Wages and rations | 13.71 | 1,000 | 1,111 | 1232x | 1,410 |
| Sharemilkers | 5.43 | 1,000 | 1,269 | 1411x | 1,692 |
| Animal health and breeding expenses. | 3.21 | 1,000 | 996 | 1090x | 1245x |
| Electricity | 1.32 | 1,000 | 1,034 | 1,034 | 1,059 |
| Feed | 8.57 | 1,000 | 1,032 | 1,157 | 1371x |
| Freight | 2.88 | 1,000 | 1,070 | 1,110 | 1,223 |
| Fertiliser and lime | 11.19 | 1,000 | 978 | 1022x | 1264x |
| Seeds | 1.32 | 1,000 | 932 | 1,069 | 1,533 |
| Shearing expenses | 3.63 | 1,000 | 1,074 | 1,120 | 1,269 |
| Weed and pest control | 1.28 | 1,000 | 1,039 | 1,067 | 1,320 |
| Other farm working expenses | 2.81 | 1,000 | 1,056 | 1,121 | 1,221 |
| Repairs and maintenance | 8.73 | 1,000 | 1,039 | 1,147 | 1257x |
| Vehicle expenses | 7.57 | 1,000 | 1,063 | 1,122 | 1,256 |
| Administrative expenses | 2.87 | 1,000 | 1,084 | 1,170 | 1,262 |
| Insurance | 1.07 | 1,000 | 1,043 | 1,064 | 1,065 |
| Rates | 3.08 | 1,000 | 1065x | 1224x | 1375x |
| Interest | 10.01 | 1,000 | 1,027 | 1054x | 1,086 |
| Rent | 1.69 | 1,000 | 1,012 | 1,013 | 1,025 |
| All Groups | 90.37* | 1,000 | 1058x | 1140x | 1296x |
EXPORT PRICES—The Export Prices Index was revised in 1972 and the base changed to the year ended June 1971. The revision of the Export Prices Index had as its main objectives:
(a) The broadening of the commodity coverage with the adoption of a more detailed and expanded classification. (The first full trade year for which statistics using this new classification were available was the year ended 30 June 1971). (b) Revision of the classification of commodity groupings. (c) The devising of an index which provides for a continuous updating of the pattern of exports. (d) The provision of complementary price and volume indexes.
Approximately 95 percent by value of all exports in the new index are explicitly dealt with. The proportion of manufactured exports so treated is higher than this overall average.
To qualify for inclusion as an explicit indicator of price movement in the index a commodity must have an aggregate value of at least $20,000 in an annual period, both base and current, and a minimum of $16,000 in the current quarterly period. This represents some 525 different items as well as subdivisions of these items.
A departure from the previous index is that the f.o.b. value of wool as recorded on export documentation is used, and not data derived from the Department of Statistics' wool price index which is based on auction sale data adjusted to an f.o.b. basis. (During the 1970-71 season 347,000 bales of wool were sold privately and 520,000 bales were scoured on account of buyers.)
In the following table are given export price index numbers for years ended 30 June.
| EXPORT PRICES INDEX | |||||||||||
|---|---|---|---|---|---|---|---|---|---|---|---|
| Base: Year ended June 1971 (=1000) | |||||||||||
| Year Ended 30 June | Butter | Cheese | Dairy Produce | Meat | Wool | Meat, Wool, and Byproducts | All Pastoral and Dairy Produce | Food, Beverages, and Tobacco | Manufactured Goods other than Food | Crude Materials other than Fuels | All Groups |
| *Provisional. | |||||||||||
| 1964 | 1,023 | 766 | 911 | 641 | 1,771 | 1,004 | 976 | .. | .. | .. | 960 |
| 1965 | 1,062 | 826 | 981 | 738 | 1,377 | 948 | 957 | .. | .. | .. | 944 |
| 1966 | 958 | 823 | 940 | 721 | 1,365 | 958 | 952 | .. | .. | .. | 938 |
| 1967 | 909 | 825 | 906 | 721 | 1,218 | 892 | 897 | .. | .. | .. | 887 |
| 1968 | 933 | 912 | 944 | 787 | 944 | 834 | 867 | .. | .. | .. | 862 |
| 1969 | 950 | 924 | 942 | 857 | 1,151 | 964 | 957 | .. | .. | .. | 953 |
| 1970 | 951 | 922 | 935 | 955 | 1,070 | 991 | 974 | .. | .. | .. | 973 |
| 1971 | 1,000 | 1,000 | 1,000 | 1,000 | 1,000 | 1,000 | 1,000 | 1,000 | 1,000 | 1,000 | 1,000 |
| 1972x | 1,687 | 1,444 | 1,646 | 988 | 1,131 | 1,040 | 1,172 | 1,206 | 1,051 | 1,099 | 1,160 |
| 1973x | 1,342 | 1,602 | 1,555 | 1,272 | 2,263 | 1,595 | 1,562 | 1,365 | 1,105 | 1,863 | 1,487 |
| 1974* | 1,141 | 1,709 | 1,522 | 1,492 | 2,614 | 1,826 | 1,735 | 1,497 | 1,225 | 2,139 | 1,657 |
The next table shows export prices index numbers for all pastoral and dairy produce groups and for all groups combined on a long time series. Separate series are prepared for calendar years and years ended June, the latter relating more closely to the farming year.
| EXPORT PRICES INDEX | ||
|---|---|---|
| Base: Year Ended June 1971 (=1000) | ||
| Year | All Pastoral and Dairy Produce | All Groups |
| *Provisional. | ||
| Calendar Year | ||
| 1924 | 397 | 390 |
| 1925 | 418 | 410 |
| 1926 | 337 | 334 |
| 1927 | 335 | 331 |
| 1928 | 374 | 367 |
| 1929 | 358 | 353 |
| 1930 | 278 | 277 |
| 1931 | 210 | 213 |
| 1932 | 191 | 194 |
| 1933 | 189 | 194 |
| 1934 | 236 | 239 |
| 1935 | 228 | 233 |
| 1936 | 264 | 266 |
| 1937 | 311 | 311 |
| 1938 | 286 | 288 |
| 1939 | 279 | 282 |
| 1940 | 324 | 325 |
| 1941 | 331 | 334 |
| 1942 | 341 | 342 |
| 1943 | 356 | 357 |
| 1944 | 374 | 376 |
| 1945 | 405 | 406 |
| 1946 | 443 | 444 |
| 1947 | 561 | 557 |
| 1948 | 624 | 619 |
| 1949 | 605 | 599 |
| 1950 | 860 | 846 |
| 1951 | 1,009 | 992 |
| 1952 | 806 | 798 |
| 1953 | 900 | 888 |
| 1954 | 915 | 905 |
| 1955 | 939 | 929 |
| 1956 | 917 | 906 |
| 1957 | 906 | 893 |
| 1958 | 767 | 761 |
| 1959 | 879 | 868 |
| 1960 | 851 | 843 |
| 1961 | 802 | 797 |
| 1962 | 818 | 813 |
| 1963 | 903 | 890 |
| 1964 | 987 | 970 |
| 1965 | 950 | 937 |
| 1966 | 942 | 927 |
| 1967 | 854 | 846 |
| 1968 | 914 | 911 |
| 1969 | 972 | 966 |
| 1970 | 974 | 971 |
| 1971 | 1056x | 1052x |
| 1972 | 1,295 | 1,268 |
| 1973* | 1,722 | 1,631 |
| 1974* | 1,635 | 1,604 |
| June Year | ||
| 1925 | 430 | 422 |
| 1926 | 366 | 361 |
| 1927 | 334 | 331 |
| 1928 | 369 | 362 |
| 1929 | 373 | 367 |
| 1930 | 308 | 305 |
| 1931 | 227 | 229 |
| 1932 | 202 | 204 |
| 1933 | 183 | 188 |
| 1934 | 235 | 237 |
| 1935 | 217 | 221 |
| 1936 | 254 | 257 |
| 1937 | 303 | 304 |
| 1938 | 296 | 297 |
| 1939 | 281 | 282 |
| 1940 | 317 | 320 |
| 1941 | 327 | 330 |
| 1942 | 342 | 342 |
| 1943 | 351 | 352 |
| 1944 | 366 | 368 |
| 1945 | 398 | 399 |
| 1946 | 416 | 417 |
| 1947 | 517 | 513 |
| 1948 | 623 | 618 |
| 1949 | 599 | 594 |
| 1950 | 694 | 685 |
| 1951 | 1,084 | 1,062 |
| 1952 | 809 | 803 |
| 1953 | 871 | 859 |
| 1954 | 921 | 909 |
| 1955 | 912 | 903 |
| 1956 | 934 | 922 |
| 1957 | 934 | 923 |
| 1958 | 781 | 773 |
| 1959 | 814 | 805 |
| 1960 | 900 | 889 |
| 1961 | 813 | 807 |
| 1962 | 797 | 791 |
| 1963 | 859 | 850 |
| 1964 | 976 | 960 |
| 1965 | 957 | 944 |
| 1966 | 952 | 938 |
| 1967 | 897 | 887 |
| 1968 | 867 | 862 |
| 1969 | 957 | 953 |
| 1970 | 974 | 973 |
| 1971 | 1,000 | 1,000 |
| 1972 | 1,172 | 1,160 |
| 1973* | 1,562 | 1,487 |
| 1974* | 1,735 | 1,657 |
IMPORT PRICES—Since 1949 the Import Prices Index has been derived from chained Fisher “Ideal” indexes. In this method two price indexes are calculated for each year on base previous year, one using the quantitative weighting pattern of the previous year and the other the quantitative weighting pattern of the latest year. The geometric mean of these two becomes the definitive index for the year, on base previous year, and is linked on to the index for that year on some earlier expression base. Since the trade statistics have, since 1962, been prepared for years ended June, the definitive import and export price indexes, and consequently terms of trade, are calculated accordingly. As from 1959 the price index is designed to reflect changes in the true c.i.f. cost of imports. Previously the calculations were based solely on the current domestic values of imports in the countries of origin as verified by the Customs Department. Differential changes in prices of and freight rates for a substantial number of import items with a low value per unit of weight can result in current domestic valuation changes being only a poor indication of c.i.f. cost movements. By measuring current domestic valuation price changes at the item level, and adjusting for changes in c.d.v. and c.i.f. valuation ratios at the division level, the index shows changes in the true cost of imports to the New Zealand economy.
The Import Prices Index has been revised and the base changed to the year ended June 1971. Opportunity has been taken to prepare sub-indexes for several commodity groupings of major interest. These are presented in the following table back to 1963, and further groupings will be available in future.
| IMPORT PRICES INDEX | |||||||||||
|---|---|---|---|---|---|---|---|---|---|---|---|
| Base: Year Ended June 1971 (=1000) | |||||||||||
| Year Ended June | Petroleum and Products | Textile Yarn, Fabrics, etc. | Iron and Steel | Machinery Other than Electric | Electric Machinery and Apparatus | Transport Equipment | Food, Beverages, and Tobacco | Manufactured Goods other than Food | Crude Materials other than Fuels | Fuels | All Groups |
| *Provisional. | |||||||||||
| 1963 | 745 | 939 | 653 | 663 | 833 | 657 | .. | .. | .. | .. | 718 |
| 1964 | 707 | 913 | 645 | 680 | 835 | 649 | .. | .. | .. | .. | 727 |
| 1965 | 734 | 901 | 671 | 702 | 851 | 650 | .. | .. | .. | .. | 730 |
| 1966 | 752 | 895 | 664 | 720 | 839 | 660 | .. | .. | .. | .. | 734 |
| 1967 | 691 | 881 | 661 | 714 | 798 | 680 | .. | .. | .. | .. | 773 |
| 1968 | 898 | 892 | 719 | 787 | 902 | 762 | .. | .. | .. | .. | 808 |
| 1969 | 946 | 929 | 779 | 912 | 990 | 828 | .. | .. | .. | .. | 898 |
| 1970 | 898 | 970 | 880 | 919 | 974 | 864 | .. | .. | .. | .. | 935 |
| 1972x | 1,048 | 1,051 | 967 | 1,076 | 1,078 | 1,026 | 1,048 | 1,046 | 1,020 | 1,048 | 1,044 |
| 1973* | 1,051 | 1,097 | 997 | 1,110 | 1,072 | 1,107 | 1,136 | 1,075 | 1,006 | 1,051 | 1,072 |
| 1974* | 1,837 | 1,242 | 1,193 | 1,152 | 1,162 | 1,192 | 1,295 | 1,194 | 1,149 | 1,840 | 1,242 |
The following table shows a long time series of all groups import prices index numbers on the new expression base. Series are available for years ended March, June, and December.
| IMPORT PRICES INDEX | |
|---|---|
| Base: Year Ended June 1971 (= 1000) | |
| Year | Year Ended 31 December (Calendar Year) |
| 1926 | 315 |
| 1927 | 301 |
| 1928 | 284 |
| 1929 | 279 |
| 1930 | 276 |
| 1931 | 258 |
| 1932 | 244 |
| 1933 | 250 |
| 1934 | 247 |
| 1935 | 243 |
| 1936 | 242 |
| 1937 | 257 |
| 1938 | 258 |
| 1939 | 258 |
| 1940 | 297 |
| 1941 | 331 |
| 1942 | 363 |
| 1943 | 402 |
| 1944 | 420 |
| 1945 | 428 |
| 1946 | 478 |
| 1947 | 569 |
| 1948 | 581 |
| 1949 | 529 |
| Year | Year Ended | ||
|---|---|---|---|
| 31 March | 30 June | 31 December (Calendar Year) | |
| *Provisional. | |||
| 1950 | 541 | 554 | 580 |
| 1951 | 592 | 612 | 679 |
| 1952 | 709 | 730 | 741 |
| 1953 | 732 | 716 | 698 |
| 1954 | 698 | 694 | 689 |
| 1955 | 690 | 692 | 703 |
| 1956 | 706 | 715 | 721 |
| 1957 | 729 | 735 | 745 |
| 1958 | 746 | 743 | 742 |
| 1959 | 740 | 734 | 724 |
| 1960 | 725 | 732 | 734 |
| 1961 | 734 | 732 | 738 |
| 1962 | 735 | 733 | 721 |
| 1963 | 716 | 718 | 721 |
| 1964 | 724 | 727 | 732 |
| 1965 | 734 | 730 | 732 |
| 1966 | 733 | 734 | 734 |
| 1967 | 734 | 733 | 745 |
| 1968 | 776 | 808 | 878 |
| 1969 | 887 | 898 | 912 |
| 1970 | 920 | 935 | 967 |
| 1971 | 983 | 1,000 | 1,027 |
| 1972 | 1,033 | 1,044 | 1,056 |
| 1973* | 1,067 | 1,072 | 1120x |
| 1974* | 1,128 | 1,242 | 1,439 |
TERMS OF TRADE—The terms of trade is the expression of the ratio of export prices to import prices, i.e., an index of the purchasing power (in units of imports) of a fixed quantity of exports. In the table that follows terms of trade are expressed on base 1957 (=100). However, an index above or below 100 means only that terms of trade are more or less favourable than in 1957. The choice of base year was arbitrarily made and is not intended to indicate that 1957 was a normal or standard year. For the purposes of this table both import prices and export prices indexes have necessarily been converted to a 1957 base.
The table below shows index numbers of import prices, export prices, and terms of trade.
| IMPORT AND EXPORT PRICES AND TERMS OF TRADE—ALL COUNTRIES | |||
|---|---|---|---|
| Base: Calendar Year 1957 (=100) | |||
| Year Ended June | Import Price Index | Export Price Index | Terms of Trade |
*Provisional. †Calendar year (base). | |||
| 1957† | 100 | 100 | 100 |
| 1964 | 97 | 108 | 111 |
| 1965 | 98 | 106 | 108 |
| 1966 | 99 | 105 | 107 |
| 1967 | 98 | 99 | 101 |
| 1968 | 108 | 97 | 89 |
| 1969 | 121 | 107 | 88 |
| 1970 | 126 | 109 | 87 |
| 1971 | 134 | 112 | 83 |
| 1972 | 140 | 130 | 93 |
| 1973* | 144 | 167 | 116 |
| 1974* | 167 | 186 | 111 |
| Period | Import Price Index | Export Price Index | Terms of Trade |
|---|---|---|---|
| Quarter— | |||
| 1971—30 Sep | 141 | 119 | 85 |
| 31 Dec | 138 | 127 | 92 |
| 1972—31 Mar | 140 | 133 | 95 |
| 30 Jun | 142 | 138 | 97 |
| 30 Sep* | 142 | 146 | 102 |
| 31 Dec* | 143 | 155 | 109 |
| 1973—31 Mar* | 146 | 174 | 119 |
| 30 Jun* | 145 | 185 | 128 |
| 30 Sep* | 155 | 188 | 121 |
| 31 Dec* | 155 | 187 | 121 |
| 1974—31 Mar* | 165 | 186 | 112 |
| 30 Jun* | 188 | 182 | 97 |
| 30 Sep* | 200 | 175 | 87 |
| 31 Dec* | 214 | 174 | 82 |
SHARE PRICES INDEX—This index is designed to reflect changes in the aggregate value of holdings of parcels of ordinary shares in representative selections of companies listed on the New Zealand Stock Exchanges and trading in New Zealand. In selecting the companies, the frequency with which shares are traded was used as a criterion as well as the value of the New Zealand shareholding. Within the subgroups the weights of the different companies are determined by the New Zealand shareholding, and appropriate methods take account of capital changes in the companies concerned
The weights used to combine the subgroup indexes to obtain the group and all-groups indexes are fixed and are based on the aggregate value in 1960 of the total New Zealand shareholdings in all the exchange-listed companies which qualified for representation in the index.
Share Price and Dividend Yield Index Numbers—The following table shows the averages for the last 14 calendar years.
| SHARE PRICES AND DIVIDEND YIELDS—GROUP INDEX NUMBERS | ||||
|---|---|---|---|---|
| Base: 1960 (= 1000) | ||||
| Calendar Year | Industrial | Distribution | Finance | All Groups |
| Prices | ||||
| 1960 | 1,000 | 1,000 | 1,000 | 1,000 |
| 1962 | 958 | 864 | 1,026 | 963 |
| 1963 | 1,094 | 974 | 1,142 | 1,089 |
| 1964 | 1,330 | 1,143 | 1,153 | 1,252 |
| 1965 | 1,369 | 1,119 | 1,058 | 1,245 |
| 1966 | 1,279 | 902 | 1,042 | 1,153 |
| 1967 | 1,125 | 738 | 1,028 | 1,031 |
| 1968 | 1,334 | 753 | 1,348 | 1,232 |
| 1969 | 1,686 | 881 | 1,688 | 1,541 |
| 1970 | 1,741 | 895 | 1,705 | 1,581 |
| 1971 | 1,497 | 837 | 1,529 | 1,380 |
| 1972 | 1,624 | 940 | 1,659 | 1,500 |
| 1973 | 1,956 | 1,141 | 1,829 | 1,770 |
| 1974 | 1,635 | 880 | 1,408 | 1,440 |
| Dividend Yields | ||||
| 1960 | 1,000 | 1,000 | 1,000 | 1,000 |
| 1962 | 1,257 | 1,261 | 1,159 | 1,228 |
| 1963 | 1,159 | 1,176 | 1,130 | 1,153 |
| 1964 | 1,037 | 1,070 | 1,133 | 1,067 |
| 1965 | 1,054 | 1,138 | 1,282 | 1,120 |
| 1966 | 1,166 | 1,432 | 1,368 | 1,250 |
| 1967 | 1,369 | 1,718 | 1,426 | 1,433 |
| 1968 | 1,196 | 1,597 | 1,170 | 1,238 |
| 1969 | 1,019 | 1,384 | 1,046 | 1,068 |
| 1970 | 1,083 | 1,485 | 1,107 | 1,135 |
| 1971 | 1,310 | 1,688 | 1,275 | 1,351 |
| 1972 | 1,214 | 1,534 | 1,184 | 1,251 |
| 1973 | 1,118 | 1,372 | 1,235 | 1,183 |
| 1974 | 1,527 | 1,972 | 1,871 | 1,663 |
SUMMARY OF PRICE MOVEMENTS—A comparative table of index numbers of various related prices series is as follows. All index numbers are quoted on a New Zealand currency basis; index numbers of terms of trade on base 1965 (= 100), all others on base 1965 (= 1000).
| Year | Import Prices | Export Prices | Terms of Trade | Wholesale Prices* | Consumers' Prices | Share Prices (All Groups) | ||||
|---|---|---|---|---|---|---|---|---|---|---|
| Pastoral and Dairy Produce | All Exports | Imported | Home Produced† | All Commodities† | Food | All Groups | ||||
*The three series have been individually linked. †Includes only those home-produced items used by domestic industry and consumers. | ||||||||||
| 1930 | 378 | 293 | 296 | 78 | 317 | 333 | 319 | 351 | 394 | 391 |
| 1931 | 352 | 221 | 228 | 65 | 310 | 293 | 299 | 305 | 364 | 234 |
| 1932 | 333 | 201 | 207 | 62 | 308 | 276 | 291 | 280 | 336 | 222 |
| 1933 | 342 | 199 | 207 | 61 | 326 | 271 | 299 | 264 | 319 | 259 |
| 1934 | 337 | 248 | 255 | 76 | 323 | 279 | 301 | 279 | 324 | 303 |
| 1935 | 332 | 240 | 248 | 75 | 324 | 302 | 310 | 301 | 336 | 321 |
| 1936 | 331 | 278 | 284 | 86 | 324 | 310 | 313 | 314 | 347 | 305 |
| 1937 | 351 | 328 | 332 | 95 | 351 | 333 | 339 | 345 | 370 | 309 |
| 1938 | 352 | 301 | 308 | 88 | 354 | 340 | 344 | 357 | 382 | 289 |
| 1939 | 353 | 294 | 302 | 86 | 358 | 363 | 355 | 379 | 397 | 275 |
| 1940 | 407 | 341 | 347 | 85 | 423 | 371 | 396 | 388 | 415 | 288 |
| 1941 | 452 | 349 | 356 | 79 | 476 | 392 | 435 | 398 | 431 | 289 |
| 1942 | 496 | 359 | 365 | 74 | 523 | 411 | 470 | 407 | 445 | 292 |
| 1943 | 549 | 375 | 381 | 69 | 576 | 415 | 502 | 409 | 455 | 339 |
| 1944 | 575 | 394 | 401 | 70 | 595 | 425 | 517 | 416 | 464 | 369 |
| 1945 | 586 | 427 | 433 | 74 | 604 | 433 | 525 | 415 | 470 | 389 |
| 1946 | 654 | 467 | 473 | 72 | 602 | 440 | 527 | 416 | 474 | 429 |
| 1947 | 778 | 592 | 595 | 76 | 615 | 417 | 547 | 442 | 488 | 543 |
| 1948 | 794 | 657 | 661 | 83 | 691 | 517 | 609 | 499 | 527 | 439 |
| 1949 | 723 | 633 | 639 | 88 | 676 | 528 | 605 | 513 | 536 | 424 |
| 1950 | 792 | 905 | 903 | 114 | 717 | 601 | 649 | 563 | 566 | 476 |
| 1951 | 928 | 1,063 | 1,059 | 114 | 836 | 699 | 768 | 647 | 629 | 519 |
| 1952 | 1,013 | 849 | 852 | 84 | 942 | 758 | 853 | 713 | 678 | 429 |
| 1953 | 955 | 947 | 948 | 99 | 895 | 802 | 844 | 756 | 709 | 428 |
| 1954 | 942 | 963 | 966 | 103 | 855 | 839 | 837 | 795 | 741 | 492 |
| 1955 | 961 | 988 | 992 | 103 | 870 | 841 | 846 | 814 | 760 | 522 |
| 1956 | 986 | 965 | 968 | 98 | 893 | 887 | 878 | 860 | 786 | 538 |
| 1957 | 1,019 | 953 | 953 | 94 | 916 | 880 | 889 | 858 | 803 | 587 |
| 1958 | 1,014 | 807 | 812 | 80 | 946 | 900 | 914 | 871 | 839 | 555 |
| 1959 | 989 | 926 | 927 | 94 | 970 | 910 | 928 | 876 | 871 | 629 |
| 1960 | 1,004 | 896 | 900 | 90 | 956 | 920 | 931 | 889 | 877 | 803 |
| 1961 | 1,009 | 844 | 851 | 84 | 960 | 914 | 928 | 897 | 893 | 778 |
| 1962 | 986 | 861 | 868 | 88 | 961 | 906 | 922 | 902 | 916 | 773 |
| 1963 | 985 | 951 | 950 | 96 | 979 | 923 | 940 | 919 | 935 | 875 |
| 1964 | 1,001 | 1,039 | 1,035 | 103 | 982 | 969 | 973 | 972 | 967 | 1,006 |
| 1965 | 1,000 | 1,000 | 1,000 | 100 | 1,000 | 1,000 | 1,000 | 1,000 | 1,000 | 1,000 |
| 1966 | 1,003 | 992 | 990 | 99 | 1,017 | 1,016 | 1,017 | 1,018 | 1,028 | 926 |
| 1967 | 1,019 | 899 | 903 | 89 | 1,054 | 1,034 | 1,040 | 1,092 | 1,090 | 828 |
| 1968 | 1,201 | 962 | 972 | 81 | 1,183 | 1,084 | 1,113 | 1,126 | 1,137 | 990 |
| 1969 | 1,246 | 1,023 | 1,032 | 83 | 1,235 | 1,142 | 1,170 | 1,180 | 1,193 | 1,238 |
| 1970 | 1,327 | 1,025 | 1,037 | 78 | 1,313 | 1,209 | 1,240 | 1,258 | 1,271 | 1,270 |
| 1971 | 1,404 | 1,112 | 1,123 | 80 | 1,412 | 1,300 | 1,334 | 1,373 | 1,403 | 1,108 |
| 1972 | 1,444 | 1,363 | 1,354 | 94 | 1,505 | 1392x | 1425x | 1,438 | 1,500 | 1,205 |
| 1973 | 1,531 | 1,813 | 1,741 | 114 | 1,598 | 1,608 | 1,606 | 1,599 | 1,623 | 1,422 |
| 1974 | 1,967 | 1,721 | 1,712 | 87 | 1,892 | 1,680 | 1,743 | 1,784 | 1,803 | 1,157 |
Various price index numbers for March and June years are given in the following table.
| Year | Base: Calendar Year 1965 (= 1000) | |||||||
|---|---|---|---|---|---|---|---|---|
| Import Prices (All Groups) | Export Prices (All Groups) | Wholesale Prices* | Consumers' Prices | Share Prices (All Groups) | ||||
| Imported | Home Produced | All Commodities | Food | All Groups | ||||
*The two component series have been individually linked. †Provisional. | ||||||||
| Year ended 31 March | ||||||||
| 1940 | .. | .. | 368 | 367 | 362 | 384 | 401 | 280 |
| 1945 | .. | .. | 597 | 425 | 518 | 415 | 465 | 371 |
| 1950 | 740 | .. | 679 | 534 | 610 | 517 | 539 | 432 |
| 1955 | 944 | 975 | 855 | 846 | 840 | 801 | 747 | 504 |
| 1956 | 965 | 1,001 | 876 | 840 | 849 | 819 | 764 | 527 |
| 1957 | 996 | 962 | 900 | 885 | 882 | 862 | 792 | 543 |
| 1958 | 1,020 | 915 | 917 | 889 | 893 | 865 | 809 | 596 |
| 1959 | 1,011 | 822 | 959 | 909 | 924 | 875 | 853 | 549 |
| 1960 | 991 | 948 | 966 | 913 | 929 | 876 | 872 | 675 |
| 1961 | 1,004 | 881 | 956 | 919 | 931 | 894 | 881 | 823 |
| 1962 | 1,005 | 842 | 961 | 913 | 927 | 899 | 900 | 758 |
| 1963 | 979 | 888 | 964 | 906 | 924 | 902 | 921 | 791 |
| 1964 | 989 | 990 | 984 | 932 | 948 | 929 | 941 | 913 |
| 1965 | 1,003 | 1,023 | 983 | 980 | 982 | 985 | 978 | 1,026 |
| 1966 | 1,002 | 994 | 1,006 | 1,005 | 1,006 | 1,006 | 1,007 | 974 |
| 1967 | 1,004 | 971 | 1,024 | 1,019 | 1,021 | 1,031 | 1,039 | 900 |
| 1968 | 1,061 | 903 | 1,082 | 1,043 | 1,056 | 1,100 | 1,103 | 829 |
| 1969 | 1,213 | 992 | 1,201 | 1,097 | 1,128 | 1,142 | 1,152 | 1,076 |
| 1970 | 1,257 | 1,030 | 1,247 | 1,156 | 1,183 | 1,192 | 1,207 | 1,271 |
| 1971 | 1,342 | 1,046 | 1,338 | 1,233 | 1,264 | 1,291 | 1,303 | 1,224 |
| 1972 | 1412† | 1179† | 1,441 | 1,320 | 1,356 | 1,392 | 1,431 | 1,110 |
| 1973 | 1459† | 1466† | 1,522 | 1437x | 1463x | 1,459 | 1,522 | 1,268 |
| 1974 | 1583† | 1776† | 1,642 | 1647† | 1646† | 1,654 | 1,663 | 1,414 |
| Year ended 30 June | ||||||||
| 1940 | .. | 341 | 383 | 371 | 373 | 387 | 405 | 284 |
| 1945 | .. | 426 | 599 | 426 | 520 | 416 | 467 | 374 |
| 1950 | 757 | 732 | 687 | 549 | 621 | 528 | 545 | 443 |
| 1955 | 947 | 964 | 860 | 846 | 842 | 806 | 751 | 512 |
| 1956 | 977 | 984 | 880 | 849 | 855 | 827 | 769 | 533 |
| 1957 | 1,005 | 986 | 908 | 888 | 887 | 865 | 797 | 555 |
| 1958 | 1,016 | 825 | 919 | 889 | 894 | 867 | 813 | 587 |
| 1959 | 1,003 | 860 | 972 | 912 | 930 | 875 | 864 | 557 |
| 1960 | 1,001 | 949 | 962 | 918 | 931 | 876 | 873 | 726 |
| 1961 | 1,001 | 861 | 957 | 917 | 930 | 897 | 884 | 827 |
| 1962 | 1,002 | 844 | 962 | 910 | 925 | 902 | 907 | 755 |
| 1963 | 982 | 907 | 971 | 908 | 927 | 906 | 926 | 808 |
| 1964 | 994 | 1,024 | 982 | 945 | 956 | 941 | 948 | 945 |
| 1965 | 998 | 1,007 | 990 | 988 | 989 | 993 | 986 | 1,034 |
| 1966 | 1,004 | 1,002 | 1,007 | 1,011 | 1,010 | 1,014 | 1,015 | 957 |
| 1967 | 1,003 | 947 | 1,036 | 1,025 | 1,029 | 1,051 | 1,055 | 877 |
| 1968 | 1,105 | 920 | 1,113 | 1,051 | 1,070 | 1,106 | 1,113 | 855 |
| 1969 | 1,228 | 1,017 | 1,214 | 1,112 | 1,143 | 1,156 | 1,167 | 1,144 |
| 1970 | 1,279 | 1,039 | 1,263 | 1,170 | 1,198 | 1,210 | 1,222 | 1,286 |
| 1971 | 1367x | 1,068 | 1,365 | 1,256 | 1,290 | 1,318 | 1,337 | 1,186 |
| 1972 | 1427† | 1235† | 1,461 | 1,341 | 1,378 | 1,412 | 1,457 | 1,120 |
| 1973 | 1465† | 1587† | 1,542 | 1,489 | 1,505 | 1,495 | 1,550 | 1,342 |
| 1974 | 1698† | 1769† | 1,709 | 1670† | 1,682 | 1,699 | 1,703 | 1,365 |
CONSUMPTION IN NEW ZEALAND—The estimates of consumption per head of population in New Zealand, in the tables which follow, have been compiled by deducting net exports from the sum of production and imports, and allowing for recorded and estimated movements in stocks of commodities.
While the estimates may be generally accepted as being reasonably accurate there are some deficiencies to which attention needs to be directed. These relate principally to the quantities of fruit, vegetables, poultry, eggs, and milk which enter into consumption. Little information is available on the quantities of these foodstuffs produced by householders for their own requirements, or on the extent of wastage which occurs in the marketing of these and other foodstuffs. In all these cases estimates have been compiled from the best available data and the quantities shown under consumption have been adjusted to allow for these circumstances.
The absence of particulars of stocks of certain commodities will result in some variation in imputed consumption from year to year but generally the figures do indicate a fairly accurate trend in consumption patterns. Consumption of food is measured in general at producer level. As a result no allowance is made for wastage before the foodstuffs are consumed (either at retailer or consumer level) but this wastage is probably diminishing to negligible proportions with more efficient distribution and storage facilities.
Dairy Products—New Zealanders are the world's largest consumers of butter per head, but are fairly moderate consumers of cheese. Estimated figures of annual consumption per head of mean population for the main items of dairy and similar produce are given below.
| Product | Unit | 1938 | 1969 | 1970 | 1971 | 1972 |
|---|---|---|---|---|---|---|
| *Includes condensed milk, evaporated milk and cream, milk powders, and sugar of milk. | ||||||
| Fresh milk | litre | 125.0 | 140.8 | 142.0 | 143.5 | 143.4 |
| Cream | litre | 4.0 | 3.0 | 3.0 | 3.0 | 3.0 |
| Processed milk* | kg | 2.3 | 7.1 | 8.4 | 7.6 | 6.4 |
| Cheese | kg | 2.3 | 4.3 | 4.2 | 4.2 | 4.2 |
| Ice cream | litre | 1.7 | 16.5 | 17.0 | 15.7 | 15.7 |
| Butter | kg | 18.6 | 17.6 | 16.4 | 16.4 | 16.9 |
| Lard, tallow, animal fats | kg | .. | 2.6 | 2.4 | 3.9 | 4.0 |
| Vegetable oils and other fats | kg | .. | 1.0 | 1.9 | 2.2 | 2.5 |
| Eggs | No. | 240.0 | 300.0 | 306.4 | 298.1 | 281.8 |
Meat, Poultry, and Fish—Gradual changes are taking place in consumption patterns for meat, poultry, and fish, of which the most notable is the increase in the consumption of poultry. New Zealanders remain among the world's largest consumers of meat.
In the estimates of average annual consumption of meats an allowance has been made for killings on farms. The weights shown are in each case on a bone-in dressed carcass basis.
Estimates of non-commercial catches of fish, and home production of poultry are included in the figures shown below.
| Product | Unit | 1938 | 1969 | 1970 | 1971 | 1972 |
|---|---|---|---|---|---|---|
| *Provisional. | ||||||
| Beef | kg | 51.7 | 45.0 | 43.7* | 43.4* | 42.8* |
| Veal | kg | 3.6 | 3.5 | 3.3* | 3.2* | 2.8* |
| Mutton | kg | 31.3 | 30.7 | 30.9* | 30.8* | 30.6* |
| Lamb | kg | 9.2 | 9.5* | 9.5* | 9.6* | |
| Pork | kg | 4.1 | 6.5 | 6.6* | 13.7* | 13.7* |
| Ham and bacon | kg | 7.7 | 7.0 | 7.1* | ||
| Edible offal | kg | 4.1 | 4.9 | 5.2* | 5.3* | 5.6* |
| Poultry | kg | 1.8 | 4.8 | 5.7 | 6.0 | 6.3 |
| Fish— | ||||||
| Fresh, frozen | kg | 5.0 | 4.5 | 4.2 | 4.1 | 2.1 |
| Shellfish | kg | 0.5 | 1.1 | 1.2 | 2.3 | 2.3 |
| Canned | kg | 1.4 | 0.7 | 1.0 | 0.9 | 0.6 |
Vegetables and Fruits—Domestic garden production is taken into account for fruit and vegetables, although it is difficult to calculate consumption quantities from this source. The estimates include, at fresh weights, the fruits and vegetables grown in New Zealand and either quick-frozen or canned for local consumption.
There are considerable variations from year to year for many of the commodities and these are often a reflection of a poor growing season, consumer resistance to higher prices, or a change in consumption pattern.
Annual consumption per head of mean population for individual items is estimated as follows.
| Product | Unit | 1938 | 1969 | 1970 | 1971 | 1972 |
|---|---|---|---|---|---|---|
*Includes asparagus, beans, brussels sprouts, cucumber, leeks, parsnip, spinach, swedes, sweetcorn, etc. †Includes grapefruit, lemons, mandarins, tangelos, etc. ‡Includes apricots, nectarines, plums, grapes, pineapples, tamarilloes, kiwi fruit, passionfruit, etc. §Revised figure. | ||||||
| Fresh vegetables | ||||||
| Potatoes | kg | 54.0 | 72.8 | 66.7 | 55.3§ | 53.5 |
| Kumaras | kg | 3.6 | 2.7 | 2.9 | 2.4 | 2.6 |
| Cabbage | kg | 13.6 | 15.2 | 13.7 | 11.9§ | 11.7 |
| Carrots | kg | 5.4 | 13.1 | 13.6 | 9.7§ | 10.0 |
| Cauliflower | kg | .. | 12.2 | 11.6 | 9.9§ | 9.6 |
| Lettuce | kg | .. | 7.3 | 6.3 | 5.5§ | 6.1 |
| Onions | kg | .. | 9.5 | 6.2 | 6.8 | 5.4 |
| Pumpkin | kg | .. | 6.5 | 6.4 | 6.1§ | 6.5 |
| Tomatoes | kg | 9.1 | 9.5 | 10.4 | 9.4§ | 9.1 |
| Other vegetables* | kg | .. | 12.2 | 10.3 | 8.5§ | 9.3 |
| Canned vegetables | kg | 0.9 | 8.4 | 7.8 | 6.9 | 8.0 |
| Quick-frozen vegetables | kg | .. | 7.8 | 6.6 | 8.5 | 11.2 |
| Fresh fruit | ||||||
| Oranges | kg | 7.3 | 5.9 | 4.9 | 6.0 | 6.8 |
| Other citrus fruit† | kg | 2.7 | 2.3 | 3.4 | 3.3 | 3.3 |
| Bananas | kg | 9.1 | 6.7 | 7.7 | 9.5 | 9.5 |
| Apples | kg | 20.4 | 19.6 | 24.0 | 20.8 | 24.5 |
| Pears and quinces | kg | 2.7 | 4.5 | 5.0 | 5.0 | 5.0 |
| Berry fruits | kg | .. | 1.9 | 2.2 | 2.2 | 2.1 |
| Peaches | kg | .. | 7.9 | 8.6 | 7.9 | 6.9 |
| Other fruits‡ | kg | .. | 5.0 | 6.1 | 4.1 | 6.5 |
| Dried fruit | kg | .. | 3.4 | 3.6 | 3.2 | 3.6 |
| Canned fruit | kg | 8.2 | 5.5 | 8.0 | 8.2 | 8.0 |
Other Foodstuffs, Beverages, etc.—The most notable changes in recent years in the consumption of the commodities in the following table have concerned the beverages. Consumption of all the alcoholic beverages continues to rise. Wine continues to grow in popularity, while beer consumption is almost two and a half times the prewar figure. Coffee consumption also continues to rise, partly at the expense of tea.
| Product | Unit | 1938 | 1969 | 1970 | 1971 | 1972 |
|---|---|---|---|---|---|---|
*Includes treacle and golden syrup. †Includes dried peas, beans, and lentils. ‡Includes barley, and maize used for cornflower and corn flakes only. §Calculations are based on total imports in the period—no information is available on stocks held, hence short-term trends are not readily apparent. ||Revised figure. | ||||||
| Foodstuffs | ||||||
| Refined sugar | kg | 44.0 | 41.1 | 39.4 | 39.9 | 40.4 |
| Syrups, etc.* | kg | 4.3 | 2.8 | 2.7 | 2.4 | |
| Honey | kg | 1.9 | 1.8 | 1.3 | 1.4 | |
| Pulses† | kg | 0.9 | 1.4 | 1.7 | 1.7 | 1.5 |
| Nuts | kg | 2.7 | 2.0 | 2.4 | 2.8 | |
| Cocoa | kg | 0.9 | 0.3 | 1.0 | 0.9 | 1.0 |
| Cereals— | ||||||
| Wheat | kg | 80.7 | 74.3 | 73.4 | 72.4 | 72.5 |
| Oats | kg | 4.1 | 1.7 | 2.0 | 1.5 | 1.8 |
| Rice | kg | 2.3 | 1.1 | 1.6 | 1.8 | 1.9 |
| Other‡ | kg | .. | 1.2 | 0.7 | 0.6 | 0.9 |
| Beverages | ||||||
| Beer | litre | 50.5 | 111.1 | 116.8 | 121.3 | 121.1 |
| Wine | litre | 1.0 | 4.9 | 5.6 | 6.8 | 7.6 |
| Spirits | litre | 1.8 | 1.9 | 2.0 | 2.2 | |
| Tea | kg | 3.0 | 2.6 | 2.5 | 2.7 | 2.8 |
| Coffee | kg | 0.1 | 1.3 | 2.5 | 2.0 | 2.5 |
| Tobacco | kg | 1.7 | 2.3 | 2.5 | 2.3 | 2.4 |
PROPORTION OF FOODSTUFFS EXPORTED—New Zealand is a major exporter of dairy produce and meat, and has a growing export trade in fruit and vegetables. The following table shows for these commodities the percentage of the New Zealand production that is exported.
| Product | 1968 | 1969 | 1970 | 1971 | 1972 |
|---|---|---|---|---|---|
*In some cases exports may exceed production for the period, the balance being drawn from stocks in store. †Provisional. | |||||
| Dairy products | |||||
| Processed milk | 73.0 | 87.1 | 106.7* | 73.6 | 76.0 |
| Cheese | 83.9 | 94.3 | 88.1 | 88.2 | 93.5 |
| Butter | 80.1 | 78.5 | 80.8 | 73.0 | 74.8 |
| Tallow and animal fats | 77.2 | 75.7 | 74.5 | 71.1 | 71.9 |
| Meat, poultry, fish | |||||
| Beef | 60.5 | 64.4 | 66.5† | 69.6† | . |
| Veal | 58.0 | 63.6 | 58.8† | 61.0† | . |
| Pig meat | 2.9 | 1.2 | 0.9† | 1.2† | . |
| Mutton | 60.9 | 59.0 | 55.2† | 56.4† | . |
| Lamb | 92.3 | 92.9 | 92.5† | 92.2† | . |
| Offal | 75.9 | 75.1 | 73.2† | 68.9† | . |
| Other meat | 22.8 | 18.3 | 19.2 | 21.1 | . |
| Fresh fish | 25.4 | 25.8 | 38.2 | 40.6 | 62.0 |
| Shellfish | 52.3 | 46.8 | 41.8 | 25.2 | 21.3 |
| Fruit and vegetables | |||||
| Apples | 40.3 | 43.8 | 44.5 | 46.1 | 47.6 |
| Pears | 16.9 | 13.8 | 16.1 | 18.1 | 13.7 |
| Berryfruits | 5.4 | 8.8 | 5.4 | 4.9 | 4.9 |
| Potatoes | 2.4 | 2.2 | 4.8 | 2.8 | 1.9 |
| Onions | 34.5 | 14.0 | 32.0 | 34.0 | 38.9 |
| Canned vegetables | 9.4 | 8.5 | 13.5 | 13.5 | 9.0 |
| Quick-frozen vegetables | 29.6 | 26.3 | 36.8 | 28.6 | 26.1 |
| Other foodstuffs | |||||
| Barley | 2.1 | 0.8 | - | - | 8.5 |
| Sugar | 2.0 | 1.9 | 1.5 | 1.0 | 1.6 |
| Honey | 3.5 | 5.3 | 10.2 | 36.3 | 27.9 |
| Pulses | 54.9 | 48.9 | 54.5 | 60.5 | 56.3 |
| Eggs | 1.9 | 3.0 | 3.3 | 7.5 | 10.6 |
CONSUMPTION OF DAIRY PRODUCTS IN SELECTED COUNTRIES—The following table shows consumption per head of dairy produce and similar products in various countries.
| Country | Year | Fresh Milk | Cheese | Butter | Margarine | Eggs |
|---|---|---|---|---|---|---|
*New Zealand figures supplied by various Producer Boards. †1973 figures. Source: Commonwealth Secretariat. | ||||||
| litre | kg | kg | kg | No. | ||
| Australia | 1,968 | 126.8 | 3.6 | 9.6 | 5.1 | 206 |
| Canada | 1,970 | 110.5 | 7.3† | 5.8† | 4.2 | 262 |
| Denmark | 1,970 | 120.0 | 9.7† | 7.8† | 17.6 | 190 |
| New Zealand* | 1,970 | 141.8 | 4.8† | 15.3† | - | 306 |
| Sweden | 1,970 | 157.7 | 9.1 | 5.4 | 17.9 | 206 |
| United Kingdom | 1,970 | 136.8 | 5.8† | 7.6† | 5.4 | 249 |
| United States | 1,970 | 116.4 | 6.0† | 2.1† | 5.0 | 285 |
COMPARISON WITH OTHER COUNTRIES—The table which follows presents statistics for selected countries of food consumption extracted from the Food and Agricultural Organisation's Production Yearbook. Total consumption in calories per person per day is shown, and includes foodstuffs not specifically mentioned in the table (i.e., pulses and nuts, eggs, fish, fats, and oils, all of which are consumed in considerably smaller quantities than the foodstuffs shown in the table).
| Country | Year | Grams per Day per Person | Calories per Day | ||||||
|---|---|---|---|---|---|---|---|---|---|
| Cereals | Potatoes, Starches | Sugars, Syrups | Vegetables | Fruits | Meats | Milk Products | |||
*Provisional. †Estimated. ‡Statistics as supplied to the Food and Agricultural Organisation by the Department of Statistics. | |||||||||
| Europe | |||||||||
| United Kingdom | 1970-71* | 200 | 279 | 136 | 170 | 155 | 209 | 592 | 3,170 |
| Italy | 1969-70 | 353 | 129 | 74 | 466 | 296 | 136 | 394 | 3,020 |
| Yugoslavia | 1,968 | 498 | 178 | 66 | 167 | 178 | 93 | 281 | 3,130 |
| Israel | 1969-70 | 304 | 107 | 107 | 331 | 410 | 155 | 403 | 2,990 |
| Africa | |||||||||
| South Africa | 1964-66† | 443 | 44 | 104 | 66 | 81 | 113 | 222 | 2,730 |
| Ghana | 1966-68 | 191 | 1,083 | 24 | 43 | 34 | 16 | 13 | 2,070 |
| Egypt | 1968-69* | 565 | 28 | 44 | 288 | 199 | 31 | 135 | 2,770 |
| Asia | |||||||||
| India | 1969-70* | 384 | 48 | 49 | 10 | 48 | 4 | 116 | 1,990 |
| Japan | 1970* | 352 | 161 | 73 | 362 | 142 | 48 | 137 | 2,470 |
| North America | |||||||||
| Canada | 1970* | 180 | 215 | 136 | 213 | 230 | 257 | 619 | ... |
| U.S.A. | 1,970 | 176 | 151 | 140 | 318 | 276 | 310 | 689 | 3,300 |
| Mexico | 1964-66 | 379 | 35 | 109 | 35 | 207 | 55 | 157 | 2,620 |
| South America | |||||||||
| Brazil | 1970* | 272 | 537 | 128 | 40 | 150 | 84 | 195 | 2,820 |
| Chile | 1,970 | 321 | 128 | 86 | 265 | 196 | 108 | 231 | 2,560 |
| Oceania | |||||||||
| Australia | 1969-70* | 216 | 154 | ... | 192 | 275 | 294 | 646 | ... |
| New Zealand | 1970‡ | 212 | 191 | 124 | 252 | 180 | 307* | 548 | 3,321 |
| New Zealand | 1971‡ | 209 | 169 | 125 | 233 | 170 | 307* | 544 | 3,309 |
SUBSIDIES—Government subsidies on food items apply from time to time as part of the economic stabilisation policy. Milk and eggs have been subsidised for a long period, the subsidy on eggs being 3.33c a dozen, and the average subsidy on milk for the year ended 31 August 1974 was 10.678 cents per litre.
The following table shows the total cost of subsidies paid under the stabilisation vote. Other subsidies, involving farm incentives, etc., are included in other government expenditure. The total amount of all subsidies will be found in the section on National Income and Expenditure.
| Subsidy Items | Year Ended 31 March | ||||
|---|---|---|---|---|---|
| 1971 | 1972 | 1973 | 1974 | 1975 | |
| $(thousand) | |||||
| Bread | - | - | 1,650 | 3,545 | 5,264 |
| Eggs | 1,615 | 1,546 | 1,756 | 1,689 | 1,792 |
| Meat | - | - | - | 10,647 | 1,189 |
| Milk | 18,171 | 25,700 | 31,040 | 42,256 | 50,362 |
| Sugar | - | - | - | 11,600 | - |
| Wool | - | - | - | 21,761 | 1,953 |
| Coal gas | 1,202 | 935 | 1,190 | 1,452 | 1,460 |
| Industrial coal (rail transport) | 420 | 519 | 559 | 535 | 493 |
| Subsidy to meet losses on— | |||||
| Post Office operations | - | - | - | 7,000 | 21,000 |
| Railways operations | - | - | - | 11,700 | 46,100 |
| Electric supply | - | - | - | - | 18,539 |
| Totals | 21,408 | 28,700 | 36,195 | 112,185 | 148,152 |
Table of Contents
GENERAL—The national accounts record the value of goods and services produced by a country and the way in which these are used. Within the accounts the flow of production and disposal of goods and incomes are analysed in various ways to provide information on the inter-relationship between industrial and institutional sectors of the economy and between the economy and the rest of the world. The accounts are used as the statistical framework within which economic policy and planning is formulated and applied, the values of the various items in the accounts providing a quantitative measure of the country's economic performance and a benchmark against which to compare other measures of economic and social well-being.
National Income—The principal aggregate is that of “national income”, which, in general terms, measures the total value of all incomes (before deduction of direct taxation) earned by the residents of New Zealand in producing the current output of goods and services.
Income can be earned in a variety of ways, and accrues to individuals according to the manner in which they participate in current production. Salary and wage payments and pay and allowances of armed forces represent the return to labour for services rendered, and included in this concept is supplementary income in kind such as board and lodging provided by the employer.
Rental value of owner-occupied houses is a non-monetary item representing the imputed net rent (before payment of rates, but after deductions for depreciation, mortgage interest, insurance, and repairs and maintenance) of all owner-occupied houses (except farmhouses).
Other personal income (excluding company dividends) represents the aggregate income of professional men, farmers, and individual traders, as well as income other than salary and wages received by salary and wage earners—e.g., rent and interest. Surplus of producer boards and of primary produce stabilisation accounts represents the increase (or, if negative, the decrease) in the revenue balances of producer boards, and the credits relating to primary production stabilisation schemes held by producer boards.
Company income represents the total income (distributed and undistributed) of companies. This means that dividends distributed to individuals are included under this heading, and not as personal income.
Apart from these incomes, which result from current productive activities on the part of individuals receiving them, there are other incomes of a “non-productive” nature in the form of social security benefits, pensions, and interest on public debt. These transfer incomes, as they are called, do not arise from the current production of goods and services and must therefore be excluded from the national income. They do, however, form part of the intermediate concept of private income, which represents the aggregate of earned incomes and unearned transfer incomes received by or accruing to persons. The deduction of direct taxation gives the concept of private disposable income. Capital receipts—e.g., from deceased persons' estates, repayment of debt, etc.—are, however, excluded both from private income and national income.
The addition to private income of Government and local authority trading profits and the deduction of transfer incomes, as already detailed, gives the concept of net national income at factor cost or, more briefly, national income. This may be defined as the income (before tax) earned by or accruing to the factors of production, in or only temporarily absent from New Zealand, in producing the current output of goods and services of all kinds. The further addition of indirect taxes (net of subsidies) is necessary to bring the national income to market price valuation.
Gross National Product—Gross national product is obtained by adding depreciation allowances to national income at market prices, and represents the value of output before deduction of allowances for depreciation and obsolescence attributable to the factors of production supplied by New Zealand residents during the year.
Gross Domestic Expenditure—This represents the total final expenditure of New Zealand residents during the year, irrespective of where the expenditure was incurred. It is the sum of personal expenditure on consumer goods and services, public authority current expenditure on goods and services, gross domestic capital formation, and changes in stocks. These four components are described in more detail in the following paragraphs.
Personal Expenditure on Consumer Goods and Services represents the value of the purchases of households and non-profit-making organisations. Besides the day-to-day expenditure on food, clothing, rent, travel and other services, etc., it includes expenditure on such items as motorcars for private use and household durables. The notable exception is expenditure on the purchase of houses; this is recorded under private capital formation.
Public Authority Current Expenditure on Goods and Services shows the current expenditure of the non-trading organs of the Central Government and local authorities. It does not include payment of pensions, monetary social security benefits or subsidies which are transfers and do not, in themselves, represent an expenditure on production. A more detailed analysis of public authority current expenditure is given later.
Gross Capital Formation represents the expenditure in New Zealand on new assets such as buildings, roads and other construction, plant, machinery and motor vehicles for business use. It does not include the value of land and secondhand assets purchased during the year which is a transfer of an asset. Nor does it include expenditure on financial assets such as company shares; such transactions do not result in direct expenditure but transfer claims from one person or organisation to another.
Change in Stocks—This represents changes in the value of stocks which may be the result of changes in volume, changes in unit values, or a combination of the two.
By adding the value of exported goods and services to gross domestic expenditure and deducting the value of imports, an estimate of the expenditure on gross domestic product is arrived at. This represents the value of goods and services produced in New Zealand during the year. The deduction of payments for the use of overseas-owned factors (capital and labour) completes the reconciliation of expenditure with the value of gross national product.
The following table shows for March years some of the more important aggregates.
| PRINCIPAL AGGREGATES OF INCOME AND EXPENDITURE | |||||||||
|---|---|---|---|---|---|---|---|---|---|
| Item | 1966-67 | 1967-68 | 1968-69 | 1969-70 | 1970-71 | 1971-72 | 1972-73 | 1973-74 | |
| *Provisional. | |||||||||
| National income | $m | 3,370 | 3,467 | 3,650 | 4,045 | 4,629 | 5,449 | 6,320 | 7,521 |
| Gross national product | $m | 3,932 | 4,082 | 4,307 | 4,753 | 5,447 | 6,339 | 7,297 | 8,593 |
| Personal expenditure on consumer goods and services | $m | 2,409 | 2,542 | 2,567 | 2,766 | 3,292 | 3,737 | 4,394 | 5,163 |
| As percentage of gross national product | 61 | 62 | 60 | 58 | 60 | 59 | 60 | 60 | |
| Gross capital formation in New Zealand | $m | 960 | 869 | 964 | 1,091 | 1,263 | 1,428 | 1,643 | 1,869 |
| As percentage of gross national product | 24 | 21 | 22 | 23 | 23 | 23 | 23 | 22 | |
| Public authority current expenditure on goods and services | $m | 565 | 598 | 650 | 721 | 861 | 1,036 | 1,116 | 1,257 |
| As percentage of gross national product | 14 | 15 | 15 | 15 | 16 | 16 | 15 | 15 | |
| Private income | $m | 3,590 | 3,694 | 3,878 | 4,285 | 4,944 | 5,788 | 6,779 | 8,082 |
| Private savings | $m | 408 | 372 | 511 | 621 | 569 | 778 | 965 | 1,108 |
| As percentage of private income | 11 | 10 | 13 | 14 | 12 | 13 | 14 | 14 | |
The gross national product as the main aggregate of production is the total unduplicated value of goods and services produced by New Zealand residents and enterprises during the year; it was $6,339 million in 1971-72, $7,297 million in 1972-73, and $8,593 million in 1973-74. National income was 1971-72, $5,449 million; 1972-73, $6,320 million; and 1973-74, $7,521 million.
The three main items of income in 1973-74 were: salaries and wages $4,821 million, an increase of 21.9 percent over 1972-73; other personal income $1,271 million, 7.8 percent up; and company incomes $1,104 million, up 23.9 percent. Within other personal income ($1,271 million above) business and investment income rose by 25.9 percent to $720 million, and net farming incomes (including producer board surpluses) increased by 15.0 percent to $566 million. Total private income increased by 19.2 percent, with social security benefits and pensions rising by $106 million to $594 million (an increase of 21.7 percent).
Total domestic spending rose by 22.1 percent over 1972-73 to reach $8,698 million. Increases were recorded in most of its components—personal expenditure on consumer goods and services 18.5 percent, current spending by Central and local Government 12.6 percent, and expenditure on new fixed capital assets in the private sector 24.2 percent; on the other hand public authority expenditure on new capital assets declined from $592 million in 1972-73 to $564 million in 1973-74. There was a marked increase in the value of stocks held—$409 million—compared with a very nominal rise of $9 million in the preceding year and $162 million in 1971-72.
Private savings grew by $107 million to reach $1,108 million in 1973-74 and the revenue balances of public authorities by $202 million to $573 million. However, even with increased depreciation allowances (from $475 million to $519 million), this was insufficient to finance the private capital formation and the increase in stocks, the difference being financed by overseas borrowing, i.e., a balance of payments deficit.
Exports of goods and services in 1973-74 were $299 million higher than in 1972-73. Imports, however, rose by $529 million and the combination of these two factors contributed towards the deficit on current account for 1973-74 of $79 million.
The estimates of national expenditure should be used with some caution, owing to the fact that not all of the items of expenditure can be estimated directly. Whatever inherent error may exist in the absolute values of individual expenditure items, year-to-year changes are likely to be reliable because the method of estimation remains the same.
In these national income aggregates, no allowances have been made for any possible understatement of income shown in the taxation returns on which the estimates are based. Also, because these aggregates are based on taxation data, there has been no deduction of current years' losses incurred by companies and by individuals operating businesses, while losses in past years carried forward for taxation purposes do result in a reduction of these aggregates. Any over or understatement of the gross product total arising from these sources will therefore be reflected in a similar over or understatement of personal consumption which is shown as a residual item in the break-up of national expenditure. Direct estimates are made of public authority current expenditure on goods and services, gross capital formation in New Zealand by private and public authority sectors, and the balance of overseas payments on current account (sometimes termed net overseas investment or net lending abroad).
After ascertaining personal consumption in the manner outlined above, it becomes possible to make an estimate of private savings. By deducting personal expenditure and direct taxation from aggregate private income, another residual is obtained—viz, private savings. Being a residual item it will, of course, contain certain minor errors of estimation inherent in the aggregates from which it is derived. It will be free, however, from the major apparent error which is caused by the understatement of incomes through tax evasion; this is due to the fact that the underestimate is cancelled out by being included both in the minuend and subtrahend, and the residual is consequently not affected.
Full details of the methods used and a description of the items in the tables are given in National Income and Expenditure 1973-74, obtainable from Government bookshops.
It is recognised that in this form the accounts do not completely fulfil the present needs of Government or those of indicative economic planning. Work on a more sophisticated system of national accounts is proceeding. Meantime it is intended to continue the present series.
CONSTANT PRICE ESTIMATES OF THE MAIN AGGREGATES—National accounting aggregates are, by their nature, summations of the values of all goods and services produced or consumed in a particular year. If the values of goods and services are expressed in current prices (i.e., the market prices prevailing in each particular year) then any comparison between 2 or more years is affected not only by changes in the volume of production between those years but by annual price movements as well. The effect of annual price movements is eliminated if all annual values are expressed in the average prices of a base period; the base used here is the year 1965-66. By expressing the aggregates in constant prices, and not in current values, their real value in terms of goods and services, either produced or available for use, can be better appreciated.
Three of the principal national accounts aggregates, gross national product, gross domestic product, and gross domestic expenditure, are expressed in current as well as 1965-66 prices in the following table.
| Year | At Current Prices | At Constant 1965-66 Prices | ||||
|---|---|---|---|---|---|---|
| Gross National Product | Gross Domestic Product | Gross Domestic Expenditure | Gross National Product | Gross Domestic Product | Gross Domestic Expenditure | |
| *Provisional. | ||||||
| $(million) | ||||||
| 1954-55 | 1,860 | 1,877 | 1,927 | 2,369 | 2,391 | 2,443 |
| 1955-56 | 1,965 | 1,979 | 2,021 | 2,465 | 2,483 | 2,506 |
| 1956-57 | 2,061 | 2,078 | 2,084 | 2,508 | 2,529 | 2,503 |
| 1957-58 | 2,184 | 2,201 | 2,270 | 2,639 | 2,660 | 2,679 |
| 1958-59 | 2,270 | 2,294 | 2,302 | 2,707 | 2,736 | 2,626 |
| 1959-60 | 2,434 | 2,453 | 2,344 | 2,822 | 2,844 | 2,703 |
| 1960-61 | 2,622 | 2,659 | 2,717 | 2,975 | 3,017 | 3,015 |
| 1961-62 | 2,722 | 2,753 | 2,820 | 3,081 | 3,116 | 3,074 |
| 1962-63 | 2,921 | 2,967 | 2,956 | 3,162 | 3,212 | 3,113 |
| 1963-64 | 3,197 | 3,239 | 3,216 | 3,364 | 3,408 | 3,371 |
| 1964-65 | 3,491 | 3,550 | 3,514 | 3,559 | 3,619 | 3,640 |
| 1965-66 | 3,784 | 3,838 | 3,944 | 3,784 | 3,838 | 3,944 |
| 1966-67 | 3,932 | 3,993 | 4,073 | 3,918 | 3,984 | 4,094 |
| 1967-68 | 4,082 | 4,137 | 4,148 | 3,896 | 3,949 | 3,877 |
| 1968-69 | 4,307 | 4,388 | 4.249 | 3,960 | 4,034 | 3,783 |
| 1969-70 | 4,753 | 4,851 | 4,712 | 4,151 | 4,237 | 3,995 |
| 1970-71 | 5,447 | 55,22 | 5,638 | 4,334 | 4,394 | 4,296 |
| 1971-72 | 6,339 | 6,414 | 6,363 | 4,453 | 4,506 | 4,358 |
| 1972-73 | 7,297 | 7,421 | 7,162 | 4,608 | 4,686 | 4,606 |
| 1973-74* | 8,593 | 8,727 | 8,698 | 4,864 | 4,940 | 5,175 |
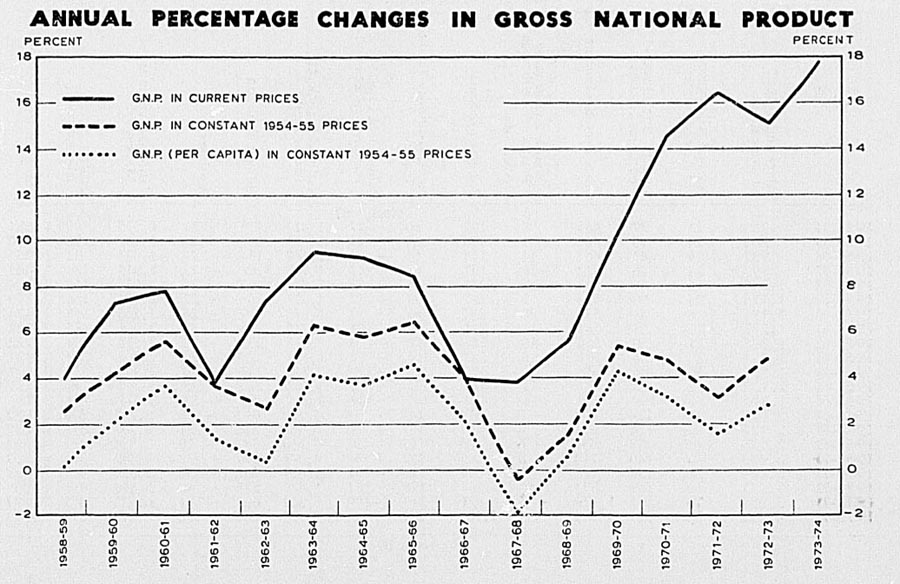
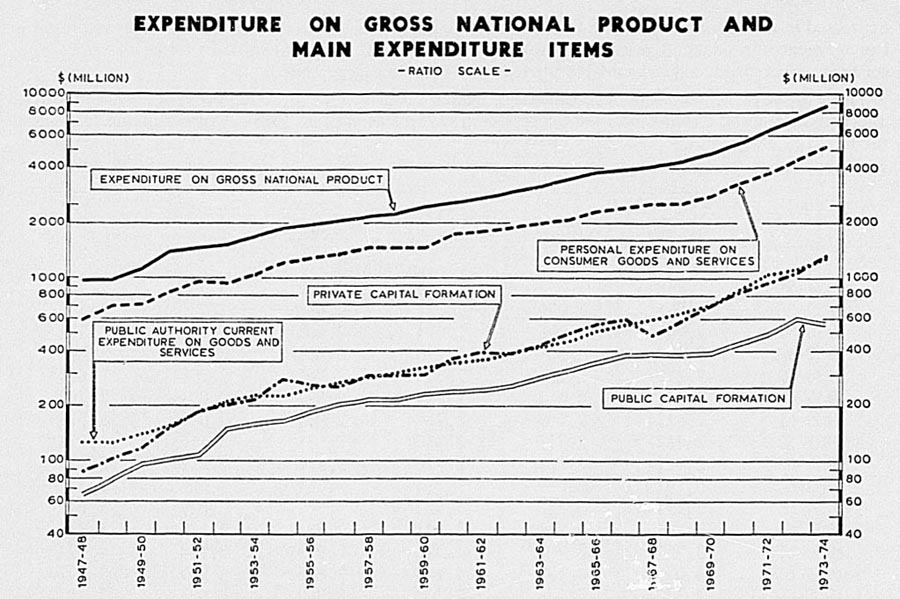
GROSS NATIONAL PRODUCT AND EXPENDITURE—The following table gives the composition of the national income by factor shares plus net indirect taxation and depreciation allowances entering into the market prices of all goods and services the production of which can be attributed to New Zealand residents (gross national product); the other side of the product account is a description of final expenditure on gross national product by type of expenditure. Personal expenditure on consumer goods and services is obtained as a residual item in this table, all other aggregates being obtained by direct estimates.
| GROSS NATIONAL PRODUCT | ||||||||||||||
|---|---|---|---|---|---|---|---|---|---|---|---|---|---|---|
| March Year | Salary and Wage Payments | Pay and Allowances of Armed Forces | Rental Value, Owner-occupied Houses | Other Personal Income | Surplus of Producer Boards and Primary Produce Stabilisation Accounts | Company Income | Public Authority Trading Income | Public Debt Interest Paid in New Zealand | National Income at Factor Cost | Indirect Taxation | Subsidies | National Income at Market Princes | Depreciation Allowances | Gross National Product |
| *Provisional. | ||||||||||||||
| $(million) | ||||||||||||||
| 1953-54 | 769 | 24 | 37 | 445 | 3 | 181 | 50 | - 37 | 1,471 | 135 | - 31 | 1,575 | 106 | 1,681 |
| 1954-55 | 862 | 24 | 40 | 462 | 1 | 195 | 60 | - 41 | 1,603 | 161 | - 27 | 1,738 | 122 | 1,860 |
| 1955-56 | 937 | 24 | 43 | 462 | 11 | 188 | 64 | - 42 | 1,688 | 171 | - 25 | 1,833 | 132 | 1,965 |
| 1956-57 | 990 | 24 | 46 | 512 | -10 | 197 | 61 | - 47 | 1,773 | 168 | - 27 | 1,915 | 146 | 2,061 |
| 1957-58 | 1,068 | 26 | 48 | 543 | -39 | 211 | 65 | - 53 | 1,870 | 182 | - 27 | 2,026 | 158 | 2,184 |
| 1958-59 | 1,116 | 25 | 50 | 496 | 1 | 219 | 74 | - 57 | 1,923 | 208 | - 27 | 2,104 | 166 | 2,270 |
| 1959-60 | 1,181 | 26 | 51 | 533 | 20 | 242 | 82 | - 59 | 2,075 | 217 | - 26 | 2,266 | 168 | 2,434 |
| 1960-61 | 1,277 | 27 | 51 | 581 | -11 | 291 | 91 | - 65 | 2,242 | 226 | - 31 | 2,437 | 185 | 2,622 |
| 1961-62 | 1,365 | 27 | 60 | 556 | -10 | 288 | 100 | - 70 | 2,315 | 231 | - 28 | 2,518 | 204 | 2,722 |
| 1962-63 | 1,445 | 29 | 81 | 591 | 6 | 323 | 105 | - 77 | 2,504 | 228 | - 29 | 2,703 | 219 | 2,921 |
| 1963-64 | 1,554 | 30 | 86 | 658 | 9 | 370 | 123 | - 89 | 2,742 | 254 | - 30 | 2,966 | 232 | 3,197 |
| 1964-65 | 1,723 | 32 | 96 | 681 | 11 | 418 | 136 | - 95 | 3,002 | 276 | - 35 | 3,242 | 249 | 3,491 |
| 1965-66 | 1,890 | 36 | 109 | 708 | -6 | 480 | 147 | - 104 | 3,261 | 289 | - 39 | 3,511 | 273 | 3,784 |
| 1966-67 | 2,041 | 40 | 114 | 678 | -9 | 474 | 147 | - 116 | 3,370 | 301 | - 39 | 3,632 | 300 | 3,932 |
| 1967-68 | 2,127 | 42 | 124 | 671 | -4 | 464 | 167 | - 124 | 3,467 | 316 | - 21 | 3,763 | 319 | 4,082 |
| 1968-69 | 2,240 | 45 | 130 | 667 | -6 | 525 | 185 | - 136 | 3,650 | 343 | - 19 | 3,974 | 333 | 4,307 |
| 1969-70 | 2,493 | 47 | 140 | 710 | -8 | 605 | 202 | - 148 | 4,041 | 377 | - 28 | 4,389 | 364 | 4,753 |
| 1970-71 | 3,004 | 56 | 156 | 755 | 1 | 644 | 171 | - 158 | 4,629 | 462 | - 52 | 5,039 | 408 | 5,447 |
| 1971-72 | 3,555 | 68 | 169 | 873 | 50 | 707 | 198 | - 171 | 5,449 | 537 | - 89 | 5,896 | 443 | 6,339 |
| 1972-73 | 3,954 | 70 | 201 | 1,179 | - 4 | 891 | 219 | - 190 | 6,320 | 603 | - 101 | 6,822 | 475 | 7,297 |
| 1973-74* | 4,821 | 79 | 221 | 1,271 | - 7 | 1,104 | 247 | -214 | 7,521 | 687 | - 134 | 8,074 | 519 | 8,593 |
| GROSS DOMESTIC EXPENDITURE | |||||||||||
|---|---|---|---|---|---|---|---|---|---|---|---|
| March Year | Personal Expenditure on Consumer Goods and Services | Public Authority Current Expenditure on Goods and Services | Gross Capital Formation in New Zealand | Changes in Stocks | Gross Domestic Expenditure | Exports of Goods and Services | Imports of Goods and Services | Expenditure on Gross Domestic Product | Net Factor Payments to Rest of World | Expenditure on Gross National Product | |
| Public Authority | Private | ||||||||||
| *Provisional. | |||||||||||
| $(million) | |||||||||||
| 1953-54 | 1,049 | 226 | 215 | 158 | -42 | 1,606 | 525 | -441 | 1,690 | - 9 | 1,681 |
| 1954-55 | 1,201 | 227 | 277 | 164 | 58 | 1,927 | 507 | - 557 | 1,877 | - 17 | 1,860 |
| 1955-56 | 1,281 | 249 | 266 | 187 | 38 | 2,021 | 565 | - 607 | 1,979 | - 14 | 1,965 |
| 1956-57 | 1,331 | 274 | 256 | 203 | 20 | 2,084 | 595 | - 601 | 2,078 | - 17 | 2,061 |
| 1957-58 | 1,450 | 287 | 287 | 214 | 32 | 2,270 | 593 | - 662 | 2,201 | - 17 | 2,184 |
| 1958-59 | 1,465 | 302 | 290 | 214 | 31 | 2,302 | 576 | - 584 | 2,294 | - 24 | 2,270 |
| 1959-60 | 1,471 | 324 | 297 | 226 | 26 | 2,344 | 671 | - 562 | 2,453 | - 19 | 2,434 |
| 1960-61 | 1,728 | 346 | 366 | 233 | 44 | 2,717 | 630 | - 688 | 2,659 | - 37 | 2,622 |
| 1961-62 | 1,799 | 363 | 393 | 241 | 24 | 2,820 | 634 | - 701 | 2,753 | - 31 | 2,722 |
| 1962-63 | 1,885 | 394 | 387 | 255 | 35 | 2,956 | 671 | - 660 | 2,967 | - 46 | 2,921 |
| 1963-64 | 1,998 | 417 | 423 | 286 | 92 | 3,216 | 791 | - 768 | 3,239 | - 42 | 3,197 |
| 1964-65 | 2,142 | 460 | 500 | 312 | 100 | 3,514 | 840 | - 804 | 3,550 | - 59 | 3,491 |
| 1965-66 | 2,366 | 516 | 573 | 342 | 147 | 3,944 | 837 | - 943 | 3,838 | - 54 | 3,784 |
| 1966-67 | 2,409 | 565 | 589 | 371 | 139 | 4,073 | 891 | - 966 | 3,998 | - 66 | 3,932 |
| 1967-68 | 2,542 | 598 | 493 | 376 | 139 | 4,148 | 866 | - 877 | 4,137 | - 55 | 4,082 |
| 1968-69 | 2,567 | 650 | 590 | 374 | 68 | 4,249 | 1,120 | - 981 | 4,388 | - 81 | 4,307 |
| 1969-70 | 2,766 | 721 | 709 | 382 | 134 | 4,712 | 1,269 | -1,130 | 4,851 | - 98 | 4,753 |
| 1970-71 | 3,292 | 861 | 831 | 432 | 222 | 5,638 | 1,290 | -1,406 | 5,522 | - 75 | 5,447 |
| 1971-72 | 3,737 | 1,036 | 931 | 497 | 162 | 6,363 | 1,532 | - 1,481 | 6,414 | - 75 | 6,339 |
| 1972-73 | 4,394 | 1,116 | 1,051 | 592 | 9 | 7,162 | 1,952 | - 1,693 | 7,421 | - 124 | 7,297 |
| 1973-74* | 5,163 | 1,257 | 1,305 | 564 | 409 | 8,698 | 2,251 | - 2,222 | 8,727 | - 134 | 8,593 |
The following tables provide some more detailed analyses of particular aspects of the national accounts.
Private Income and Outlay—This table gives in detail the break-up of private income and, on the expenditure side, the manner in which these incomes are spent on personal expenditure on consumer goods and services, paid in direct taxation, or saved. An analysis of other personal income is also given.
The total of personal consumption derived from the preceding table is carried forward to this table and this time private savings is obtained as a residual item. The limitations of these two residual items have already been mentioned.
Revenue Account of Public Authorities—The Government sector is discussed in more detail later in this section, but this table gives a consolidated statement of Central Government and local authority revenue and expenditure, showing as a balance that portion of the revenue which was available for capital formation and other capital transactions.
Combined Capital Account—This account indicates the manner in which resources for capital formation have been made available (a) from private savings, (b) from revenue surpluses of public authorities, and (c) from amounts set aside as depreciation. Gross capital formation represents the construction in New Zealand or purchase from overseas of durable capital assets by the private, Central Government, and the local authority sectors, plus the net change in stocks of trading concerns.
Rest of World Account—An account of external economic transactions between New Zealand and other countries; it is, in essence, a balance of payments on current account for the period, presented here in abridged form.
These four tables, then, give a comprehensive picture in broad terms of the changing pattern of New Zealand's economy. One important point to consider when examining the tables, however, is that all the figures are at prices current during the period and consequently are inflated to a greater or lesser extent by price movements over the period.
| PRIVATE INCOME AND OUTLAY | ||||||||||
|---|---|---|---|---|---|---|---|---|---|---|
| March Year | Salary and Wage Payments | Pay and Allowances of Armed Forces | Social Security Benefits and Pensions | Rental Value of Owner-occupied Houses | Other Personal Income | Company Income Before Distribution | Private Income (Before Tax) | |||
| Farming | Business and Investment | Changes in Balances of Income Retention Accounts | Surplus of Producer Boards and Primary Produce Stabilisation Accounts | |||||||
| *Provisional. | ||||||||||
| INCOME $(million) | ||||||||||
| 1953-54 | 769 | 24 | 115 | 37 | 259 | 197 | -11 | 3 | 181 | 1,572 |
| 1954-55 | 862 | 24 | 122 | 40 | 263 | 210 | -11 | 1 | 195 | 1,706 |
| 1955-56 | 937 | 24 | 128 | 43 | 257 | 218 | -12 | 11 | 188 | 1,794 |
| 1956-57 | 990 | 24 | 132 | 46 | 290 | 234 | -12 | -10 | 197 | 1,891 |
| 1957-58 | 1,068 | 26 | 139 | 48 | 287 | 256 | - | -39 | 211 | 1,997 |
| 1958-59 | 1,116 | 25 | 160 | 50 | 249 | 247 | - | 1 | 219 | 2,065 |
| 1959-60 | 1,181 | 26 | 198 | 51 | 279 | 255 | - | 20 | 242 | 2,251 |
| 1960-61 | 1,277 | 27 | 213 | 51 | 289 | 291 | - | -11 | 291 | 2,429 |
| 1961-62 | 1,365 | 27 | 218 | 60 | 251 | 304 | - | -10 | 288 | 2,503 |
| 1962-63 | 1,445 | 29 | 219 | 81 | 272 | 320 | - | 6 | 323 | 2,694 |
| 1963-64 | 1,554 | 30 | 229 | 86 | 315 | 334 | 8 | 9 | 370 | 2,937 |
| 1964-65 | 1,723 | 32 | 234 | 96 | 321 | 358 | 2 | 11 | 418 | 3,194 |
| 1965-66 | 1,890 | 36 | 242 | 109 | 332 | 381 | - 5 | - 6 | 480 | 3,460 |
| 1966-67 | 2,041 | 40 | 252 | 114 | 298 | 384 | - 4 | - 9 | 474 | 3,590 |
| 1967-68 | 2,127 | 42 | 269 | 124 | 294 | 381 | - 3 | - 4 | 464 | 3,694 |
| 1968-69 | 2,240 | 45 | 278 | 130 | 286 | 381 | - | - 6 | 525 | 3,878 |
| 1969-70 | 2,493 | 47 | 298 | 140 | 298 | 409 | 3 | - 8 | 605 | 4,285 |
| 1970-71 | 3,004 | 56 | 328 | 156 | 300 | 454 | 1 | 1 | 644 | 4,944 |
| 1971-72 | 3,555 | 68 | 366 | 169 | 368 | 505 | - | 50 | 707 | 5,788 |
| 1972-73 | 3,954 | 70 | 488 | 201 | 496 | 572 | 111 | - 4 | 891 | 6,779 |
| 1973-74* | 4,821 | 79 | 594 | 221 | 573 | 720 | -22 | - 7 | 1,104 | 8,082 |
| March Year | Personal Expenditure on Consumer Goods and Services | Net Transfers to Rest of World | Direct Taxation | Private Savings | Private Outlay | |
|---|---|---|---|---|---|---|
| Undistributed Profits of Companies | Other Private Savings | |||||
| *Provisional. | ||||||
| OUTLAY $(million) | ||||||
| 1953-54 | 1,049 | 1 | 308 | 58 | 156 | 1,572 |
| 1954-55 | 1,201 | 2 | 336 | 57 | 110 | 1,706 |
| 1955-56 | 1,281 | - | 348 | 42 | 123 | 1,7 |
| 1956-57 | 1,331 | - | 370 | 46 | 144 | 1,89 |
| 1957-58 | 1,450 | - 1 | 345 | 45 | 158 | 1,997 |
| 1958-59 | 1,465 | 3 | 442 | 64 | 91 | 2,065 |
| 1959-60 | 1,471 | 6 | 420 | 77 | 277 | 2,251 |
| 1960-61 | 1,728 | 8 | 493 | 83 | 117 | 2,429 |
| 1961-62 | 1,799 | 8 | 531 | 61 | 104 | 2,503 |
| 1962-63 | 1,885 | 9 | 505 | 87 | 208 | 2,694 |
| 1963-64 | 1,998 | 7 | 542 | 108 | 282 | 2,937 |
| 1964-65 | 2,142 | 10 | 629 | 101 | 312 | 3,194 |
| 1965-66 | 2,366 | 17 | 691 | 154 | 232 | 3,460 |
| 1966-67 | 2,409 | 17 | 756 | 159 | 249 | 3,590 |
| 1967-68 | 2,542 | 13 | 767 | 150 | 222 | 3,694 |
| 1968-69 | 2,567 | 8 | 792 | 219 | 292 | 3,878 |
| 1969-70 | 2,766 | 10 | 888 | 259 | 362 | 4,285 |
| 1970-71 | 3,292 | 5 | 1,078 | 239 | 330 | 4,944 |
| 1971-72 | 3,737 | -14 | 1,287 | 241 | 537 | 5,788 |
| 1972-73 | 4,394 | -40 | 1,460 | 427 | 538 | 6,779 |
| 1973-74* | 5,163 | -48 | 1,859 | 448 | 660 | 8,082 |
| REVENUE ACCOUNT OF PUBLIC AUTHORITIES (CENTRAL GOVERNMENT AND LOCAL AUTHORITIES) | |||||
|---|---|---|---|---|---|
| March Year | Taxation | Trading Income | Direct Taxes Paid by Public Authority Trading Undertakings | Total Revenue | |
| Direct | Indirect | ||||
| *Provisional. | |||||
| REVENUE $(million) | |||||
| 1953-54 | 311 | 135 | 50 | - 4 | 492 |
| 1954-55 | 342 | 161 | 60 | - 5 | 558 |
| 1955-56 | 354 | 171 | 64 | - 6 | 582 |
| 1956-57 | 376 | 168 | 61 | - 6 | 599 |
| 1957-58 | 350 | 182 | 65 | - 4 | 593 |
| 1958-59 | 447 | 208 | 74 | - 5 | 724 |
| 1959-60 | 425 | 217 | 82 | - 6 | 718 |
| 1960-61 | 499 | 226 | 91 | - 7 | 809 |
| 1961-62 | 538 | 231 | 100 | - 7 | 862 |
| 1962-63 | 512 | 228 | 105 | - 8 | 838 |
| 1963-64 | 551 | 254 | 123 | - 9 | 919 |
| 1964-65 | 640 | 276 | 136 | -11 | 1,040 |
| 1965-66 | 702 | 289 | 147 | -11 | 1,127 |
| 1966-67 | 767 | 301 | 147 | -12 | 1,203 |
| 1967-68 | 780 | 316 | 167 | -12 | 1,251 |
| 1968-69 | 806 | 343 | 185 | -14 | 1,321 |
| 1969-70 | 904 | 377 | 202 | -16 | 1,467 |
| 1970-71 | 1,093 | 462 | 171 | -15 | 1,711 |
| 1971-72 | 1,300 | 537 | 198 | -14 | 2,022 |
| 1972-73 | 1,478 | 603 | 219 | -18 | 2,282 |
| 1973-74* | 1,879 | 687 | 247 | -20 | 2,792 |
| REVENUE ACCOUNT OF PUBLIC AUTHORITIES (CENTRAL GOVERNMENT AND LOCAL AUTHORITIES)—ctd. | |||||||
|---|---|---|---|---|---|---|---|
| March Year | Current Expenditure on Goods and Services | Transfer Income | Subsidies | Balance of Revenue Over Expenditure | Total Expenditure Plus or Minus Revenue Balances | ||
| Social Security Benefits and Pensions | Net Transfers to Rest of World | Interest on Public Debt Paid in New Zealand | |||||
| *Provisional | |||||||
| EXPENDITURE $(million) | |||||||
| 1953-54 | 226 | 115 | 3 | 37 | 31 | 81 | 492 |
| 1954-55 | 227 | 122 | 4 | 41 | 27 | 138 | 558 |
| 1955-56 | 249 | 128 | 3 | 42 | 25 | 135 | 582 |
| 1956-57 | 274 | 132 | 4 | 47 | 27 | 116 | 599 |
| 1957-58 | 287 | 139 | 4 | 53 | 27 | 82 | 593 |
| 1958-59 | 302 | 160 | 4 | 57 | 27 | 174 | 724 |
| 1959-60 | 324 | 198 | 4 | 59 | 26 | 107 | 718 |
| 1960-61 | 346 | 213 | 4 | 65 | 31 | 151 | 809 |
| 1961-62 | 363 | 218 | 4 | 70 | 28 | 178 | 862 |
| 1962-63 | 394 | 219 | 4 | 77 | 29 | 115 | 838 |
| 1963-64 | 417 | 229 | 6 | 89 | 30 | 148 | 919 |
| 1964-65 | 460 | 234 | 5 | 95 | 35 | 212 | 1,040 |
| 1965-66 | 516 | 242 | 6 | 104 | 39 | 220 | 1,127 |
| 1966-67 | 565 | 252 | 6 | 116 | 39 | 225 | 1,203 |
| 1967-68 | 598 | 269 | 6 | 124 | 21 | 233 | 1,251 |
| 1968-69 | 650 | 278 | 7 | 136 | 19 | 232 | 1,321 |
| 1969-70 | 721 | 298 | 8 | 148 | 28 | 263 | 1,467 |
| 1970-71 | 861 | 328 | 9 | 159 | 52 | 303 | 1,711 |
| 1971-72 | 1,036 | 366 | 11 | 171 | 89 | 348 | 2,022 |
| 1972-73 | 1,116 | 488 | 15 | 190 | 101 | 371 | 2,282 |
| 1973-74* | 1,257 | 594 | 22 | 214 | 134 | 573 | 2,792 |
| COMBINED CAPITAL ACCOUNT | ||||||||||||
|---|---|---|---|---|---|---|---|---|---|---|---|---|
| March Year | Private Savings | Revenue Balances of Public Authorities | Depreciation Allowances | Total Savings | Gross Capital Formation in New Zealand | Changes in Stocks | Net Investment Overseas | Total Investments | ||||
| Private | Central Government Trading Undertakings | Local Authorities Trading Undertakings | Private | Central Government | Local Authorities | |||||||
| *Provisional. | ||||||||||||
| Savings | $(million) | Investments | ||||||||||
| 1955-56 | 165 | 135 | 114 | 15 | 3 | 431 | 266 | 129 | 58 | 38 | - 60 | 431 |
| 1956-57 | 190 | 116 | 127 | 16 | 4 | 452 | 256 | 138 | 65 | 20 | - 28 | 452 |
| 1957-58 | 203 | 82 | 135 | 18 | 4 | 443 | 287 | 140 | 74 | 32 | - 89 | 443 |
| 1958-59 | 155 | 174 | 141 | 20 | 5 | 496 | 290 | 137 | 77 | 31 | - 39 | 496 |
| 1959-60 | 354 | 107 | 141 | 22 | 5 | 629 | 297 | 142 | 84 | 26 | 80 | 629 |
| 1960-61 | 200 | 151 | 155 | 24 | 6 | 536 | 366 | 149 | 84 | 44 | -106 | 536 |
| 1961-62 | 165 | 178 | 173 | 24 | 6 | 547 | 393 | 147 | 94 | 24 | -110 | 547 |
| 1962-63 | 295 | 115 | 185 | 26 | 7 | 629 | 387 | 153 | 102 | 35 | - 48 | 629 |
| 1963-64 | 390 | 148 | 197 | 27 | 7 | 769 | 423 | 180 | 106 | 92 | - 32 | 769 |
| 1964-65 | 413 | 212 | 213 | 27 | 9 | 874 | 500 | 196 | 116 | 100 | - 38 | 874 |
| 1965-66 | 386 | 220 | 235 | 28 | 10 | 880 | 573 | 218 | 125 | 147 | -182 | 880 |
| 1966-67 | 408 | 225 | 257 | 33 | 10 | 934 | 589 | 242 | 129 | 139 | -164 | 934 |
| 1967-68 | 372 | 233 | 272 | 35 | 12 | 924 | 493 | 244 | 132 | 139 | - 85 | 924 |
| 1968-69 | 511 | 232 | 279 | 39 | 15 | 1,076 | 590 | 237 | 136 | 69 | 44 | 1,076 |
| 1969-70 | 621 | 263 | 305 | 43 | 16 | 1,248 | 708 | 235 | 147 | 134 | 24 | 1,248 |
| 1970-71 | 569 | 303 | 348 | 44 | 16 | 1,280 | 831 | 270 | 162 | 222 | -205 | 1,280 |
| 1971-72 | 778 | 348 | 380 | 45 | 18 | 1,570 | 931 | 309 | 188 | 162 | - 20 | 1,570 |
| 1972-73 | 965 | 371 | 408 | 48 | 19 | 1,812 | 1,051 | 388 | 204 | 9 | 161 | 1,812 |
| 1973-74* | 1,108 | 573 | 444 | 56 | 19 | 2,200 | 1,305 | 367 | 197 | 409 | - 79 | 2,200 |
| REST OF WORLD ACCOUNT | ||||||||
|---|---|---|---|---|---|---|---|---|
| March Year | Exports of | Imports of | Net Factor Payments | Net Transfers | Surplus on Current Account | |||
| Goods | Services | Goods | Services | Private | Public Authorities | |||
| *Provisional. | ||||||||
| $(million) | ||||||||
| 1953-54 | 491 | 34 | - 362 | - 79 | - 9 | - 1 | - 3 | 71 |
| 1954-55 | 471 | 36 | - 459 | - 98 | - 17 | - 2 | - 4 | - 72 |
| 1955-56 | 524 | 41 | - 498 | -109 | - 14 | - | - 3 | - 60 |
| 1956-57 | 548 | 47 | - 488 | -114 | - 17 | - | - 4 | - 28 |
| 1957-58 | 540 | 53 | - 545 | -117 | - 17 | 1 | - 4 | - 89 |
| 1958-59 | 528 | 48 | - 468 | -116 | - 24 | - 3 | - 4 | - 39 |
| 1959-60 | 622 | 49 | - 442 | -120 | - 19 | - 6 | - 4 | 80 |
| 1960-61 | 574 | 56 | - 546 | -142 | - 37 | - 8 | - 4 | -106 |
| 1961-62 | 581 | 53 | - 550 | -151 | - 31 | - 8 | - 4 | -110 |
| 1962-63 | 607 | 63 | - 509 | -151 | - 46 | - 9 | - 4 | - 48 |
| 1963-64 | 720 | 71 | - 601 | -167 | - 42 | - 7 | - 5 | - 32 |
| 1964-65 | 767 | 73 | - 616 | -188 | - 59 | -10 | - 5 | - 38 |
| 1965-66 | 749 | 89 | - 722 | -221 | - 54 | -17 | - 6 | -182 |
| 1966-67 | 787 | 104 | - 723 | -243 | - 66 | -17 | - 6 | -164 |
| 1967-68 | 753 | 113 | - 638 | -239 | - 55 | -13 | - 6 | - 85 |
| 1968-69 | 978 | 142 | - 722 | -260 | - 81 | - 8 | - 7 | 44 |
| 1969-70 | 1,117 | 152 | - 828 | -302 | - 98 | -10 | - 8 | 24 |
| 1970-71 | 1,110 | 180 | -1,043 | -363 | - 75 | - 5 | - 9 | -205 |
| 1971-72 | 1,311 | 221 | -1,071 | -410 | - 75 | 14 | -11 | - 20 |
| 1972-73 | 1,671 | 281 | -1,224 | -469 | -124 | 40 | -15 | 161 |
| 1973-74* | 1,886 | 365 | -1,586 | -636 | -134 | 48 | -22 | - 79 |
DISTRIBUTION OF PRIVATE INCOME—The following table gives an analysis of private disposable income with the amount of direct taxes on gross private income shown in parentheses. In the following table the items of private income are shown as percentages of the whole.
| PRIVATE DISPOSABLE INCOME (WITH DIRECT TAXATION ON PRIVATE INCOME SHOWN IN PARENTHESES) | |||||||
|---|---|---|---|---|---|---|---|
| March Year | Salary and Wages | Pay and Allowances of Armed Forces | Social Security Benefits and Pensions | Other Personal Income (Including Rental Value of Owner-occupied Houses) | Surplus of Producer Boards and Primary Produce Stabilisation Account | Company Income (Before Distribution) | Total |
| *Provisional. | |||||||
| DISPOSABLE INCOME $(million) | |||||||
| 1958-59 | 982 (134) | 22 (3) | 505 (200) | 1 | 113 (106) | 1,623 (442) | |
| 1959-60 | 1,035 (146) | 23(3) | 620 (160) | 20 | 133 (111) | 1,831 (420) | |
| 1960-61 | 1,130 (148) | 24 (3) | 629 (213) | -11 | 165 (129) | 1,936 (493) | |
| 1961-62 | 1,197 (168) | 24 (3) | 622 (208) | -10 | 138 (153) | 1,972 (531) | |
| 1962-63 | 1,272 (173) | 26 (3) | 707 (180) | 6 | 179 (148) | 2,190 (505) | |
| 1963-64 | 1,378 (177) | 27 (3) | 774 (195) | 9 | 207 (167) | 2,395 (542) | |
| 1964-65 | 1,517 (206) | 29 (4) | 788 (219) | 11 | 221 (200) | 2,566 (629) | |
| 1965-66 | 1,654 (236) | 31 (4) | 821 (235) | - 6 | 268 (216) | 2,768 (691) | |
| 1966-67 | 1,772 (269) | 35 (5) | 794 (246) | - 9 | 243 (236) | 2,835 (756) | |
| 1967-68 | 1,844 (283) | 37 (5) | 821 (238) | - 5 | 229 (240) | 2,926 (767) | |
| 1968-69 | 1,933 (308) | 40 (6) | 815 (253) | - 6 | 304 (226) | 3,086 (792) | |
| 1969-70 | 2,146 (346) | 41 (6) | 858 (284) | - 8 | 361 (251) | 3,398 (888) | |
| 1970-71 | 2,541 (463) | 48 (9) | 924 (307) | 1 | 352 (300) | 3,866 (1,078) | |
| 1971-72 | 2,946 (609) | 57 (11) | 1,047 (351) | 50 | 401 (315) | 4,501 (1,287) | |
| 1972-73 | 3,266 (688) | 58 (12) | 1,416 (442) | - 4 | 582 (319) | 5,319(1,460) | |
| 1973-74* | 3,948 (873) | 65 (14) | 1,513 (562) | - 7 | 704 (410) | 6,223 (1,859) | |
| PRIVATE INCOME ON A PERCENTAGE BASIS | ||||||||
|---|---|---|---|---|---|---|---|---|
| March Year | Salary and Wages | Pay and Allowances of Armed Forces | Social Security Benefits and Pensions | Rental Value, Owner-occupied Houses | Other Personal Income (Excluding Company Dividends) | Surplus of Producer Boards and Primary Produce Stabilisation Account | Company Income (Before Distribution) | Private Income |
| *Provisional. | ||||||||
| PERCENT | ||||||||
| 1958-59 | 54.0 | 1.2 | 7.7 | 2.4 | 24.0 | - | 10.6 | 100.0 |
| 1959-60 | 52.4 | 1.2 | 8.8 | 2.3 | 23.7 | 0.9 | 10.7 | 100.0 |
| 1960-61 | 52.6 | 1.1 | 8.8 | 2.1 | 23.9 | -0.5 | 12.0 | 100.0 |
| 1961-62 | 54.5 | 1.1 | 8.7 | 2.4 | 22.2 | -0.4 | 11.5 | 100.0 |
| 1962-63 | 53.6 | 1.1 | 8.1 | 3.0 | 21.9 | 0.2 | 12.0 | 100.0 |
| 1963-64 | 52.9 | 1.0 | 7.8 | 2.9 | 22.4 | 0.3 | 12.6 | 100.0 |
| 1964-65 | 53.9 | 1.0 | 7.3 | 3.0 | 21.3 | 0.3 | 13.1 | 100.0 |
| 1965-66 | 54.6 | 1.0 | 7.0 | 3.2 | 20.5 | -0.2 | 13.9 | 100.0 |
| 1966-67 | 56.8 | 1.1 | 7.0 | 3.2 | 18.9 | -0.3 | 13.1 | 100.0 |
| 1967-68 | 57.6 | 1.1 | 7.3 | 3.4 | 18.2 | -0.1 | 12.6 | 100.0 |
| 1968-69 | 57.8 | 1.2 | 7.2 | 3.4 | 17.2 | -0.2 | 13.5 | 100.0 |
| 1969-70 | 58.0 | 1.1 | 7.0 | 3.3 | 16.6 | -0.2 | 14.1 | 100.0 |
| 1970-71 | 60.8 | 1.1 | 6.6 | 3.1 | 15.3 | - | 13.0 | 100.0 |
| 1971-72 | 61.4 | 1.2 | 6.3 | 2.9 | 15.1 | 0.9 | 12.2 | 100.0 |
| 1972-73 | 58.3 | 1.1 | 7.2 | 3.0 | 17.4 | -0.1 | 13.1 | 100.0 |
| 1973-74* | 59.7 | 1.0 | 7.3 | 2.7 | 15.7 | -0.1 | 13.7 | 100.0 |
PUBLIC AUTHORITY SECTOR—The Revenue Account of Public Authorities shown earlier is a consolidation and simplification of two separate and more detailed accounts—the Central Government Revenue Account and the Local Authorities Revenue Account. The consolidated account eliminates all transfers between the two levels of Government and aggregates the respective totals of economically significant flows.
The Revenue Account of the Central Government has been obtained by an analysis of the various accounts within the Public Account. In the case of trading department operations, which are treated separately, profits only are brought into the main account as a revenue item. Expenditure has been taken “net” in all cases, sundry departmental receipts being set off against departmental expenditure The account covers only current revenue items and therefore excludes capital receipts and payments of all kinds, thus accounting in part for the differences between the details given here and those given in the published statement of the Public Accounts in parliamentary paper B. 1 [Pt. 1].
Although all Government transfer expenditure—social security cash benefits and pensions, interest on public debt, and subsidies—is also paid from the Government's taxation revenue and trading profits, it is not part of Government final consumption. It only becomes final consumption in the hands of recipients, or, in the case of subsidies, can be looked upon as an offset to indirect taxation which reduces prices to consumers. For this reason the best measure of transfers is the national income itself on which they are a charge and which they redistribute.
The balance of revenue over expenditure is the Government's surplus on current transactions and is, together with the depreciation provisions of Government trading undertakings, available for capital formation, lending, and debt repayment. Its magnitude changes appreciably from year to year both absolutely and in relation to total current revenue and is the result of short-term changes in fiscal and economic policies pursued by the administration. Year-to-year changes in the Government's surplus are, however, complementary to changes (in the opposite direction) in private savings. This is of course, merely a reflection of the fact that changes in taxation policies are a major cause of the redistribution of total savings as between the private and Government sector. From a long-term point of view, however, it is important to observe the changes in Government fiscal policy from pre-war to present days: in 1938-39, 4.8 percent of the Government's revenue was saved. In 1973-74 the proportion was 14.5 percent.
| CENTRAL GOVERNMENT—REVENUE ACCOUNT | ||||||
|---|---|---|---|---|---|---|
| Item | 1968-69 | 1969-70 | 1970-71 | 1971-72 | 1972-73 | 1973-74* |
| *Provisional. | ||||||
| 1. TAXATION— | ||||||
| (a) Direct: | REVENUE $(million) | |||||
| Income tax | 456.7 | 779.2 | 957.3 | 1,161.1 | 1,314.5 | 1,697.9 |
| Social security taxation | 234.8 | |||||
| Land tax | 2.7 | 2.9 | 3.1 | 3.8 | 3.4 | 3.3 |
| Death duties | 23.6 | 26.1 | 29.2 | 24.8 | 28.4 | 33.8 |
| Other | - | - | - | - | - | 0.2 |
| Totals | 717.9 | 808.1 | 989.5 | 1,189.7 | 1,346.3 | 1,735.2 |
| (b) Indirect: | ||||||
| Sales tax | 82.8 | 97.6 | 125.3 | 139.5 | 171.1 | 206.4 |
| Customs and excise duties | 142.2 | 152.8 | 178.5 | 198.0 | 210.2 | 245.8 |
| Motor vehicles taxation | 94.2 | 98.4 | 104.0 | 108.6 | 115.7 | 124.8 |
| Other | 21.0 | 24.1 | 27.3 | 30.5 | 37.1 | 49.4 |
| Payroll tax | - | - | 20.5 | 40.8 | 46.3 | 33.5 |
| Totals | 340.3 | 372.9 | 455.6 | 517.3 | 580.4 | 659.9 |
| 2. Totals, all taxation | 1,058.2 | 1,181.0 | 1,445.1 | 1,707.0 | 1,926.7 | 2,395.1 |
| 3. TRADING INCOME | 142.7 | 158.5 | 126.8 | 154.7 | 173.7 | 219.9 |
| 4. Less direct taxation paid by trading departments | -14.2 | -16.0 | -14.6 | - 13.7 | -18.0 | -20.4 |
| Totals | 128.5 | 142.5 | 112.2 | 141.0 | 155.7 | 199.5 |
| 5. TOTAL REVENUE | 1,186.7 | 1,323.5 | 1,557.3 | 1,848.0 | 2,082.4 | 2594.6 |
| 6. CURRENT EXPENDITURE ON GOODS AND SERVICES— | ||||||
| (a) General administration | 55.2 | 63.2 | 73.4 | 93.5 | 100.8 | 123.1 |
| (b) Interest | 28.8 | 30.8 | 32.1 | 36.3 | 38.3 | 34.1 |
| (c) Law and order | 13.0 | 16.3 | 20.7 | 26.6 | 31.5 | 39.1 |
| (d) Development of primary and secondary industries | 42.3 | 49.1 | 64.5 | 64.2 | 83.4 | 98.9 |
| (e) Health | 77.7 | 86.8 | 103.7 | 114.0 | 103.0 | 120.5 |
| (f) Education | 145.6 | 168.4 | 214.9 | 279.6 | 309.1 | 367.2 |
| (g) Other social services | 7.0 | 4.9 | 5.8 | 7.8 | 20.3 | 24.4 |
| (h) Defence | 95.9 | 102.6 | 122.8 | 121.8 | 135.5 | 140.5 |
| (i) Rehabilitation | 1.1 | 1.1 | 1.0 | 0.9 | 0.8 | 0.8 |
| (j) Maintenance of public works and services | 18.2 | 16.1 | 18.9 | 21.5 | 25.1 | 24.1 |
| Totals | 484.8 | 539.3 | 657.8 | 766.2 | 847.8 | 972.7 |
| 7. TRANSFERS— | ||||||
| (a) Monetary social security benefits and pensions | 270.9 | 292.4 | 319.5 | 361.4 | 484.0 | 590.3 |
| (b) Family benefit advances | 6.6 | 6.0 | 8.5 | 4.5 | 3.6 | 3.3 |
| (c) Net transfers to rest of world | 6.6 | 7.7 | 9.3 | 10.7 | 15.1 | 22.0 |
| 8. Interest on Central Government debt paid in New Zealand | 103.6 | 113.4 | 120.9 | 130.5 | 146.5 | 166.2 |
| Totals | 387.7 | 419.5 | 458.2 | 507.1 | 649.2 | 781.8 |
| 9. TRANSFERS TO LOCAL AUTHORITIES— | ||||||
| (a) Hospital boards | 101.1 | 113.3 | 135.0 | 169.1 | 230.8 | 269.6 |
| (b) Other | 39.3 | 41.9 | 44.0 | 47.9 | 56.2 | 60.1 |
| Totals | 140.4 | 155.2 | 179.0 | 217.0 | 287.0 | 329.7 |
| 10. SUBSIDIES | 18.9 | 28.5 | 51.6 | 89.4 | 100.7 | 133.7 |
| 11. TOTAL EXPENDITURE | 1,031.8 | 1,142.5 | 1,346.6 | 1,579.7 | 1,884.7 | 2,217.9 |
| 12. Balance of revenue over expenditure | 154.9 | 181.0 | 210.7 | 268.3 | 197.6 | 376.7 |
| 13. TOTAL EXPENDITUREPlus REVENUE BALANCES | 1,186.7 | 1,323.5 | 1,557.3 | 1,848.0 | 2,082.4 | 2,594.6 |
Local Authorities—The revenue account of local authorities is in all respects similar to that of the Central Government and has been obtained by an analysis of the accounts of all local authorities including hospital boards. In 1973-74 the Central Government contributed 62.5 percent of the revenue of local authorities through transfers. Trading profits contributed a further 5.1 percent, and rates and licence fees at 32.4 percent continued the pattern of recent years.
Current expenditure on goods and services by local authorities in 1973-74, at $283.8 million was 5.6 percent higher than in the previous year, whereas the increase in Central Government current expenditure on goods and services was 14.7 percent. The limitation in the scope of local government activities as compared with those of the Central Government do not call for a detailed analysis of expenditure items and therefore current expenditure on the provision of goods and services by local authorities is shown as a single total.
| LOCAL AUTHORITIES—REVENUE ACCOUNT | ||||||
|---|---|---|---|---|---|---|
| Item | 1968-69 | 1969-70 | 1970-71 | 1971-72 | 1972-73 | 1973-74* |
| *Provisional. | ||||||
| 14. TAXATION— | REVENUE $ (million) | |||||
| (a) Direct: Rates | 88.6 | 95.5 | 103.6 | 110.5 | 131.6 | 143.9 |
| (b) Indirect: Licence fees | 3.0 | 4.0 | 6.0 | 19.4 | 22.3 | 26.8 |
| Totals | 91.6 | 99.5 | 109.6 | 129.9 | 153.9 | 170.7 |
| 15. Trading income | 42.6 | 43.9 | 44.0 | 43.6 | 45.5 | 27.0 |
| 16. Transfers from Central Government | 140.4 | 155.2 | 179.0 | 217.0 | 287.0 | 329.7 |
| 17. TOTAL REVENUE | 274.6 | 298.6 | 332.6 | 390.5 | 486.4 | 527.4 |
| EXPENDITURE $(million) | ||||||
| 18. Current expenditure on goods and services | 164.7 | 181.6 | 202.8 | 269.7 | 268.7 | 283.8 |
| 19. Interest on local authority debt paid in New Zealand | 32.3 | 35.0 | 37.9 | 40.7 | 44.0 | 47.7 |
| 20. TOTAL EXPENDITURE | 197.0 | 216.6 | 240.3 | 310.3 | 312.7 | 331.5 |
| 21. Balance of revenue over expenditure | 77.6 | 82.0 | 92.3 | 80.2 | 173.7 | 195.9 |
| 22. TOTAL EXPENDITUREPlus REVENUE BALANCES | 274.6 | 298.6 | 332.6 | 390.5 | 486.4 | 527.4 |
GENERAL—A country's balance of payments is an account of economic transactions which take place between that country and all other countries. The balance of payments is part of the national accounting system. The present series of New Zealand balance of payments estimates is largely based on the principles set out in the Balance of Payments Manual published by the International Monetary Fund and is in conformity with the methods used in other countries. For a more detailed description of statistical concepts and methods used in preparing balance of payments estimates, refer to the Report on the Balance of Payments for the year 1973-74, obtainable from the Government Printer.
The statement is divided into a current and capital account. The balances on both accounts are, by definition, the same, the capital account showing how the surplus or deficit on current account was financed.
Current Account—The current account records all transactions between New Zealand and the rest of the world other than changes in overseas assets and liabilities. As far as possible transactions are recorded on a gross credit-debit basis rather than on the basis of net settlements. The current account includes credits and debits for goods, services (invisibles), and transfers (donations). The difference between current credits and current debits is the balance of payments surplus (deficit) on current account. This is the measure of the extent to which a country does or does not live within its current income and it is the most significant datum emerging from a balance of payments compilation.
Capital Account—The capital account records changes in claims on, or liabilities to, the rest of the world. These may consist of changes in overseas private investments in New Zealand and New Zealand private investments overseas; borrowing or repayments overseas by the Government and official institutions and changes in Government overseas cash balances, net overseas assets, monetary gold, multilateral transfers, and other capital movements. Of the items comprising the capital account, the category of net overseas assets (the overseas exchange holdings of New Zealand's banking system) is most widely known and appreciated. Its importance lies in the fact that it records changes in overseas liquid resources which, by their nature, can be made immediately available for purposes of imports, public debt repayments, capital investments, etc. Within the confines of the balance of payments capital account the movement in net overseas assets is only one of several other capital movements with which it forms an integral part; it is the combination of all these capital changes which must be studied in order to understand the financing of the current surplus or deficit.
MERCHANDISE TRANSACTIONS: Exports—The source of export figures is Custom's export entries (exclusive of ships' stores) at f.o.b. valuation; exports from New Zealand to its island territories have been excluded, but exports from island territories to other countries have been added to New Zealand totals. The remaining adjustments are for items which are not included in export and import entries (relief supplies, and some ships and aircraft), items where the valuation requires correction, e.g., parcel post, or items which are accounted for elsewhere in the balance of payments (export of gold).
Imports—The basic import figures originate from import entries. Some aircraft and ships not included in imports by Customs Department are added. New Zealand imports from its island territories have been excluded, but imports into island territories from other countries have been included.
It is necessary to comment here on the valuation method adopted for imports. Balance of payments accounts treat freight and marine insurance payments on imports (as far as they are made to non-residents) as invisible payments. As a result, merchandise transactions are shown on a f.o.b. valuation basis for imports and exports alike. This method of treatment has many advantages, and international comparability of merchandise movements is one of them. A special estimate is therefore made of imports f.o.b. for balance of payments purposes.
BALANCE OF PAYMENTS AND EXCHANGE RECORD—There are several very important differences between a balance of payments statement and the statistics of overseas receipts and payments which are included in an exchange record, such as is given in Section 29, Banking and Currency. The main differences are:
The balance of payments attempts to show all economic transactions between residents of one country and residents of other countries, whereas the exchange record shows only transactions involving remittances.
The import and export figures in the balance of payments are based on trade statistics, which enable goods to be valued at a definite and uniform valuation boundary—viz, f.o.b. country of export; the exchange record, on the other hand, records remittances for imports and exports whenever these are made and without adhering to any valuation basis (f.o.b. or c.i.f.). The result is a difference both in timing and valuation between the two statements.
Whereas exchange statistics record net settlements resulting from a number of possible contra-entries or offsets, the balance of payments shows these transactions as far as possible on a gross basis.
Other differences arise from the fact that the balance of payments is constructed on a basis of country of purchase for imports and country of destination for exports, country of residence of remittor or remittee, and nationality in the case of shipping companies, whereas the record of exchange transactions is based on the country of monetary settlement.
In essence, the exchange record is a statement of cash flows, or using the terminology of commercial accounting it is the “cash book” of the nation's transactions with other countries; the balance of payments statement on the other hand approaches an “income and expenditure” account.
GEOGRAPHICAL DIVISION—The regional break-up of the balance of payments is on a geographical (as distinct from a currency) basis. This means that it is not the currency in which any economic transaction is settled but the residence of New Zealand's immediate partner in the transaction which determines in which regional column the transaction is recorded. Any exception to this rule is due to statistical necessity—insufficiency of basic data, etc., rather than choice.
The New Zealand figures include transactions of New Zealand's dependent island territories, and included Western Samoa until 1961-62. In this respect they differ from the rest of the world account included in the national income and expenditure estimates where the rest of the world account refers to New Zealand only, and does not cover the island territories. However, this difference in coverage only slightly affects the gross figures, and the final outcome of the balance of payments current account differs very little from the rest of the world account.
The regional areas and countries comprising them have been defined as follows:
United Kingdom (including Channel Islands).
Australia (including Norfolk Island, but excluding Papua - New Guinea).
USA and Canada—United States of America, Canada, Newfoundland, Panama Canal Zone Puerto Rico, Virgin Islands, American Samoa, Guam, and other American islands in the Pacific.
EEC Countries—The six members of the European Economic Community which formed a common market in 1958; Belgium, the Netherlands, Luxembourg, France, Italy and the Federal German Republic, together with their associated and dependent overseas territories. From and including 1973-74 Denmark and Ireland are included with EEC. The United Kingdom has also become a member of the EEC but it is being shown separately.
Other Sterling Countries—Other Commonwealth countries (excluding United Kingdom, Canada, Newfoundland, and from 1968-69 Australia) and their trustee and dependent territories; the colonies, protectorates, and trustee territories, etc., of the United Kingdom, the Republic of Ireland, Iceland, and South Africa. From 1972-73 this region has been merged with “other countries” as below.
Other Countries—All countries not included in any other group.
International Organisations—Transactions with the United Nations and its agencies, the International Monetary Fund, the International Bank for Reconstruction and Development, the International Finance Corporation, the Asian Development Bank, South Pacific Air Transport Council, and other international organisations.
ACCOUNTING PERIOD—All estimates are for financial years ended 31 March.
RESIDENTS AND NON-RESIDENTS—The balance of payments is a record of economic transactions between residents and non-residents.
Residents are all people living permanently in New Zealand (and who have their “centre of interest” in New Zealand). Subsidiaries and branches of overseas companies are treated as residents, while subsidiaries and branches of New Zealand companies operating overseas are regarded as residents of the country in which they operate.
In order to simplify the rather complex operations of overseas shipping companies, the shipping transactions of their branches in New Zealand (such as their receipt of freights, port disbursements, administrative expenses in New Zealand, etc.) are regarded as transactions of non-residents, by way of exception to the general rule stated above; on the other hand, their investment activity is included in the data on New Zealand branches of overseas companies and conforms to the general rule.
SUMMARY TABLES, CURRENT AND CAPITAL ACCOUNTS—The following table summarises current transactions with all countries.
| CURRENT ACCOUNT | |||||
|---|---|---|---|---|---|
| Item | 1969-70 | 1970-71 | 1971-72 | 1972-73 | 1973-74* |
| *Provisional. Minus (-) sign denotes excess of imports over exports or payments over receipts. | |||||
| NZ$(million) | |||||
| Credits | |||||
| Exports f.o.b. | 1,113.2 | 1,102.7 | 1,305.5 | 1,665.9 | 1,879.2 |
| Non-monetary gold | .. | .. | .. | .. | .. |
| Transportation | 80.2 | 95.1 | 120.4 | 134.4 | 191.8 |
| Travel | 26.0 | 33.6 | 45.1 | 57.4 | 78.5 |
| Insurance | 3.0 | 0.9 | 0.2 | 5.7 | 6.5 |
| International investment income— | 34.8 | 42.7 | 46.2 | 55.0 | 79.9 |
| Income from direct private investment | 11.3 | 13.5 | 13.0 | 10.4 | 13.9 |
| Other private investment income | 14.6 | 24.8 | 13.8 | 13.6 | 15.0 |
| Government and official institutions | 8.9 | 4.4 | 19.4 | 31.0 | 51.0 |
| Government transactions— | 14.0 | 15.7 | 17.8 | 31.5 | 31.1 |
| Foreign Government expenditure | 9.6 | 8.8 | 11.0 | 20.4 | 21.6 |
| New Zealand Government receipts | 4.3 | 6.9 | 6.8 | 11.1 | 9.5 |
| Miscellaneous receipts | 29.1 | 35.2 | 37.3 | 52.1 | 57.3 |
| Transfers— | 37.9 | 47.9 | 69.2 | 99.6 | 121.9 |
| Government transfers | - | - | - | - | - |
| Personal remittances and other donations | 28.3 | 35.5 | 49.2 | 55.4 | 58.0 |
| Migrants' funds | 5.9 | 8.3 | 14.6 | 35.2 | 56.4 |
| Legacies | 3.8 | 4.1 | 5.4 | 9.0 | 7.5 |
| Total credits | 1,338.3 | 1,373.8 | 1,641.7 | 2,101.6 | 2,446.2 |
| Debits | |||||
| Imports f.o.b. | 827.1 | 1,042.0 | 1,070.3 | 1,222.4 | 1,584.4 |
| Non-monetary gold | |||||
| Transportation | 139.8 | 171.9 | 189.0 | 203.8 | 293.9 |
| Travel | 50.1 | 61.9 | 75.5 | 98.2 | 143.4 |
| Insurance | 1.6 | 4.4 | 4.9 | 10.5 | 19.8 |
| International investment income— | 132.4 | 117.8 | 121.0 | 178.5 | 214.1 |
| Income from direct private investment | 88.8 | 70.2 | 78.4 | 120.3 | 162.4 |
| Other private investment income | 7.9 | 14.6 | 9.6 | 20.8 | 17.7 |
| Government and official institutions | 35.3 | 32.6 | 32.9 | 37.3 | 34.0 |
| Local authority interest | 0.4 | 0.4 | 0.1 | 0.1 | - |
| Government transactions— | 27.8 | 29.9 | 39.8 | 46.2 | 52.0 |
| New Zealand Government expenditure | 27.8 | 29.9 | 39.8 | 46.2 | 52.0 |
| Miscellaneous payments | 82.6 | 94.5 | 100.9 | 110.2 | 127.2 |
| Transfers— | 55.9 | 61.8 | 65.4 | 74.8 | 95.6 |
| Government transfers and contribution to Colombo Plan | 7.7 | 9.3 | 10.7 | 15.1 | 21.4 |
| Personal remittances and other donations and transfers | 18.0 | 21.3 | 23.4 | 23.9 | 27.1 |
| Migrants' funds | 23.2 | 23.9 | 22.6 | 26.2 | 37.4 |
| Legacies | 7.0 | 7.3 | 8.8 | 9.6 | 9.7 |
| Total debits | 1,317.3 | 1,584.2 | 1,666.9 | 1,944.6 | 2,530.4 |
| Balance on current account | 21.0 | -210.4 | -25.2 | 157.0 | -84.2 |
The consolidated capital account shown below summarises capital transactions with all countries; some of the items are presented in simplified form (by adding or offsetting capital movements where these have occurred in respect of equally defined items).
| CAPITAL ACCOUNT | ||||||||||
|---|---|---|---|---|---|---|---|---|---|---|
| Item | 1969-70 | 1970-71 | 1971-72 | 1972-73 | 1973-74* | |||||
| Increase in | Increase in | Increase in | Increase in | Increase in | ||||||
| Assets | Liabilities | Assets | Liabilities | Assets | Liabilities | Assets | Liabilities | Assets | Liabilities | |
Minus (-) sign denotes decrease. *Provisional. †Allocation of special drawing rights and holdings in New Zealand currency are not increases in liabilities, but are entered here as contra entries to maintain the correct balance of the capital account. | ||||||||||
| Long-term capital (Private)— | NZ$(million) | |||||||||
| Overseas direct investment in New Zealand | ... | 76.2 | ... | 130.0 | ... | 97.5 | ... | 110.2 | ... | 181.7 |
| New Zealand direct investment overseas | 11.0 | ... | 7.8 | ... | 10.7 | ... | 2.7 | ... | 13.3 | ... |
| Other long-term capital movements | - | 3.6 | - | 8.7 | - | 93.3 | - | 90.5 | - | 37.9 |
| Long-term capital (Government)— | ||||||||||
| Government investments | 26.1 | ... | 31.3 | ... | 12.2 | ... | 8.9 | ... | 13.8 | ... |
| Public debt | ... | 2.9 | ... | 50.6 | ... | 72.2 | ... | -49.6 | ... | -58.1 |
| Local Authority debt | ... | - 1.3 | ... | - 1.3 | ... | - 1.4 | ... | - 1.1 | ... | - 0.5 |
| Asian Development Bank— | ||||||||||
| Holdings of New Zealand securities | ... | 1.0 | ... | 1.0 | ... | - | ... | 1.2 | ... | 1.1 |
| Encashment of securities | - | - | - | - | - | - | 0.3 | - | 0.3 | - |
| New Zealand subscription | 2.0 | ... | 2.0 | ... | - | ... | 2.0 | ... | 1.9 | ... |
| International Bank for Reconstruction and Development (World Bank)— | ||||||||||
| Holdings of New Zealand securities | ... | - | ... | - | ... | 0.4 | ... | - | ... | - |
| New Zealand subscription and security | - | ... | - | ... | 0.4 | ... | - | ... | - | ... |
| Other | ... | - 5.3 | ... | -11.6 | ... | 1.4 | ... | 10.5 | ... | 3.5.7 |
| Monetary institutions— | ||||||||||
| Reserve Bank of New Zealand— | ||||||||||
| International Monetary Fund— | ||||||||||
| Drawings and repurchases | ... | -18.4 | ... | -35.0 | ... | - | ... | - | ... | - |
| Allocation of Special Drawing Rights | ... | 23.6† | ... | 19.3† | ... | 19.1† | ... | - | ... | - |
| Increase in quota | - | ... | 40.2 | ... | - | ... | - | ... | - | ... |
| IMF holdings in New Zealand currency | - | - | - | 30.1† | ... | - | ... | - | ... | - |
| Other borrowing and lending | ... | -27.9 | ... | - 5.1 | ... | - 5.4 | ... | - | ... | - |
| Monetary gold | - 0.4 | ... | - 0.1 | ... | - | ... | - | ... | 5.4 | ... |
| Reserve Bank of New Zealand and other banks— | ||||||||||
| Assets of New Zealand banking system | 21.7 | ... | -32.4 | ... | 159.0 | ... | 318.9 | ... | 46.8 | ... |
| Special Drawing Rights of IMF | 23.6 | ... | - 4.0 | ... | 27.9 | ... | 4.9 | ... | - | ... |
| Official export credits | - | ... | 5.7 | ... | 4.3 | ... | 0.5 | ... | 0.3 | ... |
| Short-term capital (Government)— | ||||||||||
| Government cash balances | - 0.1 | - | - | ... | ... | - | ... | - | ... | - |
| Other | -18.3 | - | - 0.3 | - | 57.6 | ... | 73.1 | ... | -38.4 | ... |
| Other short-term capital movements including errors and omissions | 9.8 | - | - | 73.9 | - | 20.2 | - | 92.6 | 70.2 | ... |
| Balance on capital account | 21.0 | -210.4 | -25.2 | 157.0 | -84.2 | |||||
ANALYSIS OF CURRENT ACCOUNT—The balance of payments estimates show that for the year ended 31 March 1974 New Zealand's balance with the rest of the world on current account was a deficit of $84.2 million. It was $157.0 million in surplus for the 1972-73 financial year.
(a) Merchandise Transactions—As compared with 1972-73, the value of exports rose by $213.3 million to $1,879.2 million, and imports (measured f.o.b. country of shipment) were $362.0 million greater than in 1972-73 at $1,584.4 million.
The long-term trend of a declining share of exports destined for the United Kingdom has continued. In 1955-56, 64.9 percent of New Zealand's exports, by value, were sold in the United Kingdom; by 1960-61 this proportion had fallen to 52.9 percent, and in the last 3 years the percentages have been 33.9 for 1971-72, 29.2 for 1972-73, and 22.3 for 1973-74.
The following table shows how trade with each area has moved.
| Year Ended 31 March | United Kingdom | Australia | United States and Canada | EEC Countries | Other Countries* | Total, All Countries |
|---|---|---|---|---|---|---|
*Includes International Organisations and other Sterling Countries. †Provisional. | ||||||
| Exports (f.o.b. N.Z.)— | NZ$(million) | |||||
| 1970-71 | 393.3 | 100.2 | 214.9 | 135.9 | 258.4 | 1,102.7 |
| 1971-72 | 443.1 | 112.7 | 250.7 | 167.7 | 331.3 | 1,305.5 |
| 1972-73 | 486.5 | 126.4 | 304.8 | 244.8 | 503.3 | 1,665.9 |
| 1973-74† | 419.2 | 168.0 | 378.0 | 214.3 | 699.7 | 1,879.2 |
| Annual Change— | ||||||
| 1971-72 | +49.8 | +12.5 | +35.8 | +31.8 | +72.9 | +202.8 |
| 1972-73 | +43.4 | +13.7 | +54.1 | +77.1 | +172.1 | +360.4 |
| 1973-74 | -67.3 | +41.6 | +73.2 | -30.5 | +196.3 | +213.3 |
| Imports (f.o.b. Overseas)— | ||||||
| 1970-71 | 304.8 | 228.3 | 174.9 | 81.5 | 252.5 | 1,042.0 |
| 1971-72 | 325.4 | 245.4 | 146.6 | 82.5 | 270.4 | 1,070.3 |
| 1972-73 | 302.5 | 318.1 | 202.3 | 86.2 | 313.3 | 1,222.4 |
| 1973-74† | 322.1 | 422.3 | 283.8 | 137.8 | 419.0 | 1,584.4 |
| Annual Change— | ||||||
| 1971-72 | +20.6 | +17.1 | -28.3 | +1.0 | +17.9 | +28.3 |
| 1972-73 | -22.9 | +72.7 | +55.7 | +3.7 | +42.9 | +152.1 |
| 1973-74 | +19.6 | +104.2 | +81.5 | +51.0 | +105.7 | +362.0 |
| Balance of Trade (Exports Less Imports)— | ||||||
| 1970-71 | 88.5 | -128.1 | 40.0 | 54.4 | 5.9 | 60.7 |
| 1971-72 | 117.7 | -132.7 | 104.1 | 85.2 | 60.9 | 235.2 |
| 1972-73 | 184.0 | -191.7 | 102.5 | 158.6 | 190.1 | 443.5 |
| 1973-74† | 97.1 | -254.3 | 94.2 | 77.1 | 280.7 | 294.8 |
| Annual Change— | ||||||
| 1971-72 | +29.2 | -4.6 | +64.1 | +30.8 | +55.0 | +174.5 |
| 1972-73 | +66.3 | -59.0 | -1.6 | +73.4 | +129.2 | +208.2 |
| 1973-74 | -86.9 | -62.6 | -8.3 | -81.5 | +90.6 | -148.7 |
(b) Invisibles—The deficit on invisibles for 1973-74 was $405.3 million against $311.3 million in 1972-73 and $264.1 million in 1971-72. This outcome confirms the historical trend of a widening deficit on “invisibles” account which has continued over the years with only temporary reversals.
In 1973-74 all five categories making up invisibles showed increased deficits over the previous year. The largest increase was $32.7 million in transportation, being an increase of 47.1 percent, while the largest proportional increase was in travel with a 59.0 percent increase of $24.1 million. The item which was the most stable was the net outflow on investment income account which rose by $10.7 million or 8.7 percent.
The greater deficit on transportation was accounted for by a rise in the transportation debit item of $90.1 million compared with a rise in the transportation credit item of $57.4 million. The transportation debit item includes freight on imports, passenger fares to non-resident shipping lines and air carriers, and disbursements overseas by New Zealand carriers (such as port disbursements, ships' stores, and bunkers). The freight component of this item was affected by both the increase in volume of imports and the rise in freight rates.
Investment income credits include income from New Zealand direct investment overseas, other private investment income and interest on investments of Government and official institutions. The debits include income derived from overseas direct investment in New Zealand, other private investment income and interest on Government and local authority debt.
Investment income credits rose from $55.0 million to $79.9 million in 1973-74. The major portions of the increase came from interest on Reserve Bank and Government investment overseas. On the other side of the account, income debts, there was also an augmented outflow (from $178.5 million to $214.1 million) caused by an increase in income from overseas direct private investment in New Zealand. This rose from $120.3 million to $162.4 million.
The following table gives details of invisible transactions by areas.
| NET DEFICIT ON INVISIBLE ACCOUNT BY AREAS | ||||||
|---|---|---|---|---|---|---|
| Year | United Kingdom | Australia | United States and Canada | EEC Countries | Other Countries | Total, All Countries |
| NZ$(million) | ||||||
| 1971-72 | 128.3 | 29.3 | 44.5 | 17.2 | 44.8 | 264.1 |
| 1972-73 | 167.2 | 39.6 | 42.4 | 16.5 | 45.6 | 311.3 |
| 1973-74 | 188.8 | 63.1 | 68.1 | 28.7 | 56.6 | 405.3 |
In 1973-74, transactions with the United Kingdom accounted for 46.6 percent of the invisible deficit; those with Australia accounted for 15.6 percent; those with the United States and Canada for 16.8 percent; those with the European Economic Community countries for 7.1 percent; and those with other countries for 14.0 percent.
(c) Transfers—Transfers consist of legacies, personal remittances, migrants' funds, Government contributions to international agencies, gifts and donations in cash or kind, for which there is no quid pro quo. Transfer receipts have shown a steady rise for some years and recorded an inflow of $121.9 million in 1973-74 against payments of $95.6 million.
Analysis of Capital Account—The capital account of the balance of payments records changes in claims on and liabilities to other countries; such changes have direct reference to current transactions and the net difference between acquisition of new claims and the increase in liabilities explains how the current account was funded.
An analysis of the 1973-74 capital account is now presented.
| Nature of Capital | Net Outflows of Capital (Increase in Claims) | Net Inflows of Capital (Increase in Liabilities) |
|---|---|---|
| NZ($million) | ||
| Long-term private | - | 206.3 |
| Long-term Government | 37.8 | - |
| Monetary institutions | 52.5 | - |
| Short-term Government | - | 38.4 |
| Other short-term (including errors and omissions) | 70.2 | - |
| Excess of capital inflows over outflows (equals balance on current account) | 84.2 | - |
| Totals | 244.7 | 244.7 |
One of the major categories of private long-term capital movements is that of direct investment in New Zealand by overseas firms in branches and subsidiaries. In 1973-74 the increase in investment by overseas firms was $181.7 million compared with $110.2 million in 1972-7 and $97.5 million in 1971-72.
The two main components of Government long-term capital movements are Government investment overseas, which during 1973-74 increased by $13.8 million, and the external public debt which rose by $58.1 million. On the other hand, the short-term Government investment decreased by $384 million.
Under the heading monetary institutions are the international transactions entered into by the Reserve Bank and other trading banks. The assets of the banking system were under this heading. Excluding the effect of any exchange revaluations the assets rose by $46.8 million during 1973-74; there were no transactions in special drawing rights of the IMF.
Finally, the outflow of short-term private capital, timing errors, and omissions amounted to $70.2 million. No precise breakdown of this figure can be given. It is a residual and shows the amount by which the ascertained capital movements do not account for the balance on current account. Such a residual is very sensitive to relatively small timing or other errors in the very large magnitudes of both the current and capital accounts.
BALANCES BY AREAS—The following tables for current account and capital account for 1973-74 respectively, analyse the balance of payments by area.
| A. CURRENT ACCOUNT BY AREAS 1973-74* | |||||||
|---|---|---|---|---|---|---|---|
| Item | United Kingdom | Australia | United States and Canada | EEC Countries | Other Countries | International Organisations | Total, All Countries |
| *Provisional. | |||||||
| Credits | NZ$(million) | ||||||
| Exports f.o.b. | 419.2 | 168.0 | 378.0 | 214.3 | 699.7 | ... | 1,879.2 |
| Non-monetary gold | ... | ... | ... | ... | ... | ... | - |
| Transportation | 85.8 | 60.1 | 15.2 | 12.8 | 17.9 | ... | 191.8 |
| Travel | 11.6 | 45.2 | 17.1 | 0.7 | 3.9 | ... | 78.5 |
| Insurance | 7.4 | -0.4 | -0.1 | 0.1 | -0.5 | ... | 6.5 |
| International investment income— | |||||||
| Income from direct investment overseas | 3.9 | 6.2 | 0.3 | ... | 3.5 | ... | 13.9 |
| Other private investment income | -8.4 | 10.2 | 1.5 | 1.7 | 9.7 | 0.3 | 15.0 |
| Interest on investments of Government and official institutions | 50.7 | 0.1 | 0.2 | - | - | ... | 51.0 |
| Government transactions— | |||||||
| Expenditure by foreign governments in New Zealand | 1.2 | 2.2 | 4.4 | 0.3 | 12.0 | 1.5 | 21.6 |
| New Zealand Government current receipts from overseas | 5.5 | 1.1 | 2.5 | 0.1 | 0.3 | ... | 9.5 |
| Miscellaneous receipts | 14.7 | 16.4 | 14.5 | 1.6 | 10.1 | ... | 57.3 |
| Transfers— | |||||||
| Government transfers | - | - | - | - | - | ... | - |
| Personal remittances and other donations and transfers | 24.5 | 16.5 | 8.5 | 2.5 | 6.0 | ... | 58.0 |
| Immigrants' funds | 39.7 | 9.6 | 3.2 | 1.5 | 2.4 | ... | 56.4 |
| Legacies | 4.3 | 1.9 | 0.8 | 0.3 | 0.2 | ... | 7.5 |
| Total credits | 660.1 | 337.1 | 446.1 | 235.9 | 765.2 | 1.8 | 2,446.2 |
| Debits | NZ$(million) | ||||||
| Imports f.o.b. | 322.1 | 422.3 | 283.8 | 137.2 | 419.0 | ... | 1,584.4 |
| Transportation | 148.8 | 47.2 | 28.2 | 27.5 | 42.2 | ... | 293.9 |
| Travel | 40.9 | 58.6 | 17.4 | 3.5 | 23.0 | ... | 143.4 |
| Insurance | 15.1 | 3.3 | 1.1 | - | 0.3 | ... | 19.8 |
| International investment income— | |||||||
| Income from direct investment in New Zealand | 71.4 | 42.9 | 39.0 | 3.5 | 5.6 | ... | 162.4 |
| Other private investment income | 5.7 | 3.4 | 5.7 | 1.6 | 1.3 | ... | 17.7 |
| Interest on Government debt | 26.5 | ... | 5.0 | - | 0.2 | 2.3 | 34.0 |
| Interest on local authority debt | - | - | - | - | - | - | - |
| Government transactions— | |||||||
| Current Government expenditure | 8.2 | 8.6 | 5.0 | 4.2 | 23.5 | 2.5 | 52.0 |
| Miscellaneous payments | 44.6 | 40.2 | 22.3 | 5.7 | 14.4 | ... | 127.2 |
| Transfers— | |||||||
| Government transfers and contribution to Colombo Plan | 0.4 | 0.8 | 1.1 | - | 14.2 | 4.9 | 21.4 |
| Personal remittances and other donations and transfers | 6.7 | 6.7 | 2.6 | 1.0 | 11.9 | -1.8 | 27.1 |
| Emigrants' funds | 11.9 | 15.9 | 4.5 | 1.3 | 3.8 | ... | 37.4 |
| Legacies | 4.0 | 3.9 | 1.1 | 0.2 | 0.5 | ... | 9.7 |
| Total debts | 706.5 | 653.8 | 416.6 | 185.7 | 559.9 | 7.9 | 2,530.4 |
| Balance on current account (minus sign (—) denotes deficit) | -46.4 | -316.7 | 29.5 | 50.2 | 205.3 | -6.1 | -84.2 |
| B. CAPITAL ACCOUNT BY AREAS 1973-74* | ||||||
|---|---|---|---|---|---|---|
| Item | United Kingdom | Australia | United States and Canada | |||
| Increase in | Increase in | Increase in | ||||
| Assets | Liabilities | Assets | Liabilities | Assets | Liabilities | |
*Provisional. Minus (—) sign denotes decrease. | ||||||
| NZ$(million) | ||||||
| Long-term capital (private)— | ||||||
| Overseas direct investment in New Zealand | ... | 84.2 | ... | 42.2 | ... | 54.9 |
| New Zealand direct investment overseas | 8.9 | ... | 6.9 | ... | -0.7 | ... |
| Other long-term capital movements | -5.3 | -6.4 | -2.3 | -0.1 | -0.7 | 7.9 |
| Long-term capital (Government)—- | ||||||
| Government investments | -2.7 | ... | - | ... | 3.5 | ... |
| Public debt | ... | -41.3 | ... | - | ... | -9.9 |
| Local authority debt | ... | - | ... | -0.5 | ... | - |
| Asian Development Bank holdings of New Zealand securities | ... | ... | ... | ... | ... | ... |
| Encashment of securities | ... | ... | ... | ... | ... | ... |
| New Zealand subscription Other | - | -0.1 | -0.8 | - | - | 35.1 |
| Long-term capital (monetary institutions)— | ||||||
| Reserve Bank of New Zealand— | ||||||
| Other borrowing and lending | ... | ... | 0.5 | ... | 0.7 | ... |
| Reserve Bank of New Zealand and other banks | ||||||
| Assets of New Zealand banking system | 45.7 | ... | -6.3 | ... | -74.4 | ... |
| Official export credits | ... | ... | ... | ... | ... | ... |
| Short-term capital (Government) | -59.1 | ... | - | ... | -19.0 | ... |
| Other short-term capital movements including errors and omissions | 2.5 | ... | ... | 273.2 | 207.9 | ... |
| Multilateral transfers | ||||||
| Balance on capital account | -46.4 | -316.7 | 29.5 | |||
| Item | EEC Countries | Other Countries and unallocated | International Organisations | Total, All Countries | ||||
|---|---|---|---|---|---|---|---|---|
| Increase in | Increase in | Increase in | Increase in | |||||
| Assets | Liabilities | Assets | Liabilities | Assets | Liabilities | Assets | Liabilities | |
*Provisional Minus (—) sign denotes decrease | ||||||||
| NZ$(million) | ||||||||
| Long-term capital (private)— | ||||||||
| Overseas direct investment in New Zealand | -2.7 | ... | 3.1 | ... | ... | ... | ... | 181.7 |
| New Zealand direct investment overseas | -0.3 | ... | -1.5 | ... | ... | ... | ... | 13.3 |
| Other long-term capital movements | -0.2 | 8.8 | -0.7 | 18.6 | ... | ... | -9.1 | 28.8 |
| Long-term capital (Government)— | ||||||||
| Government investments | - | ... | 6.9 | ... | 6.1 | ... | 13.8 | .. |
| Public debt | ... | ... | -3.3 | ... | -0.5 | -3.1 | ... | -58.1 |
| Local authority debt | ... | - | ... | - | ... | - | ... | 0.5 |
| Asian Development Bank holdings of New Zealand securities | ... | ... | ... | ... | ... | 1.1 | ... | 1.1 |
| Encashment of securities | ... | ... | ... | ... | 0.3 | ... | 0.3 | ... |
| New Zealand subscription | ... | ... | ... | ... | 1.9 | ... | 1.9 | ... |
| Other | ... | ... | - | -0.1 | ... | ... | -0.8 | 34.9 |
| Long-term capital (monetary institutions)— | ||||||||
| Reserve Bank of New Zealand | ||||||||
| Other | 1.0 | 3.2 | 5.4 | |||||
| Reserve Bank of New Zealand and other banks | ||||||||
| Assets of New Zealand banking system | 81.8 | ... | - | ... | - | ... | 46.8 | ... |
| Official export credits | ... | ... | 0.3 | ... | ... | ... | 0.3 | ... |
| Short-term capital (Government) | 40.3 | ... | 5.4 | ... | -6.0 | ... | -38.4 | ... |
| Other short-term capital movements including errors and omissions | 69.6 | 213.0 | ... | ... | 10.4 | 70.2 | ||
| Multilateral transfers | ||||||||
| Balance on capital account | 50.2 | 205.3 | -6.1 | -.84.2 | ||||
The following diagram shows New Zealand's balance of payments by monetary areas for the latest 5 years.
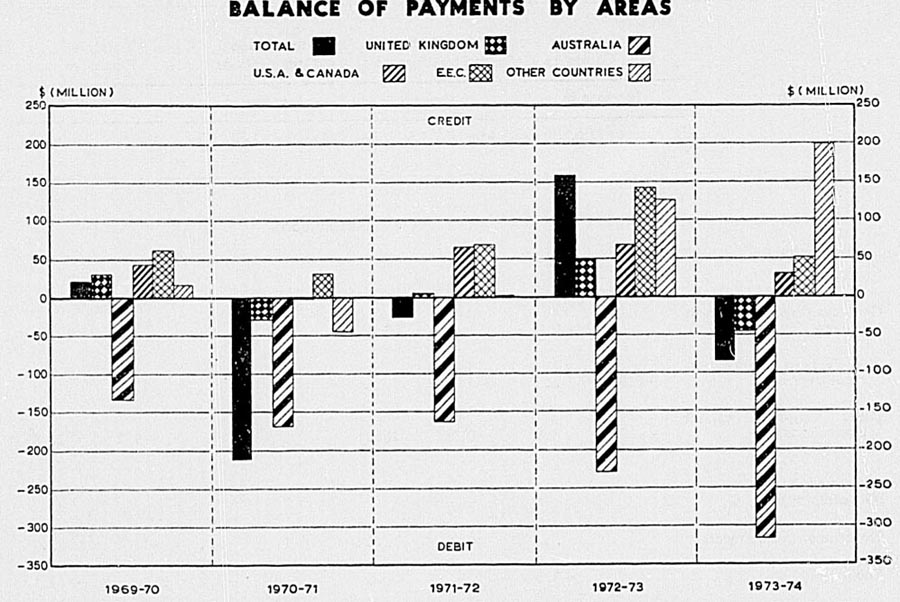
SURVEY OF COMPANIES WITH OVERSEAS AFFILIATIONS—The picture of international capital movements would be incomplete without the consideration of investment flows originating with private commercial firms. While such investment takes place in response to usual economic motivations, its effect on a country's balance of payments differs in no respect from other capital movements, such as Government lending or borrowing abroad, investment or repatriation of assets from abroad by private individuals, etc.
The type of investment referred to here is that defined as direct private investment. Subsidiaries (i.e., New Zealand companies) under control of an overseas company, branches of overseas companies, companies where many of the shareholders reside overseas, or any other companies where overseas shareholders exercise a controlling interest, fall under this category. The question of control is decided in some cases on the strength of the parent company's holdings (a 25 percent holding of the subsidiary's ordinary share capital is deemed as the qualifying minimum), in others on the actual circumstances of the case. The same criteria apply for direct investment by New Zealand companies and residents overseas.
Direct investment flows assume various forms; they may be by remittances of cash, the provision of plant, machinery, or goods without corresponding payments, charging up of services rendered by the parent company, the re-investment in New Zealand of undistributed profits, or the partial remittance only of declared dividends and branch earnings. The inclusion of undistributed profits may require some explanation: the non-remittance abroad of the whole of the current year's earnings, or any portion of them involves, where no statutory constraints exist on remittances of current profits, a decision to invest which is in every respect equal to a decision to bring additional investment capital into the country. By treating, as already mentioned previously, total earnings of subsidiaries and branches of overseas firms in New Zealand as a current account debit or payment to the rest of the world, the unremitted portions of such earnings are treated as an inflow of investment capital which, together with other forms of investment capital (cash, goods, services), make up the total of the private direct investment item in the capital account.
The information tabulated in the following tables is based on an annual survey of companies with overseas affiliations in which the companies report on the distribution of paid-up capital and its changes, dividends and dividend remittances, intercompany accounts with the parent company or affiliated company, and head office accounts in the case of branches.
It should be noted that investment figures given in the following four tables are in terms of annual changes at current prices. The total worth of direct investment assets is extremely difficult to establish in view of the fact that book values may bear little relationship to what such investments would realise on sale; annual changes on the other hand are capable of precise expression, and define exactly their relationship to other capital movements.
Overseas Private Direct Investment in New Zealand—Data on overall private investment in New Zealand are shown in the following table. The figures are totals reflecting investment changes in firms resident in New Zealand and controlled from overseas irrespective of their legal organisation. They include therefore subsidiaries incorporated in New Zealand, companies incorporated in New Zealand which have a majority of shareholders resident overseas or are controlled by overseas residents, and New Zealand branches of overseas companies.
The figures shown in the country or regional area columns refer to the country of incorporation of the New Zealand firm's parent company, head office, or other subsidiary of the parent associate company from which the investment flows, or the New Zealand company owes or is owed on outstanding accounts, or the country of residence of individual shareholders who collectively hold a controlling interest (as defined above) in the New Zealand company.
| Year | United Kingdom | Australia | Other Sterling Countries | U.S.A. and Canada | EEC Countries | Other Countries | Total, All Countries |
|---|---|---|---|---|---|---|---|
*Provisional. †Other Sterling Countries included with Other Countries after 1972-73. | |||||||
| NZ$(million) | |||||||
| 1960-61 | 20.7 | 9.3 | 2.4 | 0.7 | 1.2 | 34.2 | |
| 1965-66 | 22.8 | 25.8 | 15.1 | 1.4 | -2.4 | 62.8 | |
| 1970-71 | 37.0 | 28.2 | 2.5 | 12.9 | 23.7 | 25.7 | 130.0 |
| 1971-72 | -7.2 | 36.0 | 2.1 | 67.6 | -8.0 | 7.0 | 97.5 |
| 1972-73 | 40.7 | 36.7 | 2.4 | 25.4 | 3.0 | 2.0 | 110.2 |
| 1973-74* | 84.2 | 42.2 | † | 54.9 | -2.7 | 3.1 | 181.7 |
The graph now presented shows changes in the overseas direct investment in New Zealand.
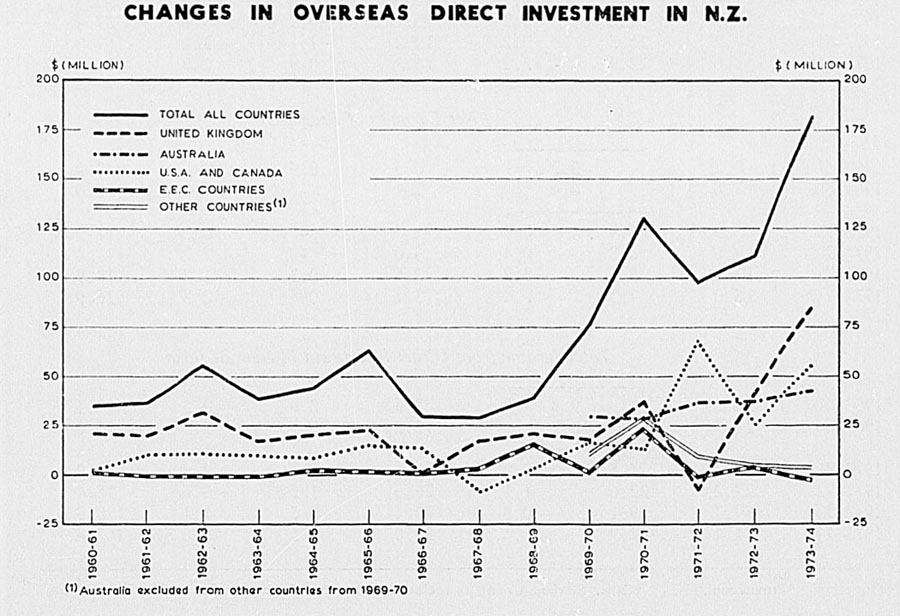
Income from Direct Investment in New Zealand—The following table provides a subdivision of total direct investment income derived by all enterprises controlled from overseas and operating in New Zealand. The investment income is given net (after payment of New Zealand taxation). The regional totals as well as the “All Countries” total correspond to the “Income from Direct Investment” debits shown in the regional current accounts.
| Year | United Kingdom | Australia | Other Sterling† Countries | U.S.A. and Canada | EEC Countries | Other Countries | Total, All Countries |
|---|---|---|---|---|---|---|---|
*Provisional. †Other Sterling Countries included with other Countries after 1972-73. | |||||||
| NZ$(million) | |||||||
| Dividends | |||||||
| 1960-61 | 4.7 | 3.1 | 5.4 | - | 0.2 | 13.4 | |
| 1965-66 | 5.7 | 4.5 | 6.9 | 0.1 | 1.0 | 18.2 | |
| 1970-71 | 12.0 | 6.2 | 0.5 | 4.0 | 0.6 | 1.2 | 24.5 |
| 1971-72 | 9.4 | 7.6 | 0.6 | 8.4 | 1.6 | 2.0 | 29.6 |
| 1972-73 | 10.5 | 10.1 | 0.7 | 7.3 | 2.0 | 3.0 | 33.6 |
| 1973-74* | 13.7 | 12.8 | - | 9.8 | 1.8 | 3.1 | 41.2 |
| Undistributed Earnings | |||||||
| 1960-61 | 6.8 | 3.5 | 2.8 | ... | 0.3 | 13.3 | |
| 1965-66 | 8.0 | 9.9 | 5.2 | 0.4 | 0.3 | 23.8 | |
| 1970-71 | 7.4 | 11.4 | 0.1 | 13.8 | 0.6 | 0.5 | 33.8 |
| 1971-72 | 14.9 | 11.2 | 0.2 | 15.1 | -0.2 | -3.8 | 37.4 |
| 1972-73 | 37.2 | 15.5 | 0.2 | 19.2 | -1.1 | -3.2 | 67.8 |
| 1973-74* | 41.6 | 22.9 | ... | 26.1 | 0.9 | 2.9 | 94.4 |
| Net Earnings of Branches | |||||||
| 1960-61 | 8.7 | 3.2 | 0.5 | 0.9 | - | 13.3 | |
| 1965-66 | 7.6 | 4.4 | 1.1 | - | - | 13.0 | |
| 1970-71 | 5.9 | 3.9 | 0.1 | 1.7 | - | 0.3 | 11.9 |
| 1971-72 | 3.0 | 3.8 | 0.4 | 3.0 | - | 1.2 | 11.4 |
| 1972-73 | 12.0 | 3.6 | -0.2 | 2.6 | -0.3 | 1.2 | 18.9 |
| 1973-74* | 16.0 | 7.3 | ... | 3.1 | 0.8 | -0.3 | 26.9 |
| Total Income from Direct Investment in New Zealand | |||||||
| 1960-61 | 20.2 | 9.8 | 8.6 | 0.9 | 0.5 | 40.1 | |
| 1965-66 | 21.3 | 18.7 | 13.2 | 0.5 | 1.2 | 55.0 | |
| 1970-71 | 25.3 | 21.5 | 0.6 | 19.6 | 1.2 | 2.0 | 70.2 |
| 1971-72 | 27.2 | 22.6 | 1.1 | 26.6 | 1.5 | -0.6 | 78.4 |
| 1972-73 | 59.7 | 29.1 | 0.8 | 29.1 | 0.5 | 1.1 | 120.3 |
| 1973-74* | 71.4 | 42.9 | ... | 39.0 | 3.5 | 5.6 | 162.4 |
Industrial Classification of Overseas Private Direct Investment and Income from Direct Investment in New Zealand—The following table shows details of overseas direct investment and income from overseas direct investment classified by major industry groupings.
| Industry | 1970-71 | 1971-72 | 1972-73 | 1973-74* |
|---|---|---|---|---|
| *Provisional. | ||||
| NZ$(million) | ||||
| Direct Investment | ||||
| Farming, hunting, and fishing | 1.1 | 1.8 | 0.4 | 2.0 |
| Forestry and logging | ||||
| Mining and quarrying | 11.5 | 2.5 | 1.3 | -4.7 |
| Manufacturing— | ||||
| Food, drink, and tobacco | 1.0 | 1.1 | 3.1 | 8.4 |
| Meat and dairy products | 6.3 | -0.2 | 11.8 | 10.1 |
| Textiles, clothing, and footwear | 0.7 | 1.8 | 1.2 | 2.5 |
| Wood, cork, and furniture production | 0.4 | 0.2 | -0.2 | - |
| Pulp, paper, and printing | 4.9 | 4.1 | 11.8 | -0.6 |
| Leather and rubber products | 1.3 | 1.9 | 2.3 | 8.1 |
| Chemical and mineral products | 8.8 | 16.8 | 10.6 | 17.9 |
| Metalworking | 45.2 | 39.0 | -5.5 | 1.0 |
| Engineering and transport equipment | 10.0 | 10.8 | 6.7 | 22.7 |
| Miscellaneous manufacturing | 3.0 | 2.3 | 4.7 | 7.9 |
| Building and construction | 0.3 | 2.5 | 3.0 | 0.8 |
| Electricity, gas, water | ... | ... | ... | ... |
| Wholesale and retail trade | 20.8 | 9.5 | 46.3 | 70.2 |
| Banking, insurance, and ownership of property | 9.5 | 11.3 | 13.7 | 29.0 |
| Transport and communications | 4.3 | -9.7 | -2.2 | 5.2 |
| Services | 0.8 | 1.8 | 1.2 | 1.2 |
| Totals | 130.0 | 97.5 | 110.2 | 181.7 |
| Income from Direct Investment | ||||
| Farming, hunting, and fishing | - | 0.2 | 0.6 | 0.7 |
| Forestry and logging | ||||
| Mining and quarrying | -0.2 | 1.1 | 1.2 | 1.4 |
| Manufacturing— | ||||
| Food, drink, and tobacco | 4.7 | 5.3 | 6.3 | 7.0 |
| Meat and dairy products | 1.7 | -2.5 | 10.2 | 9.9 |
| Textiles, clothing, and footwear | 1.0 | 2.1 | 2.1 | 2.9 |
| Wood, cork, and furniture production | 0.2 | 0.1 | 0.2 | 0.4 |
| Pulp, paper, and printing | 3.3 | 3.6 | 5.4 | 4.9 |
| Leather and rubber products | 1.7 | 1.1 | 2.5 | 2.3 |
| Chemical and mineral products | 8.2 | 11.0 | 13.1 | 15.0 |
| Metalworking | 3.2 | 0.9 | 2.0 | 9.1 |
| Engineering and transport equipment | 10.7 | 11.5 | 14.3 | 20.8 |
| Miscellaneous manufacturing | 4.0 | 3.8 | 6.1 | 8.9 |
| Building and construction | 0.6 | 2.5 | 2.5 | 1.0 |
| Electricity, gas, water | ... | ... | ... | ... |
| Wholesale and retail trade | 21.2 | 25.4 | 36.0 | 45.2 |
| Banking, insurance, and ownership of property | 8.4 | 9.0 | 14.4 | 28.3 |
| Transport and communications | 1.1 | 0.7 | 2.0 | 2.0 |
| Services | 0.4 | 2.6 | 1.4 | 2.6 |
| Totals | 70.3 | 78.4 | 120.3 | 162.4 |
Investment by New Zealand Companies Overseas—The following table presents the converse picture of those immediately preceding, viz, direct investment and income for direct investment by New Zealand companies in their overseas subsidiaries and branches.
| Year | United Kingdom | Australia | Other Sterling Countries | United States and Canada | Other Countries | Total, AH Countries |
|---|---|---|---|---|---|---|
*Provisional. †Other Sterling Countries included with Other Countries after 1972-73. | ||||||
| NZ$(million) | ||||||
| Direct Investment | ||||||
| 1969-70 | -2.2 | 11.0 | -1.1 | 2.0 | 1.3 | 11.0 |
| 1970-71 | -3.1 | 6.2 | 2.6 | 0.7 | 1.4 | 7.8 |
| 1971-72 | 10.9 | 2.1 | -0.1 | -2.8 | 0.6 | 10.7 |
| 1972-73 | -11.9 | 6.6 | 3.4 | 6.6 | -2.0 | 2.7 |
| 1973-74* | 9.0 | 6.9 | † | -0.7 | -1.9 | 13.3 |
| Income from Direct Investment | ||||||
| 1969-70 | 4.6 | 3.2 | 3.2 | - | 0.3 | 11.3 |
| 1970-71 | 5.9 | 1.8 | 5.5 | 0.6 | -0.3 | 13.5 |
| 1971-72 | 7.2 | 2.3 | 2.7 | 0.6 | 0.2 | 13.0 |
| 1972-73 | 5.7 | 1.5 | 2.3 | 0.8 | 0.1 | 10.4 |
| 1973-74* | 3.9 | 6.2 | † | 0.3 | 3.5 | 13.9 |
As a background to economic policy formation, and particularly with regard to planning of industrial development, it is desirable to have an overall view of the pattern and industrial relationships of all parts of the economy. This applies at a national level and also at lower levels of, say, an industry or group of industries, when decisions involving the direction of growth have to be taken.
Such a view can be provided in the first place by input-output tables, resulting from inter-industry studies of the New Zealand economy. These show in matrix form the transactions which took place between industries in the country and what inputs they required in a chosen year to deliver an output of goods and services to final demand users such as households, Government, and export. From these tables of commodity transactions, further tables of co-efficients are computed to show not only the degree of dependence of any one industry directly on other industries and on external producers, but also the indirect requirements of any industry on all others for each unit of its output. The relationships thus established can be held to be reasonably stable for several years in a developed country and also, for major planning purposes, can be up-dated by mathematical procedures which incorporate more recent data which may become available. In this way the tables can be made to serve until completion of a fresh inter-industry study, an undertaking requiring several years of investigation and processing.
One aim of inter-industry studies is to establish a connection between demand for finished products and its implications for production, employment, capacity utilisation, and raw material requirements of industries which may be significantly, even if remotely, involved in meeting this demand.
The input-output tables of the New Zealand economy compiled from the Department of Statistics' Inter-industry Study of the New Zealand Economy 1959-60 were published in 4 parts and depict the productive sector as divided into 110 industries. A description of the industrial classifications is contained in the final volume together with an explanation of the input-output system of analysis.
The next study in the series, the Inter-Industry Study of the New Zealand Economy 1965-66, was severely affected by delays over electronic-data-processing. However, the two volumes containing the input-output tables and descriptive material have now been published.
The Department of Statistics publication Inter-Industry Study of the New Zealand Economy 1965-1966 Part 1 may be used for general guidance to both the 1959-60 and the 1965-66 studies.
It should be noted, however, that because in some cases data were not available from the same source in both years, and for various other technical reasons, conclusions from the latest study regarding shifts in the technological inter-dependence of industries should be made with some caution.
The contributions to net output by the 21 industry groupings as adopted for national development planning are shown in the following table for 1965-66.
| Industry Group | Net Output | Proportion of Total Net Output |
|---|---|---|
| $(m) | Percent | |
| Farming and hunting | 504.3 | 15.0 |
| Pastoral products processing | 104.1 | 3.1 |
| Non-pastoral farm products processing | 17.1 | 0.5 |
| Fuel production | 8.9 | 0.3 |
| Other mining and quarrying | 12.1 | 0.4 |
| Fishing | 3.7 | 0.1 |
| Fishery products processing | 0.3 | - |
| Forestry and logging | 20.3 | 0.6 |
| Forestry products processing | 72.0 | 2.1 |
| Other manufacturing | 502.2 | 15.0 |
| Mineral products processing | 29.3 | 0.9 |
| Fuel products processing | 7.5 | 0.2 |
| Transportation | 200.6 | 6.0 |
| Wholesale and retail trade | 617.4 | 18.4 |
| Fuel and power generation and distribution | 77.4 | 2.3 |
| Building and construction | 253.1 | 7.5 |
| Banking and insurance | 68.8 | 2.0 |
| Ownership of property | 228.0 | 6.8 |
| Services to households | 30.2 | 0.9 |
| Services to government | 284.0 | 8.5 |
| Other service activities | 315.1 | 9.4 |
| Totals | 3,356.3 | 100.0 |
A special article near the back of this Yearbook provides a general introduction to inter-industry studies and input - output analysis.
INDEX OF PRODUCTION—The Index of Production measures the volume of output of all goods and services produced by the economy. Its coverage and concept of net output correspond to the national accounting aggregate of gross domestic product at factor cost.
All industries are represented in the Index of Production in proportion to their net outputs plus depreciation. The index remains weighted on the 1954-55 pattern but the industrial grouping of indicators has been amended to correspond more closely with the revised New Zealand Standard
Industrial Classification by the transfer of Industry 468—Repairs to Motor Vehicles—from the Manufacturing Group to the All Other Industries Group. The amended weighting of the major industry groups for the base year (the 12 months ended 31 March 1955) is as follows.
| Weight (percent) | |
|---|---|
| Farming | 20.7 |
| Forestry and logging | 0.8 |
| Fisheries, etc. | 0.3 |
| Mining and quarrying | 1.0 |
| Manufacturing | 20.2x |
| Electric power and gas | 1.6 |
| Building and construction | 8.2 |
| All other industries | 47.2x |
| 100.0 |
The following analysis of the Index of Production breaks it into industry groups.
| Industrial Group | 1954-55 | 1962-63 | 1963-64 | 1964-65 | 1965-66 | 1966-67 | 1967-68 | 1968-69 | 1969-70 | 1970-71 | 1971-72x | 1972-73* |
|---|---|---|---|---|---|---|---|---|---|---|---|---|
*Provisional. †Decrease. ‡Revised on account of reallocation of Industry 468—Repairs to motor vehicles. | ||||||||||||
| Fanning | 1,000 | 1,338 | 1,369 | 1,397 | 1,494 | 1,543 | 1,592 | 1,627 | 1,597 | 1,267 | 1,683 | 1,656 |
| Forestry and logging | 1,000 | 1,295 | 1,354 | 1,477 | 1,542 | 1,559 | 1,567 | 1,778 | 2,007 | 2,113 | 2,047 | 2,158 |
| Fisheries, etc. | 1,000 | 1,218 | 1,250 | 1,269 | 1,332 | 1,455 | 1,533 | 1,543 | 1,367 | 1,543 | 1,604 | 1,474 |
| Mining and quarrying | 1,000 | 1,290 | 1,364 | 1,418 | 1,550 | 1,661 | 1,460 | 1,450 | 1,566 | 1,746 | 1,978 | 2,332 |
| Manufacturing† | 1,000 | 1,505 | 1,668 | 1,882 | 2,015 | 2,126 | 2,099 | 2,163 | 2,429 | 2,554 | 2,663 | 2,771 |
| Power and gas | 1,000 | 1,832 | 2,015 | 2,204 | 2,427 | 2,581 | 2,660 | 2,781 | 2,943 | 3,146, | 3,534, | 4,003, |
| Building and construction | 1,000 | 1,310 | 1,317 | 1,379 | 1,567 | 1,633 | 1,565 | 1,513 | 1,633 | 1,630 | 1,599 | 1,811 |
| All other industries | 1,000 | 1,280 | 1,361 | 1,421 | 1,477 | 1,529 | 1,503 | 1,535 | 1,603 | 1679x | 1,717 | 1,834 |
| All groups | 1,000 | 1,349 | 1,430 | 1,518 | 1,612 | 1,679 | 1,665 | 1,700 | 1,794 | 1,868 | 1,925 | 2,025 |
| Annual percentage increase in production index | 3.2 | 6.0 | 6.2 | 6.2 | 4.2 | -0.8‡ | 2.1 | 5.5x | 4.1 | 3.1x | 5.2 | |
For the most heavily-weighted group, Services, the increase recorded has been below the All Groups average. Service industries may be said to be of two kinds, those for supplying the needs of final consumers, and those which service industries of all kinds. The volume index for these service industries covers many activities such as wholesale and retail trade, transport, communication, finance, education, and personal services.
INDEX OF EMPLOYMENT—This measures the number of members of the civilian labour force actively employed. It excludes the armed forces and unemployed workers, but includes part-time as well as full-time workers. No allowance is made for any variation in the proportion of full and part-time employment or in average hours worked.
INDEX OF PRODUCTIVITY—The term productivity has a number of meanings according to the statistical concept employed. The most usual concept is that of “ratio of net (unduplicated) real output to real factor (labour, capital) inputs”, whether this is taken at industry level or for all industries combined and therefore at national level. The index expression is merely the ratio of the index of outputs divided by an index of inputs.
The real output of the economy or industry is largely the end result of undifferentiated labour working on or using the undifferentiated capital equipment and natural resources of land. However other influences besides the main factors of production help determine the real output produced from a given combination of resources. For instance, innovations in production processes, managerial interventions and other similar measures can and do increase output without necessarily using additional factor resources.
The purpose of what economists call production functions is to determine, in measurable form, how quantities of resources combined affect real output. Much effort has been put into establishing such relationships, often of a very complex mathematical nature, but with varying degrees of success. Difficulties encountered are connected either with statistical inference or measurement (e.g., the problem of measuring a unit of capital). Because of this, productivity is still being expressed only as the relationship of output per unit of labour input, the latter being a more measurable unit than the other factors influencing output.
The three indexes set out below are equated to base 1954-55 = 1000.
| Production Year | Index of Production | Index of Employment | Index of Production Per Head‡ | Annual Percentage Increase in Production Per Head |
|---|---|---|---|---|
*Provisional. †Decrease. ‡Index of volume of production per member of the labour force. | ||||
| 1954-55 | 1,000 | 1,000 | 1,000 | ... |
| 1955-56 | 1,039 | 1,020 | 1,019 | 1.9 |
| 1956-57 | 1,059 | 1,038 | 1,020 | 0.1 |
| 1957-58 | 1,115 | 1,059 | 1,053 | 3.2 |
| 1958-59 | 1,146 | 1,082 | 1,059 | 0.6 |
| 1959-60 | 1,191 | 1,093 | 1,090 | 2.9 |
| 1960-61 | 1,265 | 1,118 | 1,131 | 3.8 |
| 1961-62 | 1,307 | 1,143 | 1,143 | 1.1 |
| 1962-63 | 1,349 | 1,161 | 1,162 | 1.7 |
| 1963-64 | 1,430 | 1,192 | 1,200 | 3.3 |
| 1964-65 | 1,518 | 1,230 | 1,234 | 2.8 |
| 1965-66 | 1,612 | 1,274 | 1,265 | 2.5 |
| 1966-67 | 1,679 | 1,314 | 1,278 | 1.0 |
| 1967-68 | 1,665 | 1,315 | 1,266 | -0.9† |
| 1968-69 | 1,700 | 1,319 | 1,289 | 1.8 |
| 1969-70 | 1794x | 1,352 | 1,327x | 2.9x |
| 1970-71 | 1,868 | 1,389 | 1,345 | 1.4x |
| 1971-72 | 1925* | 1,407 | 1368x | 1.7* |
| 1972-73 | 2037* | 1,426 | 1428* | 3.8 |
It can be seen that the Production Per Head Index is a little more sensitive to changes in economic tempo than is the Index of Production. Output per head is influenced by changes in all the inputs to production, including materials, capital, management and skills, as well as labour, but at this stage an index has not been developed to permit an assessment of relative contributions of each input to economic growth.
GROSS DOMESTIC PRODUCT IN CONSTANT PRICES—The fact that the Index of Production is a volume index covering the output of all goods and services means that it can be readily modified into an index of real gross domestic product. In New Zealand the most important change is to include the service of defence. The derived index is compared with the Index of Production in the following table.
| Year | Index of Production | Index of Real Gross Domestic Product |
|---|---|---|
| *Provisional. | ||
| 1954-55 | 1,000 | 1,000 |
| 1955-56 | 1,039 | 1,037 |
| 1956-57 | 1,059 | 1,057 |
| 1957-58 | 1,115 | 1,112 |
| 1958-59 | 1,146 | 1,143 |
| 1959-60 | 1,191 | 1,188 |
| 1960-61 | 1,265 | 1,261 |
| 1961-62 | 1,307 | 1,303 |
| 1962-63 | 1,349 | 1,343 |
| 1963-64 | 1,430 | 1,425 |
| 1964-65 | 1,518 | 1,512 |
| 1965-66 | 1,612 | 1,604 |
| 1966-67 | 1,679 | 1,670 |
| 1967-68 | 1,665 | 1,658 |
| 1968-69 | 1,700 | 1,692 |
| 1969-70 | 1794x | 1785x |
| 1970-71 | 1,868 | 1,857 |
| 1971-72 | 1925x | 1913x |
| 1972-73* | 2,025 | 2,012 |
Having obtained an index of real gross domestic product it can be used to obtain gross domestic product and gross national product at constant prices from the original estimates expressed in current price terms. In the table below gross domestic product and gross national product are shown, firstly, in current prices as they appear in the annual estimates of national income and expenditure and, secondly, valued in constant 1954-55 prices. In this case the method used to obtain constant prices is to project the value of the gross domestic product for 1954-55 by the derived index.
| Year | Gross Domestic Product in Current Prices | Gross National Product in Current Prices | Gross Domestic Product at 1954-55 Prices | Gross National Product at 1954-55 Prices |
|---|---|---|---|---|
| *Provisional. | ||||
| $(million) | ||||
| 1954-55 | 1,877 | 1,860 | 1,877 | 1,860 |
| 1955-56 | 1,979 | 1,965 | 1,946 | 1,932 |
| 1956-57 | 2,078 | 2,061 | 1,984 | 1,968 |
| 1957-58 | 2,201 | 2,184 | 2,087 | 2,071 |
| 1958-59 | 2,294 | 2,270 | 2,145 | 2,123 |
| 1959-60 | 2,454 | 2,434 | 2,230 | 2,212 |
| 1960-61 | 2,659 | 2,622 | 2,367 | 2,334 |
| 1961-62 | 2,753 | 2,722 | 2,446 | 2,418 |
| 1962-63 | 2,966 | 2,921 | 2,521 | 2,483 |
| 1963-64 | 3,240 | 3,197 | 2,675 | 2,639 |
| 1964-65 | 3,550 | 3,491 | 2,838 | 2,791 |
| 1965-66 | 3,838 | 3,784 | 3,011 | 2,969 |
| 1966-67 | 3,999 | 3,932 | 3,135 | 3,084 |
| 1967-68 | 4,139 | 4,084 | 3,112 | 3,071 |
| 1968-69 | 4,391 | 4,310 | 3,176 | 3,117 |
| 1969-70x | 4,873x | 4,775x | 3,350x | 3,283x |
| 1970-71x | 5,553 | 5,478 | 3,486 | 3,439 |
| 1971-72 | 6,336 | 6,261 | 3,591 | 3,548x |
| 1972-73* | 7,168 | 7,056 | 3,777 | 3,718 |
When correction is made for price changes in the values of exports and imports of goods and services, gross domestic expenditure may also be expressed in constant prices, as is done in the following table.
| Year | Gross Domestic Product at 1954-55 Prices | Exports of Goods and Services at 1954-55 Prices | Imports of Goods and Services at 1954-55 Prices | Goods and Services Available for Use* at 1954-55 Prices |
|---|---|---|---|---|
*This is also called gross domestic expenditure. †Provisional. | ||||
| $(million) | ||||
| 1954-55 | 1,877 | 507 | 557 | 1,927 |
| 1955-56 | 1,946 | 568 | 583 | 1,961 |
| 1956-57 | 1,984 | 592 | 563 | 1,955 |
| 1957-58 | 2,087 | 596 | 611 | 2,102 |
| 1958-59 | 2,145 | 663 | 549 | 2,031 |
| 1959-60 | 2,230 | 680 | 536 | 2,086 |
| 1960-61 | 2,367 | 658 | 650 | 2,359 |
| 1961-62 | 2,446 | 707 | 655 | 2,394 |
| 1962-63 | 2,521 | 738 | 635 | 2,418 |
| 1963-64 | 2,675 | 783 | 742 | 2,634 |
| 1964-65 | 2,838 | 769 | 776 | 2,845 |
| 1965-66 | 3,011 | 795 | 893 | 3,109 |
| 1966-67 | 3,135 | 832 | 929 | 3,232 |
| 1967-68 | 3,112 | 865 | 781 | 3,028 |
| 1968-69 | 3,176 | 1,002 | 767 | 2,941 |
| 1969-70x | 3,350 | 1,077 | 848 | 3,121 |
| 1970-71 | 3,486 | 1,066 | 979 | 3,399 |
| 1971-72† | 3,591 | 1,126 | 996 | 3,461 |
| 1972-73† | 3,777 | 1,152 | ||
The following table assesses movements caused by changes in the terms of trade, by showing gross domestic product at constant prices corrected for the terms of trade. By making this correction to the gross domestic product at 1954-55 prices, a much better picture can be obtained of the purchasing power, both here and abroad, of the income it represents.
| Year | Gross Domestic Product at 1954-55 Prices | Exports of Goods and Services at 1954-55 Prices | Exports of Goods and Services Corrected for the Terms of Trade | Effective Gross Domestic Product |
|---|---|---|---|---|
| *Provisional. | ||||
| $(million) | ||||
| 1954-55 | 1,877 | 507 | 507 | 1,877 |
| 1955-56 | 1,946 | 568 | 552 | 1,930 |
| 1956-57 | 1,984 | 592 | 563 | 1,955 |
| 1957-58 | 2,087 | 596 | 548 | 2,039 |
| 1958-59 | 2,145 | 663 | 538 | 2,020 |
| 1959-60 | 2,230 | 680 | 639 | 2,189 |
| 1960-61 | 2,367 | 658 | 592 | 2,301 |
| 1961-62 | 2,446 | 707 | 595 | 2,334 |
| 1962-63 | 2,521 | 738 | 646 | 2,429 |
| 1963-64 | 2,675 | 783 | 754 | 2,646 |
| 1964-65 | 2,838 | 769 | 790 | 2,859 |
| 1965-66 | 3,011 | 795 | 788 | 3,004 |
| 1966-67 | 3,135 | 832 | 834 | 3,137 |
| 1967-68 | 3,112 | 865 | 766 | 3,013 |
| 1968-69 | 3,176 | 1,002 | 866 | 3,040 |
| 1969-70x | 3,350 | 1,077 | 948 | 3,221 |
| 1970-71 | 3,486 | 1,066 | 901 | 3,321 |
| 1971-72 | 3,591 | 1,126 | 1,023 | 3,488 |
| 1972-73* | 3,777 | 1,152 | ||
GENERAL—In its long-term economic planning and development of natural resources, the Government is assisted by a Planning Advisory Group and sector councils with wide coverage of economic, social, and cultural life in New Zealand, namely, Agricultural Production Council, Manufacturing Development Council, Forestry Development Council, Mineral Resources Council, Tourist Development Council, Trade Promotion Council, Building Industry Advisory Council, Transport Advisory Council, Distribution Council, National Research Advisory Council, Advisory Council on Educational Planning, Environmental Council, Social Development Council, and Cultural Council.
The objectives of the planning include:
A faster economic growth rate than would otherwise be possible;
Balanced growth in which the aspirations of all main sectors are reconciled with total available resources; and
The linking of economic and non-material objectives.
During the 1950s and 1960s, “key sector” conferences were held on housing and industrial export, and agricultural development*. These conferences reflected a changed attitude regarding the Government's role in growth and development. As a result of the work of the Agricultural Development Conference in particular, medium and long-term projections, were accepted as the basis for planning. Targets were set for agricultural production up to 10 years ahead. Another feature was the formation of continuing machinery after two of the conferences, namely the Trade Promotion Council and the Agricultural Production Council.
The Agricultural Production Council's purpose was to review agricultural sector targets and to advise the Government on how to achieve them. Other sectors became interested in this approach to planning within sectors. Preparations were being made by the end of 1967 for conferences on forestry and tourism to be held in early 1969. One drawback of this type of action was that each sector tended to view its problems and future in isolation. The Government decided therefore to hold a National Development Conference, with plenary sessions in August 1968 and May 1969, to set economic planning on a national basis. The outcome of the conference was the adoption of national and sector growth targets and 631 recommendations. Two-thirds of these recommendations have been implemented.
The National Development Council (NDC) was set up on the recommendation of the National Development Conference, with senior Ministers as chairman and deputy chairman. Members represented a broad range of interest groups. The Council's terms of reference were to review and propose changes where necessary in New Zealand's long-term planning objectives, and the policies necessary to achieve them. Details of the targets for exports and for productivity growth are set out in earlier Yearbooks.
In March 1974 the Government decided that the top committee of Cabinet responsible for establishing policy and priorities should assume the functions which the National Development Council had undertaken since 1969. Individual ministers have become more closely involved in sector planning and each sector council reports primarily to the Minister holding the relevant portfolio. The Ministers report to the Cabinet Committee on Policy and Priorities and this committee invites the chairmen of sector councils and others to participate in its deliberations as appropriate.
The Government's plan is to raise New Zealand's economic performance by promoting growth activities through a more intensive market and technology orientation. Particularly in the agricultural, forestry, and manufacturing sectors.
The planning advisory group and the National Research Advisory Council are studying the broad considerations involved in achieving greater integration between science policy and economic development, the rate at which resources available to science should be expanded, the basis on which Government science resources should be available to the private sector, and the industrial framework for advising Government on the allocation of resources.
Policies are to be developed to cope with an increased pace of change.
*National Housing Conference 1953; Industrial Development Conference 1960; Export Development Conference 1963; Agricultural Development Conference 1963-64.
PRODUCTIVITY CENTRE—A Productivity Centre was established within the Department of Trade and Industry in January 1973 to improve productivity in New Zealand's manufacturing and servicing industries. The work programme of the centre is guided broadly by the Productivity Advisory Council which is made up of representatives of both the Government and private sectors.
The objects of the centre are to stimulate interest in improving productivity, to disseminate and develop productivity measurements and techniques, and to generally encourage a better use of resources. The centre is acting as an extension service to industry and co-operating with other agencies working in this field. Particular attention is being paid to encouraging industry to use specific productivity techniques, and to identifying productivity problem areas in individual companies and industries. Advice and assistance from the wide range of financial, technological, managerial, and other advisory facilities available in the public and private sectors is then channelled to these problem areas.
The centre's programme includes general publicity, financial sponsorship of interfirm comparisons of selected industries, promotion of productivity groups, and productivity research. Close liaison with industry and all organisations interested in productivity is maintained especially through the centre's industry liaison officers in the Auckland, Wellington, and South Island areas.
REGIONAL DEVELOPMENT—Regional development policies are basically concerned with creating balanced growth among the different geographical areas of a country as it develops. These policies assume that the economic and human resources of all the regions of New Zealand must be fully utilised to maximise the quality of life. They are particularly concerned to maintain the social and economic welfare of those regions with lagging growth rates, and to promote an adequate range of good employment opportunities within them.
It is clearly important to ensure that the economic structure of each region remains linked to the mainstream of national economic growth. As manufacturing is a key catalyst of economic development, the Government's regional development policies have so far been based on developing this sector in slow-growth regions, whose economies have been heavily dependent on primary industry. However, it is recognised that regional development must be a total, balanced process, and that needs and techniques will vary region by region.
In June 1973 the Government announced a scheme of regional development financial incentives to industry, administered by the Department of Trade and Industry. One of the first items in the programme, the setting up of regional development councils in priority areas, had already begun with the establishment of the Otago Regional Development Council in May 1973. Eight further councils were established in 1973, for the West Coast, Wanganui, Southland, Northland, Wairarapa, Taranaki, East Coast (North Island), and the King Country. They were aimed at ensuring regional participation in policy implementation, in monitoring development, and in identifying potential growth points. The Department of Trade and Industry directly services areas without a regional development council.
The councils have specific responsibility for promoting, accepting, and making appropriate recommendations on applications from their areas for regional development assistance. These are then processed by the Department of Trade and Industry before going to the Minister of Trade and Industry and the Minister of Finance for final approval. Councils are also encouraged to promote research into the development of their regions.
People with diverse backgrounds such as manufacturers, local body representatives, farmers, university staff, and trade unionists, are selected for their personal abilities to serve on councils. Each council includes one local member of Parliament, while representatives of the Department of Trade and Industry and the Ministry of Works and Development attend as advisers. The active participation of people in the regions themselves is seen as a vital element of the programme.
The Government's measures include interest-free suspensory loans for plant and machinery, and buildings in appropriate cases; assistance with costs of approved training programmes; assistance with employee housing where necessary; assistance with transfer costs of key employees; regional studies assistance grants; and a selective grants scheme for small projects.
The Development Finance Corporation, as part of its statutory role of promoting development of New Zealand industry, takes a sympathetic attitude towards applications for finance for projects in regional development priority areas. The Corporation's team of skilled analysts works in cooperation with the Department of Trade and Industry in the implementation of the regional development programme. The Corporation itself offers a wide range of commercial assistance, including loans and guarantees on loans and bank overdrafts, which can often be combined with regional development incentives to give maximum assistance to desirable projects in priority areas.
Table of Contents
GENERAL—Central Government is concerned with the future of the nation and therefore with the economic, social, and cultural development of the people as a whole and the quality of their environment. In New Zealand the State is fairly broadly concerned in national development and social welfare. The Central Government budgets for and controls expenditure on capital works such as electricity supply, land settlement, housing, public buildings, forest development, railway and road construction, telecommunications, and on other functions such as social security, health, education, defence, and paying interest on the public debt.
Taxing, charging, and borrowing are the three alternative avenues of raising revenue to meet Government expenditure. The problem of choice between these avenues can be described as the choice of the most efficient and equitable way of paying for publicly-provided services. However, the problems of finance and of raising revenue cannot be considered in isolation. In the first place some Government expenditures, such as subsidies and transfer payments (for example, pensions and child benefits), can and do alter the equity of the tax system. For instance, subsidies and monetary benefits can be regarded as refunds of tax. In the second place, it is now generally accepted that a system of raising revenue must be in accord with the general objectives of Government economic policy. In the final analysis any system of Government finance, embracing both expenditure and the raising of revenue, must be designed to achieve the economic objectives of growth, full employment, price stability, and external balance of payments in an efficient manner, tempered by the prevailing views about freedom and the equitable distribution of income.
Central Government, by budgeting for a surplus (revenue exceeding expenditure) or a deficiency, or by varying the impact of taxation or the level of Government expenditure on certain sectors of the economy, now uses these powers to regulate internal economic activity.
The Public Revenues Act 1953 is the governing legislation on the administration of public money.
THE PUBLIC ACCOUNT—This is a single financial account held at the Reserve Bank. The following funds and accounts controlled by the Treasury are included in the Public Account; the Consolidated Revenue Account, Works and Trading Account, Trust Account, Loans Redemption Account, National Development Loans Account, Reserve Fund, and National Roads Fund. The Trust Account represents only lodgements or withdrawals of (mainly) non-Government money. (The Loans Redemption Account is dealt with in the subsection on indebtedness.)
The receipts and payments of the Consolidated Revenue Account over a long period will be found in the Statistical Summary near the end of this volume.
Financial Year—The financial year commences on 1 April and ends on 31 March. The expenditure of public money is authorised by an annual Appropriation Act, which lapses at the end of the financial year. However, the Minister of Finance is authorised to pay money for services for a period of 3 months from the commencement of the next financial year, pending the granting of supplies by Parliament.
GOVERNMENT EXPENDITURE—The following table shows gross Government expenditure and the net amount of expenditure which requires financing from the Public Account. The functional classification is intended to focus attention on the broad areas in the economy in which there is substantial Government activity.
It is to be remembered that the Public Accounts as shown in this section are prepared on a receipts and payments (cash) basis, and consequently the accounts of the operations of various departments (prepared on an accrual basis) shown in other sections will differ to some extent from those appearing here.
The functional classification of Government expenditure is shown in the following table.
| Item | 1971-72 | 1972-73 | 1973-74 | |||
|---|---|---|---|---|---|---|
| Gross | Net* | Gross | Net* | Gross | Net* | |
*Net expenditure is generally arrived at by deducting trading and departmental receipts from gross expenditure. † The reason for net expenditure being greater than gross expenditure is that the increase in imprests outstanding of $10 million for 1973-74 has been included in arriving at net expenditure. | ||||||
| Administration— | $(million) | |||||
| General administration | 62.0 | 57.1 | 68.4 | 61.6 | 85.0 | 78.1 |
| Law and order | 44.6 | 32.2 | 54.6 | 39.8 | 63.3 | 46.3 |
| Government services | 65.0 | 37.9 | 52.7 | 40.2 | 60.6 | 47.1 |
| Miscellaneous services | 13.9 | 3.4 | 15.0 | 4.2 | 17.7 | 5.1 |
| Stabilisation | 28.7 | 28.7 | 43.5 | 43.5 | 120.1 | 120.1 |
| Foreign Relations— | ||||||
| Defence | 121.2 | 118.8 | 129.8 | 128.1 | 140.5 | 138.7 |
| Foreign Affairs | 18.7 | 15.4 | 28.2 | 27.3 | 38.5 | 37.7 |
| 139.9 | 134.2 | 158.0 | 155.4 | 179.0 | 176.4 | |
| Development of Industry— | ||||||
| Land use | 175.4 | 102.9 | 193.4 | 100.0 | 194.3 | 74.7 |
| Fuel and power | 124.0 | 10.2 | 156.5 | 30.0 | 165.6 | 31.5 |
| Other industrial services | 38.8 | 33.1 | 42.2 | 38.7 | 48.1 | 43.7 |
| 338.2 | 146.2 | 392.1 | 168.7 | 408.0 | 149.9 | |
| Education— | ||||||
| Education | 337.8 | 335.0 | 379.4 | 376.8 | 442.7 | 440.2 |
| Social Services— | ||||||
| Social welfare | 378.2 | 375.6 | 509.5 | 506.0 | 621.0 | 616.2 |
| Other social services | 20.5 | 16.3 | 24.1 | 21.3 | 34.7 | 30.6 |
| 398.7 | 391.9 | 533.6 | 527.3 | 655.7 | 646.8 | |
| Health— | ||||||
| Health | 292.9 | 291.8 | 343.8 | 343.1 | 401.9 | 401.1 |
| Transport and Communications— | ||||||
| Transport | 262.3 | 128.4 | 308.6 | 157.6 | 321.6 | 144.3 |
| Communications | 180.3 | 16.0 | 203.8 | 25.5 | 235.2 | 24.4 |
| 442.6 | 144.4 | 512.4 | 183.1 | 556.8 | 168.7 | |
| Debt Services and Miscellaneous— | ||||||
| Debt services | 168.0 | 168.0 | 186.5 | 186.5 | 201.9 | 201.9 |
| Miscellaneous investment transactions | 97.9 | 91.5 | 96.6 | 89.1 | 143.0† | 151.5† |
| 265.9 | 259.5 | 283.1 | 275.6 | 344.9 | 353.4 | |
| Totals | 2,430.2 | 1,862.3 | 2,836.6 | 2,219.3 | 3,335.7 | 2,633.2 |
The following table shows financing of Government expenditure.
| Item | 1971-72 | 1972-73 | 1973-74 |
|---|---|---|---|
*Net expenditure. † Excludes Treasury bills issued and redeemed of $318.4 million in 1971-72 and $598.0 million in 1972-73 and $478.1 million in 1973-74. ‡ Includes $10 million deposited with trading banks in 1970-71; $20 million in 1971-72, which was repaid in 1972-73. §Includes the purchase of Government securities from the Reserve Bank of $40.3 million in 1971-72, and $12.2 million in 1972-73, and the sale of Government securities to the Reserve Bank of $131.1 million in 1973-74. ¶ Excludes supplier's credit and currency realignments adjustments. | |||
| Expenditure— | $(million) | ||
| Administration | 159.3 | 189.3 | 296.7 |
| Foreign relations | 134.2 | 155.4 | 176.4 |
| Development of industry | 146.2 | 168.7 | 149.9 |
| Education | 335.0 | 376.8 | 440.2 |
| Social services | 391.9 | 527.3 | 646.8 |
| Health | 291.8 | 343.1 | 401.1 |
| Transport and communications | 144.4 | 183.1 | 168.7 |
| Debt services and miscellaneous investment transactions | 259.5 | 275.6 | 353.4 |
| Total expenditure | 1,862.3 | 2,219.3 | 2,633.2 |
| Financed from— | |||
| Taxation— | |||
| Income tax | 1,161.1 | 1,314.5 | 1,697.9 |
| Customs, sales tax, and beer duty | 337.5 | 381.4 | 452.2 |
| Highways tax | 98.7 | 95.7 | 103.2 |
| Other taxation | 118.6 | 135.0 | 141.5 |
| Total taxation | 1,706.9 | 1,926.6 | 2,394.8 |
| Interest, Profits, and Miscellaneous Receipts | 83.1 | 86.7 | Dr.3.3 |
| Total taxation, interest, etc. | 1,790.0 | 2,013.3 | 2,391.5 |
| Amount to be financed from borrowing | 72.3 | 206.0 | 241.7 |
| Borrowing in New Zealand | 218.3 | 658.4 | 460.9§ |
| Less repayments in New Zealand | 118.7§ | 340.0§ | 130.1 |
| 99.6† | 318.4† | 330.8† | |
| Plus sales (less purchase) of investments. | -14.0‡ | +20.5‡ | -67.9 |
| Net borrowing in New Zealand | 85.6 | 338.9 | 262.9 |
| Internal surplus (+) deficit (-) | +13.3 | +132.9 | +21.2 |
| Borrowing overseas¶ | 106.6 | 29.5 | 1.5 |
| Less repayment overseas | 53.9 | 100.7 | 66.6 |
| +52.7 | -71.2 | -65.1 | |
| Less purchase of overseas investments | -69.0 | -48.3 | +50.9 |
| Net borrowing overseas | -16.3 | -119.5 | -14.2 |
| Purchase of gold, etc. (I.M.F.) (A.D.B.). | - | - | - |
| Cash surplus (+) deficit (-) | -3.0 | +13.4 | +7.0 |
REVENUE AND EXPENDITURE—Tables are now given to show receipts and payments of the Consolidated Revenue Account.
By including the receipts of both the Consolidated Revenue Account and the National Roads Fund the following table shows the total receipts of direct and indirect taxation during the latest five years.
| Item | Year Ended 31 March | ||||
|---|---|---|---|---|---|
| 1970 | 1971 | 1972 | 1973 | 1974 | |
| *Provisional. | |||||
| $(million) | |||||
| Direct taxation— | |||||
| Income and social security income tax | 779.2 | 957.3 | 1,161.1 | 1,314.5 | 1,697.9 |
| Estate and gift duty | 26.3 | 29.3 | 25.0 | 28.6 | 33.8 |
| Land tax | 2.9 | 3.0 | 3.8 | 3.4 | 3.3 |
| Property speculation tax | - | - | - | - | 0.2 |
| Total—Direct taxation | 808.4 | 989.6 | 1,189.9 | 1,346.5 | 1,735.2 |
| Indirect taxation— | |||||
| Customs duty | 115.5 | 138.9 | 157.3 | 168.3 | 201.2 |
| Beer duty | 37.3 | 39.7 | 40.7 | 41.9 | 44.7 |
| Sales tax | 97.6 | 125.3 | 139.5 | 171.1 | 206.4 |
| Racing duty | 12.1 | 13.2 | 15.6 | 16.5 | 19.2 |
| Stamp and other duties | 11.5 | 13.4 | 14.2 | 19.9 | 29.4 |
| Motor spirits duty | 3.5 | 3.9 | - | - | - |
| Highways taxation | 78.8 | 82.0 | 89.7 | 95.7 | 103.2 |
| Payroll tax | - | 20.5 | 40.8 | 46.3 | 33.5 |
| Other taxation | 16.4 | 18.5 | 19.2 | 20.3 | 22.0 |
| Total—Indirect taxation | 372.6 | 455.4 | 517.0 | 580.2 | 659.6 |
| Total—Taxation receipts | 1,181.0 | 1,445.0 | 1,706.9 | 1,926.6 | 2,394.8 |
| Interest— | |||||
| On capital liability— | |||||
| Electric supply | 34.7 | 36.3 | 38.3 | 41.4 | 45.2 |
| Post Office | 12.2 | 12.9 | 14.7 | 15.5 | 16.7 |
| Other | 36.8 | 41.0 | 44.0 | 49.1 | 53.1 |
| On other public moneys | 6.2 | 7.5 | 9.4 | 13.0 | 12.5 |
| Total—Interest | 89.9 | 97.7 | 106.4 | 119.0 | 127.5 |
| Profits from trading undertakings | 9.7 | 16.1 | 15.4 | 22.3 | 16.0 |
| Departmental receipts | 64.4 | 71.2 | 80.2 | 66.5 | 74.5 |
| Special receipts | 17.1 | 19.0 | 3.3 | 98.2 | 2.5 |
| Total—Other | 181.3 | 204.0 | 205.3 | 306.0 | 220.5 |
| Total—Receipts | 1,362.2 | 1,649.0 | 1,912.2 | 2,226.5 | 2,615.3 |
| Total taxation as percentage of national income | 29.3% | 31.2% | 31.7% | 31.7% | 33.0% |
The following table shows expenditure from the Consolidated Revenue Account.
| Item | Year Ended 31 March | |||
|---|---|---|---|---|
| 1971 | 1972 | 1973 | 1974 | |
*Includes Reserve Bank compensation for depreciation of bank's investments. † Former Vote Marine now classified under Agriculture and Fisheries, and Transport. ‡ Excludes Expenditure on Developmental Roading now funded from Works and Trading Account. | ||||
| Permanent appropriations— | $(000) | |||
| Under Special Acts of Legislature— | ||||
| Civil List | 906 | 990 | 1,128 | 1,560 |
| Debt services— | ||||
| Interest | 153,019 | 166,808 | 184,817 | 200,323 |
| Transfer to Loans Redemption Account— | ||||
| New Zealand Loans Act 1953— | ||||
| Section 59 | 42,253 | 37,397 | 38,398 | 41,516 |
| Section 57 (c) | 7,747 | 12,603 | 11,602 | 8,484 |
| Administration and management | 1,114 | 1,200 | 1,689 | 1,601 |
| Total—Debt services | 204,133 | 218,008 | 236,506 | 251,924 |
| Special Acts— | ||||
| Superannuation Act 1956 | 22,925 | 20,182 | 19,155 | 18,879 |
| Miscellaneous | 3,250 | 6,370 | 7,527 | 8,058 |
| Total—Special Acts | 26,175 | 26,552 | 26,682 | 26,937 |
| Total—Permanent appropriations | 231,213 | 245,551 | 264,316 | 280,421 |
| Annual Appropriations— | ||||
| Administration— | ||||
| General Administration— | ||||
| Vote— | ||||
| Accident Compensation | - | - | - | 20 |
| Audit | 943 | 1,122 | 1,346 | 1,576 |
| Broadcasting | 22 | 23 | 28 | 41 |
| Customs | 3,546 | 4,631 | 5,094 | 6,009 |
| Inland Revenue | 8,306 | 10,117 | 11,324 | 13,193 |
| Internal Affairs | 9,817 | 11,613 | 11,576 | 17,234 |
| Legislative | 1,208 | 1,472 | 1,628 | 2,068 |
| Prime Minister's Department | 66 | 84 | 137 | 227 |
| State Advances Corporation | 6 | 8 | 15 | 18 |
| State Services Commission | 931 | 1,039 | 6,153 | 9,374 |
| Statistics | 1,799 | 3,586 | 3,286 | 4,518 |
| Treasury | 2,587 | 2,643 | 3,041 | 3,291 |
| Valuation | 2,157 | 2,801 | 2,970 | 3,514 |
| Total—General administration | 31,388 | 39,139 | 46,598 | 61,083 |
| Law and order— | ||||
| Vote— | ||||
| Crown Law | 225 | 264 | 302 | 357 |
| Justice | 13,308 | 16,306 | 21,185 | 23,820 |
| Police | 18,811 | 23,139 | 26,249 | 32,288 |
| Security Intelligence Service | 374 | 434 | 504 | 628 |
| Total—Law and order | 32,718 | 40,843 | 48,239 | 57,093 |
| Government services— | ||||
| Vote— | ||||
| Government Printing Office | 9,109 | 9,353 | 9,587 | 11,668 |
| Works | 46,754 | 54,044 | 39,814 | 32,483 |
| Total—Government services | 55,863 | 63,396 | 49,402 | 44,151 |
| Stabilisation— | ||||
| Vote— | ||||
| Stabilisation | 21,408 | 28,700 | 36,195 | 112,185 |
| Total—Administration | 141,377 | 171,378 | 180,433 | 274,512 |
| Foreign relations— | ||||
| Defence— | ||||
| Defence | 109,075 | 121,169 | 129,823 | 140,511 |
| Foreign affairs— | ||||
| Foreign affairs | 15,181 | 18,038 | 22,494 | 32,454 |
| Total—Foreign relations | 124,256 | 139,207 | 152,317 | 172,965 |
| Development of industry— | ||||
| Land use— | ||||
| Agriculture | 54,480 | 88,663 | 96,999 | 78,272 |
| Forest Service | 9,772 | 4,122 | 4,946 | 5,746 |
| Lands and Survey | 7,638 | 7,041 | 8,898 | 10,364 |
| Total—Land use | 71,890 | 99,826 | 110,843 | 94,382 |
| Fuel and power— | ||||
| Energy Resources | - | - | - | 170 |
| Mines | 1,210 | 1,751 | 1,745 | 1,168 |
| 1,210 | 1,751 | 1,745 | 1,338 | |
| Other industrial services— | ||||
| Trade and Industry | 5,352 | 5,526 | 7,079 | 9,780 |
| Labour | 6,343 | 7,853 | 9,938 | 9,928 |
| Scientific and Industrial Research | 13,204 | 13,872 | 16,154 | 18,924 |
| Tourist and Publicity | 6,815 | 7,565 | 7,197 | 7,553 |
| Total—Other industrial services | 31,714 | 34,816 | 40,368 | 46,185 |
| Total—Development of industry | 104,814 | 136,393 | 152,956 | 141,905 |
| Education— | ||||
| Education | 251,917 | 319,250 | 379,353 | 442,660 |
| Social services— | ||||
| Social Welfare | 339,415 | 378,210 | 509,535 | 621,003 |
| Maori and Island Affairs | 9,234 | 9,954 | 11,026 | 11,919 |
| Internal Affairs | - | - | - | 1,979 |
| Total—Social services | 348,649 | 388,164 | 520,561 | 634,901 |
| Health— | ||||
| Health | 241,951 | 288,800 | 339,575 | 399,044 |
| Transport and communications— | ||||
| Transport— | ||||
| Marine | 4,108 | 4,602 | 5,336 | † |
| Roads, etc. | 2,066 | 2,359 | 5,390 | 700‡ |
| Transport | 20,159 | 23,001 | 29,441 | 36,651 |
| Total—Transport | 26,333 | 29,962 | 40,168 | 37,351 |
| Total—Annual appropriations | 1,239,297 | 1,473,154 | 1,765,363 | 2,103,338 |
| Adjustment on currency realignment | - | 194 | 12,857 | 14,369 |
| Unauthorised expenditure | 303 | 159 | 3,393 | 5,971 |
| Defence credits and other special entries | 19,039 | 3,271 | 95,097* | 95,680* |
| Additional contribution to Loans Redemption Account | 45,000 | 60.000 | - | 10,000 |
| Transfer to National Development Loans Account | 15,000 | - | - | - |
| Transfer to Reserve Fund | 11,000 | 20,000 | - | - |
| Transfer to Works and Trading Account | - | 10,000 | - | - |
| Provision for Supplementary Estimates | - | - | - | - |
| Total Payments | 1,560,852 | 1,812,329 | 2,141,026 | 2,509,779 |
NATIONAL DEVELOPMENT LOANS ACCOUNT—Particulars of receipts and payments of the National Development Loans Account were as follows.
| Item | 1970-71 | 1971-72 | 1972-73 | 1973-74 |
|---|---|---|---|---|
| *Including half interest in petroleum mining licence for Maui Field. | ||||
| Receipts | $(thousand) | |||
| Stock issued | 216,524 | 261,665 | 291,434 | 370,837 |
| Advance subscriptions | 2,386 | - | - | - |
| International Monetary Fund— | ||||
| Allocation of Special Drawing Rights | 19,298 | 19,118 | - | - |
| Securities issued to Asian Development Bank— | ||||
| Non-negotiable non-interest-bearing notes | 1,007 | - | 1,209 | 1,142 |
| Securities issued to I.M.F.— | ||||
| Non-negotiable non-interest-bearing notes | 29,730 | - | - | - |
| Securities issued to IBRD— | ||||
| Non-negotiable non-interest-bearing notes | - | 394 | - | - |
| Transfer from Consolidated Revenue Account | 15,000 | - | - | - |
| Totals | 283,945 | 281,177 | 292,643 | 371,979 |
| Payments | ||||
| Charges and expenses on raising and repaying loans | 519 | 2,246 | 846 | - |
| Transfer to Works and Trading Account— | ||||
| Public Works | 52,500 | 53,600 | 65,000 | 85,000 |
| Electric supply | 47,500 | 54,000 | 78,500 | 86,500 |
| Land settlement | 10,750 | 9,100 | - | - |
| State Coal Mines | - | 1,000 | - | - |
| Working Railways | 2,365 | 10,444 | 23,724 | 13,514 |
| Capital equipment credit arrangements | 5,403 | 14,265 | 13,309 | 4,426 |
| Advances to— | ||||
| Post Office | 31,400 | 12,900 | 23,000 | 21,000 |
| New Zealand National Airways Corporation | - | 1,000 | 325 | 1,500 |
| New Zealand Steel Ltd. | - | - | - | - |
| State Advances Corporation | 61,000 | 75,000 | 85,000 | 63,000 |
| Development Finance Corporation | - | 2,900 | 100 | 18,750 |
| Tourist Hotel Corporation | 1,000 | 1,000 | 355 | 3,087 |
| New Zealand Broadcasting Corporation | - | 1,000 | - | - |
| Natural Gas Corporation | 3,165 | 1,764 | 1,700 | 1,769 |
| Offshore Mining Company Ltd. | - | - | - | 1,174 |
| Shipping Corporation of New Zealand Ltd. | - | - | - | 2,159 |
| Calls on shares in Shipping Corporation of New Zealand Ltd. | - | - | - | 7,710 |
| Acquisition of shares in New Zealand Steel Ltd. | - | 4,832 | 1,000 | - |
| Acquisition of shares in Air New Zealand Ltd. | - | 10,400 | 7,000 | - |
| Acquisition of shares in Development Finance Corporation | - | - | - | 4,825 |
| Acquisition of shares in Offshore Mining Company Ltd.* | - | - | - | 30,000 |
| Acquisition of shares in Tasman Pulp and Paper Company Ltd. | - | - | - | 7,920 |
| Calls on shares in New Zealand Wool Topmaking | ||||
| Investigating Co. Ltd. | 62 | - | - | - |
| Holding of I.M.F. Special Drawing Rights transferred | ||||
| to Reserve Bank | 19,298 | 19,118 | - | - |
| Further subscription to I.M.F. | 10,449 | - | - | - |
| Further security in favour of I.M.F. | 29,730 | - | - | - |
| Encashment of securities in favour of I.M.F. | 90 | - | - | - |
| Encashment of securities in favour of Asian Development Bank | 20 | - | 300 | 350 |
| Currency subscription to Asian Development Bank | 1,007 | - | 820 | 766 |
| Security in favour of Asian Development Bank | 1,007 | - | 1,209 | 1,142 |
| Further subscription to IBRD | - | 42 | - | - |
| Further security in favour of IBRD | - | 394 | - | - |
| Encashment of securities IBRD | - | - | - 20 | 20 |
| Advance subscriptions from previous year allocated | 2,040 | 2,385 | - | - |
| Totals | 279,305 | 277,390 | 302,209 | 354,612 |
| Balances at end of year | 53,749 | 57,537 | 47,970 | 65,337 |
WORKS AND TRADING ACCOUNT—The Works and Trading Account receipts and payments are shown in the following table.
| Receipts | 1971-72 | 1972-73 5(000) | 1973-74 |
|---|---|---|---|
| Administration — | $(000) | $(000) | $(000) |
| General Administration— | |||
| Works | 1,856 | 2,129 | 2,380 |
| Government Services— | |||
| Works | - | - | 711 |
| Development of Industry— | |||
| Land Use— | |||
| Forest Service | 26,717 | 30,007 | 40,795 |
| Lands and Survey | 27,597 | 39,764 | 50,500 |
| Maori and Island Affairs | 11,619 | 15,576 | 17,587 |
| Fuel and Power— | |||
| Electric Supply | 100,139 | 111,090 | 116,613 |
| Mines | 11,954 | 13,482 | 16,170 |
| Health— | |||
| Health | - | - | 1 |
| Social Services— | |||
| Works | 2,861 | 1,437 | 2,064 |
| Transport and Communications— | |||
| Transport— | |||
| Railways | 123,444 | 137,852 | 153,753 |
| Transport | 185 | 57 | 4 |
| Works | 14 | 50 | 67 |
| 306,387 | 351,445 | 400,645 | |
| Contributions from National Development Loans Account— | |||
| Electric Supply | 54,000 | 78,500 | 86,500 |
| Land Settlement | 9,100 | - | - |
| Public Works | 53,600 | 65,000 | 85,000 |
| Railways | 10,444 | 23,724 | 13,514 |
| State Coal Mines | 1,000 | - | - |
| 128,144 | 167,224 | 185,014 | |
| Capital equipment credit arrangements— | |||
| Electric supply | 3,946 | 10,391 | 4,426 |
| Railways | 10,319 | 2,918 | - |
| 14,265 | 13,308 | 4,426 | |
| 142,409 | 180,533 | 189,440 | |
| Contributions from Consolidated Revenue Account— | |||
| From vote “Mines”: For losses in State Coal Mines | 1,352 | 1,275 | 450 |
| From vote Stabilisation: For losses in Railways | - | - | 11,700 |
| Transfer from Consolidated Revenue Account | 10,000 | - | - |
| Excess of payments over receipts | 5,678 | - | - |
| 465,825 | 533,253 | 602,235 | |
| Balances at beginning of year— | |||
| Cash | 1,135 | 770 | 7,273 |
| Investments | 4,987 | 86 | 85 |
| Imprests outstanding | 1,408 | 997 | 3,141 |
| 7,530 | 1,852 | 10,499 | |
| Excess of receipts over payments | 8,647 | 1,550 | |
| Total | 7,530 | 10,499 | 12,049 |
| Payments | 1971-72 | 1972-73 | 1973-74 |
|---|---|---|---|
*Included in amounts of $12,926,000 and $20,710,000 are $837,000 and $986,000 respectively, being interest on capital liability paid to Consolidated Revenue Account. † Public buildings construction. ‡ 1971-72 account included $18,543,000 for university and technical institute buildings, now provided for from Consolidated Revenue Account (Vote Education). | |||
| Annual Appropriations— | |||
| Administration— | $(000) | $(000) | $(000) |
| General Administration— | |||
| Works (Construction of Public Buildings) | 18,702 | 28,841 | 12,842 |
| Law and Order— | |||
| Justice | - | - | 3,103 |
| Police | - | - | 1,945 |
| Government Services— | |||
| Works | - | - | 12,964 |
| Development of Industry— | |||
| Land Use— | |||
| Agriculture and Fisheries | - | - | 1,779 |
| Forest Service | 37,278 | 43,829 | 52,016 |
| Lands and Survey | 23,415 | 22,124 | 26,331 |
| Maori and Island Affairs | 10,943 | 13,313 | 16,734 |
| Fuel and Power | |||
| Electric Supply | 107,200 | 139,350 | 147,348 |
| Mines | 14,231 | 14,274 | 15,593 |
| Other Industrial Services— | |||
| Scientific and Industrial Research† | - | - | 1,898 |
| Foreign Relations— | |||
| Foreign Affairs† | - | - | 6,000 |
| Health— | |||
| Health† | - | - | 2,836 |
| Social Services— | |||
| Works (Programme VIII—Construction of Housing) | 10,984 | 12,926* | 20,710* |
| Transport and Communications— | |||
| Transport— | |||
| Railways | 131,242 | 149,550 | 166,063 |
| Transport | 5,602 | 6,246 | 4,691 |
| Works—Construction of Railways | 4,445 | 6,674 | 7,530 |
| Works—Developmental Roading | - | - | 2,000 |
| 382,586 | 437,129 | 502,383 | |
| Contributions to Superannuation scheme | 3,818 | 5,224 | 5,552 |
| Interest on capital liability paid to Consolidated Revenue Account— | |||
| Electric Supply | 38,331 | 41,369 | 45,166 |
| Land Settlement | 10,981 | 11,563 | 11,173 |
| Railways | 2,398 | 2,657 | 2,518 |
| 51,710 | 55,590 | 58,857 | |
| Contributions to Loans Redemption Account for redemption of securities | 10,487 | 11,016 | 26,318 |
| Capital equipment purchased under credit arrangements | 14,265 | 13,308 | 4,426 |
| Land acquired other than under annual votes | 2,711 | 1,977 | 2,722 |
| Miscellaneous expenditure | 218 | 352 | 428 |
| Unauthorised expenditure | 31 | 10 | - |
| Excess of receipts over payments | - | 8,647 | 1,549 |
| 465,825‡ | 533,253 | 602,235 | |
| Excess of payments over receipts | 5,678 | - | - |
| Balances at end of year— | |||
| Cash | 770 | 7,273 | 10,487 |
| Investments | 86 | 86 | 90 |
| Imprests outstanding | 997 | 3,141 | 1,472 |
| 1,852 | 10,499 | 12,049 | |
| Totals | 7,530 | 10,499 | 12,049 |
Works Programme—Details of the works programme expenditure by special categories are shown in the following table. (Roading is included).
| Item | Year ended 31 March | |||
|---|---|---|---|---|
| 1971 | 1972 | 1973 | 1974 | |
*Forestry planting programme is no longer included in Works programme. † Previously included in Education buildings. | ||||
| Administration— | $(million) | |||
| Works— | ||||
| National water and soil conservation | 7.3 | 7.6 | 9.2 | 10.5 |
| Public building maintenance | 3.3 | 3.1 | 3.3 | 3.2 |
| Irrigation and water supplies | 1.1 | 1.6 | 2.1 | 2.4 |
| Public Buildings— | ||||
| Government services | 2.9 | 3.6 | 6.6 | 7.4 |
| Law and order | 2.8 | 3.5 | 5.3 | 5.1 |
| Miscellaneous | 3.7 | 2.6 | 3.3 | 3.8 |
| Totals | 21.1 | 22.0 | 29.8 | 32.4 |
| Foreign relations— | ||||
| Defence | 6.4 | 5.2 | 6.2 | 7.5 |
| Public buildings—overseas posts | 0.1 | 0.7 | 5.6 | 6.7 |
| Totals | 6.5 | 5.9 | 11.8 | 14.2 |
| Development of industry— | ||||
| Forestry | 17.3 | 3.3* | 4.2* | 5.7* |
| Land utilisation | 5.1 | 4.0 | 2.7 | 3.7 |
| Electricity | 74.0 | 79.8 | 103.9 | 99.0 |
| Tourism | 1.5 | 1.5 | 0.4 | 0.4 |
| Miscellaneous | 1.2 | 1.9 | 2.7 | 4.6 |
| Totals | 99.1 | 90.5 | 113.9 | 113.4 |
| Education— | ||||
| Primary, secondary and special education— | ||||
| Buildings | 28.0 | 30.7 | 37.1 | 43.6 |
| Maintenance | 6.2 | 6.9 | 7.3 | 8.8 |
| Tertiary education— | ||||
| University buildings | 11.3 | 14.6 | 20.0 | 18.6 |
| Technical institutes | 4.2 | 4.0 | 3.7 | 2.5 |
| Teachers' Colleges | 2.3 | 2.9 | 2.8 | 3.8 |
| Totals | 52.0 | 59.1 | 70.9 | 77.3 |
| Social services— | ||||
| Housing construction | 13.3 | 11.0 | 10.6 | 18.2 |
| Public buildings—child welfare† | - | † | 1.1 | 1.3 |
| 13.3 | 11.0 | 11.7 | 19.5 | |
| Health— | ||||
| Health and hospital buildings | 3.9 | 4.7 | 4.4 | 2.3 |
| Transport and communications— | ||||
| Railways | 9.9 | 9.2 | 11.1 | 15.1 |
| Roading | 87.8 | 90.5 | 104.1 | 101.5 |
| Air transport | 5.3 | 6.3 | 8.1 | 6.8 |
| Post Office | 27.3 | 27.2 | 33.0 | 36.9 |
| Broadcasting | 1.9 | 1.9 | 1.6 | 1.0 |
| Totals | 132.2 | 135.1 | 157.9 | 161.3 |
| Grand Totals | 328.1 | 328.3 | 400.4 | 420.4 |
NATIONAL ROADS FUND—The National Roads Act 1953 established a National Roads Fund within the Public Account, the revenue of the Fund being derived mainly from motor taxation together with an annual contribution from the Consolidated Revenue Account. Expenditure from the Fund is for the purpose of developing State highways to modern standards and of subsidising the roading programmes of local authorities.
Receipts and payments of the National Roads Fund were as follows.
| Item | 1969-70 | 1970-71 | 1971-72 | 1973-74 |
|---|---|---|---|---|
| $(thousand) | ||||
| Receipts | ||||
| Motor spirits duty | 66,866 | 73,135 | 78,608 | 85,411 |
| Mileage tax and fees | 15,090 | 16,532 | 17,098 | 17,755 |
| Contribution from Consolidated Revenue Account | 10 | 10 | 3,000 | 700 |
| Miscellaneous | 813 | 1,865 | 906 | 1,585 |
| Interest | 78 | 67 | 92 | 97 |
| Totals | 82,858 | 91,609 | 99,704 | 105,548 |
| Payments | ||||
| State highways maintenance | 14,057 | 14,396 | 15,725 | 16,745 |
| State highways construction | 31,219 | 32,838 | 38,029 | 35,973 |
| Local authorities' subsidised works | 33,211 | 33,790 | 39,388 | 39,343 |
| Administration and general expenses | 7,240 | 7,073 | 8,570 | 7,458 |
| Unauthorised expenditure | 6 | 6 | 9 | 3 |
| Totals | 85,733 | 88,103 | 101,722 | 99,522 |
| Balance at end of year | 788 | 4,294 | 2,276 | 8,301 |
SUMMARY OF BALANCES—A summary of the balances in the Public Accounts is given in the following table.
| Account | Balance at 31 March | |||
|---|---|---|---|---|
| 1971 | 1972 | 1973 | 1974 | |
| *Cash received but not yet allocated. | ||||
| $(thousand) | ||||
| Consolidated Revenue Account | 42,867 | 51,219 | 45,988 | 48,374 |
| Works and Trading Account | 7,530 | 1,852 | 10,499 | 12,049 |
| Loans Redemption Account | 53,807 | 96,510 | 144,537 | 140,935 |
| National Development Loans Account | 53,749 | 57,537 | 47,970 | 65,337 |
| National Roads Fund | 788 | 4,294 | 2,276 | 8,301 |
| Reserve Fund | 59,231 | 84,771 | 95,282 | 92,125 |
| Suspense Account* | 265 | 304 | 100 | 369 |
| Trust Account | 25,676 | 27,391 | 18,422 | 31,638 |
| Totals | 243,913 | 323,878 | 365,075 | 399,128 |
The composition of the total balances is shown in the following table.
| Nature | At 31 March | |||
|---|---|---|---|---|
| 1971 | 1972 | 1973 | 1974 | |
| $(thousand) | ||||
| Cash | 72,913 | 69,865 | 83,236 | 90,225 |
| Imprests | 13.247 | 13,280 | 13,235 | 23,290 |
| Investments in New Zealand | 40,468 | 54,467 | 33,971 | 101,834 |
| Investments overseas | 117,285 | 186,266 | 234.632 | 183,779 |
| Totals | 243,913 | 323,878 | 365,075 | 399,128 |
TOTAL TAXATION—A summary of taxation revenue during the last 11 March years is given in the following table.
| Year Ended 31 March | Direct Taxes on Income (i.e., Income Tax and Social Security Taxation on Income) | Total Taxation | |||
|---|---|---|---|---|---|
| Amount | Percentage of Total Taxation (All Sources) | Amount | |||
| Total | Per Head of Mean Population | Total | Total | All Other Industries | |
| $(million) | $(million) | ||||
| 1964 | 466.5 | 182.90 | 62.8 | 742.3 | 291.10 |
| 1965 | 547.7 | 210.55 | 64.8 | 844.5 | 324.65 |
| 1966 | 606.0 | 228.92 | 66.0 | 918.2 | 346.86 |
| 1967 | 664.4 | 246.56 | 67.2 | 988.9 | 366.98 |
| 1968 | 672.8 | 245.98 | 66.4 | 1,012.7 | 370.25 |
| 1969 | 691.5 | 250.54 | 65.3 | 1,058.6 | 383.54 |
| 1970 | 779.2 | 278.98 | 66.0 | 1,181.3 | 422.93 |
| 1971 | 957.3 | 337.47 | 66.2 | 1,445.3 | 509.51 |
| 1972 | 1,161.1 | 403.67 | 68.0 | 1,707.2 | 593.54 |
| 1973 | 1,314.5 | 448.27 | 68.2 | 1,926.9 | 657.11 |
| 1974 | 1,697.9 | 566.84 | 70.9 | 2,395.1 | 799.58 |
The following table shows receipts, under the various heads, of taxation during the latest 5 years.
| Item | Revenue for Year Ended 31 March | ||||
|---|---|---|---|---|---|
| 1970 | 1971 | 1972 | 1973 | 1974 | |
*At 1 cent per gal; excludes 2.3 cents per gallon paid to National Roads Fund. † Included in National Roads Fund. ‡ As from 1 April 1969 a single income tax replaced “ordinary income tax” and “social security income tax”. | |||||
| Consolidated Revenue Account— | $(million) | ||||
| Customs revenue | 115.5 | 138.9 | 157.3 | 168.3 | 201.2 |
| Beer duty | 37.3 | 39.7 | 40.7 | 41.9 | 44.7 |
| Motor spirits duty less refunds | 3.5* | 3.9* | † | † | † |
| Motor vehicles fees and charge | 15.7 | 17.9 | 18.9 | 20.0 | 21.6 |
| Sales tax | 97.6 | 125.3 | 139.5 | 171.1 | 206.4 |
| Film-hire tax | 0.3 | 0.4 | 0.3 | 0.4 | 0.4 |
| Mileage tax | 0.4 | 0.2 | † | † | † |
| Estate and gift duties | 26.3 | 29.3 | 25.0 | 28.6 | 33.8 |
| Duty on instruments | 8.8 | 10.7 | 11.3 | 16.4 | 25.8 |
| Racing taxation | 12.1 | 13.2 | 15.7 | 16.5 | 19.3 |
| Payroll tax | - | 20.5 | 40.8 | 46.3 | 33.5 |
| Other taxation | 2.9 | 3.0 | 3.2 | 3.7 | 4.1 |
| Land tax | 2.9 | 3.1 | 3.8 | 3.4 | 3.3 |
| Income tax‡ | 779.2 | 957.3 | 1,161.1 | 1,314.5 | 1,697.9 |
| National Roads Fund— | |||||
| Highways revenue (less rebate) | 78.8 | 82.0 | 89.7 | 95.7 | 103.2 |
| Totals | 1,181.3 | 1,445.3 | 1,707.2 | 1,926.9 | 2,395.1 |
The sources of revenue are shown in the following diagrams.
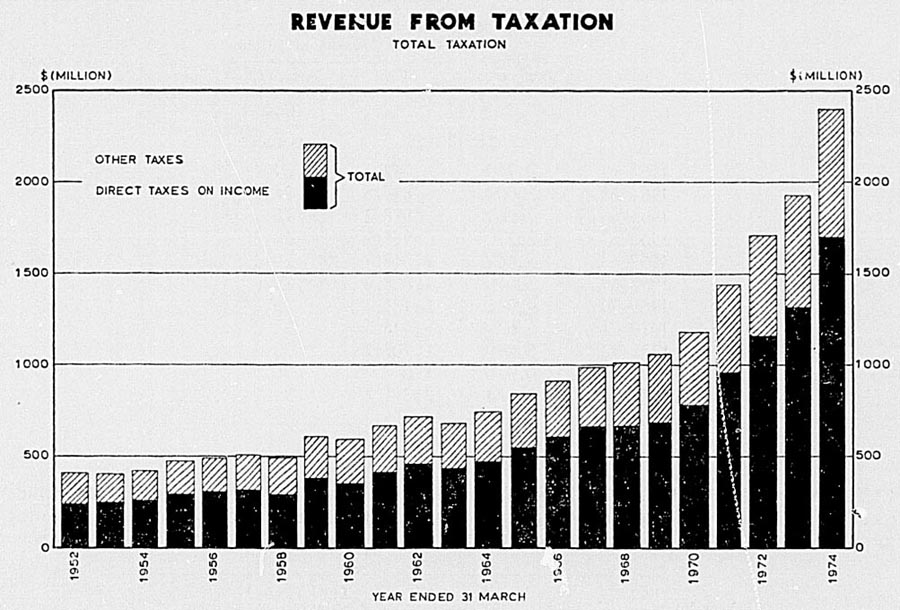
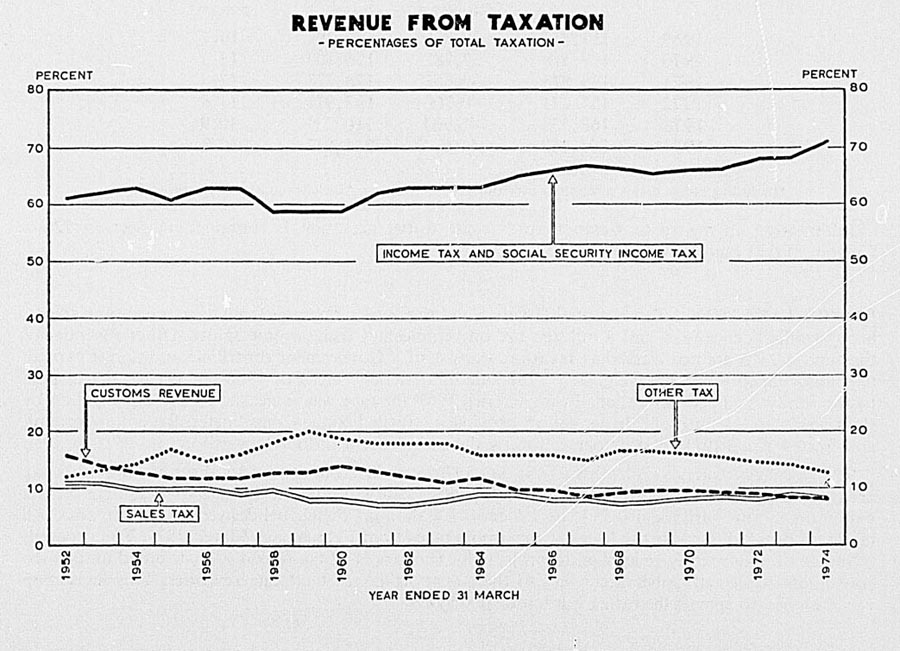
A comparison of taxation revenue and total private income and national income is afforded by the following table, which also shows taxation as a percentage of private income and national income.
| Year | National Income at Factor Cost | Central Government Taxation | |
|---|---|---|---|
| Total Revenue | Percentage of National Income | ||
| *Provisional. | |||
| $(million) | percent | ||
| 1963-64 | 2,742 | 742.3 | 27.1 |
| 1964-65 | 3,002 | 844.5 | 28.1 |
| 1965-66 | 3,261 | 918.2 | 28.2 |
| 1966-67 | 3,370 | 988.9 | 29.3 |
| 1967-68 | 3,467 | 1,012.7 | 29.2 |
| 1968-69 | 3,650 | 1,058.6 | 29.0 |
| 1969-70 | 4,041 | 1,181.3 | 29.2 |
| 1970-71 | 4,629 | 1,445.3 | 31.2 |
| 1971-72 | 5,449 | 1,707.2 | 31.3 |
| 1972-73 | 6,320 | 1,926.9 | 30.5 |
| 1973-74* | 7,521 | 2,395.1 | 31.8 |
CUSTOMS AND EXCISE TAXATION—Revenue under the headings of Customs does not include receipts from tyre tax and from motor spirits tax paid into the National Roads Fund. The following table shows customs and excise revenue, for ordinary revenue purposes, for the latest six years.
| Year Ended 31 March | Customs Duties* | Beer Duty | Total Customs and Excise Duties† | Proportion of Total Taxation |
|---|---|---|---|---|
*Including excise duties other than beer duty. †Includes gross motor spirits duty. | ||||
| $(thousand) | percent | |||
| 1969 | 119,373 | 35,826 | 155,199 | 14.7 |
| 1970 | 119,518 | 37,282 | 156,800 | 13.3 |
| 1971 | 138,875 | 39,653 | 178,528 | 12.4 |
| 1972 | 157,274 | 40,700 | 197,974 | 11.6 |
| 1973 | 168,338 | 41,901 | 210,239 | 10.9 |
| 1974* | 201,163 | 44,674 | 245,837 | 10.3 |
Information in regard to Customs and excise duties generally is contained in Section 22D—Customs Tariff and Revenue.
ROADS TAXATION—The National Roads Fund derives its revenues from a tax on motor spirits, heavy traffic licence fees, and a mileage tax on vehicles not using motor spirits. Other revenues of the fund, which are not classed as taxation, consist of a Government contribution, interest earned, and miscellaneous receipts—e.g., from the sale of materials, etc. For 1968-69, tax on petrol paid to the fund was 14.8c per gallon. From 1 April 1969 the rate was increased to 17.1c per gallon by the transfer to the fund of 2.3c per gallon previously credited to the Consolidated Revenue Account, and from 1 April 1971 to 18.1c per gallon by the transfer of a further 1c a gallon.
The Local Authorities (Petroleum Tax) Act 1970 authorised territorial local authorities in 21 tax areas covering the country to levy a local authorities petroleum tax at the rate of 1, 2, or 3 cents a gallon on motor spirits and 0.5, 1, or 1.5 cents a gallon on diesel fuel delivered in a tax area. All tax areas decided to make the levies at maximum rates from February or March 1971. The proceeds of any tax imposed may be applied to projects for the benefit of the region or distributed among the constituent local authorities according to their proportions of total rate revenues. This legislation was designed to spread the rating burden of taxpayers.
Taxation receipts for roads purposes have been as follows during the latest six years, excluding rebates.
| Year Ended 31 March | Petrol Tax | Mileage Tax | Fees | Total |
|---|---|---|---|---|
| $(000) | ||||
| 1969 | 53,601 | 3,604 | 9,120 | 66,325 |
| 1970 | 64,992 | 3,899 | 9,987x | 78,878x |
| 1971 | 66,866 | 4,858 | 10,232 | 81,957 |
| 1972 | 73,135 | 5,996 | 10,536 | 89,667 |
| 1973 | 78,608 | 5,782 | 11,265 | 95,655x |
| 1974 | 85,411 | 5,797 | 11,958 | 103,166 |
INCOME TAX—Income tax is levied under the Land and Income Tax Act 1954, the Income Tax Assessment Act 1957, and amendments.
Exemptions—Certain specified incomes and types of income are exempt from income tax. The incomes of local and public authorities (except for certain Government trading departments), building societies (with the exception of rental income), co-operative dairy and milk treatment companies, trustees of superannuation funds (subject to certain investment requirements), friendly societies, charitable societies, and others of similar character are exempt from income tax. The general principle is, when a society or association carries on business exclusively for the purpose for which it was established and does not operate for the private pecuniary profit of any individual, the income is exempt from income tax. Monetary benefits from the Consolidated Revenue Account (except the universal superannuation benefit), sick benefits from friendly societies, workers' compensation payments, war pensions, and for individuals the first $100 of income from interest are exempt from income tax. (For additional interest exemptions see in Tax Savings; “New Zealand Savings Certificates”, “Post Office National Development Bonds”, and “Savings Incentives”.)
Pay as You Earn Income Tax—Payment of income tax is on a “pay as you earn” basis. It applies to all taxpayers including companies.
The main features of the scheme are:
Income tax on salary and wages is deducted by the employer. In the main, taxpayers whose income consists solely of salary and wages are required to furnish a return of income only when their income during the year exceeds $2,600. However, they may furnish a return if they wish to have an adjustment made. In such cases the taxpayer is assessed on the basis of the annual return and receives a refund when tax assessed is less than the tax deducted by the employer.
All other individuals (including self-employed, except for certain classes of farmers), estates, and companies pay provisional tax in two instalments on a provisional declaration of the current year's income. The income of the previous year is commonly used as a basis for computing the provisional tax. Farmers in some circumstances may pay in three instalments. There is an adjustment at the end of the year when the return of income is furnished.
Tax Code Declarations—Employees are required to deliver a tax code declaration to the employer each year before 1 April. The tax code declaration specifies whether or not the taxpayer has a dependent wife or is entitled to claim the housekeeper rebate.
There is no obligation on the employer to check the accuracy of the tax code declaration. Except for cases when the employee ends and commences employment in the same week, the employee must not have more than one tax code declaration current during the pay period. However, there is provision for secondary tax code declarations when the employee has two or more employers at the same time.
At the end of the year or on the termination of employment the employer completes the tax code certificate by entering the amount of wages and salary paid and the amount of tax deductions made, amount of employees' superannuation contributions, number of shifts worked, and qualifying hours of overtime, hands one copy to the employee, and sends the other copy to the Commissioner.
In considering the incidence of income tax in New Zealand as illustrated by the next table it should be noted that under the provisions of the Social Security Act a family benefit of $156 a year is paid usually to the mother, for every child under 16 years of age irrespective of the income of the parents or the child. The allowance may continue to be paid up to age 18 years if the child is still attending school full time.
Amounts paid by an employee to a superannuation fund are deducted from the gross salary for the period: the income subject to P.A.Y.E. is the income after deduction of superannuation payments.
When there is no tax code declaration or special tax code certificate, the tax deduction is at the “no declaration” rate shown in the tax deduction tables. This deduction is at flat rate of not less than 25c in the dollar.
Special Tables—Special tables are provided for shearers and for casual agricultural employees. These are tables of deductions from daily earnings.
There are also tables of deductions at the flat rate of 19c and 21c in $1. These apply to payments of extra emoluments and to secondary employment unless a special tax code certificate is issued by the Commissioner. Extra emoluments, e.g., end of year bonuses and retrospective wage increases, are treated as separate payments and taxed at 21c in the $1. Secondary employment exists when the taxpayer has two or more employers at the same time. The secondary employer deducts tax according to the flat rate table of 19c in the $1, while the principal employer uses the normal table.
Employer's Duties—The employer is required to keep a record for each employee showing the amounts of net payments, superannuation, tax deductions, hours of overtime, and number of shifts worked. Not later than 20 April each year he must deliver to each employee a signed tax deduction certificate showing this information for the year (or period of employment if less than one year). A similar certificate must be given to the employee within seven days from the cessation of employment.
The aggregate amount of all tax deductions is to be remitted to the Commissioner each month. Not later than 15 May each year the employer must deliver to the Commissioner a reconciliation statement showing the total amount of tax deductions paid to the Commissioner in respect of deductions made during the year, and the total amount of tax deductions shown in the certificates for employees. The reconciliation statement is accompanied by signed copies of all tax deduction certificates.
Withholding Payments—These are payments for services rendered, but in circumstances where there is no real employer-employee relationship. Examples are company directors' fees, agricultural contract work, fees for free-lance journalists. Tax is deducted from the gross amounts of such payments at flat rates which vary from 7 1/2c to 25c in the dollar according to the nature of the work.
Provisional Taxpayers—Provisional taxpayers are those who derive any assessable income which is not subject to tax at source. However, the first $100 (or up to $300 under the savings incentives schemes) of interest is exempted from income tax, and is therefore not assessable income Estates, trusts, and companies are also provisional taxpayers.
Tax on provisional incomes is normally payable in two instalments during the year, by 7 September and 7 March. However, for companies the due dates are governed by the companies' balance dates. Normally the provisional income is an amount equal to the taxpayer's income for the preceding year. When the taxpayer anticipates that the income will be less than that of the preceding year, he may make an estimate of the provisional income and pay provisional tax on the estimated income. The taxpayer may estimate or re-estimate his provisional income at any time before the date for payment of any provisional tax instalment. If he does this and his estimated provisional income is less than the normal provisional income (actual income of the previous year) and less than 80 percent of his actual income for the year, he may be liable to a penalty of 10 percent on the amount of provisional tax underpaid.
Alteration of Tax Code Declaration During Year—When the employee changes employment during the year, he must deliver a declaration to the new employer. If the declaration is delivered before the end of the first pay period, it applies from and including the first pay.
Employees who become entitled to claim allowances for new dependants during the year may deliver a new tax code declaration immediately the event occurs (e.g., marriage). The new tax code applies to the pay period commencing after the pay period in which the declaration was delivered.
When it becomes apparent that a dependent wife's income will exceed $688 for the year, the employee must immediately deliver a new tax code declaration omitting the wife as a dependant. The new code applies to the pay period following that in which it was delivered.
In other cases when a dependant ceases to be a dependant during the year—e.g., when a dependent wife dies—the employee is entitled to retain the tax code including them as dependants until the following 31 March. This applies even when the employee delivers a new code declaration on a change of employment.
Tax Deduction Tables: Principal Tables—The tax code declaration bears a code (M if the taxpayer is entitled to a wife rebate or housekeeper rebate where applicable; S if not so entitled): the tax deduction tables specify for each code the amount of tax to be deducted from the salary or wage payment for the period.
The amounts of tax shown in the tables are calculated as follows:
The weekly income is converted to an annual basis and income tax computed. After deduction of any applicable rebates it is then divided by 52 to arrive at the weekly rate.
Fortnightly, three-weekly, four-weekly, and monthly tables of deductions are based on multiples of the basic weekly tables.
PAYE Tax Deductions—The tax rates for the purposes of PAYE tax deductions at source are the amounts shown in the tax deduction tables. These deductions are fixed according to the current amount of rebates and tax rates. Some examples of these tax deductions are given for selected weekly incomes in the table which follows.
| Weekly Earnings | Not Entitled to Wife's Rebate | Entitled to Wife's Rebate |
|---|---|---|
| Operative from 1 April 1974 | ||
| $ | $ | $ |
| 10 | - | - |
| 12 | - | - |
| 14 | 0.13 | - |
| 16 | 0.50 | - |
| 18 | 0.87 | - |
| 20 | 1.25 | - |
| 22 | 1.63 | - |
| 24 | 2.01 | - |
| 26 | 2.39 | - |
| 28 | 2.77 | 0.36 |
| 30 | 3.15 | 0.74 |
| 32 | 3.53 | 1.12 |
| 34 | 3.91 | 1.50 |
| 36 | 4.29 | 1.88 |
| 38 | 4.67 | 2.26 |
| 40 | 5.10 | 2.70 |
| 50 | 7.43 | 5.02 |
| 60 | 10.12 | 7.72 |
| 70 | 13.07 | 10.66 |
| 80 | 16.35 | 13.94 |
| 90 | 19.85 | 17.44 |
| 100 | 23.56 | 21.16 |
Employees who, in addition to their income from employment, derive interest (after $100 or up to $300 under the savings incentive schemes exemption) dividends, or rents, not exceeding $200 in the aggregate, are not required to pay provisional tax on this income which has not been taxed at source.
Provisional taxpayers are required to furnish returns of income, irrespective of the amount of income. The Commissioner then makes an assessment of terminal tax. Any difference between that assessment and the amount paid as provisional tax is either payable by the taxpayer or, if an overpayment, refunded to him.
Farmers who satisfy the Commissioner that they regularly derive more than half their income from an agricultural business and that more than half their gross cash income is derived after 7 February, and whose balance date falls between 1 April and 30 September, may pay provisional tax in three instalments.
Statistics relating to the incidence of income tax are given in Section 28 of this Yearbook.
Taxation of Individuals:Rates—The rates of income tax increase in steps ranging from a minimum of 18 percent on the first $500 of taxable income to a maximum of 50 percent of taxable income in excess of $12,000. The following table shows the rate of income tax for each step of taxable income from 1 April 1974.
| Taxable Income | Tax on Each Dollar |
|---|---|
| $ $ | cents |
| Up to 500 | 18 |
| 501-1,000 | 18.5 |
| 1,001-2,000 | 19 |
| 2,001-2,500 | 22.5 |
| 2,501-3,000 | 26.5 |
| 3,001-3,500 | 28.5 |
| 3,501-4,000 | 32 |
| 4,001-4,500 | 34.5 |
| 4,501-5,000 | 36 |
| 5,001-5,500 | 39 |
| 5,501- 6,000 | 41.5 |
| 6,001- 6,500 | 44.5 |
| 6,501- 7,000 | 46 |
| 7,001- 8,000 | 47 |
| 8,001- 9,000 | 48 |
| 9,001-10,000 | 48.5 |
| 10,001-11,000 | 49 |
| 11,001-12,000 | 49.5 |
| Over 12,000 | 50 |
Dividends—Dividends received by individual shareholders are included as part of their assessable income and assessed in the same manner as other income. A rebate of up to 10 percent of the taxable dividends is allowed when the taxable income including dividends is $4,000 or less. It abates $1 for every $10 of additional taxable income to disappear at $8,000. When profits from the realisation by a company of capital assets are distributed in cash, the amount of such profits may be exempted.
Special Exemptions and Rebates from 1 April 1974—In determining the taxable income of individuals certain special exemptions and rebates are deductible from the taxpayer's assessable income. A new system of allowing tax rebates against the actual tax assessed instead of allowing special exemptions from the assessable income was introduced as from 1 April 1974. Rebates available are—personal, wife, husband, housekeeper, dependent relative. Special exemptions are retained for charitable donations, private school fees, life insurance premiums, superannuation contributions. These are as follows:
Rebates:Personal Rebate—A rebate of $125 is allowable as a deduction from the tax assessed on the assessable income of every taxpayer, except for non-resident taxpayers.
Wife Rebate—A rebate of $125 is allowable as a deduction from the tax assessed on a married man's assessable income. This rebate applies only when the taxpayer supports his wife during the income year. It is reduced 40c for each $1 of the wife's income in excess of $375 up to $688, so that the taxpayer receives no rebate when the wife's income exceeds $688.
Dependent Relative Rebate—A rebate of the amount contributed towards the support of a dependent relative of the taxpayer is also allowable. The rebate here is to be a maximum of $60 or 40c for every dollar where the amount contributed is less than $150. Where more than one taxpayer contributes towards the support of the same dependent relative, the rebate is apportioned between them. The rebate is also allowable in the case of amounts paid towards the support of a separated or divorced wife.
Housekeeper Rebate—A rebate equal to the wife rebate or 40c for every dollar of the amount of wages paid, whichever is the less, is allowable in respect of payments made to a woman or a day nursery, playcentre, creche, or kindergarten to care for a widowed, divorced, separated, or unmarried taxpayer's child under the age of 18 years, or any child who by reason of mental or physical infirmity is unable to earn a living. The rebate is also allowed to a working wife who pays a woman or a day nursery, playcentre, creche, or kindergarten to care for a child while she works, and to a taxpayer employing a housekeeper to look after the taxpayer's home because of the mental or physical infirmity of the taxpayer or his spouse.
Hardship Relief For Divorced or Separated Parents Supporting Children—When a taxpayer is a divorced or separated person and has a child dependent upon him in any income year he may be allowed a rebate of up to $60 for each child, not exceeding three. The taxpayer does not get this concession if he is entitled to a dependent relative rebate for the child nor does he qualify if the child lives with him for a substantial part of the year.
Special Rebates—In addition to the above rebates there are additional rebates which apply in some circumstances. These include rebates for overtime, shift work, back pay.
Special Exemptions:Donations and School Fees—A special exemption is allowable for cash donations for qualifying religious and charitable purposes and for tuition fees incurred in sending a child of the taxpayer to a registered private school or a special school for handicapped children provided that in each case the school is not run for private pecuniary profit. The maximum exemption under this heading is $200.
Insurance and Superannuation—A special exemption is allowed for premiums paid in respect of policies of life insurance, sickness and accident insurance on the life of the taxpayer and his wife and children, and for contributions to the New Zealand Superannuation Scheme or other approved superannuation schemes.
No special exemption is allowed for premiums on any policy which has been assigned or mortgaged as a security for money borrowed and invested in or loaned to certain property syndicates formed after 3 September 1971.
The exemption which will be allowable for each of the next few years, on the basis of the present legislation, is shown in the following table.
| GENERAL OVERALL LIMIT ON SUPERANNUATION, LIFE INSURANCE, AND OTHER QUALIFYING PAYMENTS | |||
|---|---|---|---|
| Year | Category 1Persons in employment in relevant year who were also members of a subsidised superannuation scheme at 30 May 1974 | Category 2Persons in employment in relevant year who were not also members of a subsidised superannuation scheme at 30 May 1974 | Category 3Other individuals |
| $ | $ | $ | |
| 1976 | 800 | 1,000 | 1,000 |
| 1977 | 900 | 1,000 | 1,000 |
| 1978 and subsequent years | 1,000 | 1,000 | 1,000 |
In some circumstances an exemption in excess of the limit in the foregoing table may be claimed. These are shown in the next table and example.
| Category 1 | Category 2 | Category 3 |
|---|---|---|
NOTES— (X) An “approved pension fund” means the New Zealand Superannuation Scheme or an approved alternative scheme. (Y) “Compulsory contributions” for employees not exempted are the amounts which must be paid to an “approved pension fund” up to a maximum of— 1% of taxable remuneration for the year ended 31 March 1976, 2% for the 1977 year, then 2 1/2%, 3% and 3 1/2% for 1978, 1979 and 1980 and thereafter 4%. (Z) The “amount allowable for qualifying commitments” means the amount paid in the relevant year in respect of binding commitments at 30 May 1974 under life policies or non-subsidised superannuation, but limited to the amount allowed for those same commitments in the income year ended 31 March 1975. EXAMPLE—Assume taxable remunerations of $15,000 for the year ended 31 March 1976, $16,000 for the year ended 31 March 1977, and $20,000 for the year ended 31 March 1980, and that for each of those years life insurance premiums of $900 had been paid in respect of policies taken out prior to 30 May 1974. For 1975/76 the special exemption would be $1,050 ($900 plus 1 percent of $15,000), for 1976/77 it would be $1,220 ($900 plus 2 percent of $16,000), and for 1979/80 it would be $1,600 ($900 plus 3 1/2 percent of $20,000). | ||
| When the amount paid as “compulsory contributions” to an “approved pension fund” in the relevant year alone exceeds the general limit—see notes (X) and (Y) below. | When the total of—(i) the amount paid as “compulsory contributions” to an “approved pension fund” in the relevant year, and (ii) the “amount allowable for qualifying commitments” in that year exceeds the general limit—see notes (X) (Y) and (Z) below—the total may be claimed. | No circumstances—however see under deductions for self-employed taxpayers. |
Deductions for Self-employed—In addition to the special exemption already described a deduction will be allowed to a person in business in respect of contributions to an approved pension fund up to the lesser of:
the “specified amount” of $200 for the year ended 31 March 1976 increasing by annual steps of $200 for the year ending on 31 March 1980 and subsequent years, or
the amount of his income from business in the relevant year.
If the overall contributions to the pension fund exceed the amount allowable as a deduction the excess can qualify as a special exemption within the limits already mentioned.
If there is still a balance of contributions that balance can be treated as a contribution for deduction (but not for special exemption) purposes in the next year. However the amount carried forward in this way is not to be greater than the amount by which the specified amount in paragraph (a) exceeds the amount of the business income in the relevant year.
Taxable Income—In the case of individuals, income tax is assessed on the taxable income. This comprises total income less expenses less (a) any income exempted from income tax and, (b) the amount of the special exemptions to which the taxpayer is entitled. Rebates are deducted from the actual tax assessed.
A summary of the changes in the principal special exemptions and in the rates of ordinary income tax for the last 6 years is given in the following table.
| Income Year Ended 31 March | Special Exemption | Ordinary Income Tax | |||||||
|---|---|---|---|---|---|---|---|---|---|
| Personal | Wife | Child | Charitable Donations and School Fees* | Insurance and Superannuation | Basic Rates Introduced | Rebates | |||
| Member of Subsidised Scheme* | Others* | Rate | Maximum | ||||||
*Maximum. †$140 for each child in excess of four. ‡Upon amalgamation of income tax and social security tax. §For 1975 as mentioned above rebates replaced special exemptions. | |||||||||
| % | |||||||||
| 1970 | 275‡ | 240‡ | 135†‡ | 100 | 500 | 650 | 1,969 | - | - |
| 1971 | 275 | 275 | 135† | 100 | 700 | 950 | 1,969 | - | - |
| 1972 | 275 | 275 | 135† | 100 | 700 | 950 | 1,970 | - | - |
| 1973 | 275 | 275 | 35 | 200 | 700 | 950 | 1,970 | 7 1/2 | - |
| 1974 | 275 | 275 | - | 200 | 700 | 950 | 1,970 | 10 | - |
| 1975 | § | § | - | 200 | 700 | 950 | 1,974 | - | - |
Taxation of Companies:Rates—The rates of income tax as at 31 March 1974 are as follows:
Resident Companies and Public Authorities—The rate of income tax for every dollar of taxable income in the case of companies and public authorities is:
When the taxable income does not exceed $6,250, 20c increased by 0.002 of $1 for every dollar of taxable income;
When the taxable income exceeds $6,250, tax on the first $6,250 is calculated as given above and there is a flat rate tax of 45c for every dollar of income in excess of $6,250.
Non-resident Companies—(a) When the taxable income does not exceed $6,250, the rate of income tax for every dollar of taxable income is 25c, increased by 0.002 of $1 for every dollar of taxable income.
(b) When the taxable income exceeds $6,250, tax on the first $6,250 is calculated as in (a) above and tax on the excess is charged at a flat rate of 50c in the dollar.
Bonus Issue Tax—Bonus share issues are generally subject to a flat rate tax of 17 1/2c in the dollar which is payable by the company making the bonus share issue. Bonus issues arising from capitalisations of capital profits, share premium reserves, and the writing up of capital assets are exempt.
All companies which are, or are deemed to be, resident in New Zealand are liable for the bonus issue tax on bonus share issues they make. The sole exception is a petroleum mining company.
Excess Retention Tax—Excess retention tax is assessed to “privately controlled investment companies” if the amount of dividends paid is less than 40 percent of the income after taxation. The basic rate of excess retention tax is 35c in the dollar of the insufficient distribution of income.
Grouping of Companies—Two or more companies which are two-thirds commonly owned in terms of paid-up capital, or nominal value of allotted shares, or voting power, or entitlement to profits, constitute a “group” of companies. The assessable incomes of companies included in a group are aggregated for the purpose of determining the rate of income tax. Provision exists for offsetting losses incurred by companies within a group and for the making of subvention payments. A tax credit is also available to qualifying minority shareholders for a proportion of the additional tax paid by the company consequent on the application of the grouping provisions.
Non-resident Investment Companies—Special provisions exist to limit the income tax payable by a non-resident investment company on income derived from investments or assets which are used wholly or principally in projects which are of importance in the development of New Zealand.
Unit Trusts—Unit trusts are treated as companies, and income and other payments to unit holders are treated as dividends.
Charitable Gifts By Public Companies—These companies are allowed a deduction for charitable gifts subject to a limit of $1,000 to any one donee and overall to 5 percent of the company's assessable income. The definition of public companies includes any company (other than a private company), any private company which is controlled by any such company or companies, and any local or public authority.
Taxation of Trusts—Trusts created after 18 July 1968, with the exception of trusts created by will or intestacy, or other specific cases such as trusts created by Court order and statutory trusts such as the Official Assignee as trustee for creditors, are subject to a minimum rate of income tax of 35 percent on income classified as trustee's income.
The trustee of a trust other than a specified trust is entitled to a special exemption of $100 and is subject to a rate of tax calculated by reference to the trustee's income at the rate for individuals.
Deductions of Expenditure From Total Income—Any expenditure or loss necessarily incurred in carrying on a business for the purpose of gaining or producing assessable income may be deducted.
As from 1 April 1974 salary and wage earners will be allowed a standard deduction of 2 percent of their salary and wages or $50 whichever is the lower.
No deduction is allowed for expenditure which is of a capital nature or of a private or domestic nature.
Depreciation—As from 1 April 1975 a system of single first-year depreciation was introduced. This replaced the incentives such as special, additional, supplementary depreciation, and investment allowance. In the second and subsequent years ordinary depreciation on the usual basis will continue to be allowed.
The first year depreciation allowance will be available for plant and machinery at the following rates—
| Percent | |
| New plant and machinery: | |
| Auckland and Wellington metropolitan areas | 40 |
| Elsewhere | 60 |
| Secondhand plant and machinery: | |
| Auckland and Wellington metropolitan areas | 30 |
| Elsewhere | 50 |
Certain classes of buildings also have an increased first-year allowance.
Ordinary Depreciation—On buildings the allowable ordinary depreciation rates vary from 2 1/4 percent of cost price for wooden-walled and framed buildings to 1 percent of cost price for buildings of reinforced concrete. There are higher rates for certain buildings, such as cool stores, chemical works, glasshouses, etc. Various rates of depreciation have been fixed by the Commissioner of Inland Revenue for different classes of plant, machinery, and equipment. These are normally expressed as percentages of the diminishing value of the asset.
Tax Incentives—A number of taxation incentives designed to encourage investment in productive activities are available to industrial and agricultural enterprises. These incentives include:
Livestock Value—A farmer's livestock is treated as trading stock. Apart from the usual valuation options for trading stock used in a business, farmers are permitted to use a “standard value” for each class of livestock, thus reducing in some degree fluctuations in income which might occur if market prices or other valuations were used. The standard value system is universally used except for high-value stud stock. The value adopted for any particular class of animal is usually somewhat below actual cost and also usually below sale value. The disposal of all or a substantial part of a farmer's livestock may result in an unduly high income for the year. The tax law provides special measures to alleviate the tax burden if that happens in the following circumstances: (1) death of the farmer, (2) retirement from farming, (3) expiry of a lease or acquisition of the farm land by the Crown, and (4) forced sale of livestock due to an adverse event (e.g., fire, flood, drought, disease among livestock).
The term “adverse event” means any happening which is declared by the Minister of Finance to be an adverse event.
Adverse Event Bonds—These are made available to farmers through the Post Office. The purchase cost is deductible for tax purposes when purchased and assessable when redeemed. Interest at 3 1/2 percent is paid. Bonds are normally redeemable only on the occurrence of an adverse event such as a drought or flood.
Increased Livestock Incentive—An optional incentive scheme aimed at maintaining and accelerating the growth of livestock numbers is available. It applies to sheep, cattle, and pigs in a farming business and provides for the establishment of base livestock numbers. Increases in stock above the base livestock number may, at the taxpayer's option, be brought in at a “nil” value. Because there may be changes in the type of livestock carried from year to year a system of equivalents is provided, namely, one head of cattle equals six sheep, one head of cattle equals four pigs, and three sheep equal two pigs. The equivalents are not based on standard or market values but on food intake.
Sharemilkers—A sharemilker who sells his livestock, or a farmer on leasehold land who quits the land and sells his livestock in order to purchase his own farm, is allowed to spread forward the excess income arising from the sale of the livestock. The excess income is the difference between the amount realised and the standard value adopted for the livestock. The excess is assessed as income in the fifth income year after the year of sale unless the taxpayer elects to have all or part of the amount assessed in any one or more of the intervening four income years.
Farm Income Equalisation—This is a scheme whereby farmers and fishermen may deposit any amount exceeding $200 up to a maximum of 25 percent of their assessable income from farming or fishing, in an income equalisation reserve account. Deposits are deductible in the year of deposit and withdrawals constitute assessable income in the year of withdrawal. The maximum period in which deposits may be held in the reserve is five years; thus the scheme offers a means whereby a farmer or fisherman can reduce fluctuations in his income.
Capital Development Expenditure—Taxpayers engaged in agricultural pursuits and in freshwater fish farming, rock oyster farming, or mussel farming may deduct certain capital development expenditure or spread it over a period of 10 years. In the case of rock oyster and mussel farming, development expenditure includes the cost of acquiring and preparing suitable surfaces for collecting spat.
Pollution—Business taxpayers, other than farmers, may claim a deduction for business expenditure incurred to prevent or combat environmental pollution. The deduction relates only to expenditure in the construction of earthworks, ponds, settling tanks or other similar improvements on land in New Zealand. Twenty percent of the expenditure is deductible in the year incurred and 20 percent in each of the 4 succeeding years. Farmers may also claim, but on a different basis.
Employee Share Participation Scheme—This is a scheme to encourage employing companies to issue shares to their employees. Shares issued must be ordinary shares, entitled to dividends, and must be held for at least 3 years by the employee. Loans can be made by the company to the employee to enable the shares to be purchased but must be interest free. The company is allowed a concessional deduction of 10 percent of the loan as notional interest.
Export Market Development and Tourist Promotion—A 150 percent deduction, subject to an overall limit, is allowable for qualifying expenditure as an incentive to promote the export of New Zealand goods and services; the overseas use of New Zealand trade marks, patents, designs, or copyright; and to develop the New Zealand tourist industry. Self-employed professional people can claim up to 50 percent allowance in respect of their own time spent on promoting their services for overseas projects. A formula is provided to value the time.
Forestry Encouragement Grants—Under a scheme introduced in 1970 the Government makes grants in respect of the planting, maintenance, and development expenditure of companies and individuals who undertake approved forest planting programmes. This grant for expenditure is not assessable income and a deduction is not allowed for the expenditure unless and to the extent that it is more than twice the amount of the grant. Grants are also made for the personal labour of the taxpayer and his family. These grants are assessable income.
Increased Exports—This incentive is to encourage exports by manufacturers who produce mainly for the local market. If the value of qualifying goods exported during the year has increased by comparison with the average value of goods exported during a “base period” of three years, 20 percent of the increase can be deducted. The “base period” is the first 3 of the previous 7 years.
Industrial Research and Development Grants—Grants made under the Industrial Research and Development Grants Act 1970 will not represent assessable income to the recipient. When the grant is in respect of deductible expenditure the amount ordinarily allowable is reduced by the amount of the grant. When the grant is for capital expenditure, e.g., plant, the cost of the asset is reduced by the amount of the grant in determining the amount of depreciation to be allowed.
Mining—The mining industry has special methods of tax assessment, and investors may make a deduction of one-third of calls paid on shares in mineral or petroleum mining companies.
New Zealand Savings Certificates—An additional tax exemption is available in respect of the accumulated interest on the New Zealand Savings Certificate. The exemption is $500 and is on the same basis as Post Office National Development Bonds below. However, the $500 exemption is limited to total interest of one or both sources.
Post Office Bonus Bonds—Prizes received in respect of Post Office Bonus Bonds are exempt from tax.
Post Office National Development Bonds—An additional tax exemption is available in respect of the accumulated interest on Post Office National Development Bonds. The exemption is available to individuals only, and is subject to a maximum exemption of $500 in any income year. The interest is paid on maturity or surrender and is deemed to be derived in the income year in which the bond matures or in the year in which it is surrendered.
Savings Incentive—As from 1 April 1974 a further exemption of $200 was allowed in respect of interest from the Post Office Savings Bank, trustee savings banks, and private banks. This is in addition to the $100.
Scientific Research—Special incentives to encourage scientific research are available. Expenditure on research equipment acquired for scientific purposes directly relating to the business of the taxpayer may be written off over a period of 5 years. Also the cost of research directly relating to the business of the taxpayer may be deducted in the year in which it was incurred, and gifts of money made by companies to universities and approved institutes for education and research are, subject to certain limitations, deductible.
Visiting Experts—A special rebate is provided for approved visiting experts who provide (either as independent consultants or as employees) specialist, technical, or managerial expertise essential to the development in the initial years of an approved new and continuing enterprise in New Zealand; or provide expertise that is not generally available in New Zealand; or who are engaged in approved research work in institutions or universities. The effect of the rebate is to limit the New Zealand tax payable on income from the visiting experts' services to an average rate of 35 percent.
Land Tax—Land tax is levied on the total unimproved value of land held at 31 March by each owner after making, by way of special exemption from that value, the following deductions: where the value does not exceed $60,000, a deduction of $60,000; where the value exceeds $60,000 a deduction of $60,000 diminished at the rate of $1 for each $1 of that excess, so as to leave no deduction when that value amounts to or exceeds $120,000.
Subject to deductions provided, life tenants are liable for land tax and joint owners are assessed jointly as regards the land held in conjunction, and are liable severally in respect of each owner's interest in such land and other land. This liability for joint assessment also applies to companies owning land if they consist of substantially the same shareholders. Two or more companies are deemed to consist of substantially the same shareholders if they two-thirds or more commonly owned by the same persons. The ownership may be measured in terms of paid-up capital, or nominal value of allotted shares, or voting power, or entitlement to profits.
The rates of land tax on a “step” basis are as follows: where unimproved value after allowing the special exemption does not exceed $20,000 the rate is 5/12c for each dollar; where it exceeds $20,000 but does not exceed $30,000 the rate is 5/6c for each dollar; where it exceeds $30,000 but does not exceed $40,000 the rate is 1 1/4c for each dollar; where it exceeds $40,000 the rate is 1 2/3c for each dollar.
There is a rebate of a sum equal to 50 percent of the tax so assessed.
Land used for farming or agricultural activities is exempt from land tax.
Mining Companies—These companies are taxed on a conventional profit and loss basis. Exploration and development expenditure, much of which would normally be classified as capital expenditure, may be claimed against income. Tax is levied on mining income at two-thirds of the rate applicable to the income of non-mining companies. Other assessable income is taxable at normal company rates.
Property Syndicates—Unincorporated associations of not less than 11 persons formed after 3 September 1971 for the sole or principal reason of holding real property for investment or sale are treated as companies assessable at ordinary company rates. Any interest paid to members of the syndicate is not deductible for tax purposes but, together with any other distributions to members, is treated as dividends to members. A special exemption is not allowed for premiums paid on life policies assigned for the purposes of financing investment in property syndication.
PROPERTY SPECULATION TAX—The Property Speculation Tax Act 1973 became law in August 1973 and relates to all “dispositions” of “land” taking place on or after 15 June 1973. Under the Act, a profit on the “disposition” of “land” by any “person” is liable for the tax when there is a period of 2 years or less between “date of acquisition” and “date of disposition”, and the profit is not exempt from the tax.
Sales or other Dispositions After 2 Years—When the land has been held for more than 2 years by the vendor, there is no liability for property speculation tax.
Sale of Own Residence—This is generally exempt if the dwelling was bought as a residence with no intention of resale at a profit, and the reason for resale developed after purchase and was not principally to realise a profit.
Sales of Business Premises—In general terms, the tests for exemption if disposition of business premises are similar to those for the home owner disposing of his home. Exemption on these grounds is generally not available to businesses which consist principally of buying and selling land, developing land and buildings for sale, erecting buildings on land for sale, or investing in real estate.
Calculation of Profit—In general terms, the “assessable profit” will be the difference between the sale price and the cost price of the property plus and minus any intervening receipts and expenditure not taken into account for income tax purposes. The point about income and expenditure for income tax purposes is that income, such as rents, and expenditure, such as repairs and maintenance, will be properly returnable for income tax purposes in the normal way.
Rates of Property Speculation Tax—Rates are set out below.
| Where the period between Date of Acquisition and Date of Disposition is | Rate of Tax on Assessable Profit |
|---|---|
| Percent | |
| 6 months or less | 90 |
| Exceeding 6 and not exceeding 9 months | 85 |
| Exceeding 9 and not exceeding 12 months | 80 |
| Exceeding 12 and not exceeding 15 months | 75 |
| Exceeding 15 and not exceeding 18 months | 70 |
| Exceeding 18 and not exceeding 21 months | 65 |
| Exceeding 21 and not exceeding 24 months | 60 |
NOTE—If a transaction is liable to Property Speculation Tax it is not also liable to income tax. For land held more than 2 years, there could still be a liability for income tax under the provisions of the general tax law, but this will depend on the particular circumstances of each case.
ESTATE AND GIFT DUTIES—The legislation dealing with estate duty and gift duty is contained in the Estate and Gift Duties Act 1968 and amendments.
When the final balance of the dutiable estate of a deceased person exceeds $12 000, estate duty is levied on the amount thereof. Exemptions are provided for the successions of a wife, husband, infant child, or orphan infant child of a deceased person. An infant child is widely defined to mean a child or stepchild, or a deceased person, under the age of 20 years; and includes any other person, other than the wife of the deceased, who is living and under the age of 20 years, and is in the opinion of the Commissioner, a dependant of the deceased. An orphan infant child broadly means a child of the deceased, under the age of 20 years who has no parent living at the date of death of the deceased.
The exemptions are subject to the following limitations and operate by way of deduction from the duty of so much as is attributable to the exempted succession or exempted portion of the succession. In the case of a husband or wife, the exemption applies to the value of his or her succession or $60,000, whichever is the less; in the case of an infant child, to the value of the child's succession or $1,000, whichever is the less; in the case of an orphan infant child, to the value of the child's succession or the appropriate percentage of $10,000, whichever is the less. The appropriate percentage is based on the age of the child as at the date of death of the deceased. For a child up to the age of five years the appropriate percentage is 100 percent of $10,000. Where the child is 5 years of age or older, it reduces by 25 percent for every additional 5 years of age up to the age of 20.
There are also various exemptions which operate by way of the exclusion of certain property in computing the amount of the final balance of the estate as, for example, for a beneficial interest in a home settled under the Joint Family Homes Act 1964 which passes to the surviving spouse; accrued amounts of war pension and superannuation benefits; certain defined personal chattels to a value not exceeding $4,000; the property in an outright gift made before death to a charity; certain superannuation allowances for widows and infant children; and the wood value of growing trees on any land, a proprietary interest in which forms part of the dutiable estate.
An exemption is also provided for charitable bequests of up to $25,000 in aggregate in any estate. The amount of the charitable bequest is not excluded from the final balance of the estate but the rates of duty are adjusted to give the same result as if this had been done.
Relief is provided for quick successions where estate duty is payable twice on the same property by reason of the two deaths occurring within a short period. The duty is reduced in the second estate according to the interval between the two deaths as follows: second death within four months, 75 percent reduction; within eight months, 60 percent reduction; within one year, 50 percent reduction; within two years, 40 percent reduction; within three years, 30 percent reduction; within four years, 20 percent reduction; within five years, 10 percent reduction.
Income tax in respect of a deceased person up to the date of death is treated as a debt of the deceased in all cases.
Estate duty is due and payable to the Commissioner of Inland Revenue on the death of the deceased. Interest is charged at the rate of 5 percent on all duty unpaid within six months of date of death. In addition a penalty of 5 percent is payable if duty is not paid within three months after notice of assessment, but is not imposed earlier than six months after death. The time for payment of duty without incurring a penalty may be extended in certain cases.
There is a right of appeal to the Taxation Review Authority constituted under the Inland Revenue Department Amendment Act 1975, against decisions of the Commissioner in the exercise of his discretion under certain sections of the Act. There is also a right of appeal on any question of fact where the tax or duty exceeds $1,000 and on any question of law by way of a case stated to the Supreme Court.
The following table gives the scale of rates of estate duty which applies to estates of deceased persons dying on and after 25 June 1970.
| Final Balance of Estate | Basic Payment | Rate on Excess |
|---|---|---|
| $ $ | $ | percent |
| Up to 12,000 | - | - |
| 12,001- 14,000 | - | 7 |
| 14,001- 16,000 | 140 | 8 |
| 16,001- 18,000 | 300 | 9 |
| 18,001- 20,000 | 480 | 10 |
| 20,001- 22,000 | 680 | 11 |
| 22,001- 24,000 | 900 | 12 |
| 24,001- 26,000 | 1,140 | 13 |
| 26,001- 28,000 | 1,400 | 14 |
| 28,001- 30,000 | 1,680 | 15 |
| 30,001- 32,000 | 1,980 | 16 |
| 32,001- 34,000 | 2,300 | 17 |
| 34,001- 36,000 | 2,640 | 18 |
| 36,001- 38,000 | 3,000 | 19 |
| 38,001- 40,000 | 3,380 | 20 |
| 40,001- 42,000 | 3,780 | 21 |
| 42,001- 44,000 | 4,200 | 22 |
| 44,001- 46,000 | 4,640 | 23 |
| 46,001- 48,000 | 5,100 | 24 |
| 48,001- 50,000 | 5,580 | 25 |
| 50,001- 52,000 | 6,080 | 26 |
| 52,001- 54,000 | 6,600 | 27 |
| 54,001- 56,000 | 7,140 | 28 |
| 56,001- 58,000 | 7,700 | 29 |
| 58,001- 60,000 | 8,280 | 30 |
| 60,001- 70,000 | 8,880 | 31 |
| 70,001- 80,000 | 11,980 | 32 |
| 80,001- 90,000 | 15,180 | 33 |
| 90,001-100,000 | 18,480 | 34 |
| 100,001-110,000 | 21,880 | 35 |
| 110,001-120,000 | 25,380 | 36 |
| 120,001-130,000 | 28,980 | 37 |
| 130,001-140,000 | 32,680 | 38 |
| 140,001-150,000 | 36,480 | 39 |
| Exceeding 150,000 | 40,380 | 40 |
Gift Duty—A gift means any disposition of property situated in New Zealand (or of property outside New Zealand if the donor is domiciled in New Zealand at the time of the gift) which is made otherwise than by will, whether with or without an instrument in writing, without fully adequate consideration in money or its equivalent. There is provision for a deduction from the value of the gift of money payments adequately secured to the donor which were fixed or ascertainable at the date of the gift. No duty is payable on a gift which, together with the value of all other gifts (not exempt from duty by reason of their nature) made at the same time or within 12 months previously or subsequently by the same donor to the same or any other beneficiary does not exceed the value of $4,000. Gifts up to $4,000 in any year to the same person are not taken into account for gift duty (or estate duty) if made as part of the donor's normal expenditure. Various other exemptions, including gifts to any charitable trust, are contained in the Act.
The amount of the gift duty is payable by either the donor or the beneficiary, but the beneficiary is entitled to be indemnified by the donor unless the terms of the gift provide otherwise. Particulars of any gift made exceeding $2,000 (or the value of which when aggregated with the value of all gifts made by the donor within 12 months previously exceeds $2,000) are required to be furnished for assessment of duty, if any, within three months of the date of the gift, and if the duty is not paid within six months of making the gift a 5 percent penalty is imposed. Interest is also payable at 5 percent on any gift duty not paid within three months of the date of the gift and on any penalty from the date it was incurred.
The following table gives the scale of rates of gift duty on gifts made on and after 19 July 1968.
| Value of Gift (Together With Value of All Aggregated Gifts) | Basic Payment | Rate on Excess |
|---|---|---|
| *Of total value of gift. | ||
| $ $ | $ | percent |
| Up to 4,000 | - | - |
| 4,001- 6,000 | - | 9 |
| 6,001- 8,000 | 180 | 11 |
| 8,001-10,000 | 400 | 13 |
| 10,001-12,000 | 660 | 15 |
| 12,001-14,000 | 960 | 17 |
| 14,001-16,000 | 1,300 | 19 |
| 16,001-18,000 | 1,680 | 21 |
| 18,001-20,000 | 2,100 | 23 |
| 20,001-22,000 | 2,560 | 25 |
| 22,001-24,000 | 3,060 | 27 |
| 24,001-28,000 | 3,600 | 23 |
| 28,001-32,000 | 4,520 | 25 |
| 32,001-36,000 | 5,520 | 27 |
| 36,001-40,000 | 6,600 | 29 |
| 40,001-44,000 | 7,760 | 31 |
| 44,001-48,000 | 9,000 | 33 |
| 48,001-52,000 | 10,320 | 35 |
| 52,001-56,000 | 11,720 | 37 |
| 56,001-60,000 | 13,200 | 39 |
| 60,001-64,000 | 14,760 | 31 |
| Over 64,000 | - | 25* |
The net revenue received from estate duty and gift duty during each of the latest six years is given below.
| Year Ended 31 March | Estate Duty | Gift Duty | Total Estate and Gift Duties |
|---|---|---|---|
| $(thousand) | |||
| 1969 | 22,050 | 2,062 | 24,112 |
| 1970 | 24,669 | 1,633 | 26,303 |
| 1971 | 27,751 | 1,589 | 29,340 |
| 1972 | 23,670 | 1,379 | 25,049 |
| 1973 | 26,714 | 1,853 | 28,567 |
| 1974 | 31,018 | 2,804 | 33,822 |
Taxation Review Authority—The Inland Revenue Department Act provides for the establishment of one or more authorities. There is at present only one such authority. Every authority consists of one person who is a barrister or solicitor of the Supreme Court of not less than 7 years practice and is appointed by the Governor-General. The functions of the authority are to sit as a judicial authority for hearing and determining such objections to assessments of tax or duty or the decisions or determinations of the Commissioner as are authorized by the relevant legislation. A determination of an authority is subject to an appeal to the Supreme Court as to any question of fact where the tax or duty exceeds $1,000 and to any question of law.
ESTATES PASSED FOR DEATH DUTY—Particulars of deceased persons' estates certified during the year ended 31 March 1972 are given in the tables following. Totals for the previous three years are appended. Estates of Maoris, other than hereditary interests in Maori land, are included.
The following table analyses the estates certified by size of estate value.
| Size of Estate (Net Value) | Estates of Males | Estates of Females | Total Estates | Aggregate Net Value of Estates | Estate Duties Assessed | |
|---|---|---|---|---|---|---|
| $(000) | $(000) | $(000) | $(000) | |||
| Under | 2 | 514 | 524 | 1,038 | 1,268 | - |
| 2 and under | 4 | 729 | 678 | 1,407 | 4,190 | — |
| 4 “ | 6 | 705 | 668 | 1,373 | 6,873 | 1 |
| 6 “ | 8 | 762 | 668 | 1,430 | 10,011 | - |
| 8 “ | 10 | 677 | 581 | 1,258 | 11,247 | 2 |
| 10 “ | 12 | 531 | 383 | 914 | 9,992 | 1 |
| 12 “ | 14 | 423 | 252 | 675 | 8,773 | 26 |
| 14 “ | 16 | 350 | 269 | 619 | 9,273 | 84 |
| 16 “ | 18 | 299 | 237 | 536 | 9,110 | 174 |
| 18 “ | 20 | 270 | 189 | 459 | 8,711 | 152 |
| 20 “ | 22 | 217 | 154 | 371 | 7,772 | 398 |
| 22 “ | 24 | 175 | 127 | 302 | 6,929 | 189 |
| 24 “ | 30 | 393 | 272 | 665 | 17,785 | 614 |
| 30 “ | 40 | 426 | 276 | 702 | 24,171 | 1,308 |
| 40 “ | 50 | 280 | 133 | 413 | 18,449 | 1,278 |
| 50 “ | 60 | 228 | 98 | 326 | 17,914 | 1,612 |
| 60 “ | 70 | 159 | 63 | 222 | 14,480 | 1,598 |
| 70 “ | 80 | 121 | 45 | 166 | 12,454 | 1,673 |
| 80 “ | 90 | 79 | 20 | 99 | 8,370 | 1,210 |
| 90 “ | 100 | 60 | 20 | 80 | 7,581 | 1,243 |
| 100 “ | 120 | 95 | 23 | 118 | 12,805 | 2,431 |
| 120 “ | 140 | 73 | 16 | 89 | 11,561 | 2,323 |
| 140 “ | 160 | 40 | 7 | 47 | 6,992 | 1,475 |
| 160 “ | 180 | 23 | 10 | 33 | 5,597 | 1,342 |
| 180 “ | 200 | 15 | 4 | 19 | 3,602 | 946 |
| 200 and over | 55 | 14 | 69 | 20,820 | 6,151 | |
| Totals, 1972-73 | 7,699 | 5,731 | 13,430 | 276,732 | 26,232 | |
| Totals, 1971-72 | 8,403 | 5,957 | 14,360 | 271,818 | 24,592 | |
| Totals, 1970-71 | 8,662 | 6,152 | 14,814 | 264,694 | 25,995 | |
| Totals, 1969-70 | 8,415 | 5,926 | 14,341 | 251,116 | 28,611 | |
The average net value per estate certified in 1972-73 was $20,605 (males $23,854; females $16,240), compared with $18,928 (males $22,105; females $14,448) in 1971-72. Duty on estates of males amounted to $18.3 million and on estates of females $7.9 million, the respective figures for 1971-72 being $17.7 million and $6.9 million.
The law relating to death duties is contained in the Estate and Gift Duties Act 1968 which came into force on 1 January 1969. From 26 June 1969 the exemption for both a widow and a widower has been $40,000 and estates up to a value of $12,000 are exempt from duty.
The average amount of duty assessed within each of the various estate groups is now given. The rates of average duty to average estate value are also given.
| Size of Estate (Net Value) | Average Duty Assessed | Average Duty as Percentage of Average Value of Estate | ||||
|---|---|---|---|---|---|---|
| Estates of Males | Estates of Females | Combined Average | Estates of Males | Estates of Females | Combined Average | |
| $(000) $(000) | $ | $ | $ | percent | percent | percent |
| Under 10 | - | 3 | 1 | - | - | - |
| 10 and under 12 | - | 1 | - | - | - | - |
| 12 “ 14 | 26 | 56 | 37 | 0.2 | 0.4 | 0.3 |
| 14 “ 16 | 94 | 190 | 136 | 0.6 | 1.3 | 0.9 |
| 16 “ 18 | 313 | 338 | 324 | 1.8 | 2.0 | 1.9 |
| 18 “ 20 | 216 | 497 | 331 | 1.1 | 2.6 | 1.7 |
| 20 “ 22 | 1,029 | 1,133 | 1,072 | 4.9 | 5.4 | 5.1 |
| 22 “ 24 | 413 | 914 | 624 | 1.8 | 4.0 | 2.7 |
| 24 “ 30 | 663 | 1,297 | 923 | 2.5 | 4.8 | 3.5 |
| 30 “ 40 | 1,568 | 2,318 | 1,863 | 4.6 | 6.7 | 5.4 |
| 40 “ 50 | 2,526 | 4,292 | 3,095 | 5.7 | 9.6 | 6.9 |
| 50 “ 60 | 4,212 | 6,652 | 4,946 | 7.7 | 12.2 | 9.0 |
| 60 “ 70 | 6,394 | 9,227 | 7,198 | 9.8 | 14.3 | 11.0 |
| 70 “ 80 | 9,245 | 12,324 | 10,079 | 12.3 | 16.4 | 13.4 |
| 80 “ 90 | 11,718 | 14,193 | 12,218 | 13.9 | 16.7 | 14.5 |
| 90 “ 100 | 14,228 | 19,484 | 15,542 | 15.1 | 20.3 | 16.4 |
| 100 “ 120 | 20,508 | 20,987 | 20,601 | 18.9 | 19.5 | 19.0 |
| 120 “ 140 | 25,459 | 29,023 | 26,100 | 19.6 | 22.5 | 20.1 |
| 140 “ 160 | 30,729 | 35,078 | 31,376 | 20.6 | 24.0 | 21.1 |
| 160 “ 180 | 38,082 | 46,601 | 40,663 | 22.5 | 27.3 | 24.0 |
| 180 “ 200 | 48,972 | 52,914 | 49,802 | 25.8 | 27.9 | 26.3 |
| 200 and over | 85,195 | 104,693 | 89,151 | 29.0 | 31.4 | 29.5 |
| All estates, 1971-72 | 2,381 | 1,377 | 1,953 | 10.0 | 8.5 | 9.5 |
| All estates, 1970-71 | 2,104 | 1,158 | 1,712 | 9.5 | 8.0 | 9.0 |
| All estates, 1969-70 | 2,136 | 1,217 | 1,754 | 10.3 | 8.9 | 9.8 |
| All estates, 1968-69 | 2,231 | 1,660 | 1,995 | 11.2 | 11.7 | 11.4 |
A summary showing gross assets, notional estate, and debts and charges, classified in broad groups according to size of estate passed for duty in the March year 1973 is now given.
| Item | Size of Estate (Net Value) | ||||||||
|---|---|---|---|---|---|---|---|---|---|
| Under $6,000 | $6,000-$9,999 | $10,000-$19,999 | $20,000-$23,999 | $24,000-$39,999 | $40,000-$99,999 | $100,000-$199,999 | $200,000 and Over | All Estates | |
| Gross Assets— | $(000), except average per estate $ | ||||||||
| Cash | 5,048 | 6,223 | 12,435 | 3,352 | 8,543 | 12,670 | 5,285 | 2,926 | 56,483 |
| Average per estate | 1,322 | 2,315 | 3,882 | 4,980 | 6,249 | 9,701 | 17,271 | 42,410 | 4,205 |
| Furniture, effects, etc. | 519 | 719 | 1,355 | 392 | 1,032 | 1,337 | 591 | 258 | 6,203 |
| Average per estate | 135 | 267 | 423 | 582 | 754 | 1,023 | 1,931 | 3,744 | 461 |
| Farm stock, implements, etc. | 25 | 39 | 164 | 121 | 347 | 2,501 | 2,060 | 696 | 5,954 |
| Average per estate | 6 | 14 | 51 | 180 | 253 | 1,915 | 6,733 | 10,091 | 443 |
| Private business interests | 63 | 87 | 473 | 211 | 900 | 2,804 | 1,900 | 703 | 7,141 |
| Average per estate | 16 | 32 | 147 | 313 | 658 | 2,147 | 6,210 | 10,186 | 531 |
| Assurance policies | 1,278 | 1,752 | 4,112 | 1,287 | 3,119 | 4,797 | 2,327 | 631 | 19,302 |
| Average per estate | 334 | 651 | 1,283 | 1,911 | 2,281 | 3,673 | 7,604 | 9,140 | 1,437 |
| Loans | 793 | 1,659 | 4,619 | 1,855 | 6,360 | 14,263 | 6,153 | 2,742 | 38,443 |
| Average per estate | 207 | 617 | 1,442 | 2,756 | 4,652 | 10,920 | 20,107 | 39,734 | 2,862 |
| Shares, stocks, etc. | 706 | 1,411 | 4,186 | 1,775 | 6,246 | 14,291 | 8,885 | 5,996 | 43,497 |
| Average per estate | 184 | 524 | 1,307 | 2,636 | 4,569 | 10,942 | 29,037 | 86,895 | 3,238 |
| Real property | 4,651 | 9,006 | 15,864 | 4,523 | 12,270 | 20,743 | 9,314 | 3,899 | 80,270 |
| Average per estate | 1,218 | 3,350 | 4,952 | 6,720 | 8,975 | 15,883 | 30,438 | 56,510 | 5,976 |
| Other property | 522 | 627 | 1,786 | 701 | 1,979 | 3,134 | 1,684 | 543 | 10,977 |
| Average per estate | 136 | 233 | 557 | 1,041 | 1,447 | 2,400 | 5,504 | 7,869 | 817 |
| Notional estate | 779 | 1,446 | 3,238 | 990 | 2,523 | 4,813 | 2,260 | 1,027 | 17,077 |
| Average per estate | 204 | 538 | 1,011 | 1,471 | 1,845 | 3,685 | 7,384 | 14,878 | 1,271 |
| Foreign property | 99 | 138 | 459 | 277 | 1,075 | 2,676 | 2,552 | 2,140 | 9,416 |
| Average per estate | 25 | 51 | 143 | 410 | 786 | 2,049 | 8,341 | 31,013 | 710 |
| Debts— | |||||||||
| Unsecured | 1,197 | 983 | 1,574 | 478 | 1,281 | 2,462 | 1,399 | 455 | 9,828 |
| Secured | 957 | 865 | 1,257 | 303 | 1,157 | 2,320 | 1,055 | 286 | 8,201 |
| Total | 2,154 | 1,848 | 2,831 | 781 | 2,438 | 4,781 | 2,455 | 741 | 18,028 |
| Average per estate | 564 | 687 | 883 | 1,160 | 1,783 | 3,660 | 8,021 | 10,739 | 1,342 |
Realty comprised 27.2 percent of gross New Zealand assets, while the proportion of cash was 19.2 percent.
The number of deceased persons' estates in each group for 1972-73 are classified below according to net value of estate.
| Age Group of Deceased Person, in Years | Under $2,000 | $2,000-$3,999 | $4,000-$5,999 | $6,000-$7,999 | $8,000-$9,999 | $10,000-$19,999 | $20,000-$23,999 | $24,000-$29,999 | $30,000-$39,999 | $40,000-$59,999 | $60,000-$79,999 | $80,000-$99,999 | $100,000-$199,999 | $200,000 and Over | Total |
|---|---|---|---|---|---|---|---|---|---|---|---|---|---|---|---|
| Under 20 | 8 | 14 | 22 | 14 | 6 | 13 | 2 | - | - | - | - | - | - | - | 79 |
| 20-24 | 8 | 31 | 16 | 14 | 11 | 39 | 5 | 4 | 2 | 1 | - | - | - | - | 131 |
| 25-29 | 10 | 8 | 5 | 9 | 9 | 34 | 6 | 5 | 4 | 2 | 1 | - | 2 | - | 95 |
| 30-34 | 6 | 7 | 9 | 13 | 6 | 26 | 4 | 7 | 7 | 7 | 2 | - | 2 | - | 96 |
| 35-39 | 4 | 21 | 11 | 18 | 8 | 35 | 6 | 9 | 3 | 4 | 3 | 1 | 1 | - | 124 |
| 40-44 | 18 | 22 | 20 | 18 | 17 | 47 | 13 | 11 | 14 | 9 | 7 | 4 | 3 | 2 | 205 |
| 45-49 | 28 | 45 | 45 | 41 | 21 | 79 | 14 | 29 | 21 | 14 | 9 | 4 | 9 | 3 | 362 |
| 50-54 | 59 | 65 | 50 | 64 | 43 | 124 | 27 | 24 | 28 | 34 | 15 | 8 | 18 | 4 | 563 |
| 55-59 | 72 | 84 | 89 | 85 | 61 | 219 | 39 | 45 | 42 | 53 | 30 | 10 | 22 | 3 | 854 |
| 60-64 | 118 | 127 | 122 | 119 | 113 | 316 | 59 | 69 | 66 | 64 | 47 | 20 | 40 | 9 | 1,289 |
| 65-69 | 120 | 158 | 158 | 180 | 160 | 373 | 81 | 64 | 85 | 79 | 50 | 26 | 51 | 10 | 1,595 |
| 70-74 | 156 | 206 | 209 | 206 | 180 | 435 | 94 | 94 | 107 | 132 | 56 | 27 | 41 | 8 | 1,951 |
| 75-79 | 129 | 206 | 190 | 217 | 196 | 430 | 97 | 94 | 104 | 102 | 53 | 25 | 36 | 10 | 1,889 |
| 80-84 | 127 | 168 | 197 | 205 | 197 | 484 | 97 | 98 | 89 | 122 | 58 | 23 | 31 | 11 | 1,907 |
| 85-89 | 94 | 149 | 138 | 147 | 138 | 338 | 77 | 76 | 74 | 67 | 31 | 21 | 33 | 9 | 1,392 |
| 90-94 | 58 | 67 | 60 | 68 | 67 | 162 | 35 | 27 | 40 | 35 | 17 | 3 | 14 | - | 653 |
| 95-99 | 11 | 16 | 22 | 9 | 16 | 26 | 14 | 4 | 10 | 11 | 3 | 6 | 2 | - | 150 |
| Unspecified | 12 | 13 | 10 | 3 | 9 | 23 | 3 | 5 | 6 | 3 | 6 | 1 | 1 | - | 95 |
| Totals | 1,038 | 1,407 | 1,373 | 1,430 | 1,258 | 3,203 | 673 | 665 | 702 | 739 | 388 | 179 | 306 | 69 | 13,430 |
| Percent | 7.73 | 10.48 | 10.22 | 10.65 | 9.37 | 23.85 | 5.01 | 4.95 | 5.23 | 5.50 | 2.89 | 1.33 | 2.28 | 0.51 | 100.00 |
In the following table deceased persons' estates for 1972-73 are analysed by occupations.
| Occupational Group | Under $ 6,000 | $ 6,000 to 9,999 | $ 10,000 to 19,999 | $ 20,000 to 23,999 | $ 24,000 to 39,999 | $ 40,000 to 99,999 | $ 100,000 and over | Totals |
|---|---|---|---|---|---|---|---|---|
| NOTE—In this table for the separate occupation classes, estates in any value group which has less than three in it have been included with the number for the value group below; where this was not possible, no net estate distribution has been shown. As the full distribution for each occupation or value group has been given in the totals, this procedure means that in some cases the sum of individual groups will not agree with the totals. | ||||||||
| Males | ||||||||
| Architects, engineers, chemists, etc. | 38 | 38 | 70 | 12 | 27 | 40 | 11 | 236 |
| Doctors, dentists, and medical workers | 9 | 11 | 14 | 3 | 14 | 28 | 2 | 81 |
| Teachers, clergy, and jurists | 27 | 33 | 47 | 13 | 36 | 13 | 9 | 178 |
| Artists, draughtsmen, and related workers | 23 | 30 | 50 | 13 | 16 | 22 | 7 | 161 |
| Executive officials, directors, and managers | 103 | 87 | 168 | 46 | 119 | 157 | 63 | 743 |
| Bookkeepers, typists, and clerical workers | 133 | 133 | 194 | 37 | 66 | 39 | 8 | 610 |
| Working proprietors, wholesale, and retail trade | 7 | 8 | 13 | 3 | 10 | 11 | 3 | 55 |
| Insurance, real estate, and all salesmen | 66 | 73 | 89 | 26 | 34 | 24 | 8 | 320 |
| Farmers and farm managers | 159 | 151 | 271 | 90 | 244 | 458 | 167 | 1,540 |
| Farm workers | 37 | 20 | 29 | 4 | 6 | 3 | 1 | 100 |
| Hunters, fishermen, and loggers | 25 | 11 | 17 | 1 | 4 | 3 | - | 61 |
| Miners, welldrillers, and quarrymen | 33 | 6 | 9 | 4 | - | - | - | 52 |
| Merchant marine officers and ratings | 12 | 11 | 8 | 1 | 2 | 5 | - | 39 |
| Aircraft crews | 1 | 3 | 3 | 3 | 4 | 1 | - | 15 |
| Transport and communication workers | 123 | 82 | 112 | 13 | 29 | 7 | - | 363 |
| Spinners, cutters, tailors, etc. | 35 | 17 | 17 | 2 | 8 | 4 | - | 81 |
| Furnacemen and moulders | 14 | 7 | 6 | 2 | 2 | - | - | 36 |
| Instrument, tool makers, and machinists | 97 | 102 | 91 | 21 | 29 | 6 | 1 | 347 |
| Electricians | 27 | 24 | 43 | 8 | 9 | 7 | 3 | 121 |
| Carpenters, painters, and bricklayers | 139 | 117 | 133 | 21 | 47 | 38 | 6 | 501 |
| Compositors, bookbinders, etc. | 11 | 17 | 18 | 1 | 4 | 2 | - | 53 |
| Potters and clay workers | 3 | 4 | 3 | - | - | 1 | - | 11 |
| Millers, bakers, and food workers | 47 | 39 | 31 | 7 | 3 | 5 | 1 | 133 |
| Chemical and tobacco workers | 4 | 2 | 3 | 2 | - | - | - | 11 |
| Production processors, packers, etc. | 8 | 7 | 10 | 2 | 2 | 3 | - | 32 |
| Lifting equipment and freight handlers | 90 | 71 | 72 | 9 | 14 | 7 | - | 263 |
| Labourers, etc. | 214 | 85 | 71 | 7 | 18 | 2 | 1 | 398 |
| Firemen, policemen, and guards | 15 | 12 | 17 | 4 | 3 | 3 | - | 54 |
| Housekeepers, cooks, waiters, and cleaners | 47 | 24 | 18 | 2 | 4 | 2 | - | 97 |
| Hairdressers, launderers, and drycleaners | 11 | 5 | 12 | - | 2 | - | - | 30 |
| Athletes, recreation, and service workers | 16 | 7 | 10 | 1 | 4 | 3 | 1 | 42 |
| Occupation not stated or not working | 364 | 197 | 212 | 30 | 58 | 29 | 8 | 898 |
| All uniformed personnel (services) | 10 | 5 | 12 | 4 | 1 | 4 | 1 | 37 |
| Total | 1,948 | 1,439 | 1,873 | 392 | 819 | 927 | 301 | 7,699 |
| Females | ||||||||
| Occupation not stated or not working | 1,811 | 1,201 | 1,276 | 265 | 525 | 359 | 66 | 5,503 |
| Architects, engineers, chemists, etc. | 2 | 2 | - | - | 1 | - | - | 5 |
| Doctors, dentists, and medical workers | 12 | 8 | 14 | 6 | 3 | 2 | - | 45 |
| Teachers, clergy, and jurists | 6 | 9 | 13 | - | 5 | 4 | - | 37 |
| Bookkeepers, typists, and clerical workers | 10 | 16 | 10 | 4 | 8 | 2 | 1 | 51 |
| Housekeepers, cooks, etc. | 13 | 2 | 5 | 2 | - | - | - | 22 |
| Spinners, cutters, tailors, etc. | 1 | 2 | 1 | - | 1 | - | 1 | 6 |
| Other | 15 | 9 | 11 | 4 | 5 | 12 | 6 | 62 |
| Totals | 1,870 | 1,249 | 1,330 | 281 | 548 | 379 | 74 | 5,731 |
OTHER DUTIES—These cover a miscellany of items of taxation.
In the next table the receipts for the last five years are shown under the various heads; receipts under agreement on sales of overseas lottery tickets in New Zealand have been added to the revenue items handled by the Duties Division of the Inland Revenue Department.
| Duty | Year Ended 31 March | ||||
|---|---|---|---|---|---|
| 1970 | 1971 | 1972 | 1973 | 1974 | |
| $(thousand) | |||||
| Duty on instruments | 8,808 | 10,700 | 11,320 | 16,445 | 25,802 |
| Duty on cheques | 1,948 | 2,078 | 2,229 | 2,395 | 2,654 |
| Racing taxation | 12,054 | 13,157 | 15,656 | 16,513 | 19,261 |
| Lottery duty | 719 | 686 | 625 | 1,077 | 950 |
| Overseas lottery duty | 273 | 267 | 296 | 274 | 280 |
| Totals | 23,802 | 26,888 | 30,126 | 36,704 | 48,948 |
Some of the more important items included in the foregoing table are dealt with in more detail under subsequent headings.
RACING TAXATION—The Government taxation on totalisator turnover is at the rate of 9.32 percent of gross turnover subject to a rebate of 2 1/2 percent on the first $100,000 of gross investments received by a club in any one year. Total deductions from gross investments are as follows: (a) totalisator duty 9.32 percent; (b) club or Totalisator Agency Board's commission, 7.5 percent in respect of win and place dividends and 10.18 percent on doubles investments. In the case of special races, win and place investment commission of 8 percent is deducted and on special doubles commission of 10.68 percent is deducted, and in these cases the 0.5 percent levy is waived; and (c) 1/2 percent levy as provided by the Gaming Amendment Act 1965. Where the 1/2 percent levy is deducted by a racing or hunt club it is paid to the New Zealand Racing Conference and where it is deducted by a trotting club it is paid to the New Zealand Trotting Conference. Each conference pays the money received by it into a separate account, which is applied solely for the purpose of assisting clubs to provide, maintain, and replace amenities for the public and course improvements on their racecourses. The proceeds of the levy and the amounts paid to clubs are not subject to taxation.
The Racing Act 1971 came into operation on 1 August 1972. Under this Act, the 1/2 percent on bets for racecourse improvements is retained and an additional 1/2 percent levy is paid to the National Racing Authority for supplementing stakes paid by clubs on specified races. The Totalisator Agency Board pays its profits to the authority which determines its distribution to totalisator clubs.
The Totalisator Agency Board established to conduct off-course betting receives 7 1/2 percent of the turnover made through the totalisator agencies. This is the same percentage as that retained by clubs for on-course turnover.
The Minister of Internal Affairs granted totalisator licences for 435 days in the racing year 1973-74. Of these 435 days, 287 were allocated to racing and hunt clubs and 148 to trotting clubs.
The following table gives figures of totalisator duty, and the amount of turnover retained by clubs or the Totalisator Agency Board.
| Item | Year Ended 31 July | ||||
|---|---|---|---|---|---|
| 1970 | 1971 | 1972 | 1973 | 1974 | |
| *Retained by clubs and T.A.B. | |||||
| $(thousand) | |||||
| Totalisator duty | 12,440 | 14,105 | 15,952 | 18,423 | 21,170 |
| Amount of totalisator turnover retained by clubs or T.A.B. | 11,918 | 13,369 | 15,049 | 17,443 | 20,029 |
| Unpaid fractions* | 603 | 674 | 761 | 816 | 939 |
| Levy of 2 percent | 681 | 771 | 869 | 1,007 | 1,154 |
For the financial year ended 31 March 1974, Consolidated Revenue Account receipts from racing taxation amounted to $19.3 million, as compared with $16.5 million in 1972-73.
GENERAL—The principal legislative measure which is concerned with public indebtedness is the New Zealand Loans Act 1953.
The money composing the public debt has been borrowed on the security of the public revenues of New Zealand. No portion of the public estate is pledged for either principal or interest.
Whereas in 1934, 56 percent of the public debt was owing to overseas investors, the percentage has now dropped to 12.5 percent. Over 45 percent of the public debt is held by Government-owned institutions, and by reserve accounts set up for the benefit of the primary industries. Internal public debt as at 31 March 1974 comprised $3,269 million of the total public debt of $3,735 million.
Most of the present public debt has been borrowed for national development. There was established within the Public Account, as from 1 April 1942, a National Development Loans Account into which moneys for national development are paid. The amounts raised by loans since the inception of this account to 31 March 1974 totalled $3,707 million, of which $371 million was raised in 1973-74. Moneys are transferred from this account as required, the amounts transferred during the last three years being given in Section 26A.
MOVEMENT IN PUBLIC DEBT—Movement of the overseas public debt can be gauged from the following table.
| Year Ended 31 March | London and Europe | United States and World Bank | Total Overseas Debt | ||||
|---|---|---|---|---|---|---|---|
| New Borrowings | Repayments* | Balance of Debt | New Borrowings | Repayments | Balance of Debt | ||
| *Includes debt transferred to New Zealand register. | |||||||
| NZ$(thousand) | |||||||
| 1969 | 40,261 | 33,409 | 336,229 | 22,632 | 14,119 | 179,219 | 515,448 |
| 1970 | 10,329 | 5,002 | 341,556 | 19,982 | 14,953 | 184,248 | 525,804 |
| 1971 | 58,963 | 2,703 | 397,816 | 13,973 | 19,603 | 178,618 | 576,434 |
| 1972 | 132,139 | 35,820 | 494,135 | 6,293 | 25,505 | 159,406 | 653,541 |
| 1973 | 46,641 | 111,890 | 428,886 | 4,603 | 28,914 | 135,095 | 563,981 |
| 1974 | 5,946 | 82,924 | 351,908 | 2,520 | 24,313 | 113,302 | 465,210 |
A summary of movements in the public debt 1973-74 is given in the following table.
| Item | Amount |
|---|---|
| *New Plymouth power station. | |
| NZ | |
| External Debt— | $(million) |
| Loans Raised— | |
| World Bank | 1.5 |
| Defence credits | 2.5 |
| Capital equipment credit arrangements* | 4.4 |
| 8.4 | |
| Loans Redeemed— | |
| London | 44.1 |
| Europe | 2.9 |
| New York | 5.6 |
| World Bank | 4.6 |
| Capital equipment credit arrangements | 1.9 |
| Defence credits | 7.4 |
| Transfer to New Zealand Register | 0.1 |
| Currency adjustments | 40.6 |
| 107.2 | |
| Net decrease in External Debt | 98.8 |
| Internal Debt— | $(million) |
| Loans raised | 992.7 |
| Loans converted | 178.5 |
| Transfers from London Register | 0.1 |
| Loans Redemption Account | 1,171.3 |
| Loans redeemed | 662.6 |
| Loans converted | 178.5 |
| 841.1 | |
| Net increase in Internal Debt | 330.2 |
| Total increase in Public Debt | 231.5 |
| Outstanding—31 March 1974 | 3,734.5 |
A detailed allocation of the public debt as at 31 March 1974 is now given.
| Allocation of Debt | Loan Capital | Interest on Loan Capital | Equity Capital* | Total Allocation |
|---|---|---|---|---|
*The following dividends have been received during 1973-74: (a) Air New Zealand Ltd. $900,000. (b) Tasman Pulp and Paper Co. Ltd $865,000. (c) Bank of New Zealand $2,655,000 †Interest capitalised and payment deferred until such time as the industry has recovered its initial deficit and is operating profitably. †Free of interest. ψ Interest on loan capital remitted each year. ||Free of interest—position to be reviewed. ¶Includes $5 million being excess development costs not represented by sale value and not bearing interest. **Interest during construction to be capitalised. ††Includes calibration aircraft $1,554,582. §Interest rate yet to be determined. | ||||
| (a) Loans and investments in trading undertakings— | $(000) | percent | $(000) | $(000) |
| Air New Zealand Ltd. | 30,000 | 30,000 | ||
| Tasman Pulp and Paper Co. Ltd. | 6,600 | 6 1/4 | 11,920 | |
| Tasman Pulp and Paper Co. Ltd. | 761 | 4 1/2 | 2,000 | 21,281 |
| New Zealand Broadcasting Corporation | 1,000 | 6 | 1,000 | |
| New Zealand Steel Ltd. | 6,000† | 5 1/2 | 9,990 | |
| New Zealand Steel Ltd. | 2,750 | 6 1/2-7 | 18,740 | |
| New Zealand Wool Topmaking Investigating Co. Ltd. | 62 | 62 | ||
| New Zealand National Airways Corporation | 9,825 | 9,825 | ||
| Bank of New Zealand shares | 12,656 | 12,656 | ||
| Development Finance Corporation of New Zealand | 3,000 | 7 3/4 | 4,825 | |
| Development Finance Corporation of New Zealand | 18,750 | 6 1/2 | 26,575 | |
| Offshore Mining Co. Ltd. | 1,174§ | 30,000 | 31,174 | |
| Railways | 43,29 | 179,664 | 222,914 | |
| Railways (IBRD Railway projects) | 26,78 | Var. | 26,786 | |
| Railways (Third Cook Strait Ferry) | 5 1/2 | 4,133 | ||
| Railways (North Island sleeper train) | 1,384 | 6 | 1,384 | |
| Railways (G.E.C. Locomotives) | 2,445 | Var. | 2,445 | |
| Railways (Silver Fern railcars) | 670 | 6 1/4 | 670 | |
| Shipping Corporation of New Zealand Ltd. | 2,159 | 7 | 7,710 | 9,869 |
| State Advances Corporation | 745,523 | 4 1/2 | 745,523 | |
| State coal minesψ | 29,606 | 29,606 | ||
| Tourist Hotel Corporation | 1,948|| | 4,000 | ||
| Tourist Hotel Corporation | 3,384 | 8 | 9,332 | |
| Electric power | 914,248 | 5 | ||
| Electric power (IBRD Inter-island Transmission project) | 17,204 | 5 1/2 | ||
| Electric power (IBRD Marsden Point power project) | 7,374 | 6 1/4 | ||
| Electric power (New Plymouth power station) | 16,567 | 5 1/2 | 955,393 | |
| Post Office | 375,910 | 5 | 357,910 | |
| Housing under construction and land development¶ | 34,673 | 4 1/2 | 34,673 | |
| Land settlement | 211,304 | 4 1/2 | 211,304 | |
| IBRD Harbour projects | 4,241 | 5 1/4 | 4,241 | |
| Natural Gas Corporation of New Zealand** | 24,464 | 6 | 24,464 | |
| Earning interest but not at full rate— | ||||
| Housing Account (S.A.C.) | 322,038 | 3 | 322,038 | |
| 3,113,998 | ||||
| (b) Not earning interest though represented by permanent assets or development works— | ||||
| Airport development†† | 30,895 | |||
| Education buildings | 96,303 | |||
| Forests (State) | 84,668 | |||
| General public works | 173,895 | |||
| International finance organisations— | ||||
| Cash portion of subscriptions | 23,296 | |||
| 409,057 | ||||
| (c) Non-productive debt— | ||||
| Consolidated Revenue Account— | ||||
| Defence | 29,972 | |||
| New loan moneys on hand— | ||||
| National Development Loans Account | 65,336 | |||
| Loans Redemption Account | 116,165 | |||
| 211,473 | ||||
| Total | 3,734,528 | |||
GROSS INDEBTEDNESS—The gross indebtedness of the Central Government and the amount of indebtedness per head of population are given in the following table. Figures for previous years are shown in a table in the Statistical Summary.
| At 31 March | Amount | Per Head of Population |
|---|---|---|
| $(m) | $ | |
| 1964 | 2,022 | 782.89 |
| 1965 | 2,140 | 813.87 |
| 1966 | 2,256 | 842.78 |
| 1967 | 2,412 | 884.42 |
| 1968 | 2,617 | 949.72 |
| 1969 | 2,776 | 998.40 |
| 1970 | 2,877 | 1,019.96 |
| 1971 | 3,007 | 1,051.06 |
| 1972 | 3,187 | 1,095.22 |
| 1973 | 3,503 | 1,217.86 |
| 1974 | 3,735 | 1,227.36 |
INTEREST—The following table shows the payments of interest.
| Year Ended 31 March | Interest | Interest on Overseas Debt as Percentage of Export Income | Recovery of Interest from Government Enterprises and Investments | Net Interest Cost | Net Cost as a Percentage of Total Taxation | ||
|---|---|---|---|---|---|---|---|
| Overseas | New Zealand | Total | |||||
| NZ$(thousand) | |||||||
| 1969 | 28,767 | 103,592 | 132,359 | 3.0 | 84,128 | 48,231 | 4.6 |
| 1970 | 30,840 | 113,355 | 144,195 | 2.7 | 89,946 | 54,249 | 4.6 |
| 1971 | 32,076 | 120,943 | 153,019 | 2.8 | 97,712 | 55,307 | 3.8 |
| 1972 | 36,260 | 130,548 | 166,808 | 2.7 | 106,402 | 60,406 | 3.5 |
| 1973 | 38,318 | 146,499 | 184,817 | 2.3 | 118,970 | 65,847 | 3.4 |
| 1974 | 34,092 | 166,231 | 200,323 | 1.9 | 127,498 | 72,825 | 3.0 |
RECENT LOANS—Details of loans for preceding periods are given in earlier issues of the Yearbook.
External Loans—The following is a list of official overseas borrowing undertaken by New Zealand in the 1970s.
In July 1970 the Government entered into a revolving multi-currency credit agreement with a consortium of international banks led by the Bankers Trust Company, London, for a loan of the equivalent of US$40 million. The loan was raised in two tranches, each of the equivalent of US$20 million (NZ$17.8 million). At 6-monthly intervals the Government has the option of renewing the two tranches of the loan at current interest rates in any one of three euro-currencies or repaying them.
In November 1970 a bond issue was floated on the Swiss capital market. This issue, which was fully subscribed, was for a term of 15 years and raised 50 million Swiss francs, equivalent to about NZ$10.37 million. The coupon was 6 3/4 percent with an issue price of 98.
In April 1971 a loan was raised for 100 million deutschemark in bearer bonds at 7 1/2 percent maturing 1986.
A placement of 100 million Swiss francs was made on 1 July 1971 with bearer bonds at 7 1/4 percent maturing 1976.
A placement of 60 million Dutch guilders was raised in August 1971 with bearer bonds at 7 1/4 percent maturing 1978.
A loan of £(stg)10 million was raised in London in December 1971 with 7 1/4 percent stock issued at £99 3/4 percent maturing 1977.
In February 1972 a loan of 100 million deutschemark was raised with D.M. bearer bonds at 7 percent maturing 1987.
In April 1972 a loan of 60 million Dutch guilders was raised with bearer notes at 6 3/4 percent maturing 1979.
In May 1972 a loan of 75 million francs (NZ$12.3 million) with a consortium of international banks in Paris for 15 years at 7 1/4 percent was arranged.
In June 1973 a loan was raised for 75 million francs being bearer bonds at 7.25 percent, redeemable for a sinking fund and maturing 1987.
In September 1974 a placement of 100 million Swiss Francs was made with bearer notes at 9 percent maturing 1979.
Also in September 1974 a multi-currency revolving credit for up to US$400 million or its equivalent was signed with a consortium of international banks led by Lloyds Bank International Ltd. The interest rate on any drawing under the credit is determined on the basis of the then current rate for the currency drawn as quoted by Prime bonds on the London inter-bank market. The credit has a life of 5 years.
In November 1974 a first drawing of NZ$78.5 million was made under I.M.F. oil facilities, and a second drawing of NZ$21 million was made in January 1975.
Further loans totalling NZ$58 million were raised in West Germany during January 1975.
Internal Loans—The following is a list of cash and conversion loans for New Zealand Government stock from 1973.
Cash Loans—In July 1973 a cash loan was opened and stocks offered at par were 4.10 percent 15 July 1991; the amount subscribed was $135.8 million.
The second cash loan for the year was offered at the same interest rates in December and the subscription was $75.3 million for maturity in December 1976, 1979, and 1991.
A cash loan in August 1974 with interest rates unchanged was subscribed to the amount of $6.0 million.
Conversion Loans—Conversion loans in the 1972-73 financial year resulted in the conversion of $85.6 million and in the 1973-74 financial year $42.9 million. Four conversion loans were raised during the 1974-75 financial year, totalling $32.9 million.
MATURITY YEARS OF DEBT—The maturity years of the debt outstanding at 31 March 1974 are shown in the following statement, which distinguishes between overseas and internal debt. All amounts shown may be regarded as being either in New Zealand dollars or in nominal amounts.
| Loans Maturing in Financial Year Ending 31 March* | Due | Total Debt (Nominal Amount) | ||
|---|---|---|---|---|
| Overseas | New Zealand | |||
| Public | Departmental and Other | |||
| *In respect of many of the loans, the Government has the option to redeem the securities at an earlier date. | ||||
| $(000) | $(000) | $(000) | $(000) | |
| 1975 | 15,625 | 47,094 | 101,191 | 163,910 |
| 1976 | 30,801 | 86,956 | 194,686 | 312,443 |
| 1977 | 63,898 | 122,756 | 147,026 | 333,680 |
| 1978 | 58,445 | 79,544 | 129,965 | 267,954 |
| 1979 | 44,063 | 130,036 | 122,621 | 296,720 |
| 1980 | 48,692 | 96,214 | 91,225 | 236,131 |
| 1981 | 43,827 | - | 79,000 | 122,827 |
| 1982 | 13,545 | 40,488 | 47,054 | 101,087 |
| 1983 | 15,822 | 84,450 | 110,221 | 210,493 |
| 1984 | 45,257 | 95,316 | 69,256 | 209,829 |
| 1985 | 17,424 | 107,863 | 39,992 | 165,279 |
| 1986 | 12,924 | 73,944 | 119,019 | 205,887 |
| 1987 | 25,081 | 39,993 | 23,677 | 88,751 |
| 1988 | 2,485 | 56,436 | 72,976 | 131,897 |
| 1989 | 4,241 | 39,382 | 79,383 | 123,006 |
| 1990 | - | 90,065 | 59,014 | 149,079 |
| 1991 | - | 168,879 | 124,312 | 293,191 |
| 1992 | - | 149,013 | 148,119 | 297,132 |
| 1993 | 23,080 | 1,552 | - | 24,632 |
| Registered Treasury Bills | - | 600 | - | 600 |
| Totals | 465,210 | 1,510,581 | 1,758,737 | 3,734,528 |
OWNERSHIP OF PUBLIC DEBT—As shown in the preceding table, a large proportion of the public debt outstanding is held by various Government departments and quasi-Government organisations. A summary of these investments for the latest three years is as follows.
| Stockholder | At 31 March | ||
|---|---|---|---|
| 1972 | 1973 | 1974 | |
| $(thousand) | |||
| Investments held by accounts within the Public Account | 27,981 | 27,981 | 95,978 |
| Earthquake and War Damage Commission | 129,554 | 138,554 | 157,244 |
| Government Life Insurance | 58,057 | 65,556 | 68,656 |
| Government Superannuation Board | 195,187 | 228,587 | 259,587 |
| Maori Trustee | 6,758 | 6,657 | 6,958 |
| National Provident Fund | 58,174 | 91,174 | 90,394 |
| Post Office | 614,590 | 692,090 | 788,228 |
| Post Office: National Savings | 338 | 338 | 200 |
| Public Trustee | 3,601 | 4,101 | 2,933 |
| Reserve Bank | 12,607 | 432 | 131,529 |
| State Advances Corporation | 45,112 | 52,612 | 58,112 |
| State Insurance Office | 7,292 | 8,596 | 8,610 |
| Meat Industry Account | 74,179 | 69,639 | 72,639 |
| Wool Commission Account | 30,730 | 29,781 | 17,669 |
| Totals | 1,264,160 | 1,416,098 | 1,758,737 |
Other holders of Government stock at 31 March 1974 included trustee savings banks ($371.6 million), private savings banks ($323.0 million), life insurance companies ($294.5 million), and trading banks ($221.9 million).
GENERAL—The constitution and franchise of local authorities are described in Section 2, History, Government, and International Relations.
Local government is concerned with the provision of facilities for the population of a limited area, with finances levied from that area. The major authorities are city, borough, and county councils. These authorities raise money mainly by rates on property and by loans. They expend it on the provision of roads, water supply, sewerage, transport, recreational, and other services. Electric power boards and harbour boards, among the larger of the other local authorities, collect revenue from consumers or users in payment for the facilities or services provided.
Detailed statistics relating to each local authority, other than hospital boards, are contained in the Report on the Local Authority Statistics, an annual publication of the Department of Statistics. Hospital boards, which supply their returns to the Department of Health, are omitted from most of the statistics contained in this section. A special note is made where they are included, while summarised data relating to hospital boards will be found in Section 5B.
In general, the local authority year ends on 31 March. Exceptions are harbour boards (other than Greymouth) where the year ends on the preceding 30 September, the Hutt Valley Drainage Board where the year ends on the last day of February, and Chatham Islands County, where the financial year now ends on 31 December.
RATING—Local authorities are largely dependent on revenue from rates to carry out their activities, and even loans raised for special purposes are, except where the assets purchased provide revenue to meet the loan charges, ultimately liquidated by rate revenues—known then as special rates. The law relating to the making and levying of rates is contained in the Rating Act 1967. Three broad classes of rates are distinguished:
General, for general purposes.
Special rates imposed to secure the repayment of loan money, being sufficient to produce interest and sinking fund, or interest and instalment of principal, as the case may be; and
Separate rates levied for the construction of public works, for the acquisition of land and buildings, or for the benefit of the whole or part of a local district.
There are three main systems of rating: (a) by capital (land and improvements) value; (b) by annual value; and (c) by unimproved value.
For rating on either the capital value or the unimproved value, the rating roll is based on the district valuation roll prepared by the Valuation Department. Where the rating is on the annual value, the local authority generally prepares its valuation roll on the basis of the valuations made by its own valuers. Separate rates require to be struck on the annual value, and when the annual value has not been entered in the valuation roll, the annual value is required to be taken as 6 percent of the capital value. Provision is made for the Valuer-General to act as a local authority valuer where an annual roll is to be prepared.
For Chatham Islands county, import and export dues are charged in lieu of rates on land. In the case of pest destruction boards the system normally used is by rating on an acreage basis, though occasionally some boards rate according to the number of sheep and/or cattle carried.
The system of rating normally attributed to a local authority is that applicable to the general rate, but it is stressed that, in many instances, subsidiary rates of the local authority are levied in accordance with other systems.
The Local Authorities (Petroleum Tax) Act 1970 authorised territorial local authorities in 21 tax areas covering the country to levy a local authorities petroleum tax at the rate of 1, 2, or 3 cents a gallon on motor spirits and 0.5, 1, or 1.5 cents a gallon on diesel fuel delivered in a tax area. All tax areas voted to levy the tax at the maximum rate mostly from 1 February 1971. The proceeds of any tax imposed may be applied to projects for the benefit of the region or distributed among the constituent local authorities according to their proportions of total rate revenue. This legislation was designed to spread the rating burden of ratepayers.
With harbour boards, two types of rates are applicable, namely: (a) harbour improvement rates, based on so much per ton of cargo by weight or measurement; and (b) harbour rates on rateable property, which are levied according to the system of rating in force by each of the local authorities within the harbour boards' rating areas. However, the Rating Act 1967 gives to harbour boards the power to have a system of rating different from that in force in all or some of its constituent local authority districts.
RATING BY TERRITORIAL LOCAL AUTHORITIES—The following table shows the amounts levied under the various systems of rating and by annual fees or charges by the territorial local authorities for the year ended 31 March 1973. Amounts levied on behalf of other authorities are included.
| System of Rating | Counties | Cities and Boroughs | Town Districts | Total |
|---|---|---|---|---|
| $(thousand) | ||||
| Unimproved value | 28,551 | 72,098 | 277 | 100,925 |
| Capital value | 9,163 | 3,738 | 38 | 12,939 |
| Flat rate | 1,745 | 8,013 | 24 | 9,783 |
| Annual value | 1 | 20,409 | 7 | 20,418 |
| Uniform fees and charges | 501 | 2,078 | 26 | 2,606 |
| Totals | 39,962 | 106,336 | 373 | 146,671 |
The total of all rates collected by counties was equal to $6.31 per $1,000 of rateable capital value at the beginning of the year. The corresponding figure for cities and boroughs was $10.35; for independent town districts, $10.68; for dependent town districts, $6.28 (excluding rates levied by county councils). Total rate receipts have remained as a relatively constant percentage of gross national product, national income, and private disposable income, despite short-term fluctuations.
| Financial Year Ended 31 March | Rates and Levies | Annual Increase | Rates and Levies as % of GNP | Rates and Levies as % of N.I. | Rates and Levies as % of P.D.I. |
|---|---|---|---|---|---|
| $(m) | Percent | Percent | Percent | Percent | |
| 1951 | 25.2 | .. | 1.81 | 2.06 | 1.91 |
| 1952 | 29.0 | 15.1 | 2.01 | 2.32 | 2.15 |
| 1953 | 30.7 | 6.2 | 2.03 | 2.34 | 2.17 |
| 1954 | 32.8 | 6.5 | 1.95 | 2.23 | 2.09 |
| 1955 | 36.5 | 11.3 | 1.96 | 2.24 | 2.14 |
| 1956 | 37.8 | 3.6 | 1.92 | 2.24 | 2.11 |
| 1957 | 41.3 | 9.3 | 2.00 | 2.33 | 2.10 |
| 1958 | 45.4 | 9.9 | 2.08 | 2.43 | 2.27 |
| 1959 | 48.8 | 7.5 | 2.15 | 2.54 | 2.36 |
| 1960 | 51.5 | 5.5 | 2.12 | 2.48 | 2.29 |
| 1961 | 55.0 | 6.8 | 2.10 | 2.45 | 2.26 |
| 1962 | 58.0 | 5.5 | 2.13 | 2.51 | 2.32 |
| 1963 | 62.4 | 7.7 | 2.14 | 2.50 | 2.32 |
| 1964 | 68.3 | 9.5 | 2.14 | 2.49 | 2.33 |
| 1965 | 77.2 | 13.0 | 2.21 | 2.57 | 2.42 |
| 1966 | 80.5 | 4.3 | 2.13 | 2.47 | 2.33 |
| 1967 | 85.9 | 6.7 | 2.19 | 2.56 | 2.40 |
| 1968 | 92.4 | 7.6 | 2.27 | 2.67 | 2.51 |
| 1969 | 99.9 | 8.1 | 2.31 | 2.72 | 2.56 |
| 1970 | 108.1 | 8.2 | 2.28 | 2.68 | 2.53 |
| 1971 | 117.9 | 9.1 | 2.17 | 2.54 | 2.58 |
REVENUE AND EXPENDITURE—The sources of revenue of all local authorities including electric power boards, and hospital boards, are shown by broad classes in the following table.
| Year Ended 31 March | Rates and Levies | Public Utilities Rents and Licence Fees | Government Grants and Subsidies | Other Receipts (Including Loan Money) | Total Receipts |
|---|---|---|---|---|---|
| $(thousand) | |||||
| 1968 | 92,447 | 200,222 | 42,316 | 95,031 | 430,016 |
| 1969 | 99,877 | 223,670 | 44,896 | 104,206 | 472,649 |
| 1970 | 108,085 | 240,190 | 49,231 | 105,834 | 503,341 |
| 1971 | 117,919 | 262,701 | 53,558 | 101,902 | 536,080 |
| 1972 | 126,251 | 297,638x | 54,554 | 115,008 | 593,451 |
| 1973 | 148,508 | 330,887 | 66,037 | 150,610 | 696,042 |
Rates were equivalent to $58.21 per head of mean population in 1972-73.
A fairly large proportion of the receipts of urban local authorities result from the sales of commodities or services, for instance, sales of electric power and gas, and fares collected for public transport.
The expenditure of all local authorities during each of the latest 11 years has been as follows.
| Year Ended 31 March | Maintenance and Construction | Administration | Interest on Loans | Other | Total Expenditure |
|---|---|---|---|---|---|
| $(thousand) | |||||
| 1963 | 222,840 | 15,420 | 15,816 | 32,400 | 286,476 |
| 1964 | 241,516 | 18,116 | 17,520 | 52,470 | 329,624 |
| 1965 | 262,838 | 19,974 | 19,178 | 59,116 | 361,106 |
| 1966 | 288,668 | 22,866 | 20,616 | 55,392 | 387,544 |
| 1967 | 302,976 | 24,543 | 22,931 | 51,108 | 401,558 |
| 1968 | 311,367 | 27,152 | 25,747 | 56,482 | 420,748 |
| 1969 | 334,730 | 29,127 | 27,341 | 65,420 | 456,618 |
| 1970 | 362,808 | 31,787 | 30,036 | 67,452 | 492,082 |
| 1971 | 402,355 | 36,538 | 32,115 | 68,178 | 539,186 |
| 1972 | 451,814 | 46,576 | 34,254 | 72,013 | 604,657 |
| 1973 | 498,796 | 53,461 | 36,824 | 85,155 | 674,236 |
Receipts and payments of the various classes of local authorities during 1972-73 are shown below.
| Local Authority | Receipts | |||
|---|---|---|---|---|
| Rates | Public Utilities, Licences, Rents, Interest | Government Grants and Subsidies | Total Receipts (Inc. Other) | |
| $(000) | ||||
| City and borough councils | 97,855 | 108,347 | 20,184 | 290,303 |
| County councils | 35,824 | 22,664 | 31,515 | 113,316 |
| Electric power boards | - | 129,197 | - | 145,344 |
| Harbour boards | 3,587 | 36,546 | 103 | 54,555 |
| Regional authority | - | 15,823 | 1,626 | 36,210 |
| Urban drainage boards | 4,721 | 361 | 78 | 10,213 |
| Catchment boards | 3,047 | 229 | 6,543 | 13,473 |
| Fire boards | - | 11,363 | 1,228 | 13,914 |
| Pest destruction boards | 1,666 | 159 | 2,442 | 4,484 |
| Urban transport board | 852 | 1,893 | 24 | 3,091 |
| Other local authorities | 956 | 4,305 | 2,294 | 11,139 |
| Totals | 148,508 | 330,887 | 66,037 | 696,042 |
| Local Authority | Payments | |||
|---|---|---|---|---|
| Maintenance and Construction | Administration | Interest and Loans Repaid | Total Payments (Inc. Other) | |
| $(000) | ||||
| City and borough councils | 203,533 | 19,426 | 32,662 | 277,577 |
| County councils | 83,181 | 9,463 | 6,445 | 107,584 |
| Electric power boards | 116,330 | 12,350 | 11,506 | 146,682 |
| Harbour boards | 35,678 | 4,627 | 14,431 | 56,039 |
| Regional authority | 22,532 | 1,693 | 7,512 | 32,516 |
| Urban drainage boards | 5,000 | 673 | 3,716 | 9,658 |
| Catchment boards | 8,862 | 2,256 | 578 | 12,935 |
| Fire boards | 11,077 | 504 | 595 | 12,227 |
| Pest destruction boards | 3,884 | 486 | 33 | 4,470 |
| Urban transport board | 3,078 | 295 | 205 | 3,622 |
| Other local authorities | 6,241 | 1,688 | 2,484 | 10,926 |
| Totals | 498,796 | 53,461 | 80,167 | 674,236 |
ANALYSIS OF EXPENDITURE—The next table sets out details of total expenditure of local authorities by categories. (Source: Local Authority Finance in New Zealand.)
| Year Ended 31 March | Territorial Local Authorities | Non-territorial Authorities | ||||
|---|---|---|---|---|---|---|
| Counties | Municipalities | Auckland Regional Authority | Total | Annual Change | ||
| $(million) | $(million) | $(million) | $(million) | Percent | $(million) | |
| (a) In Money Terms | ||||||
| 1966 | 66 | 165 | 12 | 243 | .. | 145 |
| 1967 | 70 | 172 | 11 | 253 | +4.1 | 149 |
| 1968 | 69 | 172 | 14 | 255 | +0.8 | 166 |
| 1969 | 74 | 186 | 18 | 278 | +9.0 | 179 |
| 1970 | 81 | 203 | 19 | 303 | +9.0 | 189 |
| 1971 | 88 | 222 | 22 | 332 | +9.6 | 207 |
| (b) In Real Terms (1971 prices) | ||||||
| 1966 | 95 | 238 | 17 | 350 | .. | 209 |
| 1967 | 99 | 243 | 16 | 358 | +2.3 | 221 |
| 1968 | 95 | 236 | 19 | 350 | -2.2 | 228 |
| 1969 | 95 | 239 | 23 | 357 | +2.0 | 230 |
| 1970 | 100 | 250 | 23 | 373 | +4.5 | 233 |
| 1971 | 98 | 248 | 25 | 371 | -0.5 | 231 |
The next table shows, in real terms, trends in expenditure per head of population, by types of local authorities in real terms (1971 prices). (Source: Local Authority Finance in New Zealand.)
| Year Ended 31 March | Territorial Local Authorities | Non-territorial Authorities | ||||
|---|---|---|---|---|---|---|
| Counties | Municipalities | Auckland Regional Authority | All | Annual Change | ||
| Percent | ||||||
| 1966 | 105 | 139 | 29 | 131 | .. | 78 |
| 1967 | 117 | 134 | 26 | 131 | - | 77 |
| 1968 | 110 | 128 | 30 | 127 | -3.1 | 83 |
| 1969 | 110 | 127 | 36 | 129 | +1.6 | 83 |
| 1970 | 116 | 131 | 35 | 132 | +2.3 | 82 |
| 1971 | 112 | 128 | 37 | 130 | -1.5 | 79 |
Total capital expenditure by all local authorities is shown in the following table.
| Year Ended 31 March* | In Money Terms | Annual Change | In Real Terms | Annual Change | In Real Terms per Head of Population | Annual Change |
|---|---|---|---|---|---|---|
| *Derived from the Ministry of Works Local Authority 5-year Capital Expenditure Survey. | ||||||
| $(million) | Percent | $(million) | Percent | $ | Percent | |
| 1967 | 129 | +3.2 | 182 | +0.6 | 67.5 | -0.7 |
| 1968 | 132 | +2.3 | 181 | -0.5 | 66.1 | -2.1 |
| 1969 | 136 | -3.0 | 174 | -3.9 | 63.0 | -4.7 |
| 1970 | 147 | +8.1 | 181 | +4.0 | 64.8 | +2.9 |
| 1971 | 162 | +10.2 | 181 | - | 63.9 | -1.2 |
| 1972 | 175 | +8.0 | 175 | -3.3 | 60.8 | -4.9 |
The following is a breakdown of the preceding table in categories of local authorities. (Source: Local Authority Finance in New Zealand).
| Year Ended 31 March | Territorial Local Authorities | Non-territorial Authorities | ||||
|---|---|---|---|---|---|---|
| Counties | Municipalities | Auckland Regional Authority | Total | Annual | ||
| $(million) | $(million) | $(million) | $(million) | Percent | $(million) | |
| (a) In Money Terms | ||||||
| 1967 | 28.1 | 50.5 | 1.2 | 79.7 | +2.2 | 49.2 |
| 1968 | 25.9 | 46.5 | 3.1 | 75.5 | -5.4 | 56.5 |
| 1969 | 27.9 | 43.9 | 4.1 | 75.9 | +0.5 | 60.1 |
| 1970 | 31.4 | 50.8 | 4.9 | 87.1 | +14.8 | 59.9 |
| 1971 | 33.0 | 55.1 | 6.0 | 94.1 | +8.0 | 67.9 |
| 1972 | 35.1 | 48.0 | 8.5 | 91.6 | -2.7 | 83.4 |
| (b) In Real Terms (1971 prices) | ||||||
| 1967 | 39.7 | 71.3 | 1.7 | 112.7 | - | 69.3 |
| 1968 | 35.6 | 63.8 | 4.3 | 103.7 | -8.0 | 77.3 |
| 1969 | 35.8 | 56.3 | 5.3 | 97.4 | -6.5 | 77.1 |
| 1970 | 38.7 | 62.7 | 6.0 | 107.3 | +10.6 | 73.7 |
| 1971 | 36.9 | 61.6 | 6.7 | 105.2 | -2.0 | 75.8 |
| 1972 | 35.1 | 48.0 | 8.5 | 91.6 | -12.9 | 83.4 |
TERRITORIAL LOCAL AUTHORITIES—The following table shows total receipts and payments of territorial local authorities for years ended 31 March. The local authorities petroleum tax introduced in March 1971 produced $15.6 million in 1971-72 and $16.9 million in 1972-73 for the general purposes of territorial authorities.
| Item | 1966-67 | 1967-68 | 1968-69 | 1969-70 | 1970-71 | 1971-72 |
|---|---|---|---|---|---|---|
* Receipts from municipal undertakings and other trading activities are included under “Works and services”. † Receipts under “Repayment of advances and payments from other local authorities” include the ARA's levy on constituent local authorities and revenue from its bulk water sales. | ||||||
| Receipts $(million) | ||||||
| Rates (including grants and charges in lieu) | 76.5 | 82.6 | 89.5 | 96.9 | 106.2 | 113.2 |
| Inspection charges | 2.9 | 2.8 | 2.9 | 4.0 | 4.3 | 4.6 |
| National Roads Board | 29.7 | 28.4 | 30.7 | 33.8 | 36.5 | 36.5 |
| Government grants and subsidies | 4.6 | 5.0 | 5.6 | 6.4 | 7.3 | 7.9 |
| Works and services* | 76.6 | 75.0 | 84.5 | 89.8 | 100.4 | 113.3 |
| Rents | 3.5 | 4.0 | 4.6 | 4.9 | 5.3 | 11.5 |
| Interest | 2.7 | 3.1 | 3.6 | 4.2 | 4.6 | |
| Sale of capital assets | 3.6 | 3.7 | 3.8 | 5.0 | 5.4 | 5.7 |
| Petrol tax | - | - | - | - | - | 14.8 |
| Loan money | 35.3 | 38.1 | 42.5 | 41.4 | 40.1 | 43.5 |
| Repayment of advances and payments from other local authorities† | 4.5 | 6.6 | 8.2 | 8.9 | 10.2 | 7.2 |
| Other | 8.5 | 12.3 | 13.4 | 12.4 | 9.1 | 10.0 |
| Total | 248.4 | 261.6 | 289.3 | 307.7 | 329.3 | 368.1 |
| Percentage increase on previous year | 6.7% | 5.3% | 10.6% | 6.4% | 7.0% | 11.9% |
| Percentage of GNP | 6.3% | 6.4% | 6.7% | 6.4% | 6.0% | 5.9% |
| Payments $(million) | ||||||
| Maintenance and construction | 192.9 | 189.9 | 202.9 | 223.2 | 247.9 | 292.2 |
| Administration | 14.0 | 15.7 | 17.0 | 18.6 | 20.8 | 26.8 |
| Loan repayments (excluding interest) | 16.8 | 18.3 | 24.7 | 24.9 | 23.5 | 22.3 |
| Interest on loans | 13.3 | 15.6 | 16.4 | 18.2 | 18.9 | 20.1 |
| Other payments | 15.6 | 15.2 | 16.6 | 17.9 | 21.2 | 24.9 |
| Total | 252.6 | 254.7 | 277.7 | 302.8 | 332.3 | 386.3 |
| Percentage increase on previous year | 4.0% | 0.8% | 9.0% | 9.1% | 9.7% | 16.2% |
| Percentage of GNP | 6.4% | 6.3% | 6.4% | 6.4% | 6.1% | 6.2% |
Works and Services—The item “works and services” in the preceding table covers a wide variety of public utilities and amenities being provided by territorial local government, the main ones being abattoirs, gasworks, passenger transport undertakings, and electricity supply undertakings.
| Year | Receipts | Payments |
|---|---|---|
| $(million) | $(million) | |
| 1963-64 | 62.9 | 86.9 |
| 1964-65 | 64.9 | 92.5 |
| 1965-66 | 72.3 | 104.9 |
| 1966-67 | 76.6 | 113.0 |
| 1967-68 | 75.0 | 114.3 |
| 1968-69 | 84.5 | 127.0 |
| 1969-70 | 89.8 | 136.1 |
| 1970-71 | 100.4 | 153.7 |
| 1971-72 | 113.3 |
Many of the services provided are also trading undertakings. Generally speaking, territorial local authorities are restrained from operating trading undertakings that are particularly profitable. Public transport undertakings, which are usually a substantial burden upon ratepayers, are particularly unprofitable. The only major exception is electricity distribution from which a few territorial local authorities make surpluses.
Grants and Subsidies—The following table shows grants and subsidies received by territorial local authorities for years ended 31 March. As can be seen these form a substantial portion of local authority revenues.
| Item | 1966-67 | 1967-68 | 1968-69 | 1969-70 | 1970-71 |
|---|---|---|---|---|---|
| $(000) | $(000) | $(000) | $(000) | $(000) | |
| National Roads Board | 29,674 | 28,353 | 30,685 | 33,745 | 36,467 |
| Roads Vote (M.O.W.) (Development Roading) | 1,045 | 1,950 | 1,950 | 2,150 | 2,340 |
| N.Z. Forest Service (fifths) | 183 | 215 | 250 | 193 | 245 |
| Sewage treatment | 46 | 91 | 107 | 182 | 62 |
| Water and sewerage | - | - | - | - | 1,032 |
| Rural water supply | 67 | 153 | 91 | 301 | 105 |
| Pensioner housing | 544 | 1,024 | 930 | 848 | 1,199 |
| Urban renewal | 26 | - | - | - | 52 |
| Civil defence | - | 21 | 31 | 49 | 59 |
| Rural electricity distribution | 22 | 23 | 16 | 9 | 6 |
| Pest destruction | - | 68 | 62 | 59 | 85 |
| Noxious weeds eradication | 130 | 124 | 153 | 204 | 304 |
| Miscellaneous | 2,564 | 1,289 | 2,015 | 2,413 | 1,777 |
| Totals | 34,301 | 33,311 | 36,290 | 40,153 | 43,733 |
National Roads Board—The finance available from the National Roads Fund represents an important source of revenue for territorial local authorities. (See section 11c.)
Forest Service Fifths—The New Zealand Forest Service distributes to territorial local authorities grants equal to one-fifth of net revenue received from the sale of timber, and in the case of national endowment land, one-tenth of net revenue from the sale of timber.
Water and Sewerage Subsidies—From 1960 until 1969 a sewage treatment subsidy was available to local authorities with populations of less than 20,000. In 1969 this scheme was replaced by a more comprehensive water and sewerage subsidy scheme administered by the Department of Health, which provided assistance towards certain loan repayments on existing works and towards the capital costs of new works. There was a subsidy limit of $100,000 for any one project. Up to 31 March 1972 $5.9 million had been approved in respect of this and the earlier scheme. In 1972 the subsidy limit was abolished. This is expected to increase total annual subsidy payments under the scheme to some $8.8 million within a few years and at the same time further stimulate or encourage the upgrading and extension of water and sewerage facilities.
Rural Water Supply Scheme—The Rural Water Supply Scheme is administered by the Ministry of Works and Development and provides for subsidies towards the cost of piped water supply to rural areas.
Pensioner Housing—Since inception in 1951 the scheme has aided the construction of over 7,000 units by local authorities. Government subsidies and loans are available.
Urban Renewal—Grants for urban renewal have been available for local authorities since 1945. Since the passing of the Urban Renewal and Housing Improvement Act in 1969 a number of local authorities have exhibited a renewed interest in urban renewal projects. This is reflected in grants of $52,000 and $47,322 being made for the years 1970-71 and 1972-73 respectively, whereas for the 3 previous years no grants were made.
Civil Defence—A dollar-for-dollar subsidy towards some items of civil defence costs is paid by the Ministry of Civil Defence.
Rural Electricity Distribution—The Rural Electricity Reticulation Council has since 1947 provided subsidies towards the cost of rural electricity distribution lines. The chief beneficiaries have been power boards, but small amounts ($6,000 in 1970-71 and $975 in 1972-73) have been paid to territorial local authorities.
Noxious Weeds Eradication—The Ministry of Agriculture and Fisheries operates the subsidy scheme on the cost of noxious weeds eradication.
Urban Passenger Transport—Municipal and private urban passenger transport operators receive subsidies based on the heavy traffic licence fees they pay. The annual payments are approximately $1 million. The scheme is administered by the Ministry of Transport.
Local Authorities Petroleum Tax—Local authorities receive a tax of 3c per gallon on petrol and 1.5c on diesel fuel. For 1972-73 this tax produced $16.9 million, compared with $15.6 million in 1971-72.
BORROWING—Under the Local Authorities Loans Act 1956 all loan proposals of local authorities, except in regard to money borrowed in anticipation of revenue, require the sanction of the Local Authorities Loans Board.
As a general rule local authorities may raise a loan by special order and without a poll of ratepayers, but in the case of a local authority that is a rating body, a poll of ratepayers is to be taken if—
The Local Authorities Loans Board requires a poll to be taken; or
Before the date fixed for the meeting of the local authority to confirm the resolution to raise the loan not less than 5 percent of the ratepayers demand a poll; or
The local authority itself decides to take a poll.
A poll cannot be required in cases such as renewal loans, loans raised for emergency expenditure by reason of flood, storm, earthquake, etc., or loans for work of national and local importance and carried out by an agreement between the Government and a local authority.
Where a poll is required it shall be deemed to be carried if a bare majority of the valid votes recorded is in favour of the proposal. The properties and revenue of the local authority may be pledged as security for the repayment of any principal sum or interest thereon, or a special rate may be levied for the same purpose.
The borrowing activities of certain types of local authority are subject to special provisions. Under the Hospitals Act 1957 a hospital board must first obtain the approval of the Minister of Health before exercising its power to borrow. Harbour boards derive their authority to borrow for harbour works from special empowering legislation and similar authority is given for the capital works of certain other local authorities.
The Local Authorities Loans Act 1956 places the determination of rates of interest in the hands of the Local Authorities Loans Board, subject to the approval of the Minister of Finance of the maximum rate.
The current interest rates are as follows: 1 year, 4.5 percent; 2 years, 4.75 percent; 3 years, 5 percent; 4 years, 5.25 percent; 5 years, 5.5 percent; 6-9 years, 5.75 percent; 10 years and over, 6.25 percent.
Total borrowing by types of local authorities is shown in the following table. (Source: Local Authority Finance in New Zealand.)
| Year Ended 31 March | Territorial Local Authorities | Non-Territorial Authorities | |||
|---|---|---|---|---|---|
| Counties | Municipalities | Auckland Regional Authority | Total | ||
| $(million) | $(million) | $(million) | $(million) | $(million) | |
| (a) In Money Terms | |||||
| 1966 | 6.6 | 23.0 | 4.3 | 34.0 | 35.1 |
| 1967 | 5.8 | 26.4 | 4.7 | 36.9 | 28.9 |
| 1968 | 6.9 | 27.7 | 4.2 | 38.8 | 40.0 |
| 1969 | 6.2 | 29.6 | 5.9 | 41.7 | 55.8 |
| 1970 | 6.8 | 28.1 | 6.7 | 41.6 | 47.1 |
| 1971 | 6.1 | 27.2 | 6.9 | 40.3 | 54.1 |
| 1972 | 8.1 | 28.4 | 7.0 | 43.5 | 50.3 |
| (b) In Real Terms (1971 prices) | |||||
| 1966 | 9.5 | 34.3 | 6.2 | 50.0 | 50.7 |
| 1967 | 8.2 | 37.5 | 6.6 | 52.1 | 40.5 |
| 1968 | 9.5 | 37.9 | 5.8 | 53.2 | 55.2 |
| 1969 | 8.0 | 38.0 | 7.6 | 53.5 | 71.6 |
| 1970 | 8.4 | 34.7 | 8.3 | 51.4 | 58.2 |
| 1971 | 6.8 | 30.4 | 7.7 | 45.1 | 60.4 |
| 1972 | 8.1 | 28.4 | 7.0 | 43.5 | 50.3 |
The Local Authorities Loans Board has, in recent years, authorised between 80 and 90 percent of applications for loans. However, not all loan money sanctioned by the board has actually been raised. The following table shows that the percentage of authorised borrowing actually raised within 6 years of authorisation has remained fairly constant at about three-quarters of the amount of the authorisations.
| Year Ended 31 March | Loans Actually Raised Within 6 Years of Authorisation | |||
|---|---|---|---|---|
| Counties | Municipalities | Auckland Regional Authority | All Territorial Authorities | |
| Percent | Percent | Percent | Percent | |
| 1966 | 77.8 | 75.2 | 50.4 | 73.4 |
| 1967 | 80.1 | 77.8 | 57.2 | 75.9 |
| 1968 | 81.3 | 79.3 | 55.5 | 76.4 |
| 1969 | 78.0 | 79.8 | 58.6 | 76.1 |
| 1970 | 80.1 | 81.1 | 69.9 | 79.0 |
| 1971 | 72.5 | 76.3 | 80.4 | 76.2 |
Loans Sanctioned, Authorised, Raised, and Uplifted—The following summary of the operations of the Local Authorities Loans Board during the last 11 years shows concisely the trend of local authority borrowing during that period. Hospital boards are included in this instance.
| Year | Value of Total Applications | Sanctioned | |
|---|---|---|---|
| New Works | Redemption Loans | ||
| $(thousand) | |||
| 1963-64 | 88,980 | 62,474 | 24,364 |
| 1964-65 | 90,360 | 59,042 | 20,316 |
| 1965-66 | 111,130 | 80,006 | 15,216 |
| 1966-67 | 93,834 | 64,154 | 13,390 |
| 1967-68 | 115,741 | 71,692 | 13,729 |
| 1968-69 | 109,903 | 86,782 | 18,805 |
| 1969-70 | 115,673 | 91,296 | 16,050 |
| 1970-71 | 109,666 | 81,776 | 15,564 |
| 1971-72 | 184,900 | 133,400 | 13,000 |
| 1972-73 | 154,950 | 110,830 | 21,430 |
| 1973-74 | 254,750 | 183,780 | 15,960 |
The following table shows loans authorised during year ended March 1973, with amounts raised and uplifted to 31 March 1973 on these authorisations.
| Local Authority | Amounts Authorised Year Ended 31 March 1973 | Amounts Raised to 31 March 1973 | Balance Not Raised at 31 March 1973 | Amounts Uplifted to 31 March 1973 |
|---|---|---|---|---|
| $(thousand) | ||||
| Catchment boards | 866 | 201 | 665 | 703 |
| City and borough councils | 44,818 | 17,968 | 26,850 | 28,027 |
| County councils | 17,334 | 6,416 | 10,919 | 12,374 |
| Electric power and gas boards | 11,908 | 6,265 | 5,642 | 6,100 |
| Fire boards | 657 | 187 | 470 | 506 |
| Harbour boards | 17,751 | 7,849 | 9,903 | 9,903 |
| Harbour bridge authority | 380 | 379 | 1 | 1 |
| Hospital boards | 23,485 | 5,341 | 18,145 | 18,408 |
| Pest destruction boards | 25 | 25 | - | 10 |
| Regional authority | 15,328 | 1,258 | 14,071 | 14,071 |
| Town boards | 272 | 37 | 235 | 235 |
| Urban drainage boards | 2,728 | 912 | 1,816 | 1,816 |
| Totals | 135,553 | 46,837 | 88,717 | 92,153 |
The following table shows comparative debt figures. Hospital boards are included.
| Year Ended 31 March | Amounts Sanctioned by Loans Board | Amounts Authorised by Orders in Council | Gross Indebtedness at Beginning of Year | Amount Uplifted | Principal Repaid | Gross Indebtedness at End of Year |
|---|---|---|---|---|---|---|
| $(thousand) | ||||||
| 1963 | 58,664 | 68,828 | 395,338 | 59,268 | 20,612 | 433,994 |
| 1964 | 86,840 | 91,818 | 433,994 | 82,919 | 42,652 | 474,263 |
| 1965 | 79,358 | 89,126 | 474,263 | 82,559 | 45,498 | 511,324 |
| 1966 | 95,222 | 104,394 | 511,324 | 71,554 | 44,389 | 538,488 |
| 1967 | 77,544 | 78,852 | 538,488 | 64,950 | 39,855 | 563,584 |
| 1968 | 85,421 | 77,969 | 563,676 | 78,657 | 24,163 | 618,170 |
| 1969 | 105,587 | 107,848 | 618,170 | 97,562 | 51,752 | 663,981 |
| 1970 | 107,346 | 96,074 | 663,981 | 93,653 | 51,607 | 706,027 |
| 1971 | 97,340 | 105,520 | 706,027 | 90,876 | 50,047 | 746,856 |
| 1972 | 146,500 | 125,846 | 746,856 | 95,942 | 59,830 | 782,969 |
| 1973 | 132,200 | 134,053 | 782,969 | 129,272 | 47,929 | 864,312 |
About one-third of the gross local authority debt consists of investments by Government departments as shown in the following table.
| Department | As at 31 March | ||||
|---|---|---|---|---|---|
| 1966 | 1967 | 1968 | 1969 | 1970 | |
*Including hospital boards. †Provisional. | |||||
| $(thousand) | |||||
| Government Life Insurance Office | 22,444 | 22,062 | 22,343 | 23,427 | 24,486 |
| National Provident Fund Board | 88,008 | 101,465 | 118,555 | 131,124 | 145,284 |
| Public Trustee | 9,726 | 10,139 | 10,491 | 11,308 | 11,468 |
| State Advances Corporation— | |||||
| Trading | 15,104 | 14,364 | 13,659 | 12,905 | 12,205 |
| Housing Account | 8,342 | 12,013 | 14,486 | 16,926 | 19,368 |
| Rural Housing Act 1939 | 5,776 | 7,778 | 9,829 | 11,073 | 11,855 |
| Other | 13,714 | 16,077 | 17,757 | 20,041 | 21,735 |
| Totals | 163,114 | 183,898 | 207,120 | 226,804 | 246,401 |
| percent | percent | percent | percent | percent | |
| Percentage of total gross public debt* | 30.3 | 32.6 | 33.6 | 34.2 | 34.6† |
Registered stock issued under the Local Authorities Loans Act 1956 at 31 March totalled the following amounts: 1966, $336.5 million; 1967, $359.2 million; 1968, $393.9 million; 1969, $425.9 million; and 1970, $466.4 million.
The outstanding loans of local authorities (other than hospital boards) at the end of each of the latest 11 years are shown in the following table.
| At 31 March | Gross Public Debt | Net Debt (i.e., Less Accumulated Sinking Funds) |
|---|---|---|
| $(thousand) | ||
| 1963 | 370,090 | 349,975 |
| 1964 | 401,701 | 381,368 |
| 1965 | 436,101 | 413,635 |
| 1966 | 461,293 | 435,515 |
| 1967 | 484,944 | 455,644 |
| 1968 | 533,450 | 500,020 |
| 1969 | 564,296 | 527,923 |
| 1970 | 597,176 | 558,057 |
| 1971 | 629,814 | 586,406 |
| 1972 | 667,086 | 618,884 |
| 1973 | 722,431 | 669,080 |
The net indebtedness of cities and boroughs represents 3.0 percent of their rateable capital value. For counties, the aggregate net indebtedness was 1,0 percent of rateable capital value.
The following table shows, per head of the population, the gross public debt of local authorities and the annual charge thereon for the latest 11 years.
| At 31 March | Gross Public Debt | Annual Loan Charge | ||
|---|---|---|---|---|
| Amount | Rate Per Head | Amount | Rate Per Head | |
| $(000) | $ | $(000) | $ | |
| 1963 | 370,090 | 146.40 | 35,919 | 14.21 |
| 1964 | 401,701 | 155.55 | 46,327 | 17.94 |
| 1965 | 436,101 | 165.89 | 52,339 | 19.91 |
| 1966 | 461,293 | 172.32 | 52,049 | 19.44 |
| 1967 | 484,944 | 177.90 | 56,810 | 20.84 |
| 1968 | 533,450 | 193.79 | 56,095 | 20.38 |
| 1969 | 564,296 | 203.19 | 57,263 | 20.62 |
| 1970 | 597,176 | 212.07 | 59,704 | 21.20 |
| 1971 | 629,814 | 220.01 | 62,817 | 21.94 |
| 1972 | 667,086 | 229.25 | 67,603 | 23.23 |
| 1973 | 722,431 | 242,86 | 73,500 | 24.73 |
In the following table gross public debt is classified by types of local authority. It should be noted that the debt of electric power districts shown in the following table does not represent the complete local authority debt on account of electric power activities, since a considerable portion of the city and borough debt, and a small part of the county and town district debt also, was incurred for that purpose.
| At 31 March | Cities, Boroughs and Town Districts | Counties | Electric Power Districts | Harbour Districts | Urban Drainage Districts | Urban Transport Districts | Other Districts | Total |
|---|---|---|---|---|---|---|---|---|
| $(thousand) | ||||||||
| 1963 | 157,137 | 23,979 | 54,101 | 56,074 | 47,569 | 6,346 | 24,882 | 370,090 |
| 1964 | 173,031 | 28,401 | 53,716 | 65,409 | 49,312 | 5,862 | 25,971 | 401,701 |
| 1965 | 187,927 | 31,845 | 58,142 | 72,070 | 50,910 | 5,284 | 29,923 | 436,101 |
| 1966 | 203,133 | 31,547 | 59,985 | 79,805 | 23,218 | 987 | 62,619 | 461,293 |
| 1967 | 215,088 | 35,519 | 62,001 | 82,806 | 24,250 | 868 | 64,413 | 484,944 |
| 1968 | 228,468 | 40,266 | 64,469 | 88,047 | 26,414 | 987 | 84,799 | 533,450 |
| 1969 | 241,928 | 43,082 | 66,499 | 95,212 | 28,601 | 860 | 88,114 | 564,296 |
| 1970 | 252,561 | 46,218 | 70,641 | 103,308 | 31,332 | 659 | 92,459 | 597,176 |
| 1971 | 264,977 | 48,148 | 73,802 | 111,141 | 32,744 | 1,394 | 97,608 | 629,814 |
| 1972 | 277,312 | 53,628 | 76,269 | 121,511 | 34,065 | 1,974 | 102,328 | 667,086 |
| 1973 | 300,363 | 61,329 | 85,628 | 127,709 | 35,571 | 2,194 | 109,637 | 722,431 |
GENERAL—Comparisons between money incomes in different years should be subject to qualifications. With the changing value of money, comparisons should be made in terms of effective or real income, i.e., money in relation to the costs of goods and services. However, it is not easy to measure these changes as there is no one index that adequately gives a measure of the changing purchasing power in all circumstances. This is because the purchasing power of money is conditional to a large extent on the patterns of expenditure out of income, and these may and do differ substantially from person to person. While not an ideal measure of the changes in purchasing power in all these circumstances, the Consumers' Price Index, which measures price changes in a wide range of goods and services purchased, may be used as the best available indicator insofar as income, if expended, would be spent on these kinds of goods and services.
The elements of individual and company income and the taxation requirements of a modern welfare state are closely related. Statistics of incomes and income tax are compiled annually by the Department of Statistics. Complete details and methods of compilations are given in the annual statistical report on Incomes and Income Tax.
TREND OF INCOMES: Individuals—The data required for statistical compilation of incomes do not become available for a lengthy period after the end of the income year. This, coupled with the necessary time taken by the statistical processing, means a long time lag before final results of the compilation are available. To meet this situation provisional estimates are made on the basis of a restricted sample. The tables in the first part of this Section are presented on this basis.
The following table gives data for the principal sources of incomes of individuals.
| Source of Total Income | Income Years | |||||
|---|---|---|---|---|---|---|
| 1971-72 | 1972-73 | 1973-74 | ||||
| Number of Returns | Total Income | Number of Returns | Total Income | Number of Returns | Total Income | |
| Self-employment— | $(m) | $(m) | $(m) | |||
| Agriculture and livestock production— | ||||||
| Sheep farming | 24,000 | 103.2 | 23,750 | 171.0x | 23,750 | 205.4 |
| Dairy farming | 26,300 | 114.4 | 26,000 | 132.6x | 25,750 | 144.2 |
| Other farming | 23,400 | 81.9 | 23,000 | 102.4x | 23,000 | 124.2x |
| Totals, farming | 73,700 | 299.5 | 72,750 | 406.2x | 72,500 | 473.8 |
| Manufacturing | 6,750 | 26.0 | 7,000 | 31.2 | 7,100 | 38.7 |
| Construction | 14,400 | 64.5 | 14,550 | 74.1x | 14,750 | 94.0 |
| Wholesale and retail trade | 13,150 | 48.7 | 13,200 | 56.8 | 13,250 | 70.2 |
| Transport | 4,600 | 18.7 | 4,650 | 20.4 | 4,800 | 25.4 |
| Services— | ||||||
| Professional | 9,400 | 103.4 | 9,550 | 119.2x | 9,700 | 140.7 |
| Other | 10,000 | 33.0 | 10,050 | 36.1 | 10,100 | 45.5 |
| All other industries | 7,450 | 19.1 | 7,600 | 19.8 | 7,650 | 20.5 |
| Totals, self-employment | 139,450 | 612.9 | 139,350 | 763.6x | 139,850 | 908.8 |
| Salary and wages | 1,225,000 | 3,649.1 | 1,250,000 | 4,068.0x | 1,275,000 | 4,922.4 |
| Investment incomes | 99,500 | 222.1 | 100,000 | 244.1 | 101,000 | 260.0 |
| Grand totals | 1,463,950 | 4,484.1 | 1,489,350 | 5,075.7x | 1,515,850 | 6,091.2 |
Farmers constitute more that one-half of the numbers of all self-employed persons and are decidedly the most variable section as far as income levels are concerned.
The estimates for 1972-73 showed an increase of $106.5 million in the incomes of all farmers, with the incomes of sheep farmers showing an increase of $67.8 million, while the incomes of dairy farmers and other farmers increased by $18.2 million and $20.5 million respectively. In 1973-74 the estimated incomes of sheep farmers increased by $34.4 million, while the incomes of dairy and other farmers increased by $11.6 million and $21.8 million respectively.
The estimate of the incomes of the non-farming section of self-employed individuals showed an increase of $35.7 million in 1971-72 followed by increases of $44.2 million and $77.4 million in 1972-73 and 1973-74 respectively.
The following table shows an analysis by the amount of total income for the three major sources (self-employment, salary and wages, and investment incomes) combined.
| ALL SOURCES | ||||||
|---|---|---|---|---|---|---|
| Amount of Total Income | Income Years | |||||
| 1971-72x | 1972.73x | 1973-74 | ||||
| Number of Returns | Total Income | Number of Returns | Total Income | Number of Returns | Total Income | |
| *An “unknown” group has been included to cover cases still under investigation mainly because of problems in matching tax deduction certificates for broken periods of work; this applies to salary and wage earners with incomes of less than $2.600 who were not required to furnish a return of income. This group has been provisionally estimated at a fixed value of $48 million for the years 1971-72 to 1973-74 inclusive on the basis of past experience. | ||||||
| $(m) | $(m) | $(m) | ||||
| Under 0 (losses) | 3,700 | - | 2,670 | - | 2,240 | - |
| 1-999 | 289,100 | 123.6 | 268,800 | 113.7 | 240,600 | 100.6 |
| 1,000-1,199 | 46,600 | 51.3 | 43,700 | 48.0 | 38,200 | 42.0 |
| 1,200-1,399 | 46,600 | 60.5 | 45,000 | 58.5 | 39,500 | 51.3 |
| 1,400-1,599 | 45,400 | 68.1 | 43,100 | 64.6 | 37,600 | 56.4 |
| 1,600-1,799 | 46,000 | 78.2 | 42,700 | 72.6 | 37,200 | 63.2 |
| 1,800-1,999 | 50,500 | 95.9 | 48,300 | 91.9 | 40,800 | 77.4 |
| 2,000-2,199 | 50,800 | 106.7 | 46,400 | 97.5 | 39,000 | 81.9 |
| 2,200-2,399 | 50,400 | 115.9 | 45,000 | 103.4 | 37,500 | 86.2 |
| 2,400-2,599 | 50,600 | 126.5 | 44,800 | 111.9 | 38,200 | 95.5 |
| 2,600-2,799 | 50,100 | 135.3 | 45,000 | 121.5 | 38,400 | 103.7 |
| 2,800-2,999 | 48,700 | 141.1 | 46,600 | 135.1 | 38,000 | 110.2 |
| 3,000-3,199 | 59,800 | 157.4 | 47,400 | 146.8 | 40,100 | 124.4 |
| 3,200-3,299 | 51,100 | 168,5 | 43,600 | 143.8 | 37,000 | 122.0 |
| 3,400-3,599 | 52,400 | 183.3 | 51,900 | 181.6 | 44,700 | 156.4 |
| 3,600-3,799 | 55,600 | 205.7 | 56,100 | 207.6 | 43,400 | 160.6 |
| 3,800-4,999 | 68,400 | 266.7 | 55,800 | 217.5 | 45,200 | 176.2 |
| 4,000-4,399 | 110,600 | 464.4 | 119,000 | 499.7 | 92,700 | 389.3 |
| 4,400-4,799 | 82,900 | 381.1 | 91,500 | 420.9 | 87,800 | 403.9 |
| 4,800-5,199 | 52,300 | 261,0 | 71,900 | 359.5 | 86,100 | 430.4 |
| 5,200-5,599 | 32,800 | 176.8 | 44,600 | 240.8 | 76,200 | 411.5 |
| 5,600-5,999 | 23,200 | 134.2 | 31,000 | 179.9 | 70,900 | 411.1 |
| 6,000-5,399 | 18,100 | 112.2 | 22,300 | 138.4 | 46,100 | 285.8 |
| 6,400-6,799 | 13,300 | 87.5 | 20,400 | 134.7 | 29,700 | 195.9 |
| 6,800-7,199 | 11,000 | 76.8 | 15,300 | 107.1 | 25,800 | 180.5 |
| 7,200-7,599 | 10,000 | 73.7 | 13,200 | 97.7 | 23,300 | 172.2 |
| 7,600-7,999 | 7,100 | 55.3 | 11,200 | 87.3 | 18,700 | 145.8 |
| 8,000-9,999 | 23,600 | 207.6 | 37,480 | 336.5 | 66,340 | 595.9 |
| 10,000-11,999 | 10,550 | 114.1 | 15,940 | 174.6 | 25,590 | 280.7 |
| 12,000-13,999 | 4,270 | 54.5 | 6,620 | 85.6 | 10,280 | 133.6 |
| 14,000-15,999 | 2,560 | 37.8 | 3,730 | 55.6 | 5,290 | 79.2 |
| 16,000-17,999 | 1,720 | 28.7 | 3,030 | 51.3 | 4,610 | 78.2 |
| 18,000-19,999 | 1,230 | 23.1 | 2,360 | 44.7 | 3,860 | 73.2 |
| 20,000-39,999 | 1,590 | 41.8 | 2,400 | 65.1 | 3,940 | 108.0 |
| 40,000-59,999 | 210 | 9.9 | 340 | 16.2 | 710 | 34.1 |
| 60,000 and over | 120 | 10.9 | 180 | 16.1 | 290 | 25.9 |
| Unknown* | - | 48.0 | - | 48.0 | - | 48.0 |
| Totals | 1,463,950 | 4,484.1 | 1,489,350 | 5,075.7 | 1,515,850 | 6,091.2 |
The next table provides an analysis of the incomes of self-employed individuals by the amount of total income.
| SELF-EMPLOYED PERSONS | ||||||
|---|---|---|---|---|---|---|
| Amount of Total Income | Income Years | |||||
| 1971-72x | 1972-73x | 1973-74 | ||||
| Number of Returns | Total Income | Number of Returns | Total Income | Number of Returns | Total Income | |
| $(m) | $(m) | $(m) | ||||
| Under 0 (losses) | 1,970 | - | 1,090 | - | 710 | - |
| 1-999 | 12,900 | 5.8 | 10,700 | 5.0 | 8,900 | 3.8 |
| 1,000-1,199 | 2,900 | 3.2 | 2,500 | 2.7 | 2,100 | 2.3 |
| 1,200-1,399 | 3,400 | 4.4 | 2,800 | 3.6 | 2,400 | 3.1 |
| 1,400-1,599 | 3,700 | 5.5 | 3,100 | 4.6 | 2,600 | 3.9 |
| 1,600-1,799 | 4,200 | 7.1 | 3,500 | 5.9 | 3,000 | 5.1 |
| 1,800-1,999 | 4,700 | 8.9 | 3,700 | 7.1 | 3,200 | 6.0 |
| 2,000-2,199 | 3,900 | 8.2 | 2,800 | 5.9 | 2,500 | 5.2 |
| 2,200-2,399 | 4,200 | 9.6 | 3,000 | 6.8 | 2,500 | 5.7 |
| 2,400-2,599 | 4,500 | 11.2 | 3,500 | 8.6 | 3,000 | 7.5 |
| 2,600-2,799 | 4,600 | 12.4 | 3,600 | 9.7 | 3,000 | 8.1 |
| 2,800-2,999 | 4,400 | 12.7 | 3,600 | 10.4 | 3,000 | 8,7 |
| 3,000-3,199 | 4,500 | 13.9 | 3,900 | 12.0 | 3,500 | 10.9 |
| 3,200-3,399 | 4,000 | 13.1 | 3,200 | 10.5 | 2,500 | 8.1 |
| 3,400-3,599 | 5,300 | 17.8 | 5,100 | 17.8 | 4,800 | 16.7 |
| 3,600-3,799 | 4,100 | 15.1 | 4,300 | 15.9 | 3,500 | 13.0 |
| 3,800-3,999 | 4,400 | 17.1 | 4,600 | 17.8 | 3,900 | 15.1 |
| 4,000-4,399 | 9,100 | 38.0 | 7,400 | 31.0 | 5,600 | 23.5 |
| 4,400-4,799 | 6,800 | 31.0 | 5,200 | 23.9 | 4,500 | 20.7 |
| 4,800-5,199 | 5,800 | 28.5 | 5,100 | 25.5 | 4,300 | 21.4 |
| 5,200-5,599 | 4,500 | 24.0 | 5,100 | 27.5 | 4,600 | 24.8 |
| 5,600-5,999 | 4,000 | 22.8 | 4,700 | 27.3 | 5,000 | 28.9 |
| 6,000-6,399 | 4,400 | 27.2 | 4,500 | 27.9 | 5,200 | 32.2 |
| 6,400-6,799 | 3,500 | 22.8 | 4,000 | 26.4 | 4,200 | 27.6 |
| 6,800-7,199 | 3,300 | 22.9 | 4,000 | 28.0 | 4,800 | 33.5 |
| 7,200-7,599 | 2,800 | 20.4 | 3,500 | 25.9 | 4,500 | 33.1 |
| 7,600-7,999 | 1,800 | 14.0 | 2,800 | 21.8 | 3,300 | 25.7 |
| 8,000-9,999 | 6,500 | 57.1 | 10,880 | 97.3 | 12,340 | 109.9 |
| 10,000-11,999 | 3,650 | 39.4 | 6,530 | 71.3 | 10,150 | 110.9 |
| 12,000-13,999 | 2,020 | 25.7 | 3,360 | 43.4 | 4,990 | 64.8 |
| 14,000-15,999 | 1,310 | 19.5 | 2,150 | 32.1 | 3,060 | 45.7 |
| 16,000-17,999 | 970 | 16.3 | 1,950 | 33.1 | 2,880 | 48.9 |
| 18,000-19,999 | 730 | 13.8 | 1,690 | 32.1 | 2,650 | 50.3 |
| 20,000-39,999 | 700 | 17.9 | 1,280 | 32.4 | 2,110 | 53.2 |
| 40,000-59,999 | 80 | 4.0 | 160 | 7.6 | 450 | 21.2 |
| 60,000 and over | 20 | 1.6 | 60 | 4.8 | 110 | 9.3 |
| Totals | 139,450 | 612.9 | 139,350 | 763.6 | 139,850 | 908.8 |
In recent years there has been a strong tendency for those self-employed persons in the higher-income brackets to adopt company ownership.
The incomes of salary and wage earners are analysed by income group in the following table.
| SALARY AND WAGE EARNERS | ||||||
|---|---|---|---|---|---|---|
| Amount of Total Income | Income Years | |||||
| 1971-72x | 1972-73x | 1973-74 | ||||
| Number of Returns | Total Income | Number of Returns | Total Income | Number of Returns | Total Income | |
| * An “unknown” group has been included to cover cases still under investigation mainly because of problems in matching tax deduction certificates for broken periods of work; this applies to salary and wage earners with incomes of less than $2,600 who are not required to furnish a return of income. This group has been provisionally estimated at a fixed value of $48 million for the years 1971-72 to 1973-74 inclusive on the basis of past experience. | ||||||
| $ | $(m) | $(m) | $(m) | |||
| Under 0 (losses) | 630 | - | 630 | - | 630 | - |
| 1-999 | 247,000 | 101.5 | 232,000 | 94.0 | 206,000 | 82.4 |
| 1,000-1,199 | 35,000 | 38.5 | 33,000 | 36.3 | 28,000 | 30.8 |
| 1,200-1,399 | 35,000 | 45.5 | 34,000 | 44.2 | 29,000 | 37.7 |
| 1,400-1,599 | 36,000 | 54.0 | 35,000 | 52.5 | 30,000 | 45.0 |
| 1,600-1,799 | 37,000 | 62.9 | 35,000 | 59.5 | 30,000 | 51.0 |
| 1,800-1,999 | 41,000 | 77.9 | 39,000 | 74.1 | 32,000 | 60.3 |
| 2,000-2,199 | 43,000 | 90.3 | 40,000 | 84.0 | 33,000 | 69.3 |
| 2,200-2,399 | 43,000 | 98.9 | 39,000 | 89.7 | 32,000 | 73.6 |
| 2,400-2,599 | 43,000 | 107.5 | 38,000 | 95.0 | 32,000 | 80.0 |
| 2,600-2,799 | 43,000 | 116.1 | 38,000 | 102.6 | 32,000 | 86.4 |
| 2,800-2,999 | 42,000 | 121.8 | 40,000 | 116.0 | 32,000 | 92.8 |
| 3,000-3,199 | 43,000 | 133.3 | 40,000 | 124.0 | 33,000 | 102.3 |
| 3,200-3,399 | 45,000 | 148.5 | 38,000 | 125.4 | 32,000 | 105.6 |
| 3,400-3,599 | 45,000 | 157.5 | 44,000 | 154.0 | 37,000 | 129.5 |
| 3,600-3,799 | 50,000 | 185.0 | 50,000 | 185.0 | 38,000 | 140.6 |
| 3,800-3,999 | 63,000 | 245.7 | 50,000 | 195.0 | 40,000 | 156.0 |
| 4,000-4,399 | 100,000 | 420.0 | 110,000 | 462.0 | 85,500 | 359.1 |
| 4,400-4,799 | 75,000 | 345.0 | 85,000 | 391.0 | 82,000 | 377.2 |
| 4,800-5,199 | 45,000 | 225.0 | 65,000 | 325.0 | 80,000 | 400.0 |
| 5,200-5,599 | 27,000 | 145.8 | 38,000 | 205.2 | 70,000 | 378.0 |
| 5,600-5,999 | 18,000 | 104.4 | 25,000 | 145.0 | 64,500 | 374.1 |
| 6,000-6,399 | 13,000 | 80.6 | 17,000 | 105.4 | 40,000 | 248.0 |
| 6,400-6,799 | 9,500 | 62.7 | 16,000 | 105.6 | 25,000 | 165.0 |
| 6,800-7,199 | 7,000 | 49.0 | 10,500 | 73.5 | 20,000 | 140.0 |
| 7,200-7,599 | 6,500 | 48.1 | 9,000 | 68.6 | 18,000 | 133.2 |
| 7,600-7,999 | 5,000 | 39.0 | 8,000 | 62.4 | 15,000 | 117.0 |
| 8,000-9,999 | 16,000 | 140.8 | 25,000 | 224.9 | 52,000 | 468.0 |
| 10,000-11,999 | 6,500 | 70.5 | 9,000 | 98.9 | 15,000 | 165.0 |
| 12,000-13,999 | 2,000 | 25.6 | 3,000 | 38.9 | 5,000 | 65.0 |
| 14,000-15,999 | 1,100 | 16.2 | 1,400 | 20.9 | 2,000 | 30.0 |
| 16,000-17,999 | 600 | 10.0 | 900 | 15.2 | 1,500 | 25.5 |
| 18,000-19,999 | 350 | 6.5 | 500 | 9.5 | 1,000 | 19.0 |
| 20,000-39,999 | 700 | 18.8 | 900 | 26.9 | 1,600 | 48.0 |
| 40,000-59,999 | 70 | 3.2 | 100 | 4.8 | 160 | 8.0 |
| 60,000 and over | 50 | 5.0 | 70 | 7.0 | 110 | 10.5 |
| Unknown* | - | 48.0 | - | 48.0 | - | 48.0 |
| Totals | 1,225,000 | 3,649.1 | 1,250,000 | 4,068.0 | 1,275,000 | 4,922.4 |
The next table gives corresponding data for individuals whose incomes were principally derived from investment, i.e., from interest, rents and royalties, “estate” income, and also company dividends if there was no other major source of income.
| INVESTMENT INCOMES | ||||||
|---|---|---|---|---|---|---|
| Amount of Total Income | Income Years | |||||
| 1971-72x | 1972-73x | 1973-74 | ||||
| Number of Returns | Total Income | Number f Returns | Total Income | Number of Returns | Total Income | |
| $ | $(m) | $(m) | $(m) | |||
| Under 0 (losses) | 1,100 | - | 950 | - | 900 | - |
| 1-999 | 29,200 | 16.3 | 26,100 | 14.7 | 25,700 | 14.4 |
| 1,000-1,199 | 8,700 | 9.6 | 8,200 | 9.0 | 8,100 | 8.9 |
| 1,200-1,399 | 8,200 | 10.6 | 8,200 | 10.7 | 8,100 | 10.5 |
| 1,400-1,599 | 5,700 | 8.6 | 5,000 | 7.5 | 5,000 | 7.5 |
| 1,600-1,799 | 4,800 | 8.2 | 4,200 | 7.2 | 4,200 | 7.1 |
| 1,800-1,999 | 4,800 | 9.1 | 5.600 | 10.7 | 5,600 | 10.6 |
| 2,000-2,199 | 3,900 | 8.2 | 3,600 | 7.6 | 3,500 | 7.4 |
| 2,200-2,399 | 3,200 | 7.4 | 3,000 | 6.9 | 3,000 | 6.9 |
| 2,400-2,599 | 3,100 | 7.8 | 3,300 | 8.3 | 3,200 | 8.0 |
| 2,600-2,799 | 2,500 | 6.8 | 3,400 | 9.2 | 3,400 | 9.2 |
| 2,800-2,999 | 2,300 | 6.6 | 3,000 | 8.7 | 3,000 | 8.7 |
| 3,000-3,199 | 3,300 | 10.2 | 3,500 | 10.8 | 3,600 | 11.2 |
| 3,200-3,399 | 2,100 | 6.9 | 2,400 | 7.9 | 2,500 | 8.3 |
| 3,400-3,599 | 2,300 | 8.0 | 2,800 | 9.8 | 2,900 | 10.2 |
| 3,600-3,799 | 1,500 | 5.6 | 1,800 | 6.7 | 1,900 | 7.0 |
| 3,800-3,999 | 1,000 | 3.9 | 1,200 | 4.7 | 1,300 | 5.1 |
| 4,000-4,399 | 1,500 | 6.4 | 1,600 | 6.7 | 1,600 | 6.7 |
| 4,400-4,799 | 1,100 | 5.1 | 1,300 | 6.0 | 1,300 | 6.0 |
| 4,800-5,199 | 1,500 | 7.5 | 1,800 | 9.0 | 1,800 | 9.0 |
| 5,200-5,599 | 1,300 | 7.0 | 1,500 | 8.1 | 1,600 | 8.7 |
| 5,600-5,999 | 1,200 | 7.0 | 1,300 | 7.6 | 1,400 | 8.1 |
| 6,000-6,399 | 700 | 4.4 | 800 | 5.1 | 900 | 5.6 |
| 6,400-6,799 | 300 | 2.0 | 400 | 2.7 | 500 | 3.3 |
| 6,800-7,199 | 700 | 4.9 | 800 | 5.6 | 1,000 | 7.0 |
| 7,200-7,599 | 700 | 5.2 | 700 | 5.2 | 800 | 5.9 |
| 7,600-7,999 | 300 | 2.3 | 400 | 3.1 | 400 | 3.1 |
| 8,000-9,999 | 1,100 | 9.7 | 1,600 | 14.3 | 2,000 | 18.0 |
| 10,000-11,999 | 400 | 4.2 | 410 | 4.4 | 440 | 4.8 |
| 12,000-13,999 | 250 | 3.2 | 260 | 3.3 | 290 | 3.8 |
| 14,000-15,999 | 150 | 2.1 | 180 | 2.6 | 230 | 3.5 |
| 16,000-17,999 | 150 | 2.4 | 180 | 3.0 | 230 | 3.8 |
| 18,000-19,999 | 150 | 2.8 | 170 | 3.1 | 210 | 3.9 |
| 20,000-39,999 | 190 | 5.1 | 220 | 5.8 | 230 | 6.8 |
| 40,000-59,999 | 60 | 2.7 | 80 | 3.8 | 100 | 4.9 |
| 60,000 and over | 50 | 4.3 | 50 | 4.3 | 70 | 6.1 |
| Totals | 99,500 | 222.1 | 100,000 | 244.1 | 101,000 | 260.0 |
In the 3 years covered in the above table, persons with certain types of investment income were not required to complete income tax returns unless they were normally in receipt of income from self-employment or were applying for refunds. The conditions under which returns were not required were as follows.
In 1971-72 if:
all investment income was from dividends and the person's total income was under $1,070. In 1972-73 and 1973-74 if:
all income was from dividends and was less than $1,000 in 1972-73 and $1,150 in 1973-74.
all investment income was from dividends and total income was less than $960.
These changes affect the numbers of returns in the table.
Average and median incomes have been estimated from a restricted sample on a provisional basis. The averages are based on total income derived from all sources and not on income from self-employment alone or salary and wages income alone. Incomes of self-employed persons include an element of interest return on capital investment as well as a reward for the person's own efforts.
The following table gives estimates of average and median incomes of self-employed persons in selected industries.
| SELF-EMPLOYED PERSONS | ||||||||
|---|---|---|---|---|---|---|---|---|
| Type of Self-employment | Income Year | Income Year | ||||||
| 1970-71x | 1971-72x | 1972-73x | 1973-74 | 1970-71x | 1971-72x | 1972-73x | 1973-74 | |
| *Arithmetic mean. | ||||||||
| Agriculture and livestock production— | Averages* | Medians | ||||||
| Sheep farming | 3,750 | 4,300 | 7,200 | 8,650 | 3,400 | 4,000 | 6,400 | 7,600 |
| Dairy farming | 3,150 | 4,350 | 5,100 | 5,600 | 2,850 | 4,100 | 4,750 | 5,250 |
| Other farming | 3,000 | 3,500 | 4,450 | 5,400 | 2,350 | 2,800 | 3,500 | 4,050 |
| Manufacturing | 3,500 | 3,850 | 4,450 | 5,450 | 2,850 | 3,200 | 3,600 | 4,350 |
| Construction— | ||||||||
| Builders | 4,050 | 4,500 | 5,400 | 6,750 | 3,850 | 4,300 | 5,000 | 5,850 |
| Building ancillary trades | 3,900 | 4,450 | 5,000 | 6,100 | 3,700 | 4,100 | 4,600 | 5,400 |
| Wholesale and retail trade | 3,300 | 3,700 | 4,300 | 5,300 | 2,800 | 3,100 | 3,600 | 4,350 |
| Transport— | ||||||||
| Road passenger | 3,050 | 3,150 | 3,250 | 4,000 | 2,950 | 3,100 | 3,200 | 4,000 |
| Road freight | 4,600 | 5,300 | 6,050 | 6,950 | 4,100 | 4,750 | 5,350 | 6,250 |
| Services, professional— | ||||||||
| Medical practitioners (includes surgeons, specialists, and physicians) | 12,700 | 14,450 | 16,500 | 18,900 | 11,300 | 12,750 | 14,500 | 17,150 |
| Dental practitioners | 9,400 | 10,750 | 12,200 | 14,300 | 8,750 | 9,850 | 11,350 | 12,800 |
| Legal practitioners | 11,950 | 14,000 | 17,000 | 21,000 | 10,800 | 12,700 | 15,800 | 20,200 |
| Public accountants | 8,600 | 9,800 | 10,950 | 12,200 | 7,850 | 8,550 | 10,100 | 11,900 |
| Services, other | 2,900 | 3,300 | 3,600 | 4,500 | 2,250 | 2,500 | 2,800 | 3,150 |
In the table shown above the averages for the 1970-71 year are based on the normal statistical collection while those for the later years are based on the smaller sample used for provisional estimates in the 1974 year.
Companies—The provisional estimates of assessable income for companies are given in the next table. They are calculations based on the income trends revealed by a small sample of returns. The sample is confined to those income returns which are available at an early date. Companies with balance dates later than 30 June would be almost completely unrepresented in the sample.
The estimates are given with the warning that the figures are subject to a possible considerable margin of error and should therefore be used with caution.
| Industry Group | 1971-72x | 1972-73x | 1973-74 | |||
|---|---|---|---|---|---|---|
| Number of Returns | Assessable Income | Number of Returns | Assessable Income | Number of Returns | Assessable Income | |
| $(m) | $(m) | $(m) | ||||
| Agriculture and livestock production | 6,350 | 15.9 | 6,850 | 23.7 | 7,100 | 24.7 |
| Manufacturing | 10,000 | 245.9 | 10,400 | 313.5 | 10,900 | 368.6 |
| Construction | 5,600 | 27.8 | 5,900 | 31.7 | 6,200 | 38.9 |
| Commerce— | ||||||
| Wholesale and retail trade | 19,250 | 208.8 | 20,200 | 264.8 | 20,800 | 310.7 |
| Other | 18,000 | 142.6 | 19,200 | 185.5 | 19,550 | 221.6 |
| Transport, storage, and communication | 2,500 | 20.3 | 2,600 | 22.1 | 2,700 | 22.3 |
| Services | 5,900 | 23.2 | 6,450 | 24.7 | 6,800 | 29.7 |
| All other industries | 900 | 4.5 | 900 | 5.2 | 950 | 6.1 |
| Totals | 68,500 | 689.0 | 72,500 | 871.2 | 75,000 | 1,022.6 |
BASIS OF STATISTICS—The tables in the remainder of this Section are final figures for earlier years. In the case of individuals, the statistics are in normal years substantially based on a 5 percent sample for all incomes of less than $8,000; there is a complete enumeration of all incomes of $8,000 and over.
The broad principle adopted in calculating the assessable income is that any expenditure or loss exclusively incurred in the production of assessable income for any year may be deducted from the total income from any assessable source for that year. Depreciation is allowed, varying rates for different classes of assets being fixed. The assessable income is approximately equivalent to the net profit as determined by the normal commercial accounting systems after the deduction of special taxation incentive allowances. Before the deduction of these allowances it is on the whole, rather higher than the commercial net profit, since certain types of expenditure which are regarded as a revenue charge in commercial accounts are not permissible deductions for income tax purposes.
Where the operations of a source of income which would normally produce assessable income have resulted in a loss for the year, the loss may be set off against assessable profits from other sources (if any), or in default thereof, may be set off against assessable profits in subsequent years.
Capital profits are not assessable and capital losses are not deductible.
In these statistics the incomes given for individuals are the net incomes after deducting losses from the same source which have been carried forward from previous years. Losses for the current year which have been set off against income from some other source are recorded in the tables in this Section as the difference between the total of the component income items and the given total income.
For companies, incomes before deduction of losses carried forward from previous years are shown in a separate column and the assessable and returnable incomes given are those after the deduction of such losses. Losses during the current year from any source are deducted from the income from any other source.
CLASSES OF TAXPAYERS—"Individuals" comprise all assessments for individual persons. Partnership returns are ignored in the compilation, as the individual shares of partnership income are included in the individual tax assessments. The incomes of deceased persons' estates are not included, as the greater part of these are transferred to assessments of the beneficiaries.
The term “companies” not only covers companies incorporated under the Companies Act and other Acts relating to the formulation of companies, but also includes local and public authorities, associations (incorporated or unincorporated), and aggregations of individuals (other than partnerships) which form separate and distinct entities for income tax purposes. Government departments which are liable to pay income tax are included, but local and public authorities are generally not taxable even in respect of their trading operations, and consequently are not included in these statistics.
SUMMARY OF INCOMES, EXEMPTIONS, AND TAX—The following tables briefly summarise the main items of information for income years. Individuals and companies are given in separate successive tables respectively.
| INDIVIDUALS | |||||||
|---|---|---|---|---|---|---|---|
| Year | Number of Returns | Number of Taxpayers | Assessable Income | Total Income | Exemptions† | Taxable Income† | Ordinary Income Tax Assessed* |
*Includes social security income tax. †There was no annual equivalent for exemptions and taxable income available where incomes and tax data were derived from tax deduction certificates prior to 1969-70. For 1969-70 exemptions and taxable income were estimated. | |||||||
| $(000) | $(000) | $(000) | $(000) | $(000) | |||
| 1965-66 | 1,273,730 | 1,203,050 | 2,611,230 | 2,611,300 | 1,197,570 | 1,030,480 | 393,190 |
| 1966-67 | 1,308,910 | 1,239,700 | 2,772,130 | 2,772,130 | 1,265,430 | 1,125,700 | 421,550 |
| 1967-68 | 1,342,640 | 1,270,610 | 2,870,620 | 2,870,620 | 1,315,390 | 1,200,050 | 443,700 |
| 1968-69 | 1,367,640 | 1,291,030 | 2,993,160 | 2,993,160 | 1,353,840 | 1,289,620 | 475,050 |
| 1969-70 | 1,414,350 | 1,296,950 | 3,273,720 | 3,273,720 | 781,920 | 2,470,480 | 524,350 |
| 1970-71 | 1,460,820 | 1,359,640 | 3,855,590 | 3,855,590 | 842,420 | 2,944,670 | 689,290 |
| COMPANIES | ||||||
|---|---|---|---|---|---|---|
| Year | Number of Returns | Number of Taxpayers | Assessable Income* | Returnable Income | Income Tax Assessed | |
| Ordinary | Social Security | |||||
| Assessable income and taxable income are identical, as “exemptions” are normally nil. In ascertaining assessable income any expenditure exclusively incurred in the production of the income for the year may be deducted. | ||||||
| $(000) | $(000) | $(000) | $(000) | |||
| 1963-64 | 44,732 | 33,492 | 411,700 | 450,534 | 154,868 | 29,458 |
| 1964-65 | 47,878 | 35,754 | 458,278 | 501,698 | 172,828 | 32,814 |
| 1965-66 | 51,698 | 39,436 | 484,880 | 522,401 | 181,376 | 34,427 |
| 1966-67 | 54,958 | 41,531 | 485,058 | 527,690 | 182,387 | 34,284 |
| 1967-68 | 56,601 | 41,552 | 479,040 | 520,517 | 178,585 | 33,512 |
| 1968-69 | 60,628 | 43,623 | 540,057 | 591,358 | 204,521 | 37,741 |
| 1969-70 | 62,970 | 45,066 | 622,795 | 682,066 | 278,426 | |
| 1970-71 | 66,523 | 47,477 | 660,701 | 737.473 | 292,654 | |
A strict comparison of the figures for any year with those of another is not possible, as changes in compilation practice and numerous amendments in income tax law have affected the comparability of the figure.
INCOMES OF INDIVIDUALS—The numbers of returns and the amounts of total income are shown in the following table.
Total income is used in the sense that it is the total of the various component items of income. It does not include income which is exempt from taxation, such as social security benefits (other than universal superannuation), the first $100 of income from interest, war pensions, workers compensation payments, and certain other types of income.
| Amount of Total Income | Number of Returns | Total Income | ||||
|---|---|---|---|---|---|---|
| 1968-69 | 1969-70 | 1970-71 | 1968-69 | 1969-70 | 1970-71 | |
| $(000) | $(000) | $(000) | ||||
| Losses | 5,230 | 5,210 | 5,690 | - | - | - |
| 1-199 | 93,540 | 98,570 | 74,810 | 9,090 | 10,070 | 8,590 |
| 200-399 | 81,130 | 85,990 | 90,570 | 23,530 | 24,990 | 26,710 |
| 400-599 | 51,520 | 55,180 | 62,990 | 25,690 | 27,310 | 31,160 |
| 600-799 | 51,040 | 52,400 | 54,180 | 35,680 | 36,600 | 37,790 |
| 800-999 | 59,080 | 60,700 | 55,200 | 53,520 | 54,820 | 49,690 |
| 1,000-1,199 | 70,040 | 65,500 | 59,830 | 77,100 | 71,900 | 65,700 |
| 1,200-1,399 | 75,860 | 67,500 | 59,570 | 98,460 | 87,670 | 77,500 |
| 1,400-1,599 | 68,110 | 66,070 | 63,100 | 102,040 | 99,110 | 94,620 |
| 1,600-1,799 | 66,400 | 62,690 | 61,640 | 112,810 | 106,330 | 104,830 |
| 1,800-1,999 | 72,450 | 62,970 | 56,890 | 137,720 | 119,590 | 108,010 |
| 2,000-2,399 | 156,720 | 139,110 | 115,980 | 344,720 | 305,820 | 254,760 |
| 2,400-2,799 | 145,950 | 139,190 | 115,830 | 378,520 | 361,060 | 300,820 |
| 2,800-3,199 | 118,630 | 126,580 | 117,290 | 354,510 | 379,170 | 351,640 |
| 3,200-3,599 | 80,850 | 96,980 | 108,380 | 273,710 | 328,820 | 367,670 |
| 3,600-3,999 | 49,110 | 68,110 | 92,890 | 185,890 | 257,690 | 352,160 |
| 4,000-5,999 | 85,600 | 116,150 | 201,850 | 405,020 | 545,080 | 953,270 |
| 6,000-7,999 | 21,350 | 26,940 | 38,540 | 145,530 | 183,800 | 261,580 |
| 8,000-9,999 | 6,960 | 8,291 | 11,304 | 61,746 | 73,691 | 100,409 |
| 10,000-11,999 | 3,420 | 4,281 | 5,890 | 37,222 | 46,539 | 64,090 |
| 12,000-13,999 | 1,848 | 2,308 | 3,055 | 23,800 | 29,732 | 39,385 |
| 14,000-15,999 | 985 | 1,267 | 1,832 | 14,667 | 18,888 | 27,265 |
| 16,000-17,999 | 541 | 747 | 1,073 | 9,127 | 12,632 | 18,160 |
| 18,000-19,999 | 361 | 476 | 710 | 6,827 | 9,024 | 13,450 |
| 20,000-39,999 | 786 | 964 | 1,478 | 20,266 | 24,684 | 37,751 |
| 40,000-59,999 | 96 | 116 | 155 | 4,607 | 5,551 | 7,384 |
| 60,000 and over | 40 | 61 | 99 | 3,475 | 5,539 | 10,034 |
| Unknown | - | - | - | 47,880 | 47,600 | 41,170 |
| Totals | 1,367,640 | 1,414,350 | 1,460,820 | 2,993,160 | 3,273,720 | 3,805,600 |
There is an explanation on an earlier page concerning the methods adopted to estimate the figures given in the table.
Where salary and wage income returns were not available (and there was between 1958-59 and 1963-64 no obligation to furnish returns if the income from salary and wages only was less than $2,080, raised to $2,600 in 1964-65), the statistical information was derived from the tax deduction certificates.
There were 911,090 males and 549,720 females included in the 1970-71 income year statistics. The respective numbers of these for each total income group appear in the next table, which also gives comparisons with data for 1967-68 and 1968-69,
| Income | 1968-69 | 1969-70 | 1970-71 | |||
|---|---|---|---|---|---|---|
| Males | Females | Males | Females | Males | Females | |
| $ | ||||||
| Losses | 3,130 | 2,100 | 3,310 | 1,900 | 3,680 | 2,000 |
| 1-199 | 37,200 | 56,340 | 39,170 | 59,400 | 24,850 | 49,960 |
| 200-399 | 23,400 | 57,720 | 26,170 | 59,820 | 27,210 | 63,360 |
| 400-599 | 15,690 | 35,840 | 17,280 | 37,900 | 21,370 | 41,620 |
| 600-799 | 15,880 | 35,140 | 15,400 | 37,000 | 17,960 | 36,220 |
| 800-999 | 18,950 | 40,120 | 19,490 | 41,210 | 18,190 | 37,000 |
| 1,000-1,199 | 22,510 | 47,520 | 20,740 | 44,760 | 19,620 | 40,200 |
| 1,200-1,399 | 29,030 | 46,820 | 23,320 | 44,180 | 20,950 | 38,630 |
| 1,400-1,599 | 29,730 | 38,390 | 25,750 | 40,320 | 23,570 | 39,520 |
| 1,600-1,799 | 33,840 | 32,560 | 28,470 | 34,220 | 24,500 | 37,140 |
| 1,800-1,999 | 47,890 | 24,560 | 36,950 | 26,020 | 26,590 | 30,300 |
| 2,000-2,399 | 123,320 | 33,410 | 99,710 | 39,400 | 68,640 | 47,350 |
| 2,400-2,799 | 129,410 | 16,550 | 117,840 | 21,350 | 84,680 | 31,150 |
| 2,800-3,199 | 107,890 | 10,750 | 113,070 | 13,500 | 98,670 | 18,620 |
| 3,200-3,599 | 75,730 | 5,120 | 88,930 | 8,060 | 96,530 | 11,850 |
| 3,600-3,999 | 46,300 | 2,810 | 64,420 | 3,680 | 85,030 | 7,860 |
| 4,000-5,999 | 79,930 | 5,680 | 109,030 | 7,130 | 188,840 | 13,010 |
| 6,000-7,999 | 20,040 | 1,300 | 25,310 | 1,630 | 36,300 | 2,250 |
| 8,000-9,999 | 6,550 | 410 | 7,752 | 539 | 10,565 | 739 |
| 10,000-11,999 | 3,217 | 203 | 4,011 | 270 | 5,519 | 371 |
| 12,000-13,999 | 1,717 | 131 | 2,150 | 158 | 2,893 | 162 |
| 14,000-15,999 | 917 | 68 | 1,197 | 70 | 1,692 | 140 |
| 16,000-17,999 | 505 | 36 | 705 | 42 | 1,001 | 72 |
| 18,000-19,999 | 328 | 33 | 434 | 42 | 665 | 45 |
| 20,000-39,999 | 703 | 83 | 878 | 86 | 1,363 | 115 |
| 40,000 and over | 117 | 19 | 147 | 30 | 213 | 41 |
| Totals | 873,920 | 493,720 | 891,630 | 522,720 | 911,090 | 549,720 |
The numbers in the higher income groups have been increasing, partly as a result of inflationary movements.
Broad trends in total income movements over the three latest available income years appear in the percentages which are given in the following table.
| Amount of Total Income | Number of Returns | Total Income | ||||
|---|---|---|---|---|---|---|
| 1968-69 | 1969-70 | 1970-71 | 1968-69 | 1969-70 | 1970-71 | |
| percent | ||||||
| 1-1,199 | 29.83 | 29.66 | 27.32 | 7.63 | 7.00 | 5.83 |
| 1,200-1,999 | 20.76 | 18.40 | 16.58 | 15.31 | 12.79 | 10.23 |
| 2,000-3,999 | 40.46 | 40.47 | 37.82 | 52.20 | 50.60 | 43.22 |
| 4,000-9,999 | 8.36 | 10.75 | 17.30 | 20.79 | 24.88 | 34:94 |
| 10,000 and over | 0.59 | 0.72 | 0.98 | 4.07 | 4.73 | 5.78 |
| Totals | 100.00 | 100.00 | 100.00 | 100.00 | 100.00 | 100.00 |
In the following table the total incomes and the numbers of returns of the three classifications of ‘income recipients’—those whose incomes are mainly derived from self-employment, from investments, and from salaries or wages—are broken down on a percentage basis into amount groups. This table, which relates to 1970-71, shows for example that in that year 16.93 percent of salary and wage earners received $4,000 or more compared with 36.40 percent of self-employed individuals and 11.40 percent of those whose incomes were mainly derived from investments. Only 0.54 percent of salary and wage earners received $10,000 or more, compared with 4.78 percent of the self-employed and 1.54 percent of those with investment incomes.
| Amount of Total Income | Number of Returns | Total Income | ||||
|---|---|---|---|---|---|---|
| Self-employed | Investments | Salary and Wage Earners | Self-employed | Investments | Salary and Wage Earners | |
| percent | ||||||
| 1-1,199 | 12.99 | 39.06 | 27.89 | 2.08 | 12.22 | 6.01 |
| 1,200-1,999 | 13.92 | 26.04 | 16.09 | 5.72 | 18.59 | 10.39 |
| 2,000-3,999 | 36.69 | 23.50 | 39.09 | 27.69 | 29.92 | 46.76 |
| 4,000-9,999 | 31.62 | 9.86 | 16.39 | 46.60 | 26.01 | 33.62 |
| 10,000 and over | 4.78 | 1.54 | 0.54 | 17.91 | 13.26 | 3.22 |
| Totals | 100.00 | 100.00 | 100.00 | 100.00 | 100.00 | 100.00 |
Income recipients were classified according to their major source of income; it should not be assumed that all their income was derived from the one source. In the following table, the total incomes of the three classes of recipients are shown by source. For example, the total income of those classified as self-employed was $509.1 million, of which $472.1 was derived from self-employment and the balance from investment income, salaries and wages, and other sources.
| Source of Income | Number of Returns | Income | |||||
|---|---|---|---|---|---|---|---|
| Salary and Wages (Taxed at Source) | Not Taxed at Source | Losses | Total | ||||
| From Self-employment | Other* | Assessable Dividends | |||||
| *Includes investment income other than dividends, universal superannuation, estate income, and shareholder employee emoluments not taxed at source under PAYE. | |||||||
| $(thousand) | |||||||
| Self-employment | 132,570 | 14,250 | 472,100 | 18,580 | 6,920 | 2,700 | 509,140 |
| Investments | 100,080 | 15,390 | 5,590 | 144,260 | 51,760 | 2,300 | 214,700 |
| Salary and wages | 1,228,170 | 2,881,470 | 14,660 | 150,970 | 41,670 | 7,020 | 3,081,750 |
| Totals | 1,460,820 | 2,911,110 | 492,350 | 313,820 | 100,350 | 12,030 | 3,805,600 |
As the terms used in this table were adopted as a consequence of the introduction of PAYE taxation, the meanings attached to them are:
Income Taxed at Source—This is essentially salary and wages, including bonuses, taxable allowances, and the like. Also included are withholding payments, which are substantially salary and wage payments made in circumstances where no true employer-employee relationship exists (e.g., company directors' fees, fees for contributions to newspapers, jurors' fees) and some “estate” income.
Income Not Taxed at Source—The principal component is income derived from self-employment, which is given separately in the table. Subdivisions of “other” such income for which statistics are available were income from estates $27,100,000, and from social security universal superannuation, $47,090,000. The mainly income from interest and rents, but it includes salaries of shareholder-employees of companies. In certain circumstances, such salaries are not subject to tax deduction at source.
As has been previously mentioned, in the preceding table, as in the other statistical tables relating to individuals, the aggregate of the component income items may differ from the given totals because of rounding off.
These same 1970-71 data about sources of income are in the following table analysed by amount of total income.
| Amount of Total Income | Number of Returns | Income | Income Tax Assessed | |||||
|---|---|---|---|---|---|---|---|---|
| Salary and Wages Taxed at Source | Not Taxed at Source | Losses | Total | |||||
| From Self-employment | Other | Assessable Dividends | ||||||
| *See note to second table in this section. | ||||||||
| $ | $(thousand) | |||||||
| Losses | 5,690 | 1,070 | 1,220 | 700 | 240 | 3,240 | - | - |
| 1-199 | 74,810 | 8,180 | 400 | 400 | 110 | 500 | 8,590 | 300 |
| 200-399 | 90,570 | 23,790 | 900 | 2,160 | 260 | 410 | 26,710 | 800 |
| 400-599 | 62,990 | 26,780 | 1,330 | 3,130 | 440 | 520 | 31,160 | 1,430 |
| 600-799 | 54,180 | 31,450 | 2,100 | 4,030 | 570 | 360 | 37,790 | 1,980 |
| 800-999 | 55,200 | 39,730 | 2,610 | 7,230 | 610 | 490 | 49,690 | 2,940 |
| 1,000-1,199 | 59,830 | 50,210 | 4,160 | 10,650 | 1,020 | 340 | 65,700 | 4,850 |
| 1,200-1,399 | 59,570 | 61,260 | 5,000 | 10,440 | 1,100 | 300 | 77,500 | 7,110 |
| 1,400-1,599 | 63,100 | 75,970 | 6,970 | 10,910 | 1,190 | 420 | 94,620 | 9,860 |
| 1,600-1,799 | 61,640 | 85,100 | 8,070 | 10.570 | 1,290 | 190 | 104,830 | 12,080 |
| 1,800-1,999 | 56,890 | 87,280 | 8,420 | 10,850 | 1,610 | 140 | 108,010 | 13,120 |
| 2,000-2,399 | 115,980 | 208,840 | 20,480 | 23,180 | 2,860 | 600 | 254,760 | 33,210 |
| 2,400-2,799 | 115,830 | 251,130 | 26,240 | 20,780 | 3,260 | 590 | 300,820 | 42,570 |
| 2,800-3,199 | 117,290 | 302,170 | 27,910 | 19,150 | 3,060 | 659 | 351,640 | 53,220 |
| 3,200-3,599 | 108,380 | 315,860 | 31,330 | 17,830 | 3,270 | 620 | 367,670 | 59,840 |
| 3,600-3,999 | 92,890 | 301,300 | 32,310 | 15,710 | 3,370 | 530 | 352,160 | 61,140 |
| 4,000-5,999 | 201,850 | 757,180 | 122,640 | 59,550 | 14,850 | 950 | 953,270 | 191,530 |
| 6,000-7,999 | 38,540 | 146,290 | 70,280 | 33,250 | 12,090 | 330 | 261,580 | 67,170 |
| 8.000-9,999 | 11,304 | 37,952 | 35,114 | 17,822 | 7,696 | 175 | 100,409 | 31,394 |
| 10,000-11,999 | 5,890 | 21,876 | 24,681 | 11,444 | 6,248 | 158 | 64,090 | 23,074 |
| 12,000-13,999 | 3,055 | 10,764 | 17,266 | 6,772 | 4,634 | 50 | 39,385 | 15,578 |
| 14,000-15,999 | 1,832 | 7,139 | 11,509 | 4,327 | 4,387 | 97 | 27,265 | 11,368 |
| 16,000-17,999 | 1,073 | 4,260 | 8,068 | 2,757 | 3,111 | 35 | 18,160 | 7,934 |
| 18,000-19,999 | 710 | 2,776 | 6,053 | 2,054 | 2,644 | 78 | 13,450 | 6,036 |
| 20,000-39,999 | 1,478 | 7,208 | 13,848 | 6,078 | 10,712 | 96 | 37,751 | 17,525 |
| 40,000-59,999 | 155 | 1,424 | 2,234 | 918 | 2,881 | 72 | 7,384 | 3,619 |
| 60,000 and over | 99 | 952 | 1,197 | 1,134 | 6,834 | 82 | 10,034 | 4,203 |
| Unknown* | - | 41,170 | - | - | 41,170 | 5,400 | ||
| Totals | 1,460,820 | 2,911,110 | 492,350 | 313,820 | 100,350 | 12,030 | 3,805,600 | 689,290 |
An interesting feature is that assessable dividends are heavily concentrated in the hands of individuals who have incomes of $4,000 or more. They received 75.8 percent of this class of income.
Industrial Classification of Incomes—Incomes of individuals who were classified in 1970-71 as self-employed are analysed by industrial affiliation in the following table. For the sake of completeness, the table also includes the totals for salary and wage earners and for individuals deriving income from investments, but there is no information available concerning the industrial classification of these two classes of individuals
| Industry Group | Number of Returns | Income | Income Tax Assessed | |||||
|---|---|---|---|---|---|---|---|---|
| Salary and Wages (Taxed at Source) | Not Taxed at Source | Losses | Total | |||||
| From Self-employment | Other | Assessable Dividends | ||||||
| NOTE: There are differences between the totals of component items and the given cross totals, as “rounding off” accounts from plus or minus $10,000. | ||||||||
| Self-employed— | $(thousand) | |||||||
| Agriculture and livestock production— | ||||||||
| Sheep farming | 23,720 | 1,970 | 82,580 | 5,750 | 1,680 | 1,090 | 90,880 | 20,320 |
| Dairy farming | 26,050 | 2,170 | 79,900 | 3,010 | 360 | 130 | 85,310 | 15,640 |
| Other | 22,530 | 2,160 | 64,490 | 2,310 | 820 | 870 | 68,920 | 13,100 |
| Total farming | 72,300 | 6,300 | 226,970 | 11,070 | 2,860 | 2,090 | 245,110 | 49,060 |
| Forestry, hunting, and fishing | 3,370 | 270 | 6,980 | 90 | 20 | 110 | 7,260 | 1,560 |
| Mining and quarrying | 130 | 30 | 250 | 20 | - | - | 300 | 60 |
| Manufacturing— | ||||||||
| Food, drink, and tobacco | 520 | 20 | 1,870 | 60 | 20 | - | 1,960 | 470 |
| Apparel, textiles, and footwear | 1,270 | 60 | 2,500 | 180 | 30 | - | 2,760 | 550 |
| Metals and metal products | 2,960 | 450 | 11,880 | 440 | 50 | - | 12,820 | 2,910 |
| Other | 1,720 | 80 | 5,060 | 220 | 30 | 40 | 5,360 | 1,160 |
| Construction | 13,340 | 1,050 | 50,000 | 1,150 | 220 | 190 | 52,220 | 10,400 |
| Electricity, gas, water and sanitary services | 40 | - | 60 | - | - | - | 70 | 10 |
| Commerce— | ||||||||
| Wholesale and retail trade | 12,010 | 1,580 | 36,020 | 1,500 | 460 | 120 | 39,450 | 8,420 |
| Other | 2,120 | 290 | 10,350 | 420 | 320 | 40 | 11,340 | 3,240 |
| Transport, storage and communication | 4,200 | 560 | 14,500 | 530 | 70 | - | 15,650 | 3,020 |
| Services community— | ||||||||
| Professional | 8,910 | 2,370 | 79,200 | 2,030 | 2,480 | 70 | 86,000 | 33,260 |
| Other | 9,690 | 1,180 | 26,460 | 860 | 360 | 40 | 28,830 | 6,180 |
| Totals, self-employed | 152,570 | 14,250 | 472,100 | 18,580 | 6,920 | 2,700 | 509,140 | 120,300 |
| Salary and Wages | 1,228,170 | 2,881,470 | 14,660 | 150,970 | 41,670 | 7,020 | 3,081,750 | 532,310 |
| Investment income | 100,080 | 15,390 | 5,590 | 144,260 | 51,760 | 2,300 | 214,700 | 36,680 |
| Grand totals | 1,460,820 | 2,911,110 | 492,350 | 313,820 | 100,350 | 12,030 | 3,805,600 | 689,290 |
As the table gives the amounts received from each major source of income, it will be appreciated that the classification is based on the source of the largest component item of total income. The United Nations “enterprise” concept has been adopted for classification purposes. Under this concept, if an individual receives income from two or more of the separately classifiable industries, the whole of the income is classed as if derived from the industry which provided the largest amount of income, and no attempt is made to allocate the component portions of the income to the different industries from which derived. These statistics are therefore not exactly comparable with most other types of statistics where the “establishment” concept is generally used. This provides for the subdivision of the “enterprise” where more than one separately classifiable industry is carried on and each subdivision is then appropriately classified.
Exemptions—In the case of individuals certain statutory deductions are made from the assessable income, and income tax is paid on the balance. Absentees are not usually entitled to the benefit of exemptions. These exemptions in 1970-71 were:
A personal exemption of $275.
An exemption of $275 in respect of a dependent wife (or husband), diminished by $1 for every $1 of the wife's income in excess of $375.
(c) An exemption not exceeding $275 in respect of a housekeeper employed by a widow, widower, or divorced person to have the care and control of any child or children of the taxpayer. This is included with the wife's exemption in the statistics.
An exemption for contributions not exceeding $135 towards the support of a relative by blood, marriage, or adoption, who was dependent on the taxpayer. Children of the taxpayer were included in this definition, the exemption normally continuing until the child reaches the age of 18 years.
Life assurance premiums, National Provident Fund, superannuation, and similar contributions. An exemption up to a maximum of $700 was allowed for life insurance premiums, National Provident Fund, superannuation and similar contributions, in the case of a contributor to the Government Superannuation Fund or a contributor to a subsidised staff superannuation scheme. In the case of other taxpayers, the maximum exemption allowed was $950.
Donations and school fees. Exemptions for donations to charities (maximum $100), gifts of money and/or school fees to private schools (maximum $100) were allowed. Where exemptions were available under more than one of these headings the total maximum allowed was $100.
The scope of some of the above exemptions has been extended in later income years. Details of the later exemptions are given in Section 26B.
The next table shows the amounts of the insurance, gifts and school fees, total and excesses for the income year 1970-71, classified by size of total income. Potential exemptions have been recorded and the “excess” column gives the amounts by which the exemptions exceed the assessable income. The amounts of taxable income are also given in the table.
| Amount of Total Income | Exemptions | Taxable Income | |||
|---|---|---|---|---|---|
| Insurance | Gifts and School Fees | Total | Excess | ||
| $(thousand) | |||||
| Losses | 540 | 10 | 2,790 | 2,790 | - |
| 1-199 | 360 | 10 | 22,410 | 14,000 | 180 |
| 200-399 | 390 | 50 | 26,760 | 3,370 | 3,320 |
| 400-599 | 650 | 90 | 20,100 | 1,330 | 12,390 |
| 600-799 | 700 | 100 | 17,990 | 600 | 20,400 |
| 800-999 | 880 | 110 | 18,400 | 310 | 31,600 |
| 1,000-1,199 | 1,430 | 180 | 20,640 | 150 | 45,210 |
| 1,200-1,399 | 1,630 | 210 | 20,770 | 60 | 56,800 |
| 1,400-1,599 | 2,140 | 210 | 23,380 | 40 | 71,280 |
| 1,600-1,799 | 2,470 | 240 | 23,550 | 10 | 81,290 |
| 1,800-1,999 | 2,770 | 260 | 23,530 | - | 84,480 |
| 2,000-2,399 | 7,200 | 580 | 55,810 | - | 198,950 |
| 2,400-2,799 | 10,110 | 650 | 64,900 | - | 235,930 |
| 2,800-3,199 | 13,350 | 780 | 77,020 | - | 274,620 |
| 3,200-3,599 | 15,230 | 860 | 80,060 | - | 287,610 |
| 3,600-3,999 | 16,010 | 780 | 75,700 | - | 276,450 |
| 4,000-5,999 | 51,940 | 2,710 | 191,790 | - | 761,450 |
| 6,000-7,999 | 16,360 | 1,000 | 43,880 | - | 217,710 |
| 8,000-9,999 | 5,859 | 423 | 13,846 | - | 86,563 |
| 10,000 and over | 8,572 | 694 | 19,088 | - | 198,430 |
| Totals | 158,590 | 9,950 | 842,420 | 22,660 | 2,944,670 |
The preceding figures include the exemptions and taxable incomes for all taxpayers incorporated in these statistics. Where income and tax data were derived from tax deduction certificates, there is no information available concerning the amounts of exemptions or taxable income, but for these statistics exemptions have been estimated for these persons according to their tax code.
COMPANY INCOMES—As already explained in the section on classes of taxpayers, the term “companies” as it is used in connection with these statistics has been given a wider meaning than that which is commonly assigned to it.
The various statutory exemptions which are granted to individuals do not apply in the case of companies. The amounts of assessable income and taxable income are identical.
These statistics for companies have been compiled from returns for all companies, and are not estimates based on a sample survey.
The following table gives particulars of the number of companies and their aggregate assessable income for 1970-71 and the 2 preceding years.
| Amount of Assessable Income | Number of Returns | Assessable Income | ||||
|---|---|---|---|---|---|---|
| 1968-69 | 1969-70 | 1970-71 | 1968-69 | 1969-70 | 1970-71 | |
| *Assessable income before deduction of losses brought forward from previous years. | ||||||
| $ | $(000) | $(000) | $(000) | |||
| 1-199 | 8,591 | 8,039 | 8,948 | 411 | 425 | 455 |
| 200-399 | 2,996 | 3,072 | 3,328 | 881 | 905 | 980 |
| 400-599 | 2,447 | 2,599 | 2,574 | 1,212 | 1,292 | 1,280 |
| 600-799 | 2,104 | 2,221 | 2,233 | 1,467 | 1,549 | 1,557 |
| 800-999 | 1,900 | 1,887 | 1,842 | 1,707 | 1,693 | 1,652 |
| 1,000-1,199 | 1,684 | 1,723 | 1,818 | 1,846 | 1,888 | 1,992 |
| 1,200-1,399 | 1,541 | 1,519 | 1,516 | 2,000 | 1,970 | 1,963 |
| 1,400-1,599 | 1,330 | 1,458 | 1,380 | 1,992 | 2,180 | 2,070 |
| 1,600-1,799 | 1,149 | 1,208 | 1,313 | 1,951 | 2,048 | 2,228 |
| 1,800-1,999 | 1,100 | 1,106 | 1,140 | 2,089 | 2,098 | 2,162 |
| 2,000-3,999 | 7,051 | 7,364 | 7,533 | 20,194 | 21,132 | 21,546 |
| 4,000-5,999 | 3,504 | 3,666 | 3,846 | 17,167 | 17,926 | 18,833 |
| 6,000-7,999 | 1,921 | 2,116 | 2,203 | 13,305 | 14,608 | 15,243 |
| 8,000-9,999 | 1,130 | 1,299 | 1,348 | 10,113 | 11,580 | 12,043 |
| 10,000-11,999 | 768 | 794 | 854 | 8,376 | 8,696 | 9,343 |
| 12,000-13,999 | 503 | 605 | 637 | 6,523 | 7,821 | 8,241 |
| 14,000-15,999 | 392 | 450 | 507 | 5,857 | 6,736 | 7,584 |
| 16,000-17,999 | 327 | 359 | 397 | 5,538 | 6,105 | 6,751 |
| 18,000-19,999 | 2-72 | 296 | 338 | 5,154 | 5,620 | 6,424 |
| 20,000-39,999 | 1,338 | 1,485 | 1,682 | 37,560 | 41,868 | 47,097 |
| 40,000-59,999 | 483 | 515 | 644 | 23,248 | 25,067 | 31,484 |
| 60,000-79,999 | 245 | 285 | 313 | 16,866 | 19,785 | 21,596 |
| 80,000-99,999 | 155 | 170 | 194 | 13,793 | 15,363 | 17,209 |
| 100,000-199,999 | 328 | 398 | 437 | 46,480 | 55,854 | 61,420 |
| 200,000-399,999 | 184 | 226 | 233 | 50,606 | 61,964 | 63,795 |
| 400,000-599,999 | 62 | 72 | 85 | 29,770 | 34,835 | 41,774 |
| 600,000-799,999 | 27 | 26 | 36 | 18,919 | 17,182 | 25,081 |
| 800,000-999,999 | 16 | 27 | 19 | 14,062 | 23,619 | 16,602 |
| 1,000,000-1,999,999 | 45 | 44 | 42 | 63,509 | 65,464 | 58,058 |
| 2,000,000-3,999,999 | 19 | 25 | 26 | 49,996 | 65,528 | 68,649 |
| 4,000,000 and over | 11 | 12 | 11 | 67,465 | 79,992 | 85,588 |
| Current net loss | 11,865 | 12,256 | 13,257 | - | - | - |
| Assessable income before losses* | 5,140 | 5,648 | 5,789 | - | - | - |
| Totals | 60,628 | 62,970 | 66,523 | 540,057 | 622,795 | 660,701 |
The item “assessable income before losses”, which appears in the preceding table and also in subsequent tables, requires a little further explanation. Companies, and also individuals, are permitted to offset losses for one particular source of assessable income against the profits from any other source of assessable income during the same income year. The remainder of the loss, if any, can be carried forward and offset against the assessable profits of the subsequent years. This item represents the number of companies whose assessable incomes for the current year have been reduced to “nil” by the offsetting of losses incurred in previous income years.
In 1970-71, including those with “current net loss' and “assessable income before losses”, about 67.9 percent of all companies had assessable incomes of under $2,000. Most of these companies were virtually owned and controlled by one person or are the equivalent of a small partnership. In such cases the managerial salaries paid to the proprietors are an important element in the total income drawn from the company by the proprietors.
After an increase of $82,738,000 in assessable income in 1969-70 there was a further increase of $37,906,000 in 1970-71.
In the following table the amount of assessable income of companies is classified for the 1970-71 income year.
| Amount of Assessable Income | Number of Returns | Assessable Income Before Losses* | Assessable Income | Returnable Income | Current Net Loss | Income Tax Assessed |
|---|---|---|---|---|---|---|
| *Assessable income before deduction of losses brought forward from previous years. | ||||||
| $(thousand) | ||||||
| 1-199 | 8,948 | 985 | 455 | 10,447 | 79 | 99 |
| 200-399 | 3,328 | 1,621 | 980 | 6,730 | - | 211 |
| 400-599 | 2,574 | 1,592 | 1,280 | 2,545 | - | 279 |
| 600-799 | 2,233 | 1,804 | 1,557 | 1,749 | - | 347 |
| 800-999 | 1,842 | 1,852 | 1,652 | 1,828 | - | 374 |
| 1,000-1,199 | 1,818 | 2,180 | 1.992 | 2,896 | - | 463 |
| 1,200-1,399 | 1,516 | 2,110 | 1,963 | 3,172 | - | 467 |
| 1,400-1,599 | 1,380 | 2,277 | 2,070 | 2,393 | - | 509 |
| 1,600-1,799 | 1,313 | 2.383 | 2,228 | 2,357 | - | 554 |
| 1,800-1,999 | 1,140 | 2,313 | 2,162 | 2,304 | - | 544 |
| 2,000-3,999 | 7,533 | 22,846 | 21,546 | 22,618 | - | 5,924 |
| 4,000-5,999 | 3,846 | 19,374 | 58,833 | 22,532 | - | 5,943 |
| 6,000-7,999 | 2,203 | 15,502 | 15,243 | 16,952 | - | 5,405 |
| 8,000-9,999 | 1,348 | 12,326 | 12,043 | 13,693 | - | 4,666 |
| 10,000-11,999 | 854 | 9,530 | 9,343 | 10,115 | - | 3,783 |
| 12,000-13,999 | 637 | 8,307 | 8,241 | 8,400 | - | 3,464 |
| 14,000-15,999 | 507 | 7,737 | 7,584 | 7,815 | - | 3,226 |
| 16,000-17,999 | 397 | 6,853 | 6,751 | 7,190 | - | 2,951 |
| 18,000-19,999 | 338 | 6,519 | 6,424 | 6,653 | - | 2,861 |
| 20,000-39,999 | 1,682 | 47,668 | 47,097 | 51,321 | - | 21,567 |
| 40,000-59,999 | 644 | 31,775 | 31,484 | 33,270 | - | 14,846 |
| 60,000-79,999 | 313 | 21,685 | 21,596 | 23,217 | - | 10,147 |
| 80,000-99,999 | 194 | 17,480 | 17,209 | 20,120 | - | 8,267 |
| 100,000-199,999 | 437 | 61,723 | 61,420 | 65,364 | - | 29,691 |
| 200,000-399,999 | 233 | 64,230 | 63,795 | 68,301 | - | 30,863 |
| 400,000-599,999 | 85 | 41,861 | 41,774 | 45,508 | - | 20,412 |
| 600,000-799.999 | 36 | 25,125 | 25,081 | 25,781 | - | 11,855 |
| 800,000-999,999 | 19 | 16,602 | 16,602 | 16,784 | - | 8,314 |
| 1,000,000-1,999,999 | 42 | 58,076 | 58,053 | 64,315 | - | 27,954 |
| 2,000,000-3,999,999 | 26 | 68,914 | 68,649 | 78,873 | - | 30,577 |
| 4,000,000 and over | 11 | 85,799 | 85,588 | 86,200 | - | 36,089 |
| Net loss | 13,257 | - | - | 5,130 | 89,123 | - |
| Assessable income before losses* | 5,789 | 15,419 | - | 899 | - | - |
| Totals—1970-71 | 66,523 | 684,468 | 660,701 | 737,473 | 89,202 | 292,654 |
| 1969-70 | 62,970 | 648,226 | 622,795 | 682,066 | 53,144 | 278,426 |
| 1968-69 | 60,628 | 557,000 | 540,057 | 591,358 | 48,939 | 242,262 |
Companies are classified by industry, the classification being identical with that used for individuals, with the minor exception that “community services—professional” do not form a separate group. Attention is drawn to the remarks on the industrial classification of incomes in this Section regarding the difference between the enterprise and the establishment concepts. The statistics are based on the enterprise concept, i.e., the whole of the company's activities are classified according to the predominant activity. The figures in the next table give the results of this classification for the income year 1970-71.
| Industry Group | Number of Returns | Assessable Income Before Losses* | Assessable Income | Returnable Income | Current Net Loss | Income Tax Assessed |
|---|---|---|---|---|---|---|
| *Assessable income before deduction of losses brought forward from previous years. | ||||||
| $(thousand) | ||||||
| Agriculture and livestock production | 5,978 | 15,254 | 13,124 | 13,434 | 6,858 | 4,772 |
| Forestry, hunting and fishing | 467 | 1,682 | 1,449 | 1,464 | 1,120 | 614 |
| Mining and quarrying | 343 | 2,499 | 2,297 | 2,364 | 6,683 | 1,008 |
| Manufacturing— | ||||||
| Food, beverages and tobacco | 929 | 59,794 | 59,172 | 61,962 | 5,914 | 29,068 |
| Textiles, wearing apparel, made-up textiles and footwear | 956 | 24,723 | 24,011 | 24,791 | 2,549 | 11,584 |
| Metals and metal products | 4,461 | 55,087 | 52,553 | 54,026 | 21,703 | 24,177 |
| Wood, paper, and chemical products (including miscellaneous) | 3,622 | 113,304 | 110,707 | 119,132 | 6,668 | 53,827 |
| Construction | 5,365 | 26,657 | 23,775 | 24,064 | 6,719 | 9,895 |
| Electricity, gas, water, and sanitary services | 53 | 517 | 507 | 507 | 197 | 240 |
| Commerce— | ||||||
| Wholesale and retail | 18,757 | 211,964 | 206,662 | 222,236 | 11,526 | 96,916 |
| Other | 17,452 | 130,805 | 127,879 | 173,177 | 9,092 | 43,646 |
| Transport, storage and communication | 2,526 | 18,253 | 16,319 | 16,936 | 5,153 | 7,246 |
| Services, community, business and recreation | 5,614 | 23,930 | 22,246 | 23,378 | 5,019 | 9,662 |
| Totals—1970-71 | 66,523 | 684,468 | 660,701 | 737,473 | 89,202 | 292,654 |
| 1969-70 | 62,970 | 648,226 | 622,795 | 682,066 | 53,144 | 278,426 |
| 1968-69 | 60,628 | 557,001 | 540,057 | 591,358 | 48,939 | 242,262 |
The principal sharers of the additions to the numbers of companies in 1970-71 were “Commerce—other” (1,148) and “Agriculture and livestock production” (395).
A large proportion of the companies in the “Commerce—other” group were at one time actively engaged in some type of business operations, but on the death or retirement of the principal shareholders the companies have become property holders receiving income from interest or rents. The farming community has also contributed a share of the increase in “Commerce—other”. Many companies have been formed for the purpose of owning farm land and buildings, with the farmers owning and controlling the farming operations either as individuals or partnerships. An additional factor contributing to the increase in the numbers of companies in the “Commerce—other” group is the formation of “own your own flat” companies.
Rates of Tax: Companies—For the income year ended 31 March 1971 ordinary income tax and social security income tax were merged into one composite income tax. The rates of income tax payable by companies on incomes received during that year were—
New Zealand Resident Companies
When taxable income did not exceed $7,200, 20 cents increased by 1/48,000 of $1 for every dollar of taxable income.
When taxable income exceeded $7.200, tax on the first $7,200 of income was calculated as in (a) and tax on remainder was charged at a flat rate of 50 cents in the dollar.
Non-Resident Companies were liable for income tax on income derived in New Zealand at a rate of 5 cents per dollar of income greater than a New Zealand resident company.
More information about the taxation of companies will be found in the section on taxation. The next table shows some additional data concerning companies which relate to the income year 1970-71.
| Industry Group | Stocks at End of Period | Income | Expenditure | Gross Profit | |||||
|---|---|---|---|---|---|---|---|---|---|
| Sales and Services | Interest and Gross Rents | Purchases | Salaries and Wages | Interest | Rent | Depreciation | |||
| *Gross profit not normally available. | |||||||||
| $(thousand) | |||||||||
| Agriculture and livestock production | 64,166 | 195,973 | 2,888 | 52,063 | 46,090 | 10,748 | 5,444 | 11,524 | 103,378 |
| Forestry, hunting, and fishing | 1,137 | 30,411 | 375 | ... | 8,501 | 674 | 1,479 | 2,532 | 13,242 |
| Mining and quarrying | 3,158 | 45,201 | 362 | ... | 13,497 | 663 | 552 | 4,316 | * |
| Manufacturing— | |||||||||
| Food, beverages, and tobacco | 189,611 | 1,628,574 | 5,509 | 1,049,121 | 201,961 | 12,407 | 6,580 | 31,653 | 302,053 |
| Textiles, wearing apparel, made-up textiles, and footwear | 91,645 | 435,26 | 1,511 | 232,537 | 106,632 | 4,522 | 5,943 | 9,064 | 102,769 |
| Metals and metal products | 173,366 | 926,886 | 3,118 | 550,002 | 182,523 | 10,408 | 9,997 | 28,341 | 219,668 |
| Wood, paper, and chemical products (including miscellaneous) | 244,568 | 1,335,144 | 8,13 | 648,087 | 277,002 | 14,916 | 14,056 | 44,440 | 375,810 |
| Construction | 94,895 | 667,715 | 2,589 | 342,113 | 159,222 | 4,413 | 3,494 | 14,463 | 125,536 |
| Electricity, gas, water, and sanitary services | 1,646 | 9,486 | 89 | 2,438 | 2,394 | 508 | 25 | 679 | 3,486 |
| Commerce— | |||||||||
| Wholesale and retail | 809,075 | 5,461,761 | 35,818 | 4,253,428 | 456,412 | 39,104 | 51,601 | 50,057 | 943,166 |
| Other | 23,021 | 452,962 | 359,860 | 26,491 | 118,310 | 124,248 | 9,877 | 18,968 | * |
| Transport, storage, and communication | 2,987 | 394,469 | 3,005 | 18,686 | 116,589 | 7,046 | 4,712 | 30,951 | * |
| Services, community and business, and recreation | 15,547 | 384,431 | 6,044 | 131,824 | 109,516 | 5,708 | 10,886 | 15,811 | 84,342 |
| Totals 1970-71 | 1,714,823 | 11,968,273 | 429,578 | 7,306,790 | 1,798,647 | 235,364 | 124,645 | 262,802 | 2,273,450 |
| 1969-70 | 1,494,986 | 10,367,107 | 374,033 | 6,363,121 | 1,495,233 | 194,917 | 109,355 | 225,758 | 1,925,485 |
| 1968-69 | 1,310,477 | 9,055,695 | 322,159 | 5,537,862 | 1,311,371 | 161,369 | 95,806 | 200,356 | 1,669,650 |
One point which should be noted is that the purchases figures have not been given for the forestry and mining industry groups. It was found that there was a considerable lack of uniformity in such data for these two groups, which was probably connected with differing treatments of royalty and equivalent payments.
The amount of gross profit shown in the accounts is used in these statistics, despite the wide variations in the conceptions of gross profit. No attempt has been made to secure uniformity of calculation for individual companies, but of course the total gross profit for each industry should correspond with that industry's average conception of gross profit. In some industries, such as the transport industry, it is not normal practice to calculate gross profit, and in some cases the gross profit is recorded in these statistics as nil. Estimates of the amount of gross profit were, however, made when any company did not calculate the gross profit, and it was the custom of the industry concerned to show this figure.
The abridged version of the full industry classification for which data are given in this publication does not reveal the individual industries where the gross profit is not generally calculated. Apart from “Mining and quarrying”, “Commerce—other”, and “Transport, etc.”, there are a number of industries included in “Services, community” which do not show gross profit,
The assessable income, dividends, paid-up capital, and shareholders' funds for 1970-71 are given in the two following tables.
| Industry Group | Number of Returns | Assessable Income | Dividends Paid | Shareholders' Funds | |
|---|---|---|---|---|---|
| Total | Paid-up Capital | ||||
| $(000) | |||||
| Agriculture and livestock production | 5,978 | 13,124 | 3,931 | 219,392 | 84,820 |
| Forestry, hunting, and fishing | 467 | 1,449 | 371 | 14,729 | 6,722 |
| Mining and quarrying | 343 | 2,297 | 970 | 67,556 | 18,130 |
| Manufacturing— | |||||
| Food, beverages, and tobacco | 929 | 59,172 | 20,027 | 511,088 | 238,021 |
| Textiles, wearing apparel, made-up textiles, and footwear | 956 | 24,011 | 9,258 | 144,665 | 59,380 |
| Metals and metal products | 4,461 | 52,553 | 15,749 | 284,259 | 129,180 |
| Wood, paper, and chemical products (including miscellaneous) | 3,622 | 110,707 | 40,806 | 655,540 | 311,777 |
| Construction | 5,365 | 23,775 | 5,670 | 128,177 | 46,229 |
| Electricity, gas, water, and sanitary services | 53 | 507 | 175 | 6,816 | 3,210 |
| Commerce— | |||||
| Wholesale and retail | 18,757 | 206,662 | 59,177 | 1,250,941 | 526,353 |
| Other | 17,452 | 127,879 | 63,677 | 11,331,800 | 667,840 |
| Transport, storage, and communication | 2,526 | 16,319 | 5,033 | 145,924 | 68,771 |
| Services, community and business, and recreation | 5,614 | 22,246 | 5,567 | 176,482 | 59,980 |
| Totals—1970-71 | 66,523 | 660,701 | 230,412 | 4,937,370 | 2,220,413 |
| 1969-70 | 62,970 | 622,795 | 197,508 | 4,373,985 | 1,960,687 |
| 1958-69 | 60,628 | 540,057 | 168,376 | 3,874,814 | 1,802,886 |
In 1970-71 dividends paid were equal to 34.9 percent of the assessable income compared with 31.7 percent in 1969-70 and 31.2 percent in 1968-69.
For the purposes of these statistics, the shareholders' funds of a company are defined, briefly, as the amount which would be available to shareholders if the assets were realised and the liabilities discharged at the net values shown in the balance sheet. In the case of New Zealand branches of overseas companies, either the paid-up capital and the shareholders' funds are apportioned on some equitable basis, or the balance of the branch's head office account is taken. The capital loan liabilities of those Government departments which are included in these statistics have been omitted from both paid-up capital and shareholders' funds. Advances from shareholders have been added to shareholders' funds and advances to shareholders deducted.
An analysis of companies by amount of paid-up capital for 1970-71 discloses the position shown in the next table. Those with no paid-up capital are mostly industrial and provident societies, clubs, associations, and similar incorporated bodies.
| Amount of Paid-up Capital | Number of Returns | Paid-up Capital | Shareholders' Funds | Dividends Paid |
|---|---|---|---|---|
| $(000) | ||||
| Nil | 4,913 | - | 181,329 | 5,719 |
| 1-999 | 4,988 | 1,712 | 56,277 | 1,825 |
| 1,000-1,999 | 6,306 | 7,132 | 63,676 | 2,254 |
| 2,000-3,999 | 12,622 | 29,746 | 164,043 | 6,586 |
| 4,000-5,999 | 9,170 | 40,276 | 148,180 | 7,157 |
| 6,000-7,999 | 5,168 | 32,669 | 97,364 | 3,723 |
| 8,000-9,999 | 3,294 | 27,502 | 72,770 | 3,634 |
| 10,000-11,999 | 4,084 | 41,464 | 126,469 | 5,673 |
| 12,000-13,999 | 1,929 | 23,716 | 60,377 | 2,611 |
| 14,000-15,999 | 1,348 | 19,661 | 47,711 | 1,981 |
| 16,000-17,999 | 1,071 | 17,487 | 41,991 | 1,989 |
| 18,000-19,999 | 728 | 13,429 | 30,593 | 1,084 |
| 20,000-39,999 | 5,654 | 141,750 | 355,865 | 14,493 |
| 40,000-59,999 | 1,827 | 83,650 | 182,708 | 7,785 |
| 60,000-79,999 | 837 | 55,041 | 118,677 | 7,760 |
| 80,000-99,999 | 410 | 35,507 | 66,125 | 2,920 |
| 100,000-119,999 | 400 | 41,467 | 95,771 | 4,852 |
| 120,000-139,999 | 193 | 24,269 | 48,166 | 1,775 |
| 140,000-159,999 | 146 | 21,597 | 41,637 | 3,539 |
| 160,000-179,999 | 103 | 17,088 | 37,830 | 2,544 |
| 180,000-199,999 | 63 | 11,769 | 24,832 | 1,408 |
| 200,000-399,999 | 575 | 149,539 | 324,355 | 12,999 |
| 400,000-599,999 | 195 | 91,455 | 217,537 | 9,193 |
| 600,000-799,999 | 108 | 73,201 | 137,489 | 5,762 |
| 800,000-999,999 | 53 | 46,172 | 74,350 | 6,888 |
| 1,000,000-1,199,999 | 59 | 61,699 | 112,402 | 4,317 |
| 1,200,000-1,399,999 | 35 | 44,518 | 84,510 | 6,021 |
| 1,400,000-1,599,999 | 29 | 42,840 | 73,647 | 2,227 |
| 1,600,000-1,799,999 | 27 | 44,942 | 89,503 | 5,170 |
| 1,800,000-1,999,999 | 10 | 18,460 | 47,775 | 2,510 |
| 2,000,000-3,999.999 | 97 | 253,526 | 498,985 | 24,473 |
| 4,000,000 and over | 81 | 707,128 | 1,214,426 | 59,539 |
| Totals—1970-71 | 66,523 | 2,220,413 | 4,937,370 | 230,412 |
| 1969-70 | 62,970 | 1,960,687 | 4,373,985 | 197,508 |
| 1968-69 | 60,628 | 1,802,886 | 3,874,814 | 168,376 |
In 1970-71 there were 1,269 companies with paid-up capital of $200,000 and over. Corresponding figures for 1969-70 and 1968-69 were respectively 1,190 and 1,126. These companies had 69.1 percent of the total paid-up capital and 58.2 percent of the total shareholders' funds.
The number of companies increased by 5.6 percent in 1970-71 and paid-up capital rose by 13.2 percent. The percentages for 1969-70 were respectively 3.9 percent and 8.8 percent.
An analysis by the type of company—i.e., private, public, overseas, etc.—is given in the three following tables, which present some of the principal data for the year 1970-71.
| Industry Group | Number of Returns | Assessable Income | Income Tax | Net Business Loss | Shareholders' Funds | Dividends Paid | |
|---|---|---|---|---|---|---|---|
| Paid-up Capital | Total | ||||||
| $(000) | $(000) | $(000) | $(000) | $(000) | $(000) | ||
| New Zealand Private Companies | |||||||
| Agriculture and livestock production | 5,963 | 12,696 | 4,585 | 6,845 | 83,055 | 216,279 | 3,832 |
| Forestry, hunting, and fishing | 457 | 1,122 | 450 | 1,119 | 4,221 | 9,993 | 327 |
| Mining and quarrying | 318 | 1,824 | 813 | 919 | 13,124 | 46,172 | 648 |
| Manufacturing— | |||||||
| Food, beverages, and tobacco | 750 | 22,257 | 10,858 | 4,330 | 93,174 | 169,008 | 6,118 |
| Textiles, wearing apparel, made-up textiles, and footwear | 907 | 13,353 | 6,293 | 1,305 | 28,206 | 67,150 | 4,135 |
| Wood, paper, and chemical products (including miscellaneous) | 3,446 | 62,619 | 29,827 | 5,155 | 108,079 | 289,671 | 19,663 |
| Metals and metal products | 4,402 | 44,269 | 20,007 | 3,016 | 87,070 | 225,962 | 12,643 |
| Construction | 5,337 | 21,876 | 8,925 | 6,574 | 42,231 | 120,912 | 5,328 |
| Electricity, gas, water, and sanitary services | 47 | 132 | 51 | 38 | 248 | 494 | 8 |
| Commerce— | |||||||
| Wholesale and retail | 18,361 | 148,360 | 68,087 | 10,513 | 309,403 | 759,465 | 41,505 |
| Other | 15,937 | 35,134 | 13,696 | 3,309 | 351,724 | 694,510 | 28,957 |
| Transport, storage, and communication | 2,418 | 13,953 | 6,083 | 3,602 | 45,814 | 95,952 | 4,381 |
| Services (community and business, and recreation) | 4,596 | 16,980 | 7,215 | 3,589 | 49,533 | 107,422 | 4,917 |
| Unknown or not stated | - | - | - | - | - | - | - |
| Totals—1970-71 | 62,939 | 394,575 | 176,890 | 50,314 | 1,215,885 | 2,802,989 | 132,461 |
| 1969-70 | 59,342 | 346,854 | 153,986 | 38,476 | 1,027,233 | 2,401,743 | 104,796 |
| 1968-69 | 56,874 | 283,048 | 123,966 | 35,893 | 950,975 | 2,102,902 | 93,422 |
| New Zealand Public Companies | |||||||
| Agriculture and livestock production | 8 | 82 | 39 | 14 | 453 | 897 | 87 |
| Forestry, hunting, and fishing | 9 | 261 | 129 | - | 1,386 | 3,269 | 44 |
| Mining and quarrying | 19 | 473 | 195 | 5,653 | 3,531 | 19,202 | 322 |
| Manufacturing— | |||||||
| Food, beverages, and tobacco | 170 | 35,836 | 17,627 | 472 | 136,648 | 317,598 | 13,909 |
| Textiles, wearing apparel, made up textiles, and footwear | 47 | 10,657 | 5,291 | 1,243 | 31,174 | 77,515 | 5,123 |
| Wood, paper, and chemical products (including miscellaneous) | 141 | 45,664 | 22,813 | 1,461 | 199,855 | 357,559 | 20,884 |
| Metals and metal products | 50 | 6,362 | 3,154 | 18,568 | 38,142 | 51,149 | 2,324 |
| Construction | 13 | 1,068 | 526 | 93 | 3,390 | 6,160 | 343 |
| Electricity, gas, water, and sanitary services | 6 | 375 | 189 | 159 | 2,962 | 6,322 | 167 |
| Commerce— | |||||||
| Wholesale and retail | 253 | 50,335 | 24,695 | 641 | 200,409 | 404,999 | 17,637 |
| Other | 299 | 40,274 | 17,148 | 2,955 | 266,861 | 535,581 | 27,992 |
| Transport, storage, and communication | 93 | 1,709 | 827 | 1,551 | 22,265 | 48,405 | 652 |
| Services (community and business, and recreation) | 39 | 1,989 | 970 | 1,073 | 9,200 | 31,157 | 514 |
| Unknown or not stated | - | - | - | - | - | - | - |
| Totals—1970-71 | 1,147 | 195,087 | 93,603 | 33,882 | 916,278 | 1,859,808 | 89,998 |
| 1969-70 | 1,266 | 197,939 | 96,030 | 12,671 | 846,022 | 1,675,750 | 82,464 |
| 1968-69 | 1,342 | 184,032 | 90,599 | 9,863 | 768,542 | 1,496,056 | 66,403 |
| Remainder of Companies i(Overseas, Industrial, and Provident Societies etc.) | |||||||
| $(000) | $(000) | 5(000) | $(000) | $(000) | $(000) | ||
| Agriculture and livestock production | 7 | 345 | 148 | - | 1,312 | 2,216 | 12 |
| Forestry, hunting, and fishing | 1 | 65 | 35 | - | 1,114 | 1,467 | - |
| Mining and quarrying | 6 | - | - | 111 | 1,475 | 2,182 | - |
| Manufacturing— | |||||||
| Food, beverages, and tobacco | 9 | 1,079 | 583 | 1,111 | 8,199 | 24,482 | - |
| Textiles, wearing apparel, and made-up textiles | 2 | - | - | 1 | - | - | - |
| Wood, paper, and chemical products (including miscellaneous) | 35 | 2,923 | 1,188 | 52 | 3,842 | 8,310 | 260 |
| Metals and metal products | 9 | 1,923 | 1,016 | 119 | 3,967 | 7,153 | 781 |
| Construction | 15 | 831 | 443 | 53 | 608 | 1,106 | - |
| Electricity, gas, water, and sanitary services | - | - | - | - | - | - | - |
| Commerce— | |||||||
| Wholesale and retail | 143 | 7,967 | 4,133 | 373 | 16,541 | 86,477 | 36 |
| Other | 1,216 | 52,471 | 12,802 | 2,828 | 49,254 | 101,709 | 6,728 |
| Transport, storage, and communication | 15 | 657 | 337 | - | 692 | 1,567 | - |
| Services (community and business, and recreation) | 979 | 3,277 | 1,477 | 357 | 1,246 | 37,903 | 137 |
| Unknown or not stated | - | - | - | - | - | - | - |
| Totals—1970-71 | 2,437 | 71,039 | 22,160 | 5,006 | 88,251 | 274,572 | 7,954 |
| 1969-70 | 2,62 | 78,002 | 28,410 | 1,997 | 87,432 | 296,492 | 10,248 |
| 1968-69 | 2,412 | 72,977 | 27,697 | 3.183 | 83,369 | 275.853 | 8,554 |
Government departments which are liable for income tax have been classified as New Zealand public companies. In a percentage of cases, precise information concerning the type of company was not available and there consequently may be some instances of incorrect classifications.
The greatest part of the annual increase in the number of companies is concentrated in the New Zealand private companies. This does not mean that overseas companies are no longer venturing into the New Zealand field. Most of the overseas companies now doing this are establishing a subsidiary company, usually registered as a New Zealand private company, instead of setting up a New Zealand branch of the overseas company.
On average, private companies are much smaller than are public companies, but in the aggregate they employ a larger amount of paid-up capital. Their shareholders' funds are also a rather higher percentage of the paid-up capital (230.5 percent against 203.0 percent for public companies). However, as shareholders' funds include advances from shareholders ($613,460,000), the bulk of which relate to private companies, it is evident that the relation of retained income to paid-up capital is nearly identical for both types of companies. The earning power per unit of shareholders' funds employed is considerably higher in the case of private companies, since their assessable incomes are 14.1 percent of shareholders' funds against the 10.5 percent for public companies.
The disposable profits of the New Zealand branches of overseas companies are remitted to their overseas head offices and therefore these disposable profits are not included as dividends paid in New Zealand. Where the overseas company operates through a New Zealand subsidiary company, the New Zealand company is classified as either public or private and any dividends paid will be included in the statistics.
Companies with Overseas Affiliations—Two types of companies operating in New Zealand but subject to some degree of overseas control have been identified. The two types are:
branches of overseas organisations operating in New Zealand;
New Zealand-registered companies with 25 percent or more of their equity shareholding subject to overseas control.
The second category includes not only companies in which overseas residents have a 25 percent or greater shareholding, but also companies which are subject to this degree of control without themselves having any overseas owners. For instance, if a New Zealand company was 50 percent owned by another New Zealand company, which itself was 50 percent overseas owned, the company would qualify as having 25 percent overseas control. These are generally termed “second generation” companies.
Overseas companies whose only New Zealand income is from investments, patent rights, royalties, copyrights, and the like, are not included in the 1,270 companies selected, as they are not considered to be active in the New Zealand economy. Also excluded are those overseas companies such as air and shipping lines, which enjoy exemption from New Zealand income tax under the terms of double taxation agreements with their own countries. Such companies were also excluded from previously published statistics.
The 25 percent minimum equity criterion used to classify objectively a New Zealand company as subject to some degree of overseas control, approximates the definition of international private direct investment used by such organisations as the International Monetary Fund. Although the measure of overseas control of New Zealand firms varies according to a great number of circumstances, a minimum holding of 25 percent does provide a consistent and practical criterion for determining its presence.
In the following table, six significant values for the 1,270 overseas controlled companies are shown in industry groups both as absolute values, and as percentages of the totals for all companies assessed for income tax in the 1970-71 income year. The figures for assessable income and for shareholders' funds would indicate that overseas-affiliated companies are, on average, larger units than are wholly New Zealand controlled companies. On the other hand it must be remembered that the New Zealand companies include Government trading departments which may follow profit policies different from private sector companies and for which capital values are not included in shareholders' funds. The figures would also suggest that there is some concentration of branches and subsidiaries of overseas companies in the four manufacturing groups and mining and quarrying; these industries offer scope to large concerns with access to capital and technical expertise.
| Industry Group | Number of Returns | Assessable Income | Income Tax Assessed | Net Business Loss | Shareholders' Funds | Dividends Paid | ||
|---|---|---|---|---|---|---|---|---|
| Paid-up Capital | Total | |||||||
(1) Companies with overseas affiliation. (2) All N.Z companies including (1). (3) Percentage of (1) to (2). | ||||||||
| $(million) | ||||||||
| Agriculture and livestock production, forestry, hunting, and fishing | (1) | 14 | 0.4 | 0.2 | 0.1 | 3.4 | 4.4 | - |
| (2) | 6,445 | 14.6 | 5.4 | 8.0 | 91.5 | 234.1 | 4.3 | |
| (3) | 0.2 | 3.0 | 3.8 | 1.8 | 3.8 | 1.9 | 0.1 | |
| Mining and quarrying | (1) | 24 | 0.1 | - | 2.9 | 5.0 | 36.7 | 0.1 |
| (2) | 343 | 2.3 | 1.0 | 6.7 | 18.1 | 67.6 | 1.0 | |
| (3) | 7.0 | 2.7 | 2.9 | 43.6 | 27.7 | 54.4 | 9.5 | |
| Manufacturing—food, beverages and tobacco | (1) | 60 | 14.5 | 7.2 | 1.9 | 74.9 | 144.4 | 3.2 |
| (2) | 929 | 59.2 | 29.1 | 5.9 | 238.0 | 511.1 | 20.0 | |
| (3) | 6.5 | 24.5 | 24.9 | 31.5 | 31.4 | 28.3 | 15.8 | |
| Manufacturing—textiles, wearing apparel, and made-up textiles | (1) | 29 | 4.5 | 2.2 | 0.5 | 18.3 | 45.0 | 3.3 |
| (2) | 956 | 24.0 | 11.6 | 2.5 | 59.4 | 144.7 | 9.3 | |
| (3) | 3.0 | 18.7 | 19.2 | 20.8 | 30.9 | 31.1 | 35.4 | |
| Manufacturing—wood, paper and chemical products, and miscellaneous manufacturing | (1) | 195 | 45.6 | 22.8 | 1.1 | 106.0 | 200.0 | 15.6 |
| (2) | 3,622 | 110.7 | 53.8 | 6.7 | 311.8 | 655.5 | 40.8 | |
| (3) | 5.4 | 41.2 | 42.3 | 16.4 | 34.0 | 30.5 | 38.3 | |
| Manufacturing—metals and metal products | (1) | 133 | 15.9 | 7.8 | 0.6 | 40.3 | 81.4 | 3.9 |
| (2) | 4,461 | 52.6 | 24.2 | 21.7 | 129.2 | 284.3 | 15.7 | |
| (3) | 3.0 | 30.2 | 32.4 | 2.9 | 31.2 | 28.6 | 25.0 | |
| Construction | (1) | 30 | 0.9 | 0.4 | 1.9 | 4.0 | 5.0 | 0.1 |
| (2) | 5,365 | 23.8 | 9.9 | 6.7 | 46.2 | 128.2 | 5.7 | |
| (3) | 0.6 | 3.7 | 4.4 | 28.9 | 8.7 | 3.9 | 2.2 | |
| Electricity, gas, water, and sanitary services | (1) | - | - | - | - | - | - | - |
| (2) | 53 | 0.5 | 0.2 | 0.2 | 3.2 | 6.8 | 0.2 | |
| (3) | - | - | - | - | - | - | - | |
| Commerce—wholesale and retail | (1) | 335 | 58.7 | 29.3 | 0.7 | 123.6 | 281.7 | 11.9 |
| (2) | 18,757 | 206.7 | 96.9 | 11.5 | 526.4 | 1,250.9 | 59.2 | |
| (3) | 1.8 | 28.4 | 30.2 | 5.9 | 23.5 | 22.5 | 20.2 | |
| Commerce—other | (1) | 344 | 47.2 | 14.0 | 2.8 | 123.5 | 232.6 | 12.7 |
| (2) | 17,452 | 127.9 | 43.6 | 9.1 | 667.8 | 1,331.8 | 63.7 | |
| (3) | 2.0 | 36.9 | 32.2 | 31.2 | 18.5 | 17.5 | 19.9 | |
| Transport, storage, and communication | (1) | 42 | 2.1 | 1.1 | 0.3 | 9.2 | 23.7 | 0.5 |
| (2) | 2,526 | 16.3 | 7.2 | 5.2 | 68.8 | 145.9 | 5.0 | |
| (3) | 1.7 | 13.2 | 14.8 | 4.9 | 13.4 | 16.3 | 10.8 | |
| Services—community, business and recreation | (1) | 64 | 3.2 | 1.6 | 1.2 | 8.0 | 13.4 | 0.8 |
| (2) | 5,614 | 22.2 | 9.7 | 5.0 | 60.0 | 176.5 | 5.6 | |
| (3) | 1.1 | 14.4 | 16.7 | 24.5 | 13.3 | 7.6 | 15.2 | |
| All industries | (1) | 1,270 | 193.0 | 86.8 | 14.1 | 516.2 | 1,068.5 | 52.3 |
| (2) | 66,523 | 660.7 | 292.7 | 89.2 | 2,220.4 | 4,937.4 | 230.4 | |
| (3) | 1.9 | 29.2 | 29.7 | 15.8 | 23.2 | 21.6 | 22.7 | |
BALANCE DATE OF COMPANIES—A classification of companies by the month in which the balance date fell was made for the income year 1970-71. As the results could be of some general interest, the table below shows for each industry group the number of companies by month of balance date. More complete descriptions of the industry groups will be found in earlier tables.
| Industry Group | January | February | March | April | May | June | July | August | September | October | November | December |
|---|---|---|---|---|---|---|---|---|---|---|---|---|
| Agriculture | 31 | 20 | 2,708 | 44 | 512 | 2,257 | 119 | 49 | 37 | 126 | 24 | 51 |
| Forestry. | 8 | 4 | 373 | 4 | 6 | 25 | 2 | 6 | 9 | 11 | 8 | 11 |
| Mining | 3 | 4 | 243 | 5 | 6 | 32 | 5 | 8 | 6 | 9 | 2 | 20 |
| Manufacturing— | ||||||||||||
| Food | 24 | 13 | 518 | 7 | 83 | 85 | 36 | 27 | 26 | 56 | 13 | 41 |
| Textiles | 36 | 18 | 645 | 13 | 20 | 75 | 22 | 11 | 12 | 31 | 21 | 52 |
| Metals | 62 | 67 | 3,694 | 33 | 52 | 136 | 49 | 33 | 45 | 120 | 46 | 124 |
| Wood | 61 | 64 | 2,782 | 33 | 42 | 194 | 43 | 45 | 65 | 106 | 33 | 154 |
| Construction | 61 | 48 | 4,821 | 12 | 24 | 84 | 22 | 30 | 34 | 105 | 35 | 89 |
| Electricity | 1 | - | 44 | 1 | - | 1 | 1 | - | 2 | - | - | 3 |
| Commerce— | ||||||||||||
| Wholesale and retail | 580 | 787 | 14,102 | 194 | 332 | 890 | 412 | 251 | 261 | 455 | 176 | 317 |
| Other | 188 | 236 | 13,674 | 132 | 253 | 1,471 | 204 | 147 | 196 | 388 | 136 | 427 |
| Transport | 32 | 19 | 1,942 | 14 | 32 | 206 | 37 | 34 | 51 | 70 | 33 | 56 |
| Services | 70 | 98 | 4,252 | 62 | 89 | 314 | 121 | 82 | 105 | 138 | 77 | 206 |
| Totals | 1,157 | 1,378 | 49,798 | 554 | 1,451 | 5,770 | 1,073 | 723 | 849 | 1,515 | 604 | 1,551 |
CENSUS 1971: INCOMES OF INDIVIDUALS—The following statistics on incomes were compiled from the population census taken on 23 March 1971.
The table divides into income groups the persons actively engaged, and also the total population, including those not actively engaged in employment.
The questionnaire on the schedule asked for income for the year ended 31 March 1971 from all sources without deduction of taxes, superannuation, life insurance, rates, etc. Social security benefits (age, family, etc.) and war pensions were not included.
| Income Group | Persons Actively Engaged | Total Population | ||||
|---|---|---|---|---|---|---|
| Males | Females | Total | Males | Females | Total | |
| $ | ||||||
| Nil -999 | 35,469 | 78,733 | 114,202 | 638,998 | 1,121,334 | 1,763,332 |
| 1,000-1,399 | 28,959 | 53,529 | 82,488 | 38,398 | 69,440 | 107,838 |
| 1,400-1,799 | 33,336 | 53,899 | 87,235 | 39,405 | 62,854 | 102,259 |
| 1,800-2,199 | 62,177 | 49,982 | 112,159 | 68,164 | 57,790 | 125,954 |
| 2,200-2,599 | 97,168 | 36,254 | 133,422 | 101,397 | 41,015 | 142,412 |
| 2,600-2,999 | 99,196 | 23,871 | 123,067 | 102,006 | 26,793 | 128,799 |
| 3,000-3,999 | 202,780 | 21,218 | 223,998 | 206,747 | 24,939 | 231,686 |
| 4,000-4,999 | 100,957 | 5,228 | 106,185 | 102,988 | 6,793 | 109,781 |
| 5,000-5,999 | 46,524 | 1,799 | 48,323 | 47,647 | 2,633 | 50,280 |
| 6,000-6,999 | 22,034 | 777 | 22,811 | 22,694 | 1,271 | 23.965 |
| 7,000-7,999 | 11,917 | 402 | 12,319 | 12,274 | 682 | 12,956 |
| 8,000-8,999 | 8,345 | 286 | 8,631 | 8,607 | 499 | 9,106 |
| 9,000-9,999 | 5,615 | 172 | 5,787 | 5,786 | 286 | 6,072 |
| 10,000-14,999 | 11,626 | 300 | 11,926 | 12,000 | 660 | 12,660 |
| 15,000 and over | 5,775 | 161 | 5,936 | 6,022 | 372 | 6,394 |
| Not specified | 13,091 | 7,255 | 20,346 | 17,723 | 14,414 | 32,137 |
| Totals | 784,969 | 333,866 | 1,118,835 | 1,430,856 | 1,431,775 | 2,862,631 |
There would also be, in the smaller income group, considerable numbers of people who began work towards the end of 1970, or early in 1971, i.e., school leavers.
In the following table incomes of actively engaged persons from the population census on 23 March 1971 are related to highest levels of educational attainment or attendance.
| Highest Formal Educational Qualification | Income Group | Total | |||||
|---|---|---|---|---|---|---|---|
| Under $1,000 | $1.000-$2.999 | $3,000-$5.999 | $6,000-$7.999 | $8.000 or over | |||
| *Most of this group have attended secondary school. | |||||||
| University degree or diploma | M | 1,282 | 5,173 | 16,317 | 6,621 | 9,133 | 37,721 |
| F | 999 | 3.094 | 3,475 | 304 | 144 | 8,057 | |
| University Entrance or higher secondary | M | 3,010 | 16,793 | 28,453 | 5,106 | 3,820 | 57,386 |
| F | 4,741 | 19,100 | 5,474 | 111 | 63 | 29,675 | |
| School Certificate (incl. endorsed) | M | 4,457 | 30,596 | 28,338 | 2,012 | 1,373 | 67,149 |
| F | 9,076 | 37,222 | 4,245 | 62 | 72 | 51,244 | |
| Other secondary | M | 972 | 8,171 | 19,861 | 2,204 | 1,398 | 32,816 |
| F | 3,261 | 12,261 | 2,381 | 88 | 48 | 18,262 | |
| Primary, nil and not specified* | M | 25,748 | 260,103 | 257,292 | 18,008 | 16,637 | 589,897 |
| F | 60,656 | 145,858 | 12,670 | 614 | 592 | 226,628 | |
| Totals, actively engaged | M | 35,469 | 320,836 | 350,261 | 33,951 | 31,361 | 784,969 |
| F | 78,733 | 217,535 | 28,245 | 1,179 | 919 | 333,866 | |
Income Earners in Each Household—An analysis of income earners in each household was made from the information collected at the census of population in 1971. For this analysis an income earner was defined as one who received $200 or more a year, excluding social security benefits, universal superannuation, and war pensions. A summary of the analysis is given in the following table.
| Number of Occupants | Number of Households with— | Total Households | |||||
|---|---|---|---|---|---|---|---|
| No Income Earners | 1 Income Earner | 2 Income Earners | 3 Income Earners | 4 Income Earners | 5 or more Income Earners | ||
| 1 | 40,281 | 73,008 | - | - | - | - | 113,289 |
| 2 | 31,132 | 80,280 | 100,142 | - | - | - | 211,554 |
| 3 | 8,268 | 52,344 | 47,028 | 24,628 | - | - | 132,268 |
| 4 | 6,250 | 64,660 | 44,230 | 18,093 | 8,723 | - | 141,956 |
| 5 | 4,143 | 44,659 | 31,979 | 11,860 | 5,556 | 2,257 | 100,454 |
| 6 | 2,574 | 23,1.11 | 16,894 | 7,287 | 3,331 | 1,655 | 54,852 |
| 7 | 1,536 | 9,583 | 7,141 | 3,616 | 1,807 | 1,047 | 24,730 |
| 8 | 960 | 4,253 | 2,969 | 1,723 | 966 | 631 | 11,502 |
| 9 | 556 | 1,867 | 1,297 | 912 | 510 | 405 | 5,547 |
| 10 | 294 | 901 | 639 | 461 | 288 | 230 | 2,813 |
| 11 | 188 | 370 | 324 | 221 | 132 | 131 | 1,366 |
| 12 | 101 | 188 | 141 | 132 | 73 | 75 | 710 |
| 13 | 70 | 55 | 68 | 51 | 31 | 47 | 322 |
| 14 | 31 | 25 | 23 | 22 | 31 | 23 | 15.5 |
| 15 and over | 51 | 13 | 15 | 24 | 24 | 41 | 168 |
| Total | 96,435 | 355,317 | 252,890 | 69,030 | 21,472 | 6,542 | 801,686 |
Of the 801,686 households at the 1971 Census of Population and Dwellings, there were 485,789 complete one-family-only households, that is a husband and a wife with or without unmarried children of any age. These were analysed by the incomes of the head of the household and the wife (or spouse) and the results are given in the following table to indicate where the income of the wife (or spouse) exceeded $600 a year.
| Income Group | Heads of Households in Income Group | Spouses with Incomes over $600 | Households with Unmarried Children of Any Age | ||
|---|---|---|---|---|---|
| Number | Percentage of Households | Number | Percentage of Households | ||
| $ | |||||
| Under 600 | 36,687 | 2,985 | 8.1 | 7,465 | 20.3 |
| 600-999 | 6,882 | 1,898 | 27.6 | 2,140 | 31.1 |
| 1,000-1,399 | 9,208 | 2,768 | 30.1 | 4,095 | 44.5 |
| 1,400-1,799 | 10,519 | 3,349 | 31.8 | 5,552 | 52.8 |
| 1,800-2,199 | 26,801 | 7,822 | 29.2 | 16,355 | 61.0 |
| 2,200-2,599 | 50,017 | 15,599 | 31.2 | 33,563 | 67.1 |
| 2,600-2,999 | 56,868 | 18,553 | 32.6 | 39,979 | 70.3 |
| 3,000-3,999 | 133,692 | 43,370 | 32.4 | 100,409 | 75.1 |
| 4,000-4,999 | 72,078 | 22,113 | 30.7 | 57,236 | 79.4 |
| 5,000-5,999 | 33,332 | 10,009 | 30.0 | 26,689 | 80.1 |
| 6,000-6,999 | 15,719 | 4,562 | 29.0 | 12,489 | 79.5 |
| 7,000-7,999 | 8,355 | 2,433 | 29.1 | 6,674 | 79.9 |
| 8,000-8,999 | 5,802 | 1,689 | 29.1 | 4,563 | 78.6 |
| 9,000-9,999 | 3,003 | 1,083 | 27.7 | 3,104 | 79.5 |
| 10,000-14,999 | 7,754 | 2,400 | 31.0 | 6,204 | 80.0 |
| 15,000 and over | 3,464 | 1,207 | 34.8 | 2,763 | 79.8 |
| Not specified | 4,708 | 1,244 | 26.4 | 2,917 | 62.0 |
| Totals | 485,789 | 143,084 | 29.5 | 332,197 | 68.4 |
Households in which the highest percentages of wives had incomes above $600 (many of these would be in the labour force) were those in which the head's income was under $4,000. Households with heads in this income range also had the lowest percentage of children (except for the low-income groups of mainly retired persons). The relatively moderate incomes and relatively high percentages of households without children suggest that a substantial proportion of these households consisted of young married couples who had not yet started families, so that wives were able to remain in employment. Income includes investment income as well as wages or salary; this could have significance in the wealthier households.
GENERAL—The core of the New Zealand banking system comprises a central bank (the Reserve Bank of New Zealand) and five commercial or trading banks. There are also 12 trustee savings banks and the Post Office Savings Bank, while each trading bank has had a private savings bank since 1 October 1964. In addition, a number of trading companies, investment societies, etc., perform quasi-banking functions, accepting deposits and granting credits (short-term and long-term) to clients. In some instances deposits are repayable to the client's order at call—virtually a system of cheque issuing. An expansion in the size and scope of near-banks (or non-banking financial institutions) has been a feature in recent years in New Zealand as in many other countries. Report No. 10 of the Monetary and Economic Council, The New Zealand Financial System, published in March 1966, presents a comprehensive description of the financial and credit system, and Report No. 24, published in December 1972, reviews recent developments in the financial system.
RESERVE BANK—The Reserve Bank of New Zealand Act 1964 provides the Reserve Bank with powers in line with modern central banking practice and monetary policy. It provides the Government and the Reserve Bank with flexible authority to take such monetary action within, and to some extent outside, the conventional banking system as may be appropriate to the times.
Section 8 is the most important section in the Act. As amended in 1973, it restates the primary functions of the bank, its basic relationships with Parliament, the Government, and the Minister of Finance, and lays down the criteria for Government monetary policy. The section reads:
“(1) The primary functions of the bank shall be—
To act as the central bank for New Zealand; and
To ensure the availability and conditions of credit provided by financial institutions are not inconsistent with the sovereign right of the Crown to control money and credit in the public interest; and
To advise the Government on matters relating to monetary policy, banking, and overseas exchange; and
Within the limits of its powers, to give effect to the monetary policy of the Government as communicated in writing to the bank under subsection (2) of this section, and to any resolution of Parliament in relation to that monetary policy.
“(2) For the purposes of this Act, the Minister may from time to time communicate to the bank the monetary policy of the Government, which shall be directed to the maintenance and promotion of economic and social welfare in New Zealand having regard to the desirability of promoting the highest degree of production, trade, and employment and of maintaining a stable internal price level.
“(3) The bank shall, as directed by the Minister, regulate and control on behalf of the Government—
Money, banking, banking transactions, credit, currency and the borrowing and lending of money;
Rates of interest in respect of such classes of transactions as may from time to time be prescribed;
Overseas exchange and overseas exchange transactions.
“(4) The bank shall make such loans to the Government and on such conditions as the Minister decides from time to time, in order to ensure the continuing full employment of labour and other resources of any kind.”
Whilst the bank must give effect to Government monetary policy or to resolutions of Parliament related thereto, the directors are given a fair degree of independence and responsibility in the carrying out of the policy laid down, and in the management of the bank and the conduct of its business.
The exercise of the Reserve Bank's powers is at the discretion of the directors, but the consent of the Minister of Finance is required in certain special cases. The consent of the Governor-General in Council is required before the bank can engage in trade or have a direct interest in any commercial, industrial, or financial institution, or purchase, or lend against, the shares of a trading bank or financial institution. The Government is required to entrust to the bank, and the bank to undertake, free of charge to the Government, all Government banking transactions.
The Reserve Bank has 10 directors, comprising the Governor, the Deputy Governor, the Secretary to the Treasury, and seven other directors appointed by the Governor-General in Council.
Bank Notes—The bank retains the sole right of issue, and has authority for the calling in, with the consent of the Minister, of any note or series of notes issued by the bank. Notes called in cease to be legal tender, but remain a liability of the bank. Provisions covering the defacing of bank notes and their reproduction or imitation without the prior consent of the bank are in the Reserve Bank Act.
Overseas Exchange—Part IV of the Reserve Bank Act 1964 deals with overseas exchange and other transactions affecting the overseas resources of New Zealand. The bank has the authority to fix the actual exchange rates used in its operations, and may also prescribe or approve rates of exchange to be used by other persons in foreign exchange transactions. In December 1968 an amendment to the Act gave the Minister of Finance the right, after consultation with the Governor, to determine the par value of the New Zealand dollar in terms of the Articles of Agreement of the International Monetary Fund.
In recognition of the fact that the holding of external reserves is dependent on aspects of economic policy and conditions beyond the control of the Reserve Bank, its duty is described as “to endeavour, within the limits of its powers, to maintain, in addition to any holdings of gold, an adequate level of overseas reserves”. The bank keeps the Minister of Finance informed of the overseas exchange position and prospects, and of the level of overseas exchange reserves it regards as adequate. To assist it in carrying out this duty to hold reserves, the bank has a statutory power to require trading banks to sell to it their foreign exchange holdings in excess of maximum amounts prescribed by the Reserve Bank.
Comprehensive permissive provisions for exchange control regulations are set out in Part IV of the Act. There are adequate powers for control of takeovers in New Zealand by overseas interests, and for control over overseas companies commencing business in New Zealand and control of capital issues.
Since the passing of the 1964 Act, regulations have been promulgated for the control of: (a) overseas remuneration received by New Zealand residents for services rendered to non-residents (subsequently included in the Exchange Control Regulations 1965); (b) finance companies by giving power to the Reserve Bank to require them to hold a percentage of their holdings in Government stock; (c) deposit-holding bodies by restricting the interest rate they may pay on some types of borrowings; and (d) financial enterprises by placing a “ceiling” on the profits they may earn in any financial year and surveilling the prices charged for services.
Regulation of Banking and Credit—In Part V of the 1964 Act, trading banks are required to make monthly returns to the Reserve Bank detailing their principal liabilities and assets. Statutory authority has been provided for obtaining such subsidiary returns and other information from trading banks as the Reserve Bank may require.
There is complete flexibility, subject to the approval of the Minister, in the application of reserve ratios or assets ratios. The trading banks may be required to hold balances at the Reserve Bank or to hold assets of a specified kind including balances at the Reserve Bank. The minimum requirements may be laid down as a percentage of deposit liabilities or of assets, as a percentage of parts of such deposit liabilities or assets or as percentages of both, or in any other manner. Different percentages may be laid down for different classes of deposit liabilities or assets. Under earlier legislation, the minimum requirements could not be reduced below 7 percent of demand plus 3 percent of time liabilities; there is now no minimum.
The Reserve Bank is authorised to give directions to trading banks as to the policy to be followed in relation to advances, discounts, and investments and in relation to rates of interest or discount.
The Reserve Bank of New Zealand Amendment Act 1973 extended the controls previously exercised over the trading banks to include all financial institutions. The Amendment Act provided the monetary authorities with forms of control over non-bank financial institutions with the power:
To make recommendations or give directives,
To specify rates of interest,
To require the holding of specified assets,
To require information,
To inspect books.
To enable the Reserve Bank to obtain information of all other financial institutions the bank may from time to time, with the consent of the Minister, by notice in writing to any financial institution (other than a trading bank), or by notice in the Gazette applying to any specified class of financial institution (other than a trading bank), require the institution(s) of that class to supply to the bank such returns or information relating to the assets and liabilities of its business. The Governor-General may also require, by Order in Council, all or any specified class of financial institution (other than trading banks) to hold specified assets.
Statistics collected from finance companies, the short-term money market, life assurance companies stock and station agents, and all savings banks appear regularly in the Reserve Bank Bulletin. Since December 1973, statistics on commercial bills have also been published.
Bank Profits—The net profits of the bank are paid to the Consolidated Revenue Account. The net profit for the year ended 31 March 1973, was $7,904,657 and for the year ended 31 March 1974 $12,564,255.
The indemnity arrangement between the Reserve Bank and the Government in the event of an exchange rate adjustment was re-enacted in 1973 in an amended form because the section of the Act was not adequate to deal with the new situation of floating exchange rates. The latest amendment enables the indemnity arrangement to be adjusted in the event of any prolonged floating of any one or more of the major currencies. While a currency is “floating” or has been allowed to depart from its declared I.M.F. parity but the requisite formalities to establish a new parity have not been completed, the Minister of Finance now has the power to declare a basic rate between that currency and New Zealand currency for the purposes of making a settlement between the bank and the Government.
HISTORICAL DEVELOPMENT—Initially the Reserve Bank, as established by the Reserve Bank of New Zealand Act 1933, was a privately-owned institution with a share capital widely held throughout New Zealand. Of the seven full directors other than the Governor and Deputy Governor, three only were appointed by the Governor-General. The Secretary to the Treasury, although a member of the board, did not have the right to vote. The bank was therefore to a large extent independent of the Government, but the original Act required it, as its primary duty, to exercise control over monetary circulation and credit to the end that the economic welfare of the Dominion might be promoted and maintained.
Considerable care was taken to see that the bank was free from political interference. The first Governor of the bank made it clear, however, that the board of the bank accepted the view that the ultimate responsibility for the monetary policy of New Zealand must rest with the Government of the day. The board, nevertheless, held it was the duty of the bank to tender to the Government impartial advice on monetary and financial matters, and to exercise its own judgment in carrying out those functions entrusted to it.
The business of the bank was strictly defined, however, and the 1933 Act laid down limitations designed to ensure that the bank did not become an easy source of credit for the community, or a source of inflationary finance for the Government. The bank was given power to determine the exchange rates at which it bought and sold sterling, was required to be prepared at all times to sell sterling at the rates so fixed, and was also required to hold overseas exchange reserves equivalent to at least 25 percent of its notes and other demand liabilities. In addition, the trading banks were deprived of the right to issue notes and were required to hold minimum balances with the Reserve Bank.
Through this 1933 legislation, Parliament substantially increased its control over the monetary affairs of the country, and set up a national institution, with the sole right of note issue, to manage the currency. The legislation was the culmination of proposals, ranging back to 1886 that a central bank, or a State trading bank, should be set up in New Zealand.
In 1936 the bank became a State-owned institution, the whole of the board being appointed by the Government, and the Secretary to the Treasury was given the right to vote at board meetings. Its general function was changed to that of giving effect to the monetary policy of the Government, as communicated to it by the Minister of Finance. For this purpose, and the promotion of economic and social welfare, the bank was still required to regulate and control currency and credit, but was also empowered to control the transfer of money to and from New Zealand, and the disposal of export proceeds. Power was taken to suspend the bank's duty to sell sterling on demand.
In 1936 also, some of the restraints on Reserve Bank lending were relaxed, but the ability of the Reserve Bank to influence monetary conditions was greatly enhanced by empowering the Governor of the bank, with the authority of the Minister of Finance, to vary the minimum balances that the trading banks were required to hold at the Reserve Bank. In the same year, the Reserve Bank became Registrar of Government Stock.
In 1939 the Government's authority was reinforced by adding a requirement for the bank to have regard to any representations made by the Minister in respect of any functions or business of the bank, and to give effect to any decision of the Government in relation thereto conveyed to the Governor in writing. The Minister of Finance was given power to suspend indefinitely the duty of the bank to hold overseas reserves equal to not less than 25 percent of its demand liabilities, which could previously be suspended for short periods only.
In 1950 the 1939 amendment relating to representations by the Minister and decisions of the Government in respect of the functions and business of the bank was repealed. A new requirement—to give effect to any resolution of Parliament in respect of the bank's functions or business—was substituted, this change being designed to restore to the bank a degree of independence, while still requiring it ultimately to carry out Government policy. The duty of the bank to hold overseas reserves was changed to a duty to hold reserves which the board considered would provide a reasonable margin for contingencies. A further change in 1950 was to add to the criteria for monetary action the safeguarding of a stable internal price level and the promotion of the highest degree of production, trade, and employment that could be achieved by monetary action.
Towards the end of 1960, an amending Act removed the reference to a resolution of Parliament, reinserted the 1939 requirement regarding representations by the Minister and decisions of the Government, and recast, without significant change, the criteria for monetary policy. It declared the sovereign right of the Crown to control currency and credit, and introduced wide general powers for the bank, on behalf of the Government, to regulate and control “money, banking, credit, and currency” and interest rates, together with specific power to give directions to the trading banks. The existing right of the bank to determine overseas exchange rates was made subject to a prior right for the Minister of Finance, after consultation with the Governor, to determine the basic rate of exchange with sterling.
The Reserve Bank of New Zealand Act 1964 consolidated and amended the earlier enactments and made better provision for the control of overseas exchange and other transactions.
The Reserve Bank of New Zealand Amendment Act 1973 stated that it is a primary function of the Bank to ensure that the availability and conditions of credit provided by financial institutions are not inconsistent with the sovereign right of the Crown to control money and credit in the public interest.
The bank was also empowered to regulate credit from all sources, not just bank credit. At the same time the bank was required to make loans to the Government on such conditions as the Minister of Finance might decide to ensure continuing full employment of labour.
Discount Rate—In effect, the Reserve Bank's discount rate is the minimum rate at which trading banks may borrow from the bank if they need to do so in order to maintain the statutory minimum ratios, and the rate at which the bank lends to approved short-term money market dealers. So far the Reserve Bank's discount rate has applied mainly to transactions with trading banks and the approved short-term money market dealers. The discount rate does not apply to advances to the State or Marketing organisations. Between October 1970 and March 1971 a sliding scale was introduced for the trading banks in which borrowing was charged in three tranches of 7 percent, 8 1/2 percent, and 10 percent. In March 1974 these tranches were reimposed, but the first two tranches are equivalent to 1 percent of a bank's total deposits as compared with 1/2 percent during the earlier period.
Liabilities and Assets—Details of the liabilities and assets of the Reserve Bank at the end of June for the latest six years, and weekly averages for calendar years are shown in the following tables.
| LIABILITIES OF RESERVE BANK | |||||||
|---|---|---|---|---|---|---|---|
| Year | Bank Notes | Demand Deposits | Other Liabilities | Total Liabilities | |||
| State | Marketing | Banks | Other | ||||
| $(million) | |||||||
| Weekly Average for Calendar Year | |||||||
| 1969 | 173.9 | 74.2 | 4.5 | 36.3 | 60.2 | 40.8 | 389.9 |
| 1970 | 182.9 | 74.1 | 4.1 | 44.7 | 36.9 | 59.9 | 402.6 |
| 1971 | 201.8 | 80.1 | 3.4 | 32.3 | 15.9 | 76.4 | 409.9 |
| 1972 | 223.9 | 195.8 | 3.6 | 38.0 | 18.8 | 124.6 | 604.7 |
| 1973 | 262.3 | 276.3 | 17.9 | 31.5 | 63.8 | 308.9 | 960.7 |
| 1974 | 305.8 | 154.7 | 21.1 | 25.0 | 165.1 | 328.8 | 1,000.5 |
| At End of June | |||||||
| 1969 | 167.8 | 100.5 | 4.3 | 20.1 | 82.2 | 41.8 | 416.7 |
| 1970 | 176.1 | 77.1 | 3.5 | 48.4 | 48.2 | 65.7 | 419.1 |
| 1971 | 193.8 | 115.7 | 3.3 | 29.2 | 14.7 | 70.0 | 426.6 |
| 1972 | 212.6 | 267.9 | 3.2 | 35.3 | 25.8 | 106.2 | 651.0 |
| 1973 | 249.7 | 426.8 | 17.5 | 0.4 | 51.2 | 335.9 | 1,081.5 |
| 1974 | 293.1 | 107.9 | 20.3 | - | 115.2 | 346.4 | 883.0 |
| ASSETS OF THE RESERVE BANK | |||||||||
|---|---|---|---|---|---|---|---|---|---|
| Year | Overseas Assets | Investments in New Zealand | Advances in New Zealand | All Other Assets in New Zealand | |||||
| Gold | Short-term | Investments | Special Drawing Rights | State | Marketing Organisations | Other Advances and Discounts | |||
| $(million) | |||||||||
| Weekly Average for Calendar Year | |||||||||
| 1969 | 1.0 | 72.0 | 44.9 | - | 69.2 | 13.2 | 150.8 | 24.0 | 14.8 |
| 1970 | 0.8 | 57.5 | 51.5 | 16.4 | 74.7 | 7.4 | 148.3 | 29.7 | 16.3 |
| 1971 | 0.7 | 86.2 | 60.3 | 20.6 | 65.3 | 5.7 | 135.9 | 19.1 | 16.1 |
| 1972 | 0.7 | 193.4 | 121.3 | 49.7 | 40.5 | 0.2 | 156.0 | 11.5 | 31.4 |
| 1973 | 0.7 | 240.1 | 315.0 | 52.0 | 82.8 | 0.2 | 205.6 | 11.5 | 52.8 |
| 1974 | 0.7 | 72.4 | 258.4 | 27.7 | 256.2 | 54.8 | 248.1 | 19.9 | 62.3 |
| At End of June | |||||||||
| 1969 | 1.0 | 103.1 | 42.9 | - | 55.7 | 0.4 | 169.1 | 29.4 | 15.2 |
| 1970 | 0.8 | 69.9 | 58.1 | 23.5 | 65.9 | 0.4 | 163.1 | 22.8 | 14.6 |
| 1971 | 0.7 | 94.4 | 73.8 | 19.4 | 62.2 | 0.5 | 137.7 | 11.3 | 26.7 |
| 1972 | 0.7 | 202.1 | 159.8 | 51.6 | 29.8 | 0.4 | 173.1 | 9.9 | 23.7 |
| 1973 | 0.7 | 263.5 | 407.6 | 51.9 | 115.0 | 0.2 | 207.2 | 9.3 | 26.0 |
| 1974 | 0.7 | 19.8 | 222.3 | 51.7 | 285.1 | 0.4 | 234.7 | 15.6 | 52.7 |
TRADING BANKS—There have been trading banks in New Zealand since the early days of settlement and they have conducted their business according to the general principles which have long been traditional in British banking institutions. With the exception of the Bank of New Zealand, which became a fully State-owned bank with the passing of the Bank of New Zealand Act 1945, the banks are owned by private shareholders and their shares are traded on the stock exchanges. New Zealand has a branch banking system with more than 1,000 branches and agencies in New Zealand and a world-wide network of agents and correspondents. The general business of banking is governed by the Banking Act 1908. Part II of the Bills of Exchange Act 1908 and the Cheques Act 1960 are the law relating to cheques drawn on a bank.
Banks accept deposits from the public for either a fixed term or on a “on demand” basis. Fixed term or time deposits bear interest, but unlike demand deposits cannot be operated on by cheque. Cheques drawn on current accounts are efficient and widely used instruments for the settlement of commercial and private debts. The fundamental principle of bank advances policy is to confine advances as far as possible to financing customers' current trade or seasonal requirements, and to avoid tying up available resources in fixed or long-term finance. The major form of bank lending to customers is still by way of overdraft but term lending, mainly for medium terms of from 2-5 years, grew rapidly from approximately 3 percent of total bank lending in December 1971 to 25 percent in December 1974.
With the enactment of the Private Savings Banks Act 1964 the trading banks established savings banks from 1 October 1964 on a similar basis to that of UK Post Office Savings Bank, including ordinary accounts, investment, thrift club, home lay-by, and special purpose accounts.
There are five trading banks in New Zealand, two of these institutions—the Bank of New Zealand and the National Bank of New Zealand Limited—being incorporated by special Acts of the General Assembly of New Zealand, although the National Bank is domiciled in the United Kingdom. The other three banks—the Australia and New Zealand Banking Group Limited, the Bank of New South Wales, and the Commercial Bank of Australia Limited—are predominantly Australian institutions.
The close Australian affiliations of the Australian banks operating in New Zealand resulted in the past in an interlocking between the Australian and New Zealand financial structures, the separation of New Zealand business being one of the major motives leading up to the founding of the Reserve Bank.
Bank of New Zealand—The Bank of New Zealand became a wholly State-owned trading bank on the passing of the Bank of New Zealand Act in 1945. At 31 March 1973 it had 192 branches and 217 agencies in New Zealand, and overseas branches in London, Australia, and Fiji. It also has representative offices in Japan and Singapore and owns 50 percent of the shareholding of the Bank of Western Samoa. In addition, in common with other trading banks, it operates a savings bank. A finance company promoted by the bank commenced operations on 1 April 1966, and a merchant bank in which the bank has a 40 percent shareholding was established in 1973.
Gross profits of the Bank of New Zealand during the year ended 31 March 1974 totalled $43.6 million giving a net profit of $6.7 million. Comparable figures for the previous year were $35.2 million and $5.2 million. The total assets amounted to $1,111 million. Among the main items were loans and advances to customers ($695.8 million); securities of, or guaranteed by, the New Zealand Government ($95.4 million); and cash in hand and deposits with bankers, $253.4 million. Bank properties and equipment were valued at $30.6 million. The principal item of liabilities was deposits, at $953.8 million. The paid-up capital and reserves totalled $60 million.
Liabilities and Assets of Trading Banks—Since the Reserve Bank commenced operations the trading banks have been required to submit at monthly intervals a return of certain liabilities and assets in respect of New Zealand business. Monthly averages for the latest 6 calendar years and figures as at the last Wednesday in June are given in the next table.
| SELECTED LIABILITIES OF TRADING BANKS* | |||||
|---|---|---|---|---|---|
| Year | Liabilities in New Zealand | Liabilities Outside New Zealand | Total Liabilities | ||
| Deposits | Other Liabilities | ||||
| Demand | Time | ||||
| *Trading bank business only, excludes liabilities of savings bank subsidiaries, shareholders' funds, capital liabilities to overseas head offices, contingencies, interbank accounts, and transit items within New Zealand. | |||||
| $(million) | |||||
| Monthly Average for Calendar Year | |||||
| 1969 | 613.7 | 198.2 | 44.4 | 6.9 | 863.2 |
| 1970 | 640.5 | 270.0 | 43.0 | 6.3 | 959.8 |
| 1971 | 682.9 | 340.4 | 30.7 | 10.7 | 1,064.7 |
| 1972 | 808.9 | 500.1 | 19.2 | 21.3 | 1,349.5 |
| 1973 | 1,072.0 | 781.7 | 31.9 | 34.3 | 1,919.9 |
| 1974 | 1,106.0 | 960.0 | 49.4 | 42.2 | 2,157.6 |
| At End of June | |||||
| 1969 | 613.7 | 198.2 | 44.4 | 6.9 | 863.2 |
| 1970 | 653.7 | 253.3 | 32.0 | 8.2 | 947.2 |
| 1971 | 686.3 | 317.4 | 12.8 | 14.8 | 1,031.3 |
| 1972 | 795.9 | 485.2 | 16.0 | 20.8 | 1,317.9 |
| 1973 | 1,101.4 | 752.5 | 42.1 | 35.8 | 1,931.8 |
| 1974 | 1,111.5 | 938.9 | 86.1 | 35.7 | 2,172.2 |
| SELECTED ASSETS OF TRADING BANKS | |||||||||||||||
|---|---|---|---|---|---|---|---|---|---|---|---|---|---|---|---|
| Year | Coin | Reserve Bank Notes | Demand Deposits Held in Reserve Bank | Overseas Assets | Investments | Loans* | Other Assets† | Total Selected Assets | |||||||
*Includes advances, discounts and term lending but excludes interbank lending. †Includes interbank lending, land and buildings. | |||||||||||||||
| $(million) | |||||||||||||||
| Monthly Average for Calendar Year | |||||||||||||||
| 1969 | 4.1 | 42.7 | 38.2 | 78.1 | 117.9 | 572.4 | 66.1 | 919.5 | |||||||
| 1970 | 4.1 | 39.5 | 45.4 | 83.6 | 130.5 | 665.4 | 50.9 | 1,019.4 | |||||||
| 1971 | 4.3 | 43.0 | 31.0 | 87.4 | 167.9 | 738.3 | 47.6 | 1,119.5 | |||||||
| 1972 | 4.2 | 47.1 | 38.7 | 91.3 | 429.6 | 773.6 | 57.0 | 1,441.5 | |||||||
| 1973 | 4.7 | 54.9 | 33.1 | 111.8 | 692.4 | 1,020.8 | 81.1 | 1,998.8 | |||||||
| 1974 | 4.9 | 61.4 | 26.5 | 92.8 | 465.0 | 1,490.3 | 114.2 | 2,255.1 | |||||||
| At End of June | |||||||||||||||
| 1969 | 3.7 | 41.7 | 20.1 | 86.9 | 89.6 | 589.1 | 59.5 | 890.6 | |||||||
| 1970 | 3.8 | 40.2 | 48.4 | 97.4 | 97.6 | 673.3 | 48.5 | 1,009.2 | |||||||
| 1971 | 3.7 | 38.5 | 29.2 | 90.7 | 113.9 | 763.8 | 45.8 | 1,085.6 | |||||||
| 1972 | 3.8 | 40.8 | 33.8 | 84.5 | 358.6 | 787.5 | 49.9 | 1,358.9 | |||||||
| 1973 | 4.4 | 46.4 | 0.4 | 129.7 | 733.9 | 1,009.8 | 95.5 | 2,020.1 | |||||||
| 1974 | 4.6 | 54.0 | - | 83.4 | 442.4 | 1,536.8 | 138.9 | 2,260.1 | |||||||
Deposits and Advances—The weekly averages of total deposits (together with the amount per head of mean population), and of total advances, and the ratio of advances to deposits for each of the last 11 calendar years, are given in the following table.
| Year | Deposits | Lending† | ||||
|---|---|---|---|---|---|---|
| Not Bearing Interest | Bearing Interest | Total* | Per Head of Mean Population | Total Amount | Ratio to Deposits | |
*Including Government deposits. †Inclusive of transfers by the Bank of New Zealand to its Long-term Mortgage Department but includes advances, discounts and term loans. | ||||||
| $(m) | $(m) | percent | ||||
| 1964 | 567.3 | 146.8 | 724.8 | 279.00 | 439.9 | 60.7 |
| 1965 | 565.3 | 152.6 | 729.9 | 276.00 | 493.3 | 67.6 |
| 1966 | 549.1 | 170.4 | 731.8 | 272.30 | 513.4 | 70.2 |
| 1967 | 539.6 | 181.9 | 721.5 | 264.30 | 527.5 | 73.1 |
| 1968 | 536.6 | 203.3 | 739.9 | 268.40 | 522.0 | 70.6 |
| 1969 | 560.3 | 249.0 | 809.3 | 290.70 | 580.8 | 71.8 |
| 1970 | 581.1 | 325.9 | 907.0 | 321.10 | 669.1 | 73.8 |
| 1971 | 616.7 | 400.8 | 1,017.4 | 355.20 | 738.5 | 72.6 |
| 1972 | 728.9 | 561.6 | 1,290.5 | 443.01 | 774.6 | 60.1 |
| 1973 | 982.6 | 852.5 | 1,835.2 | 616.11 | 1,014.5 | 55.3 |
| 1974 | 1,015.4 | 1,048.4 | 2,063.7 | 677.78 | 1,486.9 | 72.0 |
In October 1969, the mechanism of varying the reserve ratios to impose a desired level of penal borrowing was replaced by a system whereby each bank was penalised according to the level of its non-priority sector advances in relation to the official ceilings for those advances. During 1970 advances grew by more than $100 million, mainly due to increased lending to the export sector. Non-priority sector advances continued to exceed their official ceilings and the banks were penalised continuously throughout the year. By March 1971 the banks were again within their ceilings and no penal borrowing was incurred for the remainder of the year. During 1971 the rate of growth of lending declined steadily. Guidelines were set for bank lending during 1972 and the rate of growth of lending continued to be very slow throughout the year until December when an upswing in bank lending commenced. By December 1972 advances were $55 million above the December 1971 level. Advances in 1973 rose sharply, largely in response to increased economic activity. A new method of control over trading bank operations was introduced on 1 June 1973. The previous guidelines-for-lending system that was in operation in 1972 and the ceiling-penalty system that operated prior to that, were replaced by a variable reserve asset ratio system of control. The ratios were set month by month to take account of seasonal and abnormal factors affecting bank liquidity. Advances in 1973 rose sharply largely in response to increased economic activity. In August 1973 the banks were given notice that their ratios would be increased in December. Lending continued to increase throughout 1974 but at a decreasing rate and there was quite a sharp slowdown in the later months of the year. A selectively tight-credit policy was maintained throughout the year.
Interest rates on trading banks advances are given in the following table.
| Rate Charged Percent | Percentage of Total Advances at Each Rate | ||||
|---|---|---|---|---|---|
| At 31 March 1970 | At 31 March 1971 | At 31 March 1972 | At 31 March 1973 | At 31 March 1974 | |
| Less than 5 1/2 | 4.3 | 4.1 | 3.7 | 4.2 | 4.9 |
| 5 1/2 and less than 6 | 39.7 | 40.1 | 43.6 | 42.7 | 38.9 |
| 6 and less than 6 1/2 | 12.2 | 11.4 | 9.9 | 9.9 | 13.0 |
| 6 1/2 and less than 7 | 20.8 | 19.5 | 17.0 | 16.4 | 14.0 |
| 7 and over | 23.0 | 25.0 | 25.8 | 26.9 | 29.2 |
| Weighted average | 6.14 | 6.08 | 6.10 | 6.10 | 6.11 |
The Reserve Bank instructed the banks to adhere to an average overdraft interest rate of 6 percent by September 1974 and this they did.
An analysis of demand deposits in New Zealand trading banks as at 13 November 1974 gave the following percentages for the different sectors: farming, forestry, hunting and fishing, 10.3 percent; manufacturing, 4.8 percent; construction, 5 percent; electricity, transport, local authorities, etc., 3.3 percent; commerce, trade finance, 15.1 percent; services, 27.9 percent; personal, 33.6 percent.
An analysis of advances and term lending by the New Zealand trading banks is given in the following table.
| Group | 10 March 1971 | 8 March 1972 | 14 March 1973 | 13 March 1974 | 12 March 1975 |
|---|---|---|---|---|---|
| 1. Farming, forestry, hunting, and fishing— | $(million) | ||||
| (a) Mainly dairy farming | 24.5 | 22.1 | 30.1 | 40.9 | 43.2 |
| (b) Mainly sheep farming | 38.2 | 37.1 | 27.6 | 42.2 | 53.4 |
| (c) Other farming | 26.3 | 27.7 | 27.6 | 43.8 | 53.2 |
| (d) Farm services | 5.0 | 5.9 | 7.0 | 10.8 | 13.2 |
| (e) Forestry, hunting, and fishing | 6.2 | 7.0 | 6.8 | 7.7 | 8.6 |
| Sub-totals | 100.3 | 99.8 | 99.0 | 145.4 | 171.5 |
| 2. Mining and quarrying | 1.2 | 1.1 | 3.5 | 2.9 | 2.6 |
| 3. Manufacturing— | |||||
| (a) Dairy companies, factories, etc. | 10.8 | 7.1 | 6.5 | 13.4 | 20.3 |
| (b) Freezing works, meat companies, etc. | 127.5 | 123.1 | 150.1 | 189.2 | 195.6 |
| (c) Other food, beverages, and tobacco | 12.9 | 18.8 | 26.9 | 32.1 | 49.4 |
| (d) Textiles, footwear, and clothing | 23.9 | 22.9 | 25.5 | 30.1 | 34.7 |
| (e) Pulp and paper and paper products | 4.5 | 6.1 | 14.8 | 18.7 | 23.4 |
| (f) Metal products, machinery, and engineering | 38.0 | 37.5 | 50.9 | 70.2 | 85.8 |
| (g) Transport equipment | 5.3 | 10.0 | 13.6 | 23.1 | 28.9 |
| (h) Other manufacturing | 44.4 | 47.9 | 62.2 | 80.3 | 115.2 |
| Sub-totals | 267.2 | 273.3 | 350.4 | 457.1 | 553.2 |
| 4. Construction | 27.3 | 26.9 | 37.4 | 68.1 | 71.0 |
| 5. Electricity, gas, water, and sanitary services | 1.9 | 2.6 | 2.0 | 3.9 | 6.2 |
| 6. Transport, storage, and communication | 11.8 | 10.3 | 18.4 | 31.5 | 34.0 |
| 7. Commerce, trade, and finance— | |||||
| (a) Wholesalers, mainly importers | 26.7 | 43.6 | 37.4 | 47.3 | 68.4 |
| (b) Wholesalers, other | 16.3 | 15.9 | 23.1 | 29.5 | 31.9 |
| (c) Retailers | 39.1 | 45.4 | 52.8 | 76.6 | 81.5 |
| (d) Woolbuyers | 37.1 | 45.0 | 67.2 | 61.1 | 48.2 |
| (e) Stock and station agents | 33.7 | 19.7 | 4.3 | 36.6 | 59.4 |
| (f) Finance companies (mainly hire-purchase) | 3.2 | 3.6 | 3.9 | 12.4 | 11.6 |
| (g) Other financial institutions | 15.4 | 14.8 | 27.4 | 50.5 | 58.9 |
| Sub-totals | 171.4 | 187.9 | 216.1 | 314.1 | 360.1 |
| 8. Local bodies, n.e.i. | 1.3 | 3.1 | 3.7 | 3.7 | 6.9 |
| 9. Services | 31.9 | 34.9 | 57.1 | 87.1 | 92.3 |
| 10. Personal— | |||||
| (a) For housing purposes | 18.9 | 21.2 | 31.6 | 73.2 | 76.8 |
| (b) Other | 39.2 | 48.0 | 103.1 | 141.7 | 138.4 |
| Sub-totals | 58.1 | 69.2 | 134.8 | 214.9 | 215.2 |
| Totals | 672.3 | 709.2 | 922.4 | 1.328.6 | 1,513.0 |
The following diagram illustrates the movements that have occurred in deposits and advances, the figures used, as in the foregoing table, being the weekly averages for calendar years.
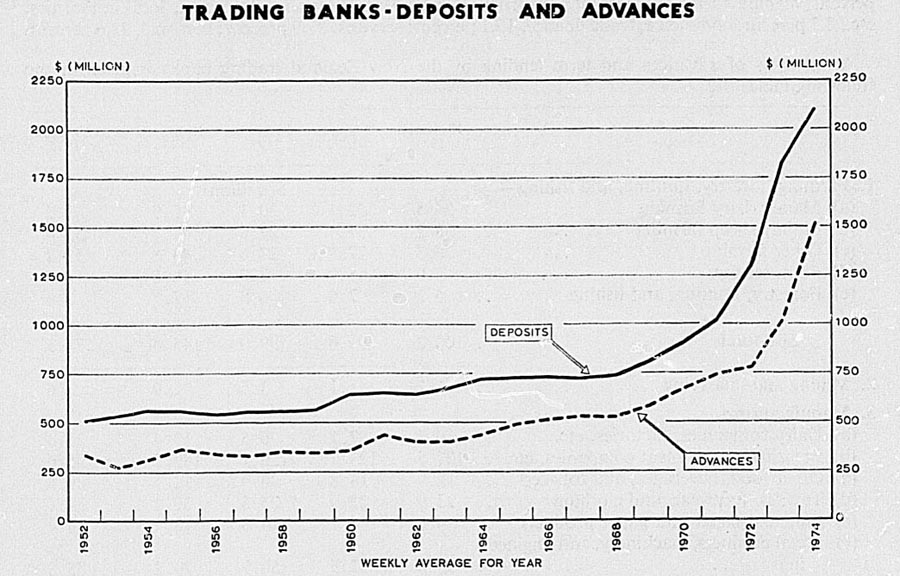
The following diagram illustrates the level of trading bank advances in March of the last three years.
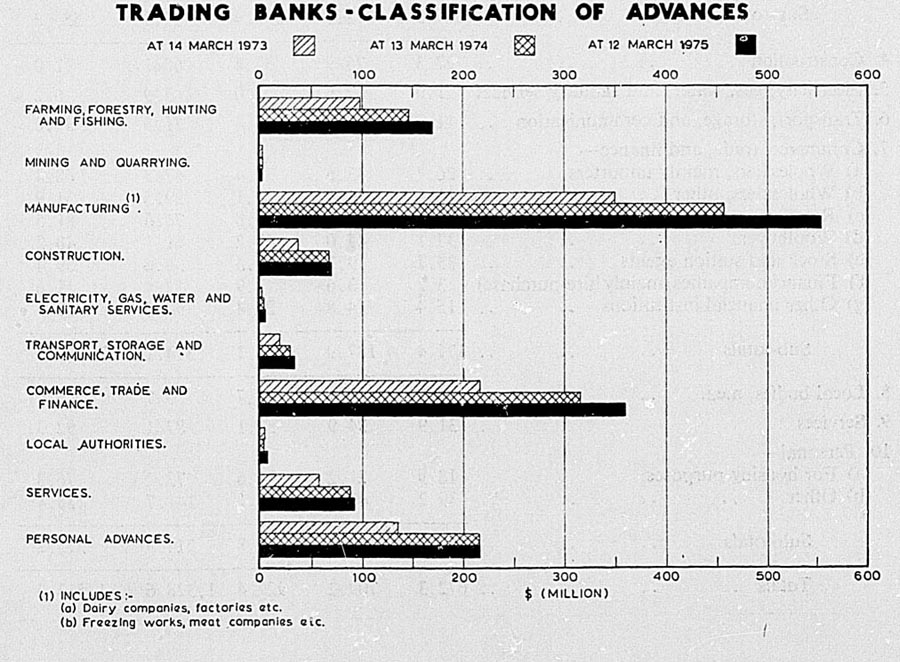
Advance Control Policy—Qualitative—An instrument of credit control used by the Reserve Bank from 1942 to 1962 was a selective control of bank advances to restrict the availability of credit to certain kinds of borrowers for certain purposes. On the whole the application of the rules prescribed by the Reserve Bank was left to the trading banks themselves, with only marginal cases referred to the Reserve Bank for decision. The main emphasis throughout was on avoidance of the use of bank credit for long-term capital purposes, hire-purchase finance, speculation, and the financing of excessive imports. As from 1 January 1963, the operation and administration of qualitative control was handed back to the trading banks. The Reserve Bank from time to time issues guidelines on priorities, these being determined in relation to Government economic and special objectives.
Quantitative—The advance control policy outlined above was supplemented in 1952 by a quantitative control of advances and reliance was placed mainly on the quantitative method of control through the reserve ratio procedure and discount rate policy. The minimum, balances the trading banks were required to maintain at the Reserve Bank were adjusted from time to time through the reserve ratio procedure so as to reduce the margin of free cash (balances in excess of the minimum required) held by them. From 1957 a flexible policy of control was followed. The aim generally was to allow for a small growth in advances. Quarterly targets for bank advances were used generally from 1962 on, but from 1966 targets were established on a two-month basis. Generally, some small growth was permitted in the targets for advances, particularly in the export field. Targets were set for farming and export advances and for “other advances” on a differential basis. If these targets were met, banks were allowed small margins of free cash, the reserve ratios being changed as often as necessary to achieve this. If the targets were exceeded the ratios were raised sufficiently to ensure that the banks were required to borrow from the Reserve Bank. As mentioned earlier, this method of penalising the banks was replaced in October 1969 by another whereby each bank was penalised according to the level of its non-priority sector advances in relation to the official ceilings for those advances. In July 1971 the banks were given a growth guideline for total bank lending for the 12 months to June 1972. This was an interim step in a move to abolish two-tier control of bank credit which had become very complex and arbitrary to administer. The bottom-tier ceilings remained in force meantime but no bank would be penalised for exceeding its ceiling if the all bank figure for total advances was within the guideline. In June 1973 a more flexible system was introduced whereby banks are required to hold in the form of reserve assets a specified percentage of its deposits, the ratio applying to time deposits being less than that applying to demand deposits. The ratios are varied on two grounds. Firstly, to take account of seasonal and random influences on bank liquidity and, secondly to put into effect a change in credit policy. A bank unable to meet its reserve requirement has to borrow the shortfall from the Reserve Bank, on conditions determined by the Reserve Bank.
Cheque Transactions—In the financial year 1973-74, the number of transactions debited to trading banks customers' accounts totalled 165 million, compared with 154 million in 1972-73, and 145 million in 1970-71. There are now over 1,000,000 cheque accounts in trading banks.
Unexercised Overdraft and Term Loan Authorities—The following are the average for calendar years and the amounts at the end of June of aggregate unexercised overdraft and term loan authorities of the trading banks.
| Year | Average for Calendar Year | At End of June |
|---|---|---|
| From July 1972 unexercised term loan authorities are also included. | ||
| $(million) | ||
| 1964 | 338.6 | 315.8 |
| 1965 | 339.8 | 325.6 |
| 1966 | 326.7 | 317.4 |
| 1967 | 305.9 | 272.3 |
| 1968 | 293.3 | 284.3 |
| 1969 | 281.0 | 261.9 |
| 1970 | 292.5 | 286.1 |
| 1971 | 307.9 | 287.0 |
| 1972 | 402.7* | 359.4 |
| 1973 | 569.4* | 554.6 |
| 1974 | 536.4* | 522.4 |
MONETARY POLICY—In October 1968 the Government reduced the percentage of deposits which the savings banks were required to invest in Government securities, with the object of assisting the building industry. For the trustee savings banks, of new investable funds in ordinary deposit accounts, 50 percent was to be invested in Government securities and 20 percent in new local authority securities or housing mortgages. For the private savings banks the percentages were 70 and 10respectively. At the same time the insurance companies agreed to lend greater proportions of their new investable funds to local authorities, the export sector, and housing, while still investing certain minimum proportions in Government securities.
In June 1969 capital issues control on finance companies was abolished and replaced by a Government stock ratio requirement under which finance companies have to hold a percentage of their borrowings in the form of Government securities. The ratio is normally 10 percent but is varied if necessary from time to time.
The interest rate ceiling of 4 1/4 percent that trading banks were permitted to pay on deposits was removed in June 1969 for deposits of over $25,000. Treasury bills were introduced in October 1969 and the trading banks were permitted to invest freely in Treasury bills and Government stock, subject to their maintaining statutory minimum cash balances at the Reserve Bank. During 1969 the proportion of investable funds which the Trustee Savings Banks were required to invest in Government securities was changed from 50 percent of ordinary accounts and 100 percent of investment accounts, to 60 percent for both types of deposit. The ratio was reduced from 60 percent to 57 percent in October 1971, releasing about $14 million for investment in the private sector, and further reduced to 54 percent in March 1972. At the same time the ratio on private savings banks' ordinary accounts was reduced from 70 percent to 63 percent. During 1974 the ratios have been varied on three occasions as a means of increasing the funds available for investment in housing mortgages. In March 1974 they were reduced by 1 percent on both trustee and private savings banks. In July they were reduced a further 2 percent, the trustee savings bank ratio becoming 51 percent on all accounts. The ratio on private savings banks ordinary accounts remained at 62 percent, while the ratio on their investment accounts was reduced from 99 percent to 91 percent in order to bring the ratios on ordinary and investments accounts closer together (this was equivalent to a 2 percent reduction on total deposits). These July changes released about $22 million for housing purposes. In December 1974 the ratios were again reduced, this time by 1 percent. The change for private savings banks was again concentrated on their investment accounts for which the ratio requirement was reduced by 5 percent.
The ratios applying at the end of 1974 were therefore:
Trustee savings banks—50 percent of all accounts;
Private savings banks—62 percent of ordinary accounts and 86 percent of investment accounts.
In June 1970 public sector security ratios were extended to building societies (5 percent of the deposit liabilities) and private superannuation funds (30 percent of total assets). A 5-year transitional period was allowed. Life insurance companies agreed to invest a further 5 percent of new investable funds in Government securities. In October the maximum interest rate of 4 1/2 percent payable on trading bank fixed deposits of $25,000 and under was increased to 4.8 percent for 2-year deposits. Fixed deposits of any amount for periods in excess of 2 years were not subject to control. To provide the banks with an investment opportunity and an incentive to compete for fixed deposits at the new rates, the banks were permitted to increase their bottom-tier lending by 80 percent of new deposits fixed for over 2 years (later amended to 3 years and over). The incentive was very effective and fixed deposits grew strongly. In March 1972 the Government introduced the Interest on Deposits Regulations as part of stabilisation policy. These were also applied to deposits taken by the trading banks, which were not already subject to control. In 1974, the Interest on Deposits Regulations were amended, the term at which the maximum rate of 7 1/4 percent applied being reduced from 7 years to 4 years and the interest rates on secured deposits of 5 years and over were freed. At the same time a margin of 1/2 percent was introduced between the maximum deposit rates trading banks could pay and the Interest on Deposits Regulations rates which applied to non-bank financial institutions. From 1973 investment orders for building societies and insurance companies require these institutions to hold specified assets.
Reserve Asset Ratio Policy—In June 1973 a new system of controlling trading bank operations was introduced. The reserve assets ratio scheme consists of a conventional liquidity requirement with the minimum ratios expressed as percentages of trading bank demand and time deposits. The percentage requirements, which may be varied from time to time, will be less for time deposits than for demand deposits in order to continue to give the banks an incentive to compete for term deposits. Reserve assets consist of trading banks' holdings of notes and Government securities and the time and demand balances of the trading banks at the Reserve Bank.
The new system was introduced at a time when trading bank lending was increasing at an extremely fast rate. The initial ratios were consequently set at a fairly high level. Directives on lending priorities were issued during 1973 and in December 1973 a policy increase of 2 percent in the reserve asset ratio took effect. Throughout 1974 the impact of the balance of payments liquidity drain on bank reserves has meant that the reserve asset ratios needed to be eased progressively in order to maintain a constant level of pressure on banks' lending and deposit policies.
There were some modifications to the detailed workings of the reserve asset ratio scheme in late 1974. A special deposits scheme, under which the Reserve Bank will lend to trading banks an amount up to a specified limit determined on a month-by-month basis by the Reserve Bank, was introduced in October 1974. The reserve asset ratios have been maintained at a constant level and the level of special deposits approved by the bank became the variable element. The modification did not imply any general relaxation in the conditions of monetary restraint. The scheme was flexible and modified according to the needs of the economy.
SAVINGS BANKS—Savings banks include the Post Office Savings Bank, the trustee savings banks, and the savings banks operated by the trading banks. In recent years there have been major changes in savings bank operations. Following an amendment to the Trustee Savings Bank Act passed in 1957, the five trustee savings banks that had survived from the middle of the last century were joined by eight new trustee savings banks between 1959 and 1964. In 1972 two of these banks merged and there are now 12 trustee savings banks. Another major change was the formation of private savings banks by the five trading banks, following the passing of the Private Savings Bank Act in 1964.
As from April 1973 trustee savings banks and the Post Office Savings Bank have been able to advance personal loans. In March 1973 the responsibilities for the administration of the trustee savings banks and the private savings banks was transferred from the Treasury to the Reserve Bank. Trustee savings banks and the Post Office Savings Bank have been allowed to offer cheque facilities since 1974.
The following table shows the total amounts of transactions in savings bank accounts, including accounts in the Post Office Savings Bank and trustee savings banks, National Savings accounts, and from 1 April 1964 School Savings Bank Accounts, but excluding National Savings bonds. From 1965 private savings banks are included.
| Year Ended 31 March | Total Amount of Deposits | Interest | Amount of Withdrawals* | Excess of Deposits Plus Interest Over Withdrawals | Total Amount to Credit of Depositors at End of March |
|---|---|---|---|---|---|
*From January 1958 includes interest paid out on Investment accounts. †Excludes $918,000 Cook Islands Savings Bank balances from 1 April 1967. | |||||
| $(million) | |||||
| 1964 | 672.4 | 29.6 | 616.2 | 85.8 | 1,050.4 |
| 1965 | 838.1 | 32.2 | 745.9 | 124.4 | 1,177.7 |
| 1966 | 994.7 | 35.8 | 906.9 | 123.6 | 1,301.3 |
| 1967 | 1,103.4 | 39.4 | 1,045.7 | 97.2 | 1,398.5 |
| 1968 | 1,138.1 | 43.7 | 1,096.5 | 85.4 | 1,483.0† |
| 1969 | 1,245.5 | 48.2 | 1,203.0 | 90.7 | 1,573.7 |
| 1970 | 1,468.4 | 50.9 | 1,408.6 | 110.8 | 1,684.5 |
| 1971 | 1,739.1 | 55.7 | 1,708.5 | 86.3 | 1,770.8 |
| 1972 | 1,923.1 | 54.7 | 1,917.9 | 59.9 | 1,830.7 |
| 1973 | 2,413.9 | 60.4 | 2,256.8 | 217.5 | 2,048.2 |
| 1974 | 3,157.4 | 65.8 | 2,969.3 | 253.9 | 2,302.1 |
In the following table the accounts in the three types of savings banks are classified by amount groups. It will be noted that over two-thirds of the accounts have balances of less than $200.
Balances in the Post Office Savings Bank and the trustee savings banks are as at 31 March 1974. In the private savings banks, balance dates range between 31 March and 31 October. National Savings and school savings accounts are included.
| SAVINGS BANK ACCOUNTS BY AMOUNT GROUPS | ||||||
|---|---|---|---|---|---|---|
| Balance | Post Office Savings Bank | Trustee Savings Banks | Private Savings Banks | |||
| Number of Accounts | Percentage of Total | Number of Accounts | Percentage of Total | Number of Accounts | Percentage of Total | |
| Under 2 | .. 609,311 | 20.7 | 251,946 | 15.3 | 143,451 | 15.1 |
| 2- 199 | .. 1,599,769 | 54.4 | 837,534 | 50.8 | 486,452 | 51.0 |
| 200- 999 | .. 461,927 | 15.7 | 349,394 | 21.2 | 200,559 | 21.0 |
| 1,000-1,999 | .. 131,472 | 4.5 | 109,842 | 6.7 | 64,311 | 6.7 |
| 2,000-3,999 | .. 86,027 | 2.9 | 66,494 | 4.0 | 39,865 | 4.2 |
| 4,000 and over | .. 52,700 | 1.8 | 33,205 | 2.0 | 19,019 | 2.0 |
| All accounts | 2,941,206 | 100.0 | 1,648,415 | 100.0 | 953,657 | 100.0 |
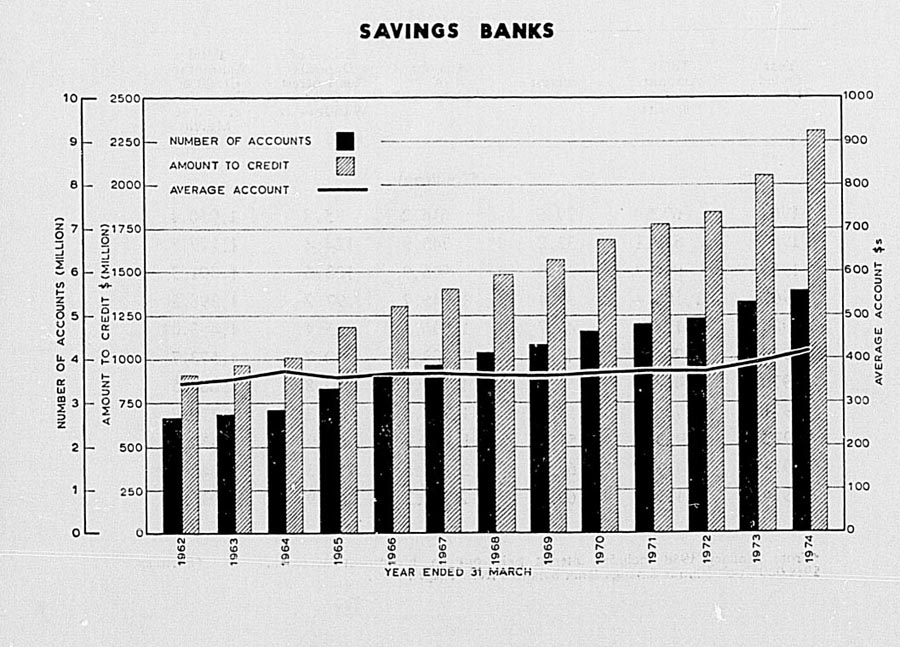
POST OFFICE SAVINGS BANK: Operation—The business of the Post Office Savings Bank started on 3 February 1867, when branches were established at Auckland, Wellington, Christchurch, Dunedin, and Hokitika. There are now 1,199 branches of the bank throughout New Zealand. Deposits may be made at any of these branches. A full demand withdrawal service is provided at 180 branches which have ledgers, and a limited service is provided at the remaining non-ledger offices.
The following table covers the activities of the Post Office Savings Bank.
| Year Ended 31 March | Number of Accounts at End of March | Total Amount of Deposits | Interest | Total Amount of Withdrawals* | Excess of Deposits, Plus Interest, Over Withdrawals | Total Amount to Credit of Depositors at End of March |
|---|---|---|---|---|---|---|
*Includes interest paid out on investment accounts. †Excludes Cook Islands balances of $918,232 omitted from ordinary accounts from 1 April 1967. | ||||||
| (000) | $(thousand) | |||||
| 1964 | 2,245 | 471,590 | 23,633 | 442,952 | 52,272 | 822,858 |
| 1965 | 2,563 | 506,665 | 25,056 | 501,717 | 30,004 | 855,838 |
| 1966 | 2,604 | 507,793 | 25,844 | 521,850 | 11,787 | 867,625 |
| 1967 | 2,640 | 525,634 | 26,025 | 542,009 | 9,650 | 877,275 |
| 1968 | 2,646 | 488,121 | 27,224 | 512,415 | 2,930 | 879,287† |
| 1969 | 2,682 | 487,663 | 27,980 | 507,852 | 7,791 | 887,078 |
| 1970 | 2,701 | 568,547 | 28,211 | 561,816 | 34,942 | 922,020 |
| 1971 | 2,737 | 620,875 | 29,590 | 626,411 | 24,054 | 946,074 |
| 1972 | 2,756 | 663,540 | 28,941 | 676,167 | 16,314 | 962,388 |
| 1973 | 2,830 | 782,364 | 30,478 | 736,507 | 76,335 | 1,038,723 |
| 1974 | 2,939 | 912,985 | 31,921 | 843,803 | 101,103 | 1,139,827 |
The securities standing in the name of the Postmaster-General on account of the Post Office Savings Bank on 31 March 1974 included Government stock to the value of $786.4 million and Housing Corporation stock to the value of $340.1 million.
A summary of specific accounts is set out in the following table as at 31 March 1974.
| Accounts | Number | Amount of Credit |
|---|---|---|
| * Schools | ||
| $(000) | ||
| Investment—1 year | 47,309 | 122,556 |
| 2 year | 51,006 | 103,306 |
| Thrift Club | 277,504 | 33,698 |
| National Savings | 71,320 | 26,095 |
| School Savings | 2,162* | 5,808 |
| Bonus Bonds | 1,582,898 | 79,599 |
| National Development Bonds | 65,004 | 25,326 |
PRIVATE SAVINGS BANKS—The Private Savings Bank Act 1964 came into force on 1 October 1964. Under this Act the five trading banks all formed private savings banks. These savings banks may transact business only in premises ordinarily occupied and used by the parent bank. In addition to ordinary deposits, these banks may accept investments similar to the trustee savings banks, by way of deposits in Home Lay-by, Investment accounts, Thrift Club, and Special Purpose accounts.
| Year Ended 31 March | Number of Accounts at End of Year | Total Amount of Deposits During Year | Total Amount of Withdrawals During Year | Excess of Deposits Over Withdrawals | Interest Credited | Total Amount to Credit of Depositors at End of Year |
|---|---|---|---|---|---|---|
| $(thousand) | ||||||
| 1969 | 577,956 | 268,349 | 228,501 | 39,848 | 8,351 | 285,420 |
| 1970 | 662,706 | 307,782 | 276,335 | 31,447 | 9,932 | 326,800 |
| 1971 | 738,247 | 391,333 | 377,754 | 13,579 | 12,088 | 352,467 |
| 1972 | 789,982 | 412,861 | 424,254 | -11,394 | 10,986 | 352,059 |
| 1973 | 885,313 | 575,032 | 540,219 | 34,813 | 12,627 | 399,500 |
| 1974 | 953,657 | 811,351 | 773,032 | 38,319 | 12,824 | 450,642 |
Private savings banks assets at 31 March 1974 included $104.8 million invested in mortgages and other loans, $320.7 million in New Zealand Government securities, out of the total assets figure of $471.7 million. Government securities must be held for amounts equal to 62 percent of deposits in ordinary accounts and 86 percent of deposits in investment accounts.
TRUSTEE SAVINGS BANKS—The trustee savings bank movement is generally regarded as having originated in Scotland in 1810. The movement spread quickly, and the first such New Zealand bank was established in Wellington in 1846, 20 years before the New Zealand Post Office Savings Bank commenced business. By 1870 nine trustee banks were in existence, but four, namely, Lyttelton, Wellington, Napier, and Nelson did not survive the turn of the century. The five remaining banks—Auckland (1847), New Plymouth (1850), Dunedin (1864), Southland (1864), and Hokitika (1866), grew in strength and their activities became an important factor in New Zealand's economic structure. Since 1957 a number of new trustee savings banks have been established, and the total is now 12.
The legislation dealing with trustee savings banks is contained chiefly in the Trustee Savings Banks Act 1948. Not less than 50 percent of investments must be held in the form of Government stock, and a proportion of depositors' balances must be kept as cash in hand or on current account, namely 5 percent up to $20 million, and 2 1/2 percent of the amount in excess of $20 million. Repayment of deposits is guaranteed by the State.
In addition to ordinary deposits, trustee savings banks may accept investments similarly to the Post Office Savings Bank, by way of deposits in Investment accounts. The maximum rates of interest payable on deposits are fixed by Order in Council. Maximum rates payable on these and other deposits are given later in this section.
The following tables relate only to trustee savings banks.
| Year Ended 31 March | Number of Accounts at End of Year | Total Amount of Deposits During Year | Total Amount of Withdrawals During Year | Excess of Deposits Over Withdrawals | Interest Credited | Total Amount to Credit of Depositors at End of Year |
|---|---|---|---|---|---|---|
| NOTE—This statement includes national savings accounts. | ||||||
| No. | $(thousand) | |||||
| 1964 | 588,124 | 200,769 | 173,244 | 27,524 | 5,966 | 227,500 |
| 1965 | 665,835 | 262,133 | 228,203 | 33,930 | 7,003 | 268,433 |
| 1966 | 775,339 | 325,352 | 294,697 | 30,655 | 8,386 | 307,475 |
| 1967 | 884,223 | 372,297 | 351,272 | 21,025 | 9,447 | 337,947 |
| 1968 | 996,271 | 405,109 | 387,226 | 17,883 | 10,690 | 366,520 |
| 1969 | 1,116,583 | 489,515 | 466,657 | 22,858 | 11,863 | 401,242 |
| 1970 | 1,238,042 | 592,099 | 570,450 | 21,649 | 12,794 | 435,685 |
| 1971 | 1,302,818 | 726,930 | 704,381 | 22,549 | 13,996 | 472,230 |
| 1972 | 1,431,898 | 846,700 | 817,511 | 29,189 | 14,817 | 516,236 |
| 1973 | 1,548,553 | 1,056,494 | 980,071 | 76,423 | 17,285 | 609,945 |
| 1974 | 1,657,285 | 1,433,061 | 1,352,434 | 80,627 | 21,059 | 711,631 |
The following table shows the results of the transactions inclusive of National Savings accounts, of each of the trustee savings banks during 12 months ended 31 March 1974.
| Bank | Number of Accounts at End of Year | Total Amount of Deposits During Year | Total Amount of Withdrawals During Year | Excess of Deposits Over Withdrawals | Interest Credited | Total Amount to Credit of Depositors at End of Year |
|---|---|---|---|---|---|---|
| NOTE—Hawke's Bay and Gisborne/Manawatu-Wairarapa merged as Eastern and Central Savings Bank as from November 1972. | ||||||
| No. | $(thousand) | |||||
| Auckland | 673,686 | 459,013 | 430,172 | 28,841 | 8,836 | 301,614 |
| Waikato | 134,083 | 195,237 | 189,524 | 5,713 | 1,755 | 50,976 |
| Bay of Plenty | 79,285 | 80,099 | 74,580 | 5,519 | 887 | 32,256 |
| Taranaki | 77,821 | 49,886 | 47,600 | 2,287 | 1,129 | 36,030 |
| Eastern and Central | 111,322 | 94,700 | 90,656 | 4,044 | 1,294 | 40,500 |
| Wanganui | 48,000 | 36,865 | 34,273 | 2,592 | 539 | 16,749 |
| Wellington District | 68,112 | 50,202 | 46,678 | 3,524 | 582 | 21,403 |
| Westland | 16,383 | 10,646 | 9,329 | 1,317 | 283 | 9,105 |
| Canterbury | 212,960 | 225,220 | 209,957 | 15,262 | 2,440 | 84,999 |
| South Canterbury | 25,662 | 22,753 | 20,937 | 1,816 | 346 | 12,211 |
| Otago | 127,559 | 74,898 | 69,379 | 5,519 | 1,537 | 53,512 |
| Southland | 82,412 | 133,542 | 129,349 | 4,194 | 1,432 | 52,277 |
| Totals | 1,657,285 | 1,433,061 | 1,352,434 | 80,627 | 21,059 | 711,631 |
Following is a summary of trustee savings banks' assets at 31 March 1974. The total assets include an amount of $1,367,000 securing National Savings deposits all of which is invested in New Zealand Government securities. Under the Trustee Savings Banks Act. however, National Savings deposits are not regarded as assets of the Trustee Savings Banks, and for this reason are shown separately.
| Bank | Mortgages | New Zealand Government Securities | Local Authority Debentures | Cash in Hand and on Call at Bank | Total Assets* (Includes Other Assets but not National Savings Deposits) | National Savings Deposits | Total Held Including National Savings Deposits |
|---|---|---|---|---|---|---|---|
*Total assets include $36 million in fixed deposits and money at call. NOTE—The Hawke's Bay and Gisborne and Manawatu-Wairarapa Savings Banks merged on 1 November 1972 under the name of Eastern and Central Savings Bank. | |||||||
| $(thousand) | |||||||
| Auckland | 105,726 | 159,967 | 28,547 | 543 | 324,533 | 819 | 325,352 |
| Waikato | 19,491 | 26,190 | 3,881 | 233 | 52,368 | - | 52,368 |
| Bay of Plenty | 12,953 | 16,293 | 1,391 | 302 | 33,311 | - | 33,311 |
| Taranaki | 16,065 | 18,674 | 133 | 309 | 38,381 | 137 | 38,518 |
| Eastern and Central | 15,987 | 20,459 | 1,680 | 120 | 41,858 | - | 41,858 |
| Wanganui | 6,400 | 8,381 | 769 | 200 | 17,283 | - | 17,283 |
| Wellington District | 8,950 | 10,085 | 1,044 | 153 | 21,909 | - | 21,909 |
| Westland | 3,797 | 4,571 | 222 | 269 | 9,641 | - | 9,641 |
| Canterbury | 32,446 | 44,873 | 4,571 | 1,821 | 88,679 | - | 88,679 |
| South Canterbury | 3,770 | 6,250 | 1,330 | 393 | 12,581 | - | 12,581 |
| Otago | 23,095 | 27,234 | 1,925 | 728 | 56,842 | 359 | 57,202 |
| Southland | 13,648 | 27,713 | 7,444 | 1,380 | 55,966 | 52 | 56,018 |
| Totals | 262,329 | 370,690 | 52,937 | 6,452 | 753,354 | 1,367 | 754,721 |
STOCK AND STATION AGENTS—Many of the existing stock and station agents first commenced business as general merchants or retailers in the early days of the country's settlement. However, during the greater part of their history, the main financial operations have been in the supply of merchandise, machinery and implements, and the provision of finance to the farming community. The companies have developed a specialised banking business involving the maintenance of current accounts for farmers, the acceptance of time deposits and the granting of secured and unsecured advances. It is a widespread practice for farmers to have current accounts with their stock and station agents to which the proceeds of the sale of livestock and produce are placed and farm and personal expenses charged. Any surplus may be left on current account or placed with the agents on fixed deposit. Stock and station agents have top-tier borrowing priority with the trading banks in order to obtain additional funds to lend for seasonal and farm development needs.
Financial data as at 30 June are given of deposits, advances, etc., for the stock and station agents operating in New Zealand. The statistics refer to the whole of the companies' trading operations including, in some cases, activities additional to normal stock and station transactions, such as retail trading in consumer goods.
The deposit figures include only moneys received for an agreed term and rate of interest and exclude amounts secured by mortgage or debenture, and amounts in credit on current account. Secured advances to customers include those made on mortgage or chattel security. The figure for merchandise and commodity stocks includes all types of trading stock which are regarded as current assets, but excludes livestock, goods held on consignment, or motor vehicles used by the company.
The following table summarises the financial statements of stock and station agents. Quarterly information, including details of interest rates, is published in the Monthly Abstract of Statistics.
| Item | At 30 June | |||||
|---|---|---|---|---|---|---|
| 1969 | 1970 | 1971 | 1972 | 1973 | 1974 | |
| $(thousand) | ||||||
| Deposits held | 31,204 | 35,514 | 36,826 | 37,768 | 57,965 | 43,927 |
| Customers' credit balances on current account | 37,363 | 39,970 | 35,478 | 38,517 | 75,118 | 57,773 |
| Advances to customers— | ||||||
| (a) On current account (unsecured) | 60,146 | 66,976 | 88,213 | 77,843 | 77,188 | 104,122 |
| (b) Other advances (secured) | 48,249 | 45,521 | 49,799 | 44,004 | 30,626 | 50,378 |
| Investments— | ||||||
| (a) Government securities | 5,307 | 5,552 | 4,501 | 5,495 | 1,915 | 1,804 |
| (b) Fixed deposits | 1,099 | 1,093 | 499 | 12,014 | 61,578 | 4,582 |
| (c) Other investments | 11,951 | 17,617 | 6,915 | 16,459 | 22,198 | 17,052 |
| Cash balances (in hand and at bank) | 7,162 | 4,863 | 2,981 | 6,621 | 9,858 | 2,741 |
| Bank overdrafts outstanding | 11,229 | 18,692 | 24,664 | 16,773 | 17,412 | 49,471 |
| Merchandise and commodity stocks | 36,577 | 39,036 | 42,949 | 44,825 | 44,824 | 62,187 |
| Interest rates paid on deposit— | Percentage of Deposits | |||||
| Under 5 percent | 29.9 | 26.6 | 17.8 | 36.0 | 52.0 | 26.7 |
| 5 percent and under 6 percent | 55.1 | 53.4 | 54.9 | 29.8 | 22.4 | 31.3 |
| 6 percent and under 7 percent | 13.8 | 18.8 | 25.4 | 30.9 | 21.8 | 32.7 |
| 7 percent and over | 1.2 | 1.2 | 1.9 | 3.3 | 3.8 | 9.3 |
The total of unsecured advances by agents of $104 million at 30 June 1974 was $53.4 million below that of trading bank advances to farmers of $157.5 million at 10 July 1974.
OVERDRAFT RATES—The maximum permitted average interest rate on bank overdrafts has been 6 percent since 31 August 1965.
DEPOSIT AND INTEREST RATES: Trading Banks—The following rates have been paid since 21 June 1966 by the associated banks on amounts lodged on fixed deposit: 30-180 days, 3 percent; six months and under 12 months, 3 1/2 percent; 12 months and under 24 months, 4 percent; 24 months and over, 4 1/2 percent. Variations in these rates and terms may be negotiated on deposits in excess of $20,000.
Investment Accounts—The rates of interest on Investment accounts in all savings banks that remain intact for the terms of investment are: 1-Year Investment accounts, 5 1/2 percent a year; 2-Year Investment accounts, 6 percent a year, but if withdrawals are made before maturity, the interest rate is adjusted for the broken period in respect of the amount withdrawn.
Post Office Savings Bank—The rate on ordinary, Thrift Club, Home ownership, and School Savings Bank deposits is 3 percent.
The rate of interest on National Savings accounts is 3 1/2 percent.
Trustee and Private Savings Banks—A rate of 3 percent is payable on ordinary deposits up to a limit of $12,000 for individuals and $40,000 for institutions.
Company, etc., Deposits—Interest on Deposits Regulations were introduced in March 1972 as part of a package of stabilisation measures. These laid down maximum interest rates which deposit-holding bodies may pay on money borrowed in New Zealand. The regulations apply to all borrowings of investment societies, which are defined as a deposit-holding body whose principal business is the investment of borrowed money, and to unsecured borrowings of trading companies.
Other Deposits and Interest Rates—References to rates of interest on mortgages will be found in Section 30A (Mortgages), while interest on Government debt is referred to in Section 26C (State Indebtedness), and Interest on local authority debt in Section 27 (Local Government Finance).
FINANCE COMPANIES—In 1971 there were 26 finance companies designated “large” by the Reserve Bank for statistical purposes, and their assets were 90 percent of the total assets of 405 surveyed finance companies. There has been rapid growth of these large companies in recent years as people have responded to higher interest rates on deposits and debentures and to the improved services offered. The large finance companies have developed simple and easily operated means of accepting money. Furthermore, many companies offer flexible deposit plans to depositors with large sums.
A much smaller proportion of the companies' lending is now channelled to individuals in the form of hire-purchase loans for consumer durables, either directly or through retailers, although hire-purchase advances for cars are still an important form of lending. Large short-term industrial loans have become more common than they were in the sixties, the finance company usually taking a floating second debenture charge against all the assets of the company. The bulk of industrial lending by finance companies, however, is still by way of hire purchase and is primarily used for commercial vehicles, machinery, and plant. In recent years several companies have begun to specialise in leasing. In addition they offer limited import and export services, and factor book debts. Another new development fostered by a few of the larger finance companies is the commercial bill market which began slowly in 1969 and started to expand more rapidly after the merchant banks entered the market in 1971-72. In September 1973 when statistics on the bill market were first collected, the total amount of commercial bills outstanding was $79 million. This figure more than doubled in the following 12 months and by the end of December 1974 had reached $187 million.
Statistics of deposits, debentures, and notes held by the large companies for which the Reserve Bank collects statistics are shown in the following table.
| Term | At 31 March | ||||
|---|---|---|---|---|---|
| 1970 | 1971 | 1972 | 1973 | 1974 | |
| $(m) | |||||
| At call | 12.7 | 17.0 | 25.3 | 23.0 | 31.8 |
| Under 3 months | 2.6 | 6.5 | 14.8 | 18.3 | 21.9 |
| 3-5 months | 4.3 | 11.8 | 12.3 | 24.7 | 22.7 |
| 6-11 months | 9.6 | 13.3 | 18.8 | 32.7 | 29.9 |
| 12-23 months | 13.9 | 20.6 | 28.4 | 32.0 | 34.2 |
| 2 years and over | 38.5 | 51.0 | 70.0 | 77.9 | 72.2 |
| Totals | 81.6 | 120.2 | 169.6 | 208.6 | 212.7 |
Gross loans and advances of these finance companies are shown in the following table.
| Type of loan | At 31 March | ||||
|---|---|---|---|---|---|
| 1970 | 1971 | 1972 | 1973 | 1974 | |
| Motor vehicles | |||||
| $(m) | |||||
| Commercial | 16.0 | 23.2 | 25.6 | 37.7 | 47.6 |
| Private | 27.8 | 38.3 | 48.6 | 67.5 | 87.5 |
| Television sets | 0.8 | 0.7 | 0.6 | 0.8 | 0.9 |
| Other consumer durables | 5.0 | 6.1 | 7.4 | 13.8 | 18.2 |
| Machinery and equipment— | |||||
| Industrial | 16.7 | 21.2 | 29.5 | 35.7 | 47.7 |
| Agricultural | 4.7 | 4.3 | 6.1 | 7.2 | 7.7 |
| Property loans | 9.0 | 11.3 | 20.4 | 27.9 | 44.0 |
| Other | 18.5 | 28.1 | 34.5 | 35.0 | 40.1 |
| Total | 98.5 | 133.2 | 172.7 | 225.7 | 293.8 |
A common feature of finance company lending is the regular repayment required on most loans and the short turnover period of assets, often averaging less than a year. This enables finance companies to switch their lending rapidly from one purpose to another. Interest rates range from about 12 percent to a more common 17 to 20 percent for most instalment loans. Despite the high costs, businesses have grown to appreciate the fast and efficient services offered by finance companies, which process loan applications quickly and accept greater risks than other lenders.
MERCHANT BANKS—The major expansion of merchant banking in New Zealand occurred in 1971, when the Government allowed overseas companies to participate in their establishment. At the present time there are eight companies which are considered to be active in merchant banking. They offer a wide range of financial services to industrial clients and also manage investment portfolios and deal in and accept commercial bills. The merchant banks engage in underwriting new share issues by companies, advise on and finance mergers and takeovers, and lend money for expansion to growing companies. The merchant banks played an important role in the expansion of the commercial bill market.
STRUCTURE OF FINANCIAL SYSTEM—The changing structure of the New Zealand financial system is shown by movements in the money supply and other major liquid assets of the public; a comparative table of selected liquid assets is now given. (Source: Reserve Bank Bulletin.)
| Deposits, etc. | At 31 March | Percentage at 31 March | |||
|---|---|---|---|---|---|
| 1973 | 1974 | 1955 | 1973 | 1974 | |
| (a) On an institutional basis | $(m) | $(m) | |||
| Trading banks | 1,521.9 | 1,904.0 | 39.0 | 36.4 | 39.4 |
| Private savings banks | 399.5 | 450.6 | - | 9.5 | 9.3 |
| Sub-totals | 1,921.4 | 2,354.6 | 39.0 | 45.9 | 48.7 |
| Post Office Savings Bank | 1,039.0 | 1,139.9 | 40.4 | 24.8 | 23.6 |
| Trustee savings banks | 609.9 | 711.6 | 7.4 | 14.6 | 14.7 |
| Stock and station agents | 121.3 | 105.6 | 2.9 | 2.9 | 2.2 |
| Finance companies | 227.6 | 233.1 | 0.9 | 5.4 | 4.8 |
| Official money market | 53.3 | 37.5 | - | 1.3 | 0.8 |
| Notes and coin | 212.4 | 251.6 | 9.4 | 5.1 | 5.2 |
| Total selected liquid | 4,184.9 | 4,833.9 | 100.0 | 100.0 | 100.0 |
| (b) On a functional basis | |||||
| Money supply | 1,134.8 | 1,298.1 | 41.6 | 27.1 | 26.9 |
| Other demand deposits | 1,607.3 | 1,808.8 | 40.2 | 38.4 | 37.4 |
| Sub-totals | 2,742.1 | 3,106.9 | 81.8 | 65.5 | 64.3 |
| Time and fixed deposits | 1,447.8 | 1,727.0 | 18.2 | 34.5 | 35.7 |
| Total selected liquid assets | 4,184.9 | 4,833.9 | 100.0 | 100.0 | 100.0 |
Loans and investments by sector of selected financial institutions at the end of March 1972 are shown in the following table. Significant omissions are general insurance companies, trustee companies and the Development Finance Corporation.
| Institutions | No. | Government | Local Authorities | Households | Agriculture | Other Business | Total | ||
|---|---|---|---|---|---|---|---|---|---|
| Housing | Other | Farmers | Business | ||||||
*Estimates. †Includes lending to State Advances Corporation. ‡Figures for building and friendly societies at end of calendar year. (Source: Monetary and Economic Council.) | |||||||||
| $(m) | |||||||||
| Reserve Bank | 1 | 13 | - | - | - | - | - | 174 | 187 |
| Trading banks | 5 | 145 | 5 | 21 | 48 | 100 | 203 | 344 | 866 |
| Private savings banks | 5 | 291 | 10 | 19* | - | 11* | - | 22* | 353 |
| Trustee savings banks | 13 | 285 | 42 | 134* | - | 13* | - | 17* | 491 |
| Post Office Savings Bank | 1 | 955 | - | - | - | - | - | - | 955 |
| Public Service Investment Society | 1 | 4 | 1 | 12* | 8* | - | - | 8* | 33 |
| Official money market | 5 | 33 | 9 | - | - | - | - | 3 | 45 |
| Finance companies | 26 | 18 | - | 10* | 63* | - | 7* | 128* | 226 |
| Stock and station agents | 22 | 5 | - | - | 12* | 126* | - | - | 143 |
| Building societies‡ | 63 | 16 | 10* | 228* | 15* | 16* | - | 17* | 302* |
| Life offices | 21 | 323 | 115 | 202 | 70 | 128 | - | 653 | 1,491 |
| Government Superannuation Fund | 1 | 195 | - | - | - | - | - | - | 195 |
| National Provident Fund | 1 | 58 | 197 | 1 | - | - | - | - | 256 |
| Earthquake and War Damage Fund | 1 | 130 | - | - | - | - | - | 130 | |
| Friendly societies‡ | 30 | 6* | 5* | 8* | 6* | - | - | 5* | 30 |
| State Advances Corporation | 1 | 45 | 12 | 581 | - | 334 | - | 32 | 1,004 |
| Total | 197 | 2,522* | 406* | 1,216* | 222* | 728* | 384* | 1,229* | 6,707* |
COINAGE AND CURRENCY: Decimal Currency—Under the Decimal Currency Act 1964 a system of decimal currency was introduced in New Zealand on 10 July 1967 with the dollar as the monetary unit. The dollar is equivalent to the previous 10s. The equivalent in decimal currency of the shilling is 10c. There are coins for $1 (not in general circulation), 50c, 20c, 10c, 5c, 2c, and 1c, and Reserve Bank notes for 1, 2, 5, 10, 20, and 100 dollars. The coins are cupro-nickel, except for the one and two cent pieces which are bronze. Notes and coins have distinctive New Zealand designs.
Issue of Notes and Coin—Since 1 August 1934 the Reserve Bank has had the sole right to issue bank notes in New Zealand. Coin is the responsibility of the Treasury but is distributed by the Reserve Bank. Notes and coin are issued solely in response to the demands of the public. In assessing likely requirements there are seasonal factors to be considered, as well as basic economic conditions, such as national income, the levels of salaries and wages, changes in price levels generally, and in the total volume of money. In addition, methods and frequency of payments affect the amount to be issued.
Legal Tender—Under the Reserve Bank of New Zealand Act 1964 notes issued by the Reserve Bank are constituted legal tender up to any amount. In terms of the Decimal Currency Act 1964, dollar coins are legal tender for any amount, coins of 5, 10, 20, and 50c for any amount not exceeding five dollars, and coins of 1 and 2c for any amount not exceeding 20c.
Restrictions on Export of Currency—Under the Exchange Control Regulations 1965 the taking or sending of money from New Zealand is forbidden except with the consent of the Reserve Bank. The Exchange Control Exemption Notice 1965, Amendment No. 8, permits travellers to take out up to $50 of New Zealand money in notes of $5 or $2 or $1 or in coin up to $4. The export of any other New Zealand notes or coin or the currency of any other country requires specific consent. (See also Exchange Control, paragraph (b), Export and Import of New Zealand notes.)
NEW ZEALAND AND STERLING EXCHANGE—Traditionally New Zealand currency was linked to sterling. Prior to December 1929 New Zealand currency was at virtual parity with U.K. currency, only slight deviations occurring from time to time, but then commenced to depreciate gradually, reaching, in January of 1931 a level of approximately £110 New Zealand = £100 London for telegraphic transfers. At that level it remained fairly stationary until January 1933, when as a result of Government intervening it was abruptly depreciated to a further degree. The relationship existing from 20 January 1933 until the establishment of the Reserve Bank of New Zealand on 1 August 1934, was £125 (selling) and £124 10s. (buying) New Zealand = £100 sterling for telegraphic transfers.
From 1 August 1934 Reserve Bank quotations for £100 sterling for immediate delivery in London were: buying rate, £124, selling rate, £125. It was intimated that the policy of the Bank would aim at retaining these rates unchanged for a long period unless there occurred marked changes in existing conditions. While prepared to fulfil its statutory obligations, the Reserve Bank did not desire to compete for exchange business, provided adequate facilities were available elsewhere.
Following the statement of the Reserve Bank's policy, the trading banks adopted as from 1 August 1934 a scale of rates representing a reduction of 10s. per £100 on the rates ruling from 20 January 1933 to 31 July 1934. The rates were slightly changed on 21 October 1938, and further changes were made in the selling rates as from 1 December 1943 and in the buying rate as from 6 November 1940. During the year 1945-46 the Reserve Bank agreed to certain alterations in the trading banks' on-demand and usance rates.
The position was materially altered as from 20 August 1948, following the announcement by the Government on the previous night of the appreciation of New Zealand currency to parity with sterling. The Reserve Bank quotations from 20 August 1948 for £100 sterling for immediate delivery in London were: buying rate, £100, selling rate, £101. Consequential adjustments to the scale of rates of trading banks in New Zealand were also made.
On 21 November 1967 the New Zealand dollar was devalued by 19.45 percent in terms of the United States dollar following the United Kingdom devaluation of sterling by 14.3 percent on 18 November 1967. The New Zealand dollar became equivalent to the Australian dollar and NZ$100 equivalent to £46.67 sterling. In terms of the United States dollar NZ$1 was equivalent to US$1.12.
The significance of the exchange rate in the case of New Zealand depends chiefly upon the country's position in regard to overseas trade and to overseas borrowings. The course of development of New Zealand has not reached a stage where the country is fully self-contained, and the external trade per head is greater than that of most countries of the world. In former years by far the bulk of New Zealand's external trade was with the United Kingdom and the London financial market played a predominant role in financing New Zealand's external trade and as a source for capital requirements. However, progressively, the base of New Zealand's external trade has been broadened which has resulted in New Zealand relying less on London to finance its trade and capital requirements. New Zealand is a member of the International Monetary Fund, and as such is required to maintain telegraphic transfer buying and selling rates for exchange transactions in its currency within certain limits either side of its established par value. The par value may be changed, i.e., the exchange rate altered, with the approval of the International Monetary Fund; this must be given if the proposed change does not exceed 10 percent, or if a “fundamental disequilibrium” exists in the country's balance of payments.
WORLD CURRENCY REALIGNMENT—In December 1971 there was a general realignment of the world's exchange rates. Subject to Congressional approval the official price for a troy ounce of fine gold was changed from US$35 to US$38. This represented a devaluation of the U.S. dollar by 7.89 percent. As part of the realignment the currencies of certain countries (notably Japan, Germany, and Netherlands) were revalued in terms of gold, while others, notably South Africa, decided to devalue their currencies.
New Zealand, like the United Kingdom, Australia, and a number of other countries, elected to leave its I.M.F. parity unchanged. As a result all these currencies appreciated 8.57 percent in terms of the U.S. dollar (after the change in gold price to US$38 = 1 ounce). At the same time New Zealand, like Australia, nominated the U.S. dollar as its intervention currency instead of sterling as had previously been the case. This enabled New Zealand to quote fixed exchange rates on U.S.A. and fluctuating rates on London. New Zealand decided to avail itself of the wider margins within which its exchange rates are permitted to move. This meant that New Zealand's public exchange rates for the U.S. dollar could fluctuate 2 1/4 percent either side of its par value (i.e., US$1.2160=NZ$1) while New Zealand's rates for other currencies were permitted to move up to 4 1/2 percent either side of the cross rates of the par values (or central rates, where these had been established pending approval by the U.S. Congress of the new gold price). In July 1973 the N.Z. dollar was floated.
EXCHANGE RATES—Events since December 1971 are now set out.
Revaluation of Australian Dollar—When the Australian dollar was revalued by approximately 7 percent in December 1972, the New Zealand Government decided that the effects of this action on New Zealand's trading relationship with Australia did not justify a change in our parity to gold. Consequently, instead of being at parity to the Australian dollar the New Zealand became worth about 7 percent less.
Devaluation of United States Dollar—Following the devaluation of the United States dollar by 10 percent on 13 February 1973 the T.T. buying rate for that currency was fixed at US$1.3337 = NZ$1, compared with the previous rate of US$1.2017 = NZ$1. At this stage the value of the New Zealand dollar relative to the rest of the world was at a level regarded as appropriate, in view of the strong balance of payments position at that time.
Fixed Link With United States Dollar Abandoned—After its devaluation in February 1973 the United States dollar continued to weaken in relation to other major currencies, with the result that by early July the New Zealand dollar had depreciated effectively by about 3 1/4 percent from the mid February position. This involuntary depreciation was not warranted on balance of payments grounds, nor appropriate because of imported inflation the country was already experiencing. Therefore on 9 July 1973 it was decided to sever the fixed link with the United States dollar and to restore the approximate average relationship with other currencies that existed at mid February. (This necessitated an appreciation of about 3 1/4 percent.) From that date adjustments were made daily to reflect changes in the relative values of the major currencies, so as to maintain the average relationship (on a trade weighted basis) that existed on 15 February 1973.
10 Percent Revaluation—September 1973—On 10 September 1973 the New Zealand dollar was revalued upwards by 10 percent and after that date the exchange rates were calculated by the same method as before, except that the base date to which daily adjustment was made was 10 September instead of 15 February.
Devaluation September 1974—The New Zealand dollar was devalued by approximately 6.2 percent (measured against the weighted basket of currencies of New Zealand's main trading partners) on 25 September 1974 and this date became the basis for daily adjustment to exchange rates thereafter.
The following table shows the outer limit exchange rates (in terms of NZ$1) for telegraphic transfers quoted by the New Zealand trading banks for various currencies as at 31 December 1974.
| New Zealand on | Selling | Buying |
|---|---|---|
| United States | 1.3105 | 1.3205 |
| Australia | 0.9893 | 0.9933 |
| United Kingdom | 0.5585 | 0.5616 |
| Japan | 390.8989 | 398.7959 |
Devaluation August 1975—The New Zealand dollar was devalued by 15.0 percent on 10 August 1975.
OVERSEAS RESERVES—The trading banks are required to supply returns to the Reserve Bank at monthly intervals showing among other things overseas assets held and liabilities incurred on amount of New Zealand business.
Statistics of New Zealand's official overseas reserves are shown in the following table. The figures for assets of the banking system and gold are as at the last Wednesday of the month; other figures are as at the end of the month. (Source: Reserve Bank of New Zealand.)
| As at | Assets of N.Z. Banking System* | Treasury-held Overseas Securities | Government-held Overseas Securities | Gold† | Reserve Position at I.M.F.‡ | Special Drawing Rights | Total |
|---|---|---|---|---|---|---|---|
*Comprises foreign exchange and overseas investment of the Reserve Bank and the trading banks in respect of New Zealand business. A small item “Liabilities in Other Currencies” has been deducted from the Reserve Bank's overseas assets while gross foreign liabilities on account of New Zealand business have been deducted from the trading banks' overseas foreign assets. †Gold holdings of the Reserve Bank at NZ$31.25 a fine ounce. ‡Equal to the gold subscription less any drawings of the gold tranche. New Zealand's initial allocation made on 1 January 1970. | |||||||
| NZ$(million) | |||||||
| End of June | |||||||
| 1964 | 202.3 | 65.0 | 17.7 | 0.5 | 22.5 | - | 307.9 |
| 1965 | 160.8 | 67.9 | 18.1 | 0.5 | 22.5 | - | 269.8 |
| 1966 | 123.5 | 61.7 | 12.7 | 0.1 | - | - | 198.1 |
| 1967 | 111.7 | 57.1 | 13.1 | 0.6 | - | - | 182.4 |
| 1968 | 209.3 | 76.8 | 14.5 | 1.2 | - | - | 301.9 |
| 1969 | 229.4 | 78.9 | 15.3 | 1.0 | - | - | 324.6 |
| 1970 | 216.8 | 87.9 | 16.1 | 0.8 | - | 23.5 | 345.0 |
| 1971 | 243.9 | 132.8 | 17.4 | 0.7 | 45.1 | 19.4 | 459.3 |
| 1972 | 425.2 | 216.2 | 18.9 | 0.7 | 45.1 | 51.6 | 757.7 |
| 1973 | 764.3 | 209.1 | 22.3 | 0.7 | 45.1 | 51.9 | 1,093,5 |
| 1974 | 289.4 | 185.0 | 21.7 | 0.7 | 45.1 | 51.7 | 593.6 |
| End of December | |||||||
| 1964 | 127.8 | 66.5 | 17.7 | 0.5 | 22.5 | - | 235.0 |
| 1965 | 102.6 | 54.8 | 12.3 | 0.3 | - | - | 170.0 |
| 1966 | 90.6 | 60.5 | 12.7 | 0.2 | - | - | 163.9 |
| 1967 | 145.1 | 75.0 | 13.9 | 0.5 | - | - | 234.5 |
| 1968 | 112.0 | 78.0 | 14.5 | 0.5 | - | - | 205.0 |
| 1969 | 155.1 | 86.4 | 15.3 | 0.8 | - | - | 257.6 |
| 1970 | 128.6 | 117.5 | 16.1 | 0.7 | 45.1 | 0.3 | 308.4 |
| 1971 | 244.1 | 146.5 | 17.4 | 0.7 | 45.1 | 24.8 | 478.6 |
| 1972 | 435.7 | 209.8 | 25.6 | 0.7 | 45.1 | 52.1 | 768.9 |
| 1973 | 502.1 | 202.5 | 22.5 | 0.7 | 45.1 | 51.9 | 824.8 |
| 1974 | 335.8 | 220.7 | 24.2 | 0.7 | - | 0.5 | 581.8 |
A deficit on current account of $815.7 million was recorded for the year ended December 1974. This deterioration resulted from a sharp increase in import payments and to a lesser extent by a drop in export receipts and a larger deficit on invisible transactions compared with the previous year.
Export receipts, $1,746.7 million, declined by 5.3 percent during the year. Receipts for the main commodities, wool and meat, dropped noticeably as a result of falling overseas prices.
Total import payments rose by 53.3 percent or $791.2 million during 1974 to total $2,276.9 million. The high level of import payments was primarily responsible for the substantial reversal in the trade balance from a surplus of $358.6 million in 1973 to a deficit of $530.1 million in 1974.
The deficit on “invisible” transactions during 1974 was $285.6 million compared with lower deficits of $197.2 million and $206.6 million recorded 1972 and 1973 respectively. The higher deficit in 1974 was primarily the result of a strong growth in payments which exceeded the growth recorded for “invisible” receipts.
The capital account recorded a net inflow of $425.1 million for 1974. Both private and Government capital transactions were at high levels, recording net inflows of $141.1 million and $284.0 million respectively in 1974.
As a result of the deficit on current account, the capital account surplus (including the drawing from the International Monetary Fund's oil facility in November) and accumulated valuation adjustments, the official overseas reserves declined by $243 million to total $581.8 million at the end of December 1974. The most significant adjustment arose from the devaluation of the New Zealand dollar in September 1974 which resulted in an upward adjustment of approximately $34 million to the New Zealand currency book values of overseas reserves.
The following diagram shows the overseas reserves.
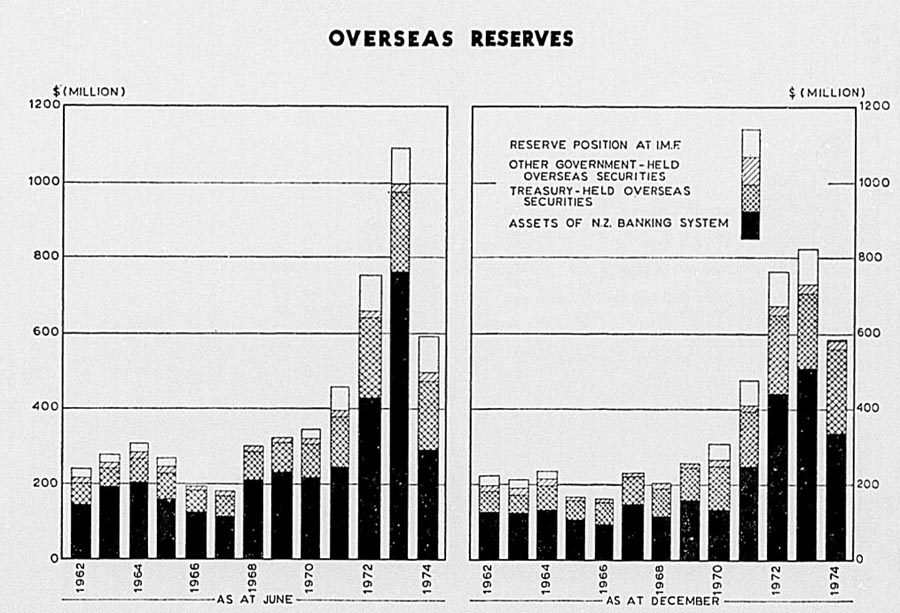
OVERSEAS EXCHANGE TRANSACTIONS—Statistics of overseas exchange transactions include transactions both through the banking system and through the Government's overseas accounts. A full classification of overseas exchange transactions for the two latest calendar years is now given.
| OVERSEAS EXCHANGE TRANSACTIONS | ||||||
|---|---|---|---|---|---|---|
| Item | 1973 | 1974 | ||||
| U.K. | Other Countries | Total | U.K. | Other Countries | Total | |
| NOTE—Minus sign (-) denotes a deficit. | ||||||
| NZ$(million) | ||||||
| Exports— | Receipts | |||||
| Butter | 93.9 | 17.0 | 110.9 | 85.2 | 24.4 | 109.6 |
| Cheese | 38.3 | 21.0 | 59.2 | 11.4 | 33.0 | 44.4 |
| Meat | 218.6 | 405.3 | 624.0 | 166.7 | 366.2 | 532.9 |
| Wool | 76.7 | 374.7 | 451.4 | 60.3 | 276.9 | 337.1 |
| Other | 72.4 | 526.4 | 598.7 | 50.7 | 672.1 | 722.7 |
| Total, export receipts | 499.9 | 1,344.4 | 1,844.2 | 374.3 | 1,372.4 | 1,746.7 |
| Other Current— | ||||||
| Cook Islands exports | - | - | - | - | - | - |
| Transport | 51.9 | 26.9 | 78.8 | 70.5 | 39.2 | 109.7 |
| Insurance | 2.8 | 8.8 | 11.6 | 5.0 | 9.0 | 14.2 |
| Travel (excluding fares) | 11.5 | 61.0 | 72.5 | 11.7 | 82.8 | 94.5 |
| International investment income— | ||||||
| Interest and dividends | 38.7 | 12.6 | 51.3 | 36.5 | 17.6 | 54.0 |
| Other investment income | 0.6 | 4.0 | 4.6 | 0.5 | 3.8 | 4.3 |
| New Zealand Government receipts and expenditure by other Governments in New Zealand | 7.6 | 16.0 | 23.6 | 7.1 | 15.4 | 22.6 |
| Miscellaneous— | ||||||
| Commissions, royalties | 3.8 | 8.1 | 11.9 | 4.6 | 12.5 | 17.1 |
| Expenses of business firms | 2.1 | 7.9 | 10.0 | 1.6 | 8.7 | 10.3 |
| Personal receipts, legacies and immigrants' transfers | 67.1 | 52.9 | 120.0 | 62.6 | 56.4 | 119.1 |
| Other current transactions | 3.4 | 9.3 | 12.7 | 3.7 | 13.4 | 17.2 |
| Totals, current | 689.5 | 1,551.8 | 2,241.3 | 203.9 | 259.0 | 462.9 |
| Capital Transfers— | ||||||
| Government borrowing | - | 3.7 | 3.7 | - | 232.7 | 232.7 |
| Other official receipts | - | 0.6 | 0.6 | - | 106.1 | 106.1 |
| Private | 65.7 | 114.7 | 180.5 | 66.2 | 204.2 | 270.4 |
| Totals capital | 65.7 | 119.0 | 184.7 | 66.2 | 542.9 | 609.2 |
| I.M.F.— | ||||||
| Drawings | - | - | - | - | 78.5 | 78.5 |
| Allocations of SDRs | - | - | - | - | - | - |
| Total Receipts | 755.3 | 1,670.8 | 2,426.0 | 644.5 | 2,252.8 | 2,897.3 |
| Imports— | Payments | |||||
| Private | 419.4 | 1,003.4 | 1,422.8 | 571.6 | 1,607.8 | 2,179.4 |
| Government | 34.0 | 28.9 | 62.9 | 41.4 | 56.1 | 97.5 |
| Totals, import payments | 453.4 | 1,032.2 | 1,485.7 | 613.0 | 1,663.8 | 2,276.9 |
| Other current— | ||||||
| Cook Islands imports | - | 0.3 | 0.3 | - | 0.4 | 0.4 |
| Transport | 93.2 | 51.3 | 144.5 | 108.0 | 67.6 | 175.6 |
| Insurance— | ||||||
| Premiums | 3.0 | 0.8 | 3.8 | 4.1 | 0.9 | 5.1 |
| Claims | 0.2 | 0.6 | 0.8 | 0.3 | 0.7 | 1.1 |
| Other transfers | 6.5 | 5.9 | 12.4 | 5.3 | 6.8 | 12.1 |
| Travel (excluding fares) | 40.3 | 92.8 | 133.1 | 44.6 | 134.6 | 179.2 |
| International investment income— | ||||||
| Private | 20.4 | 36.0 | 56.3 | 15.5 | 59.5 | 75.0 |
| Government interest | 26.9 | 7.8 | 34.7 | 27.6 | 8.8 | 36.3 |
| Local authority interest | - | 0.1 | 0.1 | - | 0.1 | 0.1 |
| Government expenditure overseas | 8.8 | 49.1 | 58.0 | 6.0 | 66.4 | 72.3 |
| Miscellaneous— | ||||||
| Commissions, royalties, and rebates | 5.4 | 19.1 | 24.4 | 5.4 | 23.5 | 28.9 |
| Expenses of business firms | 26.3 | 25.3 | 51.6 | 19.3 | 34.7 | 53.9 |
| Film hire and entertainment | 0.5 | 3.4 | 3.9 | 0.7 | 5.6 | 6.3 |
| Religious and charitable | 1.3 | 8.7 | 10.0 | 1.2 | 9.4 | 10.6 |
| Personal remittances, legacies, and emigrants' transfers | 16.1 | 30.1 | 46.2 | 21.8 | 40.1 | 62.0 |
| Transfers by temporary residents | 4.0 | 7.1 | 11.1 | 4.7 | 9.9 | 14.6 |
| Other current transactions | 2.2 | 10.2 | 12.4 | 1.8 | 13.2 | 15.1 |
| Totals, current | 708.6 | 2,380.7 | 2,089.3 | 266.4 | 482.3 | 748.5 |
| Capital Transfers— | ||||||
| Government debt repayments | 21.0 | 20.6 | 41.5 | 27.7 | 21.4 | 49.7 |
| Other official payments | - | 3.2 | 3.2 | - | 5.6 | 5.6 |
| Private | 93.6 | 66.3 | 159.9 | 36.2 | 92.3 | 128.5 |
| Local authorities debt repayment | - | 0.9 | 0.9 | - | 0.7 | 0.7 |
| Totals, capital | 114.6 | 90.9 | 205.5 | 64.0 | 120.1 | 184.0 |
| I.M.F. Repurchases | - | - | - | - | - | - |
| Total Payments | 823.2 | 1,471.6 | 2,294.8 | 943.4 | 2,266.0 | 3,209.0 |
| Surplus of receipts over payments | -67.9 | +199.1 | +131.2 | -298.9 | -13.2 | -312.0 |
The next table gives overseas exchange transactions in summary form for a number of June years, which fit more closely to the farm-production export season than do calendar years. Information for calendar years over a similar period is in the Monthly Abstract of Statistics.
| Item | Year Ended 30 June | |||||
|---|---|---|---|---|---|---|
| 1969 | 1970 | 1971 | 1972 | 1973 | 1974 | |
| NZ$(million) | ||||||
| Receipts | ||||||
| Exports— | ||||||
| Butter | 109.4 | 118.5 | 124.5 | 145.3 | 106.3 | 108.5 |
| Cheese | 41.3 | 50.9 | 51.8 | 71.7 | 64.3 | 58.4 |
| Meat | 315.8 | 413.9 | 414.8 | 447.7 | 585.7 | 565.4 |
| Wool | 226.1 | 228.5 | 206.1 | 252.5 | 436.3 | 371.4 |
| Other | 308.1 | 352.6 | 396.6 | 469.9 | 580.5 | 644.1 |
| Total exports | 1,000.8 | 1,164.5 | 1,193.8 | 1,387.1 | 1,773.1 | 1,747.9 |
| Other current receipts | 144.2 | 155.8 | 209.6 | 266.0 | 349.9 | 423.7 |
| Total current receipts | 1,145.0 | 1,320.3 | 1,403.4 | 1,653.1 | 2,123.0 | 2,171.6 |
| Capital receipts— | ||||||
| Government borrowing | 48.8 | 6.2 | 69.4 | 112.1 | 4.2 | 0.5 |
| Other official receipts | - | - | - | - | - | 14.0 |
| Private | 46.3 | 63.0 | 117.5 | 175.7 | 187.0 | 189.4 |
| Total capital receipts | 95.1 | 69.2 | 186.9 | 287.9 | 191.2 | 204.0 |
| I.M.F.— | ||||||
| Drawings | - | - | - | - | - | - |
| Allocation of SDRs | - | 23.6 | 19.3 | 19.1 | - | - |
| Total Receipts | 1,240.1 | 1,413.0 | 1,609.5 | 1,960.1 | 2,314.2 | 2,375.6 |
| Payments | ||||||
| Imports— | ||||||
| Government | 48.4 | 45.2 | 63.3 | 66.1 | 65.9 | 68.7 |
| Private | 723.1 | 843.3 | 962.2 | 1,006.5 | 1,182.8 | 1,780.4 |
| Total imports | 771.6 | 888.5 | 1,025.5 | 1,072.6 | 1,248.7 | 1,849.0 |
| Other current payments— | ||||||
| Government | 64.3 | 70.9 | 70.4 | 77.5 | 98.2 | 95.5 |
| Private | 259.1 | 299.3 | 321.7 | 372.8 | 451.1 | 561.0 |
| Total current payments | 1,095.0 | 1,258.8 | 1,417.6 | 1,522.8 | 1,798.0 | 2,505.5 |
| Capital payments— | ||||||
| Government debt repayments | 46.2 | 18.7 | 21.7 | 49.9 | 92.9 | 67.7 |
| Other official repayments | 32.2 | 7.6 | 5.3 | 2.8 | - | 7.0 |
| Private | 40.4 | 55.9 | 55.7 | 94.5 | 91.6 | 190.4 |
| Total capital payments | 118.7 | 82.2 | 82.7 | 147.2 | 184.5 | 265.0 |
| I.M.F. repurchases | 26.1 | 18.4 | - | - | - | - |
| Total payments | 1,239.9 | 1,359.4 | 1,500.3 | 1,670.1 | 1,982.5 | 2,770.5 |
| Balance on trade transactions | +229.2 | +276.0 | +168.3 | +314.5 | +524.4 | -101.2 |
| Balance on current account “Invisible” transactions | -179.3 | -214.4 | -182.5 | -184.2 | -199.4 | -232.8 |
| Balance on current account | +49.9 | +61.5 | -14.3 | +130.3 | +325.0 | -333.9 |
| Balance on capital account | -23.7 | -13.0 | +104.2 | +140.7 | + 6.8 | - 61.6 |
| I.M.F. transactions (incl. SDRs) | -26.1 | +5.1 | + 19.3 | + 19.1 | - | - |
| Change in official overseas reserves | +22.7 | +20.4 | +114.3 | +298.4 | +335.8 | -499.9 |
Overseas Travel Allowances—Since 1938, there have been restrictions on the amount of overseas travel funds made available for non-business purposes. From June 1973 trading banks have been able to sell overseas exchange to travellers up to $1,000 a month with a maximum of $4,000 a year. Requests for higher amounts need to be referred to the Reserve Bank, which is prepared to approve all reasonable requests.
Exchange Control—Transactions affecting overseas exchange are governed by the Exchange Control Regulations 1965, made under the Reserve Bank of New Zealand Act 1964: The exemption in respect of dealings in sterling area currencies and securities in the hands of New Zealand residents was continued by the Exchange Control Exemption Notice 1965.
Certain new measures in exchange control and related fields were introduced by the Minister of Finance in the Budget of 16 June 1966, and are set out in paragraphs (a) to (d).
(a) Overseas Securities and Currencies: The facility previously available to New Zealand residents to sell overseas sterling area securities for New Zealand currency or other assets in New Zealand was withdrawn. These securities could then be sold only for other sterling area securities or for sterling area currencies. Therefore, if a New Zealand resident sought cash in New Zealand for his sterling area securities the only avenue available at law was to sell overseas and transfer the proceeds to New Zealand through the banking system.
This measure, in effect, closed the market in sterling area securities in exchange for New Zealand currency. A limited market has since been re-opened (see (f) below).
In June 1972 the United Kingdom made changes in its exchange control system. As a result the sterling area and the non-sterling area were redefined. For New Zealand exchange control purposes the sterling area incorporates the United Kingdom and the Republic of Ireland. The non-sterling area covers all other countries outside New Zealand except Rhodesia. Exchange control transactions with Rhodesia are strictly limited because of the United Nations sanctions against that country Therefore, all currencies and securities domiciled outside New Zealand (except Rhodesia) may now be dealt with freely, i.e., in the same manner as sterling area currencies and securities were previously. (See also paragraph (f)).
(b) Export and Import of New Zealand Notes: A limit was set in June 1966 on the export of notes at $10 for all travellers, regardless of destination.
The importation of New Zealand money (including postal notes, money orders, cheques, and promissory notes, but excluding travellers' cheques) was also prohibited, except that travellers to New Zealand could bring in with them up to $10 in New Zealand notes.
From June 1971 travellers from New Zealand have been able to take out up to $50 (of which not more than $4 may be in coin and the denominations of the notes may not exceed $5). For travellers to New Zealand there is now no restriction on bringing in notes of $1 or $2 or $5 or coin of any denomination.
(c) Supervision of Non-Residents' Accounts in New Zealand: The Reserve Bank was given power to exercise supervision over specific accounts in New Zealand of non-residents with banks or elsewhere.
The following accounts were initially declared to be controlled accounts:
Those of non-resident banks;
Those of non-resident travel agents;
A group of seven individual accounts connected with international currency dealers.
A subsequent notice to banks had the effect of bringing under control any accounts for the credit to which New Zealand money was received from overseas without the consent of the Reserve Bank. No change of policy was involved, this being a technical measure to ensure that transfers of funds outside the banking system were not facilitated by the operation of New Zealand accounts.
(d) London-domiciled New Zealand Government Stock: In 1920 provision was made for New Zealand residents to transfer holdings of London-domiciled New Zealand stock to the New Zealand register, a facility which provided a means of transferring funds to New Zealand outside the banking system. The volume of such transactions in recent years became excessive, and the following conditions were therefore applied to transfers to the New Zealand register on 16 June 1966:
Stock must have been registered in the applicant's name for at least six months;
After stock has been transferred to the New Zealand register it may not be sold for six months.
Since 5 September 1969 the transfer to the New Zealand register has been limited to stock held on or prior to that date. Stock purchased subsequently may not be transferred to the New Zealand register.
(e) Overseas Investment in New Zealand: In 1973 the Overseas Investment Act was passed to make better provision for the supervision and control of overseas investment in New Zealand. The Overseas Investment Commission established under that Act administers the Overseas Investment Regulations 1974 which came into force on 28 May 1974 to give administrative effect to the Act. The secretariat for the Overseas Investment Commission is at the Reserve Bank.
The new legislation consolidated and repeated the provisions of the Capital Issues (Overseas) Regulations 1965 and the Overseas Takeovers Regulations 1964 which formerly governed overseas investment in New Zealand. In addition, the opportunity was taken to close some avenues through which the existing takeover regulation could in some circumstances be evaded.
The Overseas Investment Regulations cover such transactions as borrowing overseas by any New Zealand incorporated company; borrowing in New Zealand or overseas, or the issue of any shares by any New Zealand incorporated company which is 25 percent or more overseas owned; borrowing in New Zealand by a New Zealand branch of an overseas company; and the issue of shares to overseas residents by a New Zealand incorporated company.
Consent under these regulations is also required to the acquisition by any overseas resident individual or organisation of
25 percent or more of the shares of a New Zealand incorporated company where such shares carry voting rights at any general meeting of the company,
all, or substantially all, of the property in New Zealand used in carrying on a business in New Zealand where the value of the property is more than NZ$100,000.
Any New Zealand incorporated company also requires the prior consent of the Reserve Bank before it borrows overseas or issues shares to overseas residents.
(f) Market in Overseas Securities: Trading in overseas sterling area securities in exchange for New Zealand currency is confined to New Zealand residents, and to securities which were registered in the names of New Zealand residents on 16 June 1966. All dealings must be effected through a member of a New Zealand stock exchange, and both seller and purchaser must supply details of the transaction to an approved depository, with whom the scrip must be lodged. Securities so purchased may be sold for New Zealand currency under the same conditions, or sold for overseas currency through a member of a New Zealand stock exchange, provided the proceeds are either remitted to New Zealand or re-invested in similar securities within three months. The new scrip must also be lodged with an approved depository. The approved depositories are the Reserve Bank in Wellington and its branches in Auckland and Christchurch and the Bank of New South Wales (in respect of its own shares only). Up to 31 December 1974 some 100,000 transactions involving approximately 49,000,000 shares had taken place under these arrangements.
Administrative details on import and export control and exchange allocation are set out in Section 22A.
ROYAL COMMISSION ON MONETARY, BANKING, AND CREDIT SYSTEMS—The report of the Royal Commission, which was released in April 1956 (as parliamentary paper B. 3, 1956) gives a general background on the monetary, banking, and credit systems of New Zealand. The Royal Commission examined and reported on these systems and made recommendations within its order of reference which had the stated objectives of fostering a greater degree of stability in prices, maintaining full employment, ensuring the healthy development of natural resources, and promoting generally the economic, financial, and social welfare of the people.
Section 4 of the report outlines the history of monetary, banking, and credit systems from 1934 to 1955. As recommended by the Royal Commission, New Zealand has joined the International Monetary Fund, a Monetary and Economic Council has been established, and the Reserve Bank of New Zealand Act has been amended to give the Government full and final responsibility for decisions on monetary policy. (A summary of the report was given as Appendix (d) of the 1956 issue of the Yearbook.)
INTERNATIONAL MONETARY FUND, INTERNATIONAL BANK FOR RECONSTRUCTION AND DEVELOPMENT, AND INTERNATIONAL FINANCE CORPORATION—New Zealand became a member of these three organisations on 31 August 1961 under the International Finance Agreements Act 1961. The organisations are specialised agencies of the United Nations, and their objectives and the implications of New Zealand membership are set out in parliamentary paper A. 12, 1961. One of the purposes of the International Monetary Fund is to give confidence to members by making the fund's resources available to them under adequate safeguards, thus providing them with opportunity to correct maladjustments in their balance of payments without resorting to measures destructive of national or international prosperity. By paying in some gold and the balance of its fund quota in its own currency a member is able to draw against its gold for a nominal cost. New Zealand's fund quota was increased in March 1966 and again in December 1970 with the result that drawing rights have risen to a maximum of $225.5 million. In addition, drawings may be made under the fund's compensatory finance arrangements, and under the Oil Facility.
The International Bank for Reconstruction and Development (World Bank) is designed to promote the international flow of capital for productive purposes and to assist in financing the development of the resources of its member countries.
New Zealand paid $24.4 million in gold and $1 million in New Zealand currency to join the three agencies, and in addition $77.2 million of non-negotiable non-interest bearing bonds were lodged with the Reserve Bank of New Zealand.
The World Bank made a loan of $5.6 million to New Zealand in November 1963. The loan is for a term of 25 years and bears interest at 5 1/2 percent, including the 1 percent commission which is allocated to the Bank's special reserve. It has assisted in financing improvements at the ports of Auckland, Lyttelton, Napier, Timaru, and Whangarei, and applied to the overseas-currency content of capital works. A loan of $23.4 million was received for the Cook Strait electricity cable project. These loan agreements are set out in parliamentary papers A. 21 and A. 23, 1964.
In December 1965 the World Bank agreed to lend $30.2 million for railways modernisation and $14.7 million for power development. The railways loan is being used to buy additional diesel locomotives and rolling stock, while part was used to pay for the second rail-road ferry Aranui. The electricity development loan was used to meet the overseas costs in the building of the thermal power station at Marsden Point, Whangarei. The term of the loans is 15 years with interest at 6 1/4 percent.
New Zealand joined the International Development Association, a subsidiary of the World Bank, effective from 17 January 1975. In this connection New Zealand has undertaken to subscribe to the fourth replenishment of the association's resources. The first payment of NZ$280,300 was made on 3 January 1975 and there are further payments due in 1975.
New Zealand's transactions with the International Monetary Fund are shown in the attached table. Special drawing rights are intended to supplement existing reserve assets and facilitate the expansion of world trade.
| Date | Drawings | Repurchases | Drawings Outstanding | Special Drawing Rights | Total Holdings | |
|---|---|---|---|---|---|---|
| Acquisitions* | Utilisation | |||||
| *Includes both allocations to New Zealand from the IMF and SDRs received by way of transactions with other countries. | ||||||
| NZ$(million) | ||||||
| 1965—Nov 10 | 55.4 | - | 55.4 | ... | ... | ... |
| 1966—Mar 23 | 7.1 | - | 62.5 | ... | ... | ... |
| 1967—May 10 | 26.1 | - | 88.6 | ... | ... | ... |
| Oct 31 | 40.2 | - | 128.8 | ... | ... | ... |
| Dec 5 | 13.4 | - | 142.1 | ... | ... | ... |
| 1968—Mar 26 | - | 31.3 | 110.9 | ... | ... | ... |
| May 8 | - | 31.3 | 79.6 | ... | ... | ... |
| Nov 12 | - | 0.1 | 79.6 | ... | ... | ... |
| Dec 13 | - | 26.1 | 53.5 | ... | ... | ... |
| 1969—Aug 20 | - | 18.4 | 35.0 | ... | ... | ... |
| 1970—Jan 1 | - | - | 35.0 | 23.6 | - | 23.5 |
| Sep 16 | - | 35.0 | - | - | 23.2 | 0.3 |
| 1971—Jan 1 | - | - | - | 19.3 | - | 19.4 |
| Oct 19 | - | - | - | 5.4 | - | 24.8 |
| 1972—Jan 1 | - | - | - | 19.1 | - | 43.9 |
| Jan 18 | - | - | - | 3.6 | - | 47.5 |
| Jun 16 | - | - | - | 4.5 | - | 51.6 |
| Sep 12 | - | - | - | 0.4 | - | 52.1 |
| 1974—Jun 15 | - | - | - | - | 50.9 | 0.8 |
| Aug 30 | 45.1 | - | 45.1 | - | - | 0.8 |
| Nov 19 | 78.5 | - | 123.6 | - | - | 0.9 |
ASIAN DEVELOPMENT BANK—New Zealand is participating in the Asian Development Bank whose main objective is to accelerate the economic development of the ESCAP region. New Zealand's initial contribution to the capital stock of the bank is US$22.56* million, half of which is callable. Of the paid-in portion, 50 percent is paid in convertible currency, a total of US$5.64 million, while the balance is paid in New Zealand currency. In 1971 the capital subscription was increased 150 percent, increasing New Zealand's contribution from US$22.56 million to US$56.4 million. Of the increase 20 percent is paid in and 80 percent is callable, with a total of US$3.24 million to be paid in convertible currency.
New Zealand also makes contributions to three special funds—the Technical Assistance Special Fund to which New Zealand contributed NZ$375,000, the Multi-purpose Special Fund to which New Zealand contributed NZ$822,370, and the Asian Development Fund to which New Zealand has contributed NZ$1,352,925 to date.
Further payments fall due to the Asian Development Fund after this financial year. New Zealand's contributions to each of these funds, as with the New Zealand currency portion of the equity capital of the bank, have been tied to the procurement of goods and services from New Zealand.
MONETARY AND ECONOMIC COUNCIL—In 1961, in line with a recommendation of the Royal Commission on Monetary, Banking, and Credit Systems, there was established a Monetary and Economic Council whose principal functions are to report from time to time on the extent to which stability in the prices of goods and services, economic growth, full employment, and higher standards of living are being achieved, and to make recommendations as to measures that should be taken to promote such developments. Among other matters, the council is required to consider the provision of finance for the expansion of primary and secondary industries and of services, and the ensuring of a balanced relationship between the creation and issue of money and the production and provision of goods and services. A series of reports have been made to the Government and have been published.
The Council has also reported on particular segments of the economy that it considered warranted special attention. For example, Report No. 22 dealt with Inflation and the Labour Market and Report No. 26 dealt with Growth.
*The contributions to the bank are expressed in United States dollars as at their 1966 value.
DEVELOPMENT FINANCE CORPORATION—This Corporation was established under the Development Finance Corporation Act 1964 primarily as a lender of last resort for small and medium sized businesses which could not secure finance on reasonable terms from conventional sources. The corporation's share capital was owned in approximately equal thirds by the Reserve Bank, the Associated Trading Banks, and a group of insurance companies.
The scope of the corporation's activities was progressively broadened in the years following its establishment and in the 1973 Budget, the corporation was made responsible for the administration of the special schemes of suspensory loans, mortgage guarantees, and bank overdraft guarantees designed by Government for the encouragement of regional development and the growth of export industries. In June 1973 Government acquired by negotiation the whole of the share capital and the corporation was reconstituted under the Development Finance Corporation Act 1973.
The general functions of the corporation are to provide finance for the establishment of new industries and for the development of existing industries and to encourage and promote investment in the industrial development of New Zealand by providing suitable technical advice.
The corporation secures finance for its operation partly by direct loans from Government and partly by borrowing from the public, both by way of medium- and long-term debentures and by way of short-term deposits. Loans to the corporation are defined by its Act as trustee securities. The corporation is also prepared in appropriate circumstances to act on behalf of borrowers as a financial intermediary in arranging overseas sources.
Table of Contents
MORTGAGE LAW—The borrowing of money on mortgage is a principal means of financing the erection or purchase of houses and commercial buildings, and the purchase of farms. Under the Land Transfer Act 1952 “mortgage” means and includes any charge on land created under the provisions of that Act for securing:
The repayment of a loan or satisfaction of an existing debt.
The repayment of future advances, or payment or satisfaction of any future or unascertained debt or liability, contingent or otherwise.
The payment to the holders for the time being of any bonds, debentures, promissory notes, or other securities, negotiable or otherwise, made or issued by the mortgagor before or after the creation of such charge.
The payment to any person or persons by yearly or periodical payments or otherwise of an annuity, rent charge, or sum of money other than a debt.
Where the ownership of land is registered under the Land Transfer Act (as, see Section 10A, the great majority of land titles now are) mortgages on that land are granted by virtue of the provisions of that Act; they take effect as securities and do not operate as transfers of the estate or interest charged. In the case of other land or property a mortgage is granted under what is known as the deeds or deeds-registration system; the mortgage in this instance operating as a conveyance or assignment of the land or property mortgaged, for the mortgagee becomes the registered proprietor of the land, subject to the right of the mortgagor to have the property reregistered in his name on the discharge of his obligations under the mortgage. Although in form a mortgage under the deeds system is a conveyance, in equity it is treated as merely a charge on the land.
SUMMARY OF MORTGAGES REGISTERED AND DISCHARGED—A table is given showing the number of urban and rural registrations, and amounts involved.
(A longer time series is produced in the Statistical Summary at the back of the Yearbook.)
| Year Ended 31 March | Mortgage Registrations | Area | Amount Secured | ||||
|---|---|---|---|---|---|---|---|
| Urban | Rural | Total | Rural | Urban | Rural | Total | |
| NOTE—These figures exclude certain miscellaneous registrations, but may include minor duplications. | |||||||
| No. | hectares (000) | $(m) | $(m) | $(m) | |||
| 1964 | 52,613 | 11,408 | 64,021 | 1,490 | 222.9 | 117.4 | 340.3 |
| 1965 | 58,232 | 13,299 | 71,531 | 1,739 | 257.2 | 162.8 | 420.0 |
| 1966 | 62,809 | 14,169 | 76,978 | 1,829 | 308.0 | 180.0 | 488.0 |
| 1967 | 61,017 | 14,286 | 75,303 | 2,196 | 307.8 | 185.6 | 493.4 |
| 1968 | 60,155 | 13,180 | 73,335 | 1,901 | 315.3 | 152.4 | 467.8 |
| 1969 | 63,169 | 12,374 | 75,543 | 1,641 | 334.3 | 148.1 | 482.3 |
| 1970 | 69,495 | 13,983 | 83,478 | 1,805 | 388.3 | 185.6 | 573.9 |
| 1971 | 80,039 | 17,903 | 97,942 | 2,448 | 488.4 | 214.6 | 703.0 |
| 1972 | 85,446 | 17,454 | 102,900 | 2,463 | 544.5 | 215.3 | 759.8 |
| 1973 | 101,044 | 17,960 | 119,004 | 2,339 | 684.0 | 256.7 | 940.7 |
| 1974 | 117,942 | 21,051 | 138,993 | 2,341 | 958.9 | 342.7 | 1,301.7 |
The 117,942 urban mortgages in 1973-74 were in the following categories: first table, 42,215, first flat, 41,576; subsequent table, 11,536; subsequent flat, 17,758; increases in amount, 4,857. The 21,051 rural mortgages in 1973-74 were in the following categories first table, 4,891; first flat, 7,878; subsequent table, 2,285; subsequent flat, 4,613; increases in amount 1,384.
MORTGAGES REGISTERED: Value by Districts—The total amount for which mortgages were registered, under the Land Transfer Act, in each registration district is given in the next table.
| District | 1969-70 | 1970-71 | 1971-72 | 1972-73 | 1973-74 | |
|---|---|---|---|---|---|---|
| $(million) | ||||||
| North Auckland | 175.5 | 221.3 | 239.0 | 285.8 | 394.3 | |
| South Auckland | 82.6 | 100.0 | 110.5 | 140.0 | 191.5 | |
| Gisborne | 7.0 | 8.5 | 8.9 | 9.4 | 15.4 | |
| Hawke's Bay | 26.8 | 30.4 | 32.7 | 42.8 | 53.8 | |
| Taranaki | 17.3 | 23.5 | 24.2 | 30.2 | 42.8 | |
| Wellington | 108.3 | 129.5 | 141.3 | 188.8 | 257.4 | |
| Marlborough | 6.2 | 8.4 | 8.3 | 9.6 | 15.1 | |
| Nelson | 11.1 | 15.2 | 17.9 | 17.4 | 26.3 | |
| Westland | 2.1 | 2.9 | 3.3 | 3.1 | 3.7 | |
| Canterbury | 78.1 | 95.7 | 104.9 | 123.9 | 180.5 | |
| Otago | 31.9 | 39.3 | 39.4 | 51.5 | 66.6 | |
| Southland | 27.1 | 28.2 | 29.4 | 38.3 | 54.5 | |
| Totals | 573.9 | 703.0 | 759.8 | 940.7 | 1,301.7 | |
The following table shows urban and rural mortgages by land registration district for 1973-74. Auckland urban area, the largest centre of population in New Zealand, is in the North Auckland district.
| Land Registration District | Urban | Rural | Total | ||||
|---|---|---|---|---|---|---|---|
| Number | Amount | Number | Amount | Area | Number | Amount | |
| $(m) | $(m) | hectares (000) | $(m) | ||||
| North Auckland | 38,071 | 337.7 | 4,253 | 56.6 | 215 | 42,324 | 394.3 |
| South Auckland | 15,348 | 113.5 | 4,762 | 77.9 | 395 | 20,110 | 191.5 |
| Gisborne | 1,077 | 8.6 | 393 | 6.8 | 117 | 1,470 | 15.4 |
| Hawke's Bay | 5,014 | 34.3 | 1,053 | 19.5 | 132 | 6,067 | 53.8 |
| Taranaki | 2,829 | 20.0 | 1,313 | 22.8 | 151 | 4,142 | 42.8 |
| Wellington | 25,068 | 213.4 | 2,460 | 44.0 | 330 | 27,528 | 257.4 |
| Marlborough | 1,124 | 8.9 | 362 | 6.2 | 89 | 1,486 | 15.1 |
| Nelson | 2,574 | 18.9 | 712 | 7.4 | 71 | 3,286 | 26.3 |
| Westland | 402 | 2.1 | 130 | 1.7 | 25 | 532 | 3.7 |
| Canterbury | 16,586 | 129.9 | 2,862 | 50.6 | 358 | 19,448 | 180.5 |
| Otago | 6,608 | 45.3 | 1,284 | 21.2 | 276 | 7,892 | 66.6 |
| Southland | 3,241 | 26.4 | 1,467 | 28.1 | 183 | 4,708 | 54.5 |
| Totals | 117,942 | 958.9 | 21,051 | 342.7 | 2,341 | 138,993 | 1,301.7 |
Classification by Amounts—The following table shows urban and rural mortgages by amount groups for 1973-74.
| Amount Group | Urban | Rural | All Properties | |||
|---|---|---|---|---|---|---|
| Number | Amount | Number | Amount | Number | Amount | |
| $(000) | $(000) | $(000) | ||||
| Under 1,000 | 2,580 | 1,547 | 170 | 96 | 2,750 | 1,643 |
| 1,000- 1,999 | 7,661 | 10,247 | 556 | 742 | 8,217 | 10,989 |
| 2,000- 3,999 | 16,815 | 45,021 | 1,599 | 4,419 | 18,414 | 49,440 |
| 4,000- 5,999 | 11,559 | 53,873 | 1,506 | 7,039 | 13,065 | 60,913 |
| 6,000- 7,999 | 9,778 | 65,431 | 1,152 | 7,618 | 10,930 | 73,049 |
| 8,000- 9,999 | 13,109 | 116,377 | 1,092 | 9,370 | 14,201 | 125,747 |
| 10,000-14,999 | 23,992 | 275,930 | 2,758 | 31,960 | 26,750 | 307,890 |
| 15,000 and over | 14,023 | 390,518 | 7,656 | 281,471 | 21,679 | 671,988 |
| Unspecified | 18,425 | ... | 4,562 | ... | 22,987 | ... |
| Totals | 117,942 | 958,943 | 21,051 | 342,717 | 138,993 | 1,301,660 |
Rates of Interest—The average rate of interest on new mortgages over the last 50 years is given in a table in the Statistical Summary at the end of this Yearbook.
The average rate of interest for urban properties for 1973-74 was 7.71 percent, as compared with 7.32 percent for rural properties. The comparable rates for 1972-73 were 7.74 and 7.23 percent respectively.
In 1973-74 the number of 3-percent mortgages decreased from 582 to 572 and the amount advanced increased from $5.9 million to $6.2 million.
An analysis showing amounts classified by interest rate groups is given below. It should be noted that some mortgages, notably those of trading banks, do not specify the rate of interest.
| Year Ended 31 March | Not Exceeding 3 Percent | Over 3 Percent to 5 Percent | Over 5 Percent to 5 1/2 Percent | Over 5 1/2 Percent to 6 Percent | Over 6 Percent to 6 1/2 Percent | Over 6 1/2 Percent to 7 Percent | Over 7 Percent to 8 Percent | Exceeding 8 Percent |
|---|---|---|---|---|---|---|---|---|
| $(million) | ||||||||
| 1964 | 34.0 | 62.7 | 26.5 | 71.6 | 53.0 | 23.2 | 12.8 | 7.6 |
| 1965 | 32.9 | 86.4 | 27.2 | 92.4 | 63.9 | 33.2 | 13.0 | 11.7 |
| 1966 | 27.1 | 91.5 | 28.1 | 81.7 | 107.0 | 50.2 | 24.3 | 22.3 |
| 1967 | 13.7 | 102.1 | 26.1 | 46.1 | 93.4 | 82.4 | 39.3 | 24.4 |
| 1968 | 8.9 | 44.6 | 56.9 | 31.0 | 64.1 | 109.8 | 57.5 | 34.2 |
| 1969 | 9.5 | 27.8 | 65.1 | 30.8 | 69.5 | 108.2 | 74.7 | 37.7 |
| 1970 | 10.8 | 26.2 | 76.6 | 38.9 | 74.4 | 145.0 | 105.9 | 37.5 |
| 1971 | 17.3 | 20.5 | 105.9 | 46.3 | 65.3 | 149.7 | 175.0 | 51.2 |
| 1972 | 9.5 | 18.6 | 109.8 | 33.6 | 25.1 | 101.7 | 239.1 | 140.9 |
| 1973 | 6.4 | 20.0 | 135.2 | 26.8 | 22.6 | 109.4 | 267.9 | 256.1 |
| 1974 | 7.5 | 22.9 | 125.0 | 25.5 | 17.5 | 160.2 | 392.8 | 427.0 |
A similar analysis by interest rate groups is shown (together with the annual average interest rate) in the following diagram.
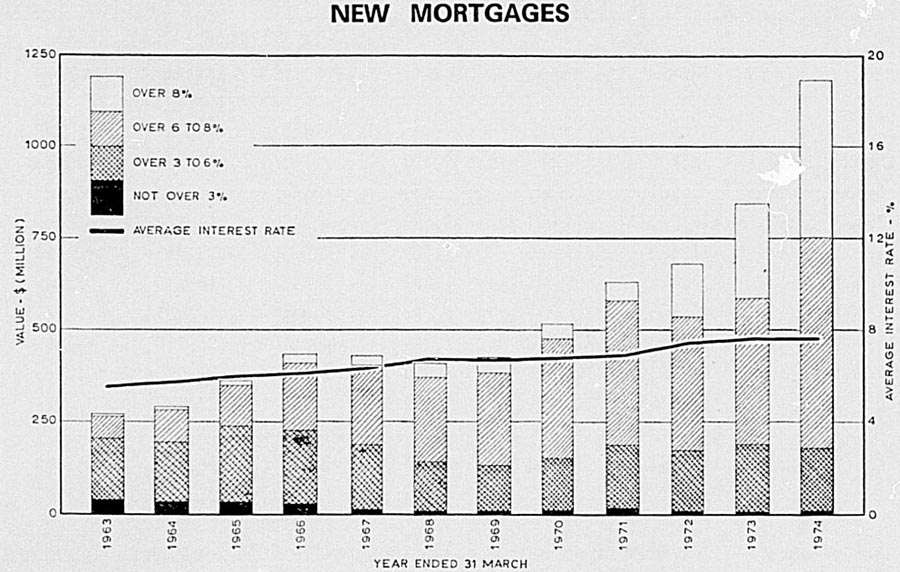
Mortgages by Class—In this section, mortgages are tabulated by class, i.e., as first flat, subsequent flat, first table, subsequent table, and as increases on existing mortgages. The majority of housing mortgages, especially those from Government agencies, are table (or instalment) mortgages. At the 1971 Census, out of a total of 801,686 inhabited permanent private dwellings, 247,582 were owned with table mortgage compared with 82,151 owned with flat mortgage (212,374 dwellings were owned without mortgage, 206,465 were rented or leased, and the balance of the dwellings were free with job, loaned without payment, or the tenure was unspecified).
The following table shows the amounts advanced and average interest rates of mortgages on urban and rural property by class. Mortgages for which the interest rates are not specified are excluded from the calculations of average rates.
| Year Ended 31 March | Class of Mortgage | Total, Urban and Rural | |||||
|---|---|---|---|---|---|---|---|
| Urban | Rural | ||||||
| First Flat | First Table | Total (Including Other) | First Flat | First Table | Total (Including Other) | ||
| Amount advanced $(m) | |||||||
| 1969 | 88.5 | 202.9 | 334.3 | 44.9 | 61.1 | 148.1 | 482.3 |
| 1970 | 74.4 | 258.6 | 388.3 | 46.7 | 81.1 | 185.6 | 573.9 |
| 1971 | 112.6 | 304.2 | 488.4 | 54.2 | 86.5 | 214.6 | 703.0 |
| 1972 | 193.3 | 263.7 | 544.5 | 64.5 | 69.0 | 215.3 | 759.8 |
| 1973 | 250.3 | 335.7 | 684.0 | 88.0 | 81.2 | 256.7 | 940.7 |
| 1974 | 378.0 | 450.8 | 958.9 | 136.0 | 108.8 | 342.7 | 1,301.7 |
| Average interest rate (percent) | |||||||
| 1969 | 7.45 | 6.36 | 6.84 | 6.73 | 6.37 | 6.50 | 6.74 |
| 1970 | 7.36 | 6.54 | 6.87 | 6.86 | 6.44 | 6.55 | 6.77 |
| 1971 | 7.68 | 6.56 | 7.02 | 7.01 | 6.36 | 6.54 | 6.88 |
| 1972 | 8.22 | 6.81 | 7.61 | 7.43 | 6.47 | 6.82 | 7.40 |
| 1973 | 8.33 | 7.01 | 7.73 | 7.79 | 6.88 | 7.23 | 7.60 |
| 1974 | 8.47 | 7.22 | 7.92 | 7.99 | 7.24 | 7.59 | 7.83 |
From 12 February 1958 the State Advances Corporation has made housing loans with provision for rebate of interest to 3 percent where the income of applicants does not exceed prescribed limits. If mortgages at 3 percent interest are excluded from the calculations, the average rate of interest on all mortgages during recent years becomes 6.41 percent in 1966-67, 6.71 percent in 1967-68, 6.81 percent in 1968-69, 6.84 percent in 1969-70, 6.98 percent in 1970-71, 7.45 percent in 1971-72, 7.63 percent in 1972-73, and 7.66 percent in 1973-74.
SOURCES OF MORTGAGE FINANCE—The following table indicates the sources of finance for mortgages registered. For mortgages on urban properties, 14.8 percent of the aggregate advances in 1973-74 were obtained from Government agencies (of which the principal one is the State Advances Corporation) compared with 18.6 percent in 1972-73.
| Year Ended 31 March | Government | Local Authorities | Trading Banks | Trustee Savings Banks | Building Societies | Insurance Companies | Private Individuals | All Other | Total |
|---|---|---|---|---|---|---|---|---|---|
| $(million) | |||||||||
| Urban Properties | |||||||||
| 1969 | 68.3 | 0.5 | 2.7 | 18.1 | 44.7 | 45.8 | 105.6 | 48.6 | 334.3 |
| 1970 | 76.0 | 0.4 | 4.2 | 22.3 | 56.6 | 49.7 | 114.4 | 64.9 | 388.3 |
| 1971 | 95.7 | 1.1 | 4.7 | 34.9 | 66.0 | 49.6 | 126.4 | 110.2 | 488.4 |
| 1972 | 92.5 | 0.6 | 4.3 | 37.5 | 61.3 | 51.6 | 144.6 | 152.1 | 544.5 |
| 1973 | 127.2 | 0.7 | 8.2 | 59.0 | 71.0 | 54.9 | 150.0 | 213.0 | 684.0 |
| 1974 | 142.3 | 1.4 | 10.4 | 73.7 | 108.9 | 79.2 | 174.4 | 368.7 | 958.9 |
| Rural Properties | |||||||||
| 1969 | 33.3 | 0.1 | 1.6 | 4.2 | 5.2 | 19.0 | 62.8 | 21.8 | 148.0 |
| 1970 | 47.8 | 0.1 | 2.5 | 4.8 | 6.5 | 22.4 | 72.3 | 29.2 | 185.6 |
| 1971 | 67.4 | 0.1 | 1.9 | 6.2 | 7.8 | 18.0 | 76.1 | 37.0 | 214.6 |
| 1972 | 78.6 | 0.1 | 1.4 | 4.8 | 6.5 | 15.5 | 72.7 | 35.7 | 215.3 |
| 1973 | 83.9 | 0.1 | 1.4 | 8.3 | 7.9 | 19.0 | 82.6 | 53.4 | 256.7 |
| 1974 | 79.7 | 0.2 | 2.3 | 9.7 | 13.3 | 28.8 | 106.5 | 102.2 | 342.7 |
Points to note in considering statistics of mortgages by source of finance are that most trading bank mortgages specify neither interest rates nor the amounts involved; and that the Government Life Insurance Office and the State Insurance Office are included among Government agencies, not with insurance companies.
Supplementary details on sources of mortgage finance with numbers and amounts of mortgages at various rates of interest are given in a supplement to the July 1974 issue of the Monthly Abstract of Statistics.
MORTGAGES DISCHARGED—Details of urban and rural discharges for the latest 2 years are given in the following table.
| Land Registration District | 1972-73 | 1973-74 | ||||||
|---|---|---|---|---|---|---|---|---|
| Urban | Rural | Urban | Rural | |||||
| Number | Amount | Number | Amount | Number | Amount | Number | Amount | |
| $(m) | $(m) | $(m) | $(m) | |||||
| North Auckland | 26,257 | 139.7 | 3,064 | 23.9 | 30,116 | 176.2 | 3,515 | 26.9 |
| South Auckland | 8,325 | 41.7 | 2,817 | 29.2 | 10,937 | 57.9 | 3,789 | 45.5 |
| Gisborne | 752 | 2.8 | 260 | 2.0 | 894 | 3.8 | 344 | 3.1 |
| Hawke's Bay | 3,095 | 13.1 | 661 | 8.7 | 3,758 | 17.8 | 803 | 9.5 |
| Taranaki | 1,645 | 7.5 | 792 | 7.3 | 2,220 | 10.8 | 1,141 | 12.1 |
| Wellington | 16,641 | 89.1 | 1,576 | 15.8 | 19,360 | 110.2 | 2,048 | 21.5 |
| Marlborough | 803 | 3.8 | 263 | 2.3 | 983 | 5.0 | 357 | 3.3 |
| Nelson | 1,736 | 7.4 | 439 | 2.5 | 2,250 | 10.5 | 587 | 4.0 |
| Westland | 286 | 0.9 | 71 | 0.7 | 337 | 1.0 | 129 | 0.9 |
| Canterbury | 10,710 | 47.4 | 1,680 | 16.8 | 12,844 | 62.2 | 2,260 | 25.8 |
| Otago | 5,141 | 20.2 | 844 | 7.7 | 5,867 | 23.8 | 1,103 | 11.0 |
| Southland | 2,187 | 11.0 | 823 | 8.8 | 2,790 | 14.9 | 1,168 | 14.9 |
| Totals | 77,578 | 384.6 | 13,290 | 125.5 | 92,356 | 494.2 | 17,244 | 178.7 |
Many discharges are not registered, particularly in the case of leaseholds and also of second or other further mortgages when the power of sale has been exercised by the first mortgagee. The figures for discharges are further affected by the high proportion of table mortgages. This is particularly so in cases where the mortgage is approaching maturity, since the whole amount remains on the register until finally discharged, despite the fact that the original amount of indebtedness has been considerably reduced.
GENERAL—Government first entered the field of mortgage finance in 1894 with the passing of the Government Advances to Settlers Act—the objective being to provide loans at economic interest rates and on stable terms and conditions to farmers for land development purposes. The functions of the office, later known as the State Advances Department, were subsequently enlarged to allow loans for the erection and purchase of houses and to local authorities for the provision of public facilities. A public corporation was established with the passing of the Mortgage Corporation Act 1934-35—the share capital of $2,000,000 being subscribed equally by Government and public. In terms of the State Advances Corporation Act 1936, the Government acquired the privately-owned share of the Mortgage Corporation, extended its functions and changed its name to the State Advances Corporation of New Zealand. Under the Rural Banking and Finance Corporation Act 1974 the rural lending activities of the State Advances Corporation passed to the new corporation from 1 April 1974. Loans may be made in respect of farms and farm support industries. The State Advances Corporation transferred part of its General Reserve Fund and approved securities to the Rural Banking and Finance Corporation (RBFC).
Under the Housing Corporation Act 1974 the functions of the State Advances Corporation in housing were amalgamated with those hitherto performed by the Housing Division of the Ministry of Works and Development to constitute a Housing Corporation responsible to the Minister of Housing.
Since 1937 when Government embarked upon the scheme for the erection of State rental houses, the corporation has been responsible for the letting and subsequent administration of these properties.
The Rural Banking and Finance Corporation Act 1974 reconstituted the farm lending activities of the Rural Division of the State Advances Corporation.
The principal functions of the RBFC are to carry on the business of making loans and providing other assistance, in its discretion, for farming purposes and for other purposes in relation to primary industries and related service industries.
The corporation's powers include the purchase or lease of property, and the management, development, sale, or lease of property. The RBFC also has powers to give guarantees and indemnities to other lenders. In the execution of its functions and powers, the RBFC is required to give effect to Government policy.
The Rural Banking and Finance Corporation (RBFC) consists of a chairman and four other directors appointed by the Minister of Finance. Two of these directors are appointed after consultation with Federated Farmers of New Zealand (Inc.).
Farm Loans—Loan finance is granted by the corporation for the purchase and/or development of farm properties. Present policy is directed towards stimulating increased production, the strengthening of marginal farms and assisting suitable young farmers and from workers who can demonstrate a need for finance from the corporation, and who have not previously owned an economic property. Loans may be granted for the purchase of land and improvements and stock and plant, the erection of necessary buildings, and for essential development work. Loans are generally limited to two-thirds of the corporation's value of the land and improvements, although loans in excess of this margin may be approved where collateral security over stock and plant is available. The maximum loan available for the purchase of a dairy farm is $45,000 and for a sheep farm $65,000. However, loans in excess of these amounts will be considered in special circumstances. Some funds are allocated for refinancing of existing debts where these are considered to be onerous. Where a farmer whose property is already mortgaged elsewhere requires finance for development and for increasing production, the corporation is able in appropriate cases to grant loans by way of second (or subsequent) mortgage.
Loans on Stock and Plant—Loans by way of first security over stock and plant only can be granted by the corporation to farmers, including sharemilkers and lessees of farms, for the purchase of stock and plant or for other farming purposes.
Co-operative Rural Intermediate Credit Associations—Loans may be granted by the corporation to co-operative rural intermediate credit associations operating in terms of the Rural Intermediate Credit Act 1927 and amendments. At 31 March 1974 there were five cooperative rural intermediate credit associations in operation. The loans authorised through this channel during the year 1973-74 amounted to $1,949,864, and loans current at the end of the year amounted to $2,721,600.
Farm Mortgage Guarantees—In recognition of the need for farmers to have access to more capital for future reorganisation and reconstruction than the corporation can make available by direct loans, the corporation operates a Farm Mortgage Guarantee Scheme. Under this scheme the corporation protects prudent lenders with soundly administered mortgage against loss of capital.
Since its establishment in April 1974, there have been some changes in the policy and lending activities of the RBFC.
Rural industrial lending has been expanded and now covers: (a) the establishment of new types of industry associated with the rural sector which have export potential and/or regional development prospects; (b) the establishment of vet. clinics or similar projects serving the rural sector; (c) the provision of packing sheds, cool stores, grain dryers, and storage fish-processing plants, etc.; (d) milk treatment plants.
To foster progressive farming methods and new techniques the RBFC is now assisting competent and soundly-based farmers and agricultural contractors with the purchase of modern plant and machinery for demonstration and evaluation under New Zealand conditions.
The RBFC is also providing finance to agricultural contractors for housing and the establishment of a base area.
Export Suspensory Loan Scheme—To promote the export of non-traditional agricultural and horticultural products suspensory loans of up to 40 percent of qualifying expenditure on plant and equipment are now available. Upon achievement of an export target the loans are converted to a grant and are subsequently written off.
Forestry—Where it is considered that tree planting is the best use of the land the RBFC now lends to farmers for forestry projects and associated development works.
Farm Ownership Savings—The Farm Ownership Savings Act provides a savings scheme for intending farmers and the payment of a substantial grant of between 25 percent and 50 percent of savings depending upon the length of time deposits have been held. This Act is administered by the Rural Banking and Finance Corporation and the Post Office. Trustee banks have been authorised to accept deposits.
Seasonal Finance Support Scheme, 1974-75—The purpose of the scheme is to ensure that sheep and cattle farmers who have established that they need financial assistance will have sufficient funds to meet normal seasonal expenditure during 1974-75. The scheme provides seasonal advances of up to $5,000 to qualifying farmers facing a budget deficit in 1974-75 and a “hard-core” debt at the end of the season.
HOUSING LOANS—The Housing Corporation continues to concentrate the bulk of its residential lending on the provision of loans for the erection of houses or the acquisition of houses not previously occupied. Loans to assist home seekers to purchase previously occupied houses, reinstated in 1964, are available to the extent of available funds and to applicants within strictly defined priority categories.
All loans are made on security of a first mortgage of land. Each case is considered on its merits, taking into account the financial position of the applicant and the cost of the proposition. Each applicant is expected to make the maximum possible contribution from available resources.
There are no fixed loan limits but an average loan concept is applied which provides loans of a greater amount in areas where housing costs are highest. The maximum loan available for either erection or purchase will, however, generally not exceed 90 percent of the Corporation's assessed value of the security offered.
The standard interest rate at present is 5 1/2 percent and this rate is subject to review at 3-yearly intervals. The rebated interest rate of 3 percent is still available and from May 1974 an intermediate interest rate of 4 1/2 percent was introduced. To qualify for a rebated interest loan, borrowers must not have owned a property within 5 years prior to the date of the loan application and the breadwinner's gross income earned within a 40-hour week excluding overtime, must not exceed certain limits—for 3 percent—$55 increased by $5 for each dependent child and for 4 1/2 percent—between $80 and $85 similarly increased by $5 for each dependent child. Loans now being granted at 3 percent provide for the interest rate to be automatically increased to 4 1/2 percent after 3 years and to 5 1/2 percent (or the then standard rate) after a further 3 years. The loans at 4 1/2 percent, the rate increases to 5 1/2 percent (or the then standard rate) after 3 years.
For the year ended 31 March 1974, 799 loans involving $82,570,000 were authorised with rebate to 3 percent compared with 446 loans for $53,982,000 in 1972-73.
Corporation loans towards the purchase of private sections were introduced in April 1975. Generally, only first-home seekers are available for the loans, which are of up to two-thirds of the cost of sections, carry interest at 5 percent or 7 percent depending on income of borrower, and are repayable over a 10-year period.
Loans are also granted for essential alterations and alterations to Corporation securities as where the housing of an elderly or dependent relative is involved. Loans, together with any prior mortgage debt must be within 90 percent of value and where housing of an elderly relative is involved may be by way of second or subsequent mortgage security.
Housing improvement loans, introduced in 1972, continue to be confined in the meantime to inner areas of the four main centres. Loans will be entertained for owner-occupier or tenanted properties or subsequent mortgage for the purposes of upgrading of older housing stock.
Loans to refinance existing mortgages on a residential property where family income is under undue strain caused by high interest rates and/or onerous terms of repayment, were introduced in the 1973 Budget and for the year ended 31 March 1974 a total of 423 loans for $1,689,000 were advanced. Security may be on first and subsequent mortgage.
Family Benefit Capitalisation—Applications for advances under the Family Benefit (Home Ownership) Act 1964 are received only from applicants who have already been declared eligible by the Social Welfare Department. For the year ended 31 March 1974, 4,481 advances totalling $5,890,264 were authorised by the corporation under this agency, compared with 5,421 advances totalling $7,045,423 in 1972-73.
Mortgage Guarantee Scheme For Housing—The corporation has statutory authority to guarantee mortgages and operates schemes whereby an approved lender may be guaranteed either repayment of that portion of a housing loan granted by the institution in excess of its normal limits (usually two-thirds of the value) or the whole of the amount advanced. In 1973-74 there were 2,129 guarantees involving $8,179,000.
LOAN AUTHORISATIONS—A summary of loans authorised by the corporation for the latest 2 financial years ended 31 March is given in the following table.
| Class of Loan | 1972-73 | 1973-74 | ||
|---|---|---|---|---|
| Number | Amount | Number | Amount | |
| Farm loans— | $(000) | $(000) | ||
| Purchase | 524 | 16,052 | 633 | 21,686 |
| Development | 1,315 | 12,796 | 1,183 | 12,655 |
| Refinance | 422 | 4,784 | 511 | 7,244 |
| Additional land | 1,244 | 28,186 | 527 | 12,583 |
| Stock loans— | ||||
| Direct | 501 | 3,656 | 477 | 3,812 |
| RIC associations | 254 | 1,716 | 246 | 1,950 |
| Lands Department settlements | 21 | 581 | 19 | 527 |
| Primary industries | - | - | 4 | 580 |
| Climatic relief | - | - | 33 | 350 |
| Totals, farm | 4,281 | 67,771 | 3,633 | 61,387 |
| Housing loans— | ||||
| Erection | 10,319 | 102,622 | 8,660 | 95,615 |
| Purchase | 3,060 | 24,269 | 3,192 | 31,280 |
| Other purchases | 757 | 1,645 | 950 | 2,449 |
| Refinance | - | - | 423 | 1,690 |
| Totals, housing | 14,136 | 128,536 | 13,225 | 131,034 |
| Loans to industry | 40 | 3,294 | 35 | 2,592 |
| Grand totals | 18,457 | 199,601 | 16,893 | 195,013 |
The above figures include rehabilitation loans to ex-servicemen in respect of farms and houses.
The aggregate loans approved from its own funds since the corporation commenced business in 1935 to 31 March 1974 were as follows.
| Type of Loan | Number | Amount |
|---|---|---|
| *Since 1958 the whole of the General Reserve Fund has been invested in Government securities. | ||
| $(million) | ||
| Farm | 71,355 | 752.0 |
| Housing | 301,883 | 1,463.3 |
| Loans to industry | 407 | 58.4 |
| Loans to local authorities (from General Reserve Fund)* | 1,131 | 38.3 |
| Totals | 374,776 | 2,312.0 |
A summary of the loans under administration as at 31 March 1974 is as follows.
| Loans on Mortgage | Accounts | Amount |
|---|---|---|
| $(000) | ||
| Rural | 21,125 | 382,032 |
| Urban | 131,728 | 660,249 |
| Industrial | 172 | 34,316 |
| Hotel investment loans | 34 | 4,217 |
| Totals | 153,059 | 1,080,814 |
HOUSING ACT 1955—In addition to its lending activities the Housing Corporation has the function of administering the Housing Act 1955 on behalf of the Crown. The following are the main operations:
Letting and administration of State rental houses and flats.
Sale of State rental houses to tenants desiring to purchase.
Loans to local authorities for the erection of rental accommodation.
State Rental Housing—The number of additional dwelling units taken over by the Corporation during the year ended 31 March 1974 totalled 851 including 201 older houses purchased by the Corporation. Rental houses under administration on a tenancy basis at 1 April 1973 were 52,580. After adding the new units taken over and allowing for sales and repurchases, there was a net total of 52,213 at 31 March 1974, a decrease of 367 from the previous year.
Rental accounts in arrears at 31 March 1974 were 6.28 percent compared with 6.77 percent a year earlier.
Rents received from tenancies amounted to $21,605,818. In addition the sum of $514,757 was recouped by deduction of interest payable on National Development Loans capital to offset rental concessions granted to pensioners, etc., thus bringing the total receipts to $22,120,575 compared with $21,320,847 for 1972-73. Apart from interest, the largest single item of expenditure charged against rentals was the provision for maintenance of rental houses. For the year ended 31 March 1974 this amounted to $6,588,984 against $5,980,343 for the previous year. Rates payable to local authorities showed an increase for the year ended 31 March 1974 being $4,192,727 compared with the previous year's figure of $3,947,257.
The interest rate payable on National Development Loans capital is 3 percent. References to Corporation housing construction are contained in Section 19 (Building Construction and Housing).
Sale of Rental Houses—The Corporation does not extend an automatic right to a tenant to purchase the dwelling he occupies. However where the Corporation does agree to a sale tenants can purchase single units on the following terms:
(a) A minimum deposit of $500 or 5 percent of the gross purchase price if this is higher. Where however, the financial position of the purchaser warrants, the corporation may require a greater deposit.
(b) The balance of the purchase money, together with interest, payable over a period of up to 40 years on an instalment-table basis.
(c) Interest at 5 1/2 percent reducible to 4 1/2 percent or 3 percent while conditions of sale are complied with in the case of purchasers who would qualify for these rates for a housing loan.
(d) Agreements for sale completed after 1 April 1968 provide for a review of the rate of interest at 5-yearly intervals but from May 1974 rebated interest loans are only available on the same terms as housing loans.
From the inception of the sale of rental houses up to 31 March 1974 the number sold was 26,035 for a total sale price of $153,532,069 Of the houses sold, 1,306 have been repurchased by the corporation for $6,559,290. The repurchases comprise properties which have been bought back in terms of the sale agreement—generally from purchasers who have transferred to other towns in the course of their employment.
GENERAL—Building societies are a relatively popular means of saving and investment in New Zealand and have over 450,000 members. There are 66 building societies with total assets of $409.8 million. They provide finance for home ownership to the extent of over $101 million a year. Building societies have assisted the national economy by developing the field of saving. They are encouraged by legislation, as in other countries and are exempt from income tax except for income derived from the letting of property. The relevant legislation is the Building Societies Act 1965, the Building Societies Savings Bank Regulations 1966, and the Building Societies Regulations 1967.
The Building Society Amendment Act 1974 brought the sale of shares by terminating societies under provisions along the lines of those of the Door to Door Sales Act 1967.
In 1970 a measure was introduced requiring building societies to hold 5 percent of their assets in the form of public securities.
TERMINATING SOCIETIES—Although some of these societies issue preference shares and accept deposits, most of their funds are obtained from periodical subscriptions paid by members on their shares. In general members contract to subscribe for a minimum period of 10 years. Subscriptions cannot be withdrawn within 10 years of membership without penalty. Field staffs are employed to recruit by direct canvassing new members who take up subscription shares, each share entitling a member to compete for a loan of $400, with a contractual payment of 10 cents weekly per share. As funds allow, ballots are held for interest-free loans. A member winning an interest-free loan may use it to finance a home, but the popular feature of these societies is that they offer to ballot-winners, as an alternative to an interest-free loan, a tax-free lump sum payment which is accepted by the great majority of ballot-winners in preference to the interest-free loan.
Members may also compete for interest-bearing loans by a process of tendering or by application. Over 90 percent of the loans granted are on an interest-bearing basis and generally if a member receives an interest-bearing loan he is then excluded from ballots. Terminating societies do not pay an annual dividend or interest on subscription shares but shareholders who have not received a loan and withdraw their shares after 10 or more years of membership receive their subscriptions back in full plus such an amount as the directors may determine. Shares are segregated into groups which terminate after some 30 years when those remaining financial members who have not won a ballot nor received an interest-bearing loan receive a share of profits in addition to a return of their subscriptions. In 1973 there were 16 terminating societies with 405,947 shareholders and 494 terminating groups; the number of mortgagors was 40,755.
For 1973 818 interest-free loans won by ballot were taken up, while in 4,840 cases members elected to receive payments for rights won by ballot; 1,128 advances were made through tender or auction process, and 6,155 other interest-bearing advances were made on mortgage to members.
PERMANENT SOCIETIES—Whilst encouraging systematic savings these societies rely more substantially for their funds on single investment deposits and fully paid shares. Some of these societies are authorised to conduct savings banks in a manner substantially similar to the Post Office and other savings banks. A number of permanent societies maintain financial ratios which have enabled them to qualify for designation as societies with which trustees may invest trust funds by way of deposit.
Permanent societies do not conduct ballots but make loans available to members on application. The structures of permanent societies differ, some being purely co-operative, others being partly proprietary and partly co-operative, and others being fully proprietary with all fixed capital somewhat similar to finance companies. In 1973 there were 50 permanent societies with 48,429 shareholders; the number of borrowers totalled 19,902.
ACTIVITIES OF SOCIETIES—A review of main activities is given in the following table.
| Item | Permanent Societies | Terminating Societies | ||||
|---|---|---|---|---|---|---|
| 1971 | 1972 | 1973 | 1971 | 1972 | 1973 | |
| $S(million) | ||||||
| (a) At end of year— | ||||||
| Paid-up capital | 47.9 | 52.0 | 60.7 | 186.8 | 203.7 | 223.0 |
| Borrowings— | ||||||
| Savings bank deposits | 2.5 | 2.4 | 2.5 | 0.1 | 0.2 | 0.2 |
| Other deposits | 42.1 | 47.4 | 58.3 | 22.2 | 24.5 | 30.6 |
| Investments— | ||||||
| NZ Government securities | 4.1 | 5.1 | 6.1 | 11.4 | 12.2 | 12.5 |
| Local authority securities | 1.2 | 2.4 | 4.8 | 9.2 | 10.4 | 12.8 |
| Other | 3.0 | 5.5 | 10.6 | 7.9 | 11.0 | 15.1 |
| Mortgages | 90.1 | 95.0 | 107.3 | 179.1 | 195.0 | 216.4 |
| (b) During year— | ||||||
| Advances made on mortgage | 21.9 | 19.8 | 32.2 | 48.8 | 49.7 | 68.9 |
| Special advances made included in above | 1.7 | 1.0 | 2.4 | 5.5 | 4.5 | 6.6 |
A summary of receipts and payments is given in the following table for the financial year of societies ended during 1973.
| Item | Permanent Societies | Terminating Societies | All Societies |
|---|---|---|---|
| * Ten Societies are authorised by the Act to accept deposits on conditions substantially similar to the conditions pertaining to the Post Office, trustee, and private savings banks. | |||
| $(000) | $(000) | $(000) | |
| Receipts | |||
| Share subscriptions (excluding subscriptions on borrowing shares) | 18,595 | 44,012 | 62,607 |
| Deposits received— | |||
| Savings bank* | 4,331 | 200 | 4,531 |
| Other | 74,118 | 24,131 | 98,249 |
| Interest and principal repaid— | |||
| Advances on mortgage (including subscriptions on borrowing shares) | 24,599 | 59,762 | 84,361 |
| Advances on shares | 254 | 7,762 | 8,016 |
| Investments realised | 21,044 | 44,946 | 65,990 |
| Payments | |||
| Share moneys withdrawn | 10,516 | 22,783 | 33,299 |
| Deposits and interest withdrawn— | |||
| Savings bank* | 4,294 | 214 | 4,508 |
| Other | 65,291 | 19,019 | 84,310 |
| Advanced on mortgage | 32,150 | 68,872 | 101,022 |
| Advanced on shares | 285 | 6,962 | 7,247 |
| Investments made | 29,092 | 51,652 | 80,744 |
A summary of income and expenditure for financial years ended in 1973 is given in the following table.
| Item | Permanent Societies | Terminating Societies | All Societies |
|---|---|---|---|
*Mainly levies on members as provisions against losses on mortgage. †Mainly agency commissions. | |||
| Income | |||
| Interest earned on— | $(000) | $(000) | $(000) |
| Advances | 7,026 | 14,691 | 21,717 |
| Investments | 912 | 2,385 | 3,297 |
| Fees, commissions and fines | 108 | 782 | 890 |
| Incomes from properties | 53 | 367 | 420 |
| Net credit from shares forfeited or withdrawn at a discount | 25 | 1,756 | 1,781 |
| Other* | 80 | 753 | 833 |
| Total Income | 8,204 | 20,734 | 28,938 |
| Expenditure | |||
| Interest incurred on borrowings | 2,862 | 1,659 | 4,521 |
| Directors' emoluments | 134 | 102 | 236 |
| Auditors' fees | 33 | 59 | 92 |
| Salaries | 517 | 2,323 | 2,840 |
| Other administrative expenses | 240 | 1,527 | 1,767 |
| Selling and establishment expenses—written off | 15 | 2,050 | 2.065 |
| Payments for ballot loan rights—written off | — | 3,910 | 3,910 |
| Expenses on properties, including depreciation | 37 | 244 | 281 |
| Discount on shares paid in advance—written off | — | 64 | 64 |
| Other | 43 | 899† | 942 |
| Total expenditure | 3,881 | 12,837 | 16,718 |
| Excess of income over expenditure | 4,323 | 7,897 | 12,220 |
The purposes of advances on mortgage in the three latest calendar years are shown in the following table.
| Purpose of Loan | Permanent Societies | Terminating Societies | All Societies | ||||||
|---|---|---|---|---|---|---|---|---|---|
| 1971 | 1972 | 1973 | 1971 | 1972 | 1973 | 1971 | 1972 | 1973 | |
| $(m) | $(m) | $(m) | |||||||
| Dwellings— | |||||||||
| Erections | 3.5 | 3.2 | 3.0 | 6.5 | 6.7 | 7.0 | 9.9 | 9.9 | 10.0 |
| Purchases | 13.9 | 12.3 | 21.8 | 24.4 | 25.7 | 36.3 | 38.4 | 38.0 | 58.1 |
| Other purposes | 1.8 | 2.3 | 3.5 | 11.7 | 11.9 | 20.4 | 13.5 | 14.3 | 23.9 |
| Business and other properties | 2.7 | 2.0 | 3.8 | 6.1 | 5.3 | 5.3 | 8.9 | 7.3 | 9.1 |
| Totals | 21.9 | 19.8 | 32.1 | 48.8 | 49.7 | 68.9 | 70.7 | 69.5 | 101.0 |
The following table summarises balance sheets for the financial year ended during 1973.
| Item | Permanent Societies | Terminating Societies | All Societies |
|---|---|---|---|
*Most terminating societies bring the principal outstanding on interest-free loans into their balance sheets at its face value. †In previous years included in either “Advances on security of mortgage” or “Other”. | |||
| Assets | $(000) | $(000) | $(000) |
| Land and buildings | 1,061 | 8,649 | 9,710 |
| Other fixed assets | 93 | 906 | 999 |
| Advances on security of mortgage (less credits on borrowing shares)* | 107,274 | 216,376 | 323,650 |
| Advances on security of shares | 430 | 8,976 | 9,406 |
| Investments | 21,148 | 40,384 | 61,532 |
| Cash and bank | 379 | 148 | 527 |
| Appropriations in trust debit balances† | — | 2,066 | 2,066 |
| Other | 60 | 1,933 | 1,993 |
| Total assets | 130,445 | 279,438 | 409,883 |
| Liabilities | |||
| Paid-up capital (excluding borrowing shares) | 60,720 | 223,006 | 283,726 |
| Reserves | 6,291 | 14,754 | 21,045 |
| Retained profits | 774 | 23,836 | 24,610 |
| 67,785 | 261,596 | 329,381 | |
| Less fictitious assets | 147 | 17,954 | 18,101 |
| 67,638 | 243,642 | 311,280 | |
| Deposits— | |||
| Savings bank | 2,527 | 190 | 2,717 |
| Other | 58,322 | 30,641 | 88,963 |
| Appropriations in trust credit balances | .. | 2,032 | 2,032 |
| Provisions | 1,320 | 1,047 | 2,367 |
| Bank overdraft | 457 | 960 | 1,417 |
| Other | 181 | 926 | 1,107 |
| Total liabilities | 130,445 | 279,438 | 409,883 |
The book values of investments at the end of the three latest financial years are shown in the next table.
| Item | Permanent Societies | Terminating Societies | All Societies | ||||||
|---|---|---|---|---|---|---|---|---|---|
| 1971 | 1972 | 1973 | 1971 | 1972 | 1973 | 1971 | 1972 | 1973 | |
| $(m) | $(m) | $(m) | |||||||
| Government securities | 4.1 | 5.1 | 6.1 | 11.4 | 12.2 | 12.5 | 15.5 | 17.3 | 18.6 |
| Local body securities | 1.2 | 2.4 | 4.5 | 9.2 | 10.4 | 12.8 | 10.4 | 12.8 | 17.2 |
| Short-term money market | 0.8 | 2.1 | 2.9 | — | 1.5 | 1.8 | 0.8 | 3.6 | 4.8 |
| Advances to employees | — | — | 0.1 | 2.1 | 2.4 | 2.8 | 2.1 | 2.4 | 2.9 |
| Deposits with other societies | — | — | — | 0.5 | 0.4 | 0.4 | 0.5 | 0.4 | 0.4 |
| Deposits with banks | 2.1 | 3.2 | 7.4 | 2.2 | 3.8 | 6.9 | 4.3 | 7.0 | 14.3 |
| Other | — | — | 0.2 | 2.9 | 2.9 | 3.1 | 3.0 | 2.9 | 3.3 |
| Totals | 8.3 | 13.0 | 21.2 | 28.4 | 33.6 | 40.4 | 36.8 | 46.6 | 61.5 |
GENERAL—The method of carrying on business by companies is now a proved system, a system for the incorporation of persons into a separate entity for trading purposes and providing a convenient method for the investment of capital and for the limitation of liability of the people associated in the company. The incorporation of a company with limited liability provides the framework of commercial and industrial life; private companies have become a usual form of business organisation for the smaller trader.
LEGISLATION—Comprehensive legislation relating to companies is contained in the Companies Act 1955, which came into force on 1 January 1957. An important principle in the legislation is the protection of shareholders, creditors, and the general public by the requirement that there must be the fullest practicable disclosure of information concerning the activities of companies. The annual financial statements must exhibit a true and complete account of a company's affairs and transactions. A prescribed form of presentation is required, and comparative figures for the previous year must be shown. A prospectus must be deposited with the Registrar of Companies before it is issued.
Any number of persons from 2 to 25 may form a private company; a public company must have at least 7 members. A private company of not less than seven members may, under certain conditions, be re-registered as a public company.
The Companies Amendment Act 1963 restricts company takeovers. The Companies Amendment Act 1966 deals with deposits and debentures, and came into force on 1 January 1967.
NEW COMPANIES REGISTERED—The following table shows for the last 11 years the number and aggregate nominal capital of new private companies registered.
In comparing one year with another it should not be overlooked that registrations, on account of reconstruction of companies or for other reasons, are included. Such reregistrations of large companies may have a considerable effect on the year's total, so far as capital is concerned.
The nominal capital shown for overseas companies is the total nominal capital of these companies and, of course, bears no relationship to their capital resources employed in New Zealand. It is shown merely as some indication of the relative size of overseas companies commencing business in this country.
| Year | Private Companies | Public Companies | Overseas Companies | |||
|---|---|---|---|---|---|---|
| Number | Nominal Capital | Number | Nominal Capital | Number | Nominal Capital | |
| *Two companies are limited (as to capital) by guarantee | ||||||
| $(000) | $(000) | $(000) | ||||
| 1963 | 4,107 | 30,358 | 26 | 6,315 | 32 | 37,460 |
| 1964 | 5,009 | 43,832 | 26 | 14,307 | 19 | 31,814 |
| 1965 | 5,504 | 36,779 | 37 | 25,379 | 22 | 23,602 |
| 1966 | 5,556 | 37,570 | 16 | 6,887 | 37 | 142,882 |
| 1967 | 4,771 | 32,076 | 27 | 13,145 | 31 | 57,497 |
| 1968 | 4,955 | 30,033 | 20 | 6,032 | 35 | 154,036 |
| 1969 | 6,338 | 60,060 | 30 | 15,004 | 35 | 211,552 |
| 1970 | 6,346 | 45,154 | 34 | 38,434 | 51 | 199,318 |
| 1971* | 5,425 | 38,523 | 31 | 42,175 | 34 | 278,291 |
| 1972* | 6,484 | 82,931 | 10 | 4,672 | 53 | 4,183,507 |
| 1973 | 8,753 | 90,345 | 32 | 51,045 | 52 | 108,034 |
The following table gives a classification of new companies registered in 1973 according to the amount of nominal capital.
| Amount of Nominal Capital | Private Companies | Public Companies | Overseas Companies | |||
|---|---|---|---|---|---|---|
| Number | Nominal Capital | Number | Nominal Capital | Number | Nominal Capital | |
| $ | $(000) | $(000) | $(000) | |||
| Under 2,000 | 3,212 | 2,104 | — | — | 2 | 1 |
| 2,000-3,999 | 1,661 | 3,851 | — | — | 1 | 2 |
| 4,000-5,999 | 1,348 | 6,248 | — | — | 1 | 4 |
| 6,000-7,999 | 489 | 3,125 | — | — | — | — |
| 8,000-9,999 | 352 | 2,946 | — | — | — | — |
| 10,000-11,999 | 759 | 7,632 | 1 | 10 | 18 | 180 |
| 12,000-13,999 | 129 | 1,576 | — | — | — | — |
| 14,000-15,999 | 135 | 2,027 | — | — | — | — |
| 16,000-17,999 | 38 | 624 | — | — | — | — |
| 18,000-19,999 | 16 | 293 | — | — | — | — |
| 20,000-29,999 | 288 | 6,072 | — | — | 3 | 60 |
| 30,000-39,999 | 89 | 6,099 | — | — | — | — |
| 40,000-99,999 | 126 | 6,693 | 4 | 235 | 9 | 480 |
| 100,000-199,999 | 70 | 7,676 | 7 | 800 | 4 | 400 |
| 200,000 and over | 40 | 33,380 | 19 | 50,000 | 10 | 106,907 |
| Limited by guarantee, etc. | 1 | — | 1 | — | 4 | — |
| Totals | 8,753 | 90,345 | 32 | 51,045 | 52 | 108,034 |
The number of private company registrations in 1973 was 8,753, an increase of 2,269 from the 6,484 registered in 1972. The nominal capital of companies increased by $7.4 million over the previous year.
The extent of changes in the number and nominal capital of new registrations of private companies between 1963 and 1973, expressed as percentages of the totals is shown in the following table.
| Amount of Nominal Capital | Number | Amount of Capital | ||
|---|---|---|---|---|
| 1963 | 1973 | 1963 | 1973 | |
| percent | ||||
| Under 2,000 | 24.4 | 36.7 | 2.3 | 2.3 |
| 2,000-9,999 | 58.9 | 44.0 | 31.6 | 17.9 |
| 10,000-19,999 | 9.9 | 12.3 | 16.3 | 13.5 |
| 20,000 and over | 6.8 | 7.0 | 49.8 | 66.3 |
| Totals | 100.0 | 100.0 | 100.0 | 100.0 |
Compiled from published sources, the following summary gives the stated objects of all new companies registered during the latest 3 years. Because of possible inaccuracies in the source data, and the difficulty of precise classification by industrial group from the information available, the figures should be regarded as approximate only.
| Industry Group | 1971 | 1972 | 1973 |
|---|---|---|---|
| Agriculture and livestock production | 405 | 460 | 852 |
| Forestry, hunting, and fishing | 58 | 67 | 84 |
| Mining and quarrying | 50 | 31 | 33 |
| Manufacturing— | |||
| Food, beverages, and tobacco | 71 | 74 | 91 |
| Textile, footwear, and apparel | 84 | 83 | 185 |
| Woodwork and furniture | 56 | 79 | 125 |
| Machinery | 154 | 241 | 310 |
| Transport equipment | 183 | 218 | 419 |
| Other | 315 | 320 | 565 |
| Construction | 526 | 667 | 1,113 |
| Commerce— | |||
| Wholesale and retail | 1,678 | 2,070 | 2,323 |
| Banks and other financial institutions | 257 | 235 | 249 |
| Real estate | 426 | 515 | 876 |
| Other | 20 | 20 | 35 |
| Transport, storage, and communication | 181 | 200 | 322 |
| Services— | |||
| Community and business | 267 | 335 | 303 |
| Personal | 562 | 747 | 813 |
| Other | 91 | 106 | 129 |
| Miscellaneous or not known | 106 | 79 | 10 |
| Totals | 5,490 | 6,547 | 8,837 |
Changes of Nominal Capital by Registered Companies—In the calendar year 1973, 1,846 public and private companies which previously had a total nominal capital of $321.6 million increased their nominal capital by $316.8 million to $638.4 million. There were 49 cases with increases of $1 million or more and these accounted for $241.6 million of the total increase.
Overseas companies registered in New Zealand, but not included in the preceding figures, increased their nominal capital by $59.4 million, from $124.2 million to $183.6 million.
In 35 cases local companies reduced their nominal capital by a total of $6.1 million from $21.6 million to $15.5 million.
Companies on Register—At 31 December 1973 there were 94,233 companies on the register compared with 88,071 at the same date last year. Included in these figures are overseas companies which amount to 519 and 513 respectively. These figures were supplied by the Registrar of Companies.
Companies Gazetted as Deleted From the Company Register—During 1973 there were 2,718 companies deleted from the Company Register, their total nominal capital being $177.0 million. In the previous year 2,559 companies with total capital of $132.7 million were deleted.
ANALYSIS OF PUBLIC COMPANY FINANCIAL STATEMENTS—Since 1953 the Reserve Bank of New Zealand has undertaken an analysis of the annual financial statements of a sample of public companies in New Zealand to obtain information concerning company finance and the capital market. Results of these analyses are published in the Reserve Bank Bulletin.
The basis of coverage includes only companies of New Zealand domicile whose income is wholly or mainly from New Zealand sources. This definition excludes, among others, companies carrying on insurance, some stock and station agents, and shipping companies. The number of companies covered has been: 1968-69, 279; 1969-70, 260; 1970-71, 248; 1971-72, 248; and 1972-73. 239. The 1973 survey is the first of a new series and covers the analysis of the accounts of 239 New Zealand public companies that were received during the calendar year 1973. Previous annual surveys have covered accounts received during a June year, but the change was made to give a more up-to-date coverage. Because of the change of the survey period this analysis is more representative of the 1972-73 financial year as 84 percent of the companies included in this survey actually balanced in 1973. In the June year 1972-73 survey only 13 percent of the companies balanced in 1973.
Changes in sources of funds over the latest four years are shown in the following table.
| Source of Funds | 1969-70 | 1970-71 | 1971-72 | 1972-73 | 1973 |
|---|---|---|---|---|---|
| percent | |||||
| Retained profits and depreciation | 44.7 | 42.4 | 37.1 | 40.4 | 37.5 |
| Other long-term sources | 25.3 | 24.4 | 30.5 | 44.3 | 28.5 |
| All long-term sources | 70.0 | 66.8 | 67.6 | 84.7 | 66.0 |
| Short-term sources | 30.0 | 33.2 | 32.4 | 15.3 | 34.0 |
| Totals | 100.0 | 100.0 | 100.0 | 100.0 | 100.0 |
The next table sets out proportionately the use of funds.
| Use of Funds | 1969-70 | 1970-71 | 1971-72 | 1972-73 | 1973 |
|---|---|---|---|---|---|
| percent | |||||
| Property and plant | 46.8 | 41.4 | 49.1 | 53.5 | 40.9 |
| Long-term investment | 9.7 | 11.4 | 8.4 | 5.2 | 8.7 |
| 56.5 | 52.8 | 57.5 | 58.7 | 49.6 | |
| Stocks | 18.3 | 22.3 | 20.5 | 8.5 | 7.6 |
| Debtors | 24.2 | 23.6 | 21.3 | 17.2 | 25.4 |
| Other short-term | 1.0 | 1.3 | 0.7 | 15.6 | 17.4 |
| Totals | 100.0 | 100.0 | 100.0 | 100.0 | 100.0 |
Appropriation of income of 239 New Zealand public companies in the latest two years is shown in the following table.
| Item | 1971-72 | 1972-73 | 1973 |
|---|---|---|---|
| $(000) | |||
| Income for year— | |||
| Trading | 286,456 | 305,418 | 397,623 |
| Investment income | 9,992 | 10,890 | 14,118 |
| Other non-trading income | 2,292 | 2,435 | 2,268 |
| Total income | 298,740 | 318,743 | 414,009 |
| Deductions— | |||
| Depreciation | 68,238 | 77,202 | 88,754 |
| Interest on fixed liabilities | 24,595 | 29,553 | 37,923 |
| Directors' fees | 1,747 | 1,862 | 2,052 |
| Tax on current year's income | 93,542 | 85,591 | 107,756 |
| Minority interests | 2,222 | 2,451 | 2,815 |
| Total deductions | 190,344 | 196,659 | 239,300 |
| Item | 1971-72 | 1972-73 | 1973 |
|---|---|---|---|
| Net profit after tax | 108,396 | 122,084 | 174,709 |
| Previous year's adjustments— | |||
| Tax | 338 | 2,017 | 388 |
| Other | 8,971 | 11,235 | 16,205 |
| Available for appropriation | 117,705 | 135,336 | 191,302 |
| Appropriations— | |||
| Goodwill, etc, written off | 8,483 | 14,103 | 17,993 |
| Ordinary dividends | 56,994 | 61,305 | 78,786 |
| Preference dividends | 1,939 | 1,919 | 1,937 |
| Retained in reserves | 50,289 | 58,009 | 92,586 |
| Total appropriations | 117,705 | 135,336 | 191,302 |
DEVELOPMENT OF LIFE ASSURANCE—Life assurance is no longer restricted to its original function, but has been encouraged for its avenue of contractual savings accumulating to considerable capital investment. Its additional role as the basis of many private superannuation schemes gives to a large segment of the labour force a protection not available to it a generation ago. Whole-life assurance has been widely supplemented by endowment assurance. Under this category there are policies with titles such as “family-income”, “education”, “mortgage-protection”, or “retirement”, and persons taking out policies regard them as a means of systematic saving. Government encouragement is given by way of income-tax concessions on premiums paid, this approach being common to the governments of many countries.
The steady flow of funds to insurance companies by the payment of premiums are in the form of contractual saving, and the investment of these funds has become a major influence on the financial market. Life-assurance companies are leading lenders of long-term funds to the private sector and important investors in Government and local authority securities. Growth in life-assurance assets has exceeded $100 million a year in recent years and in 1973-74 they totalled $1,862 million of which 32.4 percent is invested in mortgages on property, 28.5 percent in Central Government and local authority securities, and 16.6 percent in company stocks, shares and debentures. Premiums paid each year for life assurance are the equivalent of some 3.6 percent of national income, and life assurance and the insurance organisations as a group have financed about 10 percent of the country's internal public debt.
In the year 1973-74 there were 232,132 new policies issued for a total sum assured of $2,216.6 million, or approximately $740 per head of population. The total number of policies in force at the end of the year was 2,533,008 for a total life assurance of $10,985 million. (These figures exclude annuities.)
INTERNATIONAL COMPARISON—On the basis of the ratio of the value of life assurance in force to the national income, New Zealand is fifth to Canada, the United States, Japan, and Sweden, as shown in the following table. This survey covered 43 countries. (Source: Life Insurance Fact Book, 1974.) Selected countries are listed in the following table.
| Country | 1967 | 1972 |
|---|---|---|
| percent | ||
| Canada | 184 | 158 |
| United States | 149 | 155 |
| Sweden | 144 | 140 |
| New Zealand | 135 | 137 |
| Japan | 96 | 153 |
| Australia | 93 | 122 |
| Netherlands | 108 | 111 |
| United Kingdom | 83 | 103 |
In Sweden the introduction in 1936 of a large national group life plan sponsored by the Government but underwritten by private life companies helped to increase the ratio markedly. Term life cover is believed to constitute a higher proportion of the total coverage in Canada and the United States than in New Zealand, where permanent life cover is relatively high. (Purchase of assurance for a set term provides maximum immediate cover at the lowest cost and can be used to cover mortgage repayments on a house; insurance for a short term for travel purposes is also popular in the United States and Canada.) Group life plans are negotiated by groups of workers in other countries and typically provide for a death benefit equal to one or two times annual earnings.
GENERAL—The statutory provisions affecting life assurance in New Zealand are in the main contained in the Life Insurance Act 1908, the Inalienable Life Annuities Act 1910, and the Government Life Insurance Act 1953.
There are 26 life-assurance offices conducting business in New Zealand at the present time. Of these, nine are purely New Zealand institutions—namely, the Government Life Insurance Office, Capital Life Assurance Ltd., Cuna Mutual Insurance Society, New Zealand Insurance (Life and General) Co. Ltd., Metropolitan Life Assurance Co. of New Zealand Ltd., the South British Life Assurance Co. Ltd., Superannuation and Mutual Savings Ltd., Primary Industries Insurance Co. Ltd., and the Tasman Mutual Life Assurance Co. Ltd.; whilst three, the Provident Life Assurance Co., Commercial Union Assurance Co. of New Zealand Ltd. (formerly Dominion Life Assurance Office of New Zealand Ltd.) and the Monarch Life Insurance Co. of New Zealand, are registered in this country. The balance dates of the offices vary between June and May of the following year, the financial year of the majority ending in December. The statistics given here relate exclusively to business transacted in New Zealand. Further information is available in the Report on Insurance Statistics prepared by the Department of Statistics and available in Government bookshops.
LIFE ASSURANCE: Ordinary and Industrial—The progress of life assurance in New Zealand is illustrated by the following diagram, which shows the amount of new business transacted.
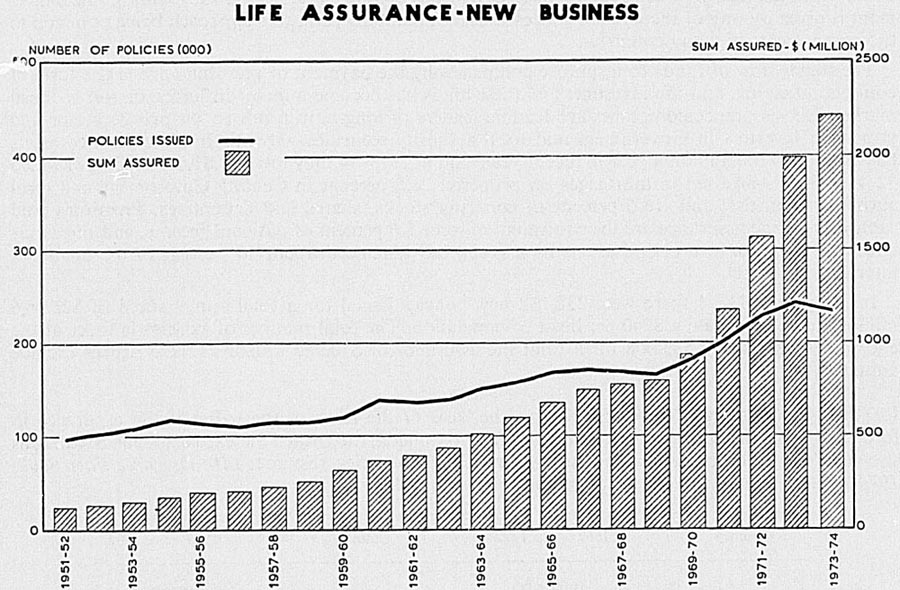
A summary of annual life-assurance business is given in the following table.
| Year | Value of Policies Issued | Value of Policies Discontinued | Value of Policies Existing at End of Year | Annual Premiums on Existing Policies | Number of Policies in Force |
|---|---|---|---|---|---|
| *Includes policies (value $12.1 million) transferred. | |||||
| $(m) | $(m) | $(m) | $(m) | (000) | |
| 1963-64 | 508.6 | 156.0 | 3,195.5 | 75.5 | 1,793 |
| 1964-65 | 595.6 | 183.3 | 3,609.1 | 82.8 | 1,846 |
| 1965-66 | 674.0 | 213.3 | 4,069.8 | 91.1 | 1,911 |
| 1966-67 | 744.0 | 227.0 | 4,586.7 | 100.9 | 1,973 |
| 1967-68 | 768.9 | 260.6 | 5,094.9 | 113.6 | 2,028 |
| 1968-69 | 793.2 | 309.2 | 5,579.0 | 121.4 | 2,087 |
| 1969-70 | 928.8 | 346.1 | 6,155.0 | 131.7 | 2,149 |
| 1970-71 | 1,173.9* | 434.5 | 6,894.5 | 146.6 | 2,230 |
| 1971-72 | 1,560.5 | 462.0 | 7,996.4 | 168.6 | 2,337 |
| 1972-73 | 1,988.1 | 563.0 | 9,445.0 | 196.3x | 2,443 |
| 1973-74 | 2,216.6 | 677.9 | 10,984.7 | 221.8 | 2,533 |
While the upward trend shown in the figures has been influenced both by the rate of monetary depreciation and the normal growth of population, the course of life-assurance business, particularly during the past decade, has been one of steady progress. In the last 12 years the face value of new business underwritten annually and the amount of cover in force has more than trebled.
Total discontinuances include surrenders and lapses, as well as policies maturing or terminated by death.
A prominent feature of new insurances of recent years has been the increase in the average amount of the sum assured per policy.
| Year | Average Amount |
|---|---|
| 1962-63 | 3,560 |
| 1963-64 | 3,788 |
| 1964-65 | 4,142 |
| 1965-66 | 4,412 |
| 1966-67 | 4,784 |
| 1967-68 | 4,968 |
| 1968-69 | 5,166 |
| 1969-70 | 5,525 |
| 1970-71 | 6,159 |
| 1971-72 | 7,174 |
| 1972-73 | 8,575 |
| 1973-74 | 9,916 |
Reasons for the growth in the average amount of the sum assured per policy shown in the above table include the changing types of policies being issued, and the increasing numbers of such policies which have a high cover (for example, cover for staff superannuation purposes by business concerns, temporary insurance with a high death-risk cover, multiple death benefit and family benefit policies having a high initial cover, and “unit” policies whereby a single premium provides a high initial death cover).
LIABILITIES AND ASSETS—The principal items in the balance sheets of life-assurance companies are summarised below for the 3 latest years. As in the previous tables the figures relate to New Zealand business only. In the case of some companies other branches of insurance business are included.
| Liabilities | 1971-72 | 1972-73 | 1973-74 |
|---|---|---|---|
| $(000) | |||
| Paid-up share capital | 4,550 | 5,066 | 5,189 |
| Life-assurance and annuity funds | 1,464,303 | 1,612,799 | 1,783,326 |
| Depreciation, reserve, and other special funds | 29,003 | 5,88 | 30,288 |
| Claims admitted but not paid | 11,1 | 11,38 | 14,081 |
| Other liabilities | 22,065 | 4,424 | 29,230 |
| Totals | 1,530,952 | 1,688,415 | 1,862,115 |
The assets of the New Zealand branches at the end of each of the 3 latest years were as follows.
| Assets | Amount | Percentage of Totals | ||||
|---|---|---|---|---|---|---|
| 1971-72 | 1972-73 | 1973-74 | 1971-72 | 1972-73 | 1973-74 | |
| $(m) | percent | |||||
| Mortgages on houses, etc. | 539.2 | 564.6 | 602.6 | 35.2 | 33.6 | 32.4 |
| Loans on policies | 77.4 | 87.1 | 92.4 | 5.1 | 5.2 | 5.0 |
| Central Government securities | 315.3 | 350.9 | 389.5 | 20.6 | 20.7 | 20.9 |
| Local authority securities | 113.4 | 123.9 | 141.4 | 7.4 | 7.3 | 7.6 |
| Real estate | 184.9 | 219.3 | 261.8 | 12.1 | 13.0 | 14.0 |
| Company shares and debentures | 251.4 | 282.3 | 308.3 | 16.4 | 16.7 | 16.5 |
| Outstanding premiums | 14.1 | 15.7 | 18.5 | 0.9 | 0.9 | 1.0 |
| Interest accrued, etc. | 16.3 | 18.3 | 19.7 | 1.0 | 1.0 | 1.1 |
| Cash | 5.4 | 9.5 | 12.3 | 0.4 | 0.5 | 0.7 |
| Other assets | 13.6 | 16.8 | 15.6 | 0.9 | 1.0 | 0.8 |
| Totals | 1,531.0 | 1,688.4 | 1,862.1 | 100.0 | 100.0 | 100.0 |
The Government has made agreements with the life-insurance companies regarding the proportion of their new funds invested in Government and local authority securities. By 1970 the life-insurance companies were investing 30 percent of their new investable funds in public sector securities, of which not less than 22.5 percent would be in Government stock and 7.5 percent in local authority stock. As a further measure to help restrain expenditure by the private sector, the life-insurance companies were asked by the Government to invest an additional 5 percent of their new funds in public sector securities from 1 October 1970.
For 1973-74 the average rate of interest earned on the life funds of insurance companies was $7.28 percent, compared with $7.05 percent during 1972-73. This rate was calculated by taking the arithmetic means of funds at the beginning and end of the year less half the amount of interest, etc., earned.
The following diagram illustrates the expansion that has taken place in recent years in the assets of the New Zealand branches of life-assurance companies and the manner of their investment. In composite-insurance offices, receipts of life assurance and annuity business must be treated as a separate fund, and the interests of the policyholders are safeguarded by the fact that these funds are available only for liabilities arising from such business.
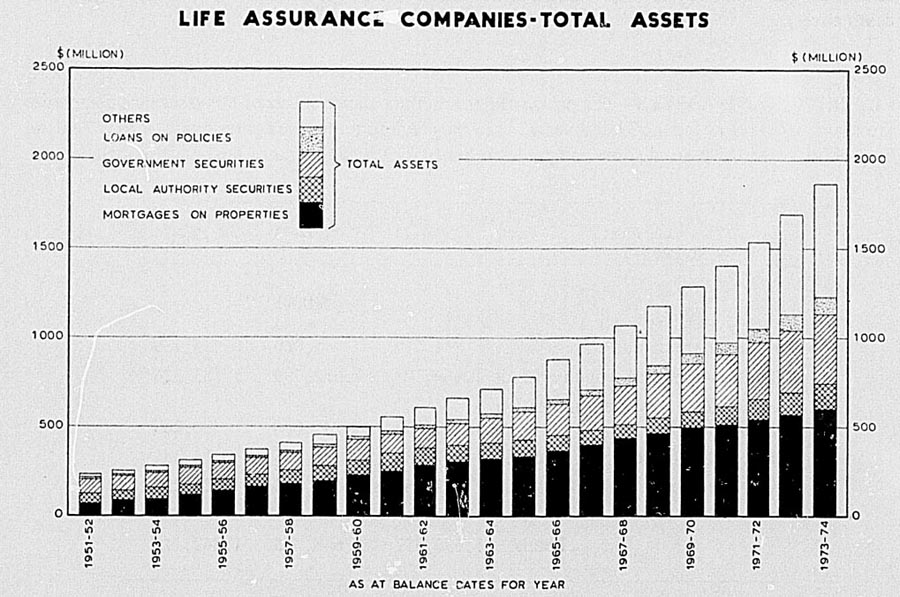
GENERAL—Until 1974 there were three principal classes of accident insurance transacted in New Zealand. These were: (a) personal, covering accidents, sickness, etc.; (b) employers' liability under statutory or common law; and (c) motor vehicle insurance. Other classes of accident insurance include the insurance of plate glass, television sets, luggage, and livestock.
The Accident Compensation Act 1972, effective from 1 April 1974, provides continuous cover against accidents of all persons in regular employment, whether at work or not, through an earners' scheme financed by levies averaging 1 percent of incomes payable by employers on behalf of employees: the levies replace employers' liability premiums under the Workers' Compensation Act. (See Section 35B—Industrial Injuries.)
Until 1974 there were two classes of motor vehicle insurance—comprehensive coverage, and compulsory third-party risks cover. Owners of motor vehicles were compelled to insure against their liability to pay damages on account of the death or bodily injury of another person caused through the car-owners negligence. However, this compulsory scheme was replaced from 1 July 1974 by a new scheme under the Accident Compensation Act 1972. The new scheme provides financial compensation for personal injuries suffered in motor vehicle accidents irrespective of blame. It is financed by levies similar to the previous insurance premiums paid by motor vehicle owners.
The number of accident insurance offices represented in the statistics for 1973-74 was 64. The head offices of the companies concerned were in the following countries: Great Britain, 21; Australia, 13; United States of America, 3; Hong Kong, 1; and New Zealand, 26.
REVENUE AND EXPENDITURE—The following table shows the principal items of revenue and expenditure. Premiums and claims are net, i.e., after deductions for acceptances of reinsurance, whether effected locally or overseas, have been taken into account.
| Year | Number of Offices | Revenue | Expenditure | ||||||
|---|---|---|---|---|---|---|---|---|---|
| Premiums | Other Revenue | Total* | Claims | Commission | Salaries | Other Expenses | Total* | ||
| *Excluding reserve provisions. | |||||||||
| $(million) | |||||||||
| 1963-64 | 81 | 46.8 | 2.3 | 49.0 | 30.2 | 3.5 | 5.2 | 4.8 | 43.7 |
| 1964-65 | 80 | 51. | 2.7 | 54.2 | 33.9 | 3.9 | 5.6 | 5.3 | 48.7 |
| 1965-66 | 80 | 60.0 | 3.0 | 62.9 | 39.5 | 4.2 | 6.0 | 5.9 | 55.6 |
| 1966-67 | 82 | 66.0 | 3.3 | 69.3 | 43.8 | 4.1 | 6.7 | 7.0 | 61.6 |
| 1967-68 | 77 | 69.2 | 3.8 | 73.0 | 47.7 | 4.3 | 7.4 | 7.8 | 67.2 |
| 1968-69 | 77 | 71.6 | 4.2 | 75.8 | 49.0 | 4.4 | 7.6 | 9.0 | 70.0 |
| 1969-70 | 75 | 76.9 | 4.6 | 81.5 | 54.2 | 4.8 | 8.4 | 9.7 | 77.1 |
| 1970-71 | 75 | 88.0 | 4.8 | 92.8 | 65.8 | 5.6 | 9.4 | 8.6 | 89.4 |
| 1971-72 | 67 | 106.2 | 5.7 | 111.9 | 77.2 | 7.0 | 11.3 | 8.6 | 104.1 |
| 1972-73 | 67 | 126.2 | 6.3 | 132.5 | 86.5 | 8.0 | 12.2 | 13.3 | 120.0 |
| 1973-74 | 64 | 137.4 | 9.1 | 146.5 | 99.8 | 8.7 | 13.2 | 13.0 | 134.7 |
Premium receipts in 1973-74 were 8.7 percent above the 1972-73 figure, while claims rose by 15.4 percent.
A review of the expenses incurred in transacting all accident insurance is contained in the table following. The fluctuations over a period of 5 years are shown in the form of percentages of revenue to expenditure under various heads. The percentages do not take into account reserve provisions.
| Year | Claims to Premiums | Commission to Premiums | Salaries to Premiums | Other Expenses to Premiums | Total Expenses (other than Claims) to Premiums | Total Expenditure to Premiums | Total Expenditure to Total Revenue |
|---|---|---|---|---|---|---|---|
| percent | |||||||
| 1969-70 | 70.4 | 6.3 | 10.9 | 12.6 | 29.8 | 100.2 | 94.6 |
| 1970-71 | 74.8 | 6.3 | 10.7 | 9.8 | 26.8 | 101.5 | 96.3 |
| 1971-72 | 72.7 | 6.6 | 10.6 | 8.1 | 25.3 | 98.0 | 93.0 |
| 1972-73 | 68.5 | 6.3 | 9.7 | 10.5 | 26.6 | 95.1 | 90.6 |
| 1973-74 | 72.6 | 6.3 | 9.6 | 9.5 | 25.4 | 98.0 | 92.0 |
Working expenses (excluding taxation) amounted to $26,605,000 in 1971-72, $29,389,000 in 1972-73, and $32,223,000 in 1973-74. The ratios of working expenses to premium income for each of the 3 years were respectively 25.1, 23.3, and 23.5 percent.
ANALYSIS OF PREMIUMS AND CLAIMS—In the next table particulars of premiums and claims for the three main classes of accident insurance are given for the last 5 years. Reinsurances effected outside New Zealand are not taken into account in the figures presented below.
| Year | Employers' Liability | Personal Accident and Sickness | Motor Vehicle Comprehensive | Motor Vehicle Third-party Risks | Other | Total |
|---|---|---|---|---|---|---|
| $(thousand) | ||||||
| Premiums Received | ||||||
| 1969-70 | 16,601 | 7,905 | 33,503 | 8,366 | 12,133 | 78,507 |
| 1970-71 | 19,038 | 9,193 | 38,913 | 8,804 | 14,481 | 90,429 |
| 1971-72 | 23,267 | 10,754 | 48,529 | 11,682 | 16,353 | 110,586 |
| 1972-73 | 2,890 | 12,026 | 56,775 | 14,211 | 19,790 | 129,692 |
| 1973-74 | 26,511 | 13,831 | 65,137 | 11,147 | 21,980 | 138,608 |
| Claims Paid | ||||||
| 1969-70 | 11,752 | 3,327 | 25,865 | 6,946 | 5,728 | 53,619 |
| 1970-71 | 13,497 | 3,819 | 31,629 | 7,402 | 7,597 | 63,944 |
| 1971-72 | 15,680 | 4,390 | 37,302 | 10,013 | 7,734 | 75,120 |
| 1972-73 | 18,130 | 4,767 | 38,885 | 10,820 | 9,165 | 81,767 |
| 1973-74 | 21,300 | 5,097 | 46,895 | 11,279 | 10,947 | 95,518 |
Premiums and claims for motor vehicle third-party risks into the years ended 30 June.
The following table shows the ratio of claims to premiums for each class of accident insurance.
| Class of Insurance | Claims to Premiums | ||
|---|---|---|---|
| 1971-72 | 1972-73 | 1973-74 | |
| Employers' liability | 67.4 | 67.4 | 0.3 |
| Personal accident and sickness | 40.8 | 39.6 | 36.9 |
| Motor vehicle comprehensive | 76.9 | 68.5 | 72.0 |
| Motor vehicle third-party risks | 85.7 | 76.1 | 101.2 |
| Other | 47.3 | 46.3 | 49.8 |
| All classes | 67.9 | 63.0 | 68.9 |
In the following table premiums and claims under motor-vehicle third-party risks insurance are shown for the last year of operation of the old scheme by class of motor vehicles.
| Class of Motor Vehicle | Net Premiums Received | Claims Paid | Estimated Claims Outstanding | ||
|---|---|---|---|---|---|
| Arising During Year | Arising During Previous Years | Arising During Year | Arising During Previous Years | ||
| $(000) | |||||
| 1973-74 | |||||
| Motor cycles | 291 | 5 | 310 | 377 | 1,230 |
| Private and business cars* | 8,699 | 124 | 8,837 | 8,724 | 34,464 |
| Goods-service vehicles | 1,540 | 20 | 1,345 | 1,243 | 5,921 |
| Public taxicabs | 111 | 2 | 112 | 81 | 476 |
| Public omnibuses | 135 | 6 | 112 | 293 | 632 |
| Other classes | 373 | 5 | 401 | 364 | 1,840 |
| Totals | 11,147 | 162 | 11,118 | 11,082 | 44,564 |
GENERAL—Fire is still the main cause of property damage, but today many property owners seek protection not only against fire damage, but also against a wide range of other dangers including water, windstorm, explosion, breakages, theft, aircraft, and impact by motor vehicles. Under houseowners' and householders' comprehensive policies, which have largely superseded fire insurance policies for covering dwellings and their contents, many thousands of additional claims are now dealt with each year. Increasing numbers of commercial property owners, too, are extending their fire policies to include damage from other causes.
In 1973 there were 51 fire-insurance companies conducting business in New Zealand. Of these the head offices of 20 were in New Zealand, 20 were in Great Britain, 8 in Australia, 2 in the United States of America, and 1 in Hong Kong. The statistics in this section relate to the calendar year for about two-thirds of these companies; for the remaining companies the financial year nearest to the calendar year is used.
SUMMARY OF BUSINESS—The statistics in the following summary of business relate to the business conducted with the insuring public. Reinsurance transactions are not taken into account. While the bulk of the claims represent fire losses the figures also include the numerous, frequently minor, claims made under comprehensive policies for damage from other causes.
| Year | Policies at 31 December | Gross Cover at 31 December | Premium Income | Claims | Percentage of Claims to Premium Income |
|---|---|---|---|---|---|
| $(m) | $(000) | $(000) | percent | ||
| 1963-64 | 1,664,045 | 8,969.3 | 20,269 | 7,010 | 34.6 |
| 1964-65 | 1,722,612 | 9,555.9 | 22,574 | 7,305 | 32.4 |
| 1965-66 | 1,739,031 | 10,399.9 | 24,033 | 8,387 | 34.9 |
| 1966-67 | 1,776,856 | 11,076.1 | 25,995 | 8,466 | 32.6 |
| 1967-68 | 1,853,439 | 12,115.2 | 28,387 | 11,877 | 41.8 |
| 1968-69 | 1,895,719 | 13,598.1 | 30,016 | 13,814 | 46.0 |
| 1969-70 | 1,913,299 | 13,805.1 | 32,695 | 13,010 | 39.8 |
| 1970-71 | 2,032,105 | 16,069.4 | 37,456 | 14,806 | 39.5 |
| 1971-72 | 2,068,970 | 18,309.4 | 43,339 | 17,349 | 40.0 |
| 1972-73 | 2,092,711 | 21,223.7 | 54,492 | 20,860 | 38.3 |
| 1973-74 | 2,149,598 | 24,832.8 | 60,775 | 24,804 | 40.8 |
LIABILITIES—The following table shows whole-world liabilities of fire-insurance offices. The figures refer to all departments of business underwritten. Funds of life departments are added for completeness, but by the Life Insurance Act 1908 life funds must be accounted for separately, and form a security for life-policy holders which is not available for other classes of insurance transacted. Of the 51 fire offices, 11 also engage in life-assurance business, but only 2 of these conduct such business in New Zealand.
| Item | 1971-72 (Total) | 1972-73 (Total) | 1973-74 | ||
|---|---|---|---|---|---|
| Overseas Companies | Local Companies | Total | |||
| $(million) | |||||
| Paid-up capital | 480.9 | 509.9 | 484.6 | 40.0 | 524.6 |
| Reserves | 4,846.2 | 4,657.0 | 3,856.8 | 90.1 | 3,946.9 |
| Other liabilities | 6,298.6 | 8,034.0 | 7,969.8 | 232.1 | 8,202.0 |
| Totals | 11,625.7 | 13,201.0 | 12,311.3 | 362.2 | 12,673.5 |
| Life funds | 11,364.5 | 11,694.7 | 11,374.0 | 0.9 | 11,374.8 |
| Total liabilities | 22,990.2 | 24,895.6 | 23,685.2 | 363.1 | 24,048.3 |
ASSETS—The following table gives the amount of assets in New Zealand as at the end of each of the last 5 years classified under various heads. The figures given include all investments in New Zealand securities and do not relate merely to the assets held by the New Zealand branches of the companies concerned. The assets of other departments—accident, life, marine, etc.—are also included.
| Assets in New Zealand | 1969-70 | 1970-71 | 1971-72 | 1972-73 | 1973-74 |
|---|---|---|---|---|---|
| $(million) | |||||
| Real estate | 24.89 | 29.92 | 36.09 | 41.29 | 47.21 |
| Central Government securities | 32.66 | 31.67 | 29.93 | 31.77 | 33.86 |
| Local authority securities | 25.12 | 23.91 | 25.47 | 28.40 | 31.40 |
| Company shares and debentures | 41.92 | 47.31 | 58.75 | 79.02 | 88.92 |
| Mortgages, etc. | 31.57 | 31.92 | 35.21 | 37.22 | 41.16 |
| Outstanding premiums | 18.13 | 22.32 | 27.76 | 31.43 | 34.91 |
| Cash and other assets in New Zealand | 34.07 | 36.47 | 40.97 | 51.75 | 69.28 |
| Total New Zealand assets | 208.35 | 223.52 | 254.17 | 300.88 | 346.75 |
REVENUE AND EXPENDITURE—A statement of the total revenue and expenditure, both gross and net, of all offices is now given in respect of New Zealand business. The gross figures include reinsurance business accepted, while the net figures comprise insurances with the public, plus reinsurances accepted, and less amounts reinsured with other offices.
It is insurance practice at the closing date of the accounts of a fire-insurance company to transfer to a reserve a proportion of the income received during the year, to allow for policies whose currency extends into the following accounting year. Thus, if the amount transferred to reserve at the end of the current year is greater than that transferred at the end of the previous year, the net effect is equivalent to an increase in this year's expenditure and the difference is therefore shown as expenditure. Similarly, if the amount transferred this year is less than last year, then the difference will be shown as revenue.
The entry of change in reserve provision in the gross figures, it should be noted, is calculated on the assumption that it bears the same proportion to gross premium income as does the actual net reserve to the net premium income.
| Item | 1972-73 | 1973-74 | ||
|---|---|---|---|---|
| Gross | Net | Gross | Net | |
| Revenue | $(thousand) | |||
| Change in reserve provision | 129 | 85 | 77 | 50 |
| Amount of fire premiums received during year | 66,337 | 42,609 | 76,885 | 51,142 |
| Interest and dividends | 3,119 | 3,119 | 4,052 | 4,052 |
| Rents | 688 | 688 | 821 | 821 |
| Other revenue | 204 | 204 | 391 | 391 |
| Totals | 70,477 | 46,705 | 82,226 | 56,456 |
| Expenditure | ||||
| Change in reserve provisions | 5,190 | 3,411 | 6,825 | 4,360 |
| Amount of fire claims paid during year, including adjustment and other expenses of settlement, but less salvage | 22,704 | 15,241 | 29,628 | 19,009 |
| Fire authority levies | 5,953 | 4,430 | 6,609 | 5,105 |
| Central Government taxes | 3,405 | 3,626 | 3,387 | 2,597 |
| Rents | 623 | 622 | 733 | 732 |
| Depreciation | 462 | 462 | 611 | 611 |
| Allowance and commissions on premiums to agents, subagents, and others | 7,730 | 3,904 | 8,748 | 4,655 |
| Salaries and wages, including commissions, on profits or bonuses | 7,210 | 7,198 | 8,720 | 8,697 |
| Other expenses of management | 4,442 | 4,451 | 4,739 | 4,796 |
| Totals | 57,718 | 43,333 | 69,999 | 50,562 |
ORGANISATION OF FIRE SERVICE—The New Zealand fire service comprises 277 fire districts. Twenty-six of these districts are served mainly by permanent firemen and 251 united, urban, and secondary urban fire districts by volunteers. In addition, 29 fire brigade auxiliary units are attached to a number of urban and secondary urban fire authorities. The total strength of the fire service at 31 March 1974 was 7,279, comprising 1,840 permanent firemen and 5,439 volunteers.
For the year ended 31 March 1974 the total cost of the fire service was $14.669 million. Fifteen percent ($2.2 million) of this was contributed by the Government, 35 percent ($5.134 million) by local authorities, and 50 percent ($7.335 million) by the insurance companies. The total includes the costs of the Fire Service Commission, which amounted to $755,694, an increase of $437,038 over the previous year. The costs of the decentralised training scheme and of the Fire Safety inspectorate were largely responsible for this increase.
FIRE CALLS DURING 1973—The total number of calls attended by brigades throughout New Zealand during 1973 was 34,847 including 557 for assistance under the mutual assistance scheme. Of the total number of calls received, 9,567 were false alarms, including 1,803 classified as malicious and 2,863 caused by defective alarm equipment. Chimney fires totalled 2,206; 9,590 were rubbish and herbage fires; 9,179 were property fires; and the remainder of the calls (4,305) were for special services.
Forty-eight lives were lost by fire during 1973 compared with 28 the previous year. Included in the total were five persons who died as a result of burns in traffic accidents and one as a result of burns in an aircraft crash.
The following table shows the causes of fires in which loss of life occurred.
| Smoking in bed | 2 |
| Careless disposal of smoking materials | 6 |
| Children playing with matches | 3 |
| Cars igniting as a result of accidents | 5 |
| Aircraft igniting after crash | 1 |
| Electric blankets | 2 |
| Electric heaters igniting clothing | 2 |
| Electric heaters igniting room contents | 2 |
| Liquified petroleum gas in caravan ignited by lighted match | 1 |
| Deliberately lit | 2 |
| Unknown | 15 |
LIFE ASSURANCE—The New Zealand Government Life Insurance Office was founded in 1869 at a time when New Zealanders had comparatively poor facilities in regard to life assurance. The payment of all policies has always been guaranteed by the Government.
From a total of 59 policies, assuring a sum of $60,005, issued during 1869-70, the business of the office has grown to a stage when, at the end of 1973, policies numbered 446,252 and the total sum assured reached $1,458 million. Among life insurance companies, the Government Life Insurance handles the second largest volume of business in New Zealand.
Income and expenditure figures of the Government Life Insurance Office are now given for each of the latest 5 years.
| Year | Premium Income (Including Purchase of Annuities) | Total Income | Management Expenses | Total Expenditure | Ratio of Management Expenses to Total Income | Ratio of Management Expenses to Premium Income |
|---|---|---|---|---|---|---|
| $(thousand) | percent | |||||
| 1969 | 20,877 | 33,592 | 2,805 | 14,481 | 8.35 | 13.43 |
| 1970 | 22,717 | 37,053 | 3,234 | 16,260 | 8.73 | 14.24 |
| 1971 | 24,941 | 41,008 | 3,956 | 18,573 | 9.65 | 15.86 |
| 1972 | 28,136 | 46,058 | 4,537 | 21,157 | 9.85 | 16.13 |
| 1973 | 32,514 | 52,772 | 5,237 | 24,104 | 9.92 | 16.11 |
During the year 1973 payments were made under the following heads: matured policies (including bonus addition), $6,389,822; claims by death (including bonuses), $3,629,170; annuities, $514,958; surrendered policies and bonuses cashed, $6,796,267; commission, $2,658,274; other management expenses, $2,578,916; taxes, $1,315,646; and other expenditure, including transfers to reserves, $220,585.
Figures showing the progress of the office during the latest 5 years are contained in the next table. Annuities are excluded.
| Year | New Business | Policies Discontinued | Policies in Force at End of Year | ||||||
|---|---|---|---|---|---|---|---|---|---|
| Number of Policies | Sum Assured | Annual* Premiums | Number | Sum Assured | Annual Premiums | Number | Sum Assured | Annual Premiums | |
| *Excludes single premiums. | |||||||||
| $(m) | $(m) | $(m) | $(m) | $(m) | $(m) | ||||
| 1969 | 26,651 | 119.1 | 2.1 | 18,111 | 49.6 | 1.0 | 400,241 | 992.4 | 19.3 |
| 1970 | 27,974 | 134.7 | 2.6 | 17,859 | 51.4 | 1.1 | 410,356x | 1,075.7 | 20.9 |
| 1971 | 29,708 | 160.2 | 3.4 | 17,470 | 53.3 | 1.2 | 422,594 | 1,182.6 | 23.1 |
| 1972 | 32,147 | 190.7 | 3.9x | 19,902 | 69.5 | 1.6 | 434,839 | 1,303.9 | 25.3 |
| 1973 | 30,585 | 228.5 | 3.8 | 19,172 | 73.9 | 1.7 | 446,252 | 1,458.5 | 27.5 |
The average sum assured per policy was $4,470 in 1969, $4,814 in 1970, $5,392 in 1971, $5,933 in 1972, and $7,471 in 1973. In the total sum assured at the end of the year, accrued reversionary bonuses amounting to $125,772,358 have been added. Values of immediate and deferred annuities in force at the end of latest 5 years were as follows: $10,299,000, $11,413,000, $12,678,000, $13,357,000, and $13,531,000. New business in annuities in 1973 totalled $2,650,000 and discontinuances $2,477,000.
The office's total assets at 31 December and their class of investment are shown in the following table.
| Class of Investment | Amount | Percentages | ||||
|---|---|---|---|---|---|---|
| 1971 | 1972 | 1973 | 1971 | 1972 | 1973 | |
| *Mainly premiums and interest due and accrued interest. | ||||||
| $(thousand) | percent | |||||
| Mortgages on freehold property | 105,686 | 113,684 | 125,515 | 39.31 | 38.70 | 38.84 |
| Loans on policies | 17,012 | 18,463 | 19,415 | 6.33 | 6.28 | 6.01 |
| Government securities | 57,026 | 63,606 | 68,661 | 21.21 | 21.65 | 21.25 |
| Local authority securities | 26,554 | 26,133 | 27,441 | 9.88 | 8.90 | 8.49 |
| Real estate | 21,477 | 26,124 | 31,327 | 7.99 | 8.90 | 9.69 |
| Company shares and debentures | 35,196 | 39,018 | 43,083 | 13.09 | 13.28 | 13.33 |
| Miscellaneous assets* | 5,891 | 6,738 | 7,736 | 2.19 | 2.29 | 2.39 |
| Totals | 268,842 | 293,767 | 323,178 | 100.00 | 100.00 | 100.00 |
At 31 December 1973 assurances, annuity, and endowment funds, apart from special reserves of $3.9 million, amounted to $315.5 million.
FIRE, ACCIDENT, AND OTHER INSURANCE—The State Insurance Office is empowered to carry on any class of insurance business other than life assurance. As the State Fire Office it commenced business in 1905. In 1925 accident business was transferred to it from the Government Life Insurance Office and since 1947 it has undertaken marine insurance.
Its growth is indicated in the following table.
| Year | Net Premiums | Claims | Working Expenses |
|---|---|---|---|
| $(000) | $(000) | $(000) | |
| 1923 | 357 | 137 | 93 |
| 1933 | 502 | 195 | 141 |
| 1943 | 1,123 | 438 | 185 |
| 1953 | 3,118 | 1,652 | 916 |
| 1963 | 8,632 | 5,217 | 1,801 |
| 1969 | 16,360 | 11,287 | 2,829 |
| 1970 | 19,777 | 15,537 | 3,692 |
| 1971 | 25,758 | 20,219 | 4,193 |
| 1972 | 30,291 | 20,615 | 4,479 |
| 1973 | 34,405 | 24,263 | 5,092 |
The main classes of accident insurance transacted are motor vehicle (comprehensive and third-party risk), employers' liability, personal accident, public risk, and plate glass.
Fire insurance is more accurately described as property insurance, since the houseowners' and householders' policies, which have largely superseded fire insurance policies for covering dwellings and their contents, provide coverage not only against fire but also against a wide range of other possible causes of damage. Commercial property owners, too, are increasingly extending their fire policies to cover other dangers.
The total assets of the State Insurance Office at 31 December 1973 amounted to $58.4 million which included $40.3 million in the form of investments ($8.6 million in Government securities, $13.6 million in local body securities), and $10.5 million in fixed assets, mainly land, buildings, and plant. Of the total liabilities, reserves amounted to $23.1 million, unexpired risks to $14.0 million, and unadjusted claims to $6.4 million.
EARTHQUAKE AND WAR DAMAGE INSURANCE—The Earthquake and War Damage Act 1944 is administered by a commission. All property insured against fire is deemed to be insured to the extent of the indemnity value against earthquake and war damage. Premiums at the rate of 5c for each $100 of insurance cover are collected by the insurance companies and paid into the Earthquake and War Damage Fund (less commission of 2 1/2 percent).
Advances may be made from the Consolidated Revenue Account if at any time the amount in the Earthquake and War Damage Fund is not sufficient to meet the claims thereon.
“Earthquake damage" is defined as damage occurring as the direct result of earthquake or of fire occasioned by or in consequence of earthquake. In 1950 an extension of the scheme was instituted to provide some measure of protection to the insured against storm and flood of an abnormal or widespread nature. In 1954 the definition of disaster damage was extended to include volcanic eruption, and authority was given to the commission to accept insurance against landslip. This latter type of cover does not apply automatically. Finance is provided by crediting 10 percent of the premiums compulsorily collected under the Act to a special Disaster Fund.
Since 1 June 1967 the commission has had power to underwrite the geothermal activity insurance on a voluntary basis.
The following is a comparative statement for the last 6 years of the financial operations under the Earthquake and War Damage Act, together with a statement showing the position from the inception of the fund to 31 March 1973.
| Item | 1968-69 | 1969-70 | 1970-71 | 1971-72 | 1972-73 | 1973-74 | 19 Dec 1941 to 31 Mar 1974 |
|---|---|---|---|---|---|---|---|
*At end of each period. †From commencement in November 1949. | |||||||
| Income— | $(thousand) | ||||||
| Premiums— | |||||||
| Earthquake and war damage | 6,172 | 6,411 | 7,311 | 7,901 | 9,623 | 10,751 | 119,574 |
| Storm and flood | 684 | 706 | 810 | 882 | 1,069 | 1,195 | 11,836 |
| Interest | 5,025 | 5,807 | 6,725 | 7,672 | 8,780 | 9,853 | 76,932 |
| Totals | 11,885 | 12,923 | 14,846 | 16,456 | 19,472 | 21,799 | 208,341 |
| Outgo— | |||||||
| Claims— | |||||||
| Earthquake and war damage | 2,573 | 120 | 35 | 211 | 273 | 92 | 4,328 |
| Storm and flood | 2,166 | 172 | 90 | 563 | 436 | 577 | 9,071 |
| Salaries and expenses of management | 79 | 62x | 72x | 63x | 63 | 65 | 1,566 |
| Discount to insurance offices | 168 | 174 | 204 | 215 | 269 | 298 | 3,058 |
| Totals | 4,986 | 529x | 1,202x | 1,052x | 1,040 | 1,032 | 18,023 |
| Surplus | 6,899 | 12,395 | 13,645 | 15,404x | 18,432 | 20,767 | 190,317 |
| Earthquake and War Damage Fund* | 109,450 | 121,211 | 134,929 | 150,306 | 164,886 | 181,969 | 181,969 |
| Disaster Fund† | 1,132 | 1,663 | 1,590 | 1,950 | 2,600 | 3,249 | 3,249 |
During the year ended 31 March 1974, 567 earthquake claims were lodged compared with 3,700 for the previous year.
A total of 1,193 claims under the storm and disaster damage provisions were made during the year ended 31 March 1974 compared with 1,816 in the previous year.
LABOUR FORCE—The size of the labour force as a percentage of population is affected by various factors, notably by changes in the birth rate causing variations in the percentage of the population in working-age groups, by extension of school attendance, and by the changing proportion of married women seeking work. The fluctuations in the growth of the labour force follow those of births some 15 years earlier. Net migration flow has only a minor effect on the work force (except in times of recession) and the effect varies according to the age structure of the migrants and their dependency ratio. There is a relatively greater importance of the 15-25 year age group in the labour force as the majority of females are actively engaged at this period of their lives before taking on home-making responsibilities.
The New Zealand economy has normally enabled a policy of full employment to operate. The labour force therefore embraces almost all those seeking work.
The percentage of the male population in active employment was 57 percent in 1956, 55.3 percent in 1961, 55.5 percent in 1966, and 54.9 percent in 1971. Females actively engaged rose from 18 percent in 1956 to 18.7 percent in 1961, to 21 percent in 1966, and 23.3 percent in 1971. Married women working (as a percentage of all married women) rose from 12.9 percent in 1956 to 16 percent in 1961, to 20 percent in 1966, and 26.1 percent in 1971. Increasing numbers of married women have entered the labour force after their family responsibilities have lightened.
The estimated annual growth of the labour force is shown in the following table.
| As at April | Males | Females | Total | Labour Force as a Percentage of Total Population | ||||
|---|---|---|---|---|---|---|---|---|
| Number | Annual Increase | Number | Annual Increase | Number | Annual Increase | |||
| *Decrease. | ||||||||
| (000) | percent | (000) | percent | (000) | percent | percent | ||
| 1964 | 709.8 | 2.3 | 248.1 | 5.0 | 957.9 | 3.0 | 37.1 | |
| 1965 | 728.9 | 2.7 | 262.5 | 5.8 | 991.4 | 3.5 | 37.7 | |
| 1966 | 745.6 | 2.3 | 280.4 | 6.8 | 1,026.0 | 3.5 | 38.3 | |
| 1967 | 759.4 | 1.9 | 293.1 | 4.5 | 1,052.5 | 2.6 | 38.6 | |
| 1968 | 756.2 | -0.4* | 287.2 | -2.0* | 1,043.4 | -0.9* | 37.9 | |
| 1969 | 764.7 | 1.1 | 296.5 | 3.2 | 1,061.2 | 1.7 | 38.2 | |
| 1970 | 779.2 | 1.9 | 311.5 | 5.1 | 1,090.7 | 2.8 | 38.7 | |
| 1971 | 789.8 | 1.4 | 322.2 | 3.4 | 1,112.0 | 1.9 | 38.9 | |
| 1972 | 796.9 | 0.9 | 326.0 | 1.2 | 1,122.9 | 1.0 | 38.9 | |
| 1973 | 814.7 | 2.2 | 335.5 | 2.9 | 1,150.2 | 2.4 | 38.7 | |
| 1974 | 834.2 | 2.5 | 357.1 | 6.4 | 1,191.3 | 3.6 | 39.2 | |
The average annual percentage increase for males was 1.8 percent as compared with 4.2 percent for females and 2.5 percent for the total labour force over those 11 years.
The following table shows the male and female members of the labour force by age groups at five censuses.
| Age Group (Years) | 1951 | 1956 | 1961 | 1966 | 1971 | |
|---|---|---|---|---|---|---|
| *Includes Not Specified ages at 1951 and 1956 censuses. | ||||||
| Under 20 | (m) | 47,849 | 53,848 | 62,396 | 78,669 | 75,973 |
| (f) | 41,044 | 48,889 | 58,224 | 74,358 | 72,598 | |
| 20-24 | (m) | 68,774 | 66,407 | 75,682 | 91,155 | 108,686 |
| (f) | 36,381 | 33,634 | 38,884 | 49,321 | 63,367 | |
| 25-34 | (m) | 138,261 | 155,628 | 153,128 | 159,117 | 175,557 |
| (f) | 31,866 | 32,658 | 30,586 | 36,875 | 51,687 | |
| 35-44 | (m) | 131,371 | 138,820 | 149,691 | 164,492 | 158,185 |
| (f) | 27,242 | 32,558 | 38,317 | 46,545 | 57,206 | |
| 45-64 | (m) | 159,639 | 184,497 | 209,456 | 229,693 | 244,476 |
| (f) | 31,740 | 42,346 | 54,938 | 68,608 | 84,098 | |
| 65 and over | (m) | 22,461 | 22,935 | 20,153 | 22,469 | 22,092 |
| (f) | 3,074 | 3,793 | 3,908 | 4,737 | 4,910 | |
| Totals* | (m) | 568,963 | 622,758 | 670,506 | 745,595 | 784,969 |
| (f) | 171,533 | 194,094 | 224,857 | 280,444 | 333,866 | |
Though year-to-year fluctuations were considerable during the 10 years to 1967 the average migration gain to the population was about 10,000 a year, representing approximately one-fifth of the annual increase in the population as a whole. As immigrants as a body have a higher proportion in the working-age group than the normal cross-section of population, a period of high net immigration adds rapidly to the percentage of the population in the labour force and is particularly valuable where vacancies requiring particular skills are filled by migrants. In 1968 and 1969 there was a migration loss with a loss of some workers to Australia and a consequent slowing down of the labour force growth. From 1970 migration gain has averaged about 14,000 a year.
EMPLOYMENT STRUCTURE—The growth of population has been accompanied by a changing emphasis in employment. In the nineteenth century the major activities of farming, mining, and lumbering gave rise to manufacturing industries and to commercial and professional occupations. In 1881, 11.2 percent of the total population was engaged in agriculture, 13.1 percent in industries, which included mining, and 6.6 percent in commercial and professional occupations. By 1901 the proportion in tertiary activities and farming had increased while that in secondary industries had remained constant, and mining had declined relatively in importance. The proportions were then 14.5 percent in farming, 13.1 percent in industry, and 11 percent in services.
The more recent rapid development of larger urban centres has been associated with a trend away from primary into secondary industries, a trend which developed noticeably after the depression of the 1930s and which was given marked impetus by the war. The broad changes in the economy are indicated by the following table. Decreases in the proportions engaged in primary production are typical of advanced economies, although it has to be noted that the farming community makes greater use of the services sector in the development of farm productivity.
| Group | 1961 Census | 1966 Census | 1971 Census | |||
|---|---|---|---|---|---|---|
| Persons Employed | Percentage of Labour Force | Persons Employed | Percentage of Labour Force | Persons Employed | Percentage of Labour Force | |
| Primary production | 136,098 | 15.2 | 140,936 | 13.7 | 134,159 | 12.0 |
| Secondary industry | 321,241 | 35.8 | 381,589 | 37.2 | 388,071 | 34.7 |
| Services | 438,024 | 49.0 | 503,514 | 49.1 | 596,605 | 53.3 |
From April 1971, estimates of the industrial distribution of the total labour force have been made according to the revised New Zealand Standard Industrial Classification.
As a result, comparisons with the earlier estimates for the industrial groups shown in previous issues of the Yearbook are not possible. Only the figures for “Total in industry” and “Total labour force” are comparable with previous estimates.
The estimates for April 1973 and April 1974 are as follows:
| Industrial Group N.Z.S.I.C. | April 1973 | April 1974 | ||||
|---|---|---|---|---|---|---|
| Males | Females | Total | Males | Females | Total | |
| (000) | (000) | |||||
| Agriculture, hunting, forestry and fishing | 121.0 | 16.6 | 137.6 | 125.0 | 15.8 | 140.8 |
| Mining and quarrying | 4.2 | 0.1 | 4.3 | 4.3 | 0.1 | 4.4 |
| Manufacturing industry— | ||||||
| Food, beverages, and tobacco | 58.0 | 12.5 | 70.5 | 56.6 | 12.8 | 69.4 |
| Textiles, wearing apparel and leather | 17.7 | 31.0 | 48.7 | 17.8 | 32.4 | 50.2 |
| Wood and wood products | 20.7 | 1.9 | 22.6 | 21.9 | 2.4 | 24.3 |
| Paper and paper products, printing and publishing | 20.5 | 7.4 | 27.9 | 21.1 | 7.7 | 28.8 |
| Chemicals, petroleum, coal, rubber, and plastics | 15.4 | 5.8 | 21.2 | 16.0 | 6.4 | 22.4 |
| Non-metallic mineral products | 10.5 | 1.1 | 11.6 | 11.0 | 1.5 | 12.5 |
| Basic metals, metal products, machinery and equipment, and other manufacturing industries | 70.7 | 13.4 | 84.1 | 74.3 | 15.9 | 90.2 |
| Totals, manufacturing industries | 213.5 | 73.1 | 286.6 | 218.7 | 79.1 | 297.8 |
| Electricity, gas, and water | 13.2 | 1.3 | 14.5 | 13.2 | 1.3 | 14.5 |
| Construction | 86.1 | 2.7 | 88.8 | 89.8 | 3.2 | 93.0 |
| Wholesale and retail trade | 111.7 | 78.4 | 190.1 | 112.5 | 83.0 | 195.5 |
| Transport, storage, and communication | 86.6 | 17.9 | 104.5 | 88.0 | 18.9 | 106.9 |
| Finance, insurance, real estate, etc. | 41.0 | 30.2 | 71.2 | 42.3 | 32.4 | 74.7 |
| Community, social and personal services— | ||||||
| Public administration, etc. | 33.1 | 12.4 | 45.5 | 34.5 | 13.5 | 48.0 |
| Sanitary and similar services | 4.9 | 2.1 | 7.0 | 4.9 | 2.3 | 7.2 |
| Social and related community services | 47.4 | 83.0 | 130.4 | 49.9 | 89.6 | 139.5 |
| Recreational services | 6.6 | 3.6 | 10.2 | 6.9 | 3.8 | 10.7 |
| Personal and household services | 33.2 | 12.6 | 45.8 | 33.6 | 13.1 | 46.7 |
| Totals, community and personal services | 125.2 | 113.7 | 238.9 | 129.8 | 122.3 | 252.1 |
| Total in industry | 802.5 | 334.0 | 1,136.5 | 823.6 | 356.1 | 1,179.7 |
| Armed forces in New Zealand | 10.6 | 0.6 | 11.2 | 10.2 | 0.7 | 10.9 |
| Registered unemployed | 1.6 | 0.9 | 2.5 | 0.4 | 0.3 | 0.7 |
| Total labour force | 814.7 | 335.5 | 1,150.2 | 834.2 | 357.1 | 1,191.3 |
LABOUR FORCE PROJECTIONS—A new series of labour force projections has been prepared by the Department of Statistics for the period up to 2001. These projections, which are fully integrated with the complementary population projections are based on similar assumptions in respect of fertility, mortality, and net immigration. Labour force participation for males is projected to decline marginally in the youngest age groups, increase marginally in the middle age groups and decline for the 65 years and over age group. Female labour force participation is projected to decline marginally for the 15-19-year age groups, and increase steadily for the 20-64-year age group.
| PROJECTED TOTAL NEW ZEALAND LABOUR FORCE (SEX SPECIFIC) 1971-2001 | |||||
|---|---|---|---|---|---|
| As At 31 March | Projected Total Labour Force* Assuming Age-specific Labour Force Participation Rates Change in Accordance with the “Medium” Participation Assumption† and Net Annual Immigration of: | ||||
| 5,000 Total | 10,000 Total | 15.000 | |||
| Males | Females | Total | |||
*These projections have as a base the estimated labour force at 31 March 1971. The mortality, fertility, and net immigration assumptions on which these projections are based are the same as those used for the corresponding population projections (see footnotes to table in section 3). †The projections based on “Medium” labour force participation assume the continuation of 1956-71 general trends in male, female age-specific labour force participation rates (whether increasing or decreasing) for five years (until 1976), with a subsequent continuation of these general trends, somewhat flattened until 1986. Because of the uncertainty in projecting labour force participation experience for longer than 15-20 years ahead, age-specific labour force participation rates which make up the “Medium” participation assumption have been kept constant from 1987 until 200, at the levels projected for 1986. | |||||
| (000) | |||||
| 1971 (base) | 1,118 | 1,118 | 784 | 334 | 1,118 |
| "Constant" Fertility Assumption* | |||||
| 1976 | 1,230 | 1,242 | 886 | 369 | 1,255 |
| 1981 | 1,361 | 1,386 | 982 | 430 | 1,412 |
| 1986 | 1,476 | 1,517 | 1,079 | 478 | 1,557 |
| 1991 | 1,612 | 1,668 | 1,183 | 541 | 1,724 |
| 1996 | 1,773 | 1,845 | 1,310 | 607 | 1,918 |
| 2,001 | 1,956 | 2,046 | 1,457 | 678 | 2,135 |
| "High" Fertility Assumption* | |||||
| 1976 | 1,230 | 1,242 | 886 | 369 | 1,255 |
| 1981 | 1,361 | 1,386 | 982 | 430 | 1,412 |
| 1986 | 1,476 | 1,517 | 1,079 | 478 | 1,557 |
| 1991 | 1,612 | 1,668 | 1,183 | 541 | 1,724 |
| 1996 | 1,776 | 1,848 | 1,312 | 609 | 1,921 |
| 2,001 | 1,966 | 2,056 | 1,462 | 683 | 2,145 |
| "Medium" Fertility Assumption* | |||||
| 1976 | 1,230 | 1,242 | 886 | 369 | 1,255 |
| 1981 | 1,361 | 1,386 | 982 | 430 | 1,412 |
| 1986 | 1,476 | 1,517 | 1,079 | 478 | 1,557 |
| 1991 | 1,604 | 1,661 | 1,179 | 537 | 1,717 |
| 1996 | 1,745 | 1,817 | 1,295 | 594 | 1,889 |
| 2,001 | 1,895 | 1,984 | 1,420 | 652 | 2,072 |
| "Low" Fertility Assumption* | |||||
| 1976 | 1,230 | 1,242 | 886 | 369 | 1,255 |
| 1981 | 1,361 | 1,386 | 982 | 430 | 1,412 |
| 1986 | 1,476 | 1,517 | 1,079 | 478 | 1,557 |
| 1991 | 1,596 | 1,653 | 1,175 | 533 | 1,709 |
| 1996 | 1,712 | 1,783 | 1,277 | 578 | 1,855 |
| 2,001 | 1,822 | 1,909 | 1,376 | 620 | 1,996 |
EMPLOYMENT SITUATION—In the post-war years up to 1967 the labour situation was characterised by overfull employment and a high number of vacancies in industry. In 1967, following deflationary measures, there was a sharp rise in the number of unemployed persons. By the middle of the year when seasonal workers found difficulty in obtaining off-season jobs the number of unemployed rose to over 6,000, or about 0.6 percent of the labour force. Unemployment became stabilised at about this level until the autumn of 1968, when it rose further to 8,500 and remained about this figure during the following winter. From a peak of 8,560 in July 1968 the number of unemployed fell steadily, except for occasional monthly increases, to under 1,200 in March 1971. The number of unemployed rose to average 5,684 for 1972 but for 1973 dropped to an average of 2,321. Vacancies, which moved from a general level of about 8,000 to a level between 2,000 and 4,000 during 1967 and 1968, increased to approximately 6,000 in late 1969, and averaged 2,648 for 1972, 3,538 for 1973, and 4,556 for 1974. The monthly average of unemployed during 1974 was 955.
PROMOTION OF EMPLOYMENT—The functions and duties of the Department of Labour are set out in the Labour Department Act 1954. On the employment side the duties include: the provision of a complete employment service for the purposes of placing workers in employment, assisting employers to provide employment, helping persons to find better or more suitable employment, and aiding persons who require occupational readjustment or training; the collection and publication of information relating to employment and unemployment; the making of surveys and forecasts of the classes of employment required or available; the promotion of voluntary placing of suitable persons in such employment; and in general the promotion and maintenance of full employment. In particular the department may operate hostels for workers, provide a home-aid service, and arrange for the selection, transport, and accommodation of immigrants.
Accordingly the department seeks to maintain a policy of full employment at the highest productive level, operates 21 district employment offices, provides (through a home-aid service) domestic help for families in urgent circumstances, and administers employment schemes, subsidised where necessary, for those unfit to compete in the ordinary labour market.
The nine hostels operated by or for the department at 31 March 1975—comprising an industrial workers' hostel, immigration hostels, Public Service hostels, miners' hostel, and Maori youth hostel—provided accommodation for 1,234 workers.
The department's employment service is being developed in order to provide the co-ordinating point for employment and related services for the work force. A new development has taken place in Auckland where, since June 1972, additional staffing resources and better facilities (including open-planning layout replacing the “barrier” of the traditional public counter) have been provided. These have helped to achieve a situation in which for the last few months of 1973 there were no registered unemployed in a labour market of some 300,000 persons. The work and functions of the Auckland Employment Centre are reviewed regularly by an employment advisory committee representing interested groups, including representatives of trade unions, employers' organisations, and the special interests of the Polynesian people, women, and the disabled. The Departments of Education, Health, Labour, Maori Affairs, and Social Welfare also have members on the committee.
The experience of the Auckland Employment Centre has demonstrated that, given better staffing and facilities, a more positive attitude can be secured from those seeking employment and that employers will co-operate in notifying vacancies on a more regular basis.
Four sub-committees of the Auckland Employment Advisory Committee have undertaken valuable work corresponding to the special employment problems faced by the disabled, Polynesians, young persons, and women returning to the work force. The Disabled Persons Subcommittee brought down a report with practical recommendations on the co-ordination of services leading to a more rational procedure for the placement of the disabled. Its recommendations were endorsed by the National Civilian Rehabilitation Committee late in 1973 when steps were taken to implement the subcommittee's proposals. Another development with which the new Auckland Employment Service has been connected was a pilot survey of women who wish to return to the work force in a full-time capacity.
Rotorua has become the second of the Department's upgraded employment districts.
MANPOWER PLANNING—Changes in the structure of industry and in technology are occurring at an ever-increasing rate. This fact has led to a growing emphasis on forecasting manpower supply on the one hand and likely manpower requirements on the other, with a view to equating the two by means of relevant manpower policies. The forecasts are based on certain assumptions concerning the growth of population, net migration and labour force participation rates on the supply side, and on production plans and productivity rates on the demand side. As the bases of the forecasts are volatile, the latter need to be revised at frequent intervals. The forecasting process is therefore never completed, but is an on-going task which must take account of the dynamic forces operating in the labour market.
VOCATIONAL TRAINING—A cornerstone of improved productivity growth rates is education in the field of vocational training, including managerial competence. The organisation and orderly development of training on a national basis is the responsibility of the Vocational Training Council.
The council has the following membership, appointed jointly by the Ministers of Education and Labour: a chairman; the Director-General of Education; the Secretary of Labour; two members nominated by the N.Z. Employers' Federation; two members nominated by the N.Z. Federation of Labour; one member nominated by the N.Z. Manufacturers' Federation; one member nominated by the Technical Institutes Association; one member nominated by the Technicians Certification Authority of New Zealand; and not more than five other members—(two appointments have so far been made under this provision).
In addition, the council has three associate (non-voting) members: an appointee of the State Services Co-ordinating Committee; an appointee of the Combined State Services Organisations; and the Chairman of the University Grants Committee.
Under the Vocational Training Council Act 1968 the council's functions are prescribed as advisory to Government, State departments, industry, commerce, agriculture, social welfare, and other interested organisations. Recommendations may relate to improved training, the development of new or established facilities, the co-ordination of training schemes, levies or other methods for the financing or encouragement of training, the award of scholarships, the fostering of research, the carrying out of inquiries and investigations in any field of training, and the maintenance of an adequate information service.
However, the activities of the council considerably exceed that of an advisory or recommendatory role. Council has been, and still is, deeply involved in the promotion of fully integrated and meaningful training in the majority of industries and local authorities.
The Vocational Training Council, encourages a systematised approach to training at all levels in all sectors of the economy, linked to proper manpower development policies with in-built tangible recognition for proven efficiency. There is emphasis in industry self-help.
Representative voluntary industrial and commercial training boards have been established for 28 industries. Boards include members from employer, employee, educational, and other specialist groups. A major incentive has been the Government grant of $15,000 a year to encourage the appointment of executive training officers to work for industry training boards. There are now 33 of these officers. Industry training boards, among other things, examine existing training and assess the need for revised or new schemes. This involves both the identification of the level of ability of the person required (machine operator, graduate, tradesman, supervisor, etc.) and the numbers required at each level.
In addition, the council has concerned itself with “back-up” research and investigational studies, for example, apprenticeship and trade training, women and employment, technician training, management and supervisory training, and Polynesians in the work force.
Trade Training and Apprenticeships—Perhaps the major changes with the Vocational Training Council and the industrial training boards have been associated, is in the field of apprenticeships and related trade training. “Time served” principles are being more closely integrated with “performance level reached” philosophy. Continuity and adaptability to change becomes the central objective, whilst refresher and updating training becomes the norm on a lifelong basis.
The Vocational Training Council's major task has been to change attitudes and draw attention to changing conditions—not only technological change in the shape of volume-type industries but important social changes.
At present, eight industrial training boards, in collaboration where relevant with New Zealand Apprenticeship committees, the Trades Certification Board, and educational authorities are deeply involved in a new approach to trade training.
In 1974 Government approved a new policy for trade training together with an incentive scheme of assistance with the wages of apprentices during their period of attendance at block courses. It is now possible for trades to have up to 21 weeks of block course instruction. Two trades have already availed themselves of these changes and carpenters and joiners and fitter-turners moved on to the new and lengthened training schemes in 1975. Negotiations with other trades, in particular motor and electrical, indicate that modifications and extension in these trades will probably commence in 1976.
APPRENTICESHIPS—Under the Apprentices Act 1948 orders governing apprenticeships are made by the Industrial Court, which consists of a judge, a workers' member, and an employers' member. Orders are made on the recommendations of New Zealand Apprenticeship Committees, which consist of four representatives of employers, four representatives of workers, a person conversant with technical education, and the Commissioner of Apprenticeship, who is ex officio chairman of each committee. The New Zealand committees are in effect policy-making committees. There are 35 committees, which normally meet once or twice a year.
Day-to-day administration of the Apprentices Act and the apprenticeship orders is carried on by local apprenticeship committees, of which there are 242. They consist of three representatives of employers, three representatives of workers, a person conversant with technical education, and the District Commissioner of Apprenticeship, who is ex officio chairman of all committees for the district for which he is appointed. District Commissioners delegate chairmanship to other officers of the Department of Labour when necessary.
In the majority of industries there are provisions in apprenticeship orders for the attendance of apprentices at technical classes, both during working hours and in the evening. In the 40-hour week four hours are spent at day classes, with usually equivalent amount of time at evening classes. In some industries technical training is concentrated into an annual course of three or four weeks' duration. The classes are operated by Technical Institutes and Secondary Schools.
The general policy regarding apprentice education is determined by the Department of Education in co-operation with New Zealand Apprenticeship Committees. That department itself operates a Technical Correspondence Institute, which provides courses of instruction for those apprentices who live too far from any school to allow them to attend evening classes.
A statutory body, the New Zealand Trades Certification Board, conducts examinations for apprentices (see Section 7A, Education). The examinations are voluntary and, except in the electrical trade and in plumbing, no examination test is required for the practice of a trade. There is very close liaison between New Zealand Apprenticeship Committees and the board, the Commissioner of Apprenticeships being a member of the board.
During the five years to March 1974 a total of 51,343 new apprenticeship contracts were registered, 30,193 were completed and 14,698 lapsed or were cancelled; in the building trades there were 20,779 new contracts over the period and 10,716 completions and 4,556 lapses.
The number of apprenticeship contracts registered during the year, completed during the year, and in force at the end of the year, are indicated in the following table.
| Trade | Apprenticeship Contracts | |||||
|---|---|---|---|---|---|---|
| Registered During Year Ended 31 March | Completed During Year Ended 31 March | In Force at 31 March | ||||
| 1973 | 1974 | 1973 | 1974 | 1973 | 1974 | |
| Aircraft | 71 | 130 | 65 | 47 | 329 | 406 |
| Baking | 106 | 82 | 49 | 35 | 263 | 266 |
| Boilermaking | 76 | 85 | 49 | 44 | 239 | 251 |
| Bricklaying | 81 | 117 | 31 | 43 | 240 | 287 |
| Carpentry | 1,872 | 2,667 | 811 | 969 | 5,291 | 6,538 |
| Clothing | 66 | 71 | 40 | 45 | 233 | 213 |
| Coachbuilding | 435 | 526 | 242 | 287 | 1,889 | 1,920 |
| Dentistry | 10 | 3 | 4 | 4 | 23 | 19 |
| Electrical | 599 | 701 | 358 | 476 | 2,107 | 2,187 |
| Engineering | 685 | 814 | 493 | 524 | 2,711 | 2.809 |
| Footwear repair and making | 12 | 1 | 1 | 1 | 13 | 10 |
| Footwear manufacturing | 61 | 42 | 24 | 15 | 136 | 138 |
| Furniture | 360 | 422 | 184 | 158 | 949 | 1,074 |
| Hairdressing | 606 | 545 | 297 | 270 | 1,409 | 1,399 |
| Heating and ventilation | 39 | 30 | 10 | 18 | 120 | 120 |
| Horticulture | 64 | 78 | 55 | 37 | 198 | 207 |
| Jewellery | 43 | 43 | 19 | 25 | 189 | 188 |
| Masonry | 2 | 3 | 1 | — | 4 | 6 |
| Motor trades | 1,469 | 1,689 | 938 | 1,109 | 5,525 | 5,712 |
| Moulding | 16 | 17 | 11 | 7 | 59 | 61 |
| Painting | 428 | 409 | 182 | 167 | 1,030 | 1,122 |
| Photo-engraving | 29 | 50 | 23 | 31 | 180 | 158 |
| Piano repairing and tuning | 2 | 2 | 1 | 4 | 11 | 8 |
| Plastering | 78 | 57 | 37 | 37 | 189 | 181 |
| Plumbing | 377 | 416 | 160 | 164 | 1,162 | 1,260 |
| Printing | 230 | 277 | 188 | 211 | 1,121 | 1,080 |
| Radio | 112 | 135 | 67 | 62 | 364 | 406 |
| Refrigeration engineering | 40 | 38 | 30 | 29 | 163 | 165 |
| Retail meat industry | 328 | 305 | 184 | 212 | 940 | 918 |
| Saddlery, leather and canvas goods | 33 | 28 | 11 | 18 | 69 | 72 |
| Sheet-metal working | 124 | 107 | 65 | 67 | 382 | 383 |
| Shipbuilding | 41 | 47 | 15 | 16 | 137 | 146 |
| Timber industry | 42 | 48 | 29 | 20 | 88 | 105 |
| Others | 59 | 66 | 30 | 22 | 149 | 167 |
| Totals | 8,596 | 10,052 | 4,704 | 5,174 | 27,912 | 29,982 |
TRAINING COURSES FOR MAORIS AND POLYNESIANS FROM THE PACIFIC—Trade training is one approach that has been adopted to broaden employment opportunities for Maori and Polynesian youths.
The trade-training schemes have the approval of the educational and apprenticeship authorities. Time spent on a course is credited towards the normal apprenticeship, which is completed with employers in the usual way. The schemes are run in conjunction with the technical institutes at Auckland, Hamilton, Petone, and Christchurch. Special tuition is also given in other subjects to help the boys adapt themselves to urban living.
Entry into the schemes is generally restricted to boys from country areas where apprenticeships are not normally available. Boys taken into the schemes, and their parents, enter into a training agreement with the Maori Affairs Department, whereby the boys are required to live at approved hostels, regularly attend evening technical classes, and to sit the appropriate trade examinations. The trainees are paid a weekly training allowance.
Training is provided in 11 trades—carpentry (all four centres), motor mechanics (Auckland, Hamilton, and Christchurch), plumbing, electrical wiring (Auckland and Hamilton), diesel mechanics and sheetmetal work (Auckland), fitting and turning (Hamilton and Christchurch), plastering (Petone), and painting, panelbeating, and bricklaying (Christchurch), with a total intake of 288 boys each year. The training courses last for 1 year, except that carpentry is a 2-year course and includes 1 year on practical house building works for the department. From the time of the pilot scheme in 1959 up to 31 March 1974 2,720 Maori youths had been taken into the schemes, and 1,186 of them had completed their apprenticeships with private employers and were qualified tradesmen.
The increase in the number of Maori apprentices in recent years is illustrated by the following table.
| At 31 March | Registered Maori Apprentices | Percentage of Total Registered Apprentices |
|---|---|---|
| 1964 | 770 | 3.3 |
| 1965 | 852 | 3.6 |
| 1966 | 981 | 3.9 |
| 1967 | 1,072 | 4.2 |
| 1968 | 1,031 | 4.3 |
| 1969 | 1,191 | 4.8 |
| 1970 | 1,302 | 5.1 |
| 1971 | 1,375 | 5.3 |
| 1972 | 1,489 | 5.6 |
| 1973 | 1,471 | 5.3 |
| 1974 | 1,513 | 5.1 |
Farm Training—Special arrangements have been made for 8 Maori boys to enter Telford Farm Training Institute each year. This is a comprehensive one-year course covering important theoretical and practical aspects of farming and farm management. The department meets full cost of board and school fees at the Institute.
Shorthand Typists—Each year up to 12 Maori girls from rural districts are trained as shorthand typists. Their mornings are spent at a local commercial college and afternoons in practical instruction at the Maori Affairs Department under the supervision of the head typist. On completing their training the girls are expected to take up employment in Government departments.
City Pre-employment Courses—Special pre-employment courses to help Maori boys and girls from country areas coming to cities for work are conducted early each year by the Maori Affairs Department in conjunction with the Wellington Polytechnic and the Auckland, Christchurch, and Waikato Institutes. The Education, Health, and Police Departments and local civic authorities also co-operate in the schemes. The courses, which last about four weeks, are specially designed to help with initial adjustments to city life and with the selection of suitable employment. At the end of the course the students take up suitable employment in the city. Accommodation is provided at hostels. The present annual intake of students into the course is: Wellington, 60 boys—75 girls; Auckland, 30 boys—20 girls; Hamilton, 15 girls; and Christchurch, 15 girls.
STATISTICS OF EMPLOYMENT: Half-yearly Surveys—The Department of Labour carries out at half-yearly intervals a general survey of employment in New Zealand. These surveys are conducted by means of inquiries sent out to employers of labour, the results being published in the Labour and Employment Gazette. Returns are required from all establishments in which at least two persons (including working proprietors) are engaged. Government and local authority employment is included. Employers in farming, hunting, trapping, fishing, waterfront work, seagoing work, private domestic service, and armed forces are not required to submit half-yearly returns. The following tables are based on these surveys. (A survey of farm employment is included in Section 14, Farming.)
A summary of employment is given in the following table.
| Date of Survey | Full-time Employees and Working Proprietors | Part-time Workers | Half-yearly Percentage Rate of Labour Turnover* | |||||
|---|---|---|---|---|---|---|---|---|
| Males | Females | Total | Males | Females | Total | Males | Females | |
| *The relationship between the number of terminations over the previous half-year and the average number of employees during the same period. | ||||||||
| April— | percent | percent | ||||||
| 1964 | 507,174 | 200,596 | 707,770 | 18,481 | 30,800 | 49,281 | 20 | 32 |
| 1965 | 526,455 | 211,599 | 738,054 | 20,386 | 34,669 | 55,055 | 21 | 33 |
| 1966 | 542,943 | 223,955 | 766,898 | 23,813 | 39,814 | 63,627 | 23 | 36 |
| 1967 | 554,644 | 233,899 | 788,543 | 24,372 | 44,453 | 68,825 | 21 | 34 |
| 1968 | 547,000 | 227,045 | 774,045 | 23,449 | 43,512 | 66,961 | 16 | 28 |
| 1969 | 558,695 | 235,077 | 793,772 | 25,074 | 48,221 | 73,295 | 20 | 30 |
| 1970 | 572,052 | 247,353 | 819,405 | 27,643 | 57,455 | 85,098 | 23 | 35 |
| 1971 | 584,793 | 255,687 | 840,480 | 29,110 | 66,000 | 95,110 | 24 | 36 |
| 1972 | 589,740 | 257,792 | 847,532 | 28,545 | 68,322 | 96,867 | 21 | 33 |
| 1973 | 606,567 | 265,756 | 872,323 | 30,182 | 74,898 | 105,080 | 23 | 33 |
| 1974 | 622,111 | 284,966 | 907,077 | 33,542 | 88,147 | 121,689 | 27 | 39 |
| October | ||||||||
| 1973 | 600,203 | 273,409 | 873,612 | 33,062 | 84,927 | 117,989 | 24 | 33 |
| 1974 | 618,226 | 287,111 | 905,337 | 34,489 | 96,625 | 131,114 | 26 | 35 |
Public Service Employment—Distribution of permanent staff in the Public Service by sex and by occupational classes as at 31 March 1974 is shown in the following table. (Railways, Post Office, Police, Education Boards and Universities staffs are not included.)
| Occupational Class | Males | Females |
|---|---|---|
| Accountants | 287 | 13 |
| Actuarial | 5 | — |
| Administrative | 89 | — |
| Agriculture extension— | ||
| Farm advisory | 369 | 6 |
| Home science instruction | — | — |
| Sheep and wool instruction | 23 | — |
| Agriculture (grading and testing)— | ||
| Dairy instruction | 69 | 3 |
| Seed analysis | — | 68 |
| Agriculture instruction— | ||
| Apiary instruction | 11 | — |
| Farm dairy instruction | 86 | — |
| Farm livestock instruction | 426 | — |
| Aircraft surveying | 27 | — |
| Air traffic control | 297 | 40 |
| Architectural | 184 | 7 |
| Art and display | 58 | 14 |
| Aviation calibration | 22 | — |
| Aviation operations | 38 | — |
| Bailiffs | 86 | — |
| Clerical | 8,473 | 6,784 |
| Coal mining— | ||
| Coal mining | 36 | — |
| Mine surveying | 12 | — |
| Communications | 283 | 1 |
| Computer programmers | 84 | 31 |
| Customs— | ||
| Customs (boarding and prevention) | 85 | — |
| Customs (bond) | 14 | — |
| Dental nursing— | ||
| Dental attendants | — | 2 |
| School dental nursing | — | 1,765 |
| Dental officers | 37 | 3 |
| Dietitians | — | 4 |
| Dockyard trades | 363 | — |
| Draughting | 1,620 | 376 |
| Editorial and journalists | 92 | 26 |
| Education | 204 | 14 |
| Education (teaching service) | 20 | 20 |
| Electricity (linemen) | 406 | — |
| Electricity (operating) | 900 | — |
| Engineering | 1,214 | 2 |
| Engineering officers | 1,037 | 2 |
| Engineering technicians | 730 | 29 |
| Executive | 2,034 | 56 |
| Farming | 164 | 11 |
| Fire protection and services | 198 | — |
| Fisheries and marine inspection | 38 | — |
| Forest management | 905 | — |
| Forestry | 170 | — |
| General servicing | 174 | 9 |
| Health education | 3 | 21 |
| Health inspection | 102 | 4 |
| Horticultural inspection | 52 | — |
| Hostel and domestic services | 30 | 118 |
| Industrial inspection— | ||
| Explosives | 9 | — |
| Factory | 112 | 5 |
| Factory (bush) | 9 | — |
| Port safety | 4 | — |
| Safety inspection | 39 | — |
| Weights and measures | 39 | — |
| Institutional welfare— | ||
| Institutional instruction | 27 | 6 |
| Institutional welfare | 164 | 90 |
| Investigating | 211 | 29 |
| Land management | 312 | — |
| Land surveying | 175 | 1 |
| Landscape and gardening | 75 | 3 |
| Legal | 134 | 8 |
| Library | 68 | 360 |
| Lighthouse keeping | 50 | — |
| Machining | — | 380 |
| Manual (non-trades) | 1,033 | — |
| Meat inspection | 1,270 | — |
| Medical | 50 | 16 |
| Mental health— | ||
| Mental health (assistant nurses) | 20 | — |
| Mental health (community nurses) | — | 3 |
| Mental health (general nurses) | 1 | 1 |
| Mental health (hospital aids) | 3 | 5 |
| Mental health (nurses) | 66 | 10 |
| Meteorological | 66 | 5 |
| Meteorological observing | 176 | 25 |
| Mine management, inspection, and engineering | 33 | — |
| Mine underviewers and deputies | 93 | — |
| Motion picture production | 77 | 15 |
| Motor vehicle inspection | 220 | — |
| National parks and reserves | 77 | — |
| Nautical services | 41 | — |
| Nursing | 4 | 278 |
| Occupational therapy | — | 7 |
| Office and general assistants | 555 | 1,309 |
| Patent examining | 17 | 4 |
| Pharmacy | 12 | 3 |
| Photographic | 49 | 17 |
| Physiotherapy | — | 2 |
| Port agriculture service | 103 | 7 |
| Printing (non-trades) | 92 | 128 |
| Printing trades | 364 | 4 |
| Prisons— | ||
| Prison instruction | 163 | 6 |
| Prison officers | 722 | 54 |
| Prison officers (nursing) | 17 | 1 |
| Property supervision | 133 | — |
| Psychology | 19 | 5 |
| Quantity surveying | 148 | 4 |
| Road traffic— | ||
| Parking meter enforcement | — | 61 |
| Road safety instruction | 1 | 7 |
| Road traffic enforcement | 750 | — |
| Road traffic instruction | 76 | — |
| Rural valuing | 137 | — |
| Sawmilling | 80 | — |
| Science | 1,226 | 87 |
| Science technicians | 1,268 | 450 |
| Ships officers | 30 | — |
| Social workers | 441 | 276 |
| Storekeeping | 667 | 1 |
| Survey assistants | 131 | — |
| Survey engineering | 7 | — |
| Technicians | 285 | 46 |
| Timber inspection | 39 | — |
| Town planning | 43 | 9 |
| Trades— | ||
| Trades | 1,185 | — |
| Carpenters and related trades | 223 | — |
| Electricians and related trades | 494 | — |
| Fitters and related trades | 623 | — |
| Motor mechanics and related trades | 185 | — |
| Painters and related trades | 90 | — |
| Plumbers and related trades | 31 | — |
| Other trades | 4 | — |
| Traffic engineering | 11 | — |
| Typing— | ||
| Shorthand reporters | — | 2 |
| Shorthand typists | — | 1,343 |
| Shorthand typists (special duties) | — | 74 |
| Teletypists | 1 | 19 |
| Typists | — | 1,334 |
| Varitypists | — | 15 |
| Urban valuing | 302 | 3 |
| Veterinary | 135 | 3 |
| Vocational guidance | 28 | 29 |
| Welders (non-trades) | 20 | — |
| Wildlife management | 69 | — |
| Totals | 37,260 | 15,977 |
EMPLOYMENT BY LOCAL AUTHORITIES—Employees of local authorities are principally engaged in the construction and maintenance of roads and streets, the operation and maintenance of public-utility industries (gas, electric and water supply, and transport), and community services.
In the following table particulars are given of the number of all direct wage-earning employees who were actually in the employ of the various classes of local authorities (hospital boards excluded) at 31 March of each of the latest five years inclusive. Besides permanent staff, including administrative and professional employees, the statistics include part-time, casual, and temporary employees, and subsidised workers, but exclude those employed by contractors.
| Local Authority | Employees at 31 March | ||||
|---|---|---|---|---|---|
| 1969 | 1970 | 1971 | 1972 | 1973 | |
* As at 30 September. †County pest destruction districts included. ‡Now redesignated as a county. § Includes Forestry District employees (8 in 1972 and 1973). | |||||
| Catchment boards | 753 | 788 | 762 | 761 | 780 |
| City and borough councils | 16,363 | 16,528 | 16,666 | 16,902 | 17,110 |
| County councils | 5,969 | 6,058 | 6,045 | 6,269 | 6,167 |
| Electric power boards | 5,272 | 5,475 | 5,646 | 5,794 | 5,903 |
| Fire boards | 1,046 | 1,252 | 1,387 | 1,550 | 1,993 |
| Gas boards | 37 | 41 | 48 | 59 | 49 |
| Harbour boards* | 3,746 | 3,710 | 3,814 | 3,886 | 3,845 |
| Harbour bridge authority | 139 | 156 | 150 | 135 | 136 |
| Land drainage boards | 87 | 97 | 91 | 82 | 79 |
| Local railway board | 15 | 15 | 15 | 15 | 15 |
| Museum authority | 110 | 112 | 118 | 146 | 64 |
| Nassella tussock boards | 48 | 42 | 34 | 31 | 35 |
| Plantation board | 9 | 9 | 8 | — | — |
| Pest destruction boards | 1,267† | 1,226 | 1,207 | 1,122 | 1,080 |
| Regional authority | 1,536 | 1,514 | 1,582 | 1,683 | 2,030 |
| River boards | 37 | 34 | 32 | 30 | 25 |
| Road board | 26 | 28 | § | § | § |
| Road tunnel authority | 42 | 42 | 42 | 44 | 40 |
| Town boards— | |||||
| Dependent | 27 | 26 | 26 | 22 | 17 |
| Independent | 52 | 52 | 67 | 54 | 48 |
| Underground water authorities | 6 | 5 | 4 | 4 | 4 |
| Urban drainage boards | 428 | 430 | 453 | 466 | 470 |
| Urban transport boards | 410 | 416 | 423 | 445 | 411 |
| Valley authority | 24 | 26 | 27 | 25 | 30 |
| Water supply boards | 5 | 5 | 5 | 5 | 4 |
| Totals | 37,454 | 38,087 | 38,652 | 39,538‡ | 40,343‡ |
UNEMPLOYMENT—Except for occasional returns relating to State unemployment relief which were presented to Parliament from time to time, practically no direct statistical evidence as to the extent of unemployment in New Zealand prior to 1892 is available. Such information is, however, available from the census (since 1896) and from the records of the Department of Labour (since 1892). In addition, statistics of unemployment among trade unionists were collected from trade union secretaries by the Department of Statistics from 1925 to 1930. A table showing figures of unemployment from June 1931 to March 1939 will be found on page 854 of the 1940 Yearbook.
Census Data on Unemployment—The great disadvantage of the census inquiry as an indicator of the trend of unemployment is that it provides data at quinquennial intervals only. Unemployment figures from the 1971 Census were 8,757 males and 7,411 females.
The following table gives relevant census data on unemployment. Prior to 1951 Maoris were not included.
| Census | Number of Males Unemployed | Proportion per 1,000 Male Wage and Salary Earners |
|---|---|---|
| 12 April 1896 | 14,759 | 100 |
| 31 March 1901 | 8,467 | 48 |
| 12 April 1906 | 8,189 | 39 |
| 2 April 1911 | 7,152 | 30 |
| 15 October 1916 | 5,920 | 26 |
| 17 April 1921 | 11,061 | 39 |
| 20 April 1926 | 10,694 | 34 |
| 24 March 1936 | 35,774 | 96 |
| 25 September 1945 | 5,823 | 16 |
| 17 April 1951 | 7,902 | 18 |
| 17 April 1956 | 5,558 | 12 |
| 18 April 1961 | 4,674 | 9 |
| 22 March 1966 | 5,125 | 8 |
| 23 March 1971 | 8,757 | 13 |
The 1936 figure includes men on rationed relief work, but excludes men (16,222) partly unemployed but not on relief work. The 1945 figure includes ex-servicemen recently returned from overseas who had not then resumed work. At the time of the 1951 Census the waterfront strike was in progress and it was estimated that approximately 15,000 workers in that and other industries were on strike. Evidently many of these were not returned as unemployed; it is likely that a number changed to other industries, while some may not have considered themselves to be unemployed.
Unemployment Benefit—Unemployment benefits under the Social Security Act have been payable since 1 April 1939. The number in force at 31 March 1974 was 483.
Subject to the conditions set out in Section 6A, the unemployment benefit may be claimed as of right. Registration at a district office of the Department of Labour is a compulsory prerequisite to eligibility for the benefit. Hence it is considered that the great majority of workers becoming involuntarily unemployed would register for employment in order to validate a claim for the benefit.
Close liaison is maintained between the Social Welfare Department and the Department of Labour to prevent the payment of benefit where work is available. In addition to the requirement that a benefit applicant must register for work at an employment office, all unemployment beneficiaries must report once weekly at the employment office.
VACANCIES, PLACEMENTS, AND UNEMPLOYED PERSONS—In addition to the half-yearly survey of the employment position, the Department of Labour maintains a weekly record of registered unemployed persons and a half-monthly record of vacancies and placements. The following tables are derived from this record and hence relate only to the department's operations as an employment service.
The following table contains a summary of the numbers of notified vacancies, placements, and registered unemployed persons as recorded by the Department of Labour.
| Date | Notified Vacancies at End of Month | Placements During Month | Registered Unemployed Persons at End of Month | ||||||
|---|---|---|---|---|---|---|---|---|---|
| Males | Females | Total | Males | Females | Total | Males | Females | Total | |
| Monthly Average For Calendar Years | |||||||||
| 1964 | 4,847 | 1,766 | 6,613 | 788 | 392 | 1,180 | 511 | 139 | 650 |
| 1965 | 6,000 | 1,936 | 7,936 | 722 | 379 | 1,101 | 385 | 128 | 513 |
| 1966 | 5,550 | 2,203 | 7,753 | 674 | 337 | 1,011 | 332 | 131 | 463 |
| 1967 | 2,682 | 1,445 | 4,127 | 1,376 | 407 | 1,783 | 3,267 | 585 | 3,852 |
| 1968 | 1,852 | 828 | 2,680 | 1,821 | 542 | 2,363 | 5,272 | 1,609 | 6,881 |
| 1969 | 2,977 | 1,190 | 4,167 | 1,162 | 378 | 1,540 | 2,191 | 735 | 2,926 |
| 1970 | 3,794 | 1,451 | 5,245 | 796 | 290 | 1,086 | 1,225 | 375 | 1,600 |
| 1971 | 2,207 | 950 | 3,157 | 946 | 337 | 1,283 | 2,555 | 560 | 3,115 |
| 1972 | 1,790 | 857 | 2,647 | 1,529 | 396 | 1,925 | 4,368 | 1,316 | 5,684 |
| 1973 | 2,626 | 912 | 3,538 | 1,312 | 394 | 1,706 | 1,591 | 730 | 2,321 |
| 1974 | 3,386 | 1,170 | 4,556 | 1,067 | 345 | 1,412 | 607 | 348 | 955 |
Registered unemployed, vacancies, and placements are classified by occupation in the following table on the basis of monthly averages.
| Occupation Group | Registered Unemployed (Monthly Average) | Vacancies (Monthly Average) | Placements (Monthly Average) | |||
|---|---|---|---|---|---|---|
| 1972 | 1973 | 1972 | 1973 | 1972 | 1973 | |
| Professional, technical, and clerical | 352 | 169 | 442 | 315 | 60 | 71 |
| Sales | 274 | 127 | 120 | 113 | 52 | 45 |
| Farming, fishing, logging | 391 | 182 | 35 | 53 | 237 | 230 |
| Transport and communications | 257 | 86 | 508 | 80 | 34 | 43 |
| Manufacturing and trades | 1,794 | 637 | 986 | 1,640 | 390 | 387 |
| Service | 535 | 275 | 120 | 209 | 122 | 129 |
| Labouring | 1,622 | 582 | 116 | 291 | 972 | 702 |
| All other occupations | 459 | 263 | 320 | 837 | 58 | 99 |
| All occupations | 5,684 | 2,321 | 2,647 | 3,538 | 1,925 | 1,706 |
STATISTICS FROM CENSUS OF POPULATION—Statistics on industrial distribution, occupations, and occupational status compiled from the population censuses of 1966 and 1971 are given in the following tables. (Excluded from the tables are members of the Armed Services overseas at census dates, numbering 1,936 in 1966 and 1,482 in 1971.)
Occupational Status—The following table shows the occupational status of persons in the work force, and also the persons not actively engaged including children.
| Occupational Status | 1966 Census | 1971 Census | ||||
|---|---|---|---|---|---|---|
| Males | Females | Total | Males | Females | Total | |
| Employer | 66,170 | 7,254 | 73,424 | 59,815 | 8,103 | 67,918 |
| Self employed | 61,975 | 7,856 | 69,831 | 62,185 | 10,101 | 72,286 |
| Wage or salary earner | 610,732 | 260,081 | 870,813 | 651,499 | 307,064 | 958,563 |
| Unemployed | 5,125 | 3,982 | 9,107 | 8,757 | 7,411 | 16,168 |
| Relative assisting, unpaid | 312 | 488 | 800 | 250 | 353 | 603 |
| Not specified | 1,281 | 783 | 2,064 | 2,463 | 834 | 3,297 |
| Totals, actively engaged | 745,595 | 280,444 | 1,026,039 | 784,969 | 333,866 | 1,118,835 |
| Not actively engaged | 598,148 | 1,052,732 | 1,650,880 | 645,887 | 1,097,909 | 1,743,796 |
| Grand totals | 1,343,743 | 1,333,176 | 2,676,919 | 1,430,856 | 1,431,775 | 2,862,631 |
The next table classifies households at the 1971 Census according to the occupational status of the head and the number of persons in the household with an income exceeding $200.
| Occupational Status of Head | Households by Number of Persons with Incomes of $200 or more | Total Households | |||||
|---|---|---|---|---|---|---|---|
| 1 Person | 2 Persons | 3 Persons | 4 Persons | 5 or more Persons | Nil (incl. not Specified) | ||
| *Including relative assisting heads and not specified but who are in the labour force. | |||||||
| Employer | 19,376 | 23,836 | 8,357 | 2,653 | 969 | 1,495 | 56,686 |
| Own account | 27,205 | 21,197 | 5,358 | 1,442 | 367 | 1,662 | 57,231 |
| Wage or salary earner | 240,819 | 179,007 | 48,755 | 15,508 | 4,459 | 12,461 | 501,009 |
| Unemployed | 1,371 | 783 | 221 | 73 | 34 | 809 | 3,291 |
| Totals* | 288,914 | 224,877 | 62,709 | 19,681 | 5,831 | 16,901 | 618,913 |
| Not actively engaged head— | |||||||
| Retired | 33,517 | 16,514 | 2,986 | 620 | 170 | 35,362 | 89,169 |
| Full-time student | 723 | 1,269 | 526 | 482 | 305 | 426 | 3,731 |
| Housewife | 30,772 | 9,678 | 2,640 | 639 | 213 | 41,535 | 85,477 |
| Others | 1,391 | 552 | 169 | 50 | 23 | 2,211 | 4,396 |
| Totals | 66,403 | 28,013 | 6,321 | 1,791 | 711 | 79,534 | 182,773 |
| Totals, all heads | 355,317 | 252,890 | 69,030 | 21,472 | 6,542 | 96,435 | 801,686 |
Industrial Distribution: Divisions—The industrial distribution of the labour force by the major divisions of industry is now given.
| Industrial Major Division | 1971 Census | |||
|---|---|---|---|---|
| Males | Females | Total | Percentage | |
| Agriculture, hunting, forestry, and fishing | 110,665 | 18,229 | 128,894 | 11.5 |
| Mining and quarrying | 5,088 | 177 | 5,265 | 0.5 |
| Manufacturing | 207,088 | 74,022 | 281,110 | 25.1 |
| Electricity, gas, and water | 12,105 | 1,168 | 13,273 | 1.2 |
| Construction | 90,671 | 3,017 | 93,688 | 8.4 |
| Wholesale and retail trade and restaurants and hotels | 117,237 | 81,078 | 198,315 | 17.7 |
| Transport, storage, and communication | 84,861 | 18,320 | 103,181 | 9.2 |
| Financing, insurance, real estate, and business services | 37,811 | 26,963 | 64,774 | 5.8 |
| Community, social, and personal services | 110,887 | 105,640 | 216,527 | 19.4 |
| Activities not adequately defined | 8,556 | 5,252 | 13,808 | 1.2 |
| Totals | 784,969 | 333,866 | 1,118,835 | 100.0 |
Industrial participation by industrial divisions is now given for the 1971 Census.
| Industrial Major Division and Division | Males | Females | Total |
|---|---|---|---|
| Agriculture, hunting, forestry and fishing— | |||
| Agriculture and hunting | 101,310 | 17,962 | 119,272 |
| Forestry and logging | 6,857 | 196 | 7,053 |
| Fishing | 2,498 | 71 | 2,569 |
| Total | 110,665 | 18,229 | 128,894 |
| Mining and quarrying— | |||
| Coalmining | 2,054 | 47 | 2,101 |
| Crude petroleum and natural gas production | 198 | 18 | 216 |
| Metal ore mining | 230 | 11 | 241 |
| Other mining | 2,606 | 101 | 2,707 |
| Total | 5,088 | 177 | 5,265 |
| Manufacturing— | |||
| Food, beverages and tobacco | 54,081 | 11,126 | 65,207 |
| Textile, wearing apparel and leather industries | 17,717 | 33,181 | 50,898 |
| Wood and wood products including furniture | 19,317 | 1,580 | 20,897 |
| Paper and paper products, printing and publishing | 21,029 | 7,320 | 28,349 |
| Chemicals and chemical, petroleum, coal, rubber, and plastic products | 16,723 | 6,417 | 23,140 |
| Non-metallic mineral products except products of petroleum and coal | 9,382 | 1,312 | 10,694 |
| Basic metal industries | 3,795 | 283 | 4,078 |
| Fabricated metal products, machinery and equipment | 62,947 | 10,898 | 73,845 |
| Other manufacturing industries | 2,097 | 1,905 | 4,002 |
| Total | 207,088 | 74,022 | 281,110 |
| Electricity, gas and water— | |||
| Electricity, gas and steam | 11,188 | 1,153 | 12,341 |
| Waterworks and supply | 917 | 15 | 932 |
| Total | 12,105 | 1,168 | 13,273 |
| Industrial Major Division and Division | Males | Females | Total |
|---|---|---|---|
| Construction | 90,671 | 3,017 | 93,688 |
| Wholesale and retail trade and restaurants and hotels— | |||
| Wholesale trade | 43,604 | 13,221 | 56,825 |
| Retail trade | 60,967 | 49,121 | 110,088 |
| Restaurants and hotels | 12,666 | 18,736 | 31,402 |
| Total | 117,237 | 81,078 | 198,315 |
| Transport, storage and communication— | |||
| Transport and storage | 66,978 | 6,838 | 73,816 |
| Communication | 17,883 | 11,482 | 29,365 |
| Total | 84,861 | 18,320 | 103,181 |
| Finance, insurance, real estate, and business services— | |||
| Financial institutions | 10,552 | 8,329 | 18,881 |
| Insurance | 8,768 | 5,012 | 13,780 |
| Real estate and business services | 18,491 | 13,622 | 32,113 |
| Total | 37,811 | 26,963 | 64,774 |
| Community, social and personal services— | |||
| Public administration and defence | 34,651 | 11,800 | 46,451 |
| Sanitary and similar services | 3,793 | 3,114 | 6,907 |
| Social and related community services | 42,509 | 74,973 | 117,482 |
| Recreational and cultural services | 8,302 | 3,682 | 11,984 |
| Personal and household services | 21,108 | 11,839 | 32,947 |
| International and other extra-territorial bodies | 524 | 232 | 756 |
| Total | 110,887 | 105,640 | 216,527 |
| Activities not adequately defined | 8,556 | 5,252 | 13,808 |
| Grand total actively engaged | 784,969 | 333,866 | 1,118,835 |
Occupations—The occupational classification in major groups is given for 1971 in the following table.
| Occupational Major Groups and Minor Groups | Males | Females | Total |
|---|---|---|---|
Note: n.e.c.—not elsewhere classified. *Includes related workers. | |||
| Professional and technical*— | |||
| Physical scientists and technicians | 3,133 | 1,314 | 4,447 |
| Architects, engineers and technicians | 22,639 | 1,062 | 23,701 |
| Aircraft and ships officers | 2,821 | 4 | 2,825 |
| Life scientists and technicians | 2,707 | 1,601 | 4,308 |
| Medical, dental, and veterinary workers* | 9,327 | 22,254 | 31,581 |
| Statisticians, mathematicians, systems analysts and technicians | 1,290 | 248 | 1,538 |
| Economists | 422 | 51 | 473 |
| Accountants | 7,170 | 264 | 7,434 |
| Jurists | 2,683 | 50 | 733 |
| Teachers | 18,446 | 25,834 | 44,280 |
| Workers in religion | 2,830 | 501 | 3,331 |
| Authors, journalists and writers* | 1,918 | 668 | 2,586 |
| Sculptors, painters (artists), photographers | 2,714 | 926 | 3,640 |
| Composers and performing artists | 1,062 | 792 | 1,854 |
| Athletes, sportsmen* | 702 | 139 | 841 |
| Professional, technical n.e.c.* | 2,086 | 1,732 | 3,818 |
| Total | 81,950 | 57,440 | 139,390 |
| Administrators and managerial workers— | |||
| Legislative officials and government administrators | 624 | 13 | 637 |
| Managers (excluding those in wholesale and retail trade, catering and lodging services and in farming) | 26,724 | 1,042 | 27,766 |
| Total | 27,348 | 1,055 | 28,403 |
| Clerical workers— | |||
| Clerical supervisors | 4,059 | 465 | 4,524 |
| Government executive officials | 4,626 | 192 | 4,818 |
| Stenographers, typists and punch machine operators | 526 | 33,866 | 34,392 |
| Bookkeepers, cashiers* | 13,740 | 16,172 | 29,912 |
| Computing machine operators | 596 | 6,733 | 7,329 |
| Transport and communication supervisors | 5,848 | 150 | 5,998 |
| Transport conductors | 636 | 2 | 638 |
| Mail distribution clerks | 2,152 | 1,554 | 3,706 |
| Telephone and telegraph operators | 1,571 | 5,568 | 7,139 |
| Clerical n.e.c.* | 36,280 | 45,645 | 81,925 |
| Total | 70,034 | 110,347 | 180,381 |
| Sales workers— | |||
| Managers (wholesale and retail trade) | 16,017 | 2,280 | 18,297 |
| Working proprietors (wholesale and retail trade) | 8,319 | 4,111 | 12,430 |
| Sales supervisors, and buyers | 8,019 | 863 | 8,882 |
| Technical salesmen, commercial travellers and manufacturers' agents | 12,986 | 307 | 13,293 |
| Insurance, real estate, securities and business services salesmen and auctioneers | 9,781 | 384 | 10,165 |
| Salesmen and shop assistants* | 21,331 | 30,702 | 52,033 |
| Sales workers n.e.c. | 90 | 36 | 126 |
| Total | 76,54 | 38,683 | 115,226 |
| Service workers— | |||
| Managers (catering and lodging services) | 1,993 | 1,188 | 3,181 |
| Working proprietors (catering and lodging services) | 3,145 | 2,234 | 5,379 |
| Housekeeping and related service supervisors | 254 | 2,970 | 3,224 |
| Cooks, waiters, bartenders* | 6,336 | 12,474 | 18,810 |
| Maids and related housekeeping workers n.e.c. | 1,059 | 9,049 | 10,108 |
| Building caretakers and cleaners* | 5,331 | 4,212 | 9,543 |
| Launderers, drycleaners and pressers | 1,258 | 2,791 | 4,049 |
| Hairdressers, barbers, beauticians* | 1,510 | 4,667 | 6,177 |
| Protective service workers | 7,452 | 218 | 7,670 |
| Service workers n.e.c. | 3,341 | 5,899 | 9,240 |
| Total | 31,679 | 45,702 | 77,381 |
| Agricultural, animal husbandry and forestry workers, fishermen and hunters— | |||
| Farm managers and supervisors | 5,798 | 70 | 5,868 |
| Farmers | 58,829 | 6,456 | 65,285 |
| Agricultural and animal husbandry workers | 39,058 | 10,628 | 49,686 |
| Forestry workers | 5,337 | 40 | 5,377 |
| Fishermen and hunters* | 3,393 | 41 | 3,434 |
| Total | 112,415 | 17,235 | 129,650 |
| Production and related workers, transport equipment operators and labourers— | |||
| Production supervisors, overseers and general foremen (non-clerical) (and excluding Agricultural, transport, sales and service supervisors, overseers and foremen) | 13,144 | 1,013 | 14,157 |
| Miners, quarrymen, and well-drillers* | 2,699 | — | 2,699 |
| Metal processers | 2,507 | 120 | 2,627 |
| Wood preparation workers and paper makers | 7,566 | 204 | 7,770 |
| Chemical processers* | 2,293 | 314 | 2,607 |
| Spinners, weavers, knitters, dyers* | 5,512 | 4,520 | 10,032 |
| Tanners, fellmongers and pelt dressers | 1,317 | 165 | 1,482 |
| Food and beverage processers | 36,770 | 3,844 | 40,614 |
| Tobacco preparers and tobacco product makers | 162 | 360 | 522 |
| Tailors, dressmakers, sewers, and upholsterers* | 4,764 | 21,016 | 25,780 |
| Shoemakers and leather goods makers | 2,146 | 2,894 | 5,040 |
| Cabinet makers and related woodworkers | 4,894 | 206 | 5,100 |
| Stone cutters and carvers | 197 | 1 | 198 |
| Blacksmiths, tool makers and machine tool operators | 6,760 | 601 | 7,361 |
| Machinery fitters, machine assemblers and precision instrument makers (except electrical) | 46,445 | 1,027 | 47,472 |
| Electrical fitters and electrical and electronics workers | 23,285 | 2,196 | 25,481 |
| Broadcasting station and sound equipment operators and cinema projectionists | 330 | 98 | 428 |
| Plumbers, welders, sheet-metal and structural metal preparers and erectors | 22,467 | 773 | 23,240 |
| Jewellery and precious metal workers | 657 | 168 | 825 |
| Glass formers and potters* | 2,301 | 483 | 2,784 |
| Rubber and plastics product makers | 4,072 | 1,794 | 5,866 |
| Paper and paper-board products makers | 845 | 694 | 1,539 |
| Printers* | 8,293 | 2,605 | 10,898 |
| Painters | 12,288 | 153 | 12,441 |
| Production and related workers n.e.c. | 2,816 | 1,726 | 4,542 |
| Bricklayers, carpenters and other construction workers | 44,275 | 9 | 44,284 |
| Stationary engine and related equipment operators n.e.c. | 3,276 | 4 | 3,280 |
| Material handling and related equipment operators, dockers and freight handlers | 37,975 | 7,805 | 45,780 |
| Transport equipment operators | 41,178 | 1,017 | 42,195 |
| Labourers n.e.c. | 24,934 | 2,149 | 27,083 |
| Total | 366,168 | 57,959 | 424,127 |
| Workers not classifiable by occupation— | |||
| New workers seeking employment | 996 | 1,632 | 2,628 |
| Workers reporting occupation unidentifiable or inadequately described | 4,159 | 1,783 | 5,942 |
| Workers not reporting any occupation (excluding armed forces) | 2,871 | 1,369 | 4,240 |
| Armed forces | 10,806 | 661 | 11,467 |
| Grand total, actively engaged | 784,969 | 333,866x | 1,118,835 |
EMPLOYMENT ON FARMS—A table giving statistics for farm employment appears in Section 14A of this Yearbook.
TRAVEL TIME—Travel time to work for persons actively engaged in 1971 is shown in the following table.
| Travel Time (Minutes) | Drive Car Van or Truck | Passenger in Car Van or Truck | Bus | Train | Cycle, Motor cycle | Walk | Total Including Others |
|---|---|---|---|---|---|---|---|
| *Includes 126,705 who work at home (such as farmers) and 28,252 not applicable, etc. | |||||||
| 1-4 | 26,007 | 2,767 | 114 | 22 | 3,518 | 30,150 | 62,779 |
| 5-9 | 105,243 | 16,311 | 2,161 | 131 | 15,653 | 35,369 | 175,723 |
| 10-14 | 128,597 | 25,681 | 11,225 | 474 | 20,170 | 29,452 | 216,833 |
| 15-19 | 89,272 | 20,138 | 18,484 | 817 | 12,504 | 17,177 | 159,056 |
| 20-24 | 65,071 | 15,847 | 25,486 | 1,870 | 7,259 | 12,654 | 128,741 |
| 25-29 | 18,262 | 4,056 | 10,430 | 1,293 | 1,715 | 3,358 | 39,267 |
| 30-39 | 43,462 | 14,463 | 35,915 | 6,568 | 3,290 | 7,601 | 112,151 |
| 40-49 | 9,355 | 4,379 | 17,693 | 6,284 | 594 | 1,605 | 40,476 |
| 50-59 | 1,195 | 708 | 3,247 | 2,754 | 57 | 204 | 8,312 |
| 60-74 | 3,375 | 2,072 | 5,816 | 4,363 | 126 | 436 | 16,459 |
| 75-89 | 305 | 288 | 644 | 756 | 9 | 39 | 2,085 |
| 90+ | 755 | 434 | 598 | 584 | 17 | 44 | 2,560 |
| Not Specified | 3,289 | 672 | 406 | 56 | 241 | 441 | 9,751 |
| Totals | 494,188 | 107,816 | 132,219 | 25,972 | 65,153 | 138,530 | 1,118,835* |
Means of transport to work for particular urban areas are shown in Section 11C, Roads and Road Transport.
WOMEN IN THE LABOUR FORCE—During the past 40 years there has been a marked change in the composition of the New Zealand labour force. The female component of the labour force increased from 20.9 percent in 1926 to 29.8 percent in 1971. Some of the relevant issues are discussed in the report of a commission of inquiry Equal Pay in New Zealand (Parliamentary Paper H.54, 1971).
Female labour force participation rates for women aged 15 to 64 years have been: 1926, 25.6; 1936, 26.5; 1945, 29.0; 1951, 28.4; 1956, 29.7; 1961, 31.9; 1966, 35.4; 1971, 38.9.
Between 1936 and 1971 the male work force increased by 48.8 percent while the female labour force grew by 135.2 percent.
Despite these marked increases the New Zealand female participation rate in the labour force is not as high as that of some overseas countries.
Female labour force participation rates for women aged 15 to 64 years in certain countries are given in the following table. Source: ILO Year Book 1973.
| Country | Year | Participation Rate of Women Aged 15-64 years |
|---|---|---|
| Japan | 1,970 | 54.4 |
| United Kingdom | 1,966 | 50.1 |
| Denmark | 1,966 | 47.6 |
| Sweden | 1,970 | 45.5 |
| France | 1,968 | 43.6 |
| United States | 1,970 | 46.0 |
| Australia | 1,971 | 42.3 |
| Canada | 1,961 | 32.8 |
| New Zealand | 1,971 | 38.9 |
Compared with Australia and New Zealand, the United States and Sweden report considerably lower participation rates by 15 to 19 year old girls, reflecting the longer time spent in formal education. This trend is also appearing in New Zealand and may be expected to continue. There is a rather lower New Zealand participation rate in the 25 to 29 years age group and this may be due to the higher incidence of marriage, the higher New Zealand birth rates, and the social attitudes in New Zealand which expect a mother to care for her own children. It seems apparent that the likely continued rise in the female labour force will be due mainly to the re-entry of married women after their children have reached school age.
Married women in paid employment have increased until in 1971 49.8 percent of the total female labour force consisted of married women.
Married women in the labour force as a percentage of the female labour force are given in the following table.
| Item | 1936 | 1945 | 1951 | 1956 | 1961 | 1966 | 1971 |
|---|---|---|---|---|---|---|---|
| Married women in labour force | 11,291 | 31,958 | 41,932 | 62,033 | 84,556 | 116,314 | 166,472 |
| Percent | 8.5 | 17.7 | 24.4 | 32.0 | 37.6 | 41.5 | 49.9 |
Married women in the labour force as a percentage of all married women progressed from 3.5 in 1926 to 26.1 in 1971, with every indication that this momentum of increase is being sustained.
Married women in labour force as a percentage of all married women in the same age group are given in the next table.
| Age (Years) | 1936 | 1945 | 1951 | 1956 | 1961 | 1966 | 1971 |
|---|---|---|---|---|---|---|---|
| percent | |||||||
| 16-19 | 5.7 | 18.2 | 14.5 | 18.5 | 20.0 | 23.5 | 30.3 |
| 20-24 | 4.3 | 17.4 | 16.0 | 19.4 | 20.7 | 26.7 | 34.3 |
| 25-29 | 3.7 | 10.3 | 9.7 | 11.6 | 11.9 | 15.8 | 20.7 |
| 30-34 | 3.6 | 8.0 | 8.9 | 11.3 | 13.3 | 16.4 | 24.3 |
| 35-39 | 3.6 | 8.4 | 10.5 | 13.9 | 18.0 | 21.8 | 31.8 |
| 40-44 | 3.9 | 8.7 | 12.2 | 16.6 | 21.3 | 26.9 | 35.3 |
| 45-49 | 4.4 | 7.8 | 13.1 | 17.5 | 23.1 | 27.7 | 35.9 |
| 50-54 | 4.2 | 6.1 | 10.7 | 15.5 | 20.7 | 25.2 | 30.7 |
| 55-59 | 4.2 | 4.6 | 6.9 | 10.8 | 14.9 | 18.5 | 22.0 |
| 60-64 | 2.8 | 2.5 | 3.7 | 5.2 | 7.5 | 9.5 | 11.2 |
| 65+ | 1.6 | 1.0 | 1.4 | 1.6 | 1.7 | 2.1 | 2.4 |
| All ages— 16+ | 3.7 | 7.7 | 9.7 | 12.9 | 16.0 | 19.9 | 26.1 |
Occupation and age groups of married women working in 1971 are shown in the following table.
| Occupation | Age Group in Years | Total | ||||||
|---|---|---|---|---|---|---|---|---|
| Under 20 | 20-29 | 30-39 | 40-49 | 50-59 | 60-69 | 70 and Over | ||
| Note: n.e.c. — Not elsewhere classified | ||||||||
| Professional and technical— | ||||||||
| Medical, dental, veterinary | 94 | 2,418 | 1,357 | 1,602 | 879 | 117 | 3 | 6,470 |
| Teachers | 96 | 4,233 | 2,924 | 2,750 | 984 | 192 | 8 | 11,187 |
| Other | 62 | 1,276 | 581 | 726 | 510 | 119 | 16 | 3,290 |
| Totals | 252 | 7,927 | 4,862 | 5,078 | 2,373 | 428 | 27 | 20,947 |
| Administrators and managers— | ||||||||
| Managers | 2 | 85 | 153 | 221 | 157 | 43 | 1 | 662x |
| Administrators | — | 1 | 1 | 1 | 3 | 1 | — | 7 |
| Totals | 2 | 86 | 154 | 222 | 160 | 44 | 1 | 669 |
| Clerical workers— | ||||||||
| Stenographers, typists and punch machine operators | 460 | 5,947 | 2,861 | 3,182 | 1,447 | 243 | 9 | 14,149 |
| Bookkeepers, cashiers | 193 | 2,531 | 1,417 | 2,000 | 1,084 | 158 | 10 | 7,393 |
| Clerks | 519 | 5,750 | 4,435 | 6,529 | 3,823 | 624 | 20 | 21,700 |
| Other | 225 | 2,827 | 1,503 | 1,205 | 448 | 59 | 2 | 6,269 |
| Totals | 1,397 | 17,055 | 10,216 | 12,916 | 6,802 | 1,084 | 41 | 49,511 |
| Sales staff— | ||||||||
| Managers | 5 | 159 | 403 | 627 | 437 | 99 | 3 | 1,733 |
| Working proprietors | 8 | 381 | 936 | 1,243 | 713 | 170 | 9 | 3,460 |
| Saleswomen and shop assistants | 349 | 2,727 | 3,665 | 5,968 | 4,001 | 699 | 28 | 17,437 |
| Other | 5 | 138 | 200 | 317 | 221 | 34 | 1 | 916 |
| Totals | 367 | 3,405 | 5,204 | 8,155 | 5,372 | 1,002 | 41 | 23,546 |
| Service workers— | ||||||||
| Working proprietors (catering and lodging services) | 2 | 216 | 531 | 703 | 368 | 82 | 6 | 1,908 |
| Cooks, waitresses, bartenders | 105 | 986 | 1,553 | 2,169 | 1,768 | 404 | 14 | 6,999 |
| Maids and housekeepers, n.e.c. | 54 | 525 | 984 | 1,331 | 987 | 218 | 21 | 4,120 |
| Building caretakers, cleaners | 21 | 417 | 952 | 1,091 | 655 | 168 | 6 | 3,310 |
| Service workers, n.e.c. | 45 | 534 | 674 | 769 | 474 | 82 | — | 2,578 |
| Other | 155 | 1,363 | 894 | 1,299 | 1,070 | 231 | 9 | 5,021 |
| Totals | 382 | 4,041 | 5,588 | 7,362 | 5,322 | 1,185 | 56 | 23,936 |
| Agricultural, animal husbandry and forestry workers, fishermen, and hunters— | ||||||||
| Farmers | 8 | 985 | 1,998 | 1,574 | 711 | 180 | 20 | 5,476 |
| Agricultural and animal husbandry workers | 80 | 1,469 | 2,401 | 2,128 | 938 | 175 | 9 | 7,200 |
| Other | 1 | 18 | 40 | 27 | 19 | 4 | — | 109 |
| Totals | 89 | 2,472 | 4,439 | 3,729 | 1,668 | 359 | 29 | 12,785x |
| Production workers, transport operators and labourers— | ||||||||
| Spinners, weavers, knitters, dyers | 61 | 625 | 742 | 743 | 514 | 83 | 2 | 2,770 |
| Food and beverage processors | 69 | 346 | 519 | 705 | 499 | 77 | 1 | 2,216* |
| Tailors, dressmakers, sewers, upholsterers | 319 | 2,191 | 3,126 | 4,069 | 2,405 | 445 | 18 | 12,573 |
| Shoemakers and leather goods makers | 34 | 273 | 422 | 615 | 368 | 65 | 1 | 1,778 |
| Material handling and equipment operators, dockers and freight handlers | 104 | 682 | 1,092 | 1,633 | 1,180 | 211 | 6 | 4,908 |
| Other | 228 | 1,884 | 2,568 | 3,283 | 2,099 | 325 | 11 | 10,398 |
| Totals | 815 | 6,001 | 8,469 | 11,048 | 7,065 | 1,206 | 39 | 34,643 |
| Armed forces | 2 | 52 | 20 | 21 | 7 | — | — | 102 |
| Other including new workers seeking employment, workers not reporting any occupation or not adequately described | 36 | 78 | 67 | 72 | 66 | 13 | 1 | 333 |
| Grand totals, actively engaged | 3,342 | 41,117 | 39,019 | 48,603 | 28,835 | 5,321 | 235 | 166,472 |
Participation of married women in the labour force may be said to follow this pattern—higher than average percentages below 25 years of age when the economic desirability of a second income in the purchase and furnishing of a home is likely to be at its greatest; lower than average percentages between 25 and 34 years when younger families are being cared for; higher than average percentages at 35-54 years when family responsibilities have diminished; and lower than average percentages at 55 years and beyond when retirement causes increasing withdrawals from the labour force.
The increasing tendency for women to continue in employment after marriage until the birth of the first child and to re-enter the labour force as family responsibilities lessen has been aided by a combination of factors, including the progressively younger ages at marriage, changing social attitudes particularly toward the role of married women, and possibly to a greater awareness and readier acceptance of family planning and improved methods of contraception.
EDUCATIONAL QUALIFICATIONS—The Census of Population and Dwellings 1971 included a question on the highest educational qualification obtained. An analysis by occupational major groups of the labour force is given in the following table. Additional information will be given in the census reports, Volume 4, Industries and Occupations, and Volume 6, Education and Internal Migration.
| Occupation Major Group | University | Secondary | ||||
|---|---|---|---|---|---|---|
| Degree | Diploma or other | Scholarship, H.L.C. U.E.* | School Certificate | Other Examination | ||
| *U.E.—University Entrance; H.L.C.—Higher Leaving Certificate. | ||||||
| Professional and technical | M | 24,007 | 3,603 | 19,003 | 10,674 | 5,604 |
| F | 5,069 | 1,370 | 17,559 | 16,500 | 3,077 | |
| Administrators and managers | M | 1,642 | 730 | 4,598 | 2,324 | 2,509 |
| F | 68 | 6 | 112 | 86 | 129 | |
| Clerks | M | 1,453 | 500 | 12,596 | 11,877 | 6,156 |
| F | 757 | 163 | 8,249 | 24,958 | 9,780 | |
| Sales staff | M | 779 | 964 | 7,071 | 7,639 | 4,343 |
| F | 99 | 53 | 1,075 | 2,848 | 1,549 | |
| Service workers | M | 138 | 120 | 1,341 | 2,034 | 1,462 |
| F | 96 | 70 | 1,055 | 2,538 | 1,639 | |
| Agricultural, animal husbandry and forestry workers, fishermen and hunters | M | 561 | 1,862 | 4,938 | 9,019 | 2,189 |
| F | 78 | 98 | 856 | 1,680 | 631 | |
| Production workers, transport operators and labourers | M | 507 | 551 | 6,793 | 21,261 | 9,921 |
| F | 66 | 31 | 598 | 2,054 | 1,336 | |
| Workers not classifiable by occupation | M | 23 | 1 | 68 | 105 | 8 |
| F | 6 | 1 | 72 | 227 | 29 | |
| Workers reporting occupation unidentifiable or inadequately described | M | 38 | 6 | 69 | 73 | 62 |
| F | 13 | — | 32 | 73 | 42 | |
| Workers not reporting any occupation | M | 29 | 8 | 63 | 82 | 36 |
| F | 10 | 2 | 19 | 59 | 15 | |
| Armed Forces | M | 173 | 26 | 846 | 2,061 | 526 |
| F | — | 1 | 48 | 221 | 35 | |
| Totals, persons with examination qualifications | M | 29,350 | 8,371 | 57,386 | 67,149 | 32,816 |
| F | 6,262 | 1,795 | 29,675 | 51,244 | 18,262 | |
WORKING LIFE EXPECTANCIES—A table of working life displays the manner in which rates of participation in, entry to, and withdrawal from the labour force vary with age for the given population group. Also included are expectancies of future working life and retirement life, assuming that the rates displayed in the table continue unchanged. The main applications of these tables are to economic and social studies relating to large groups of people. Individuals frequently do not conform to group patterns and, therefore, applications of any statistics from the tables must be made with caution.
Abridged tables are now presented of working life for males based on the year 1966 and of working life for females based on the year 1951 (this being the latest table available for females).
A new series of tables of male/female working life are being prepared, based on labour force data from the 1971 Census of Population and Dwellings, and the 1970-72 life tables (contained in section 4 of the Yearbook).
| Exact Age (Years) | Percentage of Population in Labour Force | Number in Labour Force, per 100,000 Live Births | Changes in the Labour Force in the following 5 Years of Age, per 100,000 Live Births | Expectation of Work Life of Person in Labour Force† (Years) | Expectation of Retirement Life of Person in Labour Force‡ (Years) | |
|---|---|---|---|---|---|---|
| Total Entries* | Total Withdrawals | |||||
*Entries of females into the labour force below the horizontal line are secondary entries by those who withdrew at younger ages for reasons connected with marriage. †The working life expectancies for females allow for the possibility of a second spell of labour force membership after a period of non-membership due to marriage. ‡Difference between life expectancy and working life expectancy §These are withdrawals at all ages 80 and above. | ||||||
| Males 1966 | ||||||
| 15 | — | — | 86,174 | 413 | 47.0 | 8.3 |
| 20 | 89.1 | 85,760 | 7,821 | 722 | 42.3 | 8.3 |
| 25 | 97.2 | 92,860 | 1,515 | 674 | 37.6 | 8.4 |
| 30 | 98.8 | 93,701 | 246 | 817 | 32.8 | 8.5 |
| 35 | 99.1 | 93,131 | 46 | 1,148 | 28.1 | 8.5 |
| 40 | 99.0 | 92,029 | — | 1,988 | 23.4 | 8.6 |
| 45 | 98.5 | 90,043 | — | 3,363 | 18.9 | 8.7 |
| 50 | 97.6 | 86,680 | — | 5,953 | 14.5 | 8.8 |
| 55 | 95.5 | 80,725 | — | 15,305 | 10.4 | 8.9 |
| 60 | 84.0 | 65,420 | — | 26,640 | 7.1 | 8.7 |
| 65 | 56.7 | 38,781 | — | 23,069 | 5.2 | 7.4 |
| 70 | 28.1 | 15,712 | — | 10,296 | 4.4 | 5.4 |
| 75 | 13.3 | 5,417 | — | 3.787 | 3.9 | 3.5 |
| 80 | 6.5 | 1,629 | — | 1,628§ | 3.1 | 2.5 |
| Females 1951 | ||||||
| 15 | — | — | 81,805 | 8,473 | 16.2 | 42.7 |
| 20 | 76.5 | 73,332 | 1,129 | 42,407 | 12.4 | 41.8 |
| 25 | 33.6 | 32,054 | 1,136 | 14,064 | 16.7 | 32.7 |
| 30 | 20.2 | 19,126 | 4,031 | 5,030 | 20.3 | 24.4 |
| 35 | 19.2 | 18,127 | 4,228 | 3,062 | 19.9 | 20.1 |
| 40 | 20.7 | 19,293 | 3,014 | 1,803 | 17.5 | 17.9 |
| 45 | 22.3 | 20,504 | 1,297 | 2,651 | 13.6 | 17.2 |
| 50 | 21.3 | 19,150 | 775 | 4,676 | 9.9 | 16.6 |
| 55 | 17.6 | 15,249 | 351 | 5,449 | 7.2 | 15.2 |
| 60 | 12.3 | 10,151 | — | 6,414 | 4.6 | 13.8 |
| 65 | 4.9 | 3,737 | — | 2,592 | 3.8 | 11.0 |
| 70 | 1.7 | 1,145 | — | 1,014 | 2.5 | 8.9 |
| 75 | 0.2 | 131 | — | 131 | 1.1 | 7.4 |
GENERAL—For many years the basis for determination of wages and salaries for the majority of employees has been a system of conciliation and arbitration supplemented by general wage orders. About half of New Zealand's wage and salary earners are subject to awards and collective agreements falling under the jurisdiction of the Industrial Relations Act 1973.
The State Services Remuneration and Conditions of Employment Act 1969, provides for determinations covering salaries and conditions of service for State employees to be made by employing authorities. A State Services Co-ordinating Committee has been established as the principal coordinating body for Government and as the main official negotiating body on issues having significant inter-service or “across the board” application. Hospital and Education Services Committees have been appointed to conduct negotiations on matters affecting respectively the hospital service alone and the education service (teachers) alone. There is a State Services Tribunal to hear appeals by employee organisations, and also a Government Service Tribunal, a Government Railways Industrial Tribunal, a Post Office Staff Tribunal, and a Hospital Service Tribunal, all with a common chairman.
Pay and allowances for the Armed Services are prescribed by the Secretary of Defence in accordance with provisions of the State Services Remuneration and Conditions of Employment Act 1969. A Police Staff Tribunal established under the Police Act 1958 makes orders as to the remuneration and conditions of service of members of the Police.
The State Services Remuneration and Conditions of Employment Act 1969 provides for the wages and salaries of all State servants to be adjusted half-yearly on the basis of an index of general movement from the half-yearly survey of wages and salaries conducted by the Department of Labour, but the operation of the October 1973 and April 1974 adjustments was suspended by the Economic Stabilisation Regulations 1973 and the Wage Adjustment Regulations 1974 further suspended this provision.
A significant feature of recent years has been the exceptionally high rate of wage and salary increases. Average weekly earnings have increased at nearly three times the average annual rate of 4.8 percent for the 10 years prior to 1970. Following the 1970 experience of a rise of 13.6 percent, consideration of deflationary measures began with discussions between the Government and representatives of the Employers' Federation and the Federation of Labour, with a view to slowing down the accelerated trade-by-trade leap-frogging which was occurring with wage bargaining. These discussions showed that the relativities issue was but one aspect of a total problem contributing to the inflationary spiral. Attention then turned to positive wage and salary stabilisation as part of an overall stabilisation programme, and on 25 March 1971 the Stabilisation of Remuneration Act was passed. This Act stipulated that new awards and agreements had to remain in force for at least 12 months and established an independent Remuneration Authority to administer certain arrangements under the Act. The Remuneration Authority continued to operate until December 1972, although in April 1972 the Stabilisation of Remuneration Act was superseded by the stabilisation of remuneration regulations.
After the abolition of the stabilisation of remuneration regulations in December 1972 there was a return to free collective bargaining within the framework of the Industrial Conciliation and Arbitration Act 1954. However, in response to increasing pressure on the level of wage settlements during the early part of 1973, direct Government intervention in the wage-fixing process was again deemed necessary and the Economic Stabilisation Regulations became effective on 10 August 1973. Under the regulations a partial wage pause until June 1974 was introduced with a Wages Tribunal being established to deal with various administrative aspects of the regulations, including the settlement of wage relativity anomalies caused by the regulations.
Following the expiry of the Economic Stabilisation Regulations on 30 June 1974, and in response to continued inflationary pressures within the economy, Government introduced long-term wage stabilisation measures. The Wage Adjustment Regulations 1974 became effective on 1 July 1974and form an integral part of a much wider economic stabilisation policy. From a wage bargaining viewpoint they represent a significantly less restrictive and more flexible wage control system than that previously operating; one of the major relaxations was a return to limited free collective bargaining for wages and conditions of employment.
GENERAL WAGE ORDERS—The General Wage Orders Act 1969 is presently suspended by the Wage Adjustment Regulations gazetted in June 1974. Prior to this the Act had been suspended during the currency of the Stabilisation of Remuneration Act 1971 and later by the Economic Stabilisation Regulations in August 1973.
Historically, general wage orders have been the principal source of a large number of general adjustments made to salary and wage payments in the economy. Before 1970, general wage orders were made by the Court of Arbitration under the authority of the Economic Stabilisation Regulations 1953. Since 1970 the empowering legislation has been the General Wage Orders Act 1969; and following the enactment of the Industrial Relations Act 1973, responsibility for making such orders has lain with the Industrial Commission.
When the Act is operational, general wage orders can be made by the Industrial Commission of its own initiative, or on the application of any industrial union or industrial association of employers or workers. The general purpose of the Act is to provide for the making of a just and equitable review of rates of remuneration in awards and industrial agreements. Every such review has to consider whether an adjustment should be made to rates of remuneration, in order to: (a) maintain and promote living standards, so far as it is within the capacity of the economy to sustain such an agreement; (b) promote industrial harmony; and (c) maintain and promote exports by New Zealand industry.
General wage orders from 1964 have been as follows:
| Date of Order | Effective Date | Increase in Minimum Wage Rates |
|---|---|---|
| *Application limited to first $40 a week for male workers, $30 for female workers and $25 for junior workers. Earlier, in June 1968, after a general wage order hearing, the Court had decided not to issue a general wage order. | ||
| percent | ||
| 19 August 1964 | 10 September 1964 | |
| 10 November 1966 | 1 December 1966 | 2 1/2 |
| 5 August 1968 | 19 August 1968 | 5* |
| 3 November 1970 | 23 November 1970 | 3 |
STABILISATION OF REMUNERATION—On 25 March 1971 the Stabilisation of Remuneration Act 1971 was passed which, among other things, limited the renegotiation of new agreements affecting remuneration for a minimum period of 12 months (subject to certain exceptions), and generally aimed to restrict the annual increase in such agreements to a maximum of 7 percent. In addition, a Remuneration Authority was established to administer certain arrangements under the Act.
Under the Act the Remuneration Authority was required to make cost of living orders as soon as possible after the Consumers' Price Index had been prepared by the Government Statistician for the quarters ended 30 June 1971 and 31 December 1971. Two orders were made by the Remuneration Authority—the first of 4.8 percent applying from 21 July 1971, and the second of 9.1 percent (including the order of 4.8 percent) applying from 31 January 1972. The orders applied automatically to all awards and agreements which, based on the rate of 1 January 1971, had not changed.
As from 1 April 1972, increases in pay were subject to the Stabilisation of Remuneration Regulations 1972, which were made under the Economic Stabilisation Act 1948. The Remuneration Authority continued to operate until 17 December 1972 when it was discontinued with the change in Government.
The main features of the regulations were:
The rates of remuneration under existing agreements and other instruments were to continue in force for the period of their currency and all new instruments were for a period of not less than 12 months.
Apart from certain increases for individuals (as under the Stabilisation Act), no increases in the rate of remuneration payable on 31 March 1972, could take effect without the authority's consent.
New criteria were established to guide the authority in making its decisions.
There was no longer a guideline or “specified percentage” for pay increases. The authority had to place “paramount importance on the need to achieve and maintain stability in the levels of remuneration and prices”.
The regulations provided that the authority could not consent to any increase in any rate of remuneration unless it was satisfied that it was warranted in the special circumstances of the particular case. The grounds on which the authority could consent to an increase were limited.
It could make adjustments to the minimum extent required to remove or relieve serious anomalies. It could also consent to increases in remuneration on the grounds of increased productivity, provided that the cost would not result in an increase in prices.
There would, however, be some increases in prices due to unavoidable costs including the increased costs of imports. The Government therefore decided to make provision for a cost of living order related to movement in the Consumers' Price Index over the 9 months ended in September 1972.
An order of 4.2 percent was made by the Remuneration Authority following publication of the index for the September 1972 quarter. The order applied automatically from 26 October 1972 to minimum rates in awards and industrial agreements as at 1 February 1972 and, by agreement between the parties, could be applied to other rates of pay.
As with the orders made under the 1971 Act, negotiated increases effective from February 1972 were offset against the order. But increases approved by the authority explicitly on the grounds of productivity not involving price increases were not to be offset.
Under the Economic Stabilisation Regulations 1973 a wage adjustment order increased wages by 8.5 percent, with a limit of $5.80 a week, from 11 August 1973.
Following the abolition of the Remuneration Authority in December 1972, New Zealand experienced a return to free collective bargaining during the earlier part of 1973. However, in response to the high level of wage and salary increases in the period of free bargaining, deflationary measures were considered necessary and resulted in the promulgation of the Economic Stabilisation Regulations 1973. These regulations became effective on 10 August 1973, the section relating to wages being designed to expire on or before 30 June 1974.
The main features of the regulations are now covered.
All instruments in force at the date of making of the regulations were to continue in force without amendment until the expiry of the regulations. All new instruments made subsequent to 10 August 1973 were to cover a period of not less than 12 months.
A wage adjustment order of 8.5 percent, up to a maximum of $5.80 per week, was introduced to be applied to all rates payable under any award or industrial agreement. The increase could also be applied to other rates of pay by agreement between the parties concerned. However, this order was to be offset by any increase effected during the period 1 February to 10 August 1973 (inclusive). The application of the wage adjustment order to State employees was limited to 6.2 percent up to a maximum of $4.60 per week.
A Wages Tribunal was established to remove or relieve any serious anomalies created by the regulations. Provision was also made for the tribunal to consider applications for wage increases on the basis of productivity gains.
Under the regulations a further wage adjustment order effective from 11 February 1974 was made on the basis of movements in the Consumers' Price Index during the 6 months ended 31 December 1973. The amount was 2.7 percent based on a 4.7 percent rise in the index over the period abated by 2 percent.
Subsequent to the expiry of the Economic Stabilisation Regulations on 30 June 1974, a new long-term wage stabilisation policy became effective. The Wage Adjustment Regulations 1974 represent a significant relaxation from the more stringent controls in force prior to 1 July. They provide for the control and adjustment of salaries and wages in both the private and state sectors and, as well, delineate specific guidelines for the control of special salaries such as those of members of Parliament and senior employees in the State services, public bodies, and local authorities.
Under the new regulations, an initial round of adjustment was created in three distinct tiers. The first of these provided for a general wage adjustment of 9 percent, effective from 1 July 1974, applying automatically to the rates of remuneration payable on 30 June 1974 under all awards and collective agreements. Its application to other types of industrial instrument (such as ruling rates or house agreements) was subject to agreement between the parties to the instrument concerned. State employees and officers of public bodies and local authorities automatically received the 9 percent order but the salaries of members of Parliament were specifically excluded from its scope. The general increase applied to every payment expressly stated in money terms, including piece rates and allowances.
In addition to the wage adjustment order the regulations restored freedom for a majority of those groups in the State and private sectors to negotiate a supplementary increase of up to 2.25 percent of the rate of remuneration payable on 30 June 1974. Members of Parliament and specific groups in the higher salaries category were excluded from this provision. Freedom for all groups to negotiate improvements in conditions of employment (such as sick leave, annual holiday, etc.) was restored.
The third tier of wage adjustment contained in the regulations enabled parties to negotiate wage and salary increases beyond the 2.25 percent limit, subject to the consent of the Industrial Commission or other appropriate wage-fixing tribunal.
Under the Wage Adjustment Regulations the Industrial Commission has power to grant cost-of-living increases (based on movements in the Consumers' Price Index) at intervals of not less than 6 months. The filing of applications for such orders is restricted to a central organisation (i.e., the Employers Federation or the Federation of Labour) or to the Minister of Labour. All groups covered by the regulations will receive the cost-of-living orders, although in the private sector their application is subject to the same conditions that applied to the general wage adjustment of 30 June 1974.
The first such cost-of-living increase applied from 15 January 1975; the amount was 4 percent on the first $75 of gross weekly earnings. It was judged that this increase combined with the earlier adjustments fully compensated for the rise in consumer prices in 1974 by a Government decision.
Other features of the Wage Adjustment Regulations are now given. All rates of remuneration are to remain fixed for at least 12 months. Exceptions to this provision are made for decisions of the Industrial Commission (including the effects of cost-of-living orders). A Higher Salaries Commission was established; its functions include the determination of salaries and allowances of members of Parliament, the salary of the highest paid executive officer of each of a number of corporations and other public bodies, salaries of the highest paid officers of local authorities and the salaries of certain university positions. The Industrial Commission (private sector) and the State Services Tribunal (State sector) have the authority to approve wage increases in order to remove or relieve any serious anomalies. They can also consider and approve genuine productivity agreements.
Wage increases authorised under the stabilising legislation are summarised as follows:
| Authority | Effective Date | Rate of Increase |
|---|---|---|
*This was a further increase on prescribed rates as at 1 January 1971, making a 9.1 percent cumulative increase. †Limited to 2.8 percent for State employees. ‡Maximum $5.80 per week, application to State employees limited to 6.2 percent (maximum $4.60 per week). §A supplementary increase of 2.25 percent could be negotiated. || On first $75 of gross weekly earnings. | ||
| percent | ||
| Stabilisation of Remuneration Act 1971 | 21 July 1971 | 4.8 |
| Stabilisation of Remuneration Act 1971 | 31 Jan 1972 | 4.3* |
| Stabilisation of Remuneration Regulations 1972 | 26 Oct 1972 | 4.2† |
| Economic Stabilisation Regulations 1973 | 11 Aug 1973 | 8.5‡ |
| Economic Stabilisation Regulations 1973 | 11 Feb 1974 | 2.7 |
| Wage Adjustment Regulations 1974 | 1 July 1974 | 9.0§ |
| Wage Adjustment Regulations 1974 | 15 Jan 1975 | 4.0|| |
MINIMUM WAGE—Enforceable minimum wage rates are determined under various statutes, the most universally applicable being the Minimum Wage Act 1945. This Act provides that workers of age 20 years and upwards must receive not less than the rates prescribed under the Act. In the great majority of cases, however, workers are subject to wage orders, awards, or industrial agreements relating to the particular industries in which they are employed and which provide somewhat higher enforceable minimum rates. The minimum wage for males is currently set at a rate which is lower than the standard rate for unskilled labour.
In July 1974 the minima became males $52.76 a week; females, $42.30 a week and in January 1975 they were raised to males $54.88 a week; females $46.65 a week.
EQUAL PAY—The Report of the Commission of Inquiry into Equal Pay (Parliamentary paper H.54 1971) was tabled in Parliament in September 1971. An Equal Pay Act give effect, in the main, to the Commission's recommendations was passed in October 1972. It provided for the phasing in of equal pay in five annual steps, ending in 1978, but an amendment to the Act in 1973 requires the phasing in to be completed by 1977. After this time there will be equal pay in the private and public sectors. The Government Service Equal Pay Act was passed in 1960.
INSTITUTIONAL SECTORS—A classification of salary and wage payments by institutional sectors is given in the following table for the year ended 31 March 1971.
| Institutional Sector | Payments | |
|---|---|---|
| 1971-72 | 1972-73 | |
| $(million) | ||
| Producer enterprises— | ||
| Corporate | 1,934.5 | 2,148.8 |
| Non-corporate | 307.0 | 345.5 |
| Producer boards | 5.4 | 6.1 |
| Government producer enterprises | 290.9 | 329.4 |
| Local government producer enterprises | 64.7 | 72.9 |
| Totals | 2,602.5 | 2,902.7 |
| Financial intermediaries— | ||
| Central bank | 36.8 | 41.8 |
| Trading banks - Central Government and private | ||
| Insurance and pension funds— | ||
| Central Government | 59.4 | 68.4 |
| Local Government | ||
| Private | ||
| Other financial intermediaries— | ||
| Central Government | 21.1 | 24.6 |
| Local Government | ||
| Private | ||
| Totals | 117.3 | 134.8 |
| General Government— | ||
| Central Government | 697.6 | 788.9 |
| Local Government | 90.8 | 105.9 |
| Totals | 788.4 | 894.8 |
| Private non-profit organisations serving households | 51.9 | 59.9 |
| Rest of world | 0.4 | 0.5 |
| Totals | 3,560.6 | 3,992.7 |
INDUSTRIAL CLASSIFICATION OF SALARY AND WAGE PAYMENTS—The data in the following table represent the results of an industrial classification of the salary and wage payments to employees during the latest three years ended 31 March. This information is extracted from returns required in connection with “pay as you earn” income tax.
Actual gross payments made during a year are not the exact equivalent of the earnings of the employees during that year. Accrued wages at the beginning of the year are taken into account but those accrued at the end of the year are not. The effect of this is normally insignificant.
The “enterprise” concept has been used in this classification. Under this concept where an individual or a company is concerned in two or more industries for which separate classifications are provided, the whole of the wage payments have been classified according to the predominant activity. In most statistical analyses the enterprise is subdivided into separate units where two or more industries are involved, and each unit is then appropriately classified. A minor exception to the general rule has been made in the case of the road passenger transport and the electricity supply services of local authorities. These activities have been included in the appropriate industries.
| Industry Group | Salary and Wage Payments | ||
|---|---|---|---|
| 1970-71 | 1971-72 | 1972-73 | |
| $(million) | |||
| Agriculture and livestock production | 116.4 | 125.4 | 146.0 |
| Forestry, hunting, and fishing | 10.9 | 11.9 | 12.6 |
| Mining and quarrying | 15.3 | 16.3 | 17.4 |
| Manufacturing, food, beverages, and tobacco | 222.7 | 261.1 | 292.3 |
| Manufacturing, textiles, wearing apparel, and made-up textiles | 107.2 | 121.0 | 124.3 |
| Manufacturing, wood, paper, chemical, etc., products (including miscellaneous manufacturing) | 318.8 | 376.3 | 415.5 |
| Manufacturing, metals and metal products | 223.8 | 265.6 | 296.2 |
| Construction | 243.3 | 278.9 | 317.8 |
| Electricity, gas, water, and sanitary services (not construction) | 45.7 | 53.8 | 61.5 |
| Commerce—wholesale and retail trade | 460.2 | 534.6 | 594.0 |
| Commerce—other | 150.5 | 174.7 | 203.0 |
| Transport, storage, and communication | 366.3 | 424.3 | 474.0 |
| Services, community, business, recreation, and personal | 796.6 | 916.2 | 1,037.5 |
| Activities not adequately described | 0.6 | 0.5 | 0.5 |
| Totals | 3,011.5 | 3,560.6 | 3,992.7 |
Percentage rates of increase during the last 3 years were: 1969-70 to 1970-71, 20.2 percent; 1970-71 to 1971-72 18.2 percent; 1971-72 to 1972-73 12.1 percent. It should be noted that the labour force has grown over the period.
WEEKLY EARNINGS—The Department of Labour carries out surveys at half-yearly intervals; returns are required from all establishments in which at least two persons (including working proprietors) are engaged; Government and local authority employment is included, but not farming, hunting, fishing, waterfront and seagoing work, domestic service in private households, and armed forces.
The following table shows the average weekly wage payout per person (covering males and females, adult and juvenile) derived from this survey during the last 11 years. Comparison is made, for those years for which figures are available, with the weighted average nominal wage rate for adult males as used in the wage rates index covering rates prescribed by all determining authorities.
| Date of Survey | Weekly Wage Payout per Person | Nominal Minimum Weekly Wage for Adult Males* as at End of Preceding Month | ||
|---|---|---|---|---|
| Aggregate Payout (Including Overtime, Bonus Earnings, etc.) for One Week Divided by— | Aggregate Ordinary-time Earnings Divided by Full-time and Half Part-time Employees | |||
| Full-time and Part-time Employees | Full-time and Half Part-time Employees | |||
| * Nominal minimum weekly wage, which relates to adult males only, is the weighted average of the sample rates used in the calculation of the Nominal Weekly Wage Rates Index. | ||||
| 1964—April | 34.085 | 35.312 | 31.720 | .. |
| October | 35.745 | 37.125 | 33.562 | .. |
| 1965—April | 36.881 | 38.301 | 34.381 | .. |
| October | 37.256 | 38.829 | 34.804 | .. |
| 1966—April | 38.052 | 39.676 | 35.346 | 36.369 |
| 1966—October | 38.947 | 40.714 | 36.503 | 37.337 |
| 1967—April | 40.200 | 42.001 | 37.551 | 38.435 |
| October | 39.971 | 41.771 | 38.463 | 38.959 |
| 1968—April | 41.303x | 43.130x | 39.378x | 39.232 |
| October | 42.385 | 44.394 | 40.824 | 41.524 |
| 1969—April | 44.286 | 46.382 | 41.898 | 41.942 |
| October | 45.046 | 47.369 | 42.778 | 42.885 |
| 1970—April | 47.852 | 50.378 | 44.874 | 44.887 |
| October | 51.157 | 54.077 | 48.579 | 49.902 |
| 1971—April | 56.493 | 59.725 | 53.613 | 56.891 |
| October | 59.299 | 62.844 | 57.055 | 60.631 |
| 1972—April | 63.932 | 67.622 | 60.970 | 63.415 |
| October | 65.016 | 69.006 | 62.632 | 63.830 |
| 1973—April | 71.755 | 76.103 | 67.886 | 68.957 |
| October | 74.937 | 80.007 | 71.818 | 75.176 |
| 1974—April | 80.895 | 86.324 | 77.070 | 77.422 |
| October | 88.469 | 94.877 | 85.633 | 86.364 |
HOURLY EARNINGS—In the following table average hourly earnings from the half-yearly surveys are shown; estimated average ordinary time worked by full-time employees has been obtained by dividing aggregate ordinary-time hours worked during one week by the sum of full-time employees plus half of the part-time employees; hence if there are any part-time workers the sum of the average ordinary-time hours and overtime hours will not be equal to the average time worked by full-time and part-time employees as shown in the last column.
| Date | Average Hourly Earnings for All Workers Covered by Half-yearly Survey | Average Weekly Hours Worked by Workers Covered by Half-yearly Survey | ||||
|---|---|---|---|---|---|---|
| Ordinary Time | Overtime | Ordinary Time and Overtime Combined | Ordinary Time (Estimated) Worked by Full-time Employees | Overtime (Estimated) Worked by Full-time Employees | Ordinary Time and Overtime Worked by Full-time and Part-time Employees Combined | |
| hours | hours | hours | ||||
| 1963—April | 0.818 | 1.242 | 0.845 | 37.9 | 2.7 | 39.1 |
| October | 0.831 | 1.230 | 0.856 | 37.8 | 2.7 | 39.0 |
| 1964—April | 0.839 | 1.252 | 0.868 | 37.7 | 3.0 | 39.2 |
| October | 0.880 | 1.306 | 0.917 | 37.8 | 2.8 | 39.0 |
| 1965—April | 0.908 | 1.337 | 0.939 | 37.6 | 3.1 | 39.0 |
| October | 0.927 | 1.367 | 0.956 | 37.7 | 3.1 | 39.0 |
| 1966—April | 0.939 | 1.418 | 0.975 | 37.7 | 3.2 | 39.0 |
| October | 0.967 | 1.432 | 1.000 | 37.8 | 3.1 | 38.9 |
| 1967—April | 0.996 | 1.518 | 1.033 | 37.7 | 3.1 | 38.9 |
| October | 1.019 | 1.505 | 1.046 | 37.7 | 2.3 | 38.2 |
| 1968—April | 1.042x | 1.543 | 1.072x | 37.8 | 2.5 | 38.5 |
| October | 1.081 | 1.581 | 1.109 | 37.8 | 2.4 | 38.2 |
| 1969—April | 1.108 | 1.634 | 1.144 | 37.8 | 2.9 | 38.7 |
| October | 1.137 | 1.679 | 1.174 | 37.6 | 2.9 | 38.4 |
| 1970—April | 1.193 | 1.791 | 1.238 | 37.6 | 3.2 | 38.6 |
| October | 1.303 | 1.934 | 1.348 | 37.3 | 3.0 | 38.0 |
| 1971—April | 1.440 | 2.178 | 1.491 | 37.2 | 3.0 | 37.9 |
| October | 1.5 Jo | 2.263 | 1.582 | 37.2 | 2.7 | 37.5 |
| 1972—April | 1.640 | 2.442 | 1.694 | 37.2 | 2.9 | 37.7 |
| October | 1.690 | 2.456 | 1.740 | 37.1 | 2.8 | 37.4 |
| 1973—April | 1.828 | 2.701 | 1.894 | 37.1 | 3.2 | 37.9 |
| October | 1.934 | 2.818 | 1.998 | 37.1 | 3.1 | 37.5 |
| 1974—April | 2.068 | 3.000 | 2.139 | 37.3 | 3.3 | 37.8 |
| October | 2.304 | 3.260 | 2.372 | 37.2 | 3.1 | 37.3 |
The preceding table combines all industries. A dissection by industrial groups of the last line of that table according to the major headings of the New Zealand Standard Industrial Classification, relating to October 1974, is now provided.
| Industrial Group | Average Hourly Earnings for All Workers Covered by Half-yearly Survey | Average Weekly Hours Worked by Workers Covered by Half-yearly Survey | ||||
|---|---|---|---|---|---|---|
| Ordinary Time | Overtime | Ordinary Time and Overtime Combined | Ordinary Time (Estimated) Worked by Full-time Employees | Overtime (Estimated) Worked by Full-time Employees | Ordinary Time and Overtime Worked by Full-time and Part-time Employees Combined | |
| hours | hours | hours | ||||
| Forestry and logging | 2.153 | 3.155 | 2.212 | 37.7 | 2.4 | 39.7 |
| Mining and quarrying | 2.543 | 3.182 | 2.640 | 36.4 | 6.6 | 42.5 |
| Manufacturing— | ||||||
| Seasonal food processing | 2.471 | 3.454 | 2.599 | 35.3 | 5.4 | 40.1 |
| Other food, beverages, and tobacco | 2.050 | 3.078 | 2.178 | 36.6 | 5.8 | 38.0 |
| Textiles, clothing, and leather | 1.886 | 2.916 | 1.952 | 35.7 | 2.7 | 35.5 |
| Wood and wood products | 2.102 | 3.188 | 2.221 | 37.3 | 4.7 | 40.7 |
| Paper and paper products, printing and publishing | 2.369 | 3.566 | 2.487 | 37.8 | 4.4 | 39.8 |
| Chemicals, petroleum, rubber, and plastics | 2.399 | 3.283 | 2.489 | 37.1 | 4.3 | 39.9 |
| Non-metallic mineral products | 2.198 | 3.250 | 2.360 | 35.8 | 6.7 | 41.2 |
| Metal products and engineering | 2.283 | 3.352 | 2.413 | 37.3 | 5.3 | 41.3 |
| Machinery | 2.278 | 3.372 | 2.402 | 37.8 | 5.0 | 41.7 |
| Electrical equipment | 2.042 | 3.019 | 2.129 | 37.1 | 3.8 | 38.8 |
| Transport equipment | 2.323 | 3.417 | 2.460 | 37.3 | 5.4 | 42.1 |
| Other manufacturing | 1.978 | 2.886 | 2.030 | 36.5 | 2.4 | 36.0 |
| Group | 2.207 | 3.288 | 2.323 | 36.7 | 4.6 | 39.4 |
| Electricity, gas and water | 2.508 | 3.587 | 2.595 | 38.3 | 3.4 | 41.2 |
| Construction | 2.247 | 3.194 | 2.357 | 38.8 | 5.1 | 43.9 |
| Wholesale, retail, etc.— | ||||||
| Wholesale trade | 2.377 | 3.122 | 2.407 | 38.1 | 1.6 | 38.1 |
| Retail trade | 1.835 | 2.868 | 1.867 | 37.0 | 1.4 | 32.4 |
| Restaurants, hotels, etc. | 1.905 | 2.788 | 1.955 | 33.3 | 3.2 | 25.9 |
| Group | 2.058 | 2.953 | 2.093 | 36.8 | 1.7 | 33.1 |
| Transport and communication— | ||||||
| Transport and storage | 2.394 | 3.534 | 2.542 | 38.2 | 5.8 | 43.0 |
| Communication | 2.388 | 3.593 | 2.463 | 38.8 | 2.7 | 40.0 |
| Group | 2.392 | 3.546 | 2.514 | 38.4 | 4.7 | 41.9 |
| Finance, insurance, etc.— | ||||||
| Finance | 2.496 | 3.141 | 2.502 | 37.9 | 0.4 | 36.8 |
| Insurance | 2.581 | 3.7 | 2.592 | 37.4 | 0.4 | 36.4 |
| Real estate and business services | 2.491 | 3.315 | 2.508 | 36.7 | 0.8 | 34.7 |
| Group | 2.510 | 3.323 | 2.522 | 37.2 | 0.6 | 35.7 |
| Community and personal services— | ||||||
| Government services, n.e.i. | 2.924 | 3.054 | 2.927 | 37.4 | 1.0 | 37.9 |
| Local Authorities, n.e.i. | 2.532 | 3.183 | 2.567 | 38.1 | 2.2 | 39.0 |
| Sanitary services, etc. | 1.881 | 2.972 | 1.929 | 32.7 | 3.1 | 22.7 |
| Education services | 2.852 | 3.061 | 2.853 | 35.6 | 0.1 | 33.4 |
| Research and scientific institutes | 3.307 | 3.762 | 3.318 | 37.5 | 1.0 | 37.7 |
| Health services | 2.301 | 2.677 | 2.315 | 38.5 | 1.7 | 35.5 |
| Other community services | 2.332 | 3.046 | 2.339 | 36.1 | 0.5 | 30.2 |
| Recreational services | 2.496 | 3.671 | 2.545 | 33.5 | 2.0 | 28.0 |
| Personal and household services | 1.943 | 2.992 | 1.991 | 38.0 | 2.0 | 37.3 |
| Group | 2.510 | 2.979 | 2.523 | 36.9 | 1.2 | 34.6 |
| All surveyed industries | 2.304 | 3.260 | 2.372 | 37.2 | 3.1 | 37.3 |
NOMINAL WAGE RATES—The present index dates from 1966 and is designed to represent the movements in all minimum or mandatory rates of pay fixed by or within the jurisdiction of the Industrial Commission or any special industrial tribunal, or determined from time to time by some statutory authority. Within this wider index a major sub-index is provided of minimum rates of pay fixed by or within the jurisdiction of the Industrial Commission. The residue then provides a second major sub-index of mainly mandatory rates fixed within the jurisdiction of other industrial tribunals or determined by some other statutory authority. Within the “All Jurisdictions” index and both the “Commission” and “Other Jurisdictions” major sub-indexes, further sub-indexes give analyses firstly by industry groups and secondly by occupation groups.
Complete details of the new revised index are contained in the Report of New Nominal Weekly Wage Rates Index for Adult Males published as a special supplement to the Monthly Abstract of Statistics in August 1968.
The next table shows the index numbers of nominal wage rates of adult males for industry and occupation groups. For revisions of recent quarters see Monthly Abstract of Statistics.
Base: For each group the average rates for that group at 31 December 1965 (= 1000)*.
| Industry Group | Average for Calendar Year | As at | ||||||
|---|---|---|---|---|---|---|---|---|
| 1972x | 1973x | 1974 | 31 Dec 1973x | 31 Mar 1974 | 30 Jun 1974 | 30 Sep 1974 | 31 Dec 1974 | |
| Part I—Rates Within the Jurisdiction of the Industrial Commission | ||||||||
| Industry Groups | ||||||||
| Primary industries | 1,578 | 1,759 | 1,998 | 1,848 | 1,899 | 1,899 | 2.08 | 2,123 |
| Manufacturing | 1,813 | 2,012 | 2,284 | 2,115 | 2,172 | 2,173 | 2,410 | 2,411 |
| Food, beverages, and tobacco | 1,698 | 1,890 | 2,156 | 1,992 | 2,046 | 2,046 | 2,281 | 2,281 |
| Meat processing and dairy factories | 1,676 | 1,867 | 2,128 | 1,968 | 2,021 | 2,021 | 2,248 | 2,248 |
| Other food, beverages, and tobacco | 1,801 | 2,001 | 2,291 | 2,109 | 2,166 | 2,166 | 2,436 | 2,436 |
| Textiles and apparel | 1,811 | 1,985 | 2,247 | 2,077 | 2,134 | 2,134 | 2,365 | 2,381 |
| Wood, pulp, paper and their products | 1,815 | 1,999 | 2,280 | 2,102 | 2,158 | 2,158 | 2,415 | 2,415 |
| Printing and allied industries | 1,903 | 2,120 | 2,408 | 2,221 | 2,281 | 2,281 | 2,548 | 2,548 |
| Metals, machinery and transport equipment | 1,912 | 2,130 | 2,402 | 2,235 | 2,295 | 2,295 | 2,523 | 2,523 |
| Other manufacturing | 1,804 | 1,991 | 2,270 | 2,102 | 2,161 | 2,161 | 2,392 | 2,393 |
| Construction | 1,865 | 2,049 | 2,332 | 2,166 | 2,225 | 2,225 | 2,437 | 2,474 |
| Electricity, gas, water, and sanitary services | 1,756 | 2,054 | 2,289 | 2,124 | 2,181 | 2,181 | 2,407 | 2,418 |
| Commerce | 1,762 | 1,986 | 2,256 | 2,089 | 2,145 | 2,145 | 2,376 | 2,382 |
| Wholesale and retail trade | 1,764 | 1,993 | 2,253 | 2,096 | 2,153 | 2,153 | 2,361 | 2,369 |
| Finance, insurance and real estate | 1,750 | 1,946 | 2,275 | 2,045 | 2,100 | 2,100 | 2,462 | 2,462 |
| Transport, storage and communications | 1,760 | 1,941 | 2,200 | 2,039 | 2,094 | 2,095 | 2,318 | 2,319 |
| Services industries | 1,723 | 1,928 | 2,196 | 2,038 | 2,096 | 2,096 | 2,312 | 2,312 |
| Occupation Groups | ||||||||
| Professional, technical, managerial | 1,726 | 1,963 | 2,236 | 2,073 | 2,129 | 2,129 | 2,347 | 2,366 |
| Clerical | 1,774 | 1,977 | 2,270 | 2,091 | 2,149 | 2,149 | 2,404 | 2,404 |
| Sales | 1,742 | 1,994 | 2,245 | 2,096 | 2,153 | 2,153 | 2,347 | 2,355 |
| Farm, forestry, fishing, mining | 1,626 | 1,810 | 2,059 | 1,904 | 1,956 | 1,956 | 2,172 | 2,186 |
| Transport | 1,755 | 1,922 | 2,186 | 2,016 | 2,071 | 2,071 | 2,314 | 2,315 |
| Craftsmen, process workers, labourers | 1,824 | 2,024 | 2,296 | 2,130 | 2,187 | 2,187 | 2,415 | 2,425 |
| Service occupations | 1,733 | 1,929 | 2,176 | 2,018 | 2,073 | 2,073 | 2,296 | 2,297 |
| All (industry or occupation) groups combined | 1,793 | 1,995 | 2,266 | 2,099 | 2,156 | 2,157 | 2,385 | 2,393 |
| Industry Group | Average for Calendar Year | As at | ||||||
|---|---|---|---|---|---|---|---|---|
| 1972x | 1973x | 1974 | 31 Dec 1973x | 31 Mar 1974 | 30 Jun 1974 | 30 Sep 1974 | 31 Dec 1974 | |
| Part 2—Rates Prescribed by Wage and Salary Determining Authorities Other Than the Industrial Commission | ||||||||
| Industry Groups | ||||||||
| Primary industries | 1,434 | 1,831 | 2,242 | 2,080 | 2,140 | 2,140 | 2,366 | 2,366 |
| Agriculture and livestock | 1,267 | 1,734 | 2,187 | 2,043 | 2,103 | 2,103 | 2,296 | 2,296 |
| Other primary | 1,819 | 2,053 | 2,369 | 2,165 | 2,223 | 2,223 | 2,528 | 2,528 |
| Manufacturing | 1,751 | 1,939 | 2,217 | 2,009 | 2,063 | 2,063 | 2,383 | 2,383 |
| Construction | 1,756 | 1,931 | 2,196 | 5,998, | 2,052 | 2,052 | 2,351 | 2,351 |
| Electricity, gas, water, and sanitary services | 1,805 | 1,992 | 2,271 | 2,055 | 2,111 | 2,111 | 2,443 | 2,443 |
| Commerce | 1,823 | 2,020 | 2,264 | 2,075 | 2,131 | 2,131 | 2,410 | 2,410 |
| Transport, storage and communication | 1,706 | 184 | 2,134 | 1,945 | 1,997 | 1,997 | 2,282 | 2,282 |
| Service industries | 1,892 | 2,091 | 2,338 | 2,145 | 2,202 | 2,202 | 2,487 | 2,487 |
| Education and health services | 1,893 | 2,083 | 2,322 | 2,132 | 2,189 | 2,189 | 2,469 | 2,469 |
| Government, community, business, personal and recreational services | 1,890 | 2,099 | 2,353 | 2,157 | 2,215 | 2,215 | 2,505 | 2,505 |
| Occupation Groups | ||||||||
| Professional, technical, managerial | 1,899 | 2,093 | 2,334 | 2,141 | 2,198 | 2,198 | 2,483 | 2,483 |
| Clerical | 1,797 | 1,994 | 2,241 | 2,052 | 2,107 | 2,107 | 2,387 | 2,387 |
| Farm, forestry, fishing, mining | 1,432 | 1,831 | 2,244 | 2,082 | 2,141 | 2,141 | 2,369 | 2,369 |
| Transport | 1,747 | 1,924 | 2,180 | 1,987 | 2,040 | 2,040 | 2,332 | 2,332 |
| Craftsmen, process workers, labourers | 1,695 | 1,869 | 2,128 | 1,935 | 1,987 | 1,987 | 2,282 | 2,282 |
| Service occupations | 1,971 | 2,201 | 2,484 | 2,275 | 2,337 | 2,337 | 2,645 | 2,645 |
| All (industry or occupation) groups combined | 1,749 | 1,965 | 2,238 | 2,049 | 2,104 | 2,104 | 2,386 | 2,386 |
| Industry Group | Average for Calendar Year | As at | ||||||
|---|---|---|---|---|---|---|---|---|
| 1972x | 1973x | 1974 | 31 Dec 1973x | 31 Mar 1974 | 30 Jun 1974 | 30 Sep 1974 | 31 Dec 1974 | |
| *Comparisons of the index numbers for one grouping of rates with those for other groupings indicate the relative movements in the average rates for the different groupings, not the relative levels of the average rates of wages and salaries in the different groupings. | ||||||||
| Part 3—Rates Within the Jurisdiction of All Determining Authorities | ||||||||
| Industry Groups | ||||||||
| Primary industries | 1,471 | 1,810 | 2,176 | 2,017 | 2,074 | 2,074 | 2,296 | 2,300 |
| Manufacturing | 1,803 | 2,000 | 2,272 | 2,102 | 2,159 | 2,159 | 2,399 | 2,400 |
| Construction | 1,832 | 2,013 | 2,290 | 2,117 | 2,174 | 2,174 | 2,407 | 2,435 |
| Electricity, gas, water, and sanitary services | 1,771 | 2,025 | 2,276 | 2,092 | 2,148 | 2,148 | 2,415 | 2,421 |
| Commerce | 1,758 | 1,980 | 2,247 | 2,080 | 2,136 | 2,136 | 2,368 | 2,374 |
| Transport, storage and communication | 1,724 | 1,903 | 2,155 | 1,976 | 2,029 | 2,030 | 2,294 | 2,294 |
| Service industries | 1,848 | 2,048 | 2,300 | 2,116 | 2,173 | 2,173 | 2,441 | 2,441 |
| Occupation Groups | ||||||||
| Professional, technical, managerial | 1,858 | 2,062 | 2,310 | 2,123 | 2,180 | 2,180 | 2,450 | 2,455 |
| Clerical | 1,780 | 1,980 | 2,252 | 2,069 | 2,126 | 2,126 | 2,391 | 2,391 |
| Sales | 1,735 | 1,986 | 2,236 | 2,088 | 2,144 | 2,144 | 2,337 | 2,345 |
| Farm, forestry, fishing, mining | 1,495 | 1,822 | 2,179 | 2,019 | 2,076 | 2,076 | 2,299 | 2,304 |
| Transport | 1,752 | 1,923 | 2,184 | 2,005 | 2,059 | 2,059 | 2,321 | 2,322 |
| Craftsmen, process workers, labourers | 1,792 | 1,987 | 2,255 | 2,084 | 2,140 | 2,140 | 2,380 | 2,388 |
| Service occupations | 1,818 | 2,026 | 2,285 | 2,109 | 2,166 | 2,166 | 2,421 | 2,421 |
| All (industry or occupation) groups combined | 1,778 | 1,985 | 2,256 | 2,082 | 2,138 | 2,138 | 2,385 | 2,391 |
Allowances for housing, board and lodging, or rations are included in cases where these are normally provided in addition to the cash pay.
EFFECTIVE WEEKLY WAGE RATES—The index numbers quoted in the foregoing paragraphs relate to nominal weekly wage rates only—that is, they are based on actual or equivalent money rates without any allowance being made for changes during the period under review in the prices of those goods and services which are purchased out of wages earned. It is obvious that this factor is of considerable importance, for a rise in wage rates may be offset by a fall in the purchasing power of the monetary unit, while, on the other hand, a fall in money wages may be offset by a rise in the purchasing power of money. Index numbers of effective (or “real”) wage rates are arrived at by dividing the index numbers of nominal wage rates by the corresponding all-groups index numbers of consumer prices (both series of index numbers having first been set on a common time base) and multiplying the result by the base value of 1000.
The following table accordingly shows a comparison of nominal and effective weekly wage rates of adult male workers. The base of the index numbers is in each case 31 December 1965 (= 1000).
| Year | Consumer Prices (All Groups) | Nominal Weekly Wage Rates Adult Males | Effective Weekly Wage Rates Adult Males |
|---|---|---|---|
| *Provisional. | |||
| 1956 | 777 | 748 | 963 |
| 1957 | 794 | 783 | 986 |
| 1958 | 829 | 791 | 954 |
| 1959 | 860 | 806 | 937 |
| 1960 | 866 | 846 | 977 |
| 1961 | 882 | 860x | 975 |
| 1962 | 905 | 881 | 973 |
| 1963 | 923 | 905 | 980 |
| 1964 | 956 | 933 | 976 |
| 1965 | 988 | 989 | 1,001 |
| 1966 | 1,016 | 1,017 | 1001x |
| 1967 | 1,077 | 1,070 | 994 |
| 1968 | 1,124 | 1,111 | 988 |
| 1969 | 1,179 | 1,176 | 997 |
| 1970 | 1,256 | 1,327 | 1,057 |
| 1971 | 1,386 | 1,628 | 1,175 |
| 1972 | 1,482 | 1,778 | 1,200 |
| 1973 | 1,604 | 1985x | 1238x |
| 1974* | 1,782 | 2,256 | 1,266 |
The continuous index of consumer prices required for the foregoing table has been obtained by linking together the successive series of the Consumers' Price Index and converting the whole to the base: quarter ended 31 December 1965 (= 1000).
In making use of these results it should not be overlooked that the index numbers of nominal rates apply only to full-time employment at award or mandatory rates of pay. They do not take into account either, on the one hand, above-award rates or overtime earnings, or on the other, short-time deductions. Nor do the consumer prices index numbers take cognisance of all classes of household expenditure; income tax, charitable and other gifts, air and overseas travel, domestic help, etc., are omitted.
AVERAGE MINIMUM WEEKLY WAGES—A table showing minimum wages in various occupations is given in the annual statistical report Prices, Wages, and Labour available in Government bookshops.
FARM EMPLOYEES—A survey of farm employment was made by the Department of Statistics in 1972 and the following table shows salaries and wages (including bonuses) paid to permanent employees; no account is taken of free housing and food, etc.
| Farm Type | Paid Permanent Employees on 15 June 1972 | Salaries and Wages Year Ended 30 June 1972 | ||
|---|---|---|---|---|
| Males | Females | Males | Females | |
| $(000) | $(000) | |||
| Dairy | 5,972 | 2,145 | 14,377 | 2,271 |
| Sheep | 3,659 | 657 | 8,440 | 476 |
| Beef | 774 | 161 | 1,824 | 134 |
| Pig | 186 | 33 | 553 | 33 |
| Cropping | 172 | 21 | 415 | 12 |
| Dairy with sheep | 255 | 83 | 584 | 79 |
| Dairy with beef | 615 | 230 | 1,528 | 232 |
| Dairy with other | 194 | 65 | 469 | 72 |
| Sheep with beef | 4,818 | 610 | 12,308 | 477 |
| Sheep with cropping | 612 | 108 | 1,388 | 59 |
| Sheep with other | 183 | 26 | 396 | 13 |
| Beef with sheep | 1,199 | 159 | 3,024 | 143 |
| Beef with other | 72 | 27 | 166 | 22 |
| Cropping with sheep | 367 | 52 | 895 | 31 |
| Cropping with other | 45 | 7 | 135 | 6 |
| Mixed livestock | 4,079 | 638 | 10,505 | 529 |
| General mixed farming | 1,139 | 141 | 2,786 | 109 |
| Poultry | 339 | 221 | 1,002 | 276 |
| Orchardist | 955 | 203 | 3,000 | 344 |
| Market gardening | 561 | 203 | 1,638 | 313 |
| Tobacco grower | 130 | 26 | 400 | 30 |
| Nurseries | 304 | 58 | 1,063 | 114 |
| Other farming | 917 | 80 | 3,096 | 119 |
| Total | 27,547 | 5,954 | 69,992 | 5,894 |
INTERNATIONAL COMPARISON—Average hourly earnings of adults (both sexes) in non-agricultural sectors in 1973 were as follows: United States. US$3.89; New Zealand NZ$1.94, and in Canada average weekly earnings (both sexes) were Can $160.24. For adult males in non-agricultural sectors in 1973 average weekly earnings in Australia were A$108.80 and average hourly earnings in the United Kingdom £0.90. (Source: International Labour Office — Yearbook of Labour Statistics). Exchange rates are given in Section 29.
GENERAL—The Industrial Relations Act 1973 is the first major restructuring of New Zealand's industrial legislation and institutions since 1894. It provides a new charter for the conduct of industrial relations. It replaced the Industrial Conciliation and Arbitration Act 1954, the Labour Disputes Investigation Act 1913, and the Industrial Relations Act 1949.
Institutions—The Industrial Relations Act has provided for a separation of the functions of the former Court of Arbitration in the belief that the more strictly legal functions of interpretation and enforcement should not be carried out by a body which has an arbitral role.
The Industrial Commission has taken over the arbitral functions of the former Court of Arbitration. The commission has jurisdiction for the settlement of disputes of interest (i.e., disputes during the negotiation or renewal of an agreement) and for the making of awards. Collective agreements negotiated voluntarily by the parties to a dispute of interest are registered with the commission. Registration of collective agreements is an important provision in that agreements will be binding on the parties.
The Industrial Court is the ultimate court of appeal on disputes of rights (i.e., disputes over the interpretations of an instrument, personal grievances, and other disputes arising while an instrument is in force). The Court also hears and determines enforcement and recovery actions.
An Industrial Relations Council has been established as an advisory body comprising representatives at national level of employer organisations, worker organisations, and Government. Establishment of the council recognises the need for permanent machinery for central consultation on industrial affairs. The council gives advice to the Government on ways of improving current industrial legislation in order to accommodate changes in the industrial environment. Some specific matters to which the council gives consideration are: the formulation and implementation of manpower policies; the formulation of codes of practice relating to industrial relations; ways and means of improving industrial relations, industrial organisations, and industrial welfare.
Right to Strike—By removal of previous provisions which made strikes illegal, the Act gives implicit recognition to the right to strike and as a consequence no blanket punitive provisions for strike action are made. However, the following controls remain: stoppages over disputes of rights are tantamount to breach of award or collective agreement and may incur appropriate penalties; once a dispute is before a conciliation council, stoppages in connection with the dispute are prohibited and a strike in these circumstances is a breach of the Act; in essential industries 14 days notice of proposed strike or lockout action must be given; the Minister of Labour has the power to call a compulsory conference of parties wherever he has reasonable grounds for believing a strike or lockout exists or threatens; in extreme cases the Minister of Labour may deregister a union.
INDUSTRIAL DISPUTES—The Industrial Relations Act 1973 defines two classes of disputes—disputes of interest, and disputes of rights.
Disputes of Interest—A dispute of interest is defined as a dispute created with intent to procure a collective agreement or award settling terms or conditions of employment of workers in an industry.
The Act recognises the right of parties to a dispute to negotiate a voluntary settlement, or a conciliated settlement resulting in a collective agreement. The procedures available for the settlement of disputes of interest include: (a) The Industrial Mediation Service; (b) the Industrial Conciliation Service; (c) the Industrial Commission.
Industrial Mediation Service—The Industrial Mediation Service continues to provide assistance to employers, workers, and their respective organisations to prevent or settle disputes (including disputes of interest) at an early stage. The mediator, however, has no jurisdiction over an industrial dispute which is the subject of conciliation or arbitration proceedings. The service consists of mediators, appointed by the Governor-General on the recommendation of the Minister after consultation with the central organisations of employers and workers.
In carrying out his duties and responsibilities a mediator has the following functions and powers:
To use his best endeavours to prevent industrial disputes.
Where he, or any employer or union considers that an industrial dispute is likely to arise, to offer his services to the parties to assist in preventing the dispute.
When an industrial dispute arises, to offer his services to the parties to assist them in bringing about a settlement of the dispute.
In giving such assistance, to inquire fully into the dispute and all matters affecting its merits and to make such suggestions and recommendations and do all such things as he thinks right and proper for inducing the parties to come to a fair and amicable settlement.
Where the parties to an individual dispute agree, to decide such matters as they may refer to him for decision.
To maintain a close and continuous liaison with the parties in industry, and to carry out such studies and surveys as will enable him to exercise his functions.
To exercise such other functions as conferred on him by the Act.
The service operates independently of any Government department, and any mediator may exercise his function within any part of New Zealand.
One of the major causes of industrial disputes is a breakdown in communications. This might occur either between union officials and their members, or between management and those same workers, or any combination of both. The Industrial Mediation Service continues to perform an invaluable role in ensuring a constant dialogue between parties where normal channels have broken down, and in facilitating prompt settlement of an industrial dispute before an unnecessary stoppage or severe deterioration in industrial relations occurs. However, in order to fulfil his functions satisfactorily, the co-operation and assistance of employers, workers, and their organisations with the mediator is essential, particularly in advising him of problems and seeking and accepting his assistance when the need arises.
Industrial Conciliation Service—The Industrial Conciliation Service (now attached to the Industrial Commission) continues to be available to assist the parties to reach a conciliated settlement over a dispute of interest. Conciliators are appointed for a term of 3 years by the Governor-General on recommendation of the Minister. Their general functions are to convene conciliation councils, and ensure that the parties enter properly into the process of reconciling their differences.
In performing his duties the conciliator has the following functions and powers: to appoint dates for the hearing of disputes in consultation with representatives of the parties; to appoint assessors and constitute conciliation councils; to join or strike out parties to a dispute; to call conferences; to record the proceedings of conciliation councils; to report to the commission the terms of settlement of any industrial dispute; to refer unsettled disputes to the commission.
Either party to a dispute of interest may make application to the Industrial Commission for the dispute to be heard by a conciliation council. Where an award or collective agreement is in force, application must be made not more than 6 months before the expiry of the instrument (3 months for disputes affecting a single district). The applicant must cite the respondent parties to the dispute, and prepare a detailed statement of the claims against the respondents. The Industrial Commission, when it receives the application, will appoint a conciliator to hear the dispute.
Copies of the application, incorporating the claims, must be forwarded to the Registrar of the Industrial Commission, the conciliator, the central organisations, and the respondent parties, not less than 6 weeks before the commencement of the hearing. The respondents are to prepare their counter claims, and forward the requisite copies not less than 2 weeks before the commencement of the hearing. Each party is then entitled to nominate up to seven assessors, or up to four in a dispute affecting a single industrial district, to act on their behalf in the conciliation council. Where it is claimed by the applicants or respondents that more than 7 or 4 assessors are needed to represent them adequately, the conciliator will have the power to increase the numbers of assessors up to 10 (6 in the case of a dispute affecting a single district) as he thinks fit. Before appointing the assessors nominated by the parties, the conciliator must be satisfied that they are fully representative of the parties to the dispute and have the authority to make a settlement. The assessors and the conciliator form the conciliation council.
The primary function of the conciliation council is to reconcile conflicting viewpoints and reach a settlement in the dispute. In deciding matters of procedure before the council a decision of a majority of assessors will suffice, or where the assessors are equally divided, the conciliator will have the casting vote.
Where complete agreement is reached in conciliation, the terms of the conciliated settlement are referred to the Industrial Commission for registration. A copy is retained at the office of the commission and copies are also sent to the central organisations, to the representatives of the parties, and to the Secretary of Labour. The commission will be responsible for printing and publishing collective instruments.
By force of the Act, unless agreed otherwise, a collective agreement binds every union, association, or employer who is connected with the industry to which the agreement applies.
Any party to such an agreement may, within 1 month of the agreement coming into force, apply to the Industrial Commission for a total or partial exemption. The commission may grant such an exemption, either in whole or in part, and subject to such conditions as it thinks necessary.
In New Zealand, conciliation has always played an important and integral role in the formal industrial relations system. Indeed, in by far the majority of disputes, complete agreement has been reached in conciliation. It has been considered essential, therefore that the characteristics of the conciliation service should be retained in the new industrial relations legislation.
The emphasis in conciliation is on negotiation and compromise. However, where the parties have reached a deadlock in negotiations, the conciliator, by ascertaining the parties' true position, can assist in reconciling their differences. In so doing he can substantially reduce the area of conflict.
Industrial Commission—If the parties ate unable to reach a settlement in conciliation, the dispute, with any partial settlement, is referred to the Industrial Commission for arbitration. The commission comprises five members, two of whom are appointed on recommendation of the workers and employers central organisations, the remaining three not representing any sectional interest. Of the three, one is appointed president of the commission and another deputy president. The appointment of the president and deputy president is made after consultation with the central organisations (and after taking into account the views of non-affiliated organisations).
The jurisdiction of the commission is exercised only if the parties fail to reach complete agreement in conciliation. Before arbitrating, the commission will first hear representations from the parties to the dispute. However, the exercise of the commission's arbitral powers is by no means automatic. Indeed, if the commission is not satisfied that the parties have made a genuine attempt to settle, it may refer the matter back to the conciliation council. This provision is in line with current legislation. The commission might also, with the consent of both parties, refer the dispute to a mediator if it is satisfied that this might assist the parties to reach agreement.
When the Commission arbitrates, an award is made which is binding on the parties to the dispute and every other union, association or employer who is connected with or engaged in the industry and area to which the award applies. Exemption may be sought in the same manner as for collective agreements settled in conciliation.
Voluntary Settlements—Apart from the formal machinery available to the parties for the conciliated settlement of interest disputes, the parties may jointly agree to negotiate a collective agreement for the voluntary settlement of the dispute. In these cases, a negotiating committee will be formed, comprising an equal number of properly appointed representatives of employers and the union of workers. The voluntary settlement is recorded in writing by the parties and forwarded to the Industrial Commission for registration as a collective agreement. The registered agreement will bind only the signatory parties. Any union or association or employer within the locality of the agreement may, with the consent of the original parties, become a party to the agreement by filing with the Registrar of the Industrial Commission a notice of concurrence.
Disputes of Rights—Disputes of rights are defined as those concerning the interpretation, application, or operation of a collective agreement or award; interpretation, application, or operation of an enactment or contract of employment, being a matter related to a collective agreement or award; any dispute that is not a dispute of interest; or a personal grievance arising from a claim that a worker has been unjustifiably dismissed by his employer, or his employment otherwise adversely affected by action not generally applicable to workers in similar circumstances.
Every award or collective agreement is to contain procedures for determining disputes of rights and personal grievances. Disputes committees comprising representatives of the union and the employer and a chairman agreed on by the parties or a conciliator or a person appointed by him are to determine disputes of rights other than personal grievances. If the members of the committee are unable to reach a settlement the chairman may either make a decision or refer the dispute to the Industrial Court for settlement. There is a right of appeal to the Industrial Court against a decision of the committee.
If a worker has grounds for personal grievance, the matter is to be taken up initially with his supervisor and in turn the union representative may take it up with the employer. If settlement is not reached, it will go before a disputes committee comprising a maximum of three representatives from each side. If the committee cannot reach a decision the matter goes to the Industrial Court for decision.
INDUSTRIAL UNIONS—The New Zealand system of conciliation and arbitration is based on the voluntary registration of industrial unions and industrial associations. The Industrial Relations Act 1973 simplified and consolidated procedures developed over the years under the former Industrial Conciliation and Arbitration Act. A sliding scale operates to determine the minimum number required to form a union depending on the number of industrial districts in which the union has coverage. A union of employers with coverage of up to one full industrial district is to have a minimum of six members or more than 75 percent of employers engaged in the industry in the area concerned who together employ more than 75 percent of the workers so engaged, with an absolute minimum of three. A union of workers with coverage of up to one full industrial district is to have a minimum of 30 members or more than 50 percent of the total number of workers engaged in the industry in the area concerned with an absolute minimum of 10 members. The prime minimum and the absolute minimum figures increase progressively with coverage of a greater number of industrial districts. If the membership of a union falls below the minimum requirements the union may be deregistered
The great majority of unions of workers and employers in the private enterprise field are registered under the Industrial Relations Act. The wages and conditions of the majority of agricultural workers have been determined by wage orders made under the Agricultural Workers Act 1962 but it is now proposed to bring them within the scope of the Industrial Relations Act. The history and development of industrial unions is covered comprehensively in Industrial Conciliation and Arbitration in New Zealand by N. S. Woods.
Further provisions of the Industrial Relations Act 1973 operate to deter multiple unionism and simplify the procedures for amalgamation of unions. It is hoped that this will give impetus to amalgamation of unions.
Restrictions on the exercise of welfare activities by unions have been removed and unions are able, subject to membership approval, to devote any percentage of subscription to welfare activities. A union may apply funds to furtherance of political objects if this is decided by a secret ballot of members.
Awards and collective agreements may, by agreement of the parties or by wish of the majority of the workers concerned, contain a provision making membership of a union a condition of employment, but not so as to restrict an employer's right to engage a worker who at the time of engagement is not a member of the union. Where no such “unqualified” preference provision is inserted, the award or collective agreement will contain a “qualified” preference provision. This requires the employer to give preference to a unionist over a non-unionist if the non-unionist is engaged and subsequently fails to become or remain a member of the union, provided that the non-unionist has been requested by a representative of the union to become a member and that a union member is ready and willing to be engaged and is equally qualified to do the particular work required. In fact, since the provision was first introduced the representatives of the parties involved in all negotiations for new awards or agreements have unanimously agreed to include the “unqualified” preference provision.
UNIONS OF WORKERS—In the years subsequent to 1936, when changes in the law enabled national unions of workers to be formed and introduced compulsory membership of unions, two tendencies were visible. The first was the immediate creation of many new small unions, the number of unions jumping from 410 in 1935 to 499 in 1937, as many small groups of workers for the first time became unionised and secured an award. Later, a tendency for small unions to amalgamate into New Zealand unions became evident, so that the total number of unions declined at the same time as the number of larger unions increased. By 1942 the result of these changes was to leave the number and membership of the small unions little different from what they were in 1928, but substantially to increase the number of larger unions, and to increase greatly their membership.
Compulsory unionism resulted in a great numerical strengthening of the existing unions with consequential increase in their financial strength, while the legislation enabling national unions to be formed helped to consolidate these gains: at the same time it resulted in the unionisation of many small groups of workers who were previously unorganised. Since 1962 the State has not imposed compulsory union membership.
The union movement remains diverse, with 309 separate registrations and some important unions and the professional associations outside it*. In size, the registered unions range from about 43,000 members† down to 5, with many of them having fewer than 100. Amalgamation is proceeding and significant consolidation has occurred in recent years.
Most unions are still occupational, or craft-based, and the industry agreements that are becoming more common—especially at the informal bargaining level—require the co-operation of numerous unions‡.
The Act provides for a worker to seek a certificate of exemption from any union-membership provision on grounds of conscience.
Federation of Labour—The great increases in the membership of the trade unions brought about by compulsory unionism and the formation of national unions were factors facilitating the formation of the Federation of Labour in 1937 as an organisation representative of the trade union movement as a whole on a national basis.
The supreme authority of the Federation of Labour is the annual conference of delegates representing affiliated unions. Between conferences the business of the federation is carried on by a National Executive Committee and a National Council. The executive consists of the president, vice president, secretary, and six members elected directly by the conference. The National Council which meets regularly twice a year, and at other times as required, consists of members of the National Executive and is representative of each local trades council. It is the governing body of the federation between meetings of the conference. The local organs of the federation are the local trades councils, 20 in number, and one trade union committee, to which all local unions and branches of unions affiliated to the Federation of Labour are entitled to send representatives. The trades councils meet once a month to carry on the local business of the federation and they maintain close contact with the National Executive by means of exchange of minutes of meetings. Within each district the trades council has local autonomy, but where any matter affects other districts the National Executive or the National Council usually deals with it.
UNIONS OF EMPLOYERS—By registering, the employers secure all the rights of a union and can exercise them, with only minor differences, in the same manner as a union of workers.
Compulsory membership of unions does not apply to employers and in many cases their unions are maintained with a nominal membership.
Employers are more organised for negotiations with unions than figures of membership and the prevalence of local unions of employers might suggest. The New Zealand Employers Federation is the central organisation of employers and the chief co-ordinating body of employers in all matters of industrial relations and employment. It comprises four regional divisions (the Auckland Provincial, Wellington Regional, Canterbury, and Otago-Southland Employers Associations) plus national and North or South Island organisations that are admitted to membership of the Federation's General Council. There are nearly 70 in this latter category.
*Mainly the State services organisations, and the pulp and paper workers.
†The Engineers Union.
‡More than a dozen, for example, in the forest products agreements and in the Hutt Valley motor vehicle assembly plants agreement.
Individual company membership of the four regional divisions of the federation now exceeds 10,000 and these employers receive advice, assistance, and representation from the associations' specialist industrial staff. In addition to work in the negotiations and advocacy field, the Employers Federation has staff handling research and information services.
A new constitution adopted by the federation in 1971 was designed to achieve greater unity amongst employers and employer organisations associated with the federation, and greater employer sector participation has been provided in the formulation of the federation's policies.
STATISTICS: Unions of Workers—The numbers and membership of workers' unions at the end of the year according to industry groups is shown in the following table. Where the members of a union are employed in more than one industry they have been classified to the predominant industry for the union concerned.
| Industrial Group | 1971 | 1972 | 1973 | |||
|---|---|---|---|---|---|---|
| Unions | Members | Unions | Members | Unions | Members | |
| *Revised figures. | ||||||
| Agriculture, grazing, etc. | 5 | 9,381 | 5 | 9,195 | 5 | 14,551 |
| Mining and quarrying | *6 | 507 | *4 | 442 | 4 | 424 |
| Manufacturing— | ||||||
| Metal products and engineering | 17 | 47,932 | 16 | 47,519 | 15 | 50,850 |
| Textiles, clothing, and leather | 25 | 28,269 | 24 | 28,525 | 23 | 32,358 |
| Food, beverages, and tobacco, including seasonal | 48 | 45,653 | *47 | 45,555 | 45 | 44,714 |
| Wood and wood products, including furniture | 9 | 15,442 | 9 | 16,794 | 9 | 15,561 |
| Paper and paper products, printing, and publishing | 10 | 8,577 | 10 | 9,475 | 4 | 11,487 |
| Chemicals, petroleum, rubber, and plastics | 10 | 3,123 | *9 | 3,331 | 9 | 3,720 |
| Non-metallic mineral products | 5 | 1,374 | 5 | 1,431 | 5 | 1,787 |
| Other manufacturing | *11 | 904 | 11 | 967 | 10 | 989 |
| Construction | 22 | 43,265 | *21 | 41,776 | 14 | 41,777 |
| Road and rail transport | *16 | 32,399 | 17 | 34,280 | 17 | 34,126 |
| Air transport | 5 | 1,142 | 5 | 1,189 | 5 | 1,479 |
| Shipping and stevedoring | *42 | 13,045 | 44 | 14,488 | 36 | 14,805 |
| Finance, insurance, real estate etc. | *30 | 53,553 | 31 | 55,611 | 31 | 60,485 |
| Wholesale and retail trade, including hotels, restaurants, etc. | *36 | 59,753 | *35 | 60,489 | 34 | 72,142 |
| Government and local authority | 14 | 9,464 | 14 | 10,646 | 14 | 11,578 |
| Recreational services | 11 | 3,809 | *10 | 3,942 | 10 | 4,528 |
| Social community services including health, education, etc. | *3 | 293 | 3 | 343 | 4 | 535 |
| Other personal and community services | 11 | 8,390 | 11 | 8,750 | 11 | 9,796 |
| Total | *336 | 386,275 | *331 | 394,748 | 305 | 427,692 |
In the following table industrial unions of workers are classified according to membership.
| At 31 December | Under 100 | 100 -199 | 200 -299 | 300 -499 | 500 -999 | 1,000 -1,999 | 2,000 -2,999 | 3,000 -4,999 | 5,000 -9,999 | 10,000 and Over | Total |
|---|---|---|---|---|---|---|---|---|---|---|---|
| Number of Unions | |||||||||||
| 1901 | 142 | 30 | 19 | 5 | 4 | 1 | 1 | - | - | - | 202 |
| 1911 | 182 | 53 | 26 | 23 | 14 | 8 | - | - | 1 | - | 307 |
| 1921 | 239 | 70 | 36 | 28 | 28 | 11 | 3 | 2 | 1 | - | 418 |
| 1931 | 239 | 58 | 31 | 30 | 29 | 14 | 3 | - | 1 | - | 405 |
| 1941 | 184 | 70 | 38 | 38 | 32 | 27 | 13 | 10 | 5 | 2 | 419 |
| 1951 | 165 | 69 | 44 | 38 | 39 | 28 | 11 | 11 | 7 | 3 | 415 |
| 1961 | 147 | 58 | 39 | 39 | 46 | 25 | 15 | 11 | 11 | 4 | 395 |
| 1971 | 117 | 39 | 29 | 37 | 39 | 29 | 13 | 13 | 14 | 6 | 336 |
| 1972 | 108 | 41 | 27 | 35 | 42 | 30 | 15 | 13 | 13 | 7 | 331 |
| 1973 | 92 | 36 | 24 | 30 | 42 | 30 | 18 | 9 | 16 | 8 | 305 |
| Membership | |||||||||||
| 1901 | 5,777 | 4,032 | 4,815 | 2,073 | 2,520 | 1,651 | 2,900 | - | - | - | 23,768 |
| 1911 | 7,521 | 7,686 | 6,360 | 8,879 | 9,685 | 9,414 | - | - | 6,084 | - | 55,629 |
| 1921 | 11,222 | 9,708 | 9,182 | 11,066 | 18,527 | 14,580 | 7,433 | 6,506 | 9,495 | - | 97,719 |
| 1931 | 9,969 | 7,966 | 7,578 | 11,244 | 20,602 | 18,566 | 6,744 | - | 7,857 | - | 90,526 |
| 1941 | 7,909 | 9,768 | 9,207 | 15,060 | 22,841 | 35,417 | 31,102 | 41,191 | 28,987 | 20,657 | 231,049 |
| 1951 | 7,875 | 10,225 | 10,394 | 14,671 | 27,274 | 39,658 | 27,364 | 43,218 | 40,278 | 52,000 | 272,957 |
| 1961 | 6,374 | 7,922 | 9,374 | 14,643 | 32,619 | 35,300 | 34,720 | 46,061 | 72,393 | 65,341 | 324,747 |
| 1971 | 5,064 | 5,298 | 7,266 | 14,748 | 26,844 | 42,346 | 31,166 | 49,788 | 98,144 | 105,611 | 386,275 |
| 1972 | 4,672 | 5,701 | 6,491 | 13,564 | 28,709 | 43,003 | 35,384 | 51,169 | 85,224 | 120,831 | 394, 748 |
| 1973 | 4,060 | 5,250 | 5,651 | 11,838 | 28,482 | 42,795 | 43,765 | 33,174 | 106,762 | 145,975 | 427,692 |
NOTE—Unions in process of cancellation at the end of each year and for which no membership figures are available have been included in with the unions with less than 100 members.
The following table shows the total membership of industrial union of workers at the end of each of the latest 42 years. The most noticeable feature is the steep rise in 1936. This was as a result of the 1936 amendment to the Industrial Conciliation and Arbitration Act which made union membership compulsory whenever an award or industrial agreement existed.
| Year | Number of Members |
|---|---|
| 1933 | 71,888 |
| 1934 | 74,391 |
| 1935 | 80,929 |
| 1936 | 185,527 |
| 1937 | 232,986 |
| 1938 | 249,231 |
| 1939 | 254,690 |
| 1940 | 248,081 |
| 1941 | 231,049 |
| 1942 | 218,398 |
| 1943 | 214,628 |
| 1944 | 223,027 |
| 1945 | 229,103 |
| 1946 | 247,498 |
| 1947 | 260,379 |
| 1948 | 271,100 |
| 1949 | 275,977 |
| 1950 | 275,779 |
| 1951 | 272,957 |
| 1952 | 283,496 |
| 1953 | 290,149 |
| 1954 | 299,254 |
| 1955 | 304,520 |
| 1956 | 308,031 |
| 1957 | 317,137 |
| 1958 | 324,438 |
| 1959 | 327,495 |
| 1960 | 332,362 |
| 1961 | 324,747 |
| 1962 | 332,801 |
| 1963 | 334,128 |
| 1964 | 346,338 |
| 1965 | 353,093 |
| 1966 | 362,760 |
| 1967 | 366,884 |
| 1968 | 364,872 |
| 1969 | 366,523 |
| 1970 | 378,465 |
| 1971 | 386,275 |
| 1972 | 394,748 |
| 1973 | 427,692 |
| 1974 | 436,623 |
Unions of Employers—The numbers and membership of registered industrial unions of employers as at the end of the year are shown in the following table according to industrial groups. Some are employers belonging to two or more unions.
| Industry Group | 1971 | 1972 | 1973 | |||
|---|---|---|---|---|---|---|
| Unions | Members | Unions | Members | Unions | Members | |
| Agriculture, grazing, etc. | 9 | 2,570 | 9 | 2,551 | 9 | 3,030 |
| Mining and quarrying | - | - | - | - | - | - |
| Manufacturing— | ||||||
| Metal products and engineering, etc. | 9 | 1,104 | 9 | 1,167 | 9 | 1,167 |
| Textiles, clothing and leather | 12 | 479 | 11 | 453 | 10 | 437 |
| Food, beverages, and tobacco, including seasonal | 23 | 682 | 21 | 565 | 22 | 611 |
| Wood and wood products, including furniture | 9 | 374 | 9 | 486 | 9 | 528 |
| Paper and paper products, printing, and publishing | 14 | 400 | 14 | 391 | 14 | 410 |
| Chemicals, petroleum, rubber, and plastics | 5 | 233 | 5 | 230 | 5 | 244 |
| Non-metallic mineral products | 3 | 45 | 2 | 45 | 2 | 45 |
| Other manufacturing | 1 | 24 | 1 | 26 | 1 | 23 |
| Construction | 55 | 4,893 | 55 | 5,453 | 53 | 4,995 |
| Road and rail transport | 5 | 1,710 | 5 | 1,750 | 5 | 1,748 |
| Air transport | 2 | 34 | 2 | 34 | 2 | 34 |
| Shipping and stevedoring | 14 | 155 | 14 | 122 | 14 | 123 |
| Finance, insurance, real estate, etc. | 1 | 189 | 2 | 871 | 2 | 328 |
| Wholesale and retail trade, including hotels, restaurants, etc. | 63 | 9,616 | 61 | 13,468 | 59 | 14,474 |
| Government and local authority n.e.c. | 5 | 390 | 5 | 403 | 5 | 403 |
| Recreational services | 1 | 105 | 1 | 106 | 1 | 90 |
| Social community services, including health, education, etc. | 2 | 771 | 2 | 780 | 2 | 780 |
| Other personal and community services | 6 | 686 | 6 | 584 | 7 | 725 |
| Totals | 239 | 24,457 | 234 | 29,485 | 231 | 30,195 |
INDUSTRIAL ASSOCIATIONS—Associations of two or more unions in different districts in the same industry can be registered as industrial associations. As at 31 December 1973 there were 15 industrial associations of employers and 33 of workers, the former having 126 affiliated unions and the latter 167.
PROPORTION OF UNIONISTS—The following table, showing the proportion of workers belonging to registered unions to the total number of wage earners in the country, is of interest as manifesting the movement in and the extent of unionism during the period under review. The figures for total wage earners are derived from census enumerations and include professional, business, and other classes in which unionism prior to the passing of the amending Act of 1936 did not exist, and agricultural and pastoral occupations where it was practically non-existent. In addition, females are included in both sets of figures, although the proportion of women unionised prior to 1936 was negligible.
| Census Year | Total Wage Earners | Unemployed† Males | End of Year Nearest to Census Date | Numbers of Workers on Rolls of Registered Unions‡ | Percentage of Wage Earners on Rolls of Registered Unions‡ |
|---|---|---|---|---|---|
*1950 figure now includes the membership of 5 subsequently deregistered unions, totalling 8,554 members. †Nearly all of the relatively small numbers of unemployed from 1951 onwards would have been wage earners. ‡There are a number of associations of employees not registered. These include many State servants and mine workers, chemical fertiliser workers, agricultural workers, etc. | |||||
| 1901 (Mar) | 224,346 | 8,467 | 1,900 | 17,989 | 8 |
| 1906 (Apr) | 269,039 | 8,189 | 1,905 | 29,869 | 11 |
| 1911 (Apr) | 304,272 | 7,152 | 1,910 | 57,091 | 19 |
| 1916 (Oct) | 302,161 | 5,920 | 1,916 | 71,587 | 24 |
| 1921 (Apr) | 370,692 | 11,061 | 1,920 | 96,350 | 26 |
| 1926 (Apr) | 414,673 | 10,694 | 1,925 | 100,540 | 24 |
| 1936 (Mar) | 496,563 | 35,774 | 1,935 | 80,929 | 16 |
| 1945 (Sep) | 473,684 | 5,823 | 1,945 | 229,103 | 48 |
| 1951 (Apr) | 577,694 | 7,902 | 1,950 | 275,779* | 48 |
| 1956 (Apr) | 653,358 | 5,558 | 1,955 | 304,520 | 47 |
| 1961 (Apr) | 750,882 | 4,674 | 1,960 | 332,362 | 44 |
| 1966 (Mar) | 870,813 | 5,125 | 1,965 | 353,093 | 41 |
| 1971 (Mar) | 958,563 | 8,757 | 1,970 | 378,465 | 39 |
STATISTICS OF INDUSTRIAL STOPPAGES—In the tables which follow only those disputes are included which resulted in a strike, penalty, or lockout, or where organised “go slow” or other passive-resistance methods were clearly manifested. Many disputes are, of course, settled without recourse to such measures; these are not recorded for statistical purposes. Stoppages in which no demand is made on the employer (or the employees in the case of a lockout) are not included—for example any stoppage which is the result of disagreement by workers with measures taken (or not taken) by Government or other authority, as distinct from employers, is excluded. To avoid confusion with the term “dispute” as used in industrial relations legislation, these statistics have been called “industrial stoppages”. A long-term series of stoppages is given towards the back of this Yearbook.
The figures for stoppages include details of stopwork meetings unless, as on the waterfront, provision is made for these in the relevant award or agreement. In all cases unauthorised stopwork meetings are included, also unauthorised delays in resuming work after recognised stopwork meetings. A single stoppage may include or may consist of one stopwork meeting or several stopwork meetings; if several such meetings are included, these may be held at different times or at different places, provided all relate to the same issue.
In the table shown later, recording methods of settlement, all such interruptions of labour, including periods of deliberate absence from work by way of protest against an alleged injustice, are classified under the heading “voluntary return to work”. In 1965, these cases comprised 27 out of 105 stop-pages; in 1966, 59 out of 145; in 1967, 26 out of 89; in 1968, 26 out of 153; in 1969, 27 out of 169; in 1970, 72 out of 323; in 1971, 95 out of 313; and in 1972, 119 out of 284.
The following table shows incidence rates of stoppages for the last 20 years. (A 50-year time series is tabulated in the Statistical Summary towards the end of this Yearbook.)
| Year | Number of Wage and Salary Earners* | Workers Involved as Percentage of Wage and Salary Earners | Working Days Lost per 1,000 of Wage and Salary Earners |
|---|---|---|---|
| *October estimates. | |||
| (000) | |||
| 1955 | 639.6 | 3.16 | 81.37 |
| 1956 | 652.9 | 2.08 | 36.56 |
| 1957 | 670.2 | 2.32 | 42.06 |
| 1958 | 693.0 | 1.98 | 27.11 |
| 1959 | 699.4 | 2.68 | 42.39 |
| 1960 | 725.9 | 1.97 | 49.16 |
| 1961 | 752.7 | 2.21 | 50.73 |
| 1962 | 763.9 | 5.23 | 121.95 |
| 1963 | 788.0 | 1.89 | 69.15 |
| 1964 | 814.6 | 4.27 | 82.05 |
| 1965 | 846.7 | 1.80 | 25.76 |
| 1966 | 875.0 | 3.79 | 113.25 |
| 1967 | 871.8 | 3.27 | 160.00 |
| 1968 | 876.0 | 4.28 | 148.71 |
| 1969 | 899.7 | 4.90 | 154.13 |
| 1970 | 928.8 | 11.85 | 298.60 |
| 1971 | 935.8 | 9.19 | 173.77 |
| 1972 | 948.5 | 7.18 | 148.31 |
| 1973 | 987.4x | 11.73x- | 275.17x |
| 1974 | 1,015.8 | 6.98 | 180.83 |
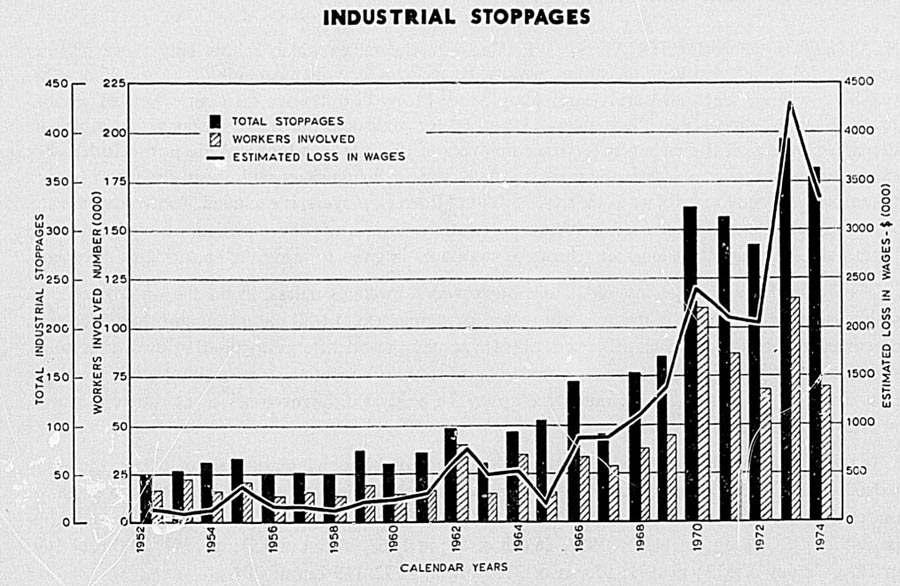
Nature and Duration—The next table shows the number and nature of the stoppages and the number of workers solved during the last 11 years.
| Year | Nature of Stoppage | Number of Workers Involved | ||||||||
|---|---|---|---|---|---|---|---|---|---|---|
| Direct Strike | Sympathetic Strike | Partial Strike* | Penalty† | Total | Direct Strike | Sympathetic Strike | Partial Strike* | Penalty† | Total | |
*i.e., where no actual cessation of work, but a ‘go slow’ or other policy of protest adopted. † Waterfront stoppages sometimes result in the imposition of penalties under Port Bureau Rules. Details of stoppages where penalties were imposed are:— 1964—4, (two of two days, one of three days, one of five days), some 6,520 working days were lost and $67,924 in wages. 1966—4. (one of one day, two of two days, one of three days), some 684 working days lost and $7,330 in wages. 1971—2 ,(two of two days), 2,322 working days lost, and approximately $33,080 in wages. 1972—3, (three of two days), 1,833 working days lost and approximately $32,240 in wages. 1974 (one of one day, one of two days) 524 working days lost and approximately $17,570 in wages. These figures are included in the statistics. ‡Two lockouts involving 572 workers are included. §Including 3 lockouts involving 549 workers. ¶One lockout involving 60 workers included. **Three lockouts involving 354 workers. ††Includes 120 workers involved in lock-outs. | ||||||||||
| 1964 | 89 | - | - | 4 | 93 | 30,196 | - | - | 4,583 | 34,779 |
| 1965 | 97 | 2 | 4 | - | 105‡ | 13,312 | 726 | 657 | - | 15,267‡ |
| 1966 | 137 | 3 | 1 | 4 | 145 | 31,906 | 725 | 9 | 492 | 33,132 |
| 1967 | 79 | 7 | 3 | - | 89 | 24,102 | 4,034 | 354 | - | 28,490 |
| 1968 | 148 | 3 | 2 | - | 153 | 36,168 | 831 | 459 | - | 37,458 |
| 1969 | 160 | 1 | 8 | - | 169 | 43,055 | 36 | 950 | - | 44,041 |
| 1970 | 307 | 3 | 10 | - | 323§ | 106,520 | 233 | 2,794 | - | 110,096 |
| 1971 | 283 | 5 | 22 | 2 | 313¶ | 81,543 | 436 | 2,878 | 1,152 | 86,009 |
| 1972 | 237 | 13 | 31 | 3 | 284 | 58,884 | 2,557 | 5,312 | 1,357 | 68,110 |
| 1973 | 350 | 5 | 36 | - | 394* | 107,944 | 1,760 | 5,807 | - | 115,865** |
| 1974 | 340 | 8 | 29 | 2 | 380 | 63,217 | 1,107 | 5,963 | 497 | 70,904†† |
The table following illustrates the duration of stoppages during 1973.
| Duration | Number of Stoppages | Number of Firms Affected | Number of Workers Involved | Number of Working Days Lost | Estimated Loss in Wages |
|---|---|---|---|---|---|
| 1 day and less | 165 | 216 | 43,526 | 23,492 | 440,340 |
| Over 1 day but not over 2 days | 53 | 84 | 14,449 | 22,457 | 352,880 |
| Over 2 days but not over 3 days | 40 | 65 | 8,325 | 10,865 | 196,900 |
| Over 3 days but less than 1 week | 67 | 130 | 34,815 | 106,798 | 1,737,750 |
| 1 week but less than 2 weeks | 40 | 54 | 8,497 | 48,796 | 820,940 |
| 2 weeks but less than 4 weeks | 19 | 34 | 4,040 | 38,633 | 517,700 |
| 4 weeks but less than 8 weeks | 7 | 8 | 2,124 | 16,174 | 146,910 |
| 8 weeks and over | 3 | 4 | 89 | 4,491 | 75,610 |
| 394 | 595 | 115,865 | 271,706 | 4,289,030 |
Industrial Distribution—In the following table industrial stoppages are classified according to the industry in which they took place. The figures relate to stoppages which terminated during 1973.
| Industry | Number of Stoppages | Number of Firms Affected | Average Duration (Days) | Number of Workers Involved | Working days Lost | Approximate Loss in Wages ($) |
|---|---|---|---|---|---|---|
| Forestry | 2 | 2 | 0.75 | 90 | 60 | 510 |
| Coal mining | 3 | 4 | 2.33 | 488 | 882 | 14,470 |
| Stone quarrying | 3 | 3 | 5.83 | 299 | 848 | 5,970 |
| Abattoirs | 5 | 5 | 8.30 | 1,203 | 3,212 | 56,830 |
| Meat freezing, preserving | 98 | 138 | 4.01 | 73,085 | 141,738 | 2,330,330 |
| Bacon curing | 3 | 3 | 1.17 | 187 | 287 | 3,240 |
| Bread making | 1 | 5 | 3.00 | 106 | 258 | 4,150 |
| Cake-pastry making | 1 | 1 | 9.00 | 189 | 695 | 8,400 |
| Ice-cream making | 1 | 1 | 1.00 | 35 | 39 | 500 |
| Other foods, n.e.c. | 4 | 4 | 2.38 | 173 | 99 | 1,130 |
| Brewing, malting, etc. | 2 | 3 | 3.00 | 108 | 209 | 4,250 |
| Woollen mills | 1 | 1 | 7.00 | 97 | 521 | 6,170 |
| Carpets, rugs, etc. | 2 | 2 | 6.00 | 634 | 4,415 | 81,930 |
| Other textiles | 3 | 3 | 8.33 | 205 | 677 | 13,330 |
| Footwear | 2 | 2 | 7.50 | 443 | 505 | 7,180 |
| Cabinet, furniture making | 1 | 1 | 1.00 | 14 | 6 | - |
| Pulp and paper products | 16 | 16 | 5.16 | 2,945 | 14,786 | 118,900 |
| Printing and publishing | 2 | 2 | 3.25 | 138 | 323 | 5,270 |
| Tanning and currying | 1 | 1 | 16.50 | 11 | 137 | 3,350 |
| Rubber products including pneumatic tyres and tubes | 9 | 27 | 5.89 | 3,140 | 11,466 | 198,300 |
| Chemicals, chem. prod. | 6 | 6 | 5.08 | 390 | 1,115 | 15,350 |
| Petroleum refining | 1 | 1 | 2.00 | 75 | 150 | 2,150 |
| Non-metallic minerals | 11 | 12 | 4.68 | 1,755 | 6,351 | 85,760 |
| Iron and steel making | 4 | 4 | 3.00 | 309 | 743 | 15,520 |
| Metal products | 10 | 11 | 10.00 | 925 | 4,142 | 63,340 |
| General engineering | 18 | 20 | 14.31 | 1,087 | 3,915 | 98,120 |
| Battery manufacture | 1 | 1 | 1.00 | 21 | 30 | 970 |
| Ship and boat-building | 1 | 1 | 0.50 | 106 | 73 | 1,130 |
| Motor vehicle assembly | 10 | 10 | 6.10 | 1,920 | 3,681 | 86,260 |
| Painting and decorating | 1 | 1 | 6.00 | 17 | 97 | 1,380 |
| Electric installation | 3 | 5 | 4.33 | 89 | 709 | 12,430 |
| Building construction | 53 | 97 | 4.69 | 8,264 | 22,967 | 365,560 |
| Road construction | 2 | 3 | - | 185 | 35 | 160 |
| Electric power construction | 9 | 11 | 6.56 | 1,439 | 6,797 | 124,030 |
| Electric power supply | 3 | 3 | 1.67 | 538 | 1,052 | 13,920 |
| Sanitation, disposal of refuse, etc. | 1 | 1 | 12.0 | 84 | 336 | 3,930 |
| Wholesale and retail trades | 8 | 11 | 4.56 | 192 | 577 | 7,560 |
| Railway services | 2 | 2 | 4.00 | 388 | 1,072 | 16,540 |
| Trolley bus services | 2 | 2.75 | 663 | 980 | 12,500 | |
| Motor bus services | 4 | 4 | 4.88 | 125 | 44 | 1,410 |
| Carriers | 9 | 16 | 2.39 | 611 | 1,384 | 21,340 |
| Harbour Boards | 2 | 15 | 4.50 | 203 | 49 | 1,730 |
| Shipping services | 40 | 40 | 3.04 | 1,068 | 2,550 | 7,860 |
| Waterfront | 15 | 57 | 2.07 | 7,310 | 10,453 | 192,140 |
| Other transport | 3 | 3 | 4.50 | 108 | 282 | 4,060 |
| Storage | 1 | 1 | 2.00 | 22 | 34 | 630 |
| Services | 9 | 12 | 4.17 | 947 | 4,475 | 4,920 |
| Industry not specified: | ||||||
| Factory engineers | 2 | 13 | 7.75 | 3,100 | 16,327 | 262,340 |
| Boilermakers | 1 | 6 | 0.50 | 94 | 54 | 860 |
| Drivers | 2 | 2 | 0.25 | 240 | 69 | 920 |
| Totals | 394 | 595 | 4.80 | 115,865 | 271,706 | 4,289,030 |
CAUSES AND RESULTS—In the next table the causes and results of stoppages occurring during 1973 are shown. Under the heading “Wages” are included stoppages concerning wages, overtime, or rates for piecework.
Stoppages concerning the employment or dismissal of persons are included under the heading “Employment”. Stoppages on the subject of employment usually concern the dismissal of a worker on allegedly insufficient grounds.
“Other working conditions" are of diverse nature, and include such causes as the following: distribution of work in coal mines and on wharves, conveyance to and from work, atmospheric conditions in coal mines, accommodation on ships, numbers of men to be allocated to certain duties, supply of food, and the method of handling cargo.
Under the heading “Sympathy” are included all stoppages caused by workers striking not on account of a grievance arising out of their own wages or conditions, but in sympathy with the demands of other workers.
In compiling this table no stoppage has been included as ending in favour of either employers or workers unless the result has been beyond question. In cases where workers have made more than one demand, succeeding in one or more and failing in one or more, or where they have made one or more demands and in respect of each have been partially successful only, the result has been treated as a compromise. Where strikers have returned to work without any definite decision being arrived at regarding the demands made, or where (as in the case of a sympathetic strike) no definite demand has been made, or when a strike is merely by way of a protest, the result has been recorded as indeterminate.
| Result | Cause | ||||||
|---|---|---|---|---|---|---|---|
| Wages | Hours | Employment | Other Working Conditions | Sympathy | Other | Total | |
| Number of Stoppages | |||||||
| In favour of workers | 10 | - | 24 | 36 | - | 6 | 76 |
| In favour of employers | 14 | - | 11 | 3 | - | 2 | 30 |
| Compromise | 95 | 4 | 48 | 18 | - | 10 | 175 |
| Indeterminate | 40 | 5 | 23 | 24 | 6 | 15 | 113 |
| Totals | 159 | 9 | 106 | 81 | 6 | 33 | 394 |
Methods of Settlement—Following is a table showing the methods of settlement of disputes causing stoppages in 1973. Negotiations supposedly under the Industrial Conciliation and Arbitration Act and the Labour Disputes Investigation Act were treated as “Intervention of third party”. “Voluntary return to work” includes such cases as “Protest” absence and stopwork meetings.
| Method of Settlement | Number of Stoppages | Number of Firms Affected | Number of Workers Involved | Number of Working Days Lost | Estimated Loss in Wages |
|---|---|---|---|---|---|
| $(000) | |||||
| Private negotiations between parties | 177 | 226 | 35,462 | 76,230 | 1,129 |
| Intervention of third party | 102 | 192 | 43,844 | 157,917 | 2,485 |
| Substitution | 2 | 2 | 61 | 41 | - |
| Voluntary return to work | 105 | 167 | 35,546 | 32,813 | 584 |
| Other | 8 | 8 | 952 | 4,705 | 91 |
| Totals | 394 | 595 | 115,865 | 271,706 | 4,289 |
WORKING CONDITIONS—A considerable proportion of the persons comprising the labour force of New Zealand have their working conditions determined either directly or indirectly by virtue of the provision of the Aircrew Industrial Tribunal Act 1971, the Factories Act 1946, the Coal Mines Act 1925, the Shops and Offices Act 1955, the Shipping and Seamen Act 1952, the Agricultural Workers Act 1962, the Construction Act 1959, the Machinery Act 1950, the Disabled Persons Employment Act 1960, the Bush Workers Act 1945, the Sharemilking Agreement Act 1937, and the Shearers Act 1962. Legislative authority covering the working conditions of substantially the greater portion of the remaining participants in the labour force is contained in the State Services Act 1962, the State Services Remuneration and Conditions of Employment Act 1969, the Government Railways Act 1964, the Post Office Act 1959, the Police Act 1958, the Education Act 1964, the Hospitals Act 1957 and the Hospital Employment Regulations 1963, and the Waterfront Industry Act 1953.
Notes on Acts which have as their prime purpose the protection of workers from accidents in the course of their employment have been included in Section 35 D—Occupational Safety.
HOURS OF WORK—Employees in most occupations have had the benefit of a 40-hour 5-day week since 1946, with the first legislation in this regard being enacted in 1936.
HOLIDAYS—The Annual Holidays Act 1944 provides for an annual holiday of 3 weeks' duration on ordinary pay for all workers. A worker who has been employed for less than 1 year, on termination of his employment, is entitled to holiday pay for the period of employment. An employer is required to keep a record (holiday book) containing particulars of employment, annual holidays, and amounts paid in respect of each worker in his employment.
Public holidays include Christmas Day, Boxing Day, New Year's Day, 2 January (or a day in lieu), New Zealand Day, Good Friday, Easter Monday, Anzac Day, Labour Day, the Sovereign's Birthday, and the provincial anniversary day (or a day in lieu). Labour Day is deemed to be the fourth Monday in October. New Zealand Day is 6 February. Anzac Day (the 25th day of April) is a day of commemoration, being the anniversary of the first landing of troops on Gallipoli in 1915, and in terms of employment is observed as if it were a holiday. Where Anzac Day falls on a Sunday it is not transferred to a working day.
Other statutes dealing with holidays are the Anzac Day Act 1966, Sovereign's Birthday Observance Act 1952, and the New Zealand Day Act 1973.
FACTORIES ACT—The Factories Act 1946 applies to “any building, office, or place in which two or more persons are engaged or in which one or more persons are employed . . . directly or indirectly, in any handicraft, or in preparing or manufacturing goods for trade or sale . . .”.
Restrictions on Employment—No boy or girl under 16 years of age may be employed in any factory unless a certificate of fitness is issued by an Inspector of Factories.
Safety, Health, and Welfare—The safety measures have reference to dangerous liquids, harmful noise, means of access and safety of employment, and means of escape in case of fire. The employer is required to keep a register of all accidents of which he has any knowledge, and first-aid appliances must be provided and maintained. The health and welfare provisions are very extensive and include reference to such matters as air space, cleanliness, ventilation, canteens, the care of employees, amenities, and other things to be supplied by the employer to secure employees' health or welfare.
SHOPS AND OFFICES ACT: Hours of Work—For shop assistants the hour of commencing work for persons under 16 years must not be earlier than 7 a.m., except that newspapers may be delivered from 6 a.m. by persons aged 12 years and under 16, and milk by persons aged 14 years and under 16 from the same hour. Persons under 18 years may not be employed after 10.30 p.m. The Act also provides that persons under 18 years cannot be employed in restaurants before 5 a.m. or after 10.30 p.m.
Sunday Trading—Sunday trading is prohibited except: (a) if provision is made in an award, the prior consent of the Minister being required to such inclusion; (b) for sale of exempted goods listed later; (c) if individual shops are granted exemption by the Shops and Offices Exemptions Tribunal or the Minister to permit them to open on Sunday. This is designed to offer a relaxation to enable shops to cater for the essential needs of the public after work and on weekends.
Exempted Goods—The Shops and Offices Exempted Goods Order 1968 permits the sale of various commodities including bakers' and pastrycooks' lines, building supplies and handyman's requisites, condiments, cooked foods, dairy produce, drinks, fish, frozen foods, fruit and vegetables, gardening supplies, miscellaneous groceries, magazines and periodicals, meats and small goods, medicinal and household goods, photographic goods, and some miscellaneous items.
Non-exempted goods must be properly locked away from the view of the public after normal closing hours.
Safety, Health, and Welfare Provisions—The Act also makes provision for the welfare, health, and safety of assistants. Particular matters that are covered relate to dangerous liquids and noxious gases, limitation of loads, safe means of access, construction and maintenance of floors, passages, stairs, fire precautions, lighting, cleanliness, ventilation, drinking water, drainage, washing facilities, clothing, accommodation, seating and first-aid facilities, rest rooms for women, sanitary conveniences, temperature and heating appliances, accommodation for meals, etc.
AGRICULTURAL WORKERS ACT—Under the Agricultural Workers Act 1962 regulations have been made setting out minimum standards of accommodation to be supplied for agricultural workers.
Restrictions on Employment of Children—Under the Agricultural Workers Act no child under the age of 15 years may: (a) be employed in any agricultural work during such times as the child is required to attend school under the Education Act; (b) be required to lift any weights, or to perform any task, likely to be injurious to his health; (c) work more than 8 hours in any 1 day.
SHEARERS ACT—Under the Shearers Act 1962 an employer is required to provide amenities for all shearers employed by him. Where five or more shearers are to be accommodated on the farm suitable accommodation must be provided. Minimum standards of amenities and accommodation are prescribed by the Shearers Regulations 1963.
SHIPPING AND SEAMEN LEGISLATION—The general superintendence of matters relating to merchant ships and seamen in New Zealand is the responsibility of the Marine Division of the Ministry of Transport.
Competence, Safety, and Welfare Provisions—The Shipping and Seamen Act 1952 makes provision to ensure competence on the part of navigational officers, engineers, and certain crew members. Rules or regulations under that Act set out the qualifications and examination standards for persons to obtain the appropriate certificates in New Zealand, and there are provisions for the acceptance of certain certificates granted in other Commonwealth countries. The number and qualifications of persons required to man ships of various classes are set out in statutory scales.
The seaworthiness of ships is covered by annual survey for compliance as to condition and equipment, and regulations govern the day-to-day operations of ships to ensure their safe navigation and operation.
The pay and many conditions of employment are determined by industrial awards or agreements between shipowners and employee organisations. There are also legislative measures to ensure compliance with some of the international conventions or recommendations relating to the employment of seafarers.
MINING LEGISLATION—Consolidating legislation has been passed as the Mining Act 1971 and this will become law after its attendant regulations are gazetted.
Working Conditions—In the coal-mining industry working conditions are determined by agreement reached at annual conferences between the coal-mine owners and the employee organisations.
Restrictions on Employment—No person under the age of 16 years may be employed underground in any coal mine, or in any alluvial mine, or on or about any dredge; while the minimum age in respect of underground work in a quartz mine is 19 years. No youth may be employed in a mine for more than 8 hours per day or 48 hours per week except in cases of emergency.
OCCUPATIONAL SAFETY—Measures for occupational safety, involving the Machinery Act 1950, the Construction Act 1959, and a number of other Acts, are discussed in Section 35d.
WORKING CONDITIONS OF STATE SERVANTS—Apart from remuneration (which is discussed in Section 33, Wages) the working conditions of State servants are controlled by legislation set out in the following paragraphs.
Members of the Public Service are governed by the State Services Act 1962 and the State Services Remuneration and Conditions of Employment Act 1969. Included in the functions of the State Services Commission are the provision of suitable office accommodation, the prescription and supervision of physical working conditions, and also the regulations of a variety of points connected with control—e.g., leave, hours of work.
The Government Railways Act 1949 furnishes the legislative framework for determination of the working conditions of railway employees. There is a Government Railways Industrial Tribunal, the principal functions of which are to prescribe conditions in regard to hours of work, etc.; and terms and conditions in respect of leave of absence, railway concessions, etc.
Working conditions for Post Office employees are determined by the administrative authority, the Postmaster-General, with the Director-General as executive head. Power is vested in the Minister by virtue of the Post Office Act 1959. There is a Post Office Staff Tribunal whose function it is to make recommendations to the Minister on such matters as may be referred to it by the Minister, the Director-General, or the New Zealand Post Office Association (Incorporated).
There are other legislative enactments which apply to the relevant sections of general Government employees. Members of the Police are governed by the Police Act 1958 and the Police Regulations 1959, while there is also a Police Staff Tribunal. The three armed services are controlled by the Defence Act 1971.
The Education Act 1964 and amendments authorise, either by regulation or through the agency of education boards, the determination of the conditions of employment, leave of absence, etc., for the members of the teaching profession.
LEGISLATIVE PROVISION FOR CERTAIN OTHER GROUPS: Hospital Board Employees—The provisions relating to working conditions of hospital board employees, such as nurses, etc., will be found in the Hospitals Act 1957 and the State Services Remuneration and Conditions of Employment Act 1969.
Waterfront Industry—The legislation at present governing waterside work is contained in the Waterfront Industry Act 1953, which defines waterside work as “the loading and unloading of ships, barges, lighters, and other vessels; and, in relation to any port where the harbour board acts as wharfinger, includes the work of receiving and delivering cargo customarily performed by waterside workers at that port”. Under the Act functions of government are shared between two types of bodies—one legislative and judicial, the other administrative only.
The legislative and judicial body is the Waterfront Industry Tribunal which consists of a chairman and two other members appointed by the Governor-General on the recommendation of the Minister of Labour. The tribunal is appointed for a term of 3 years and is a Commission of Inquiry under the Commissions of Inquiry Act 1908. The functions of the tribunal are, firstly, to prescribe the terms and conditions of employment for waterside work, and here the tribunal's procedure is similar to that followed by the Government Service Tribunal. To assist with this function, the Act also provides for the setting up by the Minister of Labour of a National Conciliation Committee to be appointed for a term not exceeding 2 years and consisting of eight employer and eight worker representatives, with an independent chairman, to conduct conciliation proceedings on any application to the tribunal which concerns two or more ports. Secondly, the tribunal is required to settle any disputes that arise in relation to waterside work, and for this function has the assistance of Port Conciliation Committees which consist of an equal number of employers' and workers' representatives with an independent chairman. Thirdly, the tribunal is a general Appeal Court from decisions of Port Conciliation Committees (with certain limitations), the National Amenities Committee, and orders of the Waterfront Industry Commission imposing levies or charges.
The Waterfront Industry Commission which is the administrative body, consists of one commissioner appointed for a term of 5 years by the Governor-General on the recommendation of the Minister of Labour. The functions of the commission are, firstly, to carry out all administrative work in connection with the engagement of, and payment of wages to waterside workers, including administrative work in connection with guaranteed minimum payments, annual and statutory holiday payments, and systems of payment by results for waterside workers. Secondly, the commission is responsible for the provision of amenities for waterside workers (subject to the direction of the National Amenities Committee) and for the equipping, operation, and management of these amenities which include waiting rooms or assembly halls, restaurants, canteens, and first-aid rooms. The National Amenities Committee, which is associated with the commission in the function of provision of amenities, consists of six nominated representatives of employers, workers, and harbour boards, and the Waterfront Industry Commissioner as chairman, and is appointed by the Minister of Labour. This committee acts in an advisory capacity to the commission, authorising amenities costing not more than $10,000 each at any port, and approving schemes for the provision by harbour boards of amenities costing more than $10,000 each at any port.
The organisation of “registered” waterside workers is on the basis of separate port unions with one association or federation of unions. The port unions and the association are registered through the Registrar of Industrial Unions in the Department of Labour.
Table of Contents
NEW DEAL IN ACCIDENT COMPENSATION—The Accident Compensation Act 1972, which took effect from 1 April 1974, is unprecedented anywhere in the world and provides insurance against injury by accident at any hour of the day or night to virtually every member of the community.
It has superseded the Workers' Compensation Act 1956, the compulsory third-party insurance against personal injury received in motor vehicle accidents, and the fault principle under which court actions for damages for personal injury were brought by the injured person or his dependants.
Workers' compensation in the more limited form familiar to New Zealanders for many years has been abolished and the need to prove negligence is a thing of the past. There is now a comprehensive system, the essence of which is that the community itself recognises its responsibility for both the accident toll and its effects, and finances and provides for the victims of all accidents however their injuries are caused.
The three main objectives of the legislation are: (a) to promote safety in every walk of life; (b) to urge forward the concept of prompt and effective rehabilitation of all people injured by accident so as to restore them to the fullest physical, mental, social, vocational, and economic usefulness of which they are capable; (c) to provide prompt, fair, and reasonable compensation so that every accident victim will be treated according to his real needs.
Accident prevention, which is of great importance to the Accident Compensation Commission, is being tackled by a safety division aiming at co-ordinating existing organisations and initiating its own accident prevention programme.
The Accident Compensation Act 1972, therefore: (a) provides immediate compensation without proof of fault for every injured person, regardless of his or her fault, and wherever the accident occurred; (b) entitles the injured person to compensation both for permanent physical disability and also for income losses on an income-related basis; (c) provides for regular adjustment in the level of payment to injured persons in accord with variations in the value of money; (d) urges forward the injured person's physical and vocational rehabilitation; and (e) provides effective 24-hour insurance against personal injury by accident for everyone in New Zealand.
ACCIDENT COMPENSATION COMMISSION—To administer the Act the Accident Compensation Commission, comprising three persons, was appointed in December 1972.
The Accident Compensation Commission, based in Wellington, progressively built up its staff to a full strength of more than 130 by the time the system came into effect on 1 April 1974.
The commission has compensation, finance, administration, research and planning, and safety divisions each headed by a director, a legal division under the control of the chief solicitor and a medical and rehabilitation division controlled by a qualified medical director.
THREE SCHEMES IN SYSTEM—People are covered against injury by accident under three schemes in the accident compensation system:
Earners' scheme, which provides for everyone who receives remuneration either as an employee or as a self-employed person.
Motor vehicle scheme, which covers everyone injured in a motor accident and replaces the compulsory third-party insurance.
Supplementary scheme, which brings in all those not otherwise covered, among them tourists and visitors to New Zealand, and people not earning, such as housewives, children, students, and retired people.
The earners' scheme provides for the payment of compensation under a formula which gives 80 percent of the averaged earnings after the first week of incapacity through accident (supported by a medical certificate). If the accident arises out of and in the course of the employment, the employer pays the employee at his normal rate of pay (excluding overtime) for the time lost during that first week. There is no provision for payment of the first week's wages if the accident occurred outside the place of employment, but the scheme takes effect if incapacity extends beyond the first week.
If the injured person has more than one job he receives full pay for the first week from his employer on the job on which the accident occurred, and the commission will pay compensation based on the amount he would have earned from the other jobs.
After the first week's incapacity and for the ensuing 4 weeks, an employee can be paid 80 percent of his average earnings for the 28 days preceding the accident. Beyond that time the 80 percent is related to the average weekly earnings over the 12 months preceding the accident. For the self-employed, the 80 percent is related to earnings during the last financial year. In both cases the maximum payable is (from 1 April 1975) $240 a week, being 80 percent of $300.
Weekly payments generally cease at age 65 years, but can continue until the normal retiring age for a particular job. If the accident occurs after age 60 years payment continues for a further 5 years; if it occurs after age 65 years, then up to age 70 years; and if the accident happens after age 70 years, compensation is payable for 1 year, assuming in all these cases that the injured person was an earner at the time of the accident.
In addition, the injured person may qualify for payment of a lump sum for permanent loss or impairment of bodily function up to a maximum of $7,000 and for loss of capacity to enjoy life, for pain and mental suffering, and for disfigurement up to a maximum of $10,000.
The injured earner can also qualify for compensation for reasonable expenses resulting directly from the accident, such as medical and hospital expenses, the cost of transport to hospital, or wages paid to an attendant or nurse.
In the event of a fatal accident, the commission pays reasonable funeral expenses.
The dependent widow of an earner who has died as a result of an accident can qualify for half the earnings-related compensation her husband would have received had he been totally incapacitated but still living. For each dependent child up to a total of three, an additional one-sixth can be payable so that for a widow with three or more children, there could be paid the full earnings-related compensation her husband would have received had he been totally incapacitated. In addition, a lump sum of up to $1,000 is payable to the dependent widow, plus up to $500 for each dependent child to a maximum of $1,500 for the dependent children.
Non-earners do not normally qualify for earnings-related compensation, but they are eligible for all other benefits.
Motor accident victims qualify for all benefits including, if they are earners, earnings-related compensation.
In some special circumstances, compensation for loss of potential earnings may be awarded.
Earnings-related compensation is taxable, although other forms of benefits are not taxable.
Provision is made for rehabilitation and retraining of accident victims.
Housewives—The provisions for non-earners are of particular interest to housewives. Housewives injured in an accident are eligible for the benefits available to non-earners and, if justified, home help can be paid for, or the husband compensated for loss of earnings while he is looking after the house until the injured wife can resume her duties.
Furthermore, visiting women from overseas who are non-earners can qualify for the same benefits if injured during a visit to New Zealand.
FINANCING OF COMPENSATION FUNDS—Accident compensation is a form of compulsory insurance in which the community as a whole accepts responsibility for the accidents, which inevitably will afflict a proportion of its members as a consequence of the kind of life that society today demands as its right.
The community pays in these ways:
Levies on employers (including the Crown) and on the self-employed to pay for the earners' scheme. They are paid through the Inland Revenue Department (the commission's agents).
Levies on vehicle owners are paid to an agent for the commission, the Post Office, in place of the present third-party insurance premiums, to pay for the motor vehicle scheme.
General taxation pays for the supplementary scheme through the Consolidated Revenue Account.
The employer pays levies on a scale ranging from 25 cents to $5 per $100 of wages paid and he classifies his employees for the appropriate levy in accordance with the industrial-activity in which he is engaged. There are special classes for staff on clerical/management and commercial travelling duties, so that the employer can pay for them at a lower levy rate than he would for the employees engaged in his industrial activity. The maximum amount on which levy is payable is $15,600 a year for each employee.
A levy of 1 percent of earnings applies to self-employed people, regardless of their industrial activity, but the limit of income on which the levy may be imposed is $15,600 a year. The maximum payable by any self-employed person is thus $156 a year.
The levy system in respect of employers is risk-related, as it was previously. The previous range was 5 cents (clerical rate) to $9 per $100 of salary or wages. The new rates as promulgated by Order in Council follow the provision in the Act that they be not less than 25 cents and not more than $5 per $100. Thus employers of clerical staff have faced a substantial increase, while employers of high-risk staff pay substantially less.
Future cover and benefits are incomparably in advance of what was available previously under workers' compensation or social welfare. Some benefits, for example, continue for the whole working life.
Levies for the motor vehicle scheme are collected in the same manner as for the previous third-party insurance. The commission estimated that its first full year would cost between $23 million and $28 million, and this involved an increase in the annual amount of the insurance premium paid at relicensing time; a 25 percent increase added $2.85 a year for the private motorcar, but in return compensation is available to everyone injured in a motor accident for the period of working life, if necessary, and without having to establish that anyone was to blame.
The non-earners' scheme, it had been estimated, required $1.1 million for the first year rising to $1.3 million annually in 3 years.
HANDLING OF CLAIMS—The State Insurance Office is the claims handling agent for all cases except New Zealand seamen, whose claims are dealt with by P. and I. Services Limited. Claims are made by a worker injured at his place of employment notifying his employer and filling in a claim form which the employer then forwards to the State Insurance Office, or in other cases by direct notification to the State Insurance Office. Claims need to be supported by a medical certificate.
It is intended that there should be no long delays in providing compensation. An injured worker who is hurt at work will receive his pay in full from his employer for the first week he is unable to work. If his incapacity continues beyond the first week, earnings-related compensation will promptly become available so that effectively there is no break in his flow of income. He will continue to be paid locally, without delay.
Naturally it will take time to assess permanent disability, loss of faculty, potential earnings, pain and suffering, and loss of enjoyment of life, and the like, but here again it is firmly intended that previous delays will be markedly reduced.
REHABILITATION—Prompt and successful rehabilitation will reduce the need for compensation, return persons to economic usefulness more quickly and in some cases provide them with a vocation and self-respect they might otherwise have lost altogether.
Adequate compensation will by removing anxiety and economic fear, in itself help to achieve rehabilitation of the injured. From the outset they will be assured of retaining a reasonable enjoyment of life and a reasonable standard of living, despite even the most severe disability.
The commission's interests extend to co-operating with existing rehabilitation work, some of it of extremely high standards already, and to developing this concept to give the injured person the best possible treatment.
This concept extends to such matters as reducing the possibility of permanent disability; assisting those who are disabled to make the best possible use of what ability remains or can be inculcated by new training, further education, or other special help; re-establishing people in employment; modifying homes or workplaces to provide for incapacitated people; providing wheelchairs, or adapting a car to hand control so that transport to work will be available.
GENERAL—Statistics of industrial injuries have become increasingly important with the widening mechanisation of industry and the growing labour force. They are basic material for programmes of industrial safety. The national bill for compensation payments is in the region of $9 million annually.
The system of statistical reporting of industrial injuries introduced from 1 January 1968 involves returns of compensable accidents being generally notified to the Department of Statistics shortly after the accident, while claim details are sent to the department later when settlement has been achieved. (Under the previous system which operated up to and including the 1966 year, both the accident and claim settlement details were forwarded at settlement date.)
The statistics cover compensable accidents, which require that the injured worker is paid compensation for an absence from work of one day or longer. Considerable numbers of accidents involving reimbursement of medical expenses only, i.e., “no time lost” cases, are thus excluded from the statistics. The statistics exclude accidents to working proprietors and similar persons not insurable under the Workers Compensation Act 1956. This limits the scope of the statistics in the farming industry especially. Coverage does, however, extend to organisations exempt from insurance under the Act.
Claims resulting from the more serious accidents are frequently not settled for some considerable time after the occurrence of the accident, and a period is therefore allowed so that the bulk of such claims may be included in the statistics for the year in which the accidents occurred. From 1963 the closing date has been standardised at mid August of the following year. Even allowing this period of 7 1/2 months, it is inevitable that any year's statistics will include a small proportion of long-delayed claims from previous years, but these late claims should be compensatory from year to year.
The far-reaching scheme for compensation for personal injuries which took effect from 1 April 1974 is described in the previous section.
PRINCIPAL STATISTICS—The following table gives a summary of the principal statistics for compensable accidents during the latest available 3 years. Claim settlements were received for 67,375 accidents in 1971, but the number of compensable accidents reported was 67,662, a drop of 314 or 0.5 percent on the 1970 total of 67,976 reported accidents.
| Item | 1969 | 1970 | 1971 |
|---|---|---|---|
*Adjustment according to age of worker, i.e. number of total days (9,263) of working-life expectancy remaining. †For definition of rates see Industrial Injuries (Department of Statistics). ‡Claims settled but reported cases were 78 in 1969, 88 in 1970, and 80 in 1971. | |||
| Number of accidents resulting in— | |||
| Fatality | 66‡ | 74‡ | 66‡ |
| Permanent total disability | 3 | 11 | 6 |
| Permanent partial disability | 971 | 1,012 | 792 |
| Temporary disability | 61,912 | 66,734 | 66,511 |
| Totals | 62,952 | 67,831 | 67,375 |
| Compensation paid (incl. damages)— | |||
| Total $(m) | 8.8 | 9.4 | 9.2 |
| Average per accident $ | 139 | 139 | 137 |
| Calendar days lost— | |||
| Temporary disability only (000) | 934.4 | 990.9 | 982.5 |
| Average days per accident | 15 | 15 | 15 |
| Total on constant basis* (000) | 3,707.7 | 3,896.1 | 3,509.5 |
| Average days per accident | 59 | 57 | 52 |
| Total on actual basis (000) | 3,704.0 | 3,888.0 | 3,234.1 |
| Average days per accident | 59 | 57 | 48 |
| Frequency and severity rates†— | |||
| Frequency rate | 3.70 | 3.88 | ... |
| Injury severity rate | 1,307 | 1,333 | ... |
| Economic severity rate | 1,314 | 1,335 | ... |
NATURE OF INJURIES—The nature of injuries is shown by industrial groups in the following table for 1971. The most common types of injuries were sprains or strains, closely followed by lacerations, punctures, and open wounds. In 1971, injuries of the first type made up 35.5 percent of all compensable injuries, and injuries of the second type, 30.3 percent. Bruises or contusions, the third most common type of injury, made up 8.1 percent.
| Nature of Injury | Agriculture, forestry, hunting and fishing | Mining and quarrying | Manufacturing | Building and Construction | Electricity, gas, water and sanitary services | Commerce | Transport, storage, and communication | Services | Activities not adequately described | Totals |
|---|---|---|---|---|---|---|---|---|---|---|
| Traumatic amputation or enucleation | 15 | - | 94 | 25 | - | 7 | 7 | 4 | - | 152 |
| Fracture | 676 | 47 | 1,383 | 590 | 100 | 320 | 476 | 366 | - | 3,958 |
| Dislocation without fracture | 70 | 1 | 89 | 43 | 5 | 24 | 40 | 34 | - | 306 |
| Sprain, strain | 2,426 | 397 | 9,647 | 3,801 | 770 | 1,896 | 3,197 | 1,880 | - | 24,014 |
| Laceration, puncture or open wound | 2,584 | 197 | 10,685 | 2,634 | 440 | 1,608 | 1,299 | 1,031 | - | 20,478 |
| Superficial injury (scratch, abrasion, etc) | 300 | 105 | 1,500 | 465 | 112 | 196 | 350 | 133 | - | 3,161 |
| Bruise, contusion | 367 | 88 | 2,421 | 911 | 170 | 365 | 789 | 369 | - | 5,480 |
| Foreign body in eye or ear | 116 | 33 | 1,425 | 501 | 57 | 39 | 218 | 32 | - | 2,421 |
| Burn, scald | 248 | 19 | 2,108 | 394 | 77 | 124 | 138 | 407 | - | 3,515 |
| Injury to nerve or spinal cord | 2 | - | 12 | 2 | 1 | 4 | 6 | 2 | - | 29 |
| Internal injury (not eye or ear) | 13 | 1 | 13 | 2 | 3 | 1 | 4 | 5 | - | 42 |
| Multiple | 6 | 2 | 4 | 8 | 1 | 2 | 10 | 4 | - | 37 |
| Other | 989 | 40 | 1,506 | 494 | 85 | 250 | 306 | 396 | 3 | 4,069 |
| Totals | 7,812 | 930 | 30,887 | 9,870 | 1,821 | 4,836 | 6,840 | 4,663 | 3 | 67,662 |
PERMANENT PHYSICAL DISABILITY—Where a permanent disability results from an accident, the percentage of disability is determined by, or assessed from, the First Schedule to the Workers' Compensation Act 1956. For example, the loss of both eyes, both hands, or both feet, the total and incurable loss of mental powers involving ability to work, or the total and incurable paralysis of the limbs are considered total disabilities. The total loss of an arm is an 80 percent disability, and of a leg, a 75 percent disability. Loss of one eye is a 50 percent disability; of a thumb, a 30 percent disability. Loss of a forefinger is a 20 percent disability; of a little finger, a 12 percent disability; and of a big toe, a 10 percent disability.
The numbers of permanently disabling accidents according to the percentage of disability are shown in the following table.
| Extent of Disability | 1969 | 1970 | 1971 |
|---|---|---|---|
| Percent | |||
| 5 | 211 | 216 | 182 |
| 6-10 | 190 | 195 | 165 |
| 11-15 | 174 | 178 | 151 |
| 20 | 75 | 96 | 70 |
| 25 | 50 | 63 | 33 |
| 30 | 57 | 54 | 53 |
| 40 | 45 | 52 | 38 |
| 50 and over | 169 | 158 | 100 |
| Total disability | 3 | 11 | 6 |
| Totals | 974 | 1,023 | 798 |
The largest proportions of permanent total and permanent partial disabilities occurred in the agriculture, forestry, hunting, and fishing; manufacturing; building and construction; and transport, storage, and communication industries.
| Industry Group | Fatality | Permanent Disability—Claims Settled Cases | ||||||||||
|---|---|---|---|---|---|---|---|---|---|---|---|---|
| Reported Cases | Claims Settled Cases | Total Disability | Partial Disability | |||||||||
| 1969 | 1970 | 1971 | 1969 | 1970 | 1971 | 1969 | 1970 | 1971 | 1969 | 1970 | 1971 | |
| Agriculture, forestry, hunting, and fishing | 24 | 27 | 23 | 20 | 22 | 21 | - | 2 | - | 107 | 121 | 90 |
| Mining and quarrying | 2 | 2 | 3 | 2 | 1 | 3 | - | - | - | 11 | 12 | 10 |
| Manufacturing | 17 | 11 | 17 | 15 | 10 | 16 | - | 4 | 5 | 456 | 467 | 375 |
| Building and construction | 16 | 19 | 17 | 15 | 16 | 10 | 2 | 3 | - | 153 | 141 | 108 |
| Electricity, gas, water, and sanitary services | 1 | 8 | 3 | 1 | 5 | 2 | - | - | - | 11 | 17 | 11 |
| Commerce | 2 | 6 | 5 | 1 | 5 | 5 | 1 | 1 | - | 58 | 75 | 60 |
| Transport, storage, and communication | 11 | 8 | 6 | 8 | 6 | 5 | - | 1 | - | 119 | 117 | 81 |
| Services | 4 | 12 | 6 | 3 | 9 | 4 | - | - | 1 | 53 | 61 | 54 |
| Activities not adequately described | 1 | - | - | 1 | - | - | - | - | - | 3 | 1 | 3 |
| Totals | 78 | 93 | 80 | 66 | 74 | 66 | 3 | 11 | 6 | 971 | 1,012 | 792 |
INCAPACITY BEYOND 3 MONTHS—Those accidents in which weekly compensation was paid for more than 3 months' duration of incapacity are shown as follows.
| Duration of Incapacity | Temporary Incapacity | Other | ||||
|---|---|---|---|---|---|---|
| 1969 | 1970 | 1971 | 1969 | 1970 | 1971 | |
| *Excludes some of the longer-term absence cases for which claim settlements have not been received. | ||||||
| Over 3 months and up to 6 months | 763 | 785 | 762 | 173 | 183 | 124 |
| Over 6 months and up to 1 year | 162 | 170 | 154 | 116 | 115 | 87 |
| Over 1 year | 40 | 35 | 22 | 97 | 93 | 62 |
| Totals | 965 | 990 | 938 | 386* | 391* | 273* |
The following table shows, for industrial divisions, the calendar days lost through industrial injuries, and the compensation and damages paid.
| Industrial Division | Calendar Days Lost | Compensation (Including Damages) | ||||
|---|---|---|---|---|---|---|
| 1969 | 1970 | 1971 | 1969 | 1970 | 1971 | |
| $(000) | ||||||
| Agriculture, forestry, hunting, and fishing | 594,665 | 661,686 | 591,441 | 1,190 | 1,451 | 1,372 |
| Mining and quarrying | 64,756 | 89,118 | 64,855 | 201 | 227 | 146 |
| Manufacturing | 1,580,147 | 1,478,376 | 1,327,923 | 3,507 | 3,773 | 3,757 |
| Building and construction | 707,367 | 680,682 | 458,559 | 1,675 | 1,534 | 1,405 |
| Electricity, gas, water, and sanitary services | 64,857 | 110,374 | 78,783 | 175 | 256 | 229 |
| Commerce | 179,270 | 259,064 | 204,392 | 507 | 635 | 694 |
| Transport, storage, and communication | 361,079 | 389,471 | 302,919 | 956 | 941 | 942 |
| Services | 141,380 | 216,583 | 201,973 | 516 | 572 | 656 |
| Activities not adequately described | 10,380 | 2,471 | 3,241 | 27 | 6 | 4 |
| Totals | 3,703,901 | 3,887,825 | 3,234,086 | 8,752 | 9,396 | 9,206 |
DURATION OF ABSENCE FROM WORK—Excluding fatalities and cases of permanent total disability, 63.8 percent of other industrial injuries in 1971 involved absences from work of from 3 days to 2 weeks. Almost 27 percent involved absences of over 2 weeks, and just over 9 percent, 1 or 2 days.
AGE GROUPS—A feature of industrial injury statistics over a number of years has been the high percentage of accidents involving male workers under 21 years of age. In 1971, for example, this age group made up 14.28 percent of the male labour force, but included 21.06 percent of males sustaining industrial injuries.
Victims of industrial accidents are shown by sex and age group in the following table.
| Age Group (Years) | Accidents* | Percentage of Accidents for each Sex | Percentage of Total Wage or Salary Earners 1971 Census | ||
|---|---|---|---|---|---|
| 1970 | 1971 | 1970 | 1971 | ||
| *Excludes 3,898 accidents in 1970 and 3,771 accidents in 1971 where age not stated. | |||||
| Males | |||||
| Under 21 | 11,805 | 12,067 | 20.32 | 21.06 | 14.28 |
| 21-24 | 8,757 | 8,497 | 15.08 | 14.83 | 12.47 |
| 25-34 | 13,543 | 13,498 | 23.32 | 23.56 | 22.65 |
| 35-44 | 10,311 | 9,962 | 17.75 | 17.39 | 18.95 |
| 45-54 | 8,175 | 7,883 | 14.07 | 13.76 | 17.31 |
| 55-64 | 4,734 | 4,661 | 8.15 | 8.13 | 11.89 |
| 65 and over | 759 | 729 | 1.31 | 1.27 | 2.45 |
| Totals | 58,084 | 57,297 | 100.00 | 100.00 | 100.00 |
| Females | |||||
| Under 21 | 1,561 | 1,778 | 26.04 | 26.96 | 27.21 |
| 21-24 | 756 | 732 | 12.61 | 11.10 | 14.50 |
| 25-34 | 910 | 1,051 | 15.18 | 15.94 | 15.28 |
| 35-44 | 1,163 | 1,211 | 19.40 | 18.37 | 16.78 |
| 45-54 | 1,102 | 1,254 | 18.39 | 19.02 | 16.84 |
| 55-64 | 444 | 507 | 7.41 | 7.69 | 8.04 |
| 65 and over | 58 | 61 | 0.97 | 0.92 | 1.35 |
| Totals | 5,994 | 6,594 | 100.00 | 100.00 | 100.00 |
TIME OF ACCIDENT—Records of times at which industrial accidents take place suggest that the most dangerous time of the day for industrial workers is the middle of the morning. Year after year, the greatest number of accidents occur between 10.30 a.m. and 11.29 a.m., with the next largest number occurring between 9.30 a.m. and 10.29 a.m.
A factor to be considered, however, is that these are the times when (allowing for part-time workers, shift workers, and the growing practice of glide-time) the number “at risk” is likely to be at its peak.
Times of accidents are shown in the following table.
| Time of Accident | 1969 | 1970 | 1971 |
|---|---|---|---|
| 11.30 p.m. to 7.29 a.m. | 2,134 | 2,447 | 2,367 |
| 7.30 a.m. to 8.29 a.m. | 3,055 | 3,533 | 3,424 |
| 8.30 a.m. to 9.29 a.m. | 6,168 | 6,855 | 6,715 |
| 9.30 a.m. to 10.29 a.m. | 7,334 | 7,935 | 7,969 |
| 10.30 a.m. to 11.29 a.m. | 7,935 | 8,678 | 8,456 |
| 11.30 a.m. to 12.29 p.m. | 4,843 | 4,852 | 3,996 |
| 12.30 p.m. to 1.29 p.m. | 2,994 | 3,249 | 3,314 |
| 1.30 p.m. to 2.29 p.m. | 6,225 | 6,653 | 6,742 |
| 2.30 p.m. to 3.29 p.m. | 6,385 | 6,703 | 6,707 |
| 3.30 p.m. to 4.29 p.m. | 5,691 | 6,037 | 6,066 |
| 4.30 p.m. to 5.29 p.m. | 2,968 | 3,099 | 3,068 |
| 5.30 p.m. to 6.29 p.m. | 983 | 1,131 | 942 |
| 6.30 p.m. to 11.29 p.m. | 2,185 | 2,180 | 2,177 |
| Not stated or not applicable | 4,295 | 4,624 | 4,719 |
| Totals | 63,195 | 67,976 | 67,662 |
ACCIDENTS BY TYPE, SOURCE, AND AGENCY—Analyses of accidents by type, source and agency are now covered.
The definitions of the three characteristics are as follows:
Type of Accident—Occurrences such as falls; stepping on, striking against, or being struck by objects; over-exertion or strenuous movements; exposure to, or contact with, electricity or harmful substances, etc.
Source of Injury—The source of injury covers the object that inflicted the injury on the worker, e.g., a machine or tool; the ground when someone falls from a ladder.
Agency of Accident—The direct cause of the accident, e.g., if a workman strikes his finger with a hammer then the hammer is both the source of injury and the agency of the accident. However, in the instance of an impact with a surface following a fall, e.g., floor, then the floor would be taken as the source of the injury but not the agency. The agency would be a slipping ladder or some such other cause.
Agencies of accidents are analysed in the next table.
| Agency of Accident | 1969 | 1970 | 1971 |
|---|---|---|---|
| Machines— | |||
| Prime movers and pumps (excluding electric motors) and transmission machinery | 154 | 218 | 247 |
| Metal-working machines | 1,681 | 2,313 | 2,428 |
| Wood-working machines | 1,073 | 1,433 | 1,466 |
| Other machines | 2,087 | 2,612 | 2,659 |
| Means of transport and lifting equipment— | |||
| Lifting machines and appliances | 548 | 708 | 864 |
| Means of transport | 3,115 | 3,588 | 3,552 |
| Other equipment— | |||
| Tools, implements, and appliances including electric hand tools | 7,606 | 8,537 | 8,493 |
| Other equipment | 1,949 | 2,046 | 2,192 |
| Materials, substances, and radiations— | |||
| Objects stepped on, struck against, or being handled | 20,798 | 21,928 | 21,645 |
| Other materials, substances, and radiations | 9,841 | 9,904 | 9,766 |
| Working environment and other agencies | 14,343 | 14,689 | 14,350 |
| Totals | 63,195 | 67,976 | 67,662 |
The following table analyses the types of accidents.
| Type of Accident | 1969 | 1970 | 1971 |
|---|---|---|---|
| Falls of persons | 13,178 | 13,430 | 13,785 |
| Struck by falling objects | 4,778 | 4,986 | 5,165 |
| Stepping on, striking against, or struck by objects (excluding falling objects) | 16,273 | 17,407 | 17,323 |
| Caught in or between objects | 6,501 | 7,230 | 7,337 |
| Over-exertion or strenuous movements | 11,408 | 12,596 | 12,866 |
| Exposure to or contact with extreme temperatures | 1,906 | 2,133 | 2,251 |
| Exposure to or contact with electricity | 495 | 607 | 851 |
| Exposure to or contact with other harmful materials, substances, or radiations | 4,277 | 4,574 | 4,300 |
| Other types of accident | 4,379 | 5,013 | 4,054 |
| Totals | 63,195 | 67,976 | 67,662 |
In the next table sources of injury are analysed.
| Source of Injury | 1969 | 1970 | 1971 |
|---|---|---|---|
| Machines— | |||
| Prime movers and pumps (excluding electric motors) and transmission machinery | 144 | 206 | 208 |
| Metal-working machines | 605 | 772 | 727 |
| Wood-working machines | 1,000 | 1,267 | 1,277 |
| Other machines | 1,796 | 2,133 | 2,177 |
| Means of transport and lifting equipment— | |||
| Lifting machines and appliances | 308 | 347 | 374 |
| Means of transport | 1,474 | 1,651 | 1,526 |
| Other equipment— | |||
| Tools, implements, and appliances including electric hand tools | 6,930 | 7,557 | 6,990 |
| Other equipment | 98 | 64 | 125 |
| Materials, substances, and radiations— | |||
| Objects stepped on, struck against, or being handled | 21,052 | 22,536 | 22,828 |
| Other materials, substances, and radiations | 11,924 | 13,052 | 13,651 |
| Working environment and other sources | 17,864 | 18,391 | 17,779 |
| Totals | 63,195 | 67,976 | 67,662 |
GENERAL—In the preceding section on industrial injuries the statistics include farm employees but not self-employed farmers. There are 67,000 farmers apart from nearly 50,000 general farm workers.
The high degree of mechanisation on the 60,000 farm holdings of 4 or more is responsible in large part for the high output per unit of labour engaged in farm production; but it has been responsible too for an increase in the hazards associated with rural work. Nearly 6,000 threshing machines, 19,000 wool presses, 30,000 internal combustion engines, 120,000 electric motors, 97,000 agricultural tractors, 25,000 milking plants, 73,000 shearing stands, as well as farm trucks, cultivating and harvesting implements, and other farm equipment and installations have taken a high annual toll in accidents and deaths, especially in recent years when there has been rapid growth in the use of heavy machinery, both for normal farm activities and for bringing new land into production.
The increasing use of chemicals in agriculture for weed control, and as pesticides and therapeutants, has added to the hazards to which those engaged in the agricultural industry are subjected. The Department of Agriculture undertakes educational activities to endeavour to reduce the accident rates.
Tables in this section present information compiled by the National Health Statistics Centre of the Department of Health on farm accidents and deaths sustained by farmers and their employees. The statistics relate to actual farm work, that is, they exclude domestic accidents or accidents in farm homes.
Accidents on Farms—The following table shows the number of patients discharged from, or dying in, public hospitals in 1971 after treatment for injuries sustained in farm accidents (excluding motor vehicle accidents).
| Cause of Accidents | Age of Patients (in Years) | Total Patients | ||||
|---|---|---|---|---|---|---|
| 0-14 | 15-24 | 25-44 | 45-64 | 65 and Over | ||
| Farm machinery | 70 | 98 | 109 | 73 | 8 | 358 |
| Falls | 178 | 91 | 70 | 52 | 9 | 400 |
| Animals | 23 | 26 | 50 | 29 | 8 | 136 |
| Accidental poisoning | 9 | 8 | 13 | 8 | - | 38 |
| Firearms | 5 | 10 | 1 | 1 | - | 17 |
| Fires or explosions | 1 | 5 | 2 | 1 | - | 9 |
| Hot substances, corrosive liquids, or steam | 17 | 18 | 8 | 11 | - | 54 |
| Blow from falling or projected objects | 18 | 24 | 25 | 52 | 4 | 123 |
| Cutting or piercing instruments | 8 | 38 | 49 | 28 | 1 | 124 |
| Other and unspecified farm mishaps | 23 | 38 | 66 | 47 | 13 | 187 |
| Totals, 1971 | 352 | 356 | 393 | 302 | 43 | 1,446 |
Deaths from Accidents on Farms—Causes of deaths from accidents on farms are shown in the following table. Injured persons who died after admission to a public hospital are also included in the preceding table. (Motor vehicle accidents on a farm are included.)
| Cause of Fatal Accident | Age of Deceased (in Years) | Total Deaths | ||||||||||
|---|---|---|---|---|---|---|---|---|---|---|---|---|
| 0-14 | 15-24 | 25-44 | 45-64 | 65 and Over | ||||||||
| 1971 | 1972 | 1971 | 1972 | 1971 | 1972 | 1971 | 1972 | 1971 | 1972 | 1971 | 1972 | |
| Farm machinery | 3 | 1 | 7 | 5 | 6 | 6 | 12 | 6 | 5 | - | 33 | 18 |
| Electric current | - | - | 2 | - | - | 1 | - | - | - | - | 2 | 1 |
| Falls | 2 | 3 | - | - | - | - | - | 2 | 2 | - | 4 | 5 |
| Firearms | 1 | - | 1 | - | 1 | - | 1 | - | - | - | 4 | - |
| Blow from falling or projected object | - | - | - | 1 | - | 3 | 2 | 1 | - | - | 2 | 5 |
| Drowning or submersion | 4 | 2 | - | - | - | - | 1 | - | - | - | 5 | 2 |
| Other and unspecified | 4 | 3 | 2 | 1 | 1 | - | 1 | 3 | - | - | 8 | 7 |
| Totals | 14 | 9 | 12 | 7 | 8 | 10 | 17 | 12 | 7 | - | 58 | 38 |
GENERAL—The legislation on occupational safety is principally contained in the following statutes (and the regulations made under them):
The Factories Act 1946, sections 44 to 79; the Machinery Act 1950; the Bush Workers Act 1945; the Construction Act 1959; the Shops and Offices Act 1955, First Schedule; the Accident Compensation Act 1972; the Coal Mines Act 1925; the Mining Act 1926; the Explosives Act 1957; the Dangerous Goods Act 1957; the Boilers, Lifts, and Cranes Act 1950; the Shipping and Seamen Act 1952; the Quarries Act 1944; the Health Act 1956 so far as it relates to occupational health (see Section 5A).
Department of Labour—This department has the largest overall responsibility for the prevention of accidents in industry. The principal statutes it administers are: the Factories Act 1946, of which a large section is concerned with safety, health, and welfare in factories; the Construction Act 1959, which completely covers safety, health, and welfare of workmen on works of building and engineering construction; and the Machinery Act 1950, which is concerned with the inspection of all machinery (with some exceptions covered by other legislation) in work places and the safety of persons working with such machinery. The department also administers regulations under these Acts, and other statutes dealing with specific spheres of occupational safety, health, and welfare, e.g. the Bush Workers Act 1945 and the Shops and Offices Act 1955. In addition, the department supervises more than 750 awards and industrial agreements, many of which include specific safety, health, and welfare provisions relating to particular occupations and processes.
The administration of this safety legislation is based primarily on regular inspection of work places and requisitioning for improvements, together with investigation of reported breaches of legislation by employers and workers and investigation of a large number of accidents including serious and fatal accidents in industries coming within the scope of the legislation. Special attention is given to dangerous machinery. The department employs some 130 inspectors of factories (including 9 who specialise in bush undertakings), together with some 42 safety inspectors appointed under the Construction Act 1959, all of whom are qualified by special examination. Their work is substantially preventive. The Department also engages in a large amount of occupational safety education.
A joint Committee on Occupational Health and Safety Education of the Departments of Labour and Health ensures that the educational work of these departments in this field is co-ordinate and wherever responsibility is shared that it is undertaken jointly.
Machinery Act—The Machinery Act 1950, with certain exceptions, applies to all machinery and places an obligation on the owners of machines to securely fence moving and dangerous parts. The Act also covers amusement devices, which require a certificate from a registered engineer that the device is mechanically and structurally safe for the purpose intended. The Act also requires the testing and certification of tractor safety frames used in agricultural pursuits.
Construction Act—The Construction Act 1959 promotes the safety and welfare of persons engaged in construction work, a description which covers a wide variety of work including new construction, maintenance and demolition of buildings, roads, harbour works, railways, canals, bridges, dams, pipelines, earthworks, etc. Certificates of competency are issued after examination for scaffolders, safety supervisors, and construction blasters.
Ministry of Transport—Safety of Ships—A substantial portion of the Shipping and Seamen Act 1952 is concerned with the safety of ships and those who sail in them. This Act contains the necessary authority for implementing the provisions of the International Convention for the Safety of Life at Sea 1960 and the International Load Line Convention 1930, to both of which New Zealand is a signatory. Both conventions deal principally with ships engaged on international voyages, but the Shipping and Seamen Act 1952 also contains provisions concerning the safety of all other ships plying in and about New Zealand coastal waters.
Aircraft—The Ministry of Transport is responsible for promoting the safety of aircraft and crews engaged in private and commercial carriage of the public and commercial carriage of goods, including agricultural aviation.
Boilers, Lifts, and Cranes—All boilers and power cranes are inspected and certificated once per year and lifts twice per year. In the calendar year 1973 there were 21,600 inspections of boilers, 5,896 inspections of lifts, and 3,700 inspections of cranes.
Mines Department—The Mining Act 1971 and the Quarries Act 1944 make provision for the safety of persons working in mines (both undergound and opencast) and in quarries. The definition of a quarry covers the construction of electric power generation works, dams for public water supply, tunnels, and opencast coal quarries.
New Zealand Electricity Department—The Electricity Department is responsible for the administration of Acts designed to ensure the safety of electrical apparatus and installations and of electrical workers.
Department of Internal Affairs—The Department of Internal Affairs, through its Explosives Branch, administers legislation which has as its purpose the protection of life and property from the hazards associated with the handling, storage, transport, manufacture, and use of explosives and dangerous goods.
Ministry of Works and Development—On each major construction project the Ministry of Works and Development appoints a senior technical officer to act in the capacity of safety officer.
National Safety Association of New Zealand (Inc.)—This organisation seeks to stimulate firms and organisations in establishing their own internal safety organisations, full-time or part-time safety officers, and where possible joint management-worker safety committees.
Industrial Health Centres—The Department of Health provides industrial health centres at strategic points in Auckland, Rotorua, Mount Maunganui, Lower Hutt, Wellington, Christchurch, and Dunedin. Attendances at industrial health centres and waterfront clinics in 1973 totalled 24,964 first attendances and 26,886 re-attendances.
GENERAL—New Zealand is responsible for the Tokelau Islands, and the Ross Dependency, also for the defence and international relations of the Cook Islands and Niue.
Self-governing Territory—The 15 Cook Islands achieved a status of self-government in free association with New Zealand in 1965. The Cook Islands were proclaimed a British Protectorate in 1888, and in 1901 they were annexed and proclaimed part of New Zealand under the Colonial Boundaries Act 1895.
Niue, which was also brought within the boundaries of New Zealand in 1901, achieved internal self-government in 1974. Constitutional changes negotiated between the Niue Legislative Assembly and the New Zealand Government culminated in the granting of self-government to Niue in October 1974.
Non-self-governing Territory—The Tokelau Islands became a legal part of New Zealand in 1949. The group had formerly been part of the Gilbert and Ellice Islands Colony, although New Zealand had administered it on behalf of Britain since 1925.
Reports on progress in the Tokelau Islands are forwarded annually to the United Nations.
Administered Territory—New Zealand administers the Ross Dependency. The Ross Dependency has been inhabited for some years by parties of persons maintaining the permanent scientific bases.
The South Pacific Commission is an advisory and consultative body comprising the governments of Britain, Australia, New Zealand, France, the United States, Western Samoa, Nauru, and Fiji. The functions of the commission are to recommend to the member Governments means for promoting the social, economic, and medical welfare of the peoples in the region, and to this end several programmes are in effect. The South Pacific Health Service advises member Governments on health matters, collects and distributes epidemiological information, assists in the maintenance of professional staffs, and encourages medical research and the training of indigenous people as assistant medical practitioners and nurses.
There is a training scheme under which selected students from the Cook, Niue, and Tokelau Islands receive education and vocational training in New Zealand, Fiji, Western Samoa, and elsewhere. The Department of Education's Officer for Islands Education assists with the appointment of New Zealand teachers on secondment, the publication of school journals and textbooks in the vernacular of the different groups, and the supply of modern teaching equipment.
By arrangement between the Governments of Fiji and New Zealand, young Cook Islanders, Niueans, and Tokelau Islanders receive training at the Fiji School of Medicine and the Central Nursing School in Suva to equip them for duty in their own territories as medical officers, assistant dental officers, pharmacy and laboratory assistants, and assistant health inspectors. Students receive diploma level instruction in tropical agriculture in Western Samoa and Fiji.
People migrate from the Pacific islands to New Zealand to seek employment opportunities.
At the 1971 Census of Population there were 11,523 Cook Island Maoris in New Zealand compared with 8,663 in 1966 and 4,499 in 1961. Likewise in 1971 there were 5,459 Niueans and Tokelauans in New Zealand compared with 2,846 in 1966 and 1,728 in 1961.
An indication of the immigration from the Pacific islands during the first flush of migration is reflected in the statistics of birthplace. At the 1966 Census 67.39 percent of the Cook Island Maoris resident in New Zealand were born in the Cook Islands. In more recent years the migration rates have decreased slightly and relatively more persons have been born in New Zealand. At the 1971 Census 6,959 or only 60.4 percent of the Cook Island Maoris resident in New Zealand were born in the Cook Islands.
COOK ISLANDS: Descriptive—There are 15 islands in the Cook Group, scattered over an area of some 850,000 square miles of ocean, and extending from Penrhyn, situated 9° south of the equator, to Mangaia, which is just north of the Tropic of Capricorn. The Cook Islands are bounded on the east and west by the 156th and 167th meridians of west longitude respectively, and on the north and south by the 8th and 23rd parallels of south latitude. The total land area of the 15 islands is approximately 93 square miles.
Of the islands of the Southern Group, Rarotonga, Aitutaki, Atiu, Mitiaro, Mauke, and Mangaia are elevated and fertile, while Manuae and Takutea and the islands of the Northern Group, comprising Penrhyn, Manihiki, Rakahanga, Pukapuka, Palmerston, Nassau, and Suwarrow, are sea-level coral atolls. As a consequence the southern islands support the greater population. The Northern Group island of Penryhn possesses a good harbour while Avatiu harbour in Rarotonga can accommodate vessels of approximately 1,000 tons.
All of the Cook Islands lie within the hurricane zone, and a number of destructive storms have been experienced. The Cook Islands are covered by a meteorological service with headquarters in Fiji, and advance warning of the intensity and path of tropical storms is available and enables precautions to be taken to protect life and property. From December to March the climate is warm and humid, and there is always the possibility of serious storms. In the remaining months of the year the climate of the Southern Group is mild and equable. The mean annual temperature in Rarotonga taken over the last 40 years was 23.6°c, and the average yearly rainfall over the same period was 213.4 cm.
Administration:Executive Government—The Executive Government of the Cook Islands is vested in the Crown in the right of New Zealand. The Cook Islands Constitution Act 1964 provides for the appointment by the Governor-General of a High Commissioner of the Cook Islands as the representative of Her Majesty the Queen in the Cook Islands, and also as the representative of the Government of New Zealand.
Executive Government lies with a Cabinet of Ministers comprising the Premier of the Cook Islands and six other Ministers. The Premier is appointed by the High Commissioner as the member of the Assembly commanding the confidence of the majority of members in the Assembly, and the other Ministers are appointed by the High Commissioner on the advice of the Premier. An Executive Council of the Cook Islands, consisting of the High Commissioner of the Cook Islands and the members of Cabinet, may be summoned by the High Commissioner or the Premier to consider any Cabinet decision, and has power to ask Cabinet to reconsider its decisions. If Cabinet, after reconsideration, reaffirms its original decision, this decision is forthwith put into operation.
The departments of the Cook Islands Government are structured in the following Ministries: Financial Services, Economic Services, Social Services, Supportive Services, Outer Island Affairs, Labour and Commerce, Justice and Land Development, The Premier is responsible for the portfolios of Civil Aviation, External Affairs, Police, and Tourism.
The House of Ariki—The House of Ariki of the Cook Islands consists of up to 15 Ariki, representing all islands in the group, and is required to meet at least once every 12 months. The House considers any matters relative to the welfare of the people of the Cook Islands which may be submitted to it for consideration by the Legislative Assembly and has such other functions as may be prescribed by law.
Island Councils—Island councils exist in each of the main islands of the Cook Islands and have done so for many years. All island councils were reconstituted by the Local Government Act 1966, the major effect of which was to provide that the chairman was to be elected from among the councils' members. Previously the Resident Agent (except on Rarotonga) was Chairman ex officio. The Resident Agents are still members ex officio, but without vote, and their primary function is of advisers.
The councils meet regularly and are empowered to make bylaws for the imposition of tolls, rates, taxes, and other charges (except customs duties); to regulate, control, or prohibit many activities; and to carry out various works and services on each island.
Legislative Government—The Legislative Assembly of the Cook Islands, as constituted by the Cook Islands Constitution Act 1964 consists of 22 members, all elected by secret ballot under a system of universal suffrage by the electors of the following islands: three members from Aitutaki and Manuae; two members each from Atiu and Mangaia; one member each from Manihiki, Mauke, Mitiaro, Penrhyn, and Rakahanga; one member from Pukapuka and Nassau; nine members from Rarotonga and Palmerston.
General elections are normally held at four-yearly intervals, the latest being held in April 1972. There is a common roll for both Maoris and non-Maoris. The Speaker of the Legislative Assembly is elected by members from persons within or without the Assembly.
The Legislative Assembly may make Acts for the peace, order, and good government of the Cook Islands. (These powers extend to the making of laws having extra-territorial operation.) The responsibilities of the Crown in right of New Zealand for the external affairs and defence of the Cook Islands are discharged after consultation by the Prime Minister of New Zealand with the Premier of the Cook Islands.
The Constitution of the Cook Islands is the supreme law of the Cook Islands and the Legislative Assembly alone has power to amend or repeal it. Such repeal or amendment, however, can only be made by a two-thirds affirmative vote of the Assembly followed by an interval of not less than 90 days.
By virtue of the British Nationality and New Zealand Citizenship Act 1948, Cook Islanders remain British subjects and New Zealand citizens.
Population and Vital Statistics—The Cook Islands Maori is Polynesian and has a common ethnic origin with the New Zealand Maori. There is a strong resemblance between the two peoples in tradition, language, and custom. Many of the tribes in both places are able to trace their descent back to a common ancestor.
A census of the Cook Islands taken on 1 December 1971, recorded a total population of 21,317, an increase of 2,070 or 10.75 percent as compared with the Census of 1 September 1966. Details of population of the islands of the group as at 1 December 1971 are set out in the following table.
| Island | Males | Females | Total |
|---|---|---|---|
| Rarotonga | 5,894 | 5,539 | 11,433 |
| Aitutaki | 1,443 | 1,412 | 2,855 |
| Mangaia | 1,033 | 1,047 | 2,080 |
| Atiu | 760 | 695 | 1,455 |
| Mauke | 368 | 395 | 763 |
| Mitiaro | 172 | 159 | 331 |
| Manuae | 2 | - | 2 |
| Palmerston | 33 | 39 | 72 |
| Pukapuka | 373 | 381 | 754 |
| Nassau | 96 | 72 | 168 |
| Manihiki | 239 | 213 | 452 |
| Rakahanga | 167 | 172 | 339 |
| Penrhyn | 329 | 283 | 612 |
| Suwarrow | 1 | - | 1 |
| Totals | 10,910 | 10,407 | 21,317 |
During the year ended 31 December 1973 births numbered 673 and deaths 118. The number of deaths of children under one year of age was 24, which represents a mortality rate of 35.66 per 1,000 live births. Marriages totalled 102 in 1973 compared with 112 in 1972.
Cook Islanders go to New Zealand to seek employment or learn trade skills.
Migration movement is shown in the following table.
| Nationality | Arrivals | Departures | ||||
|---|---|---|---|---|---|---|
| 1971 | 1972 | 1973 | 1971 | 1972 | 1973 | |
| American | 108 | 92 | 132 | 88 | 81 | 130 |
| Australian | 48 | 69 | 115 | 44 | 66 | 96 |
| British (United Kingdom and Ireland) | 96 | 100 | 142 | 72 | 137 | 127 |
| Cook Islands, Maori | 989 | 1,033 | 1,273 | 1,224 | 1,872 | 2,584 |
| French, including Tahitians | 76 | 183 | 47 | 81 | 181 | 28 |
| Dutch | 7 | 8 | 13 | 10 | 8 | 16 |
| New Zealand, including New Zealand Maori | 759 | 640 | 1,045 | 681 | 782 | 937 |
| Other | 60 | 111 | 115 | 51 | 108 | 97 |
| Totals | 2,143 | 2,236 | 2,882 | 2,251 | 3,235 | 4,015 |
Health—All Cook Islanders receive free medical and surgical treatment. School and pre-school children also receive free dental treatment.
Although lying within the tropics, the Cook Islands are singularly free from the common diseases prevalent in other tropical islands. Malaria is unknown, but filariasis is endemic, and this provides the main health problem of the group.
A general hospital equipped with dispensary, X-rays, and laboratory facilities, is maintained in Rarotonga. In the outer islands dispensaries with accommodation for a few patients are operated by assistant medical practitioners. Cottage hospitals have been built at Aitutaki, Atiu, Mauke, Penrhyn, Manihiki, Pukapuka, and Mangaia.
Education—Primary education in the Cook Islands is provided by the Government, the Roman Catholic Mission, and the Seventh Day Adventist Mission. The Government also provides secondary education.
Education is free, compulsory and secular from the time of a child's sixth birthday to his fifteenth birthday. At 31 March 1974 the total number of pupils on the rolls was 6,785. At the same date 88 students and trainees were receiving education or vocational training under the New Zealand Training Scheme.
Labour and Employment—On the atolls in the Northern Group the people subsist largely on coconuts and fish, and apart from making copra, there is little opportunity for them to engage in other economic pursuits. It is in the fertile islands of the Southern Group that most of the population is concentrated, and labour is required for the growing, harvesting, packing, and shipment of fruit. As most of the land in these islands is held by family groups under customary title, many of the people are engaged in work on their own plantations. There is, however, opportunity for wage and salary earners in Government departments, in plantation work, in the handling of fruit for export, and in commerce.
In Rarotonga secondary industries have been established in the form of two clothing factories, a fruit cannery, and factories manufacturing local artifacts. Products from these industries are exported to the New Zealand market.
Agriculture—Fresh fruit exports are now almost limited to bananas and mandarins, but canned pineapple and fruit juices processed locally have become major exports. The following are the estimated areas planted in the principal crops: coconuts, 14,200 acres; citrus fruits, 1,477 acres; taro, 238 acres; bananas, 482 acres; tomatoes, 27 acres; pineapples, 367 acres; maniota, 310 acres; kumaras, 151 acres; yams, 6 acres; coffee, 15 acres.
Transport and Communications—The New Zealand Shipping Corporation operates fortnightly shipping services between the Cook Islands and New Zealand ports.
An international airport was opened for full international services in December 1973.
Radio communication has largely removed the former isolation of the islands, there being now no permanently inhabited island without a radio station. The chief station is Rarotonga Radio, which maintains direct communication with the substations and with Wellington, Apia, and Suva. Postal and telegraph services are available in all the islands. There is a telephone service in Rarotonga and smaller services operate on Aitutaki and Mangaia.
Trade—A summary of exports by country of destination and imports by country of origin is contained in the next table.
| Country | 1967 | 1968 | 1969 | 1970 | 1973* |
|---|---|---|---|---|---|
| *1971 and 1972 figures not yet available. | |||||
| Imports $(000) | |||||
| New Zealand | 2,032 | 2,746 | 2,187 | 4,397 | 4,112 |
| Australia | 191 | 120 | 209 | 213 | 101 |
| United Kingdom | 229 | 141 | 245 | 213 | 161 |
| Canada | 15 | 19 | 17 | 22 | 10 |
| United States | 47 | 27 | 26 | 53 | 38 |
| Japan and Hong Kong | 233 | 226 | 297 | 478 | 329 |
| Other | 244 | 100 | 420 | 390 | 196 |
| Totals | 2,991 | 3,379 | 3,401 | 5,766 | 4,947 |
| Exports $(000) | |||||
| New Zealand | 1,758 | 1,904 | 2,267 | 2,641 | |
| Australia | - | 1 | 10 | 11 | |
| United States | - | - | - | - | |
| United Kingdom | - | - | 6 | - | |
| Other | 19 | 17 | 112 | 39 | |
| Totals | 1,777 | 1,922 | 2,395 | 2,691 | 2,877 |
There is free trade between the Cook Islands and New Zealand. Import licences are required for goods imported from countries other than New Zealand.
Details of the quantities and values of the principal commodities exported are shown below.
| Commodity | Unit | Quantity | Value $(000) | ||||
|---|---|---|---|---|---|---|---|
| 1971 | 1972 | 1973 | 1971 | 1972 | 1973 | ||
| Bananas | ton | 3,140 | 905 | 1,576 | 433 | 104 | 176 |
| Copra | ton | 1,012 | 762 | 742 | 158 | 84 | 122 |
| Fruit juice— | |||||||
| Pineapple | gals | 106,996 | 145,647 | 119,680 | 105 | 164 | 131 |
| Citrus | gals | 383,608 | 383,157 | 782,887 | 501 | 626 | 1,178 |
| Other | gals | 19,106 | 40,129 | 80,279 | 23 | 56 | 106 |
| Canned fruit | gals | 55,770 | 170,264 | 159,523 | 90 | 176 | 171 |
| Fruit pulp | gals | 84>881 | 84,857 | 80,667 | 107 | 92 | 59 |
| Pearl shell | ton | 5 | 16 | 6 | 7 | 14 | 5 |
| Oranges | ton | 466 | 41 | - | 63 | 5 | - |
| Mandarins | ton | 298 | 219 | 583 | 47 | 34 | 83 |
| Grapefruit | ton | - | - | 100 | - | - | 11 |
Foodstuffs continue to be the largest class of import; the values of major imports are set out in the following table.
| Commodity | 1968 | 1969 | 1970 | 1973 |
|---|---|---|---|---|
| Foodstuffs | 927,352 | 816,502 | 1,360,000 | 1,088,619 |
| Drapery and piece goods | 617,439 | 335,336 | 512,236 | 508,440 |
| Oils and petrol, etc. | 67,364 | 335,758 | 275,067 | 228,809 |
| Tobacco and cigarettes | 75,261 | 91,152 | .. | 68,614 |
| Vehicles and parts | 177,141 | 144,126 | .. | 195,025 |
| Timber and cement, etc. | 158,756 | 127,383 | 137,438 | 129,902 |
Public Finance—New Zealand currency is in use in the Group. For the calendar year 1971 revenue items were: import duties, $403,530; income and welfare tax, $566,230; export produce tax, $14,610; sales tax, $103,700; and stamp sales (overseas), $70,970.
The New Zealand Government has continued to give financial aid to the Cook Islands Government through grants for social services and ordinary administrative expenditure plus grants and loans for capital works and economic development. The level of aid is reviewed triennially. The amount of aid approved for the triennium 1971-74 is $7,450,000.
A comparative statement of receipts and expenditure is now given.
| Year | Aid from New Zealand | Receipts from Cook Islands | Expenditure |
|---|---|---|---|
*9 months to December 1970. †Year to March 1971. | |||
| $(000) | $(000) | $(000) | |
| 1967-68 | 1,869 | 1,817 | 3,686 |
| 1968-69 | 2,062 | 1,559 | 3,619 |
| 1969-70 | 2,375 | 779* | 3,006* |
| 1970 | 2,375† | 1,917 | 4,618 |
| 1971 | 2,943 | 1,702 | 4,695 |
The principal items of expenditure are education, health services, and capital works.
National Income—Gross domestic product at producer prices for 1970 has been estimated at $8,300,000 made up as follows: Agriculture (including processing), $1,991,000; manufacturing, $907,000; construction, $764,000; wholesale and retail trade and restaurants, $1,136,000; transport, storage and communications, $599,000; public administration, community, social and personal services, $2,262,000; other items, $641,000.
NIUE: Descriptive—Niue Island, discovered by Captain Cook in 1774, became part of New Zealand in 1901, when the boundaries of New Zealand were extended to include the Cook Islands. The island is situated in latitude 19° 02' south and longitude 169° 52' west, approximately 300 miles east of Tonga, 350 miles south east of Samoa, and 580 miles west of Rarotonga. The island, which has an area of 64,028 acres, is an elevated coral outcrop with a coral reef fringing a precipitous and broken coastline. The central saucer-shaped plateau, rising to a height of 220 ft, is encircled by a narrow terrace about 90 ft above sea level. The soil, though fertile, is not plentiful, and this feature, combined with the rocky and broken nature of the country, makes cultivation difficult. The climate is mild and equable, but the island is in the hurricane belt. The mean annual temperature is 24.7°c, and the average rainfall is 217.7 cm.
Administration—On 19 October 1974 (Constitution Day), Niue became self-governing in free association with New Zealand. The Leader of Government became the Premier of Niue and the Executive Committee became the Cabinet. Under the Constitution the Niue Assembly consists of 20 members elected by universal suffrage, 14 members each representing a village constituency, and 6 members elected on a common roll.
It is written into the Niue Constitution Act 1974 that New Zealand will continue to be responsible for the external affairs and defence of Niue and for providing necessary economic and administrative assistance.
Population and Vital Statistics—Niueans are Polynesians with close ethnic ties with the Tongans and Samoans. The language is a Polynesian dialect peculiar to the island, but closely related to that of Tonga and Samoa, with some elements from eastern Polynesia. Niueans are British subjects and New Zealand citizens.
The population census at 28 September 1971 was 4,990 comprising 2,507 males and 2,483 females.
The inhabitants are distributed amongst 13 villages, of which Alofi is the largest. A number of Niueans migrate to New Zealand each year.
For the calendar year 1973, births totalled 105 and deaths 26. There were 2 deaths of children under one year of age, the infant mortality rate per 1,000 live births being 19.05.
Age groups are shown in the following table from the 1971 census.
| Age Group, in Years | Persons | |
|---|---|---|
| 0-4 | M | 463 |
| F | 420 | |
| 5-9 | M | 458 |
| F | 436 | |
| 10-14 | M | 400 |
| F | 354 | |
| 15-19 | M | 291 |
| F | 220 | |
| 20-24 | M | 136 |
| F | 152 | |
| 25-29 | M | 110 |
| F | 139 | |
| 30-34 | M | 131 |
| F | 137 | |
| 35-39 | M | 98 |
| F | 329 | |
| 40-44 | M | 85 |
| F | 85 | |
| 45-49 | M | 81 |
| F | 82 | |
| 50-54 | M | 54 |
| F | 69 | |
| 55-59 | M | 49 |
| F | 52 | |
| 60 and over | M | 151 |
| F | 204 | |
| Not specified | M | - |
| F | 4 | |
| Totals | M | 2,507 |
| F | 2,483 | |
The population at 31 December 1973 was estimated to be 4,142, the continued decline being principally due to emigration to New Zealand. During the calendar year 1973, 1,010 Niueans left and 533 returned, a loss of 477.
Health—Niue, although situated in the tropics, is largely free from diseases prevalent in tropical countries. The Niuean standard of general hygiene is very good by Pacific standards.
All medical and dental treatment, including hospital services, is provided free of charge, the money for this expenditure being provided out of grants from the New Zealand Government. There is a Government hospital. Attached to the hospital is an outpatients department, X-ray unit, laboratory, and dispensary. The staff at April 1973 numbered 54.
The amounts expended on public health during the past five years were as follows.
| Item | 1969-70 | 1970-71 | 1971-72 | 1972-73 | 1973-74 |
|---|---|---|---|---|---|
| Amount expended | $174,806 | $161,322 | $175,229 | $187,324 | $198,767 |
| Population | 5,303 | 5,128 | 4,988 | 4,419 | 4,012 |
| Amount per head of population | $32.96 | $31.46 | $35.13 | $42.40 | $46.74 |
Education—The eight primary schools and the high school are all under the control of the Government.
The total number of children attending school in Niue at December 1973 was 1,503 while students and trainees attending school or receiving training in New Zealand numbered 51. Education is free and compulsory for those aged from six to 14 years, but most children remain at school until they reach 16 years.
Labour and Employment—The only substantial employer of labour is the Government, which employs Niueans in the Education, Police, Public Works, Health, Agriculture, and other Departments, and in the loading or discharge of vessels. A large number of unskilled labourers are employed on public works. The basic Government wage rate at 31 December 1974 was 52.5 cents an hour. Most Niueans who do not work for wages work in their family plantations.
Agriculture—The principal agricultural exports are passion fruit, honey, copra, and limes.
The extremely rocky nature of the ground makes all agriculture difficult, as practically the whole of the arable land is confined to small pockets of soil among the coral rocks. Of the total area of some 64,900 acres, approximately 50,900 acres are available for agriculture, while some 13,600 acres are in forest. The remaining 400 acres are in roads and buildings. The Agriculture Department has a programme for soil study and plant improvement, rehabilitation of coconut areas, and rearing of cattle for local consumption. At the end of 1973 there were about 700 head of cattle in Niue.
As the Niuean depends for his livelihood upon his family lands, alienation is prohibited, so that there are no landowners apart from the Niueans and the Government.
Transport and Communication—Apart from taxis and a Government bus service for the conveyance of school children there are no internal transport services. The transport of goods and produce to and from the port of Alofi is carried out by Government and privately-owned motor vehicles. There are some 77 miles of all-weather roads on the island.
At Alofi there is an open roadstead only, and cargo is handled by lighters.
Full postal services are provided at Alofi, where there is a Post Office Savings Bank. A single-line telephone system connects all villages on the island, and a radio station is maintained by the Government for overseas communication.
An airport with a sealed runway of 5,400 ft was completed in October 1970 and became fully operational for commercial air services in 1971.
Trade—During 1973 total cargo handled was 5,084 tons. As usual the bulk of the trade was with New Zealand.
The values of exports and imports for the latest five years available are given below.
| Year | Exports | Imports | Total Trade |
|---|---|---|---|
| $(000) | $(000) | $(000) | |
| 1969 | 70 | 771 | 841 |
| 1970 | 194 | 748 | 942 |
| 1971 | 179 | 811 | 990 |
| 1972 | 136 | 918 | 1,054 |
| 1973 | 137 | 721 | 858 |
Exports of principal commodities over the latest five years were as follows.
| Item | 1969 | 1970 | 1971 | 1972 | 1973 | |||||
|---|---|---|---|---|---|---|---|---|---|---|
| Quantity | Value | Quantity | Value | Quantity | Value | Quantity | Value | Quantity | Value | |
| Copra (tons) | 26 | 4,055 | 123 | 26,706 | 146 | 25,720 | 195 | 30,489 | 180 | 20,012 |
| Bananas (cases) | 352 | 994 | 130 | 320 | - | - | 43 | 170 | - | - |
| Kumaras (bags) | 963 | 4,408 | 908 | 4,240 | 1,765 | 5,981 | - | - | - | - |
| Plaited ware | 2,604 | 2,261 | - | 5,512 | - | 5,193 | - | 14,277 | ||
| Honey (lb) | 59,800 | 6,324 | 163,624 | 16,362 | 142,100 | 14,920 | 54,915 | 7,168 | 80,708 | 10,404 |
| Passion fruit (lb) | 27,228 | 9,003 | 107,408 | 34,601 | 154,703 | 48,125 | 108,008 | 39,370 | 97,607 | 31,198 |
The New Zealand Customs Tariff as modified by the Niue Customs Tariff Order 1969 is in force, and there is free trade between the islands and New Zealand.
Public Finance—Revenue is raised principally from import and export duties, income tax, “aid to revenue” tax and the sale of stamps.
Budget deficits are met by grants and loans from New Zealand. A comparative statement of receipts and expenditure during the latest five financial years is given in the following table.
| Year | Receipts | Expenditure | Grants and Loans |
|---|---|---|---|
| $(000) | $(000) | $(000) | |
| 1969-70 | 835 | 1,877 | 941 |
| 1970-71 | 1,037 | 2,103 | 972 |
| 1971-72 | 980 | 2,024 | 1,140 |
| 1972-73 | 1,024 | 2,156 | 1,208 |
| 1973-74 | 1,104 | 2,407 | 1,588 |
TOKELAU ISLANDS: Descriptive—Situated some 480 kilometres to the north of Western Samoa, between 8° and 10° south latitude and between 171° and 173° west longitude, are the three atoll islands of Atafu, Nukunonu, and Fakaofo, of the Tokelau Group. A fourth island, Olosega, belonging to the United States of America and lying 160 kilometres to the south of Fakaofo, completes the group.
Each atoll is composed of a number of coral islets surrounding a central lagoon. These islets vary in size from 100 metres in length, while none is wider than 400 metres nor, with but few exceptions, higher than 3 metres above sea level. The land area of each atoll is approximately as follows: Fakaofo, 650 acres Atafu, 500 acres; Nukunonu, 1,350 acres. The atolls do not lie in close proximity, there being 40 miles of open sea between Fakaofo and Nukunonu, and 92 kilometres between Nukunonu and Atafu.
Owing to the absence of humus in the soil, the vegetation is practically restricted to coconut palms, although one islet of each atoll is reserved for growing the tauanave, a short stubby tree, which yields to the Tokelau Islanders their only timber for the construction of canoes and utensils.
Administration—The Tokelau Islands were included under the protection of Great Britain in 1877. In 1916 the islands, at the request of the inhabitants, were formally annexed to Great Britain by an Order in Council, which also extended the boundaries of the Gilbert and Ellice Islands Colony to include the Tokelau Group (then known as the Union Islands) and their dependencies. The group was governed by the High Commissioner for the Western Pacific and administered by the District Officer at Funafuti, in the Ellice Group. In 1925 the New Zealand Government, at the request of the British Government, agreed to administer the islands. By Order in Council the group was separated from the Gilbert and Ellice Islands Colony, and by a further Order in Council in the same year the Governor-General of New Zealand was empowered to make laws for its peace, order, and good government.
By the Tokelau Islands Act 1948 the Tokelau Group was included within the territorial boundaries of New Zealand; legislative powers are now vested in the Governor-General in Council. The inhabitants of the Tokelau Islands are British subjects and New Zealand citizens.
Because of the very restricted economic and social future in the atolls, the islanders agreed to a proposal put to them by the Minister of Island Territories in 1965 that over a period of years most of the population be resettled in New Zealand. To date 502 migrants have entered New Zealand as permanent residents under Government sponsorship. Many others have settled in New Zealand of their own accord.
Village affairs are managed by the Council of Elders, or “fono”, comprising representatives of the families, and this body also exerts influence over the “aumaga” or village labour force. In this way the traditional form of patriarchal authority has been preserved and regulates Tokelau society, performing a service alongside, and in addition to, the public duties of government which are carried out by local officials such as the Faipule and the Pulenuku.
Population—The people are closely allied to the Samoans.
On 26 September 1973 a census showed a total population of 1,587.
| Island | Males | Females | Total |
|---|---|---|---|
| Atafu | 277 | 295 | 572 |
| Fakaofo | 302 | 347 | 649 |
| Nukunonu | 166 | 200 | 366 |
| Totals | 745 | 842 | 1,587 |
Health—The health authorities in the Tokelau Islands receive advice and guidance from Apia. The incidence of disease in the islands is comparatively slight.
A Fiji-trained Tokelauan medical practitioner is stationed on each atoll. Other medical staff consists of staff nurses, nurses, and dressers, who obtain their training at Apia hospital in Western Samoa. In addition, each atoll has an active women's committee, and to these committees much credit is due for their work in village health and sanitation.
Education—There are now 31 trained Tokelauan teachers in the islands. On each island there are qualified New Zealand teachers. They are endeavouring to raise educational standards by training Tokelauan teachers in improved teaching techniques and by modernising the curriculum. They also help to prepare intending migrants for life in New Zealand. All necessary school equipment, stationery, and textbooks are supplied by the New Zealand Government; the schools also receive copies of the Samoan Teachers Monthly Guide and of Samoan and New Zealand School Journals. In addition, they are equipped with filmstrip and movie projectors and also with radio sets so that the daily educational broadcasts of the Western Samoan Education Department may be utilised.
Tokelau pupils are included in the training scheme for education in New Zealand, and selected students also receive schooling and training in Western Samoa and Fiji.
Communications—Trading voyages between Western Samoa and the Tokelau Islands are made at regular intervals by an Administration-chartered vessel.
Radiotelegraph receivers and transmitters are operated on each atoll. In addition, radio receiving sets are installed in all villages and enable the people to listen to broadcasts from the Apia broadcasting station.
Trade and Finance—The quantity of copra shipped for the year ended 31 March 1974 amounted to 50 tons. Apart from copra, the only other exports are handicrafts.
Revenue is derived principally from export duty on copra, Customs duty of 12 1/2 percent ad valorem on all goods entering the islands, trading profits, and the sale of postage stamps. Total revenue for 1973-74 was $42,274. Expenditure for the year 1973-74 was $393,671.
Under the Tokelau Islands Copra Regulations 1952 a Copra Stabilisation Fund was established by a levy on purchases of copra for export, and is used to supplement the prices received by the producers, or by the purchasers on resale after export, as may be necessary from time to time. At 31 March 1974 there was $31,466 in the fund.
ROSS DEPENDENCY: Descriptive—The Ross Dependency comprises the sector of the Antarctic continent between 160° east and 150° west longitude, together with the islands lying between those degrees of longitude and south of latitude 60° south.
Within these boundaries there are an estimated 400,000-450,000 square kilometres of land and 330,000 square kilometres of permanent ice shelf. The land is virtually entirely covered by ice, but has bases inhabited by scientific personnel.
Administration—By Order in Council of 30 July 1923 under the British Settlements Act 1887 (Imp.) the territories of the Ross Dependency were brought within the jurisdiction of the New Zealand Government. From time to time laws for the Dependency have been made by regulations promulgated by the Governor-General of New Zealand.
Administrative powers are vested in the Governor-General of New Zealand, and administrative officers (commonly referred to as Administrators) have been appointed from time to time since 1923. Since 1956, the Leader of the New Zealand Expedition at Scott Base has been vested with the powers of Magistrate, Justice of the Peace, and Coroner. The Officer in Charge has jurisdiction over all New Zealand nationals in Antarctica and is responsible for the implementation of the Antarctic Research Programme as directed by Antarctic Division, DSIR.
The Ross Dependency Research Committee formulates the New Zealand Antarctic Research Programme. The committee comprises representatives of divisions of the Department of Scientific and Industrial Research, the Lands and Survey Department, the National Museum, the Royal Society of New Zealand, New Zealand Universities, the Chiefs of Staff of the New Zealand Armed Forces, and the Ministry of Foreign Affairs. It is representative of all scientific disciplines with Antarctic interests.
Antarctic Division, DSIR, is responsible for detailed planning and implements the programme. The division employs staff and obtains supplies and equipment for all Government projects. University projects are financed and equipped from university sources. The operation and control of all projects is directed by the Antarctic Division through the Officer in Charge, Scott Base.
New Zealand's international relations on Antarctic affairs are conducted at the political level by the Ministry of Foreign Affairs. Whilst scientific contact with other countries and institutions engaged in Antarctic research is maintained at all levels, the primary channel is the Ross Dependency Research Committee, which is also New Zealand's National Committee on Antarctic Research.
In 1959 New Zealand was one of the 12 nations to sign the Antarctic Treaty which requires that Antarctica be used for peaceful purposes only, promotes international co-operation, freedom of scientific investigation and exchange of information and scientific personnel, but does not require New Zealand to renounce her territorial claim to the Ross Dependency. Delegates from the 12 signatory nations met in Wellington for the Seventh Antarctic Treaty Consultative Meeting from 30 October to 10 November 1972. The Treaty has been completely successful in all its aims and has allowed freedom of scientific research in Antarctica. On the issue of mineral exploration and exploitation—whether or not they should be permitted to take place in Antarctica, and, if so, under what conditions—the Eighth Consultative Meeting to be held in Oslo in June 1975 faces one of its greatest challenges.
The Antarctica Amendment Act 1970 provides means of enforcing the regulations contained within the Antarctic Treaty (known as the Agreed Measures for the Conservation of Antarctic Fauna and Flora) and the prevention of pollution to the Antarctic Continent and surrounding waters.
Exploration and Field Activities—Various expeditions have operated within the area of the Dependency since the coastline was explored by Sir James Clark Ross in 1841. These include the two expeditions of Scott 1901-04 and 1910-13 and that of Shackleton 1907-09.
In January 1957 the first New Zealand expedition under the leadership of Sir Edmund Hillary established Scott Base near Cape Armitage on Ross Island. The purpose of the expedition was twofold: to take part in the crossing of the Continent from the Weddell Sea to Scott Base by the Commonwealth Trans-Antarctic Expedition and to participate in the Antarctic programme of the International Geophysical Year. In the summer of 1957-58 the expedition established depots for the use of the crossing party and Sir Edmund Hillary and four companions pushed on to the South Pole, which was reached on 4 January 1958. Sir Vivian Fuchs's successful crossing party reached Scott Base on 2 March 1958.
Field Work—Since 1958 remote field parties using dog teams and sledges, but more recently mechanical transport, have almost completely mapped the Ross Dependency. Geological survey parties have completed a reconnaissance of the Dependency and resulting from various interesting finds, work is now directed to specialised research in these particular areas. The Lands and Survey Department has issued a series of 48 maps based on survey work carried out by New Zealand field teams during the past few years.
Scientific Programme—During the International Geophysical Year 1957 New Zealand maintained at Scott Base and jointly with the United States at Hallett Station a scientific programme in close accord with the aims and objects of the I.G.Y. (References to these activities are contained in Appendix (d) of the 1958 Yearbook.)
Since its establishment Scott Base has been continuously occupied each year by teams of scientists and supporting base personnel. The summer population may rise to 70 or 80 people but only about 12 winter-over to continue the scientific programme of continuous observations in the fields of seismology, geomagnetism, ionosphere physics, micropulsations, aurora and airglow, very low frequency radio propagation, satellite tracking, meteorology, glaciology, and oceanography.
In 1968 a new scientific station was built near Lake Vanda in the Wright Valley of Victoria Land, some 130 km west of Scott Base. It is the first New Zealand base actually on the Antarctic Continent.
For the first two seasons after its opening Vanda Station was named on a year-round basis to enable scientists to carry out environmental investigations in this ice-free area and also to undertake studies in upper air physics and earth sciences in co-ordination with the programme at Scott Base. Blowing dust collection in the vicinity of the station is continuing as part of the study of weathering in the Dry Valleys. Synoptic weather observations are made and other meteorological data collected at the base and at satellite stations in the Wright Valley region.
The station was used only as a summer base during 1970-71 and 1971-72, but was opened again during the full year of 1974 to implement further scientific work. In the 1974-75 season it reverted to a summer base only.
Since the summer of 1972-73 New Zealand scientists have been involved with scientists from Japan and the United States in a Dry Valley drilling project, with the object of studying the subsurface of the McMurdo Sound region by means of deep drill holes in various areas. This work is being terminated in the 1974-75 season.
The New Zealand Oceanographic Institute has also inaugurated a study of trace element chemistry of Ross Sea sediments.
Biological Programme—Biological studies have been conducted each summer season at various localities within the Dependency.
In the McMurdo Sound and Cape Hallett areas, scientists continue the census and tagging of the seal population. Marine plankton samples are taken from under the sea ice near Scott Base, and further marine research is concentrated in the Cape Bird and Cape Hallett areas. Studies continue of penguin and skua gull behaviour at Cape Bird and Cape Royds.
Whaling—Regulations dated 24 October 1929 prohibit whaling in the territorial waters of the Ross Dependency without a licence. New Zealand is a member of the International Whaling Commission, the purpose of which is to enforce conservation of whale stocks.
Review of Development—Since 1959 New Zealand has achieved many of its earlier aims and ambitions. A topographic survey has been made of the Ross Dependency bringing to an end the era of long and arduous traverses. The numerous maps produced have provided detailed geographic information, particularly important for subsequent field research programmes.
A geological reconnaissance has been conducted of the same area. During recent years New Zealand has been involved in specialised work which has provided evidence indicating that the southern land masses were once linked together to form one super continent—Gondwanaland. Recent fossil discoveries in Antarctica, including land animals similar to those found in South Africa and Australia, seem to confirm this theory. Oceanographic and paleomagnetic researchers also add credence to it. Their studies show that continental drift has been, and still is, taking place at a quite rapid rate of about 3 cm to 5 cm a year. These findings have impelled scientists to revise completely their earlier ideas on the earth's history, the forming of the continents, the causes of earthquakes, and the future physical changes to the surface of the earth that can now be predicted with reasonable certainty.
Detailed hydrographic charts of the Ross Sea area have given considerable information about the ocean floor lying between New Zealand and Antarctica. Oceanographers and marine biologists have carried out intensive studies of the marine life of the Southern Ocean. Results show that the waters surrounding the Antarctic continent contain the richest marine life found anywhere—a great potential food source for the increasing human population.
Extensive studies have been made by biologists of the fauna and flora of Antarctica, enabling accurate assessments of the likelihood of survival of various species. This has given a better understanding of how the many primitive life forms adapt and survive in the narrow life-support zone of Antarctica.
There has been a substantial contribution to man's knowledge of the ice budget of Antarctica—not only important to the study of Antarctica itself but also necessary to a better understanding of the global climate changes that have occurred and the present position of the earth in the cycle of the ice ages. Antarctica contains about 95 percent of the world's ice and small changes in this amount would have a significant if not catastrophic effect on the rest of the world. This southern continent about 80,000,000 to 100,000,000 years ago enjoyed a tropical climate and more recently there have been warm periods.
Continuing studies and monitoring of the upper atmosphere from Scott Base and other Antarctic Stations have provided significant information, when correlated with satellite and space vehicle data, towards new concepts of the sun-earth relationship. Practical application of some of this new knowledge has led to vastly improved methods of radio communication.
Years of intensive studies of meteorology in Antarctica have improved the understanding of the significant part Antarctica plays in the world's weather pattern, the balance of the world's heat budget and the relationship between the atmosphere and oceans.
There have been major changes in the methods of supporting work in Antarctica. Transportation by ship between New Zealand and Antarctica used to take 7 to 10 days. Now, flights take 5 to 8 hours. Small fixed-wing aircraft and most of the earlier types of heavy surface transport have been replaced by helicopters.
In 1973 a joint DSIR/Victoria University of Wellington expedition made the first attempt at descending the crater of Mount Erebus (3,743 m) on Ross Island. Although the crater floor was not reached, samples of volcanic gas were recovered, and the party discovered an active lake of molten lava in the inner crater. This project has been followed up by a joint United States/French/New Zealand team in December 1974.
In 1973-74 the United States Navy flew 232 helicopter-hours in support of the New Zealand Antarctic research programme. Dog teams have been almost entirely replaced by motor toboggans to support small mobile field parties. With the formation of metal-and-snow compacted roads around McMurdo and Scott Base, tracked vehicles have been replaced by wheeled vehicles.
The emphasis in Antarctica is swinging away from basic scientific studies to meet the more specialised demands of man's increasing knowledge and so yield rewards of value to society. Despite the many changes and developments Antarctica has largely retained its IGY status as a unique natural laboratory for man to study the earth as a whole. It should continue to be the last relatively undisturbed area on earth from which may also be monitored the effect of man on the remainder of our global environment.
BOOM IN TRAVEL AND TOURISM—Travel between countries in and around the Pacific has boomed in recent years and international jet air services have made New Zealand fairly easily accessible to international tourists of all countries. The tourist industry is a fast-growing sector in international commerce; in some countries it has become the largest industry. The industry has grown so fast and is having such an impact on the international balance of payments that the economics of tourism are receiving increasing attention. World spending on travel abroad has increased about twice as fast as total national incomes since the 1950s. OECD statistics indicate that international tourist journeys throughout the world increased annually through the 1960s at an average rate of 9 percent. Pre-disposing factors are greater affluence, more leisure, the emancipation of the young, travel as a status symbol, improved transport facilities and arrangements such as package tours.
In New Zealand a healthy domestic tourist industry has led to the growth of all the services necessary for New Zealand's wider participation in world tourism. There has been a considerable surge in building of hotels and motels and the provision of complementary transport and other service facilities. New scenic routes have been developed, while facilities have been improved and extended in major resort areas. There is a network of convenient air services.
A tourist development conference was held in 1969 and the report of the Tourism Committee to the National Development Conference sets out forward planning for the development of the tourist potential in the next decade. A Tourist Development Council has been appointed to co-operate with the National Development Council and to keep under review the measures and resources necessary to attain the target growth rate of 349,000 overseas visitors by 1975-76 and 457,100 by 1978-79.
Travel Arrivals and New Zealand Residents Departing Temporarily—The travel surge has resulted in a doubling of visitors every 6 or 7 years as shown in the following table; a similar scale of increase has applied to New Zealanders going overseas, particularly to Australia and Britain.
| Year Ended 31 March | Visitors | Through Passengers* | Total Travel Arrivals | New Zealand Residents Departing Temporarily | ||||
|---|---|---|---|---|---|---|---|---|
| Tourists | Persons on Business | Persons on Working Holiday and for Education | Others | Total | ||||
| *Tourists on cruise ships and passengers in transit arriving and leaving in the same vessel or aircraft. | ||||||||
| 1964 | 47,978 | 7,907 | 4,029 | 9,790 | 69,704 | 39,714 | 109,418 | 62,164 |
| 1965 | 57,498 | 8,213 | 6,343 | 9,981 | 82,035 | 40,253 | 122,288 | 74,536 |
| 1966 | 65,039 | 9,969 | 12,734 | 10,274 | 98,016 | 55,265 | 153,281 | 88,145 |
| 1967 | 74,275 | 10,006 | 20,070 | 8,520 | 112,871 | 72,561 | 185,432 | 99,890 |
| 1968 | 89,953 | 12,858 | 9,814 | 10,563 | 123,188 | 84,839 | 208,027 | 104,094 |
| 1969 | 100,341 | 13,736 | 7,526 | 10,299 | 131,902 | 88,783 | 220,685 | 100,819 |
| 1970 | 118,706 | 17,389 | 10,361 | 8,535 | 154,991 | 86,119 | 241,110 | 112,082 |
| 1971 | 141,506 | 25,914 | 11,552 | 11,897 | 190,869 | 80,546 | 271,415 | 117,747 |
| 1972 | 176,562 | 24,208 | 14,896 | 11,914 | 227,580 | 82,444 | 310,024 | 133,878 |
| 1973 | 199,695 | 26,783 | 17,067 | 11,099 | 254,644 | 83,138 | 337,782 | 154,992 |
| 1974 | 244,835 | 33,000 | 22,012 | 18,397 | 318,244 | 101,011 | 419,255 | 208,314 |
Most New Zealand residents departing temporarily are tourists. In the year ended 31 March 1974, of the 208,314 such departures, 165,131 persons were in the tourist category and 11,851 in the related category of working holiday. Of the remainder, 25,939 went on business and 5,819 as theatrical performers, sportsmen, etc.
Some of the permanent movement shown in migration statistics in Section 3 concerns travel Persons intending to be absent for 12 months or more are shown as permanent departures; when they return to New Zealand after 12 months' absence they are shown as immigrants intending permanent residence. Persons arriving on working holidays or for educational purposes are not normally classified internationally as visitors or tourists.
Auckland is the main point of arrival and receives initially 70 percent of all visitors: most of the visitors arrive by air while through passengers are mostly passengers on cruise liners. Of the 14,328 persons at the 1966 census who were usually resident overseas, Auckland had 2,101, Wellington (including Lower Hutt and Petone) 1,985, Hamilton 182, Waitomo 112, Rotorua 425, Taupo 115, Napier 151, Hastings 112, New Plymouth 106, Wanganui 142, Palmerston North 122, Nelson 133, Christchurch 943, Dunedin 270, Queenstown 185, Invercargill 173, Te Anau 165.
Travel Receipts and Payments—Travel receipts as shown in the balance of payments account have been as follows in recent years: 1966-67, $14.5 million; 1967-68, $17.4 million; 1968-69, $20.1 million; 1969-70, $26.0 million; 1970-71, $33.6 million; 1971-72, $45.1 million; 1972-73, $57.5 million; 1973-74, $78.5 million. The National Development Conference targets were $74 million in Reserve Bank travel receipts by 1975-76, $119 million by 1978-79, and $178 million by 1981-82. Tourist promotion also helps to build up the overseas exchange earnings of Air New Zealand. Travel debits in recent years have been much higher than travel credits in the balance of payments account and totalled $61.9 million in 1970-71; $75.5 million in 1971-72; $98.2 million in 1972-73; and $143.4 million in 1973-74.
From a survey commissioned by the Tourist and Publicity Department it was estimated that overseas visitor expenditure in New Zealand in the year ended 31 March 1970 was $31.5 million (including cruise ship passengers $0.8 million). Statistics from the survey are given in the following table.
| Item | Tourists from | Other Visitors | |||
|---|---|---|---|---|---|
| Australia | United States and Canada | United Kingdom and Europe | Other Countries | ||
| Total expenditure ($m) | 14.84 | 7.55 | 2.39 | 1.66 | 4.24 |
| Expenditure per tourist ($)— | |||||
| Accommodation and meals | 113 | 131 | 79 | 54 | ... |
| Transport | 49 | 45 | 36 | 24 | ... |
| Excursions and souvenirs | 38 | 33 | 33 | 15 | ... |
| Social, personal, etc. | 35 | 37 | 64 | 35 | ... |
| Total per tourist | 235 | 246 | 212 | 128 | ... |
Given the initial attraction of New Zealand, transport and accommodation are the two factors which convert a potential visitor into an actual one. So far as international travel is concerned, the cost of fares to New Zealand, particularly for non-Australian visitors, accounts for over half the total cost of the trip. Within New Zealand visitors spend more money on transport than on any other item except accommodation. Some 30 percent of internal spending by visitors is on transport of various kinds, principally air travel between metropolitan centres and the main tourist areas and road transport in the form of coach tours and rental vehicles. The following table shows estimated visitor expenditure on domestic transport in 1968 and a forecast by the Institute of Economic Research for 1979, assuming that the visitor targets are achieved.
| Mode of Transport | 1967-68 | 1978-79 |
|---|---|---|
| $(million) | ||
| Air | 1.1 | 5.6 |
| Rental vehicles | 0.6 | 3.5 |
| Motor coach | 1.0 | 4.1 |
| Rail | - | 0.1 |
| Sea | 0.1 | 0.6 |
| Other, mainly taxis | 0.7 | 3.0 |
| Totals | 3.5 | 16.9 |
The greatest part of the increase is thus expected to accrue to domestic air services although in percentage terms the use of rental vehicles is the fastest growing component.
The rapid increase in overseas visitors will have a marked effect on the seasonal pattern of domestic flights. Of the total of 1,173,000 passengers carried in 1968, about 80,000 or 7 percent were overseas visitors. By 1979 the number of overseas visitors using internal air lines is expected to rise to 409,000 or 23 percent of the total. Since most of the increase will take place during the summer months, the seasonal pattern of domestic flights will be heightened, and the proportion of visitors in the summer months may be as much as 40-50 percent.
Countries of Origin—The countries or areas of origin of all visitors other than through passengers to New Zealand during years ended 31 March are given in the following table.
| Country or Area | 1968-69 | 1969-70 | 1970-71 | 1971-72 | 1972-73 | 1973-74 |
|---|---|---|---|---|---|---|
| Australia | 69,882 | 79,626 | 91,982 | 109,788 | 125,466 | 169,685 |
| Canada | 3,984 | 4,963 | 6,457 | 8,392 | 10,258 | 11,378 |
| United States | 24,786 | 30,836 | 45,220 | 52,935 | 54,211 | 55,036 |
| United Kingdom | 11,778 | 12,133 | 13,343 | 14,096 | 18,239 | 22,983 |
| Other countries | 21,472 | 27,433 | 33,864 | 42,369 | 46,470 | 59,162 |
| All countries | 131,902 | 154,991 | 190,866 | 227,580 | 254,644 | 318,244 |
Visitors who are not New Zealanders require permits to enter the country, and temporary permits or student permits are issued as appropriate. Those people who are accorded the right of free entry are not required to apply to make visits. They are granted entry on arrival. Others may make visits without visas under agreements we have entered into with a number of countries, including Japan and United States. Residents of other countries must obtain entry authorities before they set out and these are obtained through the various New Zealand posts overseas. The British posts also have some authority to act in the absence of an accredited New Zealand post. Short-term visitors are asked to submit to very little formality. Those coming under the visa abolition agreements must intend remaining no longer than the periods set out in the agreements, which vary from 30 days to 3 months, and all visitors must have sufficient funds for maintenance, and fully paid tickets which will take them out of the country.
Tourists are more often female than male. Among New Zealanders travelling overseas there are approximately 7 males to every 10 females, and among overseas visitors to New Zealand there are approximately 9 males to every 10 females. About 20 percent of New Zealanders travelling overseas are under 20 years of age, compared with about 15 percent of overseas visitors in New Zealand. About a quarter of the overseas visitors to New Zealand are over 60 years of age, compared with about 20 percent of New Zealanders going overseas.
The most popular destination for New Zealanders touring overseas is Australia, which received 49 percent of the total in 1972-73. Fiji is the next most popular country receiving 16 percent of all New Zealand tourists in 1972-73. United Kingdom follows with 14 percent of all New Zealand tourists. The United States received 3.5 percent and the balance of New Zealand tourists are spread over a large number of countries which in total absorb 18 percent of the outward flow.
In recent years, the “balance of tourist flow” has been very much in New Zealand's favour with regard to the United States (45,700 United States tourists to 4,000 New Zealand tourists in 1972-73), Canada (8,800 Canadians to 800 New Zealanders), and Australia (100,900 Australians to 58,900 New Zealanders). There has been almost a balance in regard to the United Kingdom (13,900 British came to New Zealand, 16,700 New Zealanders went to the United Kingdom) but the balance has not been in our favour for Fiji (19,100 New Zealanders went to Fiji in 1972-73 and 4,300 Fijians came to New Zealand).
New Zealanders stay overseas longer than overseas tourists stay in New Zealand, but some tourists have an itinerary covering other countries as well as New Zealand, just as New Zealanders going to the United Kingdom for the northern summer usually visit a number of other countries.
Nearly four-fifths of visitors to New Zealand stay less than 1 month, but only two-thirds of New Zealanders have an overseas trip of the same short duration. Twenty-two percent of New Zealanders are away for 1 and under 3 months compared with 15 percent of overseas visitors staying for this period in New Zealand and over twice the proportion of New Zealanders have an overseas trip of over 6 months' duration.
While the numbers of tourists have increased greatly in recent years, individual tourists have tended to stay for shorter periods. In 1962-63 just under half the tourists stayed 1 month or more; in 1972-73 the proportion was less than one-quarter. Those staying 3 months or more declined from 18 percent to 7 percent in the same period. The trend towards shorter stays is continuing.
Internal Tourism—It has been estimated by the Institute of Economic Research that the average adult New Zealander is away from home 14 nights in the year and that expenditure on holidays in New Zealand is equivalent to about 3 percent of the gross national product.
Estimates for internal tourism in 1967 are given in the following table.
| Item | Million Passenger Miles | Expenditure |
|---|---|---|
| $(million) | ||
| Air travel (recreation only) | 160 | 5.0 |
| Rail (excludes suburban travel) | 280 | 3.5 |
| Sea (roll-on roll-off ferries, etc.) | 28 | 1.1 |
| Public road transport (not suburban) | 42 | 9.4 |
| Private road travel | 240 | 6.0 |
| Accommodation expenditure (camping, caravan, motels, etc.) | 63.0 | |
| Miscellaneous outlays associated with holidays | ... | 13.0 |
| ... | 101.0 |
Accommodation in New Zealand—Leading hotels in the main centres, and Tourist Hotel Corporation hotels and others in the main resort areas, all provide first-class accommodation. Most of these hotels and motor hotels have a private bathroom or shower and toilet with every bedroom. These establishments usually operate on a room-only basis, with meals on optional extra.
There are 11 Tourist Hotel Corporation hotels. Mostly these are built in areas where, for reasons of isolation, private enterprise finds it uneconomical to operate. In many cases, the Tourist Hotel Corporation hotel has formed the nucleus on which private enterprise has developed.
Tourist Hotel Corporation hotels are situated at the following places:
| North Island | South Island |
|---|---|
| Waitangi, Bay of Islands | Mount Cook, Southern Alps |
| Waitomo (glow-worm caves), King Country | Lake Wanaka, Southern Lakes |
| International, Rotorua | Franz Josef Glacier, West Coast |
| Wairakei, near Lake Taupo | Lake Te Anau, Fiordland |
| Tokaanu, Lake Taupo | Milford Sound, Fiordland |
| Mount Ruapehu, central North Island ski-ing fields |
There are large numbers of good-quality motels throughout New Zealand, and scores of motor camps.
Motor camping is a popular form of holidaymaking during the summer months (December to Easter). Campers provide their own tents and equipment (a number of companies specialise in hiring out camping equipment) and the camps provide community washing, cooking, and toilet facilities. Some camps offer limited cabin accommodation.
Tourist arrivals are highest from October to March. These arrivals taken in conjunction with the demand from the New Zealand summer holiday period, impose a strain on available hotel accommodation at the major tourist resorts.
Provisional figures extracted from the 1971 census show that of the 24,600 guests in licensed hotels, motels (licensed and ordinary), and in private hotels or guest houses on 23 March 1971, 6,300 (26 percent) were overseas visitors and 18,300 (74 percent) were New Zealand residents.
The resident guest ratio was therefore approximately one overseas visitor to three New Zealanders. However, this ratio varied between different types of accommodation from one overseas visitor to five New Zealanders in private hotels, to one overseas visitor to one New Zealander in licensed motels, as the following analysis shows.
| Accommodation | Overseas Visitors | New Zealand Residents | Total Guests | Overseas Visitors as Percentage of Total |
|---|---|---|---|---|
| Licensed hotels | 2,700 | 5,800 | 8,500 | 32 |
| Licensed motels/motor hotels | 1,200 | 1,300 | 2,500 | 48 |
| Other motels | 1,700 | 7,700 | 9,400 | 18 |
| Private hotels and guest houses | 700 | 3,500 | 4,200 | 17 |
| Totals | 6,300 | 18,300 | 24,600 | 26 |
As the census date in March 1971 (prior to the Easter holidays) was selected to minimise the extent to which New Zealanders would be away from their usual place of residence, it is likely that the proportion of New Zealanders shown in the figures above would be lower than at most other periods of the popular summer/autumn months for travelling within New Zealand. The figure of 26 percent for visitor occupancy rate would not therefore be inconsistent with the figure of 18 percent suggested in other papers for an average proportion. Of the 6,423 overseas visitors in hotels, motels, etc., on census night, 3,838 (59 percent) were usually resident in Australia, 1,264 (20 percent) in the United States, 606 (9 percent) in the United Kingdom, 116 in Canada, and the remaining 599 were distributed amongst all other countries.
Employment in hotel/motel industry at the 1971 Census of Population and Dwellings is shown in the following table.
| Occupation | Licensed Hotels and Motels | Unlicensed Hotels and Motels | ||
|---|---|---|---|---|
| Males | Females | Males | Females | |
| Hotel proprietor/manager | 1,448 | 561 | 712 | 618 |
| Administrators, personal services, etc. | 276 | 117 | 4 | 11 |
| Clerk | 94 | 184 | 7 | 21 |
| Stenographer, typist | - | 69 | - | 12 |
| Receptionist | 5 | 836 | 1 | 86 |
| Cook/chef | 586 | 707 | 28 | 36 |
| Kitchenhand/dishwasher | 86 | 541 | 3 | 40 |
| Storeman | 45 | - | - | - |
| Waiter, waitress | 140 | 1,593 | 3 | 114 |
| Barman/barman - waiter/barmaid | 2,998 | 428 | - | - |
| Housekeeper | - | 118 | - | 26 |
| Housemaid/domestic | - | 1,555 | - | 308 |
| Laundress | - | 30 | - | 3 |
| Hotel porter | 294 | 89 | 10 | 2 |
| Maintenance man | 207 | 69 | 25 | 115 |
| Others | 80 | 9 | 15 | 1 |
| Totals | 6,259 | 6,906 | 808 | 1,393 |
Inventory of Accommodation—An inventory of accommodation has been compiled by the Tourist and Publicity Department. It relates only to hotels licensed to supply liquor and to motels. Private hotels and guest houses (and also holiday flats not catering for overnight travellers) have not been included. Private hotels and guest houses, however, provide a significant proportion (up to 20 percent) of all available commercial accommodation. In the following table statistics for licensed hotels and motels are set out by regional areas, as at 31 March 1973.
| Region | Rooms in Licensed Hotels | Units in Motels | ||
|---|---|---|---|---|
| Group 1 | Group 2 | Group 3 | ||
| NOTE—Licensed hotels are here grouped principally according to availability of rooms with private facilities: Group 1—all or most rooms so equipped; Group 2—sufficient private facilities for general availability; Group 3—a smaller proportion of rooms with private facilities. | ||||
| Northland | 381 | 351 | 259 | 623 |
| Auckland | 1,184 | 353 | 158 | 771 |
| Western Waikato | 152 | 170 | 158 | 381 |
| Coromandel-Thames | - | 27 | 84 | 147 |
| Coastal Bay of Plenty | 76 | 167 | 133 | 379 |
| Rotorua | 511 | 140 | 52 | 478 |
| Upper Waikato - Inland Bay of Plenty | 66 | 34 | 111 | 86 |
| Taupo | 149 | 138 | 30 | 441 |
| Gisborne - Northern Hawke's Bay | 64 | 147 | 144 | 207 |
| Central Hawke's Bay | 151 | 65 | 130 | 384 |
| Southern Hawke's Bay - Wairarapa | 67 | - | 106 | 84 |
| King Country | 180 | 62 | 91 | 129 |
| Taranaki | 120 | 49 | 184 | 193 |
| Wanganui-Manawatu | 160 | 187 | 183 | 300 |
| Foxton - Paremata Coast | - | 32 | 27 | 131 |
| Wellington | 787 | 231 | 179 | 294 |
| Marlborough | 52 | - | 246 | 295 |
| Nelson | 200 | 67 | 124 | 251 |
| West Coast | 159 | 160 | 199 | 311 |
| North and Mid-Canterbury | 36 | 82 | 29 | 92 |
| Christchurch | 618 | 24 | 256 | 528 |
| Inland South Canterbury | 264 | - | 78 | 50 |
| Coastal South Canterbury - North Otago | 57 | 51 | 166 | 186 |
| Central Otago | 81 | - | 69 | 184 |
| Dunedin | 240 | 64 | 98 | 190 |
| Southland | 25 | - | 135 | 48 |
| Queenstown | 346 | 32 | 23 | 246 |
| Milford - Te Anau | 362 | - | - | 160 |
| Invercargill - Bluff - Stewart Island | 110 | 133 | 38 | 124 |
| Totals | 6,598 | 2,766 | 3,490 | 7,693 |
Assistance to the Hotel Industry—The New Zealand Government has made available loan and guarantee finance to encourage the building of new hotels and motor hotels and the extension of existing hotels in areas where there was a shortage of accommodation for overseas visitors.
Under this scheme, the Government has made available $10.6 million by way of loan guarantees and $3.9 million by way of loans, resulting in the availability of an additional 3,253 first-class beds.
A similar scheme of financial assistance in respect of tourist facilities other than accommodation was introduced in 1969, to encourage private-enterprise operators to develop amenities, where necessary, in focal tourist areas.
There are generous depreciation allowances for taxation purposes which apply to approved visitor accommodation.
WIDE RANGE OF ATTRACTIONS—New Zealand has often been described as “the world's most exciting travel package”. With features such as the amazing thermal areas, magnificent lakes and fiords, glaciers, alpine regions, and unrivalled hunting, fishing, and other sporting opportunities, New Zealand combines in a comparatively small area a host of attractions. In addition to these natural attractions, the dignity and charm of the Maori race offers for study a culture which is unique to New Zealand.
Resort Development—A major development in New Zealand was the opening of the Haast Pass road in November 1965. It links the southern lakes region on the eastern side of the Alps with the West Coast and opens up one of the greatest scenic round-trip drives in the world.
In Rotorua a Maori Arts and Crafts Institute was established to preserve and foster traditional Maori culture. The institute has assumed control of the Whakarewarewa Reserve and displays Maori arts and crafts in traditional settings as well as presenting traditional songs and dances. One of the highlights is the Maori Carving School.
At Queenstown the Government and private enterprise have co-operated in the development of winter sports facilities. At Coronet Peak the access road has been improved, a new restaurant completed, and a chairlift has been in operation since 1964.
At Wairakei the Government is co-operating with local authorities in the area to plan and develop a tourist park in close proximity to the geothermal borefield, the Tourist Hotel Corporation's hotel, and the Wairakei golf course.
Weather—New Zealand lies wholly within the South Temperate Zone. The weather is sunny and rather changeable, but is neither excessively hot in summer nor uncomfortably cold in winter. A large portion of the country is favoured with at least 2,000 hours of sunshine a year.
Seasons—The seasons in New Zealand are the opposite of those in the Northern Hemisphere:
| Summer: December, January, February |
| Autumn: March, April, May |
| Winter: June, July, August |
| Spring: September, October, November |
TRANSPORT—All main cities, towns, and tourist resorts are served by regular road or rail services and there is an extensive network of internal air services. In addition to the inter-island air services, the North and South Island are also linked by roll-on roll-off steamer services. These steamer services operate between Wellington and Picton and Wellington and Lyttelton.
Several international and national car rental companies, in addition to locally based companies, supply self-drive cars. All main centres also have chauffeur-driven cars available. Coach tours of a high standard and covering a range of prices and periods are operated by a number of companies.
At several locations, but particularly in the alpine and lake regions of the South Island, set or charter air tours are available.
Travel Services—Fully accredited travel agencies are available throughout New Zealand. Most of the major international agencies are represented or have affiliates in the country and there are the Government Tourist Bureaus which offer a national service for overseas visitors and New Zealand travellers.
SPORTING ATTRACTIONS:Fishing—A wide variety of salt-water fish abound in the coasts, bays, and harbours and in both North and South islands many streams, rivers, and lakes provide excellent rainbow and brown trout fishing.
Sizes of New Zealand trout vary from district to district depending on environment, climate, food available, and angling pressure. Average trout weights are as follows: North Island—rainbow 2-2 1/2 lb and brown 5 lb in the Rotorua lakes, rainbow 4 1/2 lb and brown 5 lb in Lake Taupo, rainbow and brown 2 lb in river systems; South Island—rainbow and brown 2-3 lb in lake systems, sea-run brown 5 lb in West Coast rivers, sea-run “Quinnat” salmon 12 lb in the east coast rivers, landlocked salmon 2-2 1/2 lb.
Big-game Fishing—The warm waters off the east coast of the North Island provide some of the best surf, line, and scuba fishing in the world. The main bases for line fishing from charter boats are at Whangaroa, Bay of Islands (Russell, Otehei Bay, and Waitangi), Tutukaka, Mercury Bay (Whitianga), and Tauranga (Mayor Island).
The most prized catches are broadbill, black marlin, striped marlin and blue marlin, while other types of big game fish found in New Zealand waters are mainly tiger shark, hammerhead shark, mako shark, thresher shark, kingfish (yellow tail), and tuna. The best catches are usually made in February but fishing is good from December to April.
Shooting and Hunting—The principal game birds are duck, swan, pheasant, quail, geese, and chukor, but the sport is limited, the main season usually extending for about 6 weeks from early May.
There are fewer restrictions, however, on stalking—no limit on the number of game animals that can be taken, no licence required, and the season is open all year round. The top trophies are chamois and thar but good hunting also includes red deer, fallow deer, wild pigs, goats, and wallaby; other species present in lesser numbers and somewhat scarce are wapiti (elk), sambur deer, rusa deer, sika deer, and whitetail deer. A guide is essential for results.
Ski-ing—The ski-ing in New Zealand extends from mid-July to late October in the North Island and from early July to late September in the South Island. With the operation of ski planes from the airstrip at Mount Cook very good spring ski-ing is also available for experienced skiers on the South Island glaciers.
In the North Island the main ski-ing centre is Mount Ruapehu in the Tongariro National Park. Equipment and instruction is available for skiers, and facilities include three chairlifts, a T-bar, three Poma lifts, and two rope tows. Mount Egmont is the North Island's other principal ski area, with fields at Dawson Falls, Stratford, and North Egmont.
In the South Island the principal areas are Mount Cook (for ski touring), Coronet Peak (Queenstown), Lake Ohau, Porter's Pass, and Arthur's Pass. Coronet Peak, 7 miles from Queenstown, has the best powder snow conditions in New Zealand lying on extensive undulating slopes of varying gradients; equipment and professional instruction is available for skiers, and facilities include chairlifts and a series of ski tows.
Mountaineering and Tramping—The proximity of mountain and forest to the main centres of population encourages tramping in New Zealand. Both North and South Islands have appealing tramping routes and parties can set out to enjoy the beauty and challenge of lonely country.
In the Waitakere and Hunua Ranges near Auckland, the central ranges of the North Island, at Mount Egmont, Tongariro National Park, and the Urewera area, and in the South Island's Fiordland, there are numbers of tracks with high mountain traverses and passages through beautiful scenery.
Other Sports—A wide range of other sports is available. Golf courses are to be found in all parts of the country. Horse racing takes place throughout the year. Rugby football and cricket are widely played during their seasons. There are facilities for bowls, tennis, skating, squash, and most other sports in most parts of the country.
Scenery and Recreation—The pictorial supplement in this Yearbook shows something of New Zealand's scenic attractions. Pictorial supplements in earlier Yearbooks which have portrayed New Zealand scenery and recreational activities have included “Scenic New Zealand” (1960), “New Zealand's National Parks” (1962), “Outdoor Recreation in New Zealand” (1965), “Attractive New Zealand” (1967), “Forests of New Zealand” (1969), “Natural New Zealand” (1970), “New Zealand Environment” (1972), and “Leisure in New Zealand” (1973).
Thermal Areas and Spas—New Zealand is distinctive in having a wide range of volcanic phenomena and associated thermal spas. The chief concentration is in the volcanic belt north-east from the three major volcanoes, all usually quiet, in the centre of the North Island. Most notable in the Rotorua locality are a variety of geysers, mud-pools, pools of boiling water, and steam blow-holes.
Many mineral springs are reputed to have a beneficial effect and mineral baths are maintained by private interests in many places.
Rotorua, with its great variety and abundance of hot springs, is a well-known New Zealand spa.
At Taupo, Wairakei, and Matamata hot mineral waters feed into attractive swimming pools.
Shopping and Souvenirs—Articles of a particularly New Zealand character include attractive jewellery made from paua shell, greenstone, and gem stones, Maori carvings in native timbers, records of Maori singing, pottery depicting Maori emblems, and natural or dyed lambskin rugs and clothing.
Tourist and Publicity Department—Under the Tourist and Publicity Act 1963 the principal functions of the department are to encourage and develop the New Zealand tourist industry and tourist traffic, to, within, and beyond New Zealand; to operate publicity, information, and public relations services; and to maintain a travel service.
The department is responsible for the promotion of New Zealand overseas as a tourist destination and also operates a comprehensive travel service. Bureaus are sited in Auckland, Rotorua, Wellington, Christchurch, Dunedin, and Invercargill, with agencies in other parts of New Zealand. There are overseas offices in Sydney, Melbourne, Brisbane, London, San Francisco, Los Angeles, New York, Tokyo, and Frankfurt. The department also supplies general New Zealand publicity material, publications, films, photographs, and displays for use within New Zealand and overseas to create a background knowledge of New Zealand, its people, and way of life.
Other Tourist Organisations—The New Zealand National Travel Association, an organisation representing private travel interests in New Zealand, is also concerned with the development of the tourist industry.
New Zealand is a member of the International Union of Official Travel Organisations, an association whose principal aims are to ease travel difficulties and obstacles and promote travel research, and also is a foundation member of the Pacific Area Travel Association which was formed in 1952 as a tourist promotional body for the Pacific area.
METRICATION—New Zealand is to convert substantially to the metric system of weights and measures by the end of 1976. The conversion will apply to the whole imperial system of weights and measures that has evolved over the centuries, and will affect every facet of society.
Since 1955 there has been a world-wide change to the exclusive use of the metric system and over 126 countries are now classified by the United Nations as “metric”. Countries currently in the process of change include the United Kingdom, Australia, Canada, South Africa, and Singapore.
New Zealand's decision to change to the metric system is based almost entirely on the necessity to keep in step with her overseas trading partners, and it is for this reason that planning is for metric conversion in New Zealand to be substantially completed by the end of 1976.
Government policy is that the costs of conversion generally should be borne by those incurring them.
Metric Advisory Board—The Metric Advisory Board was set up by Government in 1969 to encourage, advise, and assist the progressive voluntary adoption of the metric system of weights and measures. Administrative support to the board is provided by the Department of Trade and Industry.
The board has established a number of sector committees to plan for the conversion. These sector committees cover all the main groups in the economy, viz:
Agriculture, building and construction industry, Central and local Government, education, engineering and engineering servicing industries, food and consumer goods and services, fuel and power, manufacturing and processing industries, public relations, recreation, health and sport, science and technology, standardisation, transport and communication, and weighing machines.
The role of the sector committees is to identify problems, prepare timetables, and co-ordinate the metric conversion in their respective sectors of the economy. Where appropriate, divisional committees are established to operate in relation to specific areas with sectors. Wherever possible, sector and divisional committees negotiate with national associations or organisations rather than with local interests or individuals.
Implementation of Conversion—The metric system was being used in New Zealand to some extent before the establishment of the Metric Advisory Board—in the pharmaceutical industry, in hospitals, in scientific establishments, and in some other industries.
The first major steps of the current metric changeover were taken on 1 July 1971 when meteorological reporting of temperature and rainfall changed from degrees Fahrenheit and inches to degrees Celsius and millimetres respectively, and when the wool industry started conducting all trading transactions for unprocessed wool in metric weights.
This was the start of a series of planned and co-ordinated conversions—each designed to be introduced with a minimum of inconvenience to the community. Some of these conversions will affect only specialised sections of the community and will be promulgated through the respective national associations or organisations. Other conversions will affect everybody and these will be publicised on a national basis.
Education—The change in the education system has been instituted smoothly in all levels, and while minor difficulties exist in the acquisition of metric materials for some practical classes, the change has created no major difficulties; in particular, all teaching in primary schools is now in metric units, with imperial measurement no longer being taught.
The planning for the change in national examinations has been implemented, and from 1974 on, examinations will be completely metric, with no alternative papers or questions.
Retraining in Industry—During 1973 a start was made in retraining those persons whose livelihoods depend on a proper appreciation and use of the new units of measurement. This is being undertaken by the technical institutes, together with the Industrial Training Service of the Department of Labour. Many government departments and large firms are instituting their own training programmes, and have prepared useful training and reference material.
Timescale of Conversion—The changeover from imperial to metric units for weights and measures is a far more extensive change than that made to decimal currency. Consequently, instead of an M-Day, the conversion will be spread over a period of years with substantial conversion planned for the end of 1976. However, there will be some areas in which the conversion will extend well beyond this date—depending on normal replacement cycles for major items of industrial plant or machinery.
Implementation of Timetables—In most sectors of the economy, the timetables have been approved and their implementation is proceeding. In addition to meteorological reporting and wool trading, which went metric in 1971, tidal predictions and land surveying are now metric; road distance signs are in the process of being converted to kilometres; coastal charts are being progressively adapted. In 1973 the building and construction industry commenced to design in metric, also the mechanical engineering industry; the retail sale of petrol in litres has been phased in, and groceries and meat are being retailed in metric quantities. Exports and imports have been expressed in metric measure from 1 July 1974 with the introduction of a new Customs Tariff.
A general guide to changeover dates is as follows:
| Category | Date of Changeover |
|---|---|
| Agriculture— | Mid 1973 - mid 1974 |
| Building and construction— | |
| Design | Oct 1972 onwards |
| Construction | Apr 1974 onwards |
| Building materials | 1974-76 (main change 1975) |
| Forestry | 1974-75 |
| Horticulture | July-Dec 1974 |
| Land surveying | Jan 1973 |
| Manufacturing— | |
| Butter | 1973 onwards |
| Chemical toiletries | 1973 onwards |
| Clothing and textiles | 1972-74 |
| Food | 1973 onwards |
| Electrical and electronic | 1974-76 |
| Engineering | 1973-76 |
| Footwear and leather goods | 1972-74 |
| Meat processing | Oct 1973 |
| Motor vehicles | 1972-78 |
| Packaging | 1972 onwards |
| Printing and paper | 1,973 |
| Retailing— | |
| Meat and fish | 1,974 |
| Groceries, greengroceries | 1975-76 |
| Textiles and apparel | Aug-Dec 1974 |
| Coal | 1,974 |
| Gas | 1975-76 |
| Petrol and lubricants | Mid 1973-74 |
| Commercial Transport— | |
| Metric documentation | 1972 onwards |
| Metric freight tariffs | Apr 1974 |
| Road Transport— | |
| Road signs | 1972 onwards |
| Regulatory speeds | Apr 1975 |
| External Trade— | |
| Exports and Imports | July 1974 |
METRIC SYSTEM—The metric system is not only simpler and more efficient than the imperial system but also has the benefits of internationally agreed definition and standardisation. The modern version of the metric system known as the “International System” (also called SI—"Systeme International d' Unites") has been adopted for use in New Zealand. This system is also being adopted by all those other countries that have recently changed, or are in the process of changing, to the metric system.
The Metric Advisory Board has recommended the following units for use in New Zealand:
| Category | Unit | Symbol | Relationship |
|---|---|---|---|
| temperature | degree Celsius | °C | |
| length | millimetre | mm | |
| centimetre | cm | 1 cm = 10 mm | |
| metre | m | 1 m = 100 cm | |
| kilometre | km | 1 km = 1000 m | |
| area | square centimetre | cm2 | |
| square metre | m2 | 1 m2 = 10,000 cm2 | |
| decare | daa | 1 daa = 1000 m2 | |
| hectare | ha | 1 ha = 10 daa | |
| volume | cubic centimetre | cm3 | |
| cubic metre | m3 | 1 m3 = 1,000,000 cm2 | |
| capacity | millilitre | ml | |
| litre | 1 | 11 = 1000 ml | |
| weight | gram | g | |
| kilogram | kg | 1kg = 1000 g | |
| tonne | t | 1 t = 1000 kg |
In addition to the above 16 units, the decimetre (dm) will be taught to children as a convenient unit of length (1 dm = 10 cm).
| Metric Equivalents |
| 1 mm = 0.039 in. |
| 1 cm = 0.394 in. |
| 1 dm = 3.937 in. |
| 1 m = 39.37 in. |
| = 3.281 ft |
| = 1.094 yds |
| 1 km = 0.621 miles |
| 1 cm2 = 0.155 sq in. |
| 1 m2 = 10.764 sq ft |
| = 1.196 sq yds |
| 1 da = 0.247 acres |
| 1 ha = 2.471 acres |
| 1 km2 = 247.1 acres |
| = 0.386 sq miles |
| 1 cm3 = 0.061 cu in. |
| 1 m3 = 35.315 cu ft |
| = 1.308 cu yds |
| 1 ml = 0.035 fl. oz |
| 1 litre = 1.760 pts |
| = 0.880 qts |
| = 0.220 gal |
| 1 g = 0.035 oz |
| 1 kg = 2.205 lb |
| = 0.019 cwt |
| 1 t = 2,204 .62 lb |
| = 0.984 long tons |
| = 1.102 short tons |
| Commonplace Units of Measurement | ||
|---|---|---|
| Item | Metric | Imperial Measure |
| Man's height | 1.72 m (metres) | 5 ft 8 in. |
| Man's weight | 74.8 kg (kilograms) | 11 st 11 lb |
| Woman's weight | 57.0 kg (kilograms) | 9 st 0 lb |
| Body temp. (normal) | 37.0°C (degrees centigrade) | 98.4°F |
| Door height | 2.00 m (metres) | 6 ft 6 in. |
| Car length | 4.70 m (metres) | 15 ft 6 in. |
| Oil drum capacity | 2001 (litres) | 44 gal |
| Building section's area | 1,000 m2 (square metres) | 1/4 acre |
| Dunedin to Christchurch | 370 km (kilometres) | 230 miles |
| Altitude of Mt. Cook | 3,764 m (metres) | 12,349 ft |
Full details of individual conversions will be publicised in ample time for public assimilation. The Metric Advisory Board has not produced any detailed conversion aids as these, together with a New Zealand Standard which is an authoritative document on the International System, are available from: Sales Section, Standards Association of New Zealand, Private Bag, Wellington.
Metric Symbol—The metric symbol was introduced in March 1971. A paper defining the conditions of use of the metric symbol may be obtained from the offices of the Metric Advisory Board, P.O. Box 10-243, Wellington.
PATENTS, DESIGNS, AND TRADE MARKS—The legislation concerned is the Patents Act 1953, the Trade Marks Act 1953, and the Designs Act 1953. The total number of applications for the grant of letters patent, and for the registration of designs and trade marks during the financial year 1973-74 was 7,976 which was 600 more than in the previous year.
The following table shows the number of applications for patents and for the registration of trade marks and designs for March years.
| Year | Patents | Trade Marks | Designs |
|---|---|---|---|
| 1963-64 | 3,192 | 2,571 | 366 |
| 1964-65 | 3,447 | 2,690 | 435 |
| 1965-66 | 3,450 | 2,591 | 340 |
| 1966-67 | 3,665 | 2,947 | 361 |
| 1967-68 | 3,698 | 2,901 | 423 |
| 1968-69 | 3,953 | 3,195 | 405 |
| 1969-70 | 3,701 | 3,320 | 301 |
| 1970-71 | 3,573 | 3,385 | 315 |
| 1971-72 | 3,497 | 3,593 | 468 |
| 1972-73 | 3,518 | 3,515 | 343 |
| 1973-74 | 3,566 | 4,041 | 369 |
Patents—The applications received during 1973-74 were broadly classified as follows: chemistry, 1,120; mechanical engineering, 965; electrical engineering, 483; building construction, 390; primary industries, 180; home science and miscellaneous, 428.
Applications originating in New Zealand totalled 953, the United States 808, Great Britain 589, Australia 316, with the remaining 900 distributed among 34 other countries.
Trade Marks—During the year 1973-74 applications for trade marks covered the whole of the 34 classes prescribed, the most favoured being: Class 5, pharmaceutical and sanitary substances, etc., 532; Class 3, soaps, detergents, perfumery, cosmetics, etc., 319; Class 25, clothing, boots, shoes, etc., 265; scientific equipment, etc., 311.
The countries from which the applications originated were: New Zealand, 1,352; United States, 969; Great Britain, 643; Australia, 331; with the remaining 746 distributed among 30 other countries.
Renewal of registration of 2,530 trade marks was effected during the year.
Designs—A total of 230 industrial designs was registered during the year 1973-74.
INVENTIONS DEVELOPMENT AUTHORITY—In March 1968 the New Zealand Inventions Development Authority was appointed under the Inventions Development Act 1966. The general function of the authority is to promote the development or exploitation of inventions with the object of improving the quality, efficiency, or range of goods or services available for use in New Zealand or for export. The definition of “invention” includes any new or improved process or technique. A main function of the Authority is to secure the development or exploitation of inventions resulting from public research.
There are three main categories of inventions: those from government sources; those from research institutes and universities; and those from private inventors. In general, inventions from government sources are regarded as the property of the Crown. These may be assigned to the Authority for management and exploitation in the national interest at the initiative of the department concerned. A number of such inventions are currently held by the Authority and are either under evaluation, under development, or are licensed for manufacture.
The Authority also assists in the promotion and exploitation of inventions from research institutes and universities if in the public interest and, if desired, becomes the assignee of the patent rights. Revenue sharing with the Authority is by agreement.
The private inventor is, of course, free to make direct contact with industrial firms operating in the field in which his invention lies. If the invention is technically and commercially attractive, a firm may well be willing to develop it to production stage at its own expense. But if industrial interest is not forthcoming, perhaps because the invention is not sufficiently developed for a judgment to be made, the Authority may be able to help.
In the year ended 31 March 1974, 18 inventions were submitted from public research sources and 66 from private inventors; there were 116 other inquiries involving requests for assistance on patenting, development, and exploitation of inventions.
COPYRIGHT—Under the Copyright Act 1962, copyright comes into existence automatically upon the completion of any original literary, dramatic, musical, and artistic work (including photographs). No registration is necessary (or even possible), nor is any other formality required for securing copyright protection.
Copyright also exists in New Zealand for sound recordings, cinematograph films, broadcasts, and published editions (typography) of literary, dramatic, and musical works.
Copyright in literary, dramatic, musical, and artistic works (except photographs) continues until 50 years after the author's death, if the works are published in the author's lifetime, and until 50 years after publication or 75 years after death (whichever is shorter) if they are unpublished at the death of the author. Copyright in photographs, sound recordings, cinematograph films, and broadcasts continues until 50 years after the making, and in editions until 25 years after publication.
Copyright in New Zealand in literary, dramatic, musical, and artistic works and in cinematograph films extends to all countries which are parties to the International Convention for the Protection of Literary and Artistic Works (Berne Copyright Union) and to all countries which are parties to the Universal Copyright Convention. In some cases sound recordings, broadcasts, and published editions arc also protected overseas. New Zealand is a party to both conventions. Most of the important countries of the world (except at present Russia and China, but all English-speaking countries) have acceded to the one or the other or to both conventions.
In New Zealand certain disputes relating to performing rights of copyright works, sound recordings, or films may be determined by the Copyright Tribunal.
INDUSTRIAL DESIGN COUNCIL—This council has been established under the Industrial Design Act 1966 to promote the development of industrial design with the object of improving the quality, efficiency, packaging, and appearance of goods produced in New Zealand. It works in closely with the Inventions Development Authority. It has established a design index whereby approved products can qualify to display the Designmark label. A magazine Designscape is published and liaison functions are provided for a designer service.
STANDARDS COUNCIL—The Standards Act 1965 established the Standards Council as the governing body of the Standards Association of New Zealand (SANZ). Its aims are to improve efficiency and stimulate development in industry and commerce by providing standards documents, which will also assist in promoting public and industrial welfare, health, and safety. The association administers the standard certification mark scheme, which encourages improved quality control in industry with consequent improvement in the quality of consumer goods.
The council regards international standardisation as an important factor in facilitating international trade. The association is the New Zealand member of the International Organisation for Standardisation (ISO) and the Pacific Area Standards Congress (PASC). It has limited membership of the International Electrotechnical Commission (IEC). The library of the association includes about 167,000 overseas or international standards. New Zealand and British standards, and the publications of ISO and IEC, can be obtained from the SANZ sales section.
The association depends on the subscriptions of members and on sales of standards for a large proportion of its income. Sales of standards exceed 100,000 annually and the subscribing membership of the association includes most of the more prominent manufacturers and local authorities. It numbers over 1,200.
PUBLIC TRUST OFFICE—In the early years of settlement in New Zealand those who wished to make provision for the administration of their estates on their deaths often experienced difficulty in selecting a suitable person competent and willing to act as trustee. That difficulty was natural in a new country where the colonists were fully occupied with their own affairs, and were unable to give to the property or business of another the close attention that was demanded.
In these circumstances the Public Trust Office was established in 1872 (it is now constituted under the Public Trust Office Act 1957) under the administration of the Public Trustee, a corporation sole with perpetual succession and a seal of office. The main purpose of the original Act was to provide a means of overcoming the difficulties that have been mentioned and to make available to the public a trustworthy administrator of the estates of deceased persons at a reasonable cost, the integrity of the Public Trustee and his officers being guaranteed by the State. That continues to be the chief function of the Office, but since its establishment the range of services has been very considerably extended. The Public Trustee now acts in many capacities, e.g., as administrator in intestate estates;executor and trustee under wills; trustee under marriage and other settlements; trustee of benefit or relief funds; agent or attorney for absentees or persons desiring to be relieved of business worries; sinking fund commissioner for local authorities; administrator of unclaimed lands and property; manager of the estates of protected patients (other than Maoris); manager (when so appointed by the court) of the estates of aged and infirm persons unable to attend to their own affairs; and trustee of compensation moneys. The wills of persons desiring the Public Trustee to act as their executor and any subsequent will or codicil may be prepared and held in safe custody by him, free of charge. With certain qualifications the Public Trustee may act jointly with another person or persons.
In lieu of obtaining probate or other grant of administration, the Public Trustee may file in an office of the Supreme Court an election by him to administer an estate (testate or intestate) if the gross value of the property in New Zealand is estimated not to exceed $7,500. If after the filing of the election the value of the property is found to exceed $10,000 the Public Trustee must obtain a grant of probate or administration in the ordinary way.
During the year ended 31 March 1974, 5,493 estates and funds valued at $63,173,382 were accepted for administration. The administration of 4,994 estates and funds was completed. Estates and funds under administration at 31 March 1974 numbered 19,970 and were valued at $237,483,599.
Capital moneys becoming available for investment either form part of the Common Fund of the Office or, at the option of the testator or settlor, are invested in such securities as he may specify. Interest is allowed on moneys in the Common Fund at the rate fixed from time to time by the Governor-General in Council and is free of all commission and other charges. Both capital and interest are guaranteed by the State, thus affording the complete security that it is the object of the Office to provide. On the other hand, moneys directed to be invested in specific securities do not carry the State guarantee and, subject to the Public Trustee's ordinary liability as a trustee, any loss resulting from their investment falls upon the estate concerned. Commission is charged on the collection of the interest.
Charges and commission rates are contained in the Public Trust Office Regulations 1958.
New investments completed during the year ended 31 March 1974 totalled $18,774,828. The investments held by the Office at 31 March 1974 totalled $85,590,673. These figures relate exclusively to Common Fund investments, and do not include other special investments made on behalf of estates, or investments which constitute assets of estates when the latter came under the Public Trustee's administration and which are still held as assets of those estates.
During the year ended 31 March 1974, 15,421 wills appointing the Public Trustee executor were deposited with him for safe custody. The total number of such wills held on deposit at 31 March 1974 was 260,620. During the year ended 31 March 1974 effect was given in 11,448 cases to changes desired by testators.
BANKRUPTCY—The law relating to bankruptcy in New Zealand is contained in the main in the Insolvency Act 1967 and the Insolvency Regulations 1970. Jurisdiction in bankruptcy matters is vested in the Supreme Court.
All proceedings in bankruptcy are commenced by a petition filed in the court. A petition may be filed either by the debtor or by a creditor, a fee of $12 being payable. The filing of a debtor's petition is equivalent to an order of the court adjudging the debtor a bankrupt, no order being required in this case. Not less than $200 in the aggregate must be owing by the debtor to the creditor or creditors filing a petition.
The Official Assignee is empowered to sell the bankrupt's property, to claim debts due to the bankrupt estate, to carry on the business of the bankrupt so far as is necessary or expedient for its beneficial winding up, or to divide the property among the creditors. The bankrupt may be appointed by the Official Assignee to manage his estate or carry on his business on behalf of the creditors.
Creditors may accept a composition in satisfaction of the debts due to them. In such a case, after approval of the court, a deed of composition is executed and filed, and the bankruptcy annulled.
On application being made by the bankrupt, the court is empowered to grant him an order of discharge, either absolute, suspended, or conditional. The application may be opposed either by the Official Assignee or by any creditor who has proved his claim. A public examination of the bankrupt may be demanded by the assignee on a resolution by creditors. A person adjudged bankrupt is discharged three years after the date of adjudication unless discharged sooner.
Another form of financial failure is covered by private assignments, of which there were 6 in 1969, 5 in 1970, 6 in 1971, 2 in 1972, 1 in 1973, and 2 in 1974. Private assignments are not included in official bankruptcy statistics.
Transactions in Bankruptcy—The number of transactions in bankruptcy during the last 6 years is now given. A long-term record of the more important features will be found in the Statistical Summary given later in this volume.
| Year | Bankruptcies | Orders of Discharge or Annulment Granted | Court Orders for Liquidation of Companies | Total Commercial Failures | |
|---|---|---|---|---|---|
| Petitions by Debtors | Adjudications on Petitions by Creditors | ||||
| 1969 | 523 | 69 | 121 | 67 | 659 |
| 1970 | 469 | 66 | 194 | 61 | 596 |
| 1971 | 350 | 52 | 134 | 75 | 477 |
| 1972 | 324 | 65 | 118 | 72 | 461 |
| 1973 | 209 | 46 | 76 | 74 | 329 |
| 1974 | 204 | 46 | 250 | 74 | 324 |
In the case of a partnership, each partner is counted in the total of transactions and also the partnership. The general bankruptcy statistics do not cover assignments and compositions, but relate only to cases dealt with by official assignees.
In some cases of company liquidations, subsequent court orders are given for the winding up of companies to be transferred to private liquidators. There were 9 such cases in 1969, 7 in 1970, 3 in 1971, 1 in 1972, 1 in 1973, and 2 in 1974; these are not included in the above table and succeeding tables.
The table following shows for each of the last 11 years the average amount of debts proved per estate, and also the proportion of dividends, preferential claims, and secured claims, to debts.
| Year | Average Debts Proved per Estate | Proportion of Dividends, etc., to Debts |
|---|---|---|
| $ | percent | |
| 1964 | 3,520 | 16.8 |
| 1965 | 4,610 | 13.3 |
| 1966 | 4,010 | 15.1 |
| 1967 | 3,546 | 10.7 |
| 1968 | 4,565 | 6.8 |
| 1969 | 5,680 | 14.8 |
| 1970 | 6,141 | 10.3 |
| 1971 | 7,278 | 13.7 |
| 1972 | 8,977 | 11.9 |
| 1973 | 9,091 | 20.9 |
| 1974 | 9,287 | 18.8 |
Apart from dividends, preferential and secured claims, and Government commission, payments made from assets realised include cost of actions, solicitors' fees, and expenses incurred in managing estates for the benefit of creditors.
In the following table bankruptcies are classified according to amount groups of stated liabilities. With all partnerships the liabilities for each partner are included, but not the partnership. Company liquidations are included.
| Liabilities | 1970 | 1971 | 1972 | 1973 | 1974 |
|---|---|---|---|---|---|
| *Excludes partnerships, 1970, 4; 1971, 1; 1972, 3; 1973, 4; 1974, 6 for which no statement of liabilities was received: also companies 9 in 1972; 7 in 1973 and 6 in 1974. | |||||
| Under $500 | 64 | 54 | 31 | 23 | 15 |
| $500- $999 | 115 | 69 | 60 | 45 | 44 |
| $1,000-$1,999 | 137 | 83 | 77 | 49 | 44 |
| $2,000-$3,999 | 94 | 93 | 77 | 63 | 57 |
| $4,000-$9,999 | 104 | 88 | 91 | 71 | 71 |
| $10,000 and over | 78 | 89 | 113 | 67 | 81 |
| Totals | 592* | 476* | 499* | 318* | 312* |
Industry Groups of Bankrupts—All persons adjudged bankrupt (whether self-employed, employers of labour, or salary and wage earners) have been classified in the following table according to the industry in which they were last employed.
| Industry Group | 1970 | 1971 | 1972 | 1973 | 1974 |
|---|---|---|---|---|---|
| *Excludes partnerships as follows: 1969, 4; 1970, 4; 1971, 1; 1972, 9; 1973, 6; 1974, 6. | |||||
| Agriculture and livestock production | 48 | 41 | 31 | 12 | 29 |
| Forestry, hunting, and fishing | 24 | 16 | 22 | 9 | 14 |
| Mining and quarrying | - | - | 2 | - | 1 |
| Manufacturing— | |||||
| Food and beverages | 15 | 16 | 15 | 8 | 3 |
| Footwear and textiles | 12 | 4 | 3 | - | 2 |
| Wood, furniture, and fixtures | 11 | 4 | 5 | 2 | 1 |
| Printing and publishing | - | - | 2 | 2 | - |
| Machinery (not electrical) | 17 | 3 | 2 | 3 | - |
| Transport equipment | 13 | 14 | 9 | 9 | 4 |
| Other | 7 | 17 | 11 | 7 | 11 |
| Construction | 90 | 58 | 69 | 50 | 47 |
| Wholesale and retail trade | 89 | 63 | 59 | 52 | 40 |
| Other commerce | 7 | 7 | 11 | 10 | 14 |
| Transport, storage, and communications | 72 | 40 | 37 | 24 | 24 |
| Personal and community services | 65 | 79 | 48 | 28 | 24 |
| Industry not adequately described | 37 | 10 | 38 | 20 | 16 |
| Persons not gainfully employed in any industry | 24 | 29 | 16 | 13 | 14 |
| Totals* | 531 | 401 | 380 | 249 | 244 |
The types of activity in which bankrupts were engaged at the time of failure frequently bear little relationship to the fact of insolvency. Personal extravagance or business incompetence are probably much more important factors in the majority of cases.
The occupational status of individual bankrupts is given in the following table. With all partnerships the occupation of each partner is included, but not the partnership.
| Year | Occupational Status | ||||
|---|---|---|---|---|---|
| Working for Salary or Wages | Employer of Labour | Working on Own Account But Not Employing Labour | Not Gainfully Employed | Total* | |
| *Excludes partnerships as follows: 1965, 1; 1966, 4; 1967, 12; 1968, 12; 1969, 4; 1970, 4; 1971, 1; 1972, 9; 1973, 6; 1974, 6. | |||||
| 1964 | 262 | 69 | 139 | 13 | 483 |
| 1965 | 251 | 91 | 123 | 17 | 482 |
| 1966 | 262 | 92 | 114 | 11 | 479 |
| 1967 | 301 | 116 | 143 | 30 | 590 |
| 1968 | 392 | 119 | 193 | 42 | 746 |
| 1969 | 263 | 123 | 172 | 30 | 588 |
| 1970 | 243 | 101 | 163 | 24 | 531 |
| 1971 | 159 | 87 | 126 | 29 | 401 |
| 1972 | 157 | 86 | 116 | 21 | 380 |
| 1973 | 97 | 52 | 87 | 13 | 249 |
| 1974 | 86 | 54 | 90 | 14 | 244 |
INTERNATIONAL INDICATORS OF STANDARDS OF LIVING—Measurements of standards or levels of living between countries constitute a complex problem for which there is no completely adequate or satisfactory solution in the way of an index that can be applied internationally. United Nations statistics on estimates of gross national product per head are indicators of relativities in the production of goods and services on a national basis; leading countries include United States, Sweden, Canada, Switzerland, Denmark, France, Australia, Norway, West Germany, Belgium, New Zealand, Netherlands, United Kingdom, Finland, and Japan.
Relative standards of living cannot be compared by taking per-head incomes or expenditure alone. Environmental and other factors are being increasingly recognised as components of quality of life, a much less easily measured concept. In assessing standards of living, the United Nations Economic and Social Council is now giving consideration to the development of social indicators parallel with purely economic terms of measurement. These include health and personal safety; equality of educational opportunity; employment and quality of working life; leisure satisfaction; social security provisions; social opportunity and quality; social, cultural, and communication capabilities; housing and community; physical environment.
Methods of measurement of these factors are being recommended on an international basis. In these wider terms of reference New Zealand's position is appreciably improved.
Some comparative indicators related to standards of living are set out in the following table. In other sections of the Yearbook there are international comparisons on food consumption, life expectancy, infant mortality, and newspaper circulation.
| Item | New Zealand | United States | Canada | Australia | United Kingdom | Sweden |
|---|---|---|---|---|---|---|
*England and Wales. †1971. | ||||||
| Number per 1,000 of population— | ||||||
| Passenger cars (1972) | 328 | 454 | 323 | 314 | 221 | 292 |
| Television sets (1972) | 250 | 474 | 349† | 227 | 305 | 333 |
| Telephones (1972) | 458 | 628 | 499 | 340 | 314 | 576 |
| Enrolment in higher education per 100,000 of population (1969) | 2,029 | 3,896 | 2,668 | 1,368 | 716* | 1,439 |
| Public education expenditure as a percentage of GNP at market price | 4.6 | 5.1 | 5.7 | 3.3 | 4.2 | 7.4 |
| (1968-69) | (1967) | (1965) | (1968-69) | (1965) | (1966) | |
| Newsprint (kg per head) (1971) | 32.1 | 43.8 | 30.7 | 36.6 | 24.9 | 31.8 |
| Persons per hospital bed (1970) | 98 | 133 | 101 | 83 | 110 | 67 |
| Persons per doctor (1971) | 844 | 634 | 662 | 792 | 787* | 734 |
SOCIAL GOALS—New Zealand, in its approach to the matter of social goals and social indicators has proceeded along the guide lines proposed by the United Nations. In this approach, goals are defined as pragmatically as possible and indicators are sought which are both statistically valid and currently available and have been collected over a number of years. The choice of social indicators is not unduly influenced by matters of immediate concern but reflects the long-run social objectives of the society. The Social Council has recently completed a statement of a goal and objectives for social development in New Zealand and this is set out as follows.
Goal for Social Development—A social, cultural, physical, and economic environment which provides the maximum opportunity for each person now and in the future to achieve self-fulfilment in a caring community concerned for the rights and well-being of all.
Objective A—To strengthen the spirit of community by ensuring each person has the maximum opportunity to:
Create and belong to family and other social units based on mutual co-operation and responsibility, affection, whanaungatanga, and aroha.
Participate in community decision-making.
Contribute towards the generation of community objectives.
Contribute his or her unique qualities towards the achievement of community objectives.
Share in the benefits of attaining community objectives.
Objective B—To enhance the dignity, freedom, and independence of the individual by ensuring that:
Each person is regarded as having dignity and as being worthy of respect.
Each person has the maximum freedom of choice and action without encroaching upon the rights of others.
Decisions relating to community objectives take account of the views and situations of all persons living in the community.
Each person is encouraged to understand and appreciate the views and religious, political, ethnic, and cultural differences of other persons and groups.
Each person has adequate access to processes of law and equal rights before the law.
Objective C—To preserve life and promote health by ensuring that:
Each person has the opportunity to be as physically healthy and fit and emotionally healthy and stable as his potential allows.
A stable family or other intimate group is provided for children growing up (and dependent adults).
Adequate and readily available health services are provided.
The hazards of injury, accident, and crime are kept to a minimum.
Objective D—To share resources fairly by ensuring each person has:
The opportunity of a material standard of living at a level which enables him or her to enjoy a sense of belonging to and participating in the community.
The opportunity to own and enjoy property and possessions.
Access to the knowledge and skills which will lead to the development of the individual and the well-being of the community.
Vocational opportunities which are satisfying and within his or her capabilities.
Ready access to leisure time activities.
Ready access to the community social welfare services.
Objective E—To enhance man's environment by:
Ensuring the ecological balance between man and his environment is such that his use and enjoyment of the environment does not endanger the quality of life of future generations.
Preserving community access to and enjoyment of the country's physical endowments and attractions.
Promoting the social, intellectual, artistic, creative, and physical pursuits which enrich people's lives.
Helping people in other parts of the world in their efforts to achieve a better life.
Promoting world peace and justice and international understanding.
The Department of Statistics is gathering a number of series of social statistics into a compendium Social Trends in New Zealand.
LOTTERIES—Under the Gaming Act 1908 the Police may license raffles where the value of prizes does not exceed in aggregate $50 or the value of any one prize does not exceed $20. The Police may also approve specified organisations conducting raffles, where the aggregate value of prizes in any one raffle does not exceed $10, without the necessity for individual licences. Raffles with prizes exceeding the above maximum values may be licensed by the Minister of Internal Affairs. There were 19,639 licences issued under the Minister's authority during the year ended 31 March 1974, to local, provincial, and national organisations. The Gaming Act precludes the issue of licences to conduct raffles for the purpose of private gain. Otherwise, the Police and the Minister may issue licences subject to such conditions as they think fit.
The Minister of Internal Affairs promotes “Kiwi Jackpot”, “Kiwi Super”, and special sweepstake lotteries. The number of tickets in each lottery is restricted to 250,000 at 50c each in the case of the “Kiwi Jackpot”, 150,000 at $2 each in the case of the “Kiwi Super”, and 150,000 at $5 each in the case of the “Special Sweepstake”. The aggregate financial results of these lotteries is shown for the latest 8 years.
| Item | 1966-67 | 1967-68 | 1968-69 | 1969-70 | 1970-71 | 1971-72 | 1972-73 | 1973-74 | |
|---|---|---|---|---|---|---|---|---|---|
| *44 Golden Kiwi, 2 Mammoth and 4 special sweepstakes. | |||||||||
| Number of lotteries | .. | 49 | 45 | 47 | 50 | 44 | 45 | 49 | 50* |
| Gross sales | $(000) | 8,375 | 7,124 | 6,624 | 7,375 | 6,250 | 6,374 | 9,750 | 9,500 |
| Commission on sales | $(000) | 725 | 655 | 653 | 711 | 614 | 627 | 825 | 820 |
| Expenses | $(000) | 245 | 231 | 240 | 231 | 205 | 209 | 241 | 318 |
| Prizes | $(000) | 4,458 | 3,786 | 3,510 | 3,912 | 3,312 | 3,378 | 5,158 | 5,044 |
| Lottery duty | $(000) | 837 | 712 | 662 | 737 | 625 | 637 | 975 | 950 |
| Direct profit | $(000) | 2,109 | 1,739 | 1,559 | 1,784 | 1,494 | 1,523 | 2,551 | 2,368 |
The net profits from these lotteries are required by the Gaming Amendment Act to be distributed for charitable, philanthropic, or cultural purposes or for other purposes beneficial to the community. A lottery board of control has the responsibility of apportioning profits of lotteries to various distributing authorities which consider applications for assistance and make grants. Allocations made by the board in 1973-74 were as follows: $270,000 for the welfare of aged persons; $400,000 for social welfare, including various mayoral and other funds for relief of distress; $795,000 for youth organisations, sporting bodies, national water safety, national mountain safety, and to various bodies providing community facilities; $200,000 for medical research; $200,000 for scientific research; $250,000 to the Queen Elizabeth the Second Arts Council; $250,000 for capital works in connection with theatres and concert auditoria; and $130,000 for miscellaneous purposes.
LIQUOR LICENSING—The principal source of the liquor law of New Zealand is the Sale of Liquor Act 1962. The principles on which the liquor law of New Zealand rests are that no liquor may be sold without a licence, that new licences are not to be authorised unless they are shown to be necessary or desirable in the locality, and that there should be close regulation of the conduct of the trade and of the provision and standard of accommodation, amenities, and services.
There is a Licensing Control Commission whose principal functions are to ascertain the requirements of the public as to the provision of accommodation, services, and other facilities on licensed premises; to determine what new hotel, tavern, and tourist house premises licences, restaurant licences, and wholesale licences are needed and to authorise their issue; to review provisional hotel licences and determine whether the licence to be issued in their place should be a hotel or tavern premises licence; to prescribe and enforce standards of accommodation, amenities, and services; to grant club charters; and to hear appeals from licensing committees. There is a right of appeal to the commission from every decision of a licensing committee except on a matter of law or character in which case the appeal is to the Supreme Court. Many of the commission's decisions are themselves subject to appeal to the Supreme Court, and an appeal may be brought in any case on a point of law. Appeals now lie to the Administrative Division of the Supreme Court.
Licences either in force or authorised at 31 March 1974 comprised 798 hotel premises licences, 279 tavern premises licences, 63 tourist house premises licences, and 172 wholesale licences.
There are 47 permanent club charters and 249 renewable club charters in force. All the permanent charters and some of the renewable charters permit the sale of liquor to members for consumption off as well as on the premises.
A total of 344 wine resellers' licences have been authorised.
New Licences—The Licensing Control Commission decides after a public inquiry whether the issue of a hotel, tourist house, or tavern premises licence, or a wholesale or wine reseller's licence is desirable in a particular locality. In the case of a hotel, tourist house, or tavern premises licence, the commission prescribes the minimum standards of accommodation, services, and other facilities that must be provided. It may direct that any bar-room of a hotel or tavern shall contain facilities for sit-down drinking. There is provision for a poll of residents on the question whether a hotel or tavern premises licence is not desired in the locality, and if the majority of votes recorded at the poll is against the licence the commission may not authorise one unless special circumstances exist.
Subject to the result of any such poll the commission (or in the case of a wholesale or wine reseller's licence, the Licensing Committee) then calls for applications for the licence. The decision of the commission or the committee as to which applicant should receive the licence in effect fixes the exact site of the proposed premises. In the case of a hotel or a tavern any adult residing within a quarter of a mile may object to the Town and Country Planning Appeal Board on the grounds that the site is in the immediate vicinity of a church, school, or hospital, or that the objector will be adversely affected by the establishment of a hotel or tavern on the site. In considering an objection on the ground of adverse affection, the board has regard to the provisions of any district planning scheme (or if there is no such scheme, planning principles), to the distance between the site and the nearest substantial number of houses, to the provision made for off-street parking, and to other relevant circumstances.
Hours of Sale—The Sale of Liquor Act 1962 governs the hours of sale. A special general poll was held on 23 September 1967 concerning the closing hours for the sale of liquor in hotel, tavern, and chartered club bar-rooms. The closing hour had been 6 p.m. since 1917. Voting for later closing was 641,105 and for 6 p.m. closing it was 353,662. Under the Sale of Liquor Amendment Act 1967 the usual hours of opening and closing of hotels or taverns were fixed at 11 a.m. and 10 p.m. respectively, and the new hours applied from 9 October 1967. Provision was made for the Licensing Committee to vary the hours for particular hotels or taverns but no premises are to be open for the sale of liquor to the public for more than 11 hours a day. Sales from licensed premises are prohibited on Sundays, Christmas Day, and Good Friday.
Legislation in 1960 authorised hotels to serve liquor to guests and lodgers partaking of a meal for consumption with the meal up to 11.30 p.m. on any day and between 12 noon and 2.30 p.m. on Sunday, Christmas Day, and Good Friday. By the same Act the hours during which licensed restaurants may sell and serve liquor to diners were fixed as 12 noon to 2.30 p.m. and 6 p.m. to 11.30 p.m. on any day. The Sale of Liquor Act 1962 authorises the commission to grant permits to a hotel for the sale of liquor in a lounge or lounge bar to diners during hours fixed by the commission, but not later than 11.30 p.m. It also provides for theatre, cabaret, and airport licences and prescribes the hours of sale in each case.
Drinking Age—The Sale of Liquor Amendment Act 1969 made provision from 24 October 1969 for the sale of liquor to persons of the age of 20 years; liquor may also be supplied to persons of 18 years and over as part of a meal if the person is accompanied by a spouse of 20 or more years of age or a parent. The report of a royal commission in 1974 has recommended that the drinking age be lowered to 18 years.
Licensing Trusts—The system of trust control in New Zealand is an alternative to the traditional means of controlling the sale of liquor through privately held licences supervised by licensing committees, and the Licensing Control Commission gives the public an indirect control over the conditions under which liquor is sold. In the case of trusts, public control is direct since the whole of the liquor trade in a trust district is conducted by the trust, which is elected by the residents and is responsible to them.
The first licensing trust in New Zealand was set up in 1944 following the carrying of restoration in the former Invercargill no-licence district. There are now eight district trusts—Ashburton, Clutha, Geraldine, Invercargill, Masterton, Mataura, Oamaru, and Porirua. In addition an increasing number of local trusts scattered throughout the country are operating hotels. Because of the circumstances of the remaining no-licence districts and their relation to the metropolitan areas as a whole, legislation was enacted in 1963 providing a special procedure if any of them should carry restoration, and introducing a new form of trust control known as suburban trusts.
On the carrying of restoration in any remaining no-licence district, the Licensing Control Commission will review the area and decide what hotel, tourist-house, and tavern premises licences and what wholesale licences are necessary or desirable in the district or any locality or place therein.
The Commission also sets a date for a further poll to determine whether any licences that may be authorised should be offered to suburban trusts. Should the trust proposal be carried, the Commission, once it has completed its review of the area, must report to the Minister of Justice, giving its opinion as to the number of suburban trusts that should be established. Once the trust is established, it may apply for the licence or licences the Commission proposes to authorise and the application must be granted if it conforms to the standards defined by the Commission.
If the trust proposal were not carried the ordinary procedure under the Sale of Liquor Act would be followed. Five suburban trusts have so far been constituted, namely, Johnsonville and Wellington South (in Wellington), and Waitakere, Portage, and Mount Albert in Auckland.
GENERAL ELECTION RESULTS—A general election of parliamentary representatives was held on 25 November 1972, voting in New Zealand for both European and Maori electorates taking place on that day.
The strength of the political party representation among members of Parliament after the 1972 election was Labour 55, National 32. The relative strengths after the eight preceding general elections were as follows: November 1949, National 46, Labour 34; September 1951, National 50, Labour 30; November 1954, National 45, Labour 35; November 1957, Labour 41, National 39; November 1960, National 46, Labour 34; November 1963, National 45, Labour 35; November 1966, National 44, Labour 35, Social Credit 1; November 1969, National 45, Labour 39.
The total numbers of electors on the roll for the election in 1972 was 1,569,937, and persons not on the roll whose votes were allowed totalled 13,319. The percentage of qualified voters who voted was 89.05.
The following table shows for the last four general elections the number of votes recorded by the main political parties, along with the percentages that the various party votes represent of the total valid votes.
| Political Party | Votes Recorded | Percentage of Total Valid Votes | ||||||
|---|---|---|---|---|---|---|---|---|
| 1963 | 1966 | 1969 | 1972 | 1963 | 1966 | 1969 | 1972 | |
| Labour | 524,066 | 499,392 | 592,055 | 677,669 | 43.74 | 41.44 | 44.18 | 48.37 |
| National | 563,875 | 525,945 | 605,960 | 581,422 | 47.07 | 43.64 | 45.22 | 41.50 |
| Social Credit | 95,176 | 174,515 | 121,576 | 93,231 | 7.94 | 14.48 | 9.07 | 6.65 |
| Values | ... | ... | ... | 27,467 | ... | ... | ... | 1.96 |
| Others | 14,928 | 5,243 | 20,577 | 21,363 | 1.25 | 0.44 | 1.53 | 1.52 |
| Total valid votes | 1,198,045 | 1,205,095 | 1,340,168 | 1,401,152 | 100.00 | 100.00 | 100.00 | 100.00 |
| Informal votes | 7,277 | 7,032 | 11,645 | 9,088 | ... | ... | ... | ... |
| Total votes recorded | 1,205,322 | 1,212,127 | 1,351,813 | 1,410,240 | ... | ... | ... | ... |
A statement of voting in individual electorates at the general election in 1972 was given in pp. 957-961 of the 1973 Yearbook.
Voting for the Sydenham by-election on 2 November 1974 was as follows:
| Candidate | Party Recorded | Votes |
|---|---|---|
| Crawford, D. J. | I. | 321 |
| Fouhy, T. C. | C.I. | 274 |
| Goldsmith, A. S. | I.N. | 684 |
| Goodger, V. K. | S.A. | 181 |
| Kirk, N. J. | L. | 6,664 |
| Lea, A. | V. | 685 |
| Mitchell, D. K. | L.P.K. | 13 |
| Pounsford, H. J. | S.C. | 1,778 |
| Valid votes | 10,600 |
NATIONAL LICENSING POLL—The licensing poll of 25 November 1972 held in conjunction with the parliamentary elections, was the fourteenth at which the three issues—national continuance, State purchase and control, and national prohibition (without compensation)—were submitted to the electors. Official figures of the 1972 poll, together with those of five preceding polls, were as follows.
| Voting Issue | 1957 | 1960 | 1963 | 1966 | 1969 | 1972 |
|---|---|---|---|---|---|---|
| For national continuance | 723,059 | 765,952 | 791,767 | 817,760 | 903,962 | 931,778 |
| For State purchase and control | 160,483 | 138,644 | 157,581 | 176,946 | 242,499 | 244,003 |
| For national prohibition | 260,132 | 255,157 | 235,959 | 198,859 | 176,055 | 203.791 |
POLL ON TERM OF PARLIAMENT—On 23 September 1967 a special general poll was held on a proposal that the term of the House of Representatives be changed. Votes for a maximum of 3 years as at present totalled 678,960; votes for a maximum term of 4 years totalled 317,973.
TIME-SERVICE ARRANGEMENTS—One uniform time is kept throughout New Zealand. The New Zealand Gazette of 31 October 1868 contained a Government announcement to the effect that the time corresponding to longitude 172° 30' east of Greenwich (exactly 111/2 hours in advance of Greenwich time) was to be adopted as the New Zealand Mean Time throughout the colony.
This New Zealand Mean Time 11h 30 min. in advance of Greenwich Mean Time (G.M.T.), was observed continuously up to 1927, when on 6 November clocks were advanced 1 hour until 4 March 1928. Summer Time, with clocks advanced only 30 minutes (to 12 h ahead of G.M.T.), became standard practice in the summer months under the Summer Time Act 1929.
The Daylight Saving Emergency Regulations of 1941 provided for the continuance of Summer Time throughout that year, and its continued observance during subsequent war years was provided for by regulations made annually.
By the Standard Time Act of 1945 the time of the meridian 180° east of Greenwich (12 h in advance of G.M.T.) was adopted as the Standard Time for New Zealand. Thus, what was formerly known as “Summer Time” became “New Zealand Standard Time” as from 1 January 1946.
The Time Act of 1974 consolidated the Standard Time Act of 1945 and also enabled the Governor-General, by Order in Council, to introduce 1 hour of daylight saving for specified periods. This time is designated New Zealand Daylight Time, and is 13 h in advance of Universal Time (or Greenwich Mean Time). The first period specified for the use of New Zealand Daylight Time was from 3 November 1974 to 23 February 1975.
Time in the Chatham Islands is 45 minutes ahead of that kept in New Zealand.
The time throughout New Zealand is controlled by the New Zealand Time Service, Department of Scientific and Industrial Research, Wellington. The Observatory signal clock is kept as correct as possible by comparison with radio signals from observatories in other parts of the world, and the error rarely exceeds a few milliseconds.
The Observatory provides a time service over Station ZLW and stations operated by TV1, TV2, and Radio New Zealand.
BOOK PUBLISHING—The following table classifies the publications for 1973 which have been included by the Alexander Turnbull Library in the New Zealand National Bibliography 1973.
| Subject | Books | Pamphlets | Total |
|---|---|---|---|
| General | 21 | 19 | 40 |
| Religion, theology, philosophy | 21 | 27 | 48 |
| Sociology, statistics | 15 | 22 | 37 |
| Political science | 57 | 68 | 125 |
| Law, public administration, social welfare | 42 | 45 | 87 |
| Education | 48 | 62 | 110 |
| Trade, communications, transport | 18 | 19 | 37 |
| Linguistics, philology | 3 | 4 | 7 |
| Sciences | 52 | 65 | 117 |
| Technology, and trades | 47 | 80 | 127 |
| Agriculture, forestry | 42 | 80 | 122 |
| Domestic science | 27 | 9 | 36 |
| Commercial management | 22 | 18 | 40 |
| Fine arts, etc. | 34 | 56 | 90 |
| Entertainment, sport | 30 | 25 | 55 |
| Literature | 64 | 47 | 111 |
| Geography, travel | 39 | 41 | 80 |
| History, biography | 38 | 21 | 59 |
| Totals | 623 | 716 | 1,339 |
The New Zealand National Bibliography, which commenced publication in 1967, is issued monthly and cumulated annually by the National Library of New Zealand. It lists works published in New Zealand and also works published overseas by authors normally resident in New Zealand, and works that deal in whole or part with New Zealand. It includes books, pamphlets, art prints, maps, new periodicals, and periodicals that have ceased publication.
As at 30 October 1973 there were 1,645 periodicals (other than parish and school magazines) being received regularly under the provisions of the Copyright Act.
COMPUTERS—Technological change is an influential contributor to economic growth. Outstanding examples are the electric motor and the computer. A useful study “The Role of the Computer in the New Zealand Economy” was published in 1968 by the New Zealand Institute of Economic Research. Basically, computers are logical electronic information handlers whether they are used for accounting, traffic control, scientific calculations, design simulation, or controlling industrial processes. The first computer was imported into New Zealand in 1960 and by 1968 the total had risen to 87. (By 1972 the total was estimated to be nearly 200.) In actual practice few computers are sold; they are imported by one of the large computer companies on behalf of the user who rents the equipment and pays importation charges of around three-quarters of the first year's rental (which for a medium-sized unit may be $50,000).
An international comparison of computer rental expenditure in relation to national income in 1967 was made by the Institute of Economic Research. Equating New Zealand's proportion to a base of 100. the corresponding figure for Australia was 140, and for Denmark 180, Norway 135, and Finland 120. (The latter three countries were selected because they have populations under 5 million and have important agricultural sectors). Computer applications in New Zealand are not generally at an advanced stage and few of them are working more than one shift.
The demand for computers has come from Government departments, local authorities, universities, primary producer boards, private firms in industries such as printing, forestry, insurance, oil, food processing, electrical equipment manufacturing, building and construction, clothing, engineering, airways, banking, retailing, motor assembly, paint manufacturing, and stock and station agents. The State Services Commission has established a computer centre in Wellington to serve a number of Government departments, while small private firms use independent bureaus and those run by equipment suppliers. A computer advisory service for commercial firms is available from the Physics and Engineering Laboratory, Department of Scientific and Industrial Research, Private Bag, Lower Hutt.
PUBLIC HOLIDAYS—These are listed below.
| Holiday | 1975 | 1976 | 1977 | 1978 | 1979 |
|---|---|---|---|---|---|
| *Date of Queen's Birthday, 21 April 1926. | |||||
| New Year's Day | 1 January | 1 January | 1 January | 1 January | 1 January |
| New Zealand Day | 6 February | 6 February | 6 February | 6 February | 6 February |
| Good Friday | 28 March | 16 April | 8 April | 24 March | 13 April |
| Easter Monday | 31 March | 19 April | 11 April | 27 March | 16 April |
| Anzac Day | 25 April | 25 April | 25 April | 25 April | 25 April |
| Queen's Birthday* | 2 June | 7 June | 6 June | 5 June | 4 June |
| Labour Day | 27 October | 25 October | 24 October | 23 October | 22 October |
| Christmas Day | 25 December | 25 December | 25 December | 25 December | 25 December |
| Boxing Day | 26 December | 26 December | 26 December | 26 December | 26 December |
In addition to the above, there is in each provincial district a holiday for the provincial anniversary. The actual anniversary days are as follows: Northland, 29 January; Auckland, 29 January; Taranaki, 31 March; Hawke's Bay, 1 November; Wellington, 22 January; Marlborough, 1 November; Nelson, 1 February; Canterbury, 16 December; Westland, 1 December; Otago and Southland, 23 March.
When Anniversary Day falls on Friday or later, the holiday is observed on the next Monday; if earlier, it is observed on the preceding Monday. In some cases the holiday is taken on the local show day or some other day; in Taranaki it is the second Monday in March to avoid a clash with Easter observance.
RACE RELATIONS—The Race Relations Act 1971 is designed to affirm and promote racial equality in New Zealand and implements the International Convention on the Elimination of All Forms of Racial Discrimination. Discrimination is unlawful on the grounds of colour, race, or ethnic or national origins, for: (a) access by the public to places, vehicles, and facilities; (b) provision of goods and services; (c) employment (including employment of independent contractors); (d) land, housing, and other accommodation. It is also unlawful to publish or display any advertisement or notice which indicates an intention to commit a breach of any of these provisions.
A breach of any of the provisions may be the subject of an investigation by the Race Relations Conciliator.
The Act also makes it an offence to incite racial disharmony.
The most important role for a race relations mediator is in situations where misunderstanding due to different racial backgrounds or concepts on the part of the parties has occurred. Potential racial incidents can often be avoided by a mediator with an explanatory role. This extension of the conciliator's duties from an area confined to complaints of racial discrimination to one where discrimination may not have occurred, but where racial misunderstanding exists, is in keeping with the aims of the Act of affirming and promoting racial equality in New Zealand.
SPORT AND RECREATION—New Zealand is fortunate in having excellent natural facilities for outdoor pursuits and sports. The climate is temperate and equable.
The long coastline, the numerous rivers, lakes, and mountain ranges give full opportunity for yachting, boating, swimming, surfing, mountaineering, tramping, and ski-ing. Sea and freshwater fishing, both by rod and by line, scuba diving, hunting, and shooting are extremely popular and relatively inexpensive.
Tennis, cricket, athletics, lawn bowls, Softball, water sports, and rowing are the most popular summer games and sports.
Rugby football is the leading winter sport but many people play rugby league football, association football, netball, indoor basketball, hockey, indoor bowls, table tennis, badminton and squash.
Golf is a popular summer and winter sport. Boxing, wrestling, gymnastics, judo, and fencing have a small following.
While some sports, for instance rugby football, attract many spectators, the high proportion of persons who actually take an active part in various sports and games compared with those who merely watch, is a striking characteristic of New Zealand life. In many sports there is a close association between school and club activities.
The administration of various sports clubs is generally controlled by national bodies within New Zealand through their district associations. The various sports in New Zealand are amateur. Promising players or performers have ample and equal opportunity on merit to represent first their clubs, then the district, and ultimately New Zealand in competitive play.
In major sports each organisation administers its own affairs. However, competitors to represent New Zealand at Olympic and Commonwealth Games are selected by an Olympic Council made up of representatives of the various sports associations.
The National Mountain Safety Council, together with its member organisations, conducts a national campaign for safety in the mountains and bush. Similarly, the National Water Safety Council, its member organisations, and swimming and lifesaving organisations, conduct a national water safety campaign, which includes general instruction in resuscitation procedures.
The Cobham Outward Bound School was established in Queen Charlotte Sound, Marlborough, in 1962, and several thousand boys aged 16 to 20 years have completed its short courses which use the challenges of the outdoors to promote self-confidence and self-discipline.
Within the schools greater emphasis is now placed on the encouragement of wider recreational interests which may be continued after leaving school and to the range of traditional team sports have been added activities such as golf, squash, surfing, yachting, fencing, tramping, flying, etc.
A system of school camps has been developed by the educational authorities. Permanent camp sites include Kaeo, Kawau, Port Waikato, Kaitawa, Paraparaumu, and Rotoiti. These camps attempt to promote the value of social growth through the provision of opportunities to live and work together and develop qualities of initiative, self-confidence, and independence. Young people are encouraged to enjoy and make use of the natural environment by developing skills of campcraft, tramping, map and compass work, bushcraft, water safety, sailing and canoeing, and climbing, etc. Field work on the natural sciences and geography involves study of the land forms and local ecology of river, sea, and bush life.
In recent years some universities have established facilities and appointed staff to serve the physical recreation needs of the student body at large. Regular physical activity and its accompanying social recreation have been found to produce considerable improvements to health and application to studies.
Recreation involves the arts, including drama, ballet, music, art and craft, just as much as the more active physical sports, and their development is more fully described elsewhere in the Yearbook in the section Support of Cultural Activities.
The range of musical recreation, involving both participants and audiences, includes orchestras, pipe and brass bands, operatic societies, dance bands and pop groups. Music plays a large part in community recreation, especially among the youth. It is interesting to note how the change to later hotel hours has tended to shift the musical focus from the dance hall to the hotel where musical groups now entertain in the evenings.
Maori and Pacific Island cultural groups organise especially for their young people recreational activity, which provides not only a grounding in the richness of their cultural heritage but also helps to counter the stresses placed on those inexperienced in urban living.
Financial Assistance—Grants from Government to national youth organisations to assist their development and leadership training programmes are made to organisations such as the National Youth Council, the Young Men's Christian Association, the Young Women's Christian Association, and the Youth Hostels' Association. During 1973-74 these grants totalled $76,100. In addition a total of $89,900 was paid in 1973-74 to national uniformed youth organisations by way of capitation grants on the basis of $50 per 100 members, with a maximum grant of $30,000 for any one organisation.
Sporting and recreational organisations receive some financial assistance from lottery profits, but to qualify for assistance the organisation must show a substantial degree of self help.
The Department of Internal Affairs is responsible for a subsidy scheme to provide financial assistance to religious groups of up to one-fifth of the total cost of a project of building or extending a hall or camp used for youth work. For 1973-74 a total of $105,606 was paid out.
The National Mountain Safety Council and National Water Safety Council received annual allocations from lottery profits of $45,000 and $115,000 respectively. Twenty-eight mountain safety committees organise courses on bushcraft, alpine instruction, map reading, exposure prevention, firearm safety, and ski-ing safety.
The department has youth activities officers stationed at each of the main centres with the tasks of maintaining close liaison with local authorities, educational institutions, and youth and community associations in order to gain support and advice for schemes involving recreational activities and of keeping the community informed of the needs of young people.
In November 1972, a Minister of Recreation and Sport was appointed. The Recreation and Sport Act 1973 provided for the establishment of a Ministry of Recreation and Sport and a New Zealand Council for Recreation and Sport. The general functions of the council are to foster and promote the total well-being of, and the fullest use of leisure by the residents of New Zealand; to advise the Minister on any matters relating to recreation and sport; and to investigate developments in recreation and sport, and disseminate knowledge and information about such developments. The sum of $3 million was appropriated through the Ministry during 1973-74 to support community recreational and sporting activities. Grants are designed to encourage the provision of new or expanded facilities or services either by local authorities or voluntary organisations, particularly for young people and senior citizens.
NATIONAL SONG—New Zealand's National Song is God Defend New Zealand, the words being written by Thomas Bracken and the music composed by John J. Woods.
The verses are now given.
| 1. God of nations at Thy feetIn the bonds of love we meet,Hear our voices, we entreat,God defend our Free Land.Guard Pacific's triple starFrom the shafts of strife and war,Make her praises heard afar,God defend New Zealand. | 2. Men of ev'ry creed and raceGather here before Thy face,Asking Thee to bless this place,God defend our Free Land.From dissension, envy, hate,And corruption guard our State,Make our country good and great,God defend New Zealand. |
| 3. Peace, not war, shall be our boast,But, should foes assail our coast,Make us then a mighty host,God defend our Free Land.Lord of battles in Thy might,Put our enemies to flight,Let our cause be just and right,God defend New Zealand. | 4. Let our love for Thee increase,May Thy blessings never cease,Give us plenty, give us peace,God defend our Free Land.From dishonour and from shameGuard our country's spotless name,Crown her with immortal fame,God defend New Zealand. |
| 5. May our mountains ever beFreedom's ramparts on the sea,Make us faithful unto Thee,God defend our Free Land.Guide her in the nations' van,Preaching love and truth to man,Working out Thy glorious plan,God defend New Zealand. | |
NEW ZEALAND ENSIGN—The national flag is the New Zealand Ensign described in a Gazette notice of 27 June 1902. Its specifications are given in an Encyclopaedia of New Zealand. The basis is the Union Jack in the upper left quarter, and on a blue ground to the right the Southern Cross is represented by four five-pointed red stars with white borders.
NEW ZEALAND COAT OF ARMS—The New Zealand Coat of Arms is pictured and described as a frontispiece in the 1969 and earlier issues of the Official Yearbook.
Table of Contents
His Excellency Sir Edward Denis Blundell, G.C.M.G., G.C.V.O., K.B.E.
Official Secretary—D. C. Williams, C.V.O.
(His Excellency assumed office on 27 September 1972)
Governors since 1840 and Governors-General since 1917 are listed below.
| Vice-Regal Representative | Assumed Office | Retired | ||
|---|---|---|---|---|
| THE DEPENDENCY PERIOD | ||||
| Lieutenant-Governor | ||||
| Captain William Hobson, R.N. | 30 Jan | 1,840 | 3 May | 1,841 |
| THE CROWN COLONY | ||||
| Governor | ||||
| Captain William Hobson, R.N. | 3 May | 1,841 | 10 Sep | 1,842 |
| Captain Robert FitzRoy, R.N. | 26 Dec | 1,843 | 17 Nov | 1,845 |
| Captain George Grey | 18 Nov | 1,845 | 31 Dec | 1,847 |
| Governor in Chief | ||||
| Sir George Grey, K.C.B. | 1 Jan | 1,848 | 7 Mar | 1,853 |
| THE SELF-GOVERNING COLONY | ||||
| Governor of New Zealand | ||||
| Sir George Grey, K.C.B. | 7 Mar | 1,853 | 31 Dec | 1,853 |
| Colonel Thomas Gore Browne, C.B. | 6 Sep | 1,855 | 2 Oct | 1,861 |
| Sir George Grey, K.C.B. | 4 Dec | 1,861 | 5 Feb | 1,868 |
| Sir George Ferguson Bowen, G.C.M.G. | 5 Feb | 1,868 | 19 Mar | 1,873 |
| The Right Hon. Sir James Fergusson, BART., G.C.S.L., K.C.M.G., C.I.E. | 14Jun | 1,873 | 3 Dec | 1,874 |
| The Right Hon. the Marquess of Normanby, G.C.B., G.C.M.G., P.C. | 9 Jan | 1,875 | 21 Feb | 1,879 |
| Sir Hercules George Robert Robinson, G.M.C.G. | 17 Apr | 1,879 | 8 Sep | 1,880 |
| The Hon. Sir Arthur Hamilton Gordon, G.C.M.G. | 29 Nov | 1,880 | 23 Jun | 1,832 |
| Lieutenant-General Sir William Francis Drummond Jervois, G.C.M.G., C.B. | 20 Jan | 1,883 | 22 Mar | 1,889 |
| Vice-Regal Representative | Assumed Office | Retired | ||
|---|---|---|---|---|
| The Right Hon. Earl of Onslow, G.C.M.G. | 2 May | 1,889 | 24 Feb | 1,892 |
| The Right Hon. Earl of Glasgow, G.C.M.G. | 7 Jun | 1,892 | 6 Feb | 1,897 |
| The Right Hon. Earl of Ranfurly, G.C.M.G. | 10 Aug | 1,897 | 19 Jun | 1,904 |
| The Right Hon. Baron Plunket, K.C.M.G., K.C.V.O. | 20 Jun | 1,904 | 8 Jun | 1,910 |
| The Right Hon. Baron Islington, G.C.M.G., G.B.E., D.S.O. | 22 Jun | 1,910 | 2 Dec | 1,912 |
| The Right Hon. Earl of Liverpool, G.C.B., G.C.M.G., G.B.E., M.V.O., P.C. | 19 Dec | 1,912 | 27 Jun | 1,917 |
| Governor-General of New Zealand | ||||
| The Right Hon. Earl of Liverpool, G.C.B., G.C.M.G., G.B.E., M.V.O., P.C. | 28 Jun | 1,917 | 7 Jul | 1,920 |
| The Right Hon. Viscount Jellicoe of Scapa, G.C.B., O.M., G.C.V.O. | 27 Sep | 1,920 | 26 Nov | 1,924 |
| General Sir Charles Fergusson, BART., G.C.B., G.C.M.G., D.S.O., M.V.O. | 13 Dec | 1,924 | 8 Feb | 1,930 |
| The Right Hon. Viscount Bledisloe, G.C.M.G., K.B.E., P.C. | 19 Mar | 1,930 | 15 Mar | 1,935 |
| The Right Hon. Viscount Galway, G.C.M.G., D.S.O., O.B.E., P.C. | 12 Apr | 1,935 | 3 Feb | 1,941 |
| Marshal of the Royal Air Force the Right Hon. Baron Newall, G.C.B., O.M., G.C.M.G., C.B.E., A.M. | 22 Feb | 1,941 | 19 Apr | 1,946 |
| Lieutenant-General the Right Hon. Baron Freyberg, V.C., G.C.M.G., K.C.B., K.B.E., D.S.O. | 17 Jun | 1,946 | 15 Aug | 1,952 |
| Lieutenant-General the Right Hon. Baron Norrie, G.C.M.G., G.C.V.O., C.B., D.S.O., M.C. | 2 Dec | 1,952 | 25 Jul | 1,957 |
| The Right Hon. Viscount Cobham, G.C.M.G., T.D. | 5 Sep | 1,957 | 13 Sep | 1,962 |
| Brigadier the Right Hon. Baron Ballantrae, G.C.M.G., G.C.V.O., D.S.O., O.B.E. | 9 Nov | 1,962 | 20 Oct | 1,967 |
| The Right Hon. Baron Porritt, Bt., G.C.M.G., G.C.V.O., C.B.E. | 1 Dec | 1,967 | 6 Sep | 1,972 |
| SINCE THE ESTABLISHMENT OF RESPONSIBLE GOVERNMENT IN NEW ZEALAND IN 1856 | |||||
|---|---|---|---|---|---|
| Name of Ministry | Name of Prime Minister | Assumed Office | Retired | ||
| 1. Bell-Sewell | Henry Sewell | 7 May | 1,856 | 20 May | 1,856 |
| 2. Fox | William Fox | 20 May | 1,856 | 2 Jun | 1,856 |
| 3. Stafford | Edward William Stafford | 2 Jun | 1,856 | 12 Jul | 1,861 |
| 4. Fox | William Fox | 12 Jul | 1,861 | 6 Aug | 1,862 |
| 5. Domett | Alfred Domett | 6 Aug | 1,862 | 30 Oct | 1,863 |
| 6. Whitaker-Fox | Frederick Whitaker | 30 Oct | 1,863 | 24 Nov | 1,864 |
| 7. Weld | Frederick Aloysius Weld | 24 Nov | 1,864 | 16 Oct | 1,865 |
| 8. Stafford | Edward William Stafford | 16 Oct | 1,865 | 28 Jun | 1,869 |
| 9. Fox | William Fox | 28 Jun | 1,869 | 10 Sep | 1,872 |
| 10. Stafford | Edward William Stafford | 10 Sep | 1,872 | 11 Oct | 1,872 |
| 11. Waterhouse | George Marsden Waterhouse | 11 Oct | 1,872 | 3 Mar | 1,873 |
| 12. Fox | William Fox | 3 Mar | 1,873 | 8 Apr | 1,873 |
| 13. Vogel | Julius Vogel, C.M.G. | 8 Apr | 1,873 | 6 Jul | 1,875 |
| 14. Pollen | Daniel Pollen, M.L.C. | 6 Jul | 1,875 | 15 Feb | 1,876 |
| 15. Vogel | Sir Julius Vogel, K.C.M.G. | 15 Feb | 1,876 | 1 Sep 1 | 1,876 |
| 16. Atkinson | Harry Albert Atkinson | 1 Sep | 1,876 | 13 Sep | 1,876 |
| 17. Atkinson (reconstituted) | Harry Albert Atkinson | 13 Sep | 1,876 | 13 Oct 1 | 1,877 |
| 18. Grey | Sir George Grey, K.C.B. | 15 Oct | 1,877 | 8 Oct | 1,879 |
| 19. Hall | John Hall | 8 Oct | 1,879 | 21 Apr | 1,882 |
| 20. Whitaker | Frederick Whitaker, M.L.C. | 21 Apr | 1,882 | 25 Sep | 1,883 |
| 21. Atkinson | Harry Albert Atkinson | 25 Sep | 1,883 | 16 Aug | 1,884 |
| 22. Stout-Vogel | Robert Stout | 16 Aug | 1,884 | 28 Aug | 1,884 |
| 23. Atkinson | Harry Albert Atkinson | 28 Aug | 1,884 | 3 Sep | 1,884 |
| 24. Stout-Vogel | Sir Robert Stout, K.C.M.G. | 3 Sep | 1,884 | 8 Oct | 1,887 |
| 25. Atkinson | Sir Harry Albert Atkinson, K.C.M.G. | 8 Oct | 1,887 | 24 Jan | 1,891 |
| 26. Ballance | John Ballance | 24 Jan | 1,891 | 1 May | 1,893 |
| 27. Seddon | Right Hon. Richard John Seddon | 1 May | 1,893 | 21 Jun | 1,906 |
| 28. Hall-Jones | William Hall-Jones | 21 Jun | 1,906 | 6 Aug | 1,906 |
| 29. Ward | Right Hon. Sir Joseph George Ward, BART., K.C.M.G. | 6 Aug | 1,906 | 28 Mar | 1,912 |
| 30. Mackenzie | Thomas Mackenzie | 28 Mar | 1,912 | 10 Jul | 1,912 |
| 31. Massey | Right Hon. William Ferguson Massey | 10 Jul | 1,912 | 12 Aug | 1,915 |
| 32. National | Right Hon. William Ferguson Massey | 12 Aug | 1,915 | 25 Aug | 1,919 |
| 33. Massey | Right Hon. William Ferguson Massey | 25 Aug | 1,919 | 14 May | 1,925 |
| 34. Bell | Hon. Sir Francis Henry Dillon Bell, G.C.M.G., K.C. | 14 May | 1,925 | 30 May | 1,925 |
| 35. Coates | Right Hon. Joseph Gordon Coates, M.C. | 30 May | 1,925 | 10 Dec | 1,928 |
| 36. Ward | Right Hon. Sir Joseph George Ward, BART., G.C.M.G. | 10 Dec | 1,928 | 28 May | 1,930 |
| 37. Forbes | Right Hon. George William Forbes | 28 May | 1,930 | 22 Sep | 1,931 |
| 38. Coalition | Right Hon. George William Forbes | 22 Sep | 1,931 | 6 Dec | 1,935 |
| 39. Savage | Right Hon. Michael Joseph Savage | 6 Dec | 1,935 | 1 Apr | 1,940 |
| 40. Fraser | Hon. Peter Fraser | 1 Apr | 1,940 | 30 Apr | 1,940 |
| 41. Fraser | Right Hon. Peter Fraser, C.H. | 30 Apr | 1,940 | 13 Dec | 1,949 |
| 42. Holland | Right Hon. Sir Sidney George Holland, G.C.B., C.H | 13 Dec | 1,949 | 20 Sep | 1,957 |
| 43. Holyoake | Right Hon. Keith Jacka Holyoake | 20 Sep | 1,957 | 12 Dec | 1,957 |
| 44. Nash | Right Hon. Sir Walter Nash, G.C.M.G., C.H. | 12 Dec | 1,957 | 12 Dec | 1,960 |
| 45. Holyoake | Right Hon. Sir Keith Jacka Holyoake, G.C.M.G., C.H. | 12 Dec | 1,960 | 9 Feb | 1,972 |
| 46. Marshall | Right Hon. John Ross Marshall, C.H. | 9 Feb | 1,972 | 8 Dec | 1,972 |
| 47. Kirk | Right Hon. Norman Eric Kirk | 8 Dec | 1,972 | 31 Aug | 1,974 |
| 48. Rowling | Right Hon. Wallace Edward Rowling | 6 Sep | 1,974 | ||
Right Hon. W. E. ROWLING, Prime Minister, Minister of Foreign Affairs, Minister in Charge of the Audit Department, Minister in Charge of the Legislative Department, Minister in Charge of the New Zealand Security Intelligence Service.
Hon. R. J. TIZARD, Deputy Prime Minister, Minister of Finance, Minister in Charge of Friendly Societies.
Hon. W. W. FREER, Minister of Trade and Industry, Minister of Energy Resources.
Hon. Dr A. M. FINLAY, Q.C., Minister of Justice, Attorney-General, Minister of Civil Aviation and Meteorological Services, Minister in Charge of Publicity.
Right Hon. H. WATT, Member of the Executive Council, Minister Without Portfolio, Resident in London.
Hon. M. RATA, Minister of Maori Affairs, Minister of Lands.
Hon. M. A. CONNELLY, Minister of Works and Development, Minister of Police, Minister of Statistics, Minister in Charge of Earthquake and War Damage Commission.
Hon. A. J. FAULKNER, Minister of Labour, Minister of State Services.
Hon. N. J. KING, Minister of Social Welfare, Minister in Charge of the Government Printing Office.
Hon. C. J. MOYLE, Minister of Agriculture and Fisheries, Minister of Forests, Minister of Science, Minister in Charge of the Rural Banking and Finance Corporation.
Hon. W. A. FRASER, Minister of Defence, Minister in Charge of War Pensions, Minister in Charge of Rehabilitation.
Hon. H. L. J. MAY, Minister of Local Government, Minister of Internal Affairs, Minister of Civil Defence, Minister in Charge of the Valuation Department.
Hon. Sir Basil ARTHUR, Bt., Minister of Transport, Minister in Charge of the State Insurance Office.
Hon. P. A. AMOS, Minister of Education.
Hon. MRS T. W. M. TIRIKATENE-SULLIVAN, Minister of Tourism, Minister for the Environment.
Hon. J. A. WALDING, Minister of Overseas Trade, Minister of Recreation and Sport, Associate Minister of Foreign Affairs.
Hon. F. M. COLMAN, Minister of Immigration, Minister of Mines, Postmaster-General.
Hon. T. M. McGUIGAN, Minister of Health, Minister in Charge of the Public Trust Office.
Hon. R. O. DOUGLAS, Minister of Housing, Minister of Customs, Minister in Charge of the Government Life Insurance Office.
Hon. R. L. BAILEY, Minister of Railways, Minister of Electricity.
Parliamentary Under-Secretaries:
B. G. BARCLAY, Parliamentary Under-Secretary to Minister of Agriculture and Fisheries and Minister of Lands.
E. E. ISBEY, Parliamentary Under-Secretary to Minister of Civil Aviation, Minister of Railways, and Minister of Transport.
B. P. MacDONELL, Parliamentary Under-Secretary to Minister of Trade and Industry and Minister of Energy Resources.
Prime Minister—Rt. Hon. W. E. Rowling
Leader of the Opposition—Hon. R. D. Muldoon
Speaker—Hon. S. A. Whitehead. Chairman of Committees—J. L. Hunt
Clerk of the House—E. A. Roussell, LL.B.
| Name | Electoral District |
|---|---|
*Government member. †Elected 2 November 1974. Voting results shown in section 38, Miscellaneous. | |
| For European Electorates | |
| Adams-Schneider, Hon. L. R. | Waikato |
| Allen, K. R. | Tauranga |
| Allen, Hon. P. B. | Bay of Plenty |
| Amos, Hon. P. A.* | Manurewa |
| Arthur, Hon. Sir Basil, Bt.* | Timaru |
| Bailey, Hon. R. L.* | Heretaunga |
| Barclay, B. G.* | Christchurch Central |
| Barclay, R. M.* | New Plymouth |
| Bassett, M. E. R.* | Waitemata |
| Batchelor, Mrs M.* | Avon |
| Begg, A. W.* | Awarua |
| Birch, W. F. | Franklin |
| Blanchfield, P.* | West Coast |
| Bolger, J. B. | King Country |
| Brooks, I. J.* | Marlborough |
| Burke, T. K.* | Rangiora |
| Carter, Hon. D. J. | Raglan |
| Christie, G.* | Napier |
| Colman, Hon. F. MacD.* | Petone |
| Comber, K. M. | Wellington Central |
| Connelly, Hon. M. A.* | Wigram |
| Davey, T.* | Gisborne |
| Douglas, N. V.* | Auckland Central |
| Douglas, Hon. R. O.* | Manukau |
| Downie, G. P. A. | Pakuranga |
| Drayton, R. P. B.* | St. Albans |
| Faulkner, Hon. A. J.* | Roskill |
| Finlay, Hon. Dr A. M., Q.C.* | Henderson |
| Fraser, Hon. W. A.* | St. Kilda |
| Freer, Hon. W. W.* | Mount Albert |
| Gair, Hon. G. F. | North Shore |
| Gandar, Hon. L. W. | Ruahine |
| Gill, Air Commodore T. F. | East Coast |
| C.B.E., D.S.O. | Bays |
| Gordon, Hon. J. B. | Clutha |
| Harrison, J. R. | Hawke's Bay |
| Highet, Hon. D. A. | Remuera |
| Holland, Hon. E. S. F. | Riccarton |
| Holyoake, Rt. Hon. Sir Keith, G.C.M.G., C.H. | Pahiatua |
| Hunt, J. L.* | New Lynn |
| Isbey, E.* | Grey Lynn |
| Jack, Hon. Sir Roy, K.B. | Rangitikei |
| Jelicich, Mrs D. C.* | Hamilton West |
| King, Hon. N. J.* | Birkenhead |
| Kirk, N. J.*† | Sydenham |
| Laney, W. R.* | Oamaru |
| Lapwood, H. R. | Rotorua |
| Luxton, J. F. | Piako |
| McCready, Hon. A. | Manawatu |
| MacDonell, B. P.* | Dunedin Central |
| McGuigan, Hon. T. M.* | Lyttelton |
| McLachlan, C. C. A. | Rakaia |
| McMillan, Mrs E. E.* | Dunedin North |
| Marshall, C. R.* | Wanganui |
| Marshall, Rt. Hon. Sir John, G.B.E., C.H. | Karori |
| Mayson, C. R.* | Hastings |
| May, Hon. H. L. J.* | Western Hutt |
| Moore, M. K.* | Eden |
| Moyle, Hon. C. J.* | Mangere |
| Muldoon, Hon. R. D. | Tamaki |
| Munro, J. B.* | Invercargill |
| O'Brien, J. G.* | Island Bay |
| O'Flynn, F. D. Q.C.* | Kapiti |
| Quigley, I. T.* | Otago Central |
| Ridley, J. W.* | Taupo |
| Rogers, Dr. A.* | Hamilton East |
| Rowling, Rt. Hon. W. E.* | Tasman |
| Schultz, L. C. | Coromandel |
| Sloane, L. F. | Hobson |
| Smith, M. R.* | Whangarei |
| Talbot, R. L. G. | South Canterbury |
| Talboys, Hon. B. E. | Wallace |
| Thomson, Hon. D. S., M.C. E.D. | Stratford |
| Tizard, Hon. R.J.* | Otahuhu |
| Walding, Hon. J. A.* | Palmerston North |
| Walker, Hon. H. J. | Papanui |
| Wall, Dr G. A.* | Porirua |
| Watt, Rt. Hon. H.* | Onehunga |
| Whitehead, Hon. S. A.* | Nelson |
| Wilkinson, P. I. | Rodney |
| Williams, J. H.* | Wairarapa |
| Young, T. J.* | Hutt |
| Young, V. S. | Egmont |
| Young, W. L. | Miramar |
| For Maori Electorates | |
| Rata, Hon. M.* | Northern Maori |
| Wetere, K. T.* | Western Maori |
| Tirikatene-Sullivan, Hon. Mrs T. W. M.* | Southern Maori |
| Reweti, P. B.* | Eastern Maori |
| Parliament | Period of Session |
|---|---|
| Thirty-third | 20 June 1961—1 December 1961 |
| 7 June 1962—14 December 1962 | |
| 12 February 1963 | |
| 20 June 1963—25 October 1963 | |
| Thirty-fourth | 10 June 1964—4 December 1964 |
| 27 May 1965—30 October 1965 | |
| 26 May 1966—1 November 1966 | |
| Thirty-fifth | 26 April 1967—24 November 1967 |
| 26 June 1968—19 December 1968 | |
| 15 May 1969—24 October 1969 | |
| Thirty-sixth | 12 March 1970—13 March 1970 |
| 1 April 1970—3 December 1970 | |
| 25 February 1971—25 March 1971 | |
| 9 June 1971—17 December 1971 | |
| 8 June 1972—20 October 1972 | |
| Thirty-seventh | 15 February 1973—16 March 1973 |
| 5 June 1973—23 November 1973 | |
| 4 February 1974—29 March 1974 | |
| 28 May 1974—8 November 1974 | |
| 25 March 1975 |
LEGISLATION 1974—During the parliamentary session of 1974, 149 public Acts, 14 local Acts, and 7 private Acts were passed.
Notable among the new legislation were the Children and Young Persons Act, Housing Corporation Act, Local Government Act, New Zealand Superannuation Act, Niue Constitution Act, and the Rural Banking and Finance Corporation Act.
PUBLIC GENERAL ACTS OF NEW ZEALAND—The following list shows the departments responsible for the administration of the public Acts of general application in New Zealand which were in force at January 1975 or which had then been passed to come into force at a later date.
The list does not include references to Acts that are spent or expired or to amending Acts, Appropriation Acts, Finance Acts, or other Acts containing miscellaneous provisions, such as Statutes Amendment Acts, Local Legislation Acts, Reserves and Other Lands Disposal Acts, and Maori Purposes Acts.
| Act | Department |
|---|---|
| Accident Compensation Act 1972 | Labour |
| Accident Insurance Companies Act 1908 | Justice |
| Acts Interpretation Act 1924 | Justice |
| Administration Act 1969 | Justice |
| Adoption Act 1955 | Justice |
| Admiralty Act 1973 | Transport |
| Adult Education Act 1963 | Education |
| Age of Majority Act 1970 | Justice |
| Aged and Infirm Persons Protection Act 1912 | Justice |
| Agricultural and Pastoral Societies Act 1908 | Agriculture and Fisheries |
| Agricultural Chemicals Act 1959 | Agriculture and Fisheries |
| Agricultural Pests Destruction Act 1967 | Agriculture and Fisheries |
| Agricultural Workers Act 1962 | Agriculture and Fisheries |
| Agriculture (Emergency Powers) Act 1934 | Agriculture and Fisheries |
| Agriculture (Emergency Regulations Confirmation) Acts | Agriculture and Fisheries |
| Air Services Licensing Act 1951 | Transport |
| Aircrew Industrial Tribunal Act 1971 | Labour |
| Airport Authorities Act 1966 | Transport |
| Alcoholics Act 1966 | Justice |
| Aliens Act 1948 | Justice |
| Animals Act 1967 | Agriculture and Fisheries |
| Animals Protection Act 1960 | Agriculture and Fisheries |
| Animal Remedies Act 1967 | Agriculture and Fisheries |
| Annual Holidays Act 1944 | Labour |
| Antarctica Act 1960 | Foreign Affairs |
| Anzac Day Act 1966 | Internal Affairs |
| Apiaries Act 1969 | Agriculture and Fisheries |
| Apple and Pear Marketing Act 1971 | Agriculture and Fisheries |
| Apprentices Act 1948 | Labour |
| Arbitration Act 1908 | Justice |
| Arbitration Clauses (Protocol) and the Arbitration (Foreign Awards) Act 1933 | Justice |
| Architects Act 1963 | Internal Affairs |
| Archives Act 1957 | Internal Affairs |
| Armed Forces Canteens Act 1948 | Defence |
| Armed Forces Discipline Act 1971 | Defence |
| Arms Act 1958 | Police |
| Atomic Energy Act 1945 | Mines |
| Auckland Harbour Bridge Act 1950 | Works and Development |
| Auctioneers Act 1928 | Justice |
| Aviation Crimes Act 1972 | Transport |
| Bank of New Zealand Act 1971 | Treasury |
| Banking Act 1908 | Treasury |
| Berryfruit Levy Act 1967 | Agriculture and Fisheries |
| Bills of Exchange Act 1908 | Treasury |
| Births and Deaths Registration Act 1951 | Justice |
| Boilers, Lifts, and Cranes Act 1950 | Transport |
| British Nationality and New Zealand Citizenship Act 1948 | Internal Affairs |
| Broadcasting Act 1973 | Broadcasting Council |
| Building Research Levy Act 1969 | Scientific and Industrial Research |
| Building Societies Act 1965 | Justice |
| Burial and Cremation Act 1964 | Health |
| Bush Workers Act 1945 | Labour |
| Bylaws Act 1910 | Internal Affairs |
| Card Tournaments Regulation Act 1933 | Internal Affairs |
| Carriage by Air Act 1967 | Transport |
| Carriers Act 1948 | Justice |
| Charitable Trusts Act 1957 | Justice |
| Chartered Associations (Protection of Names and Uniforms) Act 1930 | Internal Affairs |
| Chatham Islands County Council Empowering Act 1936 | Internal Affairs |
| Chattels Transfer Act 1924 | Justice |
| Cheques Act 1960 | Treasury |
| Children and Young Persons Act 1974 | Social Welfare |
| Children's Health Camps Act 1972 | Health |
| Chiropractors Act 1960 | Justice |
| Christchurch-Lyttelton Road Tunnel Act 1956 | Works and Development |
| Cinematograph Films Act 1961 | Internal Affairs |
| Civil Aviation Act 1964 | Transport |
| Civil Defence Act 1962 | Internal Affairs |
| Civil List Act 1950 | Prime Minister |
| Clean Air Act 1972 | Health |
| Clerks of Works Act 1944 | Labour |
| Coal Mines Act 1925 | Mines |
| Commercial Trusts Act 1910 | Justice |
| Commissions of Inquiry Act 1908 | Internal Affairs |
| Commonwealth Fabric Corporation Act 1962 | Treasury |
| Commonwealth Games Symbol Protection Act 1974 | Internal Affairs |
| Companies Act 1955 | Justice |
| Companies (Bondholders Incorporation) Act 1934-35 | Justice |
| Companies Special Investigations Act 1958 | Justice |
| Construction Act 1959 | Labour |
| Consular Privileges and Immunities Act 1971 | Foreign Affairs |
| Consumer Council Act 1966 | Trade and Industry |
| Consumer Information Act 1969 | Trade and Industry |
| Continental Shelf Act 1964 | Agriculture and Fisheries |
| Contracts Enforcement Act 1956 | Justice |
| Contributory Negligence Act 1947 | Justice |
| Control of Prices Act 1947 | Trade and Industry |
| Cook Islands Act 1915 | Foreign Affairs |
| Cook Islands Constitution Act 1964 | Foreign Affairs |
| Co-operative Companies Act 1956 | Justice |
| Co-operative Dairy Companies Act 1949 | Justice |
| Co-operative Freezing Companies Act 1960 | Justice |
| Copyright Act 1962 | Justice |
| Cornish Companies Management Act 1974 | Justice |
| Coroners Act 1951 | Justice |
| Costs in Criminal Cases Act 1967 | Justice |
| Counties Act 1956 | Internal Affairs |
| Counties Insurance Empowering Act 1941 | Internal Affairs |
| Courts Martial Appeals Act 1953 | Defence |
| Crimes Act 1961 | Justice |
| Criminal Injuries Compensation Act 1963 | Justice |
| Criminal Justice Act 1954 | Justice |
| Crowns Grants Act 1908 | Lands and Survey |
| Crown Proceedings Act 1950 | Justice |
| Customs Act 1966 | Customs |
| Customs Law Act 1908 | Customs |
| Dairy Industry Act 1952 | Agriculture and Fisheries |
| Dairy Board Act 1961 | Agriculture and Fisheries |
| Dangerous Goods Act 1974 | Internal Affairs |
| Deaths by Accidents Compensation Act 1952 | Justice |
| Decimal Currency Act 1964 | Treasury |
| Declaratory Judgments Act 1908 | Justice |
| Deeds Registration Act 1908 | Justice |
| Defamation Act 1954 | Justice |
| Defence Act 1971 | Defence |
| Demise of the Crown Act 1908 | Internal Affairs |
| Dental Act 1963 | Health |
| Department of Social Welfare Act 1971 | Social Welfare |
| Deputy Governor's Powers Act 1912 | Internal Affairs |
| Designs Act 1953 | Justice |
| Development Finance Corporation Act 1973 | Treasury |
| Dietitians Act 1950 | Health |
| Diplomatic Privileges and Immunities Act 1968 | Foreign Affairs |
| Disabled Persons Employment Promotion Act 1950 | Labour |
| Disabled Soldiers' Civil Re-establishment Act 1930 | Social Welfare |
| Distillation Act 1971 | Customs |
| Distress and Replevin Act 1908 | Justice |
| District Courts Abolition Act 1925 | Justice |
| District Railways Act 1908 | Works and Development |
| Dogs Registration Act 1955 | Internal Affairs |
| Domestic Proceedings Act 1968 | Justice |
| Door to Door Sales Act 1967 | Trade and Industry |
| Earthquake and War Damage Act 1944 | State Insurance Office |
| Economic Stabilisation Act 1948 | Trade and Industry |
| Education Act 1964 | Education |
| Education Lands Act 1949 | Education |
| Electoral Act 1956 | Justice |
| Electric Linemen Act 1959 | Electricity |
| Electric Power Boards Act 1925 | Electricity |
| Electrical Supply Authorities Association Act 1930 | Electricity |
| Electricians Act 1952 | Electricity |
| Electricity Act 1968 | Electricity |
| Electricity Distribution Commission Act 1967 | Electricity |
| Emergency Forces Rehabilitation Act 1953 | Social Welfare |
| Employment Agents Act 1908 | Labour |
| Enemy Property Act 1951 | Public Trust |
| Engineering Association Act 1961 | Works and Development |
| Engineers Registration Act 1924 | Works and Development |
| English Laws Act 1908 | Justice |
| Equal Pay Act 1972 | Labour |
| Estate and Gift Duties Act 1968 | Inland Revenue |
| Evidence Act 1908 | Justice |
| Exhibitions Act 1910 | Trade and Industry |
| Explosives Act 1957 | Internal Affairs |
| Export Guarantee Act 1964 | Treasury |
| Extradition Act 1965 | Justice |
| Factories Act 1946 | Labour |
| Family Benefits (Home Ownership) Act 1964 | Social Welfare |
| Family Protection Act 1955 | Justice |
| Farm Ownership Savings Act 1974 | Treasury |
| Fees and Travelling Allowances Act 1951 | Treasury |
| Fencing Act 1908 | Justice |
| Fertilisers Act 1960 | Agriculture and Fisheries |
| Fire Services Act 1972 | Internal Affairs |
| Fishing Industry Board Act 1963 | Agriculture and Fisheries |
| Fisheries Act 1908 | Agriculture and Fisheries |
| Fisheries (Agreement with Japan) Act 1967 | Agriculture and Fisheries |
| Food and Drug Act 1969 | Health |
| Foreign Affairs Act 1943 | Foreign Affairs |
| Forest and Rural Fires Act 1955 | Forest Service |
| Forestry Encouragement Act 1962 | Forest Service |
| Forests Act 1949 | Forest Service |
| Franklin-Manukau Pest Destruction Act 1971 | Agriculture and Fisheries |
| Friendly Societies Act 1909 | Treasury |
| Frustrated Contracts Act 1944 | Justice |
| Gaming Act 1908 | Internal Affairs |
| Gaming Duties Act 1971 | Inland Revenue |
| Gas Industry Act 1958 | Energy Resources |
| Gas Supply Act 1908 | Energy Resources |
| General Agreement on Tariffs and Trade Act 1948 | Customs |
| General Wage Orders Act 1969 | Labour |
| Geneva Conventions Act 1958 | Foreign Affairs |
| Geothermal Energy Act 1953 | Works and Development |
| Government Life Insurance Act 1953 | Government Life Insurance Office |
| Government Railways Act 1949 | Railways |
| Government Service Equal Pay Act 1960 | State Services Commission |
| Guardianship Act 1948 | Justice |
| Harbours Act 1950 | Transport |
| Hauraki Gulf Maritime Park Act 1967 | Lands |
| Health Act 1956 | Health |
| Hire Purchase Act 1971 | Justice |
| Historic Articles Act 1962 | Internal Affairs |
| Historic Places Act 1954 | Internal Affairs |
| Home Ownership Savings Act 1974 | Treasury |
| Hospitals Act 1957 | Health |
| Hotel Association of New Zealand Act 1969 | Justice |
| Housing Act 1955 | Housing Corporation |
| Housing Corporation Act 1974 | Housing Corporation |
| Hovercraft Act 1971 | Transport |
| Human Tissues Act 1964 | Health |
| Hunter Gift for the Settlement of Discharged Soldiers Act 1921 | Lands and Survey |
| Hydatids Act 1968 | Agriculture and Fisheries |
| Illegal Contracts Act 1970 | Justice |
| Immigration Act 1964 | Labour |
| Impounding Act 1955 | Internal Affairs |
| Imprisonment for Debt Limitation Act 1908 | Justice |
| Inalienable Life Annuities Act 1910 | Public Trust |
| Income Tax Assessment Act 1957 | Inland Revenue |
| Incorporated Societies Act 1908 | Justice |
| Indecent Publications Act 1963 | Justice |
| Industrial and Provident Societies Act 1908 | Justice |
| Industrial Design Act 1966 | Trade and Industry |
| Industrial Relations Act 1973 | Labour |
| Industrial Research and Development Grants Act 1970 | Trade and Industry |
| Industrial Societies Act 1908 | Justice |
| Infants Act 1908 | Justice |
| Inferior Courts Procedure Act 1909 | Justice |
| Inland Revenue Department Act 1974 | Inland Revenue |
| Innkeepers Act 1962 | Justice |
| Insolvency Act 1967 | Justice |
| Insurance Companies' Deposits Act 1953 | Justice |
| International Air Services Licensing Act 1947 | Transport |
| International Finance Agreements Act 1961 | Treasury |
| Inventions Development Act 1966 | Trade and Industry |
| Invercargill Licensing Trust Act 1950 | Justice |
| Iron and Steel Industry Act 1959 | Mines |
| Joint Family Homes Act 1964 | Justice |
| Judicature Act 1908 | Justice |
| Juries Act 1908 | Justice |
| Kapuni Petroleum Act 1970 | Trade and Industry |
| Kermadec Island Act 1887 | Foreign Affairs |
| Kitchener Memorial Scholarship Trust Act 1941 | Education |
| Labour Department Act 1954 | Labour |
| Lake Coleridge Water Power Act 1915 | Works and Development |
| Lake Waikaremoana Act 1971 | Maori Affairs |
| Lake Wanaka Preservation Act 1973 | Prime Minister |
| Land Act 1948 | Lands and Survey |
| Land and Income Tax Act 1954 | Inland Revenue |
| Land Drainage Act 1908 | Internal Affairs |
| Land Settlement Promotion and Land Acquisition Act 1952 | Lands and Survey |
| Land Transfer Act 1952 | Justice |
| Land Transfer (Hawke's Bay) Act 1931 | Justice |
| Land Valuation Proceedings Act 1948 | Justice |
| Law Practitioners Act 1955 | Justice |
| Law Reform Act 1936 | Justice |
| Law Reform Act 1944 | Justice |
| Law Reform (Testamentary Promises) Act 1949 | Justice |
| Legal Aid Act 1969 | Justice |
| Legislative Council Abolition Act 1950 | Legislative |
| Legislature Act 1908 | Legislative |
| Lesotho Act 1969 | Foreign Affairs |
| Libraries and Mechanics' Institutes Act 1908 | Internal Affairs |
| Licensing Act 1908 | Justice |
| Licensing Trusts Act 1949 | Justice |
| Life Insurance Act 1908 | Justice |
| Limitation Act 1950 | Justice |
| Lincoln College Act 1961 | Education |
| Linen Flax Corporation Act 1945 | Trade and Industry |
| Litter Act 1968 | Internal Affairs |
| Local Authorities (Employment Protection) Act 1963 | Internal Affairs |
| Local Authorities Loans Act 1956 | Treasury |
| Local Authorities (Members' Interests) Act 1968 | Internal Affairs |
| Local Authorities (Petroleum Tax) Act 1970 | Internal Affairs |
| Local Elections and Polls Act 1966 | Internal Affairs |
| Local Government Act 1974 | Internal Affairs |
| Local Government Commission Act 1967 | Internal Affairs |
| Local Railways Acts 1914 | Works and Development |
| Machinery Act 1950 | Labour |
| Magistrates' Courts Act 1947 | Justice |
| Malaysia Act 1963 | Foreign Affairs |
| Manapouri - Te Anau Development Act 1963 | Works and Development |
| Maori Affairs Act 1953 | Maori Affairs |
| Maori Affairs Department Act 1968 | Maori Affairs |
| Maori Education Foundation Act 1961 | Education |
| Maori Housing Act 1935 | Maori Affairs |
| Maori Purposes Funds Act 1934-35 | Maori Affairs |
| Maori Reserved Land Act 1956 | Maori Affairs |
| Maori Soldiers Trust Act 1957 | Maori Affairs |
| Maori Trust Boards Act 1955 | Maori Affairs |
| Maori Trustee Act 1953 | Maori Affairs |
| Maori Vested Lands Administration Act 1954 | Maori Affairs |
| Maori Welfare Act 1962 | Maori Affairs |
| Margarine Act 1908 | Agriculture and Fisheries |
| Marginal Lands Act 1950 | Lands and Survey |
| Marine and Power Engineers' Institute Industrial Disputes Act 1974 | Labour |
| Marine Farming Act 1971 | Agriculture and Fisheries |
| Marine Insurance Act 1908 | Justice |
| Marine Pollution Act 1974 | Transport |
| Marine Reserves Act 1971 | Agriculture and Fisheries |
| Marketing Act 1936 | Agriculture and Fisheries |
| Marriage Act 1955 | Justice |
| Married Women's Property Act 1952 | Justice |
| Massey University Act 1963 | Education |
| Master and Apprentice Act 1908 | Labour |
| Masterton Licensing Trust Act 1947 | Justice |
| Maternal Mortality Research Act 1968 | Health |
| Matrimonial Proceedings Act 1963 | Justice |
| Matrimonial Property Act 1963 | Justice |
| Meat Act 1964 | Agriculture and Fisheries |
| Meat Export Control Act 1921-22 | Agriculture and Fisheries |
| Meat Export Prices Act 1955 | Agriculture and Fisheries |
| Medical and Dental Auxiliaries Act 1966 | Health |
| Medical Practitioners Act 1968 | Health |
| Medical Research Council Act 1950 | Health |
| Mental Health Act 1969 | Health |
| Mercantile Law Act 1908 | Justice |
| Merchandise Marks Act 1954 | Trade and Industry |
| Military Decorations and Distinctive Badges Act 1918 | Defence |
| Military Manoeuvres Act 1915 | Defence |
| Milk Act 1967 | Agriculture and Fisheries |
| Minimum Wages Act 1945 | Labour |
| Mining Act 1971 | Mines |
| Mining Tenures Registration Act 1962 | Justice |
| Ministry of Local Government Act 1972 | Internal Affairs |
| Ministry of Agriculture and Fisheries Act 1953 | Agriculture and Fisheries |
| Ministry of Energy Resources Act 1972 | Energy Resources |
| Ministry of Transport Act 1968 | Transport |
| Ministry of Works Act 1943 | Works and Development |
| Minors' Contracts Act 1969 | Justice |
| Monetary and Economic Council Act 1961 | Treasury |
| Moneylenders Act 1908 | Justice |
| Monopoly and Prevention Act 1908 | Trade and Industry |
| Mortgagors and Lessees Rehabilitation Act 1936 | Treasury |
| Motor Spirits Distribution Act 1953 | Trade and Industry |
| Motor Spirits Duty Act 1961 | Customs |
| Motor Spirits (Regulation of Prices) Act 1933 | Trade and Industry |
| Motor-Vehicle Dealers Act 1958 | Justice |
| Municipal Association Act 1939 | Internal Affairs |
| Municipal Corporations Act 1954 | Internal Affairs |
| Municipal Insurance Act 1960 | Internal Affairs |
| Music Teachers Registration Act 1928 | Education |
| Mutual Insurance Act 1955 | Public Trust |
| Narcotics Act 1965 | Health |
| Nassella Tussock Act 1946 | Agriculture and Fisheries |
| National Art Gallery, Museum, and War Memorial Act 1972 | Internal Affairs |
| National Expenditure Adjustment Act 1932 | Treasury |
| National Housing Commission Act 1972 | Housing Corporation |
| National Library Act 1965 | Education |
| National Parks Act 1952 | Lands and Survey |
| National Provident Fund Act 1950 | Treasury |
| National Research Advisory Council Act 1963 | State Services Commission |
| National Roads Act 1953 | Works and Development |
| National Savings Act 1940 | Treasury |
| Native Plants Protection Act 1934 | Lands and Survey |
| Natural Gas Corporation Act 1967 | Mines |
| Nature Conservation Council Act 1962 | Lands and Survey |
| Naval and Victualling Stores Act 1908 | Defence |
| New Zealand - Australia Free Trade Agreement Act 1965 | Trade and Industry |
| New Zealand Bank Act 1861 | Treasury |
| New Zealand Boundaries Act 1863 (U.K.) | Internal Affairs |
| New Zealand Constitution Act 1852 (U.K.) | Internal Affairs |
| New Zealand Constitution (Amendment) Act 1947 (U.K.) | Internal Affairs |
| New Zealand Constitution Amendment (Request and Consent) Act 1947 | Internal Affairs |
| New Zealand Council for Educational Research Act 1972 | Education |
| New Zealand Council of Law Reporting Act 1938 | Justice |
| New Zealand Counties Association Act 1949 | Internal Affairs |
| New Zealand Day Act 1973 | Internal Affairs |
| New Zealand Debt Conversion Act 1932-33 | Treasury |
| New Zealand Export-Import Corporation Act 1974 | Trade and Industry |
| New Zealand Geographic Board Act 1946 | Lands and Survey |
| New Zealand Government Property Corporation Act 1953 | Treasury |
| New Zealand Library Association Act 1939 | Education |
| New Zealand Loans Act 1953 | Treasury |
| New Zealand Maori Arts and Crafts Institute Act 1963 | Tourist and Publicity |
| New Zealand National Airways Act 1945 | Transport |
| New Zealand Ports Authority Act 1968 | Transport |
| New Zealand Security Intelligence Service Act 1969 | Justice |
| New Zealand Society of Accountants Act 1958 | Treasury |
| New Zealand Superannuation Act 1974 | Treasury |
| News Media Ownership Act 1965 | Justice |
| Newspapers and Printers Act 1955 | Justice |
| Ngarimu V.C. and 28th (Maori) Battalion Memorial Scholarship Fund Act 1945 | Education |
| Niue Act 1966 | Foreign Affairs |
| Niue Constitution Act 1974 | Foreign Affairs |
| Noxious Animals Act 1956 | Forest Service |
| Noxious Weeds Act 1950 | Agriculture and Fisheries |
| Nurses Act 1971 | Health |
| Oaths and Declarations Act 1957 | Justice |
| Occupational Therapy Act 1949 | Health |
| Occupiers Liability Act 1962 | Justice |
| Offenders Legal Aid Act 1954 | Justice |
| Official Appointments and Documents Act 1919 | Internal Affairs |
| Official Secrets Act 1951 | Justice |
| Opticians Act 1928 | Health |
| Orchard Levy Act 1953 | Agriculture and Fisheries |
| Overseas Investment Act 1973 | Treasury |
| Overseas Representatives Act 1942 | Foreign Affairs |
| Parliamentary Commissioner (Ombudsman) Act 1962 | Legislative |
| Partnership Act 1908 | Justice |
| Passport Act 1946 | Internal Affairs |
| Patents Act 1953 | Justice |
| Patriotic and Canteen Funds Act 1947 | Internal Affairs |
| Pawnbrokers Act 1908 | Justice |
| Payment of Jurors Act 1919 | Justice |
| Penal Institutions Act 1954 | Justice |
| Perpetuities Act 1964 | Justice |
| Petroleum Act 1937 | Mines |
| Pharmacy Act 1970 | Health |
| Phosphorus Matches Act 1910 | Labour |
| Physical Welfare and Recreation Act 1937 | Internal Affairs |
| Physiotherapy Act 1949 | Health |
| Plant Varieties Act 1973 | Agriculture and Fisheries |
| Plants Act 1970 | Agriculture and Fisheries |
| Plumbers and Gasfitters Registration Act 1964 | Health |
| Poisons Act 1960 | Health |
| Police Act 1958 | Police |
| Police Offences Act 1927 | Justice |
| Political Disabilities Removal Act 1960 | Labour |
| Pork Industry Act 1974 | Agriculture and Fisheries |
| Pacific Islands Polynesian Education Foundation Act 1972 | Education |
| Post Office Act 1959 | Post Office |
| Potato Growing Industry Act 1950 | Agriculture and Fisheries |
| Poultry Act 1968 | Agriculture and Fisheries |
| Poultry Runs Registration Act 1933 | Agriculture and Fisheries |
| Primary Products Marketing Act 1953 | Agriculture and Fisheries |
| Primary Products Marketing Act: Regulations Confirmations Acts 1957 | Agriculture and Fisheries |
| Private Investigators and Security Guards Act 1974 | Justice |
| Private Savings Banks Act 1964 | Treasury |
| Property Law Act 1952 | Justice |
| Property Speculation Tax Act 1973 | Inland Revenue |
| Protection of British Shipping Act 1936 | Transport |
| Protection of Depositors Act 1968 | Justice |
| Public Authorities (Party Wall) Empowering Act 1919 | Works and Development |
| Public Bodies' Contracts Act 1959 | Internal Affairs |
| Public Bodies' Leases Act 1969 | Internal Affairs |
| Public Bodies' Meetings Act 1961 | Internal Affairs |
| Public Contracts Act 1908 | Labour |
| Public Holidays Act 1955 | Labour |
| Public Revenues Act 1953 | Treasury |
| Public Safety Conservation Act 1932 | Justice |
| Public Trust Office Act 1957 | Public Trust |
| Public Works Act 1928 | Works and Development |
| Quantity Surveyors Act 1968 | Works and Development |
| Quarries Act 1944 | Mines |
| Queen Elizabeth The Second Arts Council of New Zealand Act 1974 | Internal Affairs |
| Queen Elizabeth The Second Post-graduate Fellowship of New Zealand Act 1963 | Education |
| Queen Elizabeth The Second Technicians Study Award Act 1970 | Education |
| Race Relations Act 1971 | Justice |
| Racing Act 1971 | Internal Affairs |
| Radiation Protection Act 1965 | Health |
| Rangitaiki Land Drainage Act 1956 | Internal Affairs |
| Rates Rebate Act 1973 | Internal Affairs |
| Rating Act 1967 | Internal Affairs |
| Real Estate Agents Act 1963 | Justice |
| Reciprocal Enforcement of Judgments Act 1934 | Justice |
| Recreation and Sport Act 1973 | Ministry of Recreation and Sport |
| Regulations Act 1936 | Justice |
| Rehabilitation Act 1941 | Social Welfare |
| Rent Appeal Act 1973 | Labour |
| Republic of Bangladesh Act | Foreign Affairs |
| Republic of Botswana Act 1967 | Foreign Affairs |
| Republic of Cyprus Act 1961 | Foreign Affairs |
| Republic of Gambia Act 1970 | Foreign Affairs |
| Republic of Ghana Act 1960 | Foreign Affairs |
| Republic of Guyana Act 1970 | Foreign Affairs |
| Republic of India Act 1956 | Foreign Affairs |
| Republic of Ireland Act 1950 | Foreign Affairs |
| Republic of Kenya Act 1965 | Foreign Affairs |
| Republic of Malawi Act 1966 | Foreign Affairs |
| Republic of Nauru Act 1969 | Foreign Affairs |
| Republic of Nigeria Act 1963 | Foreign Affairs |
| Republic of Sierra Leone Act 1971 | Foreign Affairs |
| Republic of Singapore Act 1966 | Foreign Affairs |
| Republic of Sri Lanka Act | Foreign Affairs |
| Republic of Tanzania Act 1966 | Foreign Affairs |
| Republic of Zambia Act 1965 | Foreign Affairs |
| Reserve Bank of New Zealand Act 1964 | Reserve Bank |
| Reserves and Domains Act 1953 | Lands and Survey |
| River Boards Act 1908 | Internal Affairs |
| Royal New Zealand Foundation for the Blind Act 1963 | Education |
| Royal New Zealand Institute of Horticulture Act 1953 | Agriculture and Fisheries |
| Royal Powers Act 1953 | Foreign Affairs |
| Royal Society of New Zealand Act 1965 | Scientific and Industrial Research |
| Royal Titles Act 1974 | Foreign Affairs |
| Rural Banking and Finance Corporation Act 1974 | Treasury |
| Rural Housing Act 1939 | Housing Corporation |
| Rural Intermediate Credit Act 1927 | Housing Corporation |
| Sale of Goods Act 1908 | Justice |
| Sale of Liquor Act 1962 | Justice |
| Sale of Wool Act 1937 | Agriculture and Fisheries |
| Sales Tax Act 1974 | Customs |
| Sand Drift Act 1908 | Lands and Survey |
| Scientific and Industrial Research Act 1974 | Scientific and Industrial Research |
| Sea Carriage of Goods Act 1940 | Trade and Industry |
| Seamen's Union Funds Act 1971 | Labour |
| Secondhand Dealers Act 1963 | Justice |
| Secret Commissions Act 1910 | Justice |
| Services Export Development Grants Act 1973 | Trade and Industry |
| Sharebrokers Act 1908 | Justice |
| Sharemilking Agreements Act 1937 | Labour |
| Shearers Act 1962 | Labour |
| Shipping and Seamen Act 1952 | Transport |
| Shipping Corporation of New Zealand Act 1973 | Transport |
| Shops and Offices Act 1955 | Labour |
| Shorthand Reporters Act 1908 | Justice |
| Simultaneous Deaths Act 1958 | Justice |
| Social Security Act 1964 | Social Welfare |
| Social Security (Reciprocity with Australia) Act 1948 | Social Welfare |
| Social Security (Reciprocity with the United Kingdom) Act 1969 | Social Welfare |
| Soil Conservation and Rivers Control Act 1941 | Works and Development |
| Sovereign's Birthday Observance Act 1952 | Internal Affairs |
| Stabilisation of Remuneration Act 1971 | Labour |
| Stamp and Cheque Duties Act 1971 | Inland Revenue |
| Standards Act 1965 | Trade and Industry |
| State Insurance Act 1963 | State Insurance Office |
| State Services Act 1962 | State Services Commission |
| State Services Remuneration and Conditions of Employment Act 1969 | State Services Commission |
| State Supply of Electrical Energy Act 1917 | Electricity |
| Statistics Act 1955 | Statistics |
| Status of Children Act 1969 Justice Statute of Westminster Adoption Act 1947 | Foreign Affairs |
| Statutes Drafting and Compilation Act 1920 | Parliamentary Counsel Office |
| Statutory Land Charges Registration Act 1928 | Justice |
| Stock Foods Act 1946 | Agriculture and Fisheries |
| Submarine Cables and Pipelines Protection Act 1966 | Transport |
| Summary Proceedings Act 1957 | Justice |
| Superannuation Act 1956 | Treasury |
| Surveyors Act 1966 | Lands and Survey |
| Swamp Drainage Act 1915 | Lands and Survey |
| Swaziland Act 1968 | Foreign Affairs |
| Syndicates Act 1973 | Justice |
| Taranaki Harbours Act 1965 | Transport |
| Taranaki Scholarships Trust Board Act 1957 | Education |
| Tarawera Forest Act 1967 | Maori Affairs |
| Tariff and Development Board Act 1961 | Trade and Industry |
| Technicians Certification Act 1958 | Education |
| Technicians Training Act 1967 | Labour |
| Tenancy Act 1955 | Labour |
| Termites Act 1940 | Works and Development |
| Territorial Sea and Fishing Zone Act 1965 | Foreign Affairs |
| Testing Laboratory Registration Act 1972 | Scientific and Industrial Research |
| Timber Floating Act 1954 | Forest Service |
| Time Act 1974 | Internal Affairs |
| Tobacco-growing Industry Act 1974 | Trade and Industry |
| Tokelau Islands Act 1948 | Foreign Affairs |
| Tonga Act 1970 | Foreign Affairs |
| Tourist and Publicity Department Act 1963 | Tourist and Publicity |
| Tourist Hotel Corporation Act 1974 | Tourist and Publicity |
| Town and Country Planning Act 1953 | Works and Development |
| Trade Agreement (New Zealand and Australia) Ratification Act 1933 | Customs |
| Trade Agreement (New Zealand and Canada) Ratification Act 1932 | Customs |
| Trade and Industry Act 1956 | Trade and Industry |
| Trade Practices Act 1958 | Trade and Industry |
| Trade Unions Act 1908 | Treasury |
| Trademarks Act 1953 | Justice |
| Trades Certification Act 1966 | Education |
| Trading Coupons Act 1931 | Trade and Industry |
| Tramways Act 1908 | Works and Development |
| Transport Act 1962 | Transport |
| Treaties of Peace (Italy, Romania, Bulgaria, Hungary, and Finland) Act 1947 | Foreign Affairs |
| Treaty of Peace (Japan) Act 1951 | Foreign Affairs |
| Trespass Act 1968 | Justice |
| Trustee Act 1956 | Justice |
| Trustee Companies Act 1967 | Justice |
| Trustee Companies Protection Act 1934-35 | Justice |
| Trustee Savings Banks Act 1948 | Reserve Bank |
| Tuberculosis Act 1948 | Health |
| Turangi Township Act 1964 | Works and Development |
| Uganda Act 1964 | Foreign Affairs |
| Unclaimed Moneys Act 1971 | Treasury |
| Underground Water Act 1953 | Works and Development |
| Undesirable Immigrants Exclusion Act 1919 | Labour |
| Unit Titles Act 1972 | Justice |
| Unit Trusts Act 1960 | Justice |
| United Nations Act 1946 | Foreign Affairs |
| United Nations (Police) Act 1964 | Police |
| United Nations Relief and Rehabilitation Administration Act 1944 | Foreign Affairs |
| Universities Act 1961 | Education |
| University of Albany Act 1972 | Education |
| University of Auckland Act 1961 | Education |
| University of Canterbury Act 1961 | Education |
| University of Otago Ordinance 1869 and University of Otago Amendment Act 1961 | Education |
| University of Waikato Act 1963 | Education |
| Urban Renewal and Housing Improvement Act 1945 | Works and Development |
| Valuation of Land Act 1951 | Valuation |
| Valuers Act 1948 | Valuation |
| Vegetables Levy Act 1957 | Agriculture and Fisheries |
| Veterinary Services Act 1946 | Agriculture and Fisheries |
| Veterinary Surgeons Act 1956 | Agriculture and Fisheries |
| Victoria University of Wellington Act 1961 | Education |
| Visiting Forces Act 1939 | Foreign Affairs |
| Vocational Training Council 1968 | Education |
| Volunteers Employment Protection Act 1973 | Labour |
| Wages Protection Act 1964 | Labour |
| Wages Protection and Contractors' Liens Act 1939 | Labour |
| Waihou and Ohinemuri Rivers Improvement Act 1910 | Works and Development |
| Waikato Valley Authority Act 1956 | Works and Development |
| Wairarapa Cadet Training Farm Act 1969 | Agriculture and Fisheries |
| Waitangi Endowment Act 1932-33 | Forest Service |
| Waitangi National Trust Board Act 1932 | Lands and Survey |
| War Expenses Act 1939 | Treasury |
| War Funds Act 1915 | Internal Affairs |
| War Pensions Act 1954 | Social Welfare |
| Waterfront Industry Act 1953 | Labour |
| Water and Soil Conservation Act 1967 | Works and Development |
| Weights and Measures Act 1925 | Labour |
| Western Samoa Act 1961 | Foreign Affairs |
| Westport Harbour Act 1920 | Transport |
| Whaling Industry Act 1935 | Agriculture and Fisheries |
| Wheat Board Act 1965 | Trade and Industry |
| Wheat Levy Act 1974 | Trade and Industry |
| Wildlife Act 1953 | Internal Affairs |
| Wills Act 1837 (U.K.) | Justice |
| Winston Churchill Memorial Trust Act 1965 | Internal Affairs |
| Wool Industry Act 1944 | Agriculture and Fisheries |
| Wool Labelling Act 1949 | Trade and Industry |
| Wool Marketing Corporation Act 1972 | Agriculture and Fisheries |
| Wool Proceeds Retention Act 1950 | Agriculture and Fisheries |
| Wool Testing Authority Act 1964 | Agriculture and Fisheries |
ADMINISTRATIVE TRIBUNALS—Administrative tribunals have gradually developed over a period of more than 50 years. As a rule they are set up by Act of Parliament or under powers conferred by statute. Their growth is related to the continuing expansion of governmental activity and responsibility for the general well-being of the community. This development is common to many countries. A list of administrative tribunals in New Zealand was presented in the 1971 and earlier issues of the Yearbook. Useful references are The Citizen and Power: Administrative Tribunals—a survey by the Department of Justice, and the reports of the Public and Administrative Law Reform Committee.
Appeals from Administrative Tribunals—An Administrative Division of the Supreme Court was established by the Judicature Amendment Act 1968. The Division consists of up to four Judges of the Supreme Court, who are assigned to the Division by the Chief Justice. One of the most important functions of the Division is to determine appeals from such administrative tribunals as are specified by statute. It also hears and determines applications for judicial review and for prerogative writs and other classes of applications and proceedings referred to it by the Chief Justice or specified by statute. Judges who are at present assigned to the Division are the Chief Justice, the Right Hon. Sir Richard Wild, K.C.M.G.; the Hon. G. D. Speight; the Hon. J. C. White; and the Hon. R. B. Cooke.
Judges of the Court of Appeal and Supreme Court—
Chief Justice: Right Hon. Sir Richard Wild, K.C.M.G.
Court of Appeal: Right Hon. Sir Richard Wild, K.C.M.G. (ex officio); Right Hon. Sir Thaddeus McCarthy, K.B.E., President; Right Hon. Sir Clifford Richmond; Right Hon. Sir Owen Wood-house.
Supreme Court: Right Hon. Sir Richard Wild, K.C.M.G.; Hon. Sir Alec Haslam; Hon. Sir Ian Macarthur; Hon. A. C. Perry; Hon. J. N. Wilson; Hon. L. F. Moller; Hon. G. D. Speight; Hon. C. M. Roper; Hon. J. C. White; Hon. D. S. Beattie; Hon. J. P. Quilliam; Hon. D. W. McMullin; Hon. P. T. Mahon; Hon. R. B. Cooke; Hon. J. B. O'Regan; Hon. M. F. Chilwell; Hon. M. E. Casey; Hon. E. J. Somers.
Since 1962 there has been an Ombudsman (Sir Guy Powles) whose principal function has been to inquire into complaints from members of the public relating to administrative decisions of Government departments and related organisations, including hospital and education boards. Jurisdiction is being extended under the Ombudsmen Act 1975 to local authorities and certain national boards and organisations. Complaints must be made in writing. Investigations are conducted in private, but an ombudsman can decide not to investigate complaints where, for instance, the subject matter is trivial or the complainant has not a sufficient personal interest in the subject matter of the complaint.
An Ombudsman is empowered to report his opinion, after such an investigation, to the organisation and to the Minister concerned, and if no action is taken he may report to Parliament. Nearly all complaints held to be justified are rectified by the department or organisation concerned. No complaint of actual malpractice has been found justified.
An analysis of the complaints made to the Ombudsman and the resultant action is given in the following table.
| Action on Complaint | 1 Oct 1962-31 Mar 1972 | 1 April 1972-31 Mar 1973 | 1 April 1972-31 Mar 1974 | Total |
|---|---|---|---|---|
| *There were 152 cases still under investigation at 31 March 1974. | ||||
| Outside jurisdiction | 2,358 | 340 | 216 | 2,914 |
| Declined | 105 | 18 | 12 | 135 |
| Discontinued | 851 | 260 | 207 | 1,318 |
| Withdrawn | 597 | 74 | 57 | 728 |
| Investigated and considered justified | 683 | 154 | 114 | 951 |
| Investigated and considered not justified | 2,742 | 400 | 260 | 3,554* |
| Totals | 7,499 | 1,409 | 1,018* | 9,600 |
LIST OF DEPARTMENTS OF THE NEW ZEALAND GOVERNMENT, WITH TITLES AND HOLDERS OF CHIEF ADMINISTRATIVE POSITIONS
| Department | Chief Administrative Positions | |
|---|---|---|
| Title | Name | |
| Agriculture and Fisheries, Ministry of | Director-General | A. T. Johns, PH.D.(CANT) |
| Audit | Controller and Auditor-General | A. C. Shailes, B.A., A.C.A. |
| Crown Law | Solicitor-General | R. C. Savage, LL.B. |
| Customs | Comptroller | J. A. M. Kean, ACCTS. PROF. |
| Defence, Ministry of | Secretary | J. F. Robertson, A.C.A., D.P.A. |
| Chief of Defence Staff | Lieut.-General Sir Richard Webb, K.B.E., C.B. | |
| Chief of Air Staff | Air Vice-Marshal R. B. Bolt, C.B.E., D.F.C., A.F.C. | |
| Chief of General Staff | Major-General R. H. F. Holloway, C.B.E. | |
| Chief of Naval Staff | Rear-Admiral J. F. McKenzie | |
| Education | Director-General | W. L. Renwick, M.A. |
| Energy Resources, Ministry of | Commissioner | R. J. Hogg, B.COM., ACCTS. PROF. |
| Foreign Affairs, Ministry of | Secretary | F. H. Corner, M.A. |
| Government Life Insurance Office | Commissioner | L. L. L. DAVIS |
| Government Printing Office | Government Printer | A. R. Shearer. |
| Health | Director-General | H. J. H. Hiddlestone, M.B., CH.B., M.R.C.P,, F.R.A.C.P. |
| Housing Corporation | Director-General | E. J. Babe, B.COM., A.C.A., D.P.A., DIP.U.V. |
| Inland Revenue | Commissioner | T. M. Hunt, A.C.A. |
LIST OF DEPARTMENTS OF THE NEW ZEALAND GOVERNMENT, WITH TITLES AND HOLDERS OF CHIEF ADMINISTRATIVE POSITIONS—continued
| Department | Chief Administrative Positions | |
|---|---|---|
| Title | Name | |
| Internal Affairs | Secretary and Clerk of Writs | Sir Patrick O'Dea, K.C.V.O., ACCTS. PROF., D.P.A. |
| Justice | Secretary for Justice | G. S. Orr, B.A., LL.M. |
| Labour | Secretary of Labour | G. L. Jackson, A.C.A. |
| Lands and Survey | Director-General | N. S. Coad, B.COM., D.P.A., ACCTS.PROF. |
| Legislative | Clerk of House of Representatives | E. A. Roussell, LL.B. |
| Maori Affairs | Secretary and Maori Trustee | I. W. Apperley, D.P.A. |
| Mines | Secretary | I. D. Dick, M.SC. |
| New Zealand Electricity | General Manager | P. W. Blakeley, F.I.E.E., R.E. |
| New Zealand Forest Service | Director-General | M. J. Conway, M.A.(OXON.) |
| New Zealand Security Intelligence Service | Director of Security | Brigadier H. E. Gilbert, D.S.O., O.B.E. |
| Police | Commissioner | K. B. Burnside, O.B.E. |
| Post Office | Director-General | W. J. Sewell, B.COM., D.P.A., A.C.A. |
| Prime Minister's | Permanent Head | F. H. Corner M.A. |
| Public Trust Office | Public Trustee | J. M. Fielder, A.C.A. |
| Railways | General Manager | T. M. Small, A.M.INST.T. |
| Scientific and Industrial Research | Director-General | E. I. Robertson, O.B.E., PH.D., (LOND.), F.R.S. |
| Social Welfare | Director-General | I. J. D. MacKay, ACCTS. PROF. |
| State Insurance Office | General Manager | N. R. Ainsworth, ACCTS. PROF. |
| State Services Commission | Chairman | R. M. Williams, M.A., PH.D. (CANTAB.) |
| Statistics | Government Statistician | E. A. Harris, B.A., M.COM., A.C.A. |
| Tourist and Publicity | General Manager | J. E. Hartstonge, B.COM., A.C.A. |
| Trade and Industry | Secretary | L. J. K. Futter, A.C.A. |
| Transport, Ministry of | Secretary | R. J. Polaschek, B.A., M.COM., A.C.A., D.P.A. |
| Treasury | Secretary | H. G. Lang, B.A., B.COM., A.C.A., D.P.A. |
| Valuation | Valuer-General | M. R. Mander, DIP.V.F.M. |
| Works and Development, Ministry of | Commissioner | N. C. McLeod, B.E. |
The State services comprise, in the widest sense, all servants of the Crown other than those holding political or judicial office. They include the 36 departments of the Public Service, and the Post Office, Railways Department, Legislative Department, Law Drafting Office, and other State organisations such as Government corporations and agencies, the Police, the armed forces, and the teaching and health services.
Under the State Services Remuneration and Conditions of Employment Act 1969, the State Services Co-ordinating Committee is constituted as the principal adviser to the Minister of State Services and the official negotiating body with service organisations on all personnel matters which in the opinion of the committee significantly affect more than one employing authority. The committee consists of the following or their representatives: Chairman of the State Services Commission; Secretary to the Treasury; Director-General of the Post Office; General Manager of Railways; Secretary of Defence; Director-General of Health; Director-General of Education. Other State service employing authorities may be co-opted as members of the committee from time to time.
Apart from proposals concerning salaries and related conditions of employment, the committee discusses more general personnel matters referred to it by the Government, individual employing authorities, and employee organisations, and tries to achieve a reasonable degree of inter-service uniformity.
Brief summaries of the functions of Government departments are now given.
Source: Parliamentary Paper B7, Pt. 1, Estimates of Expenditure.
Agriculture and Fisheries, Ministry of—The main functions of the Ministry of Agriculture and Fisheries are to promote and encourage the development of all phases of the agricultural, pastoral, horticultural, and fishing industries with a view to maintaining and improving the quality of the products derived from those industries and increasing their production.
Audit Department—The functions of the Audit Office are, briefly, the auditing of the financial transactions of (a) Government, (b) local authorities, and (c) most of the statutory corporations, marketing and other boards.
In the audit of Government departments a duty is owed to Parliament to ensure that its constitutional prerogatives in financial matters are observed. Thus it is necessary to ensure that revenues are raised under proper authority and that expenditure is both lawful and covered by the appropriation of Parliament. Also it falls to the Audit Office to police expenditure on behalf of the executive to see that authorisation is obtained at the proper level. It is also an accepted duty to watch out for waste and extravagance.
These duties call for a more detailed examination of the nature of and authority for transactions than would a normal commercial audit and are in addition to the ordinary examination of internal systems and control.
Crown Law Office—The primary function of the Crown Law Office is to act as the legal adviser of the Government and Ministers in matters affecting the Crown and Government departments. In addition the Solicitor-General performs most of the statutory and ex officio duties of the Attorney-General's office and is himself entrusted by statute with various specific rights, duties, and functions. In range and activity the legal work of the Crown Law Office corresponds with the activities of the Government itself, and just as those activities have extended in the past 30 years into commerce and social services, as well as the purely governmental sphere, so the scope of the Crown Law Office's legal work has widened accordingly.
Customs Department—A principal function is the collection of indirect taxation—Customs duty, excise duty, sales tax, beer duty, and motor spirits duty. Advice is given to Government in matters of Tariff protection for local industry.
The department is also responsible for the prevention of smuggling and related offences, for the entry and clearance of ships and aircraft, and passenger processing.
Another principal function is the implementation of policy and procedural decisions in relation to import control. This involves the receipt of applications, issuing licences, exercising delegated authority, and ensuring that import licensing requirements are met at the point of importation.
Defence, Ministry of—Functions include the provision of the resources required to enable Defence Headquarters to undertake the central command, control, management, and administration of the defence forces and the Ministry of Defence, and also maintaining and operating the defence communications network.
Education, Department of—The primary objective of the department is to ensure that suitable educational facilities and services are readily available for all children of compulsory school age (from 6 to 15 years), for children who by choice start school at the age of 5 years, for the rapidly increasing number of pupils over the age of 15 who stay on at school, for suitably qualified school leavers who seek or are required to undertake education and training on leaving school in secondary schools, teachers colleges, or technical institutes, and for adults wishing to continue their education, whether for vocational or non-vocational purposes. Associated with this objective is the responsibility for administering Government policy in the maintenance and development of pre-school education.
In carrying out these objectives, the department's main activities are the provision of professional and administrative services for the support of the education system, the administration of primary and secondary education, special education, the training of teachers, technical education and the National Library.
Electricity Department, New Zealand—The primary purpose of the New Zealand Electricity Department is to operate and maintain the bulk electricity supply system and to extend it so that the electricity needs of New Zealand are supplied safely, continuously, and economically.
Energy Resources, Ministry of—The Ministry of Energy Resources was established as an independent department of State by Order in Council on 6 October 1972, following the passing of the Ministry of Energy Resources Act 1972.
In broad terms, the primary function of the ministry is to advise the Minister of Energy Resources on the development, promotion, and co-ordination of effective energy policies for New Zealand.
As a necessary part of this function, the ministry promotes, co-ordinates, and undertakes economic and technical investigations and research into all aspects of the production, supply, distribution, and use of energy in all its forms, and into the total energy resources of New Zealand. It maintains a statistical and information service for the energy sector.
The ministry is responsible for co-ordinating the implementation of policies and also maintains liaison with all parts of the energy sector.
Foreign Affairs, Ministry of—The ministry is responsible for the administration of foreign policy and the conduct of New Zealand's external relations generally, including relations with other countries and their representatives in New Zealand, and New Zealand's representation abroad.
The ministry's operating arm overseas is the network of 34 diplomatic posts, consisting of embassies, high commissions, consulates-general, and other permanent missions, located in areas of direct and immediate concern to New Zealand.
Forest Service, New Zealand—Management activities of the Forest Service are directed towards the formation of an exotic forest estate sufficiently large and diverse enough to meet future domestic timber and other forest produce needs and to provide for exports whilst also protecting, conserving, and, where possible, perpetuating the remaining indigenous forests of the country.
Development and management of a wood resource for new forest-based industries leads to continuing employment opportunities and other socio-economic benefits regionally. In accordance with Government policies of regional development, new afforestation is allocated to regions having special social needs.
Implementation of a multiple-use forest policy involves establishment and maintenance of forests for soil and water conservation, scenery preservation, and provision of recreational areas.
Government Life Insurance Office—The operations of the Government Life Insurance Office are essentially a single activity which is to provide full and progressive life insurance and superannuation facilities for the people of New Zealand.
The office is a mutual life insurance office operating in active competition with private offices.
Government Printing Office—The function of the department is to supply the requirements of printing, stationery, and allied services to Government departments. It follows that the volume of demand from client departments regulates to a large extent the development or expansion of the Printing Office.
Health, Department of—The principal functions of the Department of Health are:
To administer the Health Act 1956, the Hospitals Act 1957, the Mental Health Act 1969, Part II of the Social Security Act 1964, and all other public Acts relating to the promotion or conservation of human health, including Narcotics Act 1965 and Poisons Act 1960,
To advise local authorities in matters relating to environmental health.
To prevent, limit, and suppress communicable and other diseases.
To promote or carry out research and investigation in public health fields and the prevention and treatment of disease.
To publish reports, information, and advice concerning the public health.
To organise and control medical, dental, and nursing services, so far as such services are paid out of public moneys.
Generally to take all such steps as may be desirable to secure the preparation, effective carrying out, and co-ordination of measures conducive to public health.
Housing Corporation—The Housing Corporation functions as the chief agency for providing finance for home ownership and as the organisation for the building of Government housing, including State rental houses.
Inland Revenue Department—The main function of the Inland Revenue Department is to assess and collect various taxes and duties. The principal of these is income tax which is collected in part by PAYE deductions from salaries and wages, in part by the payment of provisional tax during the year of derivation of income, and in part by an end of the year assessment. Of the other revenues collected the most significant comprise stamp duty, estate and gift duties, land tax, and totalisator duty.
Internal Affairs, Department of—The department is responsible for administrative matters relating to the office of Governor-General and his staff. It meets the cost of travel within and beyond New Zealand by Ministers of the Crown, Parliamentary Under-Secretaries, and Ministerial private secretaries. It arranges and meets the cost of visits by distinguished persons from other countries who visit New Zealand as guests of Government and is responsible for State functions.
The department administers the legislation relating to New Zealand citizenship, passports and visas, and the registration of alien residents.
The Ministry of Recreation and Sport is responsible for administering Government policy on recreation and sport and servicing the Council for Recreation and Sport. The Youth Services Branch within the ministry has the function of encouraging and assisting local community participation in work with young people.
Justice, Department of—The functions of the department may be classified broadly under the headings of penal policy and administration; law reform; the administration of justice; commercial affairs (including the administration of the Companies and Insolvency Acts); electoral; registration work including land titles, trade marks, patents, and births, deaths, and marriages; and social measures of a preventive nature. The Domestic Proceedings Act 1968, Legal Aid Act, 1969, the Race Relations Act 1971, and the Summary Instalment Order provisions of the Insolvency Act 1967 have taken the department further into the broad area of social administration. The department is, through its Tribunals Division, responsible for the administration of the Sale of Liquor Act 1962, the Indecent Publications Act 1963, the Town and Country Planning Act 1953, together with other various tribunals.
Labour, Department of—The principal responsibilities of the Department of Labour are to promote and maintain full employment through the provision of a complete employment service, to ensure through the work of its field staff that workers are employed under safe and healthy working conditions, to promote good industrial relations, and to collect and publish relevant information. In addition, it administers a complex variety of statutes; among the most important are the Industrial Relations Act, the Factories and Construction Acts, and those dealing with weights and measures, apprenticeship, and immigration.
Lands and Survey, Department of—As the Government's major land administering agency the Department of Lands and Survey on behalf of the Land Settlement Board manages, controls, or exercises oversight of about 9 million hectares of land. Some 65 percent of this area is Crown leasehold, about 25 percent falls into miscellaneous categories (mountain tops, vacant Crown land, coastline, lake and riverbeds, and verges, etc.), and the remainder—about 700,000 hectares—is being developed for farming purposes.
The department also undertakes most Government survey functions and services, thus providing economies and effective co-ordination in the survey operations of State. This work includes basic control surveys, land title surveys, topographical surveys for engineering projects and management purposes, land development services, positional fixes of navigational aids and aerodrome obstructions, earth deformation studies, and land and environmental planning.
Maori Affairs, Department of—The broad functions of the Department of Maori Affairs are to assist the Maori people to achieve their proper place as citizens of New Zealand; to assist Maori landowners by way of title reform and capital advances to make full use of their resources; and to assist Polynesian immigrants to New Zealand in their adjustment to new conditions.
Through its Social Services Division the department encourages and assists the Maori people in the fields of education and employment and in the preservation of their culture. The division counsels groups, individuals, and families to these ends.
Mines Department—The primary objective of the Mines Department is to encourage the active exploration, and the proper development and use of the country's resources of petroleum and minerals. Within this objective the department has two major activities:
The administration of mining privileges, which includes prospecting rights; the regulation and inspection of mines and quarries to enforce acceptable operating and safety standards; and
(b) The provision of advice and financial assistance to foster prospecting and the development and operation of the mining industry.
The function of State coal mining is the production, distribution, and marketing of coal from State-owned or leased coal resources at lowest possible cost within the limitations necessitated by the need to maintain levels of employment and other relevant social considerations.
Police Department—The role of the Police is:
To prevent offences and to detect and apprehend offenders.
To preserve peace and good order.
To protect life and property.
The role of the police in protecting life and property, contrasted with law enforcement, is not governed by statute. Search and rescue features largely in this area of police responsibility, and most search and rescue operations are carried out by the police alone or with the aid of interested voluntary organisations.
Post Office—The Post Office is charged with the operation and development of postal and telecommunications systems, both internal and overseas; the Post Office Savings Bank; and with handling a wide range of payments and receipts for Government departments and other organisations.
Prime Minister's Department—The department, which draws upon the services of the Ministry of Foreign Affairs, includes the Office of the Prime Minister, the Cabinet Secretariat, and the Commission for the Environment.
The commission provides advice and administrative support to the Minister for the Environment and fosters co-ordination between Government agencies having environmental responsibilities. It also initiates relevant new policy proposals for the Minister and other appropriate departments. A principal function of the Commission for the Environment is the audit of environmental impact reports, prepared by Government departments, local authorities, and others on all major works with significant environmental effects and needing Government finance or approval.
Public Trust Office—The Public Trustee provides a wide range of services as trustee, executor, manager, and attorney. He also acts as sinking fund or depreciation fund commissioner for many local authorities when so appointed, and additionally holds other funds on their behalf. He is required to provide a number of statutory services irrespective of whether these are remunerative.
Railways Department, New Zealand Government—The fundamental and continuing aim of New Zealand Railways is to take its part in the operation and development of the nation's transport services by means of a strong, successful, and efficient organisation consisting of rail, road, and inter-island sea services which will help to increase the wealth and well-being of the community.
The main objectives are:
To provide services of the highest standard possible consistent with an overall requirement of economic and safe operation, within the constraints imposed by available labour, equipment, and investment capital.
To trade as a business enterprise.
To earn sufficient revenue to cover operating and renewal costs, to build up a contingency reserve, and to provide whatever proportion of development capital circumstances allow.
Scientific and Industrial Research, Department of—The department has functions of providing background scientific research for economic development and environmental control in several major areas.
Agriculture—Agriculture is a priority area, it being the mainstay of the country's economy. Increasing emphasis is placed on (a) new crops, including those suitable for irrigated land and mechanical harvesting, to meet the demands of the rapidly expanding food processing industry; (b) the breeding of new and better varieties of pasture, particularly for hill country farming; (c) curing, drying, storage, processing, and packaging of agricultural products.
Manufacturing—Particular emphasis is given to improved industrial liaison and advisory services, electronic and electrical work, metal cutting and forming, industrial vibration and acoustic problems, and new product development.
Minerals—Continuing emphasis is given to prospecting for and testing the processing of local raw materials with a view to substantially increasing the “added value” component before export.
Natural Environment—Studies involve freshwater research and pollution problems, and botanical studies associated with major development proposals such as the South Island breech forests and the Manapouri - Te Anau lakes.
Other Scientific Services—There are increasing demands for scientific services from Department of Health (food and drug analysis), Ministry of Transport (blood alcohol analysis), and Police Department (forensic), and for work related to road safety.
Social Welfare, Department of—The principal functions of the Department of Social Welfare are:
To administer the Department of Social Welfare Act 1971; the Children and Young Persons Act 1974; Part I of the Social Security Act 1964; the Family Benefits Home Ownership Act 1964; and to provide for the effective administration and servicing of the War Pensions Act 1954; and the Rehabilitation Act 1941.
Advise the Minister on the development of social welfare policies.
Provide such social welfare services as the Minister may from time to time direct.
Provide for the training of persons to undertake social welfare activities.
Maintain close liaison with and encourage co-operation and co-ordination among any organisations and individuals engaged in social welfare activities.
Undertake and promote research into aspects of social welfare.
State Insurance Office—The State Insurance Office transacts all classes of fire, accident, and marine insurance in New Zealand. Its function is to maintain a competitive insurance service.
It also administers the Export Guarantee Office, which provides credit insurance for exporters.
State Services Commission, Office of—The State Services Commission is responsible for reviewing the efficiency and economy of public service departments and the machinery of Government, and for approving and reviewing establishments of staff in departments. It formulates personnel policies and is responsible for the administration of personnel legislation and policies. As central personnel authority for the public service, the Commission approves the appointment, promotion, transfer, classification, and grading of public servants and determines salary scales and conditions of service.
Statistics, Department of—The Department of Statistics has the following broad functions:
To collect, prepare, process, publish, and circulate statistics on New Zealand's economic, financial, production, and social matters by way of regular reports such as news releases, the Monthly Abstract of Statistics, the annual Official Yearbook, and Pocket Digest of Statistics, and 25 annual reports in specific subject areas (such as agriculture, incomes, industrial production, justice, prices, wages and labour, trade, etc.).
To provide statistical and other information for the efficient conduct of Government business.
Tourist and Publicity Department—The main functions of the Tourist and Publicity Department are to promote travel to within and beyond New Zealand; to develop domestic tourism and to stimulate off-season travel; to publicise New Zealand overseas in the national interests of tourism, trade, and prestige; to undertake research in the interests of tourist industry development; to administer schemes for financial assistance for the provision of accommodation and other tourist facilities; to operate and sell tours and provide a booking service to assist overseas travel agents; and to provide, within New Zealand, information and publicity services for Ministers and other departments and Government agencies.
Trade and Industry, Department of—The principal statutory functions of the department are to promote and encourage the improvement and development of industry and commerce and promote and encourage the export trade of New Zealand.
New dimensions to the department's role, however, have emerged recently from New Zealand's rapidly changing economy. The Government's general stabilisation policies have involved the department in the formulation and execution of broader economic matters than formerly, and the development of pricing policy is now inextricably linked with decisions taken in the area of wages and general incomes policy.
Changes in international trading patterns, the energy crisis, and a world-wide shortage of raw materials for our manufacturing industry are major concerns.
Transport, Ministry of—The ministry is responsible for providing Government with the information and advice necessary for the development of an efficient and economic transport policy.
The principal objective of the Road Transport Division is the development of the safest and most efficient system of road traffic operation through a broad-fronted approach of research, safety education, vehicle inspection, and traffic law enforcement.
The main objective of the Marine Division is to promote the safety of shipping in and beyond New Zealand waters and to ensure the safe handling of cargo at New Zealand ports.
The main objective of the Civil Aviation Division is continuation of the existing high standards of civil aircraft operation. The ministry will continue its programme of providing improved facilities associated with the safe operation of aircraft particularly in regard to navigation aids, surveillance radars, aircraft and airport security, and general aviation supervision.
The principal objective of the Meterological Service is the provision of information and advice to all sections of the community on the atmosphere environment, weather, climatic conditions, and pollution of the air.
Treasury—The role of Treasury is:
To control the receipt, custody, and payment of Government's finances as directed by statute and Government decisions.
To keep Government informed on the existing external and internal economic situation, the effects of existing policy and trends, and prospects for the future.
To advise Government on the level and content of its expenditure and receipts, and assess the most effective allocations of limited resources among competing expenditure proposals.
To advise on, and implement, various aspects of Government's financial and economic policies.
These general functions involve the financial, economic, and programme analysis and evaluation divisions of Treasury in the following particular tasks: the allocation of funds to departments; the investment of public funds; the raising, repayment, and conversion of loans; and the preparation of the Budget and the annual Estimates of Expenditure.
Valuation Department—The major activity of the department is the preparation of valuation rolls for all districts in New Zealand, to maintain these rolls up to date with changes in property holdings, ownership, occupancy, and development and to revise the values at not more than 5-yearly intervals.
Works and Development, Ministry of—In addition to the carrying out of Government works, the ministry has responsibility under the Minister's direction of executing projects and undertakings of national significance. Its objectives include investigation, design, construction, operation, and maintenance of these works, having due regard to standards and costs, and the best practical means whereby environmental conditions can be conserved, restored, or enhanced. In most cases, completed works are taken over for operation and maintenance by operating departments such as the New Zealand Electricity Department and New Zealand Railways.
Further roles of the department include the development of natural resources and the encouragement, investigation, and co-ordination of proposals for regional planning, as well as the task of assembling information on the building and construction industries, and the programming of national capital formation including Government works.
Specific statutes administered by the department include the Public Works Act (which inter alia, provides the Crown and local authorities with land acquisition powers), the Town and Country Planning Act, Geothermal Act, National Roads Act (the department services the National Roads Board), Soil Conservation and Rivers Control Act, Water and Soil Conservation Act (which involves the department in water allocation and quality control activities), and some local Acts.
In the following table the staff numbers of the State services are set out. Hospital board employees are also included as they are paid from State funds.
| Organisation | Staff Numbers at 31 March | ||||
|---|---|---|---|---|---|
| 1971 | 1972 | 1973 | 1974 | 1975 | |
| *Estimates. | |||||
| Public Service | 71,269 | 74,132 | 69,703 | 72,147 | 76,795 |
| Railways | 21,032 | 20,688 | 20,899 | 20,933 | 22,026 |
| Post Office | 32,359 | 32,473 | 33,165 | 34,652 | 35,642 |
| Education* | 41,369 | 41,171 | 43,066 | 42,990 | 44,622 |
| Hospital services* | 30,447 | 32,242 | 38,918 | 35,073 | 36,300 |
| Armed forces | 12,992 | 12,637 | 12,789 | 12,630 | 12,670 |
| Police | 3,214 | 3,702 | 3,560 | 3,740 | 4,286 |
| Others* | 640 | 670 | 700 | 730 | 700 |
| Totals | 213,322 | 217,715 | 222,800 | 222,895 | 233,041 |
| Percentage of total labour force | 19.18 | 19.38 | 19.37 | 18.72 | 19.61 |
In New Zealand, with its long tradition of Government activity in many spheres, the work of the State services covers a broad field. The Government decides when a new service is to be provided or a new function undertaken. Work loads increase as a result of population growth, but are offset to some extent by improvements in efficiency. Recent trends have been for more staff for research and resource development and expanded social services.
The relative cost of government as a percentage of gross national product is shown in the following table.
| Year | Government Current Expenditure on Goods and Services* | Gross National Product | Percentage |
|---|---|---|---|
| *This figure is net of departmental receipts. It also excludes the operating expenses of trading departments, expenditure of a capital nature, and transfer payments to either persons or local authorities such as social security benefits, pensions, subsidies, and interest on the public debt paid in New Zealand. | |||
| $(million) | $(million) | ||
| 1938-39 | 46.4 | 464 | 10.0 |
| 1948-49 | 100.0 | 978 | 10.2 |
| 1953-54 | 178.0 | 1,681 | 10.6 |
| 1958-59 | 236.2 | 2,270 | 10.4 |
| 1963-64 | 320.2 | 3,197 | 10.0 |
| 1967-68 | 442.4 | 4,083 | 10.8 |
| 1968-69 | 484.8 | 4,307 | 11.3 |
| 1969-70 | 539.3 | 4,753 | 11.3 |
| 1970-71 | 657.8 | 5,447 | 12.1 |
| 1971-72 | 766.2 | 6,339 | 12.1 |
| 1972-73 | 847.8 | 7,297 | 11.6 |
| 1973-74 | 972.7 | 8,593 | 11.3 |
STATE SERVICES COMMISSION—The State Services Act 1962 provides for a State Services Commission of up to four persons appointed by the Governor-General in Council on the recommendation of the Prime Minister.
In respect of departments of the Public Service, the Commission is responsible for—
Reviewing the machinery of Government, including the allocation of functions to and between departments, the desirability of or need for the creation of new departments and the amalgamation or abolition of existing departments, the co-ordination of the activities of departments, and the extent and nature of controls exercised by any one department over the operations of another department;
Reviewing the efficiency and economy of each department;
(c) The provision of suitable office accommodation and the prescription and supervision of physical working conditions of all employees in the Public Service;
Approving and reviewing establishments of staff;
Acting as the central personnel authority for the Public Service;
Prescribing basic training programmes, furnishing advice on and assisting with the training of staff, and making recommendations to the Minister on the facilities necessary for the proper training of staff;
Providing management consultation services, including advice as to efficient work and control methods and techniques, data processing equipment, and problems of organisation.
It has complete independence in dealing with individual employees of the Public Service, but is made responsible to a Minister in all other matters.
When directed by the Minister charged with the administration of the Act, at the request of the Minister responsible for another part of the State Services, e.g., the Post Office or the Railways Department, the Commission must associate itself with the head of that particular part of the service in an investigation of its organisation, methods, or procedures. The Commission must also, when requested by the head of or the Minister in Charge of any part of the State Services, provide management consultation services.
Computer Services—A Computer Services Division of the State Services Commission has been established and is responsible for the control of the computer services vested in the State Services Commission. The Cumberland Computer Centre is in Willis Street, Wellington. A further centre, known as the Pipitea Computer Centre, has been established at 61-63 Thorndon Quay, Wellington.
An engineering and scientific computer centre in the Vogel Building, Wellington, is operated by the Ministry of Works and Development as agent for the State Services Commission.
A computer data base is to be established at Wanganui as part of a justice data bank system, with positive means of safeguarding access to information in the data base. A description of the proposed system is contained in a Government caucus committee report published in 1973 and available from Government bookshops. The system is to service the Police, Transport and Justice Departments.
THE PUBLIC SERVICE: Recruitment—The recruitment of public servants is conducted by the State Services Commission through its district representatives, and by departments in collaboration with the Commission. Details of career openings in the Service are regularly supplied to schools, and career leaflets are published.
Promotion—Promotion in the Public Service is based on merit. Although the Service has clearly defined salary scales and avenues of promotion, it also provides quick promotion with special salary increases to officers of outstanding merit. All vacancies above basic level are widely advertised so that all persons in the Service, and sometimes persons outside the Service, may apply for higher positions. Public servants have certain rights of appeal to the Public Service Appeal Board.
Classification and Grading—Since 1963 the Commission has prescribed occupational classes, according to the nature of the duties required to be performed. Each occupational class is graded according to relative levels of responsibility and skills required.
Remuneration—Salary rates are prescribed in accordance with the State Services Remuneration and Conditions of Employment Act 1969 and are related to the levels of remuneration of persons doing comparable work in employment outside the Public Service. Adequate margins are maintained for skill and responsibility.
Efficiency and Economy—In fulfilling its responsibility for reviewing efficiency and economy in the Public Service, the Commission, in collaboration with departments, makes full use of inspection of work and analysis of systems, standards and controls; new training methods and materials; modern technical processes and equipment; clearly defined systems of delegation of authority and of discipline.
Staff Training and Education—A comprehensive Service training and education policy is provided.
Statistics: Staff—The detailed distribution of staff among departments in the Public Service is shown in the Commission's annual report to Parliament (parliamentary paper G. 3). At 31 March 1974 there were 53,237 permanent officers and 1,796 temporary staff (excluding casuals) employed; a year earlier the comparable figures were 51,013 and 1,816 respectively. Distribution of the staff by occupational classes is given in Section 32, Employment.
PAY RESEARCH UNIT—It is accepted that there should be comparability between private sector rates and rates paid to State servants employed on broadly comparable work, taking into account differences in conditions of service and fringe benefits. But it is also recognised that there is a need to make a clear distinction between fact-finding—establishing job comparability, discovering pay and conditions—and the negotiation and arbitration process.
To this end a Pay Research Unit for the State Services was set up in August 1972 and is based in the Department of Statistics.
Such a unit had been recommended by the 1962 Royal Commission of Inquiry into the New Zealand State Services, and again by the 1969 Royal Commission on Salary and Wage Fixing Procedures in the State Services.
The Pay Research Unit has a small consultative and advisory steering committee with equal representation from both the official and the employee organisation sides to decide on which occupational groups should be surveyed, and when such surveys should be undertaken. It will also set up advisory committees and decide their functions and the composition of the committees.
Though the consultative committee decides on the occupational groups to be surveyed, the Pay Research Unit alone is responsible for deciding the fields of employment outside the State Services where comparisons are made.
STATUTORY BOARDS AND COMMITTEES—The following is a list of the main statutory boards and committees grouped according to the Government department responsible for the administration of the legislation or the servicing of the boards. The order of departments is generally that followed in the Yearbook for coverage of the main subject matter.
| Health, Department of |
|---|
| Clean Air Council. |
| Dental Council. |
| Dental Technicians Board. |
| Dental Benefits Central Advisory Committee. |
| Nursing Council. |
| Medical Council of New Zealand. |
| Medical Research Council of New Zealand. |
| Board of Health. |
| Dietitians Board. |
| Plumbers and Gasfitters Board. |
| Maternity Services Committee. |
| Poisons Committee. |
| Food and Drug Advisory and Technical Committees. |
| Radiological Advisory Council. |
| Drug Assessment Advisory Committee. |
| Medical Practitioners Disciplinary Committee. |
| Council of the Pharmaceutical Society. |
| Laboratory Service Advisory Committee. |
| Maternity Benefits Negotiating Committee. |
| Medical Services Advisory Committee. |
| Ophthalmological Services Advisory Committee. |
| Otological Services Advisory Committee. |
| Pharmaceutical Advisory Committee. |
| Pharmacology and Therapeutics Advisory Committee. |
| Pharmaceutical Benefits Negotiating Committee. |
| Radiological Services Advisory Committee. |
| Hospital Medical Officers Advisory Committee. |
| Central Committee on Training Orthopaedic Technicians. |
| Physiotherapy Board. |
| Occupational Therapy Board. |
| Chiropodists Board. |
| Ambulance Transport Advisory Board. |
| Opticians Board. |
| Board of Management of the Disabled Re-establishment League. |
| District Committees Disabled Re-establishment League. |
| Social Welfare Department War Pensions and Rehabilitation— |
| War Pensions Board. |
| War Pensions Appeal Board. |
| War Pensions Medical Research Trust. |
| Rehabilitation Board. |
| N.Z. Artificial Limb Board. |
| Education, Department of |
| Advisory Committee on the Teaching of the Maori Language. |
| Central Advisory Committee. |
| Committee of Inquiry into Pre-school Education. |
| Committee of Inquiry into the Use of Television in Education. |
| Education Boards' Employment Review Committee. |
| National Commission for UNESCO. |
| National Council for Adult Education. |
| National Library Board of Trustees. |
| Ngarimu V.C. Scholarship Fund Board. |
| N.Z. Council for Educational Research. |
| N.Z. Foundation for the Blind (Board of Trustees). |
| Primary Teachers Appointments Appeal Board. |
| School Certificate Examination Board. |
| Teachers Assessment Appeal Board. |
| Teachers Classification Appeal Board. |
| Teachers Court of Appeal. |
| Teachers Disciplinary Board. |
| Technicians Certification Authority. |
| Trades Certification Board. |
| University Entrance Board. |
| Vocational Training Council. (Joint appointments Ministers of Education and Labour.) |
| Justice, Department of |
| Borstal Parole Board. |
| Prison Parole Board. |
| Town and Country Planning Appeal Boards. |
| Legal Aid Board. |
| Legal Aid Appeal Authority. |
| Co-operative Dairy Companies Tribunal. |
| Indecent Publications Tribunal. |
| Copyright Tribunal. |
| Crimes Compensation Tribunal. |
| Chiropractic Board. |
| Licensing Control Commission. |
| Licensing Committees (there are 22 of these committees). |
| Land Valuation Committees (there are 21 of these committees). |
| Hotel Investment Advisory Committee. |
| Law Revision Commission. |
| Property Law and Equity Reform Committee. |
| Public and Administrative Law Reform Committee. |
| Contracts and Commercial Law Reform Committee. |
| Torts and General Law Reform Committee. |
| Criminal Law Reform Committee. |
| Company Law Advisory Committee. |
| Special Companies Act Committee. |
| Magistrates' Courts Rules Committee. |
| Ministry of Defence |
| Armed Forces Canteen Council. |
| Police Department |
| Police Staff Tribunal. |
| Transport, Ministry of |
| Air Services Licensing Appeal Authority. |
| Air Services Licensing Authority. |
| Marine Advisory Committees. |
| Marine Council. |
| Maritime Appeal Authority. |
| National Airways Corporation. |
| New Zealand Ports Authority. |
| New Zealand Urban Public Passenger Transport Council. |
| Nominal Defendants Advisory Council. |
| Regional Transport Licensing Authority (Auckland). |
| Road Traffic Safety Research Council. |
| Shipping Industry Tribunal. |
| Shipping Corporation of New Zealand. |
| Transport Advisory Council. |
| Transport Licensing Authorities (5). |
| Transport Licensing Appeal Authority. |
| Transport Charges Appeal Authority. |
| Railways Department |
| Government Railways Appeal Board. |
| Government Railways Industrial Tribunal. |
| Scientific and Industrial Research, Department of |
| Building Research Association. |
| Carter Observatory Board. |
| Cawthron Institute Trust Board. |
| Coal Research Association Inc. |
| Dairy Research Institute. |
| Fruit Research Committee. |
| Hop Research Committee. |
| Meat Industry Research Institute. |
| Mineral Resources Council. |
| N.Z. Atomic Energy Committee. |
| N.Z. Fertiliser Manufacturers Research Association. |
| N.Z. Leather and Shoe Research Association Inc. |
| N.Z. Pottery and Ceramics Research Association. |
| Potato Research Advisory Committee. |
| Research Institute of Launderers, Dry Cleaners, and Dyers. |
| Ross Dependency Research Committee. |
| Tobacco Research Committee. |
| Wheat Research Committee. |
| Wool Research Organisation. |
| Testing Laboratory Registration Council. |
| Agriculture and Fisheries, Ministry |
| Agricultural Chemicals Board. |
| Agricultural Pests Destruction Council. |
| Animal Remedies Board. |
| Apple and Pear Prices Authority. |
| British Phosphate Commission. |
| Canterbury Raspberry Marketing Committee. |
| Central Committee of Raspberry Growers. |
| Christmas Island Phosphate Commission. |
| Citrus Canker Advisory Committee. |
| Citrus Marketing Authority. |
| Dairy Cattle Breeding Committee. |
| Dairy Factory Managers' Registration Board. |
| Dairy Industry Loans Council. |
| Dairy Products Prices Authority. |
| Egg Marketing Authority. |
| Fruit Distributors Ltd. |
| Honey Marketing Authority. |
| Hop Marketing Authority. |
| Marlborough Nassella Tussock Board. |
| Meat Export Prices Committee. |
| Milk Prices Authority. |
| National Hydatids Authority. |
| Nelson Raspberry Marketing Committee. |
| N.Z. Agricultural Engineering Institute Management Committee. |
| N.Z. Dairy Board. |
| N.Z. Meat Producers Board. |
| N.Z. Milk Board. |
| N.Z. Potato Board. |
| N.Z. Poultry Board. |
| N.Z. Wool Board. |
| N.Z. Wool Marketing Corporation. |
| N.Z. Wool Testing Authority. |
| North Canterbury Nassella Tussock Board. |
| Otago Raspberry Marketing Committee. |
| Veterinary Services Council. |
| Veterinary Surgeons Board. |
| (Excludes advisory or technical committees appointed under section 13 of the Ministry of Agriculture and Fisheries Act 1953). |
| Works and Development, Ministry of |
| National Roads Board. |
| National Water and Soil Conservation Authority. |
| Soil Conservation and Rivers Control Council. |
| Water Allocation Council. |
| Water Pollution Control Council. |
| Building Industry Advisory Council. |
| Auckland Harbour Bridge Authority. |
| Christchurch-Lyttelton Road Tunnel Authority. |
| Engineers Registration Board. |
| Engineering Associates Registration Board. |
| Architects Education and Registration Board. |
| Quantity Surveyors Registration Board. |
| Waikato Valley Authority. |
| Catchment Boards. |
| Lands and Survey, Department of |
| Land Settlement Board. |
| Marginal Lands Board. |
| National Parks Authority. |
| National Parks Board. |
| Hauraki Gulf Maritime Park Board. |
| Nature Conservation Council. |
| Cape Kidnappers Bird Sanctuary Board. |
| Scenic and Allied Reserve Boards. |
| N.Z. Survey Board. |
| N.Z. Geographic Board. |
| N.Z. Forest Service |
| Forestry Development Council. |
| Timber Production Advisory Committee. |
| Waipoua Forest Sanctuary Advisory Committee. |
| Forest Disease Control Advisory Committee. |
| Forest Parks Advisory Committees (4). |
| Maori Affairs, Department of |
| Maori Purposes Fund Board. |
| Maori Education Foundation. |
| Licensed Interpreters Board of Examiners. |
| Valuation Department |
| Valuers Registration Board. |
| Ministry of Energy Resources |
| Natural Gas Corporation. |
| N.Z. Gas Council. |
| N.Z. Electricity Department |
| Electricians Registration Board. |
| Electric Lineman Training Committee. |
| Rural Electrical Reticulation Council. |
| Committee on Electric Power Development. |
| Committee to Review Power Requirements. |
| Electrical Wiring Regulations Committee. |
| Trade and Industry, Department of |
| Advisory Committee on Heavy Engineering Industry. |
| Consumer Council. |
| Electronics Advisory Committee. |
| Emergency Protection Authority. |
| Industrial Research and Development Grants Advisory Committee. |
| Metric Advisory Board. |
| Motor Spirits Licensing Authority. |
| N.Z. Industrial Design Council. |
| N.Z. Inventions Development Authority. |
| N.Z. Linen Flax Corporation. |
| N.Z. Steel Limited. |
| N.Z. Wheat Board. |
| N.Z. Wooltop Making Investigating Co. Ltd. |
| Productivity Advisory Council. |
| Regional Development Councils. |
| Standards Council. |
| Tariff and Development Board. |
| Timber Preservation Authority. |
| Tobacco Board. |
| Trade Practices and Prices Commission including Price Tribunal. |
| Overseas Trade— |
| Export Guarantee Advisory Committee. |
| N.Z. Overseas Trading Corporation Ltd. |
| Trade Promotion Council. |
| Mines Department |
| Coal Mines Council. |
| Coal Mining Districts Welfare and Research Fund Council. |
| Treasury |
| Monetary and Economic Council. |
| Dominion Salt Ltd. |
| N.Z. Woolpack and Textiles Ltd. |
| Local Authorities Loans Board. |
| National Provident Fund Board. |
| National Provident Fund Investments Committee. |
| Government Superannuation Board. |
| Taxation Board of Review. |
| Co-operative Pig Marketing Companies Income Tax Appeal Authority. |
| Co-operative Milk Marketing Companies Income Tax Appeal Authority. |
| Co-operative Dairy Companies Income Tax Appeal Authority. |
| Snow Loss Reserve Committee. |
| Visiting Experts Advisory Committee. |
| Labour, Department of |
| Auckland Advisory Committee on Training and Employment. |
| Building Industry Technical Training Council. |
| Exempted Goods Committee under Shops and Offices Act. |
| Higher Salaries Commission. |
| Immigration Advisory Council. |
| Industrial Commission. |
| Industrial Conciliation Service. |
| Industrial Mediation Service. |
| National Advisory Council on the Employment of Women. |
| Rent Appeal Boards. |
| Shops and Offices Exemption Tribunal. |
| Waterfront Industry Tribunal. |
| Research Fund Administration Committee for Society for Research on Women. |
| Vocational Training Council. (Appointments made by Minister of Education and Minister of Labour, acting jointly.) |
| Construction Advisory Committee. |
| National Conciliation Committee (Waterfront). |
| Internal Affairs, Department of |
| Local Government Commission. |
| Fire Service Commission. |
| Queen Elizabeth II Arts Council. |
| Lottery Board of Control. |
| N.Z. Historic Places Trust. |
| N.Z. Art Gallery and Museum Board. |
| N.Z. Council for Recreation and Sport. |
| Winston Churchill Memorial Trust Board. |
| N.Z. Patriotic Fund Board. |
| Cinematograph Films Licensing Authority. |
| Cinematograph Films Censorship Board of Appeal. |
| Cinematograph Film Projectionists Licensing Board. |
| Film Industry Board. |
| University of Hawke's Bay Trust Board. |
| Art Union Distribution Committees (6). |
| Auckland Centennial Memorial Park Committee. |
| Anzac Fellowship Selection Committee. |
| Literary Fund Advisory Committee. |
| Civil Defence— |
| National Civil Defence Committee. |
| National Civil Defence Plans Co-ordinating Committee (and 10 subcommittees). |
| Tourist and Publicity Department |
| Tourist Hotel Corporation. |
| New Zealand Maori Arts and Crafts Institute. |
| New Zealand National Travel Association. |
| Auckland Intercontinental Properties Ltd. |
| Miscellaneous |
| Earthquake and War Damage Commission. |
| State Insurance Investment Board. |
| Government Insurance Investment Board. |
Since the preceding issue of the Yearbook the following honours have been conferred by Her Majesty the Queen for services rendered in connection with New Zealand:
Dame Commander of the Civil Division of the Most Excellent Order of the British Empire (D.B.E.): Mrs Lucy Ruth Kirk.
Knight Commander of the Civil Division of the Most Excellent Order of the British Empire (K.B.E.): Peter Tait, O.B.E., J.P.
Knight Bachelor: William Norman Gough Dunlop, J.P.; Leonard Albert Hadley, J.P.
Companion of the Civil Division of the Most Honourable Order of the Bath (C.B.): Ian Gordon Lythgoe.
Companion of the Most Distinguished Order of Saint Michael and Saint George (C.M.G.): Arthur Ernest Bockett, O.B.E.; John Patrick McVeagh.
Commander of the Civil Division of the Most Excellent Order of the British Empire (C.B.E.): Laurence Alfred Cameron, J.P.; Mrs Miriam Patricia Dell; Robert James MacLachlan; Stanley William Wilford Tong; Pearce Melvin Eddy Williams, O.B.E., J.P.
Officer of the Civil Division of the Most Excellent Order of the British Empire (O.B.E.):
Dr John Dunstan Atkinson; Gordon A. Brown, J.P.; Rev. Father Leo St John Close; Bevan Ernest Congdon; James Francis Duncan; Maurice Francis Tancred Holmes; Mrs Sheila Betty Holt, J.P.; Donald Ross Hunter; Rev. George A. Jeffreys; Reginald David Lumsden; Norman Alfred Nash; Mrs Eunice Olive Nieukerke; John Goodlet Pryde; Dr John Russell Ritchie; James Malcolm Ross; Rev. Ernest James Salisbury.
Companion of the Imperial Service Order (I.S.O.):
Murray Dobson Sherwood.
Member of the Civil Division of the Most Excellent Order of the British Empire (M.B.E.):
Miss Muriel Barron (Sister Mary Gabriel); Desmond Terence Crowe; William Wallis Day, J.P.; Patrick Ballance Desmond; Pieter Johannes De Vries; Mrs Mary Frances English; Miss Binda Mary Goldsbrough; Mrs Frances Eva Boronia Gregory; Leonard Robert George Harlen, Q.F.S.M.; Hugh Wilson Hayward, J.P.; James Frederick Higgins, J.P.; Miss Florence Caroline Emily Howland; Lewis Evan Lewis; Bruce McHattie; Miss Rona Una McKenzie; Mrs Norma Mangos; John Patrick Murphy; Mrs Beverley Pentland; Miss Marjorie Ellen Rae, J.P.; George Skipworth, J.P.; John Rickard Waigth, J.P.; Neil Apanui Watene, J.P.; William Frederick. Wise.
British Empire Medal Civil Division (B.E.M.):
Miss Clare Martha Ambler; Harry Winfield Bennett, J.P.; Miss Elizabeth Joyce Addison Birley; Norman Henry Brayshaw; John Drummond; Russell MacLennan Glendinning; Mrs Joyce Iris Klemple; Miss Gladys Lorimer McAndrew; Howard Leon Mallitte; Mrs Mona Ross Moore; Mrs Alma Phyllis Neave, J.P.; Mrs Helga Marshall Newson; John Joseph O'Brien; Mrs Doris Ogden; Edward Benjamin O'Reilly, J.P.; Norman Arthur Prier; John Te Rangiani-waniwa Rangihau; Mrs Ellen June Sullivan, J.P.; Mrs Kuini Katarina Ellison Te Tau; Lindsay Eunus Warmington; Miss Olive Charlotte Mary Wharton; Kenneth Cecil Wilkinson; Eric Drayton Withell.
Queen's Fire Service Medal for Distinguished Service (Q.F.S.M.):
Alex Douglas Barton; John Fogarty; Harold Thomas Genese.
Member of the Civil Division of the Most Excellent Order of the British Empire (M.B.E.): Clifford John Bell; Keith Vincent.
British Empire Medal, Civil Division (B.E.M.):
David Skinner Paterson.
Queen's Police Medal for Distinguished Service (Q.P.M.):
Charles Erlston Weir Black; Michael John Vaughan.
Commander of the Military Division of the Most Excellent Order of the British Empire (C.B.E.): Brigadier Ronald Douglas Patrick Hassett, M.B.E.
Officer of the Military Division of the Most Excellent Order of the British Empire (O.B.E.):
Group Captain Morris Charles Pollard; Surgeon Commander Thomas Shailer Weston, V.R.D.; Lieutenant Colonel Robert McLeod Dickie; Lieutenant Colonel Neville Alan Wallace.
Member of the Military Division of the Most Excellent Order of the British Empire (M.B.E.):
Lieutenant Commander David Trevor Ingram; Major Stewart Thomas Foster, E.D.; Warrant Marine Engineering Artificer Terence Richard Martin; Warrant Officer First Class Lance Repington Reeves.
Air Force Cross (A.F.C.):
Squadron Leader Frank Hamilton Roach.
British Empire Medal Military Division (B.E.M.):
Chief Radioman James Drummond; Chief Petty Officer Gunnery Instructor Graham Clive Holloway; Flight Sergeant (now Warrant Officer) Ronald Stanley Soden; Chief Signalman Russell Graham Hockley; Staff Sergeant Jeffrey Johnson Taylor; Flight Sergeant Air Ordnance-man Graham Brian Parcell; Sergeant Donald Grant Tanui Roa; Corporal Maxwell Harry Lyver.
SPECIAL LIST 26 SEPTEMBER 1974
Knight Grand Cross of the Most Excellent Order of the British Empire (G.B.E.): Rt. Hon. John Ross Marshall.
Knight Bachelor (K.B.): Hon. Arthur Owen Woodhouse; Hon. Ian Hannay Macarthur.
George Cross (posthumous) Sergeant Murray Ken Hudson.
Knight Commander of the Most Distinguished Order of Saint Michael and Saint George (K.C.M.G.): Mr Arnold Henry Nordmeyer, C.M.G.
Knight Commander of the Civil Division of the Most Excellent Order of the British Empire (K.B.E.): Mr George Ernest Francis Wood, O.B.E., I.S.O.
Knights Bachelor: Mr C Moihi, Te Arawaka Bennett, D.S.O: Prof. Frank Wakefield Holmes.
Companions of the Most Distinguished Order of Saint Michael and Saint George (C.M.G.): Mr R. K. Davison, Q.C; Mr W. A. Fox; Mr J. M. McEwen; Mr A. G. Robb.
Commanders of the Civil Division of the Most Excellent Order of the British Empire (C.B.E.):
Mr G. J. Brocklehurst, O.B.E.; The Right Reverend J. T. Holland; Mr M. R. Jones, O.B.E., M.M.; Mrs P. Moncrieff; Mr M. J. Moriarty; Mr Justice M. B. Scully.
Officers of the Civil Division of the Most Excellent Order of the British Empire (O.B.E.):
Mr L. G. Anderson; Mrs D. B. Campbell; Mr H. E. Coxhead; Mr W. A. Dew; Miss B. Gardner; Mrs E. P. Grooby; Mr W. J. Henderson; Lady Iris M. Kitts; Mr C. N. MacKenzie; Mr J. Matteucci; Mr F. W. G. Miller; Mr E. A. Missen; Mr J. M. Stacpoole; Mr R. Tamihana; Mr R. J. Waghorn; Mr C. C. W. White.
Companions of the Queen's Service Order for Community Service (Q.S.O.): Miss A. G. Cathie; Mr J. N. Gordon; Mr H. C. M. Norris; Mr L. G. K. Steven.
Companions of the Queen's Service Order for Public Services (Q.S.O.):
Mr R. Boord; Miss M. J. Clark; Mr M. H. Janes; Mr M. R. R. Love; Dr D. G. McLachlan; Dr J. L. Newman; Mr A. R. Perry.
Members of the Civil Division of the Most Excellent Order of the British Empire (M.B.E.):
Mr D. W. R. Blackler: Miss T. H. Clough; Mr G. H. Corrick; Miss D. I. Davies (Mrs Lochore); Mr G. L. Ding; Miss J. E. Donald; The Reverend W. E. Falkingham; Mr A. S. Fong; Mr G. J. K. Keown; Miss M. A. MacKenzie; Mr J. A. Mclnnes; Mrs W. M. H. Pitama-Riwai; Mrs C. M. Purdue; Mr R. J. Rolfe; Mr C. E. Saunders; Mr K. W. Thomson; Mrs C. Winstanley.
The Queen's Service Medal for Community Service (Q.S.M.): Mr R. W. Allum; Dr F. W. W. Dawson; Miss B. M. Freeling; Mrs P. M. Hewstone; Mr A. O. Kempton; Mrs I. C. Laidlaw; Mrs G. M. A. Le Verne; Mrs M. E. Marwick; Mrs R. M. Robson; Mr T. Romain; Mr A. G. Ross; Mr N. G. Stewart; Lieut Colonel T. C. Wallace, E. D.; Mr H. W. Watson; Mr E. J. Wood, E.D.
Queen's Service Medal for Public Services (Q.S.M.): Miss J. U. Baker; Mrs A. Booth; Mr W. G. Caldwell; Mr J. F. Colvin; Mr K. H. Eddy; Mr A.H. Honeyfield; Mr G. N. Jeffery; Mr N. P. H. Jones; Miss M. R. Kinney; Mr F. C. McGehan; Mr A. E.S. Roberts; Mr J. R. Scurr; Mr C. H. Shackell; Mr J. M. Stanley; Mr W. D. Sullivan; Miss V. M. Tew; Mrs J. E. Woodham.
British Empire Medal, Civil Division (B.E.M.):
Mr R. H. Broughton; Mr W. P. Dawson; Mr A. C. Garlick; Mrs R. A. Graham; Mr F. L. G. Howard; Mr W. C. Kohn; Mr E. J. A. Ormrod; Mr J. H. Shortt; Miss M. G. Smith; Miss C. M. Wilkins.
Queen's Fire Service Medal for Distinguished Service (Q.F.S.M.): Mr D. W. Blewett; Mr B. McK. Wallis.
Member of the Civil Division of the Most Excellent Order of the British Empire (M.B.E.): Detective Chief Inspector A. W. Baker.
British Empire Medal, Civil Division (B.E.M.): Detective Senior Sergeant R. L. Butler; Senior Sergeant K. O. Evans.
Queen's Police Medal for Distinguished Service (Q.P.M.): Mr H. J. Forsey.
Companion of the Military Division of the Most Honourable Order of the Bath (C.B.): Rear-Admiral E. C. Thorne, C.B.E.
Commander of the Military Division of the Most Excellent Order of the British Empire (C.B.E.): Air Commodore C. L. Siegert, MVO, DFC, AFC, ADC.
Officers of the Military Division of the Most Excellent Order of the British Empire (O.B.E.): Colonel C. D. Hall, E.D.; Group Captain A. F. Tucker, D.F.C.
Members of the Military Division of the Most Excellent Order of the British Empire (M.B.E.): Warrant Officer Physical Training Instructor P. J. Allan; Major N. S. Kidd; Temporary Major and Quartermaster W. W. Fraser; Warrant Officer second class R. L. Pepper; Warrant Officer second class I. M. Stevenson, E.D.: Temporary Squadron Leader T. J. Kelly; Flight Lieut E. G. Wright.
Air Force Cross (A.F.C.): Squadron Leader N. J. S. Rodger.
British Empire Medal, Military Division (B.E.M.): General Dutyman H. R. Willis; Sergeant A. J. Brown; Flight Sergeant W. L. Grimes; Flight Sergeant E. J. Taylor.
Queen's Commendation for Valuable Services in the Air: Flight Lieutenant B. J. Mitchell.
Austria—Hollandstrasse 2/X11, A-1020 Vienna. (Postal address: Postcach 1471 A-1011 Vienna.)
Belgium—Boulevard du Regent 47-48, 1000-Brussels.
Chile—Isidora, Goyenechea 3516, Las Condes, Santiago.
China—No. 1 Street No. 2, East Temple of the Sun, Chao Yang District, Peking.
Denmark—Ambassador resident in Brussels.
European Communities—Boulevard du Regent, Brussels.
France—7 Rue Leonardo de Vinci, 75116 Paris.
Germany, Federal Republic of—53 Bonn, Bonn-Centre H1 902, Bundeskanzlerplatz, Bonn.
Holy See—7 Ter Rue Leonardo de Vinci, 75116, Paris.
Hungary—Ambassador resident in Vienna.
Indonesia—Djalan Prof. Moh. Yamin S.H. 60, Menteng, Djakarta.
Iran—Avenue Shah Abbas, Afsheen 29, Abbasabad, Tehran.
Ireland—New Zealand House, Haymarket, London, S.W.1.Y. 4.T.Q,
Italy—Via Zara 28, Rome, 00198
Japan—20-40 Kamiyama-Cho, Shibuya-Ku, Tokyo 150.
Khmer Republic—Ambassador resident in Saigon.
Korea—Samilro Building, 10 Kwang-chul-dong, Chongro-ku, Seoul. (C.P.O. Box 1059.)
Laos—64 Silom Road, Bangkok, Thailand.
Luxembourg—51 Rue de la Loi, Brussels 1040, Belgium.
Maldives Republic—Ambassador resident in New Delhi.
Mexico—Ambassador resident in Washington D.C.
Nepal—39 Golf Links Road, New Delhi 3, India.
Netherlands—Lange Voorhout 18, The Hague 2005.
Norway—Ambassador resident in The Hague.
Peru—Avenida Salaverry 3006, San Isidro, (postal address: Casilla 5587), Lima.
Philippines—10th Floor, Philippine Bank of Commerce Building, 6956 Ayala Avenue, Makati, Rizal.
Poland—Ambassador resident in Vienna.
Romania—Ambassador resident in Vienna.
Sweden—Ambassador resident in The Hague.
Thailand—Anglo-Thai Building, 64 Silom Road, Bangkok.
United States—19 Observatory Circle, N.W., Washington, D.C., 20008.
U.S.S.R.—44, Ulitza Voroskovo, Moscow 121069.
Vietnam—45 Phung Khac Khoan, Saigon.
Yugoslavia—Ambassador resident in Rome.
Australia—Commonwealth Avenue, Canberra, A.C.T. 2600.
Britain—New Zealand House, Haymarket, London, SWIY 4TQ.
Canada—Commonwealth Building, 77 Metcalfe Street, Ottawa, KIP 5L6.
Cook Islands—P.O. Box 21, Rarotonga.
Fiji—Sukuna House, corner Victoria Parade and MacArthur Street, Suva. P.O. Box 1378.
India—39 Golf Links Road, New Delhi 110003, India.
Jamaica—High Commissioner resident in Ottawa.
Malaysia—Bangunan Syarikat Polis, Jalan Sultan, Suleiman. P.O. Box 2003, Kuala Lumpur.
Malta—High Commissioner resident in Rome.
Singapore—13 Nassim Road, Singapore 10.
Sri Lanka—39 Golf Links Road, New Delhi 3, India.
Tonga—Immigration Office, Room 214, Tungi Arcade, Taufa'ahau Road, Nuku'alofa
Trinidad and Tobago—Furness House, 90 Independence Square, Port of Spain.
Western Samoa—Beach Road (P.O. Box 208), Apia.
Australia—Consulates-General, United Insurance Building, corner George and Hunter Streets, Sydney, N.S.W. 2000 (G.P.O. Box 365, Sydney, N.S.W. 2001).
Greece—Consulate-General, Leoforos Vasilissis Sophias 29, Athens T.T. 138.
Hong Kong—New Zealand Commission, 3414 Connaught Centre, Connaught Road.
New Caledonia—Consulate-General, 4 Boulevard Vauban, Noumea.
O.E.C.D.—New Zealand Mission, 7 Ter, Rue Leonard De Vinci, 75116, Paris.
Papua-New Guinea—ANE House, Hunter Street, Port Moresby (P.O. Box 1144, Boroko).
South-East Asia Treaty Organisation—Council Representative, Anglo-Thai Building, 64 Silom Road, Bangkok.
Switzerland—Consulate-General, 28B Chemin du Petit-Saconnex, 1209 Geneva 19.
United Nations—New Zealand Mission, 733 Third Avenue, New York, N.Y., 10017.
New Zealand Mission, 28B Chemin du Petit-Saconnex, 1209, Geneva 19.
United States—Consulate-General, 630 Fifth Avenue, New York, N.Y., 10020.
Consulate-General, Alcoa Building, 1 Maritime Plaza, San Francisco, CA.94111.
Consulate-General, Tishman Building, 10960 Wilshire Boulevard, Los Angeles, CA.90024.
Argentina—Embassy of the Argentine Republic, Government Life Insurance Building, Customhouse Quay, Wellington.
Australia—Australian High Commission, I.C.I. House, Molesworth Street, Wellington.
Austria—Hon. Consulate-General, Wool House, 139 Featherston Street, Wellington.
Belgium—Embassy of Belgium, Dominion Farmers Institute, Featherston Street, Wellington.
Brazil—Hon. Consul, 5 Elliott Street, Auckland.
Britain—British High Commission, Reserve Bank Building, 2 The Terrace, Wellington. Auckland Office, Norwich Union Building, Queen Street, Auckland 1.
Canada—Canadian High Commission, I.C.I. House, Molesworth Street, Wellington.
Chile—Embassy of the Republic of Chile, Europa House, Wellington.
China, People's Republic of—2-6 Glenmore Street, Wellington.
Costa Rica—Consul-General, 2-12 Parnell Road, Auckland.
Czechoslovakia—Legation of Czechoslovakia Socialist Republic, 12 Anne Street, Wellington.
Denmark—Hon.Consul, Challenge House, 105-109 The Terrace, Wellington.
Hon. Consul, Princes Court, Princes Street, Auckland.
Hon. Consul, Commercial Building, The Square, Palmerston North.
Hon. Consul, 100 Cumnor Terrace, Woolston, Christchurch.
Hon. Vice-Consul, 12-20 St. Andrew Street, Dunedin.
Ecuador—Hon. Consul, General Buildings, Waring Taylor Street, Wellington.
El Salvador—Hon. Consul, Gladstone Building, 5 Anzac Street, Takapuna, Auckland.
Fiji—New Zealand Agents for Fiji. L. D. Nathan and Co. Ltd., Fort Street, Auckland.
Finland—Hon. Consul, Challenge House, 105-109 The Terrace, Wellington.
Hon. Consul, Enfield Street, Auckland 3.
Hon. Consul, 6-8 Kingsley Street, Sydenham, Christchurch.
France—Embassy of France, Northern Building Society Building, 105 Customhouse Quay, Wellington.
Hon. Consul, corner of Princes Street and Eden Crescent, Auckland 1.
Hon. Consul, 904-908 Colombo Street, Christchurch.
Hon. Consul, Corner French and Robert Streets, Dunedin.
Germany, West—Embassy of the Federal Republic of Germany, 3 Claremont Grove, Wellington. Hon. Consul, Colombus House, 14-18 Customs Street East, Auckland 1.
Greece—Hon. Consul-General, 270 Wakefield Street, Wellington.
Hon. Consul, Prudential Building, 9 Manukau Road, Epsom, Auckland.
Holy See—Apostolic Nunciature, 112 Queen's Drive, Lyall Bay, Wellington 3.
India—High Commission for India, 49 Willis Street, Wellington.
Indonesia—Embassy of the Republic of Indonesia, 11 Fitzherbert Terrace, Wellington 1.
Italy—Embassy of Italy, 24 Grant Road, Wellington.
Hon. Consular Agent, Victoria Arcade, Queen Street, Auckland.
Hon. Consular Agent, 68 Lichfield Street, Christchurch.
Hon. Consular Agent, 353 Trafalgar Square, Nelson.
Hon. Consular Agent, 356 High Street, Dunedin.
Japan—Embassy of Japan, 18A Oriental Parade, Wellington.
Consulate-General of Japan, Bank of New South Wales Building, 45 Queen Street, Auckland.
Hon. Consul, J. Pallot and Co. Ltd., Christchurch.
Korea—Embassy of the Republic of Korea, Molesworth House, Molesworth Street, Wellington. Hon. Consul, Rainger House, 150 Victoria Street West, Auckland.
Malaysia—High Commission, 200 Oriental Parade, Wellington.
Mexico—Hon. Consul, Tatra House 96 Tory St., Wellington 1.
Netherlands—Royal Netherlands Embassy, Shell House, The Terrace, Wellington.
Hon. Consul, 83 Customs Street East, Auckland.
Hon. Consul, 28 Hereford Street, Christchurch.
Norway—Hon. Consul-General, 38-42 Waring Taylor Street, Wellington.
Hon. Consul, 13 Brighton Terrace, Mairangi Bay. Auckland.
Hon. Vice-Consul, Corner of Colombo and Lichfield Streets, Christchurch.
Hon. Vice-Consul, 365 Princes Street, Dunedin.
Papua New Guinea—Papua New Guinea Government Commission, Construction House, 82 Kent Terrace, Wellington.
Philippines—Hon. Consul, Wilson and Horton Ltd., Corner of Queen and Wynd Streets, Auckland.
Poland—Embassy of the Polish People's Republic, 1 Heaton Terrace, Wellington.
Portugal—Hon. Consul, L. D. Nathan, P.O. Box 190, Auckland.
Hon. Consul, Challenge House, 105-109 The Terrace, Wellington.
Hon. Vice-Consul, Midland Street, Dunedin.
Romania—Consul-General, 100 Evans Bay Parade, Wellington.
Singapore—High Commission, Molesworth House, Molesworth Street, Wellington.
South Africa—Consul-General, Federation House, 95-99 Molesworth Street, Wellington.
Sri Lanka—Hon. Trade Commissioner, Huddart Parker Building, Wellington.
Sweden—Royal Swedish Embassy, 48 The Terrace, Wellington.
Hon. Consul. Church Street, Onehunga, Auckland 6
Hon. Vice-Consul, 154 Hereford Street, Christchurch.
Hon. Vice-Consul, 40 Jetty Street, Dunedin.
Hon. Vice-Consul, 98 Layard Street, Invercargill.
Switzerland—Embassy of Switzerland, Panama House, 22-24 Panama Street, Wellington.
Hon. Consular Agent, 48 Carr Road, Mount Roskill, Auckland.
Thailand—Royal Thai Embassy, 2 Burnell Avenue, Wellington.
Tonga—New Zealand Agents for the Government of Tonga, Beachcroft Avenue, Auckland 6.
Turkey—Hon. Consul-General, 228 Queen Street, Auckland.
U.S.S.R.—Embassy of the Union of Soviet Socialist Republics, 57 Messines Road, Karori, Wellington.
U.S.A.—Embassy, I.B.M. Centre, 151 The Terrace, Wellington 1.
Consul-General, A.M.P. Building, Queen Street East, Auckland.
Hon. Consular Agent, 311 Manchester Street, Christchurch.
Venezuela—Hon. Consul, Brooklyn Flats, Emily Place, Auckland.
Vietnam—Embassy of the Republic of Vietnam, 40 Panama Street, Wellington.
Western Samoa—Trade and Development Office, 7 Fanshawe Street, Auckland 1.
Yugoslavia—Embassy of the Socialist Federal Republic of Yugoslavia, 49 Hobson Street, Wellington. Countries with diplomatic representation in Canberra, Australia, with responsibility for New Zealand are: Arab Republic of Egypt, Austria, Bangladesh, Brazil, Burma, Denmark, Finland, German Democratic Republic, Greece, Iran, Ireland, Israel, Khmer Republic, Laos, Mexico, Norway, Pakistan, Peru, Philippines, Spain, and Sri Lanka.
There are official trade commissioners at the diplomatic missions in Canberra, Sydney, Melbourne, Trinidad and Tabago, London, Athens, Hong Kong, Tokyo, Kuala Lumpur, Singapore, New York, San Francisco, Los Angeles, Lima, Santiago, Brussels, Paris, Bonn, Rome, Vienna, Moscow, New Delhi, Peking, Noumea, Suva, Jakarta, and Bangkok at the addresses given on a preceding page.
Address of additional official trade commissioners and other representatives are as follows:
American Samoa—Trade Correspondent, Air New Zealand Ltd., Fagatogo (P.O. Box 697), Pago Pago.
Australia—Watkins Place Building, 288 Edward Street, Brisbane Q.L.D. 4001 (G.P.O. Box 62).
Fifth Floor, St. George's Court, 16 St. George's Terrace, Perth W.A. 6001.
Barbados—Resident in Trinidad.
Canada—Suite 2616, 2 Bloor Street East, Toronto. Ontario M4W 1AS.
Toronto Dominion Bank Tower, Vancouver V.Z.Y. 136 B.C.
Guyana—Resident in Trinidad.
Ireland—Resident in London.
Jamaica—Resident in Trinidad.
Korea—Resident in Tokyo.
Nepal—Resident in New Delhi.
Netherlands—Resident in Brussels.
Pacific—Resident in Fiji. (P.O. Box 1378, Suva).
Philippines—Resident in Hong Kong.
Sri Lanka—Resident in New Delhi.
Tahiti—Trade Correspondent, Air New Zealand Ltd., James Norman Hall Building, Rue du General de Gaulle, P.O. Box 73, Papeete.
Tonga—Resident in Suva.
U.S.A.—Suite 600, 1707L Street, N.W., Washington D.C., 20036.
Trade Correspondent, Air New Zealand Ltd., Suite 1700, Waikiki Business Plaza, 2270 Kala Kaua Avenue, Waikiki, H.A. 96815.
Western Samoa—Resident in Suva.
Fuller information and also details of official overseas trade representation in New Zealand are set out in the booklet Overseas Representatives in New Zealand and New Zealand Representatives Overseas published by the Ministry of Foreign Affairs, Wellington.
| TOTAL POPULATION AND EXTERNAL MIGRATION | ||||||
|---|---|---|---|---|---|---|
| Year | Population† | Mean Population† | Natural Increase | Net Migration* | ||
| At 31 March | At 31 December | Year Ended 31 March | Year Ended 31 December | Year Ended 31 December | Year Ended 31 March | |
*Excluding tourists on cruising liners and members of armed forces, etc. †Does not include armed forces personnel overseas. | ||||||
| 1924 | 1,347,853 | 1,370,403 | 1,334,029 | 1,352,618 | 17,720 | 5,767 |
| 1925 | 1,379,487 | 1,401,230 | 1,359,995 | 1,384,428 | 18,025 | 12,298 |
| 1926 | 1,409,812 | 1,429,669 | 1,392,073 | 1,413,743 | 17,387 | 11,735 |
| 1927 | 1,438,132 | 1,450,356 | 1,420,838 | 1,439,004 | 16,678 | 11,664 |
| 1928 | 1,453,821 | 1,467,370 | 1,443,551 | 1,456,075 | 16,078 | - 1,235 |
| 1929 | 1,471,110 | 1,486,134 | 1,460,363 | 1,473,419 | 15,639 | 711 |
| 1930 | 1,489,203 | 1,506,809 | 1,478,027 | 1,493,019 | 15,677 | 2,385 |
| 1931 | 1,511,700 | 1,522,762 | 1,498,416 | 1,514,215 | 15,805 | 5,109 |
| 1932 | 1,525,545 | 1,534,735 | 1,517,940 | 1,527,062 | 14,660 | - 3,172 |
| 1933 | 1,538,028 | 1,547,124 | 1,530,119 | 1,539,590 | 14,342 | - 2,595 |
| 1934 | 1,550,125 | 1,558,373 | 1,542,651 | 1,551,532 | 13,410 | - 2,335 |
| 1935 | 1,560,992 | 1,569,689 | 1,554,297 | 1,562,233 | 13,486 | - 3,150 |
| 1936 | 1,573,927 | 1,584,617 | 1,565,263 | 1,575,231 | 13,737 | - 1,114 |
| 1937 | 1,587,211 | 1,601,758 | 1,578,757 | 1,589,972 | 14,681 | - 353 |
| 1938 | 1,604,479 | 1,618,313 | 1,594,275 | 1,606,763 | 13,971 | 2,386 |
| 1939 | 1,624,714 | 1,641,639 | 1,611,362 | 1,628,512 | 16,939 | 4,963 |
| 1940 | 1,640,901 | 1,633,645 | 1,633,447 | 1,637,305 | 21,070 | 6,028 |
| 1941 | 1,636,230 | 1,631,276 | 1,635,715 | 1,630,948 | 22,123 | 714 |
| 1942 | 1,634,338 | 1,636,403 | 1,630,419 | 1,639,572 | 19,701 | 209 |
| 1943 | 1,634,094 | 1,642,041 | 1,640,191 | 1,635,635 | 17,562 | 541 |
| 1944 | 1,643,900 | 1,676,286 | 1,637,570 | 1,655,795 | 20,988 | 107 |
| 1945 | 1,679,972 | 1,727,817 | 1,664,585 | 1,694,641 | 23,848 | 1,018 |
| 1946 | 1,756,756 | 1,781,214 | 1,710,680 | 1,759,526 | 29,804 | 2,343 |
| 1947 | 1,789,476 | 1,817,453 | 1,770,291 | 1,798,262 | 32,256 | 3,038 |
| 1948 | 1,828,025 | 1,853,806 | 1,807,611 | 1,834,655 | 31,777 | 5,756 |
| 1949 | 1,864,560 | 1,892,042 | 1,843,767 | 1,871,748 | 31,263 | 4,181 |
| 1950 | 1,902,883 | 1,927,629 | 1,881,317 | 1,909,092 | 31,247 | 7,880 |
| 1951 | 1,938,032 | 1,970,522 | 1,917,934 | 1,947,529 | 30,970 | 7,522 |
| 1952 | 1,984,730 | 2,024,556 | 1,958,729 | 1,996,149 | 32,950 | 15,664 |
| 1953 | 2,037,553 | 2,074,781 | 2,009,506 | 2,048,826 | 33,534 | 22,032 |
| 1954 | 2,087,740 | 2,118,434 | 2,061,376 | 2,094,910 | 35,179 | 15,441 |
| 1955 | 2,130,927 | 2,164,734 | 2,105,767 | 2,138,946 | 36,371 | 7,030 |
| 1956 | 2,175,373 | 2,209,132 | 2,150,290 | 2,182,833 | 36,835 | 8,092 |
| 1957 | 2,221,169 | 2,262,814 | 2,194,108 | 2,232,591 | 37,563 | 11,492 |
| 1958 | 2,275,515 | 2,315,900 | 2,246,093 | 2,285,852 | 40,255 | 15,408 |
| 1959 | 2,326,129 | 2,359,746 | 2,298,814 | 2,334,617 | 40,670 | 9,992 |
| 1960 | 2,370,166 | 2,403,567 | 2,345,602 | 2,377,010 | 41,887 | 3,213 |
| 1961 | 2,414,296 | 2,461,243 | 2,388,004 | 2,426,654 | 43,608 | 1,620 |
| 1962 | 2,474,588 | 2,515,835 | 2,441,400 | 2,484,873 | 42,933 | 18,832 |
| 1963 | 2,527,868 | 2,566,915 | 2,498,357 | 2,536,912 | 42,111 | 13,639 |
| 1964 | 2,582,407 | 2,616,970 | 2,550,114 | 2,589,150 | 39,441 | 15,484 |
| 1965 | 2,628,900 | 2,663,843 | 2,601,219 | 2,635,352 | 37,071 | 11,991 |
| 1966 | 2,676,778 | 2,711,318 | 2,647,196 | 2,682,604 | 36,225 | 12,021 |
| 1967 | 2,725,914 | 2,744,963 | 2,694,680 | 2,727,658 | 38,015 | 14,435 |
| 1968 | 2,752,662 | 2,772,933 | 2,735,207 | 2,753,512 | 37,648 | - 8,090 |
| 1969 | 2,777,210 | 2,804,059 | 2,760,077 | 2,780,101 | 38,199 | - 10,848 |
| 1970 | 2,815,987 | 2,852,137 | 2,788,839 | 2,819,602 | 37,210 | - 2,060 |
| 1971 | 2,860,873 | 2,899,067 | 2,831,222 | 2,864,392 | 40,151 | 7,845 |
| 1972 | 2,909,916 | 2,960,996 | 2,876,388 | 2,916,572 | 38,414 | 10,851 |
| 1973 | 2,974,659 | 3,026,930 | 2,932,406 | 2,978,676 | 35,415 | 25,475 |
| 1974 | 3,042,800 | 3,094,900 | 2,995,400 | 3,044,800 | 34,076 | 33,167 |
| 1975 | 3,105,400 | .. | 3,060,400 | .. | .. | 29,141 |
| VITAL STATISTICS | ||||||||
|---|---|---|---|---|---|---|---|---|
| Year | Numbers | Rates per 1,000 of Mean Population | Deaths Under 1 Year per 1,000 Live Births* | Marriages | ||||
| Live Births* | Deaths | Deaths Under 1 Year | Live Births* | Deaths | Number | Rate per 1,000 of Mean Population | ||
| *Figures from 1926 have been revised to exclude registrations under Section 24 of the Births and Deaths Registration Act 1925 and Section 14 of the Births and Deaths Registration Act 1951 (late registration). | ||||||||
| 1924 | 29,260 | 11,540 | .. | 21.63 | 8.53 | .. | 10,502 | 7.76 |
| 1925 | 29,869 | 11,844 | 1,309 | 21.57 | 8.56 | 43.82 | 10,817 | 7.81 |
| 1926 | 29,904 | 12,517 | 1,312 | 21.15 | 8.85 | 43.87 | 10,994 | 7.78 |
| 1927 | 29,278 | 12,600 | 1,316 | 20.35 | 8.76 | 44.95 | 10,796 | 7.50 |
| 1928 | 28,938 | 12,860 | 1,166 | 19.87 | 8.83 | 40.29 | 10,919 | 7.50 |
| 1929 | 28,859 | 13,220 | 1,086 | 19.59 | 8.97 | 37.63 | 11,403 | 7.74 |
| 1930 | 28,822 | 13,145 | 1,112 | 19.30 | 8.80 | 38.58 | 11,494 | 7.70 |
| 1931 | 28,867 | 13,062 | 1,077 | 19.06 | 8.63 | 37.31 | 10,254 | 6.77 |
| 1932 | 27,535 | 12,875 | 1,039 | 18.03 | 8.43 | 37.73 | 10,492 | 6.87 |
| 1933 | 27,204 | 12,862 | 1,043 | 17.67 | 8.35 | 38.34 | 11,067 | 7.19 |
| 1934 | 27,220 | 13,810 | 1,060 | 17.54 | 8.90 | 38.94 | 11,788 | 7.60 |
| 1935 | 27,150 | 13,664 | 1,128 | 17.38 | 8.74 | 41.55 | 12,744 | 8.16 |
| 1936 | 28,395 | 14,658 | 1,168 | 18.03 | 9.31 | 41.13 | 14,448 | 9.17 |
| 1937 | 29,896 | 15,215 | 1,178 | 18.80 | 9.57 | 39.40 | 14,973 | 9.42 |
| 1938 | 30,845 | 16,874 | 1,537 | 19.20 | 10.50 | 49.83 | 15,959 | 9.93 |
| 1939 | 32,872 | 15,933 | 1,371 | 20.19 | 9.78 | 41.71 | 17,791 | 10.92 |
| 1940 | 36,945 | 15,875 | 1,362 | 22.56 | 9.70 | 36.87 | 18,084 | 11.04 |
| 1941 | 39,170 | 17,047 | 1,562 | 24.02 | 10.45 | 39.88 | 13,830 | 8.48 |
| 1942 | 37,818 | 18,117 | 1,388 | 23.07 | 11.05 | 36.70 | 12,775 | 7.79 |
| 1943 | 34,684 | 17,122 | 1,350 | 21.21 | 10.47 | 38.92 | 12,021 | 7.35 |
| 1944 | 38,037 | 17,049 | 1,473 | 22.97 | 10.30 | 38.73 | 13,646 | 8.24 |
| 1945 | 41,534 | 17,686 | 1,449 | 24.51 | 10.44 | 34.89 | 16,693 | 9.85 |
| 1946 | 47,524 | 17,720 | 1,524 | 27.01 | 10.07 | 32.07 | 21,096 | 11.99 |
| 1947 | 49,698 | 17,442 | 1,487 | 27.64 | 9.70 | 29.92 | 19,047 | 10.59 |
| 1948 | 49,062 | 17,285 | 1,350 | 26,74 | 9.42 | 27.52 | 17,750 | 9.67 |
| 1949 | 48,841 | 17,578 | 1,468 | 26.09 | 9.39 | 30.06 | 17,354 | 9.27 |
| 1950 | 49,331 | 18,084 | 1,364 | 25.84 | 9.47 | 27.65 | 17,099 | 8.96 |
| 1951 | 49,806 | 18,836 | 1,374 | 25.57 | 9.67 | 27.59 | 16,915 | 8.69 |
| 1952 | 51,846 | 18,896 | 1,475 | 25.97 | 9.47 | 28.45 | 17,061 | 8.55 |
| 1953 | 51,888 | 18,354 | 1,335 | 25.33 | 8.96 | 25.73 | 17,224 | 8.41 |
| 1954 | 54,055 | 18,876 | 1,302 | 25.80 | 9.01 | 24.09 | 17,557 | 8.38 |
| 1955 | 55,596 | 19,225 | 1,365 | 25.99 | 8.99 | 24.55 | 17,795 | 8.32 |
| 1956 | 56,531 | 19,696 | 1,313 | 25.90 | 9.02 | 23.23 | 17,531 | 8.03 |
| 1957 | 58,425 | 20,862 | 1,420 | 26.17 | 9.34 | 24.30 | 17,614 | 7.89 |
| 1958 | 60,556 | 20,301 | 1,416 | 26.49 | 8.88 | 23.38 | 18,305 | 8.01 |
| 1959 | 61,798 | 21,128 | 1,477 | 26.47 | 9.05 | 23.90 | 18,315 | 7.84 |
| 1960 | 62,779 | 20,892 | 1,420 | 26.41 | 8.79 | 22.62 | 18,909 | 7.96 |
| 1961 | 65,390 | 21,782 | 1,490 | 26.95 | 8.98 | 22.79 | 19,426 | 8.01 |
| 1962 | 65,014 | 22,081 | 1,331 | 26.16 | 8.89 | 20.47 | 19,572 | 7.88 |
| 1963 | 64,527 | 22,416 | 1,269 | 25.44 | 8.84 | 19.67 | 19,856 | 7.83 |
| 1964 | 62,302 | 22,861 | 1,193 | 24.06 | 8.83 | 19.15 | 20,720 | 8.00 |
| 1965 | 60,047 | 22,976 | 1,174 | 22.79 | 8.72 | 19.55 | 21,702 | 8.23 |
| 1966 | 60,003 | 23,778 | 1,064 | 22.37 | 8.86 | 17.73 | 22,949 | 8.55 |
| 1967 | 61,022 | 23,007 | 1,102 | 22.37 | 8.43 | 18.06 | 23,515 | 8.62 |
| 1968 | 62,112 | 24,464 | 1,164 | 22.56 | 8.88 | 18.74 | 24,057 | 8.74 |
| 1969 | 62,360 | 24,161 | 1,057 | 22.43 | 8.69 | 16.95 | 24,971 | 8.98 |
| 1970 | 62,050 | 24,840 | 1,040 | 22.01 | 8.81 | 16.76 | 25,953 | 9.20 |
| 1971 | 64,460 | 24,309 | 1,066 | 22.50 | 8.49 | 16.54 | 27,199 | 9.50 |
| 1972 | 63,215 | 24,801 | 988 | 21.67 | 8.50 | 15.63 | 26,868 | 9.21 |
| 1973 | 60,727 | 25,312 | 985 | 20.39 | 8.50 | 16.22 | 26,274 | 8.82 |
| 1974 | 59,336 | 25,261 | 922 | 19.49 | 8.30 | 15.54 | 25,412 | 8.35 |
| EDUCATION | |||||||
|---|---|---|---|---|---|---|---|
| Roll Numbers at Educational Institutions | |||||||
| At 1 July* | Primary | Secondary | Higher | ||||
| State Schools | Registered Private Schools | State Schools | Registered Private Schools | Technical Institutes (Full-time Students) | Teachers' Colleges | University Institutions (Including Extra-mural and Part-time Students) | |
| *Figures earlier than 1928 are for December. | |||||||
| 1924 | 220,078 | 26,302 | 20,279 | 2,473 | .. | 1,274 | 4,236 |
| 1925 | 221,449 | 25,933 | 20,782 | 2,511 | .. | 1,271 | 4,442 |
| 1926 | 225,608 | 26,778 | 22,650 | 2,794 | .. | 1,198 | 4,653 |
| 1927 | 227,777 | 27,358 | 23,474 | 2,932 | .. | 1,200 | 4,878 |
| 1928 | 221,169 | 26,394 | 27,084 | 3,506 | .. | 1,115 | 4,802 |
| 1929 | 220,347 | 26,556 | 28,513 | 3,877 | .. | 1,188 | 4,623 |
| 1930 | 219,274 | 26,617 | 29,284 | 4,513 | .. | 1,155 | 4,801 |
| 1931 | 220,976 | 26,448 | 31,053 | 4,602 | .. | 1,165 | 5,111 |
| 1932 | 217,236 | 26,390 | 30,944 | 4,512 | .. | 990 | 5,171 |
| 1933 | 203,589 | 26,097 | 30,473 | 4,315 | .. | 443 | 5,085 |
| 1934 | 201,870 | 26,584 | 30,915 | 4,430 | .. | .. | 5,059 |
| 1935 | 200,135 | 26,923 | 31,611 | 4,743 | .. | 429 | 5,101 |
| 1936 | 213,497 | 27,540 | 31,894 | 5,108 | .. | 1,185 | 5,218 |
| 1937 | 212,076 | 27,507 | 32,115 | 5,595 | .. | 1,346 | 5,238 |
| 1938 | 209,961 | 28,271 | 34,345 | 6,059 | .. | 1,522 | 5,707 |
| 1939 | 208,641 | 27,972 | 35,692 | 6,266 | .. | 1,588 | 5,979 |
| 1940 | 208,433 | 27,868 | 35,273 | 6,379 | .. | 1,457 | 5,528 |
| 1941 | 208,595 | 27,836 | 33,253 | 6,451 | .. | 1,503 | 5,065 |
| 1942 | 208,721 | 26,983 | 32,391 | 6,483 | .. | 1,463 | 4,373 |
| 1943 | 206,884 | 28,521 | 34,893 | 7,184 | .. | 1,775 | 5,953 |
| 1944 | 207,292 | 29,223 | 40,723 | 8,121 | .. | 1,678 | 7,267 |
| 1945 | 211,742 | 29,583 | 44,279 | 8,933 | .. | 1,431 | 8,425 |
| 1946 | 218,129 | 30,581 | 44,985 | 9,424 | .. | 1,575 | 11,361 |
| 1947 | 229,804 | 31,929 | 45,249 | 9,968 | .. | 1,634 | 11,874 |
| 1948 | 235,243 | 32,818 | 45,109 | 9,793 | .. | 1,875 | 11,964 |
| 1949 | 244,377 | 33,941 | 46,512 | 10,243 | .. | 2,321 | 11,598 |
| 1950 | 254,664 | 35,775 | 48,232 | 10,511 | .. | 2,684 | 11,515 |
| 1951 | 265,230 | 37,109 | 50,682 | 11,045 | .. | 2,704 | 10,956 |
| 1952 | 282,699 | 39,342 | 54,124 | 11,622 | .. | 2,710 | 10,691 |
| 1953 | 298,481 | 41,277 | 59,558 | 12,476 | .. | 2,769 | 10,831 |
| 1954 | 311,541 | 42,797 | 66,344 | 13,627 | .. | 2,834 | 10,803 |
| 1955 | 320,580 | 44,086 | 72,117 | 14,970 | .. | 2,847 | 10,851 |
| 1956 | 332,049 | 46,261 | 75,354 | 15,832 | .. | 2,963 | 11,077 |
| 1957 | 344,959 | 47,953 | 78,843 | 16,265 | .. | 3,218 | 11,761 |
| 1958 | 356,224 | 48,418 | 82,699 | 16,984 | .. | 3,602 | 12,881 |
| 1959 | 365,761 | 51,549 | 89,508 | 17,663 | .. | 3,753 | 14,388 |
| 1960 | 371,825 | 52,887 | 99,365 | 19,293 | 71 | 3,838 | 15,809 |
| 1961 | 376,475 | 54,079 | 109,632 | 20,752 | 221 | 3,814 | 16,820 |
| 1962 | 384,313 | 55,293 | 118,523 | 22,290 | 441 | 4,223 | 17,214 |
| 1963 | 392,595 | 56,341 | 124,978 | 23,603 | 532 | 4,536 | 18,303 |
| 1964 | 404,257 | 57,154 | 128,709 | 24,439 | 620 | 4,691 | 19,640 |
| 1965 | 415,582 | 57,244 | 132,094 | 25,073 | 857 | 4,790 | 22,145 |
| 1966 | 429,916 | 56,050 | 136,104 | 25,585 | 1,163 | 5,022 | 24,302 |
| 1967 | 445,045 | 54,910 | 141,922 | 26,232 | 1,355 | 5,156 | 26,313 |
| 1968 | 455,119 | 53,782 | 152,422 | 27,020 | 1,485 | 6,096 | 28,821 |
| 1969 | 461,305 | 52,407 | 155,873 | 27,910 | 1,661 | 6,912 | 31,494 |
| 1970 | 465,460 | 50,904 | 157,797 | 28,441 | 1,882 | 7,587 | 34,446 |
| 1971 | 467,097 | 51,009 | 160,839 | 29,267 | 2,236 | 7,791 | 37,257 |
| 1972 | 468,692 | 50,859 | 166,851 | 29,804 | 3,118 | 8,083 | 38,482 |
| 1973 | 470,273 | 50,711 | 171,978 | 30,201 | 3,378 | 7,811x | 38,995 |
| 1974 | 473,099 | 50,574 | 177,582 | 31,014 | 3,561 | 7,616 | 39,949 |
| JUSTICE | ||||||
|---|---|---|---|---|---|---|
| Year | Magistrates' Courts* | Supreme Court† | Prisoners in Jail at End of Year (Undergoing Sentence) | |||
| Summary Convictions | Rate per 1,000 of Mean Population | Persons Sentenced | Rate per 1,000 of Mean Population | Number | Rate per 1,000 of Population | |
*Revised series. Excludes minor traffic offences as well as applications for prohibition, affiliation, maintenance and separation orders. †Change in legislation resulting in more offences dealt with in Magistrates' Courts. | ||||||
| 1924 | 27,559 | 20.37 | 555 | 0.41 | 1,197 | 0.87 |
| 1925 | 28,867 | 20.85 | 511 | 0.37 | 1,284 | 0.92 |
| 1926 | 25,759 | 18.22 | 569 | 0.40 | 1,388 | 0.97 |
| 1927 | 26,113 | 18.15 | 569 | 0.40 | 1,483 | 1.02 |
| 1928 | 24,508 | 16.83 | 478 | 0.33 | 1,435 | 0.98 |
| 1929 | 25,186 | 17.10 | 473 | 0.32 | 1,342 | 0.90 |
| 1930 | 25,192 | 16.87 | 538 | 0.36 | 1,523 | 1.01 |
| 1931 | 23,259 | 15.36 | 600 | 0.40 | 1,614 | 1.06 |
| 1932 | 23,236 | 15.22 | 636 | 0.42 | 1,522 | 0.99 |
| 1933 | 20,355 | 13.22 | 531 | 0.34 | 1,410 | 0.91 |
| 1934 | 19,654 | 12.67 | 490 | 0.32 | 1,199 | 0.77 |
| 1935 | 19,672 | 12.59 | 472 | 0.30 | 1,112 | 0.71 |
| 1936 | 21,450 | 13.62 | 462 | 0.29 | 915 | 0.58 |
| 1937 | 23,563 | 14.82 | 507 | 0.32 | 790 | 0.49 |
| 1938 | 23,762 | 14.78 | 488 | 0.30 | 777 | 0.48 |
| 1939 | 24,774 | 15.21 | 571 | 0.35 | 895 | 0.55 |
| 1940 | 25,670 | 15.67 | 547 | 0.33 | 863 | 0.53 |
| 1941 | 24,529 | 15.04 | 542 | 0.33 | 988 | 0.61 |
| 1942 | .. | .. | 457 | 0.28 | 1,304 | 0.63 |
| 1943 | .. | .. | 494 | 0.30 | 1,024 | 0.62 |
| 1944 | .. | .. | 560 | 0.34 | 945 | 0.56 |
| 1945 | .. | .. | 619 | 0.37 | 998 | 0.58 |
| 1946 | .. | .. | 655 | 0.37 | 992 | 0.56 |
| 1947 | 20,187 | 11.22 | 740 | 0.41 | 1,088 | 0.60 |
| 1948 | 21,910 | 11.94 | 717 | 0.39 | 986 | 0.53 |
| 1949 | 22,021 | 11.76 | 676 | 0.36 | 941 | 0.50 |
| 1950 | 21,102 | 11.05 | 642 | 0.34 | 1,043 | 0.54 |
| 1951 | 22,409 | 11.50 | 644 | 0.33 | 1,040 | 0.53 |
| 1952 | 27,151 | 13.60 | 704 | 0.35 | 1,083 | 0.54 |
| 1953 | 28,994 | 14.15 | 179† | 0.09 | 1,088 | 0.52 |
| 1954 | 31,488 | 15.03 | 148† | 0.07 | 1,196 | 0.57 |
| 1955 | 32,444 | 15.16 | 147† | 0.07 | 1,118 | 0.52 |
| 1956 | 35,302 | 16.17 | 204† | 0.09 | 1,362 | 0.62 |
| 1957 | 36,969 | 16.55 | 199† | 0.09 | 1,474 | 0.66 |
| 1958 | 35,393 | 15.48 | 206† | 0.09 | 1,642 | 0.72 |
| 1959 | 31,837 | 13.36 | 212† | 0.09 | 1,714 | 0.73 |
| 1960 | 33,970 | 14.29 | 286† | 0.12 | 1,777 | 0.75 |
| 1961 | 35,318 | 14.55 | 294† | 0.12 | 1,818 | 0.75 |
| 1962 | 38,312 | 15.41 | 265† | 0.12 | 1,707 | 0.69 |
| 1963 | 39,128 | 15.42 | 309† | 0.12 | 1,765 | 0.69 |
| 1964 | 39,549 | 15.24 | 242† | 0.09 | 1,689 | 0.65 |
| 1965 | 39,965 | 15.16 | 304† | 0.12 | 1,653 | 0.63 |
| 1966 | 42,149 | 15.70 | 280† | 0.10 | 1,898 | 0.71 |
| 1967 | 47,491 | 17.40 | 318† | 0.12 | 1,983 | 0.73 |
| 1968 | 52,351 | 19.01 | 351† | 0.13 | 2,023 | 0.73 |
| 1969 | 54,010 | 19.42 | 314† | 0.11 | 1,967 | 0.71 |
| 1970 | 55,560 | 19.70 | 360† | 0.13 | 2,365 | 0.84 |
| 1971 | 61,701 | 21.54 | 404† | 0.14 | 2,636 | 0.92 |
| 1972 | 65,274x | 22.38x | 476† | 0.16 | 2,531 | 0.87 |
| 1973 | 68,477 | 22.57 | 474† | 0.16 | 2,567 | 0.86 |
| POSTAL AND TELECOMMUNICATIONS | |||||||
|---|---|---|---|---|---|---|---|
| Year Ended 31 March | Mail Posted* | Telephones† | Tolls | Telegrams | Money Orders and Postal Notes* | Revenue | Expenditure |
*Calendar year until 1945. †Installed as at 31 March. At 31 March 1974 there were 933,883 subscribers. | |||||||
| million | (000) | million | million | million | $(m) | $(m) | |
| 1924 | 214 | 111.4 | 8.0 | 6.0 | 3.6 | .. | .. |
| 1925 | 236 | 120.1 | 8.6 | 6.3 | 3.8 | .. | .. |
| 1926 | 243 | 130.2 | 9.0 | 6.7 | 4.1 | .. | .. |
| 1927 | 248 | 137.3 | 9.3 | 6.4 | 4.4 | .. | .. |
| 1928 | 259 | 144.6 | 9.7 | 6.2 | 4.4 | .. | .. |
| 1929 | 266 | 152.5 | 10.7 | 6.3 | 4.7 | 6.8 | 6.8 |
| 1930 | 271 | 161.3 | 11.4 | 6.0 | 4.7 | 7.3 | 7.2 |
| 1931 | 233 | 161.7 | 10.7 | 5.5 | 3.6 | 7.4 | 7.4 |
| 1932 | 218 | 160.8 | 9.5 | 3.9 | 3.3 | 7.5 | 6.7 |
| 1933 | 231 | 155.6 | 9.0 | 3.4 | 3.5 | 6.6 | 6.5 |
| 1934 | 243 | 155.1 | 9.1 | 3.5 | 4.0 | 6.4 | 6.4 |
| 1935 | 263 | 159.1 | 9.9 | 3.4 | 4.5 | 6.6 | 6.6 |
| 1936 | 267 | 166.6 | 11.4 | 3.8 | 4.6 | 7.1 | 7.1 |
| 1937 | 274 | 178.6 | 13.1 | 4.3 | 4.5 | 7.8 | 7.7 |
| 1938 | 304 | 192.0 | 14.5 | 4.6 | 4.7 | 8.5 | 8.5 |
| 1939 | 296 | 206.2 | 15.6 | 4.9 | 4.3 | 9.1 | 9.1 |
| 1940 | 266 | 217.9 | 15.7 | 4.5 | 3.4 | 9.7 | 9.2 |
| 1941 | 262 | 228.3 | 16.1 | 4.2 | 3.2 | 10.1 | 9.6 |
| 1942 | .. | 235.4 | 16.9 | 4.5 | 3.1 | 10.5 | 10.0 |
| 1943 | .. | 238.4 | 17.6 | 5.7 | 3.0 | 11.2 | 10.4 |
| 1944 | .. | 244.8 | 18.1 | 6.3 | 3.0 | 11.8 | 10.3 |
| 1945 | 237 | 256.7 | 19.5 | 6.5 | 3.0 | 12.6 | 11.8 |
| 1946 | .. | 265.8 | 21.0 | 7.3 | .. | 13.3 | 12.7 |
| 1947 | 294 | 282.3 | 22.7 | 7.1 | 3.3 | 16.4 | 14.3 |
| 1948 | 301 | 300.6 | 23.9 | 6.7 | 3.4 | 17.1 | 16.4 |
| 1949 | 319 | 322.8 | 25.3 | 6.7 | 3.4 | 18.0 | 18.0 |
| 1950 | 343 | 348.5 | 27.1 | 6.9 | 3.4 | 18.1 | 18.4 |
| 1951 | 358 | 370.0 | 27.2 | 6.9 | 3.3 | 21.8 | 21.2 |
| 1952 | 347 | 394.6 | 28.3 | 7.0 | 3.4 | 24.6 | 24.8 |
| 1953 | 358 | 425.2 | 29.3 | 7.0 | 3.4 | 26.6 | 26.7 |
| 1954 | 359 | 456.3 | 31.1 | 7.0 | 3.4 | 31.7 | 31.0 |
| 1955 | 386 | 496.3 | 34.0 | 7.3 | 3.5 | 34.7 | 34.0 |
| 1956 | 408 | 534.5 | 36.5 | 7.6 | 3.7 | 37.1 | 36.7 |
| 1957 | 412 | 568.3 | 38.8 | 7.5 | 3.6 | 40.0 | 39.9 |
| 1958 | 439 | 605.2 | 41.9 | 7.5 | 3.5 | 44.2 | 44.1 |
| 1959 | 446 | 641.3 | 43.9 | 7.2 | 3.6 | 45.3 | 45.2 |
| 1960 | 464 | 686.0 | 47.5 | 7.3 | 3.8 | 48.5 | 48.4 |
| 1961 | 495 | 744.8 | 51.7 | 7.5 | 4.1 | 53.3 | 53.2 |
| 1962 | 507 | 801.9 | 55.5 | 7.2 | 4.4 | 60.1 | 60.0 |
| 1963 | 526 | 850.6 | 58.2 | 7.1 | 4.2 | 64.9 | 64.8 |
| 1964 | 534 | 902.0 | 61.0 | 7.2 | 4.4 | 70.2 | 70.1 |
| 1965 | 551 | 962.6 | 64.4 | 7.2 | 4.6 | 77.8 | 76.6 |
| 1966 | 573 | 1,025.1 | 67.6 | 7.3 | 4.7 | 87.0 | 84.9 |
| 1967 | 576 | 1,085.1 | 69.1 | 7.2 | 4.9 | 91.5 | 93.6 |
| 1968 | 568 | 1,119.4 | 67.7 | 6.1 | 4.8 | 106.6 | 100.8 |
| 1969 | 575 | 1,155.5 | 68.3 | 5.9 | 4.9 | 112.8 | 106.6 |
| 1970 | 595 | 1,202.6 | 67.0 | 5.7 | 4.9 | 119.5 | 117.1 |
| 1971 | 615 | 1,262.4 | 67.9 | 5.5 | 5.5 | 129.8 | 143.5 |
| 1972 | 622 | 1,304.7 | 64.8 | 5.1 | 5.4 | 169.8 | 169.5 |
| 1973 | 645 | 1,358.1 | 67.1 | 5.0 | 5.5 | 186.9 | 188.9 |
| 1974 | 669 | 1,444.0 | 73.9 | 4.9 | 206.3 | 212.5 | |
| GOVERNMENT RAILWAYS | ||||||
|---|---|---|---|---|---|---|
| Year Ended 31 March | Miles Open for Traffic | Revenue Train-miles | Rail Passenger Journeys | Goods and Livestock | Revenue† | Expenditure† |
*Equivalent tonnage of livestock. †From 1925-26 figures relate to railway operation only. | ||||||
| (000) | (000) | tonnes(000) | $(000) | $(000) | ||
| 1924 | 3,053 | 9,025 | 28,436 | 7,029 | 13,968 | 10,808 |
| 1925 | 3,085 | 9,084 | 26,107 | 7,138 | 14,226 | 11,090 |
| 1926 | 3,138 | 10,319 | 27,653 | 7,363 | 15,178 | 12,330 |
| 1927 | 3,164 | 10,724 | 26,002 | 7,147 | 14,846 | 12,316 |
| 1928 | 3,180 | 10,839 | 25,380 | 7,476 | 14,688 | 12,604 |
| 1929 | 3,287 | 11,113 | 25,757 | 7,735 | 15,050 | 12,750 |
| 1930 | 3,287 | 12,022 | 25,414 | 7,914 | 14,948 | 13,696 |
| 1931 | 3,322 | 11,282 | 22,814 | 7,070 | 13,562 | 12,812 |
| 1932 | 3,315 | 10,169 | 19,151 | 5,918 | 11,578 | 10,604 |
| 1933 | 3,315 | 9,829 | 18,367 | 5,579 | 10,678 | 9,668 |
| 1934 | 3,320 | 10,163 | 19,047 | 5,733 | 11,258 | 9,754 |
| 1935 | 3,320 | 10,626 | 19,654 | 6,121 | 11,816 | 10,278 |
| 1936 | 3,320 | 11,050 | 20,358 | 6,288 | 12,488 | 11,046 |
| 1937 | 3,320 | 11,868 | 21,235 | 6,922 | 13,808 | 12,676 |
| 1938 | 3,323 | 12,778 | 22,441 | 7,637 | 15,184 | 14,584 |
| 1939 | 3,319 | 13,073 | 23,266 | 7,660 | 16,010 | 15,328 |
| 1940 | 3,390 | 13,367 | 24,454 | 7,797 | 17,524 | 15,886 |
| 1941 | 3,390 | 13,560 | 26,277 | 8,561 | 19,388 | 16,814 |
| 1942 | 3,390 | 13,979 | 28,611 | 8,610 | 20,768 | 17,806 |
| 1943 | 3,460 | 15,140 | 36,133 | 9,030 | 24,830 | 20,040 |
| 1944 | 3,504 | 15,329 | 38,611 | 9,172 | 26,930 | 22,732 |
| 1945 | 3,504 | 12,803 | 32,995 | 9,098 | 24,896 | 23,394 |
| 1946 | 3,528 | 13,455 | 32,418 | 9,358 | 26,210 | 25,100 |
| 1947 | 3,528 | 13,169 | 28,869 | 9,479 | 25,648 | 27,290 |
| 1948 | 3,526 | 13,712 | 25,887 | 9,676 | 27,928 | 30,180 |
| 1949 | 3,526 | 13,895 | 26,168 | 9,821 | 30,678 | 33,576 |
| 1950 | 3,526 | 14,421 | 25,895 | 10,108 | 32,124 | 34,722 |
| 1951 | 3,531 | 14,153 | 24,824 | 9,770 | 37,000 | 37,450 |
| 1952 | 3,539 | 12,371 | 21,292 | 9,987 | 40,194 | 43,030 |
| 1953 | 3,535 | 13,409 | 21,455 | 10,187 | 45,178 | 45,510 |
| 1954 | 3,504 | 13,719 | 23,272 | 9,790 | 47,364 | 47,242 |
| 1955 | 3,489 | 14,420 | 24,735 | 10,502 | 54,018 | 51,084 |
| 1956 | 3,422 | 14,884 | 25,075 | 10,849 | 55,742 | 53,550 |
| 1957 | 3,418 | 15,102 | 25,377 | 10,491 | 57,014 | 57,388 |
| 1958 | 3,466 | 14,825 | 24,817 | 10,498 | 60,020 | 62,128 |
| 1959 | 3,420 | 14,605 | 25,437 | 10,533 | 59,646 | 61,010 |
| 1960 | 3,336 | 14,480 | 26,134 | 10,712 | 60,542 | 61,516 |
| 1961 | 3,333 | 14,773 | 26,233 | 11,004 | 62,858 | 62,978 |
| 1962 | 3,332 | 14,948 | 26,324 | 10,996 | 63,390 | 63,632 |
| 1963 | 3,263 | 14,575 | 25,665 | 10,205 | 62,752 | 66,874 |
| 1964 | 3,265 | 14,918 | 25,734 | 11,268 | 67,648 | 67,946 |
| 1965 | 3,254 | 15,316 | 25,137 | 12,164 | 72,786 | 71,932 |
| 1966 | 3,251 | 15,428 | 23,889 | 12,079 | 74,753 | 73,228 |
| 1967 | 3,212 | 15,359 | 23,723 | 11,719 | 75,028 | 75,151 |
| 1968 | 3,118 | 13,839 | 22,186 | 10,751 | 71,653 | 71,880 |
| 1969 | 3,063 | 13,447 | 22,261 | 10,971 | 74,602 | 72,892 |
| 1970 | 3,063 | 13,295 | 21,031 | 11,779 | 83,194 | 79,836 |
| 1971 | 3,012 | 13,594 | 20,784 | 12,040 | 86,999 | 96,502 |
| 1972 | 2,987 | 13,282 | 20,115 | 11,493 | 101,296 | 107,277 |
| 1973 | 2,986 | 13,297 | 18,565 | 12,322 | 112,162 | 117,197 |
| 1974 | 2,982 | 13,948 | 18,944 | 13,378 | 125,789 | 135,363 |
| AGRICULTURE | |||||||
|---|---|---|---|---|---|---|---|
| Season | Wheat for Threshing | Yield of | |||||
| Area | Yield | Yield per Hectare | Oats | Barley | Peas for Threshing | Potatoes | |
| *Includes yield of beans. | |||||||
| hectares | tonnes | tonnes | tonnes | tonnes | tonnes | tonnes | |
| 1921-22 | 142,820 | 287,545 | 2.01 | 122,520 | 26,112 | 9,237* | 113,889 |
| 1922-23 | 111,602 | 228,479 | 2.05 | 103,206 | 13,564 | 18,984* | 115,653 |
| 1923-24 | 70,360 | 113,614 | 1.61 | 35,644 | 13,549 | 9,874* | 107,246 |
| 1924-25 | 67,568 | 148,266 | 2.19 | 103,551 | 18,102 | 11,174* | 124,145 |
| 1925-26 | 61,380 | 125,657 | 2.05 | 74,674 | 21,478 | 7,832* | 146,089 |
| 1926-27 | 89,065 | 216,434 | 2.43 | 90,675 | 28,199 | 12,376* | 118,645 |
| 1927-28 | 105,618 | 259,680 | 2.46 | 69,903 | 19,550 | 21,839* | 123,351 |
| 1928-29 | 103,321 | 240,395 | 2.33 | 55,613 | 17,715 | 14,357 | 125,591 |
| 1929-30 | 95,482 | 197,032 | 2.06 | 54,474 | 17,124 | 8,008 | 132,295 |
| 1930-31 | 100,772 | 206,274 | 2.05 | 61,265 | 18,999 | 6,570 | 153,957 |
| 1931-32 | 108,762 | 179,155 | 1.65 | 51,133 | 12,188 | 8,420 | 118,617 |
| 1932-33 | 122,430 | 300,872 | 2.46 | 93,118 | 12,724 | 15,933 | 131,151 |
| 1933-34 | 115,830 | 245,924 | 2.12 | 58,832 | 16,578 | 19,005 | 133,148 |
| 1934-35 | 91,212 | 161,479 | 1.77 | 34,295 | 10,993 | 11,881 | 110,874 |
| 1935-36 | 100,620 | 241,113 | 2.40 | 59,923 | 16,905 | 15,315 | 122,946 |
| 1936-37 | 89,755 | 195,110 | 2.17 | 63,965 | 16,941 | 13,091 | 128,341 |
| 1937-38 | 75,251 | 164,466 | 2.19 | 47,917 | 24,629 | 10,138 | 149,141 |
| 1938-39 | 76,599 | 151,434 | 1.98 | 47,262 | 24,421 | 10,532 | 89,078 |
| 1939-40 | 104,220 | 218,003 | 2.09 | 37,760 | 20,770 | 15,327 | 143,370 |
| 1940-41 | 98,418 | 226,052 | 2.30 | 56,518 | 24,186 | 20,182 | 95,634 |
| 1941-42 | 104,410 | 235,997 | 2.26 | 62,503 | 29,408 | 23,190 | 91,042 |
| 1942-43 | 116,144 | 267,243 | 2.30 | 50,962 | 23,987 | 24,201 | 141,276 |
| 1943-44 | 94,610 | 196,186 | 2.07 | 33,282 | 18,888 | 24,187 | 164,104 |
| 1944-45 | 74,416 | 190,300 | 2.56 | 76,371 | 31,411 | 28,238 | 127,704 |
| 1945-46 | 65,174 | 148,029 | 2.27 | 50,747 | 42,464 | 22,233 | 142,503 |
| 1946-47 | 57,225 | 146,099 | 2.55 | 48,739 | 45,968 | 33,508 | 117,620 |
| 1947-48 | 50,080 | 123,534 | 2.47 | 51,774 | 47,354 | 31,008 | 157,506 |
| 1948-49 | 59,370 | 162,154 | 2.73 | 67,470 | 51,174 | 32,528 | 111,404 |
| 1949-50 | 50,650 | 133,349 | 2.63 | 47,542 | 55,199 | 33,822 | 137,601 |
| 1950-51 | 58,584 | 170,697 | 2.91 | 33,166 | 43,147 | 17,031 | 121,700 |
| 1951-52 | 36,404 | 105,875 | 2.91 | 44,807 | 49,492 | 19,876 | 70,962 |
| 1952-53 | 51,486 | 123,161 | 2.39 | 43,276 | 48,533 | 16,722 | 96,171 |
| 1953-54 | 46,059 | 130,180 | 2.83 | 17,153 | 75,647 | 25,957 | 158,445 |
| 1954-55 | 42,083 | 111,951 | 2.66 | 29,068 | 45,176 | 24,098 | 146,472 |
| 1955-56 | 27,712 | 72,352 | 2.61 | 35,334 | 46,075 | 17,278 | 102,293 |
| 1956-57 | 26,605 | 80,295 | 3.02 | 52,405 | 64,742 | 23,015 | 147,578 |
| 1957-58 | 33,968 | 101,437 | 2.99 | 26,493 | 80,565 | 28,491 | 159,627 |
| 1958-59 | 53,788 | 164,353 | 3.06 | 28,590 | 60,354 | 22,585 | 152,332 |
| 1959-60 | 66,028 | 236,785 | 3.59 | 33,115 | 71,143 | 25,142 | 159,324 |
| 1960-61 | 75,590 | 253,357 | 3.35 | 42,627 | 77,467 | 25,331 | 193,495 |
| 1961-62 | 75,388 | 213,248 | 2.83 | 34,221 | 80,753 | 20,765 | 191,049 |
| 1962-63 | 91,357 | 249,198 | 2.73 | 18,663 | 95,293 | 27,230 | 184,357 |
| 1963-64 | 82,540 | 273,997 | 3.32 | 28,080 | 130,995 | 29,985 | 203,999 |
| 1964-65 | 74,450 | 250,298 | 3.36 | 45,249 | 105,907 | 23,891 | 246,965 |
| 1965-66 | 80,745 | 291,784 | 3.61 | 43,520 | 114,077 | 28,798 | 234,563 |
| 1966-67 | 93,305 | 347,759 | 3.73 | 28,180 | 134,014 | 32,185 | 187,358 |
| 1967-68 | 126,651 | 442,330 | 3.49 | 44,754 | 219,399 | 36,300 | 235,835 |
| 1968-69 | 129,975 | 456,648 | 3.51 | 52,148 | 232,569 | 56,617 | 256,350 |
| 1969-70 | 108,394 | 287,212 | 2.65 | 57,712 | 174,446 | 49,601 | 253,204 |
| 1970-71 | 97,528 | 325,646 | 3.34 | 59,752 | 259,320 | 51,856 | 209,927 |
| 1971-72 | 106,596 | 389,156 | 3.65 | 49,457 | 335,490 | 57,519 | 219,970 |
| 1972-73 | 107,690 | 376,111 | 3.49 | 44,965 | 258,261 | 59,733 | 244,211 |
| LIVESTOCK | ||||||
|---|---|---|---|---|---|---|
| Year | Beef Cattle | Dairy Cows in Milk | Total Dairy Cattle | Total Cattle | Sheep | Pigs |
| *Coverage to 1959 relates to holdings of 1 acre and over; thereafter to 10 acres and over outside borough boundaries, except that Manukau City has been included since Manukau County was absorbed by the city. Since 1970-71 the coverage applies to 1 hectare and over. Figures are as at 31 January of year stated, except for sheep which are as at 30 June. | ||||||
| (000) | (000) | (000) | (000) | (000) | (000) | |
| 1924 | .. | 1,185 | .. | 3,563 | 23,776 | 407 |
| 1925 | .. | 1,196 | .. | 3,504 | 24,548 | 440 |
| 1926 | .. | 1,181 | .. | 3,452 | 24,905 | 473 |
| 1927 | .. | 1,182 | .. | 3,258 | 25,649 | 520 |
| 1928 | .. | 1,243 | .. | 3,274 | 27,134 | 587 |
| 1929 | .. | 1,291 | .. | 3,446 | 29,051 | 557 |
| 1930 | .. | 1,390 | .. | 3,770 | 30,841 | 488 |
| 1931 | .. | 1,479 | .. | 4,044 | 29,793 | 469 |
| 1932 | .. | 1,562 | .. | 4,072 | 28,692 | 506 |
| 1933 | .. | 1,703 | .. | 4,155 | 27,756 | 584 |
| 1934 | .. | 1,796 | .. | 4,264 | 28,649 | 653 |
| 1935 | .. | 1,807 | .. | 4,257 | 29,077 | 755 |
| 1936 | .. | 1,803 | .. | 4,217 | 30,114 | 801 |
| 1937 | .. | 1,785 | .. | 4,352 | 31,306 | 795 |
| 1938 | .. | 1,743 | .. | 4,469 | 32,379 | 749 |
| 1939 | .. | 1,724 | .. | 4,528 | 31,879 | 676 |
| 1940 | .. | 1,719 | .. | 4,496 | 31,063 | 706 |
| 1941 | .. | 1,759 | .. | 4,539 | 31,752 | 769 |
| 1942 | .. | 1,757 | .. | 4,642 | .. | 689 |
| 1943 | .. | 1,715 | .. | 4,448 | .. | 605 |
| 1944 | .. | 1,648 | .. | 4,439 | 33,200 | 573 |
| 1945 | .. | 1,697 | .. | 4,591 | 33,975 | 594 |
| 1946 | 2,066 | 1,662 | 2,600 | 4,667 | .. | 549 |
| 1947 | 2,048 | 1,658 | 2,586 | 4,634 | 32,682 | 546 |
| 1948 | 2,078 | 1,714 | 2,638 | 4,716 | 32,483 | 548 |
| 1949 | 2,041 | 1,747 | 2,681 | 4,723 | 32,845 | 545 |
| 1950 | 2,088 | 1,850 | 2,867 | 4,955 | 33,857 | 555 |
| 1951 | 2,149 | 1,898 | 2,911 | 5,060 | 34,786 | 564 |
| 1952 | 2,282 | 1,906 | 2,883 | 5,165 | 35,384 | 566 |
| 1953 | 2,478 | 1,962 | 2,968 | 5,446 | 36,193 | 628 |
| 1954 | 2,634 | 1,999 | 3,110 | 5,745 | 38,011 | 649 |
| 1955 | 2,808 | 1,995 | 3,079 | 5,887 | 39,117 | 681 |
| 1956 | .. | .. | .. | .. | 40,255 | .. |
| 1957 | 2,861 | 1,998 | 2,948 | 5,809 | 42,382 | 602 |
| 1958 | 2,915 | 1,967 | 2,970 | 5,886 | 46,026 | 628 |
| 1959 | 2,970 | 1,931 | 3,004 | 5,973 | 46,876 | 692 |
| 1960* | 3,019 | 1,887 | 2,973 | 5,992 | 47,134 | 660 |
| 1961 | 3,334 | 1,929 | 3,111 | 6,446 | 48,462 | 655 |
| 1962 | 3,462 | 1,968 | 3,136 | 6,598 | 48,988 | 686 |
| 1963 | 3,558 | 1,997 | 3,133 | 6,691 | 50,190 | 766 |
| 1964 | 3,568 | 2,011 | 3,128 | 6,696 | 51,292 | 771 |
| 1965 | 3,628 | 2,032 | 3,174 | 6,801 | 53,748 | 716 |
| 1966 | 3,856 | 2,088 | 3,362 | 7,218 | 57,343 | 667 |
| 1967 | 4,241 | 2,131 | 3,506 | 7,747 | 60,030 | 603 |
| 1968 | 4,549 | 2,232 | 3,698 | 8,247 | 60,474 | 614 |
| 1969 | 4,812 | 2,304 | 3,793 | 8,605 | 59,937 | 553 |
| 1970 | 5,048 | 2,321 | 3,729 | 8,777 | 60,276 | 578 |
| 1971 | 5,280 | 2,239 | 3,539 | 8,819 | 58,913 | 617 |
| 1972 | 5,414x | 2,200 | 3,360x | 8,774 | 60,883 | 580 |
| 1973 | 5,733 | 2,190 | 3,355 | 9,088 | 56,684 | 507 |
| 1974 | 6,142 | 2,140 | 3,273 | 9,415 | 55,883 | 507 |
| COAL CONSUMPTION | ||||||||
|---|---|---|---|---|---|---|---|---|
| Year | Factories | Shipping | Rail | Gas Works | Households | Public Hospitals Central Heating | Electricity Generation | Total |
| *Estimated. | ||||||||
| tonnes(000) | ||||||||
| 1922 | 530 | 336 | 295 | 247 | .. | .. | 51 | 2,276 |
| 1923 | 571 | 352 | 321 | 254 | .. | .. | 98 | 2,459 |
| 1924 | 535 | 334 | 332 | 249 | .. | .. | 134 | 2,711 |
| 1925 | 512 | 332 | 376 | 237 | .. | .. | 96 | 2,593 |
| 1926 | 522 | 369 | 385 | 233 | .. | .. | 118 | 2,582 |
| 1927 | 500 | 328 | 408 | 232 | .. | .. | 155 | 2,644 |
| 1928 | 510 | 324 | 417 | 225 | .. | .. | 180 | 2,600 |
| 1929 | 506 | 321 | 484 | 232 | .. | .. | 91 | 2,588 |
| 1930 | 499 | 251 | 440 | 244 | .. | .. | 173 | 2,615 |
| 1931 | 402 | 180 | 375 | 224 | .. | .. | 188 | 2,249 |
| 1932 | 396 | 151 | 394 | 210 | .. | .. | 25 | 1,941 |
| 1933 | 431 | 141 | 388 | 207 | .. | .. | 8 | 2,012 |
| 1934 | 443 | 163 | 425 | 208 | .. | .. | 8 | 2,155 |
| 1935 | 463 | 157 | 450 | 208 | .. | .. | 10 | 2,240 |
| 1936 | 508 | 156 | 466 | 224 | .. | .. | 10 | 2,241 |
| 1937 | 517 | 155 | 520 | 225 | .. | .. | 15 | 2,317 |
| 1938 | 550 | 154 | 522 | 230 | .. | .. | 15 | 2,312 |
| 1939 | 684 | 128 | 538 | 246 | .. | .. | 34 | 2,449 |
| 1940 | 693 | 154 | 572 | 262 | .. | .. | 82 | 2,540 |
| 1941 | 732 | 125 | 577 | 268 | .. | .. | 111 | 2,702 |
| 1942 | 749 | 148 | 658 | 276 | .. | .. | 75 | 2,759 |
| 1943 | 746 | 135 | 671 | 292 | .. | .. | 76 | 2,826 |
| 1944 | 765 | 121 | 613 | 305 | 582 | .. | 49 | 2,823 |
| 1945 | 758 | 126 | 643 | 315 | 604 | .. | 67 | 2,871 |
| 1946 | 747 | 111 | 626 | 320 | 549 | .. | 62 | 2,838 |
| 1947 | 788 | 93 | 601 | 328 | 607 | .. | 62 | 2,856 |
| 1948 | - | 78 | 586 | 328 | 630 | .. | .. | 2,842 |
| 1949 | 858 | 56 | 561 | 316 | 650 | .. | 67 | 2,892 |
| 1950 | 832 | 50 | 486 | 306 | 610 | .. | 91 | 2,778 |
| 1951 | 875 | 38 | 451 | 264 | 549 | .. | 64 | 2,494 |
| 1952 | 904 | 37 | 442 | 294 | 599 | .. | 131 | 2,772 |
| 1953 | 908 | 34 | 423 | 283 | 559 | 87 | 45 | 2,555 |
| 1954 | 946 | 36 | 405 | 270 | 559 | 88 | 139 | 2,651 |
| 1955 | 1,004 | 29 | 377 | 272 | 528 | 86 | 120 | 2,612 |
| 1956 | 1,049 | 33 | 316 | 265 | 549 | 86 | 136 | 2,700 |
| 1957 | 1,070 | 28 | 273 | 260 | 559 | 76 | 179 | 2,627 |
| 1958 | 1,088 | 25 | 242 | 275 | 559 | 80 | 251 | 2,735 |
| 1959 | 1,043 | 14 | 231 | 280 | 549 | 79 | 363 | 2,753 |
| 1960 | 1,015 | 9 | 223 | 281 | 549 | 100 | 611 | 2,965 |
| 1961 | 1,003 | 8 | 219 | 283 | 544 | 98 | 612 | 2,917 |
| 1962 | 969 | 8 | 190 | 266 | 478 | 96 | 347 | 2,474 |
| 1963 | 1,049 | 9 | 186 | 272 | 525 | 104 | 607 | 2,807 |
| 1964 | 1,046 | 10 | 169 | 262 | 490 | 107 | 595 | 2,821 |
| 1965 | 1,029 | 9 | 143 | 264 | 490 | 122 | 440 | 2,664 |
| 1966 | 1,010 | 10 | 122 | 245 | 488* | 128 | 499 | 2,645 |
| 1967 | 928 | 6 | 101 | 252 | 427* | 144 | 232 | 2,270 |
| 1968 | 938 | 6 | 50 | 231 | 396* | 155 | 257 | 2,143 |
| 1969 | 920 | 5 | 13 | 172 | 376* | 163 | 546 | 2,311 |
| 1970 | 910 | — | 10 | 154 | 345* | 163 | 542 | 2,306 |
| 1971 | 925 | — | 5* | 109 | 300* | 164 | 442 | 2,114 |
| 1972 | 934* | - | .. | 99 | 290* | 187 | 558 | 2,188* |
| 1973 | 948* | - | - | 91 | 284* | 193 | 827 | 2,461* |
| TRADE* | ||||||
|---|---|---|---|---|---|---|
| Year | Exports | Imports (c.d.v.) | Imports c.d.v. + 10 percent† | |||
| Total | Per Head of Mean Population | Total | Per Head of Mean Population | Total | Per Head of Mean Population | |
*Figures are in terms of New Zealand currency. Gold and specie excluded. †From 1955 c.i.f. value. ‡Provisional. | ||||||
| $(m) | $(m) | $(m) | ||||
| 1924 | 103.9 | 76.82 | 88.2 | 65.22 | 97.1 | 71.75 |
| 1925 | 109.5 | 79.12 | 95.3 | 68.84 | 104.8 | 75.72 |
| 1926 | 89.5 | 63.31 | 90.6 | 64.06 | 99.6 | 70.46 |
| 1927 | 95.9 | 66.66 | 81.4 | 56.58 | 89.6 | 62.23 |
| 1928 | 110.2 | 75.66 | 81.5 | 55.99 | 89.7 | 61.58 |
| 1929 | 108.9 | 73.91 | 88.6 | 60.12 | 97.5 | 66.14 |
| 1930 | 88.8 | 59.47 | 80.6 | 53.99 | 88.7 | 59.39 |
| 1931 | 68.7 | 45.40 | 48.2 | 31.82 | 53.0 | 34.99 |
| 1932 | 68.9 | 45.10 | 44.8 | 29.34 | 49.3 | 32.28 |
| 1933 | 79.3 | 51.52 | 46.5 | 30.21 | 51.2 | 33.22 |
| 1934 | 92.0 | 59.28 | 57.0 | 36.72 | 62.7 | 40.39 |
| 1935 | 90.2 | 57.72 | 66.0 | 42.26 | 72.6 | 46.49 |
| 1936 | 110.7 | 70.28 | 80.5 | 51.08 | 88.5 | 56.18 |
| 1937 | 130.5 | 82.11 | 102.1 | 64.22 | 112.3 | 70.63 |
| 1938 | 114.2 | 71.04 | 100.8 | 62.71 | 110.8 | 68.98 |
| 1939 | 112.8 | 69.29 | 89.8 | 55.12 | 98.7 | 60.63 |
| 1940 | 143.6 | 87.70 | 89.1 | 54.41 | 98.0 | 59.84 |
| 1941 | 131.3 | 80.50 | 89.4 | 54.81 | 98.3 | 60.29 |
| 1942 | 159.1 | 97.05 | 97.9 | 59.72 | 107.7 | 65.69 |
| 1943 | 140.6 | 85.98 | 173.2 | 105.87 | 190.5 | 116.46 |
| 1944 | 152.7 | 92.24 | 157.1 | 94.87 | 172.8 | 104.35 |
| 1945 | 160.7 | 94.85 | 100.1 | 59.09 | 110.2 | 65.00 |
| 1946 | 200.2 | 113.80 | 130.1 | 73.95 | 143.1 | 81.34 |
| 1947 | 256.8 | 142.78 | 233.9 | 130.06 | 257.3 | 143.06 |
| 1948 | 294.4 | 160.48 | 233.7 | 127.37 | 257.0 | 140.11 |
| 1949 | 293.3 | 156.72 | 218.2 | 116.59 | 240.0 | 128.25 |
| 1950 | 364.9 | 191.12 | 287.1 | 150.41 | 315.9 | 165.45 |
| 1951 | 494.6 | 253.95 | 375.5 | 192.80 | 413.0 | 212.08 |
| 1952 | 479.5 | 240.22 | 458.9 | 229.88 | 504.8 | 252.87 |
| 1953 | 470.7 | 229.74 | 327.2 | 159.70 | 359.9 | 175.68 |
| 1954 | 488.0 | 232.92 | 426.3 | 203.48 | 468.9 | 223.83 |
| 1955 | 518.1 | 242.20 | 501.3 | 234.37 | 574.2 | 268.47 |
| 1956 | 554.5 | 254.02 | 469.5 | 215.51 | 536.8 | 245.91 |
| 1957 | 552.5 | 247.48 | 523.4 | 234.42 | 594.1 | 266.09 |
| 1958 | 499.9 | 218.68 | 505.5 | 221.14 | 570.0 | 249.38 |
| 1959 | 586.6 | 251.26 | 410.1 | 175.64 | 462.7 | 198.21 |
| 1960 | 604.6 | 254.35 | 506.2 | 212.94 | 564.5 | 237.48 |
| 1961 | 567.4 | 233.76 | 576.4 | 237.48 | 649.7 | 267.64 |
| Jan-Jun 1962 | 332.6 | 134.32 | 237.4 | 95.88 | 264.3 | 106.74 |
| Year ended June 1963 | 627.5 | 249.42 | 523.7 | 208.16 | 576.6 | 229.18 |
| 1964 | 737.3 | 286.72 | 637.4 | 247.88 | 694.0 | 269.91 |
| 1965 | 742.2 | 282.95 | 662.7 | 252.64 | 724.5 | 276.20 |
| 1966 | 767.3 | 288.54 | 729.4 | 274.31 | 792.8 | 298.13 |
| 1967 | 727.2 | 268.57 | 752.2 | 277.79 | 813.2 | 300.32 |
| 1968 | 820.5 | 299.04 | 622.9 | 227.03 | 674.7 | 245.91 |
| 1969 | 989.1 | 357.56 | 799.2 | 288.91 | 852.9 | 308.32 |
| 1970 | 1,086.7 | 388.3 | 944.3 | 337.4 | 1,007.2 | 359.9 |
| 1971 | 1,131.7 | 398.2 | 1,070.6 | 376.7 | 1,155.5 | 406.6 |
| 1972 | 1,375.0 | 475.9 | 1,152.7 | 399.0 | 1,239.0 | 428.9 |
| 1973‡ | 1,787.0 | 606.2 | 1,276.2 | 433.0 | 1,366.3 | 463.5 |
| 1974‡ | 1,787.6 | 593.5 | 1,842.3 | 611.7 | 2,014.2 | 668.7 |
| 1975‡ | 1,612.6 | 524.3 | 2,470.4 | 803.1 | 2,737.5 | 889.9 |
| EXPORTS OF NEW ZEALAND PRODUCE | ||||||
|---|---|---|---|---|---|---|
| Year | Wool | |||||
| Greasy | Scoured and Washed | Total, including Slipe* | ||||
| Quantity | Value | Quantity | Value | Quantity | Value | |
*Including fine animal hair. †Provisional. | ||||||
| tonnes | $(m) | tonnes | $(m) | tonnes | $(m) | |
| 1924 | 73,496 | 22.7 | 8,235 | 3.7 | 93,526 | 30.5 |
| 1925 | 75,301 | 28.5 | 6,858 | 3.2 | 93,316 | 35.5 |
| 1926 | 75,541 | 17.4 | 7,741 | 2.7 | 96,685 | 23.7 |
| 1927 | 81,290 | 20.3 | 6,482 | 2.4 | 100,018 | 25.9 |
| 1928 | 85,916 | 27.1 | 4,997 | 2.2 | 102,877 | 33.4 |
| 1929 | 89,978 | 25.1 | 5,786 | 2.3 | 106,574 | 30.7 |
| 1930 | 69,954 | 11.2 | 5,740 | 1.5 | 89,467 | 15.3 |
| 1931 | 75,068 | 8.2 | 5,012 | 0.9 | 96,034 | 11.0 |
| 1932 | 84,683 | 8.6 | 6,597 | 1.0 | 108,036 | 11.5 |
| 1933 | 104,130 | 11.3 | 9,141 | 1.5 | 129,867 | 14.8 |
| 1934 | 95,077 | 20.2 | 7,499 | 2.0 | 116,028 | 25.0 |
| 1935 | 78,889 | 10.3 | 7,155 | 1.5 | 100,997 | 14.2 |
| 1936 | 118,724 | 21.1 | 7,658 | 1.9 | 142,614 | 26.6 |
| 1937 | 106,204 | 30.9 | 4,982 | 1.9 | 128,067 | 38.1 |
| 1938 | 102,012 | 19.4 | 5,709 | 1.6 | 123,052 | 24.4 |
| 1939 | 102,748 | 18.4 | 5,859 | 1.5 | 125,823 | 23.3 |
| 1940 | 104,762 | 24.2 | 9,342 | 2.9 | 136,209 | 33.8 |
| 1941 | 73,315 | 17.4 | 11,164 | 3.7 | 97,859 | 25.2 |
| 1942 | 97,778 | 23.3 | 17,398 | 5.8 | 139,501 | 36.7 |
| 1943 | 69,623 | 18.5 | 11,353 | 4.0 | 93,813 | 27.0 |
| 1944 | 58,618 | 15.8 | 13,459 | 4.8 | 85,547 | 25.4 |
| 1945 | 30,996 | 8.4 | 25,163 | 9.5 | 75,414 | 25.4 |
| 1946 | 119,949 | 35.8 | 18,926 | 7.5 | 165,745 | 53.2 |
| 1947 | 116,750 | 40.0 | 23,025 | 11.6 | 170,245 | 63.9 |
| 1948 | 147,237 | 64.8 | 18,253 | 11.8 | 190,972 | 89.0 |
| 1949 | 148,447 | 66.9 | 18,400 | 11.7 | 194,897 | 93.1 |
| 1950 | 137,201 | 110.6 | 15,097 | 16.4 | 178,704 | 149.3 |
| 1951 | 111,820 | 188.5 | 10,815 | 24.5 | 143,727 | 256.4 |
| 1952 | 154,629 | 122.7 | 15,354 | 16.6 | 198,723 | 164.0 |
| 1953 | 137,903 | 124.7 | 14,686 | 18.2 | 177,630 | 169.2 |
| 1954 | 137,692 | 130.8 | 16,142 | 20.4 | 178,216 | 176.9 |
| 1955 | 146,417 | 138.1 | 18,723 | 23.2 | 189,408 | 187.9 |
| 1956 | 151,350 | 136.6 | 18,449 | 22.0 | 194,163 | 183.1 |
| 1957 | 153,478 | 161.2 | 19,411 | 25.3 | 195,880 | 212.1 |
| 1958 | 162,595 | 122.0 | 18,713 | 17.7 | 207,333 | 160.1 |
| 1959 | 188,118 | 137.4 | 21,209 | 19.4 | 240,037 | 179.5 |
| 1960 | 182,542 | 152.9 | 23,589 | 25.3 | 236,947 | 205.0 |
| 1961 | 197,367 | 152.9 | 24,338 | 24.3 | 251,723 | 200.7 |
| Jan-June 1962 | 128,186 | 97.8 | 15,325 | 14.6 | 163,039 | 127.5 |
| Year ended June 1963 | 204,338 | 163.2 | 29,596 | 28.5 | 261,724 | 214.5 |
| 1964 | 195,139 | 201.8 | 32,009 | 39.7 | 256,547 | 271.6 |
| 1965 | 180,920 | 149.9 | 32,314 | 36.1 | 241,066 | 208.6 |
| 1966 | 212,149 | 170.2 | 37,158 | 37.8 | 278,228 | 231.9 |
| 1967 | 158,468 | 117.7 | 36,067 | 32.9 | 227,150 | 174.1 |
| 1968 | 182,297 | 99.7 | 48,915 | 35.6 | 268,427 | 158.2 |
| 1969 | 205,260 | 131.4 | 65,913 | 55.1 | 307,915 | 212.4 |
| 1970 | 196,430 | 119.3 | 74,684 | 63.3 | 303,053 | 204.2 |
| 1971 | 173,926 | 100.2 | 82,225 | 65.7 | 293,499 | 187.9 |
| 1972 | 177,990 | 119.1 | 96,629 | 84.1 | 312,374 | 228.6 |
| 1973† | 160,212 | 224.2 | 94,798 | 152.6 | 287,917 | 424.2 |
| 1974† | 121,888 | 190.9 | 67,046 | 131.5 | 214,213 | 363.4 |
| EXPORTS OF NEW ZEALAND PRODUCE—ctd. | ||||||
|---|---|---|---|---|---|---|
| Year | Beef and Veal | Lamb and Mutton | All Meat | |||
| Quantity | Value | Quantity | Value | Quantity | Value | |
| *provisional. | ||||||
| 1924 | 34,352 | 1.7 | 126,292 | 17.0 | 163,257 | 19.0 |
| 1925 | 36,943 | 2.2 | 132,013 | 19.7 | 173,450 | 22.3 |
| 1926 | 22,487 | 1.2 | 126,884 | 15.4 | 154,152 | 17.3 |
| 1927 | 23,242 | 1.3 | 90,326 | 16.1 | 120,146 | 18.2 |
| 1928 | 38,476 | 2.3 | 144,033 | 17.2 | 192,735 | 20.6 |
| 1929 | 19,796 | 1.3 | 138,777 | 17.2 | 169,487 | 19.8 |
| 1930 | 21,289 | 1.5 | 173,233 | 19.2 | 205,071 | 21.9 |
| 1931 | 23,942 | 1.2 | 175,931 | 15.7 | 210,261 | 17.8 |
| 1932 | 27,191 | 0.9 | 195,631 | 15.0 | 236,001 | 16.9 |
| 1933 | 47,164 | 1.9 | 193,927 | 16.0 | 264,330 | 19.7 |
| 1934 | 45,626 | 1.9 | 177,245 | 19.0 | 252,460 | 23.8 |
| 1935 | 47,020 | 2.2 | 184,480 | 20.0 | 264,503 | 25.5 |
| 1936 | 43,226 | 2.3 | 177,185 | 20.2 | 260,098 | 24.5 |
| 1937 | 50,911 | 3.0 | 184,929 | 22.0 | 274,883 | 29.4 |
| 1938 | 52,514 | 3.6 | 184,858 | 22.4 | 272,977 | 30.2 |
| 1939 | 62,111 | 4.5 | 203,879 | 22.2 | 300,051 | 30.8 |
| 1940 | 75,985 | 6.0 | 237,857 | 27.8 | 354,429 | 39.4 |
| 1941 | 40,209 | 3.5 | 192,192 | 24.5 | 268,483 | 33.2 |
| 1942 | 46,614 | 4.5 | 221,010 | 27.6 | 291,676 | 35.6 |
| 1943 | 25,831 | 2.3 | 188,748 | 23.9 | 224,173 | 27.6 |
| 1944 | 7,141 | 0.6 | 194,016 | 23.0 | 211,137 | 25.0 |
| 1945 | 29,923 | 2.9 | 243,114 | 30.3 | 287,229 | 35.2 |
| 1946 | 62,488 | 6.7 | 255,786 | 35.9 | 343,087 | 46.5 |
| 1947 | 68,464 | 8.7 | 259,643 | 45.1 | 353,362 | 58.7 |
| 1948 | 68,976 | 8.1 | 253,433 | 43.8 | 349,008 | 57.2 |
| 1949 | 59,966 | 6.7 | 261,049 | 43.0 | 349,556 | 54.4 |
| 1950 | 59,971 | 7.0 | 258,009 | 45.6 | 343,442 | 57.2 |
| 1951 | 43,567 | 5.8 | 212,074 | 39.6 | 278,929 | 50.7 |
| 1952 | 57,421 | 10.3 | 299,717 | 60.9 | 384,162 | 78.8 |
| 1953 | 45,098 | 9.9 | 256,129 | 60.5 | 329,047 | 78.8 |
| 1954 | 60,487 | 14.7 | 281,448 | 78.0 | 367,237 | 100.5 |
| 1955 | 95,581 | 26.8 | 262,346 | 83.8 | 383,562 | 121.2 |
| 1956 | 119,675 | 29.2 | 274,394 | 87.2 | 420,635 | 127.7 |
| 1957 | 117,402 | 31.3 | 254,668 | 87.0 | 394,531 | 128.1 |
| 1958 | 117,627 | 51.1 | 273,910 | 85.5 | 411,773 | 146.9 |
| 1959 | 90,279 | 44.4 | 326,810 | 87.0 | 441,574 | 142.4 |
| 1960 | 99,992 | 44.4 | 350,454 | 97.2 | 474,188 | 152.3 |
| 1961 | 97,024 | 44.4 | 348,278 | 89.9 | 467,883 | 144.2 |
| Jan-June 1962 | 49,558 | 21.6 | 218,811 | 52.5 | 282,282 | 80.6 |
| Year ended June 1963 | 128,777 | 58.8 | 358,466 | 98.2 | 516,376 | 169.5 |
| 1964 | 121,197 | 58.1 | 368,993 | 107.2 | 522,744 | 180.0 |
| 1965 | 121,393 | 57.4 | 366,434 | 135.0 | 519,742 | 208.5 |
| 1966 | 101,197 | 54.6 | 369,234 | 121.4 | 501,983 | 193.1 |
| 1967 | 106,251 | 63.9 | 367,842 | 119.5 | 505,425 | 200.8 |
| 1968 | 129,338 | 89.3 | 413,227 | 147.0 | 581,251 | 256.2 |
| 1969 | 133,226 | 109.1 | 473,286 | 175.5 | 645,443 | 304.5 |
| 1970 | 177,704 | 154.2 | 439,344 | 182.9 | 658,534 | 364.3 |
| 1971 | 180,858 | 170.4 | 425,311 | 186.5 | 647,785 | 385.7 |
| 1972 | 185,390 | 187.2 | 446,913 | 178.1 | 674,335 | 393.3 |
| 1973* | 202,750 | 240.3 | 441,395 | 257.3 | 690,478 | 534.4 |
| 1974* | 183,443 | 235.6 | 350,856 | 257.0 | 572,532 | 530.2 |
| EXPORTS OF NEW ZEALAND PRODUCE—ctd. | ||||||
|---|---|---|---|---|---|---|
| Year | Butter | Cheese | Milk, dried and condensed | |||
| Quantity | Value | Quantity | Value | Quantity | Value | |
| Provisional. | ||||||
| 1924 | 64,492 | 23.3 | 81,004 | 14.0 | 6,115 | 1.0 |
| tonnes | $(m) | tonnes | $(m) | tonnes | $(m) | |
| 1925 | 63,266 | 20.5 | 69,943 | 11.6 | 6,233 | 0.9 |
| 1926 | 59,339 | 17.4 | 74,250 | 11.9 | 5,137 | 0.7 |
| 1927 | 73,945 | 21.8 | 75,838 | 11.2 | 5,635 | 0.7 |
| 1928 | 73,642 | 22.6 | 79,622 | 13.4 | 7,810 | 0.8 |
| 1929 | 84,017 | 26.5 | 90,383 | 14.0 | 6,230 | 0.7 |
| 1930 | 95,724 | 23.7 | 92,104 | 12.9 | 6,895 | 0.7 |
| 1931 | 101,024 | 21.3 | 83,130 | 8.9 | 5,827 | 0.5 |
| 1932 | 111,031 | 21.3 | 90,959 | 9.9 | 7,273 | 0.5 |
| 1933 | 133,877 | 23.3 | 100,738 | 9.5 | 8,001 | 0.6 |
| 1934 | 132,824 | 20.1 | 100,818 | 9.4 | 9,780 | 0.8 |
| 1935 | 141,703 | 27.2 | 87,764 | 8.8 | 9,427 | 0.7 |
| 1936 | 142,051 | 30.6 | 84,241 | 10.2 | 10,769 | 0.8 |
| 1937 | 151,192 | 34.0 | 83,680 | 10.7 | 11,210 | 0.7 |
| 1938 | 132,825 | 33.0 | 81,818 | 11.9 | 9,315 | 0.6 |
| 1939 | 124,126 | 32.2 | 85,209 | 11.7 | 11,134 | 0.8 |
| 1940 | 133,240 | 36.5 | 103,307 | 16.5 | 11,993 | 0.8 |
| 1941 | 115,007 | 31.6 | 120,211 | 19.7 | 13,445 | 1.4 |
| 1942 | 121,806 | 33.9 | 136,538 | 23.7 | 12,513 | 1.4 |
| 1943 | 102,619 | 29.4 | 102,110 | 18.3 | 11,880 | 1.2 |
| 1944 | 117,231 | 37.1 | 78,950 | 14.9 | 8,360 | 1.1 |
| 1945 | 105,167 | 38.6 | 88,829 | 19.0 | 15,347 | 2.0 |
| 1946 | 103,438 | 39.7 | 76,962 | 16.9 | 17,268 | 2.4 |
| 1947 | 129,758 | 57.7 | 88,441 | 23.2 | 20,302 | 3.3 |
| 1948 | 137,811 | 67.5 | 76,837 | 22.4 | 26,966 | 4.4 |
| 1949 | 150,040 | 70.9 | 95,446 | 25.3 | 34,942 | 5.7 |
| 1950 | 140,486 | 71.7 | 101,493 | 29.1 | 41,284 | 6.6 |
| 1951 | 149,830 | 83.0 | 108,330 | 33.3 | 47,463 | 7.9 |
| 1952 | 186,982 | 112.3 | 92,720 | 31.1 | 63,739 | 13.1 |
| 1953 | 161,660 | 102.9 | 102,987 | 36.7 | 64,001 | 12.6 |
| 1954 | 134,607 | 89.6 | 91,874 | 32.8 | 45,949 | 8.2 |
| 1955 | 153,388 | 102.0 | 86,407 | 27.4 | 51,742 | 7.2 |
| 1956 | 170,137 | 106.3 | 90,303 | 44.5 | 52,916 | 8.8 |
| 1957 | 147,403 | 76.9 | 89,896 | 35.8 | 68,798 | 11.5 |
| 1958 | 178,207 | 77.7 | 90,863 | 24.8 | 53,882 | 7.6 |
| 1959 | 196,075 | 111.6 | 84,791 | 44.2 | 71,509 | 11.5 |
| 1960 | 159,572 | 100.3 | 80,688 | 37.1 | 61,287 | 11.1 |
| 1961 | 167,689 | 78.8 | 89,013 | 39.8 | 51,267 | 8.4 |
| Jan-June 1962 | 86,078 | 41.5 | 52,990 | 21.3 | 30,726 | 4.4 |
| Year ended June 1963 | 167,227 | 90.9 | 93,689 | 37.0 | 64,367 | 9.5 |
| 1964 | 184,875 | 109.6 | 89,000 | 35.1 | 73,768 | 11.0 |
| 1965 | 192,180 | 119.6 | 94,746 | 40.7 | 88,050 | 18.9 |
| 1966 | 193,472 | 109.6 | 98,037 | 41.7 | 101,152 | 22.0 |
| 1967 | 203,163 | 109.4 | 104,360 | 45.1 | 135,235 | 29.8 |
| 1968 | 204,467 | 112.2 | 100,281 | 47.4 | 140,450 | 30.3 |
| 1969 | 206,378 | 114.8 | 87,661 | 42.6 | 134,733 | 23.1 |
| 1970 | 198,021 | 109.7 | 90,582 | 44.3 | 184,351 | 31.1 |
| 1971 | 194,464 | 113.9 | 92,681 | 48.0 | 160,452 | 34.1 |
| 1972 | 187,680 | 183.9 | 88,464 | 66.3 | 191,925 | 76.5 |
| 1973* | 172,249 | 135.1 | 95,464 | 79.4 | 197,415 | 87.0 |
| 1974* | 159,464 | 107.2 | 69,544 | 61.8 | 278,348 | 130.6 |
| EXPORTS OF NEW ZEALAND PRODUCE—ctd. | ||||||
|---|---|---|---|---|---|---|
| Year | Casein | Apples and Pears† | Grass and Clover Seeds | |||
| Quantity | Value | Quantity | Value | Quantity | Value | |
| *Provisional. †Whole fruit only. | ||||||
| tonnes | $(m) | tonnes | $(m) | tonnes | $(m) | |
| 1923 | 2,554 | 0.4 | 2,701 | 0.1 | 2,389 | 0.4 |
| 1924 | 2,348 | 0.3 | 4,438 | 0.2 | 1,846 | 0.3 |
| 1925 | 2,230 | 0.2 | 3,986 | 0.2 | 2,305 | 0.3 |
| 1926 | 1,852 | 0.2 | 13,313 | 0.7 | 2,933 | 0.4 |
| 1927 | 2,376 | 0.3 | 9,907 | 0.5 | 4,591 | 0.5 |
| 1928 | 2,141 | 0.3 | 18,424 | 1.0 | 2,552 | 0.3 |
| 1929 | 2,906 | 0.3 | 18,299 | 1.2 | 2,939 | 0.4 |
| 1930 | 2,911 | 0.3 | 24,082 | 1.3 | 1,857 | 0.3 |
| 1931 | 2,688 | 0.2 | 24,316 | 1.3 | 2,081 | 0.3 |
| 1932 | 2,173 | 0.1 | 28,677 | 1.6 | 1,744 | 0.2 |
| 1933 | 2,473 | 0.2 | 26,098 | 1.4 | 4,080 | 0.3 |
| 1934 | 2,933 | 0.3 | 28,431 | 1.6 | 2,477 | 0.3 |
| 1935 | 3,310 | 0.3 | 18,859 | 1.0 | 3,640 | 0.4 |
| 1936 | 4,107 | 0.4 | 22,379 | 1.2 | 4,063 | 0.5 |
| 1937 | 3,939 | 0.5 | 17,110 | 0.9 | 2,952 | 0.4 |
| 1938 | 2,103 | 0.2 | 28,053 | 1.5 | 2,311 | 0.5 |
| 1939 | 1,957 | 0.1 | 19,008 | 1.1 | 2,328 | 0.6 |
| 1940 | 1,237 | 0.1 | 10,754 | 0.5 | 2,324 | 0.7 |
| 1941 | 630 | 0.1 | 193 | - | 4,480 | 1.1 |
| 1942 | 250 | - | 148 | - | 4,191 | 1.2 |
| 1943 | 750 | 0.1 | 84 | - | 4,609 | 1.3 |
| 1944 | 305 | - | 9 | - | 8,051 | 2.9 |
| 1945 | 818 | 0.1 | 72 | - | 8,461 | 3.6 |
| 1946 | 755 | 0.1 | 5,515 | 0.3 | 7,651 | 3.9 |
| 1947 | 2,634 | 0.7 | 109 | - | 7,469 | 3.3 |
| 1948 | 4,190 | 1.2 | 18,236 | 1.7 | 8,882 | 3.4 |
| 1949 | 5,548 | 1.2 | 9,691 | 0.8 | 8,230 | 3.0 |
| 1950 | 5,627 | 1.3 | 12,974 | 1.4 | 8,337 | 4.2 |
| 1951 | 5,987 | 1.9 | 12,675 | 1.4 | 4,492 | 2.5 |
| 1952 | 8,498 | 2,6 | 25,069 | 4.1 | 8,304 | 4.2 |
| 1953 | 8,745 | 2.5 | 20,920 | 3.4 | 9,107 | 3.7 |
| 1954 | 8,277 | 2.5 | 22,541 | 3.1 | 9,360 | 5.6 |
| 1955 | 12,487 | 3.7 | 18,887 | 2.6 | 4,034 | 2.7 |
| 1956 | 13,623 | 4.2 | 29,250 | 4.1 | 7,438 | 3.2 |
| 1957 | 14,355 | 4.5 | 26,031 | 3.6 | 8,258 | 2.4 |
| 1958 | 20,386 | 6.2 | 33,175 | 4.6 | 7,530 | 3.0 |
| 1959 | 29,648 | 8.8 | 34,815 | 4.8 | 4,634 | 2.0 |
| 1960 | 28,655 | 8.4 | 34,839 | 4.8 | 6,526 | 3.4 |
| 1961 | 29,494 | 8.8 | 37,122 | 4.8 | 6,702 | 2.6 |
| Jan-June 1962 | 14,956 | 4.6 | 40,756 | 5.6 | 3,051 | 1.2 |
| Year ended June 1963 | 30,246 | 8.4 | 33,784 | 4.7 | 8,308 | 3.6 |
| 1964 | 42,189 | 11.3 | 38,549 | 5.3 | 9,258 | 3.5 |
| 1965 | 52,594 | 16.8 | 44,066 | 6.1 | 4,634 | 2.0 |
| 1966 | 42,985 | 20.0 | 51,592 | 7.1 | 10,322 | 3..2 |
| 1967 | 43,265 | 18.6 | 40,155 | 5.5 | 11,337 | 3.2 |
| 1968 | 40,923 | 18.1 | 41,543 | 5.7 | 11,919 | 3.7 |
| 1969 | 50,026 | 21.7 | 44,075 | 6.1 | 9,161 | 3.5 |
| 1970 | 61,989 | 25.8 | 57,742 | 9.4 | 7,939 | 3.6 |
| 1971 | 69,534 | 30.2 | 55,596 | 9.2 | 9,719 | 4.9 |
| 1972 | 42,113 | 25.4 | 60,635 | 10.7 | 11,640 | 4.4 |
| 1973* | 27,796 | 22.0 | 69,510 | 13.4 | 15,962 | 6.5 |
| 1974* | 39,965 | 28.6 | 63,803 | 13.3 | 9,370 | 8.9 |
| EXPORTS OF NEW ZEALAND PRODUCE—ctd. | ||||
|---|---|---|---|---|
| Year | Hides and Skins | Sausage Casings | Tallow* | |
*From 1923 to 1948 figures cover only inedible tallow, and unrendered fats of bovine cattle, sheep, or goats are included in all figures. †Provisional. | ||||
| $(m) | $(m) | tonnes | $(m) | |
| 1924 | 6.3 | 1.1 | 24,373 | 1.6 |
| 1925 | 7.7 | 1.4 | 25,440 | 1.8 |
| 1926 | 6.4 | 1.6 | 21,467 | 1.5 |
| 1927 | 6.5 | 1.5 | 24,258 | 1.4 |
| 1928 | 7.7 | 1.6 | 26,161 | 1.6 |
| 1929 | 5.9 | 1.3 | 21,166 | 1.4 |
| 1930 | 4.4 | 1.6 | 25,023 | 1.4 |
| 1931 | 2.5 | 0.8 | 23,637 | 0.8 |
| 1932 | 2.1 | 0.5 | 25,784 | 0.9 |
| 1933 | 3.7 | 0.8 | 28,470 | 1.0 |
| 1934 | 4.4 | 1.3 | 28,106 | 1.0 |
| 1935 | 4.8 | 1.6 | 25,683 | 1.3 |
| 1936 | 6.6 | 1.3 | 26,514 | 1.3 |
| 1937 | 4.5 | 1.5 | 26,356 | 1.3 |
| 1938 | 4.8 | 1.5 | 30,088 | 1.1 |
| 1939 | 5.1 | 1.4 | 29,605 | 0.9 |
| 1940 | 6.5 | 1.8 | 34,686 | 1.4 |
| 1941 | 8.2 | 1.6 | 39,959 | 1.6 |
| 1942 | 9.5 | 1.8 | 52,610 | 2.3 |
| 1943 | 8.8 | 2.2 | 44,660 | 2.1 |
| 1944 | 9.0 | 2.1 | 27,051 | 1.2 |
| 1945 | 10.0 | 2.2 | 31,219 | 1.8 |
| 1946 | 11.5 | 2.8 | 25,153 | 2.1 |
| 1947 | 20.8 | 3.1 | 26,138 | 4.7 |
| 1948 | 18.9 | 4.5 | 20,385 | 4.3 |
| 1949 | 13.4 | 4.1 | 25,840 | 5.1 |
| 1950 | 20.0 | 5.3 | 30,071 | 4.3 |
| 1951 | 25.7 | 7.8 | 30,134 | 5.1 |
| 1952 | 19.9 | 9.8 | 49,395 | 9.4 |
| 1953 | 21.4 | 4.9 | 40,433 | 3.9 |
| 1954 | 20.9 | 6.4 | 39,496 | 5.1 |
| 1955 | 18.4 | 8.1 | 44,131 | 5.7 |
| 1956 | 21.2 | 9.8 | 40,254 | 5.3 |
| 1957 | 20.2 | 9.3 | 46,949 | 6.1 |
| 1958 | 16.6 | 9.0 | 52,083 | 6.8 |
| 1959 | 26.5 | 8.3 | 54,419 | 6.6 |
| 1960 | 26.6 | 7.0 | 60,422 | 5.9 |
| 1961 | 24.3 | 7.3 | 58,649 | 6.3 |
| Jan-June 1962 | 15.2 | 6.0 | 36,635 | 3.1 |
| Year ended June | ||||
| 1963 | 25.4 | 10.5 | 60,352 | 4.8 |
| 1964 | 30.4 | 12.0 | 77,351 | 7.2 |
| 1965 | 31.7 | 11.1 | 58,855 | 7.1 |
| 1966 | 40.0 | 10.9 | 51,586 | 6.7 |
| 1967 | 33.6 | 12.0 | 66,413 | 7.0 |
| 1968 | 39.8 | 9.9 | 74,637 | 7.0 |
| 1969 | 55.4 | 10.9 | 71,742 | 6.6 |
| 1970 | 48.7 | 14.0 | 73,551 | 9.2 |
| 1971 | 50.6 | 14.1 | 65,838 | 10.2 |
| 1972 | 62.2 | 15.4 | 69,651 | 8.9 |
| 1973† | 96.4 | 13.9 | 77,180 | 9.6 |
| 1974† | 67.2 | 16.6 | 54,013 | 13.9 |
| EXPORTS OF NEW ZEALAND PRODUCE—ctd. | |||||
|---|---|---|---|---|---|
| Year | Timber | Wood Pulp | Newsprint | ||
| *Provisional. | |||||
| $(m) | tonnes(000) | $(m) tonnes(000) | $(m) | ||
| 1924 | 0.9 | - | - | - | - |
| 1925 | 1.1 | - | - | - | - |
| 1926 | 1.0 | - | - | - | - |
| 1927 | 0.9 | - | - | - | - |
| 1928 | 0.8 | - | - | - | - |
| 1929 | 0.9 | - | - | - | - |
| 1930 | 0.6 | - | - | - | - |
| 1931 | 0.3 | - | - | - | - |
| 1932 | 0.5 | - | - | - | - |
| 1933 | 0.5 | - | - | - | - |
| 1934 | 0.6 | - | - | - | - |
| 1935 | 0.7 | - | - | - | - |
| 1936 | 0.5 | - | - | - | - |
| 1937 | 0.4 | - | - | - | - |
| 1938 | 0.4 | - | - | - | - |
| 1939 | 0.3 | - | - | - | - |
| 1940 | 0.4 | - | - | - | - |
| 1941 | 0.4 | - | - | - | - |
| 1942 | 0.2 | - | - | - | - |
| 1943 | 0.1 | - | - | - | - |
| 1944 | 0.1 | - | - | - | - |
| 1945 | 0.1 | - | - | - | - |
| 1946 | 0.3 | - | - | - | - |
| 1947 | 0.4 | - | - | - | - |
| 1948 | 1.0 | - | - | - | - |
| 1949 | 1.1 | - | - | - | - |
| 1950 | 0.7 | - | - | - | - |
| 1951 | 1.5 | - | - | - | - |
| 1952 | 1.2 | - | - | - | - |
| 1953 | 1.3 | 4 | 0.4 | - | - |
| 1954 | 1.8 | 20 | 1.6 | - | - |
| 1955 | 2.5 | 28 | 2.3 | - | - |
| 1956 | 2.1 | 48 | 4.0 | 26 | 3.1 |
| 1957 | 1.8 | 66 | 5.3 | 36 | 4.3 |
| 1958 | 2.9 | 70 | 5.5 | 42 | 5.3 |
| 1959 | 4.4 | 78 | 5.8 | 44 | 5.4 |
| 1960 | 4.2 | 71 | 5.6 | 50 | 6.2 |
| 1961 | 4.4 | 65 | 5.0 | 47 | 5.4 |
| Jan-June 1962 | 2.6 | 33 | 2.7 | 22 | 2.3 |
| Year ended June 1963 | 4.1 | 70 | 5.5 | 73 | 8.0 |
| 1964 | 5.0 | 67 | 5.5 | 109 | 11.5 |
| 1965 | 6.5 | 57 | 4.7 | 113 | 11.9 |
| 1966 | 6.5 | 71 | 6.0 | 119 | 11.9 |
| 1967 | 7.3 | 73 | 5.9 | 96 | 10.1 |
| 1968 | 16.5 | 76 | 6.2 | 127 | 15.8 |
| 1969 | 28.5 | 89 | 7.4 | 123 | 16.1 |
| 1970 | 34.1 | 82 | 7.2 | 122 | 15.8 |
| 1971 | 37.1 | 97 | 9.4 | 111 | 14.0 |
| 1972 | 40.9 | 113 | 11.3 | 131 | 16.5 |
| 1973* | 44.9 | 142 | 14.2 | 123 | 16.2 |
| 1974* | 47.8 | 232 | 25.6 | 103 | 14.5 |
| PRODUCTION | ||||||||
|---|---|---|---|---|---|---|---|---|
| Season | Wool Production | Milkfat Production | Timber Production | Meat Production | ||||
| Total Production (Greasy Equivalent) | Average Price (Greasy Wool) | Total Value | Total Production | Yield per Cow in Milk | Average Payout per kg† | |||
*Provisional. †Milkfat for butter and cheese making. Excludes payment for milkfat in milk and cream consumed as such. These figures do not include payments for non-fat solids in the whole milk delivered for butter manufacture; therefore they cannot be used as a measure of total income from milk for manufacture. | ||||||||
| kg(m) | c per kg | $(m) | tonnes (000) | kg | c per kg | m3(000) | tonnes (000) | |
| 1923-24 | 98 | 28.99 | 28.4 | 104 | 88 | 28.48 | 748 | .. |
| 1924-25 | 101 | 37.13 | 37.6 | 109 | 92 | 31.24 | 812 | .. |
| 1925-26 | 103 | 21.91 | 22.7 | 106 | 90 | 33.07 | 833 | .. |
| 1926-27 | 109 | 23.32 | 25.5 | 117 | 99 | 28.48 | 722 | .. |
| 1927-28 | 115 | 30.62 | 35.1 | 120 | 97 | 33.07 | 637 | .. |
| 1928-29 | 119 | 27.34 | 32.6 | 131 | 102 | 34.00 | 637 | |
| 1929-30 | 119 | 15.72 | 18.7 | 142 | 103 | 29.39 | 665 | .. |
| 1930-31 | 117 | 10.43 | 12.3 | 146 | 98 | 21.12 | 540 | .. |
| 1931-32 | 122 | 9.66 | 11.8 | 154 | 98 | 20.21 | 363 | .. |
| 1932-33 | 126 | 9.46 | 11.9 | 180 | 104 | 16.53 | 392 | .. |
| 1933-34 | 132 | 20.35 | 26.8 | 194 | 107 | 16.53 | 467 | .. |
| 1934-35 | 120 | 12.02 | 14.4 | 186 | 102 | 17.46 | 576 | .. |
| 1935-36 | 138 | 16.78 | 23.1 | 198 | 109 | 22.97 | 691 | .. |
| 1936-37 | 137 | 28.86 | 39.7 | 208 | 115 | 25.18 | 722 | .. |
| 1937-38 | 135 | 18.45 | 24.9 | 197 | 112 | 27.93 | 762 | .. |
| 1938-39 | 149 | 16.84 | 25.1 | 181 | 104 | 30.31 | 748 | .. |
| 1939-40 | 141 | 22.44 | 33.2 | 195 | 112 | 30.69 | 793 | .. |
| 1940-41 | 151 | 22.49 | 35.5 | 211 | 119 | 30.69 | 807 | .. |
| 1941-42 | 156 | 20.51 | 37.0 | 198 | 112 | 30.86 | 765 | .. |
| 1942-43 | 154 | 25.64 | 41.3 | 185 | 106 | 31.42 | 807 | .. |
| 1943-44 | 150 | 25.66 | 40.2 | 176 | 105 | 33.44 | 828 | .. |
| 1944-45 | 169 | 25.68 | 45.3 | 196 | 115 | 37.30 | 802 | .. |
| 1945-46 | 166 | 25.514 | 44.1 | 169 | 100 | 38.96 | 814 | 541 |
| 1946-47 | 166 | 33.00 | 54.5 | 185 | 110 | 43.54 | 835 | 560 |
| 1947-48 | 164 | 46.14 | 75.8 | 190 | 109 | 48.88 | 1,017 | 549 |
| 1948-49 | 166 | 47.42 | 78.9 | 207 | 117 | 51.08 | 1,109 | 556 |
| 1949-50 | 177 | 69.78 | 123.4 | 211 | 113 | 53.64 | 1,128 | 577 |
| 1950-51 | 177 | 161.38 | 285.5 | 222 | 116 | 56.95 | 1,246 | 530 |
| 1951-52 | 185 | 73.83 | 136.3 | 225 | 117 | 63.56 | 1,357 | 602 |
| 1952-53 | 190 | 84.86 | 160.9 | 240 | 122 | 68.34 | 1,357 | 578 |
| 1953-54 | 193 | 92.33 | 178.4 | 223 | 111 | 71.47 | 1,354 | 589 |
| 1954-55 | 206 | 91.25 | 188.3 | 228 | 113 | 70.17 | 1,454 | 637 |
| 1955-56 | 210 | 84.86 | 177.8 | 238 | 118 | 69.82 | 1,477 | 682 |
| 1956-57 | 223 | 100.60 | 224 | 235 | 117 | 70.00 | 1,409 | 670 |
| 1957-58 | 225 | 75.62 | 170.1 | 250 | 127 | 67.79 | 1,409 | 688 |
| 1958-59 | 245 | 66.27 | 162.3 | 250 | 129 | 60.25 | 1,503 | 731 |
| 1959-60 | 262 | 82.03 | 214.7 | 245 | 129 | 69.45 | 1,638 | 773 |
| 1960-61 | 267 | 74.12 | 197.7 | 249 | 128 | 61.55 | 1,685 | 758 |
| 1961-62 | 266 | 71.98 | 191.7 | 248 | 125 | 60.80 | 1,635 | 821 |
| 1962-63 | 281 | 78.70 | 221.3 | 253 | 126 | 60.45 | 1,517 | 828 |
| 1963-64 | 279 | 101.17 | 283.1 | 265 | 131 | 64.29 | 1,572 | 866x |
| 1964-65 | 283 | 77.40 | 218.8 | 282 | 138 | 67.62 | 1,737 | 836x |
| 1965-66 | 315 | 76.46 | 241.1 | 292 | 140 | 65.75 | 1,808 | 843x |
| 1966-67 | 322 | 64.77 | 208.4 | 296 | 138 | 65.86 | 1,770 | 905x |
| 1967-68 | 330 | 50.42 | 166.5 | 289 | 129 | 61.95 | 1,621 | 1,002x |
| 1968-69 | 332 | 61.86 | 205.4 | 301 | 130 | 60.58 | 1,697 | 1,030x |
| 1969-70 | 328 | 56.48 | 185.3 | 278 | 120 | 61.25 | 1,805 | 1,051x |
| 1970-71 | 334 | 53.42 | 178.4 | 279 | 125 | 65.50 | 1,850 | 1,055x |
| 1971-72 | 322 | 66.46 | 214.2 | 294 | 133 | 71.94 | 1,747 | 1,082x |
| 1972-73 | 309 | 143.96 | 444.5 | 283 | 129 | 78.72x | 1,785 | 1,097x |
| 1973-74 | 285 | 139.19 | 396.4 | 264 | 121 | 80.89* | 2,055 | 990* |
| 1974-75 | 294 | 91.75 | 269.8 | |||||
| FACTORY PRODUCTION | ||||||||
|---|---|---|---|---|---|---|---|---|
| Year | Establishments | Persons* Engaged | Salaries* and Wages Paid | Cost of Materials | Other Expenses of Production | Value of Production | Net Output (Net Value Added) | Value of Land and Buildings, Plant and Machinery |
*For the year 1915-16 and earlier years, figures refer to productive employees only. †Estimates based on results of sample survey carried out during that year. N.B. Series revised back to 1956-57 to exclude Industry 468—Motor Vehicle Repairs. | ||||||||
| No. | No. | $(million) | ||||||
| 1885-86 | 1,833 | 19,653 | .. | .. | .. | 12.9 | .. | 8.1 |
| 1890-91 | 2,152 | 23,761 | 3.3 | .. | .. | 17.1 | .. | 8.7 |
| 1895-96 | 2,361 | 25,397 | 3.5 | 7.1 | .. | 18.5 | .. | 9.6 |
| 1900-01 | 3,059 | 38,651 | 5.6 | 15.4 | .. | 33.0 | .. | 13.1 |
| 1905-06 | 3,381 | 45,198 | 7.2 | 26.6 | .. | 43.2 | .. | 19.1 |
| 1910-11 | 3,421 | 42,142 | 8.7 | 37.5 | .. | 57.1 | .. | 24.0 |
| 1915-16 | 3,657 | 44,673 | 10.6 | 59.7 | .. | 83.8 | .. | 31.6 |
| 1920-21 | 3,894 | 62,972 | 23.5 | 106.0 | .. | 151.0 | .. | 51.4 |
| 1925-26 | 4,643 | 70,212 | 28.3 | 102.6 | 14.5 | 156.9 | .. | 64.8 |
| 1930-31 | 5,047 | 70,625 | 27.8 | 90.6 | 16.9 | 143.4 | 37.0 | 69.0 |
| 1933-34 | 4,883 | 65,961 | 21.5 | 87.0 | 15.1 | 131.8 | 30.7 | 63.9 |
| 1934-35 | 5,126 | 72,095 | 23.4 | 97.7 | 16.3 | 146.6 | 33.7 | 64.8 |
| 1935-36 | 5,391 | 78,701 | 26.2 | 113.7 | 17.3 | 167.5 | 37.5 | 66.4 |
| 1936-37 | 5,584 | 87,822 | 32.6 | 135.0 | 19.6 | 198.8 | 45.3 | 68.8 |
| 1937-38 | 5,780 | 93,534 | 37.4 | 143.5 | 19.6 | 213.0 | 51.0 | 72.6 |
| 1938-39 | 6,002 | 93,638 | 39.9 | 142.3 | 18.6 | 213.2 | 53.4 | 77.2 |
| 1939-40 | 6,198 | 99,349 | 43.8 | 160.4 | 20.7 | 240.6 | 60.8 | 82.0 |
| 1940-41 | 6,252 | 104,784 | 48.6 | 186.0 | 22.4 | 274.8 | 67.7 | 84.3 |
| 1941-42 | 6,225 | 108,275 | 53.6 | 193.0 | 24.1 | 291.2 | 75.5 | 87.5 |
| 1942-43 | 5,985 | 106,179 | 58.9 | 203.8 | 25.1 | 311.6 | 84.0 | 89.3 |
| 1943-44 | 6,062 | 109,221 | 62.8 | 214.1 | 27.3 | 329.7 | 89.8 | 92.0 |
| 1944-45 | 6,340 | 113,534 | 68.4 | 233.0 | 29.1 | 357.2 | 96.6 | 97.5 |
| 1945-46 | 6,847 | 118,886 | 75.8 | 234.1 | 30.6 | 367.1 | 103.9 | 103.6 |
| 1946-47 | 7,498 | 124,925 | 83.0 | 262.7 | 34.6 | 411.3 | 115.8 | 111.6 |
| 1947-48 | 7,822 | 130,504 | 95.9 | 349.7 | 40.2 | 518.4 | 130.5 | 126.6 |
| 1948-49† | 7,852 | 132,427 | 102.8 | 390.1 | 43.9 | 572.8 | 141.0 | 147.2 |
| 1949-50 | 7,815 | 133,245 | 112.5 | 430.0 | 48.3 | 634.7 | 158.8 | 156.0 |
| 1950-51 | 8,113 | 138,435 | 130.0 | 533.8 | 57.7 | 760.4 | 171.6 | 175.2 |
| 1951-52 | 8,546 | 144,352 | 150.1 | 581.5 | 64.0 | 862.0 | 219.7 | 195.0 |
| 1952-53 | 8,511 | 143,164 | 157.0 | 637.9 | 70.5 | 927.9 | 222.9 | 218.2 |
| 1953-54 | 8,377 | 146.488 | 173.2 | 665.7 | 80.5 | 990.4 | 247.8 | 244.5 |
| 1954-55 | 8,366 | 153,575 | 196.8 | 730.6 | 95.7 | 1,101.2 | 278.6 | 276.5 |
| 1955-56 | 8,515 | 158,238 | 215.9 | 769.6 | 113.1 | 1,171.9 | 294.4 | 337.1 |
| 1956-57 | 6,793 | 143,040 | 203.3 | 766.2 | 80.6 | 1,152.0 | 277.7 | 334.4 |
| 1957-58 | 6,774 | 148,641 | 219.8 | 810.5 | 88.7 | 1,233.4 | 303.5 | 349.9 |
| 1958-59 | 6,757 | 153,811 | 235.3 | 808.5 | 96.7 | 1,257.4 | 321.9 | 380.9 |
| 1959-60 | 6,709 | 156.778 | 250.0 | 846.3 | 101.5 | 1,345.0 | 366.8 | 415.7 |
| 1960-61 | 6,875 | 165,572 | 277.3 | 905.0 | 111.0 | 1,441.9 | 393.9 | 462.8 |
| 1961-62 | 6,984 | 171,108 | 296.9 | 936.7 | 120.5 | 1,532.4 | 439.3 | 521.6 |
| 1962-63 | 7,025 | 174,417 | 312.2 | 964.1 | 128.4 | 1,596.7 | 461.9 | 591.8 |
| 1963-64 | 7,317 | 181,399 | 338.6 | 1,115.0 | 139.3 | 1,832.0 | 531.7 | 626.5 |
| 1964-65 | 7,554 | 191,995 | 378.8 | 1,292.5 | 156.2 | 2,081.6 | 580.6 | 693.3 |
| 1965-66 | 7,659 | 203,165 | 418.8 | 1,360.0 | 174.9 | 2,260.7 | 664.0 | 792.1 |
| 1966-67 | 7,838 | 207,999 | 451.7 | 1,402.3 | 193.8 | 2,354.9 | 691.0 | 874.3 |
| 1967-68 | 7,788 | 204,510 | 454.2 | 1,427.1 | 203.9 | 2,404.9 | 704.0 | 912.2 |
| 1968-69 | 7,667 | 207,703 | 483.5 | 1,591.0 | 224.7 | 2,645.8 | 757.1 | 969.0 |
| 1969-70 | 7,686 | 220,108 | 559.6 | 1,791.4 | 255.1 | 2,994.8 | 867.1 | 1,130.4 |
| 1970-71 | 7,600 | 229,104 | 676.0 | 2,014.6 | 306.7 | 3,401.4 | 995.7 | 1,239.3 |
| 1971-72 | 7,783 | 232,424 | 780.3 | 2,288.6 | 354.4 | 3,874.3 | 1,130.7 | 1,436.9 |
| 1972-73 | 7,669x | 235,648x | 875.4x | 2,787.2x | 561.5 | 4,611.3x | 1,301.7x | 1,634.0 |
| 1973-74 | 7,690 | 244,522 | 1,042.2 | 3,112.8 | 683.7 | 5,250.9 | 1,502.4 | .. |
| REVENUE AND EXPENDITURE OF CENTRAL GOVERNMENT | ||||||
|---|---|---|---|---|---|---|
| Year Ended 31 March | Receipts | Payments | Deficit | Surplus | ||
| From Taxation | From Other Sources | Total | ||||
*Excludes duty on motor spirits refunded under the Transport Amendment Act; $1.9 million in 1958-59, $4.7 million in 1959-60, $2.0 million in 1960-61, $0.8 million in 1961-62, $0.8 million in 1962-63, $0.8 million in 1963-64. NOTE—The figures shown in the above table are not on a comparable basis over the whole period. | ||||||
| $(million) | ||||||
| CONSOLIDATED FUND | ||||||
| 1925 | 33.1 | 24.2 | 57.3 | 54.8 | ... | 2.5 |
| 1926 | 34.0 | 15.5 | 49.5 | 47.1 | ... | 2.3 |
| 1927 | 33.8 | 16.1 | 49.9 | 48.7 | ... | 1 2 |
| 1928 | 33.7 | 16.6 | 50.2 | 49.9 | ...0.4 | |
| 1929 | 35.7 | 11.5 | 47.2 | 48.4 | 1.2 | ... |
| 1930 | 39.0 | 11.7 | 50.7 | 50.4 | ... | 0.3 |
| 1931 | 37.2 | 8.9 | 46.1 | 49.4 | 3.3 | ... |
| 1932 | 32.4 | 13.1 | 45.4 | 49.7 | 4.3 | ... |
| 1933 | 31.2 | 13.9 | 45.1 | 45.1 | ... | - |
| 1934 | 34.1 | 12.9 | 47.0 | 48.4 | 1.4 | ... |
| 1935 | 40.4 | 11.9 | 52.3 | 49.0 | ... | 3.3 |
| 1936 | 43.1 | 9.2 | 52.3 | 51.8 | ... | 0.6 |
| 1937 | 53.9 | 8.4 | 62.3 | 61.4 | ... | 0.9 |
| 1938 | 63.3 | 26.3 | 89.6 | 88.0 | ... | 1.6 |
| 1939 | 64.6 | 22.8 | 87.4 | 85.8 | ... | 1.6 |
| 1940 | 65.6 | 28.2 | 93.8 | 93.2 | ... | 0.6 |
| 1941 | 68.7 | 32.2 | 102.9 | 98.5 | ... | 3.5 |
| 1942 | 70.3 | 38.7 | 109.1 | 105.8 | ... | 3.3 |
| 1943 | 72.4 | 37.8 | 110.2 | 101.8 | ... | 8.3 |
| 1944 | 84.0 | 31.1 | 115.1 | 110.7 | ... | 4.5 |
| 1945 | 91.4 | 28.5 | 119.9 | 117.4 | ... | 2.4 |
| 1946 | 96.7 | 31.1 | 127.8 | 125.3 | ... | 2.5 |
| 1947 | 181.4 | 35.2 | 216.6 | 207.4 | ... | 9.2 |
| 1948 | 192.2 | 42.0 | 234.2 | 230.7 | ... | 3.6 |
| 1949 | 202.1 | 41.0 | 243.0 | 237.8 | ... | 5.3 |
| 1950 | 207.7 | 42.3 | 250.0 | 241.4 | ... | 8.6 |
| 1951 | 244.4 | 43.2 | 287.5 | 271.0 | ... | 16.5 |
| 1952 | 313.9 | 47.7 | 361.6 | 336.3 | ... | 25.3 |
| 1953 | 308.5 | 47.1 | 355.6 | 349.0 | ... | 6.6 |
| 1954 | 312.4 | 52.2 | 364.6 | 361.0 | ... | 3.6 |
| 1955 | 325.0 | 57.4 | 382.4 | 368.8 | ... | 13.7 |
| 1956 | 334.9 | 60.0 | 394.9 | 386.6 | ... | 8.3 |
| 1957 | 345.6 | 67.0 | 412.6 | 405.9 | ... | 6.7 |
| 1958 | 317.9 | 69.3 | 387.2 | 387.5 | 0.3 | ... |
| 1959 | 409.7 | 71.1 | 480.8* | 480.0* | ... | 0.8 |
| 1960 | 552.9 | 76.8 | 629.7* | 628.4* | ... | 1.3 |
| 1961 | 474.8 | 94.0 | 568.7* | 567.9* | ... | 0.8 |
| 1962 | 508.3 | 93.0 | 601.3* | 600.6* | ... | 0.6 |
| 1963 | 471.5 | 101.8 | 573.3* | 581.2* | 7.9 | ... |
| 1964 | 512.6 | 120.6 | 633.2* | 635.9* | 2.7 | ... |
| CONSOLIDATED REVENUE ACCOUNT | ||||||
| 1965 | 783.2 | 120.5 | 903.7 | 894.5 | ... | 9.2 |
| 1966 | 852.2 | 122.2 | 974.5 | 970.9 | ... | 3.5 |
| 1967 | 918.8 | 132.5 | 1,051.3 | 1,050.6 | ... | 0.7 |
| 1968 | 949.4 | 147.3 | 1,096.7 | 1,095.3 | ... | 1.4 |
| 1969 | 992.1 | 162.5 | 1,154.6 | 1,146.9 | ... | 7.7 |
| 1970 | 1,102.0 | 170.5 | 1,282.5 | 1,275.1 | ... | 7.4 |
| 1971 | 1,363.0 | 203.2 | 1,566.2 | 1,560.9 | ... | 5.3 |
| 1972 | 1,617.3 | 203.4 | 1,820.7 | 1,812.3 | ... | 8.4 |
| 1973 | 1,830.9 | 304.9 | 2,135.8 | 2,141.0 | ... | —5.2 |
| 1974 | 2,291.6 | 220.5 | 2,512.2 | 2,509.8 | ... | 2.4 |
| 1975 | 2,760.5 | 285.5 | 3,046.1 | 3,034.9 | ... | 11.2 |
| GROSS GOVERNMENT EXPENDITURE ON SOCIAL SERVICES | |||||
|---|---|---|---|---|---|
| Year Ended 31 March | Health* | Education | Social Security | War Pensions | Total |
| *Includes hospital boards. | |||||
| $(million) | |||||
| 1950 | 38.8 | 22.0 | 78.6 | 10.7 | 145.1x |
| 1951 | 37.2 | 24.6 | 87.8 | 11.2 | 160.8 |
| 1952 | 44.0 | 29.2 | 97.3 | 12.9 | 183.4 |
| 1953 | 48.8 | 31.4 | 97.9 | 13.3 | 191.4 |
| 1954 | 51.2 | 34.6 | 104.4 | 14.5 | 204.7 |
| 1955 | 56.4 | 38.4 | 110.7 | 16.0 | 221.5 |
| 1956 | 63.2 | 42.4 | 116.1 | 16.9 | 238.6 |
| 1957 | 71.2 | 46.2 | 119.2x | 17.9 | 254.5x |
| 1958 | 78.2 | 51.4 | 124.6 | 19.6 | 273.8 |
| 1959 | 83.0 | 55.8 | 142.5 | 21.9 | 303.2 |
| 1960 | 89.6 | 59.8 | 180.0 | 23.2 | 352.6 |
| 1961 | 97.4 | 67.2 | 192.0 | 27.4 | 384.0 |
| 1962 | 104.0 | 71.0 | 196.3 | 27.5 | 398.8 |
| 1963 | 113.0 | 78.8 | 196.5 | 28.3 | 416.6 |
| 1964 | 121.2 | 87.0 | 205.9 | 29.7 | 443.8 |
| 1965 | 132.0 | 99.0 | 210.3 | 29.9 | 471.2 |
| 1966 | 148.0 | 110.4 | 217.7 | 30.5 | 506.6 |
| 1967 | 161.7 | 124.4 | 225.4 | 30.9 | 542.4 |
| 1968 | 168.2 | 136.8 | 244.8 | 30.7 | 580.5 |
| 1969 | 178.8 | 145.6 | 254.8 | 30.8 | 610.0 |
| 1970 | 200.1 | 168.4 | 272.0 | 32.4 | 672.9 |
| 1971 | 238.7 | 214.9 | 301.3 | 33.5 | 788.4 |
| 1972 | 283.1 | 279.6 | 338.5 | 36.1 | 937.3 |
| 1973 | 333.8 | 309.1 | 468.5x | 40.2 | 1,151.6x |
| 1974 | 390.1 | 367.2 | 574.2 | 44.6 | 1,346.1 |
| SOCIAL SERVICES EXPENDITURE (INCLUDING AND EXCLUDING EDUCATION) AS PERCENTAGE OF GROSS NATIONAL PRODUCT, AND OF TOTAL GOVERNMENT EXPENDITURE | ||||||||
|---|---|---|---|---|---|---|---|---|
| Year Ended 31 March | Gross National Product | Total Government Expenditure | Total Social Services Expenditure | Social Services Expenditure less Education | Total Social Services Expenditure as Percentage of | Social Services Expenditure less Education as Percentage of | ||
| Gross National Product | Total Government Expenditure | Gross National Product | Total Government Expenditure | |||||
| $(m) | $(m) | $(m) | $(m) | % | % | % | % | |
| 1950 | 1,101 | 271.7 | 145.1x | 123.1x | 13.2 | 53.4 | 11.2 | 45.3 |
| 1951 | 1,396 | 282.2 | 160.8 | 136.2 | 11.5 | 57.0 | 9.8 | 48.3 |
| 1952 | 1,446 | 343.9 | 183.4 | 154.2 | 12.7 | 53.3 | 10.7 | 44.8 |
| 1953 | 1,517 | 366.7 | 191.4 | 160.0 | 12.6 | 52.2 | 10.6 | 43.6 |
| 1954 | 1,681 | 388.4 | 204.7 | 170.1 | 12.2 | 52.7 | 10.1 | 43.8 |
| 1955 | 1,860 | 402.1 | 221.5 | 183.1 | 11.9 | 55.1 | 9.8 | 45.5 |
| 1956 | 1,965 | 427.5 | 238.6 | 196.2 | 12.1 | 55.8 | 10.0 | 45.9 |
| 1957 | 2,061 | 462.9 | 254.5x | 208.3x | 12.3 | 55.0 | 10.1 | 45.0 |
| 1958 | 2,184 | 489.6 | 273.8 | 222.4 | 12.5 | 55.9 | 10.2 | 45.4 |
| 1959 | 2,270 | 527.9 | 303.2 | 247.4 | 13.4 | 57.4 | 10.9 | 46.9 |
| 1960 | 2,434 | 585.4 | 352.6 | 292.8 | 14.5 | 60.2 | 12.0 | 50.0 |
| 1961 | 2,622 | 631.4 | 384.0 | 316.8 | 14.6 | 60.8 | 12.1 | 50.2 |
| 1962 | 2,722 | 654.9 | 398.8 | 327.8 | 14.7 | 60.9 | 12.0 | 50.1 |
| 1963 | 2,921 | 691.2 | 416.6 | 337.8 | 14.3 | 60.3 | 11.6 | 48.9 |
| 1964 | 3,197 | 738.2 | 443.8 | 356.8 | 13.9 | 60.1 | 11.2 | 48.3 |
| 1965 | 3,491 | 802.0 | 471.2 | 372.2 | 13.5 | 58.8 | 10.7 | 46.4 |
| 1966 | 3,784 | 872.1 | 506.6 | 396.2 | 13.4 | 58.1 | 10.5 | 45.4 |
| 1967 | 3,932x | 935.6 | 542.4 | 418.0 | 13.8 | 58.0 | 10.6 | 44.7 |
| 1968 | 4,082x | 966.5 | 580.5 | 443.7 | 14.2 | 60.1 | 10.9 | 45.9 |
| 1969 | 4,307x | 1,031.8 | 610.0 | 464.4 | 14.2 | 59.1 | 10.8 | 45.0 |
| 1970 | 4,753x | 1,142.5 | 672.9 | 504.5 | 14.1 | 58.9 | 10.6 | 44.2 |
| 1971 | 5,447x | 1,346.6 | 788.4 | 573.5 | 14.5 | 58.5 | 10.5 | 42.6 |
| 1972 | 6,339x | 1,579.7x | 937.3 | 657.7 | 14.8 | 59.3 | 10.4 | 41.6 |
| 1973 | 7,297x | 1,884.7x | 1,151.6 | 842.5 | 15.8 | 61.1 | 11.5 | 44.7 |
| 1974 | 8,593 | 2,217.9 | 1,376.1 | 1,101.1 | 16.0 | 62.0 | 12.8 | 49.6 |
| INDEBTEDNESS OF CENTRAL GOVERNMENT—AMOUNT OF DEBENTURES AND STOCK IN CIRCULATION | ||||||
|---|---|---|---|---|---|---|
| (Nominal Amounts) | ||||||
| As at 31 March | Domiciled in | Total | Per Head of Population | |||
| United States and World Bank | London and Europe | Australia | New Zealand | |||
*Includes $1.9 million in 1964, $17.5 million in 1965, $29.9 million in 1966, $44.9 million in 1967, $65.1 million in 1968, $72.3 million in 1969, $76.8 million in 1970, and $74.5 million in 1971 held by International Bank for Reconstruction and Development. †Comparability affected by devaluation on 22 November 1967. Devaluation adjustments added $21.5 million to the debt in London and $29.0 million to the debt in United States | ||||||
| NZ$(million) | $ | |||||
| 1925 | - | 241.6 | 5.9 | 208.1 | 455.6 | 330.30 |
| 1926 | - | 256.1 | 7.3 | 214.3 | 477.7 | 338.80 |
| 1927 | - | 265.0 | 8.1 | 218.6 | 491.7 | 341.90 |
| 1928 | - | 279.5 | 8.3 | 214.9 | 502.8 | 343.80 |
| 1929 | - | 298.7 | 8.3 | 221.4 | 528.4 | 359.80 |
| 1930 | - | 293.2 | 8.6 | 233.1 | 534.8 | 359.20 |
| 1931 | - | 309.1 | 8.4 | 234.7 | 552.1 | 365.20 |
| 1932 | - | 268.9 | 7.8 | 236.8 | 511.5 | 335.30 |
| 1933 | - | 270.4 | 5.7 | 236.7 | 512.9 | 333.50 |
| 1934 | - | 269.4 | 5.8 | 278.0 | 553.2 | 356.90 |
| 1935 | - | 269.6 | 4.4 | 234.9 | 508.8 | 325.90 |
| 1936 | - | 265.0 | 3.2 | 244.5 | 512.7 | 325.80 |
| 1937 | - | 261.1 | 1.8 | 260.1 | 523.0 | 329.30 |
| 1938 | - | 261.5 | 1.8 | 264.9 | 528.0 | 329.10 |
| 1939 | - | 261.3 | 1.8 | 292.5 | 555.6 | 341.90 |
| 1940 | - | 263.3 | 1.8 | 328.3 | 593.4 | 361.70 |
| 1941 | - | 264.4 | 1.8 | 380.4 | 646.5 | 395.10 |
| 1942 | - | 255.1 | 1.7 | 461.6 | 718.4 | 439.60 |
| 1943 | - | 264.2 | 1.7 | 609.4 | 875.3 | 535.60 |
| 1944 | - | 265.9 | 1.7 | 733.5 | 1,001.1 | 608.90 |
| 1945 | - | 266.2 | 1.7 | 806.5 | 1,074.5 | 639.60 |
| 1946 | - | 189.1 | 1.7 | 945.5 | 1,136.3 | 646.80 |
| 1947 | - | 189.1 | 1.7 | 966.0 | 1,156.8 | 646.40 |
| 1948 | - | 166.4 | 1.6 | 988.2 | 1,156.2 | 632.50 |
| 1949 | - | 159.9 | 1.3 | 1,068.8 | 1,230.0 | 659.70 |
| 1950 | - | 156.3 | 1.3 | 1,130.2 | 1,287.8 | 676.70 |
| 1951 | - | 155.6 | - | 1,178.8 | 1,334.5 | 688.60 |
| 1952 | - | 155.6 | - | 1,151.8 | 1,307.3 | 658.70 |
| 1953 | - | 155.6 | - | 1,179.8 | 1,335.4 | 655.40 |
| 1954 | - | 175.6 | - | 1,233.2 | 1,408.7 | 674.80 |
| 1955 | - | 195.6 | - | 1,261.6 | 1,457.2 | 683.80 |
| 1956 | - | 191.6 | - | 1,278.8 | 1,470.4 | 675.90 |
| 1957 | 8.9 | 200.9 | - | 1,304.5 | 1,514.2 | 681.70 |
| 1958 | 7.9 | 199.2 | - | 1,357.1 | 1,564.2 | 687.40 |
| 1959 | 47.1 | 236.6 | - | 1,349.0 | 1,633.1 | 702.10 |
| 1960 | 37.9 | 235.5 | - | 1,415.6 | 1,689.0 | 712.60 |
| 1961 | 37.0 | 216.3 | - | 1,483.0 | 1,736.3 | 719.20 |
| 1962 | 25.1 | 254.0 | - | 1,528.6 | 1,807.7 | 730.50 |
| 1963 | 41.5 | 272.5 | - | 1,620.4 | 1,934.3 | 765.18 |
| 1964 | 41.8 | 279.9 | - | 1,700.0 | 2,021.7 | 782.89 |
| 1965 | 54.3* | 276.5 | - | 1,908.8 | 2,139.6 | 813.87 |
| 1966 | 88.3* | 244.8 | - | 1,922.8 | 2,256.0 | 842.78 |
| 1967 | 107.3* | 283.4 | - | 2,021.3 | 2,412.0 | 884.42 |
| 1968† | 170.7* | 329.4 | - | 2,116.5 | 2,616.6 | 949.72 |
| 1969 | 179.2* | 336.2 | - | 2,261.0 | 2,776.5 | 998.40 |
| 1970 | 184.2* | 341.6 | - | 2,351.3 | 2,887.1 | 1,023.50 |
| 1971 | 178.6 | 397.8 | - | 2,430.5 | 3,007.0 | 1,051.06 |
| 1972 | 159.4 | 494.1 | - | 2,533.0 | 3,186.6 | 1,095.22 |
| 1973 | 135.1 | 428.9 | - | 2,939.1 | 3,503.1 | 1,198.00 |
| 1974 | 113.3 | 351.9 | - | 3,269.3 | 3,734.5 | 1,220.75 |
| 1975 | 180.1 | 682.6 | - | 3,336.9 | 4,199.7 | 1,372.27 |
| LOCAL AUTHORITIES* | ||||||
|---|---|---|---|---|---|---|
| Year Ended 31 March | Receipts | Payments | Total Gross Indebtedness† | |||
| Revenue | Other Receipts | Total | ||||
| From Rates | From Other Sources | |||||
*Exclusive of hospital boards. †Debt up to 1967 shown at its nominal amount, that portion domiciled overseas not being converted to its New Zealand currency equivalent. As from 1968 the gross public debt is shown in New Zealand currency only, including overseas debt. ‡Includes petrol tax $14.9 million in 1971-72 and $16.7 million in 1972-73. | ||||||
| $(million) | ||||||
| 1923 | 8.6 | 12.5 | 14.8 | 35.8 | 31.4 | 86.4 |
| 1924 | 8.9 | 13.4 | 11.4 | 33.7 | 33.0 | 93.1 |
| 1925 | 9.3 | 14.4 | 15.9 | 39.6 | 38.8 | 106.7 |
| 1926 | 10.1 | 16.0 | 15.7 | 41.8 | 41.8 | 118.8 |
| 1927 | 10.6 | 17.2 | 14.0 | 41.9 | 43.5 | 128.0 |
| 1928 | 11.2 | 19.0 | 12.0 | 42.1 | 44.9 | 132.8 |
| 1929 | 11.7 | 18.4 | 12.9 | 42.9 | 42.6 | 138.6 |
| 1930 | 12.0 | 20.7 | 11.9 | 44.5 | 44.1 | 142.4 |
| 1931 | 11.3 | 20.4 | 9.7 | 41.4 | 44.4 | 145.4 |
| 1932 | 11.0 | 18.1 | 10.0 | 39.1 | 40.2 | 144.8 |
| 1933 | 10.5 | 17.0 | 9.8 | 37.2 | 37.8 | 145.0 |
| 1934 | 11.0 | 16.5 | 8.5 | 36.1 | 35.5 | 142.0 |
| 1935 | 11.0 | 17.2 | 9.0 | 37.2 | 37.4 | 142.5 |
| 1936 | 11.2 | 18.0 | 9.9 | 39.0 | 38.7 | 140.8 |
| 1937 | 12.0 | 19.1 | 9.4 | 40.5 | 40.4 | 137.1 |
| 1938 | 13.1 | 21.1 | 9.7 | 43.9 | 44.1 | 136.1 |
| 1939 | 14.0 | 22.6 | 13.5 | 50.0 | 50.2 | 136.4 |
| 1940 | 14.6 | 24.4 | 14.5 | 53.5 | 51.4 | 139.0 |
| 1941 | 14.7 | 25.4 | 10.2 | 50.3 | 49.5 | 136.0 |
| 1942 | 14.9 | 26.0 | 7.2 | 48.0 | 48.1 | 133.2 |
| 1943 | 15.5 | 27.4 | 6.1 | 49.0 | 46.5 | 130.3 |
| 1944 | 15.6 | 29.6 | 4.9 | 50.0 | 47.6 | 126.5 |
| 1945 | 15.8 | 30.1 | 5.0 | 50.9 | 50.4 | 122.5 |
| 1946 | 17.3 | 30.8 | 6.4 | 54.4 | 54.7 | 120.0 |
| 1947 | 19.1 | 33.0 | 8.5 | 60.6 | 61.0 | 115.6 |
| 1948 | 19.6 | 34.4 | 10.0 | 64.0 | 64.9 | 114.2 |
| 1949 | 21.6 | 38.2 | 12.3 | 72.0 | 71.6 | 113.2 |
| 1950 | 23.3 | 40.7 | 16.2 | 80.2 | 79.3 | 112.6 |
| 1951 | 25.2 | 43.4 | 16.7 | 85.3 | 86.5 | 112.2 |
| 1952 | 29.0 | 49.1 | 21.3 | 98.4 | 97.7 | 115.7 |
| 1953 | 30.8 | 55.2 | 31.5 | 117.4 | 116.7 | 128.9 |
| 1954 | 32.8 | 64.6 | 41.0 | 138.5 | 136.4 | 146.9 |
| 1955 | 36.5 | 70.6 | 42.1 | 149.2 | 148.0 | 158.6 |
| 1956 | 37.8 | 76.8 | 50.9 | 165.4 | 167.1 | 176.0 |
| 1957 | 41.3 | 79.1 | 60.7 | 181.2 | 181.5 | 198.2 |
| 1958 | 45.4 | 84.7 | 71.1 | 201.2 | 196.6 | 229.4 |
| 1959 | 48.8 | 97.8 | 69.6 | 216.2 | 213.2 | 255.9 |
| 1960 | 51.5 | 101.7 | 83.6 | 231.8 | 231.2 | 287.1 |
| 1961 | 55.0 | 108.7 | 88.1 | 251.8 | 245.0 | 318.8 |
| 1962 | 58.0 | 118.9 | 78.7 | 255.6 | 267.5 | 337.6 |
| 1963 | 62.4 | 125.5 | 96.2 | 284.1 | 286.5 | 370.2 |
| 1964 | 68.3 | 153.2 | 120.0 | 351.5 | 329.6 | 401.8 |
| 1965 | 77.2 | 164.0 | 122.7 | 363.8 | 361.1 | 436.2 |
| 1966 | 80.5 | 176.4 | 119.0 | 375.8 | 387.5 | 461.4 |
| 1967 | 85.9 | 191.2 | 119.4 | 396.5 | 401.6 | 485.0 |
| 1968 | 92.4 | 200.2 | 137.3 | 430.0 | 420.7 | 533.5 |
| 1969 | 99.9 | 223.7 | 149.1 | 472.6 | 456.6 | 564.3 |
| 1970 | 108.1 | 240.2 | 155.1 | 503.3 | 492.1 | 597.2 |
| 1971 | 117.9 | 262.7 | 155.5 | 536.2 | 539.2 | 629.8 |
| 1972 | 126.3 | 297.6 | 169.6† | 593.5 | 604.7 | 667.1 |
| 1973 | 148.5 | 330.9 | 216.6‡ | 696.0 | 674.2 | 722.4 |
| LOCAL AUTHORITIES*—LOAN INDEBTEDNESS† | ||||||
|---|---|---|---|---|---|---|
| (Exclusive of Inscribed Debt) | ||||||
| As at 31 March | Counties | Cities and Boroughs | Harbour Boards | Electric Power Districts | Other | Total |
*Exclusive of hospital boards. †Debt up to 1967 shown at its nominal amount, that portion domiciled overseas not being converted to its New Zealand currency equivalent. As from 1968 the gross public debt is shown in New Zealand currency only, including overseas debt. | ||||||
| $(million) | ||||||
| 1923 | 7.6 | 43.2 | 17.2 | 6.1 | 7.6 | 81.7 |
| 1924 | 8.0 | 44.2 | 18.3 | 9.5 | 8.5 | 88.4 |
| 1925 | 9.2 | 51.8 | 19.5 | 13.0 | 8.6 | 102.2 |
| 1926 | 10.8 | 56.1 | 20.0 | 17.5 | 10.1 | 114.4 |
| 1927 | 12.0 | 60.1 | 20.5 | 20.2 | 10.8 | 123.6 |
| 1928 | 12.4 | 63.2 | 21.0 | 20.4 | 11.6 | 128.5 |
| 1929 | 12.7 | 64.5 | 21.5 | 24.0 | 11.7 | 134.4 |
| 1930 | 13.1 | 63.0 | 20.9 | 25.3 | 16.1 | 138.4 |
| 1931 | 13.3 | 64.3 | 21.0 | 26.0 | 16.9 | 141.4 |
| 1932 | 13.4 | 63.4 | 21.1 | 26.2 | 16.9 | 141.0 |
| 1933 | 13.2 | 63.6 | 21.2 | 26.1 | 17.1 | 141.2 |
| 1934 | 13.1 | 62.7 | 21.0 | 26.4 | 17.0 | 140.3 |
| 1935 | 12.8 | 62.0 | 21.1 | 26.8 | 16.4 | 139.0 |
| 1936 | 12.5 | 61.5 | 20.4 | 27.0 | 16.3 | 137.5 |
| 1937 | 12.3 | 61.0 | 20.3 | 24.1 | 16.1 | 134.0 |
| 1938 | 12.2 | 61.1 | 19.7 | 23.8 | 16.2 | 133.0 |
| 1939 | 12.2 | 61.2 | 19.5 | 24.9 | 15.5 | 133.4 |
| 1940 | 12.4 | 61.5 | 19.9 | 26.2 | 16.0 | 136.0 |
| 1941 | 12.3 | 60.0 | 19.9 | 26.2 | 14.7 | 133.1 |
| 1942 | 12.2 | 59.3 | 19.6 | 25.0 | 14.6 | 130.7 |
| 1943 | 11.7 | 57.7 | 19.6 | 24.7 | 14.2 | 128.0 |
| 1944 | 11.3 | 56.4 | 19.4 | 23.6 | 13.9 | 124.6 |
| 1945 | 10.8 | 55.1 | 19.0 | 23.1 | 12.9 | 120.8 |
| 1946 | 10.4 | 54.5 | 18.7 | 22.4 | 12.7 | 118.7 |
| 1947 | 9.9 | 53.4 | 16.8 | 21.7 | 12.5 | 114.3 |
| 1948 | 9.5 | 53.0 | 16.5 | 22.2 | 12.1 | 113.2 |
| 1949 | 9.3 | 51.9 | 16.1 | 23.2 | 12.0 | 112.4 |
| 1950 | 8.9 | 52.2 | 15.6 | 24.0 | 11.4 | 112.1 |
| 1951 | 8.6 | 52.5 | 14.8 | 24.9 | 11.2 | 112.0 |
| 1952 | 8.6 | 54.3 | 15.0 | 26.0 | 11.8 | 115.7 |
| 1953 | 8.6 | 59.5 | 17.8 | 28.8 | 14.1 | 128.8 |
| 1954 | 8.6 | 68.0 | 20.7 | 31.9 | 17.6 | 146.9 |
| 1955 | 9.2 | 73.4 | 21.6 | 34.4 | 20.0 | 158.6 |
| 1956 | 10.2 | 80.2 | 23.2 | 37.7 | 24.6 | 176.0 |
| 1957 | 11.9 | 89.4 | 26.1 | 39.6 | 31.3 | 198.2 |
| 1958 | 13.5 | 102.8 | 31.4 | 42.6 | 39.0 | 229.4 |
| 1959 | 14.8 | 111.5 | 35.1 | 45.9 | 48.6 | 256.0 |
| 1960 | 17.4 | 124.1 | 40.1 | 47.8 | 57.7 | 287.1 |
| 1961 | 19.8 | 132.6 | 46.0 | 49.3 | 71.2 | 318.8 |
| 1962 | 22.3 | 141.4 | 48.0 | 51.4 | 74.4 | 337.6 |
| 1963 | 24.0 | 156.6 | 56.1 | 54.1 | 79.5 | 370.2 |
| 1964 | 28.4 | 172.4 | 65.4 | 53.7 | 81.8 | 401.8 |
| 1965 | 31.8 | 187.2 | 72.1 | 58.1 | 87.0 | 436.2 |
| 1966 | 31.5 | 202.5 | 79.8 | 60.0 | 87.6 | 461.4 |
| 1967 | 35.5 | 214.4 | 82.8 | 62.0 | 90.3 | 485.0 |
| 1968 | 40.2 | 227.7 | 88.0 | 64.5 | 113.0 | 533.5 |
| 1969 | 42.9 | 241.2 | 95.2 | 66.5 | 118.5 | 564.3 |
| 1970 | 46.1 | 251.8 | 103.3 | 70.6 | 125.4 | 597.2 |
| 1971 | 48.1 | 265.0 | 111.1 | 73.8 | 131.8 | 629.8 |
| 1972 | 53.6 | 277.3 | 121.5 | 76.3 | 138.4 | 667.1 |
| 1973 | 61.3 | 300.4 | 127.7 | 85.6 | 147.4 | 722.4 |
| BANKING AND CURRENCY | ||||||||
|---|---|---|---|---|---|---|---|---|
| Year | Assets of Trading Banks | Liabilities of Trading Banks | Notes in Hands of Public† | Net Overseas Assets of Banking System†|| | ||||
| Advances and Discounts*† | Notes and Coin and Balances at Reserve Bank‡ | Investments‡ | Total Selected Assets§ | Deposits† | Total Selected Liabilities‡ | |||
*Includes term loans and export finance from 1964 on. †Average of weekly figures. ‡Average of monthly figures. §As at last balance day in December, assets exclude shareholders' funds, while both assets and liabilities exclude inter-branch accounts within New Zealand, contingencies, and certain transit items. ||Includes holdings of Reserve Bank. ¶Devaluation adjustment November 1967. Includes holdings | ||||||||
| $(million) | ||||||||
| 1935 | 89.4 | 19.4 | 10.2 | 166.0 | 123.0 | 132.0 | 12.8 | 84.0 |
| 1936 | 91.8 | 25.0 | 11.0 | 167.8 | 130.4 | 131.8 | 15.0 | 78.2 |
| 1937 | 98.4 | 28.2 | 15.8 | 171.6 | 133.6 | 135.6 | 17.8 | 63.4 |
| 1938 | 111.4 | 23.0 | 15.8 | 170.2 | 130.0 | 133.6 | 20.0 | 42.0 |
| 1939 | 109.4 | 31.6 | 23.0 | 192.2 | 134.6 | 152.0 | 24.0 | 20.6 |
| 1940 | 96.0 | 40.4 | 33.6 | 203.0 | 154.8 | 164.0 | 29.6 | 47.2 |
| 1941 | 99.4 | 35.4 | 42.0 | 210.6 | 161.4 | 168.2 | 34.8 | 60.2 |
| 1942 | 90.8 | 47.6 | 56.2 | 237.8 | 181.8 | 201.6 | 43.0 | 77.0 |
| 1943 | 86.6 | 65.8 | 75.4 | 265.4 | 212.6 | 229.2 | 55.2 | 84.4 |
| 1944 | 93.6 | 78.8 | 77.2 | 281.8 | 235.2 | 244.4 | 64.2 | 99.6 |
| 1945 | 103.6 | 104.8 | 63.6 | 329.0 | 260.2 | 285.2 | 70.0 | 160.8 |
| 1946 | 116.6 | 135.6 | 57.0 | 358.0 | 299.6 | 321.0 | 76.4 | 201.4 |
| 1947 | 153.0 | 132.0 | 46.0 | 384.0 | 328.4 | 355.2 | 80.2 | 205.2 |
| 1948 | 196.4 | 137.6 | 37.8 | 387.0 | 351.0 | 381.6 | 81.6 | 168.2 |
| 1949 | 166.8 | 172.2 | 29.4 | 416.6 | 372.2 | 417.8 | 85.0 | 141.2 |
| 1950 | 189.4 | 173.4 | 26.8 | 450.6 | 404.4 | 468.0 | 90.4 | 150.2 |
| 1951 | 265.8 | 166.6 | 26.4 | 540.6 | 501.4 | 550.6 | 98.0 | 208.0 |
| 1952 | 339.6 | 127.4 | 26.0 | 536.4 | 506.0 | 510.2 | 102.0 | 145.2 |
| 1953 | 273.6 | 210.6 | 28.0 | 582.6 | 530.6 | 563.2 | 106.8 | 207.2 |
| 1954 | 314.0 | 183.8 | 50.4 | 603.2 | 563.6 | 611.6 | 115.4 | 236.0 |
| 1955 | 365.8 | 137.0 | 50.4 | 600.6 | 559.8 | 599.0 | 119.0 | 176.6 |
| 1956 | 341.2 | 144.8 | 57.6 | 575.4 | 537.4 | 568.8 | 120.0 | 171.8 |
| 1957 | 329.8 | 155.8 | 57.4 | 599.2 | 557.8 | 592.2 | 122.4 | 173.0 |
| 1958 | 350.8 | 152.0 | 57.0 | 577.0 | 558.0 | 560.2 | 124.2 | 104.2 |
| 1959 | 340.2 | 161.0 | 57.0 | 632.6 | 566.8 | 629.8 | 125.4 | 179.8 |
| 1960 | 355.4 | 212.6 | 46.8 | 700.6 | 647.8 | 720.6 | 131.2 | 195.0 |
| 1961 | 435.0 | 170.6 | 46.6 | 648.2 | 652.0 | 705.4 | 135.0 | 107.4 |
| 1962 | 401.0 | 192.4 | 46.4 | 687.2 | 646.6 | 701.2 | 133.2 | 128.4 |
| 1963 | 403.8 | 187.0 | 46.2 | 722.6 | 676.5 | 723.8 | 133.0 | 159.2 |
| 1964 | 439.9 | 188.0 | 46.2 | 804.8 | 724.8 | 782.2 | 129.6 | 167.4 |
| 1965 | 493.2 | 145.2 | 53.4 | 812.0 | 729.9 | 796.0 | 128.0 | 139.5 |
| 1966 | 513.4 | 114.6 | 64.7 | 826.6 | 731.7 | 817.9 | 125.3 | 114.8 |
| 1967 | 527.5 | 96.6 | 72.3 | 826.2 | 721.5 | 800.8 | 117.8 | 116.0¶ |
| 1968 | 522.4 | 79.9 | 84.1 | 879.6 | 739.9 | 851.3 | 121.4 | 181.2 |
| 1969 | 580.8 | 85.0 | 117.9x | 1,022.4 | 809.1 | 953.1 | 130.4 | 188.5‡ |
| 1970 | 669.1 | 89.0 | 130.5x | 1,080.8 | 907.0 | 1,026.8 | 142.4 | 184.2‡ |
| 1971 | 738.5 | 78.2 | 167.9x | 1,233.8x | 1,017.5 | 1,182.2x | 158.9 | 225.6‡ |
| 1972 | 774.6 | 120.9 | 429.7 | 1,721.7x | 1,290.7 | 1,654.4x | 176.4 | 393.2‡ |
| 1973 | 1,014.5 | 287.3 | 692.4x | 2,253.3 | 1,835.2 | 2,169.0 | 207.8 | 632.4‡ |
| 1974 | 1,486.9 | 465.0 | 2,063.7 | 375.3‡ | ||||
| POST OFFICE SAVINGS BANK | ||||||
|---|---|---|---|---|---|---|
| Year | Number of Accounts at End of Year | Total Amount of Deposits During Year | Interest Credited to Depositors | Total Amount of Withdrawals During Year* | Excess of Deposits plus Interest over Withdrawals | Total Amount to Credit of Depositors at End of Year |
*From January 1958 includes interest paid out on investment accounts. †Excess of withdrawals over deposits. ‡Excludes 15,439 amounts credited with $0.6 million transferred to Apia, Western Samoa. §Includes School Savings Accounts from 1 April 1964. From 1 October 1969 includes National Development Bonds, and from 1 March 1970 Post Office Bonus Bonds. | ||||||
| Number | $(million) | |||||
| 1924-25 | 735,148 | 59.2 | 3.4 | 60.8 | 1.7 | 93.9 |
| 1925-26 | 758,155 | 63.7 | 3.5 | 65.2 | 1.9 | 95.8 |
| 1926-27 | 783,827 | 58.9 | 3.5 | 60.3 | 2.1 | 98.0 |
| 1927-28 | 804,725 | 55.2 | 3.5 | 61.2 | —2.4† | 95.5 |
| 1928-29 | 828,296 | 54.5 | 3.5 | 56.2 | 1.8 | 97.3 |
| 1929-30 | 852,757 | 57.1 | 3.6 | 59.2 | 1.6 | 98.9 |
| 1930-31 | 878,043 | 49.1 | 3.5 | 56.1 | —3.5† | 95.3 |
| 1931-32 | 877,090 | 38.9 | 3.2 | 50.9 | —8.8† | 86.5 |
| 1932-33 | 797,097 | 33.9 | 2.9 | 39.3 | —2.4† | 84.1 |
| 1933-34 | 798,262 | 38.9 | 2.5 | 35.6 | 5.7 | 89.7 |
| 1934-35 | 817,617 | 48.4 | 2.6 | 41.9 | 9.1 | 98.8 |
| 1935-36 | 840,671 | 51.2 | 2.8 | 47.1 | 7.0 | 105.8 |
| 1936-37 | 880,857 | 61.3 | 3.0 | 54.1 | 10.3 | 116.1 |
| 1937-38 | 920,805 | 66.1 | 3.3 | 59.3 | 10.2 | 126.3 |
| 1938-39 | 946,822 | 60.9 | 3.5 | 69.2 | —4.9† | 121.4 |
| 1939-40 | 960,565 | 50.3 | 3.2 | 58.9 | —5.4† | 116.0 |
| 1940-41 | 1,142,792 | 58.5 | 3.3 | 50.6 | 11.2 | 127.2 |
| 1941-42 | 1,298,483 | 68.4 | 3.7 | 50.8 | 21.3 | 148.5 |
| 1942-43 | 1,399,896 | 80.3 | 3.8 | 53.8 | 30.3 | 178.8 |
| 1943-44 | 1,494,136 | 107.9 | 4.4 | 71.2 | 41.0 | 219.8 |
| 1944-45 | 1,570,586 | 121.3 | 5.5 | 84.6 | 42.2 | 262.1 |
| 1945-46 | 1,605,981 | 148.6 | 6.5 | 114.0 | 41.0 | 303.1 |
| 1946-47 | 1,634,548 | 155.1 | 7.5 | 129.3 | 33.3 | 336.4 |
| 1947-48 | 1,652,765 | 157.7 | 8.2 | 143.5 | 22.4 | 358.8 |
| 1948-49 | 1,679,692 | 153.6 | 8.7 | 142.0 | 20.3 | 379.1 |
| 1949-50 | 1,730,072 | 197.9 | 9.7 | 161.6 | 46.0 | 425.1 |
| 1950-51 | 1,760,541 | 189.3 | 10.2 | 179.6 | 19.9 | 445.0 |
| 1951-52 | 1,800,709 | 215.6 | 10.8 | 198.9 | 27.5 | 472.5 |
| 1952-53 | 1,835,552 | 216.9 | 11.4 | 207.6 | 20.7 | 493.3 |
| 1953-54 | 1,868,788 | 237.2 | 12.1 | 214.9 | 34.4 | 527.7 |
| 1954-55 | 1,900,649 | 255.7 | 12.8 | 243.6 | 24.9 | 552.6 |
| 1955-56 | 1,927,422 | 255.2 | 13.3 | 256.4 | 12.1 | 564.7 |
| 1956-57 | 1,971,731 | 279.1 | 16.3 | 265.8 | 29.4 | 594.1 |
| 1957-58 | 2,013,664 | 311.7 | 17.9 | 291.2 | 38.5 | 632.6 |
| 1958-59 | 2,052,626 | 294.2 | 18.5 | 307.4 | 5.3 | 637.9 |
| 1959-60 | 2,084,837 | 326.3 | 18.9 | 311.0 | 34.1 | 672.0 |
| 1960-61 | 2,116,675 | 374.6 | 20.1 | 350.1 | 44.6 | 716.6 |
| 1961-62 | 2,143,586 | 383.4 | 21.0 | 383.7 | 20.7 | 736.7‡ |
| 1962-63 | 2,190,757 | 409.1 | 22.0 | 397.2 | 33.9 | 770.6 |
| 1963-64 | 2,245,339 | 471.6 | 23.6 | 442.9 | 52.3 | 822.8 |
| 1964-65 | 2,563,154 | 506.7 | 25.1 | 501.7 | 30.0 | 855.8§ |
| 1965-66 | 2,604,058 | 507.8 | 25.8 | 521.9 | 11.8 | 867.6 |
| 1966-67 | 2,639,890 | 525.6 | 26.0 | 542.0 | 9.6 | 877.3 |
| 1967-68 | 2,646,284 | 488.1 | 27.2 | 512.4 | 2.9 | 879.3 |
| 1968-69 | 2,681,654 | 487.7 | 28.0 | 507.9 | 7.8 | 887.1x |
| 1969-70 | 2,700,874 | 568.5 | 28.2 | 561.8 | 34.9 | 922.0 |
| 1970-71 | 2,736,917 | 620.9 | 29.6 | 626.4 | 24.1 | 946.1 |
| 1971-72 | 2,756,109 | 663.5 | 28.9 | 676.2 | 16.3 | 962.4 |
| 1972-73 | 2,838,441x | 782.4 | 30.5 | 736.5 | 76.3 | 1,038.7 |
| 1973-74 | 2,941,206 | 913.0 | 31.9 | 843.8 | 101.1 | 1,139.8 |
| 1974-75 | 2,954,000 | 976.6 | 34.1 | 963.7 | 47.1 | 1,186.9 |
| MORTGAGES AND LAND TRANSFERS | |||||
|---|---|---|---|---|---|
| Year Ended 31 March | Mortgages | Average Rate of Interest On New Mortgages | Land Transfers | ||
| Registered | Discharged | Number | Consideration | ||
| *Land sales restrictions removed in 1950. | |||||
| $(m) | $(m) | percent | $(m) | ||
| 1924 | 75.7 | 44.5 | 6.38 | 33,293 | 67.7 |
| 1925 | 82.2 | 59.5 | 6.30 | 34,289 | 67.3 |
| 1926 | 94.2 | 67.9 | 6.22 | 36,038 | 70.4 |
| 1927 | 80.0 | 58.5 | 6.47 | 34,106 | 64.7 |
| 1928 | 66.4 | 48.0 | 6.46 | 31,141 | 60.3 |
| 1929 | 67.1 | 50.5 | 6.46 | 30,760 | 62.3 |
| 1930 | 77.7 | 56.7 | 6.35 | 32,112 | 61.7 |
| 1931 | 60.4 | 40.1 | 6.25 | 25,626 | 44.1 |
| 1932 | 26.8 | 20.1 | 6.28 | 16,943 | 26.4 |
| 1933 | 18.3 | 16.3 | 5.88 | 15,381 | 22.0 |
| 1934 | 15.6 | 18.2 | 5.56 | 15,760 | 19.1 |
| 1935 | 23.7 | 27.5 | 5.06 | 18,628 | 24.4 |
| 1936 | 32.5 | 35.1 | 4.73 | 23,044 | 31.2 |
| 1937 | 39.4 | 39.6 | 4.60 | 25,178 | 37.7 |
| 1938 | 38.0 | 38.7 | 4.65 | 26,269 | 46.7 |
| 1939 | 40.1 | 33.2 | 4.58 | 28,965 | 47.3 |
| 1940 | 35.2 | 28.2 | 4.69 | 28,057 | 44.2 |
| 1941 | 32.5 | 31.9 | 4.69 | 28,828 | 51.5 |
| 1942 | 29.1 | 30.2 | 4.73 | 28,207 | 46.5 |
| 1943 | 24.3 | 33.4 | 4.72 | 27,657 | 48.3 |
| 1944 | 31.2 | 40.1 | 4.63 | 33,701 | 76.3 |
| 1945 | 36.2 | 42.0 | 4.51 | 33,284 | 64.9 |
| 1946 | 45.0 | 46.6 | 4.10 | 38,060 | 76.7 |
| 1947 | 62.2 | 51.9 | 3.85 | 42,994 | 89.9 |
| 1948 | 64.1 | 50.8 | 3.90 | 48,801 | 80.9 |
| 1949 | 70.6 | 46.8 | 3.98 | 36,564 | 76.8 |
| 1950 | 72.0 | 46.2 | 3.99 | 39,058 | 81.3 |
| 1951* | 91.6 | 64.5 | 4.09 | 57,938 | 158.7 |
| 1952 | 135.9 | 74.5 | 4.15 | 56,609 | 218.3 |
| 1953 | 147.4 | 62.8 | 4.29 | 48,378 | 201.4 |
| 1954 | 140.8 | 72.0 | 4.49 | 52,615 | 228.8 |
| 1955 | 169.2 | 82.3 | 4.69 | 56,571 | 273.4 |
| 1956 | 192.5 | 70.7 | 4.76 | 49,100 | 241.9 |
| 1957 | 182.4 | 75.4 | 5.09 | 45,334 | 229.4 |
| 1958 | 199.1 | 92.2 | 5.24 | 50,573 | 279.4 |
| 1959 | 217.1 | 88.8 | 5.15 | 49,153 | 255.2 |
| 1960 | 239.0 | 102.3 | 5.01 | 52,855 | 285.4 |
| 1961 | 300.8 | 136.6 | 5.01 | 61,412 | 375.6 |
| 1962 | 331.5 | 133.8 | 5.27 | 57,813 | 360.1 |
| 1963 | 295.1 | 135.6 | 5.51 | 53,566 | 336.3 |
| 1964 | 339.8 | 168.8 | 5.70 | 59,836 | 419.9 |
| 1965 | 420.0 | 206.8 | 5.78 | 69,548 | 536.2 |
| 1966 | 487.7 | 230.0 | 6.07 | 71,508 | 592.6 |
| 1967 | 493.4 | 293.3 | 6.31 | 68,639 | 589.2 |
| 1968 | 467.8 | 236.1 | 6,64 | 63,925 | 541.8 |
| 1969 | 482.3 | 260.9 | 6.74 | 65,655 | 576.5 |
| 1970 | 573.9 | 328.1 | 6.77 | 72,624 | 724.4 |
| 1971 | 703.0 | 376.5 | 6.88 | 83,610 | 918.9 |
| 1972 | 759.8 | 415.8 | 7.40 | 86,042 | 985.4 |
| 1973 | 940.7 | 510.5 | 7.60 | 105,193 | 1,339.9 |
| 1974 | 1,301.7 | 672.9 | 7.61 | 125,796 | 2,133.0 |
| BANKRUPTCIES AND NEW COMPANY REGISTRATIONS | |||||
|---|---|---|---|---|---|
| Year | Bankruptcies | New Company Registrations* | |||
| Number of Bankruptcies | Amount Realised by Official Assignee | Amount of Debts Proved | Number of New Registrations | Amount of Nominal Capital | |
Public, private, and overseas. †The extraordinarily high figure for 1934 is due to the inclusion of all overseas companies (numbering 187 with an aggregate nominal capital of $386 million) which had previous to 1934 established places of business in New Zealand and which were reregistered in 1934 under Part XII of the Companies Act 1933. ‡Since 1954 company liquidations are included in the total. | |||||
| $(000) | $(000) | $(m) | |||
| 1923 | 674 | 249.3 | 1,337.8 | 502 | 26.0 |
| 1924 | 670 | 237.3 | 1,408.0 | 565 | 42.7 |
| 1925 | 653 | 197.3 | 942.1 | 621 | 29.5 |
| 1926 | 752 | 205.8 | 1,171.4 | 655 | 21.5 |
| 1927 | 867 | 217.7 | 1,359.0 | 698 | 17.4 |
| 1928 | 806 | 233.2 | 1,534.6 | 736 | 22.0 |
| 1929 | 687 | 182.4 | 1,004.2 | 903 | 24.9 |
| 1930 | 780 | 166.6 | 1,654.7 | 893 | 13.4 |
| 1931 | 848 | 217.6 | 2,084.4 | 795 | 16.6 |
| 1932 | 661 | 151.3 | 1,249.8 | 812 | 13.7 |
| 1933 | 450 | 123.4 | 979.8 | 830 | 14.6 |
| 1934 | 326 | 89.1 | 517.8 | 933 | 401.5† |
| 1935 | 257 | 82.1 | 451.0 | 810 | 48.5 |
| 1936 | 260 | 66.0 | 339.7 | 942 | 19.9 |
| 1937 | 222 | 111.9 | 343.4 | 888 | 12.2 |
| 1938 | 267 | 129.0 | 460.9 | 824 | 13.2 |
| 1939 | 267 | 88.3 | 451.0 | 681 | 17.8 |
| 1940 | 213 | 84.8 | 250.6 | 391 | 7.6 |
| 1941 | 165 | 70.9 | 142.0 | 288 | 22.5 |
| 1942 | 82 | 59.5 | 64.5 | 198 | 1.9 |
| 1943 | 45 | 37.8 | 40.1 | 270 | 3.1 |
| 1944 | 51 | 26.9 | 102.1 | 464 | 3.0 |
| 1945 | 45 | 37.1 | 236.4 | 741 | 6.8 |
| 1946 | 52 | 41.9 | 97.0 | 1,435 | 22.1 |
| 1947 | 74 | 31.1 | 89.5 | 1,813 | 19.2 |
| 1948 | 148 | 100.6 | 286.6 | 1,751 | 17.4 |
| 1949 | 179 | 76.8 | 406.3 | 2,157 | 16.0 |
| 1950 | 142 | 98.5 | 251.8 | 2,074 | 20.4 |
| 1951 | 145 | 96.5 | 273.6 | 2,020 | 25.6 |
| 1952 | 168 | 112.5 | 502.3 | 1,744 | 66.8 |
| 1953 | 215 | 144.3 | 762.0 | 2,041 | 86.1 |
| 1954‡ | 277 | 165.1 | 826.9 | 2,685 | 55.5 |
| 1955 | 304 | 224.8 | 764.6 | 2,695 | 36.7 |
| 1956 | 390 | 261.1 | 1,095.5 | 3,255 | 41.2 |
| 1957 | 437 | 360.7 | 1,564.5 | 3,502 | 161.1 |
| 1958 | 495 | 369.6 | 1,638.3 | 3,034 | 61.5 |
| 1959 | 618 | 389.8 | 1,510.4 | 2,737 | 94.2 |
| 1960 | 495 | 331.2 | 1,337.8 | 3,767 | 74.0 |
| 1961 | 425 | 303.6 | 1,415.8 | 3,567 | 71.7 |
| 1962 | 591 | 446.1 | 2,138.4 | 3,351 | 45.1 |
| 1963 | 566 | 441.1 | 1,600.3 | 4,165 | 74.1 |
| 1964 | 507 | 325.5 | 1,784.9 | 5,054 | 90.0 |
| 1965 | 507 | 335.6 | 2,337.5 | 5,563 | 85.8 |
| 1966 | 507 | 378.5 | 2,033.5 | 5,609 | 187.3 |
| 1967 | 652 | 373.9 | 2,312.2 | 4,829 | 102.7 |
| 1968 | 820 | 487.2 | 3,743.5 | 5,010 | 190.1 |
| 1969 | 659 | 746.5 | 3,743.5 | 6,403 | 286.6 |
| 1970 | 596 | 466.5 | 3,660.1 | 6,431 | 282.9 |
| 1971 | 477 | 604.4 | 3,471.7 | 5,490 | 359.0 |
| 1972 | 461 | 698.5 | 4,138.5 | 6,547 | 4,271.1 |
| 1973 | 329 | 783.0 | 2,991.0 | 8,837 | 249.4 |
| 1974 | 324 | 606.0 | 3,009.0 | ||
| INSURANCE | ||||||
|---|---|---|---|---|---|---|
| Year | Life (Ordinary and Industrial) | Accident | Fire | |||
| Policies in Force† | Sum Assured† | Net Revenue* | Net Expenditure* | Net Revenue* | Net Expenditure* | |
*Excluding unexpired risks reserves. †Excludes annuities. | ||||||
| (000) | $(million) | |||||
| 1922-23 | 370 | 131 | 1.4 | 1.3 | 2.9 | 2.3 |
| 1923-24 | 389 | 141 | 1.5 | 1.4 | 2.9 | 2.4 |
| 1924-25 | 412 | 152 | 1.7 | 1.6 | 2.9 | 2.6 |
| 1925-26 | 433 | 163 | 2.3 | 2.0 | 3.0 | 2.4 |
| 1926-27 | 455 | 174 | 2.7 | 2.3 | 3.0 | 2.7 |
| 1927-28 | 480 | 184 | 2.7 | 2.4 | 3.0 | 2.9 |
| 1928-29 | 503 | 196 | 2.8 | 2.6 | 3.0 | 3.1 |
| 1929-30 | 532 | 211 | 3.3 | 2.9 | 3.0 | 2.7 |
| 1930-31 | 553 | 224 | 3.5 | 3.1 | 3.1 | 2.6 |
| 1931-32 | 546 | 225 | 3.1 | 2.9 | 3.1 | 2.9 |
| 1932-33 | 543 | 224 | 2.6 | 2.4 | 3.0 | 2.3 |
| 1933-34 | 558 | 226 | 2.5 | 2.2 | 2.9 | 2.2 |
| 1934-35 | 589 | 233 | 2.8 | 2.4 | 2.7 | 2.1 |
| 1935-36 | 628 | 248 | 3.0 | 2.8 | 2.8 | 2.0 |
| 1936-37 | 686 | 272 | 3.5 | 3.4 | 2.7 | 2.0 |
| 1937-38 | 751 | 302 | 4.4 | 4.3 | 2.6 | 1.9 |
| 1938-39 | 801 | 322 | 5.2 | 4.7 | 2.7 | 2.0 |
| 1939-40 | 836 | 341 | 5.6 | 4.8 | 2.8 | 2.1 |
| 1940-41 | 865 | 355 | 5.3 | 4.6 | 2.9 | 2.2 |
| 1941-42 | 900 | 374 | 5.2 | 4.5 | 3.0 | 2.3 |
| 1942-43 | 922 | 388 | 4.8 | 4.1 | 3.1 | 2.7 |
| 1943-44 | 954 | 408 | 5.4 | 4.6 | 3.4 | 2.6 |
| 1944-45 | 992 | 438 | 5.4 | 4.9 | 3.1 | 2.6 |
| 1945-46 | 1,036 | 477 | 5.9 | 5.3 | 3.3 | 2.7 |
| 1946-47 | 1,096 | 532 | 6.8 | 5.7 | 3.7 | 3.1 |
| 1947-48 | 1,151 | 593 | 8.1 | 6.9 | 4.1 | 3.3 |
| 1948-49 | 1,192 | 650 | 8.9 | 8.0 | 4.6 | 3.4 |
| 1949-50 | 1,226 | 707 | 10.1 | 9.0 | 5-1 | 3.8 |
| 1950-51 | 1,263 | 774 | 12.0 | 10.4 | 5.5 | 4.5 |
| 1951-52 | 1,304 | 866 | 13.7 | 12.1 | 6.1 | 4.9 |
| 1952-53 | 1,345 | 958 | 16.4 | 14.4 | 6.8 | 5.6 |
| 1953-54 | 1,381 | 1,058 | 18.4 | 16.1 | 7.5 | 6.2 |
| 1954-55 | 1,427 | 1,184 | 20.4 | 18.1 | 8.3 | 6.5 |
| 1955-56 | 1,463 | 1,324 | 22.8 | 20.8 | 8.4 | 7.1 |
| 1956-57 | 1,494 | 1,464 | 25.6 | 23.7 | 8.8 | 7.3 |
| 1957-58 | 1,528 | 1,623 | 28.3 | 26.4 | 9.3 | 8.1 |
| 1958-59 | 1,561 | 1,804 | 30.7 | 28.7 | 10.0 | 8.4 |
| 1959-60 | 1,598 | 2,026 | 33.4 | 30.5 | 11.1 | 8.8 |
| 1960-61 | 1,695 | 2,278 | 37.5 | 33.3 | 12.1 | 9.7 |
| 1961-62 | 1,723 | 2,548 | 40.9 | 36.1 | 13.4 | 10.7 |
| 1962-63 | 1,751 | 2,843 | 44.3 | 39.6 | 14.8 | 12.0 |
| 1963-64 | 1,793 | 3,195 | 49.0 | 43.7 | 16.4 | 13.6 |
| 1964-65 | 1,846 | 3,609 | 54.2 | 48.7 | 17.6 | 14.6 |
| 1965-66 | 1,911 | 4,070 | 63.0 | 55.6 | 19.6 | 15.7 |
| 1966-67 | 1,973 | 4,587 | 69.3 | 61.6 | 21.6 | 17.4 |
| 1967-68 | 2,028 | 5,095 | 73.0 | 67.2 | 23.0 | 19.9 |
| 1968-69 | 2,087 | 5,579 | 75.8 | 70.0 | 25.4 | 22.3 |
| 1969-70 | 2,149 | 6,155 | 81.5 | 77.1 | 27.5 | 23.2 |
| 1970-71 | 2,230 | 6,894 | 92.8 | 89.4 | 31.9 | 25.7 |
| 1971-72 | 2,337 | 7,996 | 111.9 | 104.1 | 36.7 | 30.7 |
| 1972-73 | 2,443 | 9,445 | 133.0 | 120.0 | 46.7 | 39.9 |
| 1973-74 | 2,533 | 10,985 | 147.2 | 134.7 | 56.5 | 46.2 |
| INDUSTRIAL STOPPAGES | ||||||||
|---|---|---|---|---|---|---|---|---|
| Year | Total Industrial Stoppages* | Firms Affected | Total Duration (Days) | Average Duration (Days) | Workers Involved† | Working Days Lost† | Average Days Lost per Worker Involved† | Estimated Loss in Wages† |
*The number of lockouts included in total industrial stoppages were: 1925, 2; 1928, 2; 1929, 1; 1931, 1; 1940, 1; 1944, 1; 1965, 2; 1970, 3; and 1971, 1. †Includes workers indirectly involved. ‡Includes in 1964, 4; in 1966, 4; and in 1971, 2 additional penalty (suspension) stoppages provided for under Port Bureau Rules. §A limited number of stoppages affected a large number of firms the totals of which are not available and hence excluded || Refer to working days only. | ||||||||
| $(000) | ||||||||
| 1924 | 34 | 58 | 134 | 3.94 | 14,815 | 89,105 | 6.01 | 125 |
| 1925 | 83 | 93 | 598 | 7.20 | 9,905 | 74,552 | 7.53 | 98 |
| 1926 | 59 | 67 | 314 | 5.32 | 6,264 | 47,811 | 7.63 | 65 |
| 1927 | 38 | 40 | 83 | 2.18 | 4,476 | 12,485 | 2.79 | 24 |
| 1928 | 39 | 56 | 253 | 6.49 | 9,258 | 21,997 | 2.38 | 45 |
| 1929 | 47 | 60 | 342 | 7.28 | 7,151 | 25,889 | 3.62 | 54 |
| 1930 | 38 | 44 | 392 | 10.32 | 5,467 | 31,669 | 5.79 | 75 |
| 1931 | 24 | 37 | 262 | 10.92 | 6,356 | 48,486 | 7.63 | 89 |
| 1932 | 23 | 67 | 313 | 13.61 | 9,355 | 108,605 | 11.61 | 211 |
| 1933 | 15 | 43 | 205 | 13.67 | 3,558 | 65,099 | 18.30 | 119 |
| 1934 | 24 | 37 | 120 | 5.00 | 3,773 | 10,393 | 2.75 | 14 |
| 1935 | 12 | 65 | 88 | 7.33 | 2,323 | 18,563 | 7.99 | 31 |
| 1936 | 43 | 128 | 221 | 5.14 | 7,354 | 16,980 | 2.31 | 26 |
| 1937 | 52 | 72 | 320 | 6.15 | 11,411 | 29,916 | 2.62 | 64 |
| 1938 | 72 | 103 | 287 | 3.99 | 11,388 | 55,456 | 3.11 | 84 |
| 1939 | 66 | 636 | 416 | 6.30 | 15,682 | 53,801 | 3.43 | 121 |
| 1940 | 57 | 99 | 435 | 7.63 | 10,475 | 28,097 | 2.68 | 56 |
| 1941 | 89 | 97 | 233 | 2.62 | 15,261 | 26,237 | 1.72 | 69 |
| 1942 | 65 | 78 | 143 | 2.20 | 14,345 | 51,189 | 3.57 | 126 |
| 1943 | 69 | 114 | 122 | 1.77 | 10,915 | 14,687 | 1.35 | 40 |
| 1944 | 149 | 269 | 281 | 1.89 | 29,766 | 52,602 | 1.77 | 148 |
| 1945 | 154 | 1,255 | 379 | 2.46 | 39,418 | 66,629 | 1.69 | 185 |
| 1946 | 96 | 122 | 259 | 2.70 | 15,696 | 30,393 | 1.94 | 80 |
| 1947 | 134 | 234 | 834 | 6.22 | 26,970 | 102,725 | 3.81 | 375 |
| 1948 | 101 | 885 | 608 | 6.02 | 28,494 | 93,464 | 3.28 | 392 |
| 1949 | 123 | 1,315 | 672 | 5.46 | 61,536 | 218,172 | 3.55 | 782 |
| 1950 | 129 | 1,189 | 567 | 4.40 | 91,492 | 271,475 | 2.97 | 1,028 |
| 1951 | 109 | 354 | 3,464 | 31.78 | 36,878 | 1,157,390 | 31.38 | 6,223 |
| 1952 | 50 | 177 | 108 | 2.16 | 16,297 | 28,123 | 1.73 | 139 |
| 1953 | 73 | 880 | 145 | 1.99 | 22,175 | 19,291 | 0.87 | 97 |
| 1954 | 61 | 447 | 136 | 2.23 | 16,153 | 20,474 | 1.27 | 133 |
| 1955 | 65 | 114 | 211 | 3.25 | 20,224 | 52,043 | 2.57 | 371 |
| 1956 | 50 | 426 | 390 | 7.80 | 13,579 | 23,870 | 1.76 | 168 |
| 1957 | 51 | 88 | 165 | 3.24 | 15,545 | 28,186 | 1.81 | 166 |
| 1958 | 49 | 83 | 152 | 3.10 | 13,709 | 18,788 | 1.37 | 128 |
| 1959 | 73 | 119 | 229 | 3.14 | 18,762 | 29,651 | 1.58 | 215 |
| 1960 | 60 | 80 | 344 | 5.73 | 14,305 | 35,683 | 2.49 | 233 |
| 1961 | 71 | 89 | 353 | 4.96 | 16,626 | 38,185 | 2.30 | 299 |
| 1962 | 96 | 129 | 498 | 5.18 | 39,921 | 93,157 | 2.33 | 749 |
| 1963 | 60 | 91 | 366 | 6.09 | 14,911 | 54,490 | 3.65 | 496 |
| 1964‡ | 93 | 230 | 333 | 3.58 | 34,779 | 66,834 | 1.92 | 513 |
| 1965 | 105 | 218 | 287 | 2.73 | 15,267 | 21,814 | 1.43 | 184 |
| 1966‡ | 145 | 151§ | 462 | 3.18 | 33,132 | 99,095 | 2.99 | 878 |
| 1967 | 89 | 107 | 347|| | 3.90|| | 28,490 | 139,490 | 4.90 | 869 |
| 1968 | 153 | 209 | 622|| | 4.07|| | 37,458 | 130,267 | 3.48 | 1,097 |
| 1969 | 169 | 325 | 683|| | 4.04|| | 44,041 | 138,675 | 3.15 | 1,384 |
| 1970 | 323 | 693§ | 1,394|| | 4.32|| | 110,096 | 277,348 | 2.52 | 2,425 |
| 1971‡ | 313 | 590 | 1,389|| | 4.44|| | 86,009 | 162,563 | 1.89 | 2,109 |
| 1972 | 266x | 372x | 1,257|| | 4.73|| | 60,429x | 134,505x | 2.23 | 1,951x |
| 1973 | 394 | 595 | 1,892|| | 4.80|| | 115,865 | 271,706 | 2.35 | 4,289 |
| 1974 | 380 | 533 | 1,530|| | 4.03|| | 70,904 | 183,688 | 2.59 | 3,332 |
| NOTEWORTHY EVENTS IN THE HISTORY OF NEW ZEALAND | |
|---|---|
| 1,642 | European discovery of New Zealand by Tasman. |
| 1,769 | Captain Cook's first visit to New Zealand. |
| 1,791 | Discovery of Snares and Chatham Islands. |
| 1,792 | First sealing gang left on New Zealand coast. |
| 1,814 | Arrival of Rev. Samuel Marsden, and introduction of Christianity. Horses, cattle, sheep, and poultry first brought to New Zealand. |
| 1,820 | Hongi's visit to England. |
| 1823-28 | Jurisdiction of Courts of Justice in New South Wales extended to British subjects in New Zealand. |
| 1,825 | First attempt at colonisation, by an expedition under Captain Herd. |
| 1,827 | Hongi's forces destroyed mission station at Whangaroa. |
| 1,831 | Tory Channel whaling station established. Application of 13 chiefs for the protection of King William IV. |
| 1,833 | Mr James Busby appointed British Resident at Bay of Islands. |
| 1,834 | Waimate Pa, near Opunake, shelled and captured by British—first occasion on which HM troops employed in New Zealand. |
| 1,835 | Declaration of independence of the whole of New Zealand as one nation, with title of “United Tribes of New Zealand”. Ngati-Awa tribes migrated to and conquered Chatham Islands. |
| 1,838 | Pelorus Sound discovered. |
| 1,839 | Governor of New South Wales authorised to include within the limits of that colony any territory that might be acquired in sovereignty by Her Majesty in New Zealand. Preliminary expedition of New Zealand Company under Colonel Wakefield arrived at Port Nicholson. |
| 1,840 | Arrival of New Zealand Company's settlers at Port Nicholson. Treaty of Waitangi signed. British sovereignty proclaimed. Captain Hobson appointed Lieutenant-Governor, with residence at Auckland. Settlements formed at Petre (Wanganui) and Akaroa. |
| 1,841 | Issue of charter of incorporation of New Zealand Company. New Zealand proclaimed independent of New South Wales. Arrival of New Plymouth settlers. |
| 1,842 | Settlement founded at Nelson. |
| 1,843 | Affray with Maoris at Wairau. |
| 1,844 | Royal flagstaff at Kororareka cut down by Heke. |
| 1,845 | Destruction of Kororareka by Heke. |
| 1,846 | Arrival of first steam vessel (HMS Driver) in New Zealand waters. Capture of pa at Ruapekapeka and termination of Heke's war. Maori hostilities near Wellington. Te Rauparaha captured and detained as a prisoner. New Zealand divided into two provinces, New Munster and New Ulster, and representative institutions conferred. |
| 1,847 | Attack by Maoris on Wanganui. |
| 1,848 | Suspension of that part of New Zealand Government Act which had conferred representative institutions. Otago founded. |
| 1,850 | Surrender of New Zealand Company's charter, all its interests reverting to the Imperial Government. Canterbury founded. |
| 1,852 | Discovery of gold at Coromandel. Constitution Act passed, granting representative institutions to New Zealand, and dividing country into six provinces. |
| 1,854 | Opening at Auckland of first session of the General Assembly. |
| 1,855 | First members elected to the House of Representatives under system of responsible Government. Very severe earthquake on both sides of Cook Strait. |
| 1,856 | Appointment of first Ministry under system of responsible Government. |
| 1,857 | Goldfield opened at Collingwood. |
| 1,858 | New Provinces Act passed. |
| 1,860 | Hostilities in Waitara district. |
| 1,861 | Truce arranged with Waitara Maoris. Bank of New Zealand incorporated. Southland Province established. Gold discovery at Gabriel's Gully, Otago. |
| 1862 | Coromandel proclaimed a goldfield. Wreck of s.s White Swan, with loss of many public records. First electric-telegraph line opened - Christchurch to Lyttelton. |
| 1,863 | Wreck of HMS Orpheuson Manukau bar, with loss of 181 lives. Control of Maori affairs transferred to Colonial Government. Commencement of Waikato War. Defeat of Maoris at Rangiriri, and occupation of Ngaruawahia. First railway in New Zealand, portion of Christchurch-Lyttelton line, opened. |
| 1,864 | Severe fighting in Waikato and elsewhere, including battles of Rangiaowhia, Orakau, Gate Pa, and Te Ranga. First major discovery of gold on West Coast of South Island. |
| 1,865 | Seat of Government transferred to Wellington. Further fighting, followed by proclamation of peace. Activities of Hauhau fanatics, including murders of Europeans. Rebel Maoris defeated at Wairoa. |
| 1,866 | Cook Strait submarine telegraph cable laid. |
| 1,867 | Opening of Thames Goldfield. Lyttelton Tunnel completed. Admission of four Maori members to House of Representatives as direct representatives of Maori people. |
| 1,868 | Maori prisoners, under leadership of Te Kooti, seized schooner Rifleman and escaped from Chatham Islands to mainland where they massacred Europeans. Considerable fighting with these and other rebel Maoris. |
| 1,869 | Continuation of fighting with rebels and of pursuit of Te Kooti. Visit of H.R.H. the Duke of Edinburgh. Government Life Insurance Office established. |
| 1,870 | Further fighting with Te Kooti. Last of Imperial troops left New Zealand. Commencement of San Francisco mail service. Possession taken of Bounty Island. Inauguration of Vogel public works policy. Act passed to establish the New Zealand University. |
| 1,871 | Commencement of railway construction under public works policy. |
| 1,872 | Resumption of friendly relations with Waitara Maoris. Appointment of Maori chiefs (two) to Legislative Council. Public Trust Office created. |
| 1,873 | Establishment of New Zealand Shipping Co. |
| 1,874 | In pursuance of immigration and public works policy, 31,774 assisted immigrants arrived. |
| 1,875 | Resumption of amicable relations with Maori King. Establishment of Union Steam Ship Company. |
| 1,876 | New Zealand connected by cable with Australia. Abolition of Provinces Act came into operation, provincial institutions being abolished and the country divided into counties and boroughs. |
| 1,877 | Education Act passed, providing for free compulsory education. |
| 1,878 | Completion of the Christchurch-Invercargill railway. |
| 1,879 | Triennial Parliaments Act passed. Adult male suffrage introduced. Kaitangata coal mine explosion, whereby 34 lives lost. |
| 1,881 | Wreck of s.s. Tararua, with loss of 130 lives. |
| 1,882 | First shipment of frozen meat from New Zealand. |
| 1,883 | Direct steamer communication inaugurated between New Zealand and England. |
| 1,885 | New Zealand Industrial Exhibition at Wellington. |
| 1,886 | Tarawera eruption, involving loss of 101 lives and destruction of Pink and White Terraces. |
| 1,887 | Annexation of Kermadec Islands. Members of House of Representatives reduced to 74, including four Maoris. |
| 1,888 | British protectorate over Cook Islands proclaimed. |
| 1,889 | South Seas Exhibition at Dunedin. |
| 1,890 | Great maritime strike. First election of House of Representatives under one-man-one-vote principle. |
| 1,891 | Inauguration of Liberal regime under Hon. John Ballance. |
| 1,892 | Introduction of lease-in-perpetuity system of land tenure. |
| 1,893 | Right Hon. R. J. Seddon, Prime Minister. Franchise extended to women. Special licensing poll introduced. |
| 1,894 | Industrial Conciliation and Arbitration Act passed. Government Advances to Settlers Act passed. Wreck of s.s. Wairarapa, with loss of 135 lives. |
| 1,896 | Brunner Mine explosion, causing 67 deaths. Abolition of non-residential or property qualification to vote. Government Valuation of Land Act passed. |
| 1,898 | Old-age Pensions Act passed. |
| 1,899 | Labour Day instituted. New Zealand contingent (the first of 10) sent to South Africa. |
| 1,900 | Number of European representatives in Lower House increased to 76. |
| 1,901 | T.R.H. the Duke and Duchess of York visited New Zealand. Penny postage adopted by New Zealand. Cook and other Pacific islands annexed. |
| 1902 | Pacific cable opened. Wreck of s.s. Elingamite, with loss of 43 lives. Conference of colonial Premiers in London. |
| 1,903 | Empire Day proclaimed. State Fire Insurance Act passed. |
| 1,905 | Workers' Dwellings Act passed. Title of New Zealand's representative in London altered to “High Commissioner”. |
| 1,906 | Death of Right Hon. R. J. Seddon, Premier. Advances to Workers Act passed. New Zealand International Exhibition at Christchurch. |
| 1,907 | New Zealand constituted a Dominion. Lease-in-perpetuity system of land tenure abolished. Parliament Buildings destroyed by fire. |
| 1,908 | Through railway communication established between Wellington and Auckland. |
| 1,909 | S.s. Penguin wrecked in Cook Strait, with loss of 75 lives. Battle cruiser presented by New Zealand to Imperial Government. System of compulsory military training introduced. |
| 1,910 | Public Debt Extinction Act and National Provident Fund Act passed. |
| 1,911 | Wireless telegraphy installed in New Zealand. Widows' Pensions Act passed. First poll on national prohibition taken. |
| 1,912 | Public Service placed under Commissioner control. |
| 1,913 | Extensive strikes. |
| 1,914 | Western Samoa occupied by New Zealand Advance Expeditionary Force. Main Expeditionary Force left for Egypt. Huntly coal mine disaster, with loss of 43 lives. |
| 1,915 | New Zealand Expeditionary Force engaged in operations on Gallipoli Peninsula. National Cabinet formed. Pensions for miners introduced. |
| 1,916 | New Zealand Division transferred to Western Front, Mounted Brigade being retained in Egypt. Compulsory enrolment of men for war service introduced. Lake Coleridge electric-supply scheme opened. |
| 1,918 | S.s. Wimmera sunk by enemy mine off New Zealand coast, with loss of 26 lives. Otira Tunnel pierced. End of First World War. Great influenza epidemic, causing nearly 7,000 deaths. |
| 1,919 | Women made eligible for seats in Parliament. New Zealand represented at Peace Conference by Right Hon. W. F. Massey, Prime Minister. |
| 1,920 | Visit of H.R.H. the Prince of Wales. Railway strike. First aeroplane flight over Cook Strait. League of Nations gave New Zealand mandate to administer Western Samoa. Anzac Day constituted. |
| 1,921 | Samoa Act passed, making provision for government in terms of mandate. New Zealand represented at Disarmament Conference, Washington. |
| 1,922 | Meat-export trade placed under control of a board. |
| 1,923 | Opening of Otira Tunnel. Ross Dependency proclaimed, and placed under jurisdiction of Governor-General. Dairy Produce Export Control Act passed. |
| 1,924 | Railway strike. Direct two-way radio communication effected with England. Motor Vehicles Act provided for registration and annual licensing of motor vehicles. Pensions for blind persons introduced. S.s. Ripple foundered off Cape Palliser with loss of 16 lives. |
| 1,925 | New Zealand and South Seas International Exhibition at Dunedin. Administration of Tokelau (Union) Islands transferred to New Zealand. |
| 1,926 | Family Allowances Act passed. |
| 1,927 | Visit of T.R.H. the Duke and Duchess of York. Summer Time Act passed. |
| 1,928 | Kingsford Smith and party made first successful flight across Tasman Sea. |
| 1,929 | Severe earthquake in Murchison-Karamea district caused 17 deaths. Daylight saving (half hour) permanently adopted for summer months. |
| 1,930 | Legislation providing for relief of unemployment first passed. |
| 1,931 | Worst earthquake in history of New Zealand occurred in Hawke's Bay, resulting in the loss of 255 lives. General reduction of 10 percent in wages and salaries. Parliament approved draft Statute of Westminster. Mortgagors' relief legislation passed. |
| 1,932 | Industrial Conciliation and Arbitration Amendment Act made important changes in industrial legislation. National Expenditure Adjustment Act made reductions in old-age and other pensions, in salaries of State employees, and in rentals, interest rates, and other fixed charges. The historic Waitangi Estate presented to the nation by Their Excellencies Lord and Lady Bledisloe. New Zealand represented at Ottawa Conference. |
| 1,933 | Exchange rate raised to £125 N.Z. for £100 London (telegraphic transfers). Sales tax instituted. Conversion of internal public debt with reduction in interest rates, and provision made for local authorities interest reduction and loans conversion. Successful experimental shipments of chilled beef to England. |
| 1934 | First official trans-Tasman air mail. Reserve Bank incorporated and commenced business. First licensed air transport service commenced operations. |
| 1,935 | Rural Mortgagors Final Adjustment Act passed, and Court of Review established. National Government defeated at general election, and Labour Government assumed office for first of four successive terms. |
| 1,936 | Inauguration of inter-Island trunk air services. Reserve Bank nationalised. System of basic prices for butter and cheese introduced. Forty-hour week became operative. Powers of Court of Arbitration restored. Railcar services inaugurated. New Zealand elected to seat on League of Nations Council. |
| 1,937 | New Zealand represented at Imperial Conference by Right Hon. M. J. Savage. Death of Lord Rutherford of Nelson. |
| 1,938 | Mr W. J. Jordan, New Zealand's representative on League of Nations, elected President of the League Assembly. Social Security Act passed. Introduction of import selection and control. |
| 1,939 | Declaration of war with Germany. Recruitment for 2nd New Zealand Expeditionary Force. Arrangements for purchase of farm products by Britain. New Zealand Centennial Exhibition opened at Wellington. |
| 1,940 | Centennial celebrations. Departure of First Echelon of 2nd New Zealand Expeditionary Force. Death of the Prime Minister, the Right Hon. M. J. Savage; succeeded in office by Hon. P. Fraser. Declaration of war with Italy. RMS Niagara sunk off New Zealand coast by enemy mine. Ballots for military service. National savings scheme inaugurated. |
| 1,941 | Daylight saving period extended to cover whole year. First enrolment of married men for military service. Declaration of war. with Japan. Territorial Forces mobilised. |
| 1,942 | Complete mobilisation of Military Forces ordered. Introduction of control of industrial manpower. Compulsory enrolment of all male British subjects between ages of 18 and 65 inclusive, in Emergency Reserve Corps. Lend-lease reciprocal aid extended to include Australia and New Zealand. Rationing introduced. Mobilisation of women for essential work. |
| 1,943 | North African campaign brought to a successful conclusion. Railway accident near Hyde—21 persons killed. 2nd NZEF (3rd Division) took part in action against Japanese in the Pacific Area. |
| 1,944 | Australia - New Zealand Agreement 1944, providing for collaboration on matters of mutual interest. Mutual-aid Agreement between Canadian and New Zealand Governments signed. |
| 1,945 | War in Europe ended (8 May). Manpower controls in regard to women and young persons relaxed. Wartime press censorship abolished. War Cabinet dissolved. War in Pacific ended. Japan formally surrenders (15 August). Electoral Amendment Act providing for abolition of the “country quota” passed. South Island Main Trunk Railway opened, through rail connection from Picton to Bluff established. |
| 1,946 | Restrictions on consumption of electric power imposed in North Island. Remaining manpower controls lifted in June. Family benefit of $1 per week made universal as from 1 April. Lieutenant-General Sir Bernard Freyberg, v.c., assumed office as Governor-General (17 June). |
| 1,947 | $25 million presented to United Kingdom Government by New Zealand. Local Government Commission appointed. First woman Cabinet Minister in New Zealand appointed. Marketing of dairy produce taken over by Dairy Commission. Statute of Westminster adopted by New Zealand Parliament. |
| 1,948 | Licensing Control Commission appointed. Adjustment of exchange rate to parity with sterling as from 20 August. |
| 1,949 | Polls on the establishment of off-course betting and on an alteration in hotel hours held in March. Referendum agrees to compulsory military training. Labour Government defeated and National Government assumed office under Right Hon. S. G. Holland. |
| 1,950 | British Empire Games held at Auckland. Control of land sales, except of farm land, lifted. Control of sterling funds and securities relaxed. Abolition of petrol and butter rationing. Legislative Council Abolition Act passed. Kayforce sailed from Wellington for Korea. |
| 1951 | Prolonged waterfront strike resulted in Proclamation of State of Emergency, and issue of regulations under the Public Safety Conservation Act. Servicemen kept essential cargoes moving. Waterfront unions deregistered. Establishment of Civil Emergency Reserve. Off-course betting operations commenced by Totalisator Agency Board. United States, Australia, and New Zealand signed Pacific Security Treaty. |
| 1,952 | Royal Commission on Railways. Accession of Queen Elizabeth II. New Zealand team at Olympic Games at Helsinki gained one gold and two bronze medals. Report of Royal Commission on the Waterfront Industry released. |
| 1,953 | Power restrictions suspended in North Island, first time for 12 years. Coronation Day for Her Majesty Queen Elizabeth the Second. Mt. Everest conquered on 29 May by British expedition, the summit being reached by the New Zealander Edmund Hillary and the Sherpa Tensing. Armistice agreement signed in Korea. The London-Christchurch air race won by RAF Canberra No. 3 in record time of 23 hours 51 minutes. National Housing Conference held. New Zealand's worst railway disaster occurred at Tangiwai on Christmas Eve, with a death roll of 154 persons. Arrival of Her Majesty Queen Elizabeth the Second and His Royal Highness the Duke of Edinburgh, on 23 December, the first occasion on which a reigning monarch had visited these shores. |
| 1,954 | The Queen opened a special session of Parliament. New Zealand took seat on United Nations Security Council. New Zealand won seven gold, seven silver, and five bronze medals at Empire Games in Vancouver. The Executive Council and Cabinet held meetings at Auckland on 25 May to mark the centenary of parliamentary government in New Zealand. New Zealand signed the South-east Asia Treaty at Manila. |
| 1,955 | New Zealand made contribution to defence of South-east Asia by sending squadron of fighter bombers and part transport squadron to Malaya and, later in the year, an Army Special Air Service Squadron. Pulp and paper mill at Kawerau began operation. Rimutaka tunnel opened for traffic in November. |
| 1,956 | Report of Royal Commission on Monetary, Banking, and Credit Systems released. Roxburgh and Whakamaru power stations in operation. Building controls abolished. Team sent to Olympic Games at Melbourne wins two gold medals. Colombo Plan Conference held in Wellington. |
| 1,957 | New Zealand Antarctic Expedition established Scott Base at Pram Point, McMurdo Sound. Dairy produce given unrestricted, duty-free right of entry to Britain till 1967. Plan announced to almost double generating capacity of New Zealand's power systems by 1970 at cost of $470 million, including the laying of a cable across Cook Strait. Lord Cobham succeeded Lord Norrie as Governor-General on 5 September. Separate Court of Appeal constituted. Sir Leslie Munro elected President of United Nations General Assembly. Labour Government assumed office under Right Hon. W. Nash. Battalion sailed for service in Malaya. |
| 1,958 | Import selection and exchange allocation brought into force to conserve overseas exchange. Sir Edmund Hillary and companions reached South Pole overland from Scott Base. Royal Tour of Her Majesty the Queen Mother. PAYE taxation on incomes introduced. Electric power restrictions in North Island. New Zealand won four gold, six silver, and nine bronze medals at Empire Games in Cardiff. Power generated from geothermal steam at Wairakei and from coal station at Mercer. |
| 1,959 | Mr C. M. Bennett, a distinguished Maori, appointed High Commissioner in Malaya. National Consumer Council appointed and four regional consumer committees established. Scheme provided for capitalisation of family benefit for housing purposes. Auckland Harbour Bridge opened (May). Reconstructed Wellington Airport opened for traffic (July). S.s. Holmglen foundered off Timaru with loss of 15 lives. Twelve nations, including New Zealand, signed treaty to preserve Antarctica for peaceful scientific research for all time. |
| 1,960 | Government signed agreement for company to use power from Te Anau - Manapouri Lakes system for large aluminium smelting industry. Regular television programmes began in Auckland. Commission on Education appointed with Sir George Currie as chairman. Institute of Economic Research established., Industrial Development Conference held in Wellington. New Zealand athletes won two gold medals in one day at Olympic Games in Rome, also one bronze medal. Government Service Equal Pay Act passed. Conference of British Commonwealth Statisticians held in Wellington. Labour Government defeated and National Government assumed office under Right Hon. K. J. Holyoake. |
| 1961 | Review of Maori Affairs (Hunn Report) published. United Nations seminar on Human Rights held in Wellington. Right of unrestricted and duty-free access to United Kingdom market for meat and dairy produce emphasised in discussions on possible entry of United Kingdom into European Economic Community; assurance given that special arrangement would be sought to protect vital interests of New Zealand. Minister to European Economic Community appointed. Expansion of overseas trade posts. Tasman Empire Airways became wholly owned by New Zealand (later renamed Air New Zealand). Monetary and Economic Council appointed. New Zealand joined International Monetary Fund, International Bank for Reconstruction and Development, and International Finance Corporation. Industrial Development Conference held. Television broadcasts extended to Wellington and Christchurch. |
| 1,962 | Western Samoa became first independent Polynesian State. Cook Strait rail-ferry service commenced with Aramoana. Protracted discussions, including Commonwealth Prime Ministers' Conference, on possible trade repercussions of Britain's proposal to join European Economic Community. Report presented by Royal Commission on State Services chaired by Mr Justice McCarthy. Extensive building programme for universities approved. Brigadier Sir Bernard Fergusson succeeded Lord Cobham as Governor-General. New Zealand won 10 gold, 12 silver, and 10 bronze medals at Commonwealth Games at Perth. New Tasman cable link completed as part of Commonwealth Pacific cable. |
| 1,963 | Breakdown of Britain's bid to enter European Economic Community. Export Development Conference held in Wellington. Visit of Her Majesty Queen Elizabeth II and His Royal Highness the Duke of Edinburgh. The Queen opened New Zealand House in London. Approval given by Government for development of iron and steel industry. The World Bank loaned $5.6 million for port development. Work was begun on Manapouri tail-race tunnel as part of electric-power project. Crash of a National Airways Corporation DC3 aircraft in the Kaimai Ranges killed 23 persons, and 15 lives lost in accident to a bus returning from Waitangi Royal celebrations. Controversy over proposed French nuclear tests in Pacific. |
| 1,964 | Three Cook Strait cables, each of 25 miles, laid as part of inter-Island transmission project. Start made on Tongariro hydro-electric power scheme. Oil refinery opened at Whangarei. Exports and Shipping Council established. New agreement on beef exports to United States. Agricultural Development Conference held. New Zealand team won three gold and two bronze medals at Olympic Games in Tokyo. Reports made by overseas consultants on steps to meet traffic problems of central areas of main cities. Private savings banks opened by trading banks. |
| 1,965 | United Nations Economic Commission for Asia and the Far East held its twenty-first session in Wellington. Eleventh Conference of Commonwealth Parliamentary Association held in Wellington. Contract let for oil-fired thermal power station at Marsden Point, Whangarei. Artillery unit committed to combat service in Vietnam. Limited free trade agreement negotiated with Australia. Cook Islands became self-governing. Auckland International Airport came into use. Jet airliners (three DC8's) obtained by Air New Zealand. Haast Pass highway opened to link south Westland and Otago. Millionth telephone installed. |
| 1,966 | Labour force reached 1,000,000. Licensed television sets reach 500,000. Collier Kaitawa sank off Cape Reinga with loss of 29 lives. Royal Tour by Her Majesty the Queen Mother. Visit by the President of the United States, Mr Lyndon B. Johnson. An Encyclopaedia of New Zealand published. New Zealand won 8 gold, 5 silver, and 13 bronze medals at Commonwealth Games in Jamaica. Revival of United Kingdom interest in joining European Economic Community. |
| 1,967 | Matahina electric power station brought into operation. Explosion at Strongman mine caused 19 deaths. Low wool prices led to extensive purchases by Wool Commission. Decimal currency introduced on 10 July ($2 equal to former unit of £). Contributions by public to Freedom from Hunger Campaign since 1962 reached $3.5 million. Infantry battalion moved to Vietnam. Extension from 6 p.m. to 10 p.m. of hotel hours for sale of liquor. Taxation Review Committee Report completed. Roll-on roll-off vessels on Wellington-Lyttelton run and Auckland-Lyttelton-Dunedin run. New Zealand put case to GATT session for improved trade arrangements for agricultural products. Devaluation of the New Zealand dollar by 19.45 percent following United Kingdom devaluation by 14.3 percent of pound sterling. Sir Arthur Porritt succeeded Brigadier Sir Bernard Fergusson as Governor-General. |
| 1968 | SEATO Conference held in Wellington. Prime Minister attended five-power defence conference held at Kuala Lumpur. T.E.V. Wahine foundered in Wellington Harbour in severe storm with loss of 51 lives. Strong earthquake in Inangahua area resulted in three deaths. Coaster Maranui sank in gale off Coromandel Peninsula with loss of nine lives. Manapouri tunnel pierced. Construction commenced of natural gas pipeline from Kapuni to Auckland and Wellington. Jet planes introduced in internal air services. Guidelines for economic growth in next decade contained in report of Targets Committee of National Development Conference. New Zealand team won one gold and two bronze medals at Olympic Games in Mexico City. Human Rights Year specially observed. |
| 1,969 | National Development Conference held; 632 recommendations approved to assist in attainment of growth targets in indicative planning for 10 years ahead. National Development Council and advisory councils set up. Vocational Training Council appointed. Technical Committee on Statistics made a special report to the National Development Council. Transport Advisory Council and Ports Authority appointed. Royal Commission on Social Security commenced hearings. Electric power generated from giant Manapouri project. Construction of aluminium smelter at Invercargill commenced. First output from steel mill at Glenbrook. Construction of thermal power station at New Plymouth commenced. Oil strike off shore at Taranaki. Widening of Auckland Harbour Bridge completed. Motorways extended into Auckland and Wellington. Selection of Auckland and Wellington as major container ports. Prime Minister and Deputy Prime Minister press in EEC capitals New Zealand's special case in regard to butter and lamb exports to the United Kingdom. Special celebrations for bi-centenary of Captain James Cook's discovery of New Zealand. Voting rights extended to 20-year-old persons. |
| 1,970 | Council for Asian and Pacific Co-operation (ASPAC) met in Wellington. Queen Elizabeth the Second, the Duke of Edinburgh, Prince Charles, and Princess Anne made a Royal Tour in connection with Cook bi-centenary celebrations. New Zealand represented at Pacific Basin Economic Co-operation Council in Japan and participated in Expo 70, Trade Fair at Osaka, Japan. New Zealand granted associate status in Organisation for Economic Co-operation and Development. Physical Environment Conference held. Report made by Commission on proposal to raise level of Lake Manapouri to provide additional electric power. Natural gas from Kapuni supplied to Auckland. Tender accepted for international airport at Rarotonga, Cook Islands. New Zealand team won two gold, six silver, and six bronze medals at Commonwealth Games in Edinburgh. Visit of Mr G. Rippon, Britain's representative in EEC negotiations. In Europe, Deputy Prime Minister further presented New Zealand's claim for special consideration in the marketing of butter, cheese, and lamb in an enlarged EEC. |
| 1,971 | South Pacific Year observed; forum held in Wellington with Heads of State attending from Cook Islands, Western Samoa, Tonga, Fiji, and Nauru. Commonwealth Declaration adopted at conference in Singapore. Centenary of birth of Lord Ernest Rutherford. Ministry of Works completes 100 years of public works dating from Vogel era. Centenary of formation of first co-operative dairy company. Stabilisation of Remuneration Act in operation, and also price justification scheme. Negotiations by Britain with members of European Economic Community secure New Zealand's position by special arrangement for her butter and cheese exports to the United Kingdom; Britain decides to join EEC in 1973 and later signs Treaty of Accession. Crisis with meat schedule price for lambs, related to large increase in freight rates and imposition of levy on meat imports by United Kingdom. First container ships loaded at Wellington and Auckland. Seamen's Union deregistered. Major shipments of ironsand to Japan from Taranaki coast. Bluff aluminium smelter in commercial operation and first exports made. All seven generators installed at Manapouri hydro-electric station. Silver Star express introduced on North Island main trunk line. Tenders called for fourth Cook Strait rail ferry. Natural gas reticulation to Wellington completed. Consumers Price Index Revision Advisory Committee presents its report. Introduction of first steps of metric conversion for weights and measures. Fixed exchange rate adopted between New Zealand and the United States dollar; devaluation adjustment of 1.75 percent in line with Australia. Withdrawal of New Zealand combat troops from Vietnam. |
| 1,972 | Right Hon. J. R. Marshall succeeded Right Hon. Sir Keith Holyoake as Prime Minister. Special measures for stabilisation of remuneration and prices. Sheep retention scheme payments. National Development Conference re-convenes to set revised targets. Meeting of Pacific Basin Economic Council held in Wellington. Educational Priorities Conference held. Royal Commission on Social Security presented Its report; some recommendations applied in 1972 Budget. Report presented by Royal Commission on Containers. Containerised shipping service in operation from Auckland and Wellington to United Kingdom and Europe. First container train ran from Invercargill to Wellington. Wellington Airport runway extended to enable DC8 jet aircraft to be operated on trans-Tasman service. Strong lead on opposition to nuclear testing in atmosphere given by New Zealand at United Conference on the Environment in Stockholm. Tunnel 4 miles long completed for Tongariro electric power project. Wool price recovery. New Zealand team won 1 gold, 1 silver, and 2 bronze medals at Olympic Games in Munich. Sir Denis Blundell succeeded Sir Arthur Porritt as Governor-General. Legislation passed for Wool Marketing Corporation, Equal Pay, and Accident Compensation. Indo-Pacific Fisheries Council of Food and Agricultural Organisation met in Wellington. Meeting of 12 Antarctic Treaty consultative powers held in Wellington. Overseas reserves reach record levels. National Government defeated and Labour Government assumed office under Right Hon. N. E. Kirk. Third Cook Strait rail ferry in operation. |
| 1,973 | Britain joins European Economic Community; future supply and prices for New Zealand butter and cheese in traditional market affected. Wool Marketing Corporation established. Farm income equalisation scheme extended. Trade negotiations with China; Embassy opened in Peking. Extension of trade with Peru, Brazil, and Chile. New Zealand becomes member of Organisation for Economic Co-operation and Development (OECD). First DC10 jet aircraft with 241 seats in service with Air New Zealand, and purchase of fourth DC10 approved. Reduced air fares in Pacific. Lake Manapouri to be controlled only within natural levels for electricity generation. Agreement reached for development of Maui field of natural gas offshore from Taranaki. Electricity restrictions. Regional development promoted. Timber and pulp mill opened at Whirinaki, Napier. Price control policy extended. United Kingdom agrees to compensate New Zealand dairy farmers for losses due to sterling exchange adjustment related to average value of currencies of major trading partners. New Zealand currency placed on “near float arrangement” of relationships with major trading partners. Revaluation of 3 percent and 10 percent. Official overseas reserves reach $1,000 million. Colour television introduced. First step of Equal Pay Act in effect. Industrial Relations Act passed. New Zealand Shipping Corporation established; two ships purchased for overseas trade and one roll-on roll-off ship for coastal trade. Moves to economise in oil and petrol consumption and review energy resources. Construction of 100-megawatt Rangipo hydro-power station and 550-megawatt Huntly coal-fired power station approved. Peak of 845 road deaths. |
| 1,974 | Tenth British Commonwealth Games held in Christchurch, New Zealand won 9 gold, 8 silver, and 18 bronze medals. Visit of Royal Family and opening of Parliament by Her Majesty the Queen. Energy supplies under close examination; reduced supply and higher prices of oil led to call for economies. New Plymouth thermal power station in operation and projects approved during the year include three hydro stations, two thermal stations, and more gas turbines. Plans for Clutha River development evolved. Increased public participation in decisions affecting the environment; environmental impact reports required for public works. Public discussions organised on educational development; reports support greater community involvement. Review of immigration policy. EPIC reduced fares boost trans-Tasman air traffic. Revised Customs Tariff introduced on 1 July in metric measure. Reorganisation of broadcasting begun. State Shipping Corporation places order for container ship. Fourth Cook Strait rail ferry brought into service. Government supports Wellington-Lyttelton steamer service by charter. Self-government granted to Niue after referendum; aid continues. Embassies opened in Moscow and Vienna, Report by Commission of Inquiry into the Meat Industry. Drop in overseas assets with adverse terms of trade; fall in wool and meat prices. Britain's proposal to pay 18 percent more for dairy products approved by EEC. Superannuation Act passed and board of New Zealand Superannuation Corporation appointed. Death of the Prime Minister, Right Hon. N. E. Kirk; succeeded in office by Right Hon. W. E. Rowling. Severe fall in overseas reserves. Shah and Empress of Iran visit New Zealand; trade agreement signed. 1974 Devaluation of 9 percent. Compulsory savings scheme to combat inflation. Government offers to meet 40 percent of prospecting costs of offshore oil drilling programmes subject to receiving 51 percent of controlling interest in development. |
| Subject | Year | Page |
|---|---|---|
| Building stones | 1,892 | 194 |
| Varieties of soil | 1,892 | 193 |
| Acclimatisation | 1,894 | 430 |
| Co-operative system of constructing public works | 1,894 | 234 |
| Frozen meat trade, the | 1,894 | 311 |
| Labour in New Zealand | 1,894 | 362 |
| Railways in New Zealand: Their history and progress | 1,894 | 377 |
| Sheep farming | 1,894 | 302 |
| Southern Alps, the | 1,894 | 474 |
| State farms | 1,894 | 243 |
| West Coast Sounds, the | 1,894 | 482 |
| Shipping companies | 1,895 | 389 |
| Wellington-Manawatu railway, the | 1,895 | 381 |
| Laws of England and New Zealand, difference between | 1,896 | 281 |
| Waihi Gold Mining Co. | 1,897 | 432 |
| Mount Cook: Its glaciers, and the Hermitage | 1,898 | 552 |
| Scenic wonderland, a | 1,898 | 565 |
| Christchurch to West Coast, journey from | 1,899 | 548 |
| Forest trees and the timber industry | 1,899 | 470 |
| Gold dredging industry, the | 1,899 | 509 |
| Mount Cook district, the | 1,899 | 554 |
| Journeys in Central North Island | 1,899 | 520 |
| Tuhoeland | 1,899 | 546 |
| Chatham Islands, the | 1,900 | 531 |
| Coal deposits of New Zealand, the | 1,900 | 479 |
| Hemp industry, the | 1,900 | 477 |
| Kauri gum | 1,900 | 489 |
| Maori mythology | 1,900 | 536 |
| Mount Sefton, ascent of, and a night on Mount Cook | 1,900 | 519 |
| New Zealand contingents for South Africa | 1,900 | 449 |
| Pumice-stone deposits of New Zealand | 1,900 | 486 |
| Wanganui River, up the, to Tokaanu | 1,900 | 509 |
| Maori religion | 1,901 | 530 |
| Marlborough Sounds, and Otago lakes, the | 1,901 | 517 |
| Cook Islands, the laws of | 1,902 | 573 |
| Maori, neolithic, the | 1,902 | 578 |
| Maori sociology | 1,903 | 641 |
| Maori, colour sense of the | 1,905 | 637 |
| Maori marriage customs | 1,906 | 638 |
| Maori, ancient: His amusements, games, etc. | 1,907 | 707 |
| New Zealand international exhibition | 1,907 | 701 |
| Maori, ancient: His clothing, etc. | 1,908 | 734 |
| Agriculture in New Zealand | 1,912 | 809 |
| HMS New Zealand and Government training ship Amokura | 1,913 | 932 |
| Mineral waters of New Zealand | 1,913 | 896 |
| External trade of New Zealand, the | 1,915 | 858 |
| Maori, topographical nomenclature of the | 1,919 | 936 |
| Wages and working hours in New Zealand | 1,919 | 860 |
| Education system of New Zealand, the | 1,925 | 816 |
| Effect of nativity order on infant mortality | 1,925 | 835 |
| Local government in New Zealand | 1,925 | 845 |
| Terman intelligence tests in New Zealand schools | 1,925 | 823 |
| Cancer in New Zealand: A Statistical study | 1,926 | 889 |
| Totalisator, the | 1,926 | 838 |
| Britomart, mission of, at Akaroa, in August 1840 | 1,927 | 1,012 |
| Mortality rates, New Zealand | 1,927 | 995 |
| Livestock production: A review based on standard values and units | 1,929 | 990 |
| Dairy farm survey | 1,938 | 429 |
| Ross Dependency | 1,938 | 900 |
| Plants and fauna | 1,940 | 28 |
| Libraries | 1,940 | 928 |
| Tourist attractions: mineral waters and spas | 1,940 | 932 |
| Alexander Turnbull Library | 1,946 | 914 |
| National Film Unit | 1,946 | 724 |
| Retail prices in New Zealand, with reference to the Consumers' Price Index | 1947-49 | 998 |
| Economic policy and national income | 1,950 | 1,033 |
| Department of Scientific and Industrial Research | 1951-52 | 1,066 |
| Standardisation | 1951-52 | 1,076 |
| Sources of statistical information | 1,953 | 1,016 |
| Royal Tour of New Zealand, 23 December 1953 to 31 January 1954 | 1,954 | 1,121 |
| New Zealand: Its tourist industry, tourist and sporting attractions | 1,955 | 1,143 |
| Royal Commission on Monetary, Banking, and Credit Systems: Summary of report | 1,956 | 1,201 |
| Consumers' Price Index—1955 Revision | 1,957 | 1,214 |
| New Zealand activities in the Antarctic | 1,958 | 1,247 |
| New Zealand's international activities | 1,959 | 1,221 |
| Grassland research in New Zealand | 1,960 | 1,243 |
| University education for science and technology | 1,961 | 1,186 |
| New Zealand and the European Economic Community | 1,962 | 1,150 |
| Visit of Her Majesty Queen Elizabeth II and His Royal Highness the Duke of Edinburgh, 6 to 18 February 1963 | 1,963 | 1,167 |
| The development of New Zealand's railway system 1863-1963 | 1,963 | 1,175 |
| The arts in New Zealand, including the visual arts, literature, music and opera, and drama and ballet | 1,964 | 1,145 |
| The Maori people as shown by the Population Census 1961 | 1,965 | 1,160 |
| Industrial relations—The next ten years and beyond | 1,966 | 1,131 |
| Population growth and economic development in New Zealand | 1,966 | 1,136 |
| Scientific research in New Zealand | 1,967 | 1,118 |
| Recent constitutional changes in the South-west Pacific | 1,968 | 1,104 |
| National Development Conference 1969 | 1,969 | 1,103 |
| Development of forestry and forest industries | 1,969 | 1,107 |
| Captain James Cook and his three voyages of discovery in the Pacific 1768-79 | 1,969 | 1,116 |
| Metrication | 1,970 | 1,110 |
| Human pressures on the natural environment | 1,970 | 1,115 |
| Ministry of Works, 1871-1971 | 1,971 | 1,110 |
| Evolution of social security in New Zealand | 1,972 | 1,015 |
| Evolution of New Zealand dairy industry 1871-1971 | 1,972 | 1,024 |
| Development of the meat industry 1922-72 | 1,973 | 1,047 |
| New Zealand membership of the Organisation for Economic Co-operation and Development | 1,973 | 1,064 |
| Tenth British Commonwealth Games 1974 | 1,973 | 1,068 |
| New Zealand Ports and Shipping Developments | 1,974 | 1,065 |
Table of Contents
Patronage has always been part of the history of the arts. If the arts are to flourish in the face of strong competition from mass media entertainment there must be both private patronage and assistance from the State and from other sources of public funds. In New Zealand private patronage has become an important source of finance and encouragement for the arts, and the State and public bodies are playing an important part by providing direct financial help as well as other forms of assistance. The Departments of Internal Affairs and Education, the Council of Adult Education, and broadcasting services have for many years given valuable assistance to the arts in the course of their everyday functions, and many local statutory bodies make worth-while donations of finance and facilities.
In 1946 State aid for literature was put on a permanent basis by the establishment of the New Zealand Literary Fund, financed from the vote of the Department of Internal Affairs, and in 1973 the New Zealand Authors' Fund was set up to compensate authors for the loss of royalties resulting from the use of their books in libraries. Applications should be made by 31 July each year to the Secretary for Internal Affairs, Private Bag, Wellington.
Assistance to the arts other than literature began in 1947 when a Cultural Fund administered by the Department of Internal Affairs was instituted. The fund was used mainly to help talented young people to further their studies abroad by awarding bursaries to them to pay for travel and study.
The assistance now available is described below.
Queen Elizabeth the Second Arts Council—To commemorate the visit of Her Majesty the Queen to New Zealand in 1963, the Queen Elizabeth the Second Arts Council was formed in 1964. The arts council was charged to encourage, foster, and promote the practice and appreciation of the arts in New Zealand, to make accessible to the public of New Zealand all forms of artistic and cultural work, to improve the standard of execution of the arts, and to foster and maintain public interest in the arts and culture of New Zealand.
In pursuit of its principal objective of raising the standard of both the practice and appreciation of the arts in New Zealand, the council assists individuals working in the arts, and incorporated and non-profit making organisations, which have the capacity to work at a consistent level of artistic achievement so as to maintain sound standards of management and promotion, and which can offer career opportunities to trained and gifted people. Activities which are professional in character and standard thus receive priority of consideration for financial support.
The council recognises that a strong amateur movement represents the foundation on which professional activity is built. Through national bodies representing amateur theatre, operatic and musical comedy societies, and art societies the council channels funds to assist a variety of projects undertaken either by the national body itself or by the affiliated groups.
In April 1970, the council sponsored Arts Conference 1970, at which individuals and representatives of organisations from throughout New Zealand reviewed existing cultural policies and made a bold attempt to reach agreement on a policy for the arts which would be valid for the next decade. Two main themes emerged: the needs of the individual artists and the needs of the regions.
The council concerns itself with the needs of each art form nationally and the artistic needs of each community, and the council and its staff continue to seek advice from experts. This advice has, in the main, been sought from “advisory panels” and from ad hoc consultants available in respect of specific matters.
In order to assist the emergence of film making in New Zealand the council has set up a Creative Film Fund to provide assistance for specific film projects being undertaken by both established and experimental film-makers and groups. It also supports a national Drama School and the National School of Ballet.
The council recognises that local government has an important role to play in the arts. In pursuing a policy of regional development of the arts the council will, in assessing levels of subsidy, take into account the financial support organisations can attract from the public and from local government.
The 1974 Queen Elizabeth II Arts Council Act 1974 provides for greater emphasis on regional development of the arts through three regional arts councils and through community arts councils.
The government grant for 1974-75 was $1,500,000. Included in this was a maximum subsidy of $10,000 on funds raised by beneficiary organisations. The Lottery Profits Board of Control grant was $260,000 for the year ended 31 March 1975. An additional $250,000 was allocated by the Board of Control to the Minister of Internal Affairs to be used for capital projects; this fund was distributed by the Minister on the advice of the Council.
Sector Council for Cultural Affairs—Following Arts Conference 1970, the Queen Elizabeth II Arts Council was asked to assume responsibility for the functions outlined in the N.D.C. Social and Cultural Committee's report, including the need for an institution to provide advanced training for the whole range of the arts.
Individual art galleries and museums were described in the 1971 and earlier issues of the Yearbook. These subjects are very well covered in An Encyclopaedia of New Zealand under the headings Art in New Zealand, and Museums, while Music is another heading for cultural activity and is covered separately.
In 1973 a fund was set up to subsidise capital works of art galleries and museums. Subsidies are made available by the Minister of Internal Affairs on the recommendation of an Advisory Committee. A small proportion of the fund is made available each year to the 6 major metropolitan art galleries and museums in Auckland, Christchurch, and Dunedin, to enable them to assist smaller art galleries and museums in their areas with approved non-capital expenses.
The following awards are available:
New Zealand Literary Fund—This fund is financed by a yearly appropriation on the vote of the Department of Internal Affairs. Assistance from the fund is granted by the Minister of Internal Affairs, who is advised by the Literary Fund Advisory Committee.
Scholarship in letters—The scholarship of $4,000 is awarded annually to an established New Zealand writer by the Minister of Internal Affairs, on the recommendation of the Literary Fund Advisory Committee. Applications are made to the Secretary, New Zealand Literary Fund Advisory Committee, Department of Internal Affairs, Private Bag, Wellington.
Writing Bursary—The bursary is awarded annually to a New Zealand writer with potential by the Minister of Internal Affairs, on the recommendation of the Literary Fund Advisory Committee. It is of the value of $4,000.
Robert Burns Fellowship in Literature—This fellowship in literature is tenable for 1 year, with provision for extension, at the University of Otago, a condition being that the fellow shall be resident for the academic year. The fellowship is open to New Zealand writers, preferably under 40 years. Subject to the availability of funds, the Fellow receives the equivalent of a lecturer's salary. Applications are made to the Registrar, University of Otago, Dunedin, by 10 August.
Maori Writers's Awards—The Maori Purposes Fund Board annually makes available one award of $1,000 for creative writing in the English language, and another of $1,000 for creative writing in the Maori language. Applications from persons of Maori descent should be with the Secretary of the Maori Purposes Fund Board, Box 2390, Wellington, by no later than 31 May.
Award for Achievement—The Award for Achievement, of $500, recognises the contribution of one person to New Zealand literature. The award is granted each year by the Minister of Internal Affairs, on the recommendation of the Literary Fund Advisory Committee.
Esther Glen Award—This award of the New Zealand Library Association is available annually to the author of the most distinguished children's book written by a New Zealander. (Applications are not called for.)
Hubert Church Prose Award—This award of PEN (New Zealand Centre) with the assistance of the New Zealand Literary Fund, is available annually for the best prose writing by a New Zealand author. (Applications are not called for.)
(i) Jessie Mackay Poetry Award—This award of PEN (New Zealand Centre) with the assistance of the New Zealand Literary Fund is available annually for the best poetry written by a New Zealand author. (Applications are not called for.)
Katherine Mansfield Memorial Award—The Bank of New Zealand, in association with the New Zealand Women Writers' Society (Inc.), sponsors a biennial prestige memorial award for the short story. For 1975 the award will be for an unpublished short story.
Bank of New Zealand Young Writers' Awards—Concurrently with the Katherine Mansfield Memorial Award, the Bank of New Zealand sponsors two awards for young writers. These are—the senior award, for entrants aged 24 years and under; and the junior award for secondary school students. Both awards are for the short story.
Winn-Manson Menton Fellowship—The fellowship is to allow a New Zealand writer to write and study at Menton in the South of France. Applicants must be serious writers who would use the fellowship to further their literary studies and endeavours. For 1975 the fellowship will consist of an award of $1,750, a bursary from the Government of France of 3,600 francs (approximately $530), and return passage. Applications should be made to the Hon. Secretary of the Winn-Manson Menton Fellowship, P.O. Box 10256, Wellington.
Young Writers' Award—This award of PEN (New Zealand Centre) with the assistance of the New Zealand Literary Fund, the New Zealand Book Council, and the McKenzie Foundation, is available annually for writing by people under 20 years of age. There are categories for prose and poetry. Applications should be made to the Secretary, P.O. Box 2283, Wellington.
James Wattie Book of the Year Award—This award is made each year by Wattie Industries Limited. Full conditions of entry for the James Wattie Book of the Year Award, which is aimed mainly at encouraging the growth of publishing in New Zealand, are available from the Secretary, NZBPA, care of P.O. Box 36064, Auckland 9.
One-act Playwriting Competition—In this annual competition the winning play is workshopped and produced with the Theatre Federation assistance. Applications should be made to the Secretary, New Zealand Theatre Federation, P.O. Box 6158, Wellington.
Biennial Playwriting Competition—This competition is for full length plays. For 1976 the winning play will be workshopped and produced with Theatre Federation assistance. Applications should be made to the Secretary, New Zealand Theatre Federation, P.O. Box 6158, Wellington.
J. M. Sherrard Awards—These awards of the Historical Association (Canterbury) are available biennially for outstanding work in the field of New Zealand regional history. (Applications are not called for.)
Professor J. C. Reid Award for Arts Criticism—The Queen Elizabeth the Second Arts Council of New Zealand sponsors an annual award to journalists for excellence in arts criticism in conjunction with the New Zealand Journalists' Union. The competition is administered by the New Zealand Journalists' Union, Box 1238, Wellington.
Frances Hodgkins Fellowship—The fellowship is open to New Zealand painters and sculptors preferably under 40 years. It is tenable for 1 year, with provision for extension, at the University of Otago. Subject to the availability of funds, the fellow receives the equivalent of a lecturer's salary. Applications are made to the Registrar, University of Otago, Dunedin, by 10 August.
Mozart Fellowship—The fellowship is open to New Zealand musicians who are serious composers. It is tenable for 1 year, with provision for extension, at the University of Otago. Applicants should be at least 27 years old. Subject to the availability of funds, the fellow receives the equivalent of a lecturer's salary. Applications are made to the Registrar, University of Otago, Dunedin, by 10 August.
Since 1963 there has been a control of the export from New Zealand of Maori artifacts made in or brought to New Zealand before 1903, important books and papers more than 90 years old of which there is no copy in the main types of library, and biological, botanical, and mineralogical type specimens. Permission of the Minister of Internal Affairs for the export of historic articles must be secured, and the Minister may withhold permission if he is satisfied that removal would be detrimental to historical or scientific study or research in New Zealand, or contrary to the public interest.
Protection to a wider range of items of historical significance and controls on the sale of Maori artifacts within New Zealand are embodied in the Antiquities Act 1975.
Government has approved grants being made on a four-year basis to the National Museum to enable the purchase of Maori artifacts.
The Archives Act established a National Archives to provide for the custody and preservation of the public archives of New Zealand. The Chief Archivist, appointed under the Act, has certain statutory powers. No public archives, as defined in the Act, can be destroyed without his approval and he has powers of inspection and direction in respect of the keeping of public records. Government records of permanent value are deposited with National Archives, and considerable original research is done in the National Archives by scholars, students, officials, and the public. As well as the public archives (i.e., public records out of current use) there are small holdings of semi-official and private papers of Governor Sir Thomas Gore Brown and some political figures, including Sir Frederick Weld, W. P. Reeves, Sir James Allen, W. Lee Martin, C. F. Skinner, and T. P. Shand. The papers of the New Zealand Company, R. J. Seddon, and Sir Walter Nash provide larger collections. The Nash collection is one of great significance covering his life and times. At present Professor Keith Sinclair, as Sir Walter's official biographer, is working with the papers. Some of the more noteworthy public documents are to be found amongst the archives of the Governor, Colonial Secretary, Maori Affairs Department, Samoan administrations, and the armed forces both in peace and war.
National Archives has a records centre in Lower Hutt and one in Auckland. These provide storage for semi-current Government records as well as public archives. The total staff, including that of records centres, is 15. An officer of the National Archives collaborates with departmental records officers and occasionally with the State Services Commission on assignments on the management of current records. Some public archives of regional interest are deposited with certain non-government repositories approved by the Minister of Internal Affairs, such as the Hocken Library in Dunedin, the Canterbury Museum in Christchurch, the Hawke's Bay Art Society Gallery and Museum in Napier, the Auckland Institute and Museum, the New Plymouth Public Library, and the Marlborough Historical Society Museum in Blenheim.
National Archives publishes an annual Summary of Work, including a list of new accessions to its holdings.
Under the Historic Places Act 1954, the New Zealand Historic Places Trust was created with the complementary functions of fostering public interest in places and objects of national or local historic interest, and assisting with, or itself undertaking, the preservation and maintenance of such places and objects. The Trust is currently composed of 15 members, 11 of whom are either ex officio or appointed on the nomination of some outside agency, 3 of whom are elected by associate or public members, and 1 who is co-opted for special knowledge. The Trust operates locally through Regional Committees.
Much of the early emphasis of Trust work was concerned with the erection of bronze plaques and notice boards to commemorate significant sites or buildings. The Trust is now giving more attention to preservation which, in the case of buildings, often means first-aid repairs and, less frequently, restoration. Repairs are usually financed through a grant-in-aid to the owner or occupant. The Trust administers six properties which are open to the public; these are the Waimate Mission House, Pompallier House in Russell, Clendon House in Rawene, Ewelme Cottage and Alberton in Auckland, and old St Paul's in Wellington. The Trust also owns several other properties, and is involved in the administration of properties owned by other organisations.
Historic sites are sometimes, but not yet on a scale to satisfy the Trust, protected by some form of reservation. The Trust is also aware of the accelerated loss of our prehistoric heritage. Roading, hydro-electric development, closer settlements, and other undertakings, all on an increasing scale, have meant the loss or destruction of many archaeological remains. The Trust collaborated with the Ministry of Works to survey the areas affected by the Tongariro power development scheme and the Kapuni gas pipeline, and to rescue, wherever possible, the field monuments threatened by those two projects. The Trust employs its own archaeologist.
The Trust publishes booklets and leaflets, usually about buildings and sites in which it has been actively interested. It also has a growing photographic collection.
Compiled in the Alexander Turnbull Library, National Library, Wellington
THE following list of books has been compiled to give New Zealand and overseas readers a selective approach to the country's literature and sources of information. Entries are arranged alphabetically under appropriate subject headings which are in approximate order of the Dewey Classification. Emphasis has been placed on works which are known to be in print. Selection has covered books published in New Zealand as well as books published overseas about New Zealand or written by resident New Zealanders. Works which are clearly university or school texts have been omitted unless they represent the most concise and authoritative treatment of a subject. Works of less than 75 pages have been indicated by an asterisk.
The standard current bibliography of New Zealand books and pamphlets as from 1967 is the New Zealand National Bibliography issued by the Alexander Turnbull Library for the National Library of New Zealand. Prices of New Zealand imprints are as shown in the Associated Booksellers' New Zealand books in print, in publishers' catalogues and from other sources, but prices of overseas publications are given at the overseas rate.
ALEXANDER TURNBULL LIBRARY. Union Catalogue of New Zealand and Pacific Manuscripts in New Zealand Libraries. Wn, 1963-1969. 2 v.
BAGNALL, A. G., ed. New Zealand National Bibliography to the Year 1960. Wn, Govt. Print., 1969-.v. 2, 1890-1960, A-H, published 1969; v. 3, I-O, published 1972.
AN ENCYCLOPAEDIA OF NEW ZEALAND, edited by A. H. McLintock. Wn, Govt. Print., 1966. 3 v. $15.
FAIR, A. P. R. Guide to Book Values, New Zealand - Australia - Pacific - Antarctic; Book Auction Records 1962-1967. Wn, the author, 1967. o.p.
GENERAL ASSEMBLY LIBRARY. Copyright Periodicals Currently Received 1971. Wn, 1972. $2.
HOCKEN, T. M. A. A Bibliography of the Literature Relating to New Zealand. Wn, Govt. Print., 1909. o.p. Reprinted. Wn, Newrick Associates, 1973. $20.
MC ELDOWNEY, W. J. The New Zealand Library Association 1910-60 and its Part in New Zealand Library Development. Wn, New Zealand Library Association, 1962. $1.80.
NEW ZEALAND BOOKS in Print 1974, ed. by Judith Wilson. Wn, New Zealand Book Publishers Association, 1974. $5.
NEW ZEALAND LIBRARY ASSOCIATION. Bibliography of New Zealand Bibliographies. Wn, 1967.
OXFORD NEW ZEALAND ENCYCLOPAEDIA. London, O. U. P., 1965. o.p.
RODGER, D. M. Theses on the History of New Zealand. Palmerston North, Massey University, 1968-72. 4 v.
TAYLOR, C. R. H. A bibliography of publications on the New Zealand Maori. Oxford, Clarendon Press, 1972. $3.50.
—- A Pacific Bibliography. 2nd ed. Oxford, Clarendon Press, 1965. o.p.
UNION CATALOGUE OF NEW ZEALAND NEWSPAPERS PRESERVED IN PUBLIC LIBRARIES, NEWSPAPER OFFICES, AND LOCAL AUTHORITY OFFICES, compiled by J. S. Gully. 2nd. ed. Wn, General Assembly Library, 1961. $1.30.
UNION LISTOF SERIALS IN NEW ZEALAND LIBRARIES. 3rd ed. Wn, National Library of New Zealand, 1969-1970. 6 v. $25.
UNION LIST OF THESES OF THE UNIVERSITY OF NEW ZEALAND, 1910-54, compiled by D. L. Jenkins. Wn, New Zealand Library Association, 1956. o.p.
Supplement, 1955-1962. $1.25. Supplement, 1963-67. $4. Supplement, 1968-71. $4. See also Rodger above.
*WILSON, J. O. A Finding List of British Parliamentary Papers Relating to New Zealand, 1817-1900. Wn, General Assembly Library, 1960. $1.
*WOOD, G. A. A guide for students of New Zealand history. Dn. McIndoe, 1973,
ADMINISTRATION IN NEW ZEALAND'S MULTI-RACIAL SOCIETY, edited by R. H. Brookes and I. H. Kawharu. Wn, New Zealand Institute of Public Administration, 1967. o.p.
ASIA AND THE PACIFIC IN THE 1970s; the Roles of the United States, Australia, and New Zealand. Bruce Brown, editor. Wn, Reed, 1971. $5.
BETTS, G. M. Betts on Wellington; a City and its Politics. Wn, Reed for the Wellington City Council and Victoria University of Wellington, 1970. $6.95.
BROWN, B. M. The Rise of New Zealand Labour; a History of the New Zealand Labour Party from 1916-1940. Wn, Price Milburn, 1962. o.p.
BUSH, G. W. A. Decently and in Order; the Government of the City of Auckland 1840-1971. Ak, Collins for the Auckland City Council, 1971. $5.
CLEVELAND, L. The Anatomy of Influence; Pressure Groups and Politics in New Zealand. Wn, Hicks Smith, 1972. $3.85.
CLEVELAND, L. and A. D. ROBINSON, comps. Readings in New Zealand Government. Wn, Reed Education, 1972. $8.50.
COLEMAN, M. D. The New Zealand Labour Party, 1916-1966; a bibliography. Wn, Library School 1972.
CONTEMPORARY NEW ZEALAND: essays on the human resource, urban growth, and problems of society, edited by K. W. Thomson and A. D. Trlin. Wn, Hicks Smith, 1973. $10.40.
DEFENCE PERSPECTIVES: papers read at the 1972 Otago Foreign Policy School. Wn, New Zealand Institute of International Affairs, 1972. $2.
*DOLLIMORE, H. N. The Parliament of New Zealand and Parliament House. 3rd ed. Wn, Govt. Print., 1973. 90c.
ESSAYS ON RACE RELATIONS AND THE LAW IN NEW ZEALAND; A series of Lectures Delivered at the Victoria University of Wellington. Ed. by W. A. McKean. Wn, Sweet and Maxwell, 1971. $5.50.
FIGHT FOR LIFE; New Zealand, Britain, and the European Economic Community. Papers and commentaries read at the 1970 Conference of the Institute and edited by Keith Jackson. Wn, Price Milburn for the New Zealand Institute of International Affairs, 1971. $1.50.
GRIMSHAW, P. Women's Suffrage in New Zealand. Ak, Auckland U.P.; Wn, O.U.P., 1972. $5.25.
HEALTH ADMINISTRATION IN NEW ZEALAND, edited by R. J. Latimer. Wn, New Zealand Institute of Public Administration, 1969. o.p.
JACKSON, W. K. New Zealand: politics of change. Wn, Reed, 1973. $3.95.
JOHNSTON, R. J. Urbanisation in New Zealand. Wn, Reed, 1973. $10.50.
JOLLIFFE, W. Jolliffe's Local Government in Boroughs and Counties. 8th ed., edited by J. P. McVeagh. Wn, Ferguson and Osborn, 1964-. 2 v.
KENNAWAY, R. N. New Zealand foreign policy 1951-1971. Wn, Hicks Smith, 1972. $4.50. pbk
MACLEAN, F. S. Challenge for Health; a History of Public Health in New Zealand. Wn, Govt. Print., 1964. $3.50.
MILNE, R. S. Political Parties in New Zealand. Oxford, Clarendon Press, 1966. $6.90; $5.
NEW ZEALAND DEPARTMENT OF JUSTICE. Crime in New Zealand; A Survey. Wn, Govt. Print., 1968. $4.50.
NEW ZEALAND FOREIGN POLICY: statements and documents, 1943-1957, Wn, Govt. Print., 1972. $9.
NEW ZEALAND PARLIAMENTARY RECORD, 1840-1949. edited by G. H. Scholefield. Wn, Govt. Print., 1950. $3.50.
Supplement 1950-1969 edited by J. O. Wilson. Wn. Govt. Print., 1969.
NEW ZEALAND. ROYAL COMMISSION ON SOCIAL SECURITY IN NEW ZEALAND. Social Security in New Zealand. Wn, Govt. Print., 1972. $3.95.
ORAM, C. A. Social Policy and Administration in New Zealand. Wn, New Zealand University Press, 1969. $5.
PACIFIC HORIZONS: a regional role for New Zealand. Wn, New Zealand Institute of International Affairs, 1972. $2.
PERRY, C. S. The Indecent Publications Tribunal; a Social Experiment. Ch, Whitcombe and Tombs, 1965. $2.75.
POLICIES FOR REGIONAL DEVELOPMENT IN NEW ZEALAND, ed. by G. A. Town. Wn, New Zealand Institute of Public Administration, 1972. (Studies in Public Administration, No. 17.) $2.50.
ROBINSON, H. A History of the Post Office in New Zealand. Wn, Govt. Print., 1964. $2.40.
ROBSON, J. L. ed. New Zealand; the Development of its Laws and Constitution. 2nd rev. ed. London, Stevens, 1967. $10.50.
ROTH, H. O. Trade unions in New Zealand. Wn, Reed, 1973.
SAUNDERS, J. L. The New Zealand School Dental Service. Wn, Govt. Print., 1964.
SCOTT, K. J. The New Zealand Constitution. Oxford, Clarendon Press, 1962. $3.65; $2.50.
SOCIAL PROCESS IN NEW ZEALAND; Readings in Sociology, edited by John Forster. Ak, Longman Paul, 1969. $7.50.
SUTCH, W. B. The responsible society in New Zealand. Ch, Whitcombe and Tombs, 1971. $2.40.
THOMPSON, K. W., and A. D. TRLIN, ed. Immigrants in New Zealand. Palmerston North, Massey University, 1970. $5.
VAUGHAN, G. M., ed. Racial issues in New Zealand. Ak, Akarana Press, 1971. $3.60.
WEBB, S. D., and J. COLLETTE., eds. New Zealand society; contemporary perspectives. Sydney, J. Wiley, 1973. A$6.75.
BERL PUBLICATIONS LTD. Equity Investment, 1971-72; a Ten Year Review of Public Companies Listed on New Zealand Stock Exchanges, Including Share Prices, Earning Rates, Dividend Yields and Asset Backings. Wn, 1971. $4.
BRIGHT, T. N. Banking Law and Practice in New Zealand. 2nd ed. Wn, Sweet and Maxwell, 1969. $13.50.
CAREY, R. H., and F. W. HOLMES. A Preliminary Bibliography of New Zealand Economics and Economic History. Wn, Victoria University of Wellington, 1967. o.p.
CHRISTIE, K. M. Retailing; performance, planning and policy. Wn, N.Z. Institute of Economic Research, 1973. $1.50.
CONDLIFFE, J. B. The Economic Outlook for New Zealand. Wn, Whitcombe and Tombs for the New Zealand Institute of Economic Research, 1969. $3.
COWAN, T. K. Financial Accounting in New Zealand. 2nd ed. Wn, Sweet and Maxwell, 1966. $8.
FIGGE, A. H. Introduction to Economic Policies in New Zealand. 2nd ed. Wn, Butterworth, 1972. $5.
HANLEY, G., ed. Personnel Management in New Zealand. 3rd rev. enl. ed. Wn, Sweet and Maxwell, 1967, $6.50.
HAWKE, G. R. Between governments and banks; a history of the Reserve Bank of New Zealand Wn, Govt. Print., 1973.
HOLMES, F. W. Money, finance, and the economy. Ak, Heinemann, 1972.
JOHNSTON, T. R. The Law and Practice of Company Accounting in New Zealand. 4th ed. Wn, Butterworth, 1972. $14.
LLOYD PRICHARD, M. F. An Economic History of New Zealand to 1939. Ak, Collins, 1970. $8.
—- Economic Practice in New Zealand 1954/55-1967/68. Ak, Collins, 1970. $5.60.
MARRIS, E. C. New Zealand Investment Guide. Rev. ed. Wn, N.Z. Financial Times Co. 1970. $3.
NEW ZEALAND DEPARTMENT OF INDUSTRIES AND COMMERCE. Investment in New Zealand; a Ready Reference for the Overseas Investor. Rev. ed. Wn, 1972. gratis.
NEW ZEALAND Farm PRODUCTION AND MARKETING, edited by M. J. Moriarty. Wn, New Zealand Institute of Public Administration; London, O.U.P., 1963. o.p.
NEW ZEALAND MONETARY AND ECONOMIC COUNCIL. New Zealand and an Enlarged EEC. Wn, Govt. Print., 1970. NEW ZEALAND'S EXTERNAL RELATIONS, edited by T. C. Larkin. Wn, New Zealand Institute of Public Administration; London, O.U.P., 1962. o.p.
PARRY, A. G. Underwriting adventure: a centennial history of the National Insurance Company of New Zealand. Dn, 1973.
RESERVE BANK OF NEW ZEALAND. Overseas Trade and Finance, with Particular Reference to New Zealand. 2nd ed. Wn, 1966. $1.
SUTCH, W. B. Takeover New Zealand. Wn, Reed, 1972. $3.50.
ADAMS, F. B. Criminal Law and Practice in New Zealand. 2nd ed. Wn, Sweet and Maxwell, 1971. $28.
BRIGHT, T. N. Banking Law and Practice in New Zealand, 2nd ed. Wn, Sweet and Maxwell, 1969. $13.50.
BUTTERWORTH'S CASES ANNOTATIONS OF THE NEW ZEALAND STATUTES REPRINT. 1908-57, by H.J. Wily. Wn, Butterworth, 1958-1971. 5v. $60.
CAMPBELL, I. B., and D. P. NEAZOR. Workers' Compensation Law in New Zealand. 2nd ed. Wn, Sweet and Maxwell, 1964. $8.50.
CHESHIRE, G. C., and C. H. S. FIFOOT. Law of Contract. 3rd New Zealand ed., by J. F. Northey. Wn, Butterworth, 1970.
CUNNINGHAM, H. A. Taxation Laws of New Zealand. 7th ed. Wn, Butterworth, 1970. 3 v.
ESSAYS ON CRIMINAL LAW IN NEW ZEALAND, edited by R. S. Clark. Wn, Sweet and Maxwell, 1971. $5.
ESTATE PLANNING. Rev. ed. Wn, New Zealand Society of Accountants, 1971. $6.
GARROW, J. M. E. Garrow's Law of Trusts and Trustees. 4th ed. Wn, Butterworth, 1972. $17.50.
GARROW, J. M. E., and H. R. Gray. Garrow and Grays' Law of Personal Property in New Zealand. 5th ed. Wn, Butterworth, 1968. $9.50.
GARROW, J. M. E., and J. D. WILLIS. Garrow and Willis's Criminal Law. 5th ed. Wn, Butterworth, 1968. $16.
HINDE, G. W. Land Law Study Guide. Wn, Sweet and Maxwell, 1972. $5.50.
INGLIS, B. D. Family Law. 2nd ed. Wn, Sweet and Maxwell, 1968-1970. 2 v. $12 ea.
KELLY, E. M. Summary of the Law Relating to Land Surveying in New Zealand. 4th ed., enl. and rev. by B. H. Davis. Wn, New Zealand Institute of Surveyors, 1971. $8.
A LEGAL BIBLIOGRAPHY OF THE BRITISH COMMONWEALTH OF NATIONS, v. 6: Australia, New Zealand, and Their Dependencies. 2nd ed. London, Sweet and Maxwell, 1958. $2.50.
MATHIESON, D. L. Industrial Law in New Zealand. Wn, Sweet and Maxwell, 1970-. v. 1 1970. $13.
MULHOLLAND, B. D. Introduction to the New Zealand legal system. Wn, Butterworth, 1972. $7.50.
NEW ZEALAND LAWS, STATUTES, ETC. Reprint of the Statutes of New Zealand, 1908-57. Wn, Govt. Print., 1958-1961. 16 v. $7.50 ea.
NEW ZEALAND PUBLIC AND ADMINISTRATIVE LAW REFORM CCOMMITTEES. Reports... to the Minister of Justice. Wn, Govt. Print., 1968-1971. 5 v.
NORTHEY, J. F. Introduction to Company Law in New Zealand. 7th ed. Wn, Butterworth, 1971. $8.50.
NORTHEY, J. F., and W. C. S. LEYS. Commercial Law in New Zealand. 4th ed. Wn, Butterworth, 1969, $11.
O'KEEFF, J. A. B., and W. L. FARRANDS. Introduction to New Zealand law. 2d. ed. Wn, Butterworth, 1973.
PATERSON, D. E. An Introduction to Administrative Law in New Zealand. Wn, Sweet and Maxwell, 1965. $9.
ROBINSON, K. The Law of Town and Country Planning. 2nd rev. and enl. ed. Wn, Butterworth, 1968. $8.
SIM, Sir W. A. Sim's Divorce Law and Practice in New Zealand. 8th ed., by W. J. Sim. Wn, Butterworth, 1971. $17.50,
SMITH, N. W. Maori Land Law. Wn, Reed, 1960. $4.20.
STEPHENS, M. O. Traffic and Transport Law in New Zealand. Wn, Sweet and Maxwell, 1964. o.p.
STOUT, R. and W. A. SIM. The Practice of the Supreme Court and Court of Appeal of New Zealand. 11th ed., by W. J. Sim. Wn, Butterworth, 1972. 2v. $30.
SZAKATS, A. Trade Unions and the Law. Wn, Sweet and Maxwell, 1968. $5.
WARD, D. A. S., and H. R. C. WILD. Mercantile Law in New Zealand. 5th ed. (rev.) Ch, Whitcombe and Tombs, 1968. $4.50.
WILY, H. J. Wily's Magistrates' Courts Practice. 6th ed. Wn, Butterworth, 1968. $15.
BATES, R. J., ed. Prospects in New Zealand Education. Ak, Hodder and Stoughton, 1970. $2.40.
COMPULSORY EDUCATION IN NEW ZEALAND; a Study Initiated by the National Commission for UNESCO. Rev. ed., prepared by J. L. Ewing. Paris, UNESCO, 1969. $1.90.
EWING, J. L. Development of the New Zealand Primary School Curriculum 1877-1970. Wn, New Zealand Council for Educational Research, 1970. $5.25.
EWING, J. L., and J. SHALLCRASS, comps. An Introduction to Maori Education; Selected Readings. Wn, New Zealand University Press; Price Milburn, 1970.
HALL, D. O. W. New Zealand Adult Education. London, Joseph, 1970. $2.50.
HAVILL, S. J., and D. R. MITCHELL, eds. Issues in New Zealand Special Education. Ak, Hodder and Stoughton in Association with University of London Press, 1972. $4.80.
MCDONALD, G. Maori mothers and pre-school education. Wn, New Zealand Council for Educational Research, 1973. $4.
MITCHELL, F. W., ed. Looking Ahead in New Zealand Education. Wn, Reed for New Zealand College of Education, 1971. $2.95.
NEW ZEALAND COMMISSION ON EDUCATION IN NEW ZEALAND. Report, Wn, Govt. Print., 1962. o.p.
NEW ZEALAND. COMMITTEE of INQUIRY INTO PRE-SCHOOL EDUCATION. Report. Wn, Department of Education, 1971. 95c.
NEW ZEALAND POST-PRIMARY TEACHERS' ASSOCIATION. CURRICULUM REVIEW GROUP. Education in Change; Report... Ak, Longman Paul, 1969. $2.
ROTH, H. O. A Bibliography of New Zealand Education. Wn, New Zealand Council for Educational Research, 1964. $2.25.
SEMINAR ON ASPECTS OF TERTIARY EDUCATION, Wellington, 1968. Trends and Issues in Higher Education. Wn, New Zealand Council for Educational Research and the Association of University Teachers of New Zealand, 1970. o.p.
WATSON, J. E. Intermediate Schooling in New Zealand. Wn, New Zealand Council for Educational Research, 1964. $3.75.
BARROW, T. T. Decorative Art of the New Zealand Maori. 3rd ed. Wn. Reed, 1972. $3.95.
—- Maori Wood Sculpture of New Zealand. Wn, Reed, 1969. $9.50.
BEST, E. The Maori as He Was. Wn, Govt. Print., 1974. $6.50.
BIGGS, B. G. Let's Learn Maori; a Guide to the Study of the Maori Language. Wn, Reed, 1973. $3.50.
—- Maori Marriage; an Essay in Reconstruction. Wn, Reed for the Polynesian Society, 1970. $2.95.
BIGGS, B. G., P. W. HOHEPA, and S. M. MEADS, eds. Selected Readings in Maori. Rev. ed. Wn, Reed, 1967. $1.65.
BIGWOOD, K. V., and H. DANSEY. New Zealand Maori in Colour. Wn, Reed, 1967. $4.50.
BUCK, Sir P. The Coming of the Maori. 2nd ed. Wn, Whitcombe and Tombs, 1950. $4.75.
—- Vikings of the Sunrise. Ch, Whitcombe and Tombs, 1954. $3.85.
FIRTH, R. W. Economics of the New Zealand Maori. 2nd ed. Wn, Govt. Print., 1972. $7.
GOLSON, J., ed. Polynesian Navigation; A Symposium on Andrew Sharp's Theory of Accidental Voyages. 2nd ed. Wn, Reed for the Polynesian Society, 1972. $3.95.
GREY, Sir G. Polynesian Mythology and Ancient Traditional History of the Maori. Ch, Whitcombe and Tombs, 1956. $2.50.
HARRE, J. N. Maori and Pakeha; a Study of Mixed Marriages in New Zealand. Wn, Reed, 1966. o.p.
MACDONALD, CHRISTINA. Medicines of the Maori. Ak, Collins, 1973. $3.95.
MEAD, S. M. Traditional Maori Clothing; a Study of Technological and Functional Change. Wn, Reed, 1969. $6.95.
METGE, J. The Maoris of New Zealand. London, Routledge, 1967. $2.
MITCHELL, J. H. Takitimu. Wn, Reed, 1972. $4.50.
OPPENHEIM, R. S. Maori death customs. Wn, Reed, 1973. $4.95.
ORBELL, M. R. Maori Folk Tales in Maori and English. Ak, B. and J. Paul, 1968. $2.50.
PHILLIPPS, W. J. Carved Maori Houses of Western and Northern Areas of New Zealand. Wn, Govt. Print., 1955. $5 (Dominion Museum. Monograph No. 9.)
Also others in the same series.
RYAN, P. M. A Dictionary of Modern Maori. Ak. Heinemann Educational, 1971. $1.20.
SCHWIMMER, E. G., ed. The Maori People in the Nineteen Sixties; a Symposium. Ak, B. and J. Paul, 1968. $7.50.
—- The World of the Maori. Wn, Reed, 1974. $2.95.
SHARP, C. A. Ancient Voyagers in Polynesia. Ak, Longman Paul, 1969. $2.50.
TROTTER, M. M., and B. MC CULLOCH. Prehistoric Rock Art of New Zealand. Wn, Reed, 1971. $2.95.
VAYDA, A. P. Maori Warfare. Wn, Reed for the Polynesian Society, 1970. $2.95.
WESTRA, A., and J. RITCHIE. Maori. Wn, Reed, 1967. $6.30.
WILLIAMS, J. A. Politics of the New Zealand Maori; Protest and Co-operation, 1891-1909. Ak, O.U.P. for the University of Auckland, 1969. $8.55.
WILLIAMS, W. A Dictionary of the Maori Language. 7th ed., by H. W. Williams. Rev. and augmented by the Advisory Committee on the Teaching of the Maori Language, Department of Education. Wn, Govt. Print., 1971. $4,50.
WILLIAMS, W. L. First Lessons in Maori. 13th ed. Wn, Whitcombe and Tombs, 1966. $1.35.
DIRECTORY OF NEW ZEALAND SCIENCE. 4th ed., edited by H. Jansen. Wn, New Zealand Association of Scientists, 1962. o. p.
LOCKLEY, R. M. Man Against Nature; a Survival Special on New Zealand Wildlife. Wn, Reed, 1970.
MILLER, M. C. Reef and beach life of New Zealand; an introduction. Ak, Collins, 1973. $9.80.
MORTON, J. E., D. THOM, and R. LOCKER. Seacoast in the Seventies. Ak, Hodder and Stoughton, 1973.
ADKIN, G. L., and B. W. COLLINS. A Bibliography of New Zealand Geology to 1950. Wn, D.S.I.R., 1967. o. p.
BECK, R. J. New Zealand Jade; the Story of Greenstone. Wn, Reed, 1970. $2.95.
COTTON, Sir C A. Geomorphology. 7th ed. Ch, Whitcombe and Tombs, 1958. $3.25.
EIBY, G. A. About Earthquakes. New York. Harper, 1957. US$4.95.
—- Earthquakes. 2nd rev. ed. London, Muller, 1967. $3.
*GARNER, D. M., and N. M. RIDGWAY. Hydrology of New Zealand Offshore Waters. Wn, Govt. Print., 1965. o. p.
GRINDLEY, G. W., H. J. HARRINGTON, and B. L. WOOD. The Geological Map of New Zealand, 1:2,000,000. Wn, D.S.I.R., 1959. $3.25.
NEW ZEALAND WATER AND SOIL DIVISION. Land Use Capability Survey Handbook; a New Zealand Handbook for the Classification of Land. Rev. ed. Wn, Soil Conservation and Rivers Control Council, 1971.
SALMON, J. H. M. A History of Goldmining in New Zealand. Wn, Govt. Print., 1963. $2.70.
SOIL BUREAU. Soils of New Zealand. Wn, D.S.I.R., 1968. 3 v. (Its Bulletin 26.) $15.
STEVENS, G. R. Rugged landscape; the geology of central New Zealand. Wn, Reed, 1974. $12.50.
THOMPSON, B. N. New Zealand Volcanology. Wn, D.S.LR., 1965. 3 v. (D.S.I.R. Information Series No. 50.) o. p.
BULLER, Sir W. L. Birds of New Zealand. New ed., by E. G. Turbott. Ch, Whitcombe and Tombs, 1967. $16.50.
DAFF, L. A. An album of New Zealand birds. Wn, Reed, 1974. $4.95.
DOAK, W. T. Fishes of the New Zealand region. Ak, Hodder and Stroughton, 1972.
FALLA, R. A., R. B. SIBSON, and E. G. TURBOTT. A Field Guide to the Birds of New Zealand and Outlying Islands. 2nd ed. London; Ak, Collins, 1970. $5.
GASKIN, D. E. The Butterflies and Common Moths of New Zealand. Ch, Whitcombe and Tombs, 1966. o. p.
FORSTER, R. R., and L. M. FORSTER. Small Land Animals of New Zealand. Dn, McIndoe, 1970. $5.85.
FORSTER, R. R. New Zealand spiders. Ak, Collins, 1973. $10.60.
HOWARD, W. E. Control of Introduced Mammals in New Zealand. Wn, D.S.I.R, 1965. $1.25.
LAIDLAW, W. B. R. Butterflies of New Zealand. Ak, Collins, 1970. $2.70.
MILLER, D. Common Insects in New Zealand. Wn, Reed, 1971. $6.50.
LESLIE, M. A. Animals of the Rocky Shore of New Zealand. Wn, Reed, 1968. $2.50.
MARSHALL, J., F. C. KINSKY, and C. J. R. ROBERTSON. The Fiat book of common birds in New Zealand. 2 v. Wn, Reed, 1972-73. $3.60.
OLIVER, W. R. B. New Zealand birds. Reprint ed. Wn, Reed, 1974. $18.50.
PENDERGRAST, J. G., and D. R. COWLEY. An Introduction to New Zealand Freshwater Insects Ak, London, Collins, 1966. $1.80.
POWELL, A. W. B. Shells of New Zealand; an Illustrated Handbook. 4th ed. Ch, Whitcombe an Tombs, 1964. $2.25.
SHARELL, R. New Zealand Insects and Their Story. Ak. Collins, 1971. $9.20.
—- The Tuatara, Lizards, and Frogs of New Zealand. London, Collins 1966. $3.50.
WILD ANIMALS IN NEW ZEALAND, compiled under the direction of A. L. Poole. Wn, Reed, 1970. $4.50.
ALLAN, H. H. A Handbook of the Naturalised Flora of New Zealand. Wn, Govt. Print., 1950. o.p.
ALLISON, K. W., and J. Child. The Mosses of New Zealand. Dn, University of Otago Press, 1971. $6.60.
COCKAYNE, L. New Zealand Plants and Their Story, 4th ed., by E. J. Godley. Wn, Govt. Print., 1967. $3.
COCKAYNE, L. and E. P. TURNER. The Trees of New Zealand. 6th ed. Wn. Govt. Print., 1967. o. p.
FLORA OF NEW ZEALAND. Wn, Govt. Print., 1961—. 3 v. v.l by H. H. Allan, 1961. $10.50; v. 2 by L. B. Moore and E. Edgar, 1970. $4.50.
LAING, R. M., and E. W. BLACKWELL. Plants of New Zealand. 7th ed. Ch, Whitcombe and Tombs, 1964. $3.85.
MARK, A. F., and N. M. ADAMS. New Zealand Alpine Plants. Wn, Reed, 1973. Hbk. $19.50; Pbk. $13.50.
MARTIN, W., and J. CHILD. Lichens of New Zealand. Wn, Reed, 1972. $6.50.
MOORE, L. B., and N. M. ADAMS. Plants of the New Zealand Coast. Ak, Longman Paul, 1969. $1.80.
PHILIPSON, W. R., and D. HEARN. Rock Garden Plants of the Southern Alps. Ch, Caxton Press, 1962. o. p.
POOLE, A. L., and N. M. ADAMS. Trees and Shrubs of New Zealand. Wn, Govt. Print., 1963. $2.50.
SALMON, J. T. Field Guide to the Alpine Plants of New Zealand. Wn, Reed, 1968. o. p.
TAYLOR, G. M. Mushrooms and Toadstools in New Zealand. Wn, Reed, 1970. $2.50.
AGRICULTURAL PRODUCTION COUNCIL. Economic Position of the Farming Industry in New Zealand. Wn, 1971. 50c.
ALLSOP, F. The first fifty years of New Zealand's Forest Service. Wn, Govt. Print., 1973.
ATKINSON, J. D. Diseases of Tree Fruits in New Zealand. Wn, Govt. Print., 1971. $7.50.
DU FAUR, R. T. Dairy Farming for Profit. Wn, Reed, 1967.. $4.50.
—- Sheep Farming for Profit. 2nd ed. Wn, Reed, 1967. o. p.
DURING, C. Fertilisers and Soils in New Zealand Farming. 2d. ed. Wn, Govt. Print., 1972. $6.
EVANS, B. L. A History of Agriculture Production and Marketing in New Zealand. Palmerston North, Keeling and Mundy, 1969. o. p.
FARRELL, B. H. Power in New Zealand; a Geography of Energy Resources. Wn, Reed, 1962. $4.25.
FISHER, M. E., E. SATCHELL, and J. M. WATKINS. Gardening with New Zealand Plants, Shrubs, and Trees. Ak, Collins, 1970. $6.
THE FUTURE OF MANUFACTURING IN NEW ZEALAND, edited by C. A. Blyth. Wn, New Zealand Institute of Public Administration; London, O.U.P., 1964. $1.70.
HADFIELD, J. W. Arable Farm Crops of New Zealand, rev. by J. H. Claridge. Wn, D.S.I.R., 1972. $9.50.
HARRISON, R. E. Handbook of Bulbs and Perennials for the Southern Hemisphere. 2nd ed. rev. Palmerston North, R. E. Harrison, 1963. $5.50.
—- Handbook of Trees and Shrubs for the Southern Hemisphere. 4th ed. rev. Wn, Reed, 1967. $5.95.
HEALY, A. J. F. Identification of Weeds and Clover. Wn, Editorial Services, 1970. o. p.
LANGER, R. H. M. Pastures and pasture plants. Wn, Reed, 1973.
LEVY, E. B. Grasslands of New Zealand. 3rd ed. Wn, Govt. Print., 1970. $5.50.
LEITCH, D. B. Railways of New Zealand. Ak, L. Fullerton; Newton Abbot. Devon, David and Charles, 1972. $9.10.
MC CASKILL, L. W. Hold this land; a history of soil conservation. Wn, Reed, 1973. $8.50.
METCALF, L. J. The cultivation of New Zealand trees and shrubs. Wn, Reed, 1972. $12.50.
NEW ZEALAND FARMERS' VETERINARY GUIDE. 4th ed. Wn, New Zealand Dairy Exporter, 1972. $6.
NEW ZEALAND INSTITUTE OF AGRICULTURAL SCIENCE. New Zealand Beef Production, Processing, and Marketing, edited by A. G. Campbell. Wn, 1970. o. p.
NEW ZEALAND INSTITUTE FOR Turf Culture. Turf Culture. 2nd ed. Palmerston North, 1971. $9.
NEW ZEALAND. ROYAL COMMISSION TO INQUIRE INTO AND REPORT UPON HANDLING OF CONTAINERS, SEAFREIGHTERS, AND Unitised CARGO. Containers; Final Report of the Royal Commission. Wn, Govt. Print., 1972. o. p.
PHYSICAL ENVIRONMENT CONFERENCE, VICTORIA UNIVERSITY OF WELLINGTON, 1970. Reports, Papers, and Proceedings. Ed. by C. K. McMahon. Wn, Environmental Council, 1972. $5.
POOLE, A. L. Forestry in New Zealand; the Shaping of Policy. Ak, Hodder and Stoughton in association with the English Universities Press, London, 1969. $3.
REES, S. W. Pig Farming for Profit. Rev. ed. Wn, Reed, 1972. $5.50.
SIMPSON, T. E. Kauri and radiata: origin and expansion of the timber industry of New Zealand. Ak, Hodder and Stroughton, 1973.
THORPY, F. Wine in New Zealand. Ak, Collins, 1971.
WATKINSON, J. G. and SMITH, R. New Zealand fisheries. Wn, Ministry of Agriculture and Fisheries, 1972.
*AUCKLAND CITY ART GALLERY. Ten Years of New Zealand Painting in Auckland. 1958-1967. Ak, 1967.
Also similar catalogues on New Zealand artists.
BRUSEY, P. Ring down the curtain. Wn, Monigatti, 1973. $5.70.
BROWN, G. H., and H. H. KEITH. An Introduction to New Zealand Painting, 1839-1967. Ak, Collins, 1969. $7.50.
*COLQUHOUN, N., comp. New Zealand Folksongs; Song of a Young Country. 2nd ed. Wn, Reed, 1972. $2.25.
DOCKING, G. C. Two Hundred Years of New Zealand Painting. Wn, Reed, 1971. $22.50.
JENSEN, O. The N.Z.B.C. Symphony Orchestra. Wn, Reed, 1966. o. p.
KNIGHT, H. Photography in New Zealand; a Social and Technical History. Dn, McIndoe, 1971. $7.20.
NORTHCOTE-BADE, S. Colonial Furniture in New Zealand. Wn, Reed, 1971. $5.95.
STACPOOLE, J. M. and P. BEAVER. Architecture, 1820-1970. Wn, Reed, 1972. $4.95
BULL, M. A. Vintage Motor Cycling; a Record of Motor Cycling in New Zealand from 1899 to 1931. Masterton. Hedley's Bookshop, 1970. $4.
CUTHBERTSON, K. E. Pighunting in New Zealand. Wn, Reed, 1974. $4.95.
DOOGUE, R. B., and J. M. MORELAND. New Zealand Sea Anglers' Guide. 5th ed. Wn, Reed, 1969. $2.75.
FORRESTER, R. and ILLINGWORTH, N. Hunting in New Zealand. 2d. ed. Wn, Reed, 1973. $4.50.
HARRIS, O. A Land Apart; the Mount Cook Alpine Region. Wn, Reed, 1971. $8.50.
HEINE, A. J. Mountaincraft Manual. Wn, National Mountain Safety Council of New Zealand, 1971. 80c.
HERBERT, F. T. Harking Back; a History of Hunting in New Zealand 1870-1969. Hastings, the author, 1970. $4.
HINTZ, O. S. Trout at Taupo. New enl. ed. London. Reinhardt, 1970. $3.60.
KELLY, G. M. Golf in New Zealand; A Centennial History. Wn, New Zealand Golf Association, 1971. $4.50.
LAIDLAW, C. R. Mud in your eye; a worm's eye view of the changing world of rugby. Wn, Reed, 1973. $4.95.
MAC LEAN, P. J. The Veteran Years of New Zealand Motoring. Wn, Reed, 1971. $4.95.
MAHONEY, D. J. C. Trio at the Top; the Story of Bruce McLaren, Denny Hulme, and Chris Amon. Ch, Whitcombe and Tombs, 1970. $3.90.
SLATTER, G. C. Great days at Lancaster Park. Ch, Whitcombe and Tombs, 1974.
SWAN, A. C. They played for New Zealand: a complete record of New Zealand rugby representatives 1884-1972 and their matches. Wn. N.Z. Rugby Football Union, 1973. $1.
CURNOW, W. T. L. Essays on New Zealand literature. Ak, Heinemann, 1973. $5.50.
MC CORMICK, E. H. New Zealand Literature; a Survey. London, O.U.P., 1959. o.p.
ORBELL, M. R., comp. Contemporary Maori Writing. Wn, Reed, 1970. $2.95.
REID, J. C., ed. A Book of New Zealand. Ak, Collins, 1964. $1.70.
CURNOW, T. A. M. The Penguin Book of New Zealand Verse. Harmondsworth, Eng., Penguin Books, 1966. $1.25.
JONES, G. M. These islands; a collection of New Zealand verse. Ak, Longman Paul, 1973. $2.95.
MC QUEEN, H. J. Ten modern New Zealand poets. Ak, Longman Paul, 1973. Hbk $4.50; Pbk $2.95.
MITCALFE, B. Maori poetry, the singing word. Wn, Price Milburn, 1974. $6.30.
NGATA, A. T., ed. Nga Moteatea. Wn, Polynesian Society, 1959-72. 3v. Collection of Maori Songs.
O'SULLIVAN, V., comp. An Anthology of Twentieth-century New Zealand Poetry. London, O.U.P., 1970. $6.99; $7.50.
POETRY NEW ZEALAND. V. 2. Ch, Pegasus Press, 1974. $4.
SMITHYMAN, W. K. A Way of Saying; a Study of New Zealand Poetry. Ak, Collins, 1965. o.p.
ALLEY, R. Winds of Change; Poems. Ch, Caxton Press, 1972.
BAXTER, J. K. The labyrinth; poems 1944-72. Wn, O.U.P., 1974. Hbk $4.35; Pbk $2.95.
JAMES K. BAXTER; A memorial volume. Wn, A Taylor, 1972. $2.95.
WEIR, J. E. The Poetry of James K. Baxter. Wn, Oxford U.P., 1970. $1.25.
BRASCH, C. O. Not Far Off; Poems. Ch, Caxton Press, 1969. o.p.
CAMPBELL, A. Kapiti; Selected Poems, 1947-71. Ch, Pegasus Press, 1972. $3.50.
CURNOW, T. A. M. Collected poems, 1933-73. Wn, Reed, 1974. $5.95.
DALLAS, R. Shadow Show; Poems. Ch, Caxton Press, 1968. o. p.
FAIRBURN, A. R. D. Collected Poems. Ch, Pegasus Press, 1966. $2.50; paperback $1.75.
JOHNSON, O. A., A. R. D. Fairburn, 1904-57; A Bibliography of His Published Work. Ak, University of Auckland, 1958. 50c.
JOSEPH, M. K. Inscription on a paper dart; selected poems, 1945-72. Ak, Auckland University Press, 1974. $2.85.
GLOVER, D. Enter Without Knocking. Enl. ed. Ch, Pegasus Press, 1972. $4.
MASON, R. A. K. Collected Poems. With an Introduction by Allen Curnow. New ed. Ch, Pegasus Press. 1972. $3.50.
*O'Sullivan, V. G. Bearings. Wn, O.U.P., 1973. $4.
*PATERSON, A. I. H. Birds flying. Ch, Pegasus, 1973. Hbk $3.75; Pbk $1.95.
SMITHYMAN, K. Earthquake Weather. Ak, Auckland U.P.; Wn, O.U.P., 1972. $2.25.
*STEAD, C. K. Crossing the Bar. Ak, Auckland U.P.; Wn, O.U.P., 1972. $2.25.
HOLCROFT, M. H. Islands of Innocence; the Childhood Theme in New Zealand Fiction. Wn, Reed, 1964. o. p.
NATIONAL LIBRARY OF NEW ZEALAND. SCHOOL LIBRARY SERVICE. Fiction for Post-primary Schools; an Annotated List. 2nd ed., rev. and enl. Wn, 1960.
RHODES, H. W. New Zealand Fiction Since 1945. Dn, McIndoe, 1968. $1.20.
STEVENS, J. The New Zealand Novel, 1860-1965. 2nd ed. Wn, Reed, 1966. $1.50.
STEAD, C. K. New Zealand Short Stories. 2nd series. London, O.U.P., 1966. $1.55.
ACHESON, F. O. V. Plume of the Arawas. Wn, Reed, 1974. $2.95.
AMATO, R. The Full Circle of the Travelling Cuckoo. With a memoir of the author by M. Shadbolt. Ch, Whitcombe and Tombs, 1967. 45c.
ASHTON-WARNER, S. Bell Call. London, Hale; Ch, Whitcombe and Tombs, 1971.
—- Three; a Novel. London, Hale; Ch, Whitcombe and Tombs, 1971. $3.60.
BALLANTYNE, D. A Friend of the Family. Ch, Whitcombe and Tombs, 1966. 50c.
BILLING, G. J. The Alpha Trip. Ch, Whitcombe and Tombs, 1969. 50c.
BRATHWAITE, E. The Evil Day. London, Collins, 1967. o. p.
COURAGE, J. Such separate creatures. Ch, Caxton, 1973. $4.
DAVIN, D, Brides of Price. London, Hale, 1972. $4.
DUCKWORTH, M. Over the Fence is Out. London, Hutchinson, 1969. $2.80.
DUGGAN, M. N. O'Leary's Orchard and Other Stories. Ch, Caxton Press, 1970. $3.50.
—- Summer in the Gravel Pit; Stories. Hamilton, B. and J. Paul; London, Gollancz, 1965. o. p.
FRAME, J. The Adaptable Man. Ch, Pegasus Press, 1965. $2.10.
—- Daughter Buffalo. Wn, Reed, 1973.
—- Intensive Care; a Novel. Wn, Reed, 1971. $4.95.
—- The Rainbirds. Ch, Pegasus Press, 1969. $2.75.
—- A State of Siege. Ch, Pegasus Press, 1967. $2.25.
EVANS, P. D. An Inward Sun; the Novels of Janet Frame. Wn, New Zealand University Press Price Milburn, 1971. $1.50.
GEE, M. In my Father's Den. London, Faber, 1972. $3.50.
GLENDAY, A. Follow, follow. Ak, Collins, 1973.
GROVER, R. F. Another Man's Role. Ak, B. and J. Paul, 1967. o. p.
HILLIARD, N. H. Maori Girl. London, Heinemann, 1971. $3; paperback, $1.80.
—- Maori Women. London, Hale, 1974. $5.45.
HYDE, R. The Godwits Fly. 2nd ed. Ak, Auckland U.P.; Wn, O.U.P., 1970. $3.
IHIMAERA, W. Pounamu, Pounamu. Ak, Heinemann, 1972. $3.80.
—- Tangi. Ak, Heinemann, 1973. $4.95.
—- Whanau. Ak, Heinemann, 1974. $5.25.
JOSEPH, M. K. The Hole in the Zero. B. and J. Paul, 1967. o. p.
LEE, J. A. Children of the Poor. London, Mayfair Books, 1963. o. p.
MC NEISH, J. H. P. Mackenzie; a Novel. Ak, Hodder and Stoughton, 1970. o. p.
MANDER, J. Allen Adair. Ak, Auckland U.P.; Wn, O.U.P., 1971. $4.10.
MANSFIELD, K. Selected Stories, Chosen and Introduced by D. M. Davin. London, O.U.P., 1969. $1.40.
—- Complete stories. Ak, Golden Press, 1974. $3.95.
MULGAN, J. A. E. Man Alone. 2nd ed. Ak, Longman Paul, 1969. $1.95.
SARGESON, F. Stories. Ak, Longman Paul, 1973. Hbk $6.50; Pbk $2.95.
—- Joy of the Worm. London, MacGibbon and Kee, 1969. o. p.
—- Man of England Now. Ch, Caxton Press, 1972. (New Zealand Short Stories, No. 2.) $4.50.
—- Once is enough; a memoir. Wn, Reed, 1973. $4.50.
SATCHELL, W. The Land of the Lost. Ak, Auckland U.P.; Wn, O.U.P., 1971. $4.20.
SHADBOLT, M. F. R. An Ear of the Dragon. London, Cassell, 1971. $5.20.
—- Strangers and journeys. London, Hodder and Stroughton, 1972. $8.40.
STEAD, C. K. Smith's Dream. Ak, Longman Paul, 1971. $3.50.
TAYLOR, W. Episode. London, Hale; Ch, Whitcombe and Tombs, 1970. $3.05.
WENDT, A. Sons for the return home. Ak, Longman Paul, 1973.
BAXTER, J. K. The Sore-footed Man [and] The Temptations of Oedipus. Ak, Heinemann Educational Books, 1971. $1.50.
CURNOW, A. Four Plays. Wn, Reed, 1972. $5.50. Pbk $3.95.
MASON, B. E. G. Awatea; a Play in Three Acts. Wn, New Zealand University Press; Price Milburn, 1969. $1.50.
MC NAUGHTON, H. D. Contemporary New Zealand plays. Wn, O.U.P., 1974. $2.95.
BIGWOOD, K. V. New Zealand in Colour. Rev. ed. Wn, Reed, 1972. 2 v. $9.
BRAKE, V. J. and M. SHADBOLT. New Zealand gift of the sea. Ch, Whitcombe and Tombs, 1973. $9.95.
BRATHWAITE, E. F. The Companion Guide to the North Island of New Zealand. Ak, Collins, 1970. $5.50.
—- The companion guide to the South Island of New Zealand. Ak, Collins, 1972. $6.50.
IMBER, W. and K. B. CUMBERLAND. Pacific land down under. Wn, Reed, 1973.
MC LINTOCK, A. H., ed. A Descriptive Atlas of New Zealand. Wn, Govt. Print., 1959. o.p.
PASCOE, J. D., ed. National Parks of New Zealand 3rd ed. Wn, Govt. Print., 1974. $9.
THE PATTERN OF NEW ZEALAND CULTURE, edited by A. L. McLeod. Melbourne, O.U.P.; Ithaca, N.Y., Cornell University Press, 1968. A$9; US$10.
POPE, D. M. and POPE, J. D. Mobil New Zealand travel guide, North Island. Wn, Reed, 1973. $3.50.
—- South Island. Wn, Reed, 1974. $4.95.
REED, A. W. A Dictionary of Maori Place Names. Wn, Reed, 1961. $1.50.
SHADBOLT, M. F. R. The Shell Guide to New Zealand, rev. ed. Ch, Whitcombe and Tombs, 1973. $4.75
WISE'S NEW ZEALAND GUIDE; a Gazetteer of New Zealand. 5th ed. Ak, Wises Publications, 1972.
ADAMS, C. W. A Spring in the Canterbury Settlement. Ch, Capper Press, 1971. Also other facsimile titles by the same publisher.
BARKER, M. A. Station life in New Zealand. Ak, Golden Press, 1973, $2.95.
BEST, A. D. W. The Journal of Ensign Best, 1837-1843. Edited by Nancy M. Taylor. Wn, Govt. Print., 1966. $3.50.
BUTLER, S. A First Year in Canterbury Settlement. Edited by A. C. Brassington and P. B. Maling. Hamilton, B. and J. Paul, 1964. $1.85.
EARLE, A. Augustus Earle in New Zealand, by A. Murray-Oliver. Ch, Whitcombe and Tombs, 1968. $7.50.
—- Narrative of a Residence in New Zealand. Edited by E. H. McCormick. Oxford, Clarendon Press, 1966. $7.55.
GUTHRIE-SMITH, W. H. Tutira; the Story of a New Zealand Sheep Station. 4th ed. Wn, Reed, 1969. $8.50.
HEAPHY, C. Narrative of a Residence in Various Parts of New Zealand. London, Smith, Elder, 1842. Dn, Hocken Library, 1968. $4.25 Facsimile ed.
MANING, F. E. Old New Zealand; a Tale of the Good Old Times. Ak, Golden Press, 1973. $2.95.
MARKHAM, E. New Zealand, or Recollections of It. Edited with an introduction by E. H. McCormick. Wn, Govt. Print., 1963. $3.
SHARP, C. A., comp. Duperrey's Visit to New Zealand in 1824. Wn, Alexander Turnbull Library, 1971. $4.75.
TAYLOR, N. M. Early Travellers in New Zealand. Oxford, Clarendon Press, 1959. $9.60.
TAYLOR, R. Te ika a Maui. Wn, Reed, 1974. $12.95.
TROLLOPE, A. With Anthony Trollope in New Zealand. Edited by A. H. Reed. Wn, Reed for Dunedin Public Library, 1969. $2.50.
WAKEFIELD, E. J. Adventure in New Zealand from 1839 to 1844. Ak, Wilson and Horton, 1971. $2.50. Also similar titles in paperback by the same publisher.
YATE, W. An Account of New Zealand and of the Church Missionary Society's Mission in the Northern Island. Wn, Reed, 1971. $10.95.
The following are representative of the many titles in this category:
LISTER, R. G., ed. Central Otago. Dn, New Zealand Geographical Society, 1965. $3.50.
NEW ZEALAND TOWN AND COUNTRY PLANNING DIVISION. Wanganui Region. Wn, Govt. Print., 1971. (National Resources Survey, Pt. 7) $7.50.
Also similar titles on other regions.
QUARTERMAIN, L. B. New Zealand and the Antarctic. Wn, Govt. Print., 1971. $5.85.
SIERS, J. and A. BRISTOW. Wellington. Wn, Millwood Press, 1974. $6.50.
TEMPLE, P. Mantle of the Skies; the Southern Alps of New Zealand. Ch; Whitcombe and Tombs, 1971. $9.95.
BASSETT, M. Confrontation 1951; The 1951 Waterfront Dispute. Wn, Reed, 1972. $4.50.
BEAGLEHOLE, J. C. The Discovery of New Zealand. 2nd ed. London, O.U.P., 1961. o.p.
BEGG, A. C., and N. C. BEGG. James Cook and New Zealand. Wn, Govt. Print., 1969. 54.50.
CHAPMAN, R. M., and K. SINCLAIR, ed. Studies of a Small Democracy: Essays in Honour of Willis Airey. Ak, Lougman Paul, 1965. $3.
CONDLIFFE, J. B. New Zealand in the Making. 2nd ed. London, Allen and Unwin, 1959. o. p.
COOK, J. The Journals of Captain James Cook on His Voyages of Discovery. Edited by J. C Beagle-hole. Cambridge, Hakluyt Society, 1955-.5 v. to date. (Hakluyt Society. Extra series No. 34.)
COWAN, J. The New Zealand Wars. Wn, Govt. Print., 1955-1956. 2 v. $9.
HALL. D. The Golden Echo; Some Aspects of New Zealand Social History. Ak, Collins, 1971. $3.80.
HEINZ, W. F. Bright fine gold stories of the New Zealand goldfields. Wn, Reed, 1974. $8.95.
INGRAM, C. W. N. New Zealand shipwrecks, 1795-1970. 4th ed. Wn, Reed, 1972. $9.50.
JACKSON, W. K. The New Zealand Legislative Council; a Study of the Establishment, Failure and Abolition of an Upper House. Dn, University of Otago Press, 1972. $7.40.
LISSINGTON, M.P. New Zealand and Japan, 1900-1941. Wn, Govt. Print., 1972, $5.75.
—- New Zealand and the United States, 1840-1944. Wn, Govt. Print, 1972. $3.
MC LINTOCK, A. H. Crown Colony Government in New Zealand. Wn, Govt, Print., 1958. $3.50.
MORRELL, W. P. The Anglican church in New Zealand; a history. Dn, McIndoe, 1973.
—- The Provincial System in New Zealand, 1852-76. 2nd rev. ed. Ch, Whitcombe and Tombs, 1964. $4.50.
MULGAN, J. A. E. Report on Experience. 2nd ed. Ak, B. and J. Paul, 1967. o. p.
NEW ZEALAND CENTENNIAL BRANCH. Making New Zealand; Pictorial Surveys of a Century. Wn, 1939-40. 2 v. o.p.
NEW ZEALAND HISTORIC PLACES TRUST. Leaflets on various historic sites; Booklets. See under individual authors, e.g., Standish, M. W., Wilson, G.H.O., in following section. gratis.
NEW ZEALAND WAR HISTORY BRANCH. Documents Relating to New Zealand's Participation in the Second World War, 1939-45. Wn, 1949-63. 3 v. 1 o.p.; 2, $1.25; 3, $2.50.
OLIVER, W. H. The Story of New Zealand. 2nd ed. London, Faber, 1963. $3.50; paperback $1.35.
PASCOE, J. D. Exploration New Zealand. Wn, Reed. 1971. $3.95.
REED, A. W. It happened today in New Zealand. Wn, Reed, 1973. $1.95.
ROSS, J. O. This Stern Coast; the Story of the Charting of the New Zealand Coast. Wn, Reed, 1969. o.p.
SHARP, C. A. The Voyages of Abel Janszoon Tasman. London, O.U.P., 1968. $8.
SIMPSON, A. J. The sugarbag years. Wn, A. Taylor, 1974. Hbk $8.95; Pbk $5.95.
SINCLAIR, K. A History of New Zealand. Rev. ed. Harmondsworth, Penguin Books, 1969. $1.35.
—- The Origins of the Maori Wars. 2nd ed. Wn, New Zealand University Press, 1961. $3.
SUTCH, W. B. Poverty and Progress in New Zealand; a Reassessment. 2nd rev. ed. Wn, Reed, 1969. $4.95.
—- The Quest for Security in New Zealand, 1840 to 1966. Wn, O.U.P., 1966. $6.50;. paperback $3.
WARDS, I .M. The Shadow of the Land; a Study of British Policy and Racial Conflict, 1832-1852. Wn, Historical Publications Branch, 1968. $6.
WOOD, F. L. W. The New Zealand People at War; Political and External Affairs. Wn, Historical Publications Branch in conjunction with Reed, 1971. $5.95.
The following are representative of the many titles in this category:
ADKIN, G. L. The Great Harbour of Tara; Traditional Maori Place Names and Sites of Wellington Harbour and Environs. Ch, Whitcombe and Tombs, 1959. 75c.
A HISTORY OF CANTERBURY. Ch, Canterbury Centennial Historical and Literary Committee; Whitcombe and Tombs, 1957-71. 3 v.
ALLAN, R. M. Nelson; a History of Early Settlement. Wn, Reed, 1965. o. p.
BEGG, A. C. and N. C. BEGG. Port Preservation. Ch, Whitcombe and Tombs, 1973 $12.50.
BUCHANAN, J. D. H. The Maori history and place names of Hawke's Bay. Wn, Reed, 1973.
GILLESPIE, O. A. South Canterbury; a Record of Settlements. 2nd ed. Timaru, South Canterbury Centennial History Committee, 1971.
MC DONALD, K. C. City of Dunedin; a Century of Civic Enterprise. Dn, Dunedin City Corporation, 1965.
MAY, P. R. The West Coast Gold Rushes. 2nd rev. ed. Ch, Pegasus Press, 1967. $5.
NEWPORT, J. N. W. Collingwood; a History of the Area from Earliest Days to 1912. Ch, Printed at the Caxton Press, 1971. $5.40.
OLIVER, W. H. Challenge and Response; a Study of the Development of the Gisborne East Coast Region. Gisborne, East Coast Development Research Association, 1971. $4.50.
PINNEY, R. Early South Canterbury Runs. Wn, Reed, 1971. $9.95.
PLATTS, U. The Lively Capital, Auckland 1840-1865. Ch, Avon Fine Prints, 1971. $12.
REED, A. H. The Gumdiggers; the Story of Kauri Gum. Wn, Reed, 1972. $3.75.
SCOTTER, W. H. Ashburton; a history. Ashburton, 1972. $6.
SMART, M. J. G. and A. P. BATES. The Wanganui story. Wanganui Newspapers, 1972. $5.90.
*STANDISH, M. W. The Waimate Mission Station. Wn, Govt. Print., 1962. 70c.
Also others issued by the New Zealand Historic Places Trust.
PETERSON, G. C. Palmerston North: a centennial history. Wn, Reed, 1973. $7.50.
NEW ZEALAND DEPARTMENT OF INTERNAL AFFAIRS. The New Zealand Honours List. 8th ed. Wn, Govt. Print, 1972. $3.50.
WHO'S WHO IN NEW ZEALAND. 10th ed., edited by G. C. Peterson. Wn, Reed, 1971. o. p.
BEAGLEHOLE, J. C. The life of Captain James Cook. London, Black, 1974.
CRESSWELL, W. D. The Letters of D'Arcy Cresswell. Ch, University of Canterbury, 1971. $6.
DUNMORE, J. Norman Kirk; a Portrait. Palmerston North, New Zealand Books, 1972. $2.80.
HALL-JONES, J. Mr Surveyor Thomson; Early Days in Otago and Southland. Wn, Reed, 1971. $4.95.
HARVIE, E. F. George Bolt, pioneer aviator. Wn, Reed, 1974.
HENDERSON, J. M. Ratana; the Man, the Church, the Political Movement. 2nd ed. Wn, Polynesian Society, 1972. $3.95.
LUSH, V. The Auckland Journals of Vicesimus Lush, 1850-63, ed. by A. Drummond. Ch, Pegasus, 1971. $7.
MACGREGOR, M. F. Petticoat pioneers, Norm Island women of the colonial era. Wn, Reed, 1973. $8.95.
*MC CORMICK, E. H. The Fascinating Folly; Dr Hocken and His Fellow Collectors, Dn, University of Otago Press, 1961.65c.
OGILVIE, G. B. The riddle of Richard Pearse. Wn, Reed, 1973. $4.95.
RAFTER, P. Never Let Go; the Remarkable Story of Mother Aubert. Wn, Reed, 1972. $5.50.
ROGERS, L. M. Te Wiremu; a biography of Henry Williams. Ch, Pegasus, 1973. $7.50.
ROLLESTON, R. William and Mary Rolleston. Wn, Reed, 1971. $4.50.
SINCLAIR, K. William Pember Reeves; New Zealand Fabian. Oxford, Clarendon Press, 1965. $6.90.
STACPOOLE, J. William Mason; the First New Zealand Architect. Ak, Auckland U. P.; Wn, O. U. P., 1971. $7.40.
STUART, P. Edward Gibbon Wakefield in New Zealand; His Political Career, 1853-54. Wn, Price Milburn for Victoria University of Wellington, 1971. $2.50.
WRIGHT-ST. CLAIR, R. E. Thoroughly a Man of the World; a Biography of Sir David Monro, M.D. Ch, Whitcombe and Tombs, 1971. $6.50.
A new Consumers Price Index became operative in 1975 following the completion by the Department of Statistics of research into expenditure patterns of households and the collection of base prices. This index has an expression base of the fourth quarter of 1974 (= 1000) (i.e., each current index number compares the general level of prices in the current month or quarter with the average level of prices during the fourth quarter of 1974 for the same grouping of priced items). The relative significance of an individual item is determined by the expenditure weight assigned to it relative to expenditure weights assigned to other items in the regimen of the index. Expenditure weights calculated from information on average spending patterns of households for the 12 months ended 30 June 1974 updated for changes in average prices of items as between the 12 months ended 30 June 1974 and the quarter ended 31 December 1974. The information on average spending patterns was obtained primarily from a Household Sample Survey conducted by the department.
The previous index, on base 1965 (= 1000), measured price movements up to the end of 1974 and has now been discontinued.
This new index contains some important changes in concept and coverage compared with the index it has replaced and in this it follows the recommendations of the Consumers Price Index Revision Advisory Committee. The wide ranging changes in concepts, methods, and expenditure patterns introduced by the new index produce a break in comparability between the new and old series. Although this problem was always present in the past its significance was minimal since successive index constructions differed only in a relatively minor way.
Background to Revision—The Government appointed a Consumers Price Index Revision Advisory Committee in June 1971 to report on requirements for a new index. Members of the committee represented the Federations of Employers, Farmers, Labour, and Retailers, and the Combined State Services Organisation, the Consumer Council, the National Council of Women, and academic and statistical experts. The committee made a number of recommendations, some of them confirming existing practices, others recommending basic conceptual changes and improvements in statistical procedures and methods. Major features of the committee's report were that:
The weighting for the new index be based on the expenditures of all people living in private households, rather than, as are the 1965 and earlier based indexes, on their actual or notional consumption.
There be more frequent revisions of the index, with the institution of a Household Sample Survey to obtain more accurate information on expenditures from the households themselves.
Expenditure involved in the purchase of all forms of housing be the basis on which owner-occupied housing is included in the new index rather than the previous approach which was based on a notional rental value.
The extension of items priced in the new index include new fields of expenditure such as air fares, the consumption of certain alcoholic beverages, holiday expenditure, and package holiday tours.
The index should not include expenditure on certain items such as those to which no price can be attached (contributions to charity, etc.); items where it was impossible to specify the good or service unambiguously (collectors' items, legal expenses in court proceedings); investments in securities; and all forms of direct taxation. Also by definition no expenditure was to be attributed to home-grown foods other than the cost of materials incurred in producing them.
All of the committee's main recommendations have been incorporated in the new Consumers Price Index.
Price Collection—Prices used in the old all centres combined index were collected in 25 market centres (Wellington-Hutt and Napier-Hastings, respectively, each being regarded as single centres) and indexes were published for 14 market centres. The Consumers Price Index Revision Advisory Committee laid down as guidelines that prices should be collected in all urban areas with the status of cities, in all large towns (i.e., over 10,000 population), a representative range of intermediate towns (i.e., 5,000—10,000 population), and a small representative range of small towns (i.e., 2,500 to 5,000 population). To better meet these guidelines, pricing of food for the revised index is undertaken in Tokoroa and Taupo. These market centres replace Thames and Oamaru for which prices were collected for the old index. The new index series thus continues to incorporate prices from 25 centres and has indexes for:
Each of the seven chief market centres (Auckland, Hamilton, Napier-Hastings, Palmerston North, Wellington-Hutt, Christchurch, Dunedin).
All seven chief market centres combined.
Each of the 10 larger market centres (Whangarei, Tauranga, Rotorua, Gisborne, New Plymouth, Wanganui, Masterton, Nelson, Timaru, Invercargill).
All 10 larger market centres combined.
New Zealand as a whole [25 market centres combined (i.e., those listed above and Tokoroa, Whakatane, Taupo, Hawera, Blenheim, Greymouth, Ashburton, and Gore)].
All Food Group—In the weighting base for the old index (1965) food represented 30.09 percent of the total index expenditure whereas in the base of the new index (Fourth quarter 1974) it represents a significantly lower percentage—17.82 percent.
For the new index 145 items are being priced monthly or weekly for the All Food Group against 125 for the old index. Additions include dehydrated peas, additional cuts of beef and sheep meats (including lamb), fresh shellfish, yoghurt, cakemix, animal and vegetable fats and oils, frozen fruit pie, instant pudding, margarine, ice blocks, potato chips, and take-aways. Bananas and oranges have been transferred to the seasonal basket of fruit and vegetables and the distinction between hothouse and outdoor tomatoes has been discontinued since they are frequently indistinguishable in the shop. As the prices and availability of eggs are now virtually non-seasonal, seasonal adjustments have been discontinued for this item.
Tables 1 and 2 set out the regimen of the revised index and table 3 compares the expenditure weighting of the revised index with that of its predecessor.
| Table 1—Regimen of Consumers Price Index, Fourth quarter 1974* | |
|---|---|
| Grouping and Commodity or Service | Base Expenditure Weight† |
*The estimated quantities of commodities purchased in the year ended June 1974 have been repriced with the average prices of the fourth quarter 1974 to provide the base expenditure of the index - base: fourth quarter 1974 (= 1000). †For the convenience of presentation, the figures shown in this published table have been rounded (independently) to fewer decimal places than are used in the calculations. Because of this rounding, the sums of the weights of the individual items as shown in the table are not always identical with the total. | |
| Percentage of Total | |
| 1. Food— | |
| (a) Fruit and vegetables— | |
| (i) Seasonal fruit and vegetables (see table 2) | 2.24 |
| Total, seasonal fruit and vegetables | 2.24 |
| (ii) Processed Fruit— | |
| Apricots, dried | 0.03 |
| Dates | 0.02 |
| Peaches, canned | 0.14 |
| Pineapple, canned | 0.06 |
| Sultanas | 0.09 |
| Total, processed fruit | 0.33 |
| (iii) Processed vegetables— | |
| Canned | 0.10 |
| Frozen | 0.21 |
| Dehydrated | 0.03 |
| Total, processed vegetables | 0.34 |
| Total, fruit and vegetables | 2.91 |
| (b) Meat, fish, and poultry— | |
| (i) Meat— | |
| Beef and Veal— | |
| Beef, blade steak | 0.36 |
| Beef, corned | 0.24 |
| Beef, porterhouse steak | 0.35 |
| Beef, prime rib, rolled | 0.34 |
| Beef, rump steak | 0.22 |
| Beef, topside | 0.21 |
| Wiener schnitzel | 0.11 |
| Total, beef and veal | 1.82 |
| Hogget and lamb— | |
| Hogget, chops, forequarter | 0.22 |
| Hogget, chops, midloin | 0.22 |
| Hogget, cut leg, knuckle end | 0.28 |
| Hogget, forequarter | 0.26 |
| Lamb, leg, whole | 0.18 |
| Total, hogget and lamb | 1.16 |
| Pork— | |
| Pork, cut leg, knuckle end | 0.13 |
| Pork, loin chops | 0.15 |
| Total, pork | 0.29 |
| Smallgoods and prepared meats— | |
| Bacon | 0.27 |
| Ham, cooked, pressed, sliced | 0.15 |
| Luncheon sausage | 0.12 |
| Liver, sheep's | 0.04 |
| Meat mince, seasoned, frozen | 0.01 |
| Mince, beef | 0.20 |
| Sausages | 0.28 |
| Saveloys | 0.08 |
| Canned meat | 0.05 |
| Total, smallgoods and prepared meats | 1.20 |
| Total, meat | 4.47 |
| (ii) Fish— | |
| Sole or flounder, wet | 0.04 |
| Wet fish, other | 0.10 |
| Smoked fish | 0.04 |
| Shellfish, opened | 0.06 |
| Salmon, canned | 0.08 |
| Sardines, canned | 0.03 |
| Fish fingers, frozen | 0.03 |
| Total, fish | 0.39 |
| (iii) Poultry— | |
| Chicken, roaster, frozen | 0.33 |
| Total, meat, fish, and poultry | 5.19 |
| (c) Other foods— | |
| (i) Eggs— | 0.59 |
| Total, eggs | 0.59 |
| (ii) Dairy products— | |
| Milk, delivered | 0.45 |
| Cream, delivered | 0.06 |
| Butter | 0.45 |
| Cheese | 0.30 |
| Yoghurt | 0.03 |
| Condensed milk | 0.04 |
| Milk powder, full cream | 0.07 |
| Total, dairy products | 1.39 |
| For footnotes see end of table. | |
| (iii) Cereals and cereal products— | |
| Breads, biscuits, and cakes— | |
| Breads | 0.67 |
| Biscuits | 0.44 |
| Cakes | 0.35 |
| Total, breads, biscuits, and cakes | 1.46 |
| Other cereals and cereal products— | |
| Breakfast flake biscuits | 0.12 |
| Cake mix | 0.02 |
| Cornflour, packaged | 0.01 |
| Flour, white | 0.09 |
| Oatmeal, packaged | 0.04 |
| Rice | 0.05 |
| Total, other cereals and cereal products | 0.34 |
| Total, cereals and cereal products | 1.80 |
| (iv) Jams and spreads— | |
| Honey | 0.08 |
| Jam | 0.06 |
| Marmalade | 0.02 |
| Peanut butter | 0.04 |
| Vegetable extract | 0.04 |
| Total, jams and spreads | 0.23 |
| (v) Beverages— | |
| Cocoa | 0.05 |
| Coffee, instant | 0.19 |
| Coffee, packaged, ground | 0.02 |
| Proprietary drink, granulated | 0.03 |
| Tea | 0.20 |
| Total, beverages | 0.49 |
| (vi) Other grocery foods— | |
| Baking powder | 0.02 |
| Cooking fats and oils | 0.10 |
| Fruit pie, frozen | 0.01 |
| Instant pudding | 0.04 |
| Jelly crystals | 0.04 |
| Margarine, table | 0.12 |
| Pepper, white | 0.06 |
| Salt, iodised | 0.02 |
| Sauce, tomato | 0.09 |
| Soup, canned | 0.04 |
| Soup powder | 0.07 |
| Spaghetti, canned | 0.17 |
| Sugar, white | 0.38 |
| Vinegar | 0.03 |
| Total, other grocery foods | 1.20 |
| (vii) Soft drinks, fruit juice, and ices— | |
| Aerated waters | 0.28 |
| Fruit extracts and cordials | 0.12 |
| Fruit, juice, pure | 0.05 |
| Ice block | 0.06 |
| Ice cream | 0.34 |
| Total, soft drinks, fruit juice, and ices | 0.85 |
| (viii) Sweets, potato chips, peanuts— | |
| Chocolate block | 0.22 |
| Chocolates | 0.08 |
| Peanuts, salted | 0.06 |
| Potato chips | 0.08 |
| Toffees | 0.21 |
| Total, sweets, potato chips, peanuts | 0.66 |
| (ix) Meals away from home— | |
| Grill, grillroom | 0.35 |
| Lunch, cafe | 0.48 |
| Snack, coffee bar | 1.01 |
| Total, meals away from home | 1.83 |
| (x) Takeaways— | |
| Chicken, cooked, hot | 0.16 |
| Fish, fried, hot | 0.29 |
| Hamburger, hot | 0.06 |
| Pie, meat, hot | 0.06 |
| Sandwich | 0.11 |
| Total, takeaways | 0.67 |
| Total, other foods | 9.72 |
| Total all foods | 17.82 |
| 2. Housing— | |
| (a) Rentals— | |
| (i) State and municipal dwelling rentals— | |
| Houses | 0.72 |
| Total, State and municipal rentals | 0.72 |
| (ii) Other dwelling rentals— | |
| Houses | 1.39 |
| Flats | 1.39 |
| Total, other dwelling rentals | 2.78 |
| Total, rentals | 3.50 |
| (b) Home ownership— | |
| (i) Purchase of dwellings— | |
| Previously-occupied house | 9.93 |
| Previously-occupied flat | 0.46 |
| Newly-erected house | 0.53 |
| Newly-erected flat | 1.04 |
| Section | 1.22 |
| Erection of dwelling (including additions and alterations to existing dwellings) | 3.75 |
| Total, purchase of dwellings | 16.94 |
| (ii) Expenses of purchase and financing of ownership of dwellings— | |
| Specialists' fees and stamp duty | 0.97 |
| Interest on mortgage, mortgage repayment insurance, and contribution to Housing Corporation Reserve Fund | 1.41 |
| Total, expenses of purchase and financing of ownership of dwellings | 2.38 |
| (iii) Maintenance expenditure, rates and insurance— | |
| Contractors' charges for maintenance jobs | 1.39 |
| Timber | 0.54 |
| Concrete blocks | 0.36 |
| Wallboards and insulating materials | 0.11 |
| Paint and wallpaper | 0.94 |
| Cartage | 0.05 |
| Rates, local authority | 1.23 |
| Insurance on house | 0.37 |
| Total, maintenance expenditure, rates and insurance | 4.98 |
| Total, home ownership | 24.30 |
| Total, Housing | 27.80 |
| 3. Household Operation— | |
| (a) Fuel and Light— | |
| Coal, delivered | 0.19 |
| Electricity | 1.55 |
| Gas | 0.06 |
| Oil, domestic heating | 0.19 |
| Total, fuel and light | 1.98 |
| For footnotes see end of table. | |
| (b) Household Furnishing— | |
| (i) Household appliances— | |
| Electric household appliances— | |
| Blanket | 0.05 |
| Cake mixer | 0.02 |
| Clothes dryer, tumbler | 0.11 |
| Drill, portable | 0.03 |
| Freezer | 0.22 |
| Frypan | 0.03 |
| Iron | 0.04 |
| Jug | 0.03 |
| Radiator | 0.10 |
| Radio | 0.05 |
| Range | 0.15 |
| Razor | 0.02 |
| Refrigerator | 0.31 |
| Sewing machine | 0.16 |
| Stereo | 0.39 |
| Tape recorder | 0.04 |
| Toaster | 0.02 |
| Television sets, black and white, and colour | 0.20 |
| Vacuum cleaner | 0.05 |
| Washing machine | 0.40 |
| Total, electric household appliances | 2.41 |
| Other household appliances— | |
| Motor mower | 0.21 |
| Stroller | 0.05 |
| Total, other household appliances | 0.26 |
| Total, household appliances | 2.67 |
| (ii) Furniture— | |
| Bedroom suite, and tallboy | 0.62 |
| Dining room and lounge suites and cocktail cabinet | 1.12 |
| Kitset furniture | 0.03 |
| Mattresses | 0.13 |
| Blinds | 0.11 |
| Cot | 0.06 |
| Piano | 0.09 |
| Total, furniture | 2.16 |
| (iii) Floor coverings— | |
| Carpets | 0.88 |
| Other floor coverings | 0.10 |
| Total, floor coverings | 0.97 |
| (iv) Household textiles— | |
| Blankets | 0.15 |
| Pillows and sheets | 0.36 |
| Towels and teatowels | 0.15 |
| Furnishing materials | 0.37 |
| Total, household textiles | 1.03 |
| (v) Household equipment and utensils— | |
| Cake tin | 0.04 |
| Baking dishes | 0.04 |
| Clock | 0.03 |
| Mixing bowl | 0.07 |
| Glassware | 0.06 |
| Saucepans | 0.08 |
| Crockery | 0.27 |
| Cutlery | 0.06 |
| Tin opener | 0.03 |
| Brooms | 0.04 |
| Hammer | 0.07 |
| Plane | 0.07 |
| Hose, garden | 0.06 |
| Ladder and steps | 0.06 |
| Garden tools | 0.13 |
| Total, household equipment and utensils | 1.11 |
| Total, household furnishing | 7.95 |
| (c) Household supplies and services— | |
| (i)Household supplies— | |
| Battery, dry cell | 0.05 |
| Bulb, electric light | 0.03 |
| Pet food | 0.38 |
| Cleanser powder | 0.05 |
| Dish-washing liquids | 0.08 |
| Disinfectant | 0.03 |
| Fly spray | 0.09 |
| Foil, aluminium | 0.03 |
| Garden fertiliser | 0.07 |
| Garden plants | 0.28 |
| Lawn seed | 0.09 |
| Lunch wrap | 0.07 |
| Polish, furniture | 0.03 |
| Polish, shoe | 0.01 |
| Washing powders | 0.25 |
| Window cleaning fluid | 0.02 |
| Total, household supplies | 1.56 |
| (ii) Household services— | |
| Post Office charges— | |
| Postages | 0.14 |
| Telegram | 0.02 |
| Telephone rental, box and toll calls | 1.24 |
| Total, Post Office, charges | 1.39 |
| Other household services— | |
| Dry-cleaning | 0.19 |
| Household furniture removal | 0.05 |
| Insurance on house contents | 0.31 |
| Television hire | 0.25 |
| Television licence | 0.22 |
| Repairs to appliances | 0.38 |
| Veterinary fees | 0.04 |
| Total, other household services | 1.43 |
| Total, household services | 2.82 |
| Total, household supplies and services | 4.38 |
| Total, household operation | 14.31 |
| 4. Apparel | |
| (a) Clothing— | |
| (i) Men's clothing— | |
| Cardigan | 0.17 |
| Handkerchief | 0.09 |
| Jacket | 0.16 |
| Jeans | 0.13 |
| Pyjamas, lightweight | 0.06 |
| Raincoat | 0.03 |
| Shirts, business | 0.20 |
| Shirts, casual | 0.14 |
| Shirts, working | 0.11 |
| Singlet, lightweight | 0.05 |
| Socks | 0.10 |
| Suit | 0.15 |
| Swimming trunks | 0.01 |
| Trousers, sports | 0.27 |
| Trousers, working | 0.08 |
| Underpants | 0.06 |
| Walk shorts | 0.06 |
| Windbreaker | 0.02 |
| Total, men's clothing | 1.90 |
| (ii) Women's clothing— | |
| Brassiere | 0.13 |
| Cardigan, lightweight | 0.28 |
| Cardigan, heavyweight | 0.12 |
| Coat | 0.08 |
| For footnotes see end of table. | |
| Dressing gown | 0.02 |
| Frock, lightweight | 0.59 |
| Frock, heavyweight | 0.18 |
| Girdle | 0.04 |
| Nightdress | 0.14 |
| Panties | 0.07 |
| Hosiery | 0.20 |
| Pyjamas | 0.02 |
| Raincoat | 0.03 |
| Slacks, lightweight | 0.25 |
| Slacks, heavyweight | 0.08 |
| Skirt | 0.13 |
| Suit | 0.19 |
| Swimsuit | 0.03 |
| Umbrella | 0.07 |
| Underslip | 0.07 |
| Vest | 0.04 |
| Total, women's clothing | 2.75 |
| (iii) Boys' clothing— | |
| Jeans | 0.05 |
| Pyjamas, lightweight | 0.02 |
| Pyjamas, heavyweight | 0.02 |
| Raincoat | 0.03 |
| School uniform | 0.25 |
| Shirt | 0.05 |
| Shorts | 0.08 |
| Underpants | 0.03 |
| Total, boys' clothing | 0.52 |
| (iv) Girls' clothing— | |
| Frock | 0.03 |
| Jeans | 0.03 |
| Jumper | 0.07 |
| Panties | 0.03 |
| Pyjamas | 0.04 |
| School uniform | 0.15 |
| Shorts | 0.02 |
| Skirt | 0.01 |
| Slacks | 0.03 |
| Socks | 0.04 |
| Vest | 0.01 |
| Total, girls' clothing | 0.46 |
| (v) Infants' clothing— | |
| Nightwear | 0.06 |
| Nursery squares | 0.02 |
| Plastic pants | 0.01 |
| Underwear | 0.08 |
| Total, infants' clothing | 0.18 |
| (vi) Piece goods— | |
| Coating material | 0.04 |
| Fabric, sailcloth | 0.28 |
| Fabric, synthetic, lightweight | 0.20 |
| Fabric, synthetic heavy weight | 0.07 |
| Cloth, woollen/cotton mixture | 0.03 |
| Cloth, woollen, medium weight | 0.07 |
| Total, piece goods | 0.70 |
| (vii) Sewing and knitting materials— | |
| Pattern, paper | 0.13 |
| Thread, sewing | 0.03 |
| Wools, knitting | 0.25 |
| Zip | 0.03 |
| Total, sewing and knitting materials | 0.44 |
| Total, clothing | 6.95 |
| (b) Footwear— | |
| (i) Men's footwear— | |
| Boots, football | 0.02 |
| Boots, heavyweight | 0.05 |
| Sandals | 0.01 |
| Sandshoes | 0.03 |
| Shoes, bowling | 0.01 |
| Shoes, lightweight | 0.23 |
| Shoes, heavyweight | 0.08 |
| Slippers | 0.02 |
| Repairs to men's shoes | 0.03 |
| Total, men's footwear | 0.47 |
| (ii) Women's footwear— | |
| Sandals | 0.05 |
| Shoes, lightweight | 0.43 |
| Shoes, heavyweight | 0.14 |
| Slippers | 0.07 |
| Sneakers | 0.01 |
| Repairs to women's shoes | 0.02 |
| Total, women's footwear | 0.71 |
| (iii) Children's footwear— | |
| Gumboots | 0.01 |
| Sandals | 0.06 |
| Sandals, Y-thong | 0.06 |
| Shoes, boys' school | 0.10 |
| Shoes, infants' | 0.02 |
| Shoes, girls' | 0.12 |
| Slippers | 0.03 |
| Total, children's footwear | 0.41 |
| Total, footwear | 1.59 |
| Total, Apparel | 8.55 |
| 5. Transportation— | |
| (a) Public transport— | |
| (i) Land travel— | |
| Urban and suburban bus and rail fares | 0.48 |
| Long distance bus and rail fares | 0.09 |
| Taxi fares | 0.22 |
| Rental car hire | 0.01 |
| Total, land travel | 0.81 |
| (ii) Air travel— | |
| Air fares | 0.22 |
| (iii) Sea travel and transport of vehicles— | |
| Inter-island passenger fares and vehicular transport charges | 0.05 |
| Total, public transport | 1.08 |
| (b) Private transport— | |
| (i) Purchase of vehicles— | |
| Car, new | 3.10 |
| Car, used | 2.78 |
| Motor cycle, new | 0.22 |
| Bicycle | 0.15 |
| Total, purchase of vehicles | 6.26 |
| (ii) Motor vehicle running and maintenance— | |
| Petrol | 2.86 |
| Lubrication | 0.18 |
| Tyre and tube, including retread | 0.37 |
| Decarbonise and valve grind | 0.53 |
| Overhaul of brakes | 0.51 |
| Overhaul of gearbox | 0.78 |
| Reconditioned short block | 0.81 |
| Annual licence | 0.50 |
| Driving licence | 0.05 |
| Driving school fee | 0.06 |
| Insurance | 0.71 |
| Total, motor vehicle running and maintenance | 7.3 |
| Total, private transport | 13.62 |
| Total, Transportation | 14.70 |
| For footnotes see end of table. | |
| 6. Miscellaneous— | |
| (a) Tobacco and alcohol— | |
| (i) Tobacco, cigarettes, and requisites— | |
| Cigarettes, including cigars | 2.22 |
| Tobacco, pipe and cigarette | 0.24 |
| Matches | 0.06 |
| Total, tobacco, cigarettes, and requisites | 2.53 |
| (ii) Alcohol— | |
| Beer, draught— | |
| Hotel or tavern sales of draught beer (including lager type beers and stout) sold by the glass, or flagon or jug | 1.20 |
| Beer, bottled and canned— | |
| Bottled and canned beers consumed in hotel or tavern or purchased for consumption off the premises, wholesale and retail | 1.35 |
| Spirits— | |
| Spirits consumed in hotel or tavern or purchased for consumption off the premises, wholesale or retail | 0.74 |
| Wines— | |
| Local and imported wines purchased wholesale or retail | 0.59 |
| Total, alcohol | 3.89 |
| Total, tobacco and alcohol | 6.42 |
| (b) Other supplies— | |
| (i) Medical and health supplies— | |
| Adhesive dressings | 0.05 |
| Antiseptic liquid | 0.03 |
| Aspirin | 0.04 |
| Cough remedy | 0.03 |
| Hormone tablets | 0.05 |
| Paracetamol | 0.06 |
| Throat tablets | 0.03 |
| Vitamin concentrate | 0.03 |
| Total, medical and health supplies | 0.31 |
| (ii) Cosmetics— | |
| Deodorant | 0.04 |
| Face powder | 0.02 |
| Foundation makeup | 0.07 |
| Haircream | 0.04 |
| Hair rinse | 0.03 |
| Hair rollers | 0.04 |
| Hair spray | 0.05 |
| Hand cream | 0.03 |
| Lipstick | 0.05 |
| Mascara eye liner | 0.05 |
| Skin perfume | 0.04 |
| Total, cosmetics | 0.46 |
| (iii) Personal goods— | |
| Toiletries— | |
| Talcum powder | 0.04 |
| Razor blades | 0.03 |
| Sanitary towels | 0.03 |
| Shampoo | 0.04 |
| Toilet paper | 0.14 |
| Toilet soap | 0.12 |
| Toilet tissues | 0.03 |
| Toothbrush | 0.02 |
| Toothpaste | 0.08 |
| Total, toiletries | 0.53 |
| Other personal goods— | |
| Handbag | 0.15 |
| Satchel | 0.05 |
| Suitcase | 0.04 |
| Ring, engagement | 0.16 |
| Watch | 0.09 |
| Total, other personal goods | 0.50 |
| Total, personal goods | 1.03 |
| (iv) Stationery supplies— | |
| Binder file refill | 0.04 |
| Envelopes | 0.11 |
| Exercise books | 0.03 |
| Pad, writing | 0.05 |
| Pen, ball-point | 0.01 |
| Pen, fountain | 0.04 |
| Pencil | 0.02 |
| Total, stationery supplies | 0.30 |
| (v) Leisure and recreational supplies— | |
| Boat and boating equipment | 0.54 |
| Photographic equipment, and supplies | 0.36 |
| Caravan | 0.27 |
| Cassettes and gramophone records | 0.28 |
| Children's toys | 0.34 |
| Equipment for sports, games and tramping | 0.39 |
| Music instruments | O.09 |
| Swimming pool | 0.02 |
| Total, leisure and recreational supplies | 2.28 |
| (vi) Newspapers, magazines, and books Newspapers | 0.27 |
| Magazines and periodicals | 0.36 |
| Books, popular reading | 0.33 |
| Library subscription | 0.02 |
| Educational text-books | 0.16 |
| Total, newspapers, magazines, and books | 1.13 |
| Total, other supplies | 5.52 |
| (c) Other services— | |
| (i) Health services (over and above social security)— | |
| Optometrists' fees | 0.18 |
| Dentists' fees | 0.41 |
| General medical practitioners fees (over and above social security) | 0.38 |
| Medical specialists' fees (over and above social security) | 0.14 |
| Private general hospital fees (over and above social security) | 0.27 |
| Total, health services | 1.36 |
| (ii) Recreational, cultural, and educational services— | |
| Admissions to concerts and cinemas | 0.58 |
| Admissions to games and sports events | 0.20 |
| Fishing licence | 0.01 |
| Music, singing, etc, tuition fees | 0.13 |
| Primary, secondary, and tertiary tuition and examination fees | 0.41 |
| Sightseeing and scenic tours | 0.05 |
| Subscriptions to sports and other clubs | 0.36 |
| Total, recreational, cultural, and educational services | 1.73 |
| For footnotes see end of table. | |
| (iii) Accommodation, board, and lodging— | |
| Board at schools | 0.06 |
| Licensed hotel tariffs | 0.14 |
| Private hotel tariffs | 0.07 |
| Motel tariffs and motor camps charges | 0.38 |
| Total, accommodation, board, and lodging | 0.65 |
| (iv) Credit services— | |
| Hire purchase charges | 0.29 |
| Total, credit services | 0.29 |
| (v) Personal services— | |
| Funeral, burial, and cremation fees | 0.14 |
| Haircuts | 0.21 |
| Hairset, woman's | 0.23 |
| Labour union dues | 0.19 |
| Watch repairs | 0.07 |
| Total, personal services | 0.84 |
| Total, other services | 4.87 |
| Total, miscellaneous | 16.82 |
| Grand total, all groups | 100.00 |
| Table 2—Consumers Price Index, Fourth Quarter 1974 Seasonal Fruit and Vegetables | ||||||||||||
|---|---|---|---|---|---|---|---|---|---|---|---|---|
| Commodity | Percentage Expenditure at Base Price*† | |||||||||||
| Jan | Feb | Mar | Apr | May | Jun | Jul | Aug | Sep | Oct | Nov | Dec | |
*For convenience of presentation the figures shown here have been rounded (independently) to fewer decimal places than are used in the calculations. Because of this rounding, sums of the individual items may not always appear identical with the totals. †The expenditure on seasonal fruit and vegetables in the base quarter (quantities for year ended June 1974 at December quarter 1974 average prices) expressed as a percentage of all expenditure was 2.24. This total is assumed to be a constant for every month of the year but the basket of fresh fruit, and vegetables varies according to availability. | ||||||||||||
| Apples | 0.12 | 0.21 | 0.27 | 0.30 | 0.26 | 0.29 | 0.30 | 0.32 | 0.33 | 0.31 | 0.19 | 0.06 |
| Apricots | 0.10 | 0.09 | - | - | - | - | - | - | - | - | - | 0.07 |
| Bananas | 0.29 | 0.23 | 0.21 | 0.20 | 0.32 | 0.35 | 0.38 | 0.35 | 0.32 | 0.30 | 0.33 | 0.31 |
| Grapefruit | - | - | - | - | - | 0.03 | 0.03 | 0.03 | 0.03 | 0.03 | 0.03 | - |
| Kiwi berries | - | - | - | - | - | 0.02 | 0.02 | 0.02 | 0.01 | - | - | - |
| Lemons | 0.01 | 0.01 | 0.02 | 0.02 | 0.01 | 0.01 | 0.01 | 0.01 | 0.01 | 0.01 | 0.01 | 0.01 |
| Oranges | 0.10 | 0.16 | 0.21 | 0.16 | 0.25 | 0.28 | 0.29 | 0.27 | 0.22 | 0.24 | 0.22 | 0.15 |
| Peaches | 0.18 | 0.17 | 0.10 | - | - | - | - | - | - | - | - | 0.07 |
| Pears | - | 0.08 | 0.06 | 0.06 | 0.05 | 0.04 | 0.04 | 0.04 | 0.05 | 0.06 | 0.02 | - |
| Plums | 0.08 | 0.07 | 0.03 | - | - | - | - | - | - | - | - | 0.07 |
| Strawberries | 0.03 | - | - | - | - | - | - | - | - | - | 0.12 | 0.11 |
| Tamarillos | - | - | - | - | 0.02 | 0.02 | 0.02 | - | - | - | - | - |
| Beans | 0.02 | 0.02 | 0.02 | - | - | - | - | - | - | - | - | 0.04 |
| Brussels sprouts | - | - | - | 0.04 | 0.04 | 0.04 | 0.04 | 0.03 | - | - | - | - |
| Cabbage | 0.06 | 0.07 | 0.08 | 0.11 | 0.10 | 0.10 | 0.09 | 0.10 | 0.09 | 0.10 | 0.10 | 0.06 |
| Carrots | 0.10 | 0.09 | 0.09 | 0.09 | 0.08 | 0.07 | 0.07 | 0.07 | 0.07 | 0.11 | 0.13 | 0.12 |
| Cauliflower | 0.02 | 0.04 | 0.05 | 0.09 | 0.08 | 0.07 | 0.09 | 0.08 | 0.07 | 0.06 | 0.05 | 0.03 |
| Celery | - | 0.01 | 0.02 | 0.03 | 0.03 | 0.03 | 0.03 | 0.03 | 0.03 | - | - | - |
| Cucumber | 0.04 | 0.03 | - | - | - | - | - | - | - | - | - | 0.06 |
| Kumaras | - | - | 0.05 | 0.05 | 0.03 | 0.03 | 0.03 | 0.03 | 0.03 | 0.03 | 0.02 | - |
| Leeks | - | - | - | 0.02 | 0.02 | 0.02 | 0.02 | 0.02 | - | - | - | - |
| Lettuce | 0.09 | 0.09 | 0.08 | 0.07 | 0.05 | 0.04 | 0.04 | 0.05 | 0.07 | 0.07 | 0.09 | 0.08 |
| Onions | 0.10 | 0.10 | 0.10 | 0.10 | 0.07 | 0.07 | 0.08 | 0.07 | 0.07 | 0.05 | 0.06 | 0.06 |
| Parsnips | - | - | - | 0.02 | 0.02 | 0.02 | 0.02 | 0.02 | 0.02 | 0.02 | 0.01 | - |
| Potatoes | 0.48 | 0.48 | 0.54 | 0.59 | 0.58 | 0.50 | 0.48 | 0.53 | 0.57 | 0.55 | 0.46 | 0.57 |
| Pumpkin | 0.07 | 0.08 | 0.07 | 0.06 | 0.05 | 0.04 | 0.04 | 0.04 | 0.05 | 0.05 | 0.05 | - |
| Silverbeet | 0.01 | 0.01 | 0.01 | 0.01 | 0.01 | 0.01 | 0.01 | 0.01 | 0.01 | 0.01 | 0.01 | 0.01 |
| Swedes | - | - | - | 0.01 | 0.01 | 0.01 | 0.01 | 0.01 | 0.01 | 0.01 | - | - |
| Tomatoes | 0.34 | 0.20 | 0.21 | 0.20 | 0.16 | 0.14 | 0.11 | 0.12 | 0.20 | 0.23 | 0.34 | 0.35 |
| Totals | 2.24 | 2.24 | 2.24 | 2.24 | 2.24 | 2.24 | 2.24 | 2.24 | 2.24 | 2.24 | 2.24 | 2.24 |
| Table 3—Consumers Price Index—Comparison of the Expenditure Weighting of the Fourth Quarter 1974 Regimen with that of the 1965 Regimen | ||
|---|---|---|
| Group and Sub-group | Percentage of Total Expenditure Covered by the Index | |
| Fourth quarter | ||
| 1,965 | 1,974 | |
| Food— | ||
| Fruit and vegetables | 5.89 | 2.91 |
| Meat, fish, and poultry | 9.22 | 5.19 |
| Other foods | 14.98 | 9.72 |
| 30.09 | 17.82 | |
| Housing— | ||
| Rentals | 5.50 | 3.50 |
| Home ownership | 12.49 | 24.30 |
| 17.99 | 27.80 | |
| Household operation— | ||
| Fuel and light | 2.82 | 1.98 |
| Household furnishing | 5.59 | 7.95 |
| Household supplies and services | 2.80 | 4.38 |
| 11.21 | 14.31 | |
| Apparel— | ||
| Clothing | 10.91 | 6.95 |
| Footwear | 2.21 | 1.59 |
| 13.12 | 8.54 | |
| Transportation— | ||
| Public transport | 2.38 | 1.68 |
| Private transport | 7.06 | 13.62 |
| 9.44 | 14.70 | |
| Miscellaneous— | ||
| Tobacco and alcohol | 7.64 | 6.42 |
| Other supplies | 5.66 | 5.52 |
| Other services | 4.85 | 4.87 |
| 18.15 | 16.82 | |
| Totals | 100.00 | 100.00 |
This Household Sample Survey arises from the acceptance of the Consumers Price Index Revision Advisory Committee's recommendation in 1971 that an essential feature of the revision should be the establishment of average expenditures of private households and that this information be a major source for determining the relative importance (or weights, in the statistical sense) of the many items of goods and services to be included in the new index. The first year of collection of the Household Sample Survey designed to provide this basic information ran from 1 July 1973 to 30 June 1974.
The Sample—Sample surveys are an internationally accepted activity when the collection of information from the total population is either administratively impracticable or would be prohibitive in cost. To meet the needs of the Consumers Price Index revision, the Household Sample Survey has been designed to produce data on a national basis, representative of the average New Zealand private household.
A three-stage probability sample was used, based upon the distribution of the total population at the 1971 Census, with updating by reference to electricity supply authority records prior to drawing the final sample. Further details of the sample design will be given in the main publication.
Concepts, Definitions, and Collection Methods—Expenditure: In accordance with the recommendation of the 1971 Consumers Price Index Revision Advisory Committee, the Household Sample Survey collection has been based on the recording of expenditure, or expenditure commitment, on goods and services acquired by a household in a particular reference period, whether or not these acquisitions are consumed during that period.
In this context of acquisition, two particular items of expenditure need special mention—
Housing—For purchase and/or sale of dwelling units, land, etc., the net cost of such transactions is collected and processed—that is, the gross receipts from all sales by responding households are offset against the total cost of all purchases by responding households. Expenditure on housing units under construction is included on the basis of actual costs (for example, progress payments on a new house) incurred in the reference period. In both cases costs are included irrespective of the manner by which purchases are financed.
Private Motor Vehicles—The Household Sample Survey results show the net cost for responding households recording transactions in this item—offsetting all purchase costs for private motor vehicles (again irrespective of the method of financing such purchases) against the total receipts from the disposal of private motor vehicles whether by way of sale or trade-in.
Private Household: The purpose of the survey was to establish expenditure patterns of New Zealand private households and to meet this need a “private household” was defined as—
“Either a single individual who makes his or her own housekeeping arrangements or who lives in group-living-quarters (other than a non-contributory institution); and all those persons living in or sharing a dwelling for most of the reference period who participate in some measure at least in consumption of food purchased for joint use by members or who, if not dependent upon a household member, contribute some portion of income towards the provision of essentials of living for the household as a whole.”
Persons living in institutions or group-living establishments such as boardinghouses, hotels, motels, and hostels were not included in the survey. However, children at boarding school were accounted for by including expenditure on behalf of these children in the record-keeping of the parent or guardian.
Collection Methods—For collection methods it was necessary to achieve a compromise between the best theoretical system—that which would collect complete expenditure from sample households for the full year—and the practical need to place, the least possible burden on those persons providing the information.
The system decided upon was that in use in many similar surveys overseas. This involves collecting data on the more frequently purchased items by asking respondents to keep a daily record of their spending for a short period (in the New Zealand survey a fortnight of diary-keeping is sought) and at an interview conducted in the household to ask respondents to recall their expenditure on major items in the preceding 12 months. The recall action usually concerns expenses of $50 and therefore relates to the acquisition of such things as housing units, major household appliances, motor vehicles, etc. Again for practical reasons, the diary-keeping requirement was restricted to those household members aged 15 years and over, expenditures by younger members being recorded in the diaries of adult members.
Households Participating in the 1973-74 Collection—Details of the numbers of households giving full response in the collection for the year ended 30 June 1974 are as follows:
| Households responding | 3,812 | Average of 3.4 persons per household. |
| Persons in those households | 12,986 | |
| Persons aged 15 years and over earning $20 or more per week | 6,139 Average of 1.6 earners per household. |
| Weekly Income of Responding Households | Number of Responding Households |
|---|---|
| $ | |
| Under 30 | 205 |
| 30-39 | 112 |
| 40-49 | 77 |
| 50-59 | 226 |
| 60-69 | 137 |
| 70-79 | 178 |
| 80-89 | 232 |
| 90-99 | 248 |
| 100-119 | 393 |
| 120-139 | 513 |
| 140-159 | 405 |
| 160-179 | 296 |
| 180-199 | 217 |
| 200 and over | 573 |
| Totals | 3,812 |
RESULTS OF THE 1973-74 COLLECTION: Expenditure—For the purpose of the Consumers Price Index revision private household expenditure was processed in considerable detail and this will be published in the main volume. However, for this and subsequent supplements average expenditures will be treated under eight main headings.
Expenditure group coverage—
Food—Purchases, including meals away from home where separately recorded by respondents.
Housing—Rent, mortgage repayments, repairs and maintenance, and net capital costs of house sale and purchase.
Household Operation—Fuel, light, and power; household equipment and appliances; furniture; domestic supplies and services.
Apparel—Clothing and footwear.
Transportation—Public transport; net cost of vehicle sale and purchase; repairs and maintenance; vehicle insurance, registration fees, etc.
Tobacco and Alcohol—Purchases.
Other Supplies—-Medical, health, and personal goods; recreational, educational, and cultural goods.
Other Services—Medical and health services; entertainment charges; education fees; accommodation charges; personal services; licence fees; life insurance premiums.
In each group the expenditures comprise the total cost of particular goods or services, including credit costs, hire and repair charges.
All expenditures are expressed (either as percentages or in money values) as average weekly expenditure per household in the particular category. Households are categorised according to their total income, number of occupants, the family types of the members (census definition), and the age of the head of the household.
In all cases information as reported by households is given without adjustment. Overseas experience has shown that expenditure on tobacco and alcohol, meals away from home, and food items such as ice cream and confectionery tend to be understated in household surveys. There is reason to believe that this Household Sample Survey collection contains similar features. There also is a possibility that households occupying houses built since the 1971 Census are under represented.
Definitions: Head of Household— Determination of the status of “head of household” is normally decided by household members themselves who nominate one of their members to this position, or, where there is doubt or disagreement, the person who is responsible for the payment of rates or rents. If two or more persons of different sex have equal claim to be the head of the household, the oldest male is chosen: if two or more persons of the same sex have equal claim, the oldest is chosen.
Family Types—In this survey for statistical purposes couple means husband and wife (including de facto relationships). Child means never-married child of household member.
Extended families cover normal family units with one or more additional persons added not being part of the immediate family, e.g., married daughter, aunt, boarder.
Non-family households are households the composition of which does not include related members, e.g., one person living alone, three youths, two girls, etc.
Income—This relates to the current gross income from all sources (including Social Welfare and other benefits) for each income recipient in the household, the one exception to this being interest from deposits in savings banks. (Unless such interest is $200 or more a year).
There has been no endeavour to obtain precise income details from respondents, the method of collection used being on similar lines to that used in the census where respondents have a broad-banded range of income categories and mark the category pertaining to themselves.
For statistical purposes the mid-point in this range is selected to represent the income of the individual responding. The total weekly income of the household is obtained by summing the values attributed to each income earner in the household. In some cases average expenditure appears to exceed average weekly income. This is caused by the purchase of major items, mainly houses, within the period covered.
A selection of summary tables is reproduced here. A fuller report is to be published separately.
| PERCENTAGE OF WEEKLY EXPENDITURE BY AGE OF HEAD OF HOUSEHOLD | |||||||||
|---|---|---|---|---|---|---|---|---|---|
| Expenditure Group | Age Group (Years) of Head of Household | All | |||||||
| Under 20 | 20-24 | 25-29 | 30-39 | 40-49 | 50-59 | 60-64 | 65 and Over | ||
| There were an average of 1.6 earners per household. | |||||||||
| Percentage Weekly Expenditure | |||||||||
| Food | 17.0 | 14.7 | 14.9 | 17.4 | 18.0 | 19.0 | 17.2 | 21.5 | 17.6 |
| Housing | 21.5 | 28.3 | 31.8 | 25.5 | 21.3 | 8.3 | 17.9 | 13.9 | 21.5 |
| Household operation | 11.5 | 14.3 | 15.0 | 13.8 | 1.32 | 15.6 | 15.8 | 20.6 | 14.7 |
| Apparel | 11.0 | 7.2 | 7.1 | 8.5 | 10.0 | 10.3 | 9.3 | 9.2 | 9.0 |
| Transportation | 13.7 | 17.2 | 15.1 | 15.4 | 17.2 | 23.5 | 21.9 | 17.8 | 17.7 |
| Tobacco and alcohol | 7.7 | 5.1 | 3.9 | 3.7 | 3.7 | 4.8 | 3.7 | 3.4 | 4.0 |
| Other goods | 8.6 | 5.4 | 4.7 | 5.9 | 6.1 | 6.7 | 5.0 | 5.1 | 5.8 |
| Other services | 9.1 | 7.7 | 7.5 | 9.9 | 10.1 | 11.8 | 9.2 | 8.5 | 9.7 |
| All groups percent | 100.0 | 100.0 | 100.0 | 100.0 | 100.0 | 100.0 | 100.0 | 100.0 | 100.0 |
| All groups $ | 82.02 | 108.97 | 123.53 | 124.39 | 139.99 | 105.84 | 89.43 | 51.99 | 109.54 |
| Total households | 32 | 291 | 425 | 840 | 777 | 602 | 263 | 582 | 3,812 |
| PERCENTAGE AVERAGE WEEKLY HOUSEHOLD EXPENDITURE BY FAMILY TYPES | ||||||||
|---|---|---|---|---|---|---|---|---|
| Expenditure Group | Couple | Couple 1 Child | Couple 2 Children | Couple 3 Children | Couple 4 or More Children | One Adult* With or Without Children | Extended Families | Non-Family Household |
*Single, separated, divorced, widowed man or woman with or without children. †One category, relating to 4 only of the 3,812 households surveyed, has been omitted as the number is too small to be representative. | ||||||||
| Percentage Weekly Expenditure | ||||||||
| Food | 15.7 | 16.3 | 17.4 | 18.3 | 21.4 | 21.7 | 19.0 | 17.1 |
| Housing | 23.3 | 23.8 | 23.0 | 21.8 | 18.4 | 10.7 | 13.4 | 20.7 |
| Household operation | 15.6 | 14.9 | 14.0 | 13.3 | 14.9 | 16.4 | 14.1 | 17.3 |
| Apparel | 7.6 | 7.9 | 8.6 | 10.7 | 9.8 | 10.1 | 10.9 | 8.8 |
| Transportation | 20.0 | 17.8 | 17.1 | 16.2 | 15.6 | 19.2 | 20.6 | 16.3 |
| Tobacco and alcohol | 4.0 | 4.4 | 4.0 | 3.3 | 3.5 | 4.3 | 4.6 | 5.0 |
| Other goods | 4.8 | 5.3 | 5.7 | 6.1 | 6.2 | 8.5 | 7.4 | 6.0 |
| Other services | 9.1 | 9.5 | 10.2 | 10.2 | 10.3 | 9.0 | 10.0 | 8.8 |
| All groups percent | 100.0 | 100.0 | 100.0 | 100.0 | 100.0 | 100.0 | 100.0 | 100.0 |
| All groups $ | 97.58 | 118.95 | 129.70 | 143.26 | 118.31 | 80.38 | 137.14 | 57.29 |
| Total households† | 833 | 514 | 726 | 549 | 261 | 133 | 188 | 604 |
| AVERAGE WEEKLY EXPENDITURE BY OCCUPATION GROUPS OF HEAD OF HOUSEHOLDS | ||||||||||
|---|---|---|---|---|---|---|---|---|---|---|
| Professional and Technical | Administrative and Managerial | Clerical | Sales Workers | Service Workers | Agricultural* | Production† | Workers Not Classified by Occupation | Members of Armed Forces | Not Actively Engaged | |
*Agriculture, animal husbandry and forestry workers, fishermen and hunters, †Production workers, transport equipment operators, and labourers. | ||||||||||
| Average Weekly Expenditure ($) | ||||||||||
| Food | 22.11 | 25.20 | 20.24 | 20.79 | 19.11 | 18.02 | 21.70 | 19.36 | 22.75 | 11.71 |
| Housing | 43.76 | 47.77 | 26.97 | 37.99 | 24.94 | 6.63 | 23.07 | 57.49 | 10.81 | 8.50 |
| Household operation | 20.71 | 20.53 | 16.52 | 18.06 | 15.72 | 16.70 | 15.65 | 13.34 | 22.45 | 11.07 |
| Apparel | 11.76 | 13.85 | 10.47 | 11.96 | 9.42 | 10.55 | 10.32 | 22.04 | 10.01 | 5.35 |
| Transportation | 25.35 | 24.76 | 22.79 | 18.11 | 15.87 | 23.20 | 19.88 | 14.11 | 14.49 | 10.64 |
| Tobacco and alcohol | 4.35 | 5.55 | 4.80 | 5.35 | 5.38 | 3.30 | 5.61 | 6.22 | 7.91 | 2.18 |
| Other goods | 9.02 | 8.90 | 6.78 | 6.69 | 5.76 | 7.05 | 6.21 | 12.25 | 9.21 | 3.32 |
| Other services | 14.70 | 18.96 | 10.77 | 12.02 | 9.16 | 14.30 | 9.65 | 6.79 | 12.86 | 4.66 |
| All groups | 151.74 | 165.52 | 119.33 | 130.96 | 105.34 | 100.05 | 112.08 | 151.60 | 110.50 | 57.43 |
| Total households | 511 | 205 | 303 | 236 | 128 | 477 | 1,163 | 8 | 21 | 755 |
| PERCENTAGE AVERAGE WEEKLY HOUSEHOLD EXPENDITURE BY TOTAL WEEKLY INCOME | ||||||||||||
|---|---|---|---|---|---|---|---|---|---|---|---|---|
| Expenditure Group | Total Weekly Income of Households ($) | All | ||||||||||
| Under 20 | 20-39 | 40-59 | 60-79 | 80-99 | 100-119 | 120-139 | 140-159 | 160-179 | 180-199 | 200 and Over | ||
| Percentage Weekly Expenditure | ||||||||||||
| Food | 18.0 | 24.2 | 22.4 | 21.1 | 19.1 | 19.4 | 18.0 | 18.0 | 16.2 | 15.5 | 14.8 | 17.6 |
| Housing | 24.0 | 10.5 | 14.6 | 14.1 | 21.3 | 21.9 | 23.3 | 20.2 | 26.2 | 23.0 | 22.4 | 21.5 |
| Household operation | 20.2 | 25.7 | 19.5 | 17.2 | 16.3 | 14.6 | 14.8 | 14.7 | 12.4 | 14.0 | 12.8 | 14.7 |
| Apparel | 20.8 | 10.5 | 9.4 | 9.3 | 8.6 | 8.2 | 8.6 | 8.8 | 8.2 | 9.7 | 9.6 | 9.0 |
| Transportation | 3.0 | 12.4 | 17.0 | 19.0 | 16.7 | 17.4 | 16.1 | 18.5 | 17.9 | 17.6 | 19.2 | 17.7 |
| Tobacco and alcohol | 2.9 | 2.9 | 3.6 | 4.5 | 4.4 | 4.3 | 3.9 | 4.1 | 4.1 | 3.7 | 3.9 | 4.0 |
| Other goods | 7.1 | 6.3 | 5.7 | 6.3 | 5.9 | 5.3 | 5.7 | 6.2 | 5.5 | 6.3 | 5.6 | 5.8 |
| Other services | 4.0 | 7.7 | 7.9 | 8.5 | 7.9 | 8.9 | 9.7 | 9.5 | 9.5 | 10.3 | 11.6 | 9.7 |
| All groups percent | 100.0 | 100.0 | 100.0 | 100.0 | 100.0 | 100.0 | 100.0 | 100.0 | 100.0 | 100.0 | 100.0 | 100.0 |
| All groups $ | 49.33 | 32.68 | 50.93 | 71.20 | 90.74 | 99.80 | 111.45 | 126.42 | 141.50 | 157.09 | 178.17 | 109.54 |
| Total households | 3 | 314 | 303 | 315 | 480 | 393 | 513 | 405 | 296 | 217 | 573 | 3,812 |
| PERCENTAGE OF AVERAGE WEEKLY HOUSEHOLD EXPENDITURE BY INCOME OF HOUSEHOLD | ||||||||||||
|---|---|---|---|---|---|---|---|---|---|---|---|---|
| Expenditure Group | Weekly Income of Head of Household ($) | All | ||||||||||
| Under 20 | 20-39 | 40-59 | 60-79 | 80-99 | 100-119 | 120-139 | 140-159 | 160-179 | 180-199 | 200 and Over | ||
| Percentage Weekly Expenditure | ||||||||||||
| Food | 17.3 | 22.6 | 20.3 | 18.8 | 18.2 | 17.5 | 17.2 | 14.6 | 14.9 | 12.3 | 13.4 | 17.6 |
| Housing | 13.1 | 11.2 | 13.0 | 19.6 | 22.9 | 24.2 | 19.2 | 27.0 | 26.4 | 35.5 | 22.6 | 21.5 |
| Household operation | 12.2 | 21.2 | 16.4 | 15.2 | 14.3 | 13.8 | 14.4 | 12.0 | 14.9 | 12.0 | 13.1 | 14.7 |
| Apparel | 9.5 | 10.1 | 10.5 | 9.3 | 8.9 | 8.1 | 9.6 | 7.9 | 8.3 | 6.7 | 9.6 | 9.0 |
| Transportation | 24.5 | 17.3 | 19.3 | 18.2 | 16.4 | 17.2 | 18.9 | 20.1 | 16.7 | 13.8 | 18.8 | 17.7 |
| Tobacco and alcohol | 5.7 | 3.8 | 4.6 | 4.6 | 4.5 | 3.8 | 4.3 | 3.4 | 2.9 | 2.6 | 3.0 | 4.0 |
| Other goods | 9.2 | 6.1 | 7.1 | 5.5 | 5.8 | 5.6 | 5.8 | 6.1 | 5.4 | 4.4 | 6.0 | 5.8 |
| Other services | 8.6 | 7.6 | 8.9 | 8.8 | 9.0 | 9.9 | 10.6 | 8.8 | 10.4 | 12.7 | 13.4 | 9.7 |
| All groups percent | 100.0 | 100.0 | 100.0 | 100.0 | 100.0 | 100.0 | 100.0 | 100.0 | 100.0 | 100.0 | 100.0 | 100.0 |
| All groups $ | 85.62 | 7 | 78.63 | 103.53 | 111.08 | 122.84 | 136.93 | 159.44 | 174.35 | 191.82 | 181.51 | 109.54 |
| Total households | 11 | 584 | 380 | 685 | 757 | 531 | 333 | 158 | 96 | 86 | 191 | 3,812 |
Expenditure is based on household income. In many cases there is more than one income earner. The head of the household is not necessarily the major income earner.
This year has seen the long-delayed publication of the Inter-Industry Study of the New Zealand Economy 1965-66. The term “Inter-Industry Study” refers to the whole task of investigation, compilation, and preliminary calculations as well as the volume of input-output tables and derived tables that forms the end-product.
Input-output analysis can no longer be called a new technique (it is almost 40 years since the first preliminary results were published) but it remains something of a mystery. This article is an attempt to answer for the student, the man in the street, and the company accountant or secretary dealing with requests for necessary information, two basic questions:
What is input-output analysis?
What use is it?
Input-Output analysis, one of the most important economic tools of today, was devised by a Harvard professor of economics, Wassily Leontief, in the nineteen thirties and first set out in his book The Structure of American Economy 1919-1939 in 1941. In his “Introduction”, Leontief described his book as “an attempt to apply the economic theory of general interdependence to an empirical study of interrelations among the different parts of a national economy” and went on “The ultimate aim of such study needs no special justification. Laymen and professional economists alike are all equally aware of the existence of some kind of interconnection between even the remotest parts of a national economy. The presence of these invisible but nevertheless very real ties can be observed whenever expanded automobile sales in New York City increase the demand for groceries in Detroit; it is dramatically demonstrated when the sudden shutdown of the Pennsylvania coal mines paralyses the textile mills in New England, and it reasserts itself with relentless regularity in alternative ups and downs of business cycles.”
The interdependence of the different parts of a national economy is a truism that had been amply demonstrated by the economic reverberations of depression and war. The new technique of input-output at analysis was designed to define and measure that interdependence down to the level of the individual industry. It provided a tool with which, for example, it was possible to measure the effects of a stated increase in the demand for houses on the timber industry, the cement industry, and the industries producing glass, steel, paint, bricks, tiles, concrete blocks, nails, plumbing requisites, and all the hundreds of other items that go into houses, as well as on the demand for imports.
An input-output study involves three distinct tasks. They are:
The systematic collection, evaluation, and arrangement of a vast body of statistical information on production and consumption covering, as far as possible, every facet of the economy. This is the basic data on which the worth of the whole study depends.
The formulation of an appropriate theoretical scheme.
The application of theoretical methods and devices to the analysis of empirical data.
In a sense, input-output analysis brings together those who in economic research have always tended to drift apart—the producers of elegant theories, and those engaged in empirical research and the accumulation of data. Input-output analysis gives scope to the theorist but at the same time keeps him anchored firmly to the basic data, to the figures of goods poured out by factories, transported by ships, trucks, and trains, and sold over shop counters.
WHAT IS AN INPUT-OUTPUT TABLE?—In the basic input-output table the entire economic activities of a country are divided into industry groups, which may number some hundreds. In New Zealand they range from 12 in the earlier studies to 109 in the 1959-60 and 1965-66 studies. A very great deal of investigation and research is necessary in order to discover what each industry consumes, both in the form of the products of other industries and in the form of primary inputs such as labour; and what it produces, what it supplies to other industries in the form of raw materials, components, and semi-finished products, and what it supplies to final consumers such as households.
Each industry appears twice in an input-output table—in a row as a producer and in a column as a consumer. The rows and columns intersect, so that what appears in a row as part of industry A's output sold to industry B can also be read down the industry B column as part of industry B's input purchased from industry A.
The following diagram shows the frame work of an input-output table. The industry entries are purely for illustrative purposes. An actual table showing inter-industry transactions in 1965-66 is given at the end of this article. The figures represent monetary values, e.g. millions of dollars.
| Intermediate Demand | Final Demand | ||||||||||||||||
|---|---|---|---|---|---|---|---|---|---|---|---|---|---|---|---|---|---|
| Output Rows (production) | Input Columns (consumption) | Industry I | Intermediate Demand (Total) | Household Consumption | Government Consumption | Gross Fixed Capital Formation | Stock Change | Exports | Final Demand | Total Demand = total Output | |||||||
| Industry A | Industry B | Industry C | Industry D | Industry E | Industry F | Industry G | Industry H | ||||||||||
| Quadrant No. 1 | Quadrant No. 2 | ||||||||||||||||
| Intermediate Input— | |||||||||||||||||
| Industry A | — | 5 | 25 | — | 5 | 6 | - | 2 | 12 | 55 | 40 | 5 | - | - | 5 | 50 | 105 |
| Industry B | 10 | - | 10 | — | - | 2 | 3 | - | 1 | 26 | 60 | 5 | 10 | — | 5 | 80 | 106 |
| Industry C | — | 20 | - | — | 3 | 2 | 4 | 2 | 5 | 36 | 10 | 5 | 25 | 10 | 10 | 60 | 96 |
| Industry D | 5 | 5 | 5 | 5 | 4 | 4 | 4 | - | 3 | 35 | 25 | - | - | 5 | 10 | 40 | 75 |
| Industry E | 1 | 3 | 5 | - | 6 | 3 | - | - | 2 | 20 | 15 | - | 6 | 2 | 7 | 30 | 50 |
| Industry F | 2 | 4 | 5 | — | — | — | — | 2 | 1 | 14 | 10 | - | 8 | — | 2 | 20 | 34 |
| Industry G | 2 | — | — | — | 3 | — | 4 | 3 | 1 | 13 | 12 | 1 | 5 | 1 | — | 19 | 32 |
| Industry H | — | 3 | — | 2 | 1 | 1 | 4 | 1 | — | 12 | 8 | - | - | 1 | — | 9 | 21 |
| Industry I | — | 2 | — | 8 | — | 1 | — | 3 | — | 14 | 11 | 2 | 3 | 2 | 4 | 22 | 36 |
| Total | 20 | 42 | 50 | 15 | 22 | 19 | 19 | 13 | 25 | 225 | 191 | 18 | 57 | 21 | 43 | 330 | 555 |
| Quadrant No. 3 | Quadrant No. 4 | ||||||||||||||||
| Primary Input— | |||||||||||||||||
| Salaries and wages | 42 | 34 | 20 | 28 | 10 | 8 | 6 | 3 | 4 | 155 | 155 | ||||||
| Other value added | 25 | 20 | 10 | 12 | 8 | 4 | 5 | 5 | 4 | 93 | 93 | ||||||
| Imports | 8 | 10 | 6 | 10 | 5 | 3 | - | - | 1 | 43 | 43 | ||||||
| Indirect tax | 8 | - | - | - | - | - | - | - | - | 8 | 8 | ||||||
| Subsidies | - | - | - | - | - | - | - | - | - | - | - | ||||||
| Depreciation | 2 | - | 10 | 10 | 5 | - | 2 | - | 2 | 31 | 31 | ||||||
| Sales by final consumers | - | - | - | - | - | - | - | - | - | - | - | ||||||
| Total | 85 | 64 | 46 | 60 | 28 | 15 | 13 | 8 | 11 | 330 | 330 | ||||||
| Total Inputs | 105 | 106 | 96 | 75 | 50 | 34 | 32 | 21 | 36 | 555 | 191 | 18 | 57 | 21 | 43 | 330 | 885 |
Input-output tables can be set out in various ways, but a common practice is to set them out in four (or sometimes three) rectangles or “quadrants”, as in the diagram.
Quadrant No. 1: Intermediate Production and Consumption—The first quadrant shows inter-industry transactions, with intersecting columns and rows for all the industries into which the economy has been divided. This is normally by far the largest of the four quadrants. In the two latest New Zealand studies it contains 109 industries.
Looking along the industry A row we can read off what part of its output (production) goes to each other industry to be consumed in producing that industry's output, and looking down the industry A column we can read off what part of its input (consumption) is derived from each other industry. The whole quadrant records intermediate production and consumption—in other words, that part of each industry's production which is sold to other industries, and that part of its consumption which comes from other industries.
Quadrant No. 2: Final Use of Production—In the case of most industries, part of the output goes to other industries, and part goes directly to final consumers such as households. It is the final consumers who are shown in the columns in the second quadrant.
Continuing along industry A row through quadrant 1 into quadrant 2 we can read off what part of its production goes to each final consumer—households, government, capital formation such as buildings or major plant or equipment, stock change, or as exports.
The final column in the table totals intermediate demand and final demand to give total demand which by definition equals total output.
Quadrant No. 3: Primary Inputs to Production—The industry columns run downwards through quadrants 1 and 3 to record the complete inputs (consumption items and costs) of each industry. Inputs (that is, goods or services) obtained from other industries are included in quadrant 1. Continuing down the column into quadrant 2, we can read off the primary inputs such as labour and “other value added” (principally profits). The quadrant also includes other categories of costs, such as imports, indirect tax, depreciation, and sales by final consumers. Subsidies are a special case. They are treated as negative primary inputs, reducing by a like amount the costs of production and the price of the subsidised product.
Quadrant No. 4: Primary Inputs to Final Demand—This quadrant, which is eliminated in the transactions tables of some countries, records the direct use of primary inputs by the categories of final demand.
This, then, is a brief description of the basic input-output table. A far fuller description, including descriptions of both the industries and the non-industrial categories, is contained in the volume Inter-Industry Study of the New Zealand Economy 1965-66 Pt 1 A Description of the Input-Output Tables and System.
Before we pass to the tables derived from the basic input-output table, one or two points concerning the New Zealand Studies should be mentioned:
Commodity Transactions the Guide to Inter-Industry Flows—The input-output table shows transactions between industries, i.e., the total value of all the goods and services industry A supplies to industry B and vice versa. In order to achieve a reasonable degree of accuracy it is necessary at the investigation and data-collection stage to break down the input and output of each industry into actual goods and services. In all, in the basic worksheets referring to the 1965-66 study, about 700 types of goods and 100 types of services were coded. For each of the range of commodities (the term “commodity” in international usage covers goods and services) the production was reconciled with the consumption. When, finally, all the commodity flows had been reconciled so that total outputs and total inputs of the entire economy were in balance, then for each “transaction point”—that is, for each intersection of an industry row column—the values of various commodities were summed up to give the total inter-industry transaction.
Common Valuation of Transactions—In order that, in the inter-industry quadrant, a single figure could be shown at each intersection to represent a sale by one industry and a purchase by another, a common valuation had to be used. Obviously, in actual fact, industry B does not purchase the product of industry A at the price industry A receives for it. There is normally a considerable margin between the two, representing the costs of merchandising, middle men's profits, distribution, advertising, insurance, and so forth. However, for the New Zealand tables in common with the tables of many other countries, the common valuation of all commodities was taken to be the producers value at the factory door, farm gate, or similar industrial establishment boundary. The margin between the producers value, i.e., what the producer received, and what the purchaser paid was considered to be made up of purchases of services from other industries—wholesale and retail trade, transport, and so forth—and is entered accordingly in the input-output table as output of those industries.
Dating of Input-Output Statistics—The publication of the 1965-66 inter-industry study has been abnormally delayed owing to E.D.P. troubles, but, in any case, it is a common criticism of inter-industry studies (and not only in New Zealand!) that they are invariably years out of date and therefore stale and of historical interest only. A considerable delay is inevitable with a full-scale study (there are methods of updating existing studies) because of the enormous amount of preparatory investigation necessary and the fact that sometimes the detailed information required for input-output purposes is not available until a considerable time after the close of the year or other period that is the subject of the study.
However, the essential value of input-output tables lies not so much in the actual transactions portrayed as in the structural relationships revealed. These relationships are, of course, subject to technological changes and other developments, but it has been found by experience that in developed countries they remain reasonably stable for periods of several years. It is in the application of these structural relationships and characteristics to current economic questions and forecasting that the value of input-output analysis lies.
DERIVED TABLES—If the straightforward monetary transactions table described previously is subjected to a mathematical process, known as inversion of the matrix, a derived table or model is produced. This derived table will show on a unit basis (that is per $ or per $ million, etc.) what will be required in additional output from every industry in the economy to support an increase of one unit in the final output of a selected industry. Such an account is often known as a table of total requirements (direct and indirect) per unit of final demand. The words “direct and indirect” are used to indicate that the table includes not only the direct requirements of the selected industry, but also the additional requirements of industries supplying that industry with raw materials, components, and services, and the additional requirements of industries supplying those industries, and so on through an ever-widening circle of the economy until the economic reverberations die away.
The use of one of these tables is shown in the following diagram (which is purely illustrative).
| REQUIREMENTS (DIRECT AND INDIRECT) PER UNIT OF FINAL DEMAND | |||||||
|---|---|---|---|---|---|---|---|
| Industry A | Industry B | Industry C | Industry D | Industry E | Industry F | Industry G | |
| Industry A | 1.001 | .010 | .001 | - | .001 | .001 | - |
| Industry B | — | 1.010 | .012 | - | .001 | .002 | - |
| Industry C | — | — | 1.005 | 0.002 | .005 | .004 | - |
| Industry D | .001 | — | — | 1.012 | — | — | — |
| Industry E | .001 | .001 | — | 0.002 | 1.007 | — | .011 |
| Industry F | — | .016 | — | — | — | 1.011 | — |
| Industry G | .018 | .001 | .006 | — | .012 | — | 1.008 |
The figures in industry column B represent the outputs which each of the industries named at the beginning of the rows would have to produce so that industry B could produce one unit of output. Thus, if the final demand for the products of industry B increased by $1 million, then (reading down the industry B column)—
| $ | |
|---|---|
| Industry A would have to increase its output by | 10,000 |
| Industry B would have to increase its output by | 1,010,000 |
| Industry E would have to increase its output by | 1,000 |
| Industry F would have to increase its output by | 16,000 |
| Industry G would have to increase its output by | 1,000 |
It will be noted that, in order to meet an increase of $1 million in final demand for its products, industry B has to increase its output by more than $1 million. This is because, in addition to supplying $1 million direct to final demand, it has to supply extra amounts of output to other industries to assist them in their task of enabling industry B to increase its output by this $1 million.
A list of the direct and derived tables in part 2 of the Inter-Industry Study of the New Zealand Economy 1965-66, shown below, gives some indication of the range of information obtainable from input-output analysis of an economy. It will be noted that, in some tables, the 109 industry groups in the full study have been aggregated into 44 industry groups. Further aggregations into smaller numbers of groups are possible. For example, in the table of inter-industry transactions 1965-66 at the end of this article, the 109 industry groups in the full study have been aggregated to 21 industry groups.
| For 109 Industries— |
| Inter-industry transactions 1965-66. |
| Gross fixed capital formation—inter-industry transactions 1965-66. |
| Total requirements (direct and indirect) per unit of final demand. |
| Cumulated primary input coefficients. |
| Cumulated primary input coefficients for capital formation by industries. |
| Direct primary input coefficients for capital formation by industries. |
| For 44 Industries— |
| Inter-industry transactions 1965-66. |
| Gross fixed capital formation—inter-industry transactions 1965-66. |
| Total requirements (direct and indirect) per unit of final demand. |
| Cumulated primary input coefficients. |
| Cumulated primary input coefficients for capital formation by industries. |
| Direct primary input coefficients for capital formation by industries. |
| Net outputs of industries in 44 groups. |
| Ultimate disposition of the output of 44 industries. |
| Ultimate disposition of the output of 44 industries—proportions used by final demand |
| categories. Composition of categories of final demand in terms of net output of 44 industries. |
| The interdependence of industries. |
| Tables Derivable from 109 and 44 Industry Transaction Tables— |
| Cumulated primary input coefficients for categories of final demand. Cumulated final demand coefficients for categories of primary inputs. |
| Imports Matrices— |
| Imports used by industries and final demand categories 1965-66. |
| Imports (including capital imports) used by industries and final demand categories (excluding capital formation) 1965-66. |
One of the most widely used of the derived tables is that showing the values of various categories of primary inputs (wages, imports, depreciation, etc.) absorbed directly or indirectly in producing each unit of an industry's output to meet final demand.
A simplified version of this table (which, in the 1965-66 study, is headed Cumulated Primary Input-Coefficients) is shown below:
| — | Industry A | Industry B | Industry C | Industry D |
|---|---|---|---|---|
| Salary and wages | .455 | .550 | .426 | .554 |
| Other value added | .227 | .309 | .234 | .223 |
| Imports | .221 | .036 | .255 | .159 |
| Indirect tax. | .042 | .044 | .031 | .012 |
| Subsidies | .001 | - | .001 | - |
| Depreciation | .056 | .061 | .055 | .052 |
From this, the use of the table can be demonstrated. If we assume, for example, that an increase of $1 million in output is required from industry B, then—
Salary and wage payments would rise by 5550,000.
Other value added (profits, payments to self-employed) would rise by $309,000.
Imports would rise by $36,000.
Indirect tax would rise by $44,000.
Depreciation would rise by $61,000.
These are direct and indirect effects, not primary inputs into just industry B. For example, while the bulk of the additional salary and wage payments would be in industry B, there would be smaller additional payments in industries supplying industry B with raw materials, components, and services, and in industries supplying those industries, and so forth. The demand for $1 million additional output from industry B would have an effect like a stone thrown in a pond; the ripples would spread with diminishing force from industry B to other parts of the economy.
In other tables the capital outlay of each industry and of the economy as a whole is analysed similarly to the current input and output, and others contain detailed analyses of the demand for imports or measure the interdependence of industries.
A table of inter-industry transactions 1965-66, aggregated to 21 industry groups, is given as an appendix to this article.
Summing Up—Almost every developed country now produces regular inter-industry studies, some on an internationally-comparable basis, and the development of input-output analysis is continuing on a world-wide basis.
To sum up, some uses of input-output analysis are given below:
By providing an interlocking model of an economy as a whole, an inter-industry study enables economic planners to take a broad view, lessening the risks that important aspects will be overlooked or that sectional interests will receive undue attention:
By enabling the probable effects of major rises or falls in demand in one industry, say building, to be traced through the economy, an inter-industry study enables planners to foresee bottlenecks in supplies or unexpected side-effects:
Input-output analysis enables the probable effects of Governmental measures affecting wages, prices, imports, etc., to be estimated more accurately than is otherwise possible:
By providing a measure of each industry's requirements (direct and indirect) of primary inputs, such as labour and imported goods and materials, input-output analysis enables more accurate estimates to be made of the effects of import cuts or wage rises on particular industries:
Input-output analysis provides a measure of each industry's relative demands for imports and production of exports, demonstrating which industries are the best net earners of overseas exchange:
Effects on the economy as a whole of major capital projects can be estimated more accurately by the aid of input-output analysis.
Input-output analysis has changed the concept of the inter-dependence of industry from an economic truism accepted because it was demonstrably true to something capable of being measured and evaluated. Nevertheless, while input-output analysis is an important aid to economists and planners, economics can never be an exact science in the sense in which, for example, physics, chemistry, and mathematics are exact sciences. Results can never be accurately predicted in the way that the results of adding a measure of one chemical to a measure of another can be predicted. In all sciences that deal with the effects of human decision-making and human behaviour, there are too many unpredictables and imponderables. Economics is a science of the market-place; the operation of economic forces is exposed to every economic, social, and political wind that blows.
Main Sources: Inter-Industry Study of the New Zealand Economy 1965-66: Pt. 1 A Description of the Input-Output Tables and System.
Pt.2 Input-Output Transactions and Derived Tables.
| APPENDIX: INTER-INDUSTRY TRANSACTIONS, 1965-66 In $ (million) at Producers Prices | |||||||||||||
|---|---|---|---|---|---|---|---|---|---|---|---|---|---|
| For the disposition of output of an industry read the row for that Industry. For the origin of input into an industry, read the column for that industry | Farming and Hunting | Pastoral Products Processing | Non-Pastoral Farm Products Processing | Fuel Production | Other Mining and Quarrying | Fishing | Fishery Products Processing | Forestry and Logging | Forestry Products Processing | Other Manufacturing | Mineral Products Processing | Fuel Products Processing | |
| Too small to be expressed; less than 0.05. - Nil. | |||||||||||||
| No. | 1 | 2 | 3 | 4 | 5 | 6 | 7 | 8 | 9 | 10 | 11 | 12 | |
| 1 Farming and Hunting | 216.3 | 469.4 | 18.4 | - | - | - | - | - | 0.3 | - | 16.2 | - | |
| 2 Pastoral products processing | 2.6 | 32.4 | 2.5 | - | - | - | - | - | 0.5 | 10.9 | - | ||
| 3 Non-pastoral farm products processing | 12.2 | 0.3 | 2.3 | - | - | - | - | - | 0.1 | 7.0 | - | - | |
| 4 Fuel production | 0.1 | 2.3 | 0.1 | 0.1 | - | 0.2 | - | 0.1 | 0.6 | 0.8 | 1.6 | 0.2 | |
| 5 Other mining and quarrying | 0.6 | 0.2 | - | - | 0.1 | - | - | 0.1 | 0.1 | 4.4 | 1.0 | - | |
| 6 Fishing | - | - | 0.3 | - | - | - | 0.7 | - | - | - | - | - | |
| 7 Fishery products processing | - | - | - | - | - | - | - | - | - | - | - | - | |
| 8 Forestry and logging | - | 0.1 | - | - | - | - | - | 4.3 | 26.6 | - | - | - | |
| 9 Forest products processing | 5.4 | 2.3 | 0.2 | 0.1 | 0.1 | - | - | 0.1 | 40.0 | 43.4 | 0.6 | 0.1 | |
| 10 Other manufacturing | 66.5 | 13.9 | 8.6 | 0.5 | 1.9 | 1.2 | 0.1 | 1.5 | 7.3 | 187.8 | 4.2 | 1.8 | |
| 11 Mineral products processing | 3.7 | 0.9 | 0.8 | - | 0.1 | - | - | - | 0.7 | 31.9 | 3.2 | - | |
| 12 Fuel products processing | 8.8 | 1.2 | 0.3 | 0.1 | 0.5 | 0.2 | - | 0.4 | 0.7 | 3.9 | 0.7 | - | |
| 13 Transportation | 28.1 | 11.3 | 5.6 | 1.2 | 3.2 | 0.3 | 0.2 | 3.3 | 7.3 | 42.2 | 2.8 | 0.6 | |
| 14 Wholesale and retail trade | 52.4 | 16.4 | 6.1 | 0.2 | 1.0 | 0.3 | 0.1 | 1.3 | 9.8 | 95.4 | 5.6 | 1.4 | |
| 15 Fuel and power generation and distribution | 7.9 | 3.5 | 0.7 | 0.3 | - | - | - | 0.2 | 5.3 | 10.8 | 2.2 | 0.3 | |
| 16 Building and construction | 5.8 | 1.5 | 0.2 | 2.0 | 2.2 | - | - | 0.9 | 1.1 | 4.3 | 0.4 | 0.1 | |
| 17 Banking and insurance | 4.4 | 1.1 | 0.3 | 0.2 | 1.0 | 0.2 | - | 0.3 | 1.3 | 8.5 | 0.5 | 0.1 | |
| 18 Ownership of property | - | 1.1 | 0.5 | - | 0.3 | - | 2.1 | 0.9 | 13.3 | 0.3 | - | ||
| 19 Service to households | - | - | - | - | - | - | - | - | - | - | - | - | |
| 20 Services to Government | - | - | - | - | - | - | - | - | - | - | - | - | |
| 21 Other service activities | 28.6 | 4.6 | 1.3 | 0.2 | 0.9 | 0.2 | - | 1.1 | 2.6 | 25.0 | 0.9 | 0.4 | |
| 22 Intermediate Inputs, totals | 443.4 | 562.5 | 48.1 | 4.7 | 11.3 | 2.7 | 1.1 | 15.9 | 104.8 | 505.8 | 24.1 | 4.9 | |
| 23 Salary and wages | 105.9 | 75.3 | 10.1 | 8.4 | 9.2 | 2.7 | 0.3 | 17.0 | 43.9 | 332.7 | 17.8 | 1.3 | |
| 24 Other value added | 398.4 | 28.8 | 7.0 | 0.5 | 2.9 | 1.0 | - | 3.3 | 28.1 | 169.5 | 11.5 | 6.2 | |
| 25 Imports | 25.7 | 8.8 | 9.1 | 0.5 | 2.3 | 0.3 | - | 1.6 | 13.6 | 311.5 | 14.0 | 38.7 | |
| 26 Indirect tax | 22.8 | 1.2 | 0.3 | 0.2 | 1.2 | 0.1 | - | 0.7 | 0.9 | 104.7 | 0.4 | 0.5 | |
| —1.9 | —22.7 | —11.8 | - | - | - | - | - | —1.4 | - | - | - | ||
| 28 Depreciation | 55.4 | 11.2 | 2.4 | 1.2 | 3.2 | 1.3 | - | 2.1 | 9.9 | 43.5 | 5.4 | 2.6 | |
| 29 Sales by final consumers | 0.2 | 1.2 | 0.1 | - | 0.1 | - | - | 0.1 | 0.7 | 1.2 | 2.6 | - | |
| 30 Primary inputs, totals | 606.5 | 103.9 | 17.3 | 10.9 | 18.8 | 5.5 | 0.4 | 24.7 | 97.1 | 961.7 | 51.7 | 49.2 | |
| 31 Totals | 1,049.9 | 666.4 | 65.4 | 15.6 | 30.1 | 8.1 | 1.5 | 40.5 | 201.9 | 1.467.5 | 75.8 | 54.0 | |
| APPENDIX: INTER-INDUSTRY TRANSACTIONS, 1965-66 In $(million) at Producers Prices | ||||||||||||||||
|---|---|---|---|---|---|---|---|---|---|---|---|---|---|---|---|---|
| Transportation | Wholesale and Retail Trade | Fuel and Power Generation and Distribution | Building and Construction | Banking and Insurance | Ownership of Property | Services to Households | Services to Government | Other Service Activities | Intermediate Outputs, Totals | Consumption expenditure by Persons and Non-Profit Organisations | Government Consumption Expenditure | Gross Fixed Capital Formation | Stock Change | Exports | Final Demand, Totals | Totals |
| 13 | 14 | 15 | 16 | 17 | 18 | 19 | 20 | 21 | 22 | 23 | 24 | 25 | 26 | 27 | 28 | 29 |
| 0.3 | 0.2 | - | 0.4 | - | 0.2 | - | - | 4.3 | 726.0 | 69.5 | 4.9 | 7.4 | 26.9 | 215.2 | 323.9 | 1,049.9 |
| 0.4 | 3.6 | - | 0.2 | - | - | - | - | 18.8 | 72.1 | 163.3 | 5.2 | - | 2.9 | 422.9 | 594.3 | 666.4 |
| 0.1 | 0.3 | - | - | - | - | - | - | 2.4 | 24.8 | 35.6 | 0.8 | - | 0.8 | 3.5 | 40.6 | 65.4 |
| 0.7 | - | 4.0 | - | - | 0.1 | - | - | 0.5 | 11.3 | 2.9 | 1.3 | - | 0.1 | - | 4.3 | 15.6 |
| 0.2 | - | - | 22.0 | - | 0.1 | - | - | 0.1 | 28.9 | 0.7 | 0.3 | 0.4 | —0.2 | - | 1.3 | 30.1 |
| - | - | - | - | - | - | - | - | 1.0 | 2.1 | 1.9 | 0.2 | - | - | 3.9 | 6.0 | 8.1 |
| - | - | - | - | - | - | - | - | 0.3 | 0.4 | 1.1 | - | - | - | 0.1 | 1.2 | 1.5 |
| - | - | - | - | - | - | - | - | - | 31.1 | 0.5 | 5.3 | 0.2 | - | 3.6 | 9.5 | 40.5 |
| 2.1 | 5.8 | 0.1 | 60.8 | 0.2 | 3.0 | - | - | 1.3 | 165.5 | 3.4 | 1.2 | 12.6 | 1.4 | 17.9 | 36.4 | 201.9 |
| 34.0 | 50.1 | 2.51 | 37.2 | 4.8 | 5.9 | - | - | 30.8 | 560.5 | 621.8 | 24.1 | 169.1 | 74.7 | 17.2 | 907.0 | 1,467.5 |
| 0.2 | 0.3 | 0.1 | 18.2 | - | 0.4 | - | - | 0.6 | 61.1 | 4.0 | 0.4 | 6.6 | 2.7 | 1.0 | 14.7 | 75.8 |
| 7.6 | 3.1 | 0.5 | 2.2 | 0.2 | 0.1 | - | - | 1.1 | 31.4 | 16.8 | 0.9 | 0,3 | 0.4 | 4.3 | 22.0 | 54.0 |
| 29.5 | 24.6 | 1.4 | 24.6 | 1.4 | 0.8 | - | - | 13.0 | 201.4 | 81.3 | 15.9 | 19.7 | 2.9 | 55.1 | 174.8 | 376.2 |
| 12.3 | 24.2 | 2.4 | 55.1 | 1.6 | 3.8 | - | - | 14.1 | 303.4 | 546.9 | 11.9 | 56.9 | 17.3 | 51.4 | 684.3 | 987.7 |
| 2.4 | 7.4 | 61.4 | 1.2 | 0.7 | 1.0 | - | - | 6.0 | 111.3 | 52.4 | 3.9 | 0.1 | - | 0.1 | 56.5 | 167.8 |
| 2.0 | 5.2 | 0.713 | 3.3 | 1.1 | 24.1 | - | - | 5.2 | 190.0 | 2.1 | 56.5 | 545.3 | - | 0.1 | 603.9 | 793.9 |
| 2.8 | 8.9 | 0.5 | 2.4 | 17.0 | 6.8 | - | - | 2.9 | 59.1 | 44.6 | 5.2 | 0.2 | - | 11.6 | 61.6 | 120.7 |
| 2.3 | 42.0 | 0.1 | 2.2 | 3.4 | 2.0 | - | - | 14.9 | 85.3 | 288.6 | 3.2 | - | - | 0.4 | 292.3 | 377.6 |
| - | - | - | - | - | - | - | - | - | - | 30.2 | - | - | - | - | 30.2 | 30.2 |
| - | - | - | - | - | - | - | - | - | - | - | 284.0 | - | - | - | 284.0 | 284.0 |
| 19.7 | 54.9 | 1.7 | 12.1 | 9.2 | 5.8 | - | - | 37.1 | 206.1 | 252.3 | 42.9 | 8.5 | 0.2 | 12.4 | 316.2 | 522.3 |
| 116.7 | 230.5 | 75.347 | 1.9 | 39.7 | 54.1 | - | - | 154.3 | 2,871.7 | 2,219.8 | 467.7 | 827.3 | 130.0 | 820.7 | 4,465.5 | 7,337.2 |
| 156.0 | 344.2 | 21.418 | 6.9 | 67.4 | 5.1 | 30.2 | 284.0 | 199.7 | 1,919.2 | - | - | - | - | 3.0 | 3.0 | 1,922.2 |
| 44.6 | 273.2 | 56.0 | 66.2 | 1.4 | 222.9 | - | - | 115.4 | 1,437.1 | - | 15.3 | - | - | - | 15.3 | 1,452,4 |
| 13.1 | 20.3 | 1.5 | 42.9 | 5.7 | 1.5 | - | - | 19.0 | 529.9 | 212.8 | 45.5 | 132.8 | 13.0 | 9.9 | 414.0 | 944.0 |
| 15.6 | 76.8 | 0.6 | 6.7 | 1.8 | 30.3 | - | - | 6.5 | 271.4 | 76.9 | 2.5 | 9.6 | 1.1 | 1.0 | 91.1 | 362.4 |
| —1.1 | - | —1.2 | - | —1.7 | - | - | - | - | —41.8 | —0.1 | - | — | —0.1 | — | —0.1 | —41.9 |
| 30.9 | 41.7 | 14.0 | 19.1 | 5.1 | 63.7 | - | - | 26.2 | 338.9 | - | - | - | - | 0.6 | 0.6 | 339.5 |
| 0.3 | 0.9 | 0.2 | 0.3 | 1.4 | - | - | - | 1.2 | 10.8 | 8.6 | —22.8 | 0.2 | - | 3.2 | —10.8 | - |
| 259.4 | 757.2 | 92.53 | 22.0 | 81.0 | 323.6 | 30.2 | 284.0 | 368.0 | 4,465.5 | 298.2 | 40.5 | 142.6 | 14.2 | 17.7 | 513.1 | 4,978.6 |
| 376.2 | 987.71 | 67.87 | 93.9 | 120.7 | 377.6 | 30.2 | 284.0 | 522.3 | 7,337.2 | 2,518.1 | 508.2 | 969.8 | 144.2 | 838.3 | 4,978.6 | 12,315.8 |
| PUBLICATIONS OF THE NEW ZEALAND DEPARTMENT OF STATISTICS | ||
|---|---|---|
| Obtainable from the Government Bookshop, Mulgrave Street (Private Bag), Wellington; Cubacade, Wellington; State Advances Building, Rutland Street (P.O. Box 5344), Auckland; 130 Oxford Terrace (P.O. Box 1721), Christchurch; T. & G. Building (P.O. Box 1104), Dunedin; and Barton Street (P.O. Box 857), Hamilton | ||
| Title | Latest No. | Date of Issue |
| *Agricultural statistics for 1972-73 are available from the Department of Statistics in bulletin form pending the issue of an annual volume. Statistics for 1973-74 are now being issued (see page 1063). | ||
| Annual Report of the Government Statistician (G. 28) | 1,975 | June 1975 |
| New Zealand Official Yearbook | 1,975 | October 1975 |
| New Zealand Pocket Digest of Statistics | 1,975 | July 1975 |
| Maps of Statistical Boundaries | 1,971 | March 1972 |
| Catalogue of New Zealand Statistics | 1,972 | February 1973 |
| Monthly Abstract of Statistics | 1,975 | Monthly |
| Annual Statistical Reports: | ||
| Agricultural Statistics* | 1971-72 | June 1975 |
| Balance of Payments | 1973-74 | July 1975 |
| Building Statistics | 1972-73 | June 1975 |
| Incomes and Income Tax to 1971-72 | February 1975 | |
| Industrial Injuries | 1,970 | September 1974 |
| Industrial Production | 1971-72 | October 1974 |
| Insurance | 1972-73 | November 1974 |
| Justice | 1,972 | December 1974 |
| Local Authority Statistics | 1972-73 | October 1975 |
| National Income and Expenditure | 1973-74 | October 1975 |
| Population and Migration | 1971-72 | November 1974 |
| Prices, Wages, and Labour | 1,973 | June 1975 |
| Transport | 1,973 | October 1975 |
| Vital Statistics | 1,972 | October 1974 |
| Trade Publications: | ||
| Exports Final Statistics | Jan-Jun 1972 | March 1975 |
| External Trade, Country Analyses | 1973-74 | June 1975 |
| External Trade, Report and Analysis of | 1970-71 | March 1974 |
| Imports (pt. A) Commodity by Country | Jan-June 1972 | June 1975 |
| Imports (pt. B) Country by Commodity | Jan-June 1972 | June 1975 |
| Inter-industry Study of the New Zealand Economy: | ||
| Parts 1 and 2 | 1965-66 | May 1975 |
| Population and Demographic Projections: | ||
| Population Projections | 1971-2001 | July 1973 |
| Labour Force Projections | 1971-2001 | August 1974 |
| Title | Latest No. | Date of Issue |
|---|---|---|
| *Results of the 1973 Census are available in bulletin form from the Department of Statistics. | ||
| Population Census: | ||
| Vol. 1. Increase and Location of Population | 1,971 | October 1972 |
| Vol. 2. Ages and Marital Status | 1,971 | November 1974 |
| Vol. 3. Religious Professions | 1,971 | November 1974 |
| Vol. 4. Industries and Occupations | 1,971 | April 1975 |
| Vol. 5. Incomes | 1,971 | May 1975 |
| Vol. 6. Birthplaces and Ethnic Groups | 1,971 | August 1975 |
| Vol. 7. Education | 1,971 | September 1975 |
| Vol. 8. Maori Population and Dwellings | 1,966 | March 1970 |
| Vol. 9A. Dwellings | 1,966 | April 1970 |
| Vol. 9B. Households | 1,966 | February 1971 |
| Vol. 10. General Report (Including Details of War Service, Dependent Children, and Usual Place of Residence) | 1,966 | April 1971 |
| Territorial Area Supplements | 1,971 | 1973-74 |
| N.Z. Summary Results | ||
| No. 1, Northland Statistical Area | ||
| No. 2, Central Auckland Statistical Area | ||
| No. 2A, Auckland Urban Areas | ||
| No. 3, South Auckland-Bay of Plenty Statistical Area | ||
| No. 4, East Coast and Hawke's Bay Statistical Areas | ||
| No. 5, Taranaki Statistical Area | ||
| No. 6, Wellington Statistical Area and Urban Areas | ||
| No. 7, Marlborough, Nelson and Westland Statistical Areas | ||
| No. 8, Canterbury Statistical Area | ||
| No. 9, Otago and Southland Statistical Areas | ||
| Consumers' Price Index | 1,965 | September 1966 |
| Census of Building and Construction | 1968-69 | July 1971 |
| Census of Distribution | 1968* | July 1970 |
| Census of Libraries | 1,969 | November 1971 |
| Life Annuity Tables | 1970-72 | November 1975 |
| SUPPLEMENTS TO MONTHLY ABSTRACT OF STATISTICS | ||
|---|---|---|
| Title | Latest No. | Date of Issue |
| Industry Supplements—Supplements on over 100 manufacturing industries are published in the Monthly Abstract as they become available. This means that statistics of most individual industries for 1973-74 were published before the general summary covering all industries could be completed | ||
| Population and Households— | ||
| Population at 31 March 1975 | 1,975 | September 1975 |
| Household Sample survey | 1973-74 | May 1975 |
| Weekly Spending of Households | 1973-74 | July 1975 |
| Production— | ||
| Indexes of Production and Productivity | 1972-73 | Jan-Feb 1974 |
| Food Balance Sheet | 1973-74 | November 1975 |
| Census of Mining, Quarrying, and Prospecting | 1968-69 | January 1971 |
| Gas Industry | 1973-74 | June 1975 |
| Trade— | ||
| External Trade (monthly cumulative) | Monthly | |
| Exports and Imports by Air | Jul-Dec 1974 | July 1975 |
| Price, Volume, and Terms of Trade Indexes for External Trade | May 1972 | |
| Manufacturers Stocks | Quarterly | |
| Prices— | ||
| Sheep Farming Costs Price Index | September 1973 | |
| Dairy Farming Costs Price Index | October 1973 | |
| All Farming Costs Price Index | March 1974 | |
| Revised Consumers Price Index | 1,974 | April 1975 |
| Farming Capital Expenditure Price Index | July 1975 | |
| Incomes— | ||
| Income Trends | 1,974 | Jan-Feb 1975 |
| Incomes of Self-Employed Persons | 1969-73 | June 1974 |
| Gross Farming Income and Volume of Farm Production | 1972-73 | Jan-Feb 1974 |
| Incomes Surveys— | ||
| Commercial Gardeners | 1973-74 | September 1975 |
| Dairy Farmers | 1972-73 | November 1974 |
| Orchardists | 1972-73 | September 1974 |
| Sheep Farmers | 1972-73 | Jan-Feb 1975 |
| Tobacco Growers | 1972-73 | September 1974 |
| Town Milk Producers | 1972-73 | November 1974 |
| Industrial Classification of Salary and Wage Payments | 1972-74 | August 1975 |
| National Accounts— | ||
| National Income and Expenditure | 1973-74 | March 1975 |
| Balance of Payments | 1973-74 | December 1974 |
| Real Gross Domestic Product | 1973-74 | September 1975 |
| Banking and Finance— | ||
| Companies with Overseas Affiliations | 1970-71 | March 1975 |
| Land Transfers | 1973-74 | August 1974 |
| Mortgages | 1973-74 | Jan-Feb 1974 |
| Miscellaneous— | ||
| Industrial Injuries | 1,971 | March 1975 |
| Cinematograph Theatres | 1972-73 | September 1974 |
| Manufacturing— | ||
| Factory Production, Genera Summary | 1973-74 | October 1975 |
| Factory Production, Regional Statistics | 1973-74 | October 1975 |
The results of the 1973-74 farming survey are being issued in a series of 6 bulletins which will eventually be combined and published as a complete volume. These may be ordered from the Department of Statistics, Private Bag, Wellington.
Provisional results of the comprehensive Census of Distribution 1972-73 have been issued in a series of bulletins. At the time of going to press the following have been issued. Inquiries concerning these should be addressed to the Department of Statistics. Private Bag, Wellington.
Bulletin 1—Selected National Aggregates
Bulletin 2—Further Selected National Aggregates and Aggregates for Main Regional Areas
Bulletin 3—Selected Details for Retail Stores Classified Within Turnover Size Groups
Bulletin 4—Selected Details for Retail Stores Classified Within Store Types
Bulletin 5—Retail Stores: Store Type by Paid Employee Size Group
Bulletin 6—Retail Stores: Store Type Group by Turnover Size Group
Bulletin 7—Retail Stores: Shopping Malls and Self-service Stores
Bulletin 8—Retail Stores: Commodities Sold
Bulletin 9—Retail Stores: Floor Space, Hours of Trading, and Weekly Turnover
Bulletin 10—Retail Stores: Miscellaneous Tables
Other bulletins containing regional data are to follow
Table of Contents
Later statistical information has become available during the course of printing the Yearbook. Some of these statistics are entered in the Statistical Summary (pp. 982 to 1010). Other information is given in the following pages with references to appropriate sections of the Yearbook. Readers are referred to the Monthly Abstract of Statistics for the most recent information on many statistical series.
Population (p. 55)—Recent figures are given in the following table for the total population.
| Date | Total | Mean Population for Year |
|---|---|---|
| 31 December 1974 | 3,094,700 | 3,044,100 |
| 31 March 1975 | 3,105,400 | 3,060,400 |
| 31 June 1975 | 3,087,800 | 3,076,000 |
The above figures do not include the population of the Cook Islands, 19,522 (at 31 March 1974); Niue Island, 3,922 (at 30 September 1974); and Tokelau Islands, 1,574 (at 25 September 1974).
Migration (p. 71)—Total arrivals and departures are classified in the following table.
| Category | Year Ended 31 March | ||
|---|---|---|---|
| 1973 | 1974 | 1975† | |
*Mainly on cruise ships. †Provisional. | |||
| Arrivals | |||
| Permanent and long-term arrivals | 54,651 | 69,815 | 65,900 |
| New Zealand residents returning | 160,087 | 210,040 | 251,561 |
| Temporary visitors | 254,644 | 318,244 | 361,194 |
| Totals | 469,382 | 598,099 | 678,655 |
| Crews | 157,518 | 172,260 | 180,474 |
| Through passengers* | 83,138 | 101,011 | 117,441 |
| Grand totals, all arrivals | 710,038 | 871,370 | 976,570 |
| Departures | |||
| Permanent and long-term departures | 35,483 | 42,338 | 43,461 |
| New Zealand residents departing temporarily | 154,992 | 208,314 | 249,884 |
| Temporary visitors departing | 253,432 | 314,280 | 356,169 |
| Totals | 443,907 | 564,932 | 649,514 |
| Crews | 156,859 | 171,851 | 179,972 |
| Through passengers* | 83,138 | 101,011 | 117,441 |
| Grand totals, all departures | 683,904 | 837,794 | 946,927 |
Internal Migration—Statistics on residential mobility are now available from questions added for the first time in the Census of Population and Dwellings 1971. A summary is presented in the following tables; it shows persons classified by usual residence on census night within statistical areas, and by domicile 1 year prior to the census.
| Usual Residence on Census Night (1971) | Residence One Year Prior to Census (1971) | ||||
|---|---|---|---|---|---|
| Unchanged | Elsewhere in N. Z. | Pacific Islands | Other Countries | Not Specified or No Settled Abode | |
| Percentage | |||||
| Northland S. A. | 87.44 | 11.56 | 0.02 | 0.76 | 0.22 |
| Central Auckland S. A. | 81.38 | 14.94 | 0.21 | 1.93 | 1.55 |
| South Auckland - Bay of Plenty S. A. | 83.95 | 13.79 | 0.07 | 1.92 | 1.28 |
| East Coast S. A. | 85.84 | 11.45 | 0.01 | 0.62 | 2.08 |
| Hawke's Bay S. A. | 85.20 | 12.89 | 0.03 | 0.73 | 1.15 |
| Taranaki S. A. | 87.55 | 11.09 | - | 0.73 | 0.63 |
| Wellington S. A. | 82.30 | 14.64 | 0.12 | 1.55 | 1.39 |
| North Island | 83.09 | 14.06 | 0.12 | 1.40 | 1.33 |
| Marlborough S. A. | 86.72 | 11.15 | 0.01 | 0.88 | 1.23 |
| Nelson S. A. | 84.93 | 12.45 | 0.02 | 1.68 | 0.92 |
| Westland S. A. | 88.37 | 8.72 | .. | 0.54 | 2.37 |
| Canterbury S. A. | 83.89 | 14.09 | 0.03 | 1.13 | 0.86 |
| Otago S. A. | 85.81 | 11.96 | 0.02 | 0.95 | 1.26 |
| Southland S. A. | 85.61 | 12.72 | 0.03 | 1.02 | 0.63 |
| South Island | 84.86 | 13.04 | 0.03 | 1.10 | 0.98 |
| New Zealand | 83.59 | 13.77 | 0.09 | 1.31 | 1.23 |
Railway Transport (pp. 292-300)—Summarised statistics of railway transport for the year ended 31 March 1975 are compared with previous years.
| TRANSPORT | ||||
|---|---|---|---|---|
| Item | Unit | Year Ended 31 March | ||
| 1973 | 1974 | 1975 | ||
| *Including road motor, rail-road ferry, and other subsidiary services. | ||||
| Passenger journeys— | ||||
| Railways | (000) | 18,565x | 18,944x | 18,894 |
| Railway road motor services | (000) | 20,866 | 20,947x | |
| Livestock tonnage | tonnes(000) | 105x | 78x | 67 |
| Goods tonnage | tonnes(000) | 12,217x | 13,301x | 12,816 |
| Revenue— | ||||
| Railway operation | $(000) | 112,162 | 125,789 | 124,921 |
| Total* | $(000) | 134,990 | 152,179 | 153,911 |
| Expenditure— | ||||
| Railway operation | $(000) | 117,197 | 135,363 | 166,657 |
| Total* | $(000) | 138,340 | 160,832 | 199,171 |
Road Transport (p. 300)—Statistics of motor vehicles licensed at 31 March 1975 are compared with those for 31 March 1974.
| As at 31 March | Class | |
|---|---|---|
| 1974 | 1975 | |
| *Mostly farm tractors, etc. | ||
| Cars | 1,091,160 | 1,142,326 |
| Trucks | 200,127 | 206,776 |
| Contract vehicles | 1,109 | 1,205 |
| Omnibuses and service cars | 3,054 | 3,130 |
| Totals | 1,295,450 | 1,353,437 |
| Motor cycles | 60,755 | 67,136 |
| Power cycles | 26,655 | 26,841 |
| Vehicles exempted from payment of licence fees* | 103,098 | 105,080 |
| Trailers and caravans Grand totals | 279,650 | 304,883 |
| Grand totals | 1,765,608 | 1,857,377 |
Registration of new cars during the 1974 calendar year totalled 99,213 and registrations of new commercial vehicles (including 134 omnibuses and 70 service coaches) totalled 16,408. New motor cycles registered totalled 24,156.
Building Permits—The following table presents the latest statistics on building permits issued (including Government buildings).
| Type of Building Permit | Year Ended 31 March | |||
|---|---|---|---|---|
| 1974 | 1975 | |||
| Number | Value | Number | Value | |
| $(m) | $(m) | |||
| New houses and flats | 39,734 | 544.7 | 33,039 | 545.4 |
| Alterations and additions to houses and flats | 45,597 | 67.6 | 42,290 | 75.8 |
| Other buildings (including alterations) | 17,533 | 384.9x | 17,446 | 456.6 |
| Totals, all buildings | 102,864x | 997.3x | 92,775 | 1,077.7 |
Houses and Flats Completed—There were 33,039 houses and flats completed in the year ended 31 March 1975 compared with 39,734 in the preceding year. Additional units created by conversion totalled 360 in 1974-75 compared with 650 in 1973-74.
Wool (p. 388)—Weight, sale value, and average value per kilogram of greasy wool sold at auction in New Zealand in the last three seasons are shown below.
| Season | Weight of Greasy Wool Sold | Sale Value | Value per Kg | Index Numbers*Base:1963-64 (= 1000) |
|---|---|---|---|---|
| *Based on price on floor, clean. | ||||
| kg(m) | $(m) | c | ||
| 1972-73 | 196.2 | 282.5 | 143.96 | 1,464 |
| 1973-74 | 195.1 | 271.6 | 139.19 | 1,448 |
| 1974-75 | 210.3 | 192.9 | 91.75 | 958 |
Retail Trade—Values of quarterly turnover for retail stores, adjusted for seasonal fluctuations and for price and population changes, are shown in the following table for the latest quarters.
| Quarter Ended | Total Turnover | Turnover per Head of Population | ||||||
|---|---|---|---|---|---|---|---|---|
| In Current $ | In Constant 1957-58's | In Current $ | In Constant 1957-58's | |||||
| As Recorded | Seasonally Adjusted | Before Seasonal Adjustment | Seasonally Adjusted | As Recorded | Seasonally Adjusted | Before Seasonal Adjustment | Seasonally Adjusted | |
| *Provisional. | ||||||||
| $(m) | $(m) | $(m) | $(m) | |||||
| 1974 Dec | 1,028.39 | 922.99 | 503.41 | 451.89 | 334.78 | 300.47 | 163.83 | 147.11 |
| 1975 Mar | 845.16 | 909.00 | 398.99 | 429.02 | 272.59 | 293.18 | 128.69 | 138.38 |
| 1975 Jun | 942.45 | 964.87 | 430.39 | 440.52 | 304.26 | 311.50 | 138.95 | 142.22 |
Hire Purchase Trade—The following statistics show trade for the latest quarter (compared with previous quarters) by surveyed businesses covering about 72 percent of total hire purchase business.
| Quarter Ended | Value of Goods Sold on Hire Purchase | Total Amount Owing Under H.P. Agreements* | ||||
|---|---|---|---|---|---|---|
| Motor Vehicles | Plant and Machinery | Television Sets | Other Household and Personal Goods | Total | ||
| *As at end of quarter. | ||||||
| 1974— | $(000) | $(m) | ||||
| December | 43,145 | 10,426 | 2,073 | 14,467 | 70,111 | 190,8 |
| 1975— | ||||||
| March | 42,123 | 10,352 | 1,823 | 12,438 | 66,736 | 192.5 |
| June | 53,581 | 12,241 | 2,861 | 16,028 | 84,711 | 185.5 |
Summary of Stocks—The following table gives a summary of stocks held by manufacturers wholesale traders, and retail traders.
| Stocks | As at 31 March | ||||
|---|---|---|---|---|---|
| 1971x | 1972x | 1973x | 1974x | 1975x | |
| *Excluding primary produce processing industries. | |||||
| Manufacturers*— | $(million) | ||||
| Materials | 383.3 | 427.6 | 429.8 | 560.9 | 808.7 |
| Finished goods | 178.3 | 207.3 | 206.4 | 213.1 | 313.4 |
| Wholesale | 416.2 | 473.9 | 462.7 | 510.0 | 802.9 |
| Retail | 363.0 | 394.6 | 408.5 | 487.6 | 595.2 |
| Totals | 1,340.8 | 1,503.4 | 1,507.4 | 1,771.6 | 2,520.2 |
Retail Prices (pp. 666-687)—Details of the new Consumers Price Index with a December Quarter 1974 base are set out in the following table.
| CONSUMERS PRICE INDEX | ||||
|---|---|---|---|---|
| Base: Weighted average 25 centres, December Quarter 1974 (=1000) | ||||
| Group or Subgroup | December Quarter 1974 | Quarter Ended 31 March 1975 | Quarter Ended 30 June 1975 | Quarter Ended 30 September 1975 |
| Food— | ||||
| Fruits and vegetables | 1,000 | 984 | 1,040 | 1,144 |
| Meat, fish and poultry | 1,000 | 975 | 978 | 1,016 |
| Other foods | 1,000 | 1,032 | 1,085 | 1,121 |
| All Foods | 1,000 | 1,007 | 1,047 | 1,094 |
| Housing— | ||||
| Rentals | 1,000 | 1,037 | 1,076 | 1,118 |
| Home ownership | 1,000 | 1,146 | 1,087 | 1,107 |
| Housing | 1,000 | 1,045 | 1,086 | 1,108 |
| Household operation— | ||||
| Fuel and light | 1,000 | 1,013 | 1,049 | 1,063 |
| Household furnishing | 1,000 | 1,028 | 1,062 | 1,104 |
| Household supplies and services | 1,000 | 1,038 | 1,049 | 1,073 |
| Household operation | 1,000 | 1,029 | 1,056 | 1,089 |
| Apparel— | ||||
| Clothing | 1,000 | 1,032 | 1,086 | 1,096 |
| Footwear | 1,000 | 1,015 | 1,057 | 1,075 |
| Apparel | 1,000 | 1,029 | 1,081 | 1,092 |
| Transportation— | ||||
| Public transport | 1,000 | 1,019 | 1,061 | 1,139 |
| Private transport | 1,000 | 1,030 | 1,090 | 1,167 |
| Transportation | 1,000 | 1,030 | 1,088 | 1,165 |
| Miscellaneous— | ||||
| Tobacco and alcohol | 1,000 | 1,016 | 1,037 | 1,070 |
| Other supplies | 1,000 | 1,053 | 1,096 | 1,162 |
| Other services | 1,000 | 1,043 | 1,087 | 1,114 |
| Miscellaneous | 1,000 | 1,036 | 1,071 | 1,113 |
| All groups | 1,000 | 1,031 | 1,072 | 1,111 |
Taxation Receipts—This table shows direct and indirect taxation.
| (Source: Receipts and Payments of the Public Account.) | |||
|---|---|---|---|
| Item | Year Ended 31 March | ||
| 1974 | 1975 | 1976* | |
| Direct taxation— | $(thousand) | ||
| Income tax | 1,697,908 | 2,135,982 | 2,400,000 |
| Estate and gift duty | 33,823 | 41,111 | 46,000 |
| Land tax | 3,265 | 3,392 | 4,000 |
| Property speculation tax | 205 | 346 | - |
| Total—Direct taxation | 1,735,201 | 2,180,831 | 2,450,000 |
| Indirect taxation— | |||
| Customs duty | 201,163 | 229,081 | 212,000 |
| Beer duty | 44,674 | 46,233 | 47,000 |
| Sales tax | 206,359 | 234,696 | 236,000 |
| Motor spirits tax | — | — | 75,000 |
| Payroll tax | 33,506 | 789 | - |
| Racing duty | 19,261 | 21,909 | 25,000 |
| Stamp duties | 29,407 | 25,872 | 25,000 |
| Other | 22,048 | 21,115 | 22,000 |
| Highways taxation | 103,166 | 104,780 | 105,000 |
| Total—Indirect taxation | 659,584 | 684,475 | 747,000 |
| Total—Taxation receipts | 2,394,785 | 2,865,306 | 3,197,000 |
The functional classification of gross Government expenditure is shown in the following table.
| FUNCTIONAL CLASSIFICATION OF GROSS GOVERNMENT EXPENDITURE | |||
|---|---|---|---|
| Item | 1973-74 | 1974-75 | 1975-76* |
| Estimated. | |||
| Administration—$(m) | |||
| General administration | 85.0 | 111.0 | 135.5 |
| Law and order | 63.3 | 79.2 | 93.4 |
| Government services | 60.6 | 86.3 | 86.5 |
| Miscellaneous services | 17.7 | 19.7 | 23.8 |
| Stabilisation | 120.1 | 162.1 | 157.2 |
| Totals | 346.7 | 458.3 | 496.4 |
| Foreign relations— | |||
| Defence | 140.5 | 166.9 | 179.2 |
| Foreign Affairs | 38.5 | 52.3 | 81.1 |
| Totals | 179.1 | 219.2 | 260.3 |
| Development of industry— | |||
| Land use | 194.3 | 255.5 | 356.6 |
| Fuel and power | 165.6 | 244,5 | 257.8 |
| Other industrial services | 48.1 | 60.7 | 70.6 |
| Totals | 408.0 | 560.7 | 685.0 |
| Education | 442.7 | 529.8 | 595.4 |
| Social services | 655.7 | 802.8 | 953.5 |
| Health | 401.9 | 493.6 | 562.3 |
| Transport and communications— | |||
| Transport | 321.5 | 392.1 | 446.9 |
| Communications | 235.1 | 287.1 | 319.0 |
| Totals | 556.8 | 679.2 | 765.9 |
| Debt services and miscellaneous investment transactions | 345.0 | 463.9 | 620.6 |
| Totals | 3,335.7 | 4,207.5 | 4,939.4 |
Consolidated Revenue Account Expenditure—The following table shows expenditure from the Consolidated Revenue Account.
| Item | Year Ended 31 March | ||
|---|---|---|---|
| 1974 | 1975 | 1976* | |
| *Estimated. | |||
| $(thousand) | |||
| Permanent approbations— | |||
| Under Special Acts of Legislature— | |||
| Civil List | 1,560 | 1,602 | 1,628 |
| Debt services— | |||
| Interest | 200,323 | 221,030 | 260,000 |
| Transfer to Loans Redemption Account | 50,000 | 50,000 | 50,000 |
| Administration and management | 1,601 | 736 | 1,610 |
| Total—Debt services | 251,924 | 271,766 | 311,610 |
| Special Acts— | |||
| Superannuation Act 1956 | 18,879 | 22,146 | 25,347 |
| New Zealand Superannuation Act 1974 | .. | .. | 3,500 |
| Miscellaneous | 8,058 | 12,395 | 7,958 |
| Total—Special Acts | 26,937 | 34,541 | 36,805 |
| Total—Permanent appropriations | 280,421 | 307,909 | 350,043 |
| Annual appropriations— | |||
| Administration— | |||
| General administration— | |||
| Vote— | |||
| Accident Compensation | 20 | 22 | 23 |
| Audit | 1,576 | 1,725 | 1,975 |
| Broadcasting | 41 | 70 | 82 |
| Customs | 6,009 | 6,636 | 7,370 |
| Inland Revenue | 13,193 | 17,295 | 20,120 |
| Internal Affairs | 17,234 | 22,294 | 26,115 |
| Legislative | 2,068 | 2,323 | 2,815 |
| Prime Minister's Department | 227 | 389 | 705 |
| Rural Banking and Finance Corporation | - | 9 | 13 |
| Housing Corporation | 18 | 16 | 33 |
| State Services Commission | 9,374 | 9,908 | 23,200 |
| Statistics | 4,518 | 4,603 | 6,300 |
| Treasury | 3,291 | 4,112 | 4,150 |
| Valuation | 3,514 | 4,684 | 4,860 |
| Total—General administration | 61,082 | 74,087 | 97,761 |
| Law and order— | |||
| Vote— | |||
| Crown Law | 357 | 416 | 478 |
| Justice | 23,820 | 29,698 | 34,000 |
| Police | 32,288 | 40,617 | 45,700 |
| Security Intelligence Service | 628 | 728 | 785 |
| Total—Law and order | 57,093 | 71,459 | 80,963 |
| Item | Year Ended 31 March | ||
|---|---|---|---|
| 1974 | 1975 | 1976* | |
*Estimated † Excludes National Water and Soil Conversation. ‡ Includes $7m for losses incurred in Post Office and $11.7 m for losses incurred in Railways. | |||
| Government services—$(thousand) | |||
| Vote— | |||
| Government Printing Office | 11,668 | 16,584 | 15,360 |
| Works and Development† | 32,483 | 47,431 | 38,752 |
| Total—Government services | 44,151 | 64,015 | 54,112 |
| Stabilisation— | |||
| Vote— | |||
| Stabilisation | 112,185 | 148,152 | 157,200 |
| Total—Administration | 274,512 | 357,713 | 390,036 |
| Foreign relations— | |||
| Defence— | |||
| Defence | 140,511 | 166,854 | 179,200 |
| Foreign affairs— | |||
| Foreign affairs | 32,454 | 47,683 | 78,880 |
| Total—Foreign relations | 172,965 | 214,537 | 258,080 |
| Development of industry— | |||
| Land use— | |||
| Agriculture and Fisheries | 78,272 | 102,337 | 177,300 |
| Forest Service | 5,746 | 6,785 | 7,552 |
| Lands and Survey | 10,364 | 12,766 | 15,086 |
| Total—Land use | 94,383 | 121,888 | 199,938 |
| Fuel and power— | |||
| Energy Resources | 170 | 197 | 655 |
| Mines | 1,167 | 3,141 | 3,500 |
| Total | 1,338 | 3,338 | 4,155 |
| Other industrial services— | |||
| Labour | 9,928 | 11,474 | 12,850 |
| Scientific and Industrial Research | 18,924 | 22,900 | 26,600 |
| Tourist and Publicity | 7,553 | 8,239 | 9,060 |
| Trade and Industry | 9,780 | 15,703 | 18,540 |
| Total—Other industrial services | 46,185 | 58,316 | 67,050 |
| Total—Development of industry | 141,906 | 183,542 | 271,143 |
| Education— | |||
| Education | 442,660 | 529,803 | 595,350 |
| Social services— | |||
| Internal Affairs | 1,979 | 3,025 | 3,000 |
| Maori and Island Affairs | 11,919 | 15,058 | 6,165 |
| Social Welfare | 621,003 | 710,959 | 812,300 |
| Total—Social services | 634,901 | 729,042 | 821,465 |
| Health—$(thousand) | |||
| Health | 399,044 | 491,367 | 558,050 |
| Transport— | |||
| Transport and communications | 37,351 | 48,659 | 63,908 |
| Total—Annual appropriations | 2,103,338 | 2,554,665 | 2,958,032 |
| Adjustment on currency realignment | 14,369 | — | — |
| Unauthorised expenditure | 5,971 | 18,738 | — |
| Defence credits and other special entries | 95,680 | 3,577 | 5,935 |
| Additional contributions to Loans Redemption Account | 10,000 | 30,000 | — |
| Transfer to National Development Loans Account | — | 120,000 | — |
| Provision for Supplementary Estimates | — | — | 40,000 |
| Total payments | 2,509,779 | 3,034,889 | 3,354,010 |
| National Roads Fund Expenditure— | |||
|---|---|---|---|
| Item | Year Ended 31 March | ||
| 1973 | 1974 | 1975 | |
| $(thousand) | |||
| Highways maintenance | 15,725 | 16,745 | 19,676 |
| Highways construction | 38,029 | 35,973 | 40,759 |
| Subsidies to local authorities | 39,388 | 39,343 | 44,304 |
| Administration and general | 8,570 | 7,457 | 9,615 |
| Unauthorised | 9 | 3 | 4 |
| Total expenditure | 101,722 | 99,522 | 114,358 |
Above figures are gross. Net expenditure for 1974-75 totalled $113,524,749.
Summary of Budget Proposals—The Financial Statement was presented on 22 May 1975. Principal changes from the existing situation are as follows.
A package policy on incomes involving a general wage increase from July 1975 and a negotiable increase up to 21/4 percent associated with a reduction in taxation at all levels up to $20,000 annual taxable income and an increase to a rate of 60 percent for incomes of $22,000 and above.
Introduction of a new allowance for social security age beneficiaries with limited income and financial assets who are not able to attain a reasonable standard of living.
Special Beneficiaries Cost of Living Index to be developed for use in future adjustment of benefits. (See Later in this section.)
Standard tertiary bursary from 1976 for full-time students in universities, technical institutes, and teachers' colleges.
Increase in farm loan limits and fertiliser application bounty.
Higher petrol tax and sales tax on luxury items.
Interest rates on savings banks deposits raised.
Social Security Benefits (p. 168)—The table below gives a summary of the latest weekly rates of cash benefits.
| Benefit | 15 Jan 1975 | 2 July 1975 |
|---|---|---|
| Superannuation*— | ||
| Unmarried person | 28.75 | 30.75 |
| Married person | 23.95 | 25.63 |
| Age*— | ||
| Unmarried person | 28.75 | 30.75 |
| Married couple if both eligible (each) | 23.95 | 25.63 |
| Married woman whose husband is not eligible | 23.95 | 25.63 |
| Married man whose wife is not eligible | 47.90 | 51.26 |
| Widows*— | ||
| Widow | 28.75 | 30.75 |
| Domestic purposes— | ||
| Solo parent* | 28.75 | 30.75 |
| Woman alone | 28.75 | 30.75 |
| Caring for sick or infirm— | ||
| Unmarried person under 18 years | 22.00 | 23.50 |
| Unmarried person 18 or over | 28.75 | 30.75 |
| Married person | 23.95 | 25.63 |
| Orphans (each child) | 14.45 | 15.45 |
| Family (each child) | 3.00 | 3.00 |
| Invalids*— | ||
| Unmarried person 18 years or over | 28.75 | 30.75 |
| Unmarried person under 18 years | 22.00 | 23.50 |
| Married man with wife included | 47.90 | 51.26 |
| Married woman | 23.95 | 25.63 |
| Miners— | ||
| Unmarried person | 28.75 | 30.75 |
| Married man with wife included | 47.90 | 51.26 |
| Miner's widow | 27.15 | 29.15 |
| Sickness*— | ||
| Unmarried person under 18 without dependants | 22.00 | 23.50 |
| Unmarried person 18 years or over | 28.75 | 30.75 |
| Married man with wife included | 47.90 | 51.26 |
| Married woman | 23.95 | 25.63 |
| Unemployment*— | ||
| Unmarried person under 20 without dependents | 22.00 | 23.50 |
| Unmarried person 20 years or over | 28.75 | 30.75 |
| Married man with wife included | 47.90 | 51.26 |
| Married woman | 23.95 | 25.63 |
| *Any of above benefits with dependent children— | ||
| Solo parent and 1 child | 44.90 | 48.26 |
| Solo parent and 2 children | 47.90 | 51.26 |
| Each subsequent child | 1.25 | 1.25 |
| Married couple with 1 child | 50.90 | 54.26 |
| Each subsequent child | 1.25 | 1.25 |
| Supplementary assistance | According to circumstances | |
| Emergency | According to circumstances | |
Industrial Classification of Salary and Wage Payments (p. 901)—The total salary and wage bill is given below for 1972-73.
| GENERAL FINANCE | |||
|---|---|---|---|
| Industry Group | 1970-71 | 1971-72 | 1972-73 |
| $(000) | |||
| Agriculture and livestock production | 116,386 | 125,395 | 146,018 |
| Forestry, hunting and fishing | 10,934 | 11,908 | 12,566 |
| Mining and quarrying | 15,309 | 16,268 | 17,406 |
| Manufacturing, food, beverages and tobacco | 222,748 | 261,085 | 292,334 |
| Manufacturing, textiles, wearing apparel and made-up textiles | 107,197 | 121,027 | 124,319 |
| Manufacturing, wood, paper, chemical, etc., products (including miscellaneous manufacturing) | 318,832 | 376,262 | 415,539 |
| Manufacturing, metals and metal products | 223,773 | 265,594 | 296,234 |
| Construction | 243,269 | 278,850 | 317,830 |
| Electricity, gas, water and sanitary services (not construction) | 45,743 | 53,845 | 61,491 |
| Commerce—Wholesale and retail trade | 460,199 | 534,616 | 594,002 |
| Commerce—Other | 150,531 | 174,678 | 202,952 |
| Transport, storage and communication | 366,329 | 424,330 | 473,959 |
| Services, community, business, recreation and personal | 729,596 | 916,242 | 1,037,544 |
| Activities not adequately described | 634 | 461 | 455 |
| Total | 3,011,481 | 3,560,561 | 3,992,650 |
| Increase on previous years Percent | 20.2 | 18.2 | 12.1 |
| Land Transfers (pp. 2/4-276) | ||||
|---|---|---|---|---|
| Item | Year Ended 31 March | |||
| 1972 | 1973 | 1974 | 1975* | |
| *Provisional. | ||||
| Urban properties— | ||||
| Number | 76,543 | 94,015 | 110,732 | 84,408 |
| Consideration ($m) | 786.8 | 1,068.0 | 1,641.4 | 1,566.0 |
| Rural properties— | ||||
| Freehold— | ||||
| Number | 9,106 | 10,760 | 14,494 | 10,822 |
| Area hectares (000) | 513.8 | 620.7 | 896.7 | 632.9 |
| Consideration $(m) | 190.0 | 260.6 | 470.9 | 465.9 |
| Weighted overall average price per hectare $ | 312.21 | 355.82 | 466.83 | 638.0 |
| All properties: Total consideration $(m) | 985.4 | 1,339.9 | 2,133.0 | 2,024.2 |
Mortgages (pp. 835-840)—Particulars of gross totals of mortgages registered and discharged during the last four financial years are shown below.
| Year Ended 31 March | Registered | Discharged | ||
|---|---|---|---|---|
| Number | Amount | Number | Amount | |
| *Provisional. | ||||
| $(m) | $(m) | |||
| 1972 | 102,900 | 759.8 | 75,699 | 415.8 |
| 1973 | 119,004 | 940.7 | 90,868 | 510.5 |
| 1974 | 138,993 | 1,301.7 | 109,600 | 673.1 |
| 1975* | 126,868 | 1,384.4 | 91,467 | 565.8 |
Overseas Exchange Transactions (p. 810)—The following statement gives statistics of overseas exchange transactions for the latest four March years.
| (Source: Reserve Bank) | ||||
|---|---|---|---|---|
| Item | Year Ended 31 March | |||
| 1972 | 1973 | 1974 | 1975 | |
| RECEIPTS— | $(million) | |||
| 1. Exports— | ||||
| (a) Butter | 149.5 | 109.2 | 111.3 | 105.5 |
| (b) Cheese | 64.5 | 74.6 | 57.5 | 34.9 |
| (c) Other dairy products | 99.8 | 133.1 | 137.6 | 172.7 |
| (d) Meat | 440.2 | 547.8 | 599.8 | 495.3 |
| (e) Wool | 225.1 | 383.1 | 415.3 | 295.2 |
| (f) Other animal products | 105.2 | 122.9 | 133.6 | 128.9 |
| (g) Forest products | 86.5 | 91.8 | 118.9 | 143.3 |
| (h) Other primary products | 56.1 | 61.2 | 75.0 | 72.5 |
| (i) Manufactured exports | 100.0 | 122.8 | 156.0 | 195.3 |
| (j) Miscellaneous | 5.6 | 6.2 | 8.5 | 13.1 |
| Total exports | 1,332.5 | 1,652.7 | 1,813.7 | 1,656.6 |
| 2. Other current receipts | 246.4 | 327.3 | 414.5 | 482.9 |
| Total current receipts | 1,578.9 | 1,980.0 | 2,228.2 | 2,139.5 |
| 3. Capital receipts— | ||||
| (a) Government borrowing | 107.3 | 30.7 | 2.0 | 318.6 |
| (b) Other official borrowing | - | - | 0.6 | 106.1 |
| (c) Private | 153.5 | 208.9 | 180.0 | 319.9 |
| Total capital receipts | 260.8 | 239.6 | 182.6 | 744.6 |
| 4. I.M.F.— | ||||
| (a) Drawings | - | - | - | 100.5 |
| (b) Allocations of SDRs | 19.1 | - | - | - |
| Total Receipts | 1,858.8 | 2,219.6 | 2,410.8 | 2,984.5 |
| PAYMENTS— | ||||
| 1. Imports— | ||||
| (a) Government | 62.1 | 69.0 | 63.6 | 112.1 |
| (b) Private | 991.5 | 1,113.7 | 1,571.3 | 2,218.6 |
| Total imports | 1,053.7 | 1,182.7 | 1,634.9 | 2,330.8 |
| 2. Other Current Payments— | ||||
| (a) Government | 79.5 | 88.9 | 97.6 | 136.3 |
| (b) Private | 350.7 | 422.5 | 525.7 | 665.1 |
| Total other current payments | 430.2 | 511.4 | 623.3 | 801.4 |
| Total current payments | 1,483.8 | 1,694.1 | 2,258.2 | 3,132.1 |
| 3. Capital Payments— | ||||
| (a) Government debt repayments | 50.6 | 90.4 | 66.5 | 30.9 |
| (b) Other official repayments | 5.4 | - | 5.5 | 4.9 |
| (c) Private | 82.4 | 100.2 | 180.5 | 103.0 |
| Total capital payments | 138.4 | 190.7 | 252.4 | 138.7 |
| Total Payments | 1,622.2 | 1,884.8 | 2,510.6 | 3,270.8 |
| Balance on trade transactions | +278.8 | +470.0 | +178.8 | —674.1 |
| Balance on invisible transactions | —183.8 | —184.2 | —208.8 | —318.5 |
| Current account balance | +95.0 | +285.9 | —30.0 | —992.6 |
| Capital account balance | +122.4 | +48.9 | —69.8 | +605.8 |
| I.M.F. transactions (incl. SDRs) | +19.1 | — | - | +100.5 |
| Change in official overseas reserves | +257.3 | +287.3 | —138.6 | —210.7 |
| Official overseas reserves at end of period | 629.9 | 917.2 | 778.5 | 567.8 |
The pattern of expenditure used in this index is based on the Special Survey of Persons Aged 65 Years and Over. That survey supplied the expenditure information for broad groupings. Information for the more detailed sub-groups, sections and items of the Index was obtained by using the relationship at these levels ascertained from the expenditure patterns of households within the comprehensive Household Sample Survey 1973-74, where the head of the household was aged 65 or over. The detailed expenditure patterns have been adjusted to reflect price levels to the fourth quarter of 1974 which is the expression base of this Index.
| BENEFICIARIES PRICE INDEX | ||||
|---|---|---|---|---|
| Group or Sub-Group | Percentage of Base Expenditure | Index Numbers | ||
| Base Period 4th Quarter 1974 | 1st Quarter 1975 | 2nd Quarter 1975 | ||
| Fruit and vegetables | 4.4 | 1,000 | 984 | 1,040 |
| Meat, fish and poultry | 7.7 | 1,000 | 967 | 970 |
| Other foods | 11.6 | 1,000 | 1,028 | 1,081 |
| All foods | 23.7 | 1,000 | 1,000 | 1,037 |
| Rentals | 5.6 | 1,000 | 1,032 | 1,064 |
| Home ownership | 15.6 | 1,000 | 1,036 | 1,073 |
| Housing | 21.2 | 1,000 | 1,035 | 1,071 |
| Fuel and light | 3.0 | 1,000 | 1,015 | 1,051 |
| Household furnishing | 9.1 | 1,000 | 1,029 | 1,059 |
| Household supplies and services | 5.2 | 1,000 | 1,038 | 1,048 |
| Household operation | 17.3 | 1,000 | 1,029 | 1,055 |
| Clothing | 6.8 | 1,000 | 1,020 | 1,086 |
| Footwear | 1.4 | 1,000 | 1,055 | 1,096 |
| Apparel | 8.2 | 1,000 | 1,027 | 1,088 |
| Public transport | 1.8 | 1,000 | 1,016 | 1,055 |
| Private transport | 11.6 | 1,000 | 1,030 | 1,094 |
| Transportation | 13.4 | 1,000 | 1,029 | 1,088 |
| Tobacco and alcohol | 3.7 | 1,000 | 1,017 | 1,038 |
| Other supplies | 4.6 | 1,000 | 1,069 | 115 |
| Other services | 8.0 | 1,000 | 1,033 | 1,061 |
| Miscellaneous | 16.2 | 1,000 | 1,039 | 1,071 |
| All groups | 100.0 | 1,000 | 1,025 | 1,064 |
| ESTIMATES OF POPULATION AT 31 MARCH 1975* | ||
|---|---|---|
| STATISTICAL AREAS† | ||
| Statistical Area | 1971 Census | Estimate at 31 March 1975 |
†Includes Shipboard: North Island 3,278; South Island 1,508; New Zealand 4,786. *While population estimates are given as at 31 March 1975 they relate to local authority boundaries existing at 1 April 1975. | ||
| North Island— | ||
| Northland | 96.191 | 100,430 |
| Central Auckland | 698,400 | |
| South Auckland - Bay of Plenty | 796,660 | |
| 422,299 | 464,120 | |
| East Coast | 47,342 | 48,550 |
| Hawke's Bay | 133,250 | 144,910 |
| Taranaki | 100,895 | 104,890 |
| Wellington | 552,986 | 591,860 |
| Totals | 2,051,363 | 2,251,420 |
| South Island— | ||
| Marlborough | 31,642 | 34,280 |
| Nelson | 68,838 | 72,320 |
| Westland | 22,861 | 22,510 |
| Canterbury | 398,830 | 428,080 |
| Otago | 182,749 | 182,760 |
| Southland | 106,348 | 111,030 |
| Totals | 811,268 | 853,980 |
| Totals, Statistical Areas | 2,862,631 | 3,105,400 |
| STATISTICAL DIVISIONS AND URBAN AREAS | ||
|---|---|---|
| Statistical Division (S. Div.) and Urban Area (U.A.) | 1971 Census | Estimate at 31 March 1975 |
| Auckland S. Div.— | ||
| Northern Auckland U.A. | 107,965 | 138,700 |
| Western Auckland U.A. | 89,946 | 109,760 |
| Central Auckland U.A. | 286,787 | 292,900 |
| Southern Auckland U.A. | 165,048 | 205,080 |
| Remainder S. Div. | 48,654 | 50,220 |
| Totals | 698,400 | 796,660 |
| Hamilton S. Div.— | ||
| Hamilton U.A. | 80,812 | 96,690 |
| Remainder S. Div. | 55,194 | 56,050 |
| Totals | 136,006 | 152,740 |
| Napier - Hastings S. Div.— | ||
| Napier U.A. | 43,601 | 50,350 |
| Hastings U.A. | 45,512 | 51,180 |
| Remainder S. Div. | 7,820 | 7,830 |
| Totals | 96,933 | 109,360 |
| Palmerston North S. Div.— | ||
| Palmerston North U.A. | 57,065 | 62,870 |
| Remainder S. Div. | 23,667 | 24,130 |
| Totals | 80,732 | 87,000 |
| Wellington S. Div.— | ||
| Upper Hutt Valley U.A. | 30,986 | 36,270 |
| Lower Hutt Valley U.A. | 92,003 | 99,000 |
| Porirua Basin U.A. | 47,858 | 55,740 |
| Wellington U.A. | 136,782 | 142,700 |
| Remainder S. Div. | 16,403 | 20,950 |
| Totals | 324,032 | 354,660 |
| Christchurch S. Div.— | ||
| Christchurch U.A. | 275,968 | 297,860 |
| Remainder S. Div. | 26,642 | 28,550 |
| Totals | 302,610 | 326,410 |
| Dunedin S. Div.— | ||
| Dunedin U.A. | 111,059 | 114,410 |
| Remainder S. Div. | 6,681 | 6,480 |
| Totals | 117,740 | 120,890 |
| Urban Areas not included in Statistical Divisions— | ||
| Whangarei U.A. | 34,029 | 37,640 |
| Tauranga U.A. | 40,349 | 48,360 |
| Rotorua U.A. | 39,752 | 47,270 |
| Gisborne U.A. | 30,161 | 32,440 |
| New Plymouth U.A. | 38,780 | 43,050 |
| Wanganui U.A. | 37,982 | 38,480 |
| Masterton U.A. | 20,147 | 21,260 |
| Nelson U.A. | 37,994 | 42,310 |
| Timaru U.A. | 28,959 | 30,250 |
| Invercargill U.A. | 50,681 | 54,060 |
| Totals, 24 Urban Areas | 1,930,226 | 2,148,630 |
| Totals, 7 Statistical Divisions | 1,756,453 | 1,947,720 |
| CITIES AND BOROUGHS | ||
|---|---|---|
| City or Borough | 1971 Census | Estimate at 31 March 1975 |
| North Island— | ||
| Kaitaia | 3,501 | 4,000 |
| Kaikohe | 3,340 | 3,490 |
| Whangarei C. | 30,746 | 34,300 |
| Dargaville | 4,101 | 4,260 |
| Helensville | 1,290 | 1,330 |
| East Coast Bays | 15,929 | 22,400 |
| Takapuna C. | 24,033 | 65,400 |
| Devonport | 11,022 | 11,000 |
| Northcote | 9,581 | 10,150 |
| Birkenhead | 15,819 | 20,500 |
| Henderson | 5,889 | 6,690 |
| Glen Eden | 6,771 | 8,020 |
| New Lynn | 10,029 | 10,300 |
| Auckland C. | 151,580 | 153,100 |
| Newmarket | 1,229 | 1,210 |
| Mount Albert | 26,151 | 27,400 |
| Mount Eden | 20,084 | 21,100 |
| Mount Roskill | 33,849 | 34,600 |
| Onehunga | 15,693 | 15,550 |
| One Tree Hill | 12,961 | 13,050 |
| Ellerslie | 5,062 | 5,690 |
| Mount Wellington | 20,178 | 21,200 |
| Howick | 12,008 | 15,200 |
| Otahuhu | 9,916 | 10,100 |
| Papatoetoe C. | 21,816 | 23,600 |
| Manukau C. | 104,024 | 134,600 |
| Papakura | 17,210 | 21,600 |
| Pukekohe | 7,590 | 8,470 |
| Waiuku | 2,879 | 3,260 |
| Tuakau | 1,814 | 1,920 |
| Huntly | 5,310 | 5,460 |
| Cambridge | 6,435 | 7,180 |
| Ngaruawahia | 3,995 | 4,240 |
| Hamilton C. | 74,784 | 90,100 |
| Te Awamutu | 6,929 | 7,300 |
| Te Kuiti | 4,842 | 4,880 |
| Taumarunui | 6,692 | 6,650 |
| Thames | 5,780 | 6,320 |
| Paeroa | 3,431 | 3,750 |
| Waihi | 3,071 | 3,200 |
| Te Aroha | 3,200 | 3,140 |
| Morrinsville | 4,452 | 4,450 |
| Matamata | 4,057 | 5,090 |
| Putaruru | 4,585 | 4,700 |
| Mount Maunganui | 8,771 | 10,650 |
| Tauranga C | 28,188 | 33,800 |
| Te Puke | 3,406 | 4,060 |
| Rotorua C. | 31,265 | 37,900 |
| Taupo | 10,563 | 12,850 |
| Whakatane | 9,748 | 11,050 |
| Kawerau | 6,687 | 7,570 |
| Murupara | 2,760 | 2,900 |
| Gisborne C. | 28,200 | 30,400 |
| Wairoa | 5,418 | 5,630 |
| Napier C. | 40,186 | 47,000 |
| Hastings C. | 29,753 | 33,600 |
| Havelock North | 7,284 | 8,880 |
| Waipawa | 1,725 | 1,700 |
| Waipukurau | 3,598 | 3,570 |
| Dannevirke | 5,610 | 5,610 |
| Woodville | 1,517 | 1,540 |
| Waitara | 5,125 | 5,660 |
| New Plymouth C. | 34,314 | 37,900 |
| Inglewood | 2,086 | 2,360 |
| Stratford | 5,398 | 5,350 |
| Eltham | 2,321 | 2,320 |
| Hawera | 8,134 | 8,380 |
| Patea | 1,950 | 1,940 |
| Ohakune | 1,418 | 1,390 |
| Raetihi | 1,359 | 1,340 |
| Wanganui C. | 35,782 | 36,200 |
| Taihape | 2,793 | 2,750 |
| Marlon | 4,700 | 4,720 |
| Feilding | 9,780 | 10,400 |
| Foxton | 2,808 | 2,830 |
| Palmerston North C. | 51,893 | 57,100 |
| Levin | 13,051 | 15,000 |
| Otaki | 3,774 | 4,000 |
| Kapiti | 11,645 | 14,550 |
| Upper Hutt C. | 26,256 | 30,800 |
| Lower Hutt C. | 61.375 | 65,300 |
| Petone | 9,464 | 9,430 |
| Eastbourne | 4,727 | 4,840 |
| Porirua C. | 36,244 | 42,800 |
| Wellington C. | 137,376 | 143,400 |
| Pahiatua | 2,610 | 2,640 |
| Masterton | 18,494 | 19,800 |
| Carterton | 3,734 | 3,950 |
| Greytown | 1,725 | 1,760 |
| Featherston | 2,090 | 2,360 |
| Martinborough | 1,390 | 1,340 |
| Totals, North Island | 1,475,052 | 1,784,570 |
| South Island— | ||
| Picton | 2,824 | 3,210 |
| Blenheim | 14,859 | 16,800 |
| Nelson C. | 29,282 | 32,100 |
| Richmond | 5,707 | 6,950 |
| Motueka | 3,874 | 4,010 |
| Westport | 4,985 | 4,900 |
| Runanga | 1,449 | 1,340 |
| Greymouth | 7,936 | 7,710 |
| Hokitika | 3,332 | 3,440 |
| Rangiora | 4,854 | 5,750 |
| Kaiapoi | 3,962 | 4,860 |
| Riccarton | 7,136 | 7,140 |
| Christchurch C. | 165,637 | 172,500 |
| Lyttelton | 3,281 | 3,200 |
| Ashburton | 13,312 | 14,250 |
| Geraldine | 1,937 | 2,030 |
| Temuka | 3,316 | 3,490 |
| Timaru C. | 28,326 | 29,600 |
| Waimate | 3,228 | 3,190 |
| Oamaru | 13,078 | 13,150 |
| Port Chalmers | 3,007 | 2,950 |
| Dunedin C. | 82,235 | 84,000 |
| St. Kilda | 6,453 | 6,420 |
| Green Island | 6,149 | 6,650 |
| Mosgiel | 8,377 | 9,430 |
| Milton | 2,164 | 2,190 |
| Kaitangata | 1,099 | 1,020 |
| Balclutha | 4,601 | 4,870 |
| Tapanui | 854 | 890 |
| Lawrence | 604 | 620 |
| Roxburgh | 750 | 780 |
| Naseby | 109 | 110 |
| Alexandra | 3,551 | 4,470 |
| Cromwell | 988 | 970 |
| Arrowtown | 260 | 320 |
| Queenstown | 2,159 | 2,760 |
| Gore | 8,648 | 9,170 |
| Mataura | 2,549 | 2,510 |
| Winton | 2,055 | 2,320 |
| Invercargill C. | 47,420 | 50,600 |
| Bluff | 3,241 | 3,250 |
| Riverton | 1,311 | 1,360 |
| Totals, South Island | 510,899 | 537,380 |
| Totals, Cities and Boroughs | 1,985,951 | 2,321,950 |
| ADMINISTRATIVE COUNTIES | ||
|---|---|---|
| County | 1971 Census | Estimate at 31 March 1975 |
| North Island— | ||
| Mangonui | 7,116 | 7,200 |
| Whangaroa | 1,950 | 1,900 |
| Hokianga | 4,338 | 4,000 |
| Bay of Islands | 14,688 | 15,390 |
| Whangarei | 13,402 | 13,200 |
| Hobson | 5,398 | 5,130 |
| Otamatea | 6,202 | 6,160 |
| Rodney | 20,157 | 24,640 |
| Waiheke | 2,352 | 2,520 |
| Great Barrier Island | 267 | 270 |
| Franklin | 17,034 | 16,800 |
| Raglan | 9,366 | 8,990 |
| Waikato | 15,586 | 15,720 |
| Waipa | 15,065 | 14,980 |
| Otorohanga | 9,980 | 9,820 |
| Waitomo | 6,419 | 5,620 |
| Taumarunui | 6,246 | 5,520 |
| Coromandel | 3,370 | 3,850 |
| Thames | 3,852 | 4,260 |
| Hauraki Plains | 5,309 | 5,100 |
| Ohinemuri | 4,072 | 4,170 |
| Piako | 11,511 | 11,050 |
| Matamata | 13,543 | 13,430 |
| Tauranga | 15,655 | 17,240 |
| Rotorua | 17,244 | 18,330 |
| Taupo | 14,054 | 13,640 |
| Whakatane | 14,706 | 14,250 |
| Opotiki | 6,556 | 6,210 |
| Waiapu | 4,974 | 4,370 |
| Waikohu | 3,247 | 3,240 |
| Cook | 8,445 | 8,270 |
| Wairoa | 5,869 | 5,360 |
| Hawke's Bay | 20,874 | 21,300 |
| Waipawa | 3,486 | 3,450 |
| Waipukurau | 3,038 | 3,980 |
| Dannevirke | 3,886 | 3,660 |
| Woodville | 1,497 | 1,440 |
| Clifton | 2,080 | 2,000 |
| Taranaki | 8,682 | 9,500 |
| Inglewood | 2,962 | 2,840 |
| Stratford | 5,298 | 5,080 |
| Egmont | 5,748 | 5,470 |
| Eltham | 3,065 | 2,880 |
| Waimate West | 2,460 | 2,320 |
| Hawera | 4,522 | 4,310 |
| Patea | 2,956 | 2,710 |
| Waimarino | 1,583 | 1,370 |
| Waitotara | 2,824 | 2,800 |
| Wanganui | 2,924 | 2,830 |
| Rangitikei | 14,515 | 15,610 |
| Kiwitea | 1,872 | 1,720 |
| Pohangina | 924 | 870 |
| Oroua | 4,763 | 4,960 |
| Manawatu | 6,470 | 6,410 |
| Kairanga | 5,747 | 6,100 |
| Horowhenua | 12,237 | 13,490 |
| Hutt | 34,270 | 26,530 |
| Pahiatua | 2,238 | 2,030 |
| Akitio | 940 | 880 |
| Eketahuna | 1,437 | 2,000 |
| Masterton | 4,092 | 3,790 |
| Wairarapa South | 2,572 | 2,530 |
| Featherston | 3,032 | 2,860 |
| Totals, North Island | 569,488 | 458,350 |
| South Island— | ||
| Marlborough | 9,316 | 9,500 |
| Awatere | 1,669 | 1,570 |
| Kaikoura | 3,070 | 3,180 |
| Golden Bay | 3,375 | 3,280 |
| Waimea | 15,825 | 15,750 |
| Buller | 3,259 | 3,060 |
| Inangahua | 2,219 | 1,960 |
| Grey | 4,437 | 4,120 |
| Westland | 5,677 | 5,870 |
| Amuri | 2,706 | 2,600 |
| Cheviot | 1,520 | 1,500 |
| Waipara | 2,724 | 2,590 |
| Ashley | 2,913 | 3,010 |
| Rangiora | 4,020 | 4,230 |
| Eyre | 2,524 | 2,860 |
| Oxford | 1,561 | 1,620 |
| Malvern | 6,413 | 6,460 |
| Paparua | 27,147 | 31,770 |
| Waimairi | 61,490 | 69,900 |
| Heathcote | 7,582 | 8,630 |
| Mount Herbert | 683 | 740 |
| Akaroa | 1,552 | 1,520 |
| Chatham Islands | 716 | 730 |
| Wairewa | 687 | 650 |
| Ellesmere | 7,512 | 8,020 |
| Ashburton | 11,209 | 11,000 |
| Strathallan | 9,273 | 9,200 |
| Mackenzie | 5,159 | 8,960 |
| Waimate | 5,346 | 5,030 |
| Waitaki | 9,419 | 8,050 |
| Waihemo | 1,714 | 1,670 |
| Waikouaiti | 4,029 | 3,730 |
| Taieri | 7,945 | 7,970 |
| Bruce | 3,574 | 3,460 |
| Clutha | 5,713 | 5,500 |
| Tuapeka | 4,130 | 3,910 |
| Maniototo | 2,628 | 2,520 |
| Vincent | 3,981 | 3,790 |
| Lake | 2,935 | 3,580 |
| Southland | 26,518 | 26,190 |
| Wallace | 12,038 | 13,110 |
| Fiord | 135 | 140 |
| Stewart Island | 414 | 410 |
| Totals, South Island | 296,807 | 313,340 |
| Totals, Administrative Counties | 866,295 | 771,690 |
note—Where more than one reference to a subject is given, the chief reference, wherever it has been possible to determine it, is indicated by bold type. Two or more references to a subject so indicated signify major, and approximately equal, importance.
A
- Abattoirs, registered, 387
- Abortion, 104, 114, 150
- Accident Compensation Act, 316, 359, 897-899, 1071
- Accident insurance, 839-841, 897-899
- Accidents—
- aircraft, 115, 151, 331
- drowning, 114, 116, 151
- cases treated in hospitals, 151-152
- drowning, 114, 116, 151
- cases of, 312-315, 904
- drowning, 114, 116, 151
- deaths from, 104, 105, 114-116, 313-314, 331, 900
- drowning, 114, 116, 151
- farming, 115, 905-906
- frequency and severity rates, 899-905
- industrial, 115, 897-908
- in home, 115, 151-152
- mining, 115
- motor-vehicle, 115, 151, 312-315
- poisoning, 151, 152
- railway, 115, 151, 299
- time lost through, 900, 902-903
- transport, 115, 116, 151, 312-315
- water, 114, 151
- Acclimatisation of fish, 436
- Accommodation, 144, 942
- tourist, 925-927
- Accommodation licences, 942
- Accommodation services, 144
- Accounts, public, 713-748
- Acts (see legislation)
- Administrative tribunals, 960
- Adolescent dental service, 132
- Adoptions, 95-96, 175
- Adult education, 225-226
- National Council of, 225
- Adultery, 122
- Adults, heights and weights of, 161
- Advances—
- bank, 795-797, 1005
- bank, control policy, 795-797
- bank, reserve ratio, 795
- building societies, 826-830
- rural, 822-823, 824
- Advertisements, medical, 128
- Advertising, radio, television, and press, 344, 345, 346
- Aerated water and cordial industry, 462, 491
- Aerial—
- land survey, 357, 373
- photography and mapping, 373
- topdressing, 327, 393
- work operations, 327, 331
- Aero clubs, 330, 331
- Aerodromes, 329
- Age benefits, 24, 165, 166, 168, 169
- Age distribution of population, 79, 81-83, 84
- Agricultural (see also Farms, Farming Corps, etc.)—
- aviation, 327
- clubs, 210
- Development Conference, 390, 409, 1016
- Economics Research Unit, 234
- machinery, 465, 503
- imports of, 637, 641
- production, 228-229, 372, 832, 988
- Production Council, 391, 710
- research, 228-229, 392
- Workers Act, 884, 895
- Agriculture, 228, 988, 1075
- Agriculture and Fisheries, Ministry of, 233-234, 391-393, 963, 1072
- Aid—
- commonwealth schemes, 40-41
- distribution of New Zealand, 35-36, 38-42
- legal, 257
- Air—
- accidents, 115, 151, 331
- Force, Royal New Zealand, 266-267
- licensing and control, 323
- mails, 325, 329, 333
- navigation services, 323-324
- pollution, 127-128, 365
- Aircraft—
- imports of, 639
- manufacture, 454
- safety of, 907
- types of domestic services, 322, 324
- types of international services, 322, 327
- Air New Zealand, 322, 327, 719, 1016, 1018
- Airport statistics, 329
- Alcoholic liquors—
- consumption of, 675, 1044
- duty on, 648, 724
- exports of, 604, 606
- imports of, 635, 639
- manufacture of, 490-491
- sale of, 941-942, 1069
- Alexander Turnbull Library, 346, 347
- Aliens, 77-78
- Aluminium, 454
- Amenities of dwellings, 524
- Ambulance services, 143
- Amortisation of public debt, 743-748
- Amputees, 182
- Amusement tax, 351
- Angling, 436, 929
- Animals, noxious, 418
- Anniversary Days, 894, 945
- Annual Holidays Act, 894
- Annual value system of rating, 749
- Annuities, 187-192
- Antarctic, N. Z. activities in the, 918-921, 1015
- Ante-natal services, 130
- Anzac Day Act, 894
- ANZAM, 37
- ANZUK, 37, 267
- ANZUS Treaty, 26, 29, 38
- Apiaries and apiculture, 413
- Apples, 398, 404
- consumption of, 406, 674, 675
- exported, 556-557, 604, 606, 623, 995
- marketing of, 404-405, 406, 556-557
- Apprentices, 853-854
- Arable farming, 377-378, 397-407, 988
- Arahanga, G.M.V. 294, 326
- Aramoana, G.M.V. 294, 326
- Aranui, G.M.V. 294, 326
- Aratika, G.M.V. 294, 326
- Arbitration Court, 24, 25, 49, 240, 881, 1014
- Area of New Zealand, 356
- of farmland, 377, 378
- of forested land, 414
- Armed Forces—
- honours and awards conferred, 977-978
- in war, 268-269, 1013, 1014
- pay and allowances, 682, 684, 687
- serving overseas, 267-268
- strengths of, 268-269, 969
- superannuation, 187-189
- Army, 265-266
- Arson and incendiarism, 843
- Art galleries, 1022
- Articles on special subjects in previous issues, 1019-1020
- Artificial aids (under Social Security), 139
- Arts in New Zealand, 1021-1023, 1033
- Asbestos, 447
- Asian Development Bank, 24, 31, 35, 41, 692, 719, 815
- Assessable income, 768-773
- Assessment of—
- income tax, 767
- land tax, 735-736
- Assurance, life, 835-838
- Auckland Harbour Bridge (see also Harbour Bridge Authority), 50, 301
- Auckland Regional Authority, 52, 752, 753
- Audio-visual teaching aids, 211-212
- Audit Department, 963
- Australia—
- trade with, 283, 584, 585, 586, 588-589, 591 593, 609, 612, 613, 632, 646, 647, 695-698
- Free Trade Agreement with, 588-589, 599
- New Zealand representation in, 977, 978
- representation in New Zealand, 979
- shipping to and from, 283
- Australia—continued
- Social security reciprocity with, 173
- visitors and migrants from, 74, 924
- Aviation, 322-331
- agricultural, 327
- Awards, cultural, 1021-1023
- Awards to armed forces personnel, 270, 977-978
B
- Bacon and ham—
- consumption of, 674
- curing, 462, 487-488
- Balance of payments, 690-704, 1076
- capital account, 693-694
- current account, 693-694
- insurance, 698
- overseas direct investments in New Zealand, 698, 699, 700-704, 783
- survey of companies with overseas affiliations, 700-704
- Balance of trade, 591
- Bananas—
- consumption of, 674
- imports of, 558, 635, 639, 644, 913
- Bank notes, 787, 789
- denominations of, 806
- in circulation, 806, 1005
- Bank of New Zealand, 790-791, 1011
- Bankruptcy, 936-938, 1008
- industry groups of bankrupts, 938
- Banks and banking, 786-816, 1005, 1028
- assets and liabilities, 789-800
- economics, publications of, 1028
- merchant banks, 804
- overseas assets of, 808, 1005
- savings, 797-801, 1006
- Barley, 398, 399, 400, 604, 606, 988
- Beds, hospital, 144
- Beef—
- cattle, 408, 989
- consumption of, 674, 675
- exports of, 547-548, 615-616, 993
- production of, 377, 381, 382, 383, 386, 399, 408, 487
- retail prices of, 660
- slaughterings for, 487
- Beer—
- consumption of, 675
- duty on, 648, 649, 724, 1070
- export of, 604, 606
- production of, 490
- Bees, 413
- Beeswax, 413
- Beneficiaries Price Index, 1077
- Benefits, adjustments and exemptions, 169
- Benefits, social security, 137-140, 162-174, 685, 687, 688, 1077
- Bentonite, 439, 447
- Berryfruit, 405
- Beverage industries, 462, 490-491, 628, 703, 793
- Bibliography, New Zealand publications, 944-945, 1026-1038
- Big-game fishing, 436, 929
- Bird sanctuaries, 368
- Biological survey, 362
- Biology publications, 1031-1032
- Birth rate, 87-91
- Birthplaces of population, 85
- Births, 87-96, 983
- ex-nuptial, 93-95, 96
- first, 92-93, 175
- multiple, 90
- of Maoris, 88
- registration of, 88, 96
- still, 91, 96, 113
- Biscuit industry, 462, 489
- Blind, benefits for and education of, 172, 199
- Board of Health, 126
- Boarding of school children, 209
- Boat building and ship repairing, 465
- Boilers, inspection of, 907
- Bonds, National Development, 799
- Bonus Bonds, 799
- Bonus issue tax, 732
- Book publishing, 944
- Books—
- imports of, 639
- library, 348-350
- New Zealand, 1026-1038
- Boroughs, 50, 63-64, 279, 749-750, 752-753
- area of, 63-64
- capital and unimproved values, 279
- councils, 50, 758
- debt, 757, 759, 760, 1004
- franchise, 50
- number of, 50
- population, 63-64, 1079
- stores in, 568
- Borstal institutions and training, 242, 251
- Breeding ewes, 410
- Breweries, 462, 490
- Brick productions, 499, 515
- Brides and grooms, 118-119
- Bridges and bridging, 293, 300-301, 304
- Brigades, fire, 843
- Britain—
- New Zealand representation in, 978
- relations with, 28-31
- representation in New Zealand, 979
- British—
- Airways, 327
- postal orders, 334
- sovereignty, 23
- trade preference, 646, 647
- Broadcasting, radio and television, 340-345
- for schools, 212, 342
- local, 342
- stations, 342
- Building (see also Housing), 505-526, 1067
- board, exports, 603, 605
- imports of, 640, 643
- business of private contractors, 508
- imports of, 640, 643
- Census of, 507
- imports of, 640, 643
- costs, 507, 514, 519
- imports of, 640, 643
- employment, 513
- imports of, 640, 643
- index of production, 706
- imports of, 640, 643
- Industry Advisory Council, 506, 513, 710
- imports of, 640, 643
- materials, 499, 513-514, 519, 525
- imports of, 640, 643
- overseas investment in, 703
- permits, 509-511, 1067
- persons engaged in, 508, 849
- programming, 505
- wages and working hours of employees, 483-484, 878-879
- work put in place, 512-513
- Building societies, 515, 805, 826-830
- assets and liabilities of, 829
- Bullion production, 446
- Burials, 102-103, 126
- Bursaries—
- dental, 132
- ex-servicemen's children, 182
- teachers, 214
- university, 214-215
- war, 182
- Buses, 299-300, 307, 309, 312, 316
- Bush, 414-415
- Business—
- census of, 564-571, 572-578
- failures, 937, 1008
- loans, 826
- Butter (see Dairy produce)
- Butterfat (see Milkfat)
C
- Cabinet, 48
- Cable tramway, 318, 321
- Cables, overseas, 337-338
- Cadet Corps, 267
- Cadets, navy, 265
- Calves, slaughter and marketing of, 387
- Campbell Island, 2, 56, 232
- Camps, health, 131, 141
- Canada—
- New Zealand representation, 978
- reciprocal trade with, 587, 594, 610, 613, 647
- representation in New Zealand, 979
- Canberra Pact, 29
- Cancer—
- ages of decedents, 107
- deaths from, 106-109, 149
- site of disease, 108, 109
- Society of New Zealand, 106, 134, 142
- Canned and preserved meats, etc., exported, 604, 605
- Canned fruits—
- consumption of, 639, 674
- production of, 462, 490
- Canned vegetables—
- consumption of, 674, 675
- exports of, 606, 608
- production of, 462, 490
- Capital—
- expenditure on farms, 379, 380
- expenditure, railways, 297
- formation, 679-686
- invested in electric-power undertakings, 537, 540
- invested in manufactured industries, 459, 480-481
- of companies, 830-832, 1008
- transfers, 810
- value of land, 278-280, 748
- Capitalisation of family benefit, 165, 171, 509, 519, 824
- Carbonettes, 444
- Cargo carried by air transport, 325, 326, 327-328
- Cargo handled at ports, 284-289, 291
- Casein exported, 551-552, 601, 604, 605, 620, 995
- Casein produced, 384, 551-552
- Casualties in war, 269
- Catchment authorities, 51, 361, 363, 751
- Cattle, 408, 410, 989, 1011
- hides exported (see Hides, skins, and pelts)
- slaughtered, 387
- Cement—
- exports of, 605
- industry, 464
- production of, 499, 514
- Census, 56
- age distribution of population, 79
- widows, number of, 79
- country of birth, 85
- widows, number of, 79
- educational qualifications, 868
- widows, number of, 79
- employment statistics, 859
- widows, number of, 79
- ethnic groups, 84
- widows, number of, 79
- income earners in each household, 784-785
- widows, number of, 79
- incomes of individuals, 783-785
- widows, number of, 79
- major industrial groups, 861-862
- widows, number of, 79
- marital status, 79-80
- widows, number of, 79
- occupations of married women, 867
- occupations of population, 860
- of agriculture, 399
- of building and construction, 507
- of distribution, 564-571, 572-578
- of dwellings, 520-526
- of home vegetable production, 402
- of libraries, 348-349
- of mining and quarrying, 450
- of pleasure craft, 291
- of poultry, 412
- of religious professions, 83
- of transport to work, 311, 868
- Census—continued
- of travel time, 868
- publications, 1061
- Central Government finance, 713-748, 100—1001, 1070-1074
- Cereals, 398, 399, 400, 401
- consumption of, 675, 988
- Cerebral palsy, 133
- Certificates of title, 272
- Chatham Islands, 2
- schools, 199
- peat wax, 438, 448
- Cheese (see Dairy produce)
- Chemicals and chemical products industry, 464, 497-498, 703
- Chemists, 136-137
- Childbirth accidents, etc., 104, 105, 111-114, 150
- Child health and welfare, 130-131, 174-178, 254-255
- Children and Young Persons Act 1974, 174
- Children—
- adopted, 95-96, 175
- affected by divorce proceedings, 122
- allowances, 162, 163, 164-166, 167-169
- born, number and sexes, 90
- deaths of (see Infant mortality), 98
- dental treatment of, 132
- dependent, 174-175
- delinquent, 176-178, 254-255
- handicapped, 131, 141, 178
- heights and weights of, 157-160
- legitimated, 94
- intellectually handicapped, 131, 141, 178
- offences by, 254-255
- restrictions on employment of, 894, 895
- school, 193-195, 199-210
- under supervision, 178
- Childrens' courts, 176-177, 239
- Children's homes, 131
- China, People's Republic of, 611
- Christchurch-Lyttelton Road Tunnel, 302
- Chronology of principal events, 1011-1018
- Churches, 83
- marriage in, 121
- Cigarettes and tobacco—
- duty on, 648
- imports of, 628, 635, 640
- production of, 462, 492
- Cinemas, 350-353
- Cities and Boroughs, 50, 63-64, 749-750, 752-753
- Cities, area and population of, 64-66, 1079
- Citizenship, 76-77
- Citrus fruits, 398, 404, 913
- imports of, 558, 635, 639, 644
- consumption of, 674
- marketing of, 404
- Civil—
- aviation, 322-331
- defence, 270-271, 756
- jurisdiction, 256
- List, 46, 47, 717
- Civilian Rehabilitation Centre, 133, 851
- Claims, insurance—
- accident, 839-841
- fire, 845
- motor vehicle (third party), 841-843
- Clays, 439, 499
- Clean Air Council, 128, 365
- Clergy of each church, and marriages by, 120-121
- Climate, 13-19
- observations for year, 19-21
- Clinics—
- ante-natal, 130
- child health, 131
- dental, 132
- Clothing and footwear, retail prices of, 656, 661, 1042, 1046, 1069
- Clothing, imports of, 632, 639
- Clothing industry, 463, 493, 703, 776, 832
- Clover, 398, 403-404, 624, 994
- seed (see Grass and clover seed)
- Club charters, 941
- Clutha River, development of, 536
- Coal, 439, 441-444, 449, 450, 529, 531
- and petroleum products industry, 464, 503, 504
- consumption of, 443, 990
- deposits, 8
- exports of, 607
- mining, 441-444
- research, 441
- resources, 441-443
- State mines, 444, 720
- used in gas industry, 990
- Coastal shipping, 284-285
- Coastline, 2, 358, 417
- Co-education, 195, 207
- Cocoa imported, 629, 635, 639
- Cocoa manufacture, 489-490
- Coffee imported, 629, 635, 639, 650, 675
- Coin and coinage, 806
- held by banks, 791
- Colleges—
- teachers', 194, 198, 200, 209, 210-211
- Colombo Plan, 41, 218
- Colonisation, 23
- Commerce Commission, 651, 653
- Commercial failures, 937, 1008
- Commercial radio and television, 342
- Commission for the Environment, 360
- Commodity sales—
- retail, 564-574, 575-580
- wholesale, 571-572, 581-582
- Common Market (see European Economic Community)
- Commonwealth, 36-37
- aid schemes, 40-41
- Commonwealth—continued
- defence, 36-37, 267
- Education schemes, 40
- Strategic Reserve, 267
- Communications, 332-353
- radio, 338-339
- satellite, 338
- Communities, 65
- Community centres, 226
- Community nurses, 135
- Companies, 830-834, 1008
- balance dates of, 783
- bank advances to, 793
- deposits with, 803-804
- finance, 803-804
- financial statements, analysis of, 832-833
- income of, 678, 766, 774-783
- joint stock, 780-781, 830-833
- overseas, 781-782, 830-832
- paid-up capital, 779-781
- private, 780-781, 830-832
- public, 780-781, 830-832
- registered, 831, 1008
- share prices, indices, 670
- taxation of, 732, 766
- with overseas affiliations, 700-704
- Comparisons with other countries (see International comparisons)
- Compensation—
- criminal injuries, 257
- workers, 897-899
- Compulsory—
- arbitration, 883
- unionism, 885
- Computers, 945
- Conciliation service, 882
- Concrete products industry, 500, 514
- Condensate, natural gas, 444
- Confectionery industry, 462, 489-490
- Confinements, 91, 138
- Conjugal status of persons marrying, 118
- Conservation (see Physical environment)
- Consolidated Revenue Account, 165, 304, 305, 306, 557, 713, 716, 721, 723, 1000-1001, 1071
- Constitution of New Zealand, 42-50
- Construction Act, 907
- Construction, building, and housing, 505-526, 823-826
- Consumer Council, 653
- Consumer prices, 671-672
- index, 654-662, 1039-1046, 1069
- Consumer information, 653
- Consumers Prices Index Revision Advisory Committee, 1039, 1047
- Consumption of food, 384, 435, 673-677
- Contagious diseases (see Diseases)
- Containerisation, 281-284
- ports, 281-284
- shipping, 281-284
- traffic, 281-284
- Convictions, 245-255
- for traffic offences, 247
- of juveniles, 254-255
- of women, 248
- Convictions in Magistrates' Courts, 245-248, 316-318, 985
- Convictions in Supreme Court, 243-244, 985
- Cook Islands, 11, 29, 32-33, 40, 41, 56, 74, 85, 212, 268, 627, 644, 909-921, 1012
- constitutional changes, 32
- immigrants from, 74, 85
- population, 56, 911
- public finance, 914
- trade, 810, 913-914
- Cook Strait—
- air freight services, 293, 326
- submarine power cable, 536
- vehicular ferry service, 294, 296, 298
- Co-operative credit associations, 823
- Co-operative dairy companies, 385-386
- Copper ore, 439, 446, 449
- Copra, 913, 916
- Copyright, 935
- Cordial and aerated-water industry, 462, 491
- Correspondence schools and classes, 193, 199, 200, 209, 220
- CORSO, 142
- Cosmetics, manufacture of, 464, 498
- Cost of living, 654-662
- Cotton piece-goods, imports of, 636, 640
- Council for—
- Adult Education, 225
- Educational Research, 224
- Counties, 51, 279
- area of, 65-67
- building values, 512
- capital and unimproved values, 279
- councils, 51, 306, 750
- debt, 757, 1004
- franchise, 51
- population, 65-67, 1080
- roads and roading, 301, 305, 306
- Country Library Service, 347
- County boroughs, 51, 66-67
- County towns, area and population, 63-64, 66-67
- Court of Appeal, 239, 242-243, 256
- Court of Arbitration, 24, 25, 49, 240, 881, 1014
- Courts (see also Supreme, Magistrates, etc.), 239-240
- Judges of, 240-241, 960
- structures and types of, 49, 239
- Cows in milk, 411
- Cranes, inspection of, 907
- Crayfish, 430, 431, 432, 435-436
- exports of, 432, 435-436, 603, 605
- Cream, consumption of, 673
- Credit, rural intermediate, 823
- Creditors' petitions, 937
- Cremation, 102-103, 126
- Crime, law and, 239-260, 985
- Criminal—
- appeals, 239, 240, 242-243
- injuries compensation, 257
- jurisdiction, 242-243
- reformation and punishment, 239-254
- Crippled children (see also Handicapped children), 141
- Crops, 377, 378, 397-407, 988
- Crown land, 272, 273, 365-371, 377
- Crown Law Office, 963
- Cultivation, area in, 377-378
- Cultural awards, 1021-1023
- Currency and banking (see also Exchange), 786-816, 1005
- Currency realignment, 807
- Customs Department, 963
- Customs tariff and revenue, 645-650, 688, 715, 724-726, 1070
D
- Dairy—
- Board, 385-386, 560
- account, 559
- consumption of, 673, 677
- export, 289, 546-548, 549-552, 584-587, 601, 604-605, 618-620, 675, 810, 811, 994, 1076
- export price index, 597
- inspection of, 392
- marketing of, 546-548, 549-552
- prices for, 559-561
- subsidies on, 677
- cows, 384, 408, 989
- account, 559
- consumption of, 673, 677
- export, 289, 546-548, 549-552, 584-587, 601, 604-605, 618-620, 675, 810, 811, 994, 1076
- export price index, 597
- inspection of, 392
- marketing of, 546-548, 549-552
- prices for, 559-561
- subsidies on, 677
- factories, 384, 462, 488
- account, 559
- consumption of, 673, 677
- export, 289, 546-548, 549-552, 584-587, 601, 604-605, 618-620, 675, 810, 811, 994, 1076
- export price index, 597
- inspection of, 392
- marketing of, 546-548, 549-552
- prices for, 559-561
- subsidies on, 677
- farming, 377, 384-386, 399, 408, 761, 766, 793
- account, 559
- consumption of, 673, 677
- export, 289, 546-548, 549-552, 584-587, 601, 604-605, 618-620, 675, 810, 811, 994, 1076
- export price index, 597
- inspection of, 392
- marketing of, 546-548, 549-552
- prices for, 559-561
- subsidies on, 677
- machinery, 396-397, 606
- account, 559
- consumption of, 673, 677
- export, 289, 546-548, 549-552, 584-587, 601, 604-605, 618-620, 675, 810, 811, 994, 1076
- export price index, 597
- inspection of, 392
- marketing of, 546-548, 549-552
- prices for, 559-561
- subsidies on, 677
- produce, 381, 382, 383, 384-386, 392, 488, 673, 998, 1076
- account, 559
- consumption of, 673, 677
- export, 289, 546-548, 549-552, 584-587, 601, 604-605, 618-620, 675, 810, 811, 994, 1076
- export price index, 597
- inspection of, 392
- marketing of, 546-548, 549-552
- prices for, 559-561
- subsidies on, 677
- Deaf, education of, 203, 210
- Death duty, 688
- estates passed for, 739-742
- Death, rates, 87, 97-116
- Maori non-Maori comparisons, 87, 97-98, 99-100
- Deaths, 87, 97-116, 148-150, 983
- accidental (see Accidents)
- by ages, 98
- by causes, 103-111
- distribution over year, 98
- due to earthquakes, 10
- from accidents on farms, 905-906
- from air accidents, 331
- from external causes, 114-117
- in hospitals, 148-150, 152
- in mental hospitals, 156
- international classification, 103
- neo-natal and perinatal, 104, 1-73, 150
- of infants, 111-114,983
- of Maoris, 98, 99-100, 101, 104, 105-106
- of servicemen, 269
- perinatal, 113
- registration of, 102-103
- Debt—
- hospital boards, 146-148
- local government, 756-760, 1003
- public, 685, 689, 743-748, 1002, 1071
- Debtors' petitions, 937
- Decimal currency, 806
- Defence, 262-271, 963
- Civil, 270-271
- expenditure on, 263-264, 689
- science, 263
- services, strength of, 264
- Degrees, university, 215, 218, 219
- Delinquency, juvenile, 176-178, 254-255
- Demography, 55-58, 982
- Demolition of buildings, 509
- Dental—
- benefits (social security), 131, 139, 140
- bursaries, 132
- Council, 135
- health, 132-133
- nurses, 130
- research, 132
- services, 126, 132-133, 135, 139
- Department of—
- Health, 126-161, 163, 908, 964
- Internal Affairs, 908, 965
- Justice, 203, 241, 965
- Labour, 75, 126, 129, 163, 526, 851, 875, 907, 965
- Lands and Survey, 306, 357, 358, 359, 366, 373, 965
- Maori and Island Affairs, 178-179, 508, 509, 516, 965
- Scientific and Industrial Research, 227-233, 362, 365, 438, 448, 966-967
- Social Welfare, 162-163, 164, 174, 177, 203, 967
- Trade and Industry, 290, 456, 598, 600, 651-653, 711, 967, 1072
- Departments, Government (see also under individual Departments), 48-49, 126, 952-953, 961-962
- Departures (see Migration)
- Dependants of servicemen, pensions for, 180-182, 184
- Dependent children, 168, 174-175, 180
- Deposits—
- interest rates on, 792, 799-800, 802-803
- time, 791, 792
- with building societies, 829-830
- with Reserve Bank, 789-800
- with savings banks, 797-801, 1006
- with stock and station agencies, 759, 802
- with trading banks, 802
- Depreciation allowances, 733
- Desertion in marriage, 122, 170
- Designs, registration of, 934
- Detention centre, 241-242, 251
- Development Finance Corporation, 456, 712, 719, 816
- Diagnostic laboratory services, 138, 140
- Diatomite, 439, 447
- Diesel and diesel-electric rail transport, 294, 295
- Dietitians, 136
- Diphtheria, whooping cough, and tetanus immunisation, 131
- Diplomas, 218, 223
- Diplomatic representation, 978-979
- Direct private investment, 698, 699, 700-704
- Disabled Re-establishment League, 133
- Disabilities from industrial accidents, 900
- Disability war pension, 181-184
- Disabled civilians, rehabilitation of, 133, 851
- Disabled servicemen, 179-181, 181-184
- Discount rates, 789
- Diseases—
- deaths from, 104-114, 148-150
- mental, 154-156
- occupational, 129
- treated in hospitals, 148-150
- Displaced persons, 75
- Disputes, industrial, 881-884, 1010, 1012, 1015
- Disqualified drivers, 313
- Dissolution of marriage, 121-123
- Distribution—
- census of, 564-574
- of labour force, 849
- of population, 60-69
- by ages, 79, 81-83
- by industries, 861-862
- District Councils, 53, 303
- District Community Councils and Community Councils, 53, 65
- District planning, 54, 357-358
- District high schools, 195, 206, 209
- Dividends—
- assessable, 778-781
- taxation on, 730
- totalisator, 743
- Divorce, 118, 119, 121-123
- Divorced persons remarrying, 118, 119
- Doctors (see Medical practitioners)
- Dogs, 412
- Dolomite, 439
- Domains, public, 369
- Domestic assistance, 139
- Domestic proceedings, 258
- Domestic purposes benefit, 170
- Domestic trade, 564-583, 1068
- Dominion, 28
- Drainage boards, 751, 752, 758
- number of, 51
- Drivers' licences, 307, 315
- Drowning accidents, 114, 116
- Drugs, 128-129, 137
- dangerous, 245
- therapeutic, 128
- Drunkenness, 244, 248, 250, 316
- Duties—
- cheque, 742
- customs and excise, 645-650, 715, 724-726
- estate and gift, 724, 737-742
- instruments, 724, 742
- lottery, 742
- Dwellings (see also Houses and flats), 505-526
- amenities, 524
- census of, 520-526
- materials used, 519, 525
- number of rooms and occupants, 518
- tenure, 523
E
- Earthquakes, 9-12, 1011, 1013
- Earthquake and War Damage Insurance, 845-846
- Earthquake magnitudes, 10
- Earth resources, satellite programme, 357, 365
- Ecological survey, 362
- Earths, soil types, 374-376
- Economic—
- aggregates, 678-712
- pensions, 180, 181
- planning, 710-712
- Economic Commission for Asia and the Far East (ECAFE), 29, 31, 34, 35,
- Education (see also Schools), 193-226, 984, 1072
- Act, 193, 896, 1012
- adult, 225-226
- annual appropriations, 718
- boards, 193-194, 198
- buildings, 197-199, 505, 509
- Commonwealth scheme, 40
- Continuing, 225-226
- Community Colleges, 194
- Department of, 178, 193, 202, 203, 204, 209, 212, 220, 225, 853, 909, 963
- dental health, 132
- development, 223
- expenditure on, 195-197, 689, 714-715, 718, 722, 1001
- handicapped children, 203-204
- health, 131-132
- higher, 213-215, 984
- Maori, 199, 205, 206, 224
- Pacific Islands, 226, 909
- pre-school, 195, 199, 204
- primary, 193, 194, 196, 199, 200, 204-206, 984
- psychological service, 203
- Education—continued
- publications, 212, 1029-1030
- rural, 208-210
- secondary, 193, 196, 199, 200, 206-208, 226, 984
- special classes, 195, 199
- system, 193-195, 203-204
- technical, 220-223, 853, 984
- training of teachers, 210-211
- University, 213-220
- Educational—
- Attainments, 207
- Development Conference, 194, 223
- planning, 193
- qualifications of labour force, 223, 784, 868
- Educational, Scientific and Cultural Organisation (UNESCO), 35
- Eels, 437
- Effective weekly wage rates, 879-880
- Eggs—
- consumption of, 673, 676, 677
- export of, 604, 605
- marketing of, 412, 557-558
- production, 412
- retail price of, 660
- subsidy on, 557-558
- Elderly, housing of, 516
- Elections, general, 46, 50
- Electoral—
- Act 1956, 44, 49
- Representation Commission, 44
- roll, 50
- Electorates, 953
- Electric—
- appliances in homes, 524
- boards, 51, 191, 538
- estimates, 528, 529, 536
- finance of, 537, 1004
- in manufacturing industries, 473-474
- power, 444, 528, 531, 533-542, 1015
- boards, 51, 191, 538
- estimates, 528, 529, 536
- finance of, 537, 1004
- in manufacturing industries, 473-474
- railways, 294
- stations, 533-535
- supply account, 720
- Electrical machinery and appliances imported, 631, 637, 639
- Electrical machinery and appliances industry, 465
- Electricity Department, 963
- Electronics, manufacture, 454
- Embassies, 979-980, 1018
- Emergency benefits, 165, 166, 169, 173
- Emigration, 71-74
- Employers—
- liability insurance, 839, 845
- unions, 885-888
- Employment, 847-869
- building, 513
- by local authorities, 857-858
- centres, 851
- forestry, 428
- in coal mining, 444
- in retail stores, 572
- in service establishments, 576
- in wholesale stores, 574
- Index of, 706
- on farms, 379
- placement service, 851, 859
- promotion, 851
- public service, 856-857, 969
- regulations affecting, 893
- survey of, 855-857
- vacancies, 859
- women in labour force, 865-868
- Endowment, land, 366-367
- Energy, 527-545
- Energy Resources, Ministry of, 530, 532, 964 1072
- Engineering industries, 465, 703
- Environment—
- Commission for, 360
- physical, 354-365
- research in, 231
- Environmental health, 127
- Epilepsy, 142
- Equal pay, 874, 1018
- Erosion, 7, 8, 327, 364
- protection, forest, 418
- Estate duty, 724, 737-742, 1070
- Estates—
- administered by Public Trust Office, 936
- assigned, 937
- passed for death duty, 739-742
- Ethnic groups, 84
- Europe, relations with, 26
- European Economic Community (EEC), 27, 29, 30, 548, 552-554, 584, 586, 589, 594, 597, 610, 612, 633, 695-698, 1016, 1018
- investment in New Zealand, 702
- trade with, 547, 552-554
- European Free Trade Association (EFTA), 589, 594, 597, 610, 612, 633
- Events, historical, 1011-1018
- Ewes, breeding, 410
- Examinations, 202-203, 218
- Excess retention tax, 733
- Exchange allocation, 787, 807-808, 812
- Exchange (currency)—
- control of, 787, 807-808, 812
- New Zealand—London, 807
- rates of, 807-808
- Exchange transactions, overseas, 786, 808-814, 1076
- Exchanges, telephone, 335, 336
- Excise duties, 648, 715, 724
- Executive council, 47
- Ex-nuptial infants, 93-95, 96, 175
- ages of mothers, 94
- births of, 93-94, 95, 96, 175
- legitimation of, 94
- paternity, 258-259
- Ex-nuptial infants—continued
- protection of, 175
- registration of, 94
- Exotic forest, 356, 416, 417, 428
- Expectation of life, 100-102
- Expenditure—
- broadcasting and television, 344-345
- cinemas, 351
- civil aviation, 324
- defence, 263-264, 689
- education, 195-197, 714-715, 718, 722
- electric power, 537
- farms, 379-380
- Forest Service, 419
- government (see Government Finance)
- health, 127, 714-715, 718, 722
- hospital boards, 146-148
- insurance companies, 839-841, 842-843, 1009
- local government, 304, 305-306, 751-753, 1003
- national, 678-690
- National Roads Fund, 304, 723
- Post Office, 339
- Railways, 295-297, 987, 1066
- rehabilitation, 185, 689
- research, 236-237
- roads, 303, 304, 722-723, 1073
- social security, 165-166
- social services, 166, 714-715, 718, 722, 1001
- urban transport, 319
- war pensions, 183, 185
- Explosives, 908
- Export Guarantee Office, 456, 601
- Export-Import Corporation, 456, 601
- Exports and Shipping Council, 558
- Exports (see also under individual products) 289, 387, 435-436, 601-627, 810, 991-997, 1075
- by ports, 287, 288, 626-627
- value, 603-604, 605-606
- volume, 603-604
- dairy produce, 555-556
- meat, 546-548, 555, 1040
- index numbers, 666-667, 671-672
- index numbers, 597-598
- classification of, 607-609
- value, 603-604, 605-606
- volume, 603-604
- dairy produce, 555-556
- meat, 546-548, 555, 1040
- index numbers, 666-667, 671-672
- index numbers, 597-598
- commodities exported—
- value, 603-604, 605-606
- volume, 603-604
- dairy produce, 555-556
- meat, 546-548, 555, 1040
- index numbers, 666-667, 671-672
- index numbers, 597-598
- control of, 598
- dairy produce, 555-556
- meat, 546-548, 555, 1040
- index numbers, 666-667, 671-672
- index numbers, 597-598
- destination of, 586-589, 593-598, 609-625
- index numbers, 666-667, 671-672
- index numbers, 597-598
- gross farming income from, 383
- index numbers, 666-667, 671-672
- index numbers, 597-598
- incentive scheme, 598, 735
- index numbers, 666-667, 671-672
- index numbers, 597-598
- licences, 598
- index numbers, 666-667, 671-672
- index numbers, 597-598
- of manufactures, 455
- index numbers, 666-667, 671-672
- index numbers, 597-598
- pulp and paper, 425-427
- index numbers, 666-667, 671-672
- index numbers, 597-598
- prices, 559-561
- index numbers, 666-667, 671-672
- index numbers, 597-598
- timber, 425-427
- index numbers, 597-598
- value of, 592-598, 602, 810, 811, 991-998
- index numbers, 597-598
- volume, 597-598, 603-604, 992-996
- index numbers, 597-598
- Ex-servicemen—
- dependants of, 180-182, 184
- disabled, 179-181
- pension for, 179-181
- rehabilitation, 179
- External—
- migration (see also emigration, immigration), 56, 71-74, 1065
- trade, 584-672, 991-996
F
- Factories, 451-504, 505, 509, 999
- accidents in, 898-900
- Act, 894
- classified by size, 470
- coal consumed in, 474-475
- dairy, 384, 462, 488
- employees, 459-461, 470-473, 999
- expenses of operation, 480
- fire losses, 843
- summary of operations, 484-485
- Factory production, 451-504, 999
- Family—
- and the law, 257-260
- benefits, 162, 163, 164-166, 167-169, 171, 689
- capitalisation of, 165, 171, 509, 519, 824
- homes, 178
- planning, 131
- Farm—
- accidents, 115, 905-906
- capital expenditure, 379-380
- classification by types, 377
- imports of, 637, 641
- production of, 503
- consumption of, 384, 673
- export of, 288-289, 584, 992-996
- marketing of, 546-564
- index of, 382, 383, 706
- advisory service, 392
- capital expenditure, 379-380
- classification by types, 377
- imports of, 637, 641
- production of, 503
- consumption of, 384, 673
- export of, 288-289, 584, 992-996
- marketing of, 546-564
- index of, 382, 383, 706
- area in cultivation, 377, 378
- capital expenditure, 379-380
- classification by types, 377
- imports of, 637, 641
- production of, 503
- consumption of, 384, 673
- export of, 288-289, 584, 992-996
- marketing of, 546-564
- index of, 382, 383, 706
- employees, 379, 880
- classification by types, 377
- imports of, 637, 641
- production of, 503
- consumption of, 384, 673
- export of, 288-289, 584, 992-996
- marketing of, 546-564
- index of, 382, 383, 706
- rates of pay, 880
- classification by types, 377
- imports of, 637, 641
- production of, 503
- consumption of, 384, 673
- export of, 288-289, 584, 992-996
- marketing of, 546-564
- index of, 382, 383, 706
- finance, 371, 793, 822-823
- classification by types, 377
- imports of, 637, 641
- production of, 503
- consumption of, 384, 673
- export of, 288-289, 584, 992-996
- marketing of, 546-564
- index of, 382, 383, 706
- gross farming income, 381-382, 383
- classification by types, 377
- imports of, 637, 641
- production of, 503
- consumption of, 384, 673
- export of, 288-289, 584, 992-996
- marketing of, 546-564
- index of, 382, 383, 706
- holdings, 377
- classification by types, 377
- imports of, 637, 641
- production of, 503
- consumption of, 384, 673
- export of, 288-289, 584, 992-996
- marketing of, 546-564
- index of, 382, 383, 706
- incomes, 381-382, 383
- imports of, 637, 641
- production of, 503
- consumption of, 384, 673
- export of, 288-289, 584, 992-996
- marketing of, 546-564
- index of, 382, 383, 706
- industry reserves, 563-564
- imports of, 637, 641
- production of, 503
- consumption of, 384, 673
- export of, 288-289, 584, 992-996
- marketing of, 546-564
- index of, 382, 383, 706
- machinery, 396-397, 465
- imports of, 637, 641
- production of, 503
- consumption of, 384, 673
- export of, 288-289, 584, 992-996
- marketing of, 546-564
- index of, 382, 383, 706
- produce—
- consumption of, 384, 673
- export of, 288-289, 584, 992-996
- marketing of, 546-564
- index of, 382, 383, 706
- production, 381-382, 383, 390, 988, 998, 1067
- index of, 382, 383, 706
- settlement and assistance, 369-371
- subsidies, 395-396
- tractors, 397
- Farming, 374-413, 776
- arable, 377-378, 397-407
- cattle, 408, 410
- dairy, 377, 399, 408
- investment in, 703
- nature of, 377
- occupations, 379
- sheep, 376, 377, 399, 408, 410
- stud, 378, 399
- Fathers, ages of, 91
- Federation of Labour, 559, 885
- Female suffrage, 50, 1012
- Female wage rates, 470-473
- Fencing, 380
- Ferry services, 293-294, 296, 297
- Fertiliser—
- imports of, 288, 631, 636, 640
- industry, 464, 487, 497
- land topdressed with, 393
- subsidy, 395-396
- Fibreboard, 424
- Fiction, selected New Zealand, 1034-1035
- Film-hire tax, 724
- Filmmaking, 1021
- Finance—
- and investment, 817-834
- companies, 803-804, 805
- farm, 371, 793, 822-823
- for electricity, 537
- Government, 688-689, 713-748, 1000-1001, 1070-1074
- hospital board, 146-148
- housing, 514
- local government, 689, 1003
- Social security, 165
- Fines, 241
- Fire—
- boards, 51, 191
- brigades, 843
- districts, 843
- insurance, 841-843, 1009
- losses, 843
- prevention in forests, 418
- Service Council, 843
- Fires—
- causes of, 843
- on vessels, 291
- First births, 92-93
- Fish, 5
- acclimatisation of, 436
- and fisheries, 430-437
- catch, 433
- consumption of, 435, 674
- exported, 432, 435, 436, 605, 625
- imported, 629, 639
- mercury level in, 435
- value of production, 432-434
- Fishing, 430-437, 706, 793, 928
- big-game, 436
- industry, index of production, 706
- Industry Board, 432
- grounds, 430
- vessels, 431
- Fixed deposits, 791, 792, 802
- Flats (see Houses and flats)—
- pensioners', 141, 509
- Flax, linen, 407, 462
- Flax, phormium (see Phormium)
- Flood prevention, 5
- Flour, production of, 489
- Fluoridation, 133
- Fodder crops, 398
- Food—
- And Agriculture Organisation (FAO), 35, 218 and Drug Act, 128, 129
- consumption, 673-677
- imports of, 632, 633, 638, 639
- inspection and sale of, 128
- poisoning, 128
- production, 462
- retail prices of, 660, 1040, 1046, 1069
- subsidies, 677
- Footwear and clothing, retail prices of, 656, 661, 1069
- Footwear industry, 463, 493, 776, 793
- imports of, 632
- Foreign Affairs, Ministry of, 30, 964, 1072
- Foreign citizenship, 76
- Foreigners, naturalisation of, 76, 77
- Foreign policy, 28-42
- Forest—
- conservation, 355-356
- exotic, 416, 417, 428
- fire prevention, 418
- indigenous, 414-415, 416, 428
- private, 419
- produce exported, 426-427, 603, 1076
- Research Institute, 362
- resources, 414-415
- service, 229, 359, 361, 362, 964, 1072
- State, 359, 414-429
- utilisation, 420-425
- Forestry, 1, 414-429, 735, 776, 832, 1075
- development and future prospects of, 428-429
- Development Conference, 429
- Development Council, 429, 710
- overseas investment in, 703
- persons engaged in, 428
- publications, 417
- research, 419, 427-428
- taxation incentives, 735
- training, 428
- Forty-hour week, 894
- Fowls, 412
- Franchise, central government, 49, 1012
- Franchise, local government, 50
- Freehold land, 274, 370, 371, 377, 1075
- Freight—
- carried by air transport, 325, 329
- carried by shipping, 284-289
- carried by trains, 298
- Freshwater fisheries, 436-437
- Friendly societies, 174
- Frost, 17, 19, 21
- Frozen foods, 490
- Frozen Foods—continued
- consumption of, 674, 675
- export, 604, 606
- Fruit—
- berry, 405
- citrus, 398, 404, 913
- consumption of, 674, 1045, 1069
- export of, 289, 602, 604, 606, 995
- imports of, 288, 629, 635, 639, 644, 913
- industry, 404-406
- marketing of, 404-405, 556-557
- stone, 404
- sub-tropical, 406
- Fruit and vegetable preserving industry, 462, 490
- Fuels and lubricants, imports of, 628, 630, 635, 640
- Furniture and fixtures industry, 463, 494, 832, 1042
G
- Gardens, market, and nurseries, 378, 398
- Gas—
- appliances in homes, 524
- Council, 530, 542
- generation and supply, 542-545
- price, 543
- subsidy, 544
- General—
- Agreement on Tariffs and Trade (GATT), 35, 550, 645-646
- Assembly (see Parliament)
- Assembly Library, 346-347
- Elections, 46, 50, 943
- wage orders, 871
- Geographical features, 2-6
- Geological Survey, 229, 448-449
- Geology, 7-9
- maps, 448-449
- publications, 9, 1031
- Geophysics Division, 231
- Geothermal steam, electric power stations, 229, 527, 535, 1015
- Geysers (see Thermal activity)
- Gift duty, 724, 737-739
- Glaciers, 4, 9
- Glass and glass products industry, 464
- God Defend New Zealand, 948
- Gold—
- discovery of, 5
- exported, 609
- mining and production, 439, 446, 1011
- reserve, 787
- Goods carried on railways, 298, 987
- Government—
- departments (see also under individual names), 48-49, 952-953, 961-962
- employees, 963
- finance, 166, 688-689, 1000-1001, 1070-1074
- houses, sale of, 825
- housing, 518, 825-826
- Life Insurance Office, 964
- Railways (see Railways)
- Industrial Tribunal, 896
- Printing Office, 964, 1072
- superannuation fund, 186-189, 773, 805
- system of, 42-54
- Governor-General, 949-950
- power, duties, etc., 42, 43, 44, 45, 47, 239
- Graduates, university, 210, 219
- Grain—
- crops, 397, 399, 988
- milling, 462, 489
- Grapes and vineyards, 398, 406
- Grass and clover seed, 398, 403-404, 624, 994
- exports of, 995
- Grasses, 398, 403-404
- Grassland and grasses research, 234, 398
- Grasslands, 398
- Greenstone, 439, 448
- Groceries, retail prices of, 660-661
- Gross—
- capital formation, 679-686
- of Central Government, 743-748, 1002
- of local government, 756-760, 1003
- domestic expenditure, 679-683
- of Central Government, 743-748, 1002
- of local government, 756-760, 1003
- domestic product, 708-709
- of Central Government, 743-748, 1002
- of local government, 756-760, 1003
- farming income, 381-382, 383
- of Central Government, 743-748, 1002
- of local government, 756-760, 1003
- indebtedness—
- of Central Government, 743-748, 1002
- of local government, 756-760, 1003
- national product, 678, 679, 680, 681, 682, 1001
- Guardianship, 177-178
H
- Hail, 17
- Halloysite, 447
- Ham (see Bacon and ham)
- Handicapped children, 131, 141, 203-204, 178
- Harbours, 2
- Harbour boards, 51, 191, 750
- Harbour Bridge Authority, 51, 301, 305
- Harvests, 988
- Hay, 398
- Health, 126-161
- Act 1956, and others, 102, 126
- annual appropriations, 689, 1073
- benefits, 127, 137-140, 163-174
- Board of, 127
- camps, 131, 141
- centres, industrial, 908
- child, 130-131
- dental, 132-133
- Department of, 126-161, 163, 964
- education, 131-132
- expenditure, 127, 689, 714-715, 718, 722, 1001, 1073
- hazards, 130
- insurance, 174
- mental, 154-156
- occupational, 129-130
- statistics, 133-134
- Heart disease, 109-110, 149
- Heavy traffic fees, 304, 726
- Heights and Weights of Population, 157-161
- Herbicides, 365
- Hides, skins, and pelts exported, 289, 487, 601, 604, 605, 622-623, 996
- Higher education (see Education)
- Higher School Certificate, 202
- Highways, 303, 304
- taxation, 724, 726, 1067
- Hire purchase trade, 565, 582-583, 1068
- Historic Articles Act, 1023-1024
- Historic Places Trust, 368, 1024-1025
- Historic reserves, 368
- History of New Zealand, 22-28, 1011-1018
- Niue Island, 23
- Tokelau Islands, 23
- Holdings (see Land holdings)
- Holidays, 894, 945-946
- Home-nursing services, 139
- Home service (in war), 270
- Homes—
- accidents in, 115, 151-152
- children's, 131, 178
- joint family, 519-520
- old people's, 141
- Homicide, 115, 151, 244
- Honey, 413
- consumption of, 644, 675
- exported, 605, 676
- marketing of, 558
- Honours conferred, 975-978
- Hops, 406-407, 604, 606
- Horse-racing, 743
- Horticulture, 392
- Hosiery and other knitting mills, 462, 492
- Hospital—
- benefits, 137-140, 165
- Boards, 143, 146-148, 191
- employees, 969
- expenditure, 146-148
- finances of, 146-148
- indebtedness of, 146-148
- districts, 143
- Hospitals (see also Patients), 142-147, 505, 509, 969
- beds in, 144
- deaths in, 148-150, 152
- general, 144
- Karitane, 157
- maternity, 138
- mental, 153-157
- old people's 141
- private, 142, 143, 144
- psychiatric units, 138, 148, 153-157
- public, 144-152
- staff of, 146, 157, 969
- waiting lists, 145
- Hostels, 141, 517, 851
- pre-release, 235
- Hot springs, 929
- Hotels, licensed, 925-927, 941-942
- Hours of work, 483-484, 876-877, 894
- Households, 80-83
- electricity consumption, 537, 542
- incomes of, 82, 784-785, 1048, 1051
- size of, 81-83
- age group of head, 81
- occupational status of head, 81
- Sample Survey, 1039, 1047-1051
- House of representatives, 28, 42, 43, 44-45, 46, 50, 953, 1011
- members of, 42, 43, 44, 46
- Houses and flats (see also Dwellings), 505-526, 823-826
- census enumerations, 520-526
- completed, 509, 1067
- conversion to flats, 509, 1067
- finance of, 508-509, 514-515, 518, 817-822
- for the elderly, 141, 516
- Maori, 516-517
- mortgages, 515, 817-822
- rental value of owner-occupier, 655, 678, 682, 684, 687
- rents, 521-522, 655
- sale of State, 825, 826
- State, 507, 508, 517-519, 825-826
- Housing, 505-526, 658-659, 823-826, 1041, 1046, 1047, 1067, 1069
- Division, Ministry of Works, 518, 817
- of elderly, 141, 509, 516, 826
- rural, 516
- Housing Corporation, 507, 508, 514, 515, 516, 518, 820, 964, 1071
- Humidity, 18
- Hunting, 929
- Hydro-electric power, 527, 528, 529, 533-534
- water sources, 4 5
- Hygiene, 126-128
I
- Ice cream—
- consumption of, 673
- industry, 462, 488-489
- Illegitimacy (see Ex-nuptial)
- Ilmenite, 438, 445
- Immigration, 71-76, 982
- ages of migrants, 70
- assisted, 75
- hostels, 851
- Immigration—continued
- original, 23
- policy, 74-76
- Immunisation, 126, 131
- Import price indexes, 668-669
- Importers, bank advances to, 793
- Imports, 628-644, 810, 991, 1076
- by end use, 643-645
- by ports, 287, 288, 643-644
- classification of, 628-632, 642, 643
- licensing and control of, 598-600
- origin of, 586-589, 593-598, 632-639
- paper and paperboard, 426-427
- payments on account of, 810, 811
- timber, 425-427
- value of, 592-598, 628-641
- volume of, 639-642
- volume index numbers, 596-597
- Income—
- company, 678, 682, 766, 774-783
- earners in each household, 784-785, 1048, 1051
- gross farming, 381-382, 383
- industrial classification of, 776-778
- investment, 765, 770-771, 772
- national, 678-690, 726
- of heads of households, 523, 524
- of individuals, 761-775, 768-773
- of salary and wage earners, 761, 764
- of self employed, 761, 763, 766, 770, 771, 772
- of women, 769, 783
- private, 678, 683, 687
- returnable, 767
- sources of, 761, 770-771
- Income tax, 715, 724, 727-736, 1070
- Indebtedness (see Debt)
- Index numbers—
- building and construction, 706
- commodity prices, 666-667
- consumers' price, 654-662, 1039-1046, 1069
- employment, 706
- export prices, 666-667
- by commodity groups, 666-667
- external trade, volume of, 597-598
- farm production, value and volume, 382, 383 706
- farming costs prices, 665-666
- gross domestic product, 708-709
- gross farming income, 381-382, 383
- import prices, 666-667, 668-669
- manufacturing industries production, value and volume, 482-483, 999
- production, 705-706
- productivity, 706
- reproduction, 90
- retail prices, 656-659
- retail turnover, 579
- share prices, 670
- urban house property price, 515
- volume of production, 482-483, 706
- wage rates, 878-879
- wholesale prices, 662-666, 668-669
- wool prices, 559
- Indigenous forest, 414-415, 416
- Industrial—
- associations, 888
- days lost through, 882, 891-893
- classification of salary and wage payments, 874-875
- days lost through, 882, 891-893
- Commission, 883
- days lost through, 882, 891-893
- conciliation and arbitration, 881-884, 1012
- days lost through, 882, 891-893
- Conciliation Service, 882
- days lost through, 882, 891-893
- Court, 881, 884
- days lost through, 882, 891-893
- Design Council, 935
- days lost through, 882, 891-893
- disputes, 881-884, 1010
- days lost through, 882, 891-893
- distribution of population, 861-862
- days lost through, 882, 891-893
- Health Centres, 908
- days lost through, 882, 891-893
- injuries, 897-908
- days lost through, 882, 891-893
- life assurance, 836-837
- days lost through, 882, 891-893
- Mediation Service, 881
- days lost through, 882, 891-893
- production, 451-504, 1053
- days lost through, 882, 891-893
- Relations Act, 881
- days lost through, 882, 891-893
- research, 230, 456, 457, 1053
- days lost through, 882, 891-893
- stoppages, 881-834, 889-893, 1010
- days lost through, 882, 891-893
- unions, 884-886
- Industrial accidents, 115, 897-908
- compensation paid, 900
- deaths from, 115
- frequency and severity rates, 900
- time lost through, 900
- Industries—
- bank advances to, 793
- aids to development, 456
- export earnings, 455
- manufacturing, 451-504, 999
- aids to development, 456
- export earnings, 455
- Industry—
- environmental protection by, 362
- groups of bankrupts, 938
- persons engaged in, 458-461, 466-470, 999
- State aid to, 714-715, 718, 722, 825, 826
- wages and overtime, 458-461, 470-473, 483-484, 486, 877
- Infant mortality, 111-114, 983
- Injuries, industrial, 899-905
- Inland Revenue Department, 964
- Input-output tables, 704-705, 1052-1064
- Insanity, 153-157
- Insecticides, 327, 365
- Insects and fungi, control in forests, 418-419
- Insolvency, 956, 1008
- Instalment credit trading, 582-583
- Institute of Nuclear Sciences, 229-230
- Instruments, duty on, 724, 742
- Insurance, 835-846, 937, 1009
- accident, 839-841, 1009
- balance of payments, 698
- earthquake, and war damage, 845-846
- employers' liability, 839, 845
- fire, 841-843, 1009
- life, 835-838, 1009
- motor vehicles, third party risks, 316, 840, 841
- policies, 835-838, 1009
- sickness, 174, 839
- State, 844-846
- tax exemptions, 731
- Intellectually handicapped children, 131, 141, 178, 203-204
- Intelligence service, 271, 717
- Inter-industry studies and sector accounts, 704-705, 1052-1056
- Interest—
- credit by savings banks, 1006
- fixed deposits, 1007
- mortgages, 819-820
- public debt, 685, 689, 746, 757
- on local government debt, 757-760
- fixed deposits, 1007
- mortgages, 819-820
- public debt, 685, 689, 746, 757
- on Post Office capital liability, 716
- fixed deposits, 1007
- mortgages, 819-820
- public debt, 685, 689, 746, 757
- on public debt, 717, 745
- fixed deposits, 1007
- mortgages, 819-820
- public debt, 685, 689, 746, 757
- payments to consolidated revenue account, 716
- fixed deposits, 1007
- mortgages, 819-820
- public debt, 685, 689, 746, 757
- rates on—
- fixed deposits, 1007
- mortgages, 819-820
- public debt, 685, 689, 746, 757
- savings banks, 797, 799, 800, 801, 799-800
- stock and station deposits, 802
- Internal Affairs Department, 965
- Internal migration, 1066
- International—
- activities, 26
- air services, 322, 327-329
- Bank for Reconstruction and Development, 35, 292, 692, 719, 744, 745, 814-815, 1092, 1016
- Coffee Agreement, 650
- Finance Corporation, 35, 814-815, 1016
- investment income, 810
- Monetary Fund, 35, 690, 692, 697, 719, 808, 810, 811, 812, 814-815, 1016, 1076
- relations, New Zealand's, 28-42
- Sugar Agreement, 649
- Wool Secretariat, 390
- International comparisons—
- birth and natural increase rates, 87
- cinema attendance, 353
- consumption of foodstuffs, 676
- dairy produce consumption, 676
- doctor to population ratio, 135
- energy consumption, 530
- expectation of life, 102
- external trade per head, 591
- fish consumption, 435
- hire purchase trade, 582
- infant mortality rates, 111
- libraries, 350
- life assurance, 835
- marriage rates, 117
- motor accident, death and injury rates, 315
- newspapers, 345
- population, 57, 86, 87
- heights and weights, 160-161
- prices, 661-662
- public expenditure on education, 197
- research expenditure, 237
- standards of living, 938-939
- telephones, 335
- wages, 880
- wholesale prices, 665
- women in the labour force, 865-866
- Invalids' benefits, 165, 166, 168, 172, 1074
- Inventions Development Authority, 934
- Investment—
- accounts, 803
- and finance, 817-834
- incomes, 765, 833
- in New Zealand and overseas, 700-704, 790
- Settlement Board, 700-704
- pool—National Provident Fund, 191-192
- Reserve Bank, 790
- societies, 826-830
- State, 745
- Invisible imports and exports, 810, 811
- Iron and steel—
- imports of, 288, 631, 637, 640-641
- industry, 446, 454
- Iron ores and ironsands, 289, 438, 439, 445-446
- Irrigation, 393-394
- Island territories, 1-2, 32-33, 56, 134, 225, 909-921
- Islands, 1, 2
J
- Jails, prisoners in, 250-251
- Japan, trade with, 546, 547, 549, 584, 585, 586, 591, 595, 596, 611, 613, 632
- shipping to and from, 283
- Joinery industry, 494
- Joint family homes, 519-520
- Judiciary, 49, 239
- members of, 966
- superannuation of, 187-189
- Juries, 240-241
- Justice, 239-261, 965, 985
- Justice of the Peace, 240
- Juvenile—
- delinquency, 176-178
- offenders, 176-180, 254-255
- working conditions, 895
K
- Karitane hospitals, 157
- Kauri gum, 448, 603, 605
- Kermadec Islands, 11, 56, 1012
- Kindergarten schools, 199, 200, 204
- Knitting mills and hosiery industry, 462, 492
L
- Laboratory diagnostic services, 138, 140
- Labour—
- Department of, 75, 126, 129, 163, 965
- distribution of, 849
- educational qualifications of, 223, 868
- projections, 850-852
- Disputes Investigation Act, 881
- distribution of, 849
- educational qualifications of, 223, 868
- projections, 850-852
- force, 458-461
- distribution of, 849
- educational qualifications of, 223, 868
- projections, 850-852
- hours, 483-484, 876-877
- laws and working conditions, 870-871, 880-881
- Lactose, 384
- Lake Manapouri, 534
- Lakes, 5-6, 359
- Lamb—
- consumption, 674
- exported, 562, 563, 546, 547-548, 616-617, 675, 993
- produced, 386, 408, 487
- Lambs, 409
- slaughtered, 387, 487
- Land, 272-280, 354-373
- classification for soil conservation, 364
- classification by farm types, 377-378
- mortgages on, 817
- conservation, 355
- classification by farm types, 377-378
- mortgages on, 817
- Crown, 272, 273, 354-373
- classification by farm types, 377-378
- mortgages on, 817
- development, 371, 357-358
- classification by farm types, 377-378
- mortgages on, 817
- drainage boards, 51
- classification by farm types, 377-378
- mortgages on, 817
- holdings, 377, 399
- classification by farm types, 377-378
- mortgages on, 817
- Maori, 272-273, 371-372
- registration, 272-276
- settlement promotion, 273, 369-371, 721
- surveys, 373
- tax, 688, 724, 735-736
- tenure, 272, 377
- transfers, 274-276, 1007, 1075
- use, 354-373
- Use Advisory Council, 356-357
- Valuation Court (see Supreme Court)
- valuation of, 276-280, 749
- Lands and Survey Department, 965
- Law (see Legislation)
- and the family, 257-260
- and crime 239-260, 985
- revision of, 239
- Lawn mowers, 485, 503
- Lead, 439, 447
- Leasehold landholdings, 274, 377
- Leather and leather products, 464, 496, 703
- Legal aid, 257
- Legal profession, 241
- Legal tender, 806
- Legislation—
- in force in January 1975, 955-960
- influences on, in New Zealand, 25
- labour and allied, 870-811, 880-881
- passed in 1974, 954
- Legislative authority, 43-45
- Legislative Council, 28, 43
- Legitimations, 94
- Letters, etc., posted, 332-333, 986
- Libraries, census of, 348-349
- Library school, 348
- Library services, 195, 211, 346-350
- Licences—
- aerodrome, 330
- drivers', 307, 315
- export, 598
- flight crew, 330
- import, 598-600
- motor-vehicle, 307-309, 1047, 106
- petroleum prospecting, 444-445
- publicans', 941-942
- radio and television, 345
- restaurant, 941
- transport, 307-309
- Licensing—
- authorities (road services), 310
- Control Commission (liquor), 941-942, 1014
- poll, 943
- trusts, 942
- Licensing of—
- commercial air services, 323
- goods and passenger services, 310
- lotteries and raffles, 940-941
- motor vehicles, 307-308, 1047, 1067
- private hospitals, 143
- sale of alcoholic liquor, 941-942
- shipping vessels, 430
- Life annuity tables, 100
- Life insurance, 835-838
- international comparison, 835
- Life, expectation of, 100-102, 869
- Lighthouses, 290
- Lime—
- for agriculture, 393, 395
- industry, 464
- Limestone, 439, 450
- Linen flax, 407, 462
- Linseed, 403
- Liquor licensing, 941-942
- Literary awards, 1020, 1021-1023
- Livestock, 407-413, 989
- slaughtering, 387
- traffic, 298
- Loans—
- allocation of, 744-745
- by building societies, 826-830
- dates of maturity, 747
- domicile of, 1002
- farm, 822
- forestry, 419
- harbour boards, 750, 752
- hospital boards, 143
- housing, 509
- national development, 719
- of local government, 756-760, 1003
- Loans—continued
- on assurance policies, 838
- overseas, 743, 747
- redemption of, 717, 721, 723, 744, 1071
- State Advances, 823
- Local Authorities (see under Local Government and individual names, e.g., Hospital Boards, Counties, etc.)
- Local Authority Loans Board, 516, 756
- Local Government, 50-54
- advances to, 825
- Commission, 52
- debt of, 756-760, 1003
- districts, 50-52
- employees of, 857-858
- expenditure of, 304, 305-306, 689, 751-753, 1003
- finance of, 689, 1003
- franchise, 54
- health and welfare responsibilities of, 127, 509
- history of, 51-54
- housing by, 509
- investment pool, 191
- number of local authorities, 51
- rates, 689, 749-750
- revenue of, 303-304, 751-753, 1003
- roading of, 303, 306
- stock, 759
- subsidies and grants to, 303, 304, 306, 689, 723, 755
- superannuation, 190
- taxation, 689
- urban transport operated by, 318-321
- Lockouts, 891, 1010
- Locomotives, 295
- Lodges, friendly societies, 174
- Logging, 420-421
- London prices for meat, 562
- Lotteries, 940-941
- duty on, 742, 941
- grants, 141, 941
- Lubricants, and fuels, imports of, 628, 630, 635, 640
- Lucerne, 398, 403
M
- Machinery—
- accidents, 905
- exports, 606
- farm, 396, 503
- imports of, 288, 631, 637, 642-643
- industry, 396, 503, 832, 1068
- safety of, 907
- used in manufacturing industries, 465
- Magistrates' Courts, 49, 123, 239, 240, 244-248, 256, 985
- Magistrates, Stipendiary, 240
- Mails, 986
- air, 325, 329, 333
- Maize, 397, 398, 399, 400
- Malaysia, reciprocal trade with, 647
- Management Services Research Unit, 143
- Manganese ore, 446
- Manila Treaty, 29, 38
- Manpower Planning Unit, 852
- Manufacturing industries, 451-504, 709, 776, 793, 832, 999
- assets of, 480-481
- by employment districts, 458-461
- coal consumed in, 474-475
- development, 451-455, 710
- expenses of operation, 480, 999
- export earnings, 455
- motive power, 473-474
- net output (net value added) in, 458-461, 478-479, 482-483, 999
- persons engaged in, 458-461, 466-470, 849
- stocks, 481-482, 1068
- summary of operations, 484-485
- value of production, 476-477, 482-483, 999
- volume of production, 478-479, 482-483
- wages in, 458-461, 470-473, 877-879, 999, 1075
- Maori—
- Affairs, Board of, 372
- Affairs Dept., 178, 179, 306, 372, 516, 965, 1072
- Appellate Court, 240, 273
- apprentices registered, 845-855
- birth rate, 87, 88
- children, heights and weights of, 159-160
- council, 178, 179
- death rate, 105-106, 107
- education, 199, 205, 206, 224
- Education Foundation, 223
- electorates, 44, 49
- housing, 516-517
- Land Court, 240, 273, 371
- lands, 272-273, 359, 371-372
- life expectancy, 101
- Members of Parliament, 44-46, 48, 953, 1012
- population, 58, 67-68, 70-71, 99, 101, 105-106
- pupils, 206, 207, 224
- Purposes Act 1951, 117
- Trustee, 372
- welfare organisations, 121, 178-179
- Woman's Welfare League, 178-179
- youths, trade training for, 854-855
- Maoris—
- children attending schools, 199, 206
- census of, 70-71
- deaths of, 87, 98, 105-106, 107, 116
- expectation of life, 100
- franchise, 49-50
- history of, 22-25, 27-28
- infant mortality of, 111-114
- natural increase of, 87
- population, 58, 67-68, 70-71, 99, 100, 101, 105-106
- pre-employment courses, 854-855
- Maoris—continued
- scholarships for, 223
- settled on farms, 372
- Maps—
- factory production, 460-461
- mineral resources, 440
- rainfall, 16
- topographical, 373
- Marginal land, 371
- Marine officers certificates, 290, 895
- Marital status, 79-80, 118
- Market gardens, 378, 398
- Marketing of primary produce, 546-564, 1067
- Marriage guidance, 123-124
- Marriages, 117-124, 983
- age of persons, 118
- dissolution and nullity, 121-123
- rates, 117
- Marine pollution, 364
- Maritime parks, 360, 368
- Masseurs (see Physiotherapists)
- Materials used in manufacturing industries, 458-461, 475-476, 999
- Maternal deaths, 114
- health, 130-131
- Maternal welfare, 130-131, 138, 140
- Maternity—
- benefits, 138, 140, 165
- hospitals, 131
- nurses, 135
- Meat—
- consumption of, 675
- export of, 289, 546-548, 597, 601, 604, 605, 810, 811, 993, 1040, 1076
- export price index, 666, 1069
- freezing and preserving industry, 462, 468-487
- wages and hours worked, 878
- industry reserve account, 564
- inspection of, 391
- levy on, 555
- marketing of, 555
- prices for, 562-563
- production, 386, 998
- retail prices, 660
- Meat Producers Board, 388, 548, 562
- Mediation, industrial, 881
- Medical—
- advertisements, 128
- benefits, 137-140, 164, 165
- care societies, 174
- Council, 134
- practitioners, 135, 137, 766
- Research Council, 134
- research foundations, 126
- services, 126-161
- statistics, 135
- Medicine, physical, 135
- Members of Parliament, 44-46
- salaries of, 46-47
- superannuation of, 47, 187-189
- Mental—
- diseases, 149, 154-156
- health and psychology publications, 153
- hospitals, 153-157
- Mercantile marine, 281
- pensions, 182
- Merchant banks, 804
- Mercury, 447
- Mercury level in fish, 435
- Metal products industry, 465, 502, 703, 793
- Meteorological—
- observations for year, 19-21
- Service, 231, 323
- Meteorology (see also Climate), 12-21
- publications, 12
- Metric equivalents, 932-933
- Metrication, 562, 931-932
- Metric Advisory Board, 931
- Midwives, 135, 138
- Migration, external, 55, 56, 57, 71-74, 982, 1065, internal, 1066
- Milage of—
- bus, etc., routes, 320-321
- commercial air services, 325, 326
- railways, 292, 987
- roads, 300
- State highways, 301
- Mileage tax, 304, 724
- Military forces, 265-266
- Milk—
- boards, 567, 561, 651
- consumption, 561, 673
- dried and condensed, exports of, 604, 605, 620, 994
- dried and condensed, production of, 384
- levy on, 557
- marketing of, 557
- production, 386
- subsidy, 557, 561
- Milkfat, 384, 998
- Milk products (see Dairy products)
- Milking machines, 396
- Minerals and mineral production, 438-450, 464, 497, 703, 710
- Miners' benefits, 164, 165, 166, 169, 172, 1074
- Mines Department, 441, 907, 965
- Mining and quarrying, census of, 450
- Mining, 361, 438-450, 793, 1075
- accidents, 115, 907
- investment in, 703
- legislation, 441
- persons engaged in, 442
- State aid to, 448-449
- taxation, 736
- value of production, 439, 441, 444, 445
- Ministers of each Church, and marriages by, 120-121
- Ministers of the Crown, 952
- Ministers, successive, 950-951
- Ministry of Agriculture and Fisheries, 233-234, 391-393, 404, 431, 432
- Ministry of Energy Resources, 530, 532
- Ministry of Foreign Affairs, 30
- annual appropriations, 718
- Ministry of Transport, 281, 290, 315, 316, 907
- Minors, marriages of, 119-120
- Monarch, the, 42
- Monetary and Economic Council, 654, 815
- Monetary, Banking, and Credit Systems, Royal Commission on, 814
- Monetary policy, 795-797
- Money orders, 334, 986
- Mortality (see Deaths)
- Mortgage guarantee scheme, 824
- Mortgages, 515, 817-822, 838, 842, 1007, 1075
- discharged, 821-822, 1075
- rates of interest on, 819-820, 1007
- registered, 817-821, 1007, 1075
- sources of finance, 515, 821
- State Advances, 823
- Mothers—
- ages of, 91-92
- in ex-nuptial cases, 93
- issue of, 91-92
- Motive power in factories, 473-474
- Motor body building industry, 465, 502
- Motor cycles, 307
- Motor spirits—
- consumption of, 308
- imports of, 288, 640
- retail price of, 651, 661
- taxation on, 303, 304, 723, 724, 726, 727, 756, 1070
- Motor vehicles—
- accidents, 114, 115, 151, 312-315
- assembly of, 454, 465, 501
- drivers' licences, 307, 315
- imports of, 288, 638, 639, 641
- inspection of, 316
- insurance, 316
- registration and licensing of, 307-309, 1047 1067
- taxation, 304, 688, 724, 749, 1070
- value of hire purchase sales, 583, 1068
- Motorways, 301, 305
- Mountaineering, 929, 946, 1033
- Mountains, 1, 2-3, 9, 11
- Multiple births, 90-91
- Murder, 114, 151, 244
- Museums, 212
- Mussels, 432, 734
- Mutton—
- consumption of, 387, 674
- exported, 386, 387, 546, 547-548, 617, 675, 993
- produced, 386, 487
- retail prices of, 660
N
- Narcotics, 129
- Nassella tussock boards, 51
- National—
- accounts, 678-712
- Airways Corporation, 322, 323, 324-325, 719
- Archives, 1024
- Art Gallery, 1022
- Council of Adult Education, 225
- Cancer Registry, 106
- Development bonds, 799
- Development Conference, 358, 390-391, 439, 530, 922, 1017
- targets, 710, 922
- Development Council, 710, 922, 1017
- development loans, 719, 723, 744
- Film Library, 212
- flag, 948
- Health Institute, 126, 134
- Health Statistics Centre, 133-134
- income and expenditure, 678-690, 726
- Land Inventory, 357
- Library of New Zealand, 195, 346-348
- licensing poll, 943
- Marriage Guidance Council, 123-124
- Mountain Safety Council, 946, 947
- parks, 359-360, 365-369
- planning, 358
- Provident Fund, 189-192, 773, 805
- Radiation Laboratory, 130
- Research Advisory Council, 235, 710
- Roads Board, 49, 302, 305, 754
- Roads Fund, 302, 304, 306, 723, 726, 1073
- Safety Association, 908
- song, 943
- superannuation scheme, 190
- Water and Soil Conservation Authority, 363
- Nationality and naturalisation, 76-77
- Native bush, 414-415
- Natural gas, 439, 444-445, 528, 529, 531, 540, 542-544, 545, 719, 745, 1017, 1018
- Natural increase of population, 55, 87
- Natural resources, 354, 414-415, 438-439
- Naturalisation, 76-77
- Nature Conservation Council, 361, 368
- Naval (see also Royal New Zealand Navy) bases, 265
- defence, 264-265
- vessels, 264
- Navigational aids, air, 323-324
- Netherlands, immigration from, 73, 74, 75, 85
- Net value added in manufacturing, 458-461, 478-479, 482-483, 999
- Neurological Foundation, 142
- New Zealand—
- Apple and Pear Marketing Board, 406, 556-557
- area of, 2, 66-67, 356
- New Zealand—continued
- Australia Free Trade Agreement (NAFTA), 588-589, 599, 646-647
- books, 1026-1038
- boundaries of, 1-2
- Broadcasting Authority, 341
- Broadcasting Corporation, 719
- Broadcasting Council, 341-342
- Citrus Marketing Authority, 558
- constitution, 42-50
- Council for Educational Research, 224
- Council for Recreation and Sport, 947
- Crippled Children Society Inc., 141
- Dairy Board, 385-386, 555
- Egg Marketing Authority, 557
- Electricity Department, 538, 908
- Export-Import Corporation, 601
- Forest Products Ltd., 422
- Gazette, 47, 50
- in the Commonwealth, 30-31
- Listener, 341, 343
- Literary Fund, 1021, 1022
- mean time, 944
- Meat Producers Board, 555, 562
- Milk Board, 557, 561, 651
- Ports Authority, 281
- Red Cross Society, 142
- representation overseas, 978-979
- Road Safety Council, 316
- Shipping Corporation, 284
- Steel Ltd., 446, 454, 719
- Superannuation Fund, 186-187
- Technical Correspondence Institute, 222-223
- Wheat Board, 400
- Wool Board, 388, 389
- Wool Marketing Corporation, 388, 390, 556
- Newspapers, 345-346, 1044
- produced, 486
- Newsprint—
- exports of, 289, 427, 603, 605, 625, 997
- imports of, 427, 639
- production, 422-423
- usage of, 495
- Niue Island, 2, 23, 32, 33, 40, 41, 56, 74, 85, 212, 627, 644, 909-921
- immigrants from, 74, 85
- Noise, 364
- Note issue, 787, 789
- Notes in circulation, 1005
- Noxious animals, 418
- Nuclear power, 529
- Nurseries, plant, 406
- Nurses—
- community, 135
- dental, 132
- in public hospitals, 146
- industrial, 130
- male, 135
- Plunket, 131, 141
- psychiatric, 135
- Nurses—continued
- psychopaedic, 135
- registration of, 135
- training of, 130
- Nursing, 126, 135, 146
- Nutrition, 129
O
- Oatmeal, etc., 489
- Oats, 398, 399, 400, 988
- Occupational—
- classification of—
- bankrupts, 938
- married women, 867
- population, 860
- health, 129-130
- safety, 895, 906-908
- therapy, 133, 136
- Oceanographic Institute, 232, 365
- OECD, 36, 1018
- Office machines, imports of, 637
- Officers' Certificates (Marine), 290
- Offices Act, Shops and, 894-895
- Oil discharge, 364
- Oil drilling and prospecting, 444, 449
- Oil, imports of, 288
- Oil refinery, 531, 533, 1016
- Old people's homes, 141
- Ombudsman (Parliamentary Commissioner), 49, 961
- Onions, 401, 402, 674
- exports of, 606, 675
- Opossum skins exported (see hides)
- Opticians, registration of, 136
- Oranges, imports of, 635 639, 644
- Orchards, 378, 404-406
- Orchestras, NZBC, National Youth, 343
- Orphans benefits, 165, 166, 169, 171, 1074
- Orthopaedic implants, 139
- Ottawa Agreement, 645
- Outpatients, 144
- Output of manufacturing (net), 458-461, 478-479, 482-483
- Outward Bound school, 947
- Overdraft authorities, unexercised, 795
- Overdraft rates, 802
- Overseas—
- companies, 781-782
- exchange transactions, 786, 808-814, 1076
- investment, 698, 699, 700-704, 781-782
- representatives in New Zealand and New Zealand representatives overseas, 601, 979-980
- reserves (banks), 808-809, 1005
- students, 201, 218
- territories (see Island territories)
- travel allowances, 812
- Overtime 483-484, 486, 545, 876-877
- Oysters, 430, 431, 432, 435, 734
P
- Pacific Islands (see Island territories, or individual islands)—
- constitutional changes, 32-33
- Pacific orientation, 27
- Paint and varnish industry, 464, 498, 513
- Paper and paper products industry, 422-424, 453, 463, 494-495, 631, 703
- Paper and pulp, external trade in, 289, 422-424, 425-427, 631, 636, 776
- Parcel post, 334
- Parents—
- ages of, 91-92
- births by duration of marriages, 93
- previous issue of, 92
- solo, 168, 170, 180, 1074
- Parks, National, 359-360, 365-369
- Parliament, 28, 43-44, 239, 953-955, 1011
- Members of, 953
- term of, 943
- Parliamentary—
- Commissioner (Ombudsman), 49, 961
- elections, 44, 943
- functions and controls, 43-44
- procedure, 43
- salaries, 46-47
- Parole boards, 235
- Particle board, 424, 454
- Passenger services—
- railway, 296
- road, 310-312
- Passengers—
- buses, etc., 299-300, 318
- commercial aircraft, 325, 326, 328, 329
- overseas, 71-73, 982
- railway, 296, 297, 987
- Passports, 76
- Pasture grasses, 403-404
- Patents, designs, trade marks, 934
- Patients in hospitals, 148, 152
- Patients in mental hospitals, 153-157
- Paua, 432, 436
- Pay Research Unit, 971
- PAYE taxation, 727-730, 1015
- Payments, balance of (see Balance of payments)
- Pears, 398, 399, 404, 406
- consumption of, 674
- export of, 556-557, 604, 606, 675, 995
- marketing of, 404-405, 406, 556-557
- Peas, 398, 399, 401, 988
- export of, 604, 606, 624
- Pelts (see Hides, pelts, and skins)
- Penal Institutions, 242, 249
- Penal system, 241-242
- Pensions—
- social security, 162-174, 179-185, 1074
- war, 179-185, 1001
- Perinatal mortality, 113
- Periodic detention, 241-242
- Perlite, 439, 447
- Permanent heads of Government departments, 961-962
- Permits, building, 509-511, 1067
- Pest destruction boards, 51, 228
- Pesticides, 365
- Petitions—
- bankruptcy, 937
- divorce, 121-123
- Petroleum (see also Motor Spirit), 439, 444-445
- imports of, 628, 630, 635, 640
- industry, 464, 503, 504, 532-533
- prospecting, 444
- usage of, 529, 532-533
- Pharmaceutical benefits, 136-137, 140, 165
- Pharmaceutical chemists, 136-137
- Pharmaceutical Society, Council of, 136
- Pharmaceuticals, manufacture of, 464, 498
- Phormium, 462
- Phosphate rock, 447, 497, 635
- Photography, aerial, 373
- Physical education, 160
- Physical Environment Conference, 357, 358, 361
- Physical welfare and recreation, 928-929
- Physical medicine, 133
- Physiotherapists, 133, 135-136
- Physiotherapy benefits, 138
- Pig-meats—
- consumption, of, 674
- exports of, 563, 617, 675
- prices for, 660
- production of, 386, 487
- Pigs, 377, 381, 382, 383, 399, 407, 412, 487, 989
- Pilots, air, 330
- Placement service, 851, 859
- Planing mills, 463, 494
- Planning—
- district, 357-358
- economic, 710-712
- regional, 357
- town and country, 54, 357
- Plantations, 414
- Plastics, industry, 465, 503
- Platinum, 447
- Play centres, 199, 204
- Pleasure craft, 291
- Plumbers, registration of, 136
- Plunket Society, 131, 141
- Plywood and veneer, 424, 463, 500, 513, 603, 605
- Poisoning, 114, 151, 152
- Poisons, 128, 130
- Police, 176, 260-261, 717, 966
- youth aid section, 176
- superannuation, 187-189
- Political parties, 46, 943
- Polynesian Education Foundation, 224
- Polling at general elections, 943
- Pollution—
- air, 127-128, 364, 365
- mercury, 435
- Pollution—continued
- tax incentives to reduce, 734
- water, 364-365
- Population (see also Census), 55-86, 99, 982, 1065, 1066, 1078-1080
- age distribution, 79, 81-83
- density of, 69
- distribution of, 60-69
- ethnic groups, 84
- heights and weights, 157-161
- increases, 55-58, 70, 87
- industrial distribution of, 861-862
- international comparisons, 57, 86, 87
- Maori, 67-68, 87, 70-71, 159-160
- projections, 59-60
- sex proportions of, 68-69
- urbanisation of, 67-68, 70
- vital statistics, 87, 124
- world, 86
- Pork (see Pig-meats)
- Portfolios of Ministers, 952
- Port Agriculture Service, 393
- Ports—
- Authority, 281, 290
- fishing, 434
- imports by, 287, 288
- of arrival and departure, 288
- safety of, 907
- shipping trade of, 284-289
- Postal notes, 334, 986
- Post Office, 332-340, 966, 986
- bonus bonds, 735
- superannuation of, 187-189
- debt, 719
- superannuation of, 187-189
- employees, 340, 969
- superannuation of, 187-189
- National Development Bonds, 735
- Savings Bank, 514, 799, 803, 805, 1006
- Staff Tribunal, 896
- Potato Board, 401, 557
- Potatoes, 398, 401-402, 557, 988
- consumption of, 674
- export of, 604, 606, 675
- Pottery, china and earthenware industry, 464, 499
- Poultry, 412, 764, 1011
- Preferential tariff, 654-650
- Pregnancy, diseases, etc., 114, 150
- deaths from, 104, 105, 114
- Premiums, insurance—
- accidents, 839-841
- fire, 841-843
- life, 835-838
- motor vehicle (third party), 839, 840, 841
- Pre-school education, 132, 195, 199, 204
- Preventive detention, 242, 251
- Price Tribunal, 651
- Price control, 651-653
- Prices, 651-672, 1069
- basic, for dairy produce, 559-561
- index numbers, 656-659, 1069
- comparisons with other countries, 661-662
- index numbers, 656-659, 1069
- export, 559-561
- index numbers, 656-659, 1069
- export, indexes of, 666-667
- index numbers, 656-659, 1069
- farming costs index, 665-666
- index numbers, 656-659, 1069
- import, indexes of, 668-669
- index numbers, 656-659, 1069
- retail, 656-659, 1069
- index numbers, 656-659, 1069
- stabilisation of, 652
- wholesale, 662-666
- Primary products—
- consumption of, 673, 675
- by ports, 287, 288
- export of, 289, 546-564, 992-996
- by ports, 287, 288
- marketing of, 546-564
- Primary schools, 193, 194, 196, 199, 200, 204-206, 784
- Prime Minister's Department, 966
- Prime Ministers, successive, 950-951
- Principal events, 1011-1018
- Printing and publishing industry, 463, 495-496, 703
- Prisoners of war, 269
- Prison service superannuation, 187-189
- Prisons and prisoners, 250-254, 985
- Private—
- income, 679, 683, 687
- investment, 698, 699, 700-704
- savings banks, 515, 679, 680, 684, 686, 800, 803, 805, 1016
- schools, 193, 195, 199, 200, 206, 984
- Privy council, 240
- Probation of offenders, 176, 241, 244, 245, 246, 249
- Production, 704-712, 998
- building materials, 499
- clothing, 476
- dairy, 384-386, 998
- farm, 381-382, 383, 390, 998, 1067
- fisheries, 432-434
- index numbers of, 382, 383, 482-483, 705-706
- manufacturing industries, 451-504, 999
- meat, 386, 487, 998
- mineral, 454-450, 464, 497
- pulp and paper, etc., 422-423, 453, 463, 494-495
- timber, 420-421, 998
- wheat, 400
- wool, 381, 382, 383, 388-390, 462, 998
- Productivity Advisory Council, 456, 711
- Productivity Centre, 711
- Productivity index, 707
- Projections—
- labour force, 850, 852
- population, 59-60
- school population, 202
- Property price index, 515
- Property speculation tax, 736-737
- Psychiatric health, 153-157
- Psychiatric units of public hospitals, 138, 148
- Public—
- accounts, 713-748
- interest on, 717, 745
- authority sector of national income and expenditure, 679, 688-690
- interest on, 717, 745
- debt, 685, 689, 743-748, 1002, 1071
- interest on, 717, 745
- finance, 1000-1001
- health, 126-134
- holidays, 945-946
- Public Service, 895, 969, 970-971
- employees, 856-857, 969
- superannuation, 186-192
- Public Trust Office, 935-936, 966
- Public works—
- maintenance appropriations, 689, 719
- occupational safety, 907
- railway construction, 293
- road construction, 300-307
- services, maintenance of, 689, 719
- Publicans' licences, 941-942
- Publishing and printing industry, 463, 495-496 944-945
- Pulp and paper industry, 422-424, 453, 463, 494-495, 793, 997
- export of, 289, 425-427, 602, 997
- import of, 426-427, 630, 635
- Pumice, 439, 605
O
- Quarries, 450
- accidents at, 902
- persons engaged in, 450
- safety in, 907
- Quarrying and mining, census of, 450
- Queen Elizabeth II Arts Council, 1021
R
- Race relations, 946
- Racing taxation, 724, 742, 743, 1070
- Radiation protection, 130
- Radio and television, 340-345
- advertising, 344
- assembly and manufacture of sets, 465, 485, 501
- licences, 345
- Radio—
- beacons, 290
- communications, 338-339
- New Zealand, 342
- private commercial, 342
- time signals, 944
- Radioactivity, protection against, 130
- Radiology, 130
- Radiotelephone services, 337, 338
- Raffles, 940-941
- Railcars, 294
- Rail traffic—
- goods, 298, 987, 1066
- passengers, 297, 987, 1066
- Railway construction and engineering, 293-294
- Railway equipment, imports of, 638
- Railways, 292-300, 719, 720, 814, 966, 987, 1066
- accidents, 115, 151, 299, 1014
- air freight service. 293
- debt, 814
- employees, 299
- licensing protection, 308-309
- notional, 292
- private, 299
- revenue and expenditure, 294-297, 719, 987, 1066
- road-rail ferry service, 294, 296, 297, 1016
- road services, 296, 299, 1066
- superannuation, 187-189
- Tribunal, 870, 896
- Rainfall, 14-17
- Rangemaking industry, 465, 501
- Raoul Island, 2, 11
- Rarotonga Island (see also Cook Islands), 910
- Rates, local government, 689, 749-750
- valuation for, 277-278
- Rates of exchange, 807-808
- Re-afforestation, 361-362
- Reciprocal tariff and trade, 646-650
- Recreation, 418, 928-929, 946-948
- Recreational land, 359
- Redemption of loans, 717, 721, 723
- Re-exports, 626-627
- Refrigerators, 485, 503, 524
- Refugees, 75
- Regional—
- Authority, 50-52
- development, 455, 711-712
- planning, 357
- Registrars, marriages before, 117, 118-121
- Registration of—
- adopted children, 95-96
- aircraft, 330
- aliens, 77-78
- apiaries, 413
- apprentices, 853-854
- births, 88
- building societies, 827
- chemists, 136-137
- child care centres, 175
- community nurses, 135
- companies, 1008
- deaths, 102-103
- dental technicians, 135
- dentists, 135
- designs, 934
- dietitians, 136
- electors, 50
- employers' unions, 885
- ex-nuptial births, 93-94
- friendly societies, 174
- Registration of—continued
- land titles, 272-273
- land valuers, 280
- land values, 276-280
- male nurses, 135
- marriages, 117-124
- maternity nurses, 135
- medical practitioners, 135
- midwives, 135
- mortgages, 817-821, 1007
- motor vehicles, 307-309, 1067
- nurseries, 406
- nurses, 135
- occupational therapists, 136
- opticians, 136
- patents, 934
- pharmaceutical chemists, 136-137
- physiotherapists, 135-136
- plumbers, 136
- private schools, 195
- psychiatric nurses, 135
- psychopaedic nurses, 135
- still births, 96
- trade marks, 934
- trade unions, 884-885
- unemployed, 858-859
- Rehabilitation, 185, 689
- disabled civilians, 133, 142, 851, 899
- Religious professions, 83
- marriages by ministers of, 120, 121
- Rental cars, 307, 311
- Rental value, owner-occupier houses, 655, 678, 682, 684, 687
- Rents, 521-522
- stabilisation of, 526
- Representation Commission, 44, 49
- Representation in New Zealand, 979-980
- Representation overseas, 978-979
- Representatives, House of, 28, 42, 43, 44-45, 46, 50
- Reproduction index, 90
- Research, 228-233
- agricultural, 228-229, 392
- animal, 234
- Antarctic, 918-921
- dental, 132
- economic, 234
- expenditure, 236-237
- fishery, 431, 437
- forestry, 419, 427-428
- grants, 233
- grassland and grasses, 234
- in building and construction, 231
- industrial, 230, 456, 457, 1053
- in environment, 231
- in transport, 231
- manufacturing, 230
- medical, 134
- mining, 441
- scientific and industrial, 235-236
- social sciences, 234
- soil, 228-229, 233
- wheat, 288-229
- wool, 390
- Research divisions, DSIR, 229 other, 234
- Reserve Bank, 25, 48, 698, 699, 714, 786-790 791, 806, 832
- assets and liabilities, 789-790
- securities held, 795
- Reserve ratio bank advances, 795-797
- Reserves—
- air force, 266
- farm industry, 563-564
- military, 266
- naval, 265
- overseas (banks), 808-809
- public or scenic, 359-360, 365-369
- Restaurant licenses, 941, 942
- Retail prices, 656-659, 1069
- index numbers, 659, 1069
- Retail trade, 578-580, 703, 1068
- Retailers, bank advances to, 793
- Revenue—
- broadcasting and television, 344-345
- cinemas, 351
- customs, 649, 688
- electric power, 540
- Forest Service, 419
- Government (see Government finance)
- insurance companies, 839-841, 842-843, 1009
- local government, 303, 304, 689, 751-753, 1003
- National Roads Fund, 302, 304, 306
- Post Office, 339
- railway, 295-297, 987, 1066
- urban transport, 319
- Rice, 639
- River boards, 51, 751
- Rivers, 4-5
- access to, 359
- control of, 363-364
- hydro-electric development on, 527-529, 533-534
- Road—
- accidents, 115, 151, 312-315
- boards, 51, 754, 755
- districts, 303
- safety, 315-316
- services, 296, 318-321, 1066
- transport, 300-321, 1067
- Tunnel Authority, 519
- Roads, 300-321
- expenditure on, 303-304, 305-306, 722-723
- taxation, 724, 726-727
- Rock lobsters (see crayfish)
- Rolling stock, railway, 294, 296
- Roman Catholic schools, 206
- Ross Dependency, 2, 11, 56, 909, 918-921, 1013
- Royal Commission on Monetary, Banking, and Credit Systems, 814
- Royal New Zealand Air Force, 266-272
- Royal New Zealand Naval Volunteer Reserve, 265
- Royal New Zealand Navy, 264-265
- Ruakura Agricultural Research Centre, 233
- Rubber products, 464, 496, 635, 703
- Rural—
- Banking and Finance Corporation, 822
- education, 208-210
- housing, 516
- intermediate credit associations, 823
- land transfers, 275-276
- mail deliveries, 333
- mortgages, 818-820
- population, 67-68
- Reticulation Council, 538
- Ryegrass, 403
S
- St. John Ambulance, 142, 143
- Safeair Limited, 323, 326
- Safety of machinery, 907
- Safety of workers, 895, 906-908
- Salaries and wages, 682, 684, 687, 870-880, 999
- and social security benefits, 167
- average, 772
- effective, 879-880
- minimum, 874
- nominal, 877-879
- weekly, 875-876
- by industry groups, 874-875, 877-879
- average, 772
- effective, 879-880
- minimum, 874
- nominal, 877-879
- weekly, 875-876
- by institutional sectors, 874-875, 877-879
- average, 772
- effective, 879-880
- minimum, 874
- nominal, 877-879
- weekly, 875-876
- by occupations, 877-879
- average, 772
- effective, 879-880
- minimum, 874
- nominal, 877-879
- weekly, 875-876
- equal pay, 874
- average, 772
- effective, 879-880
- minimum, 874
- nominal, 877-879
- weekly, 875-876
- hourly average, 876-877
- average, 772
- effective, 879-880
- minimum, 874
- nominal, 877-879
- weekly, 875-876
- industrial classification of, 874-875, 1075
- average, 772
- effective, 879-880
- minimum, 874
- nominal, 877-879
- weekly, 875-876
- in manufacturing industries, 458-461, 470-473, 999
- average, 772
- effective, 879-880
- minimum, 874
- nominal, 877-879
- weekly, 875-876
- international comparisons, 880
- average, 772
- effective, 879-880
- minimum, 874
- nominal, 877-879
- weekly, 875-876
- legislation, 871-873
- average, 772
- effective, 879-880
- minimum, 874
- nominal, 877-879
- weekly, 875-876
- lost through industrial stoppages, 889-893 1010
- average, 772
- effective, 879-880
- minimum, 874
- nominal, 877-879
- weekly, 875-876
- rates, 871-873
- average, 772
- effective, 879-880
- minimum, 874
- nominal, 877-879
- weekly, 875-876
- Salaries of members of—
- Executive Council, 46-47
- House of Representatives, 46-47
- Sales tax, 724, 1070
- Salt, 439, 448
- Sanctuaries, bird and other wildlife, 368, 369
- Sand and gravel, 439
- Sand dunes, stabilisation of, 417
- Satellite Communications, 194
- Satellite earth resources programme, 357, 365
- Sausage casings, export of, 605, 623, 996
- Sausage casings, production, 462
- Savings—
- accounts and bonds (National), 735, 799
- banks, 797-801, 1006
- private, 515, 679, 680, 684, 686, 800, 1005
- small, 797-801
- Sawmills, etc., 420, 463, 493
- Scenic reserves, 367-368
- Scheelite, 446
- Scholarships—
- for Maoris, 224
- for Pacific Islanders, 224
- university, 202, 214
- School—
- Certificate, 202, 784
- ages of, 205
- boarding allowances, 209
- duration of attendance, 207
- intended occupations of, 208
- medical examinations of, 131
- roll numbers of, 199-200, 201, 203, 204, 205, 206
- transport, 209
- children, 193-195, 199-210
- ages of, 205
- boarding allowances, 209
- duration of attendance, 207
- intended occupations of, 208
- medical examinations of, 131
- roll numbers of, 199-200, 201, 203, 204, 205, 206
- transport, 209
- committees, 194
- dental service, 126, 131
- inspectors, 206
- Journal, 212
- Library Services, 211, 348
- Saving Bank, 799
- of Pharmacy, 136
- teachers (see teachers)
- Schools—
- area, 209
- broadcasts to, 212
- Community Colleges, 194
- consolidation of, 208
- correspondence, 199, 200, 209, 220, 984
- curricula, 199, 204, 206, 208
- district high, 195, 206, 209
- denominations, 195
- free textbooks for, 205, 211
- intermediate, 199, 206
- primary, 193, 194, 196, 199, 200, 204-206, 984
- private, 193, 195, 199, 200, 206, 984
- publications, 212
- roll numbers, 199-200, 201, 203, 204, 205, 206
- secondary, 193, 194, 196, 199, 200, 206-208, 984
- size of classes, 205
- special, 195, 203-204
- State, 196-213
- technical, 198, 199, 200, 220-223, 984
- Science in New Zealand, 226-238
- budget, 235, 236
- publications, 232, 238, 1031
- Scientific and Industrial Research, Department of, 227-233, 966-967, 1072
- Scientific Services, 232
- Sea fisheries, 430-437
- Seaman Act, Shipping and, 907
- Seaweed, 432
- Secondary education (see also Schools, education), 206-208
- Secondary school boards, 194
- Secondary school councils, 194
- Securities, Government, 824, 838, 842
- Security Service, 271, 717
- Seed certification, 403
- Seed sowing, aerial, 327
- Seeds, grass and clover, 399, 403-404, 624, 995
- exported, 606, 994
- Seismic regions, 10
- Seismology, 9-12
- Self employed, incomes of, 761, 763, 766, 770 771, 772
- Sentences by courts, 246-248
- Separation, marital, 121
- Separation orders, 258-259
- Serpentine, 439, 447, 497
- Service-coach licenses, 307
- Service establishments (trade), 575-577
- Settlement of land, 273, 369-371
- Sex proportions of population, 68-69
- Sexes of—
- children born, 90
- factory employees, 470-473
- Sexual offences, 244, 245, 250, 255
- Share prices, index numbers, 670
- Shares in building societies, 826-830
- Shearers' wage rates and amenities, 895
- Sheep, 410, 549, 1011
- and lambs slaughtered, 387
- farming, 376, 377, 399, 408, 410, 761, 762, 766, 793, 989
- skins and pelts exported (see Hides)
- Sheetmetal-working industry, 502
- Shellfish, export of, 603, 605
- Shipping, 281-291
- Shipping and Seamen Act, 895
- Ships (see Vessels)
- Shops, 564
- and Officers Act, 894-895
- Short-wave radio broadcasting, 342
- Sickness, 148-150
- benefits, 165, 166, 168, 172-173, 1074
- insurance, 174, 839
- Silage, 398
- Silica, 439, 447
- Silver, 439, 446
- Sixth Form Certificate, 202
- Ski-ing, 929
- Skins (see Hides, pelts, and skins)
- Slaughter of animals for food, 387, 487
- Soap industry, 485, 497
- Soaps, export of, 606
- Social goals, 939-940
- Social Security, 162-179, 1001
- Act, 25, 162, 163, 1014
- annual appropriations, 688
- benefits, 137-140, 162-174, 685, 687, 1077
- reciprocity with other countries, 173-174
- supplementary assistance, 166, 173
- taxation, 165, 688
- Social services, expenditure on, 165-166, 689, 714-715, 718, 722, 1074
- Social welfare, 162-192, 203, 967, 1072
- Soil conservation, 363, 364
- Soils, 363, 364, 374-376
- Soldiers, 265-266
- Solo parents, 168, 170, 180
- South-east Asia Treaty Organisation (SEATO), 26, 29, 37-38, 1017
- Southern Alps, 3, 8, 17, 18
- South Pacific—
- students from, 201
- Bureau for Economic Co-operation, 27, 32
- Commission, 32, 909
- Forum, 27, 587
- trade training for youths, 854-855
- trade with, 587, 627
- Sovereignty, 27-28, 42-43
- Special articles in previous issues, 1019-1020
- Special education, 195, 203-204
- Speed limit, 316
- Spirits—
- consumption of, 675
- duty on, 684, 724
- imports of, 635
- production of, 491
- Sports, 928, 946-984
- publications on, 1033
- Stabilisation of Prices Regulations, 652
- Stabilisation of Remuneration Act, 870, 871-873
- Stamp duties, 724, 735, 1070
- Standard time, 944
- Standards Council, 935
- Standards of living, international indicators of, 938-939
- State—
- Advances Corporation, 717, 719, 805, 822
- accident and fire, 845-846, 899
- earthquake and war damage, 845-846
- life, 844-845
- Commission, 717, 967, 969-970, 1071
- aid to private schools, 195
- accident and fire, 845-846, 899
- earthquake and war damage, 845-846
- life, 844-845
- Commission, 717, 967, 969-970, 1071
- coal mines, 444, 719, 720
- accident and fire, 845-846, 899
- earthquake and war damage, 845-846
- life, 844-845
- Commission, 717, 967, 969-970, 1071
- departments, 48-49
- accident and fire, 845-846, 899
- earthquake and war damage, 845-846
- life, 844-845
- Commission, 717, 967, 969-970, 1071
- finance, 688-689, 1000-1001
- accident and fire, 845-846, 899
- earthquake and war damage, 845-846
- life, 844-845
- Commission, 717, 967, 969-970, 1071
- forests, 414-429
- accident and fire, 845-846, 899
- earthquake and war damage, 845-846
- life, 844-845
- Commission, 717, 967, 969-970, 1071
- highways, 305, 723
- accident and fire, 845-846, 899
- earthquake and war damage, 845-846
- life, 844-845
- Commission, 717, 967, 969-970, 1071
- housing, 507, 508, 517-519, 825-826
- accident and fire, 845-846, 899
- earthquake and war damage, 845-846
- life, 844-845
- Commission, 717, 967, 969-970, 1071
- indebtedness, 743-748, 1002
- accident and fire, 845-846, 899
- earthquake and war damage, 845-846
- life, 844-845
- Commission, 717, 967, 969-970, 1071
- insurance, 844-864, 967
- accident and fire, 845-846, 899
- earthquake and war damage, 845-846
- life, 844-845
- Commission, 717, 967, 969-970, 1071
- placement services, 851, 859
- Commission, 717, 967, 969-970, 1071
- schools, 196-213, 984
- Commission, 717, 967, 969-970, 1071
- Services, 895, 962-969
- Commission, 717, 967, 969-970, 1071
- wards, 177-178
- Statistical areas, 61-62
- area and population of, 61, 1078
- cinemas in, 352
- industrial production by, 458-461
- livestock, 409
- retail trade in, 567
- wholesale trade in, 567
- Statistical—
- divisions and urban areas, 61-62, 1078
- information, latest, 1065-1080
- publications, 591, 1060-1064
- summary, 982-1010
- Statistics Department, 967
- Statutes of Westminster, 28, 44, 239, 1014
- Statutes (see Legislation)
- Statutory Boards and Committees, 971-974
- Steel and iron, imports of, 288, 631, 637, 640-641
- Steel industry, 446-454
- Sterling exchange rates, 806-807
- Stewart Island, 2, 28, 67
- Still births, 91, 96, 113
- Stock and station agents—
- advances to, 793
- deposits, etc., with, 802, 805
- Stocks—
- manufacturers', 481-482
- retail, 572, 1068
- wholesale, 573-575
- Stoppages, industrial, 889-893, 1010
- Strikes, 881-884, 1010
- Students, teachers' college, 199, 210-211, 984
- Students—
- overseas, 201, 218
- projected, 202
- university, 200, 213-219, 984
- Studentships, 210, 211
- Submarine power cable, Cook Strait, 536
- Subscribers, telephone, 335
- Subsidies, 667, 682, 685
- agricultural, 395-396
- highways, 303, 304
- on butter, 677
- on eggs, 557
- on milk, 557, 561
- on food, 677
- superannuation fund, 186-192
- to gasworks, 544, 577
- to local government, 303, 304, 306, 509, 689, 755
- to mining, 448-449
- Suffrage, 50
- Sugar—
- consumption of, 675, 676
- duty on, 648, 649
- imports of, 288, 629, 635, 639
- international agreements on, 649
- used by factories, 488, 489-490
- Suicides, 104, 116, 151
- Sulphur, 447
- imports of, 636, 640
- used in fertiliser industry, 497
- Summary convictions, 245-248, 985
- Sunshine, 18-19, 21
- Superannuation, 186-192
- government, 187-189, 773
- national scheme, 190
- New Zealand scheme, 186, 1072
- of Members of Parliament, 47, 187-189
- private schemes, 192
- self schemes, 191
- social security, 164-165, 166, 169
- Superphosphate and fertiliser industry, 497
- Supreme Court, 43, 121, 239, 240, 241, 243, 247 256, 277, 985
- Surveys—
- aerial land, 373
- employment, 855-857
- geological, 229, 448-449
- land, 373
- Sweepstakes, 940-941
- Swimming accidents, 116
T
- Tallow, 289, 487, 497, 621, 996
- Tanning industry, 464, 496
- Tariff and Development Board, 599-600
- Tariff, Customs, 645-650
- Tariffs and Trade Agreement (GATT), 35, 645-646
- Tasman Pulp and Paper Co., 422, 453, 745
- Taxation (see also individual taxes), 715, 724-743
- amendment to legislation, 731
- direct, 684, 685, 688, 716, 724, 1070
- exemptions from, 727, 730, 731, 772-773
- incentives, 734-735
- indirect, 682, 685, 688, 716, 724, 1070
- rates of, 689, 777
- Taxis, 307
- Taxpayers, incomes of, 767
- Tea—
- consumption of, 675
- imports of, 629, 635, 639
- Teacher studentships, 210, 211
- Teachers, 200
- college councils, 194
- guidance, 206
- primary and secondary school, 200
- superannuation, 187-189
- training of, 194, 198, 200, 209, 210-211
- Teaching aids, 210, 211
- Technical Correspondence Institute, 199, 200, 222-233, 853
- Technical education (see also Education, Schools), 198, 199, 200, 220-223, 852, 984
- Technology—
- Central Institute of, 221
- Telecommunications, 337-338, 986
- Telegraph services, 335-337
- Telephone rental concession, 173
- Telephone services, 335-336, 524, 986
- Television, 340-345
- value of sets sold on hire purchase, 583, 1068
- Television and radio assembly and manufacture, 454, 465, 485, 501
- Telex (teleprinter) services, 337
- Temperature, 17-21
- Tenancy Act, 526
- Tenure—
- of Crown lands, 369-371, 377
- of dwellings, 369, 523
- of occupied land, 272, 369-371, 377
- Terms of trade, 669-670, 671, 709
- Territorial Air Force, 265
- Territorial Forces (Army), 265-266
- Tetanus immunisation, 131
- Textbooks in schools, free, 205, 211
- Textiles, production of, 462, 492-493
- Theft, 244, 245, 248, 250, 255
- Therapists, occupational, 133, 136
- Thermal activity, 3, 929, 1018
- Third-party risk insurance, 316, 839, 840, 841
- Thrift club accounts, Post Office Savings Banks, 799
- Thunderstorms, 17
- Timber, 414-429, 493-494, 513, 998
- exports of, 289, 425-427, 603, 605, 625, 997
- imports of, 425-427, 640
- inspection of, 419
- output, 493-494, 998
- plantations, 377, 414
- preservation of, 425, 463, 494
- resources, 414-415
- usage of, 500
- Timber Preservation Authority, 425
- Time service (radio), 944
- Tin, 447
- Tobacco—
- consumption of, 675
- duty on, 648, 649
- growers, 378, 407
- imports, of, 628, 635, 640
- industry, 378, 407, 462, 492, 793, 832, 1069
- Tokelau (Union) Islands, 2, 23, 33, 40, 41, 56, 85, 179, 212, 627, 644, 909, 917-981
- Toll service, 335
- Tonnage of shipping and cargo, 284-289
- Topdressing, 327, 393
- Topographical mapping, 373
- Totalisator—
- Agency Board, 743
- taxation, 743
- turnover on, 743
- Tourist—
- accommodation, 925-927
- and Publicity Department, 927, 929, 967, 1072
- attractions, 922-930
- Hotel Corporation, 719, 925
- industry, 710, 922-930
- Town and country planning, 54, 357, 358 358
- Town districts, 51, 61-62, 64-65, 279-280, 301, 750
- Tractors, imports of, 637, 641
- Tractors on farms, 397
- accidents, 116
- Trade, (domestic), 564-583, 1068
- overseas investment in, 702
- practices, 653
- retail, 572, 574-580, 1068
- training of Maori youths, 854-855
- unions, 884-887
- wholesale, 570, 581-582, 1068
- Trade (external), 584-672
- agreements, 649-650
- balance of, 591
- commissioner service, 600
- direction of exports, 590, 609-625,
- origin of imports, 590, 632-639
- per head value of, 590
- Promotion Council, 601, 710
- representation overseas, 981
- statistics, compilation of, 591
- terms of, 669-670, 671, 709
- volume of, 597-612
- Trade Certification Board, 223, 853
- Trade examinations, 223, 853
- Trade-marks, 934
- Trading and works account, State, 720-722
- Trading banks, 790-795, 802, 805, 1005
- advances, classification, 515, 793-794, 1005
- Traffic—
- accidents, 115, 151, 312-315
- deaths from, 312-315
- air, 322-329
- motor, 307-309
- offences, 246-247, 315-318
- railways, 296, 987
- Tramways, 318, 987
- Transport, 281-331, 710, 928, 968, 1043, 1046, 1066-1067, 1069
- accidents (see Traffic accidents)
- boards, 51
- equipment, imports of, 631, 638-639
- equipment industry, 465, 703, 793, 832
- licensing, 309-311, 501-502
- overseas investments in, 703
- of school children, 209
- research, 231
- to work, 312
- urban, 312, 318-321
- Travel and tourism, 922-930
- allowance overseas, 807, 812
- Trawling, 430, 431
- Treasury, 968
- Treasury bills, 796
- Treaty of Waitangi, 28, 272, 1011
- Trees, forest, 414-416
- Tribunals, administrative, 870, 960
- Triplets born, 90-91
- Trolley-buses, 320 321
- Trout, 5, 432, 928
- Trust (liquor) control, 942
- Trustee, Public, 935-936
- Trustee savings banks, 800-801, 803
- Tuberculosis, 104, 105, 148
- Tungsten ore, 439, 446
- Tunnels, roads and railway, 293
- Tussock boards, 51, 395
- Twins born, 90-91
U
- Undergraduates, 213-220
- Underground water authorities, 51
- Unemployment, 858-859
- benefits, 165, 166, 168, 172, 859
- UNESCO, 35, 218
- Unexercised overdraft authorities, 795
- Unimproved value of land, 278
- rating on, 749-759
- Unions, trade, 884-887
- United and regional councils, 52-53
- United Kingdom—
- communications with, 333, 338
- dairy produce and meat imported into, 554-555
- debt domiciled in, 1002
- exchange rate with, 807
- Investment in New Zealand, 702
- New Zealand representation in, 978
- relations with, 28-31, 586
- representation in New Zealand, 979
- shipping to and from, 281-282
- social security reciprocity, 174
- trade agreements with, 586
- trade with, 546, 548, 584, 586, 589, 591, 594, 609, 610, 612, 613, 632, 646, 695-698
- visitors and migrants from, 74, 85, 924
- United Nations, 33-36, 267
- Conference on Trade and Development (UNCTAD), 35
- United States of America—
- debt domiciled in, 1002
- exchange rate with, 807
- investment in New Zealand, 702
- New Zealand representation in, 979
- representation in New Zealand, 980
- shipping to and from, 282
- trade with, 546, 585, 586-587, 591, 594, 611, 613, 362, 695-698
- visitors and migrants from, 74, 85, 924
- Unit titles, 508
- Universities, 198-199, 784
- buildings, 198-199
- bursaries, 214
- colleges of agriculture, 214, 215
- education, 213-220
- entrance examinations, 202, 203, 213
- extension, 225
- graduates, 210, 219, 784
- Grants Committee, 194, 198, 213, 234, 517
- scholarships, 203, 214
- staff, 200, 220
- students, 199-200, 213-219
- Uranium, 446
- Urban—
- Areas, 61-64
- population, 63-64, 1078
- stores in, 567
- drainage boards, 51
- house price index, 515
- land transfers, 274
- mortgages, 818-820
- movement, 67-68
- population growth of, 67-68, 1078-1079
- renewal, 508, 516, 517, 756
- transport, 312, 756
- transport boards, 51
- Urbanisation—
- effects of, 354-355, 358
- of population, 67-68, 70
V
- Vacancies, employment, 859
- Valuation of land, 276-280
- Value added in manufacturing (net), 476-477, 482-483, 999
- Valuers' Registration Board, 280
- Veal—
- consumption of, 386, 674
- export of, 546, 547-548, 615-616, 675, 993
- production of, 386, 487
- Vegetable growing, commercial, 398, 401-402
- Vegetables—
- consumption of, 674
- exported, canned and frozen, 606, 675
- home production, 402
- retail prices of, 660
- Veneer and plywood, 424, 463, 500
- Venereal diseases, 104, 105, 149
- Vessels—
- entered and cleared, 284-289
- fishing, 431
- safety of, 895, 907
- wrecked, 290-291
- Veterans' allowances, 180, 181
- Veterinarians, training of, 215, 391
- Vineyards and grapes, 406, 462, 491
- Visitors to New Zealand, 71-73, 922-924
- Visual aids, in teaching, 212
- Vital statistics, 87-124
- Vocational guidance, 179, 212-213, 852
- Vocational Training Council, 223, 252, 852-853, 1017
- Volcanoes, 1, 2-3, 9, 11, 1012
- Volunteer Service Abroad (V.S.A.), 40, 142
- Voluntary welfare organisations, 141
- Voting—
- at general elections, 50, 943
- at licensing polls, 943
- qualifications, 50
W
- Waferboard, 424
- Wages (see Salaries and wages)
- Waitangi, Treaty of, 28, 272, 1011
- Waiting lists, hospitals, 145
- War—
- bursaries for ex-servicemen's children, 182
- casualties, 271
- damage and earthquake insurance, 845-864
- pensions, 164, 179-185, 1001
- pensions, supplementary assistance, 182
- veterans' allowances, 180, 181
- Warships, 265
- Washing machines, 485, 503, 524
- Water—
- boards, regional, 363
- conservation, 363-364
- pollution, 364-365
- power, development of, 533-542
- resources, 363-364
- safety campaign, 363-364
- Safety Council, National, 946, 947
- subsidies, 755
- supply boards, 51
- Waterfront control, 895
- Wax—
- bees, 413
- peat, 438, 448
- Weather, 12-21, 928
- Weedkiller, aerial spraying of, 327
- Welfare—
- Maori, 178-179
- maternal, 130-131, 141
- of children, 175
- of workers, 895
- organisations, 141-142, 517
- Pacific Islanders, 141-142
- services, 141-142
- Western Samoa, 11, 29, 30, 32, 33, 56, 73, 74, 85, 212, 610, 634, 909, 1013, 1016
- Westminster, Statute of, 28, 239
- Whales and whaling, 920
- Wheat, 398, 399, 400, 988
- Board, 400
- imports of, 639
- Whey butter (see Dairy products)
- Whisky, imports of, 635, 640
- Whitebait, 436
- Wholesale—
- liquor licences, 942
- prices, 662-666, 671-672
- trade, 570, 581-582, 703, 1068
- Widowers, remarriages of, 118
- Widows—
- benefits, 165, 166, 168, 170, 1074
- number of, 79
- remarriages of, 118
- war pensions, 180, 184
- Wildlife sanctuaries, 369
- Wills administered by Public Trust Office, 936
- Winds, 13-14
- Wine, consumption of, 675
- Wine licences, 942
- Winemaking industry, 406, 462, 491
- Women—
- accident compensation, 898
- Air Force, Royal New Zealand, 267
- childbearing ages of, 91, 92
- criminal charges and convictions against, 248
- deaths of, in childbirth, 104, 105, 114
- employment in industry, 459-461, 847, 848, 849, 856-857
- incomes of, 769, 783
- in labour force, 865-868
- married, occupations of, 866-868
- nationality laws, re, 76
- Naval Service, Royal New Zealand, 265
- offences by, 248
- on juries, 240
- police, 261
- wage rates of, 458, 470, 472, 874
- working conditions of, 893
- working hours of, 483-484
- Wood-chip industry, 421
- Wood preservation, 425
- Wood and cork products industry, 463, 703, 776
- Wood pulp—
- exports of, 605, 625, 997
- imports of, 630, 635, 640
- production of, 422-423, 453, 463, 494-495, 703
- Wool—
- Board, 388, 389
- export, 289, 546, 548-549, 556, 597, 601, 604, 614-615, 810, 811, 922
- export price index, 559
- imports, 635
- levy, 390
- Marketing Corporation, 388, 390, 556, 563
- marketing of, 548-549
- prices for, 559, 1067
- production, 381, 382, 383, 388-390, 462, 998
- research, 229, 230, 365
- scouring, 390, 462
- used at local mills, 492
- Woollen mills, 389, 462, 493
- Woollen piece-goods, imports of, 636
- Workers' compensation, 897-899
- Workers—
- Educational Association, 226
- safety and welfare, 897-908
- unions of, 884-885, 886-887
- Working—
- conditions, 893
- hours, 876-877, 894
- life expectancies, 869
- Works and trading account state, 713-715, 719, 723
- Works and Development, Ministry of, 293, 301, 303, 358, 364, 445, 908, 968-969, 1072
- Works programme, 722
- World Bank (see International Bank of Reconstruction and Development)
- World Health Organisation, 35, 133, 218
- World population statistics, 86
- Wrecks, 290-291, 1012-1017
X
- X-ray services, 138
Y
- Youth hostels, 517
- Youths, working conditions of, 895
Z
- Zinc, 439, 447