Table of Contents
THE fifty-fifth issue of the New Zealand Official Year-Book covers the years 1947 to 1949, the purpose of issuing the volume in this form being to overtake the arrears which have cumulated over the war and post-war years in the date of presentation of the Year-Book.
New features in the present issue include a Section on the national income of New Zealand; and a report (Appendix (e)) on the course of retail prices, with special reference to the consumers' price index compiled on a post-war base. The Section on labour laws and allied legislation has been completely revised, including much new material, while the set up of this Section has been rearranged to facilitate easy reference. The latest statistical data available on a number of important subjects are given in the introductory letterpress, with appropriate references to corresponding portions of the Year-Book. The object of this innovation is to make available in a convenient form for easy reference the most recent statistics on important subjects.
My thanks are due to Mr. J. Gilchrist, Editor of the Year-Book, and to the Editorial Staff for the manner in which they have carried out their duties. The co-operation of officers of this and other Government Departments is also gratefully acknowledged.
G. E. WOOD, Government Statistician.
Census and Statistics Department, Wellington C. 1, 15th February, 1950.
| Title. | Latest No. | Month of Issue. | Price per Copy. | Postage (extra). |
|---|---|---|---|---|
* With a summary for the year 1946–47. † £1 1s. per annum (post free). ‡ Other volumes to follow. § Out of print. | ||||
| s. d. | d. | |||
| New Zealand Official Year-Book | 1947–49 | April, 1950 | 7 6 | 8 |
| Annual Statistical Reports— | ||||
| Population and Buildings | 1947–48 | May, 1949 | 2 6 | 1 |
| Vital Statistics | 1944 | Aug., 1949 | 5 0 | 2 |
| Social Statistics | 1943, 1944, and 1945 | Aug., 1947 | 2 6 | 1 |
| Trade and Shipping (Part 1) | 1944 | May, 1948 | 10 0 | 4 |
| Trade and Shipping (Part II) | 1943 and 1944 | July, 1948 | 5 0 | 2 |
| Agricultural and Pastoral Production | 1947–48 | Dec., 1949 | 3 6 | 1 |
| Factory Production | 1944–45 and 1945–46* | May, 1949 | 5 0 | 4 |
| Insurance | 1943, 1944, and 1945 | Aug., 1947 | 2 0 | 1 |
| Miscellaneous (Banking, Bankruptcy, Building Societies, Cinematograph Theatres, Tramways) | 1943, 1944, and 1945 | Jan., 1949 | 2 6 | 1 |
| Prices, Wages, and Labour Statistics | 1947 | Jan., 1949 | 2 6 | 1 |
| Industrial Accidents | 1943 and 1944 | June, 1948 | 2 6 | 1 |
| Local Authorities Handbook of New Zealand | 1945–46 | Oct., 1948 | 7 6 | 4 |
| Pocket Compendium of New Zealand Statistics | 1948–49 | Aug., 1949 | 1 0 | 1 |
| Monthly Abstract of Statistics | 2 6† | 1 | ||
| Retail Prices in New Zealand | Special Spplmnt. (Oct.-Nov. Abstract) | Dec., 1949 | 2 0 | 1 |
| Volumes of 1945 Census Results‡— | ||||
| Increase and Location of Population | 1945 | Dec. 1947 | 4 6 | 2 |
| Poultry | 1945 | May, 1948 | 2 6 | 1 |
| Island Territories | 1945 | June, 1948 | 2 6 | 1 |
| Ages and Marital Status | 1945 | July, 1949 | 5 0 | 2 |
| Interim Returns of Ages, Marital Status Religious Professions, Birthplaces, Duration of Residence of Overseas-born, Race, War Service, Industries, Occupations, Occupational Status and Travelling Time | 1945 | Jan., 1949 | 2 6 | 1 |
| Volumes of 1936 Census Results— | ||||
| Increase and Location of Population | 1936 | Sept., 1937 | 4 6 | 2 |
| Dependencies | 1936 | Sept., 1937 | 1 6 | 1 |
| Maori Census | 1936 | April, 1940 | 3 0 | 1 |
| Ages and Marital Status | 1936 | April, 1940 | 4 0 | 2 |
| Orphan Children and Dependent Children | 1936 | June, 1940 | 2 6 | 1 |
| Religious Professions | 1936 | June, 1940 | 2 6 | 1 |
| Birthplaces | 1936 | July, 1945 | 2 6 | 1 |
| Duration of Residence of Overseas-born | 1936 | July, 1945 | 2 6 | 1 |
| Race | 1936 | Aug., 1945 | 2 6 | 1 |
| Industries and Occupations | 1936 | Feb., 1946 | 7 6 | 2 |
| Unemployment | 1936 | Aug., 1945 | 4 0 | 1 |
| Incomes | 1936 | Sept., 1945 | 7 6 | 2 |
| Dwellings and Households | 1936 | May, 1946 | 6 0 | 2 |
| Poultry | 1936 | Sept., 1937 | 1 6 | 1 |
| War Service | 1936 | June, 1938 | 1 6 | 1 |
| Census of Libraries§ | 1936 | May, 1940 | ||
| Life Tables | 1936 | Dec., 1944 | 1 6 | 1 |
NOTE—This list is subject to revision from time to time. Publications are obtainable from the Government Printer, Wellington.
Table of Contents
FOR some of the statistical series included in this issue of the Year-Book later information is available than is included in the body of the book. This later information is given in the following paragraphs, with references to the appropriate portion of the Year-Book containing more detailed information for earlier periods.
Inter-censal and Estimated Populations (pp. 23–38).—A further analysis of some of the more important results of the 1945 population census is included in Appendix (a), pp. 950–971. Recent population changes are given in the following table.
POPULATION AT END OF YEAR
| Year Ended | Males. | Females. | Total. | Mean Population for Year. |
|---|---|---|---|---|
| Total Population (Including Maoris) | ||||
| 30th September, 1948 | 926,785 | 922,233 | 1,849,018 | 1,832,029 |
| 31st December, 1948 | 934,329 | 927,594 | 1,861,923 | 1,841,531 |
| 31st March, 1949 | 940,507 | 932,794 | 1,873,301 | 1,851,291 |
| 30th June, 1949 | 944,228 | 936,277 | 1,880,505 | 1,861,183 |
| 30th September, 1949 | 947,632 | 940,491 | 1,888,123 | 1,871,087 |
| Maori Population | ||||
| 30th September, 1948 | 57,116 | 53,868 | 110,984 | 109,018 |
| 31st December, 1948 | 57,549 | 54,220 | 111,769 | 109,948 |
| 31st March, 1949 | 58,016 | 54,653 | 112,669 | 110,866 |
| 30th June, 1949 | 58,353 | 55,033 | 113,386 | 111,762 |
| 30th September, 1949 | 58,819 | 55,431 | 114,250 | 112,610 |
These figures exclude the population of Cook Islands and Niue (18,983 at 31st March, 1949), Tokelau Islands (1,434 at 31st March, 1949) and Western Samoa (75,381 at 31st March, 1949).
Population of Urban Areas.—Following are statistics of population (including Maoris) in the urban areas as at 1st April, 1949.
| Urban Area. | Total Population (Including Maoris). |
|---|---|
| Auckland | 298,900 |
| Wellington | 189,900 |
| Christchurch | 167,900 |
| Dunedin | 89,900 |
| Hamilton | 30,100 |
| Gisborne | 18,800 |
| Napier | 22,900 |
| Hastings | 23,300 |
| New Plymouth | 23,300 |
| Wanganui | 28,500 |
| Palmerston North | 31,100 |
| Nelson | 18,600 |
| Timaru | 21,500 |
| Invercargill | 30,500 |
Natural Increase.—Owing to the substantial increase in births in the last few years and the relative stability in the number of deaths (which will be referred to later), population gains from natural increase—i.e., excess of births over deaths—have been particularly marked in recent years, the excess of births over deaths increasing from 23,965 in 1945 to 32,362 in 1947 (a record level) with a slight recession to 31,864 in 1948. The annual average population gain from this source in the quinquennium 1941–45 was 20,925.
Migration.—The total number of arrivals in New Zealand during the year ended 31st March, 1949, was 75,714, while the total number of departures in the same year was 71,687. Excluding crews and through passengers, arrivals totalled 35,946 and departures 31,765, making the net excess of arrivals 4,181, as compared with 5,756 in 1948, 3,038 in 1947, and 2,343 in 1946 (March years). A classification of total arrivals and departures gives the following results.
| —– | Year Ended 31st March, | |
|---|---|---|
| 1948. | 1949. | |
| Migration: Arrivals | ||
| Immigrants intending permanent residence | 9,648 | 11,387 |
| Permanent residents returning | 11,987 | 12,840 |
| Visitors | 11,478 | 11,719 |
| Through passengers | 5,136 | 3,073 |
| Crews | 34,176 | 36,695 |
| Not stated | 31 | |
| Total arrivals | 72,456 | 75,714 |
| Migration: Departures | ||
| Permanent residents departing— | ||
| Permanently | 5,768 | 6,679 |
| Temporarily | 10,726 | 13,566 |
| Temporary residents departing | 10,894 | 11,520 |
| Through passengers | 5,136 | 3,073 |
| Crews | 33,319 | 36,849 |
| Total departures | 65,843 | 71,687 |
Recent statistics of the number of immigrants intending permanent residence show considerable increases; the arrivals under this heading having increased during the last five March years as follows: 1945, 1,704; 1946, 4,645; 1947, 8,106; 1948, 9,648 and 1949, 11,387. The resumption of assisted passages for certain classes of immigrants is reflected in the statistics. In the last two years the number coming under this heading totalled 1,137 in 1948 and 1,522 in 1949.
Vital statistics for the calendar years 1947 and 1948 are shown, in summary form, in the following table. Statistics in more detail for earlier years are given on pages 41–102.
| — | 1947. | 1948. | ||
|---|---|---|---|---|
| Number. | Rate per 1,000 of Mean Population. | Number. | Rate per 1,000 of Mean Population. | |
| * Infant mortality rates per 1,000 live births. | ||||
| Births— | ||||
| Europeans | 44,816 | 26.42 | 44,193 | 25.52 |
| Maoris | 4,988 | 46.86 | 4,956 | 45.09 |
| Total population | 49,804 | 27.63 | 49,149 | 26.69 |
| Deaths— | ||||
| Europeans | 15,904 | 9.38 | 15,812 | 9.13 |
| Maoris | 1,538 | 14.45 | 1,473 | 13.40 |
| Total population | 17,442 | 9.68 | 17,285 | 9.39 |
| Marriages (European population) | 18,525 | 10.92 | 17,192 | 9.93 |
| Infant deaths under one year— | ||||
| Europeans | 1,122 | 25.04* | 970 | 21.95* |
| Maoris | 365 | 73.18* | 380 | 76.67* |
| Totals | 1,487 | 29.86* | 1,350 | 27.47* |
Births.—The total number of births registered in 1948 (49,149) has been exceeded only once in the history of the country, this occurring in 1947 when the registrations numbered 49,804. The birth-rate for 1947 (27.63 per 1,000 of total population) is the highest on record in recent years; and, in fact, it is necessary to go back to 1912 to find a higher rate recorded in New Zealand. The high rate of marriages and the extension of family benefits under the Social Security Act may be mentioned as two factors contributing to the recent high level of births. The decrease in the number of births in 1948 is a reflection of the decrease in marriages, which have shown considerable decreases since the peak year of 1946. Another factor is the considerable decline in the proportion of first births to total births in 1948. Figures from 1939 to 1948, with the exception of 1942, for which year figures of first births are not available, are given below.
LIVE BIRTHS: EUROPEAN POPULATION
| Year. | Total Legitimate Cases. | Legitimate First Cases. | Proportion of First to Total Births. |
|---|---|---|---|
| Per Cent. | |||
| 1939 | 27,408 | 11,347 | 41.40 |
| 1940 | 31,150 | 12,986 | 41.69 |
| 1941 | 33,420 | 13,431 | 40.19 |
| 1943 | 28,520 | 9,216 | 32.31 |
| 1944 | 31,156 | 9,626 | 30.90 |
| 1945 | 34,733 | 11,265 | 32.43 |
| 1946 | 39,535 | 14,882 | 37.64 |
| 1947 | 42,565 | 17,027 | 40.00 |
| 1948 | 42,005 | 15,184 | 36.15 |
During the early war years, for obvious reasons, the rate of first births rose to a high level. During the later war years this proportion dropped heavily, but a definite rising trend commenced in 1945 and continued until 1947. It would thus appear that the major factor in the rising birth-rate of these years can be attributed to the increase in the first-birth rate, which is in itself a natural accompaniment of the steep rise in the marriage-rate from 1944 to 1946.
Deaths.—For the third year in succession the death-rate has fallen, the rate for the total population in 1948 being 9.39 per 1,000 of population (9.13 per 1,000 for Europeans). The absence of any widespread fatal epidemic and an exceptionally low infant-mortality rate are probably the two major factors responsible for keeping the death-rate down during 1948.
Infant Mortality.—New Zealand's infant-mortality rate—i.e., the number of deaths of infants under one year of age per 1,000 live births—in respect of its population other than Maori is normally the lowest of any country in the world. The figure for 1948, 21.95 per 1,000, again sets a new low record for this country. This achievement is all the more satisfactory when it is considered that New Zealand has enjoyed the reputation of remarkably low infant-mortality rates for very many years, and has nevertheless succeeded in further lowering the level by over 8 per 1,000 live births in the short space of the five years 1944–48. At the same time, there is no room for complacency in this respect, as other countries are also achieving appreciable improvements in their infant mortality, and, indeed, Sweden has during two out of the last three years succeeded in equalling New Zealand's rate.
Still-births and Neo-natal Deaths.—The principal factors in infant mortality are antenatal influences which cause death to ensue during the early weeks of life. The fact that still-births are also the result of such ante-natal influences should not be lost sight of, and for this and other reasons it is of value to compute rates per 1,000 total births for neo-natal mortality (deaths of infants under 1 month of age) and still-births in conjunction, as in the following table, which relates to the population exclusive of Maoris. In the computation of the rates for numbers inclusive of still-births, the latter are taken into account in both births and deaths.
| — | Still-births. | Neo-natal Deaths. | Neo-natal Deaths plus Still-births. | |||
|---|---|---|---|---|---|---|
| Number. | Rate. | Number. | Rate. | Number. | Rate. | |
| 1944 | 799 | 23.23 | 692 | 20.12 | 1,491 | 43.35 |
| 1945 | 865 | 22.84 | 725 | 19.14 | 1,590 | 41.98 |
| 1946 | 931 | 21.75 | 799 | 18.67 | 1,730 | 40.42 |
| 1947 | 911 | 19.92 | 810 | 17.71 | 1,721 | 37.63 |
| 1948 | 834 | 18.52 | 698 | 15.50 | 1,532 | 34.02 |
For a number of years the still-birth and neo-natal death-rates counterbalanced one another, but the trend of more recent years has been towards a steady reduction in both of these rates, as well as in the combined rate. The latter rate for 1948 creates a new low record.
Maternal Mortality.—The maternal-mortality rate—i.e., the number of deaths of women from the diseases and accidents of pregnancy and child-birth (excluding septic abortion)—per 1,000 live births for the year 1947 was 0.85. This easily constituted a record for New Zealand. The rate for 1948 indicated a slight rise, but the figure of 1.06 is still well below the average rate for the last ten years.
EUROPEAN DEATHS FROM PUERPERAL CAUSES (EXCLUDING SEPTIC ABORTION), 1939–48
| Year. | Number. | Rate per 1,000 Live Births. |
|---|---|---|
| 1939 | 85 | 2.95 |
| 1940 | 82 | 2.50 |
| 1941 | 94 | 2.68 |
| 1942 | 58 | 1.73 |
| 1943 | 52 | 1.72 |
| 1944 | 72 | 2.14 |
| 1945 | 72 | 1.94 |
| 1946 | 74 | 1.76 |
| 1947 | 38 | 0.85 |
| 1948 | 47 | 1.06 |
It is generally conceded that in years of unusually high birth-rates the maternal-mortality rate tends to rise, but the reverse has been the experience in recent years in this country. Even with the addition of deaths from septic abortion, the total death-rate from puerperal causes was only 1.26 per 1,000 live births in 1948.
Marriages.—The annual number of marriages celebrated in New Zealand gradually rose as the country emerged from the depression years until a very high peak was attained in the early war years, 1939 and 1940. With the recruitment into overseas war service of eligible young men, this total declined considerably to 11,579 in 1943. From then on successive annual increases in both number and rate were experienced until a new record was established in 1946 with a total of 20,535 marriages and a rate of 12.38 per 1,000 of mean population. The figures of the immediate post-war period contain a high proportion of delayed marriages, and the reduction in 1947 to 18,525, and in 1948 to 17,192 has resulted in a rate for 1948 of 9.93 per 1,000 of mean population, which is lower than that recorded in 1938 and 1939. As has already been pointed out in these notes, the effects of the falling marriage rate are reflected in the decrease in the birth-rate.
Crops (pp. 899–914).—Following is a summary of the principal crop statistics for the production year 1948–49.
PRINCIPAL CROPS, 1948–49 PRODUCTION SEASON
| Name of Crop. | Areas, 1948–49. | Yields. | |
|---|---|---|---|
| Unit. | 1948–49. | ||
| Wheat— | Acres. | ||
| For threshing | 146,707 | Bushel | 5,958,026 |
| For chaff, hay, or ensilage | 868 | Ton | 1,852 |
| Fed off, cut for green fodder, &c. | 1,078 | ||
| Oats— | |||
| For threshing | 78,300 | Bushel | 3,718,597 |
| For chaff, hay, or ensilage | 67,492 | Ton | 122,518 |
| Fed off, cut for green fodder, &c. | 49,058 | ||
| Barley— | |||
| For threshing | 58,707 | Bushel | 2,256,362 |
| For chaff, hay, or ensilage | 671 | Ton | 1,140 |
| Fed off, cut for green fodder, &c. | 11,429 | ||
| Maize— | |||
| For threshing | 6,588 | Bushel | 357,270 |
| For ensilage | 67 | Ton | 284 |
| Fed off, cut for green fodder, &c. | 5,793 | ||
| Peas for threshing | 49,152 | Bushel | 1,195,196 |
| Potatoes | 18,940 | Ton | 109,644 |
| Onions | 1,175 | Ton | 10,674 |
| Tobacco | 3,484 | ||
| Rye-grass harvested for seed— | |||
| Perennial | 51,226 | lb. | 17,159,333 |
| Italian (including western wolths) | 4,095 | lb. | 1,818,747 |
| Short rotation (HI) | 8,629 | lb. | 3,015,314 |
| Cocksfoot harvested for seed | 6,680 | lb. | 1,193,364 |
| Chewings fescue harvested for seed | 19,436 | lb. | 5,264,611 |
| Crested dogstail harvested for seed | 7,913 | lb. | 1,770,377 |
| Red clover (including cowgrass) harvested for seed | 21,299 | lb. | 3,569,818 |
| White clover harvested for seed | 27,303 | lb. | 3,544,789 |
| Fodder crops— | |||
| Grasses and clovers cut for hay | 533,471 | Ton | 1,077,198 |
| Grasses and clovers cut for ensilage | 67,913 | Ton | 283,127 |
| Lucerne cut for hay or ensilage | 47,224 | Ton | 110,937 |
The yield of wheat in the 1949 harvest season was 5,958,026 bushels, an increase of 1,419,009 bushels above the total yield in the previous season. The acreage harvested rose from 123,751 acres in 1947–48 to 146,707 acres in 1948–49—a rise of 18.6 per cent. Moreover, the yield per acre (40.41 bushels) was the highest on record, the next highest yield being in the 1944–45 season (38.02 bushels). The acreage under oats for grain also showed an increase—in this instance from 63,159 acres in 1947–48 to 78,300 acres in 1948–49—while the aggregate yield rose from 2,853,517 bushels to 3,718,597 bushels The acreage of barley threshed showed a considerable decrease (from 63,159 acres in 1947–48 to 58,707 acres in 1948–49), although the yield rose from 2,087,900 bushels in the former year to 2,256,362 bushels in the latter year.
The potato crop in 1948–49 totalled 109,644 tons, a very large reduction of 45,374 tons or 29.3 per cent. on the 1947–48 harvest; while a decrease was also recorded in the onion crop (10,674 tons in 1948–49, compared with 13,585 tons in 1947–48).
The area under tobacco increased from 3,402 acres in 1947–48 to 3,484 acres in 1948–49—a new record acreage under this crop. In addition to this area, a quite considerable acreage is grown within borough boundaries. Acreages of grasses and clovers harvested for seed in 1948–49 also increased when compared with those of the previous year. The acreage of perennial rye-grass rose from 44,738 acres in 1947–48 to 51,226 acres in 1948–49—the yield rising from 16,784,436 lb. to 17,159,333 lb.
Live-stock (pp. 914–928).—In the following table the numbers of live-stock on holdings at 31st January, 1948 and 1949, are given.
LIVE-STOCK AS AT 31ST JANUARY
| — | 1948. | 1949. |
|---|---|---|
| Cattle— | ||
| Dairy stock— | ||
| Breeding-bulls, two years old and over | 57,464 | 57,527 |
| Dairy cows and heifers, two years old and over— | ||
| Cows in milk at any time during season | 1,713,532 | 1,746,753 |
| Heifers not yet in milk | 68,071 | 62,918 |
| Cows not in milk during season, but intended for milking in future | 40,516 | 43,080 |
| Heifers— | ||
| One and under two years old | 356,507 | 365,851 |
| Under one year old | 369,289 | 373,432 |
| Bulls and bull calves under two years old intended for dairy breeding | 32,910 | 31,867 |
| Totals, dairy stock | 2,638,289 | 2,681,428 |
| Beef stock— | ||
| Breeding-bulls, two years old and over | 22,874 | 22,129 |
| Beef cows and heifers, two years old and over (including culls from dairying herds) | 775,654 | 756,354 |
| Heifers— | ||
| One and under two years old | 194,143 | 197,930 |
| Under one year old | 190,804 | 185,756 |
| Steers, two years old and over (including bulls intended for slaughter) | 463,686 | 446,689 |
| Steers and bulls, one and under two years old | 198,563 | 202,788 |
| Bulls and steer calves under one year old | 232,274 | 229,762 |
| Totals, beef stock | 2,077,998 | 2,041,408 |
| Totals, all cattle | 4,716,287 | 4,722,836 |
| Pigs— | ||
| Under six months old | 330,914 | 333,056 |
| Six months and under one year old | 136,133 | 130,649 |
| Boars, one year old and over | 12,776 | 12,831 |
| Sows, one year old and over | 68,354 | 68,305 |
| Totals, pigs | 548,177 | 544,841 |
| Horses— | ||
| Draught and three-quarter draught | 81,871 | 74,004 |
| Spring-cart or light artillery (including half draught) | 32,346 | 31,380 |
| Hacks and light working-horses | 73,882 | 73,709 |
| Thoroughbred and other horses | 15,786 | 16,962 |
| Totals, horses | 203,885 | 196,055 |
The total number of cattle in New Zealand on 31st January, 1949, was 4,722,836, compared with the previous record total of 4,716,287 in 1948. Dairy stock rose from 2,638,289 in 1948 to 2,681,428 in 1949, while beef stock fell slightly from 2,077,998 in the former year to 2,041,408 in the latter year.
The number of dairy cows in milk during the season rose slightly (from 1,713,532 in 1947–48 to 1,746,753 in 1948–49), while butterfat production increased from 420,000,000 lb. in the 1947–48 dairying season to 460,000,000 lb. in the 1948–49 season, better climatic conditions prevailing during the latter season.
Sheep.—A collection of statistics of sheep population is made through Inspectors of Stock on 30th April. Following are the results (in summarized form) of the last two collections of this data.
SHEEP AT 30TH APRIL (INCLUDING SHEEP IN BOROUGHS)
| Class. | 1948. | 1949. |
|---|---|---|
| Number. | Number. | |
| Rams | 571,477 | 582,922 |
| Wethers | 2,248,861 | 2,475,413 |
| Breeding-ewes | 21,055,482 | 21,499,703 |
| Dry ewes | 635,242 | 635,242 |
| Lambs | 7,946,724 | 7,651,638 |
| Total sheep population | 32,483,138 | 32,844,918 |
The foregoing statement shows the position at 30th April of each year, and at this stage the meat-slaughtering season is well advanced, consequently the figures do not represent maximum sheep population. Estimates of lambing made from reports furnished by Inspectors of Stock show the total production of lambs in the 1949 season to amount to 20,744,150 lambs, as compared with 19,805,885 lambs actually tailed in the 1948 season.
Farm Machinery (pp. 895–898).—Statistics of farm machinery on holdings in 1948 and 1949 are given in the following table.
FARM MACHINERY AS AT 31ST JANUARY
| — | 1948. | 1949. |
|---|---|---|
| Electric motors— | ||
| Number | 88,282 | 94,047 |
| Horse-power | 81,864 | 86,250 |
| Internal combustion engines— | ||
| Number | 24,922 | 26,199 |
| Horse-power | 71,736 | 73,540 |
| Rotary hoes and garden tractors— | ||
| Number | 2,253 | 2,660 |
| Horse-power | 9,806 | 11,905 |
| Agricultural tractors— | ||
| Number | 23,423 | 27,447 |
| Horse-power | 512,547 | 620,456 |
| Milking-machines— | ||
| Plants | 23,461 | 34,114 |
| Cow capacity | 118,548 | 123,511 |
| Cows in milk on holdings employing milking-machines | 1,574,339 | 1,616,265 |
| Shearing-machines— | ||
| Plants | 15,468 | 16,392 |
| Stands | 35,448 | 36,952 |
| Cream-separators | 48,457 | 48,451 |
Persons engaged on Farms.—Statistics were collected of the number of persons engaged in farm-work on holdings of 1 acre and over outside borough boundaries on 31st January, 1949. The figures include occupiers and those members of the occupier's family over school age who actually work on the farm; but exclude temporary workers (such as those engaged in harvesting or shearing operations), domestic servants or cooks, and workers engaged in flax-mills or other registered factories which may happen to be situated on a holding. Wives and daughters of farmers are not included unless the greater part of their time is spent in farm-work.
The following table shows a comparison of changes in the number of persons engaged on farms, statistics not being collected during the period 1931–46.
| — | Persons engaged on Farms. | ||
|---|---|---|---|
| Males. | Females. | Total. | |
| 1928 | 106,649 | 22,832 | 129,481 |
| 1929 | 112,885 | 25,724 | 138,609 |
| 1930 | 119,321 | 18,800 | 138,121 |
| 1947 | 112,921 | 11,465 | 124,386 |
| 1948 | 109,431 | 11,873 | 121,304 |
| 1949 | 109,246 | 12,140 | 121,386 |
It will be seen that the total number of persons engaged on farms has fallen by 16,735 between 1930 and 1949, the fall in the case of males being 10,075 and in the case of females 6,660. There was a considerably greater relative fall in female employment on farms, although of recent years the number of females has shown a slight but steady increasing tendency. It should be borne in mind that this collection covers only those permanently engaged in farm-work and does not cover seasonal employees.
The following statistics afford some indication of the principal changes in the volume of farm-work since 1930, and, as such, are of interest when taken in conjunction with the change in the number of persons engaged on farms.
| — | Unit. | 1930. | 1949. | Percentage Increase. |
|---|---|---|---|---|
* Decrease. †1948 year. | ||||
| Number of farm holdings | Number | 85,167 | 87,076 | +2.2 |
| Total area cultivated | Acres | 19,156,074 | 20,128,199 | +5.1 |
| Area under crops | Acres | 1,283,947 | 1,176,716 | -8.4* |
| Area under sown grasses | Acres | 16,872,948 | 17,842,399 | +5.7 |
| Area top-dressed | Acres | 2,650,748 | 5,062,412 | +91.0 |
| Dairy cows in milk | Number | 1,368,956 | 1,746,753 | +27.6 |
| Sheep shorn | Number | 26,999,410 | 30,277,551 | +12.1 |
| Lambs tailed | Number | 14,887,599 | 19,805,885† | +33.0 |
It is clear that there has been, in the aggregate, a considerable increase in farming activity between 1930 and 1949, despite the fall in the number of persons engaged. Statistics of farm machinery on holdings in the two years indicate greatly increased mechanization of New Zealand farming. This is illustrated by the following figures.
| — | 1930. | 1949. | Percentage Increase. |
|---|---|---|---|
| Electric motors | 16,456 | 94,047 | +471.5 |
| Internal-combustion engines | 19,169 | 26,199 | +36.7 |
| Agricultural tractors | 3,891 | 27,447 | +605.4 |
| Milking plants | 20,415 | 34,114 | +67.1 |
| Shearing-machines | 7,394 | 16,392 | +121.7 |
It will be seen that the increase in various types of farm machinery has been most substantial.
The changes in the regional distribution of persons engaged on farms (males only) between 1930 and 1949 show some interesting features. Following are the figures.
PERSONS ENGAGED ON FARMS (MALES ONLY)
| Land District. | 1930. | 1949. | Increase (+), Decrease (-), per Cent. |
|---|---|---|---|
| North Auckland | 16,067 | 16,275 | +1.3 |
| South Auckland | 21,213 | 23,685 | +11.7 |
| Gisborne | 3,905 | 3,927 | +0.6 |
| Hawkes Bay | 7,517 | 7,461 | -0.7 |
| Taranaki | 9,332 | 8,100 | -13.2 |
| Wellington | 18,137 | 15,904 | -12.3 |
| Marlborough | 2,586 | 2,136 | -17.4 |
| Nelson | 3,568 | 3,284 | -8.0 |
| Westland | 1,013 | 798 | -21.2 |
| Canterbury | 17,354 | 13,583 | -21.7 |
| Otago | 10,538 | 7,480 | -29.0 |
| Southland | 8,091 | 6,613 | -18.3 |
| Totals, New Zealand | 119,321 | 109,246 | -8.4 |
| Totals, North Island | 76,171 | 75,352 | -1.1 |
| Totals, South Island | 43,150 | 33,894 | -21.5 |
It will be seen that a considerable increase in the numbers of male persons engaged in farming has taken place in the South Auckland Land District, slight increases in North Auckland and Gisborne, while in the southern portion of the North Island and in the South Island considerable decreases have taken place.
Top-dressing.—The improvement in the area top-dressed shown in the statistics for 1947–48 continued in 1948–49, when 5,062,412 acres were top-dressed, as compared with 4,684,225 acres in 1947–48. The highest acreage top-dressed hitherto recorded was in the 1940–41 season, when 4,649,000 acres were treated. Owing to wartime shortages of fertilizers, top-dressing fell away in the next three seasons, the 1943–44 area being 3,370,000 acres. Since 1943–44 a very substantial improvement has taken place, the latest figure being the highest on record.
Estimated Areas of Principal Crops, 1950 Season.—Estimates of areas sown under wheat, oats, barley, and potatoes were collected in the spring of 1949 by inquiry from growers of these crops. Following are the estimates.
| — | Acreages under Principal Crops. | |
|---|---|---|
| 1948–49 (Final Acres). | 1949–50 (Estimated Acres). | |
| Wheat | 148,653 | 130,000 |
| Oats | 194,850 | 170,000 |
| Barley | 70,807 | 70,000 |
| Peas for threshing | 49,152 | 43,000 |
| Potatoes | 18,940 | 18,000 |
Following are the principal statistics of factory production in the years 1938–39, 1946–47 and 1947–48. It should be noted that the 1946–47 figures of “cost of materials” and “value of output” have been amended since the Section on Factory Production (pp. 360–390) and the Statistical Summary (p. 940) were printed off.
| — | Production Year | ||
|---|---|---|---|
| 1938–39. | 1946–47. | 1947–48. | |
| Number of— | |||
| Establishments | 6,146 | 7,642 | 7,966 |
| Persons engaged— | |||
| Males | 76,868 | 100,915 | 106,206 |
| Females | 25,667 | 33,520 | 34,061 |
| Totals | 102,535 | 134,435 | 140,267 |
| Salaries and wages paid— | |||
| To males £(000) | 19,486 | 38,840 | 44,761 |
| To females £(000) | 2,784 | 6,497 | 7,372 |
| Totals £(000) | 22,270 | 45,336 | 52,133 |
| Cost of materials £(000) | 75,635 | 138,534 | 181,773 |
| Other expenses £(000) | 10,002 | 18,247 | 21,241 |
| Value of output £(000) | 114,447 | 218,106 | 272,155 |
| Added value £(000) | 38,812 | 79,572 | 90,332 |
| Value of assets— | |||
| Fixed, including rented assets— | |||
| Land and buildings £(000) | 27,202 | 38,061 | 42,593 |
| Plant and machinery £(000) | 49,296 | 75,459 | 90,220 |
| Floating assets— | |||
| Stocks of materials, &c. £(000) | 15,220 | 38,087 | 52,895 |
| Cash, debtors, &c. £(000) | 15,180 | 35,053 | 37,163 |
| Total investment £(000) | 106,898 | 186,659 | 222,871 |
| Motive power— | |||
| Total H.p.(000) | 848 | 1,215 | 1,320 |
| Excluding electric supply industry H.p.(000) | 263 | 406 | 431 |
| Averages per person engaged— | |||
| Salary or wage— | |||
| Males £ | 254 | 384 | 421 |
| Females £ | 108 | 194 | 216 |
| Both sexes £ | 217 | 337 | 372 |
| Added value £ | 379 | 591 | 644 |
The quantities of some of the more important factory products in 1938–39, 1946–47, and 1947–48 are given in the following table.
| Item. | Unit. | 1938–39. | 1946–47. | 1947–48. |
|---|---|---|---|---|
| * Carcase weight. | ||||
| Food and drink— | ||||
| Aerated waters and cordials | Gallons | 2,803,000 | 4,330,000 | 4,312,000 |
| Ale and stout | Gallons | 17,394,000 | 29,941,000 | 30,499,000 |
| Biscuits | Tons | 8,000 | 12,000 | 13,000 |
| Butter | Cwt. | 2,957,000 | 2,915,000 | 3,040,000 |
| Canned and pulped fruit | Cwt. | 88,000 | 37,000 | 51,000 |
| Canned vegetables | Cwt. | 21,000 | 114,000 | 124,000 |
| Cheese | Cwt. | 1,705,000 | 1,833,000 | 1,729,000 |
| Confectionery | Tons | 12,000 | 12,000 | 13,000 |
| Flour | Short tons | 145,000 | 155,000 | 172,000 |
| Frozen beef* | Cwt. | 1,102,000 | 2,079,000 | 2,080,000 |
| Frozen lamb | Carcases | 9,462,000 | 11,454,000 | 12,209,000 |
| Frozen mutton | Carcases | 2,651,000 | 3,072,000 | 2,825,000 |
| Ham and bacon (cured) | Cwt. | 164,000 | 305,000 | 282,000 |
| Ice-cream and ice-cream products | Gallons | 808,000 | 2,554,000 | 2,714,000 |
| Jam and jellies | Cwt. | 56,000 | 137,000 | 133,000 |
| Oatmeal, rolled oats, &c. | Short tons | 7,000 | 11,000 | 9,000 |
| Preserved meats | Cwt. | 82,000 | 184,000 | 183,000 |
| Sauces and pickles | Doz. bot. | 166,000 | 398,000 | 343,000 |
| Textiles— | ||||
| Blankets | Pairs | 135,000 | 135,000 | 125,000 |
| Flannel | Yards | 604,000 | 604,000 | 460,000 |
| Tweed and cloth | Yards | 1,251,000 | 2,184,000 | 2,247,000 |
| Clothing— | ||||
| Boots and shoes | Pairs | 1,978,000 | 3,152,000 | 3,396,000 |
| Dresses | Number | 681,000 | 1,120,000 | 1,197,000 |
| Hosiery | Doz. pairs | 363,000 | 571,000 | 647,000 |
| Knitted outerwear | Dozen | 15,000 | 77,000 | 90,000 |
| Men's trousers | Number | 683,000 | 647,000 | 747,000 |
| Overcoats— | ||||
| Men's and boys' | Number | 69,000 | 222,000 | 196,000 |
| Women's and girls' | Number | 149,000 | 396,000 | 405,000 |
| Pyjamas and nightwear | Dozen | 57,000 | 115,000 | 111,000 |
| Shirts | Dozen | 182,000 | 148,000 | 207,000 |
| Slippers | Pairs | 1,244,000 | 1,888,000 | 2,065,000 |
| Suits— | ||||
| Men's | Number | 209,000 | 123,000 | 141,000 |
| Boys' | Number | 24,000 | 18,000 | 15,000 |
| Underwear | Dozen | 442,000 | 641,000 | 820,000 |
| Other— | ||||
| Agricultural lime | Tons | 481,000 | 897,000 | 1,012,000 |
| Cement | Tons | 216,000 | 219,000 | 227,000 |
| Chemical fertilizers | Tons | 475,000 | 602,000 | 619,000 |
| Leather | lb. | 4,829,000 | 12,222,000 | 12,267,000 |
| Manures | Cwt. | 619,000 | 818,000 | 702,000 |
| Soap (including toilet) | Tons | 8,000 | 13,000 | 10,000 |
| Bricks | Millions | 37 | 27 | 29 |
| Electricity generated | Million kW.h. | 1,414 | 2,521 | 2,590 |
| Gas made | Million cub. ft. | 4,155 | 5,329 | 5,457 |
| Radio receivers | Number | 25,000 | 52,000 | 49,000 |
Classification of Industries.—In the following table the principal factory statistics are classified according to four significant industrial groups. Group I comprises industries concerned with processing pastoral products; Group II, public utility industries (electricity generation and supply, gasworks); Group III, further industries closely associated with primary or extractive production (e.g., sawmilling); and Group IV, the remainder of factory industries, being those falling generally within the economic classification of “secondary” production. (For a detailed explanation see pages 376–377 of this Year-Book.)
| Group and Industry. | Persons engaged. | Salaries and Wages paid. | Cost of Materials. | Value of Output. | Added Value. |
|---|---|---|---|---|---|
| * Large increase due to incorporation of subsidies on guaranteed prices paid to dairy factories, previously paid direct to farmers. | |||||
| 1938–39 | |||||
| Number. | £(000) | £(000) | £(000) | £(000) | |
| Group I | 13,391 | 3,837 | 44,052 | 51,062 | 7,010 |
| Group II | 5,681 | 1,558 | 5,582 | 7,840 | 2,258 |
| Group III | 10,579 | 2,583 | 2,409 | 7,015 | 4,606 |
| Group IV | 72,884 | 14,292 | 23,592 | 48,530 | 24,938 |
| Totals | 102,535 | 22,270 | 75,635 | 114,447 | 38,812 |
| 1946–47 | |||||
| Number. | £(000) | £(000) | £(000) | (£000) | |
| Group I | 17,291 | 7,428 | 66,201 | 80,203 | 14,002 |
| Group II | 6,199 | 2,470 | 9,129 | 12,457 | 3,328 |
| Group III | 11,533 | 4,385 | 4,337 | 12,110 | 7,773 |
| Group IV | 99,412 | 31,054 | 58,867 | 113,336 | 54,469 |
| Totals | 134,435 | 45,337 | 138,534 | 218,106 | 79,572 |
| 1947–48 | |||||
| Number. | £(000) | £(000) | £(000) | £(000) | |
| Group I | 17,877 | 8,164 | 87,168* | 101,785* | 14,617 |
| Group II | 6,120 | 2,548 | 9,298 | 12,768 | 3,469 |
| Group III | 12,523 | 5,362 | 5,239 | 14,926 | 9,687 |
| Group IV | 103,747 | 36,059 | 80,068 | 142,677 | 62,609 |
| Totals | 140,267 | 52,133 | 181,773 | 272,155 | 90,382 |
In the following table index numbers of the value and volume of production in each of the four classes and for all factory production are shown.
INDEX NUMBERS OF VALUE AND VOLUME OF FACTORY PRODUCTION BASE: 1938–39 (= 100)
| — | Production Year. | ||
|---|---|---|---|
| 1945–46. | 1946–47. | 1947–48. | |
| * Large increase due to incorporation of subsidies on guaranteed prices paid to dairy factories previously paid direct to farmers. | |||
| Group I (processing pastoral farm products)— | |||
| Added value | 178 | 200 | 209 |
| Value of products | 141 | 157 | 199* |
| Volume of production | 124 | 128 | 128 |
| Group II (public utility industries)— | |||
| Added value | 152 | 147 | 154 |
| Value of products | 149 | 159 | 163 |
| Volume of production | 147 | 154 | 158 |
| Group III (processing natural resources)— | |||
| Added value | 158 | 169 | 210 |
| Value of products | 160 | 173 | 213 |
| Volume of production | 112 | 113 | 131 |
| Group IV (“secondary” industries)— | |||
| Added value | 195 | 218 | 251 |
| Value of products | 206 | 234 | 294 |
| Volume of production | 134 | 146 | 159 |
| Total, all groups— | |||
| Added value | 185 | 205 | 233 |
| Value of products | 171 | 191 | 238 |
| Volume of production | 131 | 140 | 151 |
Urban Districts.—Statistics of building permits issued in cities, boroughs, and town districts (to which are added four counties and two road districts in which the population is predominantly urban) during the year ended 31st March, 1949, are given below, together with (for purposes of comparison) statistics for the previous year.
BUILDING PERMITS ISSUED: URBAN DISTRICTS
| — | Year ended 31st March, | |
|---|---|---|
| 1948. | 1949. | |
| Private dwellings— | ||
| New buildings— | ||
| Number | 9,854 | 11,102 |
| Value | £15,906,061 | £19,047,899 |
| Value of alterations and additions | £1,613,063 | £1,937,576 |
| Other buildings— | ||
| New buildings— | ||
| Number | 641 | 736 |
| Value | £2,374,273 | £2,923,703 |
| Value of alterations and additions | £1,533,228 | £2,521,275 |
| Total— | ||
| New buildings— | ||
| Number | 10,495 | 11,838 |
| Value | £18,280,334 | £21,971,602 |
| Value of alterations and additions | £3,146,291 | £4,458,851 |
| Grand total, value | £21,426,625 | £26,430,453 |
Rural Districts.—Building-permit statistics for rural districts have been collected from counties and certain Road Boards, but in some few instances the statistics are incomplete or reliable estimates could not be supplied. In the latter cases, the Building Controller's authorizations have been used. The total value of building operations in the rural districts in the year ended 31st March, 1949, was £9,578,244 (£7,888,516 in 1947–48). The total number of new private dwellings in the rural districts covered by the collection was 5,034 in 1948–49 and 4,194 in 1947–48.
All Districts (Urban and Rural).—The total value of building operations represented by permits or authorizations issued in the year ended 31st March, 1949, in both urban and rural districts was £36,008,697 (£29,315,141 in March year, 1948). Included in this total were permits for 16,136 private dwellings (14,048 in March year, 1948). These totals include State building operations commenced in the years quoted, as do the statistics under the separate headings, urban and rural.
Statistics of external trade in the calendar year 1948, in continuation of the statistics included in pp. 202–261 of this Year-Book, are given below.
Total Commodity Trade.—Following are statistics of exports and imports in 1936–38 (yearly average), 1939, 1947, and 1948.
| Calendar Year. | Exports. | Imports. | Excess of Exports over Imports. | |
|---|---|---|---|---|
| New Zealand Produce. | Total Exports. | |||
| £(000) | £(000) | £(000) | £(000) | |
| 1936–38 (average) | 60,091 | 60,614 | 51,947 | 8,667 |
| 1939 | 57,448 | 58,049 | 49,387 | 8,662 |
| 1947 | 127,713 | 129,406 | 128,725 | 681 |
| 1948 | 146,469 | 147,823 | 128,201 | 19,622 |
Commodity-trade statistics for the calendar year 1948 show some interesting features. The value of exports during 1948 was the highest on record, while the value of imports was exceeded only once previously—i.e., in 1947. The total trade per head of mean population in 1948 was £149 17s. 11d. (exports £80 5s. 6d. and imports £69 12s. 5d.), a figure substantially higher than any recorded previously.
Although price changes have contributed materially to the high values of commodity trade—both exports and imports—compared with the pre-war years 1936–38, there has also been a considerable upward movement in the volume of trade. The following table illustrates this fact.
INDEX NUMBERS OF VALUE AND VOLUME OF TRADE
| Calendar Year. | Exports. | Imports. | ||||||
|---|---|---|---|---|---|---|---|---|
| Value Index. | Value at 1936–38 Prices. | Value Index. | Value at 1936–38 Prices. | |||||
| £(m.) | Volume Index. | £(m.) | Volume Index. | |||||
| Total. | Per Head. | Total. | Per Head. | |||||
| 1936–38 (average) | 100 | 60.6 | 100 | 100 | 100 | 51.9 | 100 | 100 |
| 1939 | 96 | 59.9 | 98 | 96 | 95 | 49.0 | 94 | 92 |
| 1946 | 167 | 67.7 | 112 | 101 | 138 | 38.9 | 75 | 68 |
| 1947 | 214 | 71.9 | 119 | 105 | 248 | 59.8 | 115 | 102 |
| 1948 | 244 | 74.4 | 123 | 106 | 247 | 59.1 | 114 | 99 |
Comparing the 1948 figures with the pre-war averages, it will be found that exports have increased by 144 per cent. in value and imports by 147 per cent. in value. The average level of export prices in 1948 was approximately 109 per cent. above the prewar level (1936–38), while import prices were 134 per cent. higher than pre-war. The total volume of imports in 1948 was 14 per cent. above the pre-war (1936–38) volume, while the volume of imports per head was one per cent. below the pre-war figure. The volume of exports in 1948 was 23 per cent. above the 1936–38 level.
Exports.—As indicated earlier, New Zealand's export commodity trade reached a record level in 1948, an increase of 14 per cent. in value being recorded between 1947 and 1948. The increase was almost wholly accounted for by the higher returns from wool (£(m.) 12.6) and butter (£(m.) 5.0). Items of some importance in which decreases in exports were recorded were cheese, rabbit-skins, and canned meat. An indication of the progress of exports in the main groups of commodities is afforded by the following table.
VALUE OF EXPORTS
| Calendar Year. | Butter. | Cheese. | Frozen Meat. | Wool. | Hides, Pelts, and Skins. |
|---|---|---|---|---|---|
| £(000) | £(000) | £(000) | £(000) | £(000) | |
| 1936 | 15,318 | 5,122 | 13,239 | 13,294 | 3,315 |
| 1937 | 16,986 | 5,372 | 14,690 | 19,070 | 3,874 |
| 1938 | 16,520 | 5,935 | 15,092 | 12,185 | 2,383 |
| 1946 | 19,841 | 8,448 | 23,240 | 26,593 | 5,743 |
| 1947 | 28,836 | 11,621 | 29,353 | 31,933 | 10,383 |
| 1948 | 33,758 | 11,197 | 28,624 | 44,496 | 9,473 |
Apart from the question of values, a special interest attaches to progress in the volume of our export trade in major export commodities. In the following table the fluctuations in the quantities of exports of butter, cheese, meat, and wool since 1937 are shown.
| Calendar Year. | Butter. | Cheese. | Frozen Meat. | Wool. |
|---|---|---|---|---|
| * Record. | ||||
| Tons (000) | Tons (000) | Tons (000) | Tons (000) | |
| 1937 | 148.8* | 82.4 | 270.5 | 126.0 |
| 1938 | 130.7 | 80.5 | 268.7 | 121.1 |
| 1939 | 122.2 | 83.9 | 295.3 | 123.8 |
| 1940 | 131.1 | 101.7 | 348.8* | 134.1 |
| 1941 | 113.2 | 118.3 | 264.2 | 96.3 |
| 1942 | 117.2 | 134.4* | 287.1 | 137.3 |
| 1943 | 99.3 | 100.5 | 220.6 | 92.3 |
| 1944 | 115.3 | 77.7 | 207.8 | 84.2 |
| 1945 | 103.5 | 87.4 | 282.4 | 74.1 |
| 1946 | 101.8 | 75.7 | 337.3 | 163.1 |
| 1947 | 127.6 | 87.0 | 347.8 | 167.5 |
| 1948 | 135.6 | 75.6 | 343.5 | 188.0* |
Quantities of meat and wool exported in 1948 were materially above the pre-war totals; while exports of butter, though more than 6 per cent. above the 1947 figure were still considerably below the record figure for 1937. The figures do not include wartime supplies to Allied Forces under mutual-aid arrangements, a factor of particular importance in 1943 and 1944.
Imports.—Imports for the year 1948 were valued at £128,200,692, almost equalling the record figure for 1947. The quantum of imports while still greatly in excess of the pre-war level, also receded slightly from the 1947 figure.
The following table shows values of the principal statistical classes of imports for the years 1947 and 1948.
| Class. | Calendar Year. | Increase (+) or Decrease (-) | |
|---|---|---|---|
| 1947. | 1948. | ||
| £ | £ | £ | |
| Food, drink, and tobacco | 15,416,354 | 14,279,805 | -1,136,549 |
| Apparel | 5,343,614 | 3,328,160 | -2,015,454 |
| Textiles, fibres, and yarns | 26,651,166 | 24,704,029 | -1,947,137 |
| Oils, fats, and waxes | 7,247,421 | 9,678,433 | +2,431,012 |
| Metals and manufactures | 12,909,632 | 16,918,550 | +4,008,918 |
| Machinery | 18,418,780 | 21,016,207 | +2,597,427 |
| Paper and stationery | 7,468,576 | 6,940,829 | -527,747 |
| Drugs, chemicals, and manures | 6,026,472 | 5,330,475 | -695,997 |
| Vehicles and accessories | 13,162,534 | 11,669,752 | -1,492,782 |
| Other classes | 16,080,292 | 14,334,452 | -1,745,840 |
| Total imports | 128,724,841 | 128,200,692 | -524,149 |
Direction of Trade.—Details are given below showing for the year 1948 the value of exports to and imports from each of the principal countries trading with New Zealand. The balance of trade has also been shown.
| Country. | Total Exports. | Imports—Country of Shipment. | Balance (+ = Excess of Exports; - = Excess of Imports). |
|---|---|---|---|
| £ | £ | £ | |
| United Kingdom | 107,912,430 | 67,421,283 | +40,491,147 |
| India and Pakistan | 791,982 | 3,499,383 | -2,707,401 |
| Ceylon | 37,458 | 2,319,228 | - 2,281,770 |
| Malaya and Singapore | 297,780 | 897,203 | -599,423 |
| British West Africa | 3,226 | 633,806 | -630,580 |
| Union of South Africa | 89,103 | 753,936 | -664,833 |
| Canada | 2,990,814 | 6,862,272 | -3,871,458 |
| Australia | 3,955,960 | 14,701,835 | -10,745,875 |
| Fiji | 413,974 | 2,257,550 | -1,843,576 |
| Western Samoa | 320,183 | 251,180 | +69,003 |
| Other British Common-wealth countries | 819,170 | 2,089,710 | -1,270,540 |
| Totals, British Commonwealth countries | 117,632,080 | 101,687,386 | +15,944,694 |
| Belgium | 1,496,294 | 1,454,788 | + 41,506 |
| Denmark | 512,400 | 27,721 | + 484,679 |
| Finland | 56,367 | 239,421 | - 183,054 |
| France | 8,308,189 | 894,001 | + 7,414,188 |
| Italy | 753,111 | 261,993 | + 491,118 |
| Netherlands | 2,848,838 | 340,012 | + 2,508,826 |
| Russia (U.S.S.R.) | 2,544,382 | 18,411 | + 2,525,971 |
| Sweden | 670,249 | 1,493,774 | -823,525 |
| Switzerland | 253,524 | 447,314 | - 193,790 |
| Bahrein Islands | 1,758 | 1,278,930 | - 1,277,172 |
| Iran | 63 | 2,092,127 | - 2,092,064 |
| United States of America | 7,272,639 | 13,485,755 | -6,213,116 |
| Tuamotu Archipelago | 52,533 | 564,794 | - 512,261 |
| Other countries | 4,822,296 | 3,914,265 | + 908,031 |
| Totals, other countries | 29,592,643 | 26,513,306 | + 3,079,337 |
| Ships' stores | 598,139 | + 598,139 | |
| Totals, all countries | 147,822,862 | 128,200,692 | + 19,622,170 |
The visible balance of trade for 1948, an excess of exports amounting to £19,622,170, reflects the upward trend in export prices for New Zealand produce, the value of imports during the year varying little from the 1947 figure.
The substantial excess of exports shown in the trade accounts with France, Netherlands, and Russia, is due principally to sales of wool, negotiated by the Wool Disposal Commission, from accumulated stocks built up during the war years.
The trade deficit of £(m.) 14.8 with the United States of America in 1947 was reduced to £(m.) 6.2 in 1948. This was achieved by a drastic reduction of imports from £(m.)23.0 to £(m.)13.5. Exports at £(m.)7.3 fell only slightly from the previous year's figure of £(m.)8.2.
Trade with British Commonwealth countries in 1948 accounted for 80 per cent. of the total exports and 79 per cent. of the total imports. Approximately 78 per cent. of the exports were destined for sterling countries, while 73 per cent. of imports were shipped from sterling countries.
The following table shows for the years 1947 and 1948 the percentage of total exports to and imports from each of the principal countries trading with New Zealand. Ships' stores have been excluded from exports.
| Country. | Exports. | Imports. | ||
|---|---|---|---|---|
| 1947. | 1948. | 1947. | 1948. | |
| Per Cent. | Per Cent. | Per Cent. | Per Cent. | |
| United Kingdom | 76.65 | 73.30 | 42.76 | 52.33 |
| India and Pakistan | 0.38 | 0.54 | 3.66 | 2.78 |
| Ceylon | 0.05 | 0.03 | 1.51 | 1.81 |
| Canada | 2.38 | 2.03 | 9.02 | 5.38 |
| Australia | 3.18 | 2.69 | 11.61 | 11.07 |
| Fiji | 0.34 | 0.28 | 1.69 | 1.72 |
| Other British Commonwealth countries | 1.18 | 1.03 | 2.21 | 3.60 |
| Totals, British Commonwealth countries | 84.16 | 79.90 | 72.46 | 78.69 |
| Belgium | 1.55 | 1.02 | 1.90 | 1.20 |
| Prance | 3.45 | 5.64 | 0.67 | 0.73 |
| Netherlands | 1.33 | 1.94 | 0.48 | 0.28 |
| Sweden | 0.27 | 0.46 | 0.89 | 1.19 |
| Bahrein Islands | 0.85 | 1.00 | ||
| Iran | 1.46 | 1.64 | ||
| United States of America | 6.35 | 4.94 | 18.12 | 10.78 |
| Other countries | 2.89 | 6.10 | 3.17 | 4.49 |
| Totals, other countries | 15.84 | 20.10 | 27.54 | 21.31 |
Reserve Bank (pp. 511–513).—The weekly averages of liabilities and assets of the Reserve Bank of New Zealand during the calendar year 1948 are shown below, together with the position as at the end of June, 1949.
| — | Weekly Average, Calendar Year 1948. | As at the end of June, 1949. |
|---|---|---|
| Liabilities— | £ | £ |
| Total liabilities (including other) | 125,359,132 | 149,868,191 |
| Bank-notes | 48,930,097 | 50,309,938 |
| Demand liabilities— | ||
| State | 13,227,571 | 7,541,881 |
| Banks | 57,706,393 | 86,257,436 |
| Other | 380,499 | 605,741 |
| Assets— | ||
| Total assets (including other) | 125,359,132 | 149,868,191 |
| Investments | 10,496,117 | 48,094,301 |
| Sterling exchange reserve (in New Zealand currency) | 65,090,053 | 58,963,306 |
| Advances to State— | ||
| Marketing organizations | 1,698,055 | 3,875,191 |
| Other purposes | 37,619,252 | 29,522,285 |
| Net reserve ratio | 56.40 | 43.04 |
Trading Banks (pp. 514–519).—A statement of the principal statistics of the operation of trading banks during the calendar year 1948 (weekly average statistics), together with the position as at the end of June, and September, 1949, is given below.
| — | Weekly Average, Calendar Year 1948. | As at the end of June, 1949. | As at the end of September, 1949. |
|---|---|---|---|
| * During last week in month. | |||
| Bank debits— | £ | £ | £ |
| Government | 5,861,887 | 8,791,091* | 5,724,868* |
| Other | 43,061,590 | 49,802,330* | 50,329,887* |
| Bank clearings | 25,253,551 | 30,569,203* | 30,194,161* |
| Advances, including notes and hills discounted | 88,159,764 | 79,948,951 | 81,652,838 |
| Deposits— | |||
| Total | 175,668,670 | 191,020,580 | 186,432,799 |
| Government | 2,037,721 | 2,099,503 | 1,730,465 |
| Not bearing interest | 130,940,692 | 147,913,067 | 142,409,417 |
| Bearing interest | 42,690,257 | 41,008,010 | 42,292,917 |
| Coin held | 1,393,197 | 1,558,306 | 1,382,832 |
| Reserve Bank notes— | |||
| Notes held by trading banks | 8,133,753 | 8,045,914 | 8,198,070 |
| Net note circulation | 40,796,344 | 42,264,024 | 42,693,207 |
| Ratio of advances to deposits | 50.19 | 41.85 | 43.80 |
An analysis of advances of the trading banks at quarterly intervals is published by the Reserve Bank of New Zealand, and the classification as at the last Wednesday in March of 1948 and 1949, is contained in the following table. Figures for earlier years will be found on page 518.
| Advances to | As at last Wednesday in March, | |
|---|---|---|
| 1948. | 1949. | |
| £ | £ | |
| Farmers | 20,030,000 | 19,313,000 |
| Industries allied to primary production | 14,231,000 | 17,178,000 |
| Other manufacturing and productive industries | 14,183,000 | 15,037,000 |
| Merchants— | ||
| Wholesalers | 12,886,000 | 8,080,000 |
| Retailers | 9,505,000 | 7,659,000 |
| Transport | 1,753,000 | 1,893,000 |
| Other | 19,932,000 | 19,586,000 |
| Total advances | 92,520,000 | 88,745,000 |
Overseas Assets of Banks (p. 521).—In the following table the overseas assets of banks (on account of New Zealand business only) are shown.
| — | Overseas Assets at | ||
|---|---|---|---|
| End of March, 1949. | End of June, 1949. | End of September, 1949. | |
| Trading banks' overseas assets— | £ (N.Z.) | £ (N.Z.) | £ (N.Z.) |
| In London | 20,163,415 | 17,311,690 | 14,917,218 |
| Elsewhere | 3,091,947 | 4,660,937 | 6,080,099 |
| Reserve Bank's holdings of sterling exchange | 50,826,391 | 58,963,306 | 47,570,597 |
| Total gross overseas assets | 74,081,753 | 80,935,933 | 68,567,914 |
| Overseas liabilities of trading banks | 6,506,593 | 8,349,492 | 9,831,336 |
| Overseas liabilities of Reserve Bank | 129,110 | 40,697 | 12,069 |
| Net overseas assets | 67,446,050 | 72,545,744 | 58,724,509 |
Savings-banks (pp. 522–525).—A summary of statistics of savings-banks at 31st March, 1949, is given below.
| — | Post Office Savings-bank. | Trustee Savings-banks. | National Savings Accounts. |
|---|---|---|---|
| * War gratuities transferred to credit of depositors as from 1st April, 1949, and not included in the total given, amounted to £11,447,755. | |||
| Number of depositors | 1,311,292 | 350,353 | |
| £ | £ | £ | |
| Total amount of deposits during year | 70,690,640 | 15,994,130 | 7,032,119 |
| Total amount of withdrawals during year | 67,722,724 | 15,748,223 | 3,943,079 |
| Excess of deposits over withdrawals | 2,967,916 | 245,907 | 3,889,040 |
| Interest credited to depositors | 3,438,790 | 746,824 | 1,037,921 |
| Total amount to credit of depositors at end of March | 154,849,010* | 32,770,677 | 40,197,218 |
During the calendar year 1949, deposits with the Post Office Savings-bank totalled £75,654,367 and withdrawals £70,626,571, resulting in an excess of deposits of £5,027,796. Deposits with trustee savings-banks in the same period totalled £17,142,616 and withdrawals £15,843,374, the excess of deposits amounting to £1,299,242. Deposits in national savings accounts in 1949 amounted to £8,436,994 and withdrawals to £4,041,439, leaving an excess of deposits of £4,395,555.
Overseas Receipts and Payments (p. 207).—The following statement, in continuation of that published on page 207 of this Year-Book, gives statistics of exchange-control transactions for the calendar year 1948, and for the years ended 31st March and 30th September, 1949. This statement is compiled by the Reserve Bank.
| — | Year Ended 31st December, 1948. | Year Ended 31st March, 1949. | Year Ended 30th September, 1949. |
|---|---|---|---|
| Receipts— | £(000) | £(000) | £(000) |
| Exports | 145,270 | 143,896 | 138,684 |
| Interest, dividends, legacies, immigrants' funds, repatriated capital, and private debts due in New Zealand | 17,364 | 14,527 | 12,208 |
| Trade debts due in New Zealand, including overseas earnings of New Zealand firms | 8,423 | 8,187 | 5,823 |
| Commissions, royalties, and insurance | 931 | 828 | 869 |
| Donations and allowances | 1,069 | 1,080 | 1,139 |
| Travellers' expenses | 813 | 787 | 843 |
| Receipts by High Commissioner in London | 937 | 577 | 870 |
| Total receipts | 174,808 | 169,882 | 160,436 |
| Payments— | |||
| Imports, excluding payments in respect of Government imports | 108,189 | 105,329 | 104,287 |
| Interest, dividends, legacies, emigrants' funds, repatriated capital, and private debts due overseas | 12,254 | 13,290 | 13,792 |
| Trade debts due overseas, including earnings in New Zealand of overseas firms | 5,666 | 5,593 | 5,783 |
| Government debt and other services, including payments in respect of imports | 46,579 | 39,806 | 26,890 |
| Local-body-debt services | 1,655 | 1,816 | 1,183 |
| Commissions, royalties, and insurance | 1,383 | 1,441 | 2,051 |
| Donations and allowances | 1,275 | 1,225 | 1,242 |
| Film hire and entertainments | 569 | 627 | 686 |
| Travellers' expenses | 2,432 | 2,645 | 3,773 |
| Total payments | 180,000 | 171,773 | 159,688 |
Consolidated Fund (pp. 405–408).—The following table contains a summary of the receipts of the Ordinary Revenue Account of the Consolidated Fund for the financial years ended 31st March, 1948 and 1949.
| — | 1947–48. | 1948–49. |
|---|---|---|
| * Includes £20,000,000 stock issued on account of exchange adjustment as from 20th August, 1948. | ||
| £ | £ | |
| Taxation | 96,099,153 | 101,061,739 |
| Interest on capital liability— | ||
| Post and Telegraph | 746,316 | 659,045 |
| Other accounts | 2,017,934 | 2,784,808 |
| Interest on Public Debt Redemption Fund | 300,724 | |
| Interest on other public moneys | 1,937,753 | 1,771,936 |
| Profits on trading undertakings | 2,171,755 | 2,197,300 |
| Departmental receipts | 13,840,710 | 13,047,757 |
| Other receipts | 1,770 | 20,001,330* |
| Totals | 117,116,115 | 141,523,915*] |
The Ordinary Revenue Account of the Consolidated Fund covers the ordinary revenue and expenditure of the General Government—i.e., apart from capital items, commercial and special undertakings, advances, &c. Until comparatively recent years its operation afforded an excellent comparison of State revenue from year to year, hut successive changes in system have largely destroyed the comparability of the figures. This applies particularly to the last few years, in which certain amounts previously shown as credits in reduction of expenditure have been treated as receipts. This change in the mode of presentation of the public accounts was not brought into full operation until 1946–47, but the figures for 1945–46 and previous years shown in Section 24A have been adjusted to bring them into line with present practice.
The next table contains a summary of payments from the Consolidated Fund for the financial years 1947–48 and 1948–49.
| — | 1947–48. | 1948–49. |
|---|---|---|
| Permanent appropriations— | £ | £ |
| Civil list | 101,724 | 98,923 |
| Debt services | 26,612,339 | 26,029,077 |
| Transfer to War Expenses Account | 2,055,000 | 2,000,000 |
| Highways | 219,281 | 205,325 |
| Miscellaneous | 132,908 | 322,410 |
| Superannuation (subsidy and contribution) | 200,000 | 2,530,000 |
| Payment to Reserve Bank (liability alteration in exchange rate) for | 20,576,207 | |
| Totals, permanent appropriations | 29,321,252 | 51,761,942 |
| Annual appropriations— | ||
| Legislative | 152,506 | 177,522 |
| Prime Minister's Department | 156,966 | 221,449 |
| External Affairs | 673,909 | 621,151 |
| Finance | 16,038,232 | 13,403,003 |
| General Administration | 7,060,405 | 5,986,211 |
| Law and Order | 1,536,679 | 1,693,627 |
| Defence | 9,382,091 | 10,388,341 |
| Maintenance of Public Works and Services | 6,405,234 | 6,759,475 |
| Maintenance of Highways | 3,404,081 | 3,920,772 |
| Development of Primary and Secondary Industries | 5,596,580 | 6,235,335 |
| Social Services— | ||
| Health | 4,718,733 | 8,081,457 |
| Mental Hospitals | 1,243,332 | |
| Education | 8,883,246 | 9,588,988 |
| War and other Pensions | 4,688,312 | 4,926,081 |
| Payment to Social Security Fund | 16,000,000 | 15,000,000 |
| Other Services not provided for | 68,845 | 127,800 |
| Totals, annual appropriations | 86,009,151 | 87,131,212 |
| Grand totals | 115,330,403 | 138,893,154 |
Taxation credited up to the year 1945–46 to the War Expenses Account was in later years paid to the Consolidated Fund, and, per contra, certain expenditure previously charged to the War Expenses Account was met from the Consolidated Fund. Votes coming within this category are Stabilization (£11,687,137 in 1948–49 and £14,621,917 in 1947–48), included under the heading of Finance in the above table, and Defence (£10,385,341 in 1948–49, and £9,382,091 in 1947–48). Also, the amounts transferred to the Social Security Fund were £15,000,000 in 1948–49 and £16,000,000 in 1947–48, as compared with only £7,000,000 in 1945–46. Again, there were transfers to the War Expenses Account of £2,000,000 in 1948–49 and £2,055,000 in 1947–48 with no corresponding amount in 1945–46.
Taxation (pp. 414–430).—Particulars of revenue from taxation for the financial years 1946–47, 1947–48, and 1948–49, are contained in the following table.
| Item of Revenue. | 1946–47. | 1947–48. | 1948–49. |
|---|---|---|---|
| * Abolished from 1st April, 1947 and shown in former years under war taxation. | |||
| Consolidated Fund— | £ | £ | £ |
| Customs revenue | 15,718,983 | 24,390,881 | 19,111,486 |
| Beer duty | 4,251,509 | 4,404,051 | 4,555,374 |
| Sales-tax | 15,550,547 | 15,945,813 | 14,105,224 |
| Motor-vehicles taxation | 2,972,036 | 3,543,954 | 3,613,743 |
| Death duties | 5,951,676 | 5,666,172 | 6,032,390 |
| Land-tax | 939,559 | 854,456 | 916,120 |
| Income-tax | 32,085,057 | 36,632,581 | 49,007,672 |
| National security tax* | 9,404,221 | 772,029 | |
| Other | 3,841,805 | 3,889,216 | 3,719,730 |
| Totals | 90,715,393 | 96,099,153 | 101,061,739 |
| Social security taxation— | |||
| Social security charge | 22,383,884 | 26,176,634 | 29,378,385 |
| Registration fee, &c. | 19,769 | 124 | 125 |
| Totals | 22,403,653 | 26,176,758 | 29,378,510 |
| Grand totals | 113,119,046 | 122,275,911 | 130,440,249 |
Taxation receipts of the Consolidated Fund were augmented during 1946–47 and later years by the crediting to that Fund of receipts formerly included under the heading of war taxation and credited to the War Expenses Account.
A summary showing the amounts received from direct taxes on income and from all sources during the last ten years is now given.
| Year. | Direct Taxes on Income (including War and Social Security Charges on Income). | Total Taxation. | |||||||
|---|---|---|---|---|---|---|---|---|---|
| Amount. | Per Head of Mean Population. | Percentage of Total Taxation. | Amount. | Per Head of Mean Population. | |||||
| £ | £ | s. | d. | £ | £ | s. | d. | ||
| 1939–40 | 20,432,167 | 12 | 10 | 2 | 45.9 | 44,522,028 | 27 | 5 | 2 |
| 1940–41 | 34,563,737 | 21 | 2 | 7 | 56.3 | 61,360,840 | 37 | 10 | 3 |
| 1941–42 | 39,845,130 | 24 | 8 | 9 | 58.5 | 68,163,256 | 41 | 16 | 2 |
| 1942–13 | 53,977,441 | 32 | 18 | 2 | 61.4 | 87,940,844 | 53 | 12 | 4 |
| 1943–44 | 63,311,965 | 38 | 13 | 3 | 62.8 | 100,839,484 | 61 | 11 | 7 |
| 1944–45 | 68,438,477 | 41 | 2 | 3 | 63.0 | 108,681,814 | 65 | 5 | 10 |
| 1945–46 | 71,582,870 | 41 | 16 | 9 | 62.3 | 114,954,873 | 67 | 3 | 9 |
| 1946–47 | 63,873,162 | 36 | 0 | 7 | 56.5 | 113,119,046 | 63 | 16 | 2 |
| 1947–48 | 63,581,244 | 35 | 1 | 7 | 52.0 | 122,275,911 | 67 | 9 | 2 |
| 1948–49 | 78,386,057 | 42 | 6 | 10 | 60.1 | 130,440,249 | 70 | 9 | 3 |
Stale Indebtedness (pp. 430–444).—The public debt as at 31st March, 1949, amounted to £614,985,632, an increase of £16,110,202, as compared with a year earlier. New issues during the year amounted to £52,250,860, made up of £1,330 for purchase of Bank of New Zealand shares, £28,284,425 for the National Development Loans Account, renewal of loans falling due £964,850, exchange adjustment £20,000,000, repayments in London £3,000,000, and miscellaneous £255. Redemptions during the year from the Loans Redemption Account amounted to £12,192,993.
The following table shows for each of the ten years ended 31st March, 1949, the amount of debt outstanding according to country of domicile. The amounts shown are exclusive of £(N.Z.)26,191,109 debt due to the Imperial Government, on which interest payments have been suspended by agreement since 1931.
| As at 31st March, | Amount domiciled in | Total Debt. | |||||
|---|---|---|---|---|---|---|---|
| London. | Australia. | New Zealand. | Amount. | Per Head of Population. | |||
| £(N.Z.) | £(N.Z.) | £(N.Z.) | £ (N.Z.) | £ | s. | d. | |
| 1940 | 164,590,202 | 879,600 | 164,164,666 | 329,634,468 | 200 | 17 | 9 |
| 1941 | 165,225,600 | 879,600 | 190,176,386 | 356,281,586 | 217 | 14 | 11 |
| 1942 | 159,455,568 | 862,300 | 230,779,870 | 391,097,738 | 239 | 6 | 0 |
| 1943 | 165,103,987 | 862,300 | 304,088,774 | 470,655,061 | 288 | 0 | 5 |
| 1944 | 166,145,898 | 862,300 | 366,746,933 | 533,755,131 | 324 | 13 | 9 |
| 1945 | 166.364,093 | 861,300 | 403,274,133 | 570,499,526 | 339 | 11 | 9 |
| 1946 | 118,161,468 | 861,300 | 472,749,936 | 591,772,704 | 336 | 12 | 4 |
| 1947 | 118,161,468 | 861,300 | 482,990,107 | 602,012,875 | 335 | 14 | 4 |
| 1948 | 103,984,458 | 779,000 | 494,111,972 | 598,875,430 | 326 | 9 | 10 |
| 1949 | 79,962,101 | 628,226 | 534,395,305 | 614,985,632 | 328 | 5 | 10 |
The annual interest charge on the public debt as at 31st March, 1949, was £16,716,404, and the average rate of interest was £2 14s. 4d. per cent.
Information concerning the various benefits under the Social Security Act, 1938, is contained in Section 25 of this Year-Book. The increases granted during 1949 and effective from the 1st June of that year have been incorporated in the text.
A summary showing particulars of the various social security benefits and war pensions in force at the end of March, 1949, together with total payments during the financial year 1948–49 is as follows:—
| Class of Benefit or Pension. | As at 31st March, 1949. | Payments during Year Ended 31st March, 1949. | |
|---|---|---|---|
| Number in Force. | Annual Value. | ||
| * Exclusive of £63,429 recoveries under maintenance orders, widows' benefits. | |||
| Social security benefits— | £ | £ | |
| Universal superannuation | 65,839 | 1,975,170 | 1,850,079 |
| Age | 116,254 | 14,008,607 | 13,790,971 |
| Widows' | 14,883 | 2,001,764 | 1,847,705* |
| Orphans' | 371 | 27,083 | 27,623 |
| Family | 248,726 | 14,065,455 | 14,242,202 |
| Invalids' | 10,051 | 1,324,722 | 1,348,616 |
| Miners' | 660 | 108,900 | 113,659 |
| Maori War | 10 | ||
| Sickness | 4,426 | 911,107 | |
| Unemployment | 30 | 8,948 | |
| Emergency | 2,031 | 251,409 | |
| Totals | 463,271 | 33,511,701 | 34,392,329 |
| War pensions— | |||
| 1914–18 War | 19,320 | 2,042,323 | 2,104,627 |
| 1939–45 War | 27,187 | 2,253,421 | 1,906,232 |
| War veteran's allowance | 3,367 | 613,458 | 562,634 |
| South African War | 41 | 3,768 | 3,892 |
| Mercantile-marine pensions | 23 | 2,184 | 2,700 |
| Emergency Reserve Corps | 10 | 1,463 | 1,447 |
| Totals | 49,948 | 4,916,617 | 4,581,532 |
| Sundry pensions and annuities | 159 | 26,300 | 27,301 |
| Grand totals | 513,378 | 38,454,618 | 39,001,162 |
Payments from the Social Security Fund on account of medical benefits, &c., for the year ending 31st March, 1949 are as follows:—
| Benefits. | Payments during 1948–19. |
|---|---|
| £ | |
| Medical | 2,306,881 |
| Hospital | 1,997,375 |
| Maternity | 916,120 |
| Pharmaceutical | 1,793,159 |
| Supplementary | 861,913 |
| Total | 7,875,448 |
Retail Prices (pp. 620–623).—The consumers' price index, base: 1st quarter, 1949 (= 1000) was 1002 in quarter ended June, 1949, 1014 in quarter ended September, 1949, and 1018 in quarter ended December, 1949. A description of this index number, together with figures for previous periods, is given in Appendix (e) of this Year-Book. Details for the quarter ended 30th September, 1949, are given below together with the indices for the June, 1949 quarter.
CONSUMERS' PRICE INDEX.—QUARTERLY INDEX NUMBERS (ALL GROUPS), TWENTY-ONE TOWNS COMBINED
Base: Weighted average twenty-one towns, first quarter, 1949 (= 1000)
| — | Food. | Housing. | Fuel and Lighting. | |||||
|---|---|---|---|---|---|---|---|---|
| Meat and Fish. | Fruits, Vegetables, and Eggs. | Other Foods. | All Food. | Rent. | Other Housing. | All Housing. | ||
| Quarter ended— | ||||||||
| 1949—March 31st | 1000 | 1000 | 1000 | 1000 | 1000 | 1000 | 1000 | 1000 |
| June 30th | 1006 | 978 | 1020 | 1007 | 1000 | 1000 | 1000 | 1001 |
| September 30th | 1101 | 992 | 1027 | 1037 | 999 | 1000 | 1000 | 1028 |
| December 31st | 1116 | 1061 | 1011 | 1047 | 999 | 1000 | 1000 | 1039 |
| — | Clothing and Footwear. | Miscellaneous. | All Groups. | |||||
|---|---|---|---|---|---|---|---|---|
| Clothing. | Footwear. | Clothing and Footwear. | Household Durable Goods. | Other Commodities. | Services. | All Miscellaneous. | ||
| Quarter ended— | ||||||||
| 1949—March 31st | 1000 | 1000 | 1000 | 1000 | 1000 | 1000 | 1000 | 1000 |
| June 30th | 1000 | 1003 | 1001 | 998 | 998 | 1000 | 999 | 1002 |
| September 30th | 1005 | 1018 | 1007 | 995 | 997 | 1001 | 998 | 1014 |
| December 31st | 996 | 1022 | 1000 | 993 | 996 | 1015 | 1002 | 1018 |
CONSUMERS' PRICE INDEX.—QUARTERLY INDEX NUMBERS FOR INDIVIDUAL TOWNS AND GROUPINGS
Base: Weighted average twenty-one towns, first quarter, 1949 (= 1000)
| — | Quarter Ended 30th June, 1949. | Quarter Ended 30th September, 1949. | ||||||||||
|---|---|---|---|---|---|---|---|---|---|---|---|---|
| Food. | Housing. | Fuel and Lighting. | Clothing and Footwear. | Miscellaneous. | All Groups. | Food. | Housing. | Fuel and Lighting. | Clothing and Footwear. | Miscellaneous. | All Groups. | |
| * In calculating these all-groups index numbers, the missing aggregates for the Clothing and Footwear and Miscellaneous groups were supplied from the first ten towns. | ||||||||||||
| Auckland | 992 | 1036 | 1005 | 1025 | 983 | 1004 | 1026 | 1027 | 1050 | 1020 | 986 | 1017 |
| Wellington | 997 | 1027 | 920 | 1001 | 1010 | 1003 | 1032 | 1031 | 939 | 1005 | 1008 | 1017 |
| Christchurch | 1016 | 1009 | 968 | 948 | 1008 | 997 | 1053 | 1013 | 992 | 957 | 1007 | 1013 |
| Dunedin | 1000 | 991 | 789 | 988 | 994 | 986 | 1027 | 996 | 825 | 1002 | 991 | 1000 |
| Four chief centres | 999 | 1023 | 950 | 999 | 997 | 1001 | 1033 | 1022 | 982 | 1004 | 997 | 1014 |
| Hamilton | 1034 | 955 | 1031 | 986 | 992 | 1000 | 1058 | 956 | 1047 | 1009 | 988 | 1013 |
| Napier | 1020 | 938 | 1123 | 1020 | 1009 | 1007 | 1039 | 941 | 1148 | 1023 | 1008 | 1016 |
| New Plymouth | 1034 | 953 | 1092 | 1013 | 988 | 1007 | 1045 | 951 | 1110 | 1023 | 988 | 1013 |
| Palmerston North | 1036 | 964 | 1020 | 1037 | 1010 | 1018 | 1055 | 981 | 1039 | 1047 | 1014 | 1030 |
| Nelson | 1051 | 1000 | 1125 | 1004 | 1014 | 1026 | 1056 | 1004 | 1159 | 1005 | 1013 | 1030 |
| Invercargill | 1029 | 905 | 1040 | 993 | 1005 | 1005 | 1050 | 902 | 1045 | 990 | 1003 | 1011 |
| Six provincial towns | 1032 | 958 | 1067 | 1011 | 1004 | 1010 | 1050 | 962 | 1086 | 1018 | 1002 | 1018 |
| Whangarei | 1013 | 930 | 1250 | 1003* | 1058 | 933 | 1252 | 1020* | ||||
| Tauranga | 1042 | 974 | 1004 | 1005* | 1073 | 984 | 1031 | 1022* | ||||
| Rotorua | 1021 | 972 | 1099 | 1002* | 1063 | 962 | 1218 | 1022* | ||||
| Gisborne | 999 | 943 | 1343 | 1006* | 1027 | 940 | 1369 | 1016* | ||||
| Wanganui | 1006 | 946 | 1140 | 1010* | 1030 | 944 | 1144 | 1019* | ||||
| Masterton | 1029 | 950 | 1202 | 1012* | 1050 | 954 | 1221 | 1021* | ||||
| Blenheim | 1031 | 971 | 1266 | 1020* | 1041 | 977 | 1280 | 1025* | ||||
| Greymouth | 1014 | 932 | 1051 | 990* | 1013 | 923 | 1068 | 990* | ||||
| Ashburton | 1015 | 910 | 1389 | 997* | 1039 | 901 | 1411 | 1005* | ||||
| Timaru | 1004 | 970 | 984 | 988* | 1018 | 976 | 1004 | 990* | ||||
| Oamaru | 999 | 929 | 1040 | 985* | 1036 | 926 | 1157 | 1004* | ||||
| Eleven other towns | 1014 | 949 | 1141 | 1001* | 1037 | 948 | 1169 | 1012* | ||||
Wholesale Prices (pp. 623–625).—Index numbers of wholesale prices for the year 1948 and for November, 1949, are shown below:—
WHOLESALE PRICES.—INDEX NUMBERS BY GROUPS.—BASE: 1926–30 (= 1000)
| Group. | 1948. | November, 1949. |
|---|---|---|
| 1. Foodstuffs, &c., of vegetable origin— | ||
| A. Agricultural produce | 1735 | 2025 |
| B. Fresh fruit and vegetables | 1646 | |
| C. Milled agricultural products | 869 | 900 |
| D. Other foods and groceries of vegetable origin | 2142 | 2064 |
| A–D. Four sub-groups combined | 1789 | 1813 |
| 2. Textile manufactures | 2024 | 2004 |
| 3. Wood and wood products | 1772 | 1865 |
| 4. Animal products— | ||
| A. Meats | 1691 | 1667 |
| B. Semi-manufactured animal products (not foods) | 878 | 1100 |
| C. Leather | 1732 | 1790 |
| D. Other foods and groceries of animal origin | 1216 | 1198 |
| A–D. Four sub-groups combined | 1468 | 1465 |
| 5. Metals and their products | 2401 | 2399 |
| 6. Non-metallic minerals and their products— | ||
| A. Mineral oils | 1691 | 1656 |
| B. Coal | 1338 | 1470 |
| C. Other non-metallic minerals and their products | 1525 | 1678 |
| A–C. Three sub-groups combined | 1522 | 1584 |
| 7. Chemicals and manures | 1821 | 1502 |
| All groups combined | 1837 | 1840 |
WHOLESALE PRICES.—INDEX NUMBERS BY CLASSES.—BASE: 1926–30 (= 1000)
| — | 1948. | November, 1949. |
|---|---|---|
| Consumers' goods— | ||
| Class I: Foodstuffs | 1651 | 1625 |
| Class II: Non-foods | 1952 | 1949 |
| Producers' materials. &c.— | ||
| Class III: Materials for building and construction | 1968 | 2036 |
| Class IV : Materials for other industries | 1870 | 1867 |
| Classes I and II combined | 1773 | 1760 |
| Classes III and IV combined | 1892 | 1905 |
| Locally produced commodities | 1501 | 1549 |
| Imported commodities | 2089 | 2053 |
| All classes combined | 1837 | 1840 |
Share Prices (pp. 629–633).—Index numbers of share prices in 1948 together with the average for the ten months ending October, 1949, are given below.
| Group. | Index Numbers Base Average for each Group, 1938 (= 1000). | |
|---|---|---|
| Average for 1948. | Average for 10 Months Ended October, 1949. | |
| Frozen meat | 2092 | 2002 |
| Woollens | 1955 | 1889 |
| Gas | 875 | 865 |
| Timber | 1542 | 1464 |
| Minerals | 1321 | 1318 |
| Miscellaneous (including breweries) | 1404 | 1305 |
| All industrial groups | 1430 | 1362 |
| Banks | 1171 | 1078 |
| Insurance | 1770 | 1726 |
| Loan-agency companies | 1715 | 1705 |
| Miscellaneous | 1893 | 1870 |
| All finance, &c., groups | 1609 | 1558 |
| All groups combined | 1520 | 1460 |
Monthly statistics for 1948 and 1949 are given below:—
SHARE PRICES MONTHLY INDEX NUMBERS, YEAR 1938 (= 1000)
| — | 1948. | 1919. | ||||
|---|---|---|---|---|---|---|
| Industrial Groups. | Finance Groups. | All Groups. | Industrial Groups. | Finance Groups. | All Groups. | |
| * Month of December interpolated. | ||||||
| January | 1496 | 1653 | 1575 | 1395 | 1580 | 1487 |
| February | 1465 | 1624 | 1545 | 1377 | 1562 | 1470 |
| March | 1424 | 1578 | 1501 | 1363 | 1535 | 1449 |
| April | 1414 | 1615 | 1515 | 1355 | 1529 | 1442 |
| May | 1429 | 1654 | 1541 | 1358 | 1575 | 1466 |
| June | 1439 | 1658 | 1548 | 1342 | 1548 | 1445 |
| July | 1437 | 1645 | 1541 | 1346 | 1548 | 1447 |
| August | 1416 | 1569 | 1492 | 1351 | 1566 | 1459 |
| September | 1415 | 1570 | 1493 | 1364 | 1567 | 1466 |
| October | 1416 | 1575 | 1495 | 1372 | 1574 | 1473 |
| November | 1411 | 1588 | 1499 | |||
| December | 1403* | 1584* | 1494* | |||
Employment (p. 712).—Statistics of numbers of notified vacancies, placements, and disengaged persons as reported by the National Employment Service are given below.
| — | Average for Year | October, 1949. | |
|---|---|---|---|
| 1947. | 1948. | ||
| Vacancies at end of month— | |||
| Males | 12,225 | 12,162 | 11,322 |
| Females | 12,171 | 11,325 | 9,579 |
| Totals | 24,396 | 23,487 | 20,901 |
| Placements during month— | |||
| Males | 1,465 | 1,243 | 1,300 |
| Females | 386 | 390 | 358 |
| Totals | 1,851 | 1,633 | 1,658 |
| Disengaged persons at end of month— | |||
| Males | 83 | 61 | 73 |
| Females | 9 | 6 | 8 |
| Totals | 92 | 67 | 81 |
Statistics of employment in industry are now compiled by the Department of Labour and Employment. In the following table the distribution of employees in the main industrial groups in April, 1949, is shown. The figures cover units in which at least two persons (including working proprietors) are engaged.
| Industry. | Number of Establishments. | Employment in April, 1949. (Excluding Working Proprietors.) | Number of Working Proprietors (Both Sexes). | ||
|---|---|---|---|---|---|
| Males. | Females. | Total. | |||
| Primary industry | 737 | 16,058 | 248 | 16,306 | 681 |
| Food, drink, and tobacco | 1,541 | 9,027 | 4,796 | 13,823 | 1,632 |
| Textiles, clothing, and leather | 1,997 | 12,696 | 21,408 | 34,104 | 1,585 |
| Building-materials and furnishings | 1,743 | 17,156 | 1,024 | 18,180 | 1,310 |
| Engineering and metalworking | 3,986 | 41,660 | 3,846 | 45,506 | 3,482 |
| Miscellaneous manufacturing | 1,176 | 14,572 | 5,691 | 20,263 | 763 |
| Building and construction | 3,422 | 33,848 | 818 | 34,666 | 3,712 |
| Transport and communication | 2,138 | 48,161 | 6,433 | 54,594 | 1,575 |
| Domestic and personal services | 3,819 | 9,867 | 13,296 | 23,163 | 3,946 |
| Administration and professional | 3,068 | 37,892 | 32,805 | 70,697 | 571 |
| Power and water supply | 223 | 8,194 | 587 | 8,781 | 6 |
| Distribution and finance | 11,880 | 55,609 | 30,667 | 86,276 | 8,408 |
| Seasonal industries | 677 | 20,819 | 1,341 | 22,160 | 119 |
| Totals | 36,407 | 325,559 | 122,960 | 448,519 | 27,790 |
The following notes on the composition of various groups are necessary towards an understanding of the coverage of the figures. The figures quoted for “Primary industry” exclude farming, fishing, hunting, and trapping. In this connection it is of interest to record that the number of persons engaged on farms, including occupiers, on 31st January, 1949, was: males, 109,246; females, 12,140; total, 121,386. The figures given above for the “Food, drink, and tobacco” group exclude meat-processing, fruit and vegetable preserving, and dairy factories, which, with threshing, chaffcutting, and wool-stores, are included under the group “Seasonal industries.” Loading and unloading of ships are excluded from the group “Transport and communication.”
Wage-rates (pp. 634–645).—Index numbers of nominal wage-rates of adult male wage-earners in 1948 and at 30th September, 1949:—
| Industrial Group. | Average for Year 1948. | As at 30th September, 1949. | ||
|---|---|---|---|---|
| Base: All Groups 1926–30 (= 1000). | Base: Each Group 1926–30 (= 1000). | Base: All Groups 1926–30 (= 1000). | Base: Each Group 1926–30 (= 1000). | |
| Provision of— | ||||
| Food, drink, &c. | 1678 | 1516 | 1845 | 1668 |
| Clothing, footwear, and textiles | 1601 | 1570 | 1753 | 1719 |
| Building and construction | 1553 | 1513 | 1684 | 1641 |
| Power, heat, and light | 1616 | 1476 | 1744 | 1592 |
| Transport by water | 1797 | 1624 | 1939 | 1752 |
| Transport by land | 1579 | 1504 | 1715 | 1634 |
| Accommodation, meals, and personal service | 1475 | 1518 | 1574 | 1620 |
| Working in or on— | ||||
| Wood, wicker, sea-grass, and fibre | 1632 | 1515 | 1762 | 1635 |
| Metal | 1651 | 1490 | 1801 | 1625 |
| Stone, clay, glass, and chemicals | 1515 | 1480 | 1649 | 1611 |
| Paper, printing, &c. | 1671 | 1404 | 1822 | 1530 |
| Skins, leather, &c. | 1499 | 1434 | 1635 | 1564 |
| Mines and quarries | 1647 | 1580 | 1781 | 1709 |
| The land (farming pursuits) | 1470 | 1912 | 1603 | 2085 |
| All Groups combined | 1588 | 1588 | 1724 | 1724 |
Effective Weekly Wage-rates.—The index numbers quoted in Section 38 of this volume relate to nominal wage-rates—that is, they are based on actual or equivalent money rates without any allowance being made for changes in prices during the period under review. It is obvious that this factor is of considerable importance, for a rise in wage-rates may be offset by a fall in the purchasing-power of the monetary unit, while, on the other hand, a fall in money wages may be offset by a rise in the purchasing-power of money. Changes in the index numbers of retail prices are inversely proportional to changes in the purchasing-power of the pound, and index numbers of effective (or “real”) wage-rates can be arrived at by dividing the index numbers for nominal wage-rates by the corresponding index numbers for retail prices covering all groups of domestic expenditure.
The following table compares nominal and effective weekly wage-rates of adult male and female workers in each of the years 1939–49. The year 1949 is incomplete, but the first three quarters are shown. The base of the index numbers is in each case the average of the five years 1926–30 (= 1000).
| Year. | Retail Prices (All Groups). | Nominal Weekly Wage-rates. | Effective Weekly Wage-rates. | ||
|---|---|---|---|---|---|
| Males. | Females. | Males. | Females. | ||
| * Not available. | |||||
| 1939 | 990 | 1100 | 1103 | 1111 | 1114 |
| 1940 | 1035 | 1130 | 1137 | 1092 | 1099 |
| 1941 | 1073 | 1170 | 1174 | 1090 | 1094 |
| 1942 | 1109 | 1222 | 1234 | 1102 | 1113 |
| 1943 | 1134 | 1261 | 1292 | 1112 | 1139 |
| 1944 | 1155 | 1274 | 1297 | 1103 | 1123 |
| 1945 | 1170 | 1381 | 1459 | 1180 | 1247 |
| 1946 | 1180 | 1434 | 1533 | 1215 | 1299 |
| 1947 | 1217 | 1489 | 1614 | 1224 | 1326 |
| 1948 | 1314 | 1588 | 1764 | 1209 | 1342 |
| 1949— | |||||
| 1st quarter | 1324 | 1616 | * | 1221 | * |
| 2nd quarter | 1327 | 1692 | * | 1275 | * |
| 3rd quarter | 1343 | 1724 | * | 1284 | * |
In considering these figures it should not be overlooked that the index number of effective wage-rates (in common, of course, with that of nominal wage-rates) applies only to full-time employment at award rates of pay. The index does not take into account overtime, short time, unemployment, alterations in the standard hours constituting a week's work, or wages-tax. Particulars of the taxes imposed on wages are given on page 636.
Industrial Disputes.—Statistics of industrial disputes in 1948 and for the nine months ended September, 1949, are given below. Figures for earlier years are shown on pages 719–726 of this Year-Book.
| Disputes. | Calendar Year 1948. | Nine Months Ended 30th Sept., 1949. |
|---|---|---|
| Total disputes | 101 | 106 |
| Direct strike | 90 | 99 |
| Sympathetic strike | 3 | 3 |
| Partial strike | 8 | 4 |
| Lockout | ||
| Number of firms affected | 885 | 1,228 |
| Number of workers involved | 28,494 | 51,341 |
| Total duration (clays) | 608¼ | 618½ |
| Average duration (days) | 6.02 | 5.83 |
| Working days lost | 93,464 | 205,683 |
| Approximate loss in wages | £195,985 | £364,787 |
Industrial Accidents.—Statistics of industrial accidents in 1947 are given in the following tables. Figures for earlier years are shown on pages 727–737 of this Year-Book.
| Year. | Total Accidents. | Accidents Per 100,000 Man-hours Worked. | Accidents Where Particulars of Compensation Available.‡ | Total Compensation or Damages Paid in Such Cases.‡ | Compensation Per Case Where Known.‡ |
|---|---|---|---|---|---|
* Excluding scaffolding, mining, and bush working accidents. † Excluding scaffolding and mining accidents. ‡ Excluding mining accidents. | |||||
| £ | £ | ||||
| 1946 | 15,123 | 3.016* | 11,289 | 258,621 | 22.9 |
| 1947 | 14,783 | 3.029† | 11,911 | 311,511 | 26.2 |
The distribution of industrial accidents in 1947 according to the source of information (accidents to Printing and Stationery Department employees being included in the Factory group) is indicated in the following table.
| Class. | Total Accidents. | Accidents Per 100,000 Man-hours Worked. | Accidents Where Particulars of Compensation Available. | Total Compensation or Damages Paid in Such Cases. | Compensation Per Case Where Known. |
|---|---|---|---|---|---|
* No information available. † Excluding scaffolding and mining accidents. ‡ Excluding mining accidents. | |||||
| £ | £ | ||||
| Factory | 6,928 | 2.351 | 6,919 | 182,199 | 26.3 |
| Public works | 917 | 5.071 | 913 | 19,958 | 21.9 |
| State Forest | 346 | 10.039 | 346 | 4,662 | 13.5 |
| Bush workers | 471 | 14.340 | 471 | 22,459 | 47.7 |
| Scaffolding | 91 | * | 91 | 12,696 | 139.5 |
| Railways | 2,743 | 5.713 | 2,736 | 56,979 | 20.8 |
| Post and Telegraph | 436 | 1.864 | 435 | 12,558 | 28.9 |
| Mining | 2,851 | * | * | * | * |
| All classes | 14,783 | 3.029† | 11,911‡ | 311,511‡ | 26.2‡ |
The next table gives accident severity statistics for the calendar years 1946 and 1947.
| — | 1946. | 1947. |
|---|---|---|
*Excluding mining accidents. † Excluding bush working, scaffolding, and mining accidents. ‡ Excluding scaffolding and mining accidents. | ||
| Total cases resulting in— | ||
| Temporary disability | 14,804 | 14,446 |
| Permanent disability | 283 | 291 |
| Fatality | 36 | 46 |
| Totals | 15,123 | 14,783 |
| Calendar days lost per accident* | 84 | 88 |
| Hours lost per 100,000 man-hours worked (i.e., severity-rate) | 1,388† | 1,484‡ |
Shipping and Cargo Handled (pp. 262–275).—Statistics of entrances and clearances of vessels in the foreign and coastal trade in 1947 and 1948 are shown in the following table.
| — | Calendar Year. | |
|---|---|---|
| 1947. | 1948. | |
| Entrances— | ||
| Overseas— | ||
| Number of vessels | 1,144 | 1,173 |
| Net tonnage | 4,966,000 | 4,858,000 |
| Coastal— | ||
| Number of vessels | 12,808 | 13,333 |
| Net tonnage | 4,529,000 | 4,579,000 |
| Clearances— | ||
| Overseas— | ||
| Number of vessels | 1,145 | 1,159 |
| Net tonnage | 5,014,000 | 4,815,000 |
| Coastal— | ||
| Number of vessels | 12,708 | 13,322 |
| Net tonnage | 4,447,000 | 4,638,000 |
| Tonnage of cargo handled— | ||
| Inwards | 4,906,000 | 4,992,000 |
| Outwards | 3,042,000 | 3,102,000 |
| Transhipped | 232,000 | 264,000 |
| Total manifest tonnage | 8,412,000 | 8,622,000 |
Statistics of shipping movement and cargo handled at New Zealand ports in 1947 and 1948 are given below.
| — | Total Shipping Movement. | Total Cargo handled. | ||
|---|---|---|---|---|
| 1947: Net Tonnage. | 1948: Net Tonnage. | 1947: Tons. | 1948: Tons. | |
| (000) | (000) | (000) | (000) | |
| Auckland | 3,671 | 3,456 | 2,596 | 2,569 |
| Wellington | 5,942 | 6,152 | 2,194 | 2,309 |
| Lyttelton | 3,735 | 3,682 | 855 | 859 |
| Dunedin | 1,320 | 1,349 | 488 | 508 |
| Other ports | 4,288 | 4,246 | 2,279 | 2,377 |
| Totals | 18,956 | 18,885 | 8,412 | 8,622 |
In the following table the country of registry of inwards overseas shipping in 1948 is shown.
| Country of Registry. | Calendar Year 1948. | |
|---|---|---|
| Number of Vessels. | Net Tonnage. | |
| British Commonwealth countries— | ||
| United Kingdom | 251 | 1,313,917 |
| New Zealand | 99 | 141,188 |
| Other British Commonwealth countries | 40 | 130,478 |
| Totals, British Commonwealth countries | 390 | 1,585,583 |
| Other countries— | ||
| Sweden | 8 | 22,035 |
| Netherlands | 3 | 15,622 |
| Panama | 9 | 56,433 |
| United States of America | 13 | 79,124 |
| Other countries | 23 | 99,028 |
| Totals, other countries | 56 | 272,242 |
| Grand totals, all countries | 446 | 1,857,825 |
Of the total net tonnage of inwards overseas vessels in 1948 (1,857,825 tons), ships on the United Kingdom registry accounted for 1,313,917 tons—70.7 per cent. of the total—while the distribution between British Commonwealth and other countries was: British Commonwealth, 85.3 per cent.; other, 14.7 per cent.
Railway Transport (pp. 276–284).—Summarized statistics of railway transport in the years ended 31st March, 1947, 1948, and 1949 follow.
| — | Unit. | Year ended 31st March, | ||
|---|---|---|---|---|
| 1947. | 1948. | 1949. | ||
| * Including road motor and other subsidiary services. | ||||
| Passenger journeys— | ||||
| Railways | (000) | 28,869 | 25,887 | 26,168 |
| Railway road motor services | (000) | 20,364 | 21,537 | 23,532 |
| Tonnage of goods carried— | ||||
| Timber | Tons (000) | 588 | 678 | 748 |
| Live-stock | Tons (000) | 781 | 758 | 725 |
| Other goods | Tons (000) | 7,960 | 8,088 | 8,193 |
| Totals | Tons (000) | 9,329 | 9,524 | 9,666 |
| Net ton miles run | Millions | 883.7 | 937.4 | 970.8 |
| Revenue— | ||||
| Railway operation | £(000) | 12,824 | 13,964 | 15,339 |
| Total* | £(000) | 15,680 | 17,071 | 18,598 |
| Expenditure— | ||||
| Railway operation | £(000) | 13,645 | 15,090 | 16,788 |
| Total* | £(000) | 15,944 | 17,711 | 19,701 |
Road Transport (pp. 292–303).—Statistics of motor-vehicles licensed at 31st March, 1948 and 1949, and as at 30th September, 1949, are as follows:—
| — | As at 31st March, | As at 30th September, 1949. | |
|---|---|---|---|
| 1948. | 1949. | ||
| Cars | 221,828 | 230,664 | 229,558 |
| Trucks— | |||
| Light | 36,591 | 40,536 | 40,109 |
| Heavy | 28,839 | 31,823 | 31,741 |
| Passenger | 2,100 | 2,182 | 2,078 |
| Omnibuses | 1,267 | 1,397 | 1,425 |
| Government and local-authority vehicles | 26,004 | 31,071 | 33,526 |
| Trailers | 25,254 | 29,293 | 22,671 |
| Motor-cycles | 19,066 | 19,989 | 17,073 |
| Totals | 360,949 | 386,955 | 378,181 |
Civil Aviation (pp. 304–313).—The principal statistics of civil aviation in the calendar year 1948, and in the year ended 31st March, 1949, are given below.
| — | Year ended 31st March, 1949. | Calendar Year 1948. |
|---|---|---|
| Internal services— | ||
| Miles flown (all services) | 4,411,431 | 4,156,442 |
| Passengers carried (all services) | 182,737 | 171,408 |
| Passenger-miles (scheduled services only) | 44,323,199 | 41,506,706 |
| Freight ton-miles (all services) | 843,528 | 802,827 |
| Mail ton-miles (scheduled services only) | 108,579 | 106,713 |
| Overseas services— | ||
| Miles flown | 3,145,617 | 2,920,807 |
| Passengers carried | 31,823 | 30,736 |
| Freight carried lb. | 536,656 | 512,776 |
| Mails carried lb. | 388,855 | 384,364 |
The number of ex-servicemen and ex-servicewomen demobilized from the Forces, as recorded by the Rehabilitation Department, up to the end of March, 1949, was 209,161, of whom 143,696 had returned from overseas service and 65,466 had served with the home Forces.
The following tables give.- particulars of rehabilitation-loan authorizations for the years ended 31st March, 1948 and 1949, and the totals to 31st March, 1949.
| Class of Loan. | Number. | Amount. | ||||
|---|---|---|---|---|---|---|
| 1947–48. | 1948–49. | Total to 31st March, 1949. | 1947–48. | 1948–49. | Total to 31st March, 1949. | |
| £ | £ | £ | ||||
| Purchase of farm, &c. | 1,107 | 963 | 5,679 | 5,197,269 | 4,372,205 | 23,609,694 |
| Housing— | ||||||
| Erection | 2,629 | 2,355 | 10,676 | 3,818,404 | 3,422,418 | 15,289,943 |
| Purchase | 2,906 | 2,710 | 14,583 | 2,886,656 | 2,638,111 | 14,523,191 |
| Tools of trade | 187 | 134 | 1,322 | 5,401 | 4,848 | 43,654 |
| Furniture | 7,954 | 8,039 | 36,468 | 729,058 | 746,101 | 3,359,461 |
| Business | 1,344 | 1,373 | 7,313 | 996,878 | 933,151 | 4,583,870 |
| Miscellaneous | 56 | 45 | 357 | 15,647 | 7,848 | 75,828 |
| Totals | 16,183 | 15,619 | 76,398 | 13,649,313 | 12,124,682 | 61,485,641 |
Included in the foregoing figures are 14,072 supplementary housing loans for £2,120,558. These loans, which are not repayable so long as the ex-serviceman or his dependants continue in occupation of the property, are granted to bridge the gap between present-day costs and normal values, and each case is considered on its merits.
In addition to loans for specific purposes, ex-servicemen may receive financial assistance in certain circumstances by way of special grants or rehabilitation allowances. The total amount authorized in this manner to 31st March, 1949, was £469,419.
The following table shows the number of scholars and students receiving instruction in the educational institutions of New Zealand during the years 1947 and 1948. Registered private schools are included.
| — | 1947. | 1948. |
|---|---|---|
* Exclusive of students taking part-time courses with the Correspondence School, 2,376 in 1947 and 1,630 in 1948. † Includes 890 students taking short courses at the Agricultural Colleges in 1947 and 877 in 1948. | ||
| Primary schools | 274,854 | 281,702 |
| Post-primary schools | 50,372* | 50,500* |
| Technical classes (part-time) | 18,697 | 20,305 |
| Universities | 12,764† | 12,801† |
| Totals | 355,687 | 365,308 |
Government expenditure on education amounted to £9,950,818 in the financial year 1947–48 and £11,023,016 in 1948–49.
Radio Licences (p. 325).—The number of radio licences in force on 31st March, 1949, was 432,000, and at 31st March, 1948, 421,000.
Commercial Failures (pp. 578–582).—The number of bankruptcies in the calendar year 1948 was 148 and the number of deeds of assignment 27. Corresponding figures for the calendar year 1917 were: bankruptcies, 74; deeds of assignment, 23.
Horse-racing (pp. 426–427).—The number of racing-days in the calendar year 1948 was 321, as compared with 320 in 1947. Totalizator investments totalled £22,969,000 in 1948 (£22,629,000 in 1947), while Government taxation totalled £2,167,000 in 1948 (£2,163,000 in 1947).
Land Transfers (pp. 852–855),—Transactions under the Land Transfer Act have been on a very heavy scale during the last three financial years, a contributing factor, no doubt, being the rehabilitation of ex-servicemen. Particulars of transfers registered during each of the three years in the period which ended March, 1949, are now given.
| — | Year ended 31st March, | ||
|---|---|---|---|
| 1947. | 1948. | 1949. | |
| Town and suburban properties— | |||
| Number | 34,685 | 32,080 | 30,494 |
| Consideration £ | 27,208,000 | 25,040,000 | 24,803,000 |
| Country properties— | |||
| Number | 8,309 | 6,721 | 6,070 |
| Area Acres | 1,844,048 | 1,756,588 | 1,691,743 |
| Consideration £ | 17,765,000 | 15,413,000 | 13,607,000 |
| All properties— | |||
| Number | 42,994 | 38,801 | 36,564 |
| Consideration £ | 44,973,000 | 40,453,000 | 38,410,000 |
Mortgages (pp. 569–577).—Particulars of mortgages registered and discharged during the last three financial years, are shown below. For several years during the war period the value of mortgages released exceeded the amount represented by mortgages registered, but from 1946–47 onwards this trend was reversed despite the fact that discharges were on a heavier scale than previously. The substantial increase in registrations has been, no doubt, due to transactions connected with the rehabilitation of ex-servicemen.
| Year ended 3lst March, | Registered. | Discharged. | ||
|---|---|---|---|---|
| Number. | Amount. | Number. | Amount. | |
| £ | £ | |||
| 1947 | 29,898 | 31,687,000 | 32,248 | 27,099,000 |
| 1948 | 29,905 | 32,312,000 | 29,008 | 25,427,000 |
| 1949 | 29,587 | 35,394,000 | 26,648 | 23,382,000 |
Page 2, Descriptive:—
The year quoted in the fourth line from the bottom of the page should be 1842.
Page 8, Descriptive:—
Under “Earthquakes,” reference should be to the 1942 and earlier issues of the Year-Book.
Page 389, Statistics of Principal Industries:—
The figures in the table relating to woollen-mills for the year 1946–47 should be amended for certain items as follows:—
| Greasy wool used— | |
| Quantity (lb.) | 10,101,731 |
| Cost(£) | 640,840 |
| Cost of other materials used (£) | 187,750 |
LOCATION, AREA, AND BOUNDARIES.—Consisting of two large and several smaller islands, New Zealand lies in the South Pacific Ocean some 1,200 miles to the eastward of Australia. With South America some 6,000 miles distant to the east and the Antarctic Continent 1,600 miles distant to the south, the Islands are, for their size, among the world's most isolated. For statistical purposes, the following classification of the administrative area is the most convenient:—
Islands forming New Zealand proper (total area, 103,416 square miles):—
Square Miles. North Island and adjacent islets 44,281 South Island and adjacent islets 58,093 Stewart Island and adjacent islets 670 Chatham Islands 372 In all further references in this volume, unless the context indicates the contrary, Chatham Islands and Stewart Island are included with the South Island. It should be noted also that statistics for “New Zealand” refer to the above group of islands, unless it is expressly stated that the outlying islands, group (b), and/or the annexed islands, group (c), are included.
Outlying islands (total area, 307 square miles) included within the geographical boundaries of New Zealand as proclaimed in 1847:—
Square Miles. Three Kings Islands 3 Auckland Islands 234 Campbell Island 44 Antipodes Islands 24 Bounty Islands 0 1/25 Snares Islands 1 Solander Island 0½ At present a meteorological station is maintained on Campbell Island; otherwise none of the outlying islands is regularly inhabited,
Islands (total area, 216 square miles) annexed to New Zealand:—
Kermadec Islands, annexed in 1887 (area, 13 square miles).
Cook and other Pacific Islands, annexed in 1901:—
Niue Island (area, 100 square miles).
Cook Islands (area, 81 square miles)—
Rarotonga. Aitutaki. Mangaia. Mauke (or Parry). Atiu. Takutea. Mitiaro. Manuae (or Hervey Islands). Northern Islands (Area, 15 square miles)—
Palmerston (or Avarau). Pukapuka (or Danger). Penrhyn (or Tongareva). Suwarrow (or Anchorage). Manihiki (or Humphrey). Nassau. Rakahanga (or Reirson). Tokelau (or Union) Islands, proclaimed part of New Zealand, 1st January, 1949 (area, 4 square miles)—
Fakaofo. Nukunono. Atafu.
The total area of the foregoing groups is 103,939 square miles. Elsewhere in this issue (viz., in the section on land tenure, settlement, &c.) the aggregate area of New Zealand appears as 66,390,722 acres—i.e., 103,735 square miles. The latter area does not include the Cook and other Pacific Islands annexed in 1901 or the Tokelau Islands.
As well as exercising jurisdiction over the areas already mentioned, New Zealand also administers the Ross Dependency and Western Samoa. Jointly with the United Kingdom Government and the Government of Australia, New Zealand is responsible for the administration of the Trust Territory of the Island of Nauru. The administrative appointments for Nauru are made by the Australian Government, but New Zealand appoints a representative to the British Phosphates Commission, which controls the working of the phosphate deposits.
The Island Territories Act, 1943, provides for the appointment of a member of the Executive Council as Minister of Island Territories. This Minister is charged with the administration of the government of any territory out of New Zealand which may at any time be a dependency or trust territory of New Zealand, or otherwise be under the jurisdiction of the Government or Parliament of New Zealand.
The relevant Proclamations, defining from time to time the administrative area of New Zealand, are briefly referred to in the following paragraphs.
The Proclamation of British sovereignty over New Zealand, dated the 30th January, 1840, gave as the boundaries of what was then the colony the following degrees of latitude and longitude: On the north, 34° 30' S. lat.; on the south, 47° 10' S. lat.; on the east, 179° 0' E. long.; on the west, 166° 5' E. long. These limits excluded small portions of the extreme north of the North Island and of the extreme south of Stewart Island.
In 1847, by Letters Patent, and again by the Imperial Act 26 and 27 Vict., c. 23 (1863), the boundaries were altered so as to extend from 33° to 53° of south latitude and from 162° of east longitude to 173° of west longitude. By Proclamation bearing date the 21st July, 1887, the Kermadec Islands, lying between the 29th and 32nd degrees of south latitude and the 177th and 180th degrees of west longitude, were declared to be annexed to and to become part of the then colony of New Zealand.
By Proclamation of the 10th June, 1901, the Cook Group of islands, and all the other islands and territories situate within the boundary-lines mentioned in the following schedule, were included as from the 11th June, 1901:—
A line commencing at a point at the intersection of the 23rd degree of south latitude and the 156th degree of longitude west of Greenwich, and proceeding duo north to the point of intersection of the 8th degree of south latitude and the 156th degree of longitude west of Greenwich; thence duo west to the point of intersection of the 8th degree of south latitude and the 167th degree of longitude west of Greenwich; thence duo south to the point of intersection of the 17th degree of south latitude and the 167th degree of longitude west of Greenwich; thence due west to the point of intersection of the 17th degree of south latitude and the 170th degree of longitude west of Greenwich; thence due south to the point of intersection of the 23rd degree of south latitude and the 170th degree of longitude west of Greenwich; and thence due east to the point of intersection of the 23rd degree of south latitude and the 156th degree of longitude west of Greenwich.
The territory of Western Samoa was formerly administered pursuant to a mandate conferred upon His Britannic Majesty, to be administered on his behalf by the Government of New Zealand, and confirmed by the Council of the League of Nations on 17th December, 1920. Following the replacement of the League of Nations by the United Nations, a draft Trusteeship Agreement for Western Samoa was prepared by the New Zealand Government and submitted to the General Assembly of the United Nations late in 1946. This draft agreement replaced the original mandate and thus brought the Territory within the framework of the international trusteeship system established under the United Nations Charter. Under the new agreement the New Zealand Government assumed direct responsibility for the administration of Western Samoa. The agreement was approved by the General Assembly on 13th December, 1946. Western Samoa is comprised of two large islands, Upolo and Savai`i, and the small islands of Manono, Apolima, Fanuatapu, Namu`a, Nu`utele, Nu`ulua, and Nu`usafe`e, and is contained within latitudes of 13° to 15° south and longitudes 171° to 173° west.
By Imperial Order in Council of the 30th July, 1923, the coasts of the ROSS Sea (in the Antarctic regions), with the adjacent islands and territories between the 160th degree of east longitude and the 150th degree of west longitude, and south of the 60th degree of south latitude, were declared a British settlement within the meaning of the British Settlements Act, 1887. This region was named the Ross Dependency, and placed under the administration of the Governor-General of New Zealand. The dependency is uninhabited.
By Imperial Orders in Council of the 4th November, 1925, the Tokelau Islands (consisting of the islands of Fakaofo, Nukunono, and Atafu, and the small islands, islets, rocks, and reefs depending on them, a total area of only four square miles) were excluded from the Gilbert and Ellice Islands Colony, and placed under the administration of the Governor-General of New Zealand. In accordance with a provision of the second of these Orders in Council, the Governor-General's authority and power in connection with the administration of the islands were, by New Zealand Order in Council of the 8th March, 1926, delegated to the Administrator of Western Samoa.
By the Tokelau Islands Act, 1948, which came into operation on 1st January, 1949, the Tokelau Islands were declared to form part of New Zealand. This Act emerged as the result of an agreement between the United Kingdom and New Zealand Governments.
GEOGRAPHICAL FEATURES—Coast-line.—Since the combined length of the North and South Islands extends just over a thousand miles, and since the width of neither Island exceeds 280 miles at its broadest point, New Zealand possesses a very lengthy coast-line in proportion to its area. With the exception of the low-lying North Auckland peninsula, the New Zealand land-mass lies along a south-westerly and north-easterly axis, parallel to the direction of its mountain-chains.
By reason of the latter fact the coast-line is, on the whole, not greatly indented; and, as a consequence, New Zealand is not well endowed with natural harbours. In the North Island, Auckland and Wellington are the only two safe natural harbours of which the fullest commercial use can be made. On the east coast of the North Auckland peninsula several deep and sheltered harbours exist, but as the surrounding country is comparatively undeveloped and the area somewhat remote they are of little economic consequence at present. In the South Island the Marlborough Sounds and the West Coast Sounds form perfect land-locked harbours, but owing to their situations and to the rugged nature of the terrain they have—with the exception of Queen Charlotte Sound—little or no commercial utility. Where vital localities have not been endowed with ideal harbours it has been necessary to improve existing facilities by dredging and by breakwater-construction, &c. In this manner efficient ports, capable of accommodating overseas vessels, have been formed in Lyttelton, Otago, and Bluff harbours. On the west coast of both Islands the strong ocean-drifts and high seas cause shoaling at river-mouths and harbour-entrances, while on the cast coast of the South Island similar circumstances prevail, due to the largo quantities of shingle brought down by the rivers being spread along the coast by ocean currents. The mountainous nature of the country makes the haulage of goods to and from the better-equipped natural harbours both costly and difficult, and the construction and maintenance of further ports at various points along the coasts of both Islands has been necessary, either by dredging river-mouths or by harbour-construction work.
Mountains.—The mountainous nature of New Zealand is one of its most striking physical characteristics, Jess than one-quarter of the land surface lying below the 650 ft. contour. In the North Island the higher mountains occupy approximately one-tenth of the surface; but, with the exception of the four volcanic peaks of Egmont (8,260 ft.), Ruapehu (9,175 ft.), Ngauruhoe (7,515 ft.), and Tongariro (6,458 ft.), they do not exceed an altitude of 6,000 ft. Of these four volcanoes only the first-named can be classed as extinct. While Ruapehu was particularly active from March, 1945, to the end of that year, being responsible for considerable deposits of volcanic ash over a very wide area, more recent and spectacular activity has been exhibited by Ngauruhoe, commencing in February, 1949. In both cases violent eruptions alternated with quieter periods. Other volcanoes include Mount Tarawera and White Island, each of which has, upon one occasion within historical times, erupted with disastrous consequences. Closely connected with the volcanic system are the multitudinous hot springs and geysers.
The South Island is much more mountainous than the North, but shows fewer manifestations of recent volcanic activity. Along almost the entire length of the Island runs the massive chain known as the Southern Alps, which attains its greatest height in Mount Cook (12,349 ft.), while no fewer than seventeen peaks exceed 10,000 ft.
As might be expected, the higher mountains of the South Island have exerted a greater influence on the economic development of the country than those of the North Island. For many years the Southern Alps were an effective barrier to communication by land between the east and west coasts, while their climatic effects on the Canterbury plains and Otago plateaux determined the types of cultivation undertaken. Moreover, the existence of much elevated open country led to the development of pastoral holdings on a large scale. While the mountains in the North Island are not as high nor as extensive as those of the South Island, in the early days they effectively isolated various portions of the coastal plains and valleys. Their effect on climatic conditions, however, is considerably less, the rainfall being more evenly distributed. Owing to this more even distribution of the rainfall, and to the existence of considerable areas of lower relief, the foothills of the mountain systems were heavily wooded, and so proved a hindrance to agrarian development.
In the 1931 issue of the Year-Book a list was given, not claimed as exhaustive, of 223 named peaks of 7,500 ft. or more in altitude. Below is a list of the peaks restricted to the three largest volcanic cones in the North Island and to mountains of a minimum height of 9,000 ft. in the South Island. The list has been compiled from various sources, and does not purport to be free from omissions.
| Mountain or Peak. | Height (Feet). |
|---|---|
| NORTH ISLAND | |
| Ruapehu | 9,175 |
| Egmont | 8,260 |
| Ngauruhoe | 7,515 |
| SOUTH ISLAND | |
| Kaikoura Ranges— | |
| Tapuaenuku | 9,465 |
| Alarm | 9,400 |
| Southern Alps— | |
| Cook | 12,349 |
| Tasman | 11,475 |
| Dampier | 11,287 |
| Silberhorn | 10,757 |
| Lendenfeldt | 10,450 |
| David's Dome | 10,443 |
| Malte Brun | 10,421 |
| Torres | 10,376 |
| Teichelmann | 10,370 |
| Sefton | 10,354 |
| Haast | 10,294 |
| Elie de Beaumont | 10,200 |
| Douglas Peak | 10,107 |
| La Perouse | 10,101 |
| Haidinger | 10,059 |
| De la Beche | 10,058 |
| The Minarets | 10,058 |
| Aspiring | 9,975 |
| Hamilton | 9,915 |
| Glacier Peak | 9,865 |
| Arguilles Rouges | 9,731 |
| Nazomi | 9,716 |
| Darwin | 9,715 |
| Chudleigh | 9,686 |
| Annan | 9,667 |
| Lowe | 9,653 |
| Haeckel | 9,649 |
| Le Receveur | 9,562 |
| Goldsmith | 9,532 |
| Big Mac | 9,511 |
| Conway Peak | 9,510 |
| Bristol Top | 9,508 |
| Walter | 9,507 |
| Grey | 9,490 |
| Green | 9,307 |
| Hutton | 9,297 |
| D'Archiac | 9,279 |
| Bell | 9,276 |
| Hochstetter Dome | 9,258 |
| Earnslaw | 9,250 |
| Nathan | 9,200 |
| Barnicoat | 9,183 |
| Sibbald | 9,181 |
| Arrowsmith | 9,171 |
| Spencer | 9,167 |
| The Footstool | 9,073 |
| Rudolf | 9,039 |
| The Dwarf | 9,025 |
| Darran Range— | |
| Tutoko | 9,691 |
| Madeline | 9,042 |
Glaciers.—In keeping with the dimensions of the mountain system, New Zealand possesses, in the South Island, a glacial system of some magnitude. Of the glaciers the largest is the Tasman, which, with others of comparable size, rises in the more elevated area surrounding Mount Cook. Flowing clown the eastern slope of the range, the Tasman glacier has a length of 18 miles and a width of 1¼ miles. In common with other glaciers on the eastern slope, of which the more important are the Murchison (11 miles), the Mueller (8 miles), the Godley (8 miles), and the Hooker (7¼ miles), its rate of flow is slow, while its terminal face is at an altitude of somewhat over 2,000 ft. On the western slope of the range, owing to the greater snow precipitation, the glaciers are more numerous and descend to lower levels, while the steeper slope gives them a more rapid rate of flow. The two largest of these are the Fox and the Franz Josef, with lengths of 9¾ miles and 8½ miles respectively, and terminal faces at altitudes of 670 ft. and 690 ft.
As will be realized, these glaciers are an important tourist attraction, and as such have definite economic significance. Moreover, those glaciers on the eastern slopes which feed rivers utilized for irrigation and hydro-electric purposes are Valuable in that they help to ensure a steady volume of water throughout the year.
Rivers.—Of the numerous New Zealand rivers few are of sufficient length or volume to be navigable. Moreover, owing to the high relief of the country, they are mostly swift-flowing, while, as mentioned previously, nearly all are obstructed at their mouths by bars. For the purpose of internal communication, therefore, they are of little economic utility, and only in two or three isolated instances have they been thus consistently used. With improved roading conditions, however, their traffic has become negligible even in these cases.
As sources of hydro-electric power, New Zealand rivers are of considerable importance, since their rapid rate of flow and dependable volume of ice-free water make them eminently suitable for this purpose. At the present time the Waikato and the Mangahao in the North Island and the Waitaki and Waipori in the South are used for major hydro-electric schemes and a further major development is now being undertaken on the Clutha. The characteristics just mentioned are also important for purposes of irrigation, but, owing to the country's reliable rainfall, there are few areas other than in Canterbury and Otago where the rivers are so utilized.
In the 1932 Year-Book appears an account of the rivers of New Zealand, but space in this issue is, however, available only for a list of the more important ones, with their approximate lengths.
NORTH ISLAND
| Flowing into the Pacific Ocean— | Miles. |
|---|---|
| Piako | 60 |
| Waihou (or Thames) | 90 |
| Rangitaiki | 95 |
| Whakatane | 60 |
| Waiapu | 55 |
| Waipaoa | 50 |
| Wairoa | 50 |
| Mohaka | 80 |
| Ngaururoro | 85 |
| Tukituki | 65 |
| Flowing into Cook Strait— | |
| Ruamahanga | 70 |
| Hutt | 35 |
| Otaki | 30 |
| Manawatu | 100 |
| Rangitikei | 115 |
| Turakina | 65 |
| Wangaehu | 85 |
| Wanganui | 140 |
| Waitotara | 50 |
| Patea | 65 |
| Flowing into the Tasman Sea— | |
| Waitara | 65 |
| Mokau | 75 |
| Waikato | 220 |
| Wairoa | 95 |
| Hokianga | 40 |
SOUTH ISLAND
| Flowing into Cook Strait— | Miles. |
|---|---|
| Aorere | 45 |
| Takaka | 45 |
| Motueka | 75 |
| Wai-iti | 30 |
| Pelorus | 40 |
| Wairau | 105 |
| Awatere | 70 |
| Flowing into the Pacific Ocean— | |
| Clarence | 125 |
| Conway | 30 |
| Waiau-uha | 110 |
| Hurunui | 90 |
| Waipara | 40 |
| Ashley | 55 |
| Waimakariri | 93 |
| Selwyn | 55 |
| Rakaia | 95 |
| Ashburton | 67 |
| Rangitata | 75 |
| Opihi | 50 |
| Pareora | 35 |
| Waihao | 45 |
| Waitaki | 135 |
| Kakanui | 40 |
| Shag | 45 |
| Taieri | 125 |
| Clutha | 210 |
| Flowing into Foveaux Strait— | |
| Mataura | 120 |
| Oreti | 105 |
| Aparima | 65 |
| Waiau | 115 |
| Flowing into the Tasman Sea— | |
| Cleddau and Arthur | 20 |
| Hollyford | 50 |
| Cascade | 40 |
| Arawata | 45 |
| Haast | 60 |
| Karangarua | 30 |
| Cook | 25 |
| Waiho | 20 |
| Wataroa | 35 |
| Wanganui | 35 |
| Waitaha | 25 |
| Hokitika | 40 |
| Arahura | 35 |
| Taramakau | 45 |
| Grey | 75 |
| Buller | 105 |
| Mokihinui | 30 |
| Karamea | 45 |
| Heaphy | 25 |
The discovery in 1861 that the beds of numerous rivers in the South Island contained extensive deposits of alluvial gold was of considerable importance in the economic development of the country. Not only did it lead to an increase in population and in wealth, but, through the following of the numerous streams to their sources, it also led to the rapid exploration of largo tracts of remote country. The exploitation of these deposits has been carried on with varying degrees of success up to the present time by both manual and mechanical means.
A further factor in connection with the rivers is that, owing to the very successful acclimatization of fresh-water fish, notably trout, many of them now provide exceptionally fine fishing.
Lakes.—In considering New Zealand's numerous lakes, a distinction can be made, especially from the scenic viewpoint, between the lakes of the two Islands. Surrounded by extremely rugged country the larger lakes of the South Island are distinguished by the grandeur of their alpine settings, while those of the North Island, situated on a volcanic plateau, are of interest by reason of the neighbouring thermal activity. Owing to the excellence of their fishing the North Island lakes possess an added tourist attraction. In both Islands the lakes are situated at high altitudes, and their consequent remoteness renders them unsuitable as a means of communication. In their functions as reservoirs the lakes of both Islands are of vital importance for the maintenance of the streams draining them and as a means of flood-prevention. More especially is this the case where hydro-electric schemes are involved, Lakes Waikaremoana and Taupo in the North Island, and Lakes Coleridge, Pukaki, and Tekapo in the South Island, being of particular significance in this respect.
An article on the lakes of New Zealand will be found in the 1932 Year-Book. Some particulars of the more important are given in the following table.
| Lake. | Length, in Miles. | Greatest Breadth, in Miles. | Area, in Square Miles. | Drainage Area, in Square Miles. | Approximate Volume of Discharge, in Cubic Feet per Second. | Height above Sea-level, in Feet. | Greatest Depth, in Feet. |
|---|---|---|---|---|---|---|---|
| NORTH ISLAND | |||||||
| Taupo | 25 | 17 | 238 | 1,250 | 5,000 | 1,211 | 534 |
| Rotorua | 7½ | 6 | 32 | 158 | 420 | 915 | 84 |
| Rotoiti | 10¾ | 2¼ | 14 | 26 | 500 | 913 | 230 |
| Tarawera | 6½ | 6½ | 15 | 75 | 1,032 | 285 | |
| Waikaremoana | 12 | 6¼ | 21 | 128 | 772 | 2,015 | 846 |
| Wairarapa | 10 | 4 | 27 | 1,250 | 64 | ||
| SOUTH ISLAND | |||||||
| Rotoiti | 5 | 2 | 2¾ | 86 | 1,997 | 228 | |
| Rotoroa | 7 | 2½ | 8 | 146 | 1,470 | ||
| Brunner | 5 | 4 | 16 | 145 | 280 | 357 | |
| Kaniere | 5 | 1¾ | 8 | 11 | 422 | 646 | |
| Coleridge | 11 | 3 | 18 | 70 | 1,667 | 680 | |
| Tekapo | 12 | 4 | 32 | 580 | 5,000 | 2,323 | 620 |
| Pukaki | 10 | 5 | 31 | 515 | 6,000 | 1,588 | |
| Ohau | 10 | 3 | 23 | 424 | 5,000 | 1,720 | |
| Hawea | 20 | 5 | 48 | 518 | 5,700 | 1,062 | |
| Wanaka | 30 | 4 | 75 | 960 | 922 | ||
| Wakatipu | 52 | 3 | 112 | 1,162 | 13,000 | 1,016 | 1,242 |
| Te Anau | 33 | 6 | 132 | 1,320 | 12,660 | 694 | 906 |
| Manapouri | 12 | 6 | 56 | 416 | 596 | 1,458 | |
| Monowai | 12 | 1 | 12 | 51 | 700 | 600 | |
| Hauroko | 20 | 3 | 25 | 195 | 1,800 | 611 | |
| Poteriteri | 17 | 2 | 17 | 162 | 96 | ||
| Waihola | 4½ | 1 ⅛ | 3⅓ | 2,200 | (Tidal) | 52 | |
| Ellesmere | 16 | 10 | 107½ | 745 | (Tidal) | 45 |
GEOLOGY.—An article on the geology of New Zealand prepared by Dr. J. Henderson, M.A., F.R.S.N.Z., former Director of the Geological Survey, is contained in the 1940 and earlier editions of the Year-Book. For more detailed information the reader is referred to the treatises of Professors Park and Marshall, the bulletins of the Geological Survey, and the many papers that have appeared in the “Transactions of the New Zealand Institute” (now the Royal Society of New Zealand).
EARTHQUAKES.—An article on earthquakes in New Zealand appeared in the 1943 and earlier issues of the Year-Book. The information given below has been supplied by Mr. R. C. Hayes, Acting-Director of the Dominion Observatory.
Seismicity and Earthquake Distribution.—A comparison between the records of destructive earthquakes in New Zealand and those in other seismic countries shows that the seismicity of New Zealand, on the whole, is surprisingly high. However, this is due to the occurrence of a large number of earthquakes of the semi-destructive type (R.-F. 8) with comparatively few major destructive shocks (R.-F. 9, 10).
During the period 1835–47, 72 destructive earthquakes are known to have occurred in New Zealand, 52 of which were of the semi-destructive type (not exceeding intensity R.-F. 8). Of the remainder, 14 were of intensity 9, and 6 of intensity 10.
The total number of earthquakes of all intensities, and the maximum intensity, reported felt in New Zealand in each of the years 1922 to 1947 were as follows:—
| Year. | Number of Earthquakes reported felt. | Maximum Intensity of Heaviest Shock. | |
|---|---|---|---|
| R.-F. Scale. | M.-M* Scale. | ||
* Modified Mercalli Scale of 1931, which is now used for recording earthquake effects in New Zealand. | |||
| 1922 | 1,187 | 8 | 7 |
| 1923 | 76 | 6 | 5–6 |
| 1924 | 70 | 7 | 6–7 |
| 1925 | 76 | 8 | 7 |
| 1926 | 173 | 8 | 7 |
| 1927 | 107 | 8 | 7 |
| 1928 | 80 | 8 | 7 |
| 1929 | 678 | 10 | 10 |
| 1930 | 748 | 8 | 7 |
| 1931 | 432 | 10 | 10 |
| 1932 | 313 | 9 | 84+ |
| 1933 | 108 | 7 | 6–7 |
| 1934 | 230 | 9 | 8+ |
| 1935 | 150 | 7 | 6–7 |
| 1936 | 123 | 6 | 5–6 |
| 1937 | 179 | 6–7 | 6 |
| 1938 | 132 | 8 | 7 |
| 1939 | 157 | 7 | 6–7 |
| 1940 | 120 | 7 | 6–7 |
| 1941 | 107 | 8 | 7 |
| 1942 | 198 | 9+ | 9 |
| 1943 | 176 | 8 | 7 |
| 1944 | 95 | 6 | 54+ |
| 1945 | 127 | 7 | 6+ |
| 1946 | 302 | 8 | 7 |
| 1947 | 233 | 8+ | 74+ |
The abnormally large number of earthquakes reported in the year 1922 was due to the swarm of local shocks in the Taupo region in the latter half of that year. Abnormally large numbers of shocks also occurred in 1929–30, due to aftershocks of the Buller earthquake of 17th June, 1929.
Summary of Seismic Activity in New Zealand in 1947.—Most of the year 1947 was a comparatively active seismic period. Numerous shocks originated off the northeast coast of the North Island, a strong one on 26th March being followed by seismic sea-waves which caused damage on parts of the Gisborne coast. The earthquake itself did no damage. Another shock in the same region on 17th May was followed by sea-waves of smaller intensity. Other strong shocks occurred in this region on 13th, 23rd, and 28th August. A shock near Tolaga Bay on 16th June reached intensity M.-M. VII (R.-F. 8) and caused some minor damage. During April seismic activity was unusually widespread, shocks occurring frequently at various points between Morrinsville and the Bluff. The strongest shock during the year occurred in the Jackson's Bay region on 13th October. It reached intensity M.-M. VII + (R.-F. 84) in the epicentral region and was widely felt in the South Island. Other groups of minor activity occurred in the Taupo area, the Lake Coleridge area, and south of Puysegur point.
In all, 233 shocks were reported felt during the year, 150 of which were felt in the North Island and 89 in the South Island. Six were felt in both Islands. The maximum intensities reported were M.-M. VII (R.-F. 8) in the North Island, and M.-M. VII+ (R.-F. 8+) in the South Island.
Regional Distribution. — New Zealand earthquake statistics over the past hundred years or so show that certain parts of the country are subject to almost continuous seismic activity with occasional destructive shocks, while other parts are more or less free from seismic disturbances. By combining early earthquake records with the more precise data of recent years it is possible to divide the country roughly into four seismic regions. These regions are classified below, in order of seismicity.
I. All areas of the North Island east and south of an approximate line from the vicinity of Whakatane in the Bay of Plenty to the vicinity of Hawera in South Taranaki, and all areas of the South Island north of an approximate line from the vicinity of Hokitika on the west coast, through the region of Lake Coleridge, to Bunks Peninsula:
South Auckland, western Bay of Plenty, Waikato, and Taranaki (except the southern portion):
Areas of the South Island, south of the boundary of region I:
Areas north of Auckland.
The following table shows the average frequency of earthquakes in each of the four regions defined above.
| Region. | Average Number of Earthquakes per Year (1921–1940). | Average Number of Destructive Shocks per Decade (1835–1940). | Relative Seismicity based on Destructive shocks. | |
|---|---|---|---|---|
| Minor Shocks (R.-F. 8). | Major Shocks (R.-F. 9, 10). | |||
| I | 97.8 | 4.1 | 1.7 | 11.5 |
| II | 23.0 | 1.1 | 1.1 | |
| III | 12.1 | 0.1 | 0.1 | |
| IV | 1.1 | 0.0 | ||
The boundaries between the seismic regions are not well defined, since one region generally merges more or less imperceptibly into another. Further, seismic frequency is not uniform. This leads to the number of shocks being considerably above the average in some years and below it in others. The normal irregularity is increased by the occasional occurrence of earthquake swarms in certain regions. Probably the most notable swarm in New Zealand was that which occurred in the Taupo region in the latter half of 1922. The number of minor local shocks in this swarm was so great that only the stronger ones, or those affecting the adjacent region, were used in determining the average frequency of region I, Major earthquakes occur chiefly in the eastern and southern parts of region I.
Deaths due to Earthquakes.—During the period 1848–1947 the number of deaths recorded in New Zealand as due directly or indirectly to earthquakes was 284. Of these, 255 were due to the Hawkes Bay earthquake of 3rd February, 1931.
CLIMATE.—An article on the climate of New Zealand, supplied by Dr. M. A. F. Barnett, O.B.E., M.Sc., Ph.D., F.Inst.P., Director of Meteorological Services, was included in the 1942 and earlier editions of the Year-Book, but considerations of space preclude its repetition in this issue.
The following table, however, suffices to give some information on the chief climatological elements. Average values, based on records for varying periods, are included for a selection of climatological stations. More detailed climatological statistics are available in the Meteorological Observations published annually by the Meteorological Office. Publication of the Meteorological Observations has been resumed after being suspended during the war years.
CLIMATOLOGICAL AVERAGES (OVER A PERIOD OF YEARS)
| Station. | Altitude of Station. | Average Annual Rainfall. | Average Number of Rain-days. | Average Bright Sunshine. | Temperatures in Shade, Degrees Fahrenheit. | |||||
|---|---|---|---|---|---|---|---|---|---|---|
| Mean Daily Maximum. | Mean Daily Minimum. | |||||||||
| Jan. | July. | Year. | Jan. | July. | Year. | |||||
*Normals relate to present site. † Temperature records for less than ten years. | ||||||||||
| Ft. | In. | Hrs. | ||||||||
| Te Paki, Te Hapua | 200 | 54.74 | 164 | 2,163 | 72.3 | 58.6 | 65.6 | 57.2 | 45.4 | 51.9 |
| Auckland | 160 | 49.14 | 183 | 2,058 | 72.9 | 56.4 | 64.8 | 60.0 | 45.9 | 53.1 |
| Tauranga | 10 | 52.90 | 151 | 2,371 | 74.5 | 57.1 | 66.1 | 54.8 | 39.7 | 47.4 |
| Hamilton East | 131 | 46.68 | 159 | 2,038 | 75.3 | 56.3 | 66.1 | 52.3 | 37.3 | 45.1 |
| Rotorua | 931 | 55.42 | 145 | 2,054 | 74.9 | 54.5 | 64.8 | 53.5 | 37.0 | 45.3 |
| Gisborne† | 12 | 38.31 | 147 | 2,271 | 77.3 | 54.1 | 66.0 | 54.3 | 41.1 | 47.6 |
| Onepoto, Lake Waikaremoana† | 2,110 | 76.25 | 184 | 67.5 | 46.7 | 57.6 | 52.4 | 37.2 | 45.0 | |
| New Plymouth | 160 | 60.60 | 186 | 2,235 | 69.5 | 54.9 | 62.5 | 55.5 | 42.7 | 49.4 |
| Napier | 5 | 31.48 | 114 | 2,417 | 73.9 | 54.6 | 64.7 | 57.2 | 39.0 | 48.5 |
| Taihape | 2,157 | 36.91 | 181 | 68.2 | 47.0 | 57.8 | 50.2 | 35.9 | 43.1 | |
| Wanganui† | 72 | 35.97 | 156 | 2,194 | 71.4 | 53.4 | 62.9 | 56.3 | 40.2 | 48.9 |
| Plant Research Bureau, Palmerston North | 110 | 38.00 | 154 | 1,818 | 70.5 | 52.5 | 62.0 | 54.6 | 38.6 | 47.0 |
| Masterton | 350 | 37.69 | 142 | 2,092 | 73.9* | 52.6* | 63.6* | 50.9* | 35.9* | 43.2* |
| Wellington | 415 | 44.86 | 166 | 2,040 | 67.7 | 51.1 | 59.7 | 54.6 | 41.5 | 48.2 |
| Nelson | 24 | 38.22 | 119 | 2,487 | 71.2 | 54.0 | 63.0 | 54.5 | 36.7 | 46.0 |
| Blenheim | 60 | 24.93 | 111 | 2,320 | 75.6 | 53.1 | 64.9 | 53.4 | 32.9 | 43.9 |
| Hanmer Springs | 1,225 | 45.84 | 134 | 1,960 | 71.8 | 47.7 | 60.9 | 48.0 | 28.7 | 39.1 |
| Hokitika | 12 | 114.64 | 188 | 1,895 | 66.3 | 52.9 | 59.6 | 53.1 | 36.5 | 45.4 |
| Lake Coleridge | 1,195 | 32.49 | 113 | 70.8 | 48.0 | 61.1 | 49.2 | 29.9 | 40.8 | |
| Christchurch | 22 | 26.10 | 126 | 1,968 | 70.2 | 49.8 | 60.8 | 52.7 | 34.7 | 44.0 |
| Timaru | 56 | 23.16 | 115 | 1,911 | 69.9 | 49.2 | 60.6 | 51.6 | 33.3 | 42.8 |
| Milford Sound | 20 | 252.76 | 195 | 64.2 | 48.5 | 56.8 | 50.0 | 34.3 | 42.4 | |
| Queenstown | 1,100 | 30.78 | 101 | 1,990 | 69.6 | 45.1 | 58.7 | 49.0 | 30.5 | 40.9 |
| Alexandra | 520 | 13.51 | 100 | 2,145 | 72.4 | 44.0 | 60.6 | 50.8 | 27.8 | 40.3 |
| Dunedin | 5 | 31.32 | 161 | 1,702 | 67.6* | 48.3* | 59.1* | 50.9* | 36.4* | 44.2* |
| Invercargill | 32 | 44.74 | 199 | 1,632 | 66.3 | 48.7 | 58.3 | 48.5 | 33.8 | 41.8 |
1945.—Dull unsettled weather persisted throughout the early part of 1945. A cool autumn was followed by a cold though relatively dry winter. Early spring growth was good, but was not maintained due to the very cold weather of October. The coldest December on record further hindered agricultural work.
From Hawkes Bay to East Cape the annual rainfall was only about 70 per cent. of the normal. Deficiencies were smaller over most of the Auckland and Coromandel Peninsulas, in Bay of Plenty, near Nelson, Masterton, Wellington, and Queen Charlotte Sound. Elsewhere the rainfall was above normal, the excess being greater than 50 per cent. over much of Canterbury and in parts of North and Central Otago. Mean temperatures for the year were below normal, the departure exceeding 1°F. in the interior of both Islands. The duration of bright sunshine was a little above normal over the Auckland and Hawkes Bay provincial districts, in Blenheim, and on the Canterbury Plains. Totals elsewhere were below normal, deficiencies of over 200 hours being recorded in parts of Otago and Westland.
Seasonal Notes.—As in December, 1944, conditions were persistently unsettled during the first two months of 1945, and culminated in severe flooding over South Canterbury on 21st February. Growth was very abundant, but crops suffered from lack of sunshine. The autumn was a cool one. Westerly conditions in both March and April gave low rainfalls to the east coast, but much wet weather elsewhere. In May this rainfall distribution was reversed, and its coldness proved hard on stock. June and July were cold and frosty, with light rainfalls. Canterbury experienced a severe snowstorm in the latter month. A mild August eased the position for stock, although it was cloudy and rather wet. September was also dull, but not very abnormal otherwise. Growth which promised well in August, did not continue strongly. The season was further hindered by an exceptionally cold October, and, although this was followed by a mild November, very dry conditions prevented much improvement. The dryness continued in Auckland and Hawkes Bay throughout December, which was the coldest known in New Zealand.
Summary of Meteorological Observations.—The observations from which the following summary was compiled for the year 1945 were taken at 09.30 hrs. New Zealand civil time—i.e., 180th Meridian Time.
| — | Temperatures in Shade, Degrees Fahrenheit. | Hours of Bright Sunshine. | Rainfall. | |||||||
|---|---|---|---|---|---|---|---|---|---|---|
| Mean Daily Maximum. | Mean Daily Minimum. | Approx, Mean Temperature. | Extremes for 1945. | Extremes. | Total Fall (Inches) | Number of Rain-days. | ||||
| Maximum and Month. | Minimum and Month. | Absolute Max. | Absolute Min. | |||||||
| Te Paki, Te Hapua | 64.5 | 51.4 | 57.9 | 77.5 Feb. | 33.0 July | 80.0 | 27.0 | 2,136.4 | 54.67 | 147 |
| Auckland | 63.7 | 52.6 | 58.1 | 78.5 Feb. | 36.2 June | 90.4 | 33.2 | 2,167.1 | 45.64 | 190 |
| Tauranga | 65.2 | 47.2 | 56.2 | 85.4 Dec. | 27.7 June | 90.7 | 22.5 | 2,470.9 | 47.96 | 149 |
| Hamilton East | 63.9 | 45.1 | 54.5 | 81.2 Jan. | 14.2 June | 94.4 | 14.2 | 2,126.4 | 47.75 | 164 |
| Rotorua | 63.6 | 45.4 | 54.5 | 86.0 Jan. | 26.7 June | 98.0 | 21.3 | 2,212.4 | 57.27 | 147 |
| Gisborne | 66.1 | 46.9 | 56.5 | 88.3 Jan. | 28.8 June | 95.8 | 26.0 | 2,385.7 | 28.22 | 138 |
| Onepoto, Lake Waikaremoana | 44.5 | 82.7 Dec. | 27.6 Sept. | 88.0 | 27.1 | 54.90 | 172 | |||
| New Plymouth | 61.0 | 48.9 | 55.0 | 79.8 Jan. | 30.0 July | 89.0 | 27.0 | 2,092.9 | 69.16 | 156 |
| Napier | 65.2 | 47.8 | 56.5 | 86.9 Feb. | 28.3 July | 96.5 | 27.5 | 2,418.8 | 22.47 | 114 |
| Taihape | 57.4 | 42.8 | 50.1 | 78.8 Jan. | 25.2 July | 87.8 | 20.4 | 39.92 | 184 | |
| Wanganui | 62.1 | 48.5 | 55.3 | 81.6 Feb. | 29.0 July | 88.0 | 28.8 | 2,078.4 | 35.69 | 161 |
| Plant Research Bureau, Palmerston North | 61.3 | 46.1 | 53.7 | 83.1 Jan. | 27.0 June | 87.0 | 21.2 | 1,790.2 | 41.77 | 181 |
| Masterton | 63.3 | 42.2 | 52.8 | 87.2 Jan. | 24.0 June | 95.4 | 20.0 | 2,034.3 | 35.19 | 116 |
| Wellington | 59.2 | 47.6 | 53.4 | 82.0 Jan. | 32.2 July | 88.0 | 28.6 | 1,975.8 | 48.22 | 161 |
| Nelson | 62.4 | 45.6 | 54.0 | 81.1 Jan. | 27.9 May | 92.0 | 25.0 | 2,334.1 | 43.95 | 122 |
| Blenheim | 63.8 | 42.2 | 53.0 | 89.0 Jan. | 18.9 June | 94.6 | 16.1 | 2,386.4 | 26.66 | 120 |
| Hanmer Springs | 59.2 | 39.8 | 49.0 | 86.3 Jan. | 10.0 July | 97.0 | 8.2 | 1,881.7 | 60.45 | 146 |
| Hokitika | 59.1 | 45.2 | 52.2 | 77.0 Jan. | 28.5 July | 84.5 | 25.0 | 1,654.1 | 125.08 | 211 |
| Lake Coleridge | 58.8 | 39.8 | 49.3 | 85.0 Jan. | 10.0 July | 92.0 | 10.0 | 41.72 | 144 | |
| Christchurch | 60.3 | 43.4 | 51.8 | 87.2 Nov. | 19.3 July | 95.7 | 19.3 | 2,012.5 | 37.75 | 133 |
| Timaru | 60.2 | 41.4 | 50.8 | 90.2 Feb. | 22.6 July | 99.0 | 19.8 | 1,949.2 | 34.25 | 118 |
| Milford Sound | 56.7 | 42.0 | 49.3 | 79.3 Jan. | 27.0 June | 79.3 | 23.1 | 265.78 | 219 | |
| Queenstown | 57.7 | 40.2 | 48.9 | 83.4 Jan. | 23.6 July | 90.2 | 19.2 | 1,940.8 | 38.80 | 142 |
| Alexandra | 59.7 | 39.7 | 49.7 | 87.8 Jan. | 17.0 July | 91.5 | 11.0 | 1,980.5 | 19.53 | 129 |
| Dunedin | 55.6 | 42.6 | 49.1 | 85.0 Feb. | 28.9 July | 94.0 | 23.0 | 1,603.6 | 46.77 | 191 |
| Invercargill | 57.1 | 42.0 | 49.0 | 83.0 Jan. | 23.0 July | 90.0 | 19.0 | 1,608.5 | 45.80 | 215 |
For 1945 the mean sea-level pressure values in millibars at 09.30 hrs., New Zealand civil time, were: Auckland, 1016.1; Wellington, 1013.4; Nelson, 1013.2; Hokitika, 1013.9; Christchurch, 1011.3; and Dunedin, 1010.5.
1946.—The early part of the year was sunny and dry, with drought conditions in the Auckland and Hawkes Bay districts. The country recovered well following good autumn rains and a mild winter. July was particularly mild, and spring growth got away to a good start. Persistently cold and unsettled weather soon caused the season to become very backward, and by the end of the year farming activities were well behind schedule.
For the greater part of the country the annual rainfall was fairly close to the normal. Over the Auckland Peninsula it was a wet year, especially in the eastern portion, where some places had an excess of 50 per cent. Moderate excesses occurred in northern Wairarapa and the Canterbury Plains. In parts of Hawkes Bay, Marlborough, and Central Otago there was a moderate deficiency. Over the year mean temperatures were slightly above average in the North Island, except in the Wairarapa. In the latter district, and in the South Island there were small negative departures. Sunshine over the North Island was better than average except in portions of the Bay of Plenty, Taranaki, and Wairarapa districts. Invercargill, Blenheim, and Westport also enjoyed a little more sunshine than usual, but over the remainder of the South Island totals were deficient.
Seasonal Notes.—During January and February the weather was sunny and dry, except in the South. Rainfall in Hawkes Bay and Auckland was negligible in amount, and dairy-production suffered severely. In these areas the five-monthly period from October, 1945, was the driest for over thirty years. Scrub and forest fires were widespread over the North Island. Beneficial rains fell over the drier areas in the middle of March and were followed by substantial rainfall in April. Pastures and supplementary crops recovered well after the summer drought.
Over the North Island the next month was the mildest of any May since 1928. Winds from an easterly quarter predominated during May and June and rain was frequent in eastern districts, especially in Auckland and Hawkes Bay. Following very heavy rains in the north during the first week of July, the easterly type of situation which had dominated the weather for several weeks gave way to the westerly type. It was the mildest July since 1917. Windy westerly weather continued in August, when many places in the west and north had rain every day. Changeable weather during September further delayed agricultural activities. A wintry spell late in the month caused serious losses among young lambs in Otago and Canterbury. Orchards also suffered some damage. Growth war, slow during the cool changeable weather of October. Temperatures were even colder in November, which was the coldest on record. Fruit and vegetable crops suffered because of frosts and hail. December weather was dull and cool, and the season remained very backward.
Summary of Meteorological Observations.—The observations from which the following summary was compiled for the year 1946 were taken at 09.30 hrs., New Zealand standard time.
| — | Temperatures in Shade, Degrees Fahrenheit. | Hours of Bright Sunshine. | Rainfall. | |||||||
|---|---|---|---|---|---|---|---|---|---|---|
| Mean Daily Maximum. | Mean Daily Minimum. | Approx, Mean Temperature. | Extremes for 1946. | Extremes. | Total Fall (Inches) | Number of Rain-days. | ||||
| Maximum and Month. | Minimum and Month. | Absolute Max. | Absolute Min. | |||||||
| Te Paki, Te Hapua | 64.7 | 52.7 | 58.7 | 76.0 Jan. | 32.0 June | 80.0 | 27.0 | 2,176.4 | 73.89 | 174 |
| Auckland | 65.3 | 53.8 | 59.5 | 82.6 Feb. | 39.5 June | 90.4 | 33.2 | 2,118.5 | 56.48 | 217 |
| Tauranga | 66.1 | 49.1 | 57.6 | 91.9 Jan. | 31.2 June | 91.9 | 22.5 | 2,362.1 | 59.68 | 173 |
| Hamilton East | 65.0 | 47.2 | 56.1 | 85.6 Feb. | 25.3 June | 94.4 | 14.2 | 2,053.8 | 50.75 | 206 |
| Rotorua | 64.7 | 46.4 | 55.6 | 92.9 Jan. | 28.0 June | 98.0 | 21.3 | 2,103.2 | 57.45 | 169 |
| Gisborne | 66.9 | 47.6 | 57.3 | 95.8 Feb. | 30.4 June | 95.8 | 26.0 | 2,302.5 | 34.84 | 152 |
| Onepoto, Lake Waikaremoana | 58.7 | 44.9 | 51.8 | 87.4 Feb. | 30.0 Oct. | 88.0 | 27.1 | 68.47 | 178 | |
| New Plymouth | 61.3 | 49.8 | 55.5 | 74.2 Feb. | 35.2 Sept. | 89.0 | 27.0 | 2,127.2 | 72.99 | 208 |
| Napier | 65.7 | 49.2 | 57.5 | 95.0 Feb. | 29.4 June | 96.5 | 27.5 | 2.4185 | 30.04 | 129 |
| Taihape | 58.4 | 43.3 | 50.8 | 87.8 Feb. | 27.8 June | 87.8 | 20.4 | 38.28 | 197 | |
| Wanganui | 62.6 | 48.6 | 55.6 | 84.5 Mar. | 29.7 June | 88.0 | 28.8 | 2,247.6 | 34.44 | 172 |
| Plant Research Bureau, Palmerston North | 61.8 | 47.2 | 54.5 | 80.6 Mar. | 27.5 June | 87.0 | 21.2 | 1,911.2 | 47.17 | 195 |
| Masterton | 64.1 | 42.4 | 53.2 | 95.1 Feb. | 19.5 June | 95.4 | 19.5 | 1,972.4 | 44.36 | 144 |
| Wellington | 60.0 | 48.0 | 54.0 | 78.9 Feb. | 34.8 June | 88.0 | 28.6 | 2,112.6 | 48.58 | 169 |
| Nelson | 63.0 | 45.9 | 54.4 | 82.6 Feb. | 29.5 June | 92.0 | 25.0 | 2,464.6 | 33.58 | 123 |
| Blenheim | 64.1 | 42.8 | 53.4 | 91.0 Feb. | 21.7 June | 94.6 | 16.1 | 2,356.1 | 21.62 | 120 |
| Hanmer Springs | 59.9 | 39.1 | 49.5 | 93.0 Feb. | 11.3 June | 97.0 | 8.2 | 1,904.4 | 41.57 | 137 |
| Hokitika | 58.4 | 43.6 | 51.0 | 69.7 Feb. | 27.5 June | 84.5 | 25.0 | 1,870.8 | 120.29 | 214 |
| Lake Coleridge | 59.4 | 40.0 | 49.7 | 91.3 Feb. | 18.6 July | 92.0 | 10.0 | 35.16 | 137 | |
| Christchurch | 60.7 | 43.1 | 51.9 | 92.3 Feb. | 22.9 June | 95.7 | 19.3 | 1,932.0 | 38.06 | 146 |
| Timaru | 60.7 | 41.8 | 51.2 | 91.6 Feb. | 21.6 July | 99.0 | 19.8 | 1,909.1 | 31.29 | 133 |
| Milford Sound | 56.6 | 42.2 | 49.4 | 72.6 Mar. | 26.8 July | 79.3 | 23.1 | 285.56 | 207 | |
| Queenstown | 57.9 | 40.2 | 49.0 | 81.8 Jan. | 22.6 July | 90.2 | 19.2 | 1,911.9 | 36.37 | 145 |
| Alexandra | 60.0 | 39.1 | 49.6 | 90.9 Feb. | 16.2 July | 91.5 | 11.0 | 2,091.3 | 11.91 | 113 |
| Dunedin | 55.9 | 42.7 | 49.3 | 88.9 Feb. | 30.3 Oct. | 94.0 | 23.0 | 1,671.7 | 38.82 | 195 |
| Invercargill | 57.1 | 40.2 | 48.7 | 84.5 Jan. | 19.0 July | 90.0 | 19.0 | 1,724.7 | 49.98 | 216 |
For 1946 the mean sea-level pressure values in millibars at 09.30 hrs., New Zealand standard time, were: Auckland, 1014.3; Wellington, 1011.5; Nelson, 1011.5; Hokitika, 1011.8; Christchurch, 1009.7; and Dunedin, 1008.9.
1947.—For a start the season was very backward, but favourable weather throughout the summer and autumn allowed this leeway to be made good. Two violent southerly storms affected southern districts of the North Island, the first in February and the second in June. After a very wet June, the spell of mild dry weather which followed provided ideal conditions for farming. Lambing percentages and milk-yields were very good. A long spell of warm settled weather followed a dull, wet October, and pastures were rapidly drying up towards the end of the year.
Over the greater part of the South Island the annual rainfall was about 20 per cent. below normal. Eastern Marlborough, South Canterbury, and the Waimea Valley (Nelson) had a slight excess. The distribution in the North Island was rather irregular, although the departures from normal were not great. In general, the districts with deficient rainfall were in South Auckland and from Taranaki across to Hawkes Bay. Over the year mean temperatures were near or slightly above normal, the departure amounting to 1° F. on the West Coast. Most places had more sunshine than usual, particularly in Westland and Manawatu. Napier's total was the equivalent of half an hour a day below normal, while small negative departures occurred in New Plymouth, Nelson, Gore, and from Auckland to Tauranga.
Seasonal Notes.—January's weather was cool and unsettled for a start, while crops and glasshouses in South Canterbury suffered considerable damage from hail on the 4th. It became more settled later in the month, enabling farmers to make some progress with their delayed shearing and harvesting. A violent southerly storm in mid-February caused considerable damage in the southern part of the North Island. Hawkes Bay orchards suffered badly, and there were stock losses due to floods and exposure in the Wairarapa. With the above exception, the weather in February and March was predominantly fine, and a number of new sunshine records were established. Favourable weather continued during the remainder of the autumn.
Conditions were very disturbed in June. In parts of the Wellington district it was the wettest month in the last fifty years. Towards the end of the month the southern part of the North Island experienced another severe southerly storm, and stock losses were heavy in South Wairarapa. During July it was wet in the far north, but very dry in the South Island. Mild sunny weather during the next two months was very beneficial for stock and for early spring growth. Substantial rainfall in October provided a good reserve of moisture to offset the effect of the warm, dry weather in November and December. Nevertheless, towards the end of the year pastures were rapidly drying up, and milk-production was on the decline.
Summary of Meteorological Observations.—The observations from winch the following summary was made for the year 1947 were taken at 09.30 hrs. New Zealand standard time.
| — | Temperatures in Shade, Degrees Fahrenheit. | Hours of Bright Sunshine. | Rainfall. | |||||||
|---|---|---|---|---|---|---|---|---|---|---|
| Mean Daily Maximum. | Mean Daily Minimum. | Approx, Mean Temperature. | Extremes for 1947. | Extremes. | Total Fall (Inches) | Number of Rain-days. | ||||
| Maximum and Month. | Minimum and Month. | Absolute Max. | Absolute Min. | |||||||
| Te Paki, Te Hapua | 45.8 | 51.6 | 58.7 | 76.7 Dec. | 32.1 Aug. | 80.0 | 27.0 | 2,165.4 | 54.44 | 195 |
| Auckland | 65.0 | 53.2 | 59.1 | 80.4 Dec. | 39.0 Aug. | 90.4 | 33.2 | 2,055.1 | 52.74 | 163 |
| Tauranga | 48.5 | 83.7 Jan. | 27.3 Aug. | 91.9 | 22.5 | 2,362.9 | 49.92 | 168 | ||
| Hamilton East | 65.1 | 44.8 | 54.9 | 83.2 Feb. | 22.3 Aug. | 94.4 | 14.2 | 2,089.8 | 41.22 | 162 |
| Rotorua | 63.8 | 45.1 | 54.5 | 86.0 Feb. | 25.0 Aug. | 98.0 | 21.3 | 2,143.9 | 47.47 | 129 |
| Gisborne | 65.8 | 47.3 | 56.6 | 88.5 Jan. | 28.7 July | 95.8 | 26.0 | 2,277.5 | 36.91 | 150 |
| Onepoto, Lake Waikaremoana | 58.8 | 44.6 | 51.7 | 84.6 Feb. | 29.8 Aug. | 88.0 | 27.1 | 83.43 | 190 | |
| New Plymouth | 62.0 | 49.3 | 55.7 | 81.6 Feb. | 33.2 Aug. | 89.0 | 27.0 | 2,217.5 | 59.04 | 142 |
| Napier | 64.3 | 48.8 | 56.5 | 89.9 Jan. | 28.0 Aug. | 96.5 | 27.5 | 2,235.0 | 28.98 | 124 |
| Taihape | 58.8 | 43.3 | 51.0 | 79.0 Jan. | 26.2 Aug. | 87.8 | 20.4 | 37.81 | 151 | |
| Wanganui | 48.2 | 83.0 Feb. | 30.2 July | 88.0 | 28.8 | 2,288.8 | 35.27 | 137 | ||
| Plant Research Bureau, Palmerston North | 62.8 | 46.4 | 54.6 | 81.2 Feb. | 27.1 Aug. | 87.0 | 21.2 | 2,001.7 | 39.29 | 156 |
| Masterton | 63.6 | 43.3 | 53.5 | 87.0 Jan. | 22.4 Aug. | 95.4 | 19.5 | 2,128.0 | 41.64 | 135 |
| Wellington | 60.4 | 48.2 | 54.3 | 82.2 Feb. | 32.3 July | 88.0 | 28.6 | 2,077.2 | 51.70 | 150 |
| Nelson | 63.2 | 46.6 | 54.9 | 83.9 Jan. | 29.6 Aug. | 92.0 | 25.0 | 2,470.6 | 41.15 | 104 |
| Hanmer Springs | 61.4 | 38.6 | 50.0 | 88.2 Jan. | 15.0 July | 97.0 | 8.2 | 2,009.7 | 42.83 | 124 |
| Hokitika | 59.6 | 44.6 | 52.1 | 73.2 Mar. | 25.4 June | 84.5 | 25.0 | 1,898.4 | 85.78 | 189 |
| Lake Coleridge | 61.0 | 40.7 | 50.8 | 85.8 Jan. | 18.0 July | 92.0 | 10.0 | 30.35 | 125 | |
| Christchurch | 60.9 | 44.3 | 52.6 | 87.7 Dec. | 23.8 July | 95.7 | 19.3 | 2,048.4 | 25.12 | 111 |
| Timaru | 61.2 | 42.5 | 51.8 | 83.4 Dec. | 24.0 July | 99.0 | 19.8 | 1,910.0 | 24.44 | 111 |
| Milford Sound | 58.3 | 43.7 | 51.0 | 75.2 Jan. | 26.3 July | 79.3 | 23.1 | 206.56 | 187 | |
| Queenstown | 60.5 | 41.3 | 50.9 | 86.6 Jan. | 21.4 July | 90.2 | 19.2 | 2,011.5 | 24.88 | 117 |
| Alexandra | 62.5 | 40.0 | 51.2 | 89.5 Jan. | 19.5 July | 91.5 | 11.0 | 2,132.4 | 10.21 | 91 |
| Dunedin | 58.8 | 43.6 | 51.2 | 87.5 Dec. | 27.0 July | 94.0 | 23.0 | 1,733.6 | 26.02 | 144 |
| Invercargill | 59.1 | 41.3 | 50.2 | 83.5 Jan. | 20.0 July | 90.0 | 19.0 | 1,715.5 | 32.70 | 207 |
For 1947 the mean sea-level pressure values in millibars at 09.30 hrs. New Zealand standard time were: Auckland, 1017.0; Wellington, 1015.1; Nelson, 1014.9; Hokitika, 1015.4; Christchurch, 1013.6; and Dunedin, 1014.1.
PLANTS OF NEW ZEALAND.—Those desiring information on the flora and plant covering of New Zealand are referred to the article by Dr. W. R. B. Oliver, D.Sc., F.R.S.N.Z., which appeared in the 1940 and previous issues of the Year-Book, while a brief reference to the geographical distribution of the forest trees is made in the section of this Year-Book dealing with Forestry (Section 19). For more detailed information the following works may also be consulted: “Plants of New Zealand,” by R. M. Laing and E. W. Blackwell, ed. 4, 1940; “Manual of the New Zealand Flora,” by T. F. Cheeseman, ed. 2, 1925; “The Trees of New Zealand,” by L. Cockayne and E. Phillips-Turner, 1928; “The Forest Flora of New Zealand,” by T. Kirk, 1889; “New Zealand Trees and Shrubs and how to Identify Them,” by H. H. Allan, 1928; “New Zealand Ferns,” by H. B. Dobbie, ed. 3, 1931; “New Zealand Plants and their Story,” by L. Cockayne, ed. 3, 1927; “The Vegetation of New Zealand,” by L. Cockayne, ed. 2, 1928; “The Cultivation of New Zealand Plants,” by L. Cockayne, 1923; “The New Zealand Nature Book,” Vol. 2, by W. Martin, ed., 2, 1944; “The Botanical Names of the Flora of New Zealand,” by A. Wall and H. H. Allan; and numerous articles published in the Transactions of the Royal Society of New Zealand.
FAUNA.—A brief article on the fauna of New Zealand, originally prepared by the late Mr. James Drummond, F.L.S., F.Z.S., and revised by him in 1935, is contained in the 1940 and earlier editions of the Year-Book.
EXECUTIVE COUNCIL.—The powers, duties, and responsibilities of the Governor-General and the Executive Council under the present system of responsible government are set out in Royal Letters Patent and Instructions thereunder of 11th May, 1917, published in the New Zealand Gazette of 24th April, 1919 (p. 1213). In the execution of the powers and authorities vested in him the Governor-General must be guided by the advice of the Executive Council; but, if in any case he sees sufficient cause to dissent from the opinion of the Council, he may act in the exercise of his powers and authorities in opposition to the opinion of the Council, reporting the matter to His Majesty without delay, with the reasons for his so acting.
In any such case any member of the Executive Council may require that there be recorded in the minutes of the Council the grounds of any advice or opinion that he may give upon the question.
At present (February, 1949) the Executive Council consists of fourteen members in addition to the Governor-General and one member of the Legislative Council without a portfolio. Two members, exclusive of His Excellency or the presiding member, constitute a quorum.
Under the Civil List Act, 1920, as amended by the Finance Act, 1946, His Excellency the Governor-General receives an honorarium of £5,000 per annum, an allowance of £4,500 per annum for the salaries and expenses of his establishment (exclusive of the Official Secretary), and an allowance of £500 per annum for travelling-expenses.
The Civil List Act fixed the number of paid Ministers (exclusive of the Prime Minister) at ten, but an amendment in 1936 increased the number to eleven, with a proviso that the total amount paid in any one year was not to exceed the aggregate amount specified in the principal Act. Part V of the Finance Act (No. 3), 1944, further increased the number of Ministers of the Crown (other than the Prime Minister) who may be paid to twelve, and also abolished the provision regarding the aggregate payment. The Prime Minister's salary is now at the rate of £1,800 per annum and that of each other Minister £1,170 per annum, in addition to which Ministers who do not occupy a Ministerial residence receive an allowance in lieu thereof at the rate of £200 per annum.
Authority is also given in the Civil List Act for the appointment of either one or two Maoris or half-castes as members of the Executive Council representing the Maori race. One such appointment is at present extant, the salary attaching thereto being £990 per annum, plus house allowance of £200 per annum.
The Civil List Amendment Act, 1936, made provision for the appointment of Parliamentary Under-Secretaries, an innovation in executive control in New Zealand. The rate of salary attachable to such a position, formerly £600, was increased to £800 by Part V of the Finance Act (No. 3), 1944, plus house allowance of £200 per annum. At the present time (February, 1949) four such appointments are current.
The present Government, shortly after assuming office, instituted a scheme whereby the services of all parliamentary representatives of the Government party might be co-opted to assist Ministers in bringing the Government's policy into effect. As part of this plan, Ministers shared a portion of their authorized salaries with other Government parliamentary representatives.
LEGISLATIVE COUNCIL.—The Imperial Act under which the earliest appointments were made to the Legislative Council under a system of responsible government provided that the first appointees should be not less than ten in number. The number actually summoned for the first session (held at Auckland from 24th May, 1854) was sixteen, of whom only fourteen attended. The number increased irregularly for thirty years. In 1885 and 1886 it stood at fifty-three, but has not since reached that limit. The number of members at present (February, 1949) is thirty-four.
An Act of the Imperial Parliament in 1868 provided that future appointments of Councillors should be made by the Governor (not by the Sovereign). Until 1891 members were appointed for life, but since that year appointments have been made for seven years only, members, however, being eligible for reappointment. Prior to 1891 the Speaker was appointed by the Governor, but the Council now elects its own Speaker, who holds office for five years. The Chairman of Committees was formerly elected every session, but in 1928 the standing orders were amended to provide for a three years' term of office. Speaker and Chairman are both eligible for re-election.
Provision for an elective Legislative Council is contained in the Legislative Council Act, 1914, which may be brought into operation at a date to be specified by Proclamation.
The qualifications for membership of the Legislative Council are the same as for the House of Representatives (see post), with the proviso that a person may not at the same time be a member of both Houses. Prior to 1941 women were not eligible for appointment to the Legislative Council, but this restriction was removed by section 40 of the Statutes Amendment Act, 1941. There were no women appointees until February, 1946, when two were included in a list of four new members.
Before the year 1892 the honorarium of Councillors was understood to be for the session, not for the year, and formed the subject of a special vote every session, the amount varying in different sessions. By the Payment of Members Act, 1892, the honorarium was made annual, not sessional, and was fixed at £150 a year. There have been several alterations since that date and the rate, prior to the passing of the Finance Act (No. 3), 1944, had for several years been £315 per annum. The Act in question raised the honorarium to £375. This Act also increased the honorarium of the Speaker from £720 to £800, and that of the Chairman of Committees from £450 to £500 per annum. The Speaker also receives free sessional quarters. Besides the honorarium, members receive certain privileges in respect of railway and other forms of travel, &c.
Subject to certain exemptions, members not attending the Council are liable to be fined.
HOUSE OF REPRESENTATIVES.—The number of members constituting the House of Representatives is eighty—seventy-six Europeans and four Maoris. They are designated “Members of Parliament.” The number was originally fixed by the Constitution Act as not more than forty-two and not less than twenty-four, and the first Parliament called together in 1854 consisted of forty members. Legislation passed in 1858 fixed the number of European members at forty-one; in 1860, at fifty-three; in 1862, at fifty-seven; in 1865, at seventy; in 1867, at seventy-two; in 1870, at seventy-four; in 1875, at eighty-four; in 1881, at ninety-one; in 1887, at seventy; and in 1900, at seventy-six. By the Maori Representation Act, 1867, which is still in force, as embodied in the Electoral Act, 1927, four Maori members were added, three for the North Island and one for the South.
The basis upon which New Zealand is divided anew into seventy-six European electorates after each population census was substantially altered by the Electoral Amendment Act, 1945. Prior to the passing of this Act the allocation of electorates was according to the distribution of the total population. An addition was also made to the rural populations, so that the number of rural electorates, in proportion to their population, was higher than urban electorates. The “country quota,” as this allowance was called, was computed on the basis that 28 per cent. was added to the rural population, which for electoral purposes meant population other than that contained in a city or borough of over two thousand inhabitants or in any area within five miles of the chief post-offices at Auckland, Wellington, Christchurch, or Dunedin. The “country quota” first appeared in 1881, to the equivalent of an addition of 33⅓ per cent., to the country population. It was reduced in 1887 to 18 per cent., but was increased in 1889 to 28 per cent.
The 1945 amendment abolished this “country quota” and, in addition, changed the basis on which the electorates were allocated from the distribution of the total population to that of the “adult” population. The definition of the “adult” population, according to the Act, excludes Maoris, persons under twenty-one years of age and persons detained in mental institutions or prisons. Persons detained as military defaulters in detention camps were also excluded. Provision is made for an allowance by way of addition or subtraction of adult population not exceeding five hundred where districts containing the exact quota cannot be formed consistently with considerations of topography, communications, community of interest, and (except in making the first division under the 1945 Act) existing boundaries of electoral districts.
The Representation Commission constituted by the Electoral Amendment Act, 1945, determined the adult population for electoral purposes as at the 25th September, 1945, to be 1,069,149, of whom 700,477 were resident in the North Island and 368,672 in the South Island. These figures include allowances made on account of members of the Armed Forces both in New Zealand and overseas, in addition to the civilian figures disclosed by the population census of the 25th September, 1945. On this basis the North Island became entitled to 50 electoral districts and the South Island to 26, as compared with 48 and 28 previously.
Quinquennial Parliaments, instituted under the Constitution Act, were abolished by the Triennial Parliaments Act, 1879, which fixed the term at three years. General elections have been hold at three-yearly intervals since 1881, with a few exceptions. The term of the nineteenth Parliament was during the 1914–18 War extended to five years by special legislation, and that of the twenty-fourth (1931–35) and subsequent Parliaments to four years under the Electoral Amendment Act, 1934. By the Electoral Amendment Act, 1937, the three-year term was restored, but on account of war conditions the term of the twenty-sixth Parliament was extended to four years by the Prolongation of Parliament Act, 1941. The Prolongation of Parliament Act, 1942, extended the term still further to one year from the termination of the war, but with a proviso for a motion to he moved in the House of Representatives each year after the year 1942 either approving the continuation of the House or fixing an earlier date for its expiry. During the 1943 session a motion in favour of dissolution was carried, and Parliament was dissolved on 30th August, 1943.
Under the Electoral Act, 1927, every registered elector of either sex, but no other person, is qualified to be a parliamentary candidate. It is provided, however, that a person shall not be so elected who is disqualified as an elector under any of the provisions of the Act (see under “Franchise” post); or is a undischarged bankrupt; or is a member of the Legislative Council; or is a contractor to the public service of Now Zealand to whom any public money above the sum of £50 is payable, directly or indirectly (but not as a member of a registered company or incorporated body), in any one financial year. Though women's suffrage has been operative since 1893, women were not eligible as parliamentary candidates until the passing of the Women's Parliamentary Rights Act, 1919, the provisions of which are now embodied in the Electoral Act, 1927. Under the Electoral Act public servants were prohibited from being elected, but this prohibition was removed by the Political Disabilities Removal Act, 1936, which provided that if elected they immediately cease to be public servants.
The honorarium paid to members of the House of Representatives is £500 per annum. They are also paid an allowance at the rate of £250 per annum for expenses incurred in connection with parliamentary duties. Payment to members is subject to certain deductions for absence not duo to sickness or other unavoidable cause. In addition to the honorarium, members are entitled to certain privileges in respect of railway and other forms of travel, &c.
Part V of the Superannuation Act, 1947, introduced a contributory superannuation scheme for members of the House of Representatives, which provided a minimum retiring-allowance of £250 per annum for a member with nine years' service, the allowance increasing by £25 per annum for every year's service in excess of that period until a maximum allowance of £400 per annum is reached after fifteen years' service.
A member must be fifty years of age before he qualifies, on ceasing to be a member, to receive the allowance. The annual deduction, which is compulsory, is £50 per annum, but a member may, if he so desires, receive a refund of his contributions upon ceasing to be a member.
In the case of a male member dying and leaving a widow surviving, she becomes entitled during her widowhood to receive an annuity of two-thirds of the retiring-allowance to which her husband was entitled at the time of his death.
The election of a Speaker is the first business of a new House after the members have been sworn. A Chairman of Committees is elected as soon afterwards as is convenient. Both Speaker and Chairman of Committees hold office until a dissolution, and receive payment until the first meeting of a new Parliament. The Speaker's remuneration is £1,000 per annum, in addition to which he receives a sessional allowance of £100 and free sessional quarters. The honorarium of the Chairman of Committees is £750, and an allowance of £150 per annum to cover expenses incurred in connection with his parliamentary and official duties is also paid.
Twenty members, inclusive of the Speaker, constitute a quorum.
FRANCHISE.—Since the abolition of plural voting in 1889 and the introduction of women's suffrage in 1893 every person twenty-one years of age or over has had the right to exercise a vote in the election of members for the House of Representatives. To be registered as an elector a person must have resided for one year in New Zealand, and for three months in the electoral district for which he claims to vote. A system of compulsory registration of electors was introduced at the end of 1924, but for Maori electors a Proclamation was necessary before registration became operative. The Electoral Amendment Act, 1948, however, provides for the preparation of rolls for Maori electoral districts, which, subject to and after notification in the Gazette that these rolls have been formed, shall be for all purposes the electoral rolls of the districts concerned.
There are, of course, slight exceptions to the foregoing, for, if a person is classified as one of the following, he or she is not entitled to register as an elector or to vote:—
An alien:
A mentally defective person:
A person convicted of an offence punishable by death or by imprisonment for one year or upwards within any part of His Majesty's dominions, or convicted in New Zealand as a public defaulter, or under the Police Offences Act, 1927, as an idle and disorderly person or as a rogue and vagabond, unless such offender has received a free pardon, or has undergone the sentence or punishment to which he was adjudged for such offence.
The Electoral Emergency Regulations 1943 prescribed the following additional classes of persons who were not entitled to be registered as electors or to vote:—
A person who has been committed to military defaulters' detention and has not been discharged therefrom:
A person who has been taken into custody under the Aliens Emergency Regulations 1940 and has not been released therefrom.
Maoris are qualified to vote only at elections of the four members representing the Maori race. A Maori half-caste is entitled to be registered either as an elector of a Maori or a European electoral district, while special provisions govern any changeover of registration.
By the Electoral Amendment Act, 1937, which made provision for a secret ballot in Maori elections, Maori electors were granted the same privileges, in the exercise of their vote, as European electors.
For the system of local-government administration a modified form of franchise exists, a ratepaying qualification being necessary for the exercising of votes on financial issues. Further reference to this aspect of franchise will be found in Section 26 of this Year-Book.
POPULATION censuses were taken as for the night of Tuesday, 25th September, 1945, in New Zealand and in all its island territories. The Administration of the Trust Territory of Western Samoa conducted the census for its own territory and also for Tokelau (Union Islands); otherwise, the work was carried out by, or on behalf of, the Census and Statistics Department.
The outlying islands (vide page 1) other than Campbell Island were uninhabited at the date of the census, as was also the Ross Dependency, situated in Antarctic regions.
The 1945 census population of New Zealand proper was 1,702,298, inclusive of 98,744 Maoris. These figures do not take into account 45,381 members of the New Zealand Armed Forces overseas at the census date; 44,081 of these were Europeans, the remaining 1,300 being Maoris. At the same date there were 9 people on Campbell Island and 23 in the Kermadec Islands. The population of Cook Islands and Nine Island was 18,341, the latter island contributing 4,253 to this total. Tokelau Islands recorded a census total of 1,388, while 68,197 persons were enumerated in the Trust Territory of Western Samoa. If members of the Armed Forces overseas are excluded, the grand total of population in New Zealand and in all its island territories was 1,790,256 at the census date.
Further 1945 census figures will be found later in this Section, or in other portions of the volume, but for details it will be necessary to refer to the census volumes published separately. The summary below gives figures more recent than those of the census.
| — | Date. | Males. | Females. | Totals. |
|---|---|---|---|---|
| New Zealand proper (exclusive of Maoris) | 1st April, 1948 | 863,279 | 861,988 | 1,725,267 |
| Maoris | 1st April, 1948 | 56,000 | 53,003 | 109,003 |
| Totals, New Zealand proper | 1st April, 1948 | 919,279 | 914,991 | 1,834,270 |
| Kermadec Islands | 1st April, 1948 | 28 | 28 | |
| Campbell Island | 1st April, 1948 | 5 | 5 | |
| Cook Islands and Niue | 1st April, 1948 | 9,421 | 9,353 | 18,774 |
| Tokelau Islands | December, 1947 | 671 | 745 | 1,416 |
| Trust Territory of Western Samoa | 1st April, 1948 | 37,584 | 35,352 | 72,936 |
| Totals | 966,988 | 960,441 | 1,927,429 |
Kermadec Islands.—These islands were annexed to New Zealand in 1877 and have had quite a colourful history. They have been occupied intermittently for varying periods from about 1837. This phase may be said to have ended with the repatriation to New Zealand in 1914 of a family which had resided there for many years. Recent settlement, apart from an attempted settlement lasting only a few months from November, 1926, began in July, 1935, while the inhabitation of the principal island (Sunday) has been probably made more permanent by the establishment of an aeradio and meteorological station. Population figures for later years are now given.
| As at 1st April, | Population. |
|---|---|
| 1936 | 2 |
| 1937 | 7 |
| 1938 | 6 |
| 1939 | 5 |
| 1940 | 20 |
| 1941 | 14 |
| 1942 | 9 |
| 1943 | 18 |
| 1944 | 20 |
| 1945(census) | 23 |
| 1946 | 21 |
| 1947 | 19 |
| 1948 | 28 |
Campbell Island and Auckland Islands.—Until 1941 these islands were not regularly inhabited, but with the provision of a meteorological station on Campbell Island it is probable that it will be permanently occupied. A review of population present on both the Campbell and Auckland Islands in recent years is given below.
| As at 1st April, | Campbell Island. | Auckland Islands. |
|---|---|---|
| 1941 | 5 | 8 |
| 1942 | 5 | 13 |
| 1943 | 5 | 12 |
| 1944 | 5 | 14 |
| 1945 | 5 | 8 |
| 1946 | 5 | Nil |
| 1947 | 8 | Nil |
| 1948 | 5 | Nil |
METHOD OF COMPILATION.—In common with almost all countries, the chief instrument in compiling population data in New Zealand is the census, which in this country in normal times is taken quinquennially. The minutiae of the distribution of population, together with analyses of various population characteristics, compiled from census data will be found in the official publications compiled after each census.
The basis adopted for the census, and virtually throughout population statistics in New Zealand, is that of the population present, which may be defined as the population present at the place of enumeration at the time of the enumeration.
Intercensal figures of total population are based on the customary equation:—
Population = Population (census) + Births and immigration - Deaths and emigration.
The first interruption in the sequence of New Zealand censuses was caused by the abandonment, for reasons of financial stringency resulting from the world-wide economic depression, of the census proclaimed for 21st April, 1931. Owing to the outbreak of war and its subsequent effect on population no census was taken in 1941, the necessary legislative sanction being provided by section 36 of the Finance Act, 1940. The section authorized the census due in 1941 to be taken in any year not earlier than 1941 nor later than 1945. As this census was taken on 25th September, 1945, authority was granted for the abandonment of the census which was due in 1946. Under the existing legislation, the next census is duo to be taken in 1951.
The comparative shortness of the interval between the census enumerations in normal times, combined with New Zealand's insular position and the completeness of her registration system, prevents serious intercensal errors in statements of the total population of New Zealand.
The distance of New Zealand from other countries, combined with the fact that overseas migration centres in a few ports or air-ports, facilitates the compilation of accurate statistics of external migration.
Population figures since 1939 are exclusive of New Zealand soldiers, &c., overseas, and of members of forces of overseas countries who were in New Zealand.
Residents of the Cook Islands, Niue, Western Samoa, and the Tokelau Islands are not included in the population statistics quoted throughout this Section, except in the first table on page 19. Separate statistics of the Maori population are given towards the end of this Section.
INCREASE OF POPULATION.—The outstanding note of the history of population movement in New Zealand is that of unbroken growth. That it has not been invariably regular is well attested by the accompanying table, and by the long-term comparison shown in a later section of this Year-Book entitled “Statistical Summary.”
| Date of Census. | Population (Excluding Maoris). | Maoris. | |||
|---|---|---|---|---|---|
| Numbers. | Numerical Increase. | Percentage Increase. | Average Annual Percentage Increase. | ||
* See letterpress. † An enumeration taken between September, 1857, and September, 1858. ‡ Inclusive of members of Armed Forces overseas at census date. | |||||
| December, 1851 | 26,707 | ||||
| December, 1858 | 59,413 | 32,706 | 122.46 | 12.14 | 56,049† |
| December, 1861* | 97,904 | 38,491 | 64.79 | 18.26 | |
| December, 1864 | 171,009 | 73,105 | 74.67 | 20.74 | |
| December, 1867 | 217,436 | 46,427 | 27.15 | 8.20 | |
| February; 1871 | 254,928 | 37,492 | 17.24 | 5.11 | |
| March, 1874 | 297,654 | 42,726 | 16.76 | 5.29 | 47,330 |
| March, 1878 | 412,465 | 114,811 | 38.57 | 8.49 | 45,542 |
| April, 1881 | 487,889 | 75,424 | 18.29 | 5.60 | 46,141 |
| March, 1886 | 576,524 | 88,635 | 18.17 | 3.41 | 43,927 |
| April, 1891 | 624,455 | 47,931 | 8.31 | 1.60 | 44,177 |
| April, 1896 | 701,094 | 76,639 | 12.27 | 2.33 | 42,113 |
| March, 1901 | 770,304 | 69,210 | 9.87 | 1.91 | 45,549 |
| April, 1906 | 885,995 | 115,691 | 15.02 | 2.79 | 50,309 |
| April, 1911 | 1,005,585 | 119,590 | 13.50 | 2.60 | 52,723 |
| October, 1916 | 1,096,228 | 90,643 | 9.01 | 1.57 | 52,997 |
| April, 1921 | 1,214,677 | 118,449 | 10.81 | 2.31 | 56,987 |
| April, 1926 | 1,344,469 | 129,792 | 10.69 | 2.05 | 63,670 |
| March, 1936 | 1,491,484 | 147,015 | 10.93 | 1.05 | 82,326 |
| September, 1945 | 1,603,554 | 112,070 | 7.51 | 0.77 | 98,744 |
| September, 1945‡ | 1,647,635 | 156,151 | 10.47 | 100,044 | |
Commencing with the 1926 census all half-caste European-Maoris were included with the Maori population in lieu of the previous practice of treating as Europeans-such half-castes as were living in European fashion, and as Maoris those half-castes who were living in Maori fashion. The figures in the preceding table have been corrected from 1861 onwards, to accord with the present practice. Lack of data prevents adjustment for years prior to 1861. The increase in the European population from 1858 to 1861 is therefore very slightly understated.
The European population now looks in retrospect down a vista of well over one hundred years. At the opening of the nineteenth century there existed a more or less fluctuating population of perhaps one hundred; by 1839 it had swelled to a total of about a thousand whalers, sealers, traders, missionaries, adventurers, and settlers. Activities of the colonizing companies and societies in the “forties” brought rapid changes and swiftly rising numbers, to be enhanced in the “sixties” by the gold rushes of the period.
The most significant period is possibly that of the “seventies,” marked by a vigorous developmental policy of public works and assisted immigration. The record year 1874, which saw a rise in population of 46,000 (including 32,000 assisted immigrants), was, and still is, the high-water mark of population gains. Both 1874 and 1875 showed a ratio of growth far in advance of any level subsequently attained.
In the late “eighties” and early “nineties” came economic depression and, consequently, comparative stagnation in population. In the three years 1888, 1890, and 1891, emigrants exceeded immigrants, these being the only such occasions in the history of the country, until the depression years following 1930, when departures exceeded arrivals in the five years 1931–35. A small decrease was also recorded in 1943.
Up to the “seventies” New Zealand was dependent on migration for the greater portion of her increase of population, but since then natural increase—i.e., excess of births over deaths—has been the principal factor.
A table is appended allowing for each five-yearly period from 1861 the excess of births over deaths and of immigration over emigration. Maoris are not included, nor, prior to 1921, are crews of vessels. Figures for years later than 1920 have not been adjusted consequent upon the censuses. While there thus exist discrepancies with total population increases given elsewhere, such discrepancies do not invalidate the use of the table.
| Period. | Excess of Births over Deaths. | Excess of Arrivals over Departures. | Total Increase. | ||||||
|---|---|---|---|---|---|---|---|---|---|
| Males. | Females. | Both Sexes. | Males. | Females. | Both Sexes. | Males. | Females. | Both Sexes. | |
* Decrease. † Members of Armed Forces, &c., are not included in migration figures. | |||||||||
| 1861–65 | 7,625 | 8,985 | 16,610 | 63,285 | 29,884 | 93,169 | 70,910 | 38,869 | 109,779 |
| 1866–70 | 15,663 | 17,779 | 33,442 | 11,167 | 9,369 | 20,536 | 26,830 | 27,118 | 53,978 |
| 1871–75 | 19,410 | 21,129 | 40,539 | 46,501 | 35,445 | 81,946 | 65,911 | 56,574 | 122,485 |
| 1876–80 | 30,144 | 32,807 | 62,951 | 31,870 | 22,917 | 54,787 | 62,014 | 55,724 | 117,738 |
| 1881–85 | 32,362 | 35,046 | 67,408 | 15,958 | 13,001 | 28,959 | 48,320 | 48,047 | 96,367 |
| 1886–90 | 30,781 | 33,544 | 64,325 | -4,911* | -3,791* | -8,702* | 25,870 | 29,753 | 55,623 |
| 1891–95 | 27,255 | 30,630 | 57,885 | 9,917 | 5,403 | 15,320 | 37,172 | 36,033 | 73,205 |
| 1896–1900 | 28,097 | 31,437 | 59,534 | 7,320 | 3,318 | 10,638 | 35,417 | 34,755 | 70,172 |
| 1901–05 | 32,515 | 36,223 | 68,738 | 31,223 | 14,223 | 45,446 | 63,738 | 50,446 | 114,184 |
| 1906–10 | 38,681 | 43,067 | 81,748 | 25,454 | 15,512 | 40,966 | 64,135 | 58,579 | 122,714 |
| 1911–15† | 42,323 | 46,682 | 89,005 | 17,656 | 17,905 | 35,561 | 59,979 | 64,587 | 124,566 |
| 1916–20† | 35,248 | 41,359 | 76,607 | 6,979 | 7,875 | 14,854 | 42,227 | 49,234 | 91,161 |
| 1921–25 | 41,876 | 44,868 | 86,744 | 26,795 | 23,294 | 50,089 | 68,671 | 68,162 | 136,833 |
| 1926–30 | 36,886 | 40,456 | 77,342 | 14,758 | 9,869 | 24,627 | 51,644 | 50,325 | 101,969 |
| 1931–35 | 30,715 | 33,237 | 63,952 | -5,256* | -4,662* | -9,918* | 25,459 | 28,575 | 54,034 |
| 1936–40† | 32,604 | 37,192 | 69,796 | 7,433 | 4,935 | 12,368 | 40,037 | 42,127 | 82,164 |
| 1941–45† | 44,170 | 47,029 | 91,199 | 1,412 | 654 | 2,066 | 45,582 | 47,683 | 93,265 |
| 1946–47† | 26,824 | 27,866 | 54,690 | 5,925 | 5,051 | 10,976 | 32,749 | 32,917 | 65,666 |
| Totals, 1861–1947 | 553,179 | 609,336 | 1,162,515 | 313,486 | 210,202 | 523,688 | 866,665 | 819,538 | 1,686,203 |
Trend of Population.—While the population of New Zealand has been growing, the rate of increase has declined substantially, the lowest point being reached in 1935. The next four years showed steady improvement until 1939, when the percentage increase recorded was the highest since 1927. Since the outbreak of war, however, the cheek on migration and the movement of members of the Armed Forces, &c., have introduced abnormal features.
Immigration now contributes relatively small increments to the population; indeed, in the five depression years 1931–35 there was a net exodus from New Zealand of 9,918. With the passing of the depression the net inward flow resumed, but fell to very low proportions during the war years. Recovery has again become manifest and during the years 1946 and 1947 the combined inward excess totalled 10,976.
In the years following 1930, natural increase (excess of births over deaths) reached a critical position, falling to a rate of 7.89 per 1,000 of mean population by 1936. It is obvious that this meant that the population was still increasing at a moderate rate, but owing to the time-lag it was less obvious to many that a rate as low as this meant, in the near future, a stationary or, more probably, a declining population. In other words, the population was failing to reproduce itself in sufficient numbers for growth and even for the maintenance of a stationary population.
One method of measuring the status of a population is that of the net reproduction index, which is based on female children born and probably surviving. Gross and net reproduction rates in recent years are:—
| Year. | Gross Rate. | Net Rate. |
|---|---|---|
| 1936 | 1.044 | 0.970 |
| 1937 | 1.074 | 0.999 |
| 1938 | 1.106 | 1.028 |
| 1939 | 1.154 | 1.073 |
| 1940 | 1.284 | 1.195 |
| 1941 | 1.369 | 1.274 |
| 1942 | 1.298 | 1.208 |
| 1943 | 1.158 | 1.077 |
| 1944 | 1.298 | 1.207 |
| 1945 | 1.421 | 1.321 |
| 1946 | 1.585 | 1.473 |
| 1947 | 1.684 | 1.567 |
Though economic factors are not the only, and possibly not even the most important, cause of the decline in the birth-rate, the immediate cause of the low level reached in 1935 was almost certainly the economic depression from 1931 onwards. As economic conditions recovered there was some improvement in the birth-rate (though accompanied by higher death-rates), and the net reproduction index returned to a level of 1.274 in 1941, indicating a modest margin of growth. Decreases were recorded for the two following years, but the years since then have shown substantial improvements, with the result that the rate for the 1947 year is the highest of the entire series. This index is not and cannot be, an exact measure, but it does afford a close and fairly reliable approximation in normal circumstances. In its use it is necessary to remember, inter alia, that the probability of survival of the children born is calculated on past mortality experience in more or less normal conditions; no allowance is made for wars, major epidemics, or other factors which may result in abnormal losses of population.
The foregoing observations necessarily omit any forecast of the trend of external migration; also they do not take into account the Maori section of the population, which is increasing fairly rapidly.
SEX PROPORTIONS.—The following table is interesting as showing the early excess of males and the gradual equalization of the sexes in New Zealand. The figures quoted are exclusive of Maoris.
| Census Year | Males. | Females. | Females to 1,000 Males. |
|---|---|---|---|
| 1851 | 15,035 | 11,672 | 776 |
| 1861 | 60,435 | 37,469 | 620 |
| 1871 | 149,600 | 105,328 | 704 |
| 1881 | 268,553 | 219,336 | 817 |
| 1891 | 331,744 | 292,711 | 882 |
| 1901 | 404,799 | 365,505 | 903 |
| 1911 | 530,433 | 475,152 | 896 |
| 1921 | 621,136 | 593,541 | 956 |
| 1926 | 686,384 | 658,085 | 959 |
| 1936 | 756,226 | 735,258 | 972 |
| 1945 | 782,602 | 820,952 | 1,049 |
The preponderance of males in the early years of New Zealand was doubtless due to the fact that the difficulties of pioneering and the remoteness of the country from Europe were such as to deter female immigration to a greater extent than male. This was accentuated by the character of the early industries.
Of the two sources from which the population has been recruited—viz., migration and natural increase—the effect of the former has hitherto been to give in the aggregate a considerable preponderance of males, and of the latter to give a regular preponderance of females.
The 1945 census results—for the first time in the history of New Zealand—recorded an excess of females. The figures wore, however, affected by the absence from New Zealand of a large number of Armed Forces at census date. Their inclusion would restore an excess of males, the number of females per 1,000 males being 995 if allowance is made for members serving overseas. Deaths of members of the Forces during the war period have still further accentuated the position as disclosed by the 1945 census.
INTERCENSAL RECORDS.—As already noted, the intercensal statements of total population, prepared from the records of vital statistics and of external migration, have been by virtue of the favourable position of New Zealand in this respect relatively accurate, and the 1945 census results, despite abnormal conditions due to the war, afforded a satisfactory demonstration of this.
| Year Ended 31st March, | Population (Excluding Maoris) at End of Year. | Increase During Year. | Mean Population for Year. | |||
|---|---|---|---|---|---|---|
| Males. | Females. | Totals. | Numerical. | Per Cent. | ||
* Minus sign (-) signifies a decrease. | ||||||
| 1938 | 769,394 | 748,318 | 1,517,712 | 14,975 | 1.00 | 1,508,542 |
| 1939 | 779,095 | 757,169 | 1,536,264 | 18,552 | 1.22 | 1,523,796 |
| 1940 | 781,723 | 768,198 | 1,549,921 | 13,657 | 0.89 | 1,543,748 |
| 1941 | 765,131 | 778,851 | 1,543,982 | -5,939* | -0.38* | 1,544,371 |
| 1942 | 751,312 | 789,346 | 1,540,658 | -3,324* | -0.22* | 1,537,734 |
| 1943 | 740,369 | 797,268 | 1,537,637 | -3,021* | -0.20* | 1,545,052 |
| 1944 | 739,744 | 805,297 | 1,545,041 | 7,404 | 0.42 | 1,539,978 |
| 1945 | 763,155 | 815,236 | 1,578,391 | 33,350 | 2.16 | 1,564,436 |
| 1946 | 827,449 | 829,257 | 1,656,706 | 78,315 | 4.96 | 1,610,406 |
| 1947 | 842,786 | 844,740 | 1,687,526 | 30,820 | 1.86 | 1,669,355 |
| 1948 | 863,279 | 861,988 | 1,725,267 | 37,741 | 2.24 | 1,705,322 |
As population figures for the calendar year are in demand for numerous purposes, figures are given also for years ending 31st December.
| Year Ended 31st December, | Population (Excluding Maoris) at End of Year. | Increase During Year. | Mean Population for Year. | |||
|---|---|---|---|---|---|---|
| Males. | Females. | Totals. | Numerical. | Per Cent. | ||
* Minus sign (-) signifies a decrease. | ||||||
| 1937 | 768,238 | 747,158 | 1,515,396 | 14,738 | 0.98 | 1,504,826 |
| 1938 | 775,976 | 754,390 | 1,530,366 | 14,970 | 0.99 | 1,519,606 |
| 1939 | 785,946 | 765,388 | 1,551,334 | 20,968 | 1.37 | 1,539,420 |
| 1940 | 766,021 | 775,910 | 1,541,931 | -9,403* | -0.61* | 1,546,312 |
| 1941 | 751,919 | 786,227 | 1,538,146 | -3,785* | -0.25* | 1,538,620 |
| 1942 | 745,008 | 795,622 | 1,540,630 | 2,484 | 0.16 | 1,545,112 |
| 1943 | 741,045 | 802,741 | 1,543,786 | 3,156 | 0.20 | 1,538,651 |
| 1944 | 762,566 | 812,885 | 1,575,451 | 31,665 | 2.05 | 1,556,318 |
| 1945 | 805,095 | 823,693 | 1,628,788 | 53,337 | 3.39 | 1,593,947 |
| 1946 | 839,440 | 840,213 | 1,679,653 | 50,865 | 3.12 | 1,659,145 |
| 1947 | 858,054 | 856,945 | 1,714,999 | 35,346 | 2.10 | 1,696,188 |
The figures given in the two preceding tables show the population exclusive of Maoris. The following table shows the population inclusive of Maoris.
| — | Population (Including Maoris) at End of Year. | Mean Population for Year. | ||
|---|---|---|---|---|
| Males. | Females. | Totals. | ||
| Years Ended 31st March | ||||
| 1938 | 814,456 | 790,023 | 1,604,479 | 1,594,275 |
| 1939 | 825,063 | 799,651 | 1,624,714 | 1,611,362 |
| 1940 | 828,971 | 811,930 | 1,640,901 | 1,633,447 |
| 1941 | 812,421 | 823,809 | 1,636,230 | 1,635,715 |
| 1942 | 798,938 | 835,400 | 1,634,338 | 1,630,419 |
| 1943 | 789,400 | 844,694 | 1,634,094 | 1,640,191 |
| 1944 | 789,772 | 854,128 | 1,643,900 | 1,637,570 |
| 1945 | 814,470 | 865,502 | 1,679,972 | 1,664,585 |
| 1946 | 879,523 | 878,481 | 1,758,004 | 1,710,990 |
| 1947 | 897,162 | 896,063 | 1,793,225 | 1,772,787 |
| 1948 | 919,279 | 914,991 | 1,834,270 | 1,812,609 |
| Years Ended 30th June | ||||
| 1938 | 814,678 | 789,807 | 1,604,485 | 1,598,570 |
| 1939 | 826,135 | 800,370 | 1,626,505 | 1,616,650 |
| 1940 | 821,983 | 814,084 | 1,636,067 | 1,636,680 |
| 1941 | 802,716 | 826,302 | 1,629,018 | 1,634,238 |
| 1942 | 800,492 | 838,210 | 1,638,702 | 1,631,375 |
| 1943 | 786,189 | 846,480 | 1,632,669 | 1,639,407 |
| 1944 | 796,969 | 856,788 | 1,653,757 | 1,641,433 |
| 1945 | 819,456 | 868,599 | 1,688,055 | 1,673,378 |
| 1946 | 879,987 | 881,272 | 1,761,259 | 1,729,897 |
| 1947 | 901,812 | 899,942 | 1,801,754 | 1,782,253 |
| 1948 | 921,885 | 918,297 | 1,840,182 | 1,822,542 |
| Years Ended 31st December | ||||
| 1937 | 813,104 | 788,654 | 1,601,758 | 1,589,972 |
| 1938 | 821,668 | 796,645 | 1,618,313 | 1,606,763 |
| 1939 | 832,841 | 808,798 | 1,641,639 | 1,628,512 |
| 1940 | 813,028 | 820,617 | 1,633,645 | 1,637,305 |
| 1941 | 799,241 | 832,035 | 1,631,276 | 1,630,948 |
| 1942 | 793,681 | 842,722 | 1,636,403 | 1,639,572 |
| 1943 | 790,842 | 851,199 | 1,642,041 | 1,635,635 |
| 1944 | 813,604 | 862,689 | 1,676,293 | 1,655,794 |
| 1945 | 855,886 | 872,555 | 1,728,441 | 1,694,714 |
| 1946 | 893,281 | 891,053 | 1,784,334 | 1,761,399 |
| 1947 | 913,583 | 909,491 | 1,823,074 | 1,802,637 |
EXTERNAL MIGRATION.—Statistics of external migration have been recorded in New Zealand since 1860. Since 1st April, 1921, they have been compiled from individual statements obtained from each person entering or leaving New Zealand.
Commencing with the year 1933–34, the year ending 31st March has been adopted as a standard for the statistical expression of external migration in place of the calendar year formerly in use. The principal reason for the change was to avoid the partition of a season's migration movement into two statistical years as was inevitable with the calendar year ending in the middle of the summer flow of tourists and immigrants.
Including crews of vessels, 67,320 persons from overseas arrived in New Zealand during the year ended 31st March, 1948, which, compared with 1946–47, shows an increase of 10,264. During the same period, 60,707 persons departed. This figure, compared with the corresponding one for 1946–47, shows an increase of 6,356.
In addition to the figures just quoted there were also 5,136 “through” passengers who called at a port of New Zealand en route to their destination.
The excess of total arrivals over total departures for 1947–48 was 6,613, compared with a similar excess of 2,705 during 1946–47.
The numbers of arrivals and departures during the last ten years are given in the table following. Crows of vessels, “through” passengers, tourists on cruising liners, and members of the Armed Forces, &c. (1939–40 to 1947–48), have not been taken into account in this table.
| Year Ended 31st March, | Arrivals. | Departures. | Excess of Arrivals over Departures. | ||||
|---|---|---|---|---|---|---|---|
| Males. | Females. | Totals. | Males. | Females. | Totals. | ||
| 1939 | 21,569 | 21,079 | 42,648 | 18,215 | 19,470 | 37,685 | 4,963 |
| 1940 | 15,868 | 15,564 | 31,432 | 13,070 | 12,334 | 25,404 | 6,028 |
| 1941 | 7,053 | 6,761 | 13,814 | 6,955 | 6,145 | 13,100 | 714 |
| 1942 | 3,709 | 3,393 | 7,102 | 3,702 | 3,191 | 6,893 | 209 |
| 1943 | 1,890 | 1,243 | 3,133 | 1,382 | 1,210 | 2,592 | 541 |
| 1944 | 2,122 | 1,625 | 3,747 | 1,848 | 1,792 | 3,640 | 107 |
| 1945 | 3,667 | 3,540 | 7,207 | 3,112 | 3,077 | 6,189 | 1,018 |
| 1946 | 6,416 | 6,893 | 13,309 | 5,657 | 5,309 | 10,966 | 2,343 |
| 1947 | 12,682 | 12,676 | 25,358 | 11,417 | 10,903 | 22,320 | 3,038 |
| 1948 | 17,004 | 16,140 | 33,144 | 13,945 | 13,443 | 27,388 | 5,756 |
Classes of Arrivals and Departures.—The following table gives an analysis of all classes of arrivals during the last five years, including “through” passengers, and crews.
| — | 1943–44. | 1944–45. | 1945–46. | 1946–47. | 1947–48. |
|---|---|---|---|---|---|
| Immigrants intending permanent residence | 748 | 1,704 | 4,645 | 8,106 | 9,648 |
| Permanent residents returning | 1,171 | 1,863 | 3,404 | 7,947 | 11,988 |
| Visitors— | |||||
| Polish refugees | 837 | ||||
| Tourists | 974 | 1,425 | 2,576 | 4,840 | 7,692 |
| On business | 349 | 611 | 966 | 1,696 | 1,732 |
| Theatrical, entertaining, &c. | 3 | 58 | 87 | 233 | 387 |
| Others, officials, &c. | 150 | 288 | 859 | 799 | 776 |
| In transit | 352 | 421 | 772 | 1,625 | 890 |
| Not stated | 112 | 31 | |||
| Through passengers | 1,812 | 576 | 3,071 | 5,742 | 5,136 |
| Crews | 33,845 | 29,686 | 36,037 | 31,698 | 34,176 |
| Totals | 39,404 | 37,469 | 52,417 | 62,798 | 72,456 |
The succeeding table gives a similar analysis of departures.
| — | 1943–44. | 1944–45. | 1945–46. | 1946–47. | 1947–48. |
|---|---|---|---|---|---|
| Permanent residents departing— | |||||
| Permanently | 1,479 | 2,392 | 4,635 | 6,051 | 5,769 |
| Temporarily | 774 | 1,268 | 2,603 | 6,865 | 10,725 |
| Temporary residents departing | 1,387 | 2,529 | 3,728 | 9,404 | 10,894 |
| Through passengers | 1,812 | 576 | 3,071 | 5,742 | 5,136 |
| Crews | 33,307 | 30,615 | 33,784 | 32,031 | 33,319 |
| Totals | 38,759 | 37,380 | 47,821 | 60,093 | 65,843 |
Ages.—The following table gives the age-distribution of immigrants and emigrants for the twelve months ended 31st March, 1948.
| Age, in Years. | Permanent Arrivals. | Permanent Departures. | Excess of Arrivals over Departures. | ||||
|---|---|---|---|---|---|---|---|
| Males. | Females. | Totals. | Males. | Females. | Totals. | ||
| 0–14 | 907 | 822 | 1,729 | 502 | 415 | 917 | 812 |
| 15–24 | 838 | 958 | 1,796 | 590 | 588 | 1,178 | 618 |
| 25–34 | 1,368 | 1,292 | 2,660 | 741 | 902 | 1,643 | 1,017 |
| 35–44 | 834 | 812 | 1,646 | 404 | 418 | 822 | 824 |
| 45–59 | 572 | 637 | 1,209 | 361 | 361 | 722 | 487 |
| 60 and over | 210 | 385 | 595 | 224 | 256 | 480 | 115 |
| Unspecified | 3 | 10 | 13 | 4 | 3 | 7 | 6 |
| Totals | 4,732 | 4,916 | 9,648 | 2,826 | 2,943 | 5,769 | 3,879 |
ASSISTED IMMIGRATION.—Various systems of assisted immigration have been in force since 1871, with the exception of the period 1892 to 1903 (inclusive). The scheme that was operating prior to 1948 had been largely suspended since 1927, and only 50 immigrants received financial assistance during the ten years ended 31st March, 1946.
To alleviate the shortage of staffs in mental hospitals, the Government decided to recruit labour in the United Kingdom, and during the year ended 31st March, 1947, the number of arrivals under this system totalled 158 (all females), and a further 36 arrived in June, 1947.
In July, 1947, the scheme now in force was introduced by the Government. Under this scheme financial aid is granted to certain categories of intending immigrants. Elegibility has been confined to single residents of the United Kingdom (with no dependants) between the ages of twenty and thirty-five years who are suitable for, and willing to accept employment in, certain selected occupations. Free passages are provided for those successful applicants who served in the United Kingdom Armed Forces (including Merchant Navy) during the Second World War; all others selected are required to contribute £10 towards the cost of their fares. All assisted immigrants are required to enter into a contract with the Government that they will engage in approved employment for two years after their arrival in New Zealand.
The first party arrived in August, 1947, and during the year ended 31st March, 1948, the total number of arrivals under this scheme was 1,101, which, together with the 36 mental-hospital employees mentioned earlier, made a total of 1,137 immigrants who' received financial assistance from the Government during the year.
The total of 1,137 comprised 600 males and 537 females.
In the preceding migration tables, assisted immigrants are included in the totals of “Immigrants intending permanent residence.”
PASSPORTS.—Authority for the issue of passports in New Zealand and by New Zealand representatives overseas is contained in the Passports Act, 1946, and the Passport Regulations 1946.
Permission to Enter New Zealand.—Apart from British subjects arriving from Australia, no person sixteen years of age or over may land in New Zealand unless in possession of a valid passport or other travel document satisfactorily establishing nationality and identity. Exemption (which is additional to the requirements of the Immigration Restriction and Undesirable Immigrants Exclusion Acts) may be granted by the Minister of Internal Affairs. With the exception of nationals of those countries with which New Zealand has concluded agreements for the mutual abolition of visas, all aliens require a British visa.
For persons from the Cook Islands, Nine, or Western Samoa the only requirement is a permit to visit New Zealand granted by the Resident Commissioner of the Cook Islands or Niue, or the High Commissioner for Western Samoa, as the case may be.
The regulations, further, do not apply to a British subject who is the master or a member of the crew of the vessel in which he arrives.
Departure from New Zealand.—British subjects leaving New Zealand, with the exception of those travelling to Australia or making the round trip to New Zealand's island territories, should be in possession of a valid passport or other travel document.
IMMIGRATION RESTRICTION.—The legislation respecting the restriction of immigration into New Zealand is contained in the Immigration Restriction Act, 1908, and its amendments, and the Undesirable Immigrants Exclusion Act, 1919. It is administered by the Customs Department.
Subject to certain exemptions, the following classes of persons are prohibited from landing in New Zealand:—
Persons not of British birth and parentage, unless in possession of permits issued by the Customs Department. (Note.—A person is not deemed to be of British birth and parentage by reason that he or his parents or either of them is a naturalized British subject, or by reason that he is an aboriginal Native or the descendant of an aboriginal Native of any dominion (other than New Zealand), colony, possession, or protectorate of His Majesty.)
Idiots or insane persons.
Persons suffering from contagious diseases which are loathsome or dangerous.
Persons arriving in New Zealand within two years after the termination of a period of imprisonment for a serious offence..
Persons who are considered by the Attorney-General to be disaffected or disloyal, or of such a character that their presence in New Zealand would be injurious to the peace, order, and good government of the country.
Aliens of the age of fifteen years or over who refuse or neglect to take an oath (or make an affirmation) of obedience to the laws of New Zealand.
To obtain permits to enter New Zealand as permanent residents, application must be made by the intending immigrants themselves to the Minister of Customs, Wellington. The application must be made in the prescribed form and must be supported by documents duly attested in the country of origin, in which country the applicant must have resided for at least twelve months prior to the date of application. Each application is considered individually on its own merits.
Provision is made in the law to permit persons covered by clause (1) above to pay temporary visits to New Zealand for the purposes of Business, pleasure, or health. Temporary permits are normally restricted to a period not exceeding six months, but may be extended if the proper authorities consider that the circumstances warrant such action. A deposit of £10 is required in respect of such temporary permit, and is returned on the departure of the visitor if the conditions of the temporary permit have been complied with. The Collector of Customs may also require, if he so decides, a deed to be entered into by some person or persons resident in New Zealand approved by him guaranteeing to pay all expenses that may be incurred by the Crown or any public body for the visitor's maintenance, relief, arrest, or detention in New Zealand or his deportation therefrom.
Provision is also made whereby, under certain conditions, students may be allowed to enter New Zealand temporarily.
Restricted Immigrants.—When persons who are lunatic, idiotic, deaf, dumb, blind, or infirm, arrive in New Zealand and are likely to become a charge upon the public or upon any public or charitable institution, the master, owner, or charterer of the ship by which such persons came to New Zealand may be called on to enter into a bond of £100 for each such person, guaranteeing payment of any expenses which may be incurred for his support and maintenance by or in any such institution within a period of five years.
Declaration by Persons Arriving in New Zealand.—Every person of and over the age of fifteen years who lands in New Zealand must, unless exempted by the Minister of Customs, make and deliver to an officer of Customs a declaration giving the following particulars: Name, age, nationality, race or people to which he belongs, residence, particulars of children under fifteen years of age arriving with him, and (if not domiciled in New Zealand) occupation, and places of birth of himself and father.
NATIONALITY AND NATURALIZATION.—Brief mention should be made of the British Nationality and Status of Aliens (in New Zealand) Amendment Act, 1946, which was passed since the last issue of the Year-Book and subsequently repealed. This Act, which came into force on the 9th October, 1946, made some fundamental changes in the national status of married women and repealed the British Nationality and Status of Aliens (in New Zealand) Amendment Act, 1934–35. The two main provisions were as follows:—
A British-born woman who married an alien did not lose her British nationality. This portion of the Act was retrospective, and those British-born women who had at any time married aliens were deemed never to have lost their British nationality.
If an alien woman married a British subject she did not automatically become British by marriage according to New Zealand law, but could acquire British nationality only by the grant of a certificate of naturalization. This portion of the Act was not retrospective, and any alien-born woman who had already become British by marriage before the 9th October, 1946, remained British.
The British Nationality and New Zealand Citizenship Act, 1948, which came into force on the 1st January, 1949, was enacted following a conference of nationality exports of British Commonwealth countries in February, 1947, when it was agreed that each Commonwealth country should establish its own citizenship status. Citizens of the various Commonwealth countries also possess a common British status as members of the wider association of peoples comprising the Commonwealth.
Upon the commencement of the Act, New Zealand citizenship is automatically conferred on the following classes of British subjects:—
Those born in New Zealand.
Those naturalized in New Zealand.
Those ordinarily resident in New Zealand for at least one year.
Those whose fathers were British subjects born or naturalized in New Zealand.
Women (being British subjects) married before the commencement of the Act to men who become citizens under the various provisions of the Act.
After the commencement of the Act, New Zealand citizenship may be acquired in the following ways:—
By birth in New Zealand.
By descent.
By registration.
By naturalization.
The principal conditions governing the grant of naturalization to aliens under the 1948 Act are that the applicant shall satisfy the Minister of Internal Affairs (a) that he has resided in New Zealand for a period of five years, (b) that he is of good character and has an adequate knowledge of the English language, (c) that if his application is granted he intends to reside permanently in New Zealand, (d) that the applicant gives a year's notice of his intention to apply, and (e) that the applicant possesses a sufficient knowledge of the responsibilities and privileges of New Zealand citizenship. There is discretionary provision for the Minister to allow residence in other British Commonwealth countries and service in the Armed Forces to be reckoned for the purposes of the first condition. Conditions (d) and (e) are new.
Certificates of naturalization granted during the year ended 31st March, 1948, under the authority of the British Nationality and Status of Aliens (in New Zealand) Act, 1928, and subsequent amendments of 1943 and 1946, are shown by sex and country of birth in the table below. Totals for the preceding year are also given for comparative purposes.
| Country of. Birth. | Year Ended 31st March, | |||
|---|---|---|---|---|
| 1947. | 1948. | |||
| Total. | Males. | Females. | Total. | |
| Sweden | 9 | 10 | 1 | 11 |
| Denmark | 20 | 14 | 4 | 18 |
| Russia (U.S.N.R.) | 8 | 1 | 9 | 10 |
| Poland | 59 | 35 | 45 | 80 |
| Germany | 153 | 50 | 92 | 142 |
| Switzerland | 1 | 10 | 3 | 13 |
| Italy | 5 | 25 | 9 | 34 |
| Czechoslovakia | 40 | 19 | 22 | 41 |
| Austria | 84 | 22 | 39 | 61 |
| Hungary | 29 | 6 | 11 | 17 |
| Yugoslavia | 7 | 33 | 10 | 43 |
| Greece | 1 | 6 | 6 | 12 |
| Lebanon | 4 | 11 | 2 | 13 |
| United States of America | 5 | 7 | 3 | 10 |
| Other countries | 38 | 42 | 15 | 57 |
| Totals | 463 | 291 | 271 | 562 |
In addition to the numbers given in the table, children shown on the certificates of their parents totalled 116 in 1946–47 and 47 in 1947–48.
REGISTRATION OF ALIENS.—The registration of aliens in New Zealand is provided for by the Aliens Act, 1948, the administration being carried out by the Police Department. This Act repealed earlier enactments relating to aliens, including the Registration of Aliens Act, 1917, and the 1920 amendment; the Registration of Aliens Suspension Act, 1923; and the Aliens Emergency Regulations 1940 and amendments.
The present compilation of statistics under the Aliens Emergency Regulations 1940 and amendments relates to 1st April, 1948, when the number on the register was 6,276, comprising 4,679 males and 1,597 females. This does not purport to be the complete number in New Zealand, as the following classes are not required to register:—
Children under sixteen years of age.
Persons holding diplomatic status, Consuls, or employees of Legations and Consulates who are resident in New Zealand solely for the purpose of performing official duties.
Uniformed members of Allied Forces.
Western Samoans are only required to register in special circumstances.
Persons specially exempted by the Minister on the recommendation of an aliens authority.
The following table shows the numbers on the register at 31st May, 1947, and 1st April, 1948.
| Country of Nationality. | 31st May, 1947. | 1st April, 1948. | ||||
|---|---|---|---|---|---|---|
| Males. | Females. | Totals. | Males. | Females. | Totals. | |
| Norway | 109 | 7 | 116 | 93 | 9 | 102 |
| Sweden | 71 | 8 | 79 | 70 | 12 | 82 |
| Denmark | 144 | 30 | 174 | 135 | 27 | 162 |
| Finland | 31 | 4 | 35 | 24 | 2 | 26 |
| Russia (U.S.S.R.) | 26 | 14 | 40 | 24 | 10 | 34 |
| Estonia | 14 | 3 | 17 | 13 | 1 | 14 |
| Poland | 157 | 264 | 421 | 245 | 308 | 553 |
| Germany | 193 | 221 | 414 | 141 | 124 | 265 |
| Netherlands | 80 | 61 | 141 | 72 | 51 | 123 |
| Belgium | 21 | 3 | 24 | 23 | 3 | 26 |
| France | 55 | 57 | 112 | 44 | 42 | 86 |
| Switzerland | 101 | 36 | 137 | 101 | 32 | 133 |
| Italy | 206 | 99 | 305 | 177 | 132 | 309 |
| Austria | 26 | 26 | 52 | 20 | 30 | 50 |
| Czechoslovakia | 32 | 37 | 69 | 17 | 24 | 41 |
| Hungary | 24 | 13 | 37 | 18 | 12 | 30 |
| Yugoslavia | 746 | 177 | 923 | 644 | 158 | 802 |
| Greece | 102 | 31 | 133 | 100 | 35 | 135 |
| Syria | 13 | 5 | 18 | 12 | 5 | 17 |
| Lebanon | 6 | 6 | 12 | 7 | 6 | 13 |
| China | 2,222 | 395 | 2,617 | 2,174 | 383 | 2,557 |
| United States of America | 437 | 135 | 572 | 462 | 147 | 609 |
| Tonga | 13 | 15 | 28 | 18 | 16 | 34 |
| Other countries | 31 | 19 | 50 | 29 | 16 | 45 |
| Stateless | 20 | 19 | 39 | 16 | 12 | 28 |
| Totals | 4,880 | 1,685 | 6,565 | 4,679 | 1,597 | 6,276 |
A summary follows giving information as to ages of registered aliens as at 1st April, 1948.
| Age-group. | Males. | Females. | Totals. |
|---|---|---|---|
| 16 years and under 21 years | 197 | 226 | 423 |
| 21 years and under 30 years | 679 | 293 | 972 |
| 30 years and under 40 years | 704 | 309 | 1,013 |
| 40 years and under 50 years | 1,212 | 400 | 1,612 |
| 50 years and under 60 years | 998 | 215 | 1,213 |
| 60 years and under 70 years | 614 | 97 | 711 |
| 70 years and over | 243 | 53 | 296 |
| Not specified | 32 | 4 | 36 |
| Totals | 4,679 | 1,597 | 6,276 |
DISTRIBUTION OF POPULATION—North and South Islands.—In 1858 the North Island had a larger population than the South, but this position was reversed at the succeeding enumeration and the South Island had the larger population (exclusive of Maoris) at each census from 1861 to 1896. In 1901 the North Island was found to have slightly the larger total and since then has steadily increased its lead. The Maori War which broke out in 1860 retarded settlement in the North, while a large area of land reserved for the Maoris was for many years a serious hindrance to the development, by Europeans, of this portion of New Zealand. The South Island was practically free from Maori troubles, and settlement was more rapid, though much of the land was disposed of in large areas. The discovery of gold in Otago in 1861 and on the West Coast in 1864 attracted to these localities considerable numbers of miners.
The following table gives the population of the North and South Islands as disclosed by each census since 1881.
| Census Year. | Population (Excluding Maoris). | Proportions Per Cent. | |||
|---|---|---|---|---|---|
| North Island. | South Island. | Totals. | North Island. | South Island. | |
*Includes Maori half-castes (total, 4,236), living as Europeans. | |||||
| 1881 | 191,534 | 296,355 | 487,889 | 39.26 | 60.74 |
| 1886 | 248,909 | 327,615 | 576,524 | 43.17 | 56.83 |
| 1891 | 279,642 | 344,813 | 624,455 | 44.78 | 55.22 |
| 1896 | 338,739 | 362,355 | 701,094 | 48.32 | 51.68 |
| 1901 | 388,626 | 381,678 | 770,304 | 50.45 | 49.55 |
| 1906 | 474,605 | 411,390 | 885,995 | 53.57 | 46.43 |
| 1911 | 561,281 | 444,304 | 1,005,585 | 55.82 | 44.18 |
| 1916 | 648,439 | 447,789 | 1,096,228 | 59.15 | 40.85 |
| 1921 | 741,255* | 477,658* | 1,218,913* | 60.81 | 39.19 |
| 1926 | 831,813 | 512,656 | 1,344,469 | 61.87 | 38.13 |
| 1936 | 938,939 | 552,545 | 1,491,484 | 62.95 | 37.05 |
| 1945 | 1,050,984 | 552,570 | 1,603,554 | 65.54 | 34.46 |
The natural increase of European population (i.e., excess of births over deaths) for the South Island during the 1936–45 intercensal period was 45,692, but the total net increase was only 25. For the North Island the natural increase was 106,317, and the total net increase 112,045. The existence of a northward drift of population was still evident, doubtless being accentuated by factors associated with the war. It should be remembered in this connection that there were 45,381 members of the Armed Tories overseas at the date of the 1945 census, and the total net increase would be affected accordingly.
At 31st March, 1948, the North Island population was estimated as 1,241,256, inclusive of 105,426 Maoris; and the South Island population as 593,014, inclusive of 3,577 Maoris.
Provincial Districts.—The approximate areas and the populations, inclusive of Maoris, of the various provincial districts are as follows:—
| Provincial District. | Area (Square Miles). | Census Population. | Estimated Population, 1st April, 1948. | |||
|---|---|---|---|---|---|---|
| 1901. | 1921. | 1936. | 1945. | |||
*Including 196 Maori wives of Europeans, provincial district not specified. | ||||||
| Auckland | 25,400 | 204,899 | 406,899 | 546,970 | 640,971 | 698,056 |
| Hawkes Bay | 4,260 | 39,604 | 65,080 | 76,968 | 79,084 | 85,400 |
| Taranaki | 3,750 | 40,465 | 65,244 | 77,652 | 76,833 | 81,700 |
| Wellington | 10,870 | 146,326 | 254,695 | 316,446 | 349,404 | 376,100 |
| Marlborough | 4,220 | 13,746 | 18,289 | 19,149 | 20,737 | 21,400 |
| Nelson | 10,870 | 38,067 | 47,734 | 59,481 | 57,201 | 61,400 |
| Westland | 4,880 | 14,566 | 14,253 | 18,676 | 17,007 | 18,000 |
| Canterbury | 13,940 | 144,195 | 199,969 | 234,399 | 246,848 | 265,614 |
| Otago— | ||||||
| Otago portion | 14,050 | 125,782 | 137,062 | 151,213 | 144,035 | 152,200 |
| Southland portion | 11,170 | 48,016 | 62,439 | 72,856 | 70,178 | 74,400 |
| Totals | 103,410 | 815,862* | 1,271,664 | 1,573,810 | 1,702,298 | 1,834,270 |
The foregoing table illustrates the wide disparities in the size of the provincial districts, whether measured by area or by population.
Urban and Rural Population.—On 25th September, 1945, somewhat over two-fifths (41.4 per cent.) of the population of New Zealand (excluding Maoris) was included in the four principal urban areas—Auckland, Wellington, Christchurch, and Dunedin—and over one-half (55.0 per cent.) in these or in the ten secondary urban areas. In the following table urban population means the population in cities and boroughs, while rural population covers counties, all town districts, and extra-county islands. It will be observed that there was a marked slackening in the rate of the urban drift between 1926 and 1936, but the 1945 figures, due, no doubt, to wartime influences, disclose a substantial increase in the urban population, whereas the rural population, for the first time, recorded a decrease.
| Census. | Population. | Per Cent. | ||||
|---|---|---|---|---|---|---|
| Rural. | Urban. | Migratory. | Rural. | Urban. | Migratory. | |
*Figures exclude military and internment camps. †Figures include Armed Services in New Zealand at census date and Internment camps, but exclude members of the United States Forces present in New Zealand and also enemy prisoners of war. | ||||||
| Excluding Maoris— | ||||||
| 1881 | 292,036 | 194,981 | 2,916 | 59.61 | 39.80 | 0.59 |
| 1886 | 328,144 | 245,612 | 4,726 | 56.72 | 42.46 | 0.82 |
| 1891 | 352,991 | 270,343 | 3,305 | 56.33 | 43.14 | 0.53 |
| 1896 | 392,678 | 307,294 | 3,381 | 55.83 | 43.69 | 0.48 |
| 1901 | 418,746 | 350,202 | 3,763 | 54.19 | 45.32 | 0.49 |
| 1906 | 459,492 | 424,614 | 4,467 | 51.71 | 47.79 | 0.50 |
| 1911 | 497,858 | 505,598 | 5,008 | 49.37 | 50.13 | 0.50 |
| 1916* | 501,956 | 585,306 | 3,463 | 46.02 | 53.66 | 0.32 |
| 1921 | 531,694 | 681,988 | 5,231 | 43.62 | 55.95 | 0.43 |
| 1926 | 552,344 | 785,040 | 7,085 | 41.08 | 58.39 | 0.53 |
| 1936 | 602,519 | 884,293 | 4,672 | 40.40 | 59.29 | 0.31 |
| 1945† | 591,855 | 1,008,534 | 3,165 | 36.91 | 62.89 | 0.20 |
| Including Maoris— | ||||||
| 1926 | 610,446 | 790,555 | 7,138 | 43.35 | 56.14 | 0.51 |
| 1936 | 677,087 | 892,024 | 4,699 | 43.02 | 56.68 | 0.30 |
| 1945† | 674,821 | 1,024,292 | 3,185 | 39.64 | 60.17 | 0.19 |
Another conception of urban and rural population is presented in the next table, which covers the period 1901–1945. Maoris are omitted, as data are not available over the whole period. The great bulk of Maoris inhabit rural communities. In the case of the larger centres there are numerous suburban boroughs and town districts; consequently, as regards the fourteen urban areas the centre has been taken as including all cities, boroughs, and town districts within the territory of the present urban area. In other instances the “centre” is a borough or town district.
| Centres of | 1901. | 1911. | 1916. | 1921. | 1926. | 1936. | 1945. |
|---|---|---|---|---|---|---|---|
| Population | |||||||
| 1,000– 2,499 | 41,814 | 54,895 | 65,706 | 80,120 | 84,792 | 82,516 | 74,752 |
| 2,500– 4,999 | 33,478 | 37,192 | 46,159 | 56,487 | 49,594 | 51,779 | 70,985 |
| 5,000– 9,999 | 36,834 | 51,326 | 44,838 | 23,306 | 32,073 | 48,292 | 59,519 |
| 10,000– 24,999 | 10,637 | 62,715 | 82,770 | 128,984 | 155,105 | 172,885 | 168,485 |
| 25,000 and over | 214,098 | 302,943 | 349,271 | 401,710 | 472,603 | 531,588 | 636,889 |
| Totals, urban | 336,861 | 509,071 | 588,744 | 690,607 | 794,167 | 887,060 | 1,010,130 |
| Rural | 432,087 | 494,385 | 498,518 | 523,075 | 543,217 | 599,752 | 590,259 |
| Grand totals (excluding migratory) | 768,948 | 1,003,456 | 1,087,262 | 1,213,682 | 1,337,384 | 1,486,812 | 1,600,389 |
| Per Cent. | |||||||
| 1,000– 2,499 | 5.44 | 5.47 | 6.04 | 6.60 | 6.34 | 5.55 | 4.67 |
| 2,500– 4,999 | 4.35 | 3.71 | 4.25 | 4.65 | 3.71 | 3.48 | 4.44 |
| 5,000– 9,999 | 4.79 | 5.11 | 4.13 | 1.92 | 2.40 | 3.25 | 3.72 |
| 10,000– 24,999 | 1.38 | 6.25 | 7.61 | 10.63 | 11.60 | 11.63 | 10.53 |
| 25,000 and over | 27.85 | 30.19 | 32.12 | 33.10 | 35.33 | 35.75 | 39.76 |
| Totals, urban | 43.81 | 50.73 | 54.15 | 56.90 | 59.38 | 59.66 | 63.12 |
| Rural | 56.19 | 49.27 | 45.85 | 43.10 | 40.62 | 40.34 | 36.88 |
| Grand totals (excluding migratory) | 100.00 | 100.00 | 100.00 | 100.00 | 100.00 | 100.00 | 100.00 |
The comparison is not an exact one, but is sufficiently accurate to indicate the general trend of urbanization. For instance, it is noticeable that in 1901 29 per cent. of the population were in towns of 10,000 population or over; by 1945 the proportion had become 50 per cent.
An important characteristic of the distribution of urban population in New Zealand is what may be termed its decentralization. In place of one great metropolis containing a huge proportion of the population, as in the case of the Australian States—e.g., Victoria, whose capital city (Melbourne) contains three-fifths of the total population of the State—the more highly urbanized portion of the community is localized in four widely separated centres. These four centres have always existed more or less on the same plane, a fact which has played no small part in the development of the country. An interesting feature is the wide gap which has long existed between the four major centres and the next largest towns.
Urban and rural communities are not evenly distributed. The South Island, for example, contains proportionately more rural population than does the North Island.
RECENT MOVEMENTS IN TOWNS AND COUNTIES.—Urban Areas.—Urban areas afford the best basis of comparison of population-growth in the case of the largest towns, since their boundaries are stable and, of greater significant, they include the suburbs as well as the central city or borough.
| Urban Area. | Population (Excluding Maoris). | Population (Including Maoris). | ||||
|---|---|---|---|---|---|---|
| 1916. | 1921. | 1926. | 1936. | 1945. | 1945. | |
| Auckland | 133,712 | 157,757 | 192,223 | 210,393 | 258,467 | 263,370 |
| Wellington | 95,235 | 107,488 | 121,527 | 149,382 | 172,320 | 173,520 |
| Christchurch | 92,733 | 105,670 | 118,501 | 132,282 | 149,570 | 150,047 |
| Dunedin | 68,716 | 72,255 | 85,095 | 81,848 | 83,191 | 83,351 |
| Hamilton | 8,980 | 13,798 | 16,538 | 19,373 | 25,945 | 26,401 |
| Gisborne | 12,660 | 14,450 | 14,789 | 15,521 | 16,111 | 16,984 |
| Napier | 15,131 | 17,187 | 18,066 | 18,443 | 19,821 | 20,297 |
| Hastings | 11,018 | 12,990 | 14,460 | 17,715 | 19,741 | 20,330 |
| New Plymouth | 9,795 | 12,645 | 15,931 | 18,194 | 20,229 | 20,642 |
| Wanganui | 19,517 | 23,523 | 26,129 | 25,312 | 25,767 | 26,462 |
| Palmerston North | 14,006 | 16,885 | 19,709 | 23,953 | 27,091 | 27,294 |
| Nelson | 9,962 | 10,632 | 11,752 | 13,545 | 16,483 | 16,577 |
| Timaru | 13,716 | 15,507 | 16,822 | 18,805 | 19,569 | 19,596 |
| Invercargill | 17,862 | 19,210 | 21,849 | 25,682 | 27,464 | 27,583 |
The next table presents the population (including Maoris) as estimated at the 1st April, 1948, for the component cities, boroughs, and town districts included in the relevant urban areas.
| Urban Area. | Population (Including Maoris). |
|---|---|
*Excludes a small area which, though part of the borough, is not within the urban area. † City from 21st January, 1949. ‡ City from 5th November, 1948. | |
| Auckland | |
| Auckland City | 135,900 |
| Birkenhead Borough | 4,140 |
| Northcote Borough | 2,820 |
| Takapuna Borough* | 11,250 |
| Devonport Borough | 11,700 |
| New Lynn Borough | 4,970 |
| Mount Albert Borough | 26,500 |
| Mount Eden Borough | 21,400 |
| Newmarket Borough | 3,060 |
| Ellerslie Borough | 3,340 |
| One Tree Hill Borough | 13,350 |
| Mount Roskill Borough | 15,700 |
| Onehunga Borough | 15,700 |
| Otahuhu Borough | 8,070 |
| Remainder of urban area | 11,900 |
| Total | 289,800 |
| Wellington | |
| Wellington City | 131,600 |
| Lower Hutt City* | 34,100 |
| Petone Borough | 11,600 |
| Eastbourne Borough* | 2,650 |
| Johnsonville Town District | 3,010 |
| Remainder of urban area | 3,140 |
| Total | 186,100 |
| Christchurch | |
| Christchurch City | 123,900 |
| Riccarton Borough | 8,360 |
| Lyttelton Borough* | 3,110 |
| Remainder of urban area | 28,630 |
| Total | 164,000 |
| Dunedin | |
| Dunedin City | 70,200 |
| Port Chalmers Borough | 2,690 |
| West Harbour Borough | 2,100 |
| St. Kilda Borough | 7,640 |
| Green Island Borough* | 2,920 |
| Remainder of urban area | 3,250 |
| Total | 88,800 |
| Hamilton | |
| Hamilton City | 24,500 |
| Remainder of urban area | 4,900 |
| Total | 29,400 |
| Gisborne | |
| Gisborne Borough | 16,150 |
| Remainder of urban area | 2,350 |
| Total | 18,500 |
| Napier | |
| Napier Borough | 18,900 |
| Taradale Town District | 1,920 |
| Remainder of urban area | 1,380 |
| Total | 22,200 |
| Hastings | |
| Hastings Borough | 16,450 |
| Havelock North Town District | 1,580 |
| Remainder of urban area | 4,570 |
| Total | 22,600 |
| New Plymouth | |
| New Plymouth Borough† | 20,400 |
| Remainder of urban area | 2,200 |
| Total | 22,600 |
| Wanganui | |
| Wanganui City | 25,400 |
| Remainder of urban area | 2,800 |
| Total | 28,200 |
| Palmerston North | |
| Palmerston North City | 27,900 |
| Remainder of urban area | 2,200 |
| Total | 30,100 |
| Nelson | |
| Nelson City | 14,400 |
| Tahunanui Town District | 1,280 |
| Remainder of urban area | 2,520 |
| Total | 18,200 |
| Timaru | |
| Timaru Borough‡ | 19,850 |
| Remainder of urban area | 1,250 |
| Total | 21,100 |
| Invercargill | |
| Invercargill City | 25,800 |
| South Invercargill Borough | 1,220 |
| Remainder of urban area | 2,980 |
| Total | 30,000 |
Counties.—The following table gives the estimated population (including Maoris) of individual counties at 1st April, 1948, together with the approximate area of each. It should be noted that “Administrative Counties” do not include boroughs or town districts independent of county control, but include dependent town districts.
| Administrative County. | Population (Including Maoris). | Approximate Area, in Square Miles. |
|---|---|---|
| North Island— | ||
| Mangonui | 8,220 | 958 |
| Whangaroa | 2,600 | 240 |
| Hokianga | 8,460 | 613 |
| Bay of Islands | 11,220 | 824 |
| Whangarei | 12,420 | 1,044 |
| Hobson | 6,050 | 746 |
| Otamatea | 5,630 | 421 |
| Rodney | 5,420 | 477 |
| Waitemata | 21,100 | 607 |
| Eden | 4,200 | 7 |
| Great Barrier Island | 190 | 110 |
| Manukau | 13,700 | 240 |
| Franklin | 16,550 | 551 |
| Raglan | 11,350 | 936 |
| Waikato | 15,130 | 646 |
| Waipa | 15,220 | 435 |
| Otorohanga | 6,220 | 600 |
| Kawhia | 2,100 | 330 |
| Waitomo | 7,150 | 1,137 |
| Taumarunui | 3,200 | 878 |
| Coromandel | 2,380 | 439 |
| Thames | 2,420 | 419 |
| Hauraki Plains | 5,050 | 233 |
| Ohinemuri | 3,200 | 237 |
| Piako | 11,550 | 444 |
| Matamata | 11,850 | 931 |
| Tauranga | 12,350 | 608 |
| Rotorua | 7,080 | 988 |
| Taupo | 5,820 | 3,268 |
| Whakatane | 11,300 | 1,677 |
| Opotiki | 5,070 | 1,408 |
| Matakaoa | 2,030 | 295 |
| Waiapu | 6,490 | 793 |
| Uawa | 1,590 | 261 |
| Waikohu | 3,420 | 1,060 |
| Cook | 7,260 | 791 |
| Wairoa | 8,590 | 1,373 |
| Hawkes Bay | 15,700 | 1,672 |
| Waipawa | 3,320 | 524 |
| Waipukurau | 1,070 | 128 |
| Patangata | 2,620 | 651 |
| Dannevirke | 4,500 | 426 |
| Woodville | 1,840 | 156 |
| Weber | 320 | 118 |
| Ohura | 1,780 | 416 |
| Whangamomona | 880 | 447 |
| Clifton | 2,600 | 444 |
| Taranaki | 6,970 | 229 |
| Inglewood | 3,160 | 187 |
| Egmont | 4,680 | 239 |
| Stratford | 4,950 | 419 |
| Eltham | 3,460 | 207 |
| Waimate West | 2,940 | 83 |
| Hawera | 5,870 | 191 |
| Patea | 3,650 | 591 |
| Kaitieke | 3,240 | 550 |
| Waimarino | 2,870 | 883 |
| Waitotara | 3,540 | 468 |
| Wanganui | 3,620 | 460 |
| Rangitikei | 9,380 | 1,675 |
| Kiwitea | 2,250 | 359 |
| Pohangina | 1,300 | 259 |
| Oroua | 3,910 | 190 |
| Manawatu | 5,870 | 265 |
| Kairanga | 5,910 | 187 |
| Horowhenua | 8,440 | 544 |
| Hutt | 12,350 | 450 |
| Makara | 5,570 | 101 |
| Pahiatua | 3,250 | 286 |
| Akitio | 1,020 | 321 |
| Castlepoint | 510 | 203 |
| Eketahuna | 1,880 | 311 |
| Mauriceville | 570 | 115 |
| Masterton | 3,230 | 586 |
| Wairarapa South | 2,880 | 440 |
| Featherston | 3,540 | 952 |
| Totals | 439,020 | 43,758 |
| South Island— | ||
| Sounds | 990 | 505 |
| Marlborough | 8,150 | 1,920 |
| Awatere | 1,490 | 1,019 |
| Kaikoura | 2,940 | 929 |
| Amuri | 2,380 | 2,256 |
| Cheviot | 1,290 | 327 |
| Waimea | 12,450 | 1,539 |
| Takaka | 1,830 | 456 |
| Collingwood | 1,010 | 562 |
| Buller | 5,190 | 1,950 |
| Murchison | 1,310 | 1,412 |
| Inangahua | 3,460 | 949 |
| Grey | 4,910 | 1,579 |
| Westland | 4,550 | 4,410 |
| Waipara | 2,440 | 937 |
| Kowai | 1,810 | 157 |
| Ashley | 620 | 309 |
| Rangiora | 3,010 | 96 |
| Eyre | 1,730 | 175 |
| Oxford | 1,540 | 318 |
| Tawera | 630 | 941 |
| Malvern | 2,890 | 250 |
| Paparua | 7,570 | 136 |
| Waimairi | 18,900 | 48 |
| Heathcote | 5,850 | 19 |
| Halswell | 2,200 | 40 |
| Mount Herbert | 510 | 66 |
| Akaroa | 1,470 | 169 |
| Chatham Islands | 510 | 372 |
| Wairewa | 910 | 170 |
| Springs | 1,950 | 91 |
| Ellesmere | 2,860 | 230 |
| Selwyn | 1,500 | 954 |
| Ashburton | 10,300 | 2,459 |
| Geraldine | 5,500 | 691 |
| Levels | 4,200 | 263 |
| Mackenzie | 3,850 | 2,739 |
| Waimate | 6,140 | 1,383 |
| Waitaki | 9,450 | 2,392 |
| Waihemo | 1,050 | 338 |
| Waikouaiti | 3,470 | 312 |
| Peninsula | 3,190 | 40 |
| Taieri | 5,500 | 902 |
| Bruce | 3,910 | 520 |
| Clutha | 5,720 | 1,025 |
| Tuapeka | 4,220 | 1,388 |
| Maniatoto | 2,810 | 1,340 |
| Vincent | 3,880 | 2,922 |
| Lake | 1,420 | 3,872 |
| Southland | 24,670 | 3,724 |
| Wallace | 9,000 | 3,727 |
| Fiord | 3,035 | |
| Stewart Island | 350 | 670 |
| Totals | 219,480 | 59,033 |
| Grand totals | 658,500 | 102,791 |
Boroughs.—Similar information as in the case of counties is now given for boroughs.
| Borough. | Population (Including Maoris). | Approximate Area, in Acres. |
|---|---|---|
*City from 21st January, 1949. | ||
| North Island— | ||
| Kaitaia | 1,460 | 1,310 |
| Kaikohe | 1,190 | 1,342 |
| Whangarei | 10,350 | 3,354 |
| Dargaville | 2,500 | 2,800 |
| Helensville | 1,130 | 1,315 |
| Birkenhead | 4,140 | 3,084 |
| Northcote | 2,820 | 1,190 |
| Takapuna | 11,500 | 2,780 |
| Devonport | 11,700 | 1,100 |
| Henderson | 1,720 | 1,265 |
| New Lynn | 4,970 | 1,392 |
| Auckland (City) | 135,900 | 18,253 |
| Mount Albert | 26,500 | 2,430 |
| Mount Eden | 21,400 | 1,476 |
| Newmarket | 3,060 | 182 |
| Ellerslie | 3,340 | 745 |
| One Tree Hill | 13,350 | 2,430 |
| Mount Roskill | 15,700 | 4,605 |
| Onehunga | 15,700 | 1,876 |
| Otahuhu | 8,070 | 1,345 |
| Papatoetoe | 4,160 | 1,267 |
| Manurewa | 2,170 | 1,960 |
| Papakura | 2,500 | 2,010 |
| Pukekohe | 3,610 | 3,470 |
| Huntly | 3,080 | 1,363 |
| Ngaruawahia | 1,770 | 1,112 |
| Hamilton (City) | 24,500 | 3,740 |
| Cambridge | 2,760 | 1,280 |
| Te Awamutu | 3,300 | 1,162 |
| Te Kuiti | 2,890 | 1,668 |
| Taumarunui | 2,850 | 1,925 |
| Thames | 4,430 | 2,712 |
| Paeroa | 2,380 | 1,419 |
| Waihi | 3,920 | 4,094 |
| Te Aroha | 2,570 | 2,783 |
| Morrinsville | 2,380 | 950 |
| Matamata | 1,840 | 934 |
| Putaruru | 1,270 | 975 |
| Mount Maunganui | 1,220 | 935 |
| Tauranga | 5,750 | 1,368 |
| Te Puke | 1,230 | 1,047 |
| Rotorua | 9,050 | 3,738 |
| Whakatane | 3,080 | 1,524 |
| Opotiki | 1,720 | 772 |
| Gisborne | 16,150 | 3,378 |
| Wairoa | 3,070 | 1,603 |
| Napier | 18,900 | 2,456 |
| Hastings | 16,450 | 2,612 |
| Waipawa | 1,220 | 1,710 |
| Waipukurau | 2,220 | 971 |
| Dannevirke | 4,550 | 1,300 |
| Woodville | 1,170 | 1,054 |
| Waitara | 2,540 | 1,587 |
| New Plymouth* | 20,400 | 4,132 |
| Inglewood | 1,360 | 703 |
| Opunake | 970 | 676 |
| Stratford | 4,080 | 2,016 |
| Eltham | 1,950 | 1,599 |
| Hawera | 5,160 | 897 |
| Patea | 1,560 | 1,420 |
| Ohakune | 1,490 | 2,079 |
| Raetihi | 1,130 | 958 |
| Wanganui (City) | 25,400 | 5,726 |
| Taihape | 2,290 | 1,923 |
| Marton | 3,120 | 1,415 |
| Feilding | 5,280 | 2,031 |
| Foxton | 1,820 | 757 |
| Palmerston N. (City) | 27,900 | 4,851 |
| Shannon | 970 | 844 |
| Levin | 3,660 | 1,332 |
| Otaki | 2,250 | 1,390 |
| Upper Hutt | 6,220 | 2,165 |
| Lower Hutt (City) | 38,500 | 7,688 |
| Petone | 11,600 | 1,132 |
| Eastbourne | 2,690 | 1,546 |
| Wellington (City) | 131,600 | 16,289 |
| Pahiatua | 1,850 | 720 |
| Eketahuna | 700 | 948 |
| Masterton | 10,400 | 3,002 |
| Carterton | 2,010 | 1,265 |
| Greytown | 1,220 | 1,927 |
| Featherston | 1,010 | 759 |
| Martinborough | 930 | 1,070 |
| Totals | 776,720 | 188,413 |
| Borough. | Population (Including Maoris). | Approximate Area, in Acres. |
|---|---|---|
* City from 5th November, 1948. | ||
| South Island— | ||
| Picton | 1,680 | 1,052 |
| Blenheim | 6,400 | 1,640 |
| Nelson (City) | 14,400 | 4,966 |
| Richmond | 1,550 | 2,600 |
| Motueka | 2,090 | 2,523 |
| Westport | 5,050 | 760 |
| Runanga | 1,850 | 1,186 |
| Greymouth | 8,880 | 2,522 |
| Brunner | 1,080 | 5,700 |
| Kumara | 420 | 842 |
| Hokitika | 2,890 | 674 |
| Ross | 460 | 3,800 |
| Rangiora | 2,530 | 877 |
| Kaiapoi | 1,900 | 877 |
| Riccarton | 8,360 | 728 |
| Christchurch (City) | 123,900 | 16,788 |
| Lyttelton | 3,390 | 2,540 |
| Akaroa | 530 | 233 |
| Ashburton | 8,250 | 1,860 |
| Geraldine | 960 | 566 |
| Temuka | 2,170 | 795 |
| Timaru* | 19,850 | 2,895 |
| Waimate | 2,710 | 771 |
| Oamaru | 7,950 | 1,386 |
| Hampden | 240 | 630 |
| Palmerston | 750 | 900 |
| Waikouaiti | 620 | 1,958 |
| Port Chalmers | 2,690 | 627 |
| West Harbour | 2,100 | 2,382 |
| Dunedin (City) | 70,200 | 15,836 |
| St. Kilda | 7,640 | 462 |
| Green Island | 3,010 | 877 |
| Mosgiel | 2,490 | 965 |
| Milton | 1,540 | 315 |
| Kaitangata | 1,370 | 1,280 |
| Balclutha | 2,330 | 993 |
| Tapanui | 290 | 129 |
| Lawrence | 580 | 615 |
| Roxburgh | 540 | 515 |
| Naseby | 150 | 112 |
| Alexandra | 1,140 | 815 |
| Cromwell | 760 | 806 |
| Arrowtown | 200 | 457 |
| Queenstown | 920 | 270 |
| Gore | 5,280 | 1,940 |
| Mataura | 1,610 | 1,272 |
| Winton | 1,040 | 505 |
| Invercargill (City) | 25,800 | 6,399 |
| South Invercargill | 1,220 | 2,257 |
| Bluff | 2,170 | 2,111 |
| Riverton | 930 | 718 |
| Totals | 366,860 | 104,727 |
| Grand totals | 11,143,580 | 293,140 |
Town Districts.—As stated earlier, the population of independent town districts—i.e., those contained in section (a) of the following table—is not included with that of the counties in which the town districts are located, but the population of dependent town districts—section (b)—is included with that of the respective parent county.
| Town District. | Population (Including Maoris). | Approximate Area, in Acres. |
|---|---|---|
*Parent country shown in parentheses. | ||
| (a) Town Districts not Forming Parts of Counties | ||
| North Island— | ||
| Hikurangi | 1,060 | 960 |
| Kamo | 610 | 852 |
| Warkworth | 650 | 1,420 |
| Glen Eden | 1,910 | 1,267 |
| Howick | 1,540 | 1,091 |
| Waiuku | 1,020 | 1,275 |
| Tuakau | 950 | 1,265 |
| Leamington | 670 | 1,330 |
| Otorohanga | 1,020 | 280 |
| Manunui | 750 | 1,251 |
| Taupo | 850 | 2,290 |
| Taradale | 1,920 | 1,469 |
| Havelock North | 1,580 | 835 |
| Ohura | 480 | 815 |
| Manaia | 650 | 510 |
| Waverley | 810 | 484 |
| Mangaweka | 290 | 955 |
| Hunterville | 530 | 791 |
| Bulls | 630 | 677 |
| Johnsonville | 3,010 | 842 |
| Totals | 20,930 | 20,59 |
| South Island— | ||
| Tahunanui | 1,280 | 520 |
| Takaka | 530 | 585 |
| Leeston | 640 | 391 |
| Tinwald | 690 | 1,525 |
| Pleasant Point | 500 | 730 |
| Wyndham | 550 | 680 |
| Lumsden | 490 | 1,264 |
| Nightcaps | 620 | 285 |
| Otautau | 630 | 954 |
| Totals | 5,930 | 6,934 |
| Grand totals | 26,860 | 27,593 |
| (b) Town Districts Forming Parts of Counties* | ||
| North Island— | ||
| Kohukohu (Hokianga) | 240 | 1,020 |
| Rawene (Hokianga) | 430 | 280 |
| Russell (Bay of Islands) | 480 | 1,066 |
| Kawakawa (Bay of Islands) | 640 | 280 |
| Onerahi (Whangarei) | 520 | 990 |
| Mercer (Franklin) | 300 | 1,000 |
| Te Kauwhata (Waikato) | 480 | 1,290 |
| Ohaupo (Waipa) | 250 | 1,283 |
| Kihikihi (Waipa) | 420 | 523 |
| Kawhia (Kawhia) | 280 | 470 |
| Te Karaka (Waikohu) | 380 | 700 |
| Patutahi (Cook) | 200 | 1,275 |
| Kaponga (Eltham) | 400 | 558 |
| Normanby (Hawera) | 310 | 260 |
| Totals | 5,330 | 10,995 |
| South Island— | ||
| Havelock (Marlborough) | 240 | 210 |
| Southbridge (Ellesmere) | 390 | 531 |
| Outram (Taieri) | 360 | 886 |
| Edendale (Southland) | 470 | 696 |
| Totals | 1,460 | 2,323 |
| Grand totals | 6,790 | 13,318 |
Extra-county Islands and Migratory Population.—In addition to the populations quoted for administrative counties, cities and boroughs, and independent town districts, the New Zealand totals include migratory population and persons located on islands not within the boundaries of any county. The two latter categories comprised an estimated 5,330 people at the 1st April, 1948.
Of the islands concerned, Waiheke was the only one with a reasonably sized population, which was estimated at 1,130 for 1st April, 1948.
AGE DISTRIBUTION.—The following table shows the estimated age distribution of the population at 31st December, 1947. The figures are based on the 1945 census data and brought up to date from statistics of births, ages of persons dying, and ages of persons arriving in or departing from New Zealand.
| Age-group. | Excluding Maoris. | Maoris. | ||||
|---|---|---|---|---|---|---|
| Males. | Females. | Totals. | Males. | Females. | Totals. | |
| Under 5 | 93,754 | 89,645 | 183,399 | 10,054 | 9,521 | 19,575 |
| 5–9 | 76,200 | 74,400 | 150,600 | 8,325 | 8,050 | 16,375 |
| 10–14 | 60,600 | 58,400 | 119,000 | 7,250 | 6,875 | 14,125 |
| 15–19 | 63,900 | 61,300 | 125,200 | 6,025 | 5,900 | 11,925 |
| 20–24 | 65,200 | 65,500 | 130,700 | 4,375 | 4,675 | 9,050 |
| 25–29 | 63,200 | 66,500 | 129,700 | 3,850 | 3,775 | 7,625 |
| 30–34 | 65,300 | 66,100 | 131,400 | 3,250 | 3,250 | 6,500 |
| 35–39 | 64,100 | 62,500 | 126,600 | 2,950 | 2,575 | 5,525 |
| 40–44 | 58,300 | 55,600 | 113,900 | 2,400 | 2,175 | 4,575 |
| 45–49 | 51,200 | 49,700 | 100,900 | 1,900 | 1,575 | 3,475 |
| 50–54 | 41,500 | 45,300 | 86,800 | 1,550 | 1,250 | 2,800 |
| 55–59 | 40,000 | 41,900 | 81,900 | 1,100 | 800 | 1,900 |
| 60–64 | 38,900 | 39,100 | 78,000 | 925 | 750 | 1,675 |
| 65–69 | 33,500 | 34,500 | 68,000 | 725 | 600 | 1,325 |
| 70–74 | 21,900 | 22,900 | 44,800 | 475 | 400 | 875 |
| 75 and over | 20,500 | 23,600 | 44,100 | 375 | 375 | 750 |
| Total under 14 | 218,800 | 211,000 | 429,800 | 24,200 | 23,200 | 47,400 |
| Total under 16 | 242,700 | 234,000 | 476,700 | 26,900 | 25,800 | 52,700 |
| Total under 21 | 307,700 | 296,600 | 604,300 | 32,600 | 31,400 | 64,000 |
| Totals 21 and over | 550,354 | 560,345 | 1,110,699 | 22,929 | 21,146 | 44,075 |
| Total population | 858,054 | 856,945 | 1,714,999 | 55,529 | 52,546 | 108,075 |
DENSITY OF POPULATION.—The total area of New Zealand is approximately 103,939 square miles. Omitting the annexed islands and certain outlying islands, the area of the land-mass remaining is 103,416 square miles. This calculation it should he explained, includes all inland waters—viz., lakes, rivers, harbours, estuaries, &c. It should be noted also that there is a great deal of high mountainous country in New Zealand, particularly in the South Island, while there are also great areas of broken, swampy, or hilly country which is either incapable of effective use or which can be used profitably only for pastoral purposes, afforestation, or the like.
The density of population at the 1945 census may be quoted as 16.46 persons to the square mile. This figure would be higher if members of the Armed Forces serving overseas were included in the population.
The area and population of individual towns and counties will be found in preceding tables in this section. At the 1915 census, density of population in the various provincial districts was:—
| Persons per Square Mile. | |
|---|---|
| Auckland | 25.24 |
| Hawkes Bay | 18.56 |
| Taranaki | 20.49 |
| Wellington | 32.14 |
| Marlborough | 4.91 |
| Nelson | 5.26 |
| Westland | 3.49 |
| Canterbury | 17.71 |
| Otago—Otago | 10.25 |
| Southland | 6.28 |
Attention must be drawn to the necessity for the exercise of discretion in the use of data concerning density of population, particularly in comparing one country with another. Areas may be calculated in many ways, while area itself may have little relationship to potentiality of use. In the case of urban population, it is impossible to obtain the aggregate area of sites actually in occupation by business premises, residences, &c. Many boroughs contain within their boundaries large reserves which, with farming and other unbuilt-on land, tend to disguise the actual relation of population to area.
MAORI POPULATION.—A record of early statistics of Maoris is given in Vol. III of the 1936 Census Results. The first official general census was taken in 1857–58, and others occurred in regular sequence from 1874 onwards. Owing to inherent difficulties the earlier census records make no pretence towards complete accuracy, and even some later enumerations hardly claim to be more than approximations.
Available statistical evidence points to a decline in the numbers of the Maori race following the advent of Europeans, but this decline was commonly exaggerated by early writers. Of later years an unmistakable and now fairly rapid increase has been noted. This gain, however, has been accompanied by a very considerable dilution of blood.
The latest Maori population figure available, at the 1st April, 1948, is 109,003, which is an increase of 3,304 on the total for the previous year.
The census record of Maori population is given below:—
| Year. | Maori Population. | Numerical Increase. | Percentage Increase. |
|---|---|---|---|
NOTE.—Minus sign (-) denotes a decrease. *Includes members of Armed Forces overseas at census date. | |||
| 1857–58 | 56,049 | ||
| 1874 | 47,330 | -8,719 | -15.6 |
| 1878 | 45,542 | -1,788 | -3.8 |
| 1881 | 46,141 | 599 | 1.3 |
| 1886 | 43,927 | -2,214 | -4.8 |
| 1891 | 44,177 | 250 | 0.6 |
| 1896 | 42,113 | -2,064 | -4.7 |
| 1901 | 45,549 | 3,436 | 8.2 |
| 1906 | 50,309 | 4,760 | 10.5 |
| 1911 | 52,723 | 2,414 | 4.8 |
| 1916 | 52,997 | 274 | 0.5 |
| 1921 | 56,987 | 3,990 | 7.5 |
| 1926 | 63,670 | 6,683 | 11.7 |
| 1936 | 82,326 | 18,656 | 29.3 |
| 1945 | 98,744 | 16,418 | 19.9 |
| 1945* | 100,044 | 17,718 | 21.5 |
The percentage increase from 1936 to 1945 was 19.94, equivalent to an average annual increase of 1.93 per cent. These percentages, it will be noted, are considerably higher than the corresponding figures for the European population—viz., 7.51 per cent. and 0.77 per cent. Movements of troops have tended to invalidate this comparison; the natural increase ratios for the year 1947–48 afford a better illustration. These are:—
| European. | Maori. | |
|---|---|---|
| Birth-rate | 25.79 | 45.49 |
| Death-rate | 9.20 | 14.01 |
| Natural-increase rate | 16.59 | 31.48 |
Of the 109,003 Maoris at 1st April, 1948, 105,426 were in the North Island. Auckland Provincial District contains the bulk of the Maoris, particularly in the Auckland Peninsula and Poverty Bay regions. In the South Island, Maoris do not attain any numerical significance.
The records of the 1936 and 1945 censuses permit of a statement of the total numbers wholly or partly of Maori blood. Figures for the 1945 census are not yet available showing numbers in each blood division of those counted in the Maori population.
| 1936. | 1945. | |
|---|---|---|
| Counted in the Maori population— | ||
| Full Maori | 55,915 | 98,744 |
| Maori-Europeans— | ||
| Three-quarter caste | 11,397 | |
| Half-caste | 14,891 | |
| Degree not specified | 123 | |
| Totals | 82,326 | 98,744 |
| Counted in the population other than Maori— | ||
| 1936. | 1945. | |
| Maori-European quarter-caste | 11,508 | 16,902 |
| Maori-Polynesian | 102 | 263 |
| Maori-Japanese | 9 | 20 |
| Maori-Chinese | 38 | 198 |
| Maori-Indian | 41 | 134 |
| Maori-Syrian | 26 | 57 |
| Maori-American Indian | 3 | 28 |
| Maori-Negro | 19 | |
| Maori-Filipino | 8 | |
| Maori-West Indian | 11 | |
| Maori-Melanesian | 10 | |
| Totals | 11,727 | 17,650 |
In 1945 there were recorded in New Zealand some 116,394 persons wholly or partly of Maori origin, compared with 94,053 in 1936.
Table of Contents
REGISTRATION.—An ordinance which came into force from 1st January, 1848, made provision for a Government record of births and deaths. While this Ordinance did not precisely make registration of births compulsory, it did make notification of births compulsory and also required registration particulars to be furnished on request made by a Deputy Registrar. Under its provisions many registrations were made, some of births as early as 1840. However, for some years (certainly until 1854 and possibly a year or so later) the requirements of the Ordinance were not fully known or appreciated, and it cannot be said to have been completely enforced during this period. The Registration Act, 1858, operative from 1st January, 1859, provided for compulsory registration of births. Registration of still-births, previously not provided for, was made compulsory from the 1st March, 1913.
The law as to registration of births is now embodied in the Births and Deaths Registration Act, 1924, a consolidation of the then existing legislation. The provisions generally as to registration are that a birth may be registered within sixty-two days without fee. After sixty-two days and within six months a birth is registrable only after a statutory declaration, of the particulars required to be registered, has been made before the Registrar by the parent or some person present at birth and on payment of a fee of 5s. When six months have elapsed, and a conviction for neglect to register has been entered against the persons responsible, a birth may be registered with a Registrar of Births within one month after conviction, and in this case no fee is payable. An information for such neglect must be laid within two years of date of birth.
Notwithstanding the foregoing provisions, power is given by the Act of 1924 for the Registrar-General to register an unregistered birth which occurred in New Zealand, irrespective of the time that may have elapsed. Satisfactory evidence on oath, and such other proof as the Registrar-General may deem necessary, are required, together with the payment of a fee of 5s. This provision does not, however, relieve any person from liability to prosecution for failure to register in the proper manner.
Although sixty-two days are allowed for the registration of a birth, it is compulsory to notify the birth to the Registrar within a much shorter interval—viz., forty-eight hours if in a city or borough and twenty-one days in every other case.
Particulars now required to be registered are: date and place of birth; name and sex of child; names, ages, and birthplaces of parents; occupation of father; maiden name of mother; date and place of parents' marriage; and ages and sex of previous issue (distinguishing living and dead) of the marriage. The father of an illegitimate child is not required to give information, nor is his name entered in the register unless at the joint request of the mother and himself, or unless he subsequently marries the mother (see pp. 52–53). A child born out of Now Zealand but arriving before attaining the age of eighteen months may be registered within six months of arrival.
Birth statistics are compiled from the records of the Registrar-General. The births covered by a year's statistics are those registered during the year irrespective of the year of birth. The figures do not include still-births, except in the special classification on page 54.
Registration of Maori Births.—In the successive Registration Acts special provision was made for exemption from the necessity of registration in the case of births and deaths of Maoris, though registration could be effected if desired. Section 20 of the Births and Deaths Registration Amendment Act, 1912 (now section 60 of the Births and Deaths Registration Act, 1924), empowered the making of regulations to provide for the registration of births and deaths of Maoris. Regulations were made accordingly, and Maori births and deaths became registrable as from the 1st March, 1913. The number of Registrars of Maori Births and Deaths is over 250, most of these being in the North Island, where the great majority of the Maori population is located. Every Maori settlement of any size is within easy reach of one of these Registrars. Maori registrations are entered in a separate register, and the figures of births given in the following pages do not include those of Maoris, which are dealt with in Subsection D.
NUMBERS AND RATES.—The general long-term history of the birth-rate in New Zealand has been downward. A reference to the diagram on page 45 and to the table on page 44, showing quinquennial average birth-rates, indicates this trend very clearly. After the pioneering days of the nineteenth century, when the population consisted very largely of young immigrants faced with the necessity of raising a largo family, the birth-rate began to decline appreciably. A further migration wave at the turn of the century reversed the trend temporarily, but in 1909 the downward movement was again resumed. With minor fluctuations in the earlier stages and in the years influenced by the 1914–18 war this decline continued until 1936. In that year a slight upward movement began, and by 1940 some of the deficit had been made up by the gradual rise. This was accelerated during the war years (with minor fluctuations) until successive record high totals (as regards the numbers of births) were established in 1945, 1946, and 1947. It is necessary to go back thirty-five years, to 1912, to find a higher birthrate in New Zealand than that of 26.42 recorded for 1947. The numbers and rates of births (children born alive) for each of the last twenty years are given in the following table.
| Year. | Number. | Rate per 1,000 of Population. |
|---|---|---|
| 1928 | 27,200 | 19.57 |
| 1929 | 26,747 | 19.03 |
| 1930 | 26,797 | 18.33 |
| 1931 | 26,622 | 18.45 |
| 1932 | 24,884 | 17.12 |
| 1933 | 24,334 | 16.63 |
| 1934 | 24,322 | 16.51 |
| 1935 | 23,965 | 16.17 |
| 1936 | 24,837 | 16.64 |
| 1937 | 26,014 | 17.29 |
| 1938 | 27,249 | 17.93 |
| 1939 | 28,833 | 18.73 |
| 1940 | 32,771 | 21.19 |
| 1941 | 35,100 | 22.81 |
| 1942 | 33,574 | 21.73 |
| 1943 | 30,311 | 19.70 |
| 1944 | 33,599 | 21.59 |
| 1945 | 37,007 | 23.22 |
| 1946 | 41,871 | 25.24 |
| 1947 | 44,816 | 26.42 |
Much of the movement in the birth-rate during recent years has been allied to the marriage-rate.
During the depression years there was a cessation of the normal annual increase in the number of marriages expected in a growing country, and correspondingly the first-birth rate remained at a low figure.
When the country emerged from the depression the effect of postponed marriages and child-bearing manifested itself immediately, and the first-birth rate rose rapidly. Again added impetus was given to this rate during the early war years, when, for obvious reasons, there was a decided rise in the marriage-rate. As the war proceeded the number of marriages declined somewhat, with a marked effect on the first-birth rate. With the end of hostilities and the release of men from the Forces the number of births rose rapidly, with first births the major factor in this increase.
A special table has been prepared for the first time illustrating the movements in the birth-rates by order of birth. While first births account for a high percentage of the substantial rise in the number of births and in the crude birth-rate from 1936 to 1947, there is evidence that there has been a simultaneous substantial increase in the proportion of couples having a second and third child. This increase, however, cannot be taken as indicating that the decline in size of the average family has been reversed or even arrested, as it may simply be a manifestation of the gains in one period being offset by the losses in another, the over-all trend being neither upward nor downward. A tendency for couples to marry and have children in prosperous years rather than in depression years is clearly demonstrated in the table, the effect of the depression periods between the two wars being evidenced in the low rates pertaining to those years. The rates, which are per 1,000 of all women aged fifteen to forty-nine, are shown by order of birth. Figures for 1922 and 1942 are not available.
| Place. | First. | Second. | Third. | Fourth. | Fifth. | Sixth and Seventh. | Eighth and Higher. |
|---|---|---|---|---|---|---|---|
| 1921 | 29.2 | 17.3 | 11.9 | 8.8 | 6.1 | 6.5 | 4.2 |
| 1923 | 22.9 | 19.4 | 12.6 | 7.8 | 5.2 | 5.8 | 4.0 |
| 1924 | 23.5 | 18.4 | 13.1 | 8.0 | 5.0 | 5.7 | 4.0 |
| 1925 | 23.3 | 17.7 | 12.6 | 7.9 | 5.0 | 5.3 | 3.8 |
| 1926 | 23.3 | 17.1 | 12.1 | 7.9 | 5.1 | 5.0 | 3.6 |
| 1927 | 22.9 | 16.7 | 11.7 | 7.3 | 4.8 | 4.9 | 3.3 |
| 1928 | 22.0 | 17.0 | 11.2 | 7.1 | 4.4 | 4.7 | 3.1 |
| 1929 | 22.1 | 16.3 | 11.0 | 6.8 | 4.2 | 4.4 | 2.9 |
| 1930 | 23.0 | 15.8 | 10.5 | 6.4 | 4.1 | 4.3 | 2.7 |
| 1931 | 22.2 | 16.2 | 10.4 | 6.5 | 4.0 | 3.9 | 2.7 |
| 1932 | 20.7 | 15.1 | 9.5 | 5.9 | 3.7 | 3.7 | 2.4 |
| 1933 | 20.1 | 15.1 | 9.4 | 5.5 | 3.5 | 3.5 | 2.3 |
| 1934 | 20.5 | 14.9 | 9.6 | 5.5 | 3.4 | 3.3 | 2.1 |
| 1935 | 20.7 | 14.6 | 9.4 | 5.4 | 3.0 | 3.2 | 1.9 |
| 1936 | 22.9 | 15.1 | 8.9 | 5.3 | 3.1 | 2.9 | 1.8 |
| 1937 | 24.8 | 15.7 | 9.2 | 5.1 | 3.0 | 2.8 | 1.7 |
| 1938 | 26.5 | 16.8 | 9.3 | 5.1 | 2.9 | 2.7 | 1.6 |
| 1939 | 28.2 | 18.2 | 9.8 | 5.1 | 2.9 | 2.5 | 1.5 |
| 1940 | 31.9 | 21.1 | 11.0 | 5.4 | 2.9 | 2.7 | 1.6 |
| 1941 | 32.7 | 23.1 | 12.6 | 6.0 | 3.0 | 2.6 | 1.4 |
| 1943 | 22.2 | 18.8 | 13.4 | 6.8 | 3.4 | 2.7 | 1.5 |
| 1944 | 23.1 | 20.0 | 14.9 | 8.1 | 4.0 | 3.1 | 1.5 |
| 1945 | 26.9 | 21.4 | 16.0 | 8.9 | 4.5 | 3.4 | 1.6 |
| 1946 | 35.1 | 23.2 | 16.2 | 9.4 | 4.4 | 3.6 | 1.5 |
| 1947 | 39.9 | 26.0 | 15.5 | 8.8 | 4.5 | 3.4 | 1.5 |
The very high levels reached by first-birth rates in recent years, together with the steep rise in the second- and third-birth rates, are the salient features in the above table, while the combined rates for the first three birth orders for 1947 recorded a 39-per-cent. increase over that for 1921. An explanation of the high rates ruling for second and third births is probably the delayed results of the high marriage rates of several years before, but the effect of the family allowance benefits under the Social Security Act may also have been a factor, the extent of which it is impossible to gauge.
The reduction over the period in the size of the family to less than five is clearly demonstrated. This diminution in the average size of the family to the point where one comprising eight or more children is a rarity calls for a change of outlook in what can be correctly designated as a “large” family, anything over six or even perhaps five children now falling into this category. There are, however, indications that the rate of decline in the average size of the family has been retarded somewhat, but a conclusion that there is at present a reversal of the long-term trend towards smaller families cannot be justified at this stage.
Comparisons of birth-rates over a series of years or between different countries are usually made on the basis of the “crude” rates—i.e., the number of births per 1,000 of the mean population, irrespective of sex or age.
The “crude” rates do not permit of allowance being made for variations in the proportion of women of the child-bearing ages, and it is advisable and of interest to supplement the table of “crude” rates with a computation of the legitimate birth-rate per 1,000 married women of 15 and under 45 years of age, or the total birth-rate per 1,000 of all women of these ages. The following table gives both rates for New Zealand in each census year from 1878 to 1945.
| Year. | Number of Women 15 and under 45. | Number of Births. | Birth-rate per 1,000 Women 15 and under 45. | |||
|---|---|---|---|---|---|---|
| Married. | Total. | Legitimate. | Total. | Legitimate.* | Total. | |
* Per thousand married women. | ||||||
| 1878. | 50,999 | 80,313 | 17,341 | 17,770 | 340.0 | 221.3 |
| 1881 | 57,461 | 96,144 | 18,198 | 18,732 | 315.0 | 194.8 |
| 1886 | 62,709 | 117,895 | 18,697 | 19,299 | 298.2 | 163.7 |
| 1891 | 63,172 | 131,271 | 17,635 | 18,273 | 279.2 | 139.2 |
| 1896 | 69,816 | 158,214 | 17,778 | 18,612 | 254.6 | 117.6 |
| 1901 | 79,420 | 183,387 | 19,554 | 20,491 | 246.2 | 111.7 |
| 1906 | 98,249 | 212,598 | 23,120 | 24,252 | 235.3 | 114.1 |
| 1911 | 119,390 | 240,714 | 25,276 | 26,354 | 211.7 | 109.5 |
| 1916 | 141,322 | 267,300 | 27,363 | 28,509 | 193.6 | 106.7 |
| 1921 | 150,400 | 288,477 | 27,309 | 28,567 | 181.6 | 99.0 |
| 1926 | 161,737 | 313,363 | 27,000 | 28,473 | 166.9 | 90.9 |
| 1936 | 173,557 | 344,124 | 23,711 | 24,837 | 136.6 | 72.2 |
| 1945 | 211,299 | 370,786 | 35,183 | 37,007 | 166.5 | 99.8 |
The legitimate rate per 1,000 married women between the ages of 15 and 45 is seen to have fallen by 51 per cent. between 1878 and 1945, while an even greater fall is shown for the total rate on the basis of all women of the ages mentioned. The greater fall in the latter rate than in the former is due to the fact that among women of the child-bearing ages the proportion of married women is considerably smaller than in the earlier years covered.
A study of the figures for successive censuses reveals considerable changes in the age-constitution of married women within the child-bearing ages. As the birth-rate varies with age, the change in age-constitution over the period is a factor which should be taken into account.
NATURAL INCREASE.—The decline of the birth-rate in New Zealand has been accompanied until recent years by a decrease in the death-rate. Nevertheless, the nominal rate of natural increase of population has fallen from 31–19 per 1,000 of mean population in 1870 to 17.04 in 1947. Acceptance of this figure without consideration of the effect of the changing age-constitution will give an erroneous view of the present margin of increase and of the probable trend of population growth in the future (see section on Population).
| Period. | Annual Rates per 1,000 Population. | ||
|---|---|---|---|
| Births. | Deaths. | Natural Increase. | |
| 1871–1875 | 39.88 | 12.67 | 27.21 |
| 1876–1880 | 41.21 | 11.80 | 29.41 |
| 1881–1885 | 36.36 | 10.95 | 25.41 |
| 1886–1890 | 31.15 | 9.85 | 21.30 |
| 1891–1895 | 27.68 | 10.15 | 17.53 |
| 1896–1900 | 25.75 | 9.55 | 16.20 |
| 1901–1905 | 26.60 | 9.91 | 16.69 |
| 1906–1910 | 27.06 | 9.75 | 17.31 |
| 1911–1915 | 25.98 | 9.22 | 16.76 |
| 1916–1920 | 24.32 | 10.73 | 13.59 |
| 1921–1925 | 22.26 | 8.63 | 13.63 |
| 1926–1930 | 19.76 | 8.60 | 11.16 |
| 1931–1935 | 16.98 | 8.23 | 8.75 |
| 1936–1940 | 18.36 | 9.20 | 9.16 |
| 1941–1945 | 21.81 | 10.08 | 11.73 |
| 1946–1947 | 25.83 | 9.54 | 16.29 |
The movements that have taken place since 1875 are well illustrated in the accompanying diagram, which shows the rates at five-yearly intervals.
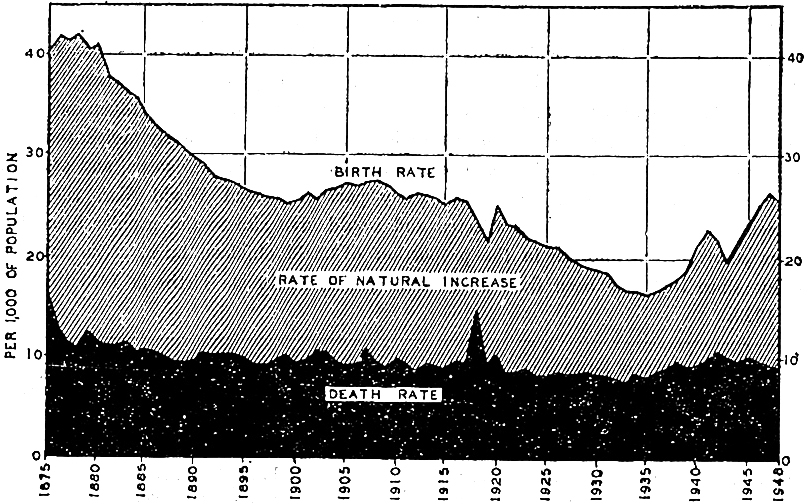
COMPARISON WITH OTHER COUNTRIES.—An international comparison of birth and natural increase rates is made in the following table. New Zealand's position is much higher on the basis of natural increase than it would be on that of the birth-rate. The rates, which are the average of the five years 1943–47 unless otherwise indicated, are taken from the Monthly Bulletin of Statistics issued by the United Nations, and cover those countries for which such information is available.
| Country. | Rates per 1,000 of Population. | |
|---|---|---|
| Births. | Natural Increase. | |
* 1942–46. | ||
| Costa Rica | 44.8 | 30.1 |
| Panama | 38.5 | 26.7 |
| Mexico | 44.4 | 24.9 |
| Venezuela | 37.4 | 21.9 |
| Nicaragua | 33.7 | 21.8 |
| Salvador | 38.0 | 21.2 |
| Union of South Africa | 26.4 | 17.3 |
| Canada | 25.4 | 15.8 |
| Netherlands | 25.5 | 14.8 |
| Chile | 33.2 | 14.5 |
| Peru* | 27.2 | 13.8 |
| New Zealand | 23.2 | 13.4 |
| Denmark | 22.6 | 12.6 |
| Australia | 22.2 | 12.4 |
| United States of America | 22.1 | 11.7 |
| Norway | 20.8 | 10.9 |
| Finland | 24.4 | 10.6 |
| Portugal | 24.9 | 10.4 |
| Bulgaria | 23.5 | 9.8 |
| Spain | 22.2 | 9.5 |
| Japan | 28.6 | 9.5 |
| Sweden | 19.8 | 9.1 |
| Switzerland | 19.6 | 8.2 |
| Eire | 22.5 | 7.8 |
| Czechoslovakia | 21.8 | 7.3 |
| Italy | 20.4 | 6.8 |
| United Kingdom | 18.1 | 6.3 |
| India* | 27.2 | 5.6 |
| France | 18.0 | 2.1 |
| Belgium | 16.3 | 2.1 |
| Austria | 17.2 | 0.8 |
SEXES OF CHILDREN BORN.—With the exception of one year (1860), there has always been a preponderance of males in the number of children born in New Zealand. The proportions are usually shown by stating the number of births of male children to every 1,000 female births. This number has been as high as 1,113 (in 1859), and as low as 991 (in 1860), but little significance can be attached to any figures prior to 1870, on account of the comparatively small number of births. The period preceding 1870 exhibited violent fluctuations in the proportion of males, which showed a tendency to disappear as the total of births grew larger. It is a popular idea that the proportion of male births tends to increase considerably in war years, but the experience in this country does little to bear out this theory, the average over the six years 1940–45 being 1,057, as against that of 1,050 for the preceding ten years. Figures taken out some years ago prove that the masculinity rate for first births is distinctly higher than for subsequent births. As the first-birth rate tends to rise during war years, and actually reached a very high peak during the early part of Second World War, the total masculinity rate would also be affected and would give rise to the popular idea that wars result in an increase in the proportion of male children born. The extreme range since 1870 has been from 1,016 male per 1,000 female births in 1878 to 1,081 in 1923.
| Year. | Number of Births of | Male Births per 1,000 Female Births. | |
|---|---|---|---|
| Males. | Females. | ||
| 1936 | 12,608 | 12,229 | 1,031 |
| 1937 | 13,245 | 12,769 | 1,037 |
| 1938 | 13,929 | 13,320 | 1,046 |
| 1939 | 14,705 | 14,128 | 1,041 |
| 1940 | 16,817 | 15,954 | 1,054 |
| 1941 | 18,003 | 17,097 | 1,053 |
| 1942 | 17,242 | 16,332 | 1,056 |
| 1943 | 15,728 | 14,583 | 1,079 |
| 1944 | 17,205 | 16,394 | 1,049 |
| 1945 | 18,950 | 18,057 | 1,049 |
| 1946 | 21,532 | 20,339 | 1,049 |
| 1947 | 22,898 | 21,918 | 1,045 |
The masculinity rate from 1856 to 1947 is oppressed in the following table in average ratios for successive decennial periods.
| Period. | Male Births per 1,000 Female Births. |
|---|---|
| 1856–1865 | 1,062 |
| 1866–1875 | 1,043 |
| 1876–1885 | 1,045 |
| 1886–1895 | 1,045 |
| 1896–1905 | 1,054 |
| 1906–1915 | 1,055 |
| 1916–1925 | 1,053 |
| 1926–1935 | 1,057 |
| 1936–1945 | 1,050 |
| 1946–1947 (two years) | 1,051 |
MULTIPLE BIRTHS.—The number of cases of multiple births and the proportion per 1,000 of the total (living births only) during the last five years were:—
| Year. | Total Births. | Total Cases. | Cases of Twins. | Cases of Triplets. | Multiple Cases per 1,000 of Total Cases. |
|---|---|---|---|---|---|
| 1943 | 30,311 | 29,973 | 332 | 3 | 11.18 |
| 1944 | 33,599 | 33,155 | 430 | 7 | 13.18 |
| 1945 | 37,007 | 36,540 | 463 | 2 | 12.73 |
| 1946 | 41,871 | 41,338 | 519 | 7 | 12.72 |
| 1947 | 44,816 | 44,279 | 529 | 4 | 12.04 |
Counting only cases where both children were born alive, there were 529 cases of twin births (1,058 children) registered in 1947. There were also four cases of triplets.
The total number of accouchements resulting in living births was 44,279, and on the average one mother in every 83 gave birth to twins (or triplets).
When still-births are taken into account, the total number of accouchements for the year 1947 is increased to 45,141, and the number of cases of multiple births to 582. On this basis the proportion of mothers giving birth to twins or triplets is increased to one in 78.
The incidence of multiple births varies considerably, as may be seen from the following summary for each of the last twenty years:—
| Year. | Cases of Twins. | Cases of Triplets. | Total Multiple Cases. | Rate per 1,000 Confinements. | |||||||
|---|---|---|---|---|---|---|---|---|---|---|---|
| Both born alive. | One born alive, one still-born. | Both still-born. | Total. | All born alive. | One born alive, two still-born. | Two born alive, one still-born. | All still-born. | Total. | |||
* Includes one case of quadruplets, all born alive. | |||||||||||
| 1928 | 273 | 21 | 6 | 300 | 4 | 4 | 304 | 11.0 | |||
| 1929 | 275 | 37 | 9 | 321 | 1 | 1 | 322 | 11.8 | |||
| 1930 | 304 | 20 | 16 | 340 | 2 | 1 | 3 | 343 | 12.6 | ||
| 1931 | 288 | 36 | 7 | 331 | 1 | 1 | 332 | 12.3 | |||
| 1932 | 260 | 26 | 5 | 291 | 3 | 3 | 294 | 11.6 | |||
| 1933 | 250 | 31 | 9 | 290 | 2 | 1 | 3 | 293 | 11.8 | ||
| 1934 | 258 | 31 | 4 | 293 | 2 | 2 | 295 | 11.9 | |||
| 1935 | 275 | 24 | 4 | 303 | 1 | 1 | 305* | 12.5 | |||
| 1936 | 225 | 34 | 8 | 267 | 2 | 2 | 269 | 10.6 | |||
| 1937 | 276 | 26 | 7 | 309 | 1 | 1 | 2 | 311 | 11.8 | ||
| 1938 | 296 | 26 | 4 | 326 | 2 | 2 | 328 | 11.9 | |||
| 1939 | 299 | 24 | 7 | 330 | 3 | 3 | 333 | 11.3 | |||
| 1940 | 344 | 44 | 11 | 399 | 1 | 1 | 2 | 401 | 12.0 | ||
| 1941 | 398 | 51 | 14 | 463 | 3 | 3 | 466 | 13.1 | |||
| 1942 | 400 | 24 | 13 | 437 | 2 | 2 | 4 | 441 | 13.0 | ||
| 1943 | 332 | 41 | 11 | 384 | 3 | 2 | 1 | 6 | 390 | 12.7 | |
| 1944 | 430 | 40 | 3 | 473 | 7 | 7 | 480 | 14.2 | |||
| 1945 | 463 | 37 | 11 | 511 | 2 | 2 | 513 | 13.7 | |||
| 1946 | 518 | 42 | 14 | 574 | 7 | 1 | 8 | 582 | 13.8 | ||
| 1947 | 529 | 38 | 11 | 578 | 4 | 4 | 582 | 12.9 | |||
The proportion of multiple births has been consistently high during the last five years, that experienced in 1944 being a record figure. The numbers of cases of triplets recorded in 1944 and in 1946 were exceptional (7 and 8 respectively).
The likelihood of still-births occurring is much greater in cases of multiple births than in single cases. This is exemplified in the following table. The figures in respect of multiple cases include all cases where one or more of the children were still-born.
| Year. | Still-birth Cases per 100 of Total Cases (including Still-births). | |
|---|---|---|
| Single Cases. | Multiple Cases. | |
| 1938 | 2.59 | 9.15 |
| 1939 | 2.97 | 9.31 |
| 1940 | 2.72 | 13.97 |
| 1941 | 2.54 | 13.95 |
| 1942 | 2.56 | 8.88 |
| 1943 | 2.46 | 14.10 |
| 1944 | 2.25 | 8.96 |
| 1945 | 2.19 | 9.36 |
| 1946 | 2.07 | 9.79 |
| 1947 | 1.91 | 8.59 |
| Average of ten years | 3.43 | 10.61 |
The following table shows the sexes in individual cases of live twin births for the years 1943.47.
| Year. | Total Cases. | Both Males. | Both Females. | Opposite Sexes. |
|---|---|---|---|---|
| 1943 | 332 | 133 | 88 | 111 |
| 1944 | 430 | 137 | 134 | 159 |
| 1945 | 463 | 171 | 146 | 146 |
| 1946 | 518 | 164 | 173 | 181 |
| 1947 | 529 | 190 | 162 | 177 |
During the ten years 1938–47 there were thirty-four cases of triplets. In ten cases all three children were males, in thirteen cases all were females, in eight cases there were two males and one female, and in three cases two of the three children were females.
AGES OF PARENTS.—Information as to the relative ages of parents of legitimate living children whose births were registered in 1947 is shown in the following tables.
| Age of Father, in Years. | Age of Mother, In Years. | ||||||||||
|---|---|---|---|---|---|---|---|---|---|---|---|
| Under 21. | 21 and under 25. | 25 and under 30. | 30 and under 35. | 35 and under 40. | 40 and under 45. | 45 and under 50. | 50 and under 55. | 55 and under 60. | 65 and over. | Total Cases. | |
*Including thirty-four legitimate cases where plural births would have been registered had not one child been still-born. † Including three cases of triplets. | |||||||||||
| Single Births | |||||||||||
| Under 21 | 210 | 1,028 | 787 | 189 | 49 | 16 | 6 | 1 | 1 | 2,287 | |
| 21 and under 25 | 104 | 2,741 | 4,683 | 1,576 | 365 | 90 | 33 | 3 | 8 | 1 | 9,604 |
| 25 and under 30 | 10 | 746 | 5,766 | 4,976 | 1,700 | 392 | 150 | 26 | 25 | 2 | 13,793 |
| 30 and under 35 | 1 | 41 | 938 | 4,011 | 3,223 | 1,021 | 296 | 81 | 49 | 8 | 9,669 |
| 35 and under 40 | 1 | 78 | 676 | 2,181 | 1,510 | 509 | 130 | 87 | 13 | 5,185 | |
| 40 and under 45 | 5 | 48 | 217 | 641 | 349 | 108 | 46 | 7 | 1,421 | ||
| 45 and over | 6 | 11 | 43 | 17 | 8 | 2 | 87 | ||||
| Totals | 325 | 4,557 | 12,257 | 11,476 | 7,741 | 3,681 | 1,386 | 366 | 224 | 33 | 42,046* |
| Multiple Births | |||||||||||
| Under 21 | 8 | 6 | 1 | 15 | |||||||
| 21 and under 25 | 15 | 42 | 22 | 3 | 82 | ||||||
| 25 and under 30 | 9 | 74 | 61 | 20 | 7 | 1 | 172 | ||||
| 30 and under 35 | 2 | 7 | 59 | 53 | 11 | 2 | 134 | ||||
| 35 and under 40 | 3 | 14 | 39 | 27 | 13 | 1 | 1 | 98 | |||
| 40 and under 45 | 1 | 3 | 11 | 1 | 2 | 1 | 19 | ||||
| 45 and over | |||||||||||
| Totals | 34 | 132 | 158 | 118 | 56 | 16 | 3 | 3 | 520† | ||
| Grand totals | 325 | 4,591 | 12,389 | 11,634 | 7,859 | 3,737 | 1,402 | 369 | 227 | 33 | 42,566 |
PREVIOUS ISSUE OF PARENTS.—Information as to the previous issue of the existing marriage, required in connection with the registration of births in New Zealand, is useful not only for record purposes, but also as providing valuable data for statistical purposes. Tables are given in the annual Report on Vital Statistics containing detailed information as to number of previous issue in conjunction with (1) age of mother and (2) duration of marriage. The table under the first heading for the year 1947 is here summarized.
| Age of Mother, in Years. | Number of Previous Issue. | Total Legitimate Cases. | ||||||||
|---|---|---|---|---|---|---|---|---|---|---|
| 0. | 1. | 2. | 3. | 4. | 5. | 6 and under 10. | 10 and under 15. | 15 and over. | ||
* This number represents 42,046 single cases and 520 multiple cases. | ||||||||||
| Under 21 | 1,939 | 319 | 39 | 4 | 1 | 2,302 | ||||
| 21 and under 25 | 6,297 | 2,531 | 620 | 181 | 43 | 10 | 4 | 9,686 | ||
| 25 and under 30 | 5,611 | 4,418 | 2,305 | 1,011 | 394 | 151 | 75 | 13,965 | ||
| 30 and under 35 | 2,156 | 2,604 | 2,262 | 1,460 | 696 | 300 | 318 | 7 | 9,803 | |
| 35 and under 40 | 852 | 1,008 | 1,152 | 888 | 574 | 333 | 427 | 49 | 5,283 | |
| 40 and under 45 | 174 | 199 | 245 | 222 | 206 | 127 | 211 | 54 | 2 | 1,440 |
| 45 and over | 10 | 15 | 11 | 11 | 10 | 13 | 13 | 3 | 1 | 87 |
| Totals | 17,039 | 11,094 | 6,634 | 3,777 | 1,924 | 934 | 1,048 | 113 | 3 | 42,566* |
In computing previous issue, multiple births have been given their full significance, the numbers at the head of the columns relating to children born alive. In the following table this procedure has been followed not only for the previous issue but also for children covered by the 1947 registrations, who are also taken into account in the computation of the averages.
| Age of Mother, in Years. | Total Mothers. | Total Issue. | Average Issue. |
|---|---|---|---|
| Under 21 | 2,302 | 2,730 | 1.19 |
| 21–24 | 9,686 | 14,328 | 1.48 |
| 25–29 | 13,965 | 29,001 | 2.08 |
| 30–34 | 9,803 | 27,934 | 2.85 |
| 35–39 | 5,283 | 18,838 | 3.57 |
| 40–44 | 1,440 | 6,391 | 4.44 |
| 45 and over | 87 | 398 | 4.57 |
| Totals | 42,566 | 99,620 | 2.34 |
It should be stressed that the averages are no more than they purport to be—viz., the average number of children (including those registered in 1947) born up to the present time to those mothers of legitimate children whose births were registered during the year. They do not purport to represent, nor do they represent, the average issue of all women of the ages shown. Furthermore, they include issue born to the existing marriages only. The averages for recent years were as follows: 1943,2.56; 1944, 2.61; 1945, 2.58; 1946, 2.44; and 1947, 2.34. In 1915, the earliest year for which reliable comparative figures are available, the average issue was 3.11. This falling trend in the average issue of women giving birth to children is a measure of the tendency towards smaller families. The 1943 average, for the first time since these figures were compiled, reversed the trend, and a further increase was recorded in 1944, but with the increase in the proportion of first births in the three following years the average declined to a level in 1947 only slightly above that of 1939.
FIRST BIRTHS.—Of a total of 176,509 accouchements resulting in legitimate births during the five years 1943–47, the issue of no fewer than 62,028 or 35 per cent., were first-born children. In 24,651, or 40 per cent., of these cases the birth occurred within twelve months, and in 42,666, or 69 per cent., within two years after the marriage of the parents. In the remaining 31 per cent. of cases where there was any issue to the marriage, two years or more had elapsed before the birth of the first child.
The annual number of first births registered naturally follows closely the movement in the marriage-rate. With the steady decline in the marriage-rate during the middle war years 1941–43 a fall in the number of first births was to be expected. This was accompanied by a marked downward movement in the actual proportion of first births to total births due in some measure to the sustained figures of total births during those years. It would appear, therefore, that the war period was responsible for at least a temporary trend towards larger families.
With the return of men from service overseas there came a heavy increase in the number of marriages, and correspondingly the proportion of first births rose steeply; and, in 1947, reached a rate very little below the record figure of 41.09 per cent. established in 1940. An interesting feature of the birth statistics for 1947 is the high proportion of first births occurring within two years after marriage—75.62 per cent. of all legitimate first cases recorded in 1947 falling in this class. This is the highest figure recorded since 1929.
The proportion of first births occurring within one year of the marriage of the parents during 1941 and 1943 (1942 figures are not available) was particularly low, no doubt mostly due to war conditions, where parenthood in many wartime marriages was postponed. The figure for 1944 showed an appreciable rise, and further substantial increases were recorded in 1946 and 1947.
| Year. | Total Legitimate Cases. | Total Legitimate First Cases. | Proportion of First Cases to Total Cases. | First Cases within One Year after Marriage. | First Cases within Two Years after Marriage. | ||
|---|---|---|---|---|---|---|---|
| Number. | Proportion to Total First Cases. | Number. | Proportion to Total First Cases. | ||||
| Per Cent. | Per Cent. | Per Cent. | |||||
| 1943 | 28,520 | 9,216 | 32.31 | 3,172 | 34.42 | 5,980 | 64.89 |
| 1944 | 31,156 | 9,626 | 30.90 | 3,703 | 38.47 | 6,234 | 64.76 |
| 1945 | 34,733 | 11,265 | 32.43 | 4,298 | 38.15 | 7,244 | 64.31 |
| 1946 | 39,534 | 14,882 | 37.64 | 6,185 | 41.56 | 10,323 | 69.37 |
| 1947 | 42,566 | 17,039 | 40.03 | 7,293 | 42.80 | 12,885 | 75.62 |
| Totals for five years | 176,509 | 62,028 | 35.14 | 24,651 | 39.74 | 42,666 | 68.79 |
Although the period of time elapsing before the birth of the first child has varied considerably during the last few years, mainly as a result of war influences, there would appear to be no evidence to indicate that the long-term decline in the proportion of first births occurring within one year of marriage has been arrested. The following table compares the 1947 figures with those for earlier years, and illustrates the movement in the duration-of-marriage factor in first births.
| Duration of Marriage, In Years. | Proportion per Cent. of Total First Births. | ||||
|---|---|---|---|---|---|
| 1914. | 1924. | 1934. | 1944. | 1947. | |
| Under 1 year | 52.95 | 50.06 | 46.25 | 38.47 | 42.80 |
| 1 and under 2 years | 28.62 | 26.64 | 26.79 | 26.30 | 32.82 |
| 2 and under 3 years | 9.02 | 10.43 | 10.24 | 11.28 | 9.24 |
| 3 and under 4 years | 3.43 | 5.51 | 6.16 | 7.88 | 3.99 |
| 4 and under 5 years | 1.88 | 3.03 | 3.96 | 7.18 | 2.88 |
| 5 and under 10 years | 3.26 | 3.36 | 5.49 | 7.36 | 7.07 |
| 10 years and over | 0.84 | 0.97 | 1.11 | 1.53 | 1.20 |
| Totals | 100.00 | 100.00 | 100.00 | 100.00 | 100.00 |
For the years covered by the foregoing table the average duration of marriage before the birth of the first child was—1914, 1.63 years; 1924, 1.76 years; 1934, 1.85 years; 1944, 2.22 years; and 1947, 2.13 years.
An item of interest extracted from the 1947 birth statistics is a table of first births occurring to mothers in different age-groups, expressed as a proportion per cent. of the total first births. A comparison has also been computed on the same basis for the years 1914, 1924, 1934, and 1944.
FIRST BIRTHS, BY AGE OF MOTHER
| Age of Mother. | First Births, Proportion per Cent. at each Age-group to Total First Births. | ||||
|---|---|---|---|---|---|
| 1914. | 1924. | 1934. | 1944. | 1947. | |
| Under 20 | 6.73 | 7.55 | 8.90 | 7.33 | 6.02 |
| 20 and under 25 | 35.89 | 38.16 | 40.39 | 41.79 | 42.32 |
| 25 and under 30 | 35.01 | 32.59 | 32.79 | 29.54 | 32.93 |
| 30 and under 35 | 15.61 | 14.68 | 13.10 | 14.61 | 12.65 |
| 35 and under 40 | 5.52 | 5.33 | 3.79 | 5.36 | 5.00 |
| 40 and under 45 | 1.16 | 1.59 | 0.99 | 1.34 | 1.02 |
| 45 and over | 0.08 | 0.10 | 0.04 | 0.03 | 0.06 |
| Totals | 100.00 | 100.00 | 100.00 | 100.00 | 100.00 |
The figures of average ages of mothers at the birth of their first child are as follows for the above years: 1914, 26.55; 1924, 26.39; 1934, 25.90; 1944, 25.18; and 1947, 26.06.
ILLEGITIMACY.—The numbers of illegitimate births registered during each of the years 1937–47, with the percentages they bear to total births registered, were as follows:—
| Year. | Number. | Percentage of Total Births. |
|---|---|---|
| 1937 | 1,210 | 4.65 |
| 1938 | 1,164 | 4.27 |
| 1939 | 1,133 | 3.93 |
| 1940 | 1,284 | 3.92 |
| 1941 | 1,281 | 3.65 |
| 1942 | 1,339 | 3.99 |
| 1943 | 1,467 | 4.84 |
| 1944 | 2,020 | 6.01 |
| 1945 | 1,824 | 4.93 |
| 1946 | 1,824 | 4.36 |
| 1947 | 1,727 | 3.85 |
War influences, resulting in unusual movements of the population and the influx of servicemen to the more heavily populated centres, no doubt are responsible for the high figures recorded during 1943–46.
The long-term trend in the rate of illegitimate births is indicated by the movement in the proportion of illegitimate births per 1,000 unmarried women—i.e., spinsters, widows, and divorced women—at the reproductive ages. The figures for each census year from 1891 to 1945 are as follows:—
| Census Year. | Unmarried Women 15 and under 45 Years of Age. | Illegitimate Births. | Illegitimate-birth Rate per 1,000 Unmarried Women. |
|---|---|---|---|
| 1891 | 68,030 | 638 | 9.38 |
| 1896 | 88,333 | 834 | 9.44 |
| 1901 | 103,652 | 937 | 9404 |
| 1906 | 114,096 | 1,132 | 9.92 |
| 1911 | 120,778 | 1,078 | 8.93 |
| 1916 | 125,461 | 1,159 | 9.24 |
| 1921 | 136,539 | 1,258 | 9.21 |
| 1926 | 148,551 | 1,473 | 9.92 |
| 1936 | 167,781 | 1,126 | 6.71 |
| 1945 | 156,326 | 1,824 | 11.67 |
Included in the total of 1,727 illegitimate births in 1947 were twelve cases of twins and 1 case of triplets, the number of accouchements being thus 1,713. From the following table it will be seen that of the 1,713 mothers 494, or 29 per cent., were under twenty-one years of age.
| Age. | Cases. |
|---|---|
| Years. | |
| 13 | 2 |
| 14 | 2 |
| 15 | 12 |
| 16 | 35 |
| 17 | 66 |
| 18 | 113 |
| 19 | 115 |
| 20 | 149 |
| 21 | 132 |
| 22 | 148 |
| 23 | 113 |
| 24 | 116 |
| 25 | 96 |
| 26 | 97 |
| 27 | 77 |
| 28 | 74 |
| 29 | 59 |
| 30 | 30 |
| 31 | 42 |
| 32 | 36 |
| 33 | 38 |
| 34 | 23 |
| 35 | 23 |
| 36 | 19 |
| 37 | 22 |
| 38 | 12 |
| 39 | 17 |
| 40 | 24 |
| 41 | 7 |
| 42 | 4 |
| 43 | 4 |
| 44 | 2 |
| 45 | 3 |
| 48 | 1 |
| Total | 1,713 |
The Births and Deaths Registration Amendment Act, 1930, directs the omission of the word “illegitimate” from the register when the birth of an illegitimate child is registered. The word “illegitimate” appearing in any entry made prior to the passing of the Act is deemed to be expunged and deleted, and must also be omitted from any certified copy of an entry.
The Legitimation Act.—An important Act was passed in 1894 and re-enacted in 1908, intituled the Legitimation Act. Under this Act any child born out of wedlock whose parents afterwards intermarried was deemed to be legitimized by such marriage on the birth being registered in the manner prescribed by the Act. For legitimation purposes a Registrar was required to register a birth when called upon to do so by any person claiming to be the father of an illegitimate child; but such person was required to make a solemn declaration that he was the father, and was also required to produce evidence of marriage between himself and the mother of the child.
Prior to the passing of the Legitimation Amendment Act, 1921–22, legitimation could be effected only if at the time of the birth of the child there existed no legal impediment to the intermarriage of the father and mother, but the legal-impediment proviso was repealed by that amendment.
The amendment of 1921–22 also provided for legitimation by the mother in the event of the death of the father after the intermarriage of the parents. In such a case the application for legitimation was heard by a Magistrate, and upon his certifying that it had been proved to his satisfaction that the husband of the applicant was the father of the child, the child was registered as the lawful issue of the applicant and her husband.
Important changes were made by the Legitimation Act of 1939, which repealed previous legislation on the subject. This Act stipulates that every illegitimate person whose parents have intermarried, whether before or after the passing of the Act, shall be deemed to have been legitimated from birth by reason of such marriage. The Act requires the parents or surviving parent of any person legitimated under the Act to register with the Registrar-General the particulars of the birth of that person, showing that person as the lawful issue of the parents. Application for registration was required to be made within six months after the date of the passing of the Act in cases where the marriage took place prior to that date. In cases where the marriage has taken place subsequent to the passing of the Act, application for registration must be made within three months after the date of the marriage.
Where the Registrar-General has reason to believe that any person has been legitimated under the terms of the Act, and no application for registration has been made within the prescribed time, he may require the responsible parents or parent to make an application within a specified period of not less than seven days after receiving notice to do so. Any failure to comply with the notice requiring application for registration within the time specified renders the person or persons responsible liable on summary conviction to a fine of £5. If no application for registration is made within the appropriate time specified in the Act or in the notice received from the Registrar-General, application for registration of the particulars of the birth of any legitimated person may be made by that person, or by one of his parents, or by any other person.
The number of legitimations registered in each of the last eleven years, and the total since the Act of 1894 came into force, are shown in the following table. The effect of the Legitimation Act of 1939 is evident in the figures for 1940, while the necessity for prompt registration in order to participate in family benefits under the Social Security Act has accentuated the falling-away of the not previously registered cases to insignificant proportions.
| Number of Children legitimized. | |||
|---|---|---|---|
| Year. | Previously registered. | Not previously registered. | Total. |
| 1937 | 322 | 114 | 436 |
| 1938 | 356 | 97 | 453 |
| 1939 | 349 | 57 | 406 |
| 1940 | 409 | 104 | 513 |
| 1941 | 379 | 57 | 436 |
| 1942 | 396 | 34 | 430 |
| 1943 | 400 | 37 | 437 |
| 1944 | 339 | 34 | 373 |
| 1945 | 394 | 11 | 405 |
| 1946 | 486 | 15 | 501 |
| 1947 | 496 | 4 | 500 |
| Totals from 1894 to 1947 | 9,587 | 3,289 | 12,876 |
ADOPTIONS.—The Births and Deaths Registration Act contains provision for the registration of adopted children. The Clerk of the Court by which any adoption order is made is required to furnish to the Registrar-General particulars of the order, including the full name and place of birth of the child, as well as the full names and addresses of both the natural and the adopting parents. An entry is made in the prescribed form in the register of births, particulars of the adopting parents being given in lieu of those of the natural parents. If the child's birth has previously been registered in New Zealand a note of the adoption order is made on the original entry. An amendment to the Infants Act in 1939 extended the age at which a child might be legally adopted from under fifteen years to under twenty-one years.
The following table shows the number of adoptions which have been registered during the eleven years ended in 1947, together with the proportion per 1,000 births registered in each year.
| Year. | Number. | Rate per 1,000 Births. | ||
|---|---|---|---|---|
| Males. | Females. | Total. | ||
| 1937 | 228 | 216 | 444 | 17 |
| 1938 | 270 | 300 | 570 | 21 |
| 1939 | 263 | 267 | 530 | 18 |
| 1940 | 293 | 339 | 632 | 19 |
| 1941 | 293 | 268 | 561 | 16 |
| 1942 | 397 | 376 | 773 | 23 |
| 1943 | 279 | 298 | 577 | 19 |
| 1944 | 631 | 682 | 1,313 | 39 |
| 1945 | 596 | 595 | 1,191 | 32 |
| 1946 | 680 | 693 | 1,373 | 33 |
| 1947 | 680 | 659 | 1,339 | 30 |
Statistics of adoptions registered are available in New Zealand only since 1919, and these indicate that the numbers are considerably influenced by the economic condition of the country, the lowest total, 329, being recorded in 1931, followed by 332 in 1933 and 337 in 1932. The highest total prior to 1940 occurred in 1921, when 584 adoptions were registered, this, no doubt, being the result of post-war influences. Possibly various factors arising out of the late war have had a bearing on the high totals for recent years, but the extension of age at which a child might legally be adopted is also of importance in this connection. It should also be noted that the unprecedented totals since 1944 are associated with the extremely high number of illegitimate births occurring in these years.
STILL-BIRTHS.—The registration of still-births was made compulsory in New Zealand as from the 1st March, 1913. Although it is necessary to effect a birth-registration entry for a still-born child, no entry is made in the register of deaths. Section 15 of the Statutes Amendment Act, 1946, amending the Births and Deaths Registration Act, 1924, stipulates, however, that a medical practitioner or a midwife in attendance at a confinement where a still-birth occurs must furnish a certificate stating to the best of his or her knowledge and belief the cause of the still-birth. Particulars of causes of still-births will be found in Sub-section “C” relating to deaths. A still-born child is defined as one “which has issued from its mother after the expiration of the twenty-eighth week of pregnancy and which was not alive at the time of such issue.” Still-births are not included either as births or as deaths in the various numbers and rates shown in this subsection and in that relating to deaths.
The registrations of still-births during each of the years, 1937–1947 were as follows:—
| Year. | Males. | Females | Totals. | Males Stillbirths per 1,000 Females Still-births. | Percentage of still-births to | |
|---|---|---|---|---|---|---|
| Living Births. | All Births. | |||||
| 1937 | 427 | 334 | 761 | 1,278 | 2.93 | 2.84 |
| 1938 | 409 | 334 | 743 | 1,225 | 2.73 | 2.65 |
| 1939 | 495 | 405 | 900 | 1,222 | 3.12 | 3.03 |
| 1940 | 528 | 437 | 965 | 1,208 | 2.94 | 2.86 |
| 1941 | 524 | 447 | 971 | 1,172 | 2.77 | 2.69 |
| 1942 | 482 | 409 | 891 | 1,178 | 2.65 | 2.59 |
| 1943 | 450 | 367 | 817 | 1,226 | 2.70 | 2.62 |
| 1944 | 437 | 362 | 799 | 1,207 | 2.38 | 2.32 |
| 1945 | 463 | 402 | 865 | 1,152 | 2.34 | 2.28 |
| 1946 | 530 | 401 | 931 | 1,322 | 2.22 | 2.18 |
| 1947 | 501 | 410 | 911 | 1,222 | 2.03 | 1.99 |
Masculinity is in general much higher among still-births than among living births, the rate for still-births in 1947 being 1,222 males per 1,000 females as compared with 1,045 for living births.
The percentage of illegitimates among still-born infants was in 1947, 4.39, and among infants born alive 3.85.
Of the living legitimate births registered in 1947, 40 per cent. were first births, while of legitimate still-births 47 per cent. were first births. Statistics over many years indicate that there is a considerably greater probability of still-births occurring to mothers having their first accouchement than those having subsequent accouchements.
MARRIAGE may be celebrated in New Zealand only on the authority of a Registrar's certificate, either by a person whose name is on the list of officiating ministers under the Marriage Act, or before a duly appointed Registrar or Deputy Registrar of Marriages. Marriage by an officiating minister may be celebrated only between 8 o'clock in the morning and 8 o'clock in the evening. Marriage before a Registrar can be celebrated at any time during the hours the office of the Registrar is open for the transaction of public business. Prior to the passing of the Marriage Amendment Act, 1920, the limits in all cases were 8 a.m. and 4 p.m.
Notice of intended marriage must be given to a Registrar of Marriages by one of the parties to the proposed marriage, and one of the parties must have resided for three full days in the district within which the marriage is to be celebrated. In the case of a person under twenty-one years of age, not being a widow or widower, the consent of parent or guardian is necessary before the Registrar's certificate can be issued. A schedule to the Guardianship of Infants Act, 1926, sets out the person or persons whose consent is required in various circumstances. In cases where double consent is required, section 8 provides for dispensing with the consent of one party if this cannot be obtained by reason of absence, inaccessibility, or disability. In similar cases where the consent of only one person is necessary, consent may be given by a Judge of the Supreme Court. Consent of the Court may also be given in cases of refusal by any person whose consent is required.
If, in any particular case, a declaration is made that there is no parent or lawful guardian resident in New Zealand, then a certificate may be issued by the Registrar (without the necessity of Court proceedings) fourteen days after the date on which the notice of intended marriage was given.
The system of notice and certificate has operated in New Zealand since 1855. Officiating ministers and Registrars are required to send to the Registrar-General returns of all marriages celebrated, and as the returns come in they are checked off with the entries in the Registrars' lists of notices received and certificates issued. In case of the non-arrival of a marriage return corresponding to any entry in the list of notices, inquiries are made as to whether the marriage has taken place.
The marriage of a man with his deceased wife's sister was legalized in New Zealand in the year 1881, and the marriage of a woman with her deceased husband's brother in 1901. Marriage with a deceased wife's niece or a deceased husband's nephew was rendered valid in 1929.
An amendment to the Marriage Act in 1939, which repealed a similar provision passed in 1933, stipulates that a Registrar may not issue a certificate of marriage where either of the intending parties is under sixteen years of age. No marriage shall be deemed to have been unduly solemnized, however, by reason only of this provision. The 1933 amendment made provision enabling women to become officiating ministers for the purposes of the Marriage Act.
The Marriage Emergency Regulations 1944 provided for the keeping in New Zealand of a special register of Service marriages solemnized out of New Zealand between parties, one or both of whom were members of the New Zealand Armed Forces. These regulations were replaced by the Marriage Amendment Act, 1946, which, in addition, provides for the validity of Service marriages, thus replacing the United Kingdom Act of 1823, upon which their validity hitherto depended.
Particulars regarding divorce will be found at the close of this subsection.
NUMBERS AND RATES.—The movement of the marriage-rate over a lengthy period of time may be observed from the statistical summary appearing towards the end of this Year-Book. In a country with a growing population, the annual number of marriages celebrated naturally shows a rising trend. This has been the experience in New Zealand, with the exception of the periodical interruptions occasioned by war and adverse economic conditions. The numbers and rates of marriages during each of the last twenty years are here given.
| Year. | Number. | Rate per 1,000 of Population |
|---|---|---|
| 1928 | 10,537 | 7.58 |
| 1929 | 10,967 | 7.80 |
| 1930 | 11,075 | 7.78 |
| 1931 | 9,817 | 6.81 |
| 1932 | 9,896 | 6.81 |
| 1933 | 10,510 | 7.18 |
| 1934 | 11,256 | 7.64 |
| 1935 | 12,187 | 8.23 |
| 1936 | 13,808 | 9.25 |
| 1937 | 14,364 | 9.55 |
| 1938 | 15,328 | 10.09 |
| 1939 | 17,115 | 11.12 |
| 1940 | 17,448 | 11.28 |
| 1941 | 13,313 | 8.65 |
| 1942 | 12,219 | 7.91 |
| 1943 | 11,579 | 7.53 |
| 1944 | 13,125 | 8.43 |
| 1945 | 16,160 | 10.14 |
| 1946 | 20,535 | 12.38 |
| 1947 | 18,525 | 10.92 |
Both the marriage rate and the number of marriages in 1946 were the highest on record. The main reason for this was the return from overseas of many thousands of men in the most prolific marriage age-groups. Although an appreciable decline in both the number of marriages and in the marriage-rate took place in 1947, the number of marriages was the second highest on record, while the actual rate has been exceeded on only three occasions—viz., 1939, 1940, and 1946.
Changes in the available marriageable population, together with factors arising out of the war, have affected the marriage-rate in recent years. From the time of arrival of American Forces in New Zealand in 1942 up to the end of the year 1944, a total of 1,396 marriages between American servicemen and New Zealand women was celebrated in this country.
Comparison with Other Countries.—Marriage-rates for certain countries for 1947 are given below (these particulars have been taken from the Monthly Bulletin of Statistics, July, 1948, issued by the Statistical Office of the United Nations): United States of America, 14.0; Austria, 10.9; Bulgaria, 10.9; Czechoslovakia, 10.9; New Zealand, 10.9; France, 10.3; Netherlands, 10.2; Australia, 10.1; Canada, 10.1; Hungary, 10.1; Germany (British Zone), 10.0; Belgium, 9.9; Denmark, 9.6; Germany (French Zone), 9.6; Italy, 9.3; United Kingdom, 9.1; Switzerland, 8.7; Sweden, 8.6; Chile, 8.2; Spain, 8.2; Portugal, 8.1; Eire, 5.5; Nicaragua, 3.9; Salvador, 3.5.
STANDARDIZED MARRIAGE-RATE.—In a country like New Zealand where the age-constitution of the population has altered considerably, the crude marriage-rate based on the total population does not disclose the true position over a period of years. Even if only the unmarried (including widowed and divorced) population over twenty in the case of men and over fifteen in the case of women be taken into account, the rates so ascertained would still not be entirely satisfactory for comparative purposes as between various periods, owing to differences in sex and age constitution, divergences between rates for different age-groups, and variations in the proportions of marriageable persons in the community. A better plan is to ascertain the rate among unmarried females in each age-group and to standardize the results on the basis of the distribution of the unmarried female population in a basic year.
This has been done for each census year from 1881 to 1945, the year 1911 being taken as the standard. The course of the standardized rates as shown in the following table varies materially from that of the crude rates.
| Year. | Marriage-rate per 1,000 | Index Numbers of Marriage-rates. (Base: 1911 = 100.) | ||||
|---|---|---|---|---|---|---|
| Total Population. | Unmarried Female Population 15 and over. | Total Population. | Unmarried Female Population 15 and over. | |||
| Crude. | Standardized. | Crude. | Standardized. | Crude. | ||
| 1881 | 6.6 | 73.9 | 80.7 | 76 | 125 | 137 |
| 1886 | 6.0 | 55.1 | 60.4 | 69 | 93 | 102 |
| 1891 | 6.0 | 48.3 | 50.3 | 69 | 82 | 85 |
| 1896 | 6.8 | 47.3 | 48.0 | 78 | 80 | 81 |
| 1901 | 7.8 | 50.2 | 49.0 | 90 | 85 | 83 |
| 1906 | 8.5 | 55.6 | 53.7 | 98 | 94 | 91 |
| 1911 | 8.7 | 59.1 | 59.1 | 100 | 100 | 100 |
| 1916 | 7.5 | 50.7 | 54.3 | 86 | 86 | 92 |
| 1921 | 8.7 | 59.7 | 63.9 | 100 | 101 | 108 |
| 1926 | 7.9 | 53.1 | 62.6 | 91 | 90 | 106 |
| 1936 | 9.3 | 57.1 | 68.0 | 107 | 97 | 115 |
| 1945 | 10 | 65.0 | 88.1 | 117 | 110 | 149 |
The index numbers of the three classes of rates over the series of years enable the effect of standardization to be seen at a glance. Comparing, for instance, the years 1881 and 1911, it is seen that whereas the crude rate per 1,000 of total population was nearly one-fourth less in 1881 than in 1911, the crude rate, when only the unmarried female population of fifteen and over is considered, was one-fourth greater, and the standardized rate more than one-third greater.
Between the censuses of March, 1936, and September, 1945, the numbers of unmarried women aged fifteen and under thirty-five (the ages within which most women marry) fell by over 11,000. This decline, which was largely a result of the high marriage-rate in 1937–40 and 1945, appears to be chiefly responsible for the remarkably high standardized marriage-rate of 1945. A contributory cause was the slightly higher ages of 1945 brides, 11.63 per cent. being over thirty-five in 1945, as compared with 9.40 per cent. in 1936.
Owing to staff difficulties arising out of the war situation, no detailed marriage statistics were compiled for the years 1941–14 inclusive. The statistics and information contained in the following pages relate in most cases to the years 1939, 1940, 1945, 1946, and 1947.
CONJUGAL CONDITION.—The total number of persons married during the year 1947 was 37,050, of whom 32,340 were single, 1,785 widowed, and 2,925 divorced. The figures for each of the five years 1939–10 and 1945–47, showing the sexes separately, are given in the table following.
| Year. | Single. | Widowed. | Divorced. | Total Persons married. | |||
|---|---|---|---|---|---|---|---|
| Bridegroom. | Bride. | Bridegroom. | Bride. | Bridegroom. | Bride. | ||
| 1939 | 15,708 | 15,833 | 758 | 527 | 649 | 755 | 34,230 |
| 1940 | 15,921 | 16,167 | 809 | 547 | 718 | 734 | 34,896 |
| 1945 | 14,080 | 14,249 | 937 | 868 | 1,143 | 1,043 | 32,320 |
| 1946 | 18,192 | 18,129 | 912 | 961 | 1,431 | 1,445 | 41,070 |
| 1947 | 16,154 | 16,186 | 899 | 886 | 1,472 | 1,453 | 37,050 |
The position is more easily seen by studying the percentages given in the next table.
| Year. | Bridegrooms. | Brides. | ||||
|---|---|---|---|---|---|---|
| Single. | Widowed. | Divorced. | Single. | Widowed. | Divorced. | |
| Per Cent. | Per Cent. | Per Cent. | Per Cent. | Per Cent. | Per Cent. | |
| 1939 | 91.78 | 4.43 | 3.79 | 92.51 | 3.08 | 4.41 |
| 1940 | 91.24 | 4.64 | 4.12 | 92.66 | 3.14 | 4.20 |
| 1945 | 87.13 | 5.80 | 7.07 | 88.18 | 5.37 | 6.45 |
| 1946 | 88.59 | 4.44 | 6.97 | 88.28 | 4.68 | 7.04 |
| 1947 | 87.20 | 4.85 | 7.95 | 87.38 | 4.78 | 7.84 |
During the ten years 1938–47 the number of divorced persons remarrying increased from 45 per 1,000 persons married to 79.
Reference to the divorce statistics at the end of this subsection will show that there has been a marked increase in the incidence of divorce during the last five years; as a matter of fact, the number of decrees absolute in the period 1943–47 was 8,705, as compared with 3,750 in the five years 1933–37, an increase of 132 per cent. The increase in the number of divorced people remarrying is therefore not surprising. The number of widowed persons remarking fell from 46 per 1,000 persons married in 1938 to 39 per 1,000 in 1940, but rose again to 49 per 1,000 in 1947.
The relative conjugal condition of bridegrooms and brides for each of the five years 1939–40 and 1945–47 is next given.
| Year. | Marriages between Widowers and | Marriages between Divorced Men and | Marriages between Bachelors and | ||||||
|---|---|---|---|---|---|---|---|---|---|
| Spinsters. | Widows. | Divorced Women. | Spinsters. | Widows. | Divorced Women. | Spinsters. | Widows. | Divorced Women. | |
| 1939 | 14,947 | 241 | 520 | 432 | 212 | 114 | 454 | 74 | 121 |
| 1940 | 15,171 | 268 | 482 | 488 | 224 | 97 | 508 | 55 | 155 |
| 1945 | 13,030 | 443 | 604 | 497 | 285 | 156 | 722 | 140 | 283 |
| 1946 | 16,763 | 512 | 917 | 454 | 288 | 170 | 912 | 161 | 358 |
| 1947 | 14,856 | 430 | 869 | 428 | 302 | 169 | 902 | 154 | 415 |
The relative proportions of divorced men and divorced women remarrying during the last three years has changed but little compared with the ten years earlier. During the three years 1935–37 the number of male divorcees remarrying was 1,411, as compared with 1,556 females, which gives a rate of 91 males for every 100 females. In 1945–47 the respective numbers were 4,056 males and 3,941 females and the corresponding rate 103 males for every 100 females. In the case of widowed persons remarrying, however, there has been a marked change in the figures. In the three-year period 1935–37, 2,272 widowers remarried but only 1,412 widows, whereas in 1945–47 there were 2,748 widowers and 2,715 widows who remarried, the number of widowers per 100 widows being 161 in the former period and 101 in the latter period. It is probable that the increase in the proportion of widows remarrying is due in some measure to the numbers of young women who were widowed as a result of the war.
AGES OF PERSONS MARRIED.—Of the 37,050 persons married in 1947, 4,468 or 12 per cent., were under twenty-one years of age; 13,287, or 36 per cent., were returned as twenty-one and under twenty-five; 9,637, or 26 per cent., as twenty-five and under thirty; 6,492, or 17 per cent., as thirty and under forty; and 3,166 or 9 per cent., as forty years of age or over. The following table relates to the year 1947.
| Age of Bridegroom, In Years. | Age of Bride, in Years. | Total Bridegrooms. | ||||||
|---|---|---|---|---|---|---|---|---|
| Under 21. | 21 and under 25. | 25 and under 30. | 30 and under 35. | 35 and under 40. | 40 and under 45. | 45 and over. | ||
| Under 21 | 476 | 200 | 17 | 2 | 1 | 696 | ||
| 21 and under 25 | 1,884 | 3,279 | 602 | 66 | 3 | 1 | 5,835 | |
| 25 and under 30 | 1,097 | 2,759 | 1,625 | 321 | 61 | 8 | 5,871 | |
| 30 and under 35 | 245 | 875 | 930 | 534 | 169 | 33 | 9 | 2,795 |
| 35 and under 40 | 52 | 249 | 402 | 351 | 216 | 64 | 16 | 1,350 |
| 40 and under 45 | 11 | 58 | 130 | 173 | 145 | 116 | 52 | 685 |
| 45 and over | 7 | 32 | 60 | 117 | 188 | 232 | 657 | 1,293 |
| Total brides | 3,772 | 7,452 | 3,766 | 1,564 | 783 | 454 | 734 | 18,525 |
There have been some considerable changes in the proportions of persons marrying at the various age-periods. To illustrate the extent to which these figures have varied since the beginning of the century, a table is given showing the proportions of men and women married at each age-period to every 100 marriages in quinquennia from 1900 to 1939 and for the three-year period 1945–47.
| Period. | Under 21. | 21 and under 25. | 25 and under 30. | 30 and under 35. | 35 and under 40. | 40 and under 45. | 45 and over. | Totals. |
|---|---|---|---|---|---|---|---|---|
| Males | ||||||||
| 1900–04 | 1.67 | 24.75 | 38.42 | 18.63 | 8.05 | 3.58 | 4.90 | 100.00 |
| 1905–09 | 1.79 | 23.42 | 39.25 | 18.78 | 8.47 | 3.38 | 4.91 | 100.00 |
| 1910–14 | 1.94 | 22.04 | 38.04 | 20.75 | 8.54 | 3.90 | 4.79 | 100.00 |
| 1915–19 | 3.26 | 21.40 | 33.04 | 19.67 | 10.47 | 5.02 | 7.14 | 100.00 |
| 1920–24 | 3.13 | 24.66 | 32.21 | 17.73 | 10.24 | 5.43 | 6.60 | 100.00 |
| 1925–29 | 3.49 | 28.04 | 34.49 | 14.33 | 7.70 | 4.48 | 7.47 | 100.00 |
| 1930–34 | 3.46 | 27.28 | 37.02 | 15.14 | 6.10 | 3.61 | 7.39 | 100.00 |
| 1935–39 | 2.68 | 25.91 | 38.26 | 16.46 | 6.75 | 3.22 | 6.72 | 100.00 |
| 1945–47 | 3.84 | 28.65 | 32.96 | 16.00 | 7.67 | 3.88 | 7.00 | 10000 |
| Females | ||||||||
| 1900–04 | 16.92 | 39.75 | 27.33 | 9.26 | 3.40 | 1.53 | 1.81 | 100.00 |
| 1905–09 | 16.15 | 37.10 | 28.53 | 10.18 | 4.21 | 1.80 | 2.03 | 100.00 |
| 1910–14 | 15.60 | 34.90 | 28.52 | 11.57 | 5.04 | 2.05 | 2.32 | 100.00 |
| 1915–19 | 15.21 | 35.01 | 26.17 | 11.39 | 6.06 | 2.98 | 3.18 | 100.00 |
| 1920–24 | 15.99 | 35.47 | 26.21 | 10.66 | 5.53 | 2.98 | 3.16 | 100.00 |
| 1925–29 | 18.61 | 37.88 | 23.67 | 8.93 | 4.65 | 2.82 | 3.44 | 100.00 |
| 1930–34 | 18.67 | 38.51 | 24.79 | 8.22 | 3.85 | 2.40 | 3.56 | 100.00 |
| 1935–39 | 17.10 | 38.26 | 26.30 | 8.86 | 3.91 | 2.02 | 3.55 | 100.00 |
| 1945–47 | 18.74 | 39.38 | 22.30 | 8.88 | 4.31 | 2.37 | 4.02 | 100.00 |
A perusal of the above table reveals the fact that greater proportions of marriages are now being celebrated at both the younger and the older age-groups. There is also a decline over the whole period in the 25 and under 30 age-group. This has become very marked in the 1945–47 period, and is mainly due to a large proportion of the male population in this age-group being overseas during the early part of the period. Moreover, the fact that the outbreak of war induced a number of earlier marriages has resulted in fewer unmarried people entering this age-group.
For many years the average age (arithmetic mean) at marriage for both males and females, more particularly the latter, showed a tendency to increase. However, after reaching its maximum in the three years 1917, 1918, and 1919, the average age recorded a slight but fairly constant decline during the next decade, since when it has fluctuated within narrow limits. The figures for each of the years 1934–40 and 1945–47 are as follows:—
| Year | Bridegrooms. | Brides. |
|---|---|---|
| 1934 | 29.80 | 26.15 |
| 1935 | 29.94 | 26.27 |
| 1936 | 29.97 | 26.32 |
| 1937 | 29.93 | 26.26 |
| 1938 | 30.03 | 26.37 |
| 1939 | 29.64 | 26.17 |
| 1940 | 29.41 | 25.97 |
| 1945 | 30.52 | 20.75 |
| 1946 | 29.73 | 26.18 |
| 1947 | 29.71 | 20.11 |
The average ages of bachelors and spinsters at marriage are considerably lower than those shown in the preceding table, which covers all parties and is naturally affected by the inclusion of remarriages of widowed and divorced persons. The average ages of grooms and brides of the various conditions in each of the last five years for which the information is available were:—
| Year. | Bridegrooms. | Brides. | ||||
|---|---|---|---|---|---|---|
| Bachelors. | Divorced. | Widowers. | Spinsters. | Divorced. | Widows. | |
| Years. | Years. | Years. | Years. | Years. | Years. | |
| 1939 | 28.06 | 41.68 | 52.04 | 25.01 | 35.88 | 47.01 |
| 1940 | 27.82 | 41.07 | 50.46 | 24.85 | 36.00 | 45.68 |
| 1945 | 28.30 | 39.90 | 52.40 | 25.13 | 35.93 | 42.43 |
| 1946 | 27.80 | 39.63 | 52.59 | 24.76 | 34.06 | 41.22 |
| 1947 | 27.54 | 39.39 | 52.76 | 24.44 | 34.57 | 42.83 |
The foregoing figures give the average ages at marriage, but these do not correspond with the modal or popular age, if the age at which the most marriages are celebrated may be so termed. For several years prior to 1918 age 26 held pride of place for bridegrooms and age 21 for brides. The latter has continued right through to 1947 without alteration, but in the case of bridegrooms the most popular age has varied, and for 1947 was 24.
Marriages of Minors.—Of every 1,000 men married in 1947, 38 were under twenty-one years of age, while 207 in every 1,000 brides were under twenty-one.
In 476 marriages in 1947 both parties were given as under twenty-one years of age, in 3,296 marriages the bride was returned as a minor and the bridegroom as an adult, and in 220 marriages the bridegroom was a minor and the bride an adult.
The proportion of minors among persons marrying declined continuously from 1932 to 1936, probably a result of the depression. Since 1936 there have been substantial increases in the actual numbers of minors marrying, although the number of brides coming within this category in 1945 was considerably below the 1940 figure. Figures for the years 1939–40 and 1945–47 are contained in the following table:—
| Year. | Age in Years. | Totals. | |||||
|---|---|---|---|---|---|---|---|
| 16. | 17. | 18. | 19. | 20. | Number. | Rate per 100 Marriages. | |
| Bridegrooms | |||||||
| 1939 | 2 | 6 | 39 | 141 | 242 | 430 | 2.51 |
| 1940 | 1 | 7 | 65 | 146 | 351 | 570 | 3.27 |
| 1945 | 3 | 17 | 76 | 187 | 408 | 691 | 4.28 |
| 1946 | 12 | 62 | 182 | 476 | 732 | 3.56 | |
| 1947 | 2 | 11 | 78 | 218 | 387 | 696 | 3.81 |
| Brides | |||||||
| 1939 | 90 | 313 | 577 | 959 | 1,056 | 2,995 | 17.50 |
| 1940 | 94 | 263 | 658 | 1,082 | 1,379 | 3,476 | 19.92 |
| 1945 | 75 | 207 | 516 | 850 | 1,161 | 2,809 | 17.38 |
| 1946 | 78 | 283 | 654 | 1,207 | 1,548 | 3,770 | 18.36 |
| 1947 | 92 | 303 | 704 | 1,155 | 1,518 | 3,772 | 20.67 |
MARRIAGES BY MINISTERS OF VARIOUS DENOMINATIONS.—Of the 18,525 marriages registered in 1947, Church of England clergymen officiated at 4,914, Presbyterians at 5,236, Roman Catholics at 2,269, and Methodists at 1,775, while 3,371 marriages were celebrated before Registrars.
The following table shows the proportions of marriages by ministers of the principal denominations in each of the years 1934–40 and 1945–47.
| Denomination. | Percentage of Marriages. | |||||||||
|---|---|---|---|---|---|---|---|---|---|---|
| 1934. | 1935. | 1936. | 1937. | 1938. | 1939. | 1940. | 1945. | 1946. | 1947. | |
| Church of England | 25.52 | 26.07 | 26.10 | 26.52 | 26.93 | 27.16 | 27.45 | 27.94 | 27.68 | 26.53 |
| Presbyterian | 26.58 | 26.79 | 26.94 | 26.86 | 26.46 | 25.37 | 26.10 | 27.88 | 28.35 | 28.26 |
| Methodist | 10.50 | 10.43 | 10.55 | 10.74 | 10.73 | 10.41 | 10.17 | 10.35 | 9.78 | 9.58 |
| Roman Catholic | 11.50 | 11.40 | 11.65 | 11.74 | 11.58 | 12.60 | 12.23 | 11.58 | 11.85 | 12.25 |
| Other denominations | 7.92 | 8.39 | 7.61 | 7.27 | 7.18 | 7.08 | 7.04 | 5.88 | 5.74 | 5.18 |
| Before Registrars | 17.98 | 16.92 | 17.15 | 16.87 | 17.12 | 17.38 | 17.01 | 16.37 | 16.60 | 18.20 |
| Totals | 100.00 | 100.00 | 100.00 | 100.00 | 100.00 | 100.00 | 100.00 | 100.00 | 100.00 | 100.00 |
The foregoing figures must not be taken as an exact indication of the religious professions of the parties married, as it does not necessarily follow that both (or even one) of the parties are members of the Church whose officiating minister performed the ceremony, and persons married before Registrars may belong, in greater or lesser proportion, to any or none of the denominations. Of the population (exclusive of Maoris) at the general census of 1945 who stated their religious profession, 41.0 per cent. were adherents of the Church of England, 25.5 per cent. Presbyterian, 14.7 per cent. Roman Catholic, 8.8 per cent. Methodist, and 10.0 per cent. other denominations.
The proportion of civil marriages in 1947 was appreciably higher than in 1946 and was the highest recorded since 1931, when it reached 22.62 per cent. The year recording the highest proportion was 1917, when 24.77 per cent. of marriages took place before Registrars.
NUMBER OF OFFICIATING MINISTERS.—The number of names on the list of officiating ministers under the Marriage Act was (January, 1948) 2,471, and the denominations to which they belong are shown hereunder.
| Denomination. | Number. |
|---|---|
| Church of England | 490 |
| Roman Catholic Church | 489 |
| Presbyterian Church of New Zealand | 430 |
| Methodist Church of New Zealand | 320 |
| Ratana Church of New Zealand | 137 |
| Salvation Army | 121 |
| Baptist | 102 |
| Ringatu Church | 41 |
| Latter Day Saints | 39 |
| Seventh Day Adventist | 39 |
| Associated Churches of Christ | 37 |
| Brethren | 36 |
| Congregational Independent | 30 |
| Commonwealth Covenant Church | 19 |
| Liberal Catholic Church | 12 |
| Apostolic Church | 11 |
| Assemblies of God | 10 |
| Spiritualist Church of New Zealand | 9 |
| United Maori Mission | 8 |
| Church of Te Kooti Rikirangi | 7 |
| Absolute Maori Established Church | 6 |
| Churches of Christ | 6 |
| Evangelical Lutheran Concordia Conference | 6 |
| Evangelistic Church of Christ | 6 |
| Hebrew Congregations | 6 |
| Christadelphian | 5 |
| Te Maramatanga Christian Society | 5 |
| Pentecostal Church of New Zealand | 4 |
| Rationalist | 3 |
| Avondale Mission | 2 |
| Christian Spiritualist Mission | 2 |
| Covenant Mission | 2 |
| Foursquare Gospel Mission | 2 |
| New Covenant Assembly | 2 |
| Star of Hope Mission of New Zealand | 2 |
| Unitarian | 2 |
| Others | 23 |
| Total | 2,471 |
The Ringatu Church, the Te Maramatanga Christian Society, the Ratana Church of New Zealand, the Absolute Maori Established Church, the United Maori Mission, and the Church of Te Kooti Rikirangi are Maori denominations.
DIVORCE.—The provisions as to dissolution of marriage are contained in the Divorce and Matrimonial Causes Act, 1928, which consolidated and amended the then existing legislation on the subject.
A brief historical account of divorce legislation is given in the 1931 issue of the Year-Book; the present position is outlined in the following résumé.
Any married person, domiciled in New Zealand for two or more years at the time of filing the petition, may obtain a divorce on one or more of the following grounds:—
Adultery since the celebration of the marriage.
Wilful and continuous desertion for three years or more.
Habitual drunkenness for four years, coupled with (wife's petition) failure to support or habitual cruelty, or with (husband's petition) neglect of, or self-caused inability to discharge, domestic duties.
Sentence to imprisonment for seven years or more for attempting to murder, or for wounding or doing actual bodily harm to, petitioner or child.
Murder of child of petitioner or respondent.
Insanity and confinement as a lunatic for seven out of ten years preceding the petition.
Insanity for seven years, and confinement for three years immediately preceding the petition.
Failure to comply with a decree of Court for restitution of conjugal rights.
Parties have separated under an agreement, written or verbal, which has been in full force for not less than three years.
Parties have been separated by a decree of judicial separation or a separation order which has been in force for three years. (An amendment in 1930 removed the restriction imposed by the principal Act—which permitted only New Zealand decrees or orders—and extended the provision to cover similar decrees or orders made in any country.)
Husband guilty of rape, sodomy, or bestiality since marriage.
A deserted wife whose husband was domiciled in New Zealand at the time of desertion is considered, for the purpose of the Divorce and Matrimonial Causes Act, 1928, as retaining her New Zealand domicile. Where a wife petitions on grounds (i) and (j), her New Zealand domicile is retained if her husband was domiciled in New Zealand at the date of the agreement, decree, or order.
The amending Act of 1930 establishes a New Zealand domicile for a wife petitioning for divorce where she has been living apart from her husband for three years, if she has been living in New Zealand for three years preceding the petition, and has the intention of residing in New Zealand permanently.
The Matrimonial Causes (War Marriages) Act, 1947, makes special provisions in respect of war marriages where one of the parties was domiciled outside New Zealand by: (1) Extension of jurisdiction of the Supreme Court to certain marriages irrespective of domicile; (2) recognition of decrees and orders (in relation to such marriages) made in the United States of America; and (3) shortening the period of desertion or separation as ground for divorce in such cases from three years to twelve months.
By authority of the Act, previous legislation on the subject embodied in the Matrimonial Causes (War Marriages) Emergency Regulations 1946 was revoked, accrued rights being protected.
Figures showing the operations of the Supreme Court in its divorce jurisdiction during recent years are as follows. About 50 per cent. of the decrees granted in any year relate to petitions filed in prior years.
| Year. | Dissolution or Nullity of Marriage. | Judicial Separation. | Restitution of Conjugal Rights. | ||||
|---|---|---|---|---|---|---|---|
| Petitions filed. | Decrees Nisi. | Decrees Absolute. | Petitions filed. | Decrees for Separation. | Petitions filed. | Decrees for Restitution. | |
| 1937 | 1,154 | 1,008 | 917 | 4 | 138 | 107 | |
| 1938 | 1,178 | 1,063 | 1,050 | 5 | 1 | 145 | 119 |
| 1939 | 1,243 | 1,092 | 1,032 | 4 | 2 | 161 | 123 |
| 1940 | 1,189 | 1,042 | 1,059 | 3 | 112 | 106 | |
| 1941 | 1,115 | 996 | 956 | 6 | 1 | 114 | 100 |
| 1942 | 1,177 | 988 | 962 | 5 | 3 | 142 | 94 |
| 1943 | 1,641 | 1,398 | 1,100 | 4 | 1 | 302 | 227 |
| 1944 | 1,992 | 1,821 | 1,630 | 7 | 2 | 499 | 421 |
| 1945 | 2,211 | 1,914 | 1,725 | 11 | 2 | 550 | 461 |
| 1946 | 2,363 | 2,137 | 2,133 | 10 | 6 | 562 | 463 |
| 1947 | 2,191 | 2,051 | 2,117 | 7 | 1 | 430 | 371 |
As was to be expected, the later years of the war witnessed a marked increase in the incidence of divorce. However, it was not anticipated that the high level of decrees absolute granted in 1945 would be exceeded by approximately 400 in each of the two succeeding years. Although a slight falling off, for the first time in six years was recorded during 1947, it is worth noting that for every nine marriages solemnized during that year, one was dissolved.
The next table gives the grounds (dissolution or nullity cases) of petitions and decrees during 1946 and 1947.
| Grounds. | Petitions Filed. | Decrees Absolute Granted. | ||||||
|---|---|---|---|---|---|---|---|---|
| Husbands' Petitions. | Wives' Petitions. | Husbands' Petitions. | Wives' Petitions. | |||||
| 1946. | 1947. | 1946. | 1947. | 1946. | 1947. | 1946. | 1947. | |
| Adultery | 386 | 246 | 200 | 150 | 363 | 251 | 148 | 160 |
| Bigamy | 2 | 1 | 6 | 9 | 1 | 3 | 4 | 5 |
| Desertion | 160 | 165 | 188 | 182 | 135 | 141 | 100 | 185 |
| Drunkenness, with cruelty, failure to maintain, &c. | 1 | 8 | 8 | 1 | 8 | 5 | ||
| Insanity | 12 | 14 | 4 | 2 | 12 | 16 | 1 | 3 |
| Rape | 2 | 1 | 1 | 1 | ||||
| Non-compliance with order for restitution of conjugal rights | 315 | 279 | 100 | 101 | 311 | 301 | 98 | 112 |
| Separation for not less than three years | 446 | 472 | 527 | 554 | 410 | 393 | 532 | 535 |
| Non-consummation | 2 | 4 | 7 | 1 | 7 | 6 | ||
| Totals | 1,324 | 1,177 | 1,039 | 1,014 | 1,234 | 1,105 | 899 | 1,012 |
The figures shown for decrees absolute cover all such granted during the year, whether the antecedent decree nisi was granted in the same or in a previous year.
The principal grounds on which petitions were filed during 1947 showed the following increases compared with 1938, a normal peacetime year: Adultery, 193 (95.1 percent.); desertion, 135 (63.7 per cent.); non-compliance with restitution order, 271 (248.6 per cent.); and separation, 391 (61.6 per cent.).
In 793 of the 2,191 cases where petitions for dissolution were filed during 1947 there was no living issue of the marriage. The number of living issue was 1 in 605 cases, 2 in 400 cases, 3 in 192 cases, 4 or more in 200 cases, while the number of issue was not stated in one case.
The table which follows shows the duration of marriage in all oases for which petitions for dissolution were filed in the five years 1943 to 1947.
| Duration of Marriage, in Years. | Husbands' Petitions. | Wives' Petitions. | ||||||||
|---|---|---|---|---|---|---|---|---|---|---|
| 1943. | 1944. | 1945. | 1946. | 1947. | 1943. | 1944. | 1945. | 1946. | 1947. | |
| Under 5 | 194 | 280 | 218 | 240 | 213 | 84 | 91 | 113 | 167 | 158 |
| 5 and under 10 | 220 | 354 | 476 | 480 | 404 | 211 | 257 | 320 | 343 | 334 |
| 10 and under 15 | 184 | 186 | 232 | 245 | 218 | 169 | 160 | 186 | 204 | 191 |
| 15 and under 20 | 122 | 164 | 147 | 166 | 140 | 122 | 118 | 149 | 140 | 122 |
| 20 and under 30 | 116 | 116 | 138 | 145 | 141 | 121 | 155 | 142 | 141 | 152 |
| 30 and over | 59 | 56 | 50 | 48 | 61 | 36 | 40 | 40 | 44 | 56 |
| Not stated | 2 | 7 | 1 | 8 | 1 | |||||
| Totals | 897 | 1,163 | 1,261 | 1,324 | 1,177 | 744 | 829 | 950 | 1,039 | 1,014 |
The number of children affected by the divorce petitions of their parents during each of the last five years was as follows: 1943, 2,439; 1944, 2,696; 1945, 2,903; 1946, 3,120; and 1947, 2,978.
REGISTRATION.—The history of the early legislative requirements in regard to the registration of deaths in New Zealand is similar to that in relation to births, particulars of which will be found on page 41.
Until the year 1876 the only particulars provided for in the death-registration entry were the date, place, and cause of death, and the name, sex, age, and occupation of deceased. The Registration of Births and Deaths Act, 1875, required information to be recorded as regards parentage, conjugal condition, and issue of deceased. Particulars as to burial had also to be entered, as well as more detailed information regarding cause of death. Subsequent amendments to the Act have made it requisite to give additional information concerning issue, and, in the case of married males, age of widow.
Every death occurring in New Zealand is required to be registered within three days after the day of the death if in a city or borough, or seven days in any other case. There is a penalty up to £10 for neglect, the undertaker in charge of the funeral being solely responsible for registration. Prior to 1913 the undertaker was primarily responsible for registration, but, in addition, the occupier of the house and every other person present at the death were also responsible parties.
The law does not impose any limit of time after which a death may not be registered as it does in the case of a birth. Although it is necessary to effect a birth-registration entry in the case of a still-born child, no entry is made in the register of deaths. Section 15 of the Statutes Amendment Act, 1946, amending the Births and Deaths Registration Act, 1924, stipulates, however, that a medical practitioner or a midwife in attendance at a confinement where a still-birth occurs must furnish a certificate stating to the best of his or her knowledge and belief the cause of the still-birth.
Any person burying, or permitting or taking part in the burial of, the body of any deceased person without a certificate of cause of death signed by a duly registered medical practitioner, a Coroner's order to bury the body, or a Registrar's certificate of registration of the death, renders himself liable to a fine of £10.
Prior to 1937 it was incumbent upon a medical practitioner to give the certificate of cause of death to the person required to supply information for the purpose of registering the death (the undertaker or other person in charge of the burial). By section 11 of the Statutes Amendment Act, 1936, however, the medical practitioner is now required to deliver the certificate forthwith direct to the Registrar of the district in which the death occurred. It is also the duty of the medical practitioner, on signing a certificate of cause of death, to give written notice of the signing to the undertaker or other person having charge of the burial.
In the new form of medical certificate introduced by this amendment, provision is made for an additional statement to be filled in by the medical practitioner in any case where, in his opinion, the death has occurred in any circumstances of suspicion. The practitioner is required to report such case forthwith to the Coroner, and an indication that this has been done must be made in the space provided on the certificate.
Section 3 of the Statutes Amendment Act, 1944, makes provision for the correction of the register of deaths in cases where it is subsequently determined, as a result of a post-mortem examination or by any other means, that the causes of death as stated in the certificate are found to be materially incorrect. This may be effected by the Registrar on receiving a statement correctly setting out the causes of death and signed by a medical practitioner appearing to the Registrar to have a knowledge of the circumstances.
Deaths of Members of the Forces while Overseas.—The Registration of Deaths Emergency Regulations 1941, which superseded 1940 regulations of similar title, required the Registrar-General to compile a War Deaths Register of persons of New Zealand domicile who died while out of New Zealand on service in some capacity in connection with the 1939–45; war. Members of the New Zealand Naval Forces were excluded from the regulations, special provision having previously been made in their case. These Regulations were revoked by the Births and Deaths Registration Amendment Act, 1947, which made permanent statutory provision in this connection. The amendment requires the Registrar-General to compile a register of all persons who have died while out of New Zealand on service with any of the Armed Forces of His Majesty and who at the time of their deaths were domiciled in New Zealand. Deaths registered in the War Deaths Register were not taken into account in arriving at the number and rate of deaths in New Zealand, nor were deaths of visiting overseas servicemen or prisoners of war in New Zealand. Deaths of New Zealand servicemen which occurred in New Zealand were, however, included.
Registration of Maori Deaths.—Registration of the deaths of Maoris are effected with the Maori Registrars in the various districts set up for this purpose. Statistics relating to the deaths of Maoris are not included in this subsection, and may be found treated fully in Subsection D.
NUMBERS AND RATES.—The following table shows the number of deaths and the death-rate per 1,000 of the mean population during each of the last twenty years.
| Year. | Number. | Rate per 1,000. |
|---|---|---|
| 1928 | 11,811 | 8.50 |
| 1929 | 12,314 | 8.76 |
| 1930 | 12,199 | 8.57 |
| 1931 | 12,047 | 8.35 |
| 1932 | 11,683 | 8.04 |
| 1933 | 11,701 | 7.99 |
| 1934 | 12,527 | 8.50 |
| 1935 | 12,217 | 8.25 |
| 1936 | 13,056 | 8.75 |
| 1937 | 13,658 | 9.08 |
| 1938 | 14,754 | 9.71 |
| 1939 | 14,158 | 9.20 |
| 1940 | 14,282 | 9.24 |
| 1941 | 15,146 | 9.84 |
| 1942 | 16,385 | 10.60 |
| 1943 | 15,447 | 10.04 |
| 1944 | 15,363 | 9.87 |
| 1945 | 16,051 | 10.07 |
| 1946 | 16,093 | 9.70 |
| 1947 | 15,904 | 9.38 |
New Zealand has been noted for many years for its favourable death-rate. In the early history of the country the high proportion of immigrants to total population contributed very materially towards the establishment of a comparatively low death-rate, while the favourable climate also was, and still is, an important factor. The effect of immigration in causing a high ratio of persons in the early adult ages—at which ages mortality experience is most favourable—more than counterbalanced the effect on the death-rate of the hazards inherent in the pioneering activities typical of the economy of the country in those days. The influence of immigration on vital statistics has, however, waned very considerably in the later decades.
The fact that the death-rate is still comparatively very low, despite the older age-constitution of the population, is probably due, inter alia, to improvements in medical techniques, expansion of health services, &c. This progress has been reflected for example, in a relatively low incidence of serious outbreaks of the more important epidemic diseases (which were much more prevalent in the early years of colonization) and in a remarkably low infant-mortality rate.
As observed in the subsection on Births, the general trend of the birth-rate in New Zealand has been downwards for several decades. The initial effect of a falling birth-rate on the mortality experience of a population is to lower the death-rate, the age constitution becoming more favourable towards a low death-rate, since there are fewer infants and a relatively higher ratio of persons of the younger adult ages. That this has been a very material factor contributing to New Zealand's low death-rate is obvious; for a death-rate of 7.99 per 1,000—the low point which was reached in 1933—would connote an expectation of life of almost 125 years if it applied to a population of stable age-distribution. The increase in the crude death-rate in recent years has accompanied an upward movement in the birth-rate. It is, however, mainly duo to the fact that, through an increasing proportion of people at the higher ages, the age constitution of the population has passed the optimum distribution from the viewpoint of maintaining a very low level of death-rates. This trend may be expected to continue, since the present death-rate is still lower than could be regarded as possible in a population stable in respect of age constitution.
A factor contributing to the increase in the death-rates during the earlier war period, particularly the male rates, has been the absence overseas of considerable numbers of men of early adult years, which, as stated earlier, are the age-groups at which mortality experience is most favourable. It is possible that the very high rates for deaths in the older age-groups during 1942 may be associated with the wartime tresses of that year. Some validity can be given to this view owing to the sharp rise in deaths resulting from diseases of the heart and nervous system. The return of servicemen from overseas, the absence of any severe outbreak of epidemic diseases, together with exceptionally low infant-mortality rates, are the principal factors responsible for the decline in the death-rate in 1946 and 1947.
The death-rates of males and females for each of the years 1937–47 are shown separately in the next table.
| Year. | Deaths per 1,000 of Population. | Male Deaths to every 100 Female Deaths. | Male Rate expressed as Index Number of Female Rate (=100). | ||
|---|---|---|---|---|---|
| Males. | Females. | Totals. | |||
| 1937 | 9.85 | 8.28 | 9.08 | 122 | 119 |
| 1938 | 10.71 | 8.68 | 9.71 | 127 | 123 |
| 1939 | 10.10 | 8.26 | 9.20 | 126 | 122 |
| 1940 | 10.18 | 8.28 | 0.24 | 124 | 123 |
| 1941 | 11.03 | 8.69 | 9.84 | 123 | 127 |
| 1942 | 11.80 | 9.47 | 10.60 | 119 | 125 |
| 1943 | 11.36 | 8.81 | 10.04 | 119 | 129 |
| 1944 | 11.32 | 8.53 | 9.87 | 123 | 133 |
| 1945 | 11.37 | 8.84 | 10.07 | 122 | 129 |
| 1946 | 10.54 | 8.86 | 9.70 | 118 | 119 |
| 1947 | 10.48 | 8.27 | 9.38 | 127 | 127 |
DISTRIBUTION OF DEATHS OVER THE YEAR.—An examination of the total number of deaths registered in each quarter of the period 1937–47 gives the following averages: March quarter, 3,304; June quarter, 3,775; September quarter, 4,484; and December quarter, 3,816.
A classification according to month of death shows that in 1947 the months during which the greatest number of deaths occurred were June, July, and August, with totals of 1,421, 1,554, and 1,544 respectively. Excluding December, a proportion of deaths occurring in that month not being registered till January, February had the least number of deaths (1,106), followed by March and April, with 1,156 and 1,171 respectively.
The lowest number of deaths on any one day, again excluding December, was 25, this number occurring on the 15th March. The greatest number (67) occurred on the 9th August.
AGE AT DEATH.—The deaths registered during the year 1947 are tabulated below according to age.
| Age. | Males. | Females. | Totals. |
|---|---|---|---|
| Under 1 month | 455 | 355 | 810 |
| 1–2 months | 50 | 41 | 91 |
| 3–5 months | 65 | 44 | 109 |
| 6–11 months | 54 | 58 | 112 |
| 1 year | 55 | 55 | 110 |
| 2 years | 31 | 23 | 54 |
| 3 years | 17 | 17 | 34 |
| 4 years | 16 | 13 | 29 |
| 5–9 years | 60 | 23 | 83 |
| 10–14 years | 37 | 21 | 58 |
| 15–19 years | 69 | 52 | 121 |
| 20–24 years | 121 | 78 | 199 |
| 25–29 years | 100 | 103 | 203 |
| 30–34 years | 116 | 104 | 220 |
| 35–39 years | 140 | 126 | 266 |
| 40–44 years | 167 | 134 | 301 |
| 45–49 years | 293 | 234 | 527 |
| 50–54 years | 402 | 304 | 706 |
| 55–59 years | 618 | 434 | 1,052 |
| 60–64 years | 924 | 595 | 1,519 |
| 65–69 years | 1,272 | 845 | 2,117 |
| 70–74 years | 1,284 | 933 | 2,217 |
| 75–79 years | 1,174 | 987 | 2,161 |
| 80–84 years | 761 | 789 | 1,550 |
| 85–89 years | 442 | 440 | 882 |
| 90–94 years | 129 | 168 | 297 |
| 95–99 years | 29 | 42 | 71 |
| 100 years | 2 | 2 | 4 |
| 103 years | 1 | 1 | |
| Totals | 8,884 | 7,020 | 15,904 |
The following table indicates the changes that have occurred over a period of fifty years in the age-distribution of persons dying. The movement in the proportions of deaths occurring at the different age-groups is very striking. The results of three main factors are illustrated—viz., health measures, which have achieved an immense saving of young life; the heavy fall in the birth-rate over the period; and the great increase in the proportion of old people in the community.
| Age, In Years. | Number of Deaths. | Percentage of Total. | ||||||||
|---|---|---|---|---|---|---|---|---|---|---|
| 1897. | 1907. | 1917. | 1927. | 1947. | 1897. | 1907. | 1917. | 1927. | 1947. | |
| Under 1 | 1,354 | 2,228 | 1,360 | 1,080 | 1,122 | 20.53 | 22.13 | 12.92 | 9.30 | 7.06 |
| 1 and under 5 | 378 | 658 | 519 | 353 | 227 | 5.73 | 6.54 | 4.93 | 3.04 | 1.43 |
| 5 and under 10 | 150 | 201 | 304 | 185 | 83 | 2.27 | 2.0 | 2.89 | 1.59 | 0.52 |
| 10 and under 15 | 154 | 165 | 156 | 166 | 58 | 2.34 | 1.64 | 1.48 | 1.43 | 0.37 |
| 15 and under 20 | 242 | 257 | 190 | 227 | 121 | 3.63 | 2.55 | 1.80 | 1.95 | 0.76 |
| 20 and under 25 | 308 | 372 | 256 | 305 | 199 | 4.07 | 3.70 | 2.43 | 2.63 | 1.25 |
| 25 and under 30 | 283 | 412 | 343 | 289 | 203 | 4.29 | 4.09 | 3.26 | 2.49 | 1.28 |
| 30 and under 35 | 250 | 385 | 404 | 310 | 220 | 3.79 | 3.82 | 3.84 | 2.67 | 1.38 |
| 35 and under 40 | 270 | 359 | 478 | 375 | 266 | 4.09 | 3.57 | 4.54 | 3.23 | 1.67 |
| 40 and under 45 | 273 | 320 | 430 | 448 | 301 | 4.15 | 3.18 | 4.08 | 3.86 | 1.89 |
| 45 and under 50 | 322 | 371 | 457 | 644 | 527 | 4.88 | 3.69 | 4.34 | 5.55 | 3.31 |
| 50 and under 55 | 329 | 387 | 502 | 700 | 706 | 4.99 | 3.84 | 4.77 | 6.03 | 4.44 |
| 55 and under 60 | 390 | 424 | 546 | 745 | 1,052 | 5.91 | 4.21 | 5.19 | 6.41 | 6.61 |
| 60 and under 65 | 443 | 555 | 674 | 869 | 1,519 | 6.72 | 5.51 | 6.40 | 7.48 | 9.55 |
| 65 and under 70 | 430 | 754 | 787 | 977 | 2,117 | 6.52 | 7.49 | 7.48 | 8.41 | 13.31 |
| 70 and under 75 | 365 | 801 | 848 | 1,129 | 2,217 | 5.53 | 7.96 | 8.05 | 9.72 | 13.94 |
| 75 and under 80 | 322 | 679 | 961 | 1,081 | 2,161 | 4.88 | 6.75 | 9.31 | 13.59 | |
| 80 and over | 332 | 738 | 1,313 | 1,730 | 2,805 | 5.03 | 7.33 | 12.47 | 14.90 | 17.64 |
| Totals. | 6,595 | 10,066 | 10,528 | 11,613 | 15,904 | 100.00 | 100.00 | 100.00 | 100.00 | 100.00 |
During the earlier period covered by the next table the fall in the death-rate was common to all ages and to both sexes. In more recent years, however, there have been some fluctuations in the rates for the higher age-groups, but the 1947 figures again reflect a declining tendency. Of special significance are the low rates recorded in the childhood and early adult life age-groups in 1047 and the high percentage reduction effected during the longer period. The female rate for the various age-groups is almost invariably lower than the male rate. The rapid increase in the death-rate (per 1,000 of population) at successive age-groups is well exemplified.
| Year. | Under 1.* | 1 and under 5. | 5 and under 15. | 15 and under 25. | 25 and under 35. | 35 and under 45. | 45 and under 55. | 55 and under 65. | 65 and under 75. | 75 and over. |
|---|---|---|---|---|---|---|---|---|---|---|
* Per 1,000 live-births in this case. | ||||||||||
| Males | ||||||||||
| 1901 | 7860 | 6.81 | 1.89 | 3.52 | 3.97 | 6.16 | 11.94 | 2312 | 5059 | 141.67 |
| 1911 | 63.48 | 5.36 | 1.91 | 2.42 | 3.87 | 6.27 | 11.02 | 20.83 | 53.22 | 130.58 |
| 1921 | 53.10 | 4.78 | 1.85 | 2.44 | 3.56 | 5.55 | 9.61 | 19.96 | 4617 | 128.60 |
| 1931 | 38.21 | 2.83 | 1.35 | 2.28 | 2.77 | 4.64 | 8.69 | 18.25 | 44.18 | 130.57 |
| 1941 | 32.55 | 2.14 | 0.99 | 1.98 | 2.62 | 3.76 | 8.79 | 20.67 | 46.31 | 137.85 |
| 1947 | 27.25 | 1.76 | 0.72 | 1.48 | 1.69 | 2.54 | 7.60 | 19.45 | 46.81 | 126.90 |
| Females | ||||||||||
| 1901 | 63.87 | 5.50 | 1.64 | 3.58 | 4.72 | 6.70 | 10.62 | 19.44 | 43.32 | 127.98 |
| 1911 | 48.74 | 5.37 | 1.48 | 2.76 | 4.34 | 4.92 | 8.38 | 17.89 | 40.44 | 119.60 |
| 1921 | 42.31 | 4.49 | 1.31 | 2.34 | 3.38 | 4.46 | 8.00 | 14.88 | 36.81 | 120.23 |
| 1931 | 25.67 | 2.47 | 0.97 | 1.85 | 3.20 | 3.81 | 6.84 | 15.36 | 36.83 | 122.87 |
| 1941 | 26.85 | 2.04 | 0.71 | 1.35 | 2.05 | 3.14 | 6.58 | 14.55 | 3806 | 116.57 |
| 1947 | 22.72 | 1.67 | 0.34 | 1.02 | 1.57 | 2.23 | 5.70 | 12.74 | 31.52 | 105.57 |
| Both Sexes | ||||||||||
| 1901 | 71.40 | 6.17 | 1.77 | 3.55 | 4.33 | 6.40 | 11.37 | 21.63 | 47.87 | 135.71 |
| 1911 | 56.31 | 5.36 | 1.70 | 2.58 | 4.09 | 5.64 | 9.82 | 19.55 | 47.74 | 126.13 |
| 1921 | 47.82 | 4.64 | 1.58 | 2.39 | 3.47 | 5.10 | 8.85 | 17.59 | 41.90 | 124.84 |
| 1931 | 32.15 | 2.65 | 1.17 | 2.07 | 2.98 | 4.22 | 7.80 | 16.88 | 40.56 | 126.87 |
| 1941 | 29.77 | 2.09 | 0.85 | 1.65 | 2.32 | 3.44 | 7.65 | 17.68 | 42.20 | 126.76 |
| 1947 | 25.04 | 1.71 | 0.53 | 1.25 | 1.63 | 2.39 | 6.64 | 16.06 | 39.05 | 115.49 |
The average (arithmetic mean) age at death of persons of either sex at ten-yearly intervals since 1897 and during each of the last ten years was as follows:—
| Year. | Males. | Females. |
|---|---|---|
| 1897 | 38.80 | 34.77 |
| 1907 | 40.43 | 36.66 |
| 1917 | 48.33 | 45.51 |
| 1927 | 52.59 | 52.35 |
| 1937 | 57.70 | 58.82 |
| 1938 | 56.13 | 58.10 |
| 1939 | 58.77 | 59.14 |
| 1940 | 58.02 | 59.96 |
| 1941 | 58.65 | 59.60 |
| 1942 | 59.13 | 61.20 |
| 1943 | 58.92 | 61.01 |
| 1944 | 59.54 | 60.31 |
| 1945 | 59.24 | 61.76 |
| 1946 | 60.03 | 61.66 |
| 1947 | 59.31 | 61.82 |
There was a striking upward movement in the average age at death during the first thirty years covered by the table, particularly between 1907 and 1937. The last ten years, however have been marked by fluctuations within fairly narrow limits, although there has been a slight increase over the decade. A noticeable feature is that in the earlier years the age for females was considerably lower than that for males, the margin gradually narrowing until virtual equality was reached in 1927–28, since when the female average age at death has been higher than the male.
EXPECTATION OF LIFE.—Life tables based on the mortality experience of New Zealand, ranging from 1880 to 1922, have been published at various times in previous issues of the Year-Book. In addition, two tables have been constructed by L. I. Dublin, Ph.D., and A. J. Lotka, D.Sc., of the Metropolitan Life Insurance Co. of New York, from the following data supplied by the Census and Statistics Department: (1) the 1926 population figures, together with the deaths for the years 1925–27; (2) the 1931 intercensal population age-estimates, together with the deaths for the year 1931. The 1931 census was not taken, and the latest investigation was based on the 1936 census combined with the deaths for the years symmetrically disposed about the census year—namely, the five years 1934–38. It should be understood that the New Zealand life tables do not take into consideration the Maori population. The following table shows the (complete) expectation of life at various ages according to the periods for which the life tables have been compiled.
| Age. | 1891–95. | 1896–1900. | 1901–05. | 1906–10. | 1911–15. | 1921–22. | 1925–27. | 1931. | 1934–38. |
|---|---|---|---|---|---|---|---|---|---|
| Males | |||||||||
| 0 | 55.29 | 57.37 | 58.09 | 59.17 | 60.96 | 62.76 | 63.99 | 65.04 | 65.46 |
| 1 | 60.16 | 61.89 | 62.31 | 63.13 | 63.85 | 65.05 | 65.72 | 66.61 | 66.92 |
| 2 | 60.26 | 61.74 | 62.07 | 62.84 | 63.34 | 64.51 | 65.09 | 65.91 | 66.23 |
| 3 | 59.71 | 61.09 | 61.43 | 62.17 | 62.64 | 63.81 | 64.38 | 65.11 | 65.44 |
| 4 | 59.04 | 60.34 | 60.70 | 61.41 | 61.84 | 63.01 | 63.53 | 64.24 | 64.59 |
| 5 | 58.29 | 59.54 | 59.91 | 60.58 | 61.01 | 62.17 | 62.66 | 63.35 | 63.70 |
| 10 | 54.09 | 55.19 | 55.57 | 56.14 | 56.53 | 57.73 | 58.11 | 58.75 | 59.11 |
| 20 | 45.47 | 46.34 | 46.74 | 47.20 | 47.61 | 48.66 | 48.93 | 49.61 | 49.89 |
| 30 | 37.54 | 37.19 | 38.47 | 38.78 | 39.03 | 39.98 | 40.15 | 40.78 | 40.94 |
| 40 | 29.60 | 30.10 | 30.28 | 30.54 | 30.69 | 31.56 | 31.54 | 32.07 | 32.03 |
| 50 | 21.88 | 22.35 | 22.48 | 22.67 | 22.78 | 23.51 | 23.30 | 23.73 | 23.64 |
| 60 | 15.06 | 15.33 | 15.40 | 15.51 | 15.54 | 16.03 | 15.79 | 16.22 | 16.06 |
| 70 | 9.53 | 9.53 | 9.39 | 9.38 | 9.31 | 9.91 | 9.67 | 9.87 | 9.82 |
| 80 | 5.69 | 5.69 | 5.29 | 5.29 | 4.96 | 5.33 | 5.08 | 5.45 | 5.35 |
| Females | |||||||||
| 0 | 58.09 | 59.95 | 60.55 | 61.76 | 63.48 | 65.43 | 66.57 | 67.88 | 68.45 |
| 1 | 61.99 | 63.57 | 63.97 | 64.82 | 65.59 | 67.03 | 67.87 | 68.64 | 69.46 |
| 2 | 61.98 | 63.33 | 63.71 | 64.50 | 65.11 | 66.44 | 67.27 | 67.89 | 68.76 |
| 3 | 61.44 | 62.66 | 63.06 | 63.84 | 64.39 | 65.72 | 66.52 | 67.04 | 67.91 |
| 4 | 60.77 | 61.90 | 62.32 | 63.05 | 63.57 | 64.90 | 65.71 | 66.18 | 67.01 |
| 5 | 60.03 | 61.09 | 61.53 | 62.21 | 62.72 | 64.05 | 64.83 | 65.30 | 66.10 |
| 10 | 55.82 | 56.69 | 57.13 | 57.75 | 58.26 | 59.50 | 60.23 | 60.67 | 61.45 |
| 20 | 47.19 | 47.91 | 48.23 | 48.77 | 49.14 | 50.36 | 50.96 | 51.28 | 52.02 |
| 30 | 39.33 | 39.72 | 40.06 | 40.48 | 40.53 | 41.76 | 42.16 | 42.45 | 42.98 |
| 40 | 31.58 | 31.73 | 31.95 | 32.37 | 32.26 | 33.23 | 33.47 | 33.80 | 34.05 |
| 50 | 23.82 | 23.93 | 24.00 | 24.30 | 24.19 | 24.91 | 25.01 | 25.24 | 25.47 |
| 60 | 16.55 | 16.54 | 16.64 | 16.77 | 16.72 | 17.29 | 17.23 | 17.30 | 17.49 |
| 70 | 10.37 | 10.37 | 10.31 | 10.31 | 10.11 | 10.57 | 10.49 | 10.63 | 10.73 |
| 80 | 5.88 | 5.88 | 5.82 | 5.82 | 5.88 | 5.78 | 5.75 | 5.63 | 5.85 |
The effect of the lowered infant-mortality rate and the efficacy of the health services generally is clearly demonstrated by the figures. The expectation of life at age 0 has risen by 10.17 years in the case of males and by 10.36 years in the case of females during the period covered by the table. Again, the expectation of life at age 5 in the earlier periods was actually greater than at age 0, the difference in the case of males amounting to 3.00 years in 1891.95, whereas in 1934–38 it was less to the extent of 1.76 years. Even at age 20 there has been an increase in the male expectation of 4.42 years between the first and the latest period, and an increase of 4.83 years in the case of females.
A comparison of the expectation of life at age 0 for various countries is now given. In selecting comparable tables from the experience of other countries clue regard was had to securing the most recent figures available. The countries selected are for the most part those of similar racial stock.
| Males. | Females. | |
|---|---|---|
* White population. | ||
| New Zealand (1934–38) | 65.46 | 68.45 |
| Australia (1932.34) | 63.48 | 67.14 |
| Union of South Africa (1935.37)* | 58.95 | 63.06 |
| England and Wales (1937) | 60.18 | 64.40 |
| United States of America, (1939–41)* | 62.81 | 67.29 |
| Netherlands (1931.40) | 65.7 | 67.2 |
| Denmark (1941.45) | 65.62 | 67.70 |
| Sweden (1936.40) | 64.30 | 66.92 |
| Belgium (1928.32) | 56.02 | 59.79 |
| Finland (1936–40) | 54.3 | 59.5 |
| France (1933–38) | 55.94 | 61.64 |
| Switzerland (1939–44) | 62.68 | 66.96 |
STANDARDIZATION OF DEATH-RATES.—Except where specifically stated, all death-rates quoted throughout this section are crude rates—i.e., those ascertained by applying the mean population for the year to the total deaths registered during the year.
In New Zealand the age and sex constitutions of the people have changed very materially within a comparatively short span of years, so that death-rates for recent years relate to a differently constituted population than do death-rates for earlier years. This factor has had a marked influence on the risks—and causes—of dying. In order to eliminate the effect of a changing age constitution from other causes influencing the death-rate, the device of standardization is resorted to. The principle of this method is to compute death-rates on the assumption that the sex and age composition of the population has not varied. A “standard” population is selected, and the mortality experience of any particular year is weighted according to the age-distribution of that standard population.
The standardized death rates thus calculated for each of a number of countries, or for a number of years for the same country, may then be regarded as indexes of the relative mortalities free from the distortion which might arise through differences in their respective sex or age constitutions. New Zealand can no longer be regarded as immature as far as the age-constitution of the population is concerned. A comparison of the relative proportions of population in various age-groups between New Zealand and England and Wales, for instance, shows this country to be very similarly constituted to the relatively much older countries.
A system of standardization of death-rates was introduced some years ago in New Zealand, the age and sex constitution of the population as disclosed at the Census of 1911 being taken as the basis. The following table gives both recorded and standardized death-rates per 1,000 of population (on the 1911 standard population) for each fifth year from 1875 to 1945 and for the year 1947.
| Year. | Recorded Rates. | Standardized Rates. | ||||
|---|---|---|---|---|---|---|
| Males. | Females. | Totals. | Mules. | Females. | Totals. | |
| 1875 | 16.56 | 15.07 | 15.92 | 19.03 | 15.36 | 17.30 |
| 1880 | 12.05 | 10.73 | 11.46 | 13.81 | 11.47 | 12.70 |
| 1885 | 11.51 | 9.67 | 10.67 | 13.38 | 10.06 | 12.36 |
| 1890 | 10.51 | 8.68 | 9.66 | 12.26 | 10.11 | 11.25 |
| 1895 | 10.81 | 8.89 | 9.91 | 12.26 | 10.07 | 11.22 |
| 1900 | 10.33 | 8.43 | 9.43 | 11.04 | 9.29 | 10.21 |
| 1905 | 10.18 | 8.24 | 9.27 | 10.49 | 8.61 | 9.60 |
| 1910 | 10.67 | 8.63 | 9.71 | 10.67 | 8.46 | 9.62 |
| 1915 | 10.19 | 7.87 | 9.06 | 10.19 | 7.87 | 9.09 |
| 1920 | 11.11 | 9.15 | 10.15 | 10.83 | 8.84 | 9.89 |
| 1925 | 9.10 | 7.48 | 8.30 | 8.68 | 6.78 | 7.78 |
| 1930 | 9.42 | 7.69 | 8.57 | 8.66 | 6.48 | 7.63 |
| 1935 | 8.95 | 7.52 | 8.25 | 7.68 | 5.78 | 6.78 |
| 1940 | 10.18 | 8.28 | 9.24 | 7.95 | 5.67 | 6.87 |
| 1945 | 11.37 | 8.84 | 10.07 | 7.96 | 5.40 | 6.75 |
| 1947 | 10.48 | 8.27 | 9.38 | 7.35 | 4.90 | 6.19 |
Standardized death-rates are computed for New Zealand for a number of causes, and details covering a ten-yearly period have been included in the annual Report on Vital Statistics. The standard population used is that of England and Wales at the census of 1901, in order that the death-rates so calculated may be comparable with those published for those countries.
ORPHANHOOD.—Information concerning the numbers of living issue left by persons dying was regularly compiled by the Census and Statistics Department over a long period of years, but owing to wartime difficulties this activity was suspended after the 1940 tabulation. Data in this connection are contained in the 1945 and previous issues of the Year-Book.
INFANT MORTALITY.—Over a long period of years, New Zealand has been renowned for its low rate of infant mortality, a fact attributable partly to such matters as climate, virility of the race, comparative absence of densely settled areas, &c., and partly to legislative and educative measures—the latter conducted by the State as well as by various organizations. A great deal of the success achieved in this direction has been due to the activities of the Royal New Zealand Society for the Health of Women and Children. Founded in Dunedin in 1907, this society has since extended its Plunket system throughout New Zealand, and its methods are being adopted to an ever-increasing extent in other countries.
Particulars of deaths of infants under one year of age for each of the years 1937–47 are shown in the following table.
| Year. | Number. | Rate per 1,000 Live Births. | ||||
|---|---|---|---|---|---|---|
| Males. | Females. | Totals. | Males. | Females. | Totals. | |
| 1937 | 461 | 351 | 812 | 34.81 | 27.49 | 31.21 |
| 1938 | 570 | 401 | 971 | 40.92 | 30.11 | 35.63 |
| 1939 | 532 | 366 | 898 | 36.18 | 25.90 | 31.14 |
| 1940 | 573 | 417 | 990 | 34.07 | 26.14 | 30.21 |
| 1941 | 586 | 459 | 1,045 | 32.55 | 26.85 | 29.77 |
| 1942 | 587 | 377 | 964 | 34.05 | 23.08 | 28.71 |
| 1943 | 551 | 400 | 951 | 35.03 | 27.43 | 31.37 |
| 1944 | 578 | 434 | 1,012 | 33.59 | 26.47 | 30.12 |
| 1945 | 607 | 429 | 1,036 | 32.03 | 23.76 | 27.99 |
| 1946 | 631 | 462 | 1,093 | 29.31 | 22.71 | 26.10 |
| 1947 | 624 | 498 | 1,122 | 27.25 | 22.72 | 25.04 |
The infant-mortality rate for 1947 of 25.04 per 1,000 live births again sets a new low record for this country. The success of New Zealand, a country with a reputation for remarkably low rates, in further lowering the level by over 6 per 1,000 in the short space of the five years 1943–47 gives some cause for satisfaction, but it must be remembered that other overseas countries have also experienced record low rates over the last two years, so that the position has not improved relatively. With the distinction of having the lowest infant-mortality rate in the world since the year 1912, it was an unusual experience for this country to occupy second place in 1943 with a rate of 31.4, as compared with 28.6 for Sweden in the same year. In 1944 and 1945 New Zealand again held pride of place, if only by narrow margins, while for the last two years the rates for the two countries have been almost identical. It is important to note that, while the figures for Sweden have been reduced in a spectacular fashion during the last ten years, the rate for 1937 being as high as 45.2, by contrast the New Zealand results have been achieved by a steady decline over a long period.
The following table, the figures for which are taken from the “Monthly Bulletin of Statistics,” issued by the United Nations, shows the favourable position occupied by New Zealand. In the case of the Union of South Africa and New Zealand, the European population only has been taken into account.
| Country. | Quinquennium. | Deaths Under 1 Year Per 1,000 Births. |
|---|---|---|
* Excluding Maoris. † European population. | ||
| New Zealand* | 1943–47 | 28 |
| Sweden | 1943–47 | 28 |
| Australia | 1943–47 | 31 |
| United States of America | 1943–47 | 37 |
| Switzerland | 1943–17 | 40 |
| Union of South Africa† | 1943–47 | 43 |
| Denmark | 1942–46 | 47 |
| Netherlands | 1943–47 | 48 |
| United Kingdom | 1942–46 | 49 |
| Canada | 1942–46 | 52 |
| Finland | 1943–47 | 59 |
| Panama | 1943–47 | 64 |
| Eire | 1942–46 | 72 |
| Belgium | 1943–47 | 82 |
| Spain | 1943–47 | 92 |
| Italy | 1943–47 | 96 |
| Austria | 1943–47 | 97 |
| Nicaragua | 1943–47 | 102 |
| Mexico | 1942–46 | 112 |
| Chile | 1943–47 | 176 |
The male rate of infant mortality is considerably above the female rate, and this holds almost without exception for each of the four divisions of the first year of life shown in the next table.
| Year. | Male Deaths per 1,000 Male Births. | Female Deaths per 1,000 Female Births. | ||||||
|---|---|---|---|---|---|---|---|---|
| Under 1 Month. | 1 and under 3 Months. | 3 and under 6 Months. | 6 and under 12 Months. | Under 1 Month. | 1 and under 3 Months. | 3 and under 6 Months. | 6 and under 12 Months. | |
| 1943 | 23.52 | 3.56 | 3.63 | 4.32 | 18.86 | 2.61 | 3.29 | 2.67 |
| 1944 | 22.32 | 3.37 | 3.89 | 4.01 | 18.79 | 2.81 | 2.07 | 2.80 |
| 1945 | 21.85 | 3.75 | 2.74 | 3.69 | 17.23 | 1.88 | 2.05 | 2.60 |
| 1946 | 21.36 | 2.32 | 2.28 | 3.35 | 16.67 | 1.87 | 1.33 | 2.85 |
| 1947 | 19.87 | 2.18 | 2.84 | 2.36 | 16.20 | 1.87 | 2.01 | 2.65 |
Even when the effect of the male excess among infants born is eliminated by comparing the respective rates for the two sexes, the number of male deaths per 100 female deaths in the first month of life during the five years 1943–47 is found to be 124; between one and three months, 138; between three and six months, 143; between six and twelve months, 131; and for the first year as a whole, 128.
The rates per 1,000 births for the two sexes in conjunction are now given for each of the last five years.
| Year. | Under 1 Month. | 1 and under 3 Months. | 3 and under 6 Months. | 6 and under 12 Months. | Totals under 1 Year. |
|---|---|---|---|---|---|
| 1943 | 21.27 | 3.10 | 3.47 | 3.53 | 31.37 |
| 1944 | 20.60 | 3.10 | 3.00 | 3.42 | 30.12 |
| 1945 | 19.59 | 2.84 | 2.40 | 3.16 | 27.99 |
| 1946 | 19.08 | 2.10 | 1.82 | 3.10 | 26.10 |
| 1947 | 18.08 | 2.03 | 2.43 | 2.50 | 25.04 |
Infants who die in the first year of life may be grouped roughly into two main classes—viz., those dying within one month of birth and those surviving the first month of life but dying before the first anniversary of their birth. Deaths among the first class are due principally to causes operating before the actual birth of the infant. The second group, generally speaking, covers infants who have succumbed to causes arising from post-natal influences, such as the various epidemic diseases, faulty feeding, diseases of the respiratory system, &c. The first group naturally presents the greater problem to the infant-welfare worker, while the history of the comparatively rapid decline of the infant-mortality rate in New Zealand is largely an illustration of the effective measures adopted towards combating the post-natal causes of death in infancy.
The next table shows that, whereas in the period 1941–45 the death-rate for children under one month of age was 33 per cent. lower than in the quinquennium 1881–85, the rate for children who had survived the first month of fife was only approximately one-sixth as high as in the “eighties.” In other words, whereas formerly over sixty children out of every 1,000 who survived the first month of life died before reaching one year of age, now only ten such deaths occur. A remarkable feature of the period 1941–45, however, has been the very appreciable decline in the rate for infants under one month, while for infants who survived the first month of life the rate recorded a definite increase. In 1946 and 1947, however, both rates continued to decline.
| Period. | Deaths per 1,000 Births. | Deaths between 1 and 12 Months per 1,000 Children who survive 1 Month. | ||
|---|---|---|---|---|
| Under 1 Year. | Under 1 Month. | Between 1 and 12 Months. | ||
| 1881–1885 | 90.60 | 29.77 | 60.83 | 62.70 |
| 1886–1890 | 84.09 | 27.57 | 56.52 | 58.13 |
| 1891–1895 | 87.60 | 30.34 | 57.26 | 58.93 |
| 1896–1900 | 80.06 | 30.38 | 49.68 | 51.24 |
| 1901–1905 | 74.77 | 30.64 | 44.13 | 45.54 |
| 1906–1910 | 69.62 | 30.28 | 39.34 | 40.57 |
| 1911–1915 | 53.63 | 29.28 | 24.35 | 25.05 |
| 1916–1920 | 48.62 | 28.16 | 20.46 | 21.05 |
| 1921–1925 | 42.75 | 27.48 | 15.27 | 15.70 |
| 1926–1930 | 36.70 | 24.82 | 11.88 | 12.18 |
| 1931–1935 | 31.88 | 22.34 | 9.54 | 9.76 |
| 1936–1940 | 31.83 | 22.51 | 9.32 | 9.50 |
| 1941–1945 | 29.53 | 20.01 | 9.52 | 9.72 |
| 1946 | 26.10 | 19.08 | 7.02 | 7.16 |
| 1947 | 25.04 | 18.08 | 6.96 | 7.09 |
The accompanying diagram further illustrates the reduction in the infant-mortality rate that has taken place during the last sixty-six years.
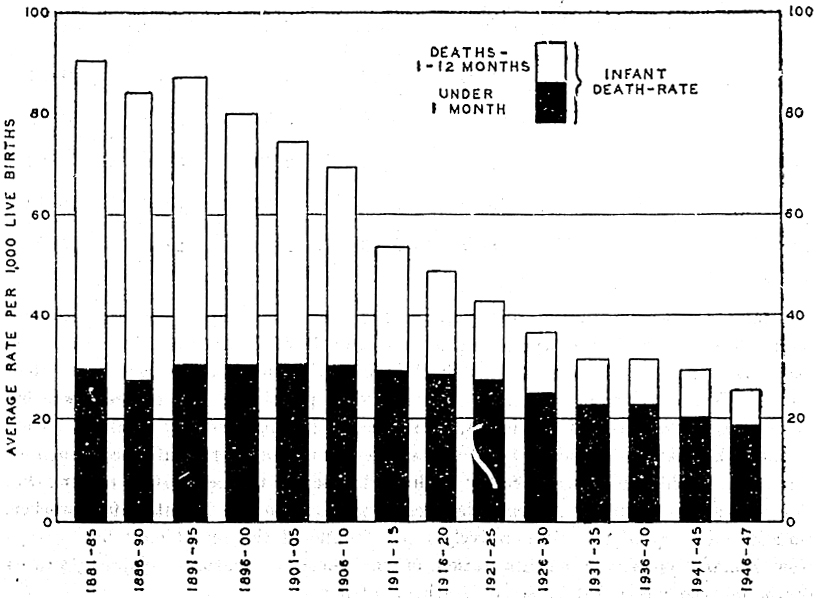
It would appear that on the one hand the diseases that can be combated openly, such as epidemic diseases, respiratory diseases, and diseases due to faulty nourishment, &c. (i.e., diseases of the digestive system), have shown a definite response to the strenuous campaigns launched against them; while, on the other hand, many infants are evidently non-viable at birth. Four out of every five deaths during the first month of life occur within the first week, and two out of every five on the first day. The following table shows the infant death-rate for subdivisions of the first month.
| Year. | Under 1 Day. | 1 Day and under 2 Days. | 2 Days and under 1 Week. | Totals under 1 Week. | 1 Week and under 2 Weeks. | 2 Weeks and under 3 Weeks. | 3 Weeks and under 1 Month. | Totals under 1 Month. |
|---|---|---|---|---|---|---|---|---|
| 1943 | 8.38 | 3.63 | 5.74 | 17.75 | 2.01 | 0.82 | 0.69 | 21.27 |
| 1944 | 8.60 | 2.56 | 5.48 | 16.64 | 2.26 | 1.28 | 0.42 | 20.60 |
| 1945 | 8.43 | 2.49 | 5.43 | 16.35 | 1.89 | 0.76 | 0.59 | 19.59 |
| 1946 | 8.22 | 2.96 | 4.94 | 16.12 | 1.81 | 0.72 | 0.43 | 19.08 |
| 1947 | 8.03 | 2.97 | 4.51 | 15.51 | 1.34 | 0.71 | 0.51 | 18.08 |
The following table gives, for each of the last five years, detailed information as to the number of deaths at various periods of the first year of life.
| Year. | Under 1 Day. | 1 Day and under 2 Days. | 2 Days and under 1 Week. | 1 Week and under 2 Weeks. | 2 Weeks and under 3 Weeks. | 3 Weeks and under 1 Month. | 1 Month and under 2 Months. | 2 Months and under 3 Months. | 3 Months and under 6 Months. | 6 Months and under 9 Months. | 9 Months and under 12 Months. | Totals. |
|---|---|---|---|---|---|---|---|---|---|---|---|---|
| Males | ||||||||||||
| 1943 | 141 | 68 | 97 | 35 | 17 | 12 | 24 | 32 | 57 | 30 | 38 | 551 |
| 1944 | 175 | 48 | 100 | 34 | 21 | 6 | 39 | 19 | 67 | 40 | 29 | 578 |
| 1945 | 176 | 51 | 122 | 36 | 17 | 12 | 45 | 26 | 52 | 42 | 28 | 607 |
| 1946 | 199 | 68 | 123 | 45 | 13 | 12 | 22 | 28 | 49 | 47 | 25 | 631 |
| 1947 | 192 | 73 | 119 | 35 | 23 | 13 | 31 | 19 | 65 | 35 | 19 | 624 |
| Females | ||||||||||||
| 1943 | 113 | 42 | 77 | 26 | 8 | 9 | 24 | 14 | 48 | 27 | 12 | 400 |
| 1944 | 114 | 38 | 84 | 42 | 22 | 8 | 26 | 20 | 34 | 25 | 21 | 434 |
| 1945 | 136 | 41 | 79 | 34 | 11 | 10 | 21 | 13 | 37 | 25 | 22 | 429 |
| 1946 | 145 | 56 | 84 | 31 | 17 | 6 | 23 | 15 | 27 | 32 | 26 | 462 |
| 1947 | 168 | 60 | 83 | 25 | 9 | 10 | 21 | 20 | 44 | 38 | 20 | 498 |
| Both Sexes | ||||||||||||
| 1943 | 254 | 110 | 174 | 61 | 25 | 21 | 48 | 46 | 105 | 57 | 50 | 951 |
| 1944 | 289 | 86 | 184 | 76 | 43 | 14 | 65 | 39 | 101 | 65 | 50 | 1,012 |
| 1945 | 312 | 92 | 201 | 70 | 28 | 22 | 66 | 39 | 89 | 67 | 50 | 1,036 |
| 1946 | 344 | 124 | 207 | 76 | 30 | 18 | 45 | 43 | 76 | 79 | 51 | 1,093 |
| 1947 | 360 | 133 | 202 | 60 | 32 | 23 | 52 | 39 | 109 | 73 | 39 | 1,122 |
Some remarkable changes are disclosed by the next table, which gives the infant mortality rates for various groups of causes in quinquennial periods commencing with the years 1872.76. If a comparison be made between the averages of the first and last five-yearly periods given—1872–76 and 1942–46—it is found that the general infant mortality rate shows a decline of 74 per cent., while even greater decreases are recorded for tuberculosis (98 per cent.), convulsions (99 per cent.), gastric and intestinal diseases (95 per cent.), epidemic diseases (92 per cent.), and respiratory diseases (78 per cent.). The rate for diseases of early infancy shows a decrease of only 36 per cent. in 1942–46 as compared with 1872–76, but the figures for recent years indicate that some measure of success has attended the steps taken to cope with ante-natal conditions.
The increase shown for malformations and the decrease for tuberculosis are probably somewhat less than is indicated by the figures. In the earlier years covered by the table the latter heading included all deaths from hydrocephalus, many of which were no doubt due to congenital hydrocephalus, which is now included among the malformations. A proportion of the deaths from hydrocephalus in the earlier years would also probably be due to meningitis. The following table shows quinquennial average death-rates of infants under one year of ago, per 1,000 live births.
| Period. | Epidemic Diseases. | Tuberculosis. | Infantile Convulsions. | Respiratory Diseases. | Gastric and Intestinal Diseases. | Malformations. | Early Infancy. | Other Causes. | Totals. |
|---|---|---|---|---|---|---|---|---|---|
| 1872–1876 | 13.5 | 5.5 | 9.7 | 12.9 | 24.2 | 1.2 | 25.0 | 17.3 | 109.3 |
| 1877–1881 | 10.2 | 5.2 | 7.5 | 12.3 | 19.8 | 1.4 | 21.9 | 15.3 | 93.6 |
| 1882–1886 | 9.3 | 4.7 | 7.9 | 11.8 | 19.1 | 1.2 | 25.5 | 12.3 | 91.8 |
| 1887–1891 | 8.9 | 3.7 | 6.3 | 10.5 | 18.5 | 1.3 | 24.7 | 8.8 | 82.7 |
| 1892–1896 | 9.8 | 3.3 | 6.6 | 11.0 | 16.6 | 1.4 | 24.9 | 11.2 | 84.8 |
| 1897–1901 | 6.1 | 2.6 | 5.6 | 10.0 | 17.2 | 1.5 | 26.2 | 9.7 | 78.9 |
| 1902–1906 | 5.5 | 1.5 | 4.1 | 9.7 | 15.3 | 1.3 | 27.6 | 7.9 | 72.9 |
| 1907–1911 | 5.9 | 1.3 | 3.3 | 7.6 | 15.5 | 1.9 | 26.7 | 6.3 | 68.5 |
| 1912–1916 | 3.6 | 0.6 | 2.2 | 5.1 | 7.4 | 3.9 | 26.2 | 3.5 | 52.5 |
| 1917–1921 | 3.2 | 0.5 | 1.9 | 4.7 | 4.5 | 4.3 | 26.1 | 2.9 | 48.1 |
| 1922–1926 | 1.8 | 0.4 | 1.3 | 4.3 | 2.8 | 4.8 | 22.4 | 3.3 | 41.1 |
| 1927–1931 | 1.5 | 0.3 | 0.5 | 3.7 | 1.7 | 5.0 | 19.4 | 3.1 | 35.2 |
| 1932–1936 | 1.5 | 0.2 | 0.6 | 3.3 | 1.2 | 5.0 | 17.5 | 2.4 | 31.7 |
| 1937–1941 | 1.4 | 0.2 | 0.2 | 3.1 | 1.3 | 5.5 | 17.4 | 2.5 | 31.6 |
| 1942–1946 | 1.1 | 0.1 | 0.1 | 2.9 | 1.2 | 4.6 | 16.1 | 2.6 | 28.7 |
| 1947 | 1.0 | 0.1 | 0.1 | 2.5 | 1.0 | 4.1 | 14.7 | 1.5 | 25.0 |
Three out of every four deaths of infants under one year of age are due to causes coming within the groups “Early Infancy” and “Malformations,” and premature birth alone is usually responsible for approximately one-third of the total infant mortality.
In accordance with international practice, New Zealand's infant mortality rate represents the number of deaths of infants actually born alive, expressed as a proportion per 1,000 live births. This method, however, takes no account of still-births. Reference has been made in an earlier paragraph to the effect on the infant mortality rate of efforts made towards the reduction of those ante-natal influences which generally cause death to ensue during the early weeks of life. The fact that still-births are also the result of such ante-natal influences should not be lost sight of, and for this and other reasons it is of value to compute rates per 1,000 total births for neo-natal mortality (deaths of infants under one month of age) and still-births in conjunction, as in the following table. In the computation of the rates for numbers inclusive of still-births, the latter are taken into account in both births and deaths.
| Year. | Still-births. | Neo-natal Deaths. | Neo-natal Deaths plus Still-births. | |||
|---|---|---|---|---|---|---|
| Number. | Rate. | Number. | Rate. | Number. | Rate. | |
| 1943 | 817 | 26.25 | 645 | 20.72 | 1,462 | 46.97 |
| 1944 | 799 | 23.23 | 692 | 20.12 | 1,491 | 43.35 |
| 1945 | 865 | 22.84 | 725 | 19.14 | 1,590 | 41.98 |
| 1946 | 931 | 21.75 | 799 | 18.67 | 1,730 | 40.42 |
| 1947 | 911 | 19.92 | 810 | 17.71 | 1,721 | 37.63 |
Recent years have shown a definite trend towards improvement in the combined rate, and the figure for 1947 is indeed remarkably low.
CAUSES OF STILL-BIRTH.—A still-born child is defined in New Zealand as one “which has issued from its mother after the expiration of the twenty-eighth week of pregnancy and which was not alive at the time of such issue.”
The registration of still-births has been effected in New Zealand since 1913, but no information regarding the causes of still-births has hitherto been required for registration purposes. The lack of such information represents a distinct gap in the otherwise excellent records available concerning the loss of infant or potential infant life. Furthermore, as mentioned in an earlier paragraph, the still-birth problem is intimately bound up with that of the neo-natal infant-mortality rate. Any appreciable improvement in New Zealand's infant-mortality rate must almost certainly depend upon the reduction of this neo-natal loss.
To reduce effectively fœtal and maternal losses resulting from still-births, health authorities and medical research workers need considerably more information in regard to the magnitude of the problem and a knowledge of the underlying fœtal and maternal conditions associated with still-births.
In the United States of America, Canada, and a few other countries, statistics are already available concerning the various causes of still-births and throw some interesting light on the problem. While the number of countries that register stillbirths and compile statistics thereof is not great, the number is increasing, and numerous classification lists of causes of still-births have been developed, especially in the United States of America.
The subject received considerable attention at the International Commission for Revision of the International List of Causes of Death in 1938. This Commission recommended that all countries which obtain records of still-births should consider introducing a certificate of the causes of still-births.
To enable New Zealand to make its contribution towards international uniformity in this matter, and also to assist in research work in this country, legislation was introduced in 1946 (section 15, Statutes Amendment Act, 1946) requiring the medical practitioner or, if there was no medical practitioner, the midwife in attendance at a confinement where a still-birth occurs to furnish a certificate stating to the best of his or her knowledge and belief the cause of the still-birth. This requirement came into force as from 1st January, 1947.
Provision was made in the certificate for the insertion of information concerning both fœtal and maternal causes of the still-birth. Of the 911 still-births registered during 1947, in 82 cases (9 per cent.) the cause was not known or not stated. Fœtal causes only were specified in 342 cases (38 per cent.); maternal causes only in 164 (18 per cent.); while for 323 still-births, or 35 per cent. of the total, there were both fœtal and maternal causes present.
The following table shows in broad classification groups for 1947 (a) the total number of still-births in which fœtal causes were present, and (b) the total number of cases where causes determined in the mother were stated on the certificate.
| Causes of Still-birth. | Number of Cases. | ||
|---|---|---|---|
| Males. | Females. | Total. | |
| (a) FOETAL CAUSES | |||
| Congenital malformations | 43 | 59 | 102 |
| Placental state | 61 | 35 | 96 |
| Cord conditions | 86 | 67 | 153 |
| Birth injury | 72 | 46 | 118 |
| Syphilis in fœtus | 3 | 3 | |
| Infection, and other causes | 112 | 81 | 193 |
| Totals | 374 | 291 | 665 |
| (b) MATERNAL CAUSES | |||
| Syphilis in the mother | 3 | 3 | |
| Other chronic diseases in the mother | 11 | 9 | 20 |
| Acute disease in the mother | 5 | 3 | 8 |
| Abortion induced for non-therapeutic reasons | |||
| Ectopic gestation | 1 | 1 | 2 |
| Hæmorrhage, trauma, shock | 52 | 31 | 83 |
| Toxæmias of pregnancy | 71 | 79 | 150 |
| Infection | 3 | 3 | |
| Difficult or prolonged labour | 62 | 37 | 99 |
| External causes | 11 | 12 | 23 |
| Other, and ill-defined causes | 54 | 42 | 96 |
| Totals | 270 | 217 | 487 |
Apart from the group of miscellaneous causes, which includes such statements as “macerated foetus,” the principal causes of still-birth of those arising in the fœtus were conditions in the umbilical cord (23 per cent.). Of causes occurring in the mother, toxæmia of pregnancy was the most prolific (31 per cent.).
CAUSES OF DEATH.—Since 1908, the classification of causes of death in New-Zealand has been on the basis of the international classification initiated by Dr. Jacques Bertillon and used by the principal European and American countries and the Commonwealth of Australia.
The following table shows the numbers of deaths and the death-rates per 10,000 of mean population from certain principal causes, following the abridged international list of causes of death (Fifth Revision, 1938).
The statistics for tuberculosis, cancer, puerperal causes, and violence—causes which are of special interest and significance—are discussed later on in this subsection.
| Cause of Death. | Numbers. | Rates per 10,000. | ||||||||
|---|---|---|---|---|---|---|---|---|---|---|
| 1943. | 1944. | 1945. | 1946. | 1947. | 1943. | 1944. | 1945. | 1946. | 1947. | |
| Typhoid and paratyphoid fever | 3 | 3 | 3 | 7 | 9 | 0.02 | 0.02 | 0.02 | 0.04 | 0.05 |
| Scarlet fever | 2 | 27 | 13 | 1 | 0.01 | 0.17 | 0.08 | 0.01 | ||
| Whooping-cough | 17 | 45 | 8 | 1 | 34 | 0.11 | 0.29 | 0.05 | 0.01 | 0.20 |
| Diphtheria | 32 | 30 | 42 | 49 | 20 | 0.21 | 0.19 | 0.26 | 0.30 | 0.12 |
| Tuberculosis of the respiratory system | 475 | 485 | 497 | 460 | 441 | 3.09 | 3.12 | 3.12 | 2.77 | 2.60 |
| Other forms of tuberculosis | 97 | 108 | 106 | 100 | 82 | 0.63 | 0.69 | 0.67 | 0.60 | 0.48 |
| Syphilis | 99 | 93 | 86 | 120 | 110 | 0.64 | 0.59 | 0.54 | 0.72 | 0.65 |
| Influenza | 65 | 62 | 53 | 111 | 33 | 0.42 | 0.40 | 0.33 | 0.67 | 0.19 |
| Measles | 7 | 10 | 16 | 1 | 0.05 | 0.06 | 0.10 | 0.01 | ||
| Other infective and parasitic diseases | 182 | 124 | 108 | 112 | 108 | 1.18 | 0.80 | 0.68 | 0.68 | 0.64 |
| Cancer and other malignant tumours | 2,131 | 2,182 | 2,213 | 2,268 | 2,315 | 13.85 | 14.02 | 13.88 | 13.67 | 13.65 |
| Non - malignant tumours and tumours of unspecified nature | 60 | 60 | 53 | 65 | 64 | 0.39 | 0.39 | 0.33 | 0.39 | 0.38 |
| Chronic rheumatism and gout | 23 | 39 | 26 | 30 | 23 | 0.15 | 0.25 | 0.16 | 0.18 | 0.14 |
| Diabetes mellitus | 332 | 327 | 319 | 338 | 328 | 2.10 | 2.10 | 2.00 | 2.04 | 1.93 |
| Alcoholism | 2 | 5 | 6 | 4 | 3 | 0.01 | 0.03 | 0.04 | 0.02 | 0.02 |
| Avitaminoses, other general diseases, diseases of the blood, and chronic poisoning | 252 | 267 | 250 | 235 | 225 | 1.64 | 1.72 | 1.57 | 1.42 | 1.33 |
| Meningitis, and diseases of the spinal cord | 87 | 71 | 68 | 74 | 61 | 0.57 | 0.46 | 0.43 | 0.45 | 0.36 |
| Intracranial lesions of vascular origin | 1,507 | 1,445 | 1,636 | 1,597 | 1,657 | 9.79 | 9.28 | 10.26 | 9.63 | 9.77 |
| Other diseases of the nervous system and organs of special sense | 219 | 214 | 183 | 160 | 142 | 1.42 | 1.38 | 1.15 | 0.96 | 0.84 |
| Diseases of the heart | 5,182 | 5,213 | 5,655 | 5,783 | 5,752 | 33.68 | 33.49 | 35.48 | 34.86 | 33.91 |
| Other diseases of the circulatory system | 231 | 241 | 294 | 256 | 258 | 1.50 | 1.55 | 1.84 | 1.54 | 1.52 |
| Bronchitis | 215 | 177 | 181 | 153 | 170 | 1.40 | 1.14 | 1.14 | 0.92 | 1.00 |
| Pneumonia and bronchopneumonia | 474 | 488 | 505 | 561 | 545 | 3.08 | 3.14 | 3.17 | 3.38 | 3.21 |
| Other diseases of the respiratory system | 225 | 204 | 219 | 190 | 216 | 1.46 | 1.31 | 1.37 | 1.15 | 1.27 |
| Diarrhœa and enteritis | 89 | 99 | 125 | 73 | 57 | 0.58 | 0.64 | 0.78 | 0.44 | 0.34 |
| Appendicitis | 73 | 78 | 60 | 52 | 51 | 0.47 | 0.50 | 0.38 | 0.31 | 0.30 |
| Diseases of the liver and biliary passages | 101 | 111 | 123 | 115 | 94 | 0.66 | 0.71 | 0.77 | 0.69 | 0.55 |
| Other diseases of the digestive system | 316 | 304 | 353 | 293 | 318 | 2.05 | 1.95 | 2.21 | 1.77 | 1.87 |
| Nephritis | 435 | 435 | 417 | 451 | 400 | 2.83 | 2.80 | 2.62 | 2.72 | 2.36 |
| Other diseases of the genitourinary system | 233 | 225 | 249 | 209 | 240 | 1.51 | 1.45 | 1.56 | 1.26 | 1.41 |
| Puerperal infection | 32 | 38 | 25 | 30 | 16 | 0.21 | 0.24 | 0.16 | 0.18 | 0.09 |
| Other diseases of the puerperal state | 35 | 53 | 58 | 56 | 32 | 0.23 | 0.34 | 0.36 | 0.34 | 0.19 |
| Diseases of the skin and cellular tissue, and of the bones and organs of locomotion | 67 | 40 | 33 | 28 | 26 | 0.44 | 0.26 | 0.21 | 0.17 | 0.15 |
| Congenital debility, malformations, premature birth, and other diseases of early infancy | 716 | 771 | 817 | 896 | 921 | 4.65 | 4.95 | 5.13 | 5.40 | 5.43 |
| Senility | 488 | 458 | 463 | 323 | 303 | 3.17 | 2.94 | 2.90 | 1.95 | 1.79 |
| Suicide | 132 | 155 | 175 | 166 | 135 | 0.86 | 1.00 | 1.10 | 1.00 | 0.80 |
| Homicide | 19 | 16 | 25 | 15 | 10 | 0.12 | 0.10 | 0.16 | 0.09 | 0.06 |
| Automobile accidents | 133 | 138 | 121 | 175 | 204 | 0.86 | 0.88 | 0.76 | 1.05 | 1.20 |
| Other accidental deaths | 649 | 528 | 466 | 515 | 500 | 4.22 | 3.39 | 2.92 | 3.10 | 2.95 |
| Cause of death not specified or ill-defined | 10 | 4 | 7 | 5 | 0.07 | 0.03 | 0.05 | 0.02 | ||
| Totals | 15,447 | 15,363 | 16,051 | 16,093 | 15,904 | 100.39 | 98.71 | 100.70 | 97.00 | 93.70 |
The incidence of epidemic diseases has a considerable bearing on the general death-rate. While New Zealand is generally comparatively free from violent outbreaks of the principal epidemic diseases, sporadic recurrences are not uncommon, but the incidence of such diseases during 1947 was unusually low, with the exception of whooping-cough. Diseases of the heart, which account for a high percentage of total deaths, after reaching a record high peak in 1942, have demonstrated a slight declining trend in recent years. The low totals experienced during 1947 in ail the degenerative diseases is a substantial factor in the over-all decrease in the death-rate.
TUBERCULOSIS.—The death-rate from tuberculosis of the respiratory system has been decreasing gradually during recent years, with occasional upward fluctuations. The rate for 1947, 2.60 per 10,000 of population, is a record low rate for this country.
In addition to the 441 deaths from tuberculosis of the respiratory system during 1947, there were 82 deaths from other forms of tuberculosis, comprising—
| Tuberculosis of meninges and central nervous system | 17 |
| Tuberculosis of intestines and peritoneum | 10 |
| Tuberculosis of vertebral column | 12 |
| Tuberculosis of bones and joints | 3 |
| Tuberculosis of genito-urinary system | 13 |
| Tuberculosis of the lymphatic system | 1 |
| Tuberculosis of the skin | 1 |
| Disseminated tuberculosis | 25 |
The following table shows the number of deaths from tuberculosis in 1947, classified according to sex and age-groups. Of those dying from this cause in 1947, persons under the age of 45 years formed 53 per cent.
| Age, in Years. | Males. | Females. | Totals. |
|---|---|---|---|
| Under 5 | 7 | 12 | 19 |
| 5 and under 10 | 2 | 3 | 5 |
| 10 and under 15 | 1 | 5 | 6 |
| 15 and under 20 | 5 | 12 | 17 |
| 20 and under 25 | 19 | 25 | 44 |
| 25 and under 30 | 18 | 36 | 54 |
| 30 and under 35 | 23 | 33 | 56 |
| 35 and under 40 | 24 | 15 | 39 |
| 40 and under 45 | 21 | 14 | 35 |
| 45 and under 50 | 27 | 12 | 39 |
| 50 and under 55 | 29 | 12 | 41 |
| 55 and under 60 | 34 | 7 | 41 |
| 60 and under 65 | 36 | 10 | 46 |
| 65 and under 70 | 25 | 7 | 32 |
| 70 and under 75 | 24 | 12 | 36 |
| 75 and under 80 | 3 | 7 | 10 |
| 80 and over | 2 | 1 | 3 |
| Totals | 300 | 223 | 523 |
CANCER.—Cancer is annually responsible for more deaths in New Zealand than can be assigned to any cause other than diseases of the heart.
One factor contributing towards the recorded increase in deaths from cancer is the increasing proportion of persons reaching the ages where cancer largely claims its victims. This position has been brought about principally by the gradual amelioration of the one-time scourges of certain epidemic diseases which exacted a heavy toll of human life at the earlier ages.
Tuberculosis may, perhaps, be classified in the group mentioned, as the progressive decline in the death-rate from tuberculosis for very many years is practically uniform with the rise in the cancer death-rate. This is illustrated by the following figures of average death-rates from tuberculosis and cancer for decennial periods.
| Average Death-rates per 10,000 of Population. | ||
|---|---|---|
| Period. | Tuberculosis. | Cancer. |
| 1880–89 | 12.35 | 3.42 |
| 1890–99 | 10.62 | 5.44 |
| 1900–09 | 9.10 | 6.79 |
| 1910–19 | 6.99 | 8.22 |
| 1920–29 | 5.69 | 9.30 |
| 1930–39 | 4.17 | 11.17 |
| 1940–47 | 3.68 | 13.43 |
The relative movements in the death-rates from cancer and tuberculosis are further illustrated in the following diagram, which shows the rates at five-yearly intervals since 1875 and for 1947. The fall in the tuberculosis rate due to the progress of the health service, and the rise in the cancer rate owing to the increasing age-constitution of the population are clearly portrayed.
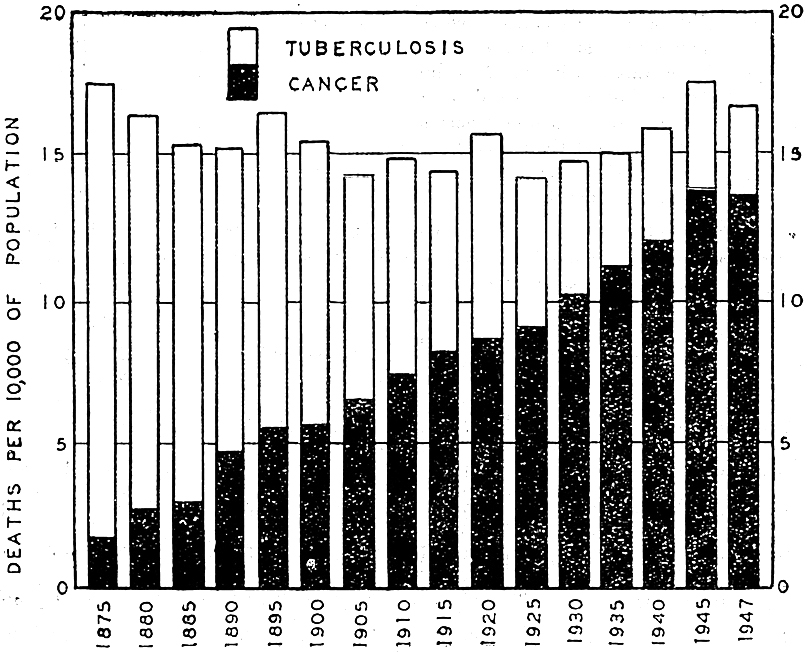
In 1947 there were 2,315 deaths from cancer in New Zealand, a proportion of 13.65 per 10,000 of population. Both the recorded and standardized death-rates have shown a slight falling tendency during the last three years.
| Year. | Number of Deaths from Cancer. | Recorded Death-rate. | Standardized Death-rate.* |
|---|---|---|---|
* On basis of age distribution in 1911. | |||
| 1937 | 1,778 | 11.82 | 8.02 |
| 1938 | 1,787 | 11.76 | 7.93 |
| 1939 | 1,815 | 11.79 | 7.87 |
| 1940 | 1,858 | 12.02 | 7.83 |
| 1941 | 2,028 | 13.18 | 8.26 |
| 1942 | 2,029 | 13.13 | 8.07 |
| 1943 | 2,131 | 13.85 | 8.43 |
| 1944 | 2,182 | 14.02 | 8.41 |
| 1945 | 2,213 | 13.88 | 8.30 |
| 1946 | 2,268 | 13.67 | 8.23 |
| 1947 | 2,315 | 13.65 | 8.15 |
The following summary shows the types of cancer returned in the death entries for the year 1947.
| Type. | Males. | Females. | Totals. |
|---|---|---|---|
| Adenocarcinoma | 27 | 47 | 74 |
| Cancer (undefined) | 22 | 21 | 43 |
| Carcinoma | 1,008 | 905 | 1,913 |
| Chloroma | 1 | 1 | |
| Cystadeno carcinoma | 1 | 1 | |
| Cystadenoma | 1 | 1 | |
| Dysgerminoma | 1 | 1 | |
| Embryoma | 2 | 2 | |
| Endothelioma | 1 | 2 | 3 |
| Epithelioma | 21 | 9 | 30 |
| Fibrosarcoma | 2 | 2 | |
| Glioma | 13 | 3 | 16 |
| Granuloma fungoides | 2 | 2 | |
| Hæmangioblastoma | 1 | 1 | |
| Hypernephroma | 24 | 10 | 34 |
| Lymphoblastoma | 2 | 1 | 3 |
| Lymphosarcoma | 20 | 11 | 31 |
| Medulloblastoma | 1 | 2 | 3 |
| Melanocarcinoma | 15 | 10 | 25 |
| Melanosarcoma | 4 | 4 | 8 |
| Melanoma | 1 | 1 | |
| Myeloma | 4 | 2 | 6 |
| Myosarcoma | 1 | 1 | |
| Neuroblastoma | 2 | 2 | |
| Osteosarcoma | 3 | 3 | |
| Papillocarcinoma | 7 | 5 | 12 |
| Reticular endotheliosis | 1 | 1 | |
| Rodent ulcer | 9 | 7 | 16 |
| Sarcoma | 34 | 14 | 48 |
| Scirrhus | 3 | 12 | 15 |
| Seminoma | 5 | 5 | |
| Spongioblastoma | 6 | 2 | 8 |
| Teratoma | 3 | 3 | |
| Totals | 1,234 | 1,081 | 2,315 |
A summary showing the location of the disease in deaths from cancer during 1947 is as follows :—
| Seat of Disease. | Numbers. | Rates per 10,000 of Population. | ||||
|---|---|---|---|---|---|---|
| Males. | Females. | Totals. | Males. | Females. | Totals. | |
| Buccal cavity and pharynx | 59 | 17 | 76 | 0.70 | 0.20 | 0.45 |
| Digestive organs and peritoneum | 662 | 495 | 1,157 | 7.81 | 5.83 | 6.82 |
| Respiratory system | 154 | 33 | 187 | 1.82 | 0.39 | 1.10 |
| Uterus | 120 | 120 | 1.41 | 0.71 | ||
| Other female genital organs | 76 | 76 | 0.90 | 0.45 | ||
| Breast | 227 | 227 | 2.68 | 1.34 | ||
| Male genital organs | 134 | 134 | 1.58 | 0.79 | ||
| Urinary organs | 78 | 27 | 105 | 0.92 | 0.32 | 0.62 |
| Skin | 42 | 24 | 66 | 0.49 | 0.28 | 0.39 |
| Brain | 22 | 12 | 34 | 0.26 | 0.14 | 0.20 |
| Other or unspecified organs | 83 | 50 | 133 | 0.98 | 0.59 | 0.78 |
| Totals | 1,234 | 1,081 | 2,315 | 14.56 | 12.74 | 13.65 |
The standardized figures for recent years suggest that cancer, while undoubtedly increasing in numerical incidence, is not doing so out of proportion to the population exposed to the cancer risk. Improvement in diagnosis has been responsible for some of the numerical increase in the recorded deaths from cancer, though this factor has now become more stabilized. A classification according to sex and age-groups is now given.
| Age, in Years. | Males. | Females. | Totals. |
|---|---|---|---|
| Under 5 | 3 | 10 | 13 |
| 5 and under 10 | 3 | 1 | 4 |
| 10 and under 15 | 1 | 1 | |
| 15 and under 20 | 4 | 1 | 5 |
| 20 and under 25 | 4 | 4 | 8 |
| 25 and under 30 | 3 | 10 | 13 |
| 30 and under 35 | 12 | 7 | 19 |
| 35 and under 40 | 18 | 21 | 39 |
| 40 and under 45 | 20 | 35 | 55 |
| 45 and under 50 | 46 | 62 | 108 |
| 50 and under 55 | 68 | 95 | 163 |
| 55 and under 60 | 126 | 113 | 239 |
| 60 and under 65 | 189 | 157 | 346 |
| 65 and under 70 | 244 | 169 | 413 |
| 70 and under 75 | 200 | 149 | 349 |
| 75 and under 80 | 173 | 139 | 312 |
| 80 and over | 120 | 108 | 228 |
| Totals | 1,234 | 1,081 | 2,315 |
Ninety-three per cent. of the deaths from cancer during 1947 were at ages 45 years and upwards, and 56 per cent. at ages 65 years and upwards.
PUERPERAL CAUSES.—In point of numbers of deaths, puerperal accidents and diseases do not rank high among causes of death. Nevertheless, deaths from puerperal causes are of special importance and significance. The rate per 1,000 live births in each of the last twenty years is shown in the following table.
| Year. | Proportion per 1,000 Live Births. |
|---|---|
| 1928 | 4.93 |
| 1929 | 4.82 |
| 1930 | 5.08 |
| 1931 | 4.77 |
| 1932 | 4.06 |
| 1933 | 4.44 |
| 1934 | 4.85 |
| 1935 | 4.21 |
| 1936 | 3.70 |
| 1937 | 3.61 |
| 1938 | 4.07 |
| 1939 | 3.64 |
| 1940 | 2.93 |
| 1941 | 3.36 |
| 1942 | 2.53 |
| 1943 | 2.21 |
| 1944 | 2.71 |
| 1945 | 2.24 |
| 1946 | 2.05 |
| 1947 | 1.07 |
A survey of the death-rate from puerperal causes since 1872 shows that for a period in the early part of the twentieth century there was a tendency for the rate to decline. Then followed a definite upward movement, culminating in a rate of 6.48 per 1,000 live births in 1920, the third highest on record, this figure having been exceeded only in 1884 and 1885. Comparatively high rates persisted until 1931, since when the decline has been more or less steady. The efficacy of new drugs and methods of treatment is reflected in the extremely low rates recorded in recent years, the figure for 1947 of 1.07 being not only a new record, but a reduction of no less than 48 per cent. from the previous lowest figure of 2.05 in 1946. This extraordinary low rate has been achieved mainly by a reduction in the number of deaths from toxæmias of pregnancy and childbirth, causes which have hitherto been particularly resistant to preventive measures. Deaths from hæmorrhages of the puerperal state were also unusually few during 1947.
It is generally conceded that in years of high birth-rates the maternal-mortality rate tends to rise, probably due to the abnormally high proportion of first births in the total of births, upon which the death-rate for these causes is based. In common with most countries for which recent figures are available, the reverse has been the experience in New Zealand during the last three years. Possibly a contributory factor in this reversal has been the rise in the proportion of births taking place in institutions, more particularly in special annexes attached to the larger hospitals, where every facility for the care of the patient is more readily available.
Deaths from diseases and accidents of childbirth for the five years 1943–47 are shown in the following summary.
| Group. | Number of Deaths. | Rate per 1,000 Live Births. | ||||||||
|---|---|---|---|---|---|---|---|---|---|---|
| 1943. | 1944. | 1945. | 1946. | 1947. | 1943. | 1944. | 1945. | 1946. | 1947. | |
| Post-abortive infection | 15 | 19 | 11 | 12 | 10 | 0.49 | 0.57 | 0.30 | 0.29 | 0.22 |
| Abortion without mention of infection | 5 | 5 | 6 | 5 | 2 | 0.16 | 0.15 | 0.16 | 0.12 | 0.04 |
| Ectopic gestation | 5 | 2 | 3 | 1 | 5 | 0.16 | 0.06 | 0.08 | 0.02 | 0.12 |
| Hæmorrhage of pregnancy | 3 | 4 | 3 | 1 | 0.10 | 0.12 | 0.08 | 0.02 | ||
| Toxæmias of pregnancy | 12 | 21 | 10 | 18 | 9 | 0.40 | 0.62 | 0.27 | 0.43 | 0.20 |
| Other diseases and accidents of pregnancy | 1 | 1 | 0.03 | 0.03 | ||||||
| Hæmorrhage of childbirth | 5 | 9 | 15 | 11 | 4 | 0.16 | 0.27 | 0.41 | 0.26 | 0.09 |
| Infection during childbirth | 17 | 19 | 14 | 18 | 6 | 0.57 | 0.57 | 0.37 | 0.43 | 0.13 |
| Puerperal toxæmias | 2 | 4 | 12 | 10 | 3 | 0.07 | 0.12 | 0.33 | 0.24 | 0.07 |
| Other accidents of childbirth | 2 | 7 | 8 | 9 | 8 | 0.07 | 0.20 | 0.21 | 0.22 | 0.18 |
| Other and unspecified conditions of childbirth | 1 | 1 | 1 | 0.03 | 0.02 | 0.02 | ||||
| Totals | 67 | 91 | 83 | 86 | 48 | 2.21 | 2.71 | 2.24 | 2.05 | 1.07 |
DEATHS FROM EXTERNAL CAUSES.—Deaths from external causes, apart from suicide, claim approximately 4 per cent. of the total deaths. Deaths from external causes in each of four years at quinquennial intervals are given in the next table.
| Cause of Death. | Number of Deaths. | Rate per Million of Mean Population. | ||||||
|---|---|---|---|---|---|---|---|---|
| 1932. | 1937. | 1942. | 1947. | 1932. | 1937. | 1942. | 1947. | |
| Homicide | 25 | 8 | 10 | 10 | 17 | 5 | 6 | 6 |
| Accidental causes— | ||||||||
| Poisoning | 13 | 4 | 7 | 10 | 9 | 3 | 5 | 6 |
| Conflagration | 4 | 10 | 18 | 15 | 3 | 7 | 12 | 9 |
| Burns and scalds | 32 | 30 | 26 | 16 | 22 | 20 | 17 | 9 |
| Anæsthesia, asphyxia, &c. | 10 | 17 | 11 | 12 | 7 | 11 | 7 | 7 |
| Drowning | 123 | 107 | 83 | 108 | 85 | 71 | 54 | 64 |
| Firearms | 18 | 22 | 25 | 14 | 12 | 15 | 16 | 8 |
| Falls | 111 | 141 | 125 | 143 | 76 | 93 | 81 | 84 |
| In mines and quarries | 17 | 13 | 10 | 9 | 12 | 9 | 6 | 5 |
| Transport accidents | 219 | 269 | 289 | 259 | 151 | 179 | 187 | 153 |
| Injuries by animals | 8 | 9 | 4 | 8 | 5 | 6 | 3 | 5 |
| Fractures (causes not specified) | 10 | 6 | 8 | 1 | 7 | 4 | 5 | 1 |
| Other | 98 | 100 | 107 | 109 | 67 | 66 | 69 | 64 |
| Totals | 688 | 736 | 723 | 714 | 473 | 489 | 468 | 421 |
The number of deaths recorded from all accidental causes in 1947 was 704, corresponding to a rate of 4.15 per 10,000 of population. By comparison with 1932, there is an increase of 41 in the number of deaths, but the death-rate has decreased by 0.41 per 10,000 of population.
In classifying deaths attributable to transport accidents under the various subheadings shown in the following table, the rule of assignment is that in fatalities due to collisions of railway-trains and electric tram-cars with motor-vehicles, the death is assigned to the railway-train or electric tram-car as being the heavier and more powerful vehicle. In the case of collisions between motor-vehicles and horse-drawn vehicles, the death is assigned to the motor-vehicle.
The number and rate of deaths resulting from railway, tramway, motor-vehicle, and aircraft accidents during each of the last eleven years are as follows:—
| Year. | Deaths due to Accident. | Rate per 10,000 of Population. | ||||||
|---|---|---|---|---|---|---|---|---|
| Railway. | Tramway. | Motor-vehicle. | Aircraft. | Railway. | Tramway. | Motor-vehicle. | Aircraft. | |
| 1937 | 41 | 10 | 195 | 4 | 0.27 | 0.07 | 1.30 | 0.03 |
| 1938 | 52 | 7 | 330 | 6 | 0.34 | 0.05 | 1.51 | 0.04 |
| 1939 | 39 | 5 | 216 | 5 | 0.25 | 0.03 | 1.40 | 0.03 |
| 1940 | 35 | 5 | 183 | 18 | 0.23 | 0.03 | 1.18 | 0.12 |
| 1941 | 40 | 5 | 159 | 50 | 0.26 | 0.03 | 1.03 | 0.32 |
| 1942 | 51 | 16 | 125 | 58 | 0.33 | 0.10 | 0.81 | 0.38 |
| 1943 | 74 | 9 | 113 | 97 | 0.48 | 0.06 | 0.73 | 0.63 |
| 1944 | 36 | 11 | 129 | 41 | 0.23 | 0.07 | 0.83 | 0.26 |
| 1945 | 36 | 11 | 104 | 27 | 0.23 | 0.07 | 0.65 | 0.17 |
| 1946 | 40 | 22 | 157 | 3 | 0.24 | 0.13 | 0.95 | 0.02 |
| 1947 | 39 | 9 | 187 | 8 | 0.23 | 0.05 | 1.10 | 0.05 |
Deaths arising out of aircraft accidents fell off steeply after 1945. This was to be expected, since the figures include Air Force accidents in New Zealand as well as civilian casualties. The sharp increase in 1943 in deaths due to railway accidents is accounted for by one serious accident near Hyde in Central Otago, which resulted in twenty-one deaths.
Deaths from motor-vehicle accidents recorded an appreciable increase up to 1930, but this trend was reversed during the depression years, largely due to a great reduction in the number of motor-vehicles on the roads during that period. With the advent of more prosperous times, the toll of the motor-vehicle again mounted, although, fortunately, not in proportion to the tremendous increase in motor-vehicular traffic on the highways. The 1938 total was the highest ever recorded in New Zealand. An appreciable drop, however, was experienced during the war years on account of there being less traffic on the roads owing to restrictions in the use of motor-spirits and rubber tires. With the gradual resumption of normal traffic since the war, the number of fatalities from motor-vehicle accidents is again tending to increase.
The figures given for deaths from motor-vehicle accidents (which do not include deaths of Maoris) are exclusive of accidents where persons have been killed in collisions between motor-vehicles and trains or trams, these, as stated above, being assigned to the heavier vehicle. For 1947 there were 17 deaths from such accidents, bringing the total number of deaths in cases where a motor-vehicle was involved up to 204. The corresponding figure for 1946 was 175. Further data regarding accidents will be found elsewhere in this volume (see Index). A later section is devoted wholly to statistics of industrial accidents.
SUICIDES.—Suicidal deaths in 1947 numbered 135—males 99, females 36—the death-rate per 10,000 of mean population being 0.80.
| Year. | Number of Suicidal Deaths. | Rate per 10,000 of Population. | ||||
|---|---|---|---|---|---|---|
| Males. | Females. | Totals. | Males. | Females. | Totals. | |
| 1943 | 90 | 42 | 132 | 1.22 | 0.53 | 0.86 |
| 1944 | 109 | 46 | 155 | 1.46 | 0.57 | 1.00 |
| 1945 | 118 | 57 | 175 | 1.52 | 0.70 | 1.10 |
| 1946 | 113 | 53 | 166 | 1.37 | 0.64 | 1.00 |
| 1947 | 99 | 36 | 135 | 1.17 | 0.42 | 0.80 |
The following table presents, for annual averages of various quinquennia, the suicide-rate per 10,000 of mean population.
| Annual Average during | Males. | Females. | Both Sexes. |
|---|---|---|---|
| 1895–99 | 1.48 | 0.31 | 0.93 |
| 1900–04 | 1.66 | 0.31 | 1.02 |
| 1905–09 | 1.62 | 0.34 | 1.02 |
| 1910–14 | 1.83 | 0.41 | 1.16 |
| 1915–19 | 1.79 | 0.40 | 1.10 |
| 1920–24 | 1.92 | 0.46 | 1.20 |
| 1925–29 | 2.17 | 0.56 | 1.38 |
| 1930–34 | 2.29 | 0.55 | 1.44 |
| 1935–39 | 1.63 | 0.57 | 1.10 |
| 1940–44 | 1.44 | 0.56 | 0.99 |
| 1945–47 (3 years) | 1.35 | 0.59 | 0.97 |
IN each of the preceding subsections, Maoris have been excluded from the statistical tables presented. The standard of registration of Maoris is very much below that of the European section of the population of New Zealand. This is due partly to difficulties of language, educational status, &c., and partly to problems of access. This latter difficulty arises from the fact that the greater portion of the Maori population is resident in country districts not so well served with modern facilities as regards transport, medical and nursing services, &c. Consequently, registration of vital facts regarding the Maori race as a whole cannot be maintained at the same high level of accuracy as obtains for the European population.
MAORI BIRTHS.—In the successive Registration Acts special provision was made for exemption from the necessity of registration in the case of births and deaths of Maoris, though registration could be effected if desired. Section 20 of the Births and Deaths Registration Amendment Act, 1912 (now section 60 of the Births and Deaths Registration Act, 1924), empowered the making of regulations to provide for the registration of births and deaths of Maoris. Regulations were made accordingly, and Maori births and deaths became registrable as from 1st March, 1913. The number of Registrars of Maori Births and Deaths in New Zealand is over 250, most of these being in the North Island, where the great majority of the Maori population is located. Every Maori settlement of any size is within reach of one of these Registrars. Maori registrations are entered in a separate register, which does not, however, make provision for as many particulars as is the case with registrations of Europeans. The births of a few Maoris are registered with the European Registrars, and these are included in the statistics relating to Maori births contained below.
The number of births of Maoris registered with Registrars of Maori Births and Deaths during 1947 was 4,961 (2,528 males, 2,433 females). In addition, 27 births (13 males and 14 females) recorded as of Maori race were registered with European Registrars, making a total of 4,988 Maori births for the year. The Maori birth-rate in 1947 was almost twice the European birth-rate (26.42 per 1,000). Registrations of Maori births in each of the last five years were as follows:—
| Year. | Number of Maori Births. | Rate per 1,000 of Mean Population. | ||
|---|---|---|---|---|
| Males. | Females. | Totals. | ||
| 1943 | 2,267 | 2,173 | 4,440 | 45.78 |
| 1944 | 2,328 | 2,180 | 4,508 | 45.32 |
| 1945 | 2,389 | 2,255 | 4,644 | 46.09 |
| 1946 | 3,007 | 2,769 | 5,776 | 56.49 |
| 1947 | 2,541 | 2,447 | 4,988 | 46.86 |
The abnormally high birth-rates recorded for Maoris in recent years, particularly in comparison with the remainder of the population, must be attributed partly to late-registrations of hitherto unregistered births. This became particularly noticeable in 1946, and is no doubt attributable in some measure to the extension of family benefits under the social security scheme to cover all children under sixteen years of age, irrespective of the income of the parents. This extension was provided for by the Social Security Amendment Act, 1945, and came into operation on 1st April, 1946. The following analysis of registrations of Maori births in 1946 illustrates this point.
| Registrations during Quarter ended | Date of Birth. | Totals. | ||
|---|---|---|---|---|
| Before 1945. | During 1945. | During 1946. | ||
| 31st March, 1946 | 118 | 436 | 588 | 1,142 |
| 30th June, 1946 | 318 | 56 | 882 | 1,256 |
| 30th September, 1946 | 523 | 21 | 1,138 | 1,682 |
| 31st December, 1946 | 488 | 20 | 1,188 | 1,696 |
| Totals, 1946 | 1,447 | 533 | 3,796 | 5,776 |
Of the 5,776 Maori births registered during 1946, no fewer than 1,447, or 25 per cent. had actually occurred before 1945—i.e., over a year before registration. For population purposes, half-castes and persons between half and full blood rank as Maoris; but it is not always possible to ensure that this practice is followed in the registration of births (and of deaths).
MAORI MARRIAGES.—In cases where both parties to a marriage are of the Maori race there is no necessity under the Marriage Act to comply with the provisions of that Act, though the parties are at liberty to take advantage thereof. Considerable inconvenience, however, was found to exist on account of the non-registration of Maori marriages, and a section was inserted in the Maori Land Act, 1909, and re-enacted in 1931, whereby it was laid down that Maori marriages must be celebrated either under the provisions of the Marriage Act or in the presence of a registered officiating minister, but without complying with the other requirements of the Marriage Act. Ministers solemnizing either class of marriages must send returns to the Registrar-General.
A marriage between a Maori and a European must be celebrated under the provisions of the Marriage Act, and does not rank as a Maori marriage.
Returns of 522 marriages in which both parties were of the Maori race were received during the year 1947. The figures for each of the last five years are as follows:—
| Year. | Under Maori Land Act. | Under Marriage Act. | Totals. |
|---|---|---|---|
| 1942 | 463 | 93 | 556 |
| 1943 | 363 | 79 | 442 |
| 1944 | 428 | 93 | 521 |
| 1945 | 457 | 76 | 533 |
| 1946 | 511 | 50 | 561 |
| 1947 | 468 | 54 | 522 |
The number of Maori marriages declined considerably during the earlier war years, reaching a low point in 1943, and although there has been some improvement since, it is still well below pre-war proportions.
MAORI DEATHS.—Registrations of Maori deaths during each of the last five years have been as follows:—
| Year. | Number. | Rate per 1,000 of Maori Population. | ||||
|---|---|---|---|---|---|---|
| Males. | Females. | Totals. | Males. | Females. | Totals. | |
| 1943 | 862 | 813 | 1,675 | 17.51 | 17.11 | 17.27 |
| 1944 | 861 | 825 | 1,686 | 17.12 | 16.77 | 16.95 |
| 1945 | 865 | 770 | 1,635 | 16.93 | 15.50 | 16.23 |
| 1946 | 837 | 790 | 1,627 | 15.94 | 15.88 | 15.91 |
| 1947 | 796 | 742 | 1,538 | 14.54 | 14.35 | 14.45 |
The rates for the two sexes are much more nearly equal for Maoris than for the rest of the population, the female rate being indeed higher than the male in some years. The total Maori death-rate has shown a steady improvement during the last five years.
Apart from mere numbers by sex, statistics of Maori deaths are not available prior to 1920, but annual tabulations are now made on the bases of age and cause of death. The ages of Maoris whose deaths were registered during the year 1947 were as shown in the following table.
| Age, in Years. | Males. | Females | Totals. |
|---|---|---|---|
| Under 1 | 195 | 170 | 365 |
| 1 and under 5 | 83 | 79 | 162 |
| 5 and under 10 | 25 | 26 | 51 |
| 10 and under 15 | 23 | 31 | 54 |
| 15 and under 20 | 40 | 64 | 104 |
| 20 and under 25 | 38 | 36 | 74 |
| 25 and under 30 | 32 | 19 | 51 |
| 30 and under 35 | 28 | 29 | 57 |
| 35 and under 40 | 30 | 45 | 75 |
| 40 and under 45 | 26 | 23 | 49 |
| 45 and under 50 | 29 | 25 | 54 |
| 50 and under 55 | 25 | 21 | 46 |
| 55 and under 60 | 32 | 24 | 56 |
| 60 and under 65 | 45 | 29 | 74 |
| 65 and under 70 | 45 | 24 | 69 |
| 70 and under 75 | 32 | 22 | 54 |
| 75 and under 80 | 28 | 20 | 48 |
| 80 and under 85 | 16 | 18 | 34 |
| 85 and under 90 | 12 | 12 | 24 |
| 90 and under 95 | 5 | 8 | 13 |
| 95 and under 100 | 3 | 1 | 4 |
| 100 and over | 2 | 10 | 12 |
| Unspecified | 2 | 6 | 8 |
| Totals | 796 | 742 | 1,538 |
With the exception of diphtheria and scarlet fever, epidemic and infectious diseases generally exact a much heavier toll proportionately among Maoris than among the European population, the most noteworthy examples being tuberculosis, particularly of the respiratory system, and typhoid fever. Other diseases of the respiratory system also show much higher rates for Maoris than for Europeans, and the same state of affairs is disclosed for diarrhœal diseases and stomach complaints.
On the other hand, there is a much lower mortality rate among Maoris from certain diseases which rank high as causes of death among the European population. Principal among these are cancer, heart-disease and other diseases of the circulatory system, nephritis, the group of general diseases which includes diabetes and exophthalmic goitre, and the group of diseases of the nervous system -which includes apoplexy and cerebral hæmorrhage. Malformations show lower rates for Maoris than for Europeans, but the indefinite nature of the data in the registration entries covering the deaths of many Maori infants may be partly responsible, as the figures of deaths from malformations and the group “early infancy” taken in conjunction indicate a much higher rate for Maoris from these causes as a whole than for the European population.
A summary is here given showing Maori deaths from the principal causes and groups of causes.
| Cause of Death. | Number of Deaths. | Rate per 10,000 of Mean Maori Population, | ||||||||
|---|---|---|---|---|---|---|---|---|---|---|
| 1943. | 1944. | 1945. | 1946. | 1947. | 1943. | 1944. | 1945. | 1946. | 1947. | |
| Typhoid fever | 9 | 9 | 7 | 7 | 12 | 0.93 | 0.91 | 0.69 | 0.68 | 1.13 |
| Measles | 12 | 4 | 27 | 1 | 1.24 | 0.40 | 2.64 | 0.09 | ||
| Whooping-cough | 47 | 8 | 15 | 4.73 | 0.79 | 1.41 | ||||
| Diphtheria | 6 | 7 | 21 | 10 | 8 | 0.62 | 0.70 | 2.08 | 0.98 | 0.75 |
| Influenza | 27 | 29 | 21 | 37 | 15 | 2.78 | 2.92 | 2.08 | 3.62 | 1.41 |
| Dysentery | 9 | 3 | 12 | 7 | 5 | 0.93 | 0.30 | 1.19 | 0.68 | 0.47 |
| Pulmonary tuberculosis | 267 | 290 | 292 | 293 | 276 | 27.53 | 29.15 | 28.98 | 28.65 | 25.93 |
| Other forms of tuberculosis | 91 | 91 | 85 | 102 | 74 | 9.38 | 0.15 | 8.44 | 9.98 | 6.95 |
| Cancer | 78 | 49 | 55 | 58 | 73 | 8.04 | 4.93 | 5.46 | 5.67 | 0.86 |
| Cerebral hæmorrhage | 41 | 25 | 33 | 14 | 36 | 4.23 | 2.51 | 3.27 | 1.37 | 3.38 |
| Convulsions (under five years) | 11 | 13 | 11 | 3 | 4 | 1.13 | 1.31 | 1.09 | 0.29 | 0.38 |
| Heart-diseases | 233 | 229 | 269 | 232 | 255 | 24.02 | 23.02 | 26.70 | 22.69 | 23.95 |
| Bronchitis | 38 | 44 | 27 | 24 | 31 | 3.92 | 4.42 | 2.68 | 2.35 | 2.91 |
| Broncho-pneumonia | 148 | 144 | 130 | 177 | 124 | 15.26 | 14.48 | 12.90 | 17.31 | 11.65 |
| Pneumonia | 141 | 123 | 85 | 102 | 81 | 14.54 | 12.37 | 8.44 | 9.98 | 7.61 |
| Diarrhœa and enteritis | 65 | 77 | 114 | 86 | 71 | 6.70 | 7.74 | 11.31 | 8.41 | 6.67 |
| Nephritis | 15 | 26 | 25 | 24 | 14 | 1.55 | 2.61 | 2.48 | 2.35 | 1.32 |
| Senility | 61 | 63 | 50 | 46 | 40 | 6.29 | 6.33 | 4.96 | 4.50 | 3.76 |
| Violence— | ||||||||||
| Suicide | 2 | 3 | 7 | 7 | 5 | 0.21 | 0.30 | 0.69 | 0.68 | 0.47 |
| Accident | 78 | 66 | 65 | 83 | 93 | 8.04 | 6.63 | 6.45 | 8.12 | 8.74 |
| Homicide | 5 | 2 | 3 | 3 | 0.50 | 0.20 | 0.29 | 0.28 | ||
| Ill-defined or not specified | 61 | 12 | 11 | 4 | 16 | 6.29 | 1.21 | 1.09 | 0.39 | 1.50 |
| Other causes | 282 | 331 | 301 | 281 | 286 | 29.08 | 33.27 | 29.89 | 27.48 | 26.86 |
| Totals | 1,675 | 1,686 | 1,635 | 1,627 | 1,538 | 172.71 | 169.49 | 162.26 | 159.11 | 144.48 |
From 1925 onwards information has been obtained as to whether the cause of death has been certified by a medical practitioner or a Coroner's inquest. As an indication of the improvements achieved in the specifying of the causes of deaths of Maoris, it may be said that in 1925, out of a total of 867 deaths, 446 or 61 per cent. were definitely shown to have been certified, while in 1947 the number so certified was 1,251 out of 1,538 registrations, equivalent to 81 per cent.
MAORI INFANT MORTALITY.—As regards infant mortality, the Maori rate is much higher than the European, principally owing to the ravages of epidemic diseases, tuberculosis, respiratory diseases, and diarrhæal diseases. The infant mortality rate for the first year of life was, for the five years 1943–47, 86 per 1,000 births in the case of Maoris, as compared with 28 per 1,000 among European infants. The decrease in the Maori infant mortality rate during the last two years is more apparent than real as the birth figures on which they are based include a considerable number of late registrations of hitherto unregistered births (see p. 83).
The numbers and rates per 1,000 live births for the last eleven years are given in the next table.
| Year. | Maoris. | Europeans. | ||
|---|---|---|---|---|
| Number of Deaths under One Year. | Rate per 1,000 Live Births. | Number of Deaths under One Year. | Rate per 1,000 Live Births. | |
| 1937 | 366 | 92.17 | 812 | 31.21 |
| 1938 | 566 | 153.26 | 971 | 35.63 |
| 1939 | 473 | 114.92 | 898 | 3114 |
| 1940 | 372 | 87.22 | 990 | 30.21 |
| 1941 | 517 | 125.06 | 1,045 | 29.77 |
| 1942 | 424 | 97.92 | 964 | 28.71 |
| 1943 | 399 | 89.86 | 951 | 31.37 |
| 1944 | 461 | 102.26 | 1,012 | 30.12 |
| 1945 | 413 | 88.93 | 1,036 | 27.99 |
| 1946 | 431 | 74.62 | 1,093 | 26.10 |
| 1947 | 365 | 73.18 | 1,122 | 25.04 |
The next table shows for the year 1947 the principal causes of deaths of Maori infants under 1 year, classified according to age.
| Cause of Death. | Under 1 Days. | 1 Days and under 2 Days. | 2 Days and under 1 Weeks. | 1 Week and under 2 Weeks. | 2 Weeks and under 3 Weeks. | 3 Weeks and under 1 Month. | 1 Month and under 2 Months. | 2 Months and under 3 Months. | 3 Months and under 6 Months. | 6 Months and under 9 Months. | 9 Months and under 12 Months. | Totals. |
|---|---|---|---|---|---|---|---|---|---|---|---|---|
| Influenza | 1 | 2 | 2 | 2 | 7 | |||||||
| Tuberculosis | 1 | 6 | 2 | 9 | ||||||||
| Infantile convulsions | 1 | 1 | 2 | 4 | ||||||||
| Bronchitis | 1 | 1 | 2 | |||||||||
| Broncho-pneumonia | 1 | 1 | 1 | 6 | 8 | 19 | 23 | 18 | 77 | |||
| Pneumonia | 1 | 3 | 2 | 3 | 14 | 13 | 4 | 40 | ||||
| Diarrhoea and enteritis | 1 | 1 | 2 | 5 | 11 | 10 | 10 | 40 | ||||
| Congenital malformations | 3 | 2 | 3 | 1 | 1 | 1 | 1 | 1 | 13 | |||
| Congenital debility, &c. | 1 | 2 | 1 | 1 | 2 | 7 | ||||||
| Injury at birth | 17 | 3 | 4 | 2 | 1 | 1 | 28 | |||||
| Premature birth | 22 | 6 | 9 | 8 | 2 | 1 | 1 | 2 | 51 | |||
| Other causes peculiar to early infancy | 5 | 2 | 7 | 2 | 1 | 1 | 1 | 1 | 20 | |||
| Accident | 1 | 1 | 1 | 1 | 2 | 3 | 6 | 15 | ||||
| Other defined causes | 2 | 1 | 1 | 1 | 1 | 3 | 5 | 16 | 9 | 7 | 46 | |
| Unspecified or ill-defined | 1 | 1 | 1 | 1 | 2 | 6 | ||||||
| Totals | 51 | 15 | 24 | 19 | 9 | 9 | 19 | 28 | 74 | 67 | 50 | 365 |
The great achievement in reducing the infant mortality rate for the European population has been accomplished during the period after the first month of life up to the end of the first year. Conversely, the causes of the extremely high Maori mortality rates are to be found in the same period of life. This is indicated in the next table, which contrasts the mortality rates per 1,000 live births for European and Maori infants respectively for the two periods mentioned. Statistics are available for this purpose only from 1930 onwards.
| Year. | Europeans. | Maoris. | ||||
|---|---|---|---|---|---|---|
| Under One Month. | One and under Twelve Months. | Total under One Year. | Under One Month. | One and under Twelve Months. | Total under One Year. | |
| 1930 | 24.03 | 10.45 | 34.48 | 24.48 | 64.03 | 88.51 |
| 1931 | 22.69 | 9.46 | 32.15 | 14.71 | 80.88 | 95.59 |
| 1932 | 21.30 | 9.92 | 31.22 | 22.22 | 73.22 | 95.45 |
| 1933 | 22.81 | 8.83 | 31.64 | 23.07 | 69.54 | 92.61 |
| 1934 | 22.86 | 9.25 | 32.11 | 17.11 | 76.48 | 93.59 |
| 1935 | 22.03 | 10.23 | 32.26 | 24.30 | 84.90 | 109.20 |
| 1936 | 22.31 | 8.65 | 30.96 | 22.32 | 87.60 | 109.92 |
| 1937 | 22.21 | 9.00 | 31.21 | 21.66 | 70.51 | 92.17 |
| 1938 | 24.15 | 11.48 | 35.63 | 30.32 | 122.94 | 153.26 |
| 1939 | 21.85 | 9.29 | 31.14 | 32.07 | 82.85 | 114.92 |
| 1940 | 22.03 | 8.18 | 30.21 | 23.92 | 63.30 | 87.22 |
| 1941 | 20.00 | 9.77 | 29.77 | 26.85 | 98.21 | 125.06 |
| 1942 | 18.73 | 9.98 | 28.71 | 19.40 | 78.52 | 97.92 |
| 1943 | 21.27 | 10.10 | 31.37 | 18.92 | 70.94 | 89.86 |
| 1944 | 20.60 | 9.52 | 30.12 | 19.30 | 82.96 | 102.26 |
| 1945 | 19.59 | 8.40 | 27.99 | 26.05 | 62.88 | 88.93 |
| 1946 | 19.08 | 7.02 | 26.10 | 18.35 | 56.27 | 74.62 |
| 1947 | 18.08 | 6.96 | 25.04 | 25.46 | 4.72 | 73.18 |
The principal causes of death of Maori infants responsible for the high mortality rates after the first month of life are diarrhœa and enteritis, broncho-pneumonia, pneumonia, and other diseases of the respiratory system.
THE principal reasons for excluding Maoris from the published vital statistics of New Zealand have already been outlined in the preceding subsection. Late registration is another important factor which prohibits the publication in general of Maori data in conjunction with vital statistics for the European population. It is, however, desirable that a complete coverage of the vital statistics for the country as a whole should be available. Furthermore, the introduction of the medical and related benefits under the social security legislation, which covers Maori and European alike, renders it more important that a health picture of the total population in a single category should be presented. There is evidence also, that, as a result of certain information being essential for the claiming of social security benefits, the standard of Maori registration is now showing a gradual improvement.
The statistical data presented in this subsection contains details concerning vital statistics covering the entire population of New Zealand (including Maoris).
TOTAL BIRTHS.—As mentioned previously, registrations of Maori births are somewhat less accurate than those of the European population. Consequently, in considering the birth statistics of the whole population, allowance must be made for the element of inaccuracy and incompleteness affecting a proportion of the figures.
For instance, owing to the extensive time-lag in the receipt by the Registrar-General of a considerable number of registrations, the statistics of Maori births relate to the number of registrations received during the year, whereas the European figures cover actual registrations effected during the year. The following table shows the numbers and rates of European, Maori, and total births for each of the last twenty years.
| Year. | Numbers. | Rates per 1,000 of Menu Population. | ||||
|---|---|---|---|---|---|---|
| European. | Maori. | Total. | European. | Maori. | Total. | |
| 1928 | 27,200 | 1,845 | 29,045 | 19.57 | 27.79 | 19.95 |
| 1929 | 26,747 | 2,216 | 28,963 | 19.03 | 32.62 | 19.66 |
| 1930 | 26,797 | 2,124 | 28,921 | 18.83 | 30.41 | 19.37 |
| 1931 | 26,622 | 2,312 | 28,934 | 18.45 | 32.26 | 19.11 |
| 1932 | 24,884 | 2,745 | 27,629 | 17.12 | 37.28 | 18.09 |
| 1933 | 24,334 | 2,948 | 27,282 | 16.63 | 38.84 | 17.72 |
| 1934 | 24,322 | 2,981 | 27,303 | 16.51 | 38.10 | 17.60 |
| 1935 | 23,965 | 3,251 | 27,216 | 16.17 | 40.36 | 17.42 |
| 1936 | 24,837 | 3,630 | 28,467 | 16.64 | 43.79 | 18.07 |
| 1937 | 26,014 | 3,971 | 29,985 | 17.29 | 46.64 | 18.86 |
| 1938 | 27,249 | 3,693 | 30,942 | 17.93 | 42.37 | 19.26 |
| 1939 | 28,833 | 4,116 | 32,949 | 18.73 | 46.20 | 20.23 |
| 1940 | 32,771 | 4,265 | 37,036 | 21.19 | 46.87 | 22.62 |
| 1941 | 35,100 | 4,134 | 39,234 | 22.81 | 44.78 | 24.06 |
| 1942 | 33,574 | 4,330 | 37,904 | 21.73 | 45.84 | 23.12 |
| 1943 | 30,311 | 4,440 | 34,751 | 19.70 | 45.78 | 21.25 |
| 1944 | 33,599 | 4,508 | 38,107 | 21.59 | 45.32 | 23.01 |
| 1945 | 37,007 | 4,644 | 41,651 | 23.22 | 46.09 | 24.58 |
| 1946 | 41,871 | 5,776 | 47,647 | 25.24 | 56.49 | 27.05 |
| 1947 | 44,816 | 4,988 | 49,804 | 26.42 | 46.86 | 27.63 |
The abnormal increase in the number of Maori births shown for the year 1946 is mainly accounted for by the late registration of births which occurred prior to 1946 (see p. 83).
The inclusion of Maoris raises the level of the birth-rate all through the period covered, but in no case does it reverse the trend of the rate on the normal published basis—i.e., the birth-rate of New Zealand, exclusive of Maoris. In an international comparison for the quinquennium 1943–47, the inclusion of Maoris raises New Zealand's position from fifteenth to thirteenth in a total of twenty-nine countries covered.
TOTAL NATURAL INCREASE.—The birth and death rates of the European population are not subject to violent fluctuation, and consequently the natural-increase rate —i.e., excess of births over deaths—for this section of the population follows an even trend in the twenty years covered by the next table, with a gradual decline from 1928 to 1936, followed by a steady rise from 1937 to 1941. A temporary decline was experienced during the next two years, with a sharp increase to the end of the period covered. The Maori population, on the other hand, evinces sudden changes in both birth and death rates, with a resultant considerable fluctuation in the natural-increase rate, especially in some years where the respective rates exhibit violent changes in opposite directions. The effect of combining the two sections of the populations is to smooth out the variations in the Maori rate of natural increase, and occasionally to reverse the trend of the European rate. The following table shows the numbers gained by natural increase, together with the rate per 1,000 of mean population for each of the years 1928–47;
| Year. | Numbers. | Rates per 1,000 of Mean Population. | ||||
|---|---|---|---|---|---|---|
| European. | Maori. | Total. | European. | Maori. | Total. | |
| 1928 | 15,389 | 721 | 16,110 | 11.07 | 10.86 | 11.07 |
| 1929 | 14,433 | 1,310 | 15,743 | 10.27 | 19.28 | 10.69 |
| 1930 | 14,598 | 1,178 | 15,776 | 10.26 | 16.86 | 10.57 |
| 1931 | 14,575 | 1,297 | 15,872 | 10.10 | 18.10 | 10.48 |
| 1932 | 13,201 | 1,553 | 14,754 | 9.08 | 21.09 | 9.66 |
| 1933 | 12,633 | 1,787 | 14,420 | 8.64 | 23.55 | 9.37 |
| 1934 | 11,795 | 1,698 | 13,493 | 8.01 | 21.70 | 8.70 |
| 1935 | 11,748 | 1,804 | 13,552 | 7.92 | 22.40 | 8.67 |
| 1936 | 11,781 | 2,028 | 13,809 | 7.89 | 24.46 | 8.76 |
| 1937 | 12,356 | 2,414 | 14,770 | 8.21 | 28.35 | 9.29 |
| 1938 | 12,495 | 1,573 | 14,068 | 8.22 | 18.05 | 8.76 |
| 1939 | 14,675 | 2,341 | 17,016 | 9.53 | 26.28 | 10.45 |
| 1940 | 18,489 | 2,672 | 21,161 | 11.95 | 29.36 | 12.92 |
| 1941 | 19,954 | 2,233 | 22,187 | 12.97 | 24.19 | 13.61 |
| 1942 | 17,189 | 2,598 | 19,787 | 11.13 | 27.50 | 12.07 |
| 1943 | 14,864 | 2,765 | 17,629 | 9.66 | 28.51 | 10.78 |
| 1944 | 18,236 | 2,822 | 21,058 | 11.72 | 28.37 | 12.71 |
| 1945 | 20,956 | 3,009 | 23,965 | 13.15 | 29.86 | 14.14 |
| 1946 | 25,778 | 4,149 | 29,927 | 15.54 | 40.58 | 16.99 |
| 1947 | 28,912 | 3,450 | 32,362 | 17.04 | 32.41 | 17.95 |
In the twenty years, 1928–47, New Zealand has gained by natural increase of the population a total of 367,459, comprising 324,057 Europeans and 43,402 Maoris.
TOTAL MARRIAGES.—The following table shows the numbers of European, Maori, and total marriages celebrated during each of the last twenty years.
| Year. | Numbers. | Rates per 1,000 of Mean Population. | ||||
|---|---|---|---|---|---|---|
| European. | Maori. | Total. | European. | Maori. | Total. | |
| 1928 | 10,537 | 382 | 10,919 | 7.58 | 5.75 | 7.50 |
| 1929 | 10,967 | 436 | 11,403 | 7.80 | 6.42 | 7.74 |
| 1930 | 11,075 | 419 | 11,494 | 7.78 | 6.00 | 7.70 |
| 1931 | 9,817 | 437 | 10,254 | 6.81 | 6.10 | 6.77 |
| 1932 | 9,896 | 596 | 10,492 | 6.81 | 8.09 | 6.87 |
| 1933 | 10,510 | 557 | 11,067 | 7.18 | 7.34 | 7.19 |
| 1934 | 11,256 | 532 | 11,788 | 7.64 | 6.80 | 7.60 |
| 1935 | 12,187 | 557 | 12,744 | 8.23 | 6.91 | 8.16 |
| 1936 | 13,808 | 040 | 14,448 | 9.25 | 7.72 | 9.17 |
| 1937 | 14,364 | 609 | 14,973 | 9.55 | 7.15 | 9.42 |
| 1938 | 15,328 | 631 | 15,959 | 10.09 | 7.24 | 9.93 |
| 1939 | 17,115 | 676 | 17,791 | 11.12 | 7.59 | 10.92 |
| 1940 | 17,448 | 636 | 18,084 | 11.28 | 6.99 | 11.04 |
| 1941 | 13,313 | 517 | 13,830 | 8.65 | 5.60 | 8.48 |
| 1942 | 12,219 | 556 | 12,775 | 7.91 | 5.89 | 7.79 |
| 1943 | 11,579 | 442 | 12,021 | 7.53 | 4.56 | 7.35 |
| 1944 | 13,125 | 521 | 13,646 | 8.43 | 5.24 | 8.24 |
| 1945 | 16,160 | 533 | 16,693 | 10.14 | 5.29 | 9.85 |
| 1946 | 20,535 | 561 | 21,096 | 12.38 | 5.49 | 11.98 |
| 1947 | 18,525 | 522 | 19,047 | 10.92 | 4.90 | 10.57 |
The fluctuations in the Maori marriage-rate, and hence, to a lesser extent, in the total marriage-rate, cannot be taken at their face value, as elements of Maori psychology play no small part on occasions in influencing the number of Maori marriages registered as distinct from the number actually celebrated. Apart from these factors, the differences observed in the movements of the respective rates are, of course, considerably affected by variations in the application of social and other legislation to the Maori race and the European population respectively.
TOTAL DEATHS.—The effect of including Maoris is to increase slightly the total death-rate for New Zealand, as is seen in the following table.
| Year. | Numbers. | Rates per 1,000 of Mean Population. | ||||
|---|---|---|---|---|---|---|
| European; | Maori. | Total. | European. | Maori. | Total. | |
| 1928 | 11,811 | 1,124 | 12,935 | 8.50 | 16.93 | 8.88 |
| 1929 | 12,314 | 906 | 13,220 | 8.76 | 13.34 | 8.97 |
| 1930 | 12,199 | 946 | 13,145 | 8.57 | 13.55 | 8.80 |
| 1931 | 12,047 | 1,015 | 13,062 | 8.35 | 14.16 | 8.63 |
| 1932 | 11,683 | 1,192 | 12,875 | 8.04 | 16.19 | 8.43 |
| 1933 | 11,701 | 1,161 | 12,862 | 7.99 | 15.29 | 8.35 |
| 1934 | 12,527 | 1,283 | 13,810 | 8.50 | 16.40 | 8.90 |
| 1935 | 12,217 | 1,447 | 13,664 | 8.25 | 17.96 | 8.75 |
| 1936 | 13,056 | 1,602 | 14,658 | 8.75 | 19.33 | 9.31 |
| 1937 | 13,658 | 1,557 | 15,215 | 9.08 | 18.29 | 9.57 |
| 1938 | 14,754 | 2,120 | 16,874 | 9.71 | 24.32 | 10.50 |
| 1939 | 14,158 | 1,775 | 15,933 | 9.20 | 19.92 | 9.78 |
| 1940 | 14,282 | 1,593 | 15,875 | 9.24 | 17.51 | 9.70 |
| 1941 | 15,146 | 1,901 | 17,047 | 9.84 | 20.59 | 10.45 |
| 1942 | 16,385 | 1,732 | 18,117 | 10.60 | 18.34 | 11.05 |
| 1943 | 15,447 | 1,675 | 17,122 | 10.04 | 17.27 | 10.47 |
| 1944 | 15,363 | 1,686 | 17,049 | 9.87 | 16.95 | 10.30 |
| 1945 | 16,051 | 1,635 | 17,686 | 10.07 | 16.23 | 10.44 |
| 1946 | 16,093 | 1,627 | 17,720 | 9.70 | 15.91 | 10.06 |
| 1947 | 15,904 | 1,538 | 17,442 | 9.38 | 14.45 | 9.68 |
Although the Maori death-rate is consistently and appreciably higher than the European rate, the inclusion of Maoris does not raise the general death-rate to a substantially higher level. The October, 1948, issue of the Monthly Bulletin of Statistics issued by the Statistical Office of the United Nations contains death-rates for 1947 for thirty-six countries, and of these, Netherlands, 8.1 per 1,000 of population, South Africa (European population only), 8.7, and Panama (excluding jungle population) 9.1, had a lower death-rate than New Zealand (excluding Maoris). Two other countries, Canada and Norway, recorded the same rate as New Zealand (9.4). The inclusion of Maoris raised the New Zealand rate to 9.7 and the only effect of this increase was to place New Zealand on the same level as Australia which ranked next after the six countries named.
Numbers and rates for principal causes of death over the five years 1943–47 are given in the following table. A comparison of these figures, which include Maoris, with similar tables for the European and the Maori population separately may be made by reference to page 76 of Subsection C and page 85 of Subsection D respectively.
| Cause of Death. | Numbers. | Rates per 10,000 of Mean Population. | ||||||||
|---|---|---|---|---|---|---|---|---|---|---|
| 1943. | 1944. | 1945. | 1946. | 1947. | 1943. | 1944. | 1945. | 1946. | 1947. | |
| Typhoid and paratyphoid fever | 12 | 12 | 10 | 14 | 21 | 0.07 | 0.07 | 0.06 | 0.08 | 0.12 |
| Scarlet fever | 2 | 27 | 14 | 1 | 0.01 | 0.16 | 0.08 | 0.01 | ||
| Whooping-cough | 17 | 92 | 16 | 1 | 49 | 0.10 | 0.55 | 0.09 | 0.01 | 0.27 |
| Diphtheria | 38 | 37 | 63 | 59 | 28 | 0.23 | 0.22 | 0.37 | 0.33 | 0.15 |
| Tuberculosis of the respiratory system | 742 | 775 | 789 | 753 | 717 | 4.54 | 4.68 | 4.66 | 4.28 | 3.98 |
| Other forms of tuberculosis | 188 | 199 | 191 | 202 | 156 | 1.15 | 1.20 | 1.13 | 1.15 | 0.87 |
| Syphilis | 110 | 101 | 100 | 135 | 125 | 0.67 | 0.61 | 0.59 | 0.77 | 0.69 |
| Influenza | 92 | 91 | 74 | 148 | 48 | 0.56 | 0.55 | 0.44 | 0.84 | 0.27 |
| Measles | 19 | 14 | 43 | 2 | 0.12 | 0.08 | 0.24 | 0.01 | ||
| Other infective and parasitic diseases | 224 | 154 | 132 | 131 | 131 | 1.37 | 6.93 | 0.78 | 0.74 | 0.73 |
| Cancer and other malignant tumours | 2,209 | 2,231 | 2,268 | 2,326 | 2,388 | 13.50 | 13.47 | 13.38 | 13.21 | 13.25 |
| Non-malignant tumours | 64 | 66 | 55 | 72 | 69 | 0.39 | 0.40 | 0.32 | 0.41 | 0.38 |
| Chronic rheumatism and gout | 25 | 42 | 30 | 30 | 23 | 0.15 | 0.25 | 0.18 | 0.17 | 0.13 |
| Diabetes mellitus | 337 | 331 | 324 | 347 | 332 | 2.06 | 2.00 | 1.91 | 1.97 | 1.84 |
| Alcoholism | 3 | 5 | 7 | 4 | 3 | 0.02 | 0.03 | 0.04 | 0.02 | 0.02 |
| Avitaminoses, other general diseases, diseases of the blood, and chronic poisonings | 273 | 296 | 270 | 260 | 250 | 1.67 | 1.79 | 1.59 | 1.48 | 1.39 |
| Meningitis, and diseases of the spinal cord | 99 | 86 | 80 | 81 | 77 | 0.61 | 0.52 | 0.47 | 0.46 | 0.43 |
| Intracranial lesions of vascular origin | 1,548 | 1,473 | 1,671 | 1,613 | 1,695 | 9.46 | 8.90 | 9.86 | 9.16 | 9.40 |
| Other diseases of the nervous system and organs of special sense | 245 | 250 | 212 | 180 | 156 | 1.50 | 1.51 | 1.25 | 1.02 | 0.86 |
| Diseases of the heart | 5,415 | 5,442 | 5,924 | 6,015 | 6,008 | 33.11 | 32.87 | 34.95 | 34.14 | 33.33 |
| Other diseases of the circulatory system | 240 | 245 | 300 | 263 | 262 | 1.47 | 1.48 | 1.77 | 1.49 | 1.45 |
| Bronchitis | 253 | 221 | 208 | 177 | 201 | 1.55 | 1.33 | 1.23 | 1.00 | 1.12 |
| Pneumonia and broncho-pneumonia | 763 | 755 | 720 | 840 | 750 | 4.66 | 4.56 | 4.25 | 4.77 | 4.16 |
| Other diseases of the respiratory system | 243 | 227 | 234 | 204 | 228 | 1.49 | 1.37 | 1.38 | 1.16 | 1.26 |
| Diarrhœa and enteritis | 154 | 176 | 239 | 159 | 127 | 0.94 | 1.06 | 1.41 | 0.90 | 0.70 |
| Appendicitis | 78 | 84 | 64 | 58 | 57 | 0.48 | 0.51 | 0.38 | 0.33 | 0.32 |
| Diseases of the liver and biliary passages | 109 | 117 | 130 | 121 | 98 | 0.66 | 0.71 | 0.77 | 0.69 | 0.54 |
| Other diseases of the digestive system | 335 | 333 | 376 | 306 | 334 | 2.05 | 2.01 | 2.22 | 1.74 | 1.85 |
| Nephritis | 450 | 461 | 442 | 475 | 414 | 2.75 | 2.78 | 2.61 | 2.70 | 2.30 |
| Other diseases of the genitourinary system | 241 | 236 | 258 | 215 | 245 | 1.47 | 1.43 | 1.52 | 1.22 | 1.36 |
| Puerperal infection | 33 | 43 | 29 | 35 | 18 | 0.20 | 0.26 | 0.17 | 0.20 | 0.10 |
| Other diseases of the puerperal state | 44 | 63 | 63 | 74 | 41 | 0.27 | 0.38 | 0.37 | 0.42 | 0.23 |
| Diseases of the skin and cellular tissue, and of the bones and organs of locomotion | 83 | 50 | 42 | 37 | 31 | 0.51 | 0.30 | 0.25 | 0.21 | 0.17 |
| Congenital debility, malformations, premature birth, and other diseases of early Infancy | 801 | 880 | 945 | 999 | 1,049 | 4.90 | 5.32 | 5.58 | 5.67 | 5.82 |
| Senility | 549 | 521 | 513 | 369 | 343 | 3.36 | 3.15 | 3.03 | 2.09 | 1.90 |
| Suicide | 134 | 158 | 182 | 173 | 140 | 0.82 | 0.95 | 1.07 | 0.98 | 0.78 |
| Homicide | 19 | 21 | 27 | 18 | 13 | 0.12 | 0.13 | 0.16 | 0.10 | 0.07 |
| Automobile accidents | 140 | 145 | 132 | 187 | 231 | 0.86 | 0.88 | 0.78 | 1.06 | 1.28 |
| Other accidental deaths | 720 | 587 | 520 | 586 | 566 | 4.40 | 3.55 | 3.07 | 3.33 | 3.14 |
| Cause of death not specified or ill-defined | 71 | 16 | 18 | 9 | 16 | 0.43 | 0.10 | 0.11 | 0.05 | 0.09 |
| Totals | 17,122 | 17,049 | 17,686 | 17,720 | 17,442 | 104.68 | 102.97 | 104.36 | 100.60 | 96.76 |
Although the incidence of different diseases as causes of death varies considerably as between the Maori and European sections of New Zealand's population, the only important disease to show a marked influence on the general death-rate by the inclusion of Maoris is tuberculosis. The average death-rate from tuberculosis (all forms) for the five years covered by the above table was 5.5 per 10,000 of mean population, as against 3.5 for the European death-rate. New Zealand has for many years had a comparatively low tuberculosis death-rate for the European section of its population, but when Maoris are included the latest quinquennial international figures available (1935–39) show New Zealand to be seventh out of a total of thirty-one countries. With Maoris excluded, New Zealand's position would be third for the same period.
TOTAL INFANT MORTALITY.—The establishing of the vital statistics of New Zealand on a total basis by the inclusion of Maoris has the greatest influence upon the infant-mortality rate. The infant-mortality rate of the European population of New Zealand held pride of place in the world for many years, and recently has declined to a particularly low level. The Maori rate, on the other hand, always a high one, has not shown any noticeable improvement in recent years. It is also subject to violent fluctuations owing to the ravages of certain epidemic diseases, which have relatively very little effect on the European rate. The European, Maori, and total infant-mortality figures for the last twenty years are given in the next table.
| Year. | Numbers. | Rates per 1,000 Live Births. | ||||
|---|---|---|---|---|---|---|
| European. | Maori. | Total. | European. | Maori. | Total. | |
| 1928 | 984 | 218 | 1,202 | 36.18 | 118.16 | 41.38 |
| 1929 | 912 | 174 | 1,086 | 34.10 | 78.52 | 37.50 |
| 1930 | 924 | 188 | 1,112 | 34.48 | 88.51 | 38.45 |
| 1931 | 856 | 221 | 1,077 | 32.15 | 95.59 | 37.22 |
| 1932 | 777 | 262 | 1,039 | 31.22 | 95.45 | 37.61 |
| 1933 | 770 | 273 | 1,043 | 31.64 | 92.61 | 38.23 |
| 1934 | 781 | 279 | 1,060 | 32.11 | 93.59 | 38.82 |
| 1935 | 773 | 355 | 1,128 | 32.26 | 109.20 | 41.45 |
| 1936 | 769 | 399 | 1,168 | 30.96 | 109.92 | 41.03 |
| 1937 | 812 | 366 | 1,178 | 31.21 | 92.17 | 39.29 |
| 1938 | 971 | 566 | 1,537 | 35.63 | 153.26 | 49.67 |
| 1939 | 898 | 473 | 1,371 | 31.14 | 114.92 | 41.61 |
| 1940 | 990 | 372 | 1,362 | 30.21 | 87.22 | 36.78 |
| 1941 | 1,045 | 517 | 1,562 | 29.77 | 125.06 | 39.81 |
| 1942 | 964 | 424 | 1,388 | 28.71 | 97.92 | 36.62 |
| 1943 | 951 | 399 | 1,350 | 31.37 | 89.86 | 38.85 |
| 1944 | 1,012 | 461 | 1,473 | 30.12 | 102.26 | 38.65 |
| 1945 | 1,036 | 413 | 1,449 | 27.99 | 88.93 | 34.77 |
| 1946 | 1,093 | 431 | 1,524 | 26.10 | 74.62 | 31.99 |
| 1947 | 1,122 | 365 | 1,487 | 25.04 | 73.18 | 29.86 |
The inclusion of Maoris not only places the infant-mortality rate for New Zealand on a considerably higher level, but also replaces the general downward movement by a much more fluctuating trend.
It also has a considerable effect on the position occupied by New Zealand among the countries of the world. In the quinquennium 1943–47, New Zealand's infant-mortality rate (exclusive of Maoris), with an average of 28, was the lowest of twenty-two countries for which reliable figures were available, whereas the inclusion of the Maori population relegated it to third place, with Sweden in the lead and Australia in second place.
DEATH-RATES are of great value as indicating the relative healthiness of different countries or of different years. The statistics of causes of deaths are of further use as showing the incidence of fatal diseases or accidents, and as indicating in a general way the relative rise or fall in the incidence of diseases over a series of years. For instance, the fall in the incidence of tuberculosis and the increase, in cancer (discussed in Subsection C of this section) can be readily traced from the records of deaths attributed to these causes in different years.
In comparisons of healthiness based on death-rates, however, the effect of the advance of medical science in recent years is not taken into account. It is common knowledge that many diseases regarded a few decades ago as incurable now show a fair percentage of recoveries. Similarly, the death-rates in epidemics are in general much lower now than formerly, owing partly to the steps taken to prevent the spread of the disease, partly to the necessity of early notification in most countries, and partly to increased medical knowledge. Again, many diseases seldom or never result fatally.
For the purpose of classification in the Census and Statistics Department, of data collected from the public hospitals, there has hitherto been no international morbidity classification list in existence. This has probably been due to the fact that no country, other than New Zealand, until recent years has compiled hospital statistics on a national basis at least as regards a detailed analysis of the diseases treated. In the field of mortality statistics, the International List of Causes of Death has been the standard classification code for the majority of countries for a considerable number of years. In order to preserve comparability with the mortality statistics, the Department, prior to 1943, used a modification of this List for the classification of its morbidity statistics. It has always been apparent, however, and increasingly so as the science of statistical analysis of disease has progressed, that a classification designed primarily for recording fatal illnesses must inevitably be inadequate for the multitudinous conditions and minor ailments and injuries that seldom or never have a fatal termination, but nevertheless require hospital treatment. In order to overcome this deficiency as far as possible, an adaptation of the “Manual for Coding Causes of Illness According to a Diagnosis Code for Tabulating Morbidity Statistics,” issued by the Public Health Service of the United States of America, was used in 1943 and subsequent years.
Late in 1946 a Committee was set up of representatives of the Royal Australasian College of Physicians, the Census and Statistics Department, and medical officers of the Department of Health to consider how the compilation of morbidity statistics could be further improved.
The Committee realized that the medical officers of hospitals required the assistance of a standard New Zealand nomenclature of disease as a guide in helping them to describe various states of illness in correct and acceptable terminology. This work has now been completed, and has been issued in two parts, Part I comprising an Introduction and Tabular List of Disease and Injury Categories, while Part II consists of a detailed Alphabetical Index of disease entities. This New Zealand classification is being used for the classification of diseases treated in the public hospitals of New Zealand as from 1st January, 1947.
The World Health Organization, at its assembly in July, 1948, adopted a new International Statistical Classification of Diseases, Injuries, and Causes of Death. This is a combined mortality and morbidity classification and replaces the existing International List of Causes of Death, as well as making provision for the classification of causes of sickness. This new International Classification will be used in New Zealand for morbidity statistics as from 1st January, 1950.
In New Zealand certain diseases are notifiable, but beyond this and the statistics of industrial accidents, given in Section 43, practically the only record other than that of fatality is the information ascertainable from the returns of patients treated in public hospitals. Information regarding benefits granted under the. Social Security Act is given in Section 25, and the sickness experience of friendly societies' members is mentioned briefly in Section 30. In the absence of full statistics of sickness, information from the sources mentioned is of considerable value.
NOTIFICATIONS OF DISEASES.—Four thousand and eight cases of notifiable diseases were reported in 1947, a decrease of 2,012 from the previous year's figure of 6,020. The principal diseases showing a decrease were diphtheria, with a decline of 1,071 cases; scarlet fever, 588; food poisoning, 223; and pulmonary tuberculosis, a fall of 134. Notifications of typhoid and paratyphoid fever increased by 57 and puerperal eclampsia by 41. These were the principal increases noted. Notifications of notifiable diseases during 1947 are shown for each month of the year in the following table.
| Disease. | January. | February. | March. | April. | May. | June. | July. | August. | September. | October. | November. | December. | Totals. |
|---|---|---|---|---|---|---|---|---|---|---|---|---|---|
| Scarlet fever | 57 | 55 | 72 | 68 | 105 | 71 | 91 | 71 | 80 | 74 | 62 | 60 | 866 |
| Diphtheria | 46 | 29 | 32 | 64 | 68 | 79 | 54 | 38 | 29 | 28 | 24 | 15 | 506 |
| Typhoid and paratyphoid fever | 2 | 3 | 4 | 5 | 2 | 1 | 1 | 3 | 2 | 38 | 39 | 6 | 106 |
| Pulmonary tuberculosis | 139 | 115 | 125 | 111 | 95 | 106 | 119 | 106 | 129 | 116 | 130 | 105 | 1,396 |
| Other tuberculosis | 35 | 33 | 23 | 26 | 14 | 23 | 25 | 13 | 29 | 25 | 21 | 29 | 296 |
| Meningococcus meningitis | 3 | 1 | 4 | 2 | 5 | 3 | 5 | 5 | 3 | 6 | 3 | 2 | 42 |
| Acute poliomyelitis | 3 | 1 | 2 | 1 | 1 | 1 | 17 | 104 | 130 | ||||
| Pneumonic influenza | 1 | 1 | 1 | 3 | |||||||||
| Erysipelas | 11 | 12 | 11 | 11 | 23 | 27 | 23 | 12 | 21 | 15 | 6 | 13 | 185 |
| Puerperal fever— | |||||||||||||
| Ordinary | 12 | 5 | 2 | 6 | 4 | 3 | 5 | 4 | 4 | 16 | 4 | 4 | 69 |
| Following abortion | 10 | 12 | 3 | 2 | 13 | 9 | 10 | 11 | 7 | 1 | 6 | 6 | 90 |
| Eclampsia | 4 | 6 | 5 | 3 | 11 | 14 | 12 | 7 | 9 | 6 | 8 | 11 | 96 |
| Tetanus | 2 | 2 | 4 | 1 | 1 | 2 | 1 | 5 | 18 | ||||
| Hydatids | 8 | 6 | 4 | 4 | 3 | 2 | 2 | 3 | 10 | 3 | 5 | 2 | 52 |
| Trachoma | 1 | 1 | 1 | 1 | 1 | 5 | |||||||
| Ophthalmia neonatorum | 1 | 1 | 1 | 3 | |||||||||
| Lethargic encephalitis | 1 | 1 | 2 | ||||||||||
| Food poisoning | 1 | 1 | 4 | 4 | 4 | 6 | 2 | 22 | |||||
| Bacillary dysentery | 2 | 8 | 8 | 4 | 10 | 4 | 5 | 5 | 3 | 4 | 53 | ||
| Amœbi dysentery | 1 | 3 | 3 | 1 | 2 | 3 | 2 | 1 | 3 | 2 | 21 | ||
| Undulant fever | 3 | 4 | 5 | 1 | 3 | 1 | 1 | 4 | 4 | 6 | 32 | ||
| Actinomycosis | 1 | 1 | |||||||||||
| Lead poisoning | 1 | 1 | 2 | ||||||||||
| Malaria | 4 | 3 | 1 | 2 | 1 | 1 | 12 | ||||||
| Totals | 343 | 296 | 311 | 317 | 357 | 350 | 363 | 288 | 330 | 345 | 337 | 371 | 4,008 |
The following were the notifications of principal diseases among Maoris daring 1947 and 1946, the latter being shown in parentheses: Diphtheria, 40 (106); typhoid and paratyphoid fever, 40 (49); pulmonary tuberculosis, 412 (449); other tuberculosis, 69 (51); meningococcus meningitis, 6 (13); hydatids, 8 (12); trachoma, 11 (16); bacillary dysentery, 78 (25); other, 30 (46): total, 694 (767).
The relative immunity of the Maori race to scarlet fever is shown by the figures of notifications for this disease during the years 1946 and 1947. In the former year there were 11 eases of scarlet fever reported in the Maori population, as compared with 1,454 in the remainder of the community, and in 1947, with 866 cases in the European population, only 5 Maoris were reported as having contracted this disease.
A quinquennial summary of notifications (exclusive of Maori notifications) of certain principal diseases is now given.
| Disease. | 1943. | 1944. | 1945. | 1946. | 1947. |
|---|---|---|---|---|---|
| Scarlet fever | 1,196 | 7,612 | 5,033 | 1,454 | 866 |
| Diphtheria | 830 | 693 | 996 | 1,577 | 506 |
| Typhoid and paratyphoid fever | 72 | 35 | 31 | 49 | 106 |
| Pulmonary tuberculosis | 1,749 | 1,501 | 1,722 | 1,530 | 1,396 |
| Meningococcus meningitis | 434 | 135 | 98 | 87 | 42 |
| Acute poliomyelitis | 178 | 45 | 14 | 112 | 130 |
| Erysipelas | 321 | 310 | 248 | 193 | 185 |
| Puerperal fever and septic abortion | 208 | 230 | 175 | 142 | 159 |
Meningococcus Meningitis.—Although epidemics of this disease are common in many countries, New Zealand is singularly free from severe outbreaks. The last noticeable epidemic was in 1943, when 434 cases were reported. In 1944 there were a further 135 cases, but since that year the annual number notified has rapidly decreased, there being only 42 cases in 1947.
Scarlet Fever.—.Scarlet fever no longer causes many deaths, but epidemics of the disease in a non-fatal form are not infrequent in New Zealand. The last severe outbreak commenced in the latter half of 1943, continued right through 1944 with a peak incidence of 999 cases in July. A high level of notifications was maintained during 1945, with a further peak of 655 cases in May. Since then the incidence rate has been comparatively low.
Diphtheria.—The last major epidemic of diphtheria occurred in 1917 (5,458 cases) and 1918 (5,539 cases). Incidence was comparatively high in 1915 and 1946, with 996 and 1,577 notifications respectively, but the 1947 figure of 506 was more in keeping with the average experience. There were 20 deaths from diphtheria in 1947, giving a case-fatality rate of 4.0 per cent. The incidence of diphtheria is much greater in the North Island than in the South Island, and in 1947 the North Island with two thirds of the population, had eight-ninths of the cases.
Venereal Disease.—In the early war years the incidence of venereal disease increased considerably but after 1941 there was an appreciable decrease. This trend was not sustained, however, and a new peak for gonorrhœa was reached in 1946, while the incidence of syphilis also increased substantially. The 1947 figures for both diseases showed some improvement. The following table shows the number of persons seen for the first time at the venereal-disease clinics in the four main centres of Auckland, Wellington, Christchurch, and Dunedin, during each of the years 1943–47, and found to be suffering from gonorrhœa or syphilis.
| — | Gonorrhœa | Syphilis. | ||||
|---|---|---|---|---|---|---|
| Males. | Females. | Total. | Males. | Females. | Total. | |
| 1943 | 576 | 637 | 1,213 | 114 | 153 | 267 |
| 1944 | 544 | 637 | 1,181 | 76 | 88 | 164 |
| 1945 | 762 | 542 | 1,304 | 114 | 68 | 182 |
| 1946 | 1,157 | 415 | 1,572 | 152 | 68 | 220 |
| 1947 | 1,106 | 390 | 1,496 | 107 | 89 | 196 |
Tuberculosis.—With an intensification of case-finding by all tuberculosis workers in recent years, the position regarding notification of tuberculosis has improved to a degree that enables a reasonable picture of the disease to be presented as it affects this country. From a study of the returns over the last few years, there is reason to believe that the annual increase in notifications of the disease has reached stability, and that an addition of approximately 250 cases (including Maoris) per year in the national total of notified cases can be expected. The Department of Health is continuing its efforts to reduce both incidence and mortality. The corps of District Health Nurses available for tuberculosis case-finding work has been increased, and hospital clinics in the charge of chest specialists have now been provided to give a wider coverage. The responsibilities of the Department of Health in case-finding and domiciliary care are being co-ordinated with that of the Hospital Boards, who are responsible for diagnosis and treatment.
The medical officers of the Department of Health assist the District Nurses in the examination of contacts and arrange tuberculin tests and x-ray examinations. One mass miniature x-ray unit has been in operation for over two years in Taranaki, and three other units have been ordered. Special investigation by these methods are directed towards those groups of the population which are likely to show a high incidence of the disease, and this type of work is being extended. Cases that are found to be tuberculosis, or suspected of having the disease, are referred to hospital chest clinics, who assess the diagnosis and prescribe treatment. The supervision of “after care” on discharge from a hospital or sanatorium then becomes the joint responsibility of the District Nurse and the hospital clinic staff.
The following figures reflect the work performed by the district nursing service and school medical officers in this connection during the five years 1943–47:—
| 1943. | 1944. | 1945. | 1946. | 1947. | |
|---|---|---|---|---|---|
| New tuberculous homes brought under control | 2,050 | 1,353 | 1,849 | 1,706 | 1,467 |
| Total number of homes under control | 6,865 | 6,164 | 8,991 | 9,595 | 9,070 |
| Number of new contacts examined and brought under control | 4,611 | 3,243 | 2,774 | 2,915 | 2,275 |
| Total number of contacts under super vision to be brought up for revision | 18,094 | 16,119 | 22,544 | 23,702 | 23,104 |
| Number of tuberculin tests | 1,822 | 417 | 495 | 476 | 1,019 |
| Number of positive reactors | 474 | 129 | 163 | 401 | 67 |
| Number of contacts x-rayed | 5,522 | 5,994 | 6,097 | 8,787 | 7,606 |
| Number of cases found among contacts as active from tuberculin testing and x-ray examination | 377 | 238 | 346 | 240 | 241 |
The Department of Health has established a Tuberculosis Register, which attempts to classify all known cases, and a clearer conception of the type, form, and extent of the disease is being obtained as workers become more accustomed to provide the necessary information. The number of cases on the Register (inclusive of Maoris) at 31st December, 1947, was 9,821, of which 8,435 were pulmonary, 1,146 non-pulmonary, and 240 mixed pulmonary and non-pulmonary. The number of new cases notified in 1947 was 2,174 of which 1,693 were European and 481 Maori. Of the European cases, 1,397 were pulmonary and 296 non-pulmonary, and in the Maori cases the figures were 412 and 69 for pulmonary and non-pulmonary respectively. Some of these cases have proved non-tuberculous and have been deregistered.
The known incidence for the European population is 4.36 per 1,000 of population, while for the Maori population it is 23.13 in the North Island and 27.99 in the South Island.
Information as to case-fatality in regard to the first three diseases mentioned in the table on page 94 is now given for each of the last eleven years.
| Year. | Scarlet Fever. | Diphtheria. | Typhoid and Paratyphoid Fever. | ||||||
|---|---|---|---|---|---|---|---|---|---|
| Cases notified. | Deaths. | Case-fatality. | Cases notified. | Deaths. | Case-fatality. | Cases notified. | Deaths. | Case-fatality. | |
| Per Cent. | Per Cent. | Per Cent. | |||||||
| 1937 | 924 | 6 | 0.65 | 599 | 24 | 4.01 | 55 | 9 | 16.36 |
| 1938 | 662 | 2 | 0.30 | 786 | 31 | 3.94 | 64 | 8 | 12.50 |
| 1939 | 480 | 2 | 0.42 | 517 | 24 | 4.64 | 61 | 4 | 6.56 |
| 1940 | 357 | 1 | 0.28 | 367 | 15 | 4.09 | 59 | 6 | 10.17 |
| 1941 | 338 | 2 | 0.59 | 383 | 17 | 4.43 | 56 | 7 | 12.50 |
| 1942 | 457 | 1 | 0.22 | 542 | 24 | 4.43 | 66 | 8 | 12.12 |
| 1943 | 1,196 | 2 | 0.17 | 830 | 32 | 3.86 | 72 | 3 | 4.17 |
| 1944 | 7,612 | 27 | 0.35 | 693 | 30 | 4.33 | 35 | 3 | 8.57 |
| 1945 | 5,033 | 13 | 0.26 | 996 | 42 | 4.22 | 31 | 3 | 9.68 |
| 1946 | 1,454 | 1 | 0.07 | 1,577 | 49 | 3.11 | 49 | 7 | 14.29 |
| 1947 | 866 | 506 | 20 | 3.95 | 106 | 9 | 8.49 | ||
In diseases of this nature, comparatively wide year to year fluctuations in the numbers affected are inevitable.
PUBLIC HOSPITALS: PATIENTS TREATED.—The public hospitals to which the following statistics relate include all hospitals under the control of the various Hospital Boards; several hospitals which are also old people's homes; special infectious diseases hospitals; the various tuberculosis institutions and special sanatoria; and such public maternity hospitals as also have provision for emergency general cases. Special military hospitals, and additions made to hospitals to accommodate military patients only, were also included during the war years. All St. Helens Hospitals, private hospitals, and solely maternity hospitals, are excluded. Out-patients are not covered by the statistics, which, however, relate to all inpatients—whether European or Maori. Inmates of old people's homes or infirmaries controlled by the Hospital Boards, for whom hospital benefits under the Social Security Act are payable for treatment received in such homes, are included in the statistics of patients treated.
During the year 1947 the total admissions to public hospitals in New Zealand numbered 151,544. There were 8,882 patients in hospital at the beginning of the year, the total cases dealt with during the year thus being 160,426, equal to 890 per 10,000 of mean population, including Maoris. In other words, the equivalent of one person out of every eleven in New Zealand received some degree of treatment in public hospitals in 1947, although, of course, the total of cases mentioned includes an unknown number of multiple admissions of the same persons.
The following table shows for each of the last eleven years the total number of patients treated, and the proportion of population.
| Year. | Total Patients treated. | Rate per 10,000 of Mean Population. |
|---|---|---|
| 1937 | 98,235 | 618 |
| 1938 | 107,323 | 668 |
| 1939 | 112,502 | 690 |
| 1940 | 127,839 | 781 |
| 1941 | 139,486 | 855 |
| 1942 | 171,483 | 1,046 |
| 1943 | 160,118 | 979 |
| 1944 | 160,990 | 972 |
| 1945 | 163,653 | 966 |
| 1946 | 163,558 | 929 |
| 1947 | 160,426 | 890 |
From 1932 to 1942 there was a continuous and substantial increase in the number of patients treated, with the one exception of 1937, when a small decrease of 200 was recorded. In 1938 the epidemic of measles with its accompaniments of ear troubles and respiratory diseases (chiefly broncho-pneumonia and pneumonia) accounted for nearly 6,000 of the 9,000 increase of that year. The further gain of 5,000 in 1939 cannot be attributed specifically to any disease or group of diseases, and it seems probable that some of this increase may have had its origin in the introduction of the hospital benefit under the social security scheme. This benefit, particulars of which may be found in Section 25, came into operation on 1st July, 1939.
The tremendous increases during the next three years can probably be attributed partly to the same cause, but the great majority of these increases were due to the admissions of Armed Services personnel, particularly in 1942, when the number of persons under arms in New Zealand was greatly increased consequent upon the entry of Japan into the war. In general, all military personnel ill over forty-eight hours were transferred to hospital, and outbreaks of such minor epidemic diseases as measles, chicken-pox, mumps, &c., commonly associated with military camps, would result in a great number of persons entering hospital who, in normal times, would be treated in their own homes. The great bulk of such cases were transferred to emergency wards of public hospitals adjacent to the camps.
The figures would also include a substantial number of patients who entered hospital for remedial treatment to enable them to be passed fit for military service. Members of the Services returned from overseas who were admitted to public hospitals for further treatment are also included. The decrease in the total for 1943 no doubt reflects the beginning of the decline in the numbers of mobilized forces in New Zealand.
It is probable that there would have been a further decrease in the number of hospital patients in 1944 but for the severe epidemic of scarlet fever experienced in that year.
Hospital staff problems necessitating the closing of wards in some cases and the introduction of a system of waiting-lists for non-urgent cases has kept the numbers of in-patients down in the post-war years.
Information concerning the members of the Armed Forces treated in public hospitals was not collected in 1940 (the first year of the war), but in each of the following four years the number discharged from, or dying in, these hospitals was as follows: 1941, 13,660; 1942, 44,435; 1943, 22,989; 1944, 12,378. Seventy-two females were included in the total for 1941, 523 in 1942, 1,278 in 1943, and 720 in 1944.
Condition on Discharge.—Of the 163,558 persons treated as in-patients in public hospitals in 1946, 90,233 were discharged as recovered, 48,094 as relieved, and 8,639 as unrelieved. Deaths in hospital numbered 7,710 and 8,882 patients were still in hospital at the end of the year. The tabulation for 1947 had not been completed when this section was prepared.
The numbers of admissions, discharges, and deaths for each of the last five years available were:—
| Year. | Admissions. | Discharges. | Deaths. | Total Discharges and Deaths. | ||
|---|---|---|---|---|---|---|
| Recovered. | Relieved. | Unrelieved. | ||||
| 1942 | 164,418 | 110,269 | 39,495 | 6,929 | 7,073 | 163,766 |
| 1943 | 152,379 | 89,849 | 46,928 | 6,970 | 7,372 | 151,119 |
| 1944 | 151,991 | 91,029 | 44,752 | 8,216 | 7,478 | 151,475 |
| 1945 | 154,413 | 89,480 | 48,229 | 8,819 | 7,939 | 154,467 |
| 1946 | 155,074 | 90,233 | 48,094 | 8,639 | 7,710 | 154,676 |
The following percentage analysis of total cases dealt with during each of the five years is of interest.
| Year. | Discharged as | Died. | Remaining at End of Year. | ||
|---|---|---|---|---|---|
| Recovered. | Relieved. | Unrelieved. | |||
| 1942 | 64.30 | 23.03 | 4.04 | 4.13 | 4.50 |
| 1943 | 56.12 | 29.31 | 4.35 | 4.60 | 5.62 |
| 1944 | 56.54 | 27.80 | 5.10 | 4.65 | 5.91 |
| 1945 | 54.68 | 29.47 | 5.39 | 4.85 | 5.61 |
| 1946 | 55.17 | 29.40 | 5.28 | 4.71 | 5.44 |
Sexes of Patients.—For many years males considerably outnumbered females among hospital patients. In 1932, for the first time, and in each of the three following years, females were in the majority. From 1935 onwards, however, the proportion of males again showed a tendency to increase. This excess of male patients became especially pronounced in the figures for 1940 and the succeeding three years, reflecting the largo number of military patients admitted to hospital during these years. The peak in this connection was reached in 1942, in which year 101,279 males and 62,487 females were discharged from, or died in, public hospitals. By 1944, the number of males had fallen to 76,306, a decrease of 24.7 per cent., but the number of females involved had risen to 75,169, an increase of 20.3 per cent. Since 1944 the male total has been fairly consistent, but females have tended to increase in numbers, probably affected to a certain extent by the increased facilities offered by public hospitals for normal maternity cases. The death-rate is invariably higher among male than among female patients, chiefly due to a higher average incidence of serious types of diseases and of accident cases among male patients. The large number of military personnel admitted to hospital for comparatively minor complaints, however, resulted in a greatly decreased male death-rate during the four years ended in 1943, and in 1942 the female death-rate exceeded that for males. The decline of the numbers of men in the Armed Forces stationed in New Zealand from 1943 onwards would result in the proportion of minor cases treated in hospital falling considerably. This factor, combined with a greater number of seriously wounded men returning from overseas probably accounts for the increase of the male case-fatality rate in later years as compared with 1942.
| Year. | Discharges and Deaths. | Deaths. | Death-rate per 1,000 Cases. | |||||
|---|---|---|---|---|---|---|---|---|
| Males. | Females. | Males per 100 Females. | Males. | Females. | Males per 100 Females. | Males. | Females. | |
| 1936 | 46,941 | 46,341 | 101 | 2,973 | 1,979 | 150 | 63 | 43 |
| 1937 | 47,025 | 45,834 | 103 | 3,257 | 2,017 | 161 | 69 | 44 |
| 1938 | 51,091 | 50,564 | 104 | 3,583 | 2,376 | 151 | 70 | 47 |
| 1939 | 54,172 | 52,513 | 103 | 3,378 | 2,190 | 154 | 63 | 42 |
| 1940 | 64,753 | 56,502 | 115 | 3,501 | 2,324 | 151 | 54 | 41 |
| 1941 | 71,374 | 61,126 | 117 | 3,836 | 2,675 | 143 | 54 | 44 |
| 1942 | 101,279 | 62,487 | 162 | 4,187 | 2,886 | 145 | 41 | 46 |
| 1943 | 82,100 | 69,019 | 119 | 4,295 | 3,077 | 140 | 52 | 45 |
| 1944 | 76,306 | 75,169 | 102 | 4,400 | 3,078 | 143 | 58 | 41 |
| 1945 | 77,947 | 76,520 | 102 | 4,633 | 3,306 | 140 | 59 | 43 |
| 1946 | 76,443 | 78,233 | 98 | 4,360 | 3,350 | 130 | 57 | 43 |
Ages of Patients.—The ages of patients who were discharged from or who died in public hospitals during 1946 were as shown in the following summary. The proportions of the population at each group which the discharges and deaths represented are also given.
| Ages of Patients, in Years. | Males. | Females. | Total. | Proportion per Cent. of Total Population. | ||
|---|---|---|---|---|---|---|
| Males. | Females. | Total. | ||||
| Under 5 | 9,631 | 7,373 | 17,004 | 10.20 | 8.15 | 9.20 |
| 5 and under 10 | 7,230 | 5,674 | 12,904 | 9.19 | 7.40 | 8.31 |
| 10 and under 15 | 4,587 | 3,633 | 8,220 | 6.83 | 5.65 | 6.25 |
| 15 and under 25 | 13,056 | 17,194 | 30,250 | 9.69 | 12.37 | 11.05 |
| 25 and under 35 | 11,516 | 17,368 | 28,884 | 8.67 | 12.65 | 10.70 |
| 35 and under 45 | 7,958 | 9,610 | 17,568 | 6.47 | 8.13 | 7.28 |
| 45 and under 55 | 6,248 | 5,733 | 11,981 | 6.73 | 5.97 | 6.34 |
| 55 and under 65 | 6,662 | 5,017 | 11,679 | 8.10 | 6.11 | 7.11 |
| 65 and over | 9,518 | 6,583 | 16,101 | 12.91 | 8.49 | 10.64 |
| Totals (including unspecified) | 76,443 | 78,233 | 154,676 | 8.69 | 8.87 | 8.78 |
In normal years there is a pronounced excess of females over males in the age-groups 25–34 and 35–44. This is attributable to the fact that these two age-groups contain the majority of the very large numbers of women admitted to public hospitals for normal confinement or for treatment of diseases and accidents of pregnancy, labour, and the puerperal state. In 1939 the number of male patients in the 25–34 age-group was 7,854 and the proportion per cent. of the total male population of those ages 5.78, as compared with 11,516 and 8.67 per cent. respectively in 1946. The corresponding figures for female patients in 1939 were 11,442 and 8.85 per cent., and in 1946, 17,368 and 12.65 per cent.
Principal Diseases.—A summary is now given of the principal diseases treated in public hospitals during the year 1944, the latest year for which detailed statistics of diseases treated are available. All figures given (including deaths) are inclusive of Maoris.
It should be noted that the disease or condition for the treatment of which a patient is admitted to hospital is not necessarily that which would rank as the cause of death in the death statistics. Cystitis, for instance, ranks comparatively high in hospital cases as the condition immediately affecting the patient, but is frequently only the consequence of some more important disease, which would take precedence over cystitis in the statistics of causes of death. Generally speaking, the hospital returns show only the immediate or final disease or condition for which the patient is treated, and classification for statistical purposes is generally made regardless of the primary cause of that disease or condition. In the death statistics, on the other hand, the primary cause of decease is of paramount importance. In the hospital statistics a case admitted on account of the fracture of any bone is treated and classified as “fracture.” Should the patient die, however, the death would be classified in the mortality statistics according to the cause of the fracture—e.g., motor-car accident, accidental fall, &c. The morbidity code, with a few exceptions and a considerable extension of the accident group, follows the mortality code fairly closely, and a comparison of the morbidity and mortality statistics can be obtained without difficulty.
SUMMARY OF PRINCIPAL DISEASES TREATED IN PUBLIC HOSPITALS DURING 1944
| Diseases. | Total Deaths Registered. | Total Cases in Public Hospitals. | Deaths In Public Hospitals. | ||
|---|---|---|---|---|---|
| Number. | Proportion of Total Deaths. | Proportion of Total Cases in Public Hospitals. | |||
*See letterpress ante. | |||||
| Per Cent. | Per Cent. | ||||
| Typhoid and paratyphoid fever | 12 | 91 | 10 | 83.33 | 10.99 |
| Meningococcus meningitis | 23 | 149 | 18 | 78.26 | 12.08 |
| Measles | 51 | ||||
| Scarlet fever | 27 | 5,606 | 11 | 40.74 | 0.20 |
| Whooping-cough | 92 | 386 | 26 | 28.26 | 6.74 |
| Diphtheria | 37 | 694 | 33 | 89.19 | 4.76 |
| Influenza | 91 | 1,313 | 6 | 6.59 | 0.46 |
| Erysipelas | 2 | 276 | 2 | 100.00 | 0.72 |
| Acute poliomyelitis | 6 | 76 | 5 | 83.33 | 6.58 |
| German measles | 43 | ||||
| Mumps | 1 | 213 | |||
| Pulmonary tuberculosis | 775 | 3,375 | 489 | 63.10 | 14.49 |
| Tuberculous meningitis | 76 | 37 | 18 | 23.68 | 48.65 |
| Other forms of tuberculosis | 123 | 975 | 91 | 73.98 | 9.33 |
| Venereal diseases | 101 | 770 | 47 | 46.53 | 6.10 |
| Septicæmia (non-puerperal) | 20 | 77 | 34 | * | 44.16 |
| Hydatids | 17 | 120 | 11 | 64.71 | 9.17 |
| Cancer | 2,231 | 3,676 | 1,135 | 50.87 | 30.88 |
| Non-malignant tumours | 66 | 2,369 | 39 | 59.09 | 1.65 |
| Diabetes | 331 | 1,291 | 145 | 43.81 | 11.23 |
| Exophthalmic goitre | 66 | 841 | 28 | 42.42 | 3.33 |
| Leukæmia and aleukæmia | 63 | 95 | 44 | 69.84 | 46.32 |
| Diseases of the spinal cord | 45 | 27 | 3 | 6.67 | 11.11 |
| Intracranial lesions of vascular origin | 1,473 | 1,477 | 783 | 53.16 | 53.01 |
| Diseases of the heart | 5,442 | 4,234 | 1,454 | 26.72 | 34.34 |
| Diseases of the arteries | 196 | 340 | 90 | 45.92 | 26.47 |
| Bronchitis | 221 | 1,987 | 83 | 37.56 | 4.18 |
| Broncho-pneumonia | 429 | 1,655 | 279 | 65.03 | 16.86 |
| Pneumonia | 326 | 2,904 | 174 | 53.37 | 5.99 |
| Pleurisy | 37 | 819 | 29 | 78.38 | 3.54 |
| Asthma | 35 | 1,066 | 21 | 60.00 | 1.97 |
| Ulcer of the stomach and duodenum | 131 | 1,689 | 81 | 61.83 | 4.80 |
| Diarrhœa and enteritis | 176 | 2,023 | 88 | 50.00 | 4.35 |
| Appendicitis | 84 | 5,457 | 61 | 72.62 | 1.12 |
| Hernia, intestinal obstruction | 130 | 3,237 | 100 | 76.92 | 3.09 |
| Diseases of the liver (excluding hydatids) | 42 | 122 | 18 | 42.86 | 14.75 |
| Diseases of the gall-bladder and biliary passages | 75 | 2,154 | 48 | 64.00 | 2.23 |
| Peritonitis | 14 | 271 | 21 | * | 7.75 |
| Nephritis | 461 | 649 | 197 | 42.73 | 30.35 |
| Urinary calculi | 16 | 726 | 5 | 31.25 | 0.69 |
| Diseases of the bladder | 13 | 615 | 20 | * | 3.25 |
| Diseases of the prostate | 128 | 818 | 100 | 78.13 | 12.22 |
| Diseases of the female genital organs | 11 | 4,311 | 11 | 100.00 | 0.26 |
| Septic abortion | 21 | 180 | 11 | 52.38 | 6.11 |
| Other puerperal diseases and accidents (including normal childbirth) | 85 | 12,868 | 49 | 57.65 | 0.38 |
| Diseases of the skin | 25 | 7,775 | 22 | 88.00 | 0.28 |
| Osteomyelitis | 16 | 879 | 18 | * | 2.05 |
| Congenital malformations | 255 | 1,139 | 99 | 38.82 | 8.69 |
| Diseases of early infancy | 625 | 808 | 156 | 24.96 | 19.31 |
| External causes | 911 | 16,836 | 393 | 43.14 | 2.33 |
| Other diseases | 1,466 | 51,885 | 872 | 59.48 | 1.68 |
| Totals | 17,049 | 151,475 | 7,478 | 43.86 | 4.94 |
Armed Forces: Patients treated.—In an endeavour to obtain some measure of the influence on the hospital population statistics of the admission of Armed Services personnel, figures have been extracted for 1941, 1942, 1943, and 1944 of the numbers of such patients discharged from or dying in the public hospitals of New Zealand during those years, according to disease treated and the age of the patient. The figures for 1944 are given in the following table, while those for 1941, 1942, and 1943 were published in the 1944, 1945, and 1946 editions of the Year-Book respectively.
| Diseases. | Under 25. | 25 and under 35. | 35 and under 45. | 45 and under 55. | 55 and Over. | Totals.* | Military Patients Per Cent. of Total Patients Treated. |
|---|---|---|---|---|---|---|---|
* Including 15 males, the ages of whom were not specified. | |||||||
| Numbers | |||||||
| I. Infective and parasitic diseases | 724 | 598 | 180 | 43 | 7 | 1,552 | 10.23 |
| II. Neoplasms | 70 | 107 | 53 | 25 | 13 | 268 | 4.69 |
| III. Rheumatic fever, diseases of the endocrine glands and nutrition, and other general diseases | 44 | 57 | 36 | 10 | 1 | 148 | 3.95 |
| IV. Diseases of the blood and blood-forming organs | 4 | 8 | 4 | 1 | 17 | 2.98 | |
| V. Chronic poisoning and intoxication | 10 | 8 | 5 | 23 | 9.70 | ||
| VI. Diseases of the nervous system and sense organs including mental disorders | 340 | 483 | 229 | 54 | 16 | 1,124 | 10.50 |
| VII. Diseases of the circulatory system | 96 | 198 | 129 | 76 | 27 | 526 | 6.04 |
| VIII. Diseases of the respiratory system | 745 | 661 | 252 | 85 | 21 | 1,764 | 7.44 |
| IX. Diseases of the digestive system | 414 | 569 | 350 | 113 | 39 | 1,485 | 7.46 |
| X. Diseases of the genitourinary system | 206 | 230 | 103 | 34 | 16 | 589 | 5.45 |
| XI. Deliveries and complications of pregnancy, childbirth, and the puerperium | 22 | 17 | 2 | 41 | 0.31 | ||
| XII. Diseases of the skin | 283 | 296 | 135 | 34 | 5 | 755 | 9.71 |
| XIII. Diseases of the bones and organs of movement | 270 | 396 | 189 | 34 | 7 | 897 | 18.32 |
| XIV. Congenital malformations | 27 | 20 | 4 | 51 | 4.48 | ||
| XVI. Other and ill-defined diseases | 187 | 203 | 117 | 28 | 7 | 542 | 15.91 |
| XVII. Injuries and poisonings | 864 | 1,015 | 283 | 48 | 17 | 2,237 | 13.29 |
| XVIII. Other enumerated conditions, without sickness | 125 | 161 | 55 | 17 | 1 | 359 | 8.20 |
| Totals | 4,431 | 5,027 | 2,126 | 601 | 178 | 12,378 | 8.17 |
| Percentage at each Age-group | |||||||
| I. Infective and parasitic discuses | 40.65 | 38.53 | 11.60 | 2.77 | 0.45 | 100.00 | |
| II. Neoplasms | 26.12 | 39.92 | 19.78 | 9.33 | 4.85 | 100.00 | |
| III. Rheumatic fever, diseases of the endocrine glands and nutrition, and other general diseases | 29.73 | 38.51 | 24.32 | 6.76 | 0.68 | 100.00 | |
| IV. Diseases of the blood and blood-forming organs | 23.53 | 47 06 | 23.53 | 5.88 | 100.00 | ||
| V. Chronic poisoning and in-toxication | 43.48 | 34.78 | 21.74 | 100.00 | |||
| VI. Diseases of the nervous system and sense organs including mental disorders | 30.30 | 43.05 | 20.42 | 4.81 | 1.42 | 100.00 | |
| VII. Diseases of the circulatory system | 18.25 | 37.65 | 24.52 | 14.45 | 5.13 | 100.00 | |
| VIII. Diseases of the respiratory system | 42.23 | 37.47 | 14.29 | 4.82 | 1.19 | 100.00 | |
| IX. Diseases of the digestive system | 27.88 | 38.31 | 23.57 | 7.61 | 2.63 | 100.00 | |
| X. Diseases of the genitourinary system | 34.97 | 39.05 | 17.49 | 5.77 | 2.72 | 100.00 | |
| XI. Deliveries and complications of pregnancy, childbirth, and the puerperium | 53.66 | 41.46 | 4.88 | 100.00 | |||
| XII. Diseases of the skin | 37.58 | 39.31 | 17.93 | 4.52 | 0.66 | 100.00 | |
| XIII. Diseases of the bones and organs of movement | 30.13 | 44.20 | 21.09 | 3.80 | 0.78 | 100.00 | |
| XIV. Congenital malformations | 52.94 | 39.22 | 7.84 | 100.00 | |||
| XVI. Other and ill-defined diseases | 34.50 | 37.45 | 21.59 | 5.17 | 1.29 | 100.00 | |
| XVII. Injuries and poisonings | 38.79 | 45.58 | 12.71 | 2.16 | 0.76 | 100.00 | |
| XVIII. Other enumerated conditions, without sickness | 34.82 | 44.84 | 15.32 | 4.74 | 0.28 | 100.00 | |
| Totals | 35.84 | 40.66 | 17.20 | 4.86 | 1.44 | 100.00 | |
The total of 12,378 Armed Forces personnel treated in hospital in 1944 represents 8 per cent. of the total hospital population for that year, corresponding figures for 1943 being 22,989 and 15 per cent. respectively. Of the total military patients treated in 1944, 11,658 were males, this figure being 15 per cent. of the total male patients treated in hospital during the year. In the previous year, the number of male military patients was 21,711, and the proportion to total male patients was 26 per cent. It should be noted that the figures include members of the services returned from overseas who have been admitted to public hospitals for further treatment.
Summary of Diseases, &c.—The following table covers all patients discharged from or dying in public hospitals during the year 1944, which is the latest year for which such figures were available.
| Class. | Discharges. | Deaths. | Total Discharges and Deaths. | ||||
|---|---|---|---|---|---|---|---|
| Recovered. | Relieved. | Unrelieved. | Males | Females. | Males. | Females. | |
| I. Infective and parasitic diseases | 9,213 | 4,138 | 979 | 484 | 353 | 7,881 | 7,286 |
| II. Neoplasms | 1,542 | 2,020 | 919 | 739 | 492 | 2,769 | 2,943 |
| III. Rheumatic fever, diseases of the endocrine glands and nutrition, and other general diseases | 1,378 | 1,882 | 258 | 80 | 148 | 1,404 | 2,342 |
| IV. Diseases of the blood and blood-forming organs | 110 | 351 | 47 | 28 | 35 | 244 | 327 |
| V. Chronic poisoning and intoxication | 126 | 90 | 19 | 2 | 206 | 31 | |
| VI. Diseases of the nervous system and sense organs, including mental disorders | 4,172 | 4,043 | 1,420 | 521 | 486 | 5,899 | 4,743 |
| VII. Diseases of the circulatory system | 2,854 | 3,901 | 349 | 1,013 | 597 | 4,995 | 3,719 |
| VIII. Diseases of the respiratory system | 18,074 | 4,450 | 507 | 427 | 264 | 12,660 | 11,062 |
| IX. Diseases of the digestive system | 13,699 | 4,990 | 753 | 282 | 179 | 11,216 | 8,687 |
| X. Diseases of the genitourinary system | 6,269 | 3,547 | 622 | 258 | 112 | 3,821 | 6,987 |
| XI. Deliveries and complications of pregnancy, childbirth, and the puerperium | 11,815 | 1,063 | 110 | 60 | 13,048 | ||
| XII. Diseases of the skin | 5,640 | 2,005 | 108 | 12 | 10 | 4,670 | 3,105 |
| XIII. Diseases of the bones and organs of movement | 1,713 | 2,723 | 401 | 29 | 30 | 3,306 | 1,590 |
| XIV. Congenital malformations | 347 | 553 | 140 | 51 | 48 | 694 | 445 |
| XV. Diseases peculiar to the first year of life | 508 | 128 | 16 | 91 | 65 | 443 | 365 |
| XVI. Other and ill-defined diseases | 1,738 | 1,152 | 327 | 126 | 63 | 1,921 | 1,485 |
| XVII. Injuries and poisonings | 9,373 | 6,596 | 474 | 257 | 136 | 12,340 | 4,496 |
| XVIII. Other enumerated conditions, without sickness | 2,458 | 1,120 | 767 | 1,837 | 2,508 | ||
| Totals | 91,029 | 44,752 | 8,216 | 4,400 | 3,078 | 76,306 | 75,169 |
DEVELOPMENT OF PUBLIC HEALTH SERVICES IN NEW ZEALAND.—Before 1872 there was no public health service in New Zealand. A few local authorities appear to have exercised a crude form of negative sanitary government, but otherwise little seems to have been done. Certainly no attempt was made to cope with outbreaks of diseases, even when they assumed epidemic proportions.
In 1872 the first Public Health Act became law. Under it a Central Board of Health was set up in each province and power was given to each Central Board to set up Local Boards of Health as required.
The Central Boards each consisted of the Provincial Superintendent, the Provincial Executive Council, and three other members. They acted mainly in a supervising capacity and took little active part in initiating or controlling preventive health measures. They were required to make periodical reports to the Governor of the colony, but, in fact, few were made.
The local Board of Health was usually the local authority for the area concerned. The Board was usually financed from rates, though if appointed by the Central Board it could be financed by parliamentary appropriation. In general its function was to administer the Public Health Act in its district, and it had power to appoint a medical adviser who was in all cases a part-time officer.
The abolition of the provinces in 1876 brought the disappearance of the provincial Central Boards of Health and the establishment of one Central Board of Health for the whole colony. Otherwise there was practically no change in the system which had existed since 1872.
The first period of public health administration in New Zealand came to an end in 1900. It is doubtful whether at any time during these twenty-eight years the administration of the 1872 Act and the later consolidating Act of 1876 was marked by much energy or thoroughness. Local Boards were hampered by lack of finance and by lack of zeal and knowledge. The powers of their Medical Officers (where appointed) were limited, and often the advice given by these officers was disregarded. The incidence of typhoid fever, a good index to the sanitary standards of a community,' remained high throughout the whole of this period.
In 1900 the outbreak of bubonic plague in Australia stimulated the authorities to action. In that year a Bubonic Plague Prevention Act was passed which, later in the same year, was repealed and embodied in the Public Health Act, 1900. Under this Act public health administration in New Zealand was put on a much more satisfactory basis. A separate Department of Public Health was set up under its own Minister; the country was divided into a number of health districts, and properly trained and qualified staff were appointed to administer the Act. In the years following the establishment of the Department steady progress was made in the building-up of a public health organization. Acts were passed dealing with the sale of food and drugs; the registration of medical practitioners, pharmacists, nurses and midwives, plumbers; the prevention of quackery; and the control of venereal disease. Sanatoria were established to help in the prevention and treatment of tuberculosis. Attention was given to problems of maternal welfare. Medical supervision of schoolchildren came into operation, at first under the control of the Education Department, though in 1921 it was transferred to the Health Department.
In 1909 a closer link between curative and preventive medicine was forged by merging the Hospitals and Charitable Aid Department into the Department of Public Health's organization.
During the years 1900 to 1920 there was also an increasing public interest being taken in health matters. As a result a number of voluntary health organizations were established with the objects of diffusing knowledge of infant welfare, first aid, and home nursing.
The 1918–19 influenza epidemic brought to light a number of defects in the public health organization, particularly the need for a simplification of existing health legislation and the need for a clear definition of the duties of local authorities, Hospital Boards, and the Department of Health. The result of this experience was the passing of the Health Act, 1920, under which, with its amendments, the Department of Health has since operated.
Following the passing of this Act, new health districts were created and the existing activities of the Department were expanded. Among the more important of the new activities of the Department were the establishment of a School Dental Service in 1920, the building-up of health publicity work, and, in 1937, the institution of the Medical Research Council. Registration was also widened to include dentists, opticians, and masseurs.
The interest of the general public in health matters continued to expand after 1920, and was marked by the establishment of additional voluntary health organizations.
Recent developments have included a more positive attack on the problem of tuberculosis marked by the passing of the Tuberculosis Act, 1948, and the completion of plans for the establishment of a National Health Institute. At the end of 1947 the Mental Hospitals Department ceased to be a separate Department of State, and became the Division of Mental Hygiene of the Department of Health.
A more detailed outline of the development of public health services in New Zealand up to 1939 will be found in the annual report of the Department of Health for that year.
PRESENT ORGANIZATION OF PUBLIC HEALTH SERVICES.—Local Authorities: Part II of the Health Act, 1920, lays definite obligations on local authorities in regard to public health. Each local authority must either appoint its own Sanitary Inspectors or contribute to the salary of an Inspector of the Department of Health. Each Inspector must hold a certificate of the Royal Sanitary Institute (or certain equivalents) before he can be appointed. A local authority's responsibility in health matters is wide. It must promote and conserve the public health within its district—a function which includes regular inspections of its district; abatement of nuisances as defined in the Health Act; provision of efficient refuse, nightsoil, and sanitary services; protection and purification of water-supplies; closing and demolition of insanitary buildings; registration and regulation of cattle saleyards; and the enforcement of certain minimum sanitary requirements for residences and business premises. It may also make by-laws dealing with public health matters.
In certain circumstances some local authorities may be exempted from the above duties, but in such cases the Health Department must do whatever is necessary for the promotion and conservation of public health in that district. All expenses incurred are recoverable from the local authority concerned.
Department of Health: The chief administrative officer of the Department is the Director-General of Health. He is assisted by two Deputy Directors, and the work of the Department is divided among the following Divisions—Public Hygiene, Hospitals, Child Hygiene, Nursing, Health Benefits, Tuberculosis, Maternal Welfare, Dental Hygiene, and Industrial Hygiene. There is also the Division of Mental Hygiene, the activities of which are described in Subsection C. New Zealand as a whole is divided into fourteen health districts, each under the control of a Medical Officer of Health, who must be a medical practitioner with special qualifications in sanitary science.
The Department is required to take whatever steps are necessary to secure the preparation, effective carrying out, and co-ordination of measures necessary to promote public health. It administers all Acts relating to public health; it advises local authorities on matters relating to public health; it must do whatever is possible to prevent, limit, or suppress disease; it promotes research into matters connected with public health and the prevention and treatment of disease; it conducts health publicity and organizes and controls medical, dental, and nursing services paid for from public funds. With the authority of the Minister, a Medical Officer of Health may exercise very wide powers in the event of an outbreak of infectious disease, including the requisitioning of land and buildings, prohibition of public gatherings, and controlling the movements of cases and contacts of any infectious disease. Certain diseases, mostly infectious, but including some non-communicable, must be notified by medical practitioners. Provisions relating to quarantine are included in the Health Act; and extensive power is given to make regulations relating to the conservation and promotion of public health.
The Department's organization includes a Board of Health, which usually acts in an advisory capacity, but may in certain circumstances require local authorities to carry out prescribed works.
In addition to the Health Act, 1920, a full summary of which is given in the 1927 issue of the Year-Book, the following Acts are administered by the Department:—
| Hospitals Act, 1926. | Opticians Act, 1928. |
| Food and Drugs Act, 1947. | Dentists Act, 1936. |
| Dangerous Drugs Act, 1927. | Medical Advertisements Act, 1942. |
| Poisons Act, 1934. | Cemeteries Act, 1908. |
| Nurses and Midwives Act, 1945. | Social Hygiene Act, 1917. |
| Medical Practitioners Act, 1914. | King George V Memorial Fund Act, |
| Medical Act, 1908. | 1938. |
| Masseurs Registration Act, 1920. | Social Security Act, 1938 (Part III). |
| Plumbers Registration Act, 1912. | Tuberculosis Act, 1948. |
A detailed report of the activities of the Department of Health is given year by year in the annual report of the Director-General of Health (parliamentary paper H–31).
The actual expenditure on the activities of the Department of Health for the years ended 31st March, 1947 and 1948, and the estimated expenditure for the year ended 31st March, 1949, are given in the following table.
| — | Expenditure, Year Ended 31st March, 1947. | Expenditure, Year Ended 31st March, 1948. | Estimated Expenditure, Year Ended 31st March, 1949. |
|---|---|---|---|
* Increase due to hospital levy on local authorities being limited to 0.5d. in the pound. | |||
| £ | £ | £ | |
| Salaries, departmental officers | 531,898 | 589,580 | 657,237 |
| Health education and publicity | 21,129 | 23,743 | 26,000 |
| Medical bursaries | 19,417 | 19,072 | 21,015 |
| Supply of milk to school-children | 228,232 | 235,650 | 244,000 |
| Subsidies under Hospitals Act | 1,899,197 | 3,148,375* | 4,500,425* |
| Medical research work | 19,031 | 19,328 | 20,223 |
| Grants to voluntary organizations | 52,921 | 60,308 | 78,146 |
| Departmental institutions | 161,216 | 179,734 | 222,320 |
| Other costs of administration | 476,803 | 442,943 | 499,074 |
| Expenditure from Consolidated Fund | 3,409,844 | 4,718,733 | 6,268,440 |
| Maternity benefits | 672,989 | 800,030 | 881,000 |
| Medical benefits | 1,760,574 | 2,167,826 | 2,480,000 |
| Hospital benefits | 1,986,288 | 1,949,489 | 2,000,000 |
| Pharmaceutical benefits | 1,439,686 | 1,558,350 | 1,701,000 |
| Supplementary benefits | 352,043 | 545,793 | 750,000 |
| Expenditure from Social Security Account | 6,211,580 | 7,021,488 | 7,812,000 |
| Total expenditure by Department | 9,621,424 | 11,740,221 | 14,080,440 |
In accordance with an amendment to the Health Act, 1920, as from 25th November, 1947, the Mental Hospitals Department became the Division of Mental Hgyiene of the Department of Health. The above figures do not include expenditure on mental hygiene, which, for the year ending 31st March, 1949, was estimated to amount to £1,488,812.
PUBLIC HEALTH ACTIVITIES IN NEW ZEALAND.—In this section an account is given of work undertaken in New Zealand which is related to public health. Information on activities related to “curative” medicine is set out in other sections of this volume—vide Section 5B (Hospitals) and Section 60 (Mental Hospitals). Information on medical, hospital, and other related benefits, which are administered by the Department of Health, is given in Section 25 (Social Security, Pensions, Superannuation, &c).
PUBLIC HYGIENE is concerned more particularly with the control of infectious disease, environmental hygiene, the sale of foods and drugs, dangerous drugs and poisons and cemeteries and crematoria.
Disease: The control of disease is based on a system of notification of certain diseases which has been in force in New Zealand for many years. The list has undergone several alterations, and at present is as follows:—
Notifiable infectious diseases mentioned in Part I of First Schedule of Health Act, 1920:—
Anthrax. Plague (bubonic or pneumonic). Cerebro-spinal fever (cerebro-spinal meningitis). Puerperal fever (puerperal septicæmia and puerperal sapræmia). Cholera. Streptococcal sore throat (including scarlet fever). Dengue. Diphtheria. Smallpox (variola, including varioloid, alastrim, amaas, Cuban itch, and Philippine itch). Enteric fever (typhoid fever, paratyphoid fever). Erysipelas. Typhus. Leprosy. Yellow fever. Infectious diseases declared notifiable by Gazette notice:—
Dysentery (amœbic and bacillary). Undulant fever. Encephalitis lethargica. Septicæmia consequent on abortion or miscarriage. Fulminant influenza. Pneumonic influenza. Puerperal fever involving any form of puerperal sepsis other than or in addition to puerperal septicæmia and puerperal sapræmia. Septicæmic influenza. Ophthalmia neonatorum. Acute poliomyelitis (infantile paralysis). Trachoma (granular conjunctivitis, granular ophthalmia, granular eyelids). Any form of sepsis or sapræmia following abortion or miscarriage. Notifiable diseases, other than infectious, mentioned in the Second Schedule to the Act:—
Actinomycosis. Food poisoning (botulismus, ptomaine poisoning). Ankylostomiasis (hookworm disease). Bilharziosis (endemic hæmaturia, Chronic lead poisoning. Egyptian hæmaturia). Phosphorus poisoning. Beriberi Tetanus. Hydatids. Notifiable diseases, other than infectious, declared by Gazette notice:—
Eclampsia. Malaria.
Tuberculosis (all forms) is now notifiable under the Tuberculosis Act, 1948.
Social Hygiene: In November, 1924, syphilis, gonorrhœea, and soft chancre were declared to be infectious diseases within the meaning of the Health Act, 1920, and in July of the following year provision was made for the compulsory notification of those diseases in certain circumstances, and for the treatment of those affected by venereal disease in a communicable form. In the Health Amendment Act, 1940, gonorrhœa, syphilis, and soft chancre were added to the list of other infectious diseases included in Part II of the First Schedule to the Act, thus strengthening the control of these diseases.
In December, 1941, regulations were issued under the Health Act, 1920, with the object of controlling venereal disease, and which at the same time revoked the Social Hygiene Regulations 1925. Under the Venereal Diseases Regulations 1941 a very thorough system has been instituted to ensure that persons suffering from venereal disease receive proper treatment. Restrictions are also placed on the nature of the employment such persons may undertake if they are suffering from the diseases in a communicable form.
In the administration of the regulations, every precaution is taken to ensure secrecy and the avoidance of publicity.
Environmental Hygiene is concerned with the provision and proper maintenance of public water-supplies and sewerage systems, the disposal of refuse, the condition of dwellinghouses, the control of offensive trades, and the hygiene of premises in which food is manufactured and sold, including eating-houses. These matters are primarily the responsibility of the local authorities, but the Department of Health has an overriding authority and acts in a general advisory capacity. In the case of many of the smaller local authorities the necessary inspections are made by departmental Inspectors on behalf of and by arrangement with the local authorities.
Food and Drugs: Legislation relating to the sale of food and drugs has been in force since 1908. The Act at present in force was passed in 1947. It provides for the analysis, by analysts appointed under the Act, of any article of food or drink, or of any drug, which may be sold, offered for sale, or exposed for sale, and for the inspection of any place where there is any food or drug intended for sale. If any such article be proved to be unfit for human consumption, or likely to cause injury to health if consumed, heavy penalties may be inflicted on the person or persons responsible. Stringent measures are provided for the prevention of adulteration of food, drink, or drugs, and for the inspection of places where such goods are manufactured or packed.
Considerable progress has been made in implementing the purposes of the Act. All the commonly used foodstuffs are standardized, and the labelling of packages is controlled by regulations, which are revised and added to as the necessity arises. Regular sampling of foods, particularly milk, is undertaken by departmental Inspectors, and these samples are analysed in the Dominion Laboratory and its branch laboratories.
An important provision of the Act controls all kinds of publicity concerning any food or drug whereby a purchaser would possibly be deceived in regard to the properties of such food or drug, whether or not it is standardized by regulation. This matter is also covered by the Medical Advertisements Act, 1942, which is referred to later.
The definition of “drug” includes medicines used externally or internally by man—anæsthetics, soaps, ointments, and disinfectants.
Any person may, on payment of the prescribed fee, together with the cost of the sample, require any authorized officer to purchase a sample of any food and submit it for analysis.
A new power contained in the 1947 Act enables any drug to be withheld from the public except when prescribed by a doctor, dentist, or veterinary surgeon.
Dangerous Drugs and Poisons: In order to carry out New Zealand's obligations under international conventions relating to habit-forming drugs, the Dangerous Drugs Act, 1927, was enacted. The dealing in and the use of prepared opium are prohibited, and the production, manufacture, sale, and distribution of other dangerous drugs are restricted to persons licensed by the Director-General of Health. The importation of these drugs is controlled by the Customs Department. Provision is made to prevent illicit traffic in drugs of a habit-forming nature. Suitable regulations are in force to give effect to the provisions of the Act, and are similar to the regulations in the United Kingdom and Australia.
The Poisons Act, 1934, controls the proper labelling and packing of poisons, and in particular requires that all liquid poisons be packed in bottles of distinctive colour and shape. It is an offence to pack poisons in bottles that are ordinarily used for food, drink, or medicine. The Act also provides for the control of certain poisonous drugs by preventing their sale to the public except on the prescription of a doctor, a dentist, or a veterinary surgeon. The regulations under the Poisons Act follow closely the corresponding legislation in force in the United Kingdom.
Hydatid Prevention: In January, 1937, an amendment to the Dogs Registration Act, 1908, came into force requiring local authorities to keep a supply of approved remedies for the care or prevention of disease in dogs caused by infection from the parasite echinococcus granulosus. At the time of registration every person registering a dog receives a sufficient amount of an approved remedy to enable him to treat the dog every three months until the ensuing date of registration, and also printed instructions for the use of the remedy. The approved remedy at present supplied is arecoline hydrobromide. The Act is administered by the Department of Internal Affairs.
Medical Advertisements Act, 1942: This Act, which repealed the Quackery Prevention Act, 1908, came into force in January, 1943. Under it the word “advertisement” is defined broadly, but does not include any advertisement or scientific matter distributed only to members of professions concerned with the health of the human body.
The Act sets up a Medical Advertisements Board, which is given power to control all medical advertisements. The Board may require the claims or statements made or implied in any medical advertisement to be substantiated to its satisfaction. Subsequent publication of such an advertisement is prohibited until after the Board has notified its decision. For the purpose of protecting the public, the Board is given power to publish privileged statements concerning the subject-matter of any medical advertisement.
Regulations issued under the Act limit the nature of the subject-matter which may be included in any medical advertisement, and include a list of diseases concerning which no advertisement may make a claim to cure. Cemeteries: The law governing burial and cremation in New Zealand is found in the Cemeteries Act, 1908, and its amendments of 1912, 1922, and 1926. The Cemeteries Amendment Act, 1926, transferred the work of administration from the Minister of Internal Affairs to the Minister of Health, one of the objects being to utilize the services of Inspectors of Health in giving closer attention to matters for which a field staff is essential.
Widespread provision for cemeteries has been made in the past by the reservation of areas of Crown land for this purpose, but apart from this the Cemeteries Act makes it clear that local authorities are charged with ensuring that in their districts there exists adequate provision for the disposal of the dead.
In most rural areas and in the smaller centres the local authority either acts as trustee or else has been delegated the power of appointing individual trustees to carry out the provisions of the Act. For some cemeteries established on Crown reserves, trustees are appointed by the Governor-General. In the larger centres local authorities-have acquired land for the establishment of cemeteries.
In regard to cremation, the law provides that this method of disposal may be carried out subject to the prior condition that the deceased was not known to have loft any written direction to the contrary and also subject to the condition that the cremation is effected in conformity with the regulations. The latter impose stringent precautions against cremation being used for any criminal purpose. Crematoria have been established in Auckland, Wellington, Christchurch, Dunedin, Hastings, and Nelson.
CHILD HYGIENE.—The Division of Child Hygiene is responsible for the supervision of all measures for safeguarding the health of school-children and ensuring a satisfactory environment at school. The medical oversight of pre-school children, from age eighteen months is also provided for.
The professional staff of the Division consists of a Director, who is a medical practitioner, and fourteen full-time and twelve part-time School Medical Officers. The medical officer in charge of a health district is responsible, within the limits of the policy laid down and the instructions he receives, for the direction and control of all child hygiene work done in his district.
The Division aims at giving each primary-school child at least three physical examinations during his primary-school life. The first, as an entrant, is carried out-by the School Medical Officer, and the others, in Standard 2 and Form II, by the District Nurse, who refers any departure from normal for a special examination by the School Medical Officer. Special medical examinations by the School Medical Officer are also made whenever parents, teachers, the District Nurse, or the School Medical Officer consider them to be necessary. Children found to be suffering from defects are kept under observation until the necessary treatment is obtained. Mentally backward and feeble-minded children are given special attention, arrangements being made for their entry into special schools, special classes, or other institutions as may be necessary.
An effort is being made to have each pre-school child examined once a year, but if the child is normal and of good physique this period may be lengthened and the parent asked to return only if the child shows any departure from normal in the meantime. The examination of pre-school children is carried out at kindergartens and, assisted by the District Nurse, at school clinics, or at Plunket Rooms in conjunction with the Plunket Nurses.
Recently a start has been made on the medical examination of post-primary school children and of physically handicapped children enrolled with the Education Department's Correspondence School.
Throughout its work the Division tries to secure the interest and co-operation of parents, because only in this way can the work be made effective. With this object in view parents are invited to be present at the medical examination of their children, an opportunity of which the majority take advantage.
Prevention of Disease: The activities of the Division are not confined to the routine medical examination of school-children. In addition, certain positive measures are taken to prevent disease and correct physical defects. The more important of these measures are—
Typhoid Inoculations.—Maori children in the North Island are inoculated annually against the typhoid group of diseases.
Diphtheria Immunization.—Protection against diphtheria is a routine procedure and is provided for by a home visit from the District Nurse, who will herself immunize the child at age from six months to twelve months, or arrange for a medical practitioner to do so. Diphtheria immunization of children who have been missed during the first year of life is undertaken by medical officers at the pre-school clinics. Booster doses are also given by the medical officers when the child enters school.
Vaccination against Whooping-cough is offered at pre-school clinics to children six months to two years of age.
Goitre Control.—The use of iodized salt and iodine-rich foods are advocated by the officers of the Division.
The Milk-in-schools Scheme and the establishment of Health Camps, which aim at the maintenance or restoration of the body.
The object of the Milk-in-schools Scheme is to supply to each school-child in New Zealand half a pint of high-grade pasteurized milk on each day the school is open. The milk is delivered at the school bottled and is consumed through a straw from the original container. To ensure that the milk delivered to the schools is of the best possible quality, the sources of supply are inspected regularly and the processing and distribution of the milk is subject to close supervision. If for any reason it is not possible to supply a school with milk under the scheme, then powdered malted milk is supplied, provided that it can be served under hygienic conditions.
Health camps cater for delicate and undernourished children. The service selects the children to attend the camps and, as necessary, re-examines them before admission and after discharge. In the camps the children live under an orderly and disciplined routine, they eat plain, well-cooked food, and they get plenty of rest and sunshine. In practically all cases a child who attends a health camp benefits both physically and mentally.
DENTAL HYGIENE.—Dental Treatment of School Children: The New Zealand School Dental Service, instituted in 1921, is conducted by the Dental Division of the Department of Health. By the end of 1947 school dental clinics had been established at 476 centres and further expansion was being continued. Each clinic deals with the children of certain specified schools in its vicinity, and these are organized into a “dental group.” Local administration of clinics is in the hands of a dental clinic committee, composed of parents and other local residents. Treatment of the children in the clinics is carried out by School Dental Nurses specially trained for this work by the Department. For this purpose there is a modern well-equipped Training School at Wellington.
At the end of March, 1948, the staff of the School Dental Service numbered 709, including 202 student Dental Nurses in training. At the same date, 233,981 children belonging to 2,331 schools were under systematic treatment at the various clinics. With the consent of their parents, children are brought under treatment while they are in the primer classes, but the attendance of pre-school children is also encouraged. Children who attend are kept dentally fit until they leave primary school. For this purpose they are re-examined at six-monthly intervals and necessary treatment is carried out.
Particular attention is given to instructing children in the principles of dental hygiene, and the Department aims at securing the co-operation of both the children and their parents in the endeavour to reduce the prevalence of dental disease.
During the year 1947 the staff of the Dental Division gave 8,530 talks, addresses, and other forms of educational activity.
The following is a summary of the treatment performed in the Service during the year 1947: fillings, 1,109,512; extractions, 66,750; other operations, 422,720: making a total of 1,598,982 operations.
Adolescent Dental Service: The dental service for adolescents was inaugurated on the 1st February, 1947. Pending the development of a salaried Dental Service, dental care for adolescents is being provided by private practitioners as a dental benefit under the Social Security Act, the practitioners being reimbursed on a fee-for-service basis. The intention is ultimately to provide dental care for adolescents until they reach nineteen years of age, but in the meantime the age is limited to the sixteenth birthday. There are two classes of dental benefits: (a) general and (6) special:—
Persons eligible for enrolment for general benefits are (i) those who, being under sixteen years of age, have been discharged from a school dental clinic on passing out of the highest class under treatment, and who apply for enrolment for dental benefits within three months of being so discharged; and (ii) those who, being under sixteen years of age, submit a certificate of dental fitness signed by a registered dental practitioner. (Children who are eligible for enrolment at a school dental clinic and fail to so enrol are not eligible for general dental benefits at the hands of a private practitioner.)
Special dental benefits include types of treatment which are not specified in the schedule to the Social Security (Dental Benefit) Regulations but which are usually given in a normal conservative dental practice. Those eligible for special dental benefits are (i) persons who are on the roll of a school dental clinic (these may be enrolled for treatment that is not available at such clinics) and (ii) persons who are enrolled with a private dental practitioner for general dental benefits. In all cases applications for special dental benefits must be approved by the Department.
At the 31st March, 1948, the numbers of adolescents enrolled for dental benefits were—
| For general dental benefits | 43,231 |
| For special dental benefits | 8,903 |
TUBERCULOSIS.—Prior to 1928 the attack on tuberculosis in New Zealand was largely confined to the treatment of cases that were suffering from the disease in an advanced form and little emphasis was laid on the need to direct intensive efforts to limit its spread.
Tuberculosis clinics had been set up in Dunedin, Christchurch, and Wellington, but in their respective communities these could serve only a limited number of the tuberculosis population who could not gain admission to an institution.
In 1928 a Commission of Inquiry was sot up at the request of the Minister of Health. While the Commission's findings could not be implemented immediately, the Department endeavoured to control the disease from a public health point of view and devoted special attention to the Maori people, in whom, it was anticipated, the incidence and mortality from tuberculosis would be high.
In 1935 a special research into the tuberculosis morbidity and mortality of the Maori people was conducted in the East Const area of the North Island and the results showed that in this area the incidence of the disease was high. Subsequent surveys of the Maori population in other areas have confirmed these findings.
Although the falling tendency in the tuberculosis death-rate amongst Europeans was an encouragement, and suggested that the combined measures of preventing the spread of the disease were becoming effective, the stationary position of the high death-rate for Maoris also indicated that control should be continued and intensified.
Consequently, arrangements were made with those Hospital Boards which had not already done so to establish tuberculosis clinics under competent tuberculosis physicians. These clinicians visited outlying areas to conduct clinics at the smaller hospitals.
At this time special attention was given by School Medical Officers of the Department and a few private practitioners to the prevention of the spread of the disease amongst children. The children's health camp movement also commenced and the District Nursing Service was expanded to embrace the field of the domestic control of tuberculosis patients.
Tuberculosis has always been recognized in New Zealand as a chronic epidemic disease associated with some overcrowding, which is conducive to its spread in families. A measure of success has been achieved in providing more and better homes for the people and in raising the general standard of living of the population as a whole.
Respiratory tuberculosis has been a notifiable disease since 1906, but in order to ascertain its true extent all forms of the disease were made notifiable by a Notifiable Disease Order in 1940.
In 1943 a Division of Tuberculosis was set up, as recommended by the 1928 Commission.
It became apparent from the activities of this Division that additional legal authority was necessary to that already in existence in order to effect a policy of full control, and in 1948, the Tuberculosis Act, largely a consolidation measure but with additions, was passed to assist a policy similar to that recommended to all countries by the World Health Organization and based on the following ideals:—
“To find every case of tuberculosis in the community.”
Following on more accurate notification and registration, the New Zealand Act should provide for more efficient case-finding. More cases should be found early from amongst contacts of the notified cases.
“To classify notified cases into two categories—
“(a) Those who may spread the infection to others,
“(b) Those who need only regular supervision and control.”
The provisions allowing for the examination of certain presumed healthy groups of the community, by tuberculin testing and mass radiography, will, no doubt, assist in bringing to light a number of early cases which otherwise would remain undiscovered.
“To segregate and control the active infectious cases in Hospitals or Sanatoria, or in their own homes.”
The regulations under the Act are designed to provide a uniform standard of classification and to allow revision of all cases at regular intervals by the chest clinics and private practitioners. The desirable segregation and control of all active infectious cases, although incapable of full realization because of the present bed and housing shortage, will be assisted to a certain degree by other measures in the Act.
“To teach individual patients the nature of their affliction, and how they can prevent the spread of their infection to others.”
“To review all inactive cases at regular intervals to ensure that they have not developed the infectious type of the disease.”
“To attempt to rehabilitate the convalescent or arrested case of tuberculosis in a graded and suitable form of employment while undergoing regular medical supervision.”
The participation of patients in the provisions of the Social Security Act, 1938, should greatly assist in returning them to a suitable form of occupation as soon as possible.
The measures of the Tuberculosis Act to limit the spread of the disease should generally be an important factor in helping to reduce its morbidity and mortality.
The provisions to introduce prophylactic inoculation against the disease by licensed vaccinators to those who desire it should also assist in limiting tuberculosis morbidity.
MATERNAL WELFARE.—Maternal- and infant-welfare work in New Zealand is based on co-operation between the Department of Health, Hospital Boards, the medical profession, and the Plunket Society.
The Director of Maternal Welfare is a medical practitioner. He supervises the inspection of maternity hospitals, the techniques in use in these hospitals, and, generally, the promotion of all aspects of maternal welfare.
The Medical Officers of Health, through their staff of Nurse Inspectors, exercise a general supervision over the work of midwives and a close control over the conduct of the many private hospitals throughout the country.
Less than one-tenth of the total confinements take place in private homes. The great majority take place in one of the various types of maternity hospitals—a St. Helens Hospital, a public hospital maternity annexe, or a private maternity hospital. Except in an emergency, no one other than a registered midwife or a registered maternity nurse is permitted to nurse a woman in childbirth.
Important contributions to maternal welfare are made by the Division of Nursing, which includes in its duties the supervision of the training of midwives and maternity nurses, and by the Hospitals Division, which includes in its duties the approval of plans for accommodation to be provided by the various types of maternity hospital. The work of these two Divisions is surveyed elsewhere in this section.
INDUSTRIAL HYGIENE.—In 1944, a Medical Inspector of Factories in Great Britain, was seconded to the Department of Health in order to undertake a survey of conditions of work in New Zealand factories. In his report he suggested “that consideration be given to the formation within the Department of Health of a Division of Industrial Hygiene to include the factory inspectorate, relieved of all other duties and to administer those parts of a new Factories Act and such other legislation as is concerned with the health, welfare, and safety of the industrial worker.”
The principle of a Division of Industrial Hygiene is now accepted, and the Factories Act, 1946, section 78, gives to Medical Officers of Health or other authorized officers of the Department of Health the same powers and authorities as Inspectors of Factories.
The first medical appointment to the new Division was made during 1946, the appointee taking up his duties in January, 1947. Subsequently, approval was obtained for the appointment of four additional industrial medical officers, one to work in each of the four main centres. Two of these medical officers commenced duty in 1948, one in Wellington and one in Christchurch, and the remaining two are expected to commence early in 1949.
In 1947, for the first time, an industrial nursing course was incorporated into the syllabus of the Post-graduate Nurses' Training School. Three nurses took this course, and at the end of the year, when they had completed their training, two of these were appointed to the Health Department to work in the Wellington area. Two nurses who took the course in 1948 were appointed to the Auckland and Christchurch areas respectively. These nurses have had special training in blood examination of workers at risk from lead-absorption, and their duties include the monthly blood examination of such workers, required under the Lead Processes Regulations. It is hoped in time that other groups of workers at special risk from health hazards, such, for example, as those in plating-shops, will be included under the regular supervision of the nurses, and that they will be available for any special work that may be required in looking after juveniles, pregnant women, or other physically handicapped workers.
In addition, a number of industrial nurses are employed by private firms, the establishments in which they work employing on an average three hundred to four hundred workers. A Nurse Inspector appointed by the Department of Health regularly visits these nurses in order to advise them in their work and to co-ordinate and broaden the conception of a health service in industry. A refresher course held in 1948 was attended by over 70 per cent of the nurses employed in industry.
A prominent characteristic of the diversification of New Zealand industry is that it is of recent growth and is contained in small units. Thus of 19,000–odd factories registered at 31st March, 1948, 10,600 employed not more than ten workers, and half of these employed only one or two. In many of the small factories, on account of the high per caput cost, amenities tend to be of a lower standard than in the average large factory. A substantial proportion of small factories, in addition to a number of the larger ones, fail to conform to Factories Act standards, and the first objective of the Industrial Health Service, therefore, must be to assist the Labour Department in establishing the minimum standards required by the Act.
The Division has also the more confined objective of guarding the health of those workers who are exposed to the special health risks, such as those handling lead salts, or liable to breathe dangerous fumes, or those who are in contact with skin-irritants. Inevitably, there is a great deal of ignorance and lack of consciousness on the part of management and workers of the dangers and hazards associated with their work. Education on these matters, together with publicity and propaganda, will do much to raise the level of understanding, and is property a function of the Division.
The Division is concerned with the health of all workers, not merely those covered by the Factories Act, and from time to time surveys will need to be undertaken of working-conditions in specific industries. As a result of inspections and reports on conditions of work of waterside workers at Wellington and Lyttelton, industrial health centres have been set up at each of these ports, staffed by the Department's industrial nurses and under the supervision of the industrial medical officer for the area.
NURSING.—The Nursing Division is responsible for the supervision of the training, the examination, and the registration of the following classes of hospital employees:—
Nurses.
Maternity nurses.
Midwives.
Nursing aides.
Psychiatric nurses.
Male nurses.
Hospital dietitians.
Masseurs.
Occupational therapeutists.
Post-graduate training for selected registered nurses is conducted at the Post-graduate School, Wellington, the courses given at present being—
Public health nursing.
Hospital and nursing school administration.
Industrial nursing.
Medical-social work.
Obstetrical nursing.
In addition, post-certificate courses are given at several of the main hospital centres in—
Plunket nursing.
Plastic surgical nursing.
Neuro-surgical nursing.
Housekeeping duties.
Regular inspection of all public hospitals, including those which are training schools, is carried out. The Division also organizes and controls the district nursing services conducted by the Department of Health and it supervises the district nursing services conducted by the various Hospital Boards throughout New Zealand.
MEDICAL RESEARCH COUNCIL.—The Medical Research Council was established in 1938. The Council is closely associated with the Department of Health, its function being to promote and correlate medical research work being done in New Zealand. The Council sets up ad hoc committees as the need arises to control and direct the research work it promotes. At the end of 1948, research in the following subjects was in progress:—
| Microbiology. | Neuropathology and neurophysiology. |
| Tuberculosis. | Dentistry. |
| Clinical medicine. | Obstetrics. |
| Nutrition. | Thyroid. |
In addition, the Council co-operates in the research work being carried out by the Travis Trust Laboratory for tuberculosis research and the New Zealand Branch of the British Empire Cancer Campaign Society.
REGISTRATION COUNCILS AND BOARDS.—Medical Practitioners: Under the Medical Practitioners Act, 1914, as amended by the Medical Practitioners Amendment Act, 1924, is constituted the Medical Council of New Zealand, consisting of the Director-General of Health and six other registered medical practitioners. One of the six members is appointed on the recommendation of the New Zealand Branch of the British Medical Association.
The Council deals with all applications for registration under the Act, which prescribes that every person shall be entitled to registration who satisfies the Council that he is a graduate in medicine and surgery of the University of New Zealand; or registered on the register kept in accordance with the provisions of the Acts regulating the registration of medical practitioners in the United Kingdom, or eligible for registration on such last-mentioned register; or the holder, after a course of not less than five years' study, of a foreign diploma approved by the Council. The Council may, however, refuse to approve any diploma (even in the case of persons registered or eligible for registration in the United Kingdom) unless it appears that Now Zealand graduates are, without further examination, entitled to registration in the country granting the diploma. It may also require the holder of a foreign diploma to pass an examination in medicine and surgery to be prescribed and conducted by the Senate of the New Zealand University.
An applicant who is refused registration as a medical practitioner has the right of appeal to the Supreme Court. The fee for registration is £1 for each qualification, with a minimum of £2, payable on deposit of evidence of qualification. Under the Finance Act, 1932–33 (No. 2), an annual practising certificate (fee, 5s.) is required.
The Medical Council is vested with disciplinary powers, including the suspension of a medical practitioner from practice. Right of appeal to the Supreme Court is provided. The Supreme Court, on the motion of the Medical Council, may order the removal of a name from the register in cases where a medical practitioner is guilty of grave misconduct, or is convicted of an indictable offence punishable by imprisonment with hard labour for a term of two years or upwards. The number of medical practitioners on the register at 31st August, 1948, was 2,235. During the year 1947–48 the names of 41 practitioners were removed and 188 added, 110 of the latter having Now Zealand qualifications.
Dentists: The Dentists Act, 1936, provides for the constitution of a Dental Council consisting of—
The Director-General of Health.
Two dentists appointed on the recommendation of the Minister of Health.
One dentist, being a member of the Faculty of Dentistry in the University of Otago, appointed on the recommendation of the Minister.
One dentist appointed upon election by postal vote of those dentists whose registered addresses are in the North Island.
One dentist appointed upon election by postal vote of those dentists whose registered addresses are in the South Island.
One medical practitioner, being a member of the Faculty of Medicine in the University of Otago, appointed on the recommendation of the Minister.
One medical practitioner nominated in that behalf by the New Zealand Branch of the British Medical Association and appointed on the recommendation of the Minister.
Every adult person is entitled to be registered as a dentist who satisfies the Dental Council that he is the holder of a qualification in dentistry obtained from the University of New Zealand; or that he is the holder of a qualification approved by the Dental Council and obtained from a University or other institution in the United Kingdom or in some other part of the British Commonwealth (in the latter case, however, the Council may require a further examination); or the holder of an approved foreign qualification, but the Council may refuse to approve any foreign qualification if New Zealand graduates in dentistry are not accepted for registration without further examination in the country concerned, or the Council may require the applicant to pass a further examination.
Application for registration should be made to the Director-General of Health. The fee for initial registration is £2. If a provisional practising certificate is required, there is a further fee of 5s. A fee of £1 per annum is payable for an annual practising certificate.
The number of dentists on the register at 1st September, 1948, was 832.
Nurses, Midwives, and Maternity Nurses: Under the Nurses and Midwives Act, 1945, is constituted the Nurses and Midwives Board, consisting of the Director-General of Health (Chairman), the Director, Division of Mental Hygiene, the Registrar (Director, Division of Nursing), one registered medical practitioner, a representative of the Hospital Boards' Association of New Zealand, two registered nurses, one registered midwife, and one registered psychiatric nurse. Members other than official members are appointed on the recommendation of the Minister of Health, the nursing personnel being nominated by the New Zealand Registered Nurses' Association.
The functions of the Board are—
To determine the courses of training and instruction to be undergone by candidates for examination.
To approve hospitals and other institutions at which training or any portion of training may be received.
To conduct examinations; to appoint examiners and make all necessary arrangements for examinations; to issue suitable certificates of registration.
To receive applications for registration and to authorize registration in proper cases.
To have regard to the conduct of persons registered under the Act, and, within the scope of its authority, to do whatever may be necessary for the effective administration of the Act.
Under the Act, regulations authorized by the Governor-General by Order in Council may be made, the current regulations being the Nurses and Midwives Regulations 1947.
Registration.—The Nurses and Midwives Act, 1945, requires that the following registers be kept by the Registrar, who is defined by the Act as the person who holds the position of Director, Division of Nursing—
Register of Nurses.
Register of Midwives and Maternity Nurses.
Register of Male Nurses.
Register of Psychiatric Nurses.
Register of Nursing Aides.
Every person trained in New Zealand who satisfies the Board that she or he has served the stipulated training period, has passed the prescribed qualifying examination, and has complied with the other conditions laid down by the Act is entitled to have her or his name entered in the appropriate register. In addition, persons trained outside New Zealand who satisfy the Board that their training and qualifications are equal to the equivalent New Zealand training and qualifications are entitled to be registered in the appropriate New Zealand registers.
In the case of Now-Zealand-trained nurses the fee payable for the qualifying examination includes the registration fee. Overseas-trained nurses whose applications for registration have been approved by the Board are required to pay a fee of £1 for the initial qualification and a further fee of 10s. for each additional qualification.
The total number of names on the various registers as at 31st March, 1948, was—
| Nurses | 3,500 | |
| Midwives | 1,018 | |
| Maternity nurses | 1,586 | |
| 2,604 | ||
| Male nurses | 65 | |
| Psychiatric nurses | 440 | |
| Nursing aides | 49 |
Masseurs: Under the Masseurs Registration Act, 1920, and the Masseurs-Registration Amendment Act, 1924, is constituted the Masseurs Registration Board, consisting of the Registrar, two persons engaged in the practice of massage in New-Zealand, and one registered medical practitioner.
The Board has regard to the training, examination, registration, and conduct of persons engaged in training or in the practice of massage in New Zealand.
The period of training is three years. Full-time training for male and female students at the New Zealand School of Physiotherapy, Dunedin, occupies two and a half years of the course, with a period of six months' training at a public hospital approved by the Board as a subsidiary training school. At the conclusion of the course of training, students are required to pass the State Examination in Massage in order to qualify for registration. The fee payable for examination is £3.
The Finance Act, 1932–33, provides for the compulsory application for an annual practising certificate by every person registered under the Act and engaged in the practice of massage. The fee payable is 10s. per annum.
The Act provides for the admission to the register of New-Zealand- and overseas-trained personnel, the registration fee in all cases being £3. The New Zealand Government has approved of the granting of bursaries to enable registered masseuses to undertake study in England in order to gain the qualification of Teacher of the Chartered Society of Physiotherapy.
Opticians: The Opticians Act, 1928, provides for the constitution of an Opticians Board, consisting of the Director-General of Health (the Registrar), three persons engaged in practice as opticians in New Zealand (one of whom must be practising as an employee of another registered optician), and a registered medical practitioner with special knowledge of diseases of the eyes.
The Board deals with all applications for registration under the Act. On payment of the prescribed fee (£5), every person is entitled to registration as an optician who satisfies the Board that—
He has received satisfactory training qualifying him to practise as an optician, and is the holder of a certificate of qualification recognized by the Board; or
He has passed an examination under the Act, both theoretical and practical, after a course of not less than three years' training in New Zealand as prescribed by regulations.
Under the Finance Act, 1932–33 (No. 2), an annual practising certificate (fee, 10s.) is required.
Regulations pursuant to the Opticians Act, 1928, prescribe the conditions and period of training and the syllabus for the examination conducted by the Opticians Board.
The number of opticians on the register at 31st March, 1948, was 295.
Plumbers: The Plumbers Board of New Zealand, constituted under the Plumbers Registration Act, 1912, consists of five members—viz., the Director-General of Health or his deputy (Chairman), the Director of Education, a city or borough engineer nominated by the Municipal Association of New Zealand, and a master plumber and a journeyman plumber elected by their respective associations.
The Board is concerned with the examination and registration of plumbers. Once registered under the Act, a plumber is not required to pass any further examination or pay licence fees to local bodies.
Under the Finance Act, 1932–33 (No. 2), an annual licence fee of 5s. is payable by registered plumbers doing sanitary plumbing.
The total of names on the register at 31st March, 1948, was 3,303.
Pharmaceutical Chemists: There are nearly 1,000 names on the Register of Pharmaceutical Chemists in New Zealand. All “registered chemists” automatically become members of the Pharmaceutical Society of New Zealand, which Society's affairs are managed by the Pharmacy Board constituted by the Pharmacy Act, 1939.
The Board consists of twelve members, one of whom is appointed by the Minister of Health, nine are elected on a district basis by registered chemists, and two by persons, not necessarily registered chemists, who have served an approved apprenticeship and who, at the time of the election, are employed in pharmacy. The main function of the Pharmacy Board is to administer the Pharmacy Act and generally to protect and promote the interests of the profession of pharmacy and the interests of the public in relation thereto.
It is a specific requirement of the Pharmacy Act that pharmacies in New Zealand be at all times maintained under the immediate supervision and control of a registered chemist, either in the capacity of proprietor or enrolled manager.
The Board has reciprocal arrangements with the pharmaceutical authorities of Great Britain, Northern Ireland, Eire, and all the Australian States in the matter of registration. Any person registered as a pharmaceutical chemist in any of these places is eligible for registration in New Zealand. Persons registered as chemists in New Zealand, similarly, are eligible for registration in the countries mentioned.
The Board conducts the examinations prescribed in the Pharmacy Regulations. Persons completing these examinations, as well as an approved apprenticeship of four years, qualify for registration as “registered chemists.”
The College of Pharmacy in Wellington was taken over as a function of the Society at the beginning of 1944 after having been conducted privately for a period of eleven years. In 1947 there were 365 students enrolled with the college for tuition either personally or by correspondence. All persons indentured after the 1st October, 1944, are obliged to attend personally at the college for a period of three weeks during their final year of apprenticeship.
Pharmacy is now subject to the provisions of the Industrial Efficiency Act, 1936, every open shop being under licence. No company or individual may open a pharmacy or change his premises without consent from the Licensing Authority. There are approximately 580 pharmacies at present licensed.
VOLUNTARY WELFARE ORGANIZATIONS.—Over the years voluntary welfare organizations have made valuable contributions to the solution of certain problems of public health. In many cases they are encouraged and assisted in their work by grants from public funds. Among the more important of these organizations are the Plunket Society, the National Federation of Health Camps, St. John Ambulance (N.Z.), the N.Z. Red Cross Society, the Crippled Children Society, and the N.Z. Federation of Tuberculosis Associations.
The Plunket Society—the Royal New Zealand Society for the Health of Women and Children—trains its own baby-welfare nurses, conducts baby welfare clinics throughout the country, and maintains four Karitane Hospitals for premature babies or difficult feeders, but not catering for the sick baby. The oversight of the healthy baby is left to the Plunket Society, except in those areas where there is no Plunket clinic. In these areas the Health Department District Nurse does baby-welfare work.
The National Federation of Health Camps was formed in 1936, and to-day maintains, a chain of permanent health camps for delicate and undernourished children. The Federation works in close co-operation with the Department of Health. It is the means whereby the voluntary nature of the various organizations is preserved, while ensuring that the available resources are utilized to the best advantage. Much of the finance for the Federation's activities is derived from the proceeds of the annual health stamp appeal.
The St. John Ambulance (N.Z.) has divisions throughout the country carrying out free ambulance work and instruction in first aid and home nursing. It is a branch of the Venerable Order of the Hospital of Saint John of Jerusalem.
The New Zealand Red Cross Society, a part of the International Red Cross Committee, has centres and sub-centres throughout the country. It gives training in first aid, home nursing, hygiene and sanitation, and emergency transportation of the injured. Graduates of these classes form voluntary aid detachments that in peacetime are recruited as aides in hospitals, and in wartime may be recruited for service overseas as well.
The Crippled Children Society keeps a register of all crippled children, helps them to acquire all possible medical treatment, and undertakes vocational training and home education where this is required.
The New Zealand Federation of Tuberculosis Associations looks after the interests of the tuberculosis. It assists the Health Department with health education of the public regarding tuberculosis and concerns itself with after-care and vocational training and guidance.
NATIONAL PHYSICAL WELFARE AND RECREATION.—Because of the abundant natural facilities for popular recreation, New Zealand citizens have always been characterized by a love of outdoor sporting and recreational activity. Although, compared with the older countries of the world, there are large areas even in the cities available as playing-fields, the demand still exceeds the supply. On the other hand, the long coast-lines and frequent mountain ranges enable most people to enjoy outdoor life. A temperate, equable climate ensures the use of facilities on a year-round basis.
The most popular summer sports are swimming and surfing, tennis, cricket, athletics, and lawn bowls, while softball is becoming popular with both sexes throughout the country.
Rugby football is the premier sport in winter, but there are enthusiastic and numerically large followings for hockey, association football, tramping, ski-ing and mountaineering, outdoor and indoor basketball, badminton, and table tennis. Both professional and amateur boxing and wrestling are quite popular winter sports, whilst the game of indoor bowls, hitherto confined to isolated areas, is attracting increasing numbers.
Generally speaking, facilities for indoor sports are inadequate in the face of the growing interest and participation in such sports as indoor basketball, badminton, table tennis, and indoor bowls. There is a growing realization of this inadequacy, and steps are being taken, usually in conjunction with community-centre movements, to provide and maintain indoor sporting facilities of a high standard.
All sporting activities in New Zealand are organized on a district basis, with representatives from each district forming a national controlling body. In this way every sport has a number of associations, unions, sub-associations, &c., which control the sport in each district from the strictly local aspect, while a New Zealand association (or union) is the controlling body in all matters of nation-wide significance in that particular sport.
An exception to this arrangement, whereby each sport is responsible for its own administration, is that of selection of representatives for the Olympic and the Empire Games. There exists in New Zealand an Olympic Council made up of representatives of all sports bodies interested in Olympic and Empire Games competition. It is this Council, for instance, which decided upon Auckland as the venue for the 1950 Empire Games when the International Association allocated the games to New Zealand.
In 1939 the first attempt was made to set up an organization in which all sports would be represented, both amateur and professional. The initial response was good, provincial “Councils of Sport” were organized, and these bodies shortly afterwards formed a National Council of Sport to which each provincial Council of Sport is affiliated.
Although some sporting organizations are not represented on the Councils of Sport, yet these institutions are filling an important place in the recreational picture of New Zealand.
The plan of the Physical Welfare and Recreation Branch of the Internal Affairs Department is to assist and encourage the development of recreation in Now Zealand. It owes its origin to the passing of the Physical Welfare and Recreation Act, 1937, which in the preamble succinctly states the purpose of the Branch: “To provide for the development of facilities for, and the encouragement of, physical training, exercise, sport, and recreation, and to facilitate the establishment of centres for social activities related thereto.”
To implement the above Act, Physical Welfare and Recreation Officers have from time to time been appointed. As at 1st January, 1949, there were thirty-seven male and twenty-one female officers. These officers are located at seventeen strategic points throughout New Zealand. The work of the officers varies according to local requirements and district trends in sport and recreation, but the principal activities of the Branch as a whole may be summarized as follows:—
Leadership Training for all sport and recreation groups, the emphasis to date being on the training of leaders for social recreation groups such as those organized by churches and clubs. Youth organizations such as Boy Scouts, Boys Brigade, and similar institutions have also received assistance in this direction. To date, a total of 325 persons have received Leadership Training Certificates, signifying the successful completion of a full training course conducted by the Physical Welfare and Recreation Branch. Many thousands of others have been trained to a lesser degree during the normal work of Branch officers. In the field of leadership training in sport, the Branch's efforts have been directed towards the raising of the standard of sports coaching and officiating at sports meetings, a need made apparent by the increased participation in sports generally, but particularly in such sports as indoor basketball and Softball, which have only recently been introduced.
Organization and Promotion of Recreational Activity within each community as made evident by local needs and requirements. Field officers are required to carry out periodical area recreational surveys with a view to planning of work and the promotion of recreational activity suitable to public demand and the facilities available in a given area. A specific activity with priority in all districts is promotion of recreation clubs in rural areas.
The Promotion of Holiday Camps and Training of Camp Leaders.—Camps have been conducted directly by Branch officers, while on many occasions the services of Physical Welfare and Recreation Officers have been made available, particularly in children's camps, to organize and conduct recreational activities.
Encouraging Tramping and Mountaineering.—The Department of Internal Affairs has constructed and maintains a chain of huts in the Harper Pass area of Canterbury. On a number of occasions officers have organized tramping parties and have thus introduced many young people to the back country of New Zealand. Similar trips have been organized in other districts, using existing huts and tracks.
The success in this experimental work warrants the hope that similar facilities will be made available in other areas.
Organization of Industrial Recreation.—To date this has for the most part taken the form of organizing and promoting associations which are calculated to provide sport and recreation (cultural and social) for a variety of employed groups. Organizations formed in this way are located chiefly in cities and larger towns and take the form of business firms' recreation associations, trade-union sports associations, and Public Service sports associations. Recreation activity for the most part takes the form of inter-unit sports tournaments, but there is ample room for development along cultural lines and in the broader field of recreation.
Organization and Conduct of Group Travel Tours.—The introduction of New Zealanders as well as tourists to New Zealand is relatively well provided for. The Tourist Department, some commercial travel organizations, and the Physical Welfare and Recreation Branch each have their respective fields of activity. The latter is interested mainly in the introduction of and in popularizing this mode of travel, organization and conduct of actual tours on any largo scale being carried out only in the Auckland district at present. Trips by sporting organizations in which group travel and sport are combined are, however, organized throughout the country by Physical Welfare Officers.
Organizational and Practical Assistance in Learn-to-swim and Fitness Campaigns.
Promotion of Cycle Touring Clubs in City Areas.—With the co-operation of the cycle trade, this activity has been introduced by Branch officers in main centres, and a national association is being formed. As a form of group travel, it is an interesting example of the work of the Branch in enabling some of our younger people to enjoy the beauties of New Zealand's natural scenery.
Production of Sports Coaching and Information Material.—Recreation information bulletins are published from time to time by the Head Office of the Physical Welfare Branch. A library is maintained and photographs and films are loaned to interested organizations through district officers. Active steps are being taken to provide literature on a wide variety of topics relating to sport and recreation, and a library is being built up of films and photographs of use to sports and recreational institutions to assist in coaching those interested in particular activities. General recreational material is distributed to all certified recreation leaders.
Advice and Information.—Physical Welfare and Recreation Offices might be termed “District Bureaux” to provide advice and information on all recreational matters to interested inquirers. In addition to such general duties, Physical Welfare Officers provide a liaison not only between the Government and local recreation authorities, but also between associations, the local authorities, and other interested societies and clubs. In addition to assisting the local Councils of Sport in every possible way, officers also assist sporting clubs and societies requesting such assistance.
A most important feature of the liaison work is that of establishing contact between children leaving school and adult sporting and recreational organizations. This is achieved through direct interviews with senior pupils of schools and colleges and through the distribution of illustrated brochures publicising the work of the Branch and indicating that assistance in the taking-up of any form of sport or recreation is available from the Physical Welfare Officers of the district concerned.
Community Centres.—A noteworthy trend in Now Zealand of recent years has been the formation and planning of community centres in many districts. This trend has been facilitated by the decision of the Government to subsidize on a pound-for-pound basis such “living” war memorials as community centres, halls, and play areas. In addition to conforming to the requirements for a living war memorial, projects must be sponsored by the local authority in order to ensure future maintenance.
Physical Welfare Officers have assisted established community centre with advice and practical instruction to keep-fit classes, sports clubs, and similar bodies, and in the provision of printed material conveying information on community centres both in New Zealand and overseas.
Financial assistance is also available to community centres not established as war memorials. Details of such assistance are given in the next paragraph.
Financial Assistance for Sport and Recreation.—Provision was made in the Physical Welfare and Recreation Act, 1937, for the making of grants by the Government to assist sport and recreation. In February, 1946, £10,000 was made available to cover the remainder of the 1945–46 financial year. £35,000 was made available in 1946–47, and £50,000 in 1947–48 and 1948–49. These sums have been disbursed in grants of varying amounts to all types of sporting and recreational organizations, and throughout have been administered by the Physical Welfare and Recreation Branch.
The basis for allocating grants is a subsidy not generally exceeding £1 for £3, with a maximum of £500, where the result of such grant will be the provision of recreational facilities or equipment. In other words, grants are made only for additional capital expenditure. Grants are not made for honoraria, travelling-expenses, personal uniforms, or general administrative expenses, nor where it is considered that an organization can carry out a project without grant assistance.
All types of sporting and recreational organizations in New Zealand have received financial assistance of recent years, and investigations have shown that such grants have been of great importance in providing facilities for the growing number of participants in active sports throughout the country.
Generally speaking, New Zealanders are very sports conscious and the percentage of participants to spectators in sport is relatively high, but, as in every other country, physical examination of recruits for the Armed Services during the war years and subsequently reveal that there is no ground for complacency, but rather that further vigorous steps must be taken towards the ideal of national fitness and a full life through recreative activity.
The Physical Welfare and Recreation Branch of the Internal Affairs Department, co-operates with the Health and Education Departments, in endeavouring to achieve the desirable goal of a fit nation.
PRIOR to the abolition of the provinces in 1876 hospital maintenance was left to the care of the several Provincial Councils, each of which had a system of its own. On the change-over to the county form of government in the following year all of these diverse systems came under the charge of the Central Government, and many difficulties and incongruities arose. Gradually there grew up a system of excessive demands upon the Government, and in 1885 an attempt to reduce a somewhat chaotic state of affairs to some semblance of order and uniformity took shape in the Hospitals Act of that year, which provided for the constitution of special hospital districts and Boards. Several amendments, based on the result of experience, were passed in later years, and the present law relating to the subject is embodied in the Hospitals Act, 1926, to which a number of amendments have since been made. (This Act was entitled the Hospitals and Charitable Institutions Act, 1926, until altered by the Hospitals Amendment Act, 1948.)
HOSPITAL BOARDS.—The management of affairs in each hospital district is entrusted to a Hospital Board, consisting of not more than twenty and not less than eight members representing the contributory local authority districts comprising the hospital area. Members are elected at the ordinary general election of the contributory authorities. The 1948 amendment to the main Act, authorizes, in cases where hospital districts are amalgamated, the establishment of a committee for the management of any one or more institutions. The acts or proceedings of such committees are to be subject to the approval of the Hospital Board concerned.
Subject to the consent of the Minister of Health, a Hospital Board has power to establish, control, and manage any of the following institutions: Hospitals, charitable institutions, maternity homes, convalescent homes, sanatoria, habitual inebriates' homes, reformatory institutions for the reception of women and girls, and any other institutions for any purpose which the Governor-General by Order in Council may declare to be a public charitable purpose. It may grant charitable aid to indigent, sick, or infirm persons; may provide medical, surgical, and nursing attention for persons not inmates of an institution; and may grant financial assistance to medical and nursing associations and private philanthropic institutions approved by the Minister.
It is the duty of every Hospital Board to provide and maintain such hospitals as the Director-General of Health considers necessary in any part of the district for (a) the reception, relief, &c., of any persons suffering from infectious diseases; (b) the reception, &c., of persons suffering from other than infections diseases. Hospital Boards are also required to provide for the removal to hospital of these classes of persons. In addition, Boards must provide maternity hospitals. Hospital Boards may, with the prior consent of the Minister, provide certain preventive health services, e.g., examinations, inoculations. Boards may be required by the Minister to provide such services. The 1948 amendment also provided that a Hospital Board may establish a residential nursery or a day nursery for the reception and temporary care of young children.
Provision of Finance.—No rating-powers are given to Hospital Boards, but under the Hospitals Act, amended as from 1st April, 1947, a levy is made on the contributing local authorities of the hospital district of an amount equal to 0.5d. for each £1 of the rateable capital value of the districts or one-half of the net estimated expenditure (both maintenance and capital) of the Board, whichever amount is the less. This levy is apportioned by the Boards among the contributory local authorities in proportion to the capital value of the rateable property in each contributory district. The balance of the net estimated expenditure (both maintenance and capital) of each Board is provided by Government subsidy.
Prior to the coming into operation of the Social Security Act, 1938, patients' fees and other recoveries from those assisted formed about a third of the total maintenance receipts of Boards.
Under Part III of the Social Security Act, however, Hospital Boards now receive payments from the Social Security Fund in respect of hospital treatment and examinations (including out-patient treatment), pharmaceutical requirements, and district nursing services. These payments provide free treatment for all persons entitled to benefits under the Act. The only exception to the foregoing is in respect of the dental treatment of out-patients. (Details of hospital and other benefits appear in the section dealing with “Social Security, Pensions, Superannuation, &c.”)
Boards derive their revenue from three main sources—i.e., benefits from the Social Security Fund, which are about one-third of the revenue for maintenance purposes; levies on contributory local authorities, about one-sixth of the maintenance revenue; and the balance from Government subsidy.
A Government subsidy was formerly payable on voluntary contributions and bequests, but this has been discontinued since March, 1932.
Receipts.—The following is a summary of the receipts of Hospital Boards for the years ended 31st March, 1945 and 1946.
| — | 1944–45. | 1945–46. |
|---|---|---|
| £ | £ | |
| Voluntary contributions and bequests | 10,671 | 8,913 |
| Levies | 1,317,339 | 1,537,271 |
| Subsidies | 1,284,477 | 1,618,751 |
| Payments from Social Security Fund, patients' payments, and charitable-aid recoveries | 2,357,005 | 2,625,296 |
| Rent, interest, and dividends | 32,752 | 38,987 |
| Loans | 993,239 | 408,471 |
| Sale of capital assets | 10,145 | 8,805 |
| Miscellaneous receipts | 104,916 | 149,289 |
| Totals | 6,110,544 | 6,395,783 |
Expenditure.—Although the figures in the preceding statement relate to receipts, the official returns of Hospital Boards have since 1916–17 been supplied on the basis of an Income and Expenditure Account and Balance-sheet.
Commencing with the year 1940–41, the expenditure only (not the income) has been tabulated. The following summary for the years ended 31st March, 1945 and 1946, gives the total expenditure by Hospital Boards, with the addition of expenditure on Government hospitals other than mental hospitals. Particulars of expenditure on mental hospitals are contained in the next subsection.
| — | 1944–45. | 1945–46. | ||
|---|---|---|---|---|
| Amount. | Percentage of Total. | Amount. | Percentage of Total. | |
| £ | £ | |||
| Hospital maintenance | 4,190,796 | 87.7 | 4,818,014 | 86.6 |
| Charitable relief— | ||||
| Indoor | 96,027 | 2.0 | 113,085 | 2.0 |
| Outdoor | 38,917 | 0.8 | 32,536 | 0.6 |
| Medical associations | 8,344 | 0.2 | 14,520 | 0.3 |
| District nursing | 30,443 | 0.6 | 33,977 | 0.6 |
| Ambulances | 24,929 | 0.5 | 29,311 | 0.5 |
| Miscellaneous maintenance expenditure | 55,563 | 1.2 | 157,974 | 2.8 |
| Administration | 148,725 | 3.1 | 175,713 | 3.2 |
| Interest on loans | 148,082 | 3.1 | 163,576 | 2.9 |
| National Provident Fund | 37,859 | 0.8 | 27,627 | 0.5 |
| Totals | 4,779,685 | 100.0 | 5,566,333 | 100.0 |
Capital expenditure for the year 1945–46 totalled £1,343,358, this amount including £219,480 in respect of amortization of loan-money. The total expenditure for the year, excluding amounts paid from one Board or departmental institution to another, was thus £6,909,691.
Hospital Maintenance Expenditure.—The average annual coat of maintenance of general hospitals per occupied bed in the eleven-year period 1935–36 to 1945–46 was as follows:—
| Year. | Provisions. | Surgery and Dispensary. | Domestic and Establishment. | Salaries and Wages. | Miscellaneous. | Totals, Maintenance. |
|---|---|---|---|---|---|---|
| £ | £ | £ | £ | £ | £ | |
| 1935–36 | 31.7 | 17.8 | 44.5 | 85.4 | 3.9 | 183.3 |
| 1936–37 | 34.1 | 18.7 | 48.4 | 97.0 | 4.1 | 202.3 |
| 1937–38 | 37.4 | 19.7 | 52.7 | 110.8 | 4.2 | 224.8 |
| 1938–39 | 40.5 | 20.9 | 56.4 | 131.7 | 4.5 | 254.0 |
| 1939–40 | 42.7 | 21.0 | 61.8 | 142.5 | 4.7 | 272.7 |
| 1940–41 | 42.3 | 22.2 | 61.9 | 153.3 | 5.2 | 284.9 |
| 1941–42 | 45.8 | 23.0 | 64.6 | 170.7 | 6.2 | 310.3 |
| 1942–43 | 48.5 | 27.0 | 65.3 | 180.6 | 6.2 | 328.2 |
| 1942–44 | 52.4 | 27.8 | 71.4 | 187.0 | 6.3 | 344.9 |
| 1944–45 | 55.0 | 28.9 | 69.9 | 195.2 | 6.0 | 355.0 |
| 1945–16 | 60.0 | 33.6 | 82.9 | 231.2 | 7.0 | 414.7 |
Charitable-aid Expenditure.—Charitable-aid expenditure during the five-year period quoted has been as follows:—
| Year. | Indoor Relief. | Outdoor Relief. | Totals. |
|---|---|---|---|
| £ | £ | £ | |
| 1941–42 | 86,265 | 43,730 | 129,995 |
| 1942–43 | 82,221 | 37,238 | 119,462 |
| 1943–44 | 84,797 | 37,460 | 122,257 |
| 1944–45 | 96,027 | 38,917 | 134,944 |
| 1945–46 | 113,085 | 32,536 | 145,621 |
The increase in rates of various existing pensions, the introduction of invalidity pensions in 1936, and the introduction of social security benefits in 1939, have relieved Hospital Boards of an appreciable amount of expenditure under the heading of “Outdoor Relief,” the decrease between 1935–36 and 1945–46 amounting to 83 per cent.
Cost to Government and Local Authorities.—The following shows, for triennial periods, the average annual net maintenance requirements of Hospital Boards—i.e., the average estimated deficit to be met by levies on the local authorities and the Government subsidy thereon.
| Triennium. | Average Annual Amount. |
|---|---|
| 1931–32 to 1933–34 | 1,075,146 |
| 1932–33 to 1934–35 | 1,086,479 |
| 1933–34 to 1935–36 | 1,100,228 |
| 1934–35 to 1936–37 | 1,173,581 |
| 1935–36 to 1937–38 | 1,306,206 |
| 1936–37 to 1938–39 | 1,495,335 |
| 1937–38 to 1939–40 | 1,711,469 |
| 1938–39 to 1940–41 | 1,697,051 |
| 1939–40 to 1941–42 | 1,733,178 |
| 1940–41 to 1942–43 | 1,838,279 |
| 1941–42 to 1943–44 | 2,036,843 |
| 1942–43 to 1944–45 | 2,111,933 |
| 1943–44 to 1945–46 | 2,190,748 |
| 1944–45 to 1946–47 | 2,598,178 |
Loans.—During the year 1945–46 twenty-nine new loans aggregating £930,750 were authorized for terms ranging from fifteen to thirty years.
The amount of loans outstanding at the 31st March, 1946, was £4,616,134. This amount, however, is reduced by a sum of £101,957 standing to the credit of sinking funds, making the net amount of loan-money £4,514,177.
PUBLIC HOSPITALS.—Subsection F of the preceding section contains statistics of in-patients treated at public hospitals other than purely maternity hospitals. In the following table the figures are inclusive of maternity hospitals, sanatoria, &c., and relate to the financial year instead of to the calendar year.
| Year. | In-patients treated. | Average Number of Occupied Beds. | Beds available. | |||
|---|---|---|---|---|---|---|
| Total Number. | Proportion per 1,000 of Population. | Number. | Proportion per 1,000 of Population. | Number. | Proportion per 1,000 of Population. | |
| 1941–42 | 152,563 | 93.3 | 9,378 | 5.7 | 11,617 | 7.0 |
| 1942–43 | 184,644 | 112.9 | 10,225 | 6.3 | 13,417 | 8.2 |
| 1943–44 | 171,828 | 105.0 | 10,753 | 6.5 | 13,587 | 8.3 |
| 1944–45 | 172,390 | 105.4 | 11,512 | 6.9 | 13,401 | 8.1 |
| 1945–46 | 177,167 | 103.5 | 11,291 | 6.6 | 13,870 | 8.1 |
The number of institutions coming under the heading of public hospitals for the year ended 31st March, 1946, was 155, comprising 75 general hospitals (5 of which were also old people's homes, and 2 special hospitals), 1 chronic hospital, 3 convalescent hospitals, 65 maternity hospitals, 5 tuberculosis sanatoria, 1 tuberculosis prevention institution, 2 chronic-tuberculosis hospitals, 1 tuberculosis dispensary, and 2 infectious-diseases hospitals. A comparison of beds and patients is as follows:—
| 1941–42. | 1942–43. | 1943–44. | 1944–45. | 1945–46. | |
|---|---|---|---|---|---|
*In addition, dental cases treated during the year and attendances were: Auckland, 1,148, 7,217; Wellington, 21,607, 37,420; Hutt, 5,781, 10,540; Christchurch, 5,588, 20,122; and Timaru, 1,307, 3,916. | |||||
| Number of institutions | 143 | 145 | 153 | 153 | 155 |
| Number of beds— | |||||
| General | 6,940 | 8,732 | 8,688 | 8,320 | 8,657 |
| Children's cots | 1,329 | 1,390 | 1,457 | 1,463 | 1,537 |
| Maternity | 868 | 893 | 958 | 1,062 | 1,130 |
| Tuberculosis | 1,321 | 1,532 | 1,549 | 1,633 | 1,763 |
| Infectious disease | 1,153 | 870 | 935 | 923 | 783 |
| Totals | 11,611 | 13,417 | 13,587 | 13,401 | 13,870 |
| Average number of occupied beds per diem | 9,378 | 10,225 | 10,753 | 11,512 | 11,291 |
| In-patients treated during year | 152,563 | 184,644 | 171,828 | 172,828 | 177,167 |
| Deaths during year | 6,751 | 7,400 | 7,281 | 7,464 | 7,685 |
| Out-patients— | |||||
| Number | 281,757 | 386,645 | 358,210 | 381,600 | 414,023* |
| Attendances | 829,446 | 1,035,234 | 1,129,703 | 1,168,318 | 1,176,510* |
PRIVATE HOSPITALS.—The Private Hospitals Act, which came into force on 1st January, 1907, is now embodied in the Hospitals Act, 1926, Part III of which provides for the licensing, management, and inspection of private hospitals. All such institutions must be licensed, and every application for a licence must be accompanied by a full description and plan of the building it is proposed to use, together with a statement showing the number and class of cases it is proposed to receive. The licence shall state whether it is in respect of a private maternity hospital or a surgical and medical private hospital, or if for both classes of cases: no private hospital may be used for any purpose other than that in respect of which the licence is granted and purposes reasonably incidental thereto.
For every private hospital there must be a resident manager, either the licensee or some person appointed by the licensee, and in every case the manager must be a legally qualified medical practitioner or a registered nurse in the case of a surgical and medical hospital, or a registered midwife in the case of a lying-in hospital, or a registered nurse and midwife, or a registered nurse having as resident assistant a registered midwife, in the case of a hospital licensed for both purposes. No licence may be granted in respect of a house not previously licensed until such house and annexed buildings have been approved by the Director-General of Health, and no addition may be made to any private hospital until it has been so approved. No licence may be granted unless the character and fitness of the applicant are deemed to be satisfactory. The licence must be renewed on 1st January of each year.
In every private hospital there must be kept a register of patients showing particulars as to name, age, abode, and date of reception of each patient, date when such patient loft (or, in the event of death, the date thereof), name of medical practitioner attending, and such other details as may be prescribed. Inquiry may be made at any time as to the management, conduct, and equipment of any private hospital, and if such inquiry discloses an unsatisfactory state of affairs the licence may be revoked. Provision is made for the inspection of private hospitals in the same manner as for public institutions.
The Social Security Act, inter alia, provides for the payment to licensees of private hospitals (who have entered into contracts under the Act) of prescribed amounts in respect of hospital treatment afforded by them. Particulars are contained in Section 25, “Social Security, Pensions, Superannuation, &c.”
The total number of private hospitals licensed in New Zealand as at 31st March, 1946, was 261, with 905 maternity beds and 1,877 beds for general cases.
HOSPITAL ACCOMMODATION.—In view of the greatly increased demand in recent years for hospital treatment, the adequacy or inadequacy of the available hospital accommodation in New Zealand has received considerable attention from the Department of Health.
Many difficulties are met in laying down a definite figure as a standard of hospital-bed establishment owing to the varying circumstances encountered in different districts or countries. Among the factors which influence the demand for hospital accommodation are the habits of the population in seeking to enter hospitals for various types of illness, the availability of medical practitioners and their habits in sending patients to hospitals or retaining them for home treatment. Housing facilities, the availability of domestic assistance, and private nursing or district nursing assistance and the efficiency of the out-patient department are other determining factors. Dangerous industries, scattered populations, and the prevalence of certain diseases also have a bearing on the matter, while the efficiency and attitude of the hospital medical staffs are of importance. The following table gives particulars of the numbers of beds in public and private hospitals at 31st March in each of the years shown. The figures include maternity, tuberculosis, and infectious-diseases beds, but do not include beds in mental hospitals, or in private or religious charitable homes.
| — | 1939. | 1940. | 1941. | 1942. | 1943. | 1944. | 1945. | 1946. |
|---|---|---|---|---|---|---|---|---|
| Number of beds in— | ||||||||
| Public hospitals | 9,234 | 9,816 | 11,182 | 11,617 | 12,118 | 12,497 | 13,232 | 13,870 |
| Charitable institutions under Hospital Boards | 1,918 | 1,797 | 1,102 | 1,063 | 977 | 933 | 915 | 968 |
| Private hospitals | 2,643 | 2,765 | 2,875 | 2,820 | 2,983 | 2,842 | 2,960 | 2,782 |
| Temporary hospitals (average of occupied beds) | 410 | 341 | 164 | |||||
| Totals | 13,795 | 14,378 | 15,159 | 15,500 | 16,488 | 16,613 | 17,271 | 17.620 |
| Per 1,000 of population | 8.6 | 8.8 | 9.3 | 9.5 | 10.1 | 10.2 | 10.6 | 10.3 |
Apart from New Zealand, the countries which appear to have the highest ratio of beds to population are Norway, with rather over 8 beds per 1,000, and Australia with 8 beds per 1,000. The position in the various Australian States is as follows: New South Wales, 7.9; Victoria, 7.5; Queensland, 8.7; South Australia, 7.9; Western Australia, 9.6; Tasmania, 8.7; Australian Capital Territory, 17.6; and Northern Territory, 14.6. In 1944 a Medical Survey Committee set up by the Government of the Commonwealth of Australia prescribed the following standard of hospital-bed establishment, excluding tuberculosis requirements:—
| Beds per 1,000 of Population. | |
|---|---|
| General beds | 5.0 |
| Maternity | 1.0 |
| Children | 0.5 |
| Infectious | 0.5 |
| Convalescent | 0.5 |
| Subacute | 0.5 |
| Chronic | 1.0 |
| Total | 9.0 |
If the tuberculosis requirements are taken as 1 bed per 1,000 of population, the Australian recommendation for all purposes except mental diseases becomes 10 beds per 1,000 of population, which closely approximates the New Zealand establishment of 10.3.
MATERNITY SERVICES.—Benefits under the Social Security Act, 1938.—The Social Security Act, inter alia, makes provision for payments from the Social Security Fund to hospitals, medical practitioners, and nurses for services in connection with maternity cases.
Particulars of maternity benefits provided under the Act will be found in Section 25, “Social Security, Pensions, Superannuation, &c.”
At the end of 1947 there were 245 maternity hospitals with a total available bed accommodation of 2,200, made up as follows:
| Public hospitals | 1,240 |
| Private hospitals | 829 |
| State (St. Helens) hospitals | 106 |
| Alexandra Home (Wellington) | 19 |
| Total | 2,200 |
This figure represents a bed ratio of 5.54 beds per 1,000 of the female population in the age-group 15–14 years.
The total number of confinements in maternity hospitals in 1947 was 45,337, of whom 43,467 were confined at the full term and 1,870 at from 7–9 months. In addition, there were 3,092 admissions for ante-natal treatment. These figures are inclusive of Maoris.
State Maternity Hospitals.—There were formerly seven State maternity (St. Helens) hospitals, but in 1933 two—Wanganui and Gisborne—were handed over to the control of the Wanganui and Cook Hospital Boards respectively, and at the end of 1937 the St. Helens Hospital, Dunedin, was closed. Prior to the advent of the maternity benefits under the Social Security Act, the use of these hospitals was restricted to cases where the husband's income did not exceed £5 per week, and in cases of large families £6 per week. There are now no restrictions in this respect, and all service is free to the patient. The main function now served by these hospitals is to provide extended training for maternity nurses, so that they may qualify for the more responsible work of midwives.
This service is given under the supervision of the Medical Superintendent, who is also responsible for the conduct of all abnormal cases and for the supervision of the ante-natal and post-natal care of all patients attending. There is also an out-patient department attached to each hospital, which provides nursing services for patients not entering the institution.
The statistics given below give the essential particulars for the four State maternity (St. Helens) hospitals for the year 1947.
| Hospital, and Year of Opening. | Number of Beds. | Confinements In Institution. | Confinements attended Outside. | |||
|---|---|---|---|---|---|---|
| Total Live Births. | Total Still births. | Deaths of Mothers. | Deaths of Infants In Hospital. | |||
| Auckland (1900) | 44 | 1,019 | 15 | 1 | 8 | |
| Wellington (1905) | 30 | 614 | 11 | 8 | ||
| Christchurch (1907) | 15 | 404 | 10 | 10 | 4 | |
| Invercargill (1918) | 17 | 354 | 5 | 6 | ||
| Totals | 106 | 2,391 | 41 | 1 | 32 | 4 |
District Midwives and Maternity Nurses.—Twenty-two Hospital Boards have district nurses, who in most cases carry out some obstetrical work in conjunction with other health work. In addition, there are Health Department district nurses appointed for the purpose of attending the Maori population, part of their work being attendance on Maori women during confinement.
Ante-natal Services.—Since maternity benefits have been provided free to patients under the Social Security Act and medical men have been paid a fee under that Act for giving ante-natal, neo-natal, and post-natal attention, the bulk of the ante-natal attendance has been provided by the patient's own medical attendant, this being one part of the service for which he receives a fee. The doctor's attendance, if desired, is supplemented by that of the midwife in charge of an ante-natal clinic. These free antenatal clinics are established in connection with the four St. Helens Hospitals, all public maternity hospitals or maternity wards, and a number of clinics conducted by the Plunket Society. In the case of women living far from the main centres of population, the work is also supplemented by the District Nurses who are employed by the Health Department or by Hospital Boards.
The majority of women now realize that ante-natal care is as essential to their welfare as attendance during their delivery and lying-in period by a doctor and trained maternity nurse or midwife. The Department has supplemented the service by the free distribution of a pamphlet “Suggestions to Expectant Mothers,” which has served its purposes as propaganda for ante-natal care.
Every effort is being made to impress the public with the importance of parental hygiene and systematic ante-natal care throughout pregnancy. Addresses and lectures are delivered by Medical Officers of the Department of Health to nurses and societies interested in this subject. So that there will be definite co-operation between the midwife and the ante-natal clinic, and in order that the midwife may be informed of the clinical methods adopted by the Health Department, refresher courses of lectures, particularly on ante-natal work, are available to all registered midwives and maternity nurses.
BENEVOLENT INSTITUTIONS AND ORPHANAGES.—One hundred and eighteen institutions classed under the heading of benevolent and orphan institutions furnished returns to the Census and Statistics Department for the year 1947. These institutions, which are conducted by Hospital Boards, religious bodies, and other public or semi-public organizations, are alike in that they provide accommodation on a benevolent or charitable basis, but differ largely in the classes of persons to whom they afford assistance. The generic name covers old people's homes, maternity and refuge homes for women and girls, orphanages, homes for the infirm or afflicted, “prison gate” homes, and an institute for the blind. Some of the orphanages deal with cases similar to those dealt with by the special schools under the control of the Education Department, and a few of the women's institutions receive offenders committed to them by the Courts.
The following table gives particulars of admissions, discharges, &c., during each of the five years quoted.
| — | Number of Institutions | Admissions during Year. | Births in Institutions during Year. | Discharges during Year. | Deaths in Institutions during Year. | Inmates at 31st December. | Total Inmates during Year. |
|---|---|---|---|---|---|---|---|
| 1943 | 120 | 6,496 | 291 | 6,327 | 327 | 5,385 | 12,039 |
| 1944 | 120 | 4,501 | 327 | 4,560 | 318 | 5,319 | 10,197 |
| 1945 | 119 | 5,711 | 291 | 5,769 | 344 | 5,208 | 11,321 |
| 1946 | 117 | 3,770 | 298 | 3,855 | 354 | 5,067 | 9,276 |
| 1947 | 118 | 3,679 | 260 | 3,905 | 326 | 4,775 | 9,006 |
A substantial decrease in the number of inmates of charitable institutions has occurred during recent years, but the actual position is obscured by the fact that certain inmates of institutions under the control of Hospital Boards are now supported by hospital benefits from the Social Security Fund, and are no longer counted in these statistics. Such inmates are now included in the statistics relating to public hospitals.
The next table gives similar information for the year 1947, classified according to the class of authority controlling the institutions.
| Controlling Authorities. | Number of Institutions. | Inmates at 1st January. | Admissions during Year. | Births in Institutions during year. | Deaths in Institutions during year. | Inmates at 31st December. | Total Inmates during Year. | |
|---|---|---|---|---|---|---|---|---|
| Hospital Boards | 21 | 872 | 768 | 574 | 157 | 909 | 1,640 | |
| Church of England | 14 | 567 | 281 | 37 | 345 | 2 | 538 | 885 |
| Roman Catholic Church | 17 | 1,566 | 669 | 33 | 738 | 102 | 1,428 | 2,268 |
| Presbyterian Church | 16 | 392 | 183 | 156 | 18 | 401 | 575 | |
| Methodist Church | 5 | 235 | 110 | 80 | 20 | 245 | 345 | |
| Baptist Church | 2 | 53 | 25 | 27 | 51 | 78 | ||
| Salvation Army | 27 | 854 | 1,286 | 157 | 1,494 | 19 | 784 | 2,297 |
| Brethren | 1 | 30 | 23 | 27 | 26 | 53 | ||
| Undenominational associations, &c. | 15 | 498 | 334 | 33 | 464 | 8 | 393 | 865 |
| Totals | 118 | 5,067 | 3,679 | 260 | 3,905 | 326 | 4,775 | 9,006 |
In many cases there is a variation in the class of inmate provided for by the different controlling bodies. For instance, none of the homes under the supervision of the Presbyterian Church, the Methodist Church, the Baptist Church, or the Brethren are maternity homes of any description. The four churches mentioned control children's homes and orphanages only, while the Church of England and the Roman Catholic Church provide chiefly for children, although some maternity cases are dealt with. The Hospital Boards concentrate chiefly upon old people's homes, while the Salvation Army deals with all types, and is the only body that conducts extensively the “prison-gate” or industrial type of institution. Factors such as these affect the demands made upon the different institutions for accommodation or relief.
The ages and sexes of all inmates in the institutions at 31st December, 1947, were as follows:—
| Age-group. | Males. | Females. | Totals. |
|---|---|---|---|
| Under 5 years | 178 | 171 | 349 |
| 5 and under 10 years | 452 | 408 | 860 |
| 10 and under 15 years | 571 | 449 | 1,020 |
| 15 and under 17 years | 73 | 135 | 208 |
| 17 and under 25 years | 41 | 150 | 191 |
| 25 and under 35 years | 45 | 68 | 113 |
| 35 and under 45 years | 51 | 53 | 104 |
| 45 and under 55 years | 90 | 77 | 167 |
| 55 and under 65 years | 173 | 111 | 284 |
| 65 years and over | 854 | 622 | 1,476 |
| Unspecified | 3 | 3 | |
| Totals | 2,528 | 2,247 | 4,775 |
Some remarkable differences in the sex proportions at the various age-groups are apparent in the foregoing table. In the first group there is naturally little relative disparity, but in the groups covering ages 5 and under 15 years, there is a considerable preponderance of males. The next three groups, covering ages 15 and under 35 years, show a large excess of females. The number of females in those groups, of course, is greatly increased by the inclusion of girls and women entering maternity homes. From age 45 onwards a distinct male excess is observed.
The overwhelming majority of males dependent upon charitable aid at these later ages is indeed remarkable, although the “prison-gate” and industrial type of home no doubt swell the numbers at this stage.
The next table contains information concerning inmates of orphanages and of a few other institutions which provide for both children and older people. The figures relate to inmates under the age of twenty-one who were admitted to the institutions during 1947.
| Age, in Completed Years. | Legitimate. | No Information as to Legitimacy. | Illegitimate. | Totals. | ||||
|---|---|---|---|---|---|---|---|---|
| Father and Mother both Alive. | Father Dead, Mother Alive. | Father Alive. Mother Dead. | Father and Mother both Dead. | No Information as to Orphanhood | ||||
| 0 | 39 | 1 | 46 | 86 | ||||
| 1 | 30 | 2 | 1 | 7 | 40 | |||
| 2 | 38 | 3 | 2 | 1 | 6 | 50 | ||
| 3 | 54 | 4 | 10 | 1 | 11 | 80 | ||
| 4 | 67 | 10 | 8 | 7 | 92 | |||
| 5 | 76 | 7 | 6 | 3 | 92 | |||
| 6 | 95 | 7 | 15 | 1 | 2 | 5 | 125 | |
| 7 | 77 | 5 | 10 | 1 | 93 | |||
| 8 | 74 | 7 | 7 | 2 | 90 | |||
| 9 | 63 | 6 | 8 | 1 | 2 | 80 | ||
| 10 | 53 | 5 | 8 | 1 | 4 | 71 | ||
| 11 | 41 | 1 | 14 | 1 | 2 | 1 | 60 | |
| 12 | 31 | 6 | 8 | 2 | 47 | |||
| 13 | 23 | 3 | 5 | 1 | 1 | 33 | ||
| 14 | 18 | 1 | 2 | 2 | 2 | 25 | ||
| 15 | 8 | 3 | 2 | 13 | ||||
| 16 | 2 | 3 | 1 | 6 | ||||
| 17 | 1 | 1 | ||||||
| 18 | 1 | 1 | 2 | |||||
| 19 | 1 | 1 | ||||||
| 20 | ||||||||
| Not stated | ||||||||
| Totals | 790 | 65 | 113 | 12 | 8 | 99 | 1,087 | |
Contrary to what might generally be expected, the above figures reveal that children both of whose parents are alive constitute a substantial majority of those admitted to homes. Cases where both parents are dead are comparatively few.
THERE are ten public mental hospitals in New Zealand maintained wholly or in part out of the public revenue. There is also one private hospital licensed for the reception of the mentally afflicted.
The patients on the register at the end of 1947 were distributed as shown below. Numbers given throughout this subsection are inclusive of Maoris. Figures for Maoris are also given separately toward the end of the subsection.
| Mental Hospital. | Males. | Females. | Totals. |
|---|---|---|---|
| Auckland | 737 | 665 | 1,402 |
| Kingseat (Papakura) | 442 | 399 | 841 |
| Raventhorpe (Drury) | 9 | 217 | 226 |
| Tokanui | 424 | 380 | 804 |
| Levin Farm | 135 | 38 | 173 |
| Porirua | 640 | 611 | 1,251 |
| Nelson | 574 | 433 | 1,007 |
| Seaview (Hokitika) | 259 | 265 | 524 |
| Sunnyside (Christchurch) | 736 | 688 | 1,424 |
| Seacliff and Waitati | 597 | 421 | 1,018 |
| Ashburn Hall (private mental hospital) | 14 | 24 | 38 |
| Totals | 4,567 | 4,141 | 8,708 |
The number of patients remaining at the end of each of the last five years is shown in the following table.
| Year. | Patients remaining at 31st December. | Proportion per 10,000 of Population. | ||||
|---|---|---|---|---|---|---|
| Males. | Females. | Totals. | Males. | Females. | Totals. | |
| 1943 | 4,376 | 3,746 | 8,122 | 55.47 | 44.24 | 49.66 |
| 1944 | 4,411 | 3,952 | 8,363 | 55.21 | 46.13 | 50.51 |
| 1945 | 4,470 | 3,934 | 8,404 | 54.06 | 45.33 | 49.59 |
| 1946 | 4,556 | 4,046 | 8,602 | 51.79 | 45.89 | 48.84 |
| 1947 | 4,567 | 4,141 | 8,708 | 50.60 | 46.00 | 48.31 |
| Average of five years | 4,476 | 3,964 | 8,440 | 53.43 | 45.52 | 49.38 |
The total number of patients under supervision, care, or control during 1945, 1946, and 1947 was 9,735 (5,068 males, 4,667 females), 9,837 (5,115 males, 4,722 females), and 10,111 (5,275 males, 4,836 females), respectively. The average number resident in mental hospitals was 7,918 in 1945, 7,972 in 1946, and 8,062 in 1947.
ADMISSIONS.—The total admissions to mental hospitals during the year 1947 was 1,509 (719 males and 790 females), this number not including 230 transfers from one institution to another. The principal causes of insanity as assigned on admission were as follows:—
| Heredity | 13 |
| Congenital | 211 |
| Previous attack | 272 |
| Puberty and adolescence | 3 |
| Climacteric | 7 |
| Puerperal state | 16 |
| Senility | 280 |
| Involution | 22 |
| Mental stress | 115 |
| Syphilis | 19 |
| Constitutional | 382 |
| Alcohol | 17 |
| Epilepsy | 27 |
| Organic brain disease | 41 |
| Physical disorders | 84 |
Of the 1,509 persons admitted to mental hospitals during 1947, those admitted for the first time to any mental hospital in New Zealand numbered 1,213 (597 males, 616 females), and those readmitted 296 (122 males, 174 females).
The figures for 1947 represent one first admission for every 1,486 persons of the mean population of New Zealand. The number of first admissions and the rate per 10,000 of mean population for each of the last five years were as follows:—
| Year. | Number of First Admissions. | Proportion per 10,000 of Mean Population. | ||||
|---|---|---|---|---|---|---|
| Males. | Females. | Totals. | Males. | Females. | Totals. | |
| 1943 | 453 | 516 | 969 | 5.74 | 6.09 | 5.92 |
| 1944 | 487 | 622 | 1,109 | 6.09 | 7.26 | 6.70 |
| 1945 | 557 | 561 | 1,118 | 6.74 | 6.46 | 6.60 |
| 1946 | 544 | 621 | 1,165 | 6.18 | 7.04 | 6.61 |
| 1947 | 597 | 616 | 1,213 | 6.61 | 6.84 | 6.73 |
| Average of five years | 528 | 587 | 1,115 | 6.27 | 6.74 | 6.51 |
VOLUNTARY INMATES.—A person labouring under mental defect, but capable of understanding the meaning of the procedure, may seek admission to a mental hospital as a voluntary boarder. At the beginning of 1947 there were 402 such patients on the books (196 males, 206 females), and during the year 739 (316 males, 423 females) were admitted. If a voluntary boarder should after admission show mental defect sufficiently pronounced and sustained to render it improper to classify him any longer as such, application for a reception order is made to a Magistrate. During the year 1947, 9 (7 males, 2 females) were transferred from the voluntary to the ordinary register, and 12 males and 12 females died, while 704 (321 males, 383 females) were discharged, leaving 104 (172 males, 232 females) on the records at the end of the year.
A feature of interest is the tendency for voluntary admissions to increase, both in absolute numbers and also in proportion to total admissions. The following series illustrates this trend.
| — | Voluntary Patients First Admissions. | |
|---|---|---|
| Numbers. | Percentage of All First Admissions. | |
| 1915 | 32 | 5.0 |
| 1920 | 64 | 8.8 |
| 1925 | 123 | 16.4 |
| 1930 | 236 | 25.3 |
| 1935 | 217 | 23.8 |
| 1940 | 252 | 26.0 |
| 1945 | 359 | 32.1 |
| 1946 | 462 | 39.7 |
| 1947 | 534 | 44.0 |
AGES OF INMATES.—A summary is given showing the ages of patients in mental hospitals at the end of 1947.
| Age, in Years. | Males. | Females. | Totals. |
|---|---|---|---|
| 1 and under 5 | 50 | 33 | 83 |
| 5 and under 10 | 114 | 77 | 191 |
| 10 and under 15 | 139 | 85 | 224 |
| 15 and under 20 | 221 | 151 | 372 |
| 20 and under 30 | 622 | 493 | 1,115 |
| 30 and under 40 | 839 | 622 | 1,461 |
| 40 and under 50 | 754 | 655 | 1,409 |
| 50 and under 60 | 708 | 794 | 1,502 |
| 60 and under 70 | 671 | 726 | 1,397 |
| 70 and under 80 | 355 | 375 | 730 |
| 80 and under 90 | 63 | 101 | 164 |
| 90 and over | 2 | 6 | 8 |
| Unknown | 29 | 23 | 52 |
| Totals | 4,567 | 4,141 | 8,708 |
Probably symptomatic to some extent of the ageing of the New Zealand population, the number of patients aged sixty years or over has formed a greater proportion of admissions during recent years. Of those remaining in mental hospitals at the end of 1947, patients in this age group numbered 2,299—i.e., 26.40 per cent of the total.
DISCHARGES AND DEATHS.—The next table gives the average number resident, those who were discharged as recovered, and those who died, during the period 1943–47.
| Year. | Average Number resident. | Discharged as recovered. | Died. | ||
|---|---|---|---|---|---|
| Number. | Percentage of Number admitted. | Number. | Percentage of Average Number resident. | ||
| 1943 | 7,694 | 361 | 29.88 | 544 | 7.07 |
| 1944 | 7,871 | 355 | 26.05 | 57.6 | 7.32 |
| 1945 | 7,918 | 460 | 33.53 | 647 | 8.17 |
| 1946 | 7,972 | 453 | 31.61 | 550 | 6.90 |
| 1947 | 8,062 | 561 | 37.18 | 565 | 7.01 |
| Average of five years | 7,903 | 438 | 31.65 | 576 | 7.29 |
The table following shows the duration of residence in mental hospitals of patients who died and of patients who were discharged as recovered during the year 1947. Of those discharged as recovered, 71 per cent. had been inmates for less than one year.
| Duration of Residence. | Patients who died. | Patients discharged as recovered. | ||||
|---|---|---|---|---|---|---|
| Males. | Females. | Totals. | Males. | Females. | Totals. | |
| Under 1 month | 45 | 26 | 71 | 7 | 7 | 14 |
| 1 month and under 3 months | 36 | 18 | 54 | 37 | 52 | 89 |
| 3 months and under 6 months | 26 | 31 | 57 | 47 | 48 | 95 |
| 6 months and under 9 months | 23 | 12 | 35 | 46 | 78 | 124 |
| 9 months and under 12 months | 11 | 15 | 26 | 31 | 46 | 77 |
| 1 year and under 2 years | 27 | 28 | 55 | 39 | 46 | 85 |
| 2 years and under 3 years | 8 | 16 | 24 | 9 | 23 | 32 |
| 3 years and under 5 years | 17 | 27 | 44 | 3 | 13 | 16 |
| 5 years and under 7 years | 12 | 13 | 25 | 9 | 6 | 15 |
| 7 years and under 10 years | 12 | 10 | 22 | 2 | 4 | 6 |
| 10 years and under 12 years | 6 | 7 | 13 | 2 | 2 | |
| 12 years and under 15 years | 14 | 6 | 20 | 3 | 3 | |
| 15 years and over | 73 | 25 | 98 | 3 | 3 | |
| Died during absence | 8 | 13 | 21 | |||
| Totals | 318 | 247 | 565 | 236 | 325 | 561 |
Old age and diseases of the circulatory system are the principal causes of death among mental hospital patients. The figures for the principal causes and groups of causes for the year 1947 are as follows:—
| Tuberculosis | 31 |
| Cancer | 19 |
| Other general diseases | 24 |
| General paralysis of the insane | 8 |
| Epilepsy | 12 |
| Other diseases of the nervous system | 61 |
| Diseases of the circulatory system | 179 |
| Diseases of the respiratory system | 63 |
| Diseases of the digestive system | 6 |
| Diseases of the genito-urinary system | 6 |
| Old age | 123 |
| External causes | 12 |
| Died during absence | 21 |
| Total | 565 |
A table is added showing for all admissions since 1876 the percentages of patients who were discharged (as recovered and relieved, separately), who died undischarged, or who still remained at the end of 1947.
| — | Males. | Females. | Totals. |
|---|---|---|---|
*Includes a small number of patients discharged whose condition was not improved. | |||
| Discharged— | Per Cent. | Per Cent. | Per Cent. |
| Recovered | 32.89 | 38.07 | 35.24 |
| Relieved* | 12.18 | 13.39 | 12.73 |
| Died | 39.76 | 31.99 | 36.23 |
| Remaining at end of 1947 | 15.17 | 16.55 | 15.80 |
| Total admissions, 1876–1947 | 100.00 | 100.00 | 100.00 |
PRIVATE MENTAL HOSPITAL.—A licence may be granted to enable a private mental hospital to receive patients for treatment. Stringent conditions are attached to the issue of such a licence, which may be revoked at any time. The Director of the Mental Hygiene Division of the Health Department has wide powers in the regulation and control of private institutions, which are placed practically on the same footing as public mental hospitals in regard to inspection and other matters.
There is only one licensed private mental institution in New Zealand, that at Wakari (Ashburn Hall), near Dunedin, established in 1882. Particulars of admissions, discharges, deaths, and patients remaining, for the last five years, are as follows. These figures are included in preceding tables.
| Year. | Admissions. | Discharges. | Deaths. | Patients remaining at End of Year. |
|---|---|---|---|---|
| 1943 | 12 | 5 | 8 | 34 |
| 1944 | 1 | 3 | 2 | 30 |
| 1945 | 9 | 3 | 1 | 35 |
| 1946 | 9 | 2 | 3 | 39 |
| 1947 | 22 | 16 | 7 | 38 |
MAORIS IN MENTAL HOSPITALS.—The number of Maoris admitted as patients to mental hospitals is small. The figures for the last five years were:—
| Year. | Admitted during Year. | Remaining at End of Year. | ||||
|---|---|---|---|---|---|---|
| Males. | Females. | Totals. | Males. | Females. | Totals. | |
| 1943 | 16 | 15 | 31 | 95 | 95 | 190 |
| 1944 | 20 | 27 | 47 | 100 | 99 | 199 |
| 1945 | 16 | 11 | 27 | 108 | 100 | 208 |
| 1946 | 17 | 17 | 34 | 135 | 106 | 241 |
| 1947 | 24 | 15 | 39 | 141 | 96 | 237 |
The above figures are also included in the tables covering all inmates of mental hospitals.
The number of Maoris remaining in mental hospitals at the end of 1947 represented a rate of only 21.93 per 10,000 of the Maori population, as compared with a rate of 49.39 in the case of the European population.
EXPENDITURE, ETC.—The total expenditure on maintenance of public mental hospitals (not including the cost of new buildings and additions) and particulars of receipts during the last eleven financial years are shown in the next table. As from 1st April, 1939, free maintenance and treatment have been provided in all public mental hospitals ill accordance with the provisions of the Social Security Act, 1938. The consequent loss of revenue through the operation of the Act was recoverable from the Social Security Fund, but as from 1st April, 1945, such recoveries ceased, and from that date all maintenance expenditure has been borne by the Consolidated Fund. The amounts shown as receipts on account of patients' fees for the years subsequent to 1938–39 represent the recovery of accounts outstanding at 31st March, 1939.
| Year ended 31st March, | Total Expenditure. | Receipts, | Net Expenditure. | Gross Average Cost per Patient. | ||
|---|---|---|---|---|---|---|
| Patients' Fees. | Sale of Produce, &c. | Social Security. Fund. | ||||
| £ | £ | £ | £ | £ | £ s. d. | |
| 1938 | 608,328 | 155,803 | 58,071 | 394,454 | 78 18 9 | |
| 1939 | 641,053 | 162,135 | 61,436 | 417,483 | 83 5 9 | |
| 1940 | 658,290 | 122,581 | 65,956 | 166,000 | 303,753 | 84 11 2 |
| 1941 | 685,605 | 20,293 | 68,641 | 171,000 | 425,671 | 86 11 4 |
| 1942 | 709,887 | 14,964 | 72,832 | 181,451 | 440,640 | 89 9 4 |
| 1943 | 738,204 | 13,030 | 68,870 | 181,869 | 474,435 | 92 12 5 |
| 1944 | 766,530 | 13,218 | 66,198 | 183,199 | 503,915 | 95 4 2 |
| 1945 | 827,128 | 8,207 | 67,433 | 187,942 | 563,546 | 100 6 1 |
| 1946 | 940,167 | 5,859 | 70,500 | 863,808 | 113 8 2 | |
| 1947 | 1,072,130 | 8,228 | 87,065 | 976,837 | 128 10 2 | |
| 1948 | 1,243,332 | 8,958 | 88,397 | 1,145,977 | 147 12 3 | |
During the period covered by the foregoing table, total expenditure increased by £635,004, or 104.4 per cent., while the gross average cost per patient rose by £68 13s. 6d. per annum, or 87.0 per cent.
As already stated, the expenditure included in the foregoing table does not include amounts spent on new buildings, additions, &c., the cost of which is met by the Works Department. The sums spent in this connection fall away considerably in the later war years, but, in the ten years ended with the financial year 1947–48 the amount totalled £1,321,762, while the aggregate expenditure from 1st July, 1877 to 31st March, 1948, was £3,532,698.
THE education system of Now Zealand can be understood only when it is seen against its historical background. The first settlements in the new colony were relatively isolated units each of which had to make its own provision for the education of its children. In some places the provision of schools was left to the churches, in some to private enterprise, and in others to public associations. When the provinces were established in 1852, the Provincial Councils took over education as one of their functions, but this brought no degree of uniformity to New Zealand schools, for each province tended to foster the type of school organization already established in its area. The provinces varied considerably in the efficiency of their school systems; but, in spite of some success in the face of difficulties in certain areas, at the end of the provincial period in 1876 not more than half the children between the ages of five and fifteen were attending school at all.
The present national system of free, secular, and compulsory* education is based on the Education Act of 1877. This Act followed upon the abolition of the provinces, but the provinces, though dead as political units, left their mark upon the school system. A fierce struggle between the protagonists of central and of local control ended in a victory for the provincialists, and the public schools were placed under the control of District Education Boards, which were for the most part the same bodies as the old Provincial Education Boards. The Colonial Government, however, had to provide all the finance in the form of capitation grants, and a small Department of Education was sot up in Wellington, very largely for the purpose of distributing the grants. For every school district constituted under the Act there was a School Committee, elected by householders, which, subject to the control of the Board, had “the management of educational matters within the school district.” The School Committees elected the members of the Education Board.
As far as mere structure is concerned, this still remains the pattern of the system of school administration in New Zealand, but there have been, in the intervening years, great changes in the relative functions of the three authorities. The general tendency has been for final power and responsibility to shift from the Committees to the Boards and from the Boards to the Department. The Committees, in fact, through lack of professional executive officers and independent sources of revenue, from the very beginning were unable to take over the full powers that the 1877 Act obviously intended them to have, and for the first twenty years of national education the Education Boards were the predominant authorities in the system.
From just before the beginning of this century the Education Department began to play an increasingly important part in educational administration, partly -as a result of improved means of communication. Under the Act of 1877 the Boards had been given wide powers: to administer funds from endowments and departmental grants, to appoint and remove teachers, to pay teachers' salaries according to their own scales, to establish scholarships and provide for secondary education in district high schools, and to control the inspectorate. Legislation, beginning with the establishment of a national scale of primary school salaries and staffing in 1901 and culminating in the Education Act of 1914 (still the basic measure under which the education system is administered), concentrated these powers more and more in the hands of the Department, which began to take a more detailed interest in expenditure by the Boards. The original freedom of the Boards in the expenditure of building grants was taken away, and the present system, requiring special departmental authorization for each new building, gradually became established. From 1901 onwards the Department paid over to the Boards the exact sum required for teachers' salaries, thus leaving a much-reduced capitation grant to be used by the local authorities at their own discretion. In 1914 the Department took over the control of the primary-school inspectorate.
*Every child (with certain statutory exemptions) between the ages of seven and fifteen years has to be enrolled as a pupil of either a public or a registered school.
The centralization of the inspectorate made possible a further change affecting the powers of the Boards. In 1920 a New Zealand grading scheme was instituted under which all primary-school teachers were annually awarded grading marks by the Inspectors. A teacher's total marks give him a place on a numerically graded list. Since all ordinary appointments are decided on the basis of this list, the system of appointment is in effect a national one, and the Boards have very limited powers of discretion although they make the appointments and the teachers are servants of the Boards. In 1940 biennial grading was substituted for annual grading, thus freeing the inspectors of schools in alternate years to give more time to schools. The provision of an annual grading number for teachers was, however, retained.
It does not follow, however, that, since the Boards and the School Committees have lost many of their original powers, they have ceased to play an important part in the system. The Committee's primary function is the care of school buildings, grounds, and equipment, but, in addition to this, many interest themselves very keenly in the general activities of the school and provide in each district a focusing-point for local opinion on educational matters. The Education Boards are still the initiating bodies on matters of buildings, sites, conveyance of pupils, consolidation, and provision of school facilities generally; and, although the final word often lies with the Minister of Education or the Department, the Boards have no small influence in the fixing of policy within their districts. The schools are legally their schools and the teachers their teachers, and, although in general the Boards' choices of applicants are limited by the grading system, they have much more discretion in the selection of applicants for special or key positions. The teachers' class-room activities are under the control of the Inspectors, but their general responsibility is to the Boards, and their professional life tends to centre on the Boards rather than on the Department. In spite of the apparent clumsiness of the administrative structure and of periods of strong feeling in the past, the system at present functions remarkably smoothly, and has achieved a balance, workable if not ideal, between the claims of local initiative and national efficiency.
Post-primary education, with the exception of that given in the district high schools, was not brought by the Act of 1877 within the province of the Education Boards. Several secondary schools had been established in various ways before 1877, and these continued under their own Boards of Governors, which were in no way related to the Education Boards. The Education Reserves Act, 1877, set aside one-fourth of the educational reserves for secondary education, vesting the remainder in the Education Boards for primary-school purposes. Thus there was introduced into the colony that cleavage between elementary and secondary education that was characteristic of the English system. In the years immediately following the Act of 1877, a series of Acts set up a number of local High School Boards, each in control of its own land endowments. No effective provision was made for the inspection of these schools by any outside authority or for the co-ordination of their work with any other part of the school system.
Further secondary schools, and, from 1902 onwards, technical high schools, were from time to time established. Before 1901, fees had been charged oven in district high schools. In that year free places were instituted in district high schools, and in 1902 secondary schools were offered special capitation grants if they would provide free places for deserving scholars. Under the Education Act of 1908 free places at the technical schools were granted on a more liberal basis, and by 1914 all State post-primary schools were obliged to give free places for two years at least to any pupil who had passed the Proficiency examination. In 1936 the Proficiency examination was abolished and free post-primary education to the end of the year in which he reached nineteen years of age became available to every child completing a primary-school course or on attaining fourteen years of age.
A direct effect of this movement towards free post-primary education was that the Department began to exercise an increasing degree of control over the schools. The Education Amendment Act, 1920, authorized the establishment of New Zealand stalling and salary scales for post-primary schools, and instituted the system—already operative in the case of the Education Boards—of paying over to the schools the exact sum required for salaries plus a capitation grant for incidental expenses, less the amount received from local secondary-school endowments. This, in effect, nationalized these endowments, and spread more evenly the benefits resulting from the foresight of the early settlers.
THE SCHOOL SYSTEM.—Perhaps the best method of sketching the outline of the school system as it now stands is to trace the career of a child as he passes through the system. He may at the age of three enter a free kindergarten under the control of the Free Kindergarten Association, At the age of five he may enter, and at seven he must enter, either a primary school under one of the nine Education Boards, or a registered private primary school. All State primary schools are co-educational. The child passes through the infant classes and Standards 1, 2, 3, and 4. At this point he will in most places go straight on to Forms I and II in the same school, but since 1922 there have been established a number of intermediate schools (under the control of Education Boards) and intermediate departments (most of them under post-primary school Boards), which take Form I and II pupils from contributing schools in their areas. Prior to 1932 those schools were called junior high schools.
On satisfying the requirements of his headmaster in Form II the child is granted a Primary School Certificate, on the receipt of which, or on reaching the age of fourteen, he becomes entitled to free post-primary education until the age of nineteen is reached. The Education Amendment Act, 1920, made provision for the raising of the school-leaving age from fourteen to fifteen years, but this change was not brought into operation until February, 1944, and all children are now required to attend school until the new leaving-age is reached. This means, in effect, that some period of secondary education is now compulsory for nearly all children. The only provision for exemption is inability to profit from the further period of education.
When a country child leaves the primary stage he may have no alternative but to enter Form III of a district high school (which is really a secondary top to a primary school and is under the same control), or enrol in the Correspondence School. In more thickly populated areas there will be either a secondary school or a technical high school available. In some towns a secondary school and a technical high school have been amalgamated to form a combined school. To those not understanding the peculiar character of the New Zealand technical high school this may seem a strange union, but the differences between schools of the two types are, except in the larger centres, relatively slight.
The technical schools, combined schools, and a few of the secondary schools run evening classes, particularly in practical and vocational subjects, which an adolescent may attend after he leaves full-time day school. Apprentices in some trades are required to attend evening classes as a part of their trade training. In 1948 approval was given to the establishment of day classes for apprentices in certain trades.
Prior to 1944 all pupils desiring to undertake a University course were required to sit and pass the University Entrance Examination conducted by the University of New Zealand. In 1944 a system of accrediting came into operation. Under this system pupils attending certain approved schools may be accredited for matriculation purposes provided they have completed a four years' post-primary-school course. The University Entrance Examination is still conducted by the University of New Zealand, and pupils not accredited for entrance to University may qualify in this manner. The standard of the present entrance examination is somewhat higher than that maintained prior to the introduction of the accrediting system.
Pupils who have been accredited for, or who have passed the University Entrance Examination, may, without further post-primary education, receive tuition fees to the extent of £20 per annum for a period of four years at a University college.
The School Certificate Examination conducted by the Education Department is now regarded as the accepted teat of a completed post-primary education for the great bulk of the pupils who do not desire to proceed to University. The School Certificate Examination is normally taken at the end of the third year of the post-primary course, and the School Certificate is awarded to pupils who pass the examination and, in other respects have complied with the regulations governing the award of the certificate.
Provision is contained in the Education (Post-primary Instruction) Regulations 1945 for endorsement of School Certificates on satisfactory completion of an advanced course of instruction for one year. Provision is also made in the regulations for the award of Higher School Certificates. In general this certificate is awarded after a five years' course to pupils who have been awarded a School Certificate and satisfactorily complete an advanced course of two years; and to pupils who have been accredited for or have passed the University Entrance Examination and satisfactorily complete an advanced course of one year.
The University of New Zealand, whose controlling body is the University Senate, is constituted of University colleges in Auckland, Wellington, and Canterbury, and the University of Otago (which does not itself grant degrees). The School of Agriculture, consisting of Massey and Canterbury Agricultural Colleges and governed under one Council in connection with the University of New Zealand, is open to students specializing in agricultural studies.
The five teachers' training colleges, although they work in conjunction with the four University colleges, are organically related to them only through their Boards of Studies. The Education Boards in the four main centres are the controlling authorities of the training colleges.
The State system also caters for the needs of certain special groups of children. Maori children may attend the public schools, but there are also Maori village schools provided for their primary education.* There are also a few mission schools remaining from the pre-Maori War system established with the help of Government subsidies. For his post-primary education the Maori child may go free to any available secondary school, including seven Maori district high schools; but in certain remote areas he will go to a denominational Maori secondary school. Some of these denominational secondary schools are financed in part from public endowments especially provided, and all of them receive funds from special State scholarships.
Children living in isolated areas or prevented in other ways from attending school may be enrolled in the Correspondence School for both primary and post primary work.
Finally there are several special schools and smaller homes, administered by the Education Department's Child Welfare Branch, to take care of deaf-and-dumb, backward, or delinquent children.
In addition to the various State schools described, a parent may send his child to a private school, either primary or secondary, conducted by either religious bodies or private individuals. No Government free place is tenable at these schools†, but a Secondary School Bursary (referred to on p. 149) may be tenable at a private school, while assistance for transport by rail and road and a boarding-allowance under certain conditions may also be given to pupils attending private schools, whether primary or post-primary. All private schools must be registered, and are subject to an annual inspection by the Department's Inspectors.‡ The majority of the private schools are conducted by the Roman Catholic Church. Amongst the private schools are two endowed secondary schools modelled after the English public school.
To complete the above sketch it should be added that co-education exists only in certain stages of the system. In the public, Maori, technical, and some of the secondary schools (particularly those in the country), in the teachers' training colleges, and in the University colleges, pupils and students of both sexes attend together. The principal State secondary schools in the larger centres, however, and—with a few exceptions—all the registered private secondary schools, are single-sex schools.
* Established under the Maori Schools Act, 1867, and administered by the Education Department since 1880.
† Except for Maori “Government pupils” in the denominational secondary schools.
‡ Education Amendment Act, 1021–22.
During 1944 consideration was given to the report of the Consultative Committee on the post-primary curriculum. This report is probably the most important contribution ever made to secondary education in New Zealand. In October, 1944, the Minister of Education called a conference in Christchurch to consider pre-school education, youth services, adult education, religion in education, and rural education. It was the first widely representative conference on education held in New Zealand, and valuable reports were made on the topics under consideration. Some of the recommendations of the conference have since been put into effect.
PUPILS AND STUDENTS.—The number of pupils and students receiving instruction in the educational institutions of New Zealand is shown in the following summary. The table refers to roll numbers as at the end of the year (except in the case of technical classes, which are as at 1st July).
| Class of Institution. | 1943. | 1944. | 1945. | 1946. | 1947. |
|---|---|---|---|---|---|
* Exclusive of children in kindergartens (3,325 in 1947). † There were also 2,376 students taking part-time courses. ‡ Part-time students. § Includes 890 students taking short courses at the Agricultural colleges in 1947. | |||||
| Primary Education | |||||
| Public (State) schools | 204,060 | 205,927 | 209,616 | 218,305 | 226,806 |
| Intermediate schools and departments | |||||
| Maori village schools | 11,274 | 11,793 | 12,190 | 12,654 | 13,170 |
| Maori mission schools | 614 | 646 | 708 | 730 | 784 |
| Registered private primary schools | 28,714 | 29,071 | 29,693 | 30,776 | 31,820 |
| Lower departments of secondary schools | 187 | 185 | 170 | 185 | 197 |
| Correspondence classes (primary) | 1,941 | 1,920 | 1,912 | 1,857 | 1,972 |
| Chatham Islands schools | 125 | 108 | 113 | 124 | 105 |
| Totals, primary* | 246,915 | 249,650 | 254,402 | 264,631 | 274,854 |
| Post-primary Education | |||||
| Secondary schools | 14,774 | 16,903 | 17,617 | 17,896 | 17,819 |
| Combined schools | 2,901 | 3,233 | 3,263 | 3,364 | 3,351 |
| Secondary departments of district high schools | 5,197 | 6,187 | 6,872 | 6,656 | 6,666 |
| Technical high schools | 8,436 | 10,233 | 10,865 | 11,712 | 12,328 |
| Maori secondary (boarding) schools | 371 | 487 | 490 | 563 | 622 |
| Registered private and endowed secondary schools | 6,572 | 7,378 | 8,027 | 8,532 | 8,968 |
| Correspondence classes (secondary) | 559 | 672 | 738 | 678 | 618† |
| Totals, post-primary | 38,810 | 45,093 | 47,872 | 49,401 | 50,372 |
| Technical Classes (excluding Technical High Schools and Technical Day Schools) | |||||
| Conducted by Education, Secondary School, or High School Boards | 2,489 | 3,567 | 3,495 | 4,194 | 5,684 |
| Conducted by Technical School Boards | 9,002 | 10,264 | 10,839 | 12,330 | 12,720 |
| Conducted by University colleges | 368 | 412 | 348 | 333 | 293 |
| Totals, technical‡ | 11,859 | 14,243 | 14,682 | 16,857 | 18,697 |
| University Education | |||||
| University colleges | 4,921 | 5,840 | 6,804 | 9,807 | 9,900 |
| Canterbury Agricultural College | 120 | 382 | 564 | 719 | 695 |
| Massey Agricultural College | 140 | 362 | 618 | 737 | 738 |
| Students exempt from lectures | 772 | 1,146 | 1,345 | 1,186 | 1,431 |
| Totals, University | 5,953 | 7,730 | 9,331 | 12,449 | 12,764§ |
| Totals, scholars and students* | 303,537 | 316,716 | 326,287 | 343,338 | 356,687 |
There have been substantial increases under practically all headings during the period covered by the foregoing table, particularly during the last three years.
During the period 1939–44 the number of pupils attending primary schools remained almost stationary, but there was an increase of approximately 5,000 in 1945, followed by further increases of slightly over 10,000, in each of the next two years. Factors contributing to these increases would be the low birth-rates in the depression period resulting in relatively fewer children leaving primary schools, the increase in the number of births in the years 1939–41, the raising of the school-leaving age in 1944, and the arrival of several hundred refugee children from overseas.
The numbers of full-time post primary students fell away during the earlier war years, due, no doubt, to the demand for wartime labour. There was an increase of 3,080 in 1943, followed by a further increase of 6,283 in 1944, the raising of the school-leaving age being largely responsible for the latter. Since 1944 there have been further increases, but on a very much lower scale than in the case of primary schools.
The number of part-time students attending technical classes also fell away during the early war years, the 1942 figure being 38 per cent. less than in 1939. Each year since 1942 has recorded an increase, and the number in 1947 was 1,469 greater than in 1939, and 8,032 above the 1942 total.
University students fell from 5,979 in 1939 to 4,373 in 1942, but since then there has been a series of remarkable increases, the total at the end of 1947 being 12,764, almost three times as many as in 1942.
ANNUAL EXAMINATIONS.—The number of candidates who actually presented themselves for the various examinations conducted by the Education Department during the last five years is given below.
| Examination. | 1943. | 1944. | 1945. | 1946. | 1947. |
|---|---|---|---|---|---|
* Final grade only. | |||||
| Public Service Entrance | 2,902 | 2,784 | 2,395 | ||
| Teachers' Certificate | 184 | 233 | 235 | 237 | 265 |
| School Certificate | 5,470 | 6,052 | 6,693 | 8,300 | 8,706 |
| Special Bursaries | 196 | 205 | |||
| London University | 6 | 4 | 8 | 10 | 6 |
| Handicraft Teachers' Certificate | 4 | 12 | 13 | 24 | 29 |
| Homecraft Teachers' Certificate | 34 | 36 | 40 | 51 | |
| Technological | 6* | 15* | 24* | 176 | 249 |
| City and Guilds of London | 107 | ||||
| Naval Cadetships | 11 | 12 | 6 | 10 | 7 |
| Totals | 8,583 | 9,146 | 9,410 | 8,993 | 9,625 |
The University of New Zealand conducted examinations in 1947 in the faculties of arts, science, medicine, dentistry, home science, law, engineering, commerce, agriculture, music, architecture and divinity; for diplomas in journalism, in banking, and in fine arts; and for admission to the legal and accountancy professions. There were 15,957 entrants for the degree and professional examinations in 1947, compared with 14,455 in 1946 and 10,428 in 1945.
The number of entries for the University Entrance Examination in the last five years has been: 1943, 5,152; 1944, 543; 1945, 973; 1946, 1,773; 1947, 1,656. The lower number of entries in the years following 1943 is accounted for by the system of accrediting which was introduced in 1944 (see p. 137). The numbers accredited since the system has been in operation have been as follows: 1944, 308; 1945, 1,213; 1946, 1,484; and 1947, 1,844. In addition, 1,320 were granted a special concession pass on the results of the School Certificate Examination in the initial accrediting year (1944).
PUBLIC EXPENDITURE ON EDUCATION.—The following table shows the expenditure from public funds on each branch or service of education for the year ended 31st March, 1948. Owing to a change in the method of presenting the departmental accounts it is not possible to give comparable figures for individual items for previous years, but the following figures of total not expenditure are comparable with the corresponding sum of £9,950,818 for 1947–48; 1943–44, £5,221,389; 1944–45, £6,216,947; 1945–46, £7,853,049; 1946–47, £8,711,637.
| — | Gross Expenditure. | Recoveries. | Net Expenditure. |
|---|---|---|---|
| Expenditure from Vote, Education— | £ | £ | £ |
| General | 940,572 | 21,409 | 919,163 |
| Buildings, land, furniture, and equipment | 558,504 | 26,804 | 531,700 |
| Primary education | 3,910,762 | 102,263 | 3,808,499 |
| Post-primary education | 1,695,216 | 7,413 | 1,687,803 |
| Higher education | 556,622 | 197 | 556,425 |
| Training of teachers | 458,723 | 15 | 458,708 |
| Maori schools | 242,762 | 1,133 | 241,629 |
| Education of the blind | 11,559 | 630 | 10,929 |
| Special schools | 61,613 | 6,644 | 54,969 |
| Child welfare | 327,082 | 36,483 | 290,599 |
| Miscellaneous grants | 39,104 | 39,104 | |
| National Library Service | 80,727 | 3,979 | 76,748 |
| Totals, vote Education | 8,883,246 | 206,970 | 8,676,276 |
| Expenditure from other sources— | |||
| Vote, Education Buildings | 1,065,870 | 52,104 | 1,013,766 |
| Cost-of-living bonus to teacher annuitants | 1,102 | 1,102 | |
| Secondary education, reserves revenue | 10,506 | 12,832 | Cr. 2,326 |
| Government contribution to Teachers' Superannuation Fund | 262,000 | 262,000 | |
| Grand Totals | 10,222,724 | 271,906 | 9,950,818 |
The foregoing figures include amounts paid from reserves revenues, but not revenues received by certain post-primary schools and University colleges from endowments, fees, &c., which are available for educational purposes. The direct income from reserves vested in post-primary schools in 1947–48 was £47,860, and of University colleges, £16,985.
There is now given a series of comparative figures which shows the cost of education during the period 1937–38 to 1947–48.
| Year ended 31st March, | Expenditure from Public Funds. | Expenditure per Head of Mean Population. |
|---|---|---|
| £ | £ s. d. | |
| 1938 | 4,619,134 | 2 17 11 |
| 1939 | 5,099,523 | 3 3 4 |
| 1940 | 5,563,326 | 3 8 1 |
| 1941 | 5,355,393 | 3 5 6 |
| 1942 | 5,218,618 | 3 3 10 |
| 1943 | 5,038,395 | 3 1 5 |
| 1944 | 5,221,389 | 3 3 9 |
| 1945 | 6,216,947 | 3 14 8 |
| 1946 | 7,853,049 | 4 11 10 |
| 1947 | 8,711,637 | 4 18 3 |
| 1948 | 9,950,818 | 5 9 10 |
From the foregoing table it will be seen that public expenditure on education, both as regards the total amount and the amount per head of population, has doubled during the last ten years.
PRIMARY SCHOOLS.—The primary-school system consisted in December, 1947, of 1,963 public schools (including district high schools and intermediate schools or departments), 160 Maori village and 10 Maori mission schools, 297 registered private primary schools, and 4 lower departments of secondary schools. There were also 73 free kindergarten schools.
Lower departments of secondary schools may be run for pupils who have not passed Form II, provided that no part of the cost of instruction or of the maintenance of the department is met out of the income from endowments of the school or from Government grants. At the end of 1947 the total number of pupils in the four departments mentioned in the preceding paragraph was 197, (143 boys, 54 girls), with 7 teachers.
The curriculum of the primary school, as set out in the syllabus of instruction, includes English, arithmetic, social studies in geography and history, drawing and handwork (including needlework), nature-study and elementary science, physical education, moral instruction and health, and singing. Elementary science, agriculture, and, in some schools, dairy work are taught by the regular staff under the supervision of specialist itinerant instructors. At the Forms I and II levels woodwork and metal-work instruction is given to boys at manual-training centres, and girls are taught domestic subjects, including cookery and hygiene.
The whole of the curriculum is being systematically revised by a number of committees representative of the Education Department and of teachers' organizations. The report of the Arithmetic Syllabus Revision Committee was the first to be adopted, and during 1944 a series of arithmetic text-books was issued to primary schools. Since then revised syllabuses in oral expression, written expression, health education, spelling, history and geography, needlework, and nature study have been published and adopted in the schools. English text-books up to Standard 3 have been distributed. These text-books are issued free of charge to pupils in all schools, both State and private.
At the end of the primary course a pupil may receive from the headmaster a Primary School Certificate to the effect that he has satisfactorily completed the work of Form II as prescribed in the Public Schools Syllabus. This certificate replaced the Proficiency Certificate which was abolished in 1936.
Kindergartens.—Children below the age of five are not enrolled in the State primary schools. They may be enrolled, however, at free kindergartens controlled by local branches of the New Zealand Free Kindergarten Association. In 1947 a Supervisor of Pre-school Services was appointed to the Department of Education. In 1948 the Department undertook the payment of the salaries of kindergarten teachers, trainees, and full-time teachers at training centres, and the system of payment of capitation grants to the Association was discontinued. Subsidies on voluntary contributions raised for the purchase of land, erection of buildings, and purchase of initial equipment are paid by the Department. The number of trainees in 1947 was 113.
At the end of 1947 there were 3,325 children on the rolls of 73 free kindergartens. As yet the system is far from universal.
Public (State) Schools.—The figures tabulated below refer to pupils in public schools—i.e., all pupils in primary schools and intermediate schools and departments. Pupils in the secondary departments of district high schools are not included.
| Year. | Population at 31st December (excluding Maoris). | Number of Schools (including Intermediate Schools and Departments). | Pupils at End of Year. | Mean of Average Weekly Roll. | Average Attendance, Whole Year. | Average Attendance as Percentage of Weekly Roll. |
|---|---|---|---|---|---|---|
| 1943 | 1,543,786 | 2,090 | 204,060 | 197,466 | 176,261 | 89.3 |
| 1944 | 1,575,451 | 2,076 | 205,927 | 197,084 | 175,478 | 89.0 |
| 1945 | 1,628,788 | 2,049 | 209,616 | 200,825 | 177,997 | 88.6 |
| 1946 | 1,679,653 | 2,030 | 218,305 | 208,035 | 181,005 | 87.1 |
| 1947 | 1,714,999 | 1,963 | 226,806 | 220,808 | 199,443 | 90.0 |
Of the 1,963 schools shown above for 1947, 1,294 had rolls of not more than seventy, and of these 653 had rolls ranging from one to twenty-four.
In each of the education districts are located Inspectors of Primary Schools, who form part of the staff of the Department of Education. The total number of Primary-school Inspectors on the 31st March, 1947, was 42, allocated as follows: Auckland, 13; Hawkes Bay, 3; Taranaki, 2; Wanganui, 3; Wellington, 7; Nelson, 2; Canterbury, 6; Otago, 4; Southland, 2.
The following table relates to pupils on the rolls of the public primary schools and Forms I and II only of intermediate schools at 1st July in each of the years shown.
| Age, in Years. | 1945: Total Pupils. | 1946: Total Pupils. | 1947. | Percentage of Total Pupils. | ||||
|---|---|---|---|---|---|---|---|---|
| Boys. | Girls. | Total Pupils. | 1945. | 1946. | 1947. | |||
| 5 and under 6 | 23,914 | 27,094 | 14,306 | 13,716 | 28,022 | 12.0 | 13.2 | 12.9 |
| 6 and under 7 | 24,233 | 26,787 | 15,822 | 14,699 | 30,521 | 12.2 | 13.1 | 14.1 |
| 7 and under 8 | 23,662 | 24,192 | 14,222 | 13,212 | 27,434 | 11.9 | 11.8 | 12.7 |
| 8 and under 9 | 22,661 | 23,500 | 12,411 | 12,086 | 24,497 | 11.4 | 11.4 | 11.3 |
| 9 and under 10 | 21,802 | 22,411 | 12,158 | 11,524 | 23,682 | 10.9 | 10.9 | 10.9 |
| 10 and under 11 | 21,232 | 21,427 | 11,542 | 11,104 | 22,646 | 10.6 | 10.4 | 10.4 |
| 11 and under 12 | 21,013 | 20,953 | 10,996 | 10,511 | 21,507 | 10.5 | 10.2 | 9.9 |
| 12 and under 13 | 20,234 | 19,889 | 10,510 | 9,662 | 20,172 | 10.2 | 9.7 | 9.3 |
| 13 and under 14 | 13,357 | 12,479 | 6,905 | 5,469 | 12,374 | 6.7 | 6.1 | 5.7 |
| 14 and under 15 | 6,131 | 5,551 | 3,154 | 2,037 | 5,191 | 3.1 | 2.7 | 2.4 |
| 15 and under 16 | 1,016 | 944 | 577 | 300 | 877 | 0.5 | 0.5 | 0.4 |
| 16 and over | 98 | 95 | 63 | 58 | 121 | |||
| Totals | 199,353 | 205,322 | 112,666 | 104,378 | 217,044 | 100.0 | 100.0 | 100.0 |
In 1947 a total of 15,885 pupils (8,075 boys and 7,810 girls) left public primary schools, as compared with 15,970 (8,090 boys and 7,880 girls) in 1946. Of those leaving in 1947, 14,390, or 90.6 per cent., had gained the Primary School Certificate. The effect of the raising of the school-leaving age in 1944 is reflected in the numbers who proceeded to full-time post-primary schooling. Of those leaving in 1947, 86 per cent, (boys, 83 per cent., girls, 88 per cent.) went on to secondary school, as compared with 76 per cent. (boys 74 per cent., girls 78 per cent.) in 1943.
The next table gives the number of public primary schools in each education district as at 31st December, 1917, classified according to roll numbers. The number of intermediate schools and departments is also shown.
| Roll-numbers. | Education District. | |||||||||
|---|---|---|---|---|---|---|---|---|---|---|
| Auckland. | Taranaki. | Wanganui. | Hawkes Bay. | Wellington. | Nelson. | Canterbury. | Otago. | Southland. | Totals. | |
| 1–8 | 10 | 2 | 17 | 10 | 13 | 12 | 9 | 11 | 7 | 91 |
| 9–24 | 130 | 31 | 57 | 56 | 58 | 25 | 107 | 49 | 49 | 562 |
| 25–30 | 50 | 8 | 9 | 11 | 4 | 5 | 27 | 13 | 13 | 140 |
| 31–70 | 182 | 46 | 38 | 34 | 33 | 24 | 60 | 42 | 42 | 501 |
| 71–110 | 62 | 11 | 15 | 10 | 21 | 5 | 32 | 12 | 11 | 179 |
| 111–150 | 36 | 9 | 8 | 9 | 8 | 4 | 9 | 10 | 8 | 101 |
| 151–190 | 17 | 6 | 3 | 6 | 2 | 4 | 6 | 6 | 2 | 52 |
| 191–230 | 9 | 2 | 3 | 4 | 8 | 2 | 4 | 1 | 2 | 35 |
| 231–270 | 7 | 3 | 3 | 8 | 5 | 2 | 1 | 29 | ||
| 271–310 | 13 | 5 | 2 | 2 | 3 | 7 | 4 | 1 | 37 | |
| 311–350 | 8 | 2 | 2 | 2 | 1 | 6 | 1 | 2 | 24 | |
| 351–390 | 8 | 5 | 6 | 1 | 1 | 6 | 1 | 28 | ||
| 391–430 | 7 | 1 | 2 | 2 | 9 | 4 | 3 | 28 | ||
| 431–470 | 7 | 2 | 5 | 1 | 3 | 2 | 7 | 2 | 2 | 31 |
| 471–510 | 11 | 1 | 1 | 3 | 1 | 2 | 1 | 20 | ||
| 511–550 | 5 | 1 | 2 | 1 | 6 | 1 | 16 | |||
| 551–590 | 7 | 3 | 2 | 1 | 2 | 1 | 16 | |||
| 591–630 | 3 | 3 | 1 | 4 | 2 | 1 | 1 | 15 | ||
| 631–670 | 3 | 1 | 1 | 1 | 1 | 7 | ||||
| 671–710 | 3 | 1 | 2 | 6 | ||||||
| 711–750 | 5 | 1 | 1 | 1 | 8 | |||||
| 751–790 | 1 | 1 | 2 | 4 | ||||||
| 791–830 | 4 | 4 | ||||||||
| 951–990 | 1 | 1 | ||||||||
| Intermediate schools and departments | 14 | 2 | 2 | 3 | 2 | 4 | 1 | 28 | ||
| Totals | 603 | 127 | 171 | 161 | 195 | 87 | 303 | 171 | 145 | 1,903 |
Primary Schools for Maoris.—Over one-half of the Maori children in New Zealand are educated in the public schools. At the end of 1947 there were 16,804 attending public schools out of a total of 28,840 Maori children receiving primary education in State schools.
The language of instruction in the Maori schools is English, but the schools are not completely English in outlook, for Maori arts and crafts, song, legend, and history are taught.
Methods of teaching are practical, and objectives closely related to the special needs of the Maori people. In many of the Maori schools, such equipment as woodwork-rooms, cookery-rooms, model cottages, baths, hot and cold showers, and laundries is supplied. Elementary agriculture and health are essential centres of activity in every Maori school.
The number of pupils on the rolls of the 160 Maori village schools at the end of 1947 was 13,170 (including 1,134 European children), while the total roll number of the ten Maori mission schools was 784.
The following table gives the principal statistics of Maori village schools during the last five years.
| Year. | Number of Schools at End of Year. | Roll at 1st July. | Average Attendance, Whole Year. | Average Attendance as Percentage of Weekly Roll. | Number of Teachers.* | ||
|---|---|---|---|---|---|---|---|
| Maori. | European. | Males. | Females. | ||||
* Includes Junior Assistants (13 males and 78 females in 1917). | |||||||
| 1943 | 156 | 9,975 | 939 | 9,261 | 84.4 | 145 | 335 |
| 1944 | 156 | 10,434 | 883 | 9,825 | 86.9 | 156 | 343 |
| 1945 | 157 | 10,947 | 883 | 10,173 | 86.2 | 171 | 342 |
| 1946 | 159 | 11,305 | 913 | 10,647 | 86.2 | 177 | 357 |
| 1947 | 160 | 11,555 | 1,042 | 11,159 | 88.0 | 193 | 294 |
Four Inspectors of Schools attached to the Education Department are engaged in the inspection of Maori schools, mission schools, and secondary schools for Maoris.
Intermediate Schools.—The intermediate school (formerly termed junior high school) was first initiated as an experiment in New Zealand in 1923. By the end of 1947, twenty-eight intermediate schools or departments had been established, of which sixteen are separate schools, eleven are attached to secondary or technical schools, and one to the secondary department of a district high school. A child may transfer to an available intermediate school after passing Standard 4 of the primary school or, with special permission of the Director of Education, on reaching the age of thirteen. Since 1932 the regular course has been two years, though in most schools, particularly where pupils are not proceeding to a post-primary school, a third-year course is available. The main purpose of the intermediate school is to secure the benefits of consolidation for the older children and, through the provision of varied and enriched courses, to help them decide on their lines of further education.
Pupils on the rolls of intermediate schools and departments at the end of 1947 numbered 9,845. The progress that is being made with the establishment of this type of school may be gauged from the fact that ten years earlier (1937), the number of pupils was 4,387. Of all children in Forms I and II of public, primary, and intermediate schools at the end of 1947, 23 per cent. were enrolled at the intermediate schools. The average attendance during the year was 9,336. The ages of pupils on the roll at 1st July of each of the last three years were:—
| Age, in Years. | 1945. | 1946. | 1947. | ||||||
|---|---|---|---|---|---|---|---|---|---|
| Boys. | Girls. | Total. | Boys. | Girls. | Total. | Boys. | Girls. | Total. | |
| Under 11 | 70 | 77 | 147 | 55 | 89 | 144 | 55 | 81 | 136 |
| 11 and under 12 | 926 | 1,067 | 1,993 | 1,020 | 1,165 | 2,185 | 1,093 | 1,215 | 2,308 |
| 12 and under 13 | 1,732 | 1,663 | 3,395 | 1,844 | 1,845 | 3,689 | 1,911 | 1,857 | 3,768 |
| 13 and under 14 | 1,325 | 1,127 | 2,452 | 1,386 | 1,065 | 2,451 | 1,397 | 1,141 | 2,538 |
| 14 and under 15 | 707 | 635 | 1,342 | 721 | 563 | 1,284 | 657 | 463 | 1,120 |
| 15 and under 16 | 144 | 110 | 254 | 144 | 89 | 233 | 138 | 66 | 204 |
| 16 and over | 11 | 10 | 21 | 17 | 7 | 24 | 18 | 20 | 38 |
| Totals | 4,915 | 4,689 | 9,604 | 5,187 | 4,823 | 10,010 | 5,269 | 4,843 | 10,112 |
Private Schools.—By the Education Amendment Act, 1921–22, every private school was required to apply for registration before the 13th July, 1922, and no private school can now be established unless application is first made to the Department of Education for registration. Certain standards of efficiency and suitability of staff, premises, equipment, and curriculum have to be fulfilled.
The following table contains the principal statistics of private primary schools for each of the last live years. The figures include Maori mission schools which are shown separately in the summary table on p. 139.
| Year. | Number of Schools. | Roll at End of Year. | Average Yearly Attendance. | Teachers. | ||||
|---|---|---|---|---|---|---|---|---|
| Boys. | Girls. | Totals. | Males. | Females. | Totals. | |||
| 1943 | 302 | 14,114 | 15,214 | 29,328 | 25,791 | 115 | 859 | 974 |
| 1944 | 301 | 14,247 | 15,470 | 29,717 | 25,989 | 119 | 856 | 975 |
| 1945 | 308 | 14,734 | 15,667 | 30,401 | 26,597 | 118 | 864 | 982 |
| 1946 | 308 | 15,163 | 16,343 | 31,506 | 27,545 | 132 | 877 | 1,009 |
| 1947 | 307 | 15,664 | 16,940 | 32,604 | 29,459 | 134 | 880 | 1,014 |
The majority of the schools included in the preceding table are Roman Catholic Church schools, of which there were 237 at the end of 1947, with 27,172 scholars (13,177 boys and 13,995 girls) and 774 teachers (65 males and 709 females). The average attendance was 24,534. The remaining private schools comprised 56 church schools of other denominations with 200 teachers and 4,634 scholars, and 14 undenominational schools with 40 teachers and 798 scholars.
POST-PRIMARY SCHOOLS.—Over a lengthy period of years, one of the most striking features of Now Zealand education has been the proportion of pupils who proceed to some form of post-primary schooling at the conclusion of the primary course. In 1943, approximately 77 per cent. of the children leaving public primary schools and intermediate schools and departments went on to full-time post-primary schooling. Mainly as a result of the raising of the school leaving-age, this percentage has risen to 86 per cent. in 1947. The movement towards free secondary education for all began in 1901, when free places were introduced in the district high schools. In 1903 it became obligatory on all State post-primary schools to provide some free places, and from 1914 every child who had passed the Proficiency Examination was entitled to free education for at least two years in any State post-primary school. The final stop was taken in 1936, when the Proficiency Examination was abolished and free post-primary education to the end of the year in which he or she is nineteen was offered to every child gaming a Primary School Certificate or attaining the age of fourteen years. As from 1st February, 1944, every child must attend school until the age of fifteen years is reached. Free places are available to those who have reached this age and who have not been awarded a Primary School Certificate. Extension beyond the age of nineteen is allowable in special cases approved by the Minister of Education.
Post-primary schools are either public (State) or private. The following table shows the number and types of post-primary schools in existence during each of the last five years.
| Year. State Secondary Schools. | Combined Schools. | Secondary Departments of District High Schools. | Technical High Schools. | Maori Secondary Schools. | Endowed and Private Secondary Schools. | Totals. | |
|---|---|---|---|---|---|---|---|
| 1943 | 39 | 7 | 98 | 21 | 6 | 62 | 233 |
| 1944 | 39 | 7 | 101 | 21 | 7 | 64 | 239 |
| 1945 | 39 | 7 | 104 | 23 | 7 | 68 | 248 |
| 1946 | 40 | 7 | 103 | 25 | 8 | 72 | 255 |
| 1947 | 40 | 7 | 107 | 28 | 9 | 73 | 264 |
A combined school is an amalgamation of a secondary and a technical school under a single governing body. District high schools are public primary schools with a secondary “top” and the basic course is academic, as in the normal secondary school. Where staffing and equipment allow, special courses are provided in agricultures commercial work, and domestic science. Technical schools are described later in this section.
Until 1904, secondary schools were established by special (local) Acts of the General Assembly, and the majority of schools giving post-primary education have been established in this manner. At the present time the provisions of the 1914 Education Act allow the Minister of Education to establish such schools. State secondary schools and combined schools are controlled by Boards of Governors, and district high schools by the Education Boards.
The inspection of State post-primary schools is carried out by Inspectors of Post primary Schools attached to the Department of Education. Commencing in 1947, these Inspectors took over the inspection of secondary departments of district high schools which were previously inspected by the primary-school inspectors. There were (in 1947) 16 Inspectors of Post-primary Schools.
The number of pupils at the end of each of the last five years is shown in the following table. No account is taken of lower departments of secondary schools, and in the case of district high schools only the secondary departments are included.
| Year. | State Secondary Schools. | Combined Schools. | District High Schools. | Technical High Schools. | Maori Secondary Schools. | Endowed and Private Secondary Schools. | Correspondence School. | Totals. |
|---|---|---|---|---|---|---|---|---|
| 1943 | 14,774 | 2,901 | 5,197 | 8,436 | 371 | 6,572 | 559 | 38,810 |
| 1944 | 16,903 | 3,233 | 6,187 | 10,233 | 487 | 7,378 | 672 | 45,093 |
| 1945 | 17,617 | 3,263 | 6,872 | 10,865 | 490 | 8,027 | 738 | 47,872 |
| 1946 | 17,896 | 3,364 | 6,656 | 11,712 | 563 | 8,532 | 678 | 49,401 |
| 1947 | 17,819 | 3,351 | 6,666 | 12,328 | 622 | 8,968 | 618 | 50,372 |
In addition to the foregoing, there were, in July, 1947, 18.697 part-time students attending technical classes, 2,416 students receiving part-time tuition from the Correspondence School, and 614 students receiving instruction from the Technical Correspondence School.
The numbers of each sex attending post-primary schools at the end of 1947 were: State secondary schools, 9,435 boys and 8,384 girls; combined schools, 1,827 and 1,524; secondary departments of district high schools, 3,092 and 3,574; technical schools, 6,704 and 5,624; endowed and registered private secondary schools, 3,984 and 4,984; and Maori secondary schools, 283 and 339.
Technical Schools.—The technical schools fall roughly into two types: (a) Those in the small centres, which provide for all the post-primary needs and are distinguishable from secondary schools only by having in general a rather more strongly developed practical side; and (b) the large technical schools in the main centres, in which there is less evidence of the generalized academic curriculum, since this is adequately provided by the city secondary schools.
However, even in the latter type most of the courses in the day schools are still designedly pro-vocational and not genuinely “technical” in character. Technical schools are controlled either by a Board of Managers or by the Education Board of the district acting in a similar capacity.
There were twenty-eight technical schools in 1947, including two Schools of Art. The following table shows the number of pupils taking the different courses available (as at 1st July in each of the last five years).
| Course. | 1943. | 1944. | 1945. | 1946. | 1947. |
|---|---|---|---|---|---|
| Industrial | 3,753 | 4,632 | 5,135 | 5,097 | 5,066 |
| Commercial and general | 4,140 | 4,497 | 4,740 | 5,050 | 5,385 |
| Domestic | 1,255 | 1,580 | 1,982 | 2,367 | 2,602 |
| Agricultural | 509 | 649 | 713 | 855 | 929 |
| Art | 398 | 456 | 486 | 452 | 411 |
| Totals | 10,055 | 11,814 | 13,056 | 13,821 | 14,393 |
Technical Classes. —The number of centres at which technical classes for part-time day and evening students are given was 85 in 1947. These technical classes, on the whole, are more in the nature of trade classes than the usual technical-school course, but many of the pupils attend in order to continue their general post-primary education, and a great number to be trained only in shorthand, typing, and book-keeping.
The number of individual students in 1947 was:—
| Classes conducted by Education or High School Boards | 5,098 |
| Classes conducted by Technical School Boards or by Managers | 13,306 |
| Classes conducted by University colleges | 293 |
| Total | 18,697 |
Of the above number, 11,381 (8,142 males and 3,239 females) held free places.
Probable Destination of Post-primary Pupils.—An indication of the vocations intended to be followed by pupils leaving public post-primary schools during 1947 is contained in the next table. Of the totals, 4.7 per cent. of boys and 2.4 per cent. of girls intended to proceed to full-time university studies, while a further 2.0 per cent. of boys and 5.3 per cent. of girls stated their intention of entering the teaching profession. Clerical occupations (including typing) claimed 10.3 per cent. of boys and 28.2 per cent. of girls, shops and warehouses, 10.8 per cent. and 15.6 per cent.; manual trades, 28.9 per cent. and 2.2 per cent.: farming 20.2 per cent. and 0.7 per cent.; 21.6 per cent. of girls intended to stay at home; while various other occupations claimed 10.2 per cent. and 18.6 per cent. of boys and girls respectively.
| Occupation. | Secondary Schools. | Combined Schools. | Technical High and Day Schools. | District High Schools. | Totals. | |||||
|---|---|---|---|---|---|---|---|---|---|---|
| Boys. | Girls. | Boys. | Girls. | Boys. | Girls. | Boys. | Girls. | Boys. | Girls. | |
| University college | 312 | 167 | 51 | 20 | 62 | 12 | 13 | 8 | 438 | 207 |
| Teaching or training college | 113 | 286 | 18 | 49 | 34 | 63 | 22 | 69 | 187 | 467 |
| Professional engineering, surveying, architecture | 32 | 6 | 32 | 4 | 74 | |||||
| Clerical (including typing)— | ||||||||||
| Government and local authority | 269 | 274 | 47 | 65 | 129 | 205 | 125 | 135 | 570 | 679 |
| Banks, insurance, legal, commercial houses, &c. | 620 | 713 | 82 | 136 | 167 | 687 | 79 | 248 | 948 | 1,784 |
| Shop and warehouse assistants | 328 | 429 | 77 | 120 | 452 | 533 | 150 | 280 | 1,007 | 1,362 |
| Manual Trades— | ||||||||||
| Government and local authority | 57 | 5 | 22 | 119 | 5 | 40 | 16 | 238 | 26 | |
| Building | 89 | 30 | 318 | 72 | 509 | |||||
| Motor engineering | 126 | 47 | 292 | 79 | 544 | |||||
| General engineering | 115 | 33 | 378 | 25 | 551 | |||||
| Printing | 30 | 4 | 7 | 1 | 58 | 2 | 4 | 1 | 99 | 8 |
| Other trades | 203 | 58 | 60 | 4 | 405 | 88 | 91 | 10 | 759 | 160 |
| Farming | 483 | 13 | 170 | 13 | 640 | 14 | 590 | 25 | 1,883 | 65 |
| Factory operatives | 64 | 68 | 5 | 8 | 132 | 243 | 35 | 78 | 236 | 397 |
| Other occupations | 181 | 539 | 49 | 101 | 289 | 387 | 124 | 199 | 643 | 1,226 |
| Home | 29 | 703 | 5 | 131 | 42 | 522 | 37 | 535 | 113 | 1,891 |
| Not known | 147 | 170 | 29 | 6 | 309 | 235 | 56 | 60 | 541 | 471 |
| Totals | 3,198 | 3,429 | 738 | 654 | 3,858 | 2,996 | 1,546 | 1,664 | 9,340 | 8,743 |
Duration of Stay at Post-primary School.—The following table gives particulars of pupils who left public post-primary schools in 1947, classified according to years of attendance. The approximate average length of stay at the various types of school was: secondary schools, 3 years 1 month; combined schools, 2 years 11 months; technical high and day schools, 2 years 4 months; secondary departments of district high schools, 2 years 3 months; all post-primary schools, 2 years 8 months.
| Year of Attendance. | Secondary Schools. | Combined Schools. | Technical High and Day schools. | District High Schools. | All School. | |||||
|---|---|---|---|---|---|---|---|---|---|---|
| Number. | Per Cent. | Number. | Per Cent. | Number. | Per Cent. | Number. | Per Cent. | Number. | Per Cent. | |
| First | 593 | 8.9 | 168 | 12.1 | 1,415 | 20.6 | 842 | 26.2 | 3,018 | 16.7 |
| Second | 1,708 | 25.8 | 439 | 31.5 | 2,911 | 42.5 | 1,269 | 39.5 | 6,327 | 35.0 |
| Third | 1,780 | 26.9 | 310 | 22.3 | 1,703 | 24.8 | 699 | 21.8 | 4,492 | 24.8 |
| Fourth | 1,579 | 23.8 | 286 | 20.6 | 638 | 9.3 | 309 | 9.6 | 2,812 | 15.6 |
| Fifth | 877 | 13.2 | 166 | 11.9 | 176 | 2.6 | 85 | 2.7 | 1,304 | 7.2 |
| Sixth and over | 90 | 1.4 | 23 | 1.6 | 11 | 0.2 | 6 | 0.2 | 130 | 0.7 |
| Totals | 6,627 | 100.0 | 1,392 | 100.0 | 6,854 | 100.0 | 3,210 | 100.0 | 18,083 | 100.0 |
Secondary Schools for Maoris.—The Maori child has the same right to a free secondary education as the European, and where a Stale post-primary school is accessible he may attend it. There were also in 1947 nine denominational Maori secondary schools available to Maori children, five for girls and four for boys. In addition to catering for private pupils, these schools provide secondary education for Maori children in remote districts by means of Government scholarships provided by the Education Department. Some of them are also partly financed out of public endowments originally provided for the purpose of Maori education.
At the end of 1947, 593 Maori pupils were receiving secondary education at these schools, 261 of the total being Government scholarship-holders. In addition, there were 31 scholarship-holders enrolled in European secondary schools.
A further stop forward in the provision of post-primary education for Maoris was the approval of the establishment of three Maori district high schools in the East Coast district of the North Island in 1940, one in North Auckland in 1944, and two in the Bay of Plenty, and one near Rotorua in 1947. These schools, unlike the private denominational schools, are controlled by the Education Department; they provide courses of a practical nature specially suited to the needs of the Maori pupils.
War Bursaries for Soldiers' Dependants.—Regulations which came into force in January, 1918, provided for the award of bursaries to dependants of members of the New Zealand Expeditionary Forces who were killed through active military service or who were disabled through such service. In 1941, bursaries were made available to dependants of members of the Second New Zealand Expeditionary Force and of veterans of the Great War who are in receipt of pensions under the War Veterans' Allowances Act, 1935 (consolidated in the War Pensions Act, 1943). To qualify for a war bursary a child must have gained the Primary School Certificate. The bursary is tenable at any post-primary school, or, if the holder has the necessary educational qualifications, at a University college. The tenure of a war bursary may be continued until the holder reaches the age of twenty-three years.
War bursaries to the number of 1,247 were current in December, 1947, as compared with 1,253 at the end of 1946.
Secondary School Bursaries.—Under regulations dated 15th December, 1943, as amended in April, 1944, a bursary of a maximum annual value of £40 and tenable for a period of up to two years may be granted to a pupil who is obliged to live away from home in order to take a Sixth Form course at a post-primary school (public or private) which is approved for accrediting purposes. In order to qualify, an applicant must be under eighteen years of age and must have passed either the School Certificate or the University Entrance Examinations or have been accredited for the latter.
Technical School Bursaries.—Bursaries of a maximum value of £40 may be awarded to pupils who have completed at any post-primary school a two years' course preparatory to a specialized course in agriculture, art, engineering, building-construction, or home science which can be completed only at some technical school. The bursaries are tenable at technical schools approved for that purpose and may be held for a maximum of two years. Applicants must be under the age of seventeen years at the commencement of the specialized course and must be obliged to live away from home in order to receive satisfactory instruction in the courses to be followed.
VOCATIONAL GUIDANCE.—Since 1938 full responsibility for the work of vocational guidance of pupils at post-primary schools, which for some years had been carried on almost entirely by voluntary organizations, has been taken by the Government. Eight vocational guidance officers (four men and four women) were appointed, two to each of the four chief centres; and educational guidance officers, known as “careers-advisers,” were also selected at certain largo post-primary schools to work in conjunction with the district vocational guidance officers. So far as the work of finding positions for children leaving school was concerned, the vocational guidance officers acted in collaboration during the war with the Man-power officers of the National Service Department, and in each of the four main cities a “Youth Centre” was established where the work of guidance and placement was undertaken jointly by officers of the Education and National Service Departments.
The Education Department assumed the full control of the youth centres in 1943, and the staffs of the centres (now called Vocational Guidance Centres) have been greatly strengthened and their activities expanded, including the provision of psychological clinics. So far, branch offices have been opened in the four main centres and in Invercargill and Wanganui, but the Vocational Guidance Officers have made contact with the post-primary schools in other centres. The Vocational Guidance Officers, acting in conjunction with headmasters and special careers teachers in the schools, offer their services at any point in the child's career where a choice has to be made, whether of school course or of vocation. When a child has made his choice of career, the Vocational Guidance Officer tries to find suitable employment for him and endeavours to follow up his progress until he is finally and satisfactorily settled in his line of work. The Centres assumed important functions in connection with the rehabilitation of returned servicemen. Working in conjunction with the Education Committee of the Rehabilitation Board, the Vocational Guidance Officers reported on applications by ex-servicemen for bursaries and scholarships, and where it was considered that an applicant was not suited for the educational facilities for which he asked, every effort was made to find some other Hold of training for which he was better fitted.
RURAL EDUCATION: Consolidation of Schools.—In order to give children in country districts the advantages of special equipment and more specialized teaching in larger schools, the consolidation of the smaller rural schools has been encouraged wherever practicable. The extent of this consolidation will be evident from the fact that, whereas in 1934 there were 2,548 public primary schools (including intermediate schools and departments), the number in 1940 had fallen to 2,030, with a further fall to 1,963 in 1947.
Transport and Board.—A natural consequence of consolidation is the provision of adequate transport facilities to bring children into the centres. Free passes on the railway to the nearest public or private school are granted to children living near a railway-line hut out of reach of a primary school, and the same privilege is enjoyed by pupils having to travel to attend secondary schools, combined schools, district high schools, technical high schools, and private secondary schools, as well as to part-time pupils travelling to attend technical schools or classes, and pupils attending manual-training centres.
In certain circumstances, mainly on account of railway facilities not being available or sufficiently convenient, the cost of the transport of pupils to schools is met by payment of conveyance or horseback allowance, and in other cases the Education Department provides school buses.
The expenditure on transport of pupils for the financial year 1947–48 was £529,187 as compared with £465,406 in 1946–47 and £302,942 in 1942–43.
During the last three years the expenditure on board of pupils attending schools was:—
| 1945–46. | 1946–47. | 1947–48. | |
|---|---|---|---|
| £ | £ | £ | |
| Public primary | 8,778 | 10,276 | 8,364 |
| Private primary | 3,225 | 4,698 | 4,414 |
| Public post-primary | 47,626 | 54,202 | 48,615 |
| Maori | 1,519 | 1,358 | 1,350 |
| Private secondary | 18,550 | 22,011 | 24,495 |
| Totals | £79,698 | £92,545 | £87,238 |
The next table gives particulars of the number of children transported to school and the number in receipt of boarding-allowance as at 1st July, 1947, according to the type of school attended. Totals for the two preceding years are also shown.
| Type of School. | Number of Pupils on Roll | Total Pupils transported to School. | Number receiving Boarding-allowance. |
|---|---|---|---|
* Estimated. | |||
| Public primary schools | 207,320 | 29,931 | 405 |
| Intermediate schools and departments | 10,112 | 653 | 17 |
| Secondary departments of district high schools | 7,629 | 3,822 | 252 |
| Secondary schools | 19,169 | 3,522 | 1,452 |
| Technical high schools | 14,393 | 5,000 | 608 |
| Combined schools | 3,670 | 718 | 497 |
| Maori village schools | 12,597 | 2,852 | 71 |
| Chatham Islands schools | 110 | 22 | 7 |
| Private primary schools | 31,929 | 1,806 | 221* |
| Private secondary schools | 9,968 | 948 | 1,416* |
| Totals, 1947 | 316,897 | 49,274 | 4,946 |
| Totals, 1946 | 302,645 | 45,132 | 4,787 |
| Totals, 1945 | 294,077 | 42,312 | 4,890 |
Correspondence School.—Since 1922, correspondence classes have been conducted for the primary education of children in very remote areas and of those unable to attend school on account of lengthy illness or other causes. In 1929, courses were extended to cover secondary education up to the stage of the University Entrance Examination. The usual subjects of the syllabus of instruction are taught at the school, and in addition pupils who require instruction which is usually available in a special class in a public school are taught by teachers on the staff of the school who are trained for the purpose. A corporate school spirit is developed through craft and club activities, weekly radio lessons, and personal visits from special travelling teachers. The work of the school has been greatly facilitated by the extension of the practice of visiting pupils in their homes. Vacation schools have been organized in various centres in order to give pupils the opportunity of doing practical work and of taking part in group activities.
Young persons in employment, including teachers of small public schools, junior assistants in Maori schools, Post Office cadets, and others who are unable to attend post-primary schools for evening classes, also receive tuition as part-time pupils of the Correspondence School. One of the features of the school is the provision of instruction for pupils taking practical subjects, such as needlework, woodwork, and practical agriculture, and also science subjects.
At the end of 1947 there were 4,966 pupils on the roll of the Correspondence School, 1,972 being in the primary department, and 618 full-time and 2,376 part-time students in the secondary department. The teaching staff of the school consists of a headmaster, and 89 secondary, and 51 primary assistant teachers.
Technical Correspondence School.—In July, 1946, the Department took over the responsibility for the study courses previously conducted by the Army Educational and Welfare Service. A Technical Correspondence School was established in Wellington to develop these courses for men in the Armed Services, and also to provide correspondence instruction in vocational and technical subjects for apprentices and advanced students unable to attend technical schools.
The number of students on the roll at 1st July, 1947, was 615, and the teaching staff at the end of the year comprised 7 full-time and 13 part-time teachers.
Agricultural Clubs.—An effort has recently been made to see that the curriculum is adapted to the social and economic background of each school, and the teaching of agriculture is made a special feature in the rural schools. Projects have been undertaken by the boys' and girls' agricultural clubs in the rearing of calves, lambs, chickens, pigs, and bees, and in the production of crops. In 1942–43 some 26,516 projects were completed; in 1943–44, 32,388; in 1944–45, 33,674; in 1945–46, 38,469; in 1946–47, 38,412; and in 1947–48, 41,736.
HEALTH SERVICES: Physical Education.—Physical education, including swimming and life-saving, is a recognized part of the primary and pest-primary school curricula. In the public primary schools three half-hourly periods per week are devoted to the subject, and in post-primary schools at least one hour a week. During the month of February public schools suspend ordinary time-tables and concentrate on development of physical welfare and outdoor activities. Corrective classes are held in the larger schools for the purpose of remedying physical defects of the children.
A Superintendent, to organize and control physical education in the schools throughout New Zealand, was appointed in 1939. Area organizers have also been appointed to develop still further the work in their respective districts, and assistants have been appointed to teach physical education in the schools to which they are attached and in neighbouring schools. In 1947 there were 83 teachers in the primary-school system engaged full-time on physical education. Increased grants have been provided for physical education in schools.
Medical and Dental Treatment.—Information on the medical and dental inspection of school-children and the dental-clinic system is given in the section (5A) of this Year-Book devoted to Public Health.
Free Issue of Milk and Apples.—The milk-in-schools scheme, for the free issue of a half-pint daily ration of milk to children, commenced on 1st March, 1937. The consumption of the milk is entirely voluntary.
In remote areas where it is impossible to maintain a pasteurized supply, the needs of the children are met by the free issue of powdered malted milk, provided that it can be served under hygienic conditions (see also Section 5A).
A similar scheme in regard to apples was inaugurated in 1941, and in some years during the apple season (approximately eight weeks) apples, free of cost, are supplied to children attending all types of schools.
CHILD WELFARE AND SPECIAL SCHOOLS.—The Child Welfare Act of 1925 provided for the creation of a special branch of the Education Department, known as the Child Welfare Branch. The Act was passed to make better provision with respect to the maintenance, care, and control of children who are specially under the protection of the State, and to provide generally for the protection and training of indigent, neglected, and delinquent children.
An important section of the Act provided for the establishment of Children's Courts, to be presided over by Stipendiary Magistrates or Justices specially authorized to exorcise jurisdiction in these Courts. Provision was also made for the appointment of honorary associates of either sex, whose function it is to consider all the facts concerning children brought before the Courts and to advise the presiding Magistrate or Justice as to what action should be taken. The appointment of Child Welfare Officers for the investigation of all cases coming before the Courts was also provided for. These investigations are carried out mainly by the regular officers employed by the Department, but in outlying districts the services of about 250 honorary child welfare officers are utilized for this important work.
The principle of dealing with children in the privacy of the Magistrate's room had been followed for many years throughout New Zealand, and the Child Welfare Act was designed to give legality to such a practice. Very wide discretionary powers are given to those special Courts in dealing with children. The ordinary procedure of requiring the child to plead, of taking evidence on oath, and, indeed, of hearing the particular charge may be dispensed with altogether. Wherever practicable the Children's Court is held in premises apart from the ordinary Police Court, and no newspaper is permitted to publish either the names of children appearing before these Courts or any particulars that are likely to identify a child.
A child was originally defined for purposes of the Act as one under sixteen years of age. This age was raised to seventeen in 1927.
In order to provide for the greater protection of infants of unmarried mothers and for the assistance and guidance of the mothers themselves, there is provision for Child Welfare Officers, on being notified of such births, to investigate each case and to render such assistance as is required, either in placing the child in a suitable foster-home or in advising the mother in the matter of affiliation proceedings, or in assisting her in obtaining employment, &c. By an amending Act in 1927 provision was made for the inspection and registration of all private institutions for children.
In 1948 a further amending Act made provision for the placing of any immigrant and refugee children who may come to New Zealand under the legal guardianship of the Superintendent of Child Welfare.
In addition to the work in connection with the maintenance and education of indigent, neglected, and delinquent children committed by the Courts, the Child Welfare Branch (1) supervises all infants and young children under the age of six years who are living apart from their parents; (2) makes inquiry through its field officers, for the information of Magistrates, into all applications for the adoption of children; (3) supervises all children and young persons placed under the field officers by order of the Court; and (4) controls institutions for deaf or for mentally backward children.
The following figures (which are exclusive of children dealt with as preventive cases, 1,645 in 1947–48) indicate the numbers under control during each of the last five years. In addition there were, in 1947–48, 22 children at the Now Zealand Institute for the Blind, for whom the Education Department made payment.
| 1943–44. | 1944–45. | 1945–46. | 1946–47. | 1947–48. | |
|---|---|---|---|---|---|
| Boarded out, institutions, receiving-homes, and in hospitals, or convalescent homes. &c. | 4,125 | 4,119 | 4,055 | 3,807 | 3,538 |
| Under supervision | 1,375 | 1,063 | 1,026 | 915 | 879 |
| Infant-life protection | 698 | 799 | 909 | 788 | 772 |
| Deaf children | 175 | 215 | 238 | 250 | 251 |
| Mentally backward children | 180 | 186 | 174 | 172 | 160 |
| Totals | 6,553 | 6,382 | 6,402 | 5,932 | 5,600 |
The Child Welfare Act authorizes Children's Courts to place children under the supervision of Child Welfare Officers in cases where it appears undesirable or unnecessary to remove them from their own homes, and generally in all cases the friendly contact with the parents as well as the children is sufficient to bring about a readjustment of the home conditions or the correction of incipient anti-social traits in the children. In this important work the Department receives valuable assistance from private social service organizations.
The number of cases dealt with by the Courts in 1947–48 was 2,032, a decrease of 939, or 30.2 per cent., as compared with five years earlier. Of those coming before the Courts, 660 in 1947–48 and 607 in 1946–47 were placed under supervision and dealt with as indicated in the foregoing paragraph. The number committed to the care of the Superintendent during the year was 431.
At 31st March, 1948, the number of children boarded out was 1,747, as compared with 1,858 at the end of the preceding year. The boarding-out rate is 25s. per week for children under twelve years, 27s. 6d. (including 1s. 6d. pocket-money) per week for children aged twelve to fourteen years, and 30s. (including 2s. 6d. pocket money) per week for children over fourteen years. The Department provides free dental treatment where not otherwise provided, and also school books and stationery.
Of the total number under control at 31st March, 1948, the number placed in employment was 1,063, of whom 336 were in farm situations, 176 in factories, 111 in shops and offices, 120 in domestic work, and the remainder numbering 314 in other occupations. Of the foregoing 59 were apprenticed to trades and 266 were receiving some assistance—e.g., with their board, clothing, books, fees—from the Department in the early stages of their employment. Except in a comparatively few cases these State wards receive standard rates of wages, the exceptions being entirely due to some physical or mental handicap which prevents the young people concerned from competing on equal terms with their fellows.
The Boys' Training Centre at Levin provides for boys of all ages who require a period of reformative detention in an institution. There are two distinct sections—a senior section for older boys (of approximately fourteen years and upwards), which is a counterpart of the Girls' Training Centre at Burwood, and a junior section at the Hokio Training School, which caters for boys of primary school age. There is a similar institution for girls at Burwood. A Girls' Hostel in Wellington and a Boys' Hostel in Auckland provide for young people under control who are in employment in these two cities.
An institution at Otekaike provides a special course of education for mentally-backward boys. The older lads, under capable supervision, are employed in farm-work, garden and orchard work, bootmaking, and carpentering. Girls are provided for at the Special School at Richmond, and are employed in housework and laundry-work, sewing, knitting, &c., and in outside occupations, such as gardening and flower-growing. Maori girls requiring training before placement in the community are provided for at an institution at Featherston. After a period of training they are placed in suitable situations where their supervision is continued under the local Child Welfare Officer.
In order to meet the requirements of children who are retarded in their development owing to physical or other defects, special classes have been established. These classes provide for children in certain public hospitals, for hard-of-hearing children and speech defectives, for under-nourished and physically defective children, and for children who are unable to benefit from ordinary class instruction.
Infant-life protection is carried out under the supervision of trained nurses who are fully qualified in the care and feeding of infants and young children. Very many infants dealt with under this system are illegitimate.
A residential school at Sumner exists for the teaching of deaf children, and special classes are established in the main centres for the education of hard-of-hearing children and for the correction of defective speech among children. Classes are also conducted for adults. In 1942 a residential school for the deaf was opened at Titirangi, Auckland, and a number of the children from Sumner were transferred to this new school.
Provision is made for blind children and also for blind adults at the Now Zealand Institute for the Blind at Auckland. This institute is administered by a board of trustees, on which the Government is represented. Certain children not admitted by private arrangement are admitted as Government pupils, the number of such pupils in residence at 31st March, 1948, being 22.
TEACHING PROFESSION: Training of Teachers.—There are, including the residential college established at Ardmore in 1948, five training colleges available to students who desire to enter the teaching profession, and at the end of 1947 there were 1,564 students in training. Of these, 1,522 were “Division A” students and 42 “Division C” students. The minimum academic qualification for “Division A” is the University Entrance or School Certificate Examinations, while students of “Division C” must be University graduates.
The normal course of training for “Division A” students is a period of two years at a training college, followed by a further period of one year as a probationary assistant attached to a public school. Third-year studentships, which entitle holders to an extra year's training, are available to selected students who wish to specialize in the teaching of certain subjects of the curriculum. There were 86 such students in December, 1947. For students of “Division C” the course is for one year. To enable students to qualify to teach homecraft subjects, bursaries providing training at a teachers' training college and at a technical high school were instituted in 1943.
In 1948, 65 Post-primary Teachers' Bursaries were awarded to students who had reached a standard of education at least equivalent to University Entrance, to enable them to attend full time at University to complete approved degree courses in preparation for entry into the post-primary teaching profession. The bursaries are of an annual value of £70 plus payment of tuition fees with an additional £40 if students are obliged to live away from home to attend University. The tenure is for a maximum period of four years. On completing their University courses students may be required to attend a teachers' training college for one year as “Division C” students, and then to serve for a period of four to five years as teachers in post-primary schools.
Commencing in 1948, a maximum of twenty Physical Education Bursaries are awarded annually to students to enable them to attend the School of Physical Education at the University of Otago for a three-year diploma course in physical education. The bursaries are of the same value as the Post-primary Teachers' Bursaries, and the bursars may be required, on completion of the course, to undertake work for a period of four to five years either as teachers of physical education or as physical welfare officers under the Internal Affairs Department.
Public Primary-school Teachers.—The following table shows the number of teachers in public primary schools in the various education districts as at 31st December, 1947. The figures do not include 198 men and 192 women teachers in intermediate schools and departments.
| Education District. | Sole Teachers. | Heads of Schools. | Assistant Teachers. | Probationary Assistants. | Total Number of Teachers. | Percentage of Stale to Female Teachers. | ||||
|---|---|---|---|---|---|---|---|---|---|---|
| M. | F. | M. | F. | M. | F. | M. | F. | |||
| Auckland | 148 | 41 | 362 | 38 | 434 | 1,087 | 70 | 122 | 2,302 | 78.7 |
| Taranaki | 40 | 10 | 66 | 11 | 60 | 157 | 8 | 22 | 374 | 87.0 |
| Wanganui | 54 | 31 | 74 | 10 | 77 | 217 | 5 | 26 | 494 | 73.9 |
| Hawkes Bay | 52 | 25 | 75 | 7 | 79 | 221 | 13 | 23 | 495 | 79.3 |
| Wellington | 49 | 31 | 101 | 11 | 174 | 446 | 19 | 47 | 878 | 64.1 |
| Nelson | 27 | 17 | 42 | 1 | 38 | 99 | 8 | 17 | 249 | 85.8 |
| Canterbury | 88 | 56 | 137 | 20 | 213 | 480 | 46 | 29 | 1,069 | 82.7 |
| Otago | 51 | 28 | 79 | 9 | 115 | 242 | 20 | 33 | 577 | 84.9 |
| Southland | 58 | 19 | 67 | 51 | 147 | 13 | 18 | 373 | 102.7 | |
| Totals | 567 | 258 | 1,003 | 107 | 1,241 | 3,096 | 202 | 337 | 6,811 | 79.3 |
Information as to teachers' superannuation will be found in the section of this book dealing with “Social Security, Pensions, Superannuation, &c.” (section 25).
Post-primary-school Teachers.—The following table indicates the number of full-time teacher employed in the post-primary schools mentioned. The principals are included except in the case of district high schools, the figures for which apply to assistants in the secondary department only.
| Year. | Secondary Schools. | District High Schools. | Technical High Schools. | Combined Schools. | Grand Totals. | ||||
|---|---|---|---|---|---|---|---|---|---|
| Males. | Females. | Males. | Females. | Males. | Females. | Males. | Females. | ||
| 1943 | 296 | 347 | 120 | 141 | 272 | 172 | 71 | 58 | 1,477 |
| 1914 | 342 | 372 | 152 | 147 | 302 | 180 | 82 | 62 | 1,639 |
| 1945 | 406 | 383 | 187 | 177 | 361 | 214 | 90 | 64 | 1,882 |
| 1946 | 409 | 370 | 204 | 142 | 425 | 218 | 91 | 65 | 1,924 |
| 1947 | 468 | 400 | 236 | 140 | 459 | 247 | 91 | 71 | 2,112 |
Male teachers employed in post-primary schools fell from 908 in 1940 to 707 in 1942, this decrease being almost entirely due to enlistment in the Armed Forces. The position was slightly improved during 1943, the number for that year being 759, and by 1947 the number had risen to 1,254. The number of female teachers rose from 630 in 1940 to 761 in 1944 and to 858 in 1947. Teachers employed in private post-primary schools and Maori secondary schools are not included in the figures.
TEACHING AIDS.—In order to assist teachers to make their work more realistic, a Supervisor of Teaching Aids was appointed to the Education Department in 1941 His work includes the supervision of school broadcasts and the work of the Education Officers in the museums and also of a library of films and film strips.
Broadcasting.—Regular broadcasting programmes for schools were initiated in 1931. A varied series of talks is given weekly over the national stations at Auckland, Wellington, Christchurch, and Dunedin. A special feature is a music lesson broadcast to schools weekly. Special lessons are also broadcast for Correspondence School pupils.
Visual Aids.—The use of visual aids, particularly the film-strip projector, is increasing in the schools. Libraries of films and film-strips for free use in schools are maintained at all Education Board offices. The Visual Education Association in Auckland runs a circuit of silent films covering some fifty schools.
Museums.—To assist schools to make the fullest use of the museums, an education officer is attached jointly to the museum and the teachers' training college in each of the four main centres. Museum boxes are circulated amongst schools where pupils are unable to make regular visits to a museum.
Publications.—An illustrated monthly paper, called the School Journal, is published by the Education Department for use as the chief reader in primary schools and intermediate schools and departments, and is supplied free to all schools, both public and private.
Post-primary Bulletins are published fortnightly and issued free to all public and private post-primary schools. They provide background reading for subjects of the revised curriculum, particularly in social studies, science, literature, and music.
A monthly Gazette, mainly for the information of teachers, is published by the Department. It is a medium for the prompt dissemination of official information and for the advertisement of vacancies. Copies are distributed to educational authorities and to State schools throughout New Zealand.
In addition, a publication entitled “Education” containing information of interest to teachers and articles by leading educationists is issued to all State and private schools five times yearly.
As stated under an earlier heading, new text-books, which are being produced as a result of a systematic review of the primary-school curriculum, are issued free to all pupils in public and private primary schools.
HIGHER EDUCATION: New Zealand University.—Control of higher education in Now Zealand is vested in the Now Zealand University, founded by the New Zealand University Acts of 1870, 1874, and 1875.
The University was formerly an examining, not a teaching, body with four teaching institutions affiliated to it—the Auckland University College, founded in 1882; Victoria University College, founded in 1897 at Wellington; Canterbury University College, founded in 1873 at Christchurch; and Otago University, founded in 1869 at Dunedin. By the New Zealand University Amendment Act, 1920, the constitution of the University was altered so that it now actually consists of the four University colleges. Each of the colleges, besides providing the usual University courses, specializes in certain directions: Otago University has medical and dental schools, a school of mining and metallurgical engineering a school of home science and a school of physical education; Canterbury University College has a school of engineering (mechanical, electrical, and civil), and a school of art; Auckland University College has a school of architecture, and a school of engineering which offers courses to the final years of the degree only in certain branches of engineering; and Victoria University College specializes in law, has a school of public administration, and is establishing a school of social work. There are also two agricultural colleges—viz., Massey and Canterbury—attached to the University (see page 138), the work of which is co-ordinated through the New Zealand School of Agriculture.
In 1930 a New Zealand University Amendment Act was passed to enable the New Zealand University to discharge its functions under the Law Practitioners Amendment Act, 1930. For this purpose a Council of Legal Education was established to make recommendations to the Academic Board of the University with respect to any matter relating to legal education. Further, the Senate of the University in making or altering statutes concerning legal education must first consider any recommendations made by the Academic Board or the Council of Legal Education.
In 1947 there were 11,333 students actually in attendance at the four University colleges and the two agricultural colleges. Of these, 747 were graduates, 8,963 undergraduates, and 1,623 unmatriculated students. Of the unmatriculated students, 890 were taking short courses at the agricultural colleges. A considerable number of the unmatriculated students are returned servicemen, who are admitted under special terms. In addition there were 1,431 students attached to the various University colleges, but exempt from lectures. Comparable figures for the five years quoted are given in the following table.
| Year. | Students attending Lectures. | Exempt Students. | Totals. | ||
|---|---|---|---|---|---|
| Males. | Females. | Males. | Females. | ||
| 1943 | 3,457 | 1,724 | 613 | 159 | 5,953 |
| 1944 | 4,621 | 1,963 | 944 | 202 | 7,730 |
| 1945 | 5,851 | 2,135 | 1,162 | 183 | 9,331 |
| 1946 | 9,141 | 2,122 | 1,016 | 170 | 12,449 |
| 1947 | 9,177 | 2,156 | 1,251 | 180 | 12,764 |
The demobilization of armed-service personnel was one of the factors contributing to the large increases in the numbers of male students in 1943, 1944, and 1945. The increases in the immediate post-war years can be attributed largely to the granting of rehabilitation bursaries to ex-servicemen. There were approximately 3,400 holders of rehabilitation bursaries attending the universities and agricultural colleges in each of the years 1946 and 1947.
Professors attached to the various University colleges in 1947 numbered 75, of whom Auckland had 16; Victoria, 15; Canterbury, 15; Otago, 24: Massey 2; Canterbury Agricultural, 3. In addition there was a considerably larger number of full-time lecturers, part-time lecturers, and assistants.
The following table gives particulars of courses taken by students who were taking definite courses, during 1947 and each of the preceding two years.
| Course. | 1945. | 1946. | 1947. | ||||||
|---|---|---|---|---|---|---|---|---|---|
| Males. | Females | Total. | Males. | Females | Total. | Males. | Females | Total. | |
*Including intermediate course students. †Excluding Medical, &c., intermediate. | |||||||||
| Agriculture— | |||||||||
| Degree | 1,145 | 52 | *1,197 | 1,479 | 10 | *1,489 | 115 | 1 | 116 |
| Diploma | 342 | 8 | 350 | ||||||
| Other | 48 | 48 | |||||||
| Architecture— | |||||||||
| Degree | 116 | 18 | 134 | 202 | 19 | 221 | 149 | 7 | 156 |
| Diploma | 76 | 8 | 84 | ||||||
| Other | 26 | 26 | |||||||
| Arts | 1,811 | 1,154 | 2,965 | 2,524 | 1,301 | 3,825 | 2,693 | 1,287 | 3,980 |
| Commerce | 1,001 | 110 | 1,111 | 2,060 | 102 | 2,162 | 1,872 | 90 | 1,962 |
| Dentistry | 169 | 6 | *175 | 199 | 6 | *205 | 170 | 5 | 175 |
| Divinity | 18 | 18 | 24 | 1 | 25 | ||||
| Education: Diploma | 35 | 32 | 67 | 69 | 34 | 103 | 77 | 29 | 106 |
| Fine Arts: Diploma | 19 | 29 | 48 | ||||||
| Engineering | 399 | *399 | 705 | *705 | 473 | 473 | |||
| Home Science— | |||||||||
| Degree | 207 | *207 | 207 | *207 | 59 | 59 | |||
| Diploma | 70 | 70 | |||||||
| Horticulture: Diploma | 20 | 32 | 52 | 41 | 19 | 60 | 53 | 16 | 69 |
| Journalism: Diploma | 20 | 17 | 37 | 51 | 23 | 74 | 38 | 25 | 63 |
| Law | 302 | 15 | 317 | 566 | 17 | 583 | 625 | 17 | 642 |
| Massage: Diploma | 5 | 39 | 44 | 13 | 30 | 43 | 15 | 39 | 54 |
| Medical Science | 3 | 3 | |||||||
| Medicine | 781 | 112 | *893 | 798 | 97 | *895 | 479 | 65 | 544 |
| Mining: Diploma | 37 | 1 | 38 | 62 | 1 | 63 | 44 | 44 | |
| Music | 61 | 86 | 147 | 114 | 134 | 248 | 96 | 92 | 188 |
| Public Administration: Diploma | 11 | 11 | |||||||
| Science (including Medical. &c., intermediate) | 946 | 230 | †1,176 | 1,274 | 242 | †1,516 | 2,098 | 372 | 2,470 |
| Other courses | 3 | 4 | 7 | ||||||
| Totals | 6,843 | 2,111 | 8,959 | 10,175 | 2,242 | 12,417 | 9,549 | 2,224 | 11,773 |
Free University Education.—Free University education was instituted in 1911 for all holders of University Scholarships (gained by examination) and bursaries (since 1945, gained by accrediting). University Junior Scholarships and University National Scholarships are of the value of £45 per annum plus tuition fees, and are tenable for three years. In the case of holders living away from home a further sum of £45 per annum is allowed. The number of University Junior and National Scholarships awarded each year is thirty. Taranaki Scholarships are of the annual value of £70, and the Senate may, at its discretion, extend the tenure from three to four years. The above scholarships are awarded on the results of the Entrance Scholarships Examination. There are also some thirty or forty local and privately endowed scholarships awarded on the results of the same examination.
Scholarships awarded during the degree course are the Senior University (£90 per annum) and John Tinline Scholarship (£90 per annum). The various colleges also have private scholarships for which their own students may compete. The chief scholarships awarded at the end of the University course are the Rhodes Scholarships, the 1851 Exhibition Scholarships, the Post-graduate Scholarships in Arts, Science, Commerce, Law, Engineering, Architecture, Medicine, and Dentistry, the Macmillan Brown Agricultural Scholarship, the Shirtcliffe Scholarships, and the National Research Scholarships. All except the last-named are tenable abroad. The National Research Scholarships are each of the value of £250 per annum. Each University college may also award two Research Scholarships of an annual value of £200. The University of New Zealand awards Research Fellowships, the value of which is not fixed, but the normal grants have been approximately £300 per annum for a period of two years.
In 1940 new regulations were made for the award of ordinary national bursaries, the holders of which were entitled to the payment of tuition fees up to £20 per annum. All students who have been accredited for, or who have sat and passed, the University Entrance Examination may be awarded one of these bursaries and thus receive free tuition up to a value of £20 annually for a period of four years, or in the case of medical students five years, at a University college. Bursars who hold the higher School Certificate receive, in addition, an annual cash payment of £20 if attending full time at University.
In order to assist qualified students to pursue special University courses, special bursaries are available in agriculture, architecture, fine arts, engineering, science, and home science. The tenure of these bursaries is five years for engineering and four years for each of the other courses. Awards are limited to approximately ninety per annum. The annual value of special bursaries is a maximum of £20 for tuition plus a cash payment of £10, and £40 boarding-allowance if the holder is required to live away from home. In 1947 the number of special bursaries held was 43 in agriculture, 52 in engineering, 10 in architecture, 59 in science, 63 in home science (tenable at Otago University), and 20 in fine arts (tenable at Canterbury College School of Art).
Each year a maximum of 65 National Boarding Bursaries are awarded to candidates on the basis of marks gained in the University Entrance Scholarship Examination. The bursaries are awarded to candidates who have to live away from home in order to attend a University, or who, although not required to live away from home, are in need of the financial assistance afforded by the bursary. The annual value of these bursaries is a maximum of £20 for tuition fees plus £50 boarding-allowance. The tenure of the bursaries is five years for medical students and four years for others. Of the bursaries awarded each year at least forty go to students who are required to live away from home in order to attend University.
The total number of Ordinary National, National Boarding, and Special Bursaries current in 1947 was 3,060, as compared with 2,693 in 1946 and 2,399 in 1945.
A scheme of bursaries for medical and dental students was inaugurated in 1943. These bursaries, which are administered by the Department of Health, are tenable for five years and are of an annual value of £70 plus £40 if the student is required to live away from home.
Bursaries are also provided by the Rehabilitation Board for ex-servicemen.
From the table given below will be seen the number of students who received free University education during each of the last five years.
| Year. | Junior University, University National, and Taranaki Scholarships. | Senior University Scholarships. | Ordinary National, National Boarding, and Special Bursaries. | Training-college Studentships. | Other. | Totals. |
|---|---|---|---|---|---|---|
| 1943 | 82 | 20 | 1,787 | 632 | 210 | 2,731 |
| 1944 | 78 | 19 | 2,018 | 732 | 595 | 3,442 |
| 1945 | 91 | 22 | 2,399 | 604 | 1,080 | 4,196 |
| 1946 | 104 | 22 | 2,693 | 758 | 3,911 | 7,488 |
| 1947 | 115 | 29 | 3,060 | 706 | 3,946 | 7,856 |
The increase under “Other” in the above table in 1944 and subsequent years is due to a limited extent to the award of Medical and Dental Bursaries, but the main cause of the increase is the number of Rehabilitation Bursaries awarded.
School of Agriculture.—The New Zealand School of Agriculture consists of two agricultural colleges specializing in higher agricultural education—Massey Agricultural College, near Palmerston North, and Canterbury Agricultural College, near Christchurch. Until 1937 the two colleges were separately governed, though both were attached to the University of New Zealand. Under an Act of that year they were co-ordinated as the New Zealand School of Agriculture in connection with the University of New Zealand. They are now governed by one Council, but continue to specialize in their respective spheres of work as separate institutions. The staff of Massey College consisted in 1947 of 1 Principal, 1 professor, 25 lecturers, and 10 assistant lecturers, while that of Canterbury was made up of a director, an assistant director, 1 professor, and 21 lecturers. The total number of students at Massey College in 1947 was 738 and at Canterbury 695, These numbers include 428 students at Massey and 462 at Canterbury Agricultural Colleges taking short courses.
Encouragement to the development of higher agricultural education is given through a Government grant to the Council, amounting to £78,000 in 1947. Various research projects at the colleges have been aided by expert assistance and grants from the Department of Scientific and Industrial Research.
In addition, agricultural bursaries are awarded to qualified candidates to provide them with practical training for positions as teachers or instructors of agriculture. During 1947 19 bursars were in attendance at Canterbury Agricultural College, 17 at Massey College, 3 at Victoria University College, 3 at Canterbury University College, and 1 at the University of Otago.
COUNCIL FOR EDUCATIONAL RESEARCH.—In 1933 the Carnegie Corporation of New York set up a committee to report on the proposal to found in New Zealand a Council for Educational Research. This committee called a conference of representative educationists to consider the proposal, and approached educational authorities for their co-operation. In view of the unanimous support given to the proposal, the committee recommended the foundation of the Council, and in November, 1933, the Carnegie Corporation appropriated a substantial grant for the purpose, payable in five yearly instalments, beginning in 1933–34. In 1938 the Corporation extended the grant to cover a second five-year period, from 1940 to 1944.
When the Corporation grants ceased in 1944 the Government passed legislation giving statutory existence to the Council, and since 1945 has made an annual grant of £3,000 to it.
The Council has concentrated on New Zealand problems, and many of its publications consist of critical surveys on various aspects of Now Zealand education and of accounts of outstanding experiments in school practice. The work done under the auspices of the Council has been carried out not only by its own permanent staff but also by part-time investigators.
In addition to its activities as a research organization, the Council administers the finances of the Carnegie Museums Trust Fund and acts as a clearing-house for information on educational matters.
The Council's activities are under the control of a permanent officer (the Director), who is assisted by a staff of three. There are local Institutes for Educational Research in Auckland, Wellington, Christchurch, and Dunedin.
ADULT EDUCATION: National Council of Adult Education.—In 1938 an Education Amendment Act provided for the establishment of a Council of Adult Education to co-ordinate activities of adult education, to make recommendations to the Minister of Education concerning the amount and distribution of the annual grant, and to receive reports from the bodies to whom grants were made.
The Adult Education Act, 1947, which followed largely the recommendations of a Consultative Committee reporting in the same year, abolished the Council and set up a National Council of Adult Education with much wider powers. The functions of the National Council are—
To promote and foster adult education and the cultivation of the arts; and
To make recommendations to the Minister of Education as to the amount of the annual grant to be made to the National Council for Adult Education out of moneys appropriated by Parliament for the purpose, and to receive, administer, and control the expenditure of such moneys granted.
The National Council has power to appoint staff and to impose conditions on grants made by it. The full-time executive officer of the Council, the National Secretary of Adult Education, is located in Wellington. The National Council is constituted as follows:—
The Director of Education (or his representative):
The Director of Broadcasting (or his representative):
The Director of the National Library Service (or his representative):
One member appointed by the Senate of the University of New Zealand:
Two members appointed by each of the four University Colleges (eight members in all):
One member appointed by the Dominion Council of the Worker's' Educational Association:
One member appointed by the Minister of Education to represent the Maori race:
Up to two members appointed by the Council itself.
Regional Councils of Adult Education.—Staff for field-work in adult education is employed by the Councils of the four constituent colleges of the University of New Zealand. Each College Council has the advice of a Regional Council of Adult Education, to which certain of the powers of the College Council are delegated. The four Regional Councils are differently constituted, but the 1947 Act requires that at least one-half of the members shall be persons appointed on the nomination of voluntary associations or oganizations engaged or interested in adult education in the district. The teaching staff who work under the direction of the Regional Councils consists of a director, “general purpose” tutors, and specialist tutors. The work supervised by the Regional Councils covers a wide range of interests—lecture courses, discussion courses, and various forms of assistance to specially organized groups or groups formed originally for other purposes, in both town and country. An important recent development has been the establishment of the Community Arts Service, which arranges for visits of exhibitions, musicians, and drama and ballet groups to country centres. The Regional Councils also organize short term summer and winter schools in town and country.
Workers' Educational Association.—The Workers' Educational Association is the principal voluntary agency in New Zealand formed specifically for the promotion of adult education. It operates in conjunction with the University colleges, and on the administrative side consists of two parts—the District Council and the Tutorial Classes Committee. The former consists of representatives of affiliated bodies (such as trade unions) and members of classes, and seeks to promote interest in adult education and to organize classes. The latter is composed of equal representation from the District Council and the University colleges, and is responsible for the maintenance of academic standards and the appointment of tutors in classes specifically organized by the Workers' Educational Association.
The work of the Workers' Educational Association is carried on in the cities by means of tutorial classes, mostly one-year classes, covering a wide variety of non-vocational subjects. The usual practice is for the lecture to last an hour, followed by class discussion for an hour. Much of the country work formerly conducted by the Workers' Educational Association is now organized in the name of the Regional Councils of Adult Education, but there are still some Workers' Educational Association country groups.
The Workers' Educational Association is financed by grants from the National Council of Adult Education, University grants, and donations from local authorities, trade-unions, and private individuals.
Community Centres.—In 1938 an experimental Community Centre was established at Feilding under the supervision of two experienced educationists specially appointed to the staff of the Feilding Agricultural High School. Classes have been conducted in drama, child-care, literature, art appreciation, and physical welfare, both at the centre and in outlying areas. In 1944 a community centre was opened in a suburb of Christ-church. More recently experimental centres have been opened in Dargaville, Westport, and the coal-mining districts of the Buller. All these receive some assistance, directly or indirectly, from public funds. There are, however, many other community centre schemes supported by voluntary effort.
The Adult Education Act, 1947, gives the Minister of Education power to establish or recognize community centres and to make grants to them.
NATIONAL LIBRARY SERVICE.—The establishment of a National Library Service was announced in October, 1945, by the Minister of Education, the decision following a recommendation from the Now Zealand Library Association. The National Library Service has been developed in three divisions: Country Library Service, National Library Centre, and Library School.
Country Library Service.—The Country Library Service, which was founded in 1938 under the control of the Minister of Education, will be extended by the establishment of Regional Depots so that closer contact may be maintained with libraries participating in it. The first Regional Centre, that at Palmerston North, was opened in December, 1948. At present the Country Library Service assists library authorities in country districts and towns with a population of less than 15,000 to give better service. Public libraries in places with over 15,000 of population, excluding the four main centres, may receive assistance under certain conditions. Free loans of books are granted to libraries controlled by local authorities provided that such libraries give a free service locally and are maintained at a reasonable standard of efficiency. Subscription libraries in country districts—i.e., outside the area of boroughs and town districts—may hire books from the Service for an annual payment of £3 per 150 books. Both free and subscription libraries exchange their books from a travelling book-van, which calls at each library three times a year. Fiction and non-fiction books are supplied from the van. The more serious type of non-fiction book is available to local libraries by mail from the headquarters or district offices.
Hampers of books for general reading are sent to isolated groups of readers from Country Library Service headquarters. Individuals living in such sparsely populated areas that they cannot even form a group may receive a postal service from headquarters.
Assistance, is being offered to certain free public libraries which undertake library service for patients in hospitals in their centres. The libraries are supplied with books from a collection selected for hospital patients.
A library service is given to lighthouses from Country Library Service headquarters, and a service for Works Department, State Hydro-electric, and State Forest Service camps is planned to start in 1949.
Particulars of libraries, &c., obtaining books from the Country Library Service on 31st December, 1948, were as follows: free libraries, 82; subscription libraries, 675; groups, 38; readers receiving individual service, 1,170, and lighthouses, 25.
The launching of the School Library Service, operating upon a circulating basis, has been a most important development. This Service, which is financed by the Education Department and administered by the Country Library Service, aims at giving primary-school children access to the best of children's modern literature. At 31st December, 1918, some 1,917 schools, representing 118,852 children, were receiving loans of books from the School Library Service.
National Library Centre.—The National Centre is responsible for various bibliographical projects, such as the maintenance of the Union Catalogue, the Union List of Serials and the Index to New Zealand Periodicals, and the development of a National Bibliography. Bibliographies and indexes on special subjects are furnished when required. The Centre's other main function, developed in conjunction with the Book Resources Committee of the New Zealand Library Association, is concerned with problems of book and periodical coverage. These projects are designed to guarantee that there will be available in the country at least one copy of all books of any consequence published in the English language and to maintain a continuous survey of holdings of books published in the past.
Library School.—The Library School was established in 1943, and at the end of 1948 seventy-nine students had taken the course.
The school offers professional training to those holding University degrees or with equivalent education, and the course lasts from February to November.
Students receive allowances equal to those paid to students of Teachers' Training Colleges.
Short courses for Librarians of smaller libraries were hold in 1947 and 1948. A short course for librarians of Government Departments is planned for 1949.
CIVIL CASES.—The law relating to Magistrates' Courts and to the jurisdiction of Magistrates in civil proceedings was consolidated and amended by the Magistrates' Courts Act, 1947. Under the new legislation the monetary limitation for claims determined in the ordinary civil jurisdiction of the Court was raised to £500 (previously £300), or, where the parties agree in writing that the Court shall have jurisdiction, claims involving any amount may be decided. The Act of 1947 also empowered the Court to grant equitable remedies, which formerly it could not grant.
The numbers of plaints entered and of cases tried, and the amounts sued for and for which judgment was recorded, in the lower Courts during the last eleven years are shown in the following table.
| Year. | Plaints entered. | Cases tried. | |||
|---|---|---|---|---|---|
| Number. | Total Amount sued for. | Number. | Total Amount claimed. | Total amount for which Judgment Judgment entered. | |
| £ | £ | £ | |||
| 1937 | 53,613 | 767,578 | 35,015 | 473,848 | 378,810 |
| 1938 | 61,351 | 829,935 | 40,327 | 500,395 | 423,528 |
| 1939 | 67,298 | 894,866 | 42,577 | 555,503 | 456,627 |
| 1940 | 61,828 | 781,294 | 39,953 | 507,710 | 421,302 |
| 1941 | 49,000 | 687,777 | 32,913 | 427,536 | 362,538 |
| 1942 | 32,484 | 495,038 | 21,582 | 306,926 | 253,296 |
| 1943 | 22,337 | 353,736 | 15,027 | 215,764 | 175,315 |
| 1944 | 20,800 | 395,946 | 14,016 | 228,428 | 181,262 |
| 1945 | 20,184 | 412,327 | 12,890 | 277,579 | 193,785 |
| 1946 | 24,407 | 544,084 | 14,507 | 311,505 | 241,523 |
| 1947 | 28,332 | 694,873 | 16,724 | 422,046 | 345,472 |
The numbers of actions commenced, cases tried, and judgments entered, together with the total amount for which judgments were recorded, in the Supreme Court of New Zealand in its civil jurisdiction during the last eleven years were as follows:—
| Year. | Number of Actions commenced. | Cases tried. | Judgments recorded. | ||
|---|---|---|---|---|---|
| With Jury. | Without Jury. | Number. | Amount. | ||
| 1937 | 887 | 144 | 282 | 334 | 137,714 |
| 1938 | 775 | 138 | 127 | 245 | 137,916 |
| 1939 | 999 | 130 | 282 | 312 | 153,667 |
| 1940 | 825 | 96 | 205 | 201 | 112,534 |
| 1941 | 751 | 65 | 202 | 198 | 82,344 |
| 1942 | 598 | 65 | 176 | 192 | 77,634 |
| 1943 | 555 | 51 | 182 | 158 | 48,400 |
| 1944 | 713 | 77 | 199 | 166 | 65,067 |
| 1945 | 779 | 86 | 209 | 159 | 116,739 |
| 1946 | 889 | 70 | 255 | 231 | 109,252 |
| 1947 | 1,055 | 84 | 225 | 197 | 110,595 |
INQUESTS.—The following is a table of inquests held over the last eleven years.
| Year. | Males. | Females. | Totals. | Maoris (included in Totals). |
|---|---|---|---|---|
| 1937 | 1,228 | 566 | 1,794 | 147 |
| 1938 | 1,430 | 605 | 2,035 | 156 |
| 1939 | 1,158 | 493 | 1,651 | 125 |
| 1940 | 1,157 | 507 | 1,664 | 122 |
| 1941 | 1,292 | 530 | 1,822 | 145 |
| 1942 | 1,183 | 516 | 1,699 | 126 |
| 1943 | 1,046 | 386 | 1,432 | 121 |
| 1944 | 1,010 | 379 | 1,389 | 131 |
| 1945 | 975 | 416 | 1,391 | 138 |
| 1946 | 1,071 | 401 | 1,472 | 154 |
| 1947 | 1,115 | 367 | 1,482 | 136 |
For the same period inquests are classified hereunder according to the type of verdict returned.
| Year. | Disease and Natural Causes. | Accident. | Homicide. | Suicide. | Violent Deaths, Nature Unknown. | |||||
|---|---|---|---|---|---|---|---|---|---|---|
| M. | F. | M. | F. | M. | F. | M. | F. | M. | F. | |
*Included in accidental deaths. | ||||||||||
| 1937 | 535 | 382 | 582 | 122 | 5 | 2 | 106 | 60 | * | * |
| 1938 | 589 | 413 | 646 | 134 | 5 | 3 | 158 | 47 | 32 | 8 |
| 1939 | 510 | 307 | 478 | 127 | 5 | 3 | 129 | 42 | 36 | 14 |
| 1940 | 564 | 359 | 465 | 102 | 5 | 3 | 84 | 28 | 39 | 15 |
| 1941 | 617 | 398 | 548 | 85 | 4 | 4 | 98 | 36 | 25 | 7 |
| 1942 | 464 | 331 | 561 | 121 | 19 | 6 | 112 | 57 | 27 | 1 |
| 1943 | 350 | 176 | 566 | 165 | 9 | 6 | 93 | 36 | 28 | 3 |
| 1944 | 396 | 184 | 458 | 133 | 7 | 9 | 108 | 42 | 41 | 11 |
| 1945 | 390 | 233 | 414 | 103 | 16 | 10 | 112 | 51 | 43 | 19 |
| 1946 | 436 | 220 | 482 | 115 | 7 | 5 | 97 | 44 | 49 | 17 |
| 1947 | 486 | 183 | 498 | 132 | 5 | 6 | 103 | 29 | 23 | 17 |
The most arresting feature of the statistics of suicide is the fact that the incidence among males is from two to three times greater than among females. Also of interest is the lower rate during the war, which confirms the experience of other belligerent countries.
Fire Inquests.—In case of fire causing the destruction of any building, ship, or merchandise, or any stack of grain, pulse, or hay, or any growing crop, a Coroner may hold an inquiry into the cause of such fire, the procedure being similar to that of inquests into causes of death. During the five years 1943–47, only one sunk inquest was held, the verdict being “cause accidental.”
POLICE FORCE.—The Police Force in New Zealand is a national body maintained wholly by the General Government. As at present constituted, it was established under the provisions of the Police Force Act, 1886, which came into operation on 1st September of that year. Prior to that date police duty in New Zealand had been carried out by members of the Armed Constabulary, which was then disbanded, some of its members being transferred to the newly constituted Police Force and others to the Permanent Militia. The Police Force Act, 1886, consolidated in 1908, was revised and brought up to date by the Police Force Act, 1913, and minor amendments were enacted in 1919, 1924, 1938, and 1941. In 1947 an Act to consolidate and amend the law relating to the establishment and regulation of the Force was passed, and the Police Force Act, 1947, is the statute under which the Force now functions.
Organization and Duties.—The Commissioner of Police, with headquarters at Wellington, has, subject to the directions of the Minister in Charge of the Police Department, the general superintendence and control of the Police Force. New Zealand is divided into fifteen districts, each under the charge of a Superintendent or Inspector of Police, who is responsible to the Commissioner for the maintenance of good order and the proper execution of police duty therein. Districts are divided into sub-districts under the charge of sergeants or constables, and cities and towns where regular beat duty is performed are divided into beats, patrolled by constables under the supervision of sergeants.
The principal duty of the Police Force as defined by the Police Force Act is “the preservation of peace and order, the prevention of crime, and the apprehension of offenders against the peace.” In addition to the enforcement of the criminal law and the provisions of the Police Offences Act, there are several statutes of a regulatory nature which the police are called upon to administer, wholly or partly, such as the Arms Act, Licensing Act, Gaining Act, Dangerous Drugs Act, Motor-vehicles Act, Pawnbrokers Act, Second-hand Dealers Act, &c. They also undertake inquiries and other duties on behalf of other Departments of the Government Service, principally the Social Security Department, Registrar-General's Office, Internal Affairs Department, and Education Department (Child Welfare Branch).
Police in country districts in many cases hold such additional appointments as Clerks and Bailiffs of Magistrates' Courts, Inspectors of Factories, Probation Officers, Inspectors of Sea-fishing, Kauri-gum Rangers, and Sub-enumerators of Agricultural and Pastoral Statistics.
Recruiting.—Recruits for the Police Force must be between the ages of twenty-one and thirty years, be not less than 5 ft. 9 in. in height, and have a normal chest measurement of not less than 38 in. They must be the holders of a certificate of school attainment for Form I, or possess educational qualifications of an equal or higher standard. They must be of good moral character, smart, active, intelligent, and free from bodily complaint or infirmity. The selection of recruits is made by the Commissioner after exhaustive inquiries have been made into the character, antecedents, and qualifications of the applicants. Before appointment they undergo a course of training in the Training Depot, in which they are drilled and receive instruction in the duties they will be called upon to perform.
Appointments to vacancies in the higher ranks of the Force are made from those members of the next lower rank who have qualified by examination, efficiency, and seniority for such promotion.
Members who show an aptitude for detective duty are detailed for service in the Detective Branch, which is attached to each district headquarters and undertakes the investigation and detection of the more serious crimes.
Strength of Force.—In addition to the Commissioner, the strength of the Police Force on 31st March, 1948, was 1,520, an increase of 23 during the year. The total was made up as follows: 7 superintendents, 18 inspectors, 11 sub-inspectors, 55 senior sergeants, 157 sergeants, 1008 constables, 170 temporary constables, 13 senior detectives, 44 detective-sergeants, and 37 detectives. There were also 14 police surgeons, 32 policewomen and 8 matrons.
The following table shows the strength of the Police Force during the last eleven years.
| As at 31st March, | Officers. | Non-commissioned Officers. | Detectives. | Constables. | Totals.* | Police to Population (including Maoris). | Cost per Head of Population. |
|---|---|---|---|---|---|---|---|
*Not including surgeons, police-women, matrons, &c. | |||||||
| s. d. | |||||||
| 1938 | 26 | 145 | 93 | 1,164 | 1,428 | 1 to 1,123 | 7 6 |
| 1939 | 27 | 148 | 91 | 1,173 | 1,439 | 1 to 1,129 | 7 5 ¾ |
| 1940 | 27 | 149 | 90 | 1,191 | 1,457 | 1 to 1,126 | 7 8 ½ |
| 1941 | 28 | 155 | 97 | 1,229 | 1,509 | 1 to 1,084 | 7 11 ¼ |
| 1942 | 29 | 159 | 105 | 1,306 | 1,599 | 1 to 1,022 | 8 3 ¼ |
| 1943 | 29 | 175 | 112 | 1,324 | 1,640 | 1 to 998 | 8 10 ½ |
| 1944 | 31 | 173 | 116 | 1,314 | 1,634 | 1 to 1,006 | 9 5 ½ |
| 1945 | 37 | 168 | 110 | 1,250 | 1,565 | 1 to 1,064 | 9 1 ½ |
| 1946 | 34 | 174 | 103 | 1,164 | 1,475 | 1 to 1,159 | 9 10 ½ |
| 1947 | 38 | 208 | 97 | 1,154 | 1,497 | 1 to 1,184 | 10 6 ¼ |
| 1948 | 36 | 212 | 94 | 1,178 | 1,520 | 1 to 1,192 | 10 8 ¼ |
The next table shows the proportion of police to population and the cost of police per head of population at the latest available date in New Zealand and the various Australian States.
| Place. | Number of Police. | Proportion of Police to Population. | Cost of Police Per Inhabitant. |
|---|---|---|---|
| s. d. | |||
| New Zealand | 1,520 | 1 to 1,192 | 10 8 ¼ |
| Victoria | 2,332 | 1 to 884 | 13 5 |
| New South Wales | 4,051 | 1 to 739 | 15 6 |
| Queensland | 1,703 | 1 to 651 | 18 11 |
| South Australia | 966 | 1 to 672 | 16 7 ¾ |
| Western Australia | 681 | 1 to 744 | 16 6 |
| Tasmania | 330 | 1 to 782 | 16 0 ¾ |
Women Police.—By the Statutes Amendment Act, 1938, provision was made for the appointment of women police, it being enacted that the terms of the Police Force Act, shall apply to women appointees. The first 10 appointees completed their training and commenced duty in October, 1941. The present strength is 32, all of whom are stationed in Auckland, Wellington, Christchurch, or Dunedin. These women police are attached to the detective staffs and do not wear uniform. Their duties consist mainly of investigating complaints in respect of women and children, and their work is confined largely to their own sex.
CRIMINAL CASES IN MAGISTRATES' COURTS.—Maoris are included in the statistics relating to Magistrates' Courts, as well as in those for Supreme Courts and for prisons. Separate figures relating to offences by Maoris are given towards the end of this section. Children's Court cases are excluded, however, and will be found under the later heading “Juvenile Offenders.”
The following table shows the number of criminal charges dealt with in Magistrates' Courts during each of the last eleven years.
| Year. | Number. | Per 1,000 of Mean Population. | ||||
|---|---|---|---|---|---|---|
| Against Males. | Against Females. | Totals. | Against Males. | Against Females. | Totals. | |
| 1937 | 47,741 | 2,842 | 50,583 | 59.14 | 3.63 | 31.81 |
| 1938 | 54,658 | 3,000 | 57,658 | 67.00 | 3.79 | 35.88 |
| 1939 | 57,321 | 3,008 | 60,329 | 69.33 | 3.75 | 37.05 |
| 1940 | 50,660 | 2,560 | 53,220 | 61.57 | 3.14 | 32.50 |
| 1941 | 43,814 | 2,478 | 46,292 | 54.45 | 3.00 | 28.38 |
| 1942 | 35,353 | 2,714 | 38,067 | 44.10 | 3.24 | 23.22 |
| 1943 | 34,247 | 2,921 | 37,168 | 43.41 | 3.45 | 22.72 |
| 1944 | 36,880 | 3,168 | 40,048 | 46.16 | 3.70 | 24.19 |
| 1945 | 39,552 | 2,922 | 42,474 | 47.83 | 3.37 | 25.06 |
| 1946 | 44,863 | 2,699 | 47,562 | 51.00 | 3.06 | 27.00 |
| 1947 | 46,337 | 2,425 | 48,762 | 51.34 | 2.69 | 27.05 |
The following table gives the number of convictions in Magistrates' Courts, classified according to some of the more common offences or groups of offences for each of the years 1937–41, and for 1947. The figures refer to total charges, with the corresponding number of distinct cases given following the totals for each year. Owing to shortage of staff, &c., it was found impossible to continue the collection and compilation of detailed figures for the five years 1942–46.
The more serious cases—such as those of a sexual nature or those involving grave bodily injury—are not tried summarily, but are sent forward to the Supreme Court for trial or sentence, and consequently do not appear in this table.
| Type of Offence. | 1937. | 1938. | 1939. | 1940. | 1941. | 1947. |
|---|---|---|---|---|---|---|
*Counting only the principal offence in cases where a person is charged simultaneously with two or more offences. † Not available. | ||||||
| Common assault | 481 | 573 | 630 | 631 | 535 | 588 |
| Other offences against the person | 100 | 60 | 73 | 66 | 57 | 66 |
| Theft | 2,504 | 2,587 | 2,878 | 3,231 | 3,061 | 2722 |
| Wilful damage | 457 | 445 | 534 | 514 | 642 | 414 |
| Other offences against property (including forgery) | 1,230 | 1,352 | 1,240 | 1,394 | 1,179 | 1,165 |
| Drunkenness (including drunk in charge, &c.) | 5,032 | 5,746 | 6,441 | 5,922 | 5,100 | 2,763 |
| Application for prohibition order | 1,226 | 1,303 | 1,220 | 982 | 1,041 | 702 |
| Offensive conduct or language, obstruction, &c., of police, and vagrancy | 1,199 | 1,706 | 1,754 | 2,864 | 2,434 | 2,844 |
| Minor traffic offences | 16,473 | 23,206 | 24,652 | 18,504 | 13,274 | 19,122 |
| Other offences against good order | 1,710 | 1,362 | 1,492 | 1,311 | 1,295 | 1,180 |
| Breach of probation | 117 | 125 | 159 | 132 | 148 | 136 |
| Unlawfully on licensed premises and other breaches of licensing Act | 3,639 | 3,358 | 4,177 | 3,863 | 3,200 | 2,647 |
| Failing to furnish return and making false return of land and income | 1 | 5 | 30 | 55 | 99 | 212 |
| Failing to pay maintenance | 1,376 | 1,623 | 1,639 | 1,351 | 1,445 | 1,349 |
| Deserting merchant ships | 90 | 104 | 150 | 94 | 103 | 575 |
| Breaches of price control orders | 61 | 20 | 282 | |||
| Other offences | 7,091 | 6,096 | 5,219 | 5,135 | 6,003 | 4,223 |
| Totals | 42,726 | 49,651 | 52,288 | 46,110 | 39,636 | 40,990 |
| Distinct cases* | † | 41,573 | 44,208 | 38,278 | 32,419 | 34,600 |
The figure for total convictions (40,990) for 1947 represents a rate of 22.74 per 1,000 mean population.
The subject of traffic offences—which accounted for almost half of the total convictions in 1947—is dealt with in greater detail toward the end of this section.
A table showing result of hearing and punishments inflicted on summary conviction for all cases during 1947 is now given.
| Result of Hearing. | Offences against the Person. | Offences against Property.* | Offences against Good Order. | Other Offences. | Totals. |
|---|---|---|---|---|---|
*Including forgery and uttering. | |||||
| Dismissed or withdrawn | 192 | 643 | 1,406 | 3,321 | 5,562 |
| Admonished and discharged | 6 | 13 | 9 | 7 | 34 |
| Committed for trial | 241 | 457 | 19 | 12 | 729 |
| Committed for sentence | 224 | 1,213 | 1 | 9 | 1,447 |
| Released under Offenders Probation Act | 64 | 763 | 100 | 110 | 1,037 |
| Convicted and discharged | 83 | 986 | 982 | 406 | 2,457 |
| Convicted and ordered to come up for sentence | 65 | 302 | 106 | 57 | 530 |
| Committed to Borstal Institution, Salvation Army Home. &c. | 2 | 127 | 20 | 20 | 169 |
| Fined | 309 | 974 | 24,295 | 5,971 | 31,519 |
| Imprisonment in lieu of fine | 10 | 30 | 41 | 102 | 183 |
| Peremptory imprisonment | 115 | 1,113 | 350 | 847 | 2,425 |
| Bound over | 5 | 1 | 4 | 10 | |
| Order made | 1 | 5 | 713 | 1,911 | 2,630 |
| Totals | 1,316 | 6,627 | 28,046 | 12,773 | 48,762 |
| Distinct cases | 1,031 | 3,445 | 24,759 | 10,068 | 39,303 |
The 39,303 distinct cases were dealt with as follows: dismissed or withdrawn, 3,796; committed for trial or sentence, 884; released on probation, 789; convicted and discharged, 1,125; fined, 27,800; imprisoned, 2,047; otherwise, 2,862.
CRIMINAL CASES IN SUPREME COURT.—Criminal cases in the Supreme Court are of two classes—viz., those in which the accused person has pleaded guilty in the lower Court and has been committed to the Supreme Court for sentence, and those actually tried in the Supreme Court.
The following table gives a summary of criminal cases dealt with in the Supreme Court during each of the last five years. As previously mentioned, Maoris are included. Frequently a series of charges is perferred against the one offender, and this serves to explain the distinction between total cases and distinct persons.
| Year. | Tried in Supreme Court. | Sentences in Case of Committal for Sentence. | Total Sentences. | ||||||
|---|---|---|---|---|---|---|---|---|---|
| Indictments and Informations. | Convictions. | ||||||||
| M. | F. | M. | F. | M. | F. | M. | F. | Totals. | |
| (a) Total Cases | |||||||||
| 1943 | 535 | 20 | 268 | 12 | 1,035 | 63 | 1,303 | 75 | 1,378 |
| 1944 | 844 | 43 | 402 | 9 | 1,024 | 6 | 1,426 | 15 | 1,441 |
| 1945 | 757 | 12 | 402 | 7 | 1,445 | 31 | 1,847 | 38 | 1,885 |
| 1946 | 9 | 14 | 454 | 4 | 1,204 | 51 | 1,658 | 55 | 1,713 |
| 1947 | 829 | 27 | 388 | 7 | 1,529 | 24 | 1,917 | 31 | 1,948 |
| (b) Distinct Persons | |||||||||
| 1943 | 196 | 9 | 113 | 4 | 353 | 24 | 466 | 28 | 494 |
| 1944 | 295 | 19 | 200 | 6 | 348 | 6 | 548 | 12 | 560 |
| 1945 | 247 | 9 | 165 | 5 | 433 | 16 | 598 | 21 | 619 |
| 1946 | 316 | 9 | 199 | 4 | 432 | 20 | 631 | 24 | 655 |
| 1947 | 309 | 17 | 187 | 6 | 530 | 17 | 717 | 23 | 740 |
Of the 326 distinct persons indicted during 1947, 193 were convicted and 107 acquitted. Of the remainder, no bill was returned or the prosecution was otherwise not proceeded with in 17 instances, 3 persons were found insane, and 6 were awaiting trial at the end of the year.
The next table summarizes the offences of persons convicted and sentenced in the Supreme Court during each of the last five years.
| Year. | Total Convictions and Sentences. | Distinct Persons convicted and sentenced. | ||||||||
|---|---|---|---|---|---|---|---|---|---|---|
| Offences against the Person. | Offences against Property. | Forgery and Offences against the Currency. | Other Offences | Totals. | Offences against the Person. | Offences against Property. | Forgery and Offences against the Currency. | Other Offences | Totals. | |
| 1943 | 248 | 960 | 135 | 35 | 1,378 | 160 | 291 | 25 | 18 | 494 |
| 1944 | 285 | 1,046 | 38 | 72 | 1,441 | 172 | 338 | 16 | 34 | 560 |
| 1945 | 301 | 1,468 | 69 | 47 | 1,885 | 194 | 389 | 17 | 19 | 619 |
| 1946 | 292 | 1,277 | 109 | 35 | 1,713 | 206 | 407 | 25 | 17 | 655 |
| 1947 | 393 | 1,429 | 76 | 50 | 1,948 | 254 | 448 | 14 | 24 | 740 |
The table which follows shows the number of distinct persons sentenced in Supreme Courts during each of the years 1937–47, classified according to the principal types of offence.
| Type of Offence. | 1937. | 1938. | 1939. | 1940. | 1941. | 1942. | 1943. | 1944. | 1945. | 1946. | 1947. |
|---|---|---|---|---|---|---|---|---|---|---|---|
| Murder | 2 | 1 | 1 | 1 | 2 | 2 | 4 | 3 | 3 | ||
| Attempted murder | 1 | 1 | 1 | 1 | 3 | 2 | 1 | ||||
| Manslaughter | 6 | 3 | 2 | 3 | 2 | 3 | 5 | 2 | 3 | ||
| Traffic offences involving death or injury | 15 | 34 | 34 | 44 | 31 | 6 | 7 | 9 | 17 | 24 | 37 |
| Assaults and wounding | 25 | 30 | 27 | 30 | 18 | 37 | 19 | 21 | 21 | 20 | 30 |
| Sexual offences | 119 | 102 | 132 | 129 | 134 | 126 | 106 | 113 | 122 | 124 | 149 |
| Other offences against the person | 18 | 11 | 13 | 8 | 20 | 24 | 24 | 23 | 25 | 22 | 27 |
| Robbery, burglary, and breaking and entering | 149 | 152 | 198 | 192 | 170 | 137 | 153 | 200 | 231 | 263 | 229 |
| Theft, receiving, and fraud | 109 | 105 | 93 | 73 | 86 | 64 | 130 | 125 | 140 | 135 | 214 |
| Other offences against property | 12 | 10 | 23 | 12 | 19 | 5 | 8 | 13 | 18 | 9 | 9 |
| Forgery and uttering | 32 | 22 | 34 | 24 | 26 | 22 | 25 | 16 | 17 | 25 | 14 |
| Other offences | 27 | 13 | 13 | 33 | 35 | 30 | 18 | 34 | 19 | 17 | 24 |
| Totals | 507 | 488 | 571 | 547 | 542 | 457 | 494 | 560 | 619 | 655 | 740 |
| Per 10,000 mean population | 3.19 | 3.04 | 3.51 | 3.34 | 3.32 | 2.79 | 3.02 | 3.38 | 3.65 | 3.72 | 4.11 |
Since 1943 there has been a fairly marked increase in the incidence of serious crime, an experience not by any means confined to New Zealand. A similar trend is reported from many other countries, and may be regarded in part at least as an aftermath of war conditions.
Apart from the increase in the number of Maoris arraigned and sentenced on serious charges, the influx of certain undesirable elements, principally through ship desertion, has been a minor but not negligible factor.
One hundred and forty Maoris were included among the 740 distinct offenders sentenced in the Supreme Court in 1947, and 476 others (including 18 women) were born in New Zealand. The birthplace was England or Wales in 54 cases, Scotland in 17, Eire in 7, and Australia in 24 cases.
Sentences imposed in the Supreme Court during 1947 were as follows: Released under the Offenders Probation Act, 173; ordered to come up for sentence, 10; lined, 28; imprisonment, 272; reformative detention, 210; detention in Borstal institution, 43. Twenty-seven of those sentenced to imprisonment received, in addition, a term of reformative detention, and seven were declared Habitual criminals during the year. Four persons were convicted and discharged.
Of the offenders, 94 were under twenty years of age, 205 between twenty and twenty-five, 131 between twenty-five and thirty, 170 between thirty and forty, 88 between forty and fifty, 36 between fifty and sixty, and 16 were sixty years or over.
By the Crimes Amendment Act, 1941, the death sentence for murder was abolished, life imprisonment with hard labour being substituted therefor. This amendment is an affirmation of governmental policy, all death sentences from 1936 onwards having been commuted to imprisonment for life. The same enactment also removed flogging and whipping from the list of sentences that may be imposed.
COURT OF APPEAL.—Under the provisions of the Judicature Amendment Act, 1913, the Court of Appeal consists of two divisions, called the First Division and the Second Division, each division consisting of five Judges of the Supreme Court, who are appointed as members of either division by the Governor-General in Council on the recommendation of three Judges of the Supreme Court, including the Chief Justice. The same division does not exercise the jurisdiction of the Court of Appeal at two successive sittings, but exercises its jurisdiction separately, except that in cases of importance involving special difficulty the Chief Justice and one other Judge may recommend, for the approval of the Governor-General in Council, that a joint sitting of both divisions be held. The Chief Justice or, in his absence, the senior Judge presides. The decision of the Court must be in accordance with the majority of the Judges present but, if the Judges present are equally divided in opinion, the judgment, &c., appealed from is deemed to be affirmed.
Under an amendment of 1933, special sittings of the Court of Appeal may be held at times and places appointed by Order in Council. This authority may be exercised only on a certificate of not less than three Judges (of whom the Chief Justice shall be one) that it is not expedient to delay hearing the appeal or other proceeding. For a special sitting any three or more Judges may exercise the jurisdiction of the Court.
In addition to the ordinary appeals from the Supreme Court, certain other proceedings arising in inferior Courts may, on an order of the Supreme Court, be removed into the Court of Appeal for argument. All decisions of the Court of Appeal are final unless leave is granted to appeal to His Majesty in Council (i.e., the Privy Council).
The law relating to appeals in criminal cases was consolidated and amended by the Criminal Appeal Act, 1945, which repealed the relevant sections of the Crimes Act, 1908, and the Crimes Amendment Act, 1920. The Act provides that any person convicted on indictment (or committed for sentence) may appeal to the Court (a) against his conviction on any ground involving a question of law; (b) with the leave of the Court of Appeal, on any ground involving a question of fact (or on any other ground deemed sufficient by the Court); (c) with the leave of the Court of Appeal, against the sentence passed, unless such sentence is fixed by law.
The now Act does not affect the Crown's prerogative of mercy, but contains a provision enabling the Governor-General to refer any application for the exorcise of the prerogative to the Court of Appeal.
During the five years 1943 to 1947, 12 Crown criminal cases were brought before the Appeal Court. In 6 instances convictions were affirmed, in 5 cases the conviction was quashed, and in the remaining case a new trial was ordered. There were 90 civil appeals, of which 45 were allowed, and also 28 cases removed to the Appeal Court, resulting in 15 judgments for plaintiffs and 8 for defendants.
Particulars concerning applications during the last five years (1943 to 1947) for leave to appeal against sentences under the appropriate sections of the existing Acts were: Applications filed, 473; granted, 139; refused, 334. Of the 139 cases in which leave to appeal was granted the sentence was varied in 97 cases and dismissed in 42.
PRISONS AND PRISONERS.—There are fourteen prisons and State reformatories and three Borstal institutions in New Zealand, as well as 21 minor prisons and police-gaols. In addition to these there are the police-stations which, under section 17 of the Statute Law Amendment Act, 1917, may be deemed to be prisons for any period (which must not exceed seven days) during which prisoners are detained there undergoing sentence.
A summary of receptions and discharges during the year 1947 is given below.
| — | Males. | Females. | Totals. |
|---|---|---|---|
| In confinement at 1st January, 1947 | 998 | 34 | 1,032 |
| Received during the year | 4,460 | 150 | 4,610 |
| Discharged during the year:— | |||
| Transferred to other prisons or to the police | 1,651 | 62 | 1,713 |
| On expiration of sentence | 1,554 | 38 | 1,592 |
| Released on bail | 137 | 4 | 141 |
| Released on recommendation of Prisons Board | 534 | 23 | 557 |
| Released on special remission | 380 | 380 | |
| Debtors | 37 | 6 | 43 |
| Mental defectives | 20 | 4 | 24 |
| Other | 51 | 4 | 55 |
| In confinement at 31st December, 1947 | 1,094 | 43 | 1,137 |
| Daily average number in confinement during 1947 | 1,072 | 38 | 1,110 |
The following table shows the number of persons in prison on 31st December of each of the last eleven years.
| At 31st December. | Persons in Gaol. | Proportion per 10,000 of Population. | |||
|---|---|---|---|---|---|
| Undergoing Sentence. | On Remand and awaiting Trial, &c. | Total. | Undergoing Sentence. | Total in Confinement. | |
| 1937 | 790 | 45 | 835 | 4.93 | 5.21 |
| 1938 | 777 | 31 | 808 | 4.80 | 4.99 |
| 1939 | 895 | 39 | 934 | 5.45 | 5.69 |
| 1940 | 863 | 32 | 895 | 5.28 | 5.48 |
| 1941 | 988 | 27 | 1,015 | 6.06 | 6.22 |
| 1942 | 1,034 | 30 | 1,064 | 6.31 | 6.49 |
| 1943 | 1,024 | 53 | 1,077 | 6.26 | 6.58 |
| 1944 | 945 | 48 | 993 | 5.71 | 6.00 |
| 1945 | 998 | 42 | 1,040 | 5.77 | 6.02 |
| 1946 | 992 | 40 | 1,032 | 5.56 | 5.78 |
| 1947 | 1,088 | 49 | 1,137 | 5.97 | 6.24 |
In the following table persons in confinement at the end of each of the last five years are classified according to nature of sentence.
| Year. | Hard Labour or Simple Imprisonment. | Habitual Criminals. | Detained for Reformative Purposes. | Detained in Borstal Institution. | On Remand, awaiting Trial, &c. | Totals. | ||
|---|---|---|---|---|---|---|---|---|
| Under Three Months. | Three Months and under One Year. | One Year and over. | ||||||
*Includes 37 military defaulters undergoing detention for duration of war. † Includes two debtors. | ||||||||
| 1943 | 87 | 193 | 329 | 22 | 154 | 239 | 53 | 1,077 |
| 1944 | 51 | 140 | 316 | 47 | 163 | 228 | 48 | 993 |
| 1945 | 74 | 148 | 337* | 45 | 182 | 210 | 42 | 1,040† |
| 1946 | 93 | 140 | 265 | 47 | 240 | 207 | 40 | 1,032 |
| 1947 | 102 | 178 | 293 | 48 | 296 | 171 | 49 | 1,137 |
As already stated, there were 4,610 receptions during 1947, counting each person once every time received, whether by the same prison or otherwise. This figure is made up as follows:—
| Debtors and mental defectives | 50 |
| Transfers between institutions | 1,271 |
| Acquitted, fined, placed on probation, &c. | 629 |
| Multiple receptions of the same prisoner | 300 |
| Distinct prisoners received under sentence | 2,351 |
| Total | 4,601 |
| Plus difference between number held on remand at beginning and end of year | 9 |
| Total | 4,610 |
Of the different classes of receptions into prison shown above, the important figure is that of distinct prisoners received under sentence—i.e., counting each sentenced prisoner once only during the year, irrespective of the number of separate terms served. Of the 2,351 distinct prisoners received during 1947, 59 were females.
Analysing the distinct receptions according to nature of sentence, 1,918 prisoners were sentenced to hard labour or simple imprisonment, 241 to reformative detention, 142 to Borstal detention, 44 to hard labour and reformative detention, and 6 were declared habitual criminals and sentenced to hard labour. Three prisoners (included in the foregoing) were received under a life sentence of imprisonment.
The number of distinct persons received into prison under sentence of imprisonment during the last eleven years, with the proportion per 10,000 of mean population, is given in the next table. Debtors and insane persons received into gaol are excluded.
| Year. | Number. | Per 10,000 of Moan Population. |
|---|---|---|
| 1937 | 1,991 | 12.52 |
| 1938 | 2,224 | 13.84 |
| 1939 | 2,505 | 15.38 |
| 1940 | 2,201 | 13.44 |
| 1941 | 2,369 | 14.53 |
| 1942 | 3,029 | 18.48 |
| 1943 | 2,482 | 15.17 |
| 1944 | 2,099 | 12.68 |
| 1945 | 2,065 | 12.21 |
| 1946 | 2,213 | 12.56 |
| 1947 | 2,351 | 13.04 |
The exceptionally large increase in the number of persons sent to prison during the year 1942 was accounted for by the committal or transfer of over 500 military defaulters to prison, and approximately 400 persons involved in industrial disputes. None of the latter group actually served sentence, a remission being granted immediately after reception. The increase in receptions since 1945 is entirely due to sentences imposed on ship-deserters; in fact, but for the prevalence of this offence a substantial decrease would have been recorded.
Ages and offences of distinct persons received into prison under sentence during 1947 are summarized in the next table.
| Age, in Years. | Offences against the Person. | Burglary, theft and Fraud. | Conversion Wilful Damage, &c. | Vagrancy, and Drunkenness. | Other Offences. | Totals. | ||
|---|---|---|---|---|---|---|---|---|
| Sexual Offences. | Assaults. | Other. | ||||||
| Under 20 | 11 | 11 | 3 | 99 | 30 | 11 | 79 | 244 |
| 20 and under 25 | 18 | 46 | 6 | 252 | 65 | 27 | 299 | 713 |
| 25 and under 30 | 18 | 26 | 5 | 170 | 40 | 25 | 157 | 441 |
| 30 and under 40 | 22 | 24 | 9 | 215 | 19 | 34 | 163 | 486 |
| 40 and under 50 | 24 | 10 | 4 | 95 | 42 | 89 | 264 | |
| 50 and under 60 | 12 | 3 | 3 | 41 | 1 | 42 | 29 | 131 |
| 60 and over | 7 | 2 | 19 | 2 | 26 | 15 | 71 | |
| Not stated | 1 | 1 | ||||||
| Totals | 112 | 122 | 30 | 892 | 157 | 207 | 831 | 2,351 |
| Maoris (included above) | 21 | 43 | 6 | 196 | 56 | 42 | 82 | 446 |
Three persons were received under sentences of life imprisonment for murder during the year. Two were aged fourteen and fifteen respectively, while one was in the 25–30 years age group.
The final table of this category supplies statistics of ages and length of sentences of distinct persons received into prison under sentence during 1947.
| Age, in Years. | Length of Sentence. | |||||||
|---|---|---|---|---|---|---|---|---|
| Under 1 Month. | 1 Month and under 3 Months. | 3 Months and under 12 Months. | 1 Year and under 3 Years. | 3 Years and under 5 Years. | Over 5 Years. | Indefinite or not Stated. | Totals. | |
| Under 21 | 32 | 142 | 46 | 140 | 14 | 4 | 5 | 383 |
| 21 and under 25 | 76 | 260 | 111 | 109 | 17 | 1 | 574 | |
| 25 and under 30 | 58 | 178 | 121 | 72 | 10 | 2 | 441 | |
| 30 and under 40 | 73 | 149 | 141 | 97 | 22 | 4 | 486 | |
| 40 and under 50 | 56 | 70 | 76 | 47 | 12 | 3 | 264 | |
| 50 and under 60 | 32 | 41 | 30 | 22 | 6 | 131 | ||
| 60 and over | 23 | 26 | 12 | 7 | 3 | 71 | ||
| Not stated | 1 | 1 | ||||||
| Totals | 350 | 866 | 537 | 495 | 84 | 14 | 5 | 2,351 |
Of the total of distinct prisoners received into prison during 1947 no less than 60.0 per cent. had been convicted for an offence on at least one previous occasion, while 27.0 per cent. had been convicted more than six times. No less than 24.3 per cent. had been granted probation for previous offences and sixteen persons who had been declared habitual criminals were readmitted during the year.
BORSTAL INSTITUTIONS.—Included among the 1,088 prisoners undergoing sentence at the 31st December, 1947, were 171 persons (153 males, 18 females) detained in Borstal institutions under the provisions of the Prevention of Crime (Borstal Institutions Establishment) Act, 1924. This Act, which is an adaptation of Part I of the Prevention of Crime Act, 1908 (Imperial), as amended by the Criminal Justice Administration Act, 1914, is designed to prevent crime, and provides for the detention of young offenders in a special class of reformative institution. An offender between the ages of fifteen and twenty-one years (twenty-three in certain cases), who would otherwise be liable to sentence of imprisonment by the Supreme Court or sentence of imprisonment of not less than one month by a Magistrate, may be made the subject of an order of detention of from two to five years by a Judge of the Supreme Court, and from one to three years by a Magistrate, without a conviction being recorded in the latter case. Inmates (if not over twenty-five years of age) may be transferred from prisons, reformatory homes, State reformatory institutions, and institutions under the Child Welfare Act, 1925, to Borstal institutions, and from Borstal institutions to prisons. The Minister of Justice has power to release an offender undergoing detention on condition that he is placed under the supervision or authority of a probation officer, or of a society or person (to be specified) who may be willing to take charge of the case.
PRISONS BOARD.—For the purposes of the Crimes Amendment Act of 1910 there is constituted a Prisons Board, the members of which are appointed by the Governor-General in Council for a period of three years, and may be reappointed. As at present constituted, the Board consists of a Judge of the Supreme Court, as President, and six other members.
It is the duty of the Board to make inquiry from time to time as to whether there is reasonable cause for belief that any habitual criminal, habitual offender, or other person under sentence of imprisonment or reformative detention is sufficiently reformed to be released on probation or discharged, or for granting discharge to any person who has been released on probation; and to make recommendations as to the release or discharge of any habitual criminal, habitual offender, or other person under sentence of imprisonment or reformative detention, and as to the conditions which may be imposed on any such release or probation. The Board is required to take into consideration, at least once a year, the case of every habitual criminal, habitual offender, or person under sentence of reformative detention. Other classes of prisoners may not apply for and are not entitled to consideration until they have served at least half the sentence (or five years in the case of those sentenced to terms exceeding ten years), and no case is to be considered until six months after the date of reception of the prisoner into prison.
The following table shows the number of cases considered by the Board during each of the last five years.
| Year. | Borstal Detention. | Reformative Detention. | Hard Labour. | Habitual Criminals. | Probationers. | Totals. | |
|---|---|---|---|---|---|---|---|
| Crimes Amendment Act. | Offenders Probation Act | ||||||
| 1943 | 373 | 254 | 273 | 35 | 9 | 13 | 957 |
| 1944 | 367 | 271 | 278 | 36 | 10 | 12 | 974 |
| 1945 | 396 | 279 | 273 | 24 | 15 | 15 | 1,002 |
| 1946 | 371 | 360 | 249 | 38 | 8 | 15 | 1,041 |
| 1947 | 352 | 409 | 232 | 35 | 6 | 13 | 1,047 |
Of the cases considered in 1947, recommendations were made for release on probation in 596 cases, and for discharge from prison in 5 cases. Eleven probationers under the Offenders Probation Act were ordered to be discharged, while 5 probationers under the Crimes Amendment Act were recommended for discharge. In 2 cases of habitual criminals, recommendation was made for remission of head sentence. Twenty petitions were declined, while the remaining 408 cases were deferred.
PROBATION.—Legislation on this subject dates from 1886. Under the Offenders Probation Act of 1920 probation was extended to cover other than first offenders, and may be granted for “ any offence punishable by imprisonment, whether on indictment or otherwise.” Formerly there were numerous important exceptions. The maximum period of probation was fixed in 1920 at five years.
The conditions of release on probation include the necessity for a person on probation to report to the Probation Officer on specified days not more than one month apart, and to notify his address and any change of address. The nature and place of his employment must be made known to and be approved of by the Probation Officer, and he must not commit any offence against the law. The Probation Officer may warn him not to associate with any particular person or class of persons.
A breach of the conditions of the probationary licence renders the offender liable to imprisonment or fine, and in addition he may, in respect of the original offence, be either committed to prison or again released on probation.
The following figures are taken from successive returns prepared by the Chief Probation Officer.
| Year. | Number admitted to Probation. |
|---|---|
| 1937 | 636 |
| 1938 | 715 |
| 1939 | 942 |
| 1940 | 902 |
| 1941 | 709 |
| 1942 | 637 |
| 1943 | 896 |
| 1944 | 920 |
| 1945 | 886 |
| 1946 | 919 |
| 1947 | 972 |
The following table gives the ages and terms of probation of offenders dealt with under the provisions of the Act during the year 1947.
| Age, in Years. | 6 Months or under. | 1 Year. | 18 Months. | 2 Years. | 3 Years. | 4 Years | 5 Years. | Totals. |
|---|---|---|---|---|---|---|---|---|
| Under 20 | 17 | 120 | 26 | 103 | 23 | 2 | 291 | |
| 20 and under 25 | 28 | 153 | 21 | 89 | 16 | 1 | 1 | 309 |
| 25 and under 30 | 3 | 76 | 10 | 42 | 7 | 1 | 1 | 140 |
| 30 and under 40 | 2 | 58 | 12 | 38 | 20 | 2 | 1 | 133 |
| 40 and under 50 | 3 | 33 | 7 | 19 | 4 | 1 | 67 | |
| 50 and under 60 | 2 | 12 | 1 | 10 | 1 | 26 | ||
| 60 and over | 1 | 1 | 3 | 1 | 6 | |||
| Totals | 55 | 453 | 78 | 304 | 72 | 7 | 3 | 972 |
JUVENILE OFFENDERS.—Under the provisions of the Child Welfare Act, 1925, offences committed by juveniles are dealt with by Magistrates in special Courts. The Child Welfare Amendment Act, 1927, altered the definition of “child” to cover persons under seventeen years of age, instead of sixteen as formerly. Cases dealt with in Children's Courts are not now included in the statistics relating to Magistrates' Courts, and it is not the practice to enter a conviction against juvenile offenders.
The following table shows the number of cases dealt with in the Children's Courts during each of the years 1937–47, and also, where available, the number of “distinct cases”—i.e., excluding multiple charges against the same person. The collection of detailed information relating to cases heard in Children's Courts was resumed in 1947, after a lapse of five years.
| Year. | Total Cases. | Distinct Cases. | ||||
|---|---|---|---|---|---|---|
| Males. | Females. | Totals. | Males, | Females. | Totals. | |
*Not available. | ||||||
| 1937 | 4,095 | 406 | 4,501 | * | * | * |
| 1938 | 4,147 | 396 | 4,543 | * | * | * |
| 1939 | 4,685 | 415 | 5,100 | 2,638 | 357 | 2,995 |
| 1940 | 4,690 | 454 | 5,144 | 2,606 | 388 | 2,994 |
| 1941 | 3,596 | 379 | 3,975 | 2,188 | 336 | 2,524 |
| 1942 | 4,357 | 617 | 4,974 | * | * | * |
| 1943 | 4,262 | 578 | 4,840 | * | * | * |
| 1944 | 3,850 | 526 | 4,376 | * | * | * |
| 1945 | 3,732 | 495 | 4,227 | * | * | * |
| 1946 | 3,175 | 458 | 3,633 | * | * | * |
| 1947 | 2,941 | 365 | 3,306 | 1,620 | 285 | 1,905 |
Detailed statistics for Children's Court cases during each of the years 1937–41 and for 1947 are as follows. The figures shown refer to total cases.
| Type of Offence. | 1937. | 1938. | 1939. | 1940. | 1941. | 1947. |
|---|---|---|---|---|---|---|
* Including forgery and uttering. | ||||||
| Sexual offences | 79 | 60 | 66 | 57 | 43 | 70 |
| Assaults | 26 | 24 | 48 | 32 | 24 | 31 |
| Other offences against the person | 4 | 4 | 3 | 2 | 9 | 7 |
| Robbery, burglary, and breaking and entering | 397 | 507 | 487 | 761 | 383 | 374 |
| Theft, receiving, and fraud | 1,630 | 1,724 | 2,114 | 1,983 | 1,639 | 1,425 |
| Unlawful conversion of vehicles | 269 | 273 | 400 | 364 | 324 | 283 |
| Wilful damage | 663 | 339 | 532 | 612 | 469 | 232 |
| Other offences against property* | 88 | 51 | 36 | 45 | 44 | 51 |
| Offences against good order | 723 | 753 | 746 | 592 | 427 | 266 |
| Indigent or delinquent child | 454 | 595 | 548 | 574 | 417 | 490 |
| Other offences | 168 | 213 | 120 | 122 | 196 | 77 |
The 3,306 cases heard during 1947 resulted as follows: dismissed or withdrawn, 142; admonished and discharged, 1,140; committed to care of Child Welfare Branch of the Department of Education, 801; placed under supervision, 939; committed to an institution, 127; fined, 109; otherwise dealt with, 48. Four persons under 17 years of age were sentenced in Supreme Courts during 1947. Two of these, aged 14 and 15, were sentenced to hard labour for life for the crime of murder. Nineteen distinct persons under 17 years of age were received into prison during the year. Seventeen of these (including 5 females) were Borstal detainees, and 2 were received under sentence of hard labour.
OFFENCES BY WOMEN.—Of the 48,762 criminal charges dealt with in the Magistrates' Courts in 1947, 2,425 or 4.97 per cent. were against females. This figure is the lowest since 1933, and reflects the return to more normal standards of behaviour following the unrest of the war period. The comparable figure for 1940 was 2,699, and for 1945, 2,922.
Most of the offences for which summary convictions are entered against women in the lower Courts are of a trivial nature, such as minor breaches of traffic regulations, using unlicensed radios, &c.
Of the more serious offences the most common for which convictions resulted during 1947 were—attempted suicide, 17; common assault, 22; theft, 299; drunkenness, 80; offensive conduct or language, 46; and vagrancy, 37.
That women in general are of a law-abiding disposition is also exemplified by the Supreme Court statistics, which disclose that only 23 females (3.1 per cent. of the total) were sentenced in 1947 for criminal offences. Of these, 0 were sentenced for bigamy and 8 for theft, receiving, and fraud.
The number of distinct females received into prison under sentence during 1947 was 69, the principal offences of these being—vagrancy, 17; theft, 17; drunkenness, 4; selling liquor without a licence, 3, and breach of probation, 3.
Two reformatories (at Addington and at Tawa Flat near Wellington) house women prisoners only. There is also a Borstal institution at Tawa that for women only.
OFFENCES BY MAORIS.—As previously mentioned, Maoris are included in the statistical tables presented elsewhere in this section, the data given here being for purposes of comparison. According to the population estimate of 31st December, 1947, 4.39 per cent. of the total population of New Zealand aged fifteen and over were Maoris (i.e., full, three-quarter, or half-caste).
The number of summary convictions of Maoris brought before Magistrates' Courts for the years 1937–41 and for 1947 is shown in the next table.
| Year. | Class of Offence. | Percentage of Total Convictions in Magistrates' Courts. | |||||
|---|---|---|---|---|---|---|---|
| Against the Person. | Against Property. | Against Good Order. | Other Offences. | Totals. | |||
| Drunkenness.* | Other. | ||||||
* Excluding prohibition-order cases. | |||||||
| 1937 | 100 | 623 | 494 | 929 | 667 | 2,813 | 6.25 |
| 1938 | 126 | 474 | 502 | 1,117 | 651 | 2,870 | 5.78 |
| 1939 | 131 | 498 | 599 | 1,149 | 708 | 3,085 | 5.90 |
| 1940 | 123 | 529 | 606 | 647 | 885 | 2,790 | 6.05 |
| 1941 | 139 | 702 | 585 | 986 | 710 | 3,122 | 7.88 |
| 1947 | 147 | 745 | 385 | 800 | 995 | 3,072 | 7.49 |
The 3,072 convictions entered against Maoris during 1947 related to 2,391 distinct offenders (2,265 males and 126 females).
The total number of Maoris convicted and sentenced in Supreme Courts during the five years 1943–47 was 563, or 18–4 per cent. of the total of 3,068.
Of the 140 Maoris (including 3 females) sentenced during 1947, 112 were committed from Magistrates' Courts, and 28 were tried and convicted in Supreme Courts. The following table shows the number of Maoris sentenced in the Supreme Courts during each of the last eleven years, together with the percentage of Maori offenders to total persons sentenced in each case.
| Year. | Offences against the Person. | Offences against Property.* | Total Offences.† | |||||
|---|---|---|---|---|---|---|---|---|
| Sexual Offences. | Other. | |||||||
| Maoris Sentenced. | Percentage of Total Sentences. | Maoris Sentenced. | Percentage of Total Sentences. | Maoris sentenced. | Percentage of Total Sentences | Maoris sentenced. | Percentage of Total Sentences. | |
* Including forgery and uttering. † Includes other Offences. | ||||||||
| 1937 | 20 | 16.8 | 7 | 11.9 | 36 | 11.9 | 64 | 12.6 |
| 1938 | 14 | 13.7 | 7 | 8.3 | 23 | 8.0 | 44 | 9.0 |
| 1939 | 22 | 16.7 | 10 | 12.8 | 50 | 14.4 | 82 | 14.4 |
| 1940 | 23 | 17.8 | 12 | 14.3 | 51 | 16.9 | 87 | 15.9 |
| 1941 | 23 | 17.2 | 4 | 5.6 | 50 | 16.6 | 79 | 14.6 |
| 1942 | 22 | 17.5 | 17 | 23.3 | 30 | 13.2 | 70 | 15.3 |
| 1943 | 26 | 24.5 | 9 | 16.7 | 41 | 13.4 | 78 | 15.8 |
| 1944 | 25 | 22.1 | 7 | 11.9 | 45 | 12.7 | 78 | 13.9 |
| 1945 | 39 | 32.0 | 13 | 18.1 | 89 | 21.9 | 143 | 23:1 |
| 1946 | 34 | 27.4 | 15 | 18.3 | 69 | 16.0 | 124 | 18.9 |
| 1947 | 32 | 21.5 | 19 | 18.8 | 87 | 18.7 | 140 | 18.9 |
The number of distinct Maoris received into prison under sentence during 1947 was 446 (19.0 per cent. of the total committals). Nineteen females are included in this figure. Of the 1,137 prisoners held in custody at the 31st December, 1947, 263 (23.1 per cent.) were Maoris.
The increase in serious crime among Maoris in recent years, while regrettable, is partly explained by the youthfulness of the Maori population, and the noticeable drift to the cities and towns, where temptation to crime is relatively greater.
DRUNKENNESS.—The following table shows the number of convictions for drunkenness, together with the rate per 1,000 of mean population for each of the years 1937–41, and for 1947.
| Year. | Convictions for Drunkenness. | Per 1,000 of Mean Population. | ||||
|---|---|---|---|---|---|---|
| Males. | Females. | Totals. | Males. | Females. | Totals. | |
| 1937 | 4,875 | 157 | 5,032 | 6.04 | 0.20 | 3.16 |
| 1938 | 6,567 | 179 | 5,746 | 6.82 | 0.23 | 3.58 |
| 1939 | 6,274 | 167 | 6,441 | 7.59 | 0.21 | 3.96 |
| 1940 | 5,752 | 170 | 5,922 | 6.99 | 0.21 | 3.62 |
| 1941 | 4,945 | 155 | 5,100 | 6.15 | 0.19 | 3.13 |
| 1947 | 2,683 | 80 | 2,763 | 2.97 | 0.09 | 1.53 |
Repeated charges against the same person are included in the totals shown in the preceding table, but the figures do not include technical convictions in cases of applications for the issue of prohibition orders, of which there were 702 in 1947. The remarkably low rate of 1.53 convictions for drunkenness per 1,000 mean population has never been approached in New Zealand since official statistics of this nature have been available, the lowest rate previously recorded being 2.16 in 1935. In 1895 the proportion was 6.52.
TRAFFIC OFFENCES.—The number of traffic offences dealt with in Magistrates' Courts during 1947 was 20,657, resulting in 19,914 convictions. Comparative figures for the years 1942–46 are not available, and in any case the indirect effects of petrol rationing and the shortage of tires render any valid comparison with pre-war years impossible.
The most noticeable feature of the 1947 figures is the striking increase in parking offences, which perhaps is not surprising in view of the problem of traffic congestion in the main centres of population.
No less than 48.6 per cent. of all convictions in Magistrates' Courts during 1947 related to traffic offences.
The following table shows convictions in Magistrates' Courts for traffic offences during each of the years 1937–41, and for 1947.
| Offence, | 1937. | 1938. | 1039. | 1940. | 1941. | 1947. |
|---|---|---|---|---|---|---|
| Failing to stop motor-vehicle after accident involving bodily injury | 4 | |||||
| Unlawfully converting vehicle to own use | 325 | 372 | 384 | 471 | 430 | 458 |
| Drunk in charge of motor-vehicle | 573 | 685 | 670 | 533 | 419 | 331 |
| Drunk in charge of other vehicle | 15 | 16 | 17 | 20 | 18 | 3 |
| Excessive speed in motor-vehicle | 1,587 | 2,855 | 3,389 | 2,467 | 1,384 | 1,986 |
| Negligent or dangerous driving of motor-vehicle | 3,712 | 4,523 | 4,624 | 3,283 | 1,678 | 3,403 |
| Negligent or dangerous driving of other vehicle | 548 | 426 | 451 | 467 | 295 | 282 |
| Breaches of regulations for the lighting of vehicles | 2,438 | 2,301 | 2,358 | 1,854 | 1,391 | 2,746 |
| Offences relating to the registration, &c., of motor-vehicles | 4,265 | 4,317 | 2,307 | 1,938 | 759 | 1,370 |
| Offences relating to driver's licence | 2,279 | 1,984 | 1,902 | 1,331 | ||
| Breaches of parking regulations | 2,161 | 3,547 | 3,498 | 1,779 | 1,432 | 4,955 |
| Other traffic offences | 1,762 | 5,237 | 5,746 | 4,732 | 4,433 | 3,049 |
| Totals | 17,390 | 24,279 | 25,723 | 19,528 | 14,141 | 19,914 |
| Convictions per 1,000 of mean population | 10.94 | 15.11 | 15.79 | 11.93 | 8.67 | 11.05 |
In addition to the offences punishable on summary conviction there are the more serious cases involving death or injury, which are almost invariably sent on to the Supreme Court for trial or sentence. Eighty-one such cases were sent forward in 1947, resulting in 37 persons being sentenced as follows: negligent or drunken driving causing death, 8; negligent or drunken driving causing injury, 9; failing to stop after accident involving injury, 20. The sentences imposed (in addition to fine, imprisonment, &c.) include 18 cases of cancellation of driving licence.
Figures showing the number of persons sentenced in Supreme Courts for serious traffic offences during each of the years 1937–47 will be found on page 169.
OFFENCES REPORTED TO THE POLICE.—So far all criminal statistics in this section have referred to offenders brought before the Courts, no account being taken of those cases where offences have been reported to the police but in which no arrest or summons resulted.
The following figures relating to offences reported are taken from the reports of the Police Department for the years 1943–47.
| Year. | Number of Offences reported. | Offences In which Arrests or Summonses resulted. | |
|---|---|---|---|
| Number. | Percentage of those reported. | ||
| 1943 | 33,192 | 28,722 | 86.53 |
| 1944 | 31,960 | 27,229 | 85.20 |
| 1945 | 33,744 | 27,965 | 82.87 |
| 1946 | 34,016 | 28,818 | 84.72 |
| 1947 | 34,628 | 29,238 | 84.43 |
It will be seen that, in cases where a crime is definitely established as such and reported to the police, an arrest or summons usually follows. The proportion of arrests and summonses varies, however, with the offence. Offences against the person, as might be expected, yield a much higher proportion of arrests or summonses than offences against property, in which detection of the lawbreaker is relatively more difficult.
Also taken from the annual reports of the Police Department, the following table shows, in respect of some of the principal offences, the number of offences reported during the last four years, and the number of arrests and summonses which resulted.
| Offences. | 1944. | 1945. | 1946. | 1947. | ||||
|---|---|---|---|---|---|---|---|---|
| Resulting in Arrest or Summons. | Reported. | Resulting in Arrest or Summons. | Reported. | Resulting in Arrest or Summons. | Reported. | Resulting in Arrest or Summons. | Reported. | |
| Murder and attempts | 28 | 24 | 27 | 27 | 15 | 13 | 15 | 14 |
| Manslaughter | 3 | 3 | 5 | 5 | 3 | 3 | 8 | 6 |
| Negligent driving causing death or injury | 25 | 23 | 35 | 34 | 49 | 45 | 46 | 44 |
| Attempted suicide | 72 | 72 | 74 | 72 | 61 | 61 | 70 | 69 |
| Assaults, wounding, &c. | 670 | 623 | 761 | 693 | 757 | 702 | 820 | 780 |
| Sexual offences | 348 | 328 | 388 | 346 | 257 | 211 | 296 | 259 |
| Robbery, breaking and entering, theft and receiving | 11,341 | 7,332 | 11,809 | 7,047 | 10,880 | 6,719 | 10,885 | 6,448 |
| Forgery, embezzlement, and fraud | 473 | 448 | 768 | 719 | 816 | 746 | 965 | 884 |
| Arson and attempts | 14 | 10 | 43 | 34 | 21 | 16 | 24 | 17 |
THE HIGHER DEFENCE ORGANIZATION.—The development of a higher defence organization in Now Zealand has been a progressive one since 1933, when the New Zealand Committee of Imperial Defence was formed. This Committee was succeeded in 1936 by the Organization for National Security, whose functions were merged with those of the War Cabinet Secretariat, formed in 1940. After the end of the Second World War and the consequent dissolution of the War Cabinet, the organization outlined below came into being. It resembles the higher defence organizations developed in the United Kingdom, Canada, and Australia, and is designed both to secure a co-ordinated approach to major defence problems in the broad sense, and to promote the maximum co-ordination between the three Services themselves.
Decisions in matters of defence policy are made by Cabinet, but in reaching these decisions Cabinet is assisted by the discussions in, and the conclusions of, the Council of Defence.
The Council of Defence.—The Council of Defence is comprised of—
The Prime Minister (Chairman).
The Minister of Finance.
The Minister of Defence.
The Minister of Rehabilitation.
The Minister of Labour and Employment.
The Minister of Supply.
The Chief of the General Staff.
The Chief of the Air Staff.
The Chief of the Naval Staff.
The Secretary to the Treasury.
The Permanent Head, Prime Minister's Department.
The Chiefs of Start, the Secretary to the Treasury, and the Permanent Head, Prime Minister's Department, participate in a consultative capacity only.
The Council is an advisory body which makes recommendations to Cabinet on matters referred to it. It deals with all questions of defence policy or organization, and in particular reviews plans affecting the Defence Forces of New Zealand. It also keeps under review questions of defence co-operation with the United Kingdom and other members of the Commonwealth, and deals with any military matters affecting New Zealand which may arise through membership of the United Nations.
The Chiefs of Staff Committee. —This Committee is composed of the Chiefs of the Naval, General, and Air Staffs and is a standing Committee to advise the Government on particular questions of defence policy, the preparation of strategic appreciations, and military plans.
The Principal Administrative Officers Committee. —This Committee is composed of the senior administrative officers and the Finance Members of the Service Boards. It considers questions arising under such headings as Personnel, Works, Supply, Munitions, Equipment, Pay, &c.
Both the Chiefs of Staff Committee and the Principal Administrative Officers Committee are served by a number of subordinate inter-Service committees.
DEFENCE SCIENCE.—The importance of scientific development in the defence field was amply demonstrated in the Second World War, and the successful prosecution of any future war will undoubtedly depend to a significant degree upon pre-eminence in science Accordingly, an organization has been established to ensure that the New Zealand Services are fully informed on defence science, that they have the means whereby there is proper scientific examination of their special problems, and that New Zealand is able not only to make some contribution towards Commonwealth defence science but also to take full advantage of results secured from research in other parts of the Commonwealth. Within New Zealand the Services have the fullest liaison with the Department of Scientific and Industrial Research and other scientific agencies. The organization referred to above includes:—
The Defence Science Advisory Committee. —The Defence Science Advisory Committee is an advisory body comprising eminent scientists from the Universities, representatives of appropriate Government Departments, and senior officers of the Services. The Committee has no executive responsibility, but is able to review any defence scientific matters deemed desirable in the national interest.
The Defence Science (Policy) Committee.—The Defence Science (Policy) Committee, comprising the Chiefs of Start' and the Secretary, Department of Scientific and Industrial Research, is responsible for the presentation of defence science proposals to the Government and for ensuring their implementation on receipt of Government approval.
These principal Committees are served by subordinate planning committees and a secretariat.
The Defence Scientific Corps.—In order to alleviate the Commonwealth shortage of scientific personnel available for defence purposes and in recognition of the greater-value to the Services of scientists with a Service background, the New Zealand Defence Scientific Corps has been formed. In this Corps it is hoped to build up within a period of five years a pool of some thirty scientists with Service training who will be available for defence research in New Zealand or elsewhere in the Commonwealth. An annual intake of approximately six graduate scientists into the Services is envisaged. After a short period of Service training, they are to be given scientific training for two or three years either in New Zealand or overseas. After this period they are to be available for defence research, at establishments within the Commonwealth appropriate to their training, for the remaining two to three years of the short-term (five-year) commission which is the initial period of engagement.
The Corps was established in 1948, the intake in the first year being four officers.
THE ARMY.—The New Zealand Army is raised, maintained, and organized under the provisions of the Defence Act, 1909, as amended by the Defence Amendment Acts of 1910, 1912, 1915, and 1931. It includes the following Corps:—
The Royal New Zealand Artillery.
The Royal New Zealand Armoured Corps.
The Royal New Zealand Engineers.
The Royal New Zealand Corps of Signals.
The Royal New Zealand Infantry Corps.
The Royal New Zealand Army Service Corps.
The Royal New Zealand Army Medical Corps.
The Royal New Zealand Army Ordnance Corps.
The Royal New Zealand Electrical and Mechanical Engineers.
The Royal New Zealand Army Dental Corps.
The Royal New Zealand Chaplains Department.
The New Zealand Army Pay Corps.
The New Zealand Army Legal Department.
The New Zealand Provost Corps.
The New Zealand Army Nursing Service.
The New Zealand Women's Auxiliary Army Corps.
[NOTE.—Except in the case of the Royal New Zealand Artillery, the prefix “Royal” was added to the designation of the Corps so indicated above by notification in the Gazette and dated 12th July, 1947.]
The New Zealand Army Nursing Service and the Now Zealand Women's Auxiliary Army Corps were constituted a part of the Defence Forces within the meaning of the Defence Act, 1909, by the Defence Emergency Regulations 1941, Amendment No. 4, issued in 1942.
The personnel of the Army are divided into Regular Force, Territorial Force, and Reserve.
The Regular Force provides commanders and staffs at the various static headquarters and military establishments; instructional staffs; and nucleus garrisons for the fixed defences.
The Territorial Force provides the personnel for the land Forces likely to be required in the event of a national emergency. It has not been reactivated since the conclusion of hostilities in the Second World War pending a decision on the basis of service to be adopted.
The Reserve at present consists of a Reserve of Officers to which officers who are no longer on the active fist, and who fulfil certain medical standards, are posted.
Liabilities and Terms of Service—Regular Force.—The engagement of personnel in the Regular Force is voluntary. The period of engagement is for five years, but at the end of this period a soldier may re-engage for further service.
Territorial Force.—Under the Defence Act, 1909, and amendments thereto, all male inhabitants who have resided in New Zealand for six months and are British subjects are liable, between the ages of seventeen years and forty years, to certain types of peacetime military training in the Territorial Force, Cadets, or Militia. At the present time, however, such liability is not being enforced. The liability is extended in time of war, to all such male inhabitants up to the age of fifty-five.
Application of the Army Act.—All ranks of the Regular Force and officers of the Territorial Force are subject at all times to military law as established by the United Kingdom Army Act, except where it is inconsistent with the New Zealand Defence Act, and as modified by certain Defence Emergency Regulations passed during the recent war and still in force. Other ranks of the Territorial Force in time of peace are so subject only when undergoing military training. In time of war, however, all members of the Army become subject to military law at all times, with the limitations mentioned above.
Command and Administration.—The Minister of Defence is in charge of the Army Department and is President of the Army Board, which is responsible for the command, training, and administration of the New Zealand Army.
The other members of the Army Board are:—
The Chief of the General Staff (First Military Member).
The Adjutant-General (Second Military Member).
The Quartermaster-General (Third Military Member).
The Army Secretary (Member).
Army Headquarters, which is the counterpart in New Zealand of the War Office in the United Kingdom, is organized as follows:—
The Branch of the General Staff.
The Branch of the Adjutant-General.
The Branch of the Quartermaster-General.
The Branch of the Army Secretary.
The Military Districts.—New Zealand is divided into three military districts (Northern, Central, and Southern), with headquarters at Auckland, Wellington, and Christchurch. Each district is commanded by a senior officer of the Regular Force, who is provided with a suitable staff.
The Areas.—Each military district is divided into four Areas. An officer of the Regular Force is in charge of each Area headquarters and is assisted by a small staff. He is responsible for administration and assists in the training of the Territorial Force and Cadet units within the Area.
Training.—The Regular Force.—Except in cases of special entry from the Universities and of personnel who have had active-service experience, the officers of the Regular Force are commissioned, in the rank of Lieutenant, on graduation from the Royal Military College, Duntroon, Australia. They receive specialist and refresher training in New Zealand, while in certain cases their advanced training is carried out at British Army Schools. Promotion to Captain and Major is gained after six and thirteen years commissioned service respectively, providing that the prescribed promotion examinations are passed. Candidates for Staff College must pass the same entrance examinations as officers of the British Regular Army.
Other ranks of the Regular Force are trained at the Army Schools in New Zealand. In certain cases advanced training is received in the United Kingdom.
The Territorial Force. —Before the Second World War the annual training prescribed for Territorial Force personnel consisted of—
Annual training camp—Coast Artillery and Mounted Rifles Regiments, ten days; other arras and services, six days.
Out-of-camp training—Coast Artillery and Mounted Rifles Regiments, four days; other arms and services, eight clays.
Attendance at a six days' course at the Army or a District School was authorized in addition to the annual training prescribed, and courses lasting one week were obligatory for Majors, Captains, and Subalterns who were preparing for promotion examinations.
Owing to the non-activation of the Territorial Force since the conclusion of hostilities in the Second World War, no training has been carried out since that date.
Army Training Establishments.—The Army School is a central training establishment which provides courses for all ranks of the Regular Force and which will in due course provide advanced instruction for officers of the Territorial Force. It is organized into Tactics, Administration, Small Arms, Signals, Engineer, and Trades Wings.
The School of Artillery provides courses for Instructors and Assistant Instructors in Gunnery (Field Branch and Anti-tank) of the Royal New Zealand Artillery. Certain other specialist Artillery training is also undertaken.
The Armoured School provides instruction in armoured fighting vehicles and the employment of armoured units.
District Schools. —Each military district has a small training school at which are held courses for Territorial Force officers and other ranks, and for Cadets.
[NOTE.—Neither a military college nor a staff college is in existence in New Zealand. Officer Cadets of the Regular Force are sent to the Royal Military College, Duntroon, Australia, and selected officers to the Staff College, Camberley, England.]
Cadets.—Certain secondary schools have their own Cadet units designated by the name of the school. Service in these units is voluntary. Annual training approximates thirty drills each of one and a half hours, including a weapon-training course and a “barracks” lasting up to five days. Courses for officers and N.C.O.s are held at the District Schools.
Rifle Clubs.—Rifle clubs exist for the purpose of encouraging individuals who are not members of the Navy, Army, or Air Force to learn to shoot. They are affiliated to, but do not form part of, the Army. All British subjects over the age of eighteen years are eligible to join. A free issue of 100 rounds is made to all members who fire and qualify in an annual range course, and a further 100 rounds to those who qualify as marksmen. Other ammunition is provided at quarter cost.
Army Expenditure.—The War Expenses Account was set up under the provisions of the War Expenses Act, 1939, and all receipts and payments in connection with the war effort were dealt with through that account. Defence expenditure was previously included as an annual appropriation of the Consolidated Fund, and upon the War Expenses Account being brought into existence the unexpended balances of the 1939–40 defence appropriations were paid into the new account. Commencing with the 1946–47 financial year, the defence vote was restored to the Consolidated Fund and current defence expenditure has since been met therefrom. Expenditure arising from or consequent upon the late war, however, is still paid from the War Expenses Account.
The following table shows Army expenditure under the headings of the War Expenses Account and the Consolidated Fund for the financial years 1946–47 and 1947–48.
| Year Ended 31st March, | £ | |
|---|---|---|
| 1947 | War Expenses Account—Army | 10,546,173 |
| Consolidated Fund—Vote “Army” | 2,840,749 | |
| 1948 | War Expenses Account—Army | 5,584,197 |
| Consolidated Fund—Vote “Army” | 3,470,245 |
The total expenditure on the Army from the War Expenses Account from September, 1939, to 31st March, 1948, was £310,464,308.
Strength of the Army.—At 31st March, 1947, the total strength of the Army was 7,164. By the end of March, 1948, this figure had been reduced to 4,746, composed of 602 officers and 4,144 other ranks. The 1948 total was inclusive of 2,287 personnel overseas, of whom 2,249 were with the occupation Forces in Japan. The great majority of this latter Force has since been repatriated. Included in the 1948 figure of 4,746 were 267 females.
Expeditionary Forces—South African War. —New Zealand supplied ten contingents for service during the South African War, comprising a total of 6,500 officers and men.
War of 1914–18. —Immediately the Great European War of 1914–18 broke out an Expeditionary Force was despatched to Western Samoa and occupied those islands, while a larger force in the form of a mixed brigade was despatched to Europe. The latter force was, however, landed in Egypt, and took part in the defence of the Suez Canal, It gave a good account of itself in the desperate campaign on Gallipoli, and after being withdrawn to Egypt was expanded into a Division and a Mounted Brigade. The Division then went to the western front, while the Mounted Brigade continued to operate in Palestine. Both forces became famous for their military qualities, and took part in practically all the great actions of their respective theatres up to the Armistice.
A total of 98,950 troops left New Zealand for service with the New Zealand Expeditionary Forces, and, of these, 16,697 lost their lives on active service. In addition to the 98,950 of all ranks of the New Zealand Expeditionary Forces, 944 British Army Reservists, British Naval Reservists, and others left New Zealand to rejoin their units in the United Kingdom or in a theatre of war. It is also known that 3,370 (not included above) left New Zealand during the period of the war and joined units of the British Forces or the Expeditionary Forces of other Commonwealth Countries.
On the Armistice being declared in November, 1918, New Zealand had 52,000 troops in the field, while 10,000 more were ready to embark or were under training.
The tremendous amount of transport work involved in the conveyance of these forces to Egypt, France, Britain, Gallipoli, and Samoa was carried out with extraordinary success, not one New Zealand transport having been lost while conveying troops.
The troops provided for foreign service represented nearly 10 per cent. of the total population of New Zealand in 1914, and over 40 per cent. of the male population between the ages of twenty and forty-five years. These percentages do not take into account New Zealanders who served in the British or Australian Naval or Military Forces.
War of 1939–45.—Middle East Theatre: At 11 a.m., British summer-time, on 3rd September, 1939, Great Britain declared war on Germany. Within a few hours the New Zealand Government had pledged its support. The mobilization for service within or beyond New Zealand of a volunteer “Special Force” of 6,600 officers and men between the ages of twenty-one and thirty-five years was authorized by Cabinet on 6th September, and on the 12th enlistments opened. This Special Force was the nucleus of the 2nd New Zealand Expeditionary Force, to the command of which Major-General B. C. Freyberg, V.C., was appointed in November, 1939.
On 23rd November the Prime Minister of New Zealand announced that the Force would he sent overseas, and on 11th December the advance party sailed from Wellington for Egypt. It was followed on 5th January, 1940, by the First Echelon.
On the departure of the First Echelon from New Zealand the Second Echelon was mobilized, its units including a Maori Battalion and railway and forestry companies. On 2nd May it left to join the First Echelon in Egypt, but owing to the threat of war with Italy was diverted in the Indian Ocean on 15th May to the United Kingdom, arriving at Greenock on 16th June. Allotted an important role in the defence of the south of England, the contingent remained in the United Kingdom until the end of the year.
Meanwhile, on 10th June, Italy declared war on Great Britain and France. Units of the First Echelon moved from Maadi Camp, the New Zealand base camp in Egypt, to the Western Desert, where for the last five months of the year most of them were employed in digging and manning a defensive position at Baggush. Their place at Maadi was taken by the Third Echelon, which arrived in Egypt oil 29th September.
New Zealand engineer, signals, and transport detachments served in the first Libyan offensive in December, 1940, but in March, 1941, the whole of the 2nd Division—the Second Echelon arrived from the United Kingdom early in March—moved to Greece. Germany declared war on Greece on 6th April. At that time the Division was manning the Aliakmon Line, in the north of Greece, but the collapse of first the Yugoslav and then the Greek Armies left its flanks in danger.
Covered by rearguards of armoured cavalry and artillery, the Division withdrew to the heights by Mount Olympus—the Olympus Line. A three-day battle ended in further retreat, this time to Thermopylæ, under heavy attack from the air. Rearguard actions by the 4th Brigade and Australian guns north of Athens and near Porto Rafti ended the campaign. All guns, transport, and heavy equipment had to be abandoned, and 1,870 New Zealanders were left behind as prisoners of war.
From Greece the 6th Brigade was evacuated to Egypt and the 4th and 5th Brigades to Crete. To strengthen the garrison, another brigade (the 10th) was formed from units made up of sappers, troopers, gunners, and drivers, who fought as infantry; it also included two Greek regiments. The German air-borne invasion began on 20th May, when the Luftwaffe arrived, unopposed, in great strength. Hundreds of glider and parachute troops were killed, but a large German force which landed west of Maleme Airfield cut off the defending companies, and the foremost battalion was forced to withdraw; by next evening the Germans were landing plane loads of troops at the airfield and pressing them into battle. Under ceaseless attacks from the air, the defenders fell back. Galatos was lost, and for a short time regained, on 25th May: at Suda Bay, another bayonet charge with Australians on the 27th also drove back the enemy for a time. But the battle was lost. There followed the difficult retreat over the mountains and the evacuation of most of the Force from Sphakia. Fewer than 700 New Zealanders were killed in the battle, but more than 4,000 German graves were later found in their sector.
In November, 1941, the Division took part in the campaign in Cyrenaica. While the 5th Brigade occupied positions to contain enemy forces at Bardia and Sollum, the 6th Brigade moved westward to intervene in the battle south-east of Tobruk. After some hard fighting the brigade occupied positions round Sidi Rezegh. In the meantime, the 4th Brigade had moved up into line with the 6th Brigade and linked up at Ed Duda with British forces pushing southwards from Tobruk. Enemy tank and infantry counter-attacks then overran units of the 4th and 6th Brigades, which had been considerably weakened by days and nights of constant fighting, and the New Zealanders were forced to withdraw. The enemy also suffered considerable losses and soon had to withdraw to positions round Gazala.
The 5th Brigade formed part of the forces used to drive the enemy from these positions. By the end of the year he had withdrawn to El Agheila, beyond Benghazi, some 200 miles west of Gazala, but within three weeks was back again at Gazala.
At the beginning of 1942 the Division went to the Suez Canal for combined operations training. From here the 5th Brigade returned for a short time to El Adem, south of Tobruk, while the other two brigades moved north into Syria, where for some months units trained and built defences in the mountains against a possible German attack through Turkey or the Caucasus. The attack came from the other flank—from Cyrenaica. At the end of May the enemy broke through the British line at Gazala and on 20th June overran Tobruk. Leaving Syria at short notice, the Division raced through Palestine and Egypt to reach Mersa Matruh between 19th and 22nd June, a few days ahead of the enemy. The New Zealanders' role was to gain time for the Eighth Army to organize the next line of defence around Alamein, where the 6th Brigade had been left in reserve.
On 27th June, in hastily prepared positions at Minqar Qaim, an escarpment to the south of Mersa Matruh, the New Zealanders withstood tank and infantry assaults, but by nightfall they were surrounded. A bayonet attack by the 4th Brigade cleared a path to the east, while the rest of the Division, with troops crammed on all available vehicles, crashed through enemy laagers to the south. With relatively few casualties the Division reassembled in the Alamein Line next day.
From positions in the inland sector of the line, the Division then took part in fierce battles to prevent the enemy from outflanking the main defences near the coast. Ruweisat Ridge and the El Mreir depression, important tactical features, were attacked and occupied by the infantry, but were lost again to enemy counter-attacks. Losses in these battles were heavy. In July the 4th Brigade was withdrawn to Maadi to be converted into an armoured brigade, and it did not again see action until the campaign in Italy.
At the end of August, Rommel made his last bid to reach Alexandria. The Division, after enemy columns had passed through the gap cleared in the minefields, attacked the supporting columns of infantry and supply vehicles. The German armour, almost surrounded, and harrassed continually by artillery and the Royal Air Force, was forced back with heavy casualties by British tanks.
After some weeks of static warfare, the heavy artillery barrage of the night of 23rd October, 1942, at Alamein, opened the final phase of the battle for Egypt. The two New Zealand brigades occupied their objectives on Miteiriya Ridge in the central sector, but losses were heavy and the break-through of the British tanks was delayed. The New Zealanders were withdrawn to attack again in another sector. On 3rd November, British tanks under New Zealand command penetrated the enemy's defences, and the Division, in a mobile role in support of the armour, followed through the gap and commenced the pursuit.
Halfaya Pass was captured by a force of only 110 New Zealanders before dawn on 11th November. The Division then stayed a month near Bardia to rest and reorganize. Then, by an outflanking move across the desert, it cut off enemy forces retreating from El Agheila, but was unable to prevent their escape on 16th December. The Division outflanked Nofilia next day, but again was unable to prevent the enemy withdrawing. The last phase of the 1,400-mile advance from Alamein to Tripoli began with an assault on the Buerat Line on 15th January. Part of an inland column, the Now Zealanders then crossed Wadi Zemzem, engaged an enemy rearguard at Azizia on 22nd January, and reached Tripoli the next day.
Elements of the Eighth Army advanced past Tripoli to the Mareth Line, but the New Zealand Division remained behind. When it became clear that Rommel intended to attack the Eighth Army, the Division was rushed up from Tripoli to hold a sector of the line at Medenine. On 6th March, Rommel attacked : he made no headway and lost fifty-two tanks. While the Eighth Army made a frontal attack on the Mareth Line, the Division, with additional British units attached to it to form the New Zealand Corps, executed a difficult outflanking movement to the west. Heavily reinforced with tanks, the Corps broke through the enemy positions at Tebaga Gap on 26th March. The collapse of the Mareth Line was followed by a set attack by British formations at Wadi Akarit, after which the Division, in the van of the Eighth Army, took part in the pursuit to Enfidaville. Here, after bitter fighting and many New Zealand casualties, Takrouna was captured. The campaign ended on 13th May, 1943, with the surrender of all the Axis forces in North Africa.
The Division then returned to Egypt for refit and training, while men with the longest service were returned to New Zealand on furlough. In September, 1943, the Division crossed to Italy.
The Italian campaign (November, 1943, to May, 1945) included some of the Division's hardest battles: Orsogna (December, 1943 to January, 1944), fought up and down steep ridges in mud and snow; Cassino (March to April, 1944), where the New Zealanders faced the best troops of the German Army at close quarters among the ruins of the town; Terelle (April to May, 1944), where the front line could be reached only after a six-hour scramble up almost vertical hillsides; Florence (July to August, 1944), against a determined enemy resisting strongly in wooded country abounding in natural defences.
Then, after a short rest in the Siena area, the Division, returned to the Adriatic coast. In a country criss-crossed with canals and rivers, and with the Italian winter at its worst, the advance was at first slow. Rimini was taken, and the New Zealanders then carried on to the Savio River, above Cesena, before they were withdrawn from the line for a period of rest and reorganization. It returned to the front for the attack on Faenza, which was captured a week before Christmas, 1944. Beyond the town the Germans strongly held the Senio River, and it remained in their hands until April, when the New Zealanders, in the final offensive of the war in Italy, crossed the river and in just over three weeks advanced more than 200 miles to Trieste. On 2nd May, 1945, the German forces in Italy surrendered.
As ships became available during the next few months, members of the 2nd Division were gradually returned to New Zealand, with the exception of one brigade group which was to form part of the British Commonwealth Occupation Force in Japan. This brigade, at first known as “Jayforce” and later as 2nd N.Z.E.F. (Japan), remained in Italy until its departure for Japan in February, 1946. Reliefs for this Force were sent periodically from New Zealand.
Pacific Theatre. —On 30th August, 1939, four days before the outbreak of war with Germany, New Zealand's first Expeditionary Force of the Second World War left for Fanning Island. The garrison's strength was 2 officers and 30 men and its duties were to protect the cable-station on the island. Later increased in strength, the garrison was relieved by troops from the United States of America in May, 1942.
The threat of Japanese aggression in the Pacific in the middle of 1940 prompted the New Zealand Government to urge the despatch of a brigade group from New Zealand to garrison Fiji. From the Third Echelon, then in training in New Zealand, 3,000 men were drawn to form the 8th Brigade Group, which assembled in Fiji in November, 1940. It was the first occasion in the annals of the British Empire that a Crown colony was garrisoned by troops from one of the self-governing dominions. When Japan entered the war on 7th December, 1941, the garrison was increased to two brigades and the Force assumed the status of a Division. Relieved by United States troops in July, 1942, the 3rd New Zealand Division returned to New Zealand.
While the Division was training and reorganizing in New Zealand, two battalions were taken from it for garrison duty on Norfolk Island and in Tonga. They rejoined it in New Caledonia early in 1943.
The 3rd Division, under the command of Major-General H. E. Barrowclough, D.S.O., M.C., left New Zealand in November, 1942, for Now Caledonia, where it continued its training in preparation for operations in the Solomons, and in August, 1943, it moved further forward to an advanced base on Guadalcanal. From this base, in co-operation with United States forces and in United States vessels, it carried out a series of successful amphibious operations against the Japanese-held islands of Vella Lavella (September to October, 1943), the Treasury Group (October to November, 1943), and Nissan (February, 1944). The landings on Vella Lavella and Nissan were made by the 14th Brigade Group and that on the Treasury Islands by the 8th Brigade Group.
Shortage of man-power in industry in New Zealand and the difficulty of reinforcing two Divisions in the field led to the disbandment of the 3rd Division on 20th October, 1944.
THE NEW ZEALAND CONTINGENT OF THE BRITISH COMMONWEALTH OCCUPATION FORCE IN JAPAN.—After the capitulation of Japan in August, 1945, New Zealand agreed to join with the United Kingdom, India, and Australia in the despatch of a British Commonwealth Force to take part in the occupation of Japan. The objects of the British Commonwealth Occupation Force (B.C.O.F.) were to represent worthily the British Commonwealth in the occupation of Japan; to maintain and enhance British Commonwealth prestige and influence in the eyes of the Japanese; and to illustrate to, and impress on, the Japanese people, as far as was possible, the democratic way and purpose of life. The military role of B.C.O.F., under the direction of the Supreme Commander for the Allied Powers and within its allotted area, was: the safeguarding of all Allied installations, and of all Japanese installations awaiting demilitarization; the demilitarization and disposal of Japanese installations and armaments; and military control (which did not include military government).
The Army Component of the New Zealand Contingent was constituted as the Japan Section of the Second New Zealand Expeditionary Force by Amendment No. 8 (Serial Number 1946/7) of the Expeditionary Force Emergency Regulations 1940. It was formed in Italy late in 1945, from the 9th Infantry Brigade and other units of the Second New Zealand Division, some 4,239 personnel being found from the single members of the 13th, 14th, and 15th Reinforcements, which were already in the Mediterranean theatre. After some delay pending inter-governmental agreement as to the conditions of the participation by British Commonwealth forces in the occupation of Japan, the New Zealand Force sailed from Naples in February and arrived in Kure, Japan, on 19th March, 1946. Its allotted area of occupation included the Hiroshima Prefecture.
In accordance with the policy of the New Zealand Government, the original members of the Force were repatriated to New Zealand in July, 1946, their places being taken by volunteers from New Zealand who had enlisted for twelve months' service in Japan. In 1947 a further relief of personnel, enlistments again being on a voluntary basis, took place, and for reasons which included the diminishing nature of the military tasks connected with the occupation, the strength of the Force was reduced to 2,400. This reduction necessitated the disbandment of the field artillery battery and one of the infantry battalions.
Early in 1948, by agreement with the other Commonwealth Governments concerned and with the concurrence of the Government of the United States of America, the New Zealand Government decided to withdraw the Force, without relief, between July and October of that year.
The Air Component of the New Zealand Contingent comprised No. 14 (Fighter) Squadron, R.N.Z.A.F. This Squadron, which initially comprised 33 officers and 239 other ranks, was formed at Ardmore on 1st December, 1945, and together with its Corsair aircraft was transported to Japan in the aircraft carrier H.M.S. “Glory” in March, 1946. In Japan it formed part of the British Commonwealth Air Group (B.C. AIR) and was stationed initially at Iwakuni and later at Bofu. Operational flying began early in May, 1946, and included surveillance patrols over the B.C.O.F. occupation area, searches for shipping bringing Koreans illicitly to Japan, and on occasion operational exercises with other units of B.C. AIR. The tour of duty for personnel was planned to be not more than one year, and reliefs were carried out progressively as the manning situation in Now Zealand did not permit the sending of large bodies of men at any one time.
Air Courier Service. —In addition to the provision of the Army and Air components of the New Zealand Contingent of B.C.O.F., an air courier service was maintained between New Zealand and Japan from March, 1946, to June, 1948. This service was undertaken by No. 41 Squadron, R.N.Z.A.F., and carried mail for the New Zealand Contingent, together with freight and personnel for the relief of No. 14 Squadron. A number of Army personnel were also carried. Two alternative routes were used, the first being New Zealand, Norfolk Island, Australia, Sourabaya, Singapore, Saigon, Hong Kong, Iwakuni; and the second, New Zealand, Norfolk Island, Australia, Morotai, Manila, Iwakuni. Each flight covered some 13,000 miles and involved about 90 hours flying-time. The weather en route ranged from tropical heat to winter snow, and there were dangerous stretches of ocean where typhoons and hurricanes were frequently met. During the operation of the service one aircraft made a forced landing, and on two occasions mail had to be jettisoned on account of engine trouble. There were no fatalities and no serious injuries to passengers or crew. Statistics of the service were: miles flown, 1,500,000; hours flown, 9,000; passengers carried, 1,500; mail carried, 250,000 lb.; and freight carried, 125,000 lb.
Financial Arrangements for B.C.O.F. —The Australian Government acted as agent for the other Commonwealth Governments concerned and was responsible for exercising financial control over the whole of B.C.O.F. The cost of transporting all troops, and their pay and allowances, were the direct responsibility of the individual Governments concerned, who also bore the cost of the initial personal and unit equipment of their contingents.
The value of all stores and supplies which were sent to Japan from New Zealand for the maintenance of the Force, and cost of transport thereof, were a charge against the B.C.O.F. Pool Account.
The Pool Account was controlled by the Australian Treasury and the total charges apportioned among the Governments concerned on a percentage basic calculated by comparing the total establishment of each national contingent. These original percentages were as follows: United Kingdom, 32; India, 24; Australia, 31; and Now Zealand 13. The percentages were reviewed from time to time when major changes took place in the constitution of the Force.
As far as practicable, stores, supplies, furniture; labour, and work and other services were obtained from the Japanese civil authorities without payment under the “procurement” procedure laid down by the Supreme Commander for the Allied Powers.
THE ROYAL NEW ZEALAND NAVY.—The Naval Forces of New Zealand are administered by a Naval Board consisting of the Minister of Defence as Chairman, a Captain, Royal Navy, with the rank of Commodore, as First Naval Member and Chief of the Naval Staff, a Captain, Royal Navy, as Second Naval Member, and a Commander (S), Royal Navy, with the acting rank of Captain (S), as Naval Secretary and Member.
The base of the Royal New Zealand Navy is at Devonport, Auckland, and the repair yard is known as H.M.N.Z. Dockyard, Devonport. The property in this base was vested in the Auckland Harbour Board, but certain important rights therein were exercised by the Naval Board under the terms of two contracts entered into between the Admiralty and the Auckland Harbour Board in 1899 and 1903. These contracts, which were consolidated in 1936, gave full rights of the use of the machinery and the Calliope Dock.
State of the Navy.—A review now follows giving the state of the Navy as at 31st March, 1948.
In Commission: —
| “Bellona” | Cruiser. |
| “Taupo,” “Pukaki,” “Kaniere,” “Hawea” | Frigates. |
| “Kiwi” | Trawler. |
| “Philomel” | Depot Ship, Auckland. Responsible for recruiting, drafting, and discharge of personnel, also for the training of the Gunnery, Torpedo, and Antisubmarine, Communications, and Mechanical Branches. |
| “Tamaki” | New-entry training establishment, Auckland. Responsible for basic training of all new entries. |
| Naval W/T Station, Waiouru. |
In Reserve: —
| “Black Prince” | Cruiser. |
| “Tui,” “Killegray,” | A/S, M/S trawlers. |
| “Inchkeith,” “Scarba,” | |
| “Sanda,” “Hinau,” | |
| “Rimu” | |
| “Tasman” | Naval Base, Lyttelton. |
Two frigates, to be named H.M.N.Z. Ships “Tutira” and “Rotoiti,” and one surveying vessel which have been purchased from the Admiralty, were to be commissioned during 1949.
Miscellaneous. —Four motor-launches have been allocated for training duties with the Royal New Zealand Naval Volunteer Reserve Divisions, and four others are being operated on fishery protection duties and for giving sea training to new entries in “Tamaki.”
An A/S M/S trawler, the “Manuka,” is under charter to the Chatham Islands Fisheries.
Personnel—Officers. —The policy of the New Zealand Naval Board is to man the Royal New Zealand Navy entirely with New Zealand officers and men. At present, to make up the deficiency, a number of officers, especially of the higher ranks, are serving on loan from the Royal Navy. These are being replaced gradually as Royal New Zealand Navy personnel become available through the following sources:—
By promotion direct from the lower deck to permanent commissions in the Executive, Engineering, Electrical, and Supply and Secretariat Branches.
By promotion of experienced ratings to Warrant Officer in all branches.
By direct entry as Naval Cadet in the Executive, Engineering, Electrical, and Supply and Secretariat Branches.
By direct entry of men with civilian professional qualifications for short-service commissions in the Medical, Dental, and Education Branches, and as Chaplain.
The ranks in the Royal New Zealand Navy are:—
| Captain | In the Executive, Engineering, Electrical, Supply and Secretariat Branches. |
| Commander | |
| Lieutenant-Commander | |
| Lieutenant | |
| Sub-Lieutenant | |
| Midshipman and Cadet | |
| Commissioned and Warrant Communications Officer. | |
| Commissioned and Warrant Engineer. | |
| Commissioned and Warrant Mechanician. | |
| Commissioned and Warrant Electrical Officer. | |
| Commissioned and Warrant Ordnance Officer. | |
| Commissioned and Warrant Shipwright. | |
| Commissioned and Warrant Writer Officer. | |
| Commissioned and Warrant Stores Officer. | |
| Commissioned and Warrant Catering Officer. | |
| Commissioned and Warrant Cookery Officer. | |
| Commissioned and Warrant Master-at-Arms. | |
| Surgeon Captain | In the Medical Branch. |
| Surgeon Commander | |
| Surgeon Lieutenant-Commander | |
| Surgeon Lieutenant | |
| Commissioned and Warrant Wardmaster | |
Dental Officers have the suffix “D”—i.e., Surgeon Lieutenant (D).
Officers who have made the Royal New Zealand Navy their career, serve up to certain specified retiring ages and qualify for superannuation. They are then placed on the Retired List and have a liability to serve again in the event of war or emergency.
The Admiralty make provision for the nomination of a limited number of New-Zealand-born Naval Cadets into the Royal Naval College, Dartmouth, and of special-entry cadets to the Naval College and to the training cruiser; candidates are required to pass medical and educational examinations. The age qualification now ruling is sixteen years for R.N. College, Dartmouth, and seventeen years four months to eighteen years four months for special-entry cadets.
Ratings.—Recruiting of New Zealand boys and men is open and continuous. At present there is a limited number of Royal Navy men on loan to the Royal New Zealand Navy, and, like the officers, these will be replaced by New-Zealand-entry personnel. The term of engagement is six years from the age of eighteen years on the active list, and the men on release to civilian life have a liability to serve in the Royal New Zealand Naval Reserve for a period of ten years or until the age of forty years is reached. The initial engagement may be followed by others, a total of twenty years' service qualifying for superannuation.
The branches in which men serve are: Seaman; Communication (visual signalling and radio); Stoker Mechanic; Sick Berth; Supply and Secretariat (writers, stores assistants, cooks, and stewards); Electrical (electrical artificers, radio electrical artificers, electricians, and radio electricians); Engine-room Artificer; Ordnance Artificer; Shipwright; Joiner; Blacksmith; Plumber; Painter; and apprenticeships in Ordnance, Electrical, Engine Room, and Shipwright Branches.
All ratings are eligible for advancement to Leading Petty Officer and Chief Petty Officer rates in their branches.
Women's Royal New Zealand Naval Service.—A place has been given in the peacetime Royal New Zealand Navy for a limited number of women who servo as members of the Women's Royal New Zealand Naval Service in shore establishments. The initial engagement is for two years, with the option of serving for further periods. They are trained to replace men in the Communications and Supply and Secretariat Branches. Entry is made in the rating of Probationary Wren, and all Wrens are eligible for advancement to the rating of Chief Wren.
Royal New Zealand Naval Volunteer Reserve.—Divisions of the Royal New Zealand Naval Volunteer Reserve are appropriated to Auckland, Wellington, Christchurch, and Dunedin. Men enrol for a period of four years, and may re-engage for periods of two years up to a total of twenty years' service.
Royal New Zealand Naval Emergency Reserve.—This consists of men who have served with the Royal New Zealand Navy in the Second World War and who have expressed their willingness to serve again in the Royal New Zealand Navy in the event of an emergency. Ex-members of the Women's Royal New Zealand Naval Service are eligible for enrolment. These reservists perform no service or training in peacetime.
The Royal New Zealand Naval Volunteer Supplementary Reserve comprises discharged Reserve officers of the Second World War who have expressed their willingness to serve in the Royal New Zealand Navy in the event of an emergency.
Strength of the Navy.—At the 31st March, 1947, the Navy strength was 160 officers and 1,472 ratings, a total of 1,632. Royal Navy personnel on loan included in these figures were 33 officers and 147 ratings. The total strength of the Navy at the 31st March, 1948, was 1,657, an increase of 25. This total comprised 152 officers and 1.505 ratings. Royal Navy loan personnel included were 36 officers and 133 ratings.
Navy Expenditure.—During the year ended 31st March, 1947, the sum of £5,295,830 was expended on the Royal New Zealand Navy, £3,985,961 being a charge on the War Expenses Account and £1,309,869 on the Consolidated Fund, vote “Navy.” As explained in connection with Army expenditure (p. 183), payments from the War Expenses Account represent expenditure in connection with or consequent upon the late war, while payments from the Consolidated Fund represent current defence expenditure. The total expended in the year ended 31st March, 1948, was £4,007,825, of which £2,271,198 was a charge on the War Expenses Account, while the remaining £1,736,627 constituted a charge on the Consolidated Fund. It may be of interest to record that the total naval expenditure from the War Expenses Account from September, 1939, to 31st March, 1948, was £43,343,778.
Review of War Activities.—In September-October, 1939, H.M.N.Z.S. “Achilles” spent six weeks patrolling the west coast of South America. She then proceeded into the Atlantic and joined the South American Division, commanded by Commodore (now Admiral Sir Henry) Harwood, operating in the protection of shipping in the focal areas of the River Plate and Rio de Janiero.
On 13th December, 1939, the “Ajax,” “Achilles,” and “Exeter” intercepted the German “pocket battleship” “Admiral Graf Spee,” and there took place the memorable action known as the Battle of the River Plate. The “Exeter” was disabled early in the engagement, but the “Ajax” and “Achilles,” in an all-day pursuit, shepherded the powerful enemy ship into Montevideo. Four clays later the “ Admiral Graf Spee” was scuttled and set on fire by her own company.
H.M.N.Z.S. “Leander” was employed on patrol duties in New Zealand waters during the first four months of the war. In January, 1940, she took part in the escorting to Australia of the transports carrying the First Echelon of the New Zealand Expeditionary Force. After the return of the “Achilles” from the River Plate, the “Leander” proceeded overseas in May, 1940, and was employed for some months on convoy escort duties in the Red Sea.
While operating in the Indian Ocean the “Leander” intercepted the Italian armed raider “Ramb I,” which opened fire when ordered to stop, but was quickly silenced by five salvoes and sank fifty minutes later. A few days later the “Leander” was in company with H.M.A.S. “Canberra” in the Mauritius area when two enemy supply ships were intercepted. One, a German vessel, was sunk by gunfire, and the other, a captured Norwegian tanker, was scuttled.
In June, 1941, H.M.N.Z.S. “Leander” proceeded into the Mediterranean and took part in operations along the coast of Syria. The ship arrived back in New Zealand waters in September, 1941, after an arduous and successful cruise of sixteen months.
Two New Zealand officers and 148 Now Zealand ratings were serving in H.M.S. “Neptune” in the Mediterranean in 1941. This ship took part in three bombardments of Bardia preliminary to the successful attack by New Zealand troops on 22nd November, 1941, which resulted in the capture of the port. H.M.S. “Neptune” was lost with all her ship's company except one rating when she struck four mines in quick succession during the night of 18th-19th December, 1941.
When hostilities against Japan commenced on 8th December, 1941, H.M.N.Z. Ships “Achilles,” “Leander,” and “Monowai” took up patrol and escort duties in the South Pacific area. H.M.N.Z.S. “Monowai,” which had been commissioned as an armed merchant cruiser on 30th August, 1940, was in action against a Japanese submarine in the approach to Suva, Fiji, on 10th January, 1942. After a brief exchange of gunfire, in which no hits were made by either side, the submarine broke off the action and dived. The “Monowai” was engaged mainly in escorting transports carrying New Zealand troops to Fiji.
“Achilles” and “Leander,” operating under the United States Commander, South Pacific Area, were employed as escorts for convoys transporting personnel and supplies from the United States of America to the South Pacific Islands, and with United States Task Forces in the Solomon Islands Area. On 5th January, 1943, a Task Force covering the passage of reinforcements to Guadalcanal was heavily attacked by Japanese aircraft. One bomb hit the “Achilles” on a gun turret, her casualties being 13 killed and 8 seriously wounded.
Operating as a unit in a United States Task Force, H.M.N.Z.S. “Leander” took part in the night action, known as the Battle of Kolombangara, on 12th–13th July, 1943, against two groups of Japanese destroyers and at least one cruiser which were attempting to reinforce the enemy troops on New Georgia. Two American cruisers and the “Leander” were damaged by torpedoes, and a destroyer was also torpedoed and had to be sunk later. “Leander's” casualties were 28 killed and missing and 15 injured. The Japanese cruiser “Jintsu” was sunk.
After temporary repairs had been effected at Auckland the “Leander” proceeded to the United States for permanent repairs and rearming. The ship paid off in Boston at the end of December, 1943, having completed seven and a half years' service in the Royal New Zealand Navy.
H.M.N.Z.S. “Monowai” completed her service in the South Pacific in March, 1943, and subsequently proceeded to the United Kingdom, being paid off at Liverpool on 18th June.
H.M.N.Z.S. “Achilles,” which had proceeded to England early in 1943, was taken in hand at Portsmouth for refitting and rearming. She paid off on 21st September, 1943, her officers and ship's company turning over to the cruiser “Gambia,” which was commissioned at Birkenhead the following day as a unit of the Royal New Zealand Navy.
During December, 1943, H.M.N.Z.S. “Gambia” took part in operations in the North Atlantic against enemy blockade-runners. The ship arrived at Trincomalee on 19th February, 1944, and joined the 4th Cruiser Squadron, British Eastern Fleet. The “Gambia” gave close anti-aircraft support to the Carrier Force which carried out air strikes against the Japanese at Sabang, Sumatra, on 16th April, 1944, and Sourabaya, Java, on 17th May. She also took part in the Eastern Fleet's bombardment of Sabang on 25th July, 1944.
After an extensive refit at Auckland, the “Gambia” rejoined the 4th Cruiser Squadron of the British Pacific Fleet at Sydney in February, 1945. H.M.N.Z.S. “Gambia,” working mainly with the aircraft-carriers, was present in all the major operations of the British Pacific Fleet against the Japanese from the end of March to the conclusion of hostilities on 15th August, 1945. The “Gambia” supplied detachments for the landing in Tokyo Bay, and was present at the signing of the Japanese surrender.
After recommissioning at Portsmouth on 23rd May, 1944, H.M.N.Z.S. “Achilles” proceeded to Trincomalee, and from 13th September to 8th December, 1944, was in Indian waters in the 4th Cruiser Squadron, British Eastern Fleet. Subsequently she assisted to escort the “Rimutaka.” carrying their Royal Highnesses the Duke and Duchess of Gloucester, from Fremantle to Sydney. After refitting at Auckland during February-April, 1945, “Achilles” proceeded to Australia to join the British Pacific Fleet. She took part in several operations against the Japanese, including the bombardment of the seaplane base on Dublon Island in the Truk Atoll on 14th June, 1945.
Throughout the war the minesweepers and anti-submarine and patrol vessels of the Royal New Zealand Navy performed much arduous and valuable service in New Zealand waters, as well as in the Pacific area. The minesweeping and anti-submarine forces were greatly expanded by the acquisition of seven vessels from the United Kingdom, the conversion of a number of trawlers and coastal traders, and the building of three composite and eight steel vessels in New Zealand. Twelve Fairmile motor-launches were constructed in New Zealand, and sixteen harbour-defence motor launches were imported, all these craft being commissioned in 1943–44. Later additions to the anti-submarine forces were the corvettes “Arabia” and “Arbutus” (the gift of the Admiralty) which arrived in New Zealand in the latter part of 1944.
The 25th Minesweeping Flotilla was organized in April-May, 1941. Its first major operation was the clearance of most of the minefield laid by a German raider in the approaches to Hauraki Gulf. On 14th May, 1941, H.M.N.Z.S. “Puriri” struck a mine off Bream Head, the explosion sinking her immediately. One officer and four ratings were killed. The Flotilla commenced sweeping on 13th June, 1941, and by 16th September, 131 mines had been accounted for, exclusive of the so which had broken adrift and had been disposed of by other vessels or on shore.
At the beginning of December, 1942, H.M.N.Z. Ships, “Matai,” “Kiwi,” “Moa,” and “Tui,” of the 25th Minesweeping Flotilla, were constituted an anti-submarine force for service under the United States Commander, South Pacific Area. During the night of 29th–30th January, 1943, the “Kiwi” and “Moa” fought, a gallant and successful action against a large and heavily-armed Japanese submarine off the northern end of Guadalcanal, Solomon Islands. Forced to surface by a depth-charge attack, the submarine was engaged by gunfire. The action lasted more than an hour, during which the “Kiwi” thrice rammed the submarine, which finally struck a reef and was wrecked. On the following night the “Moa” and “Tui” engaged four enemy barges, two of which were sunk. The “Moa” was sunk at Tulagi during a heavy air attack on 7th April, 1943. Five ratings were killed and 15 injured. The Commanding Officer was also injured.
In August, 1943, in the Noumea area, H.M.N.Z.S. “Tui” took part with aircraft in the sinking of another large Japanese submarine from which six survivors were picked up.
H.M.N.Z.S. “Arbutus” was attached to the British Pacific Fleet in July-August, 1945, for wireless telegraphy and radar servicing duties. She also acted as escort to ships of the Supply Train.
Early in 1944 the twelve Fairmile motor-launches were placed under the operational control of Commander South Pacific Area for anti-submarine patrol and escort duties in the Solomon Islands. In less than eighteen months the Fairmiles logged 380,000 miles.
THE AIR FORCE.—The Royal New Zealand Air Force can trace its beginnings to the early days of aviation, when, in 1911, preliminary arrangements were made to train officers and N.C.O.'s (Defence Forces Annual Report, 1912). In the following year a New Zealand officer was sent to England for aviation instruction, and at the same time an aircraft was presented to New Zealand “as the first unit of an Imperial Air Fleet” by a group of citizens in the United Kingdom. The aircraft was brought to this country in 1913, where it was flown and exhibited—New Zealand's first military aircraft. On the outbreak of war in 1914, the aircraft was sent to the Royal Flying Corps in the United Kingdom, and it was decided not to proceed with the establishment of an Aviation Corps in New Zealand for the time being.
Two private flying schools were formed (during the period of the war of 1914–18), one at Kohimarama, Auckland, and one at Sockburn, Christchurch, and a number of New Zealanders received flying instruction at these schools. By special arrangement with the Government, trainees were given the opportunity of qualifying for entry into the Royal Flying Corps.
Approximately seven hundred New Zealanders served with the R.F.C., R.N.A.S., and later, the R.A.F., in the war of 1914–18.
Between 1918 and 1920 the question of forming an Aviation Corps in New Zealand engaged the attention of the Government and the military authorities, and an Air Board was set up to advise on aviation matters. Steps were also taken to register all qualified pilots and to establish a Reserve. An expert on aviation matters was invited to New Zealand in 1919 to advise the Government on policy with regard to flying, and shortly after his arrival the British Government offered New Zealand a substantial number of aircraft as a gift to assist in the establishment of an Air Force.
Under this gift thirty-three aircraft arrived in 1921, and the advisers on air policy were constituted as a permanent Board. In 1922 the strength of the New Zealand Permanent Forces included two officers and two other ranks as an aviation unit, the first of its kind in New Zealand.
The New Zealand Permanent Air Force actually came into being in 1923, when the formation of a force to be part of the Permanent Military Forces and a territorial unit to be part of the Territorial Forces was approved. The administration of these Air Forces was within the organization of the Regular Military Forces (Army).
Wigram and Hobsonville were the first Air Stations, being established in 1923 and 1925 respectively.
Service flying in New Zealand developed slowly, but from about 1928 the Aero Club movement gained momentum, and arrangements were made' by the Government for these clubs to provide a reserve of pilots.
The Pre-War Period, 1937–39.—The period from 1937, when the R.N.Z.A.F. was constituted by the Air Force Act, to the 4th September, 1939, was devoted to developing an organization which should be capable of playing its part in the conflict which was seen to be coming.
The chief function of New Zealand's Air Force in the event of war was envisaged as that of training personnel for the R.A.F., together with sufficient to provide for local defence requirements. The scale of attack which it was thought the local defence Forces might be called upon to meet was not very great.
In addition to the Regular Air Force, Air Force Reserve, and Territorial Air Force, which comprised the R.N.Z.A.F., a Civil Reserve was also formed, of which one section comprised pilots, while the other, numbering some thousands by September, 1939, consisted of a register of skilled tradesmen throughout the country who offered to give their services in case of emergency.
A Flying Training Programme was put into operation to supply pilots to the R.A.F. on short-term commissions, and also to build up a reserve of pilots in New Zealand. At the same time a War Training Organization was prepared, to be put into operation if war was declared, which was to produce annually 650 pilots, 300 observers, and 350 air gunners. A scheme was prepared under which technical training was to be undertaken in the railway workshops in the four main centres. A programme of building was also commenced, of which the main feature was the formation of stations at Whenuapai and Ohakea. Territorial squadrons were established at Auckland, Wellington, and Christchurch, and buildings for the Territorial Flight at Dunedin had been commenced by 1939.
Immediately war was declared the Air Force was mobilized. Territorial and Air Force Reserves were called up and, in addition, a number of personnel of the Civil Reserve, who by virtue of their civil trade were suitable for immediate employment, were called up and posted to Service units.
Training during the War.—In September, 1939, the United Kingdom Government put forward proposals for an Empire Air Training Scheme in which Canada, Australia, and New Zealand were asked to co-operate in the training of pilots and aircrew for the R.A.F. Under the scheme finally adopted, New Zealand agreed to set up an organization which, when fully developed, would be capable of training the following personnel each year: fully trained pilots, 880; pilots trained to elementary standard (advanced training to be carried out in Canada), 520; observers (initial training only; further training to be carried out in Canada), 546; and air gunners (initial training only; further training to be carried out in Canada), 936.
This scheme, with modifications, remained in force until the middle of 1944, when the British Government advised that no further aircrew need be sent overseas under it. Reorganization of the training programme then became necessary, and from the latter part of 1944 until the end of the war New-Zealand-trained personnel were required for the Pacific theatre only.
Pilots fully trained in New Zealand during the war totalled 4,264, of whom 2,743 were sent overseas to the R.A.F. There were 7,704 pilots trained to elementary standard during the same period, 2,910 of these proceeding to Canada to complete training, the remaining 4,794 being retained in New Zealand to complete training.
During 1940, some 183 observers and 395 air gunners were trained in New Zealand for service with the R.A.F. When the Empire Air Training Scheme came into operation, this training was discontinued and aircrew in these categories were sent to Canada for training after a course of initial training in New Zealand. Aircrew personnel (other than pilots) sent to Canada under this scheme from 1940 to 1944 consisted of 2,752 wireless operator/air gunners, 1,864 navigators, and 514 bomb-aimers. In addition, over the three-year period 1943–45, 102 wireless operator/air gunners, 376 air gunners, and 195 navigators were trained in New Zealand for service with R.N.Z.A.F. squadrons in New Zealand and in the Pacific.
In order to fulfil New Zealand's part in the Empire Air Training Scheme, and later her requirements in the Pacific, a large number of skilled tradesmen was necessary. In addition, New Zealand was under commitment to supply technical personnel to the R.A.F. when her own requirements had been satisfied. This last obligation could not, owing to man-power difficulties, be fully met; but during the first half of the war period a number of wireless operators, wireless mechanics, and fitter-armourers were trained and sent overseas.
Technical Training.—The following analysis shows the number of technical personnel trained in New Zealand.
| Trade | Numbers trained. |
|---|---|
| Safety-equipment assistant | 163 |
| Fabric-worker | 95 |
| Safety-equipment worker | 114 |
| Firecrew | 486 |
| Photographer | 62 |
| Meteorologist | 306 |
| Clerk, signals | 65 |
| Telephone-operator | 60 |
| Radio-telephony operator | 68 |
| Telephone mechanic | 78 |
| Teleprinter operator | 141 |
| Electrician | 534 |
| Radar operator | 308 |
| Radar mechanic (air, ground) | 676 |
| Wireless-operator | 1,034 |
| Direction-finder operator | 30 |
| Telegraphist | 28 |
| Wireless operator/air gunner | 112 |
| Wireless electrical mechanic | 65 |
| Wireless mechanic | 726 |
| Wireless mechanic (standard beam approach) | 88 |
| Driver, petrol, mechanic | 408 |
| Driver, petrol (incl. W.A.A.F.). | 72 |
| Fitter, internal-combustion engines | 31 |
| Mechanic, internal-combustion engines | 193 |
| Flight rigger | 2,470 |
| Fitter II, airframes | 1,487 |
| Flight mechanic | 2,748 |
| Fitter II, engines | 1,548 |
| Fitters, general | 10 |
| Instrument mechanic | 141 |
| Link-trainer Mechanic | 18 |
| Instrument-repairer | 502 |
| Coppersmith and metal worker | 114 |
| Machine-tool setter and operator | 145 |
| Armourer | 1,166 |
| Fitter armourer | 433 |
| Blacksmith and Welder | 10 |
| Cooks, butchers, bakers | 474 |
| Motor-boat crew | 237 |
| Coxswain I and II | 73 |
| Clerk, general duties | 1,069 |
| Clerk, pay accounting | 427 |
| Clerk, stores accounting | 333 |
| Equipment assistant | 1,409 |
| Equipment assistant (petrol) | 296 |
| Barrack warden | 31 |
| Airfield controller | 67 |
| Clerk, librarian | 15 |
| Clerks, special duties (fighter operations, operations room, bomber operations) | 68 |
| Other | 7 |
| Total trained | 21,241 |
Operations During the War.—European Theatre.—On the outbreak of war, New Zealand was well represented overseas with a total of some 500 men serving with the Royal Air Force. Of this number, 334 were killed, principally during the first two critical war years. The numbers serving overseas were to be augmented, gradually at first and then in increasing strength, until at the close of hostilities some 8,000 to 9,000 New Zealand personnel had flown operationally with the R.A.F. A total of 3,286 (including the 334 mentioned above) were killed, 164 seriously injured, and 512 were taken prisoners of war.
Seven squadrons with a New Zealand identity were formed in the R.A.F. during the 1939–45 war. They were never completely manned by New Zealanders, particularly in the ground staff; but by the end of the war the aircrews were preponderantly composed of New Zealand personnel. The greater number, however, were scattered throughout practically every squadron in the R.A.F.
The first New Zealand squadron to become operational was No. 75 (Bomber) Squadron, which was equipped initially with Wellington aircraft. From April, 1940, onwards it attacked a variety of targets in Germany, Italy, and occupied territories. It took part in very many large-scale raids on German cities, including the “thousand bomber” raids, participated in the “softening-up” bombing operations in preparation for the invasion of Europe, attacked flying-bomb sites, and gave support to the Allied Armies. It also dropped mines along thousands of miles of enemy coastline.
Three New Zealand fighter squadrons were formed: Nos. 485, 486, and 488. The first of these, a day fighter squadron, began operations in mid-1941, and the other two, both of which operated as night fighters, in 1942. They were employed in the destruction of enemy intruders over England, the escort of bombers, and as shipping cover. They also carried out intruder operations over occupied France, where they shot down many enemy planes. In the later stages of the war they destroyed many flying bombs and also gave direct support to the Allied Armies on the Continent.
A light bomber squadron, No. 487, was formed in August, 1942. Equipped first with Ventura aircraft and later with Mosquitoes, it took part in many low-level attacks on targets in enemy-occupied territory, including the raids on the prison at Amiens and the Gestapo Headquarters in Holland and at Copenhagen. Two New Zealand squadrons operated in the Coastal Command. No. 489, a torpedo-bomber squadron, was formed in August, 1941, and destroyed much enemy shipping in European waters. No. 490 Squadron, equipped with Sunderland flying-boats, was formed in March, 1943. It was based in West Africa, where it was employed on anti-submarine patrols, shipping escort, and air-sea rescue work.
New Zealanders scattered among Royal Air Force squadrons played a similar part to that of their compatriots in Royal New Zealand Air Force squadrons. They participated in every action of note—the Norwegian campaign, the Battle of France, the Battle of Britain, and the defence of Malta. They operated over Greece, Crete, and the Western Desert; they sank submarines in the Atlantic, the North Sea, and the Mediterranean; they were based in Russia and in Iceland. The Royal New Zealand Air Force was represented in varied types of air operations from the United Kingdom—in meteorological and photographic reconnaissance flights, in air-sea rescue operations in helicopters, in aircraft engaged in the supply of the Maquis, and in the dropping and return of agents from occupied territories. New Zealanders flew transport aircraft across the Atlantic and towed gliders in the invasion of Sicily, on D Day, in the Battle of Arnhem, and during the crossing of the Rhine.
Malaya.—Towards the end of 1941, as the threat of war with Japan increased, New Zealand sent personnel to man a fighter squadron and an aerodrome-construction unit to Malaya. Both units took part in the defence of Singapore, and returned to New Zealand after the fall of the island.
Pacific Theatre.—Until the outbreak of war with Japan the R.N.Z.A.F. was primarily concerned with training, and consequently there were few modern operational aircraft in the country. Owing to the urgent demands of other theatres of war it was not immediately possible to procure supplies of aircraft for the defence of New Zealand, and plans had to be made to meet the threat with what resources were available, mainly training aircraft and some few bomber reconnaissance machines. Supplies of American P40 fighters started to arrive in April, 1942. Towards the end of that year the R.N.Z. A.F. was placed under United States authority for purposes of command and supply, and thereafter more American operational aircraft became available.
Meanwhile the Coral Sea and Midway battles, and the United States landings in the Solomons, had removed the immediate threat to New Zealand, and the R.N.Z.A.F. was able to turn from a defensive to an increasingly offensive role. The first R.N.Z.A.F. squadron to move into the operational area in the Pacific was No. 3 B.R. Squadron, which began operations from Espiritu Santo in October, 1942, and a month later sent a detachment to operate from Guadalcanal. The first R.N.Z.A.F. fighter squadrons to operate in the New Hebrides-Solomons area were Nos. 14 and 15 Squadrons, in April, 1943, the former being composed largely of New Zealanders of No. 488 Squadron R.A.F., who had seen action in Malaya and the Netherlands East Indies and had subsequently been evacuated to New Zealand.
In all, the following squadrons were formed and saw service in the Pacific:—
Six Bomber Reconnaissance Squadrons.
Two Flying-boat Squadrons.
Thirteen Fighter Squadrons.
One Dive Bomber Squadron.
Two Torpedo Bomber Squadrons (used as dive bombers).
Two Transport Squadrons (based at Whenuapai and carrying freight and personnel to the forward areas).
The tasks of the B.R. squadrons included bombing, strafing, supply dropping, convoy escort work, anti-submarine patrols, survivor searches, and sweeps for enemy mines. They played an important part in the neutralizing of the Japanese base at Rabaul. The flying-boats, in addition to submarine searches and reconnaissance patrols, were best known for their “Dumbo” or air-sea rescue work. Altogether a total of 80 personnel were picked up by them in the open sea, and a number of others were rescued by launches guided by the Catalinas.
The first actions fought by the R.N.Z.A.F. fighters took place when Guadalcanal was being hard pressed, and Nos. 14 and 15 Squadrons took part in many interception attacks. During the assault on Vella Lavella they helped to provide air cover for troops of the 3rd Division, Second New Zealand Expeditionary Force. As the Allied offensive progressed, New Zealand fighters provided close cover to United States bombers. When the extinction of Japanese air power in the Solomons-Bismark area deprived them of targets in the air, the fighters turned their attentions to the ground. Adapted as fighter-bombers, they did excellent work in support of the Australian ground Forces on Bougainville, and also carried out many offensive sweeps over targets in New Ireland and the Rabaul area.
The torpedo and dive bomber squadrons took part in operations on Bougainville and against the Rabaul area in 1944, but as the aircraft were not entirely suited to the type of work required the squadrons were disbanded after one tour of duty.
Altogether 99 enemy aircraft were shot clown by R.N.Z.A.F. Fighter squadrons in the Pacific and four by B.R. squadrons. Enemy warships destroyed comprise 1 submarine sunk and 1 possibly sunk. In addition, numerous enemy barges and small craft were destroyed.
The total weight of bombs dropped by R.N.Z.A.F. aircraft in the Pacific area amounted to some 10,700 tons.
The Post-war Air Force.—As stated earlier, the Royal New Zealand Air Force was constituted in 1937 by the Air Force Act, 1937, which, together with the Air Force Amendment Act, 1947, provides for the following:—
The Regular Air Force.
The Territorial Air Force.
The Air Force Reserve.
The Air Training Corps.
The Women's Auxiliary Air Force.
Section 2 of the 1947 Amendment Act established the Air Training Corps as part of the Royal New Zealand Air Force. Section 3 of the same amendment provided legislative sanction for the constitution of the Women's Auxiliary Air Force as a permanent service within the Air Force.
The Regular Air Force.—The Regular Air Force provides commanders and staffs at Headquarters, liaison offices overseas, stations in Now Zealand and Fiji, and instructional staffs for all elements of the R.N.Z.A.F.
Service in the Regular Air Force is voluntary and normal entry to the ranks is through an initial engagement of five years (non-technical trades) or eight years (technical trades).
Extensions of service beyond these periods provide, broadly, for a 1 to 2 ratio of long- to short-service airmen within the Regular Air Force.
Candidates for commissions will be drawn largely from the ranks, and an element with higher educational and specialist qualifications will be commissioned on joining the service. Commissions are either permanent or short service, the latter of five years' duration and carrying an obligation for service with the Air Force Reserve.
Retiring ages for officers holding permanent commissions in the General Duties Branch are: Squadron Leader and below, forty-five years; Wing Commander, forty-eight years; Group Captain and above, fifty-three years; while those for other branches are forty-nine, fifty-one, and fifty-three years respectively.
The Territorial Air Force and Air Force Reserve.—After the outbreak of war, the Territorial Air Force lost its separate identity. This continued to be the situation up to the virtual completion of demobilization of wartime personnel by March, 1948. The desirability of establishing the Territorial Air Force and of reorganizing the Air Force Reserve on an active basis as early as possible was, however, fully recognized. The Territorial Air Force has now been established and a measure of training activity commenced during the year ended March, 1949.
The Air Training Corps.—Authority for the formation of the Air Training Corps was granted in 1941, while it became an integral part of the R.N.Z.A.F. by virtue of the Air Force Amendment Act, 1947. The scheme of flying training for selected Cadets at selected aero clubs has proved a welcome incentive to service in the A.T.C.
Training Establishments.—The major training activities are centred at Wigram, which contains the Flying Training School, Advanced Flying School, the Air Navigation School, Central Flying School (for the training of instructors) Recruit Training Depot, and the Electrical and Wireless School. The Instrument Flying School, formerly located at Whenuapai, moved in 1947 to Wigram and was incorporated in the Advanced Flying School. The Technical Training School is located at Hobsonville.
Close liaison with the R.A.F. has been maintained by visits of aircraft and specialized teams from the Empire Schools of Flying, Navigation, Signals, &c.; by the interchange of officers; and by the posting of senior R.N.Z.A.F. officers to courses at the Imperial Defence College and the R.A.F. Staff College.
Personnel.—The strength of the R.N.Z.A.F. at the 31st March, 1948, was 2,896, compared with a total of 3,657 at 31st March, 1947. The totals serving overseas and included in the strength quoted were 491 and 350 respectively. Women's Auxiliary Air Force personnel, also included in the figures for the two years, were 130 in 1948 and 241 in 1947. Air Training Corps strength at the 30th November, 1947, when units went into recess for the season, was 5,253.
Activities During 1946–48.—The activities of the Royal New Zealand Air Force in the period 1946–48 were carried on in the abnormal and unstable conditions arising from the war. The service was faced with three major tasks, all of which made heavy demands on the limited resources available: first, the orderly contraction of the wide range of war activities, which still involved the use of considerable man-power; second, the reorganization and training of the service under peacetime conditions; and third, the performance of a number of operational duties.
The chief commitments of the R.N.Z.A.F. in the period under review were the segregation, custody, and disposal of surplus war equipment; the operation of a quasi-civil air transport organization in New Zealand and the South Pacific (until it was taken over by the New Zealand National Airways Corporation during 1947); the maintenance, until August, 1948, of a weekly transport schedule between New Zealand and Japan in support of the New Zealand Contingent of the British Commonwealth Occupation Force; the maintenance in Japan of No. 14 Fighter Squadron, which carried out security and anti-smuggling patrols over the B.C.O.F. area until it returned to New Zealand; and the ferrying from England of Mosquito aircraft for the re-equipment of No. 75 Bomber Squadron. In addition, at the present time two R.N.Z.A.F. crews are established in No. 24 Commonwealth Squadron, R.A.F., and three crews are participating in the Berlin air lift.
Miscellaneous flying activities have included regular fire patrols in the Rotorua area during the summer months; searches for missing aircraft and launches; cooperation with the Department of Scientific and Industrial Research in special investigations, and with the Internal Affairs Department in support of deer-culling operations; and a number of “mercy” flights.
Active Units of the Air Force.—Active units of the R.N.Z.A.F. at present comprise—
| R.N.Z.A.F. Station, Hobsonville | Technical Training School. Detachment of No. 5 Flying Boat Squadron (for search and rescue work). |
| R.N.Z.A.F. Station, Whenuapai | No. 41 Transport Squadron. (Until the facilities at Norfolk Island were taken over by the Australian authorities, Whenuapai maintained a detachment there.) |
| R.N.Z.A.F. Station, Ohakea | No. 14 Fighter Squadron. No. 75 Bomber Squadron. No. 1 Repair Depot. General Purpose Flight. |
| Air Department Headquarters Unit | Situated at Shelly Bay. Provides accommodation and administrative services for personnel of Air Force Headquarters. |
| R.N.Z.A.F. Station, Woodbourne | Aircraft Storage Depot. |
| R.N.Z.A.F. Station, Wigram | Flying Training School. Electrical and Wireless School. N.C.O.'s School of Instruction. Recruit Training Depot. (Wigram is also responsible for an aircraft storage flight at Taieri.) |
| R.N.Z.A.F. Station, Fiji | No. 5 Flying Boat Squadron. |
In addition, there are Stores Depots at To Rapa, Mangaroa, and Weedons, and sub-stores at Te Awamutu, Ardmore, Rukuhia, and Gracefield.
Air Force Expenditure.—The total expenditure on the Air Force for the year ended 31st March, 1948, was £4,861,081. Payments included in this figure which were a charge on the Consolidated Fund amounted to £4,175,219, the remaining £685,862 being payments from the War Expenses Account. Expenditure for the 1947 financial year totalled £5,559,190, the Consolidated Fund and War Expenses Accounts components of this sum being £2,955,930 and £2,603,260 respectively. Payments from the War Expenses Accounts covering the period from September, 1939, to 31st March, 1948, were £148,507,315 (see explanation given in Section 24A).
STRENGTHS OF THE ARMED SERVICES.—As stated under an earlier heading, enlistment for the Armed Forces was on a voluntary basis until July, 1940, and from that date service was made compulsory. During the nine months' period in which the voluntary system was in operation, approximately 60,000 men volunteered for service with the Forces.
The gross intake of men to the Armed Forces up to 15th August, 1945, the date of cessation of hostilities, was 224,000, of whom 160,000 entered the Army, 12,000 the Navy, and 52,000 the Air Force. The net intake—i.e., exclusive of transfers between the Services and re-entry of men who had had a previous period of service—was 194,000, which is equivalent to 67 per cent. of the male population (including Maoris) between the ages of eighteen and forty-five years. In addition, approximately 10,000 women served in the Forces.
The following table shows the approximate strength of each of the Services from the outbreak of war in September, 1939, at yearly intervals until March, 1948, and also in August, 1945, when hostilities ceased. The figures at July, 1942, are also shown, as that month marked the peak for mobilization, there being 151,073 men in the Armed Forces at that time, representing approximately 43 per cent. of the male population of military age.
| As at 31st March, | Navy. | Army. | Air Force. | All Services. | Total. | Female Personnel (Included in Previous Columns). | |
|---|---|---|---|---|---|---|---|
| In New Zealand. | Overseas. | ||||||
| 1939 (September) | 1,320 | 18,000 | 1,486 | 20,392 | 414 | 20,806 | |
| 1940 | 1,791 | 29,300 | 3,808 | 27,628 | 7,271 | 34,899 | 18 |
| 1941 | 3,579 | 75,148 | 10,213 | 54,997 | 33,943 | 88,940 | 202 |
| 1942 | 5,605 | 109,389 | 18,228 | 82,201 | 51,021 | 133,222 | 2,356 |
| 1942 (July) | 6,110 | 124,773 | 23,666 | 104,490 | 50,059 | 154,549 | 3,476 |
| 1943 | 7,657 | 104,087 | 33,777 | 82,740 | 62,781 | 145,521 | 7,302 |
| 1944 | 10,018 | 72,662 | 41,595 | 55,039 | 69,236 | 124,275 | 7,942 |
| 1945 | 10,412 | 46,698 | 35,004 | 42,731 | 49,383 | 92,114 | 5,609 |
| 1945 (August) | 10,466 | 40,942 | 31,578 | 36,962 | 46,024 | 82,986 | 4,632 |
| 1946 | 4,528 | 14,129 | 6,918 | 19,214 | 6,361 | 25,575 | 1,838 |
| 1947 | 1,632 | 7,164 | 3,657 | 7,410 | 5,043 | 12,453 | 577 |
| 1948 | 1,657 | 4,746 | 2,896 | 6,465 | 2,834 | 9,299 | 435 |
NOTE.—The Navy figures do not include the Naval Auxiliary Patrol Service, while the Army figures similarly exclude the Home Guard.
The establishment of the Emergency Reserve Corps in August, 1940, consisting of (1) the Home Guard, (2) the Emergency Precautions Services, and (3) the Women's War Service Auxiliary, provided for the effective utilization of civilian personnel in the case of emergency. The Home Guard, which was constituted a part of the Defence Forces on 30th July, 1941, reached its peak in April, 1943, with a total strength of 124,194 men, while the total numbers involved in the Emergency Precautions Services at one stage reached 150,000.
The Now Zealand Naval Auxiliary Patrol Service commenced operations in December, 1941, and attained its maximum strength of 403 ratings in August, 1942.
CASUALTIES ON ACTIVE SERVICE.—The following table gives particulars of casualties suffered on active service by members of the Now Zealand Armed Forces and Mercantile Marino from the outbreak of war in September, 1939, up to 31st December, 1940. The figures shown for the Navy and Air Force include New Zealand personnel serving with the Royal Navy and Royal Air Force respectively. Deaths and injuries due to accidental causes while on active service are included in the figures of deaths and wounded respectively. The number shown as “missing” refers to the number so classified as at 31st December, 1946.
| — | Deaths (Including Died as Prisoner of War.) | Wounded and Injured. | Prisoners of War. | Wounded and taken Prisoner of War. | Interned. | Missing. | Totals. |
|---|---|---|---|---|---|---|---|
| Navy | 573 | 170 | 54 | 3 | 800 | ||
| Army | 6,793 | 15,324 | 6,644 | 1,219 | 46 | 30,026 | |
| Air Force | 4,149 | 255 | 520 | 32 | 23 | 4,979 | |
| Mercantile Marine | 110 | 123 | 233 | ||||
| Totals | 11,625 | 15,749 | 7,218 | 1,251 | 149 | 46 | 36,038 |
In addition to the above figures, there were 11 deaths reported in the 2nd N.Z.E.F. (Japan) up to 31st December, 1948.
HONOURS AND AWARDS.—The following table shows, as far as' available records will permit, the numbers of honours, decorations, &c., for distinguished or gallant conduct, devotion to duty, &c., which were awarded to New Zealand personnel serving with His Majesty's Forces from the outbreak of the 1939–46 war up to 31st December, 1946.
The figures for the Navy include New Zealand personnel serving with the Royal Navy and also members of the Royal Navy serving with the Royal New Zealand Navy, while the Air Force figures include New Zealand personnel serving with the Royal Air Force.
| Honour or Award. | Navy. | Army. | Air Force. | Totals. |
|---|---|---|---|---|
| Bar to Victoria Cross | 1 | 1 | ||
| Victoria Cross | 5 | 3 | 8 | |
| British Orders of Knighthood, &c.— | ||||
| Knight Commander of the Order of the Bath | 1 | 1 | ||
| Companion of Order of the Bath (C.B.) | 3 | 6 | 2 | 11 |
| Knight Commander of the Order of the British Empire | 1 | 1 | 2 | |
| Commander of the Order of the British Empire (C.B.E.) | 1 | 26 | 9 | 36 |
| Distinguished Service Order (Bar) | 1 | 19 | 4 | 24 |
| Distinguished Service Order | 7 | 111 | 71 | 189 |
| Officer of the Order of the British Empire | 15 | 84 | 34 | 133 |
| Member of the Order of the British Empire | 28 | 148 | 66 | 242 |
| Decorations— | ||||
| Royal Red Cross | 27 | 27 | ||
| Distinguished Service Cross (Second Bar) | 1 | 1 | ||
| Distinguished Service Cross (Bar) | 8 | 8 | ||
| Distinguished Service Cross | 95 | 95 | ||
| Military Cross (Bar) | 13 | 13 | ||
| Military Cross | 254 | 2 | 256 | |
| Distinguished Flying Cross (Second Bar) | 4 | 4 | ||
| Distinguished Flying Cross (Bar) | 80 | 80 | ||
| Distinguished Flying Cross | 1 | 1,014 | 1,015 | |
| Air Force Cross (Bar) | 2 | 2 | ||
| Air Force Cross | 102 | 102 | ||
| Albert Medal | 1 | 1 | ||
| Medals for gallantry and distinguished conduct— | ||||
| Distinguished Conduct Medal (Bar) | 1 | 1 | ||
| Distinguished Conduct Medal | 108 | 108 | ||
| Conspicuous Gallantry Medal | 1 | 5 | 6 | |
| Distinguished Service Medal | 35 | 35 | ||
| Military Medal (Bar) | 4 | 4 | ||
| Military Medal | 589 | 3 | 592 | |
| Distinguished Flying Medal (Bar) | 1 | 1 | ||
| Distinguished Flying Medal | 179 | 179 | ||
| Air Force Medal | 5 | 5 | ||
| George Medal | 1 | 6 | 7 | |
| British Empire Medal | 30 | 74 | 42 | 146 |
| Mentioned in despatches | 197 | 2,802 | 572 | 3,571 |
| Allied orders, decorations, medals, &c. | 41 | 117 | 70 | 228 |
| Special Commendations | 1 | 42 | 43 | |
| Totals | 466 | 4,392 | 2,319 | 7,177 |
In addition, the following honours and awards were won by members of the New Zealand Mercantile Marine (December, 1939, to December, 1946):—
| Distinguished Service Order | 1 |
| Distinguished Service Cross | 3 |
| Distinguished Service Medal | 2 |
| Mentioned in Despatches | 8 |
Table of Contents
DATA regarding the overseas trade of New Zealand possess a special significance in view of the country's relatively high degree of dependence upon its external trade. According to the latest figures, New Zealand's total trade per caput is one of the highest in the world.
In the official annual statistics of the trade of Now Zealand the twelve-monthly period adopted is the calendar year. Summarized trade statistics over a lengthy period of years are included in the Statistical Summary towards the end of this volume. Monthly figures covering the principal items of export and import are published in the Monthly Abstract of Statistics, so that summarized figures are readily available for any twelve-monthly period. As the farm production year ends about June and the financial year on 31st March, it is desirable to record trade for years ended 30th June and 31st March as well as for calendar years.
The following table relates to merchandise only—i.e., it excludes specie, particulars of which will be found on page 209. Up to the end of 1929 New Zealand currency and sterling were at virtual parity, but thenceforward New Zealand currency was at a discount with sterling up to 19th August, 1948, when it was restored to parity with sterling (vide section relating to Banking and Currency). Consequently figures of total merchandise trade have been converted to a sterling basis, and a summary covering the last eleven complete years follows.
| Year. | Year ended 31st December. | Year ended 31st March. | Year ended 30th June. | |||
|---|---|---|---|---|---|---|
| Exports. | Imports. | Exports. | Imports. | Exports. | Imports. | |
* Provisional. | ||||||
| £(N.Z.) | £(N.Z.) | £(N.Z.) | £(N.Z.) | £(N.Z.) | £(N.Z.) | |
| 1937 | 66,713,379 | 56,160,695 | 60,234,511 | 47,621,104 | 64,621,474 | 50,076,468 |
| 1938 | 58,376,283 | 55,422,189 | 65,007,946 | 58,064,559 | 61,919,913 | 57,542,606 |
| 1939 | 58,049,316 | 49,387,183 | 57,867,279 | 54,408,447 | 57,891,911 | 56,499,607 |
| 1940 | 73,741,133 | 48,997,669 | 59,683,938 | 45,571,774 | 65,858,636 | 46,070,033 |
| 1941 | 67,479,413 | 49,167,010 | 71,179,430 | 47,918,224 | 65,766,530 | 46,184,967 |
| 1942 | 81,284,637 | 53,856,012 | 69,163,121 | 50,589,652 | 74,039,151 | 51,377,986 |
| 1943 | 71,862,598 | 95,242,330 | 76,112,383 | 60,967,788 | 71,711,929 | 71,958,098 |
| 1944 | 77,786,946 | 86,397,212 | 75,252,148 | 95,849,754 | 73,235,274 | 97,490,448 |
| 1945* | 81,536,431 | 55,072,928 | 79,352,307 | 81,611,313 | 86,922,973 | 67,734,502 |
| 1946* | 101,307,165 | 71,634,114 | 88,966,955 | 56,987,882 | 90,908,344 | 62,646,851 |
| 1947* | 129,406,264 | 128,724,841 | 107,436,855 | 81,795,677 | 122,079,977 | 91,022,710 |
| £(Stg.) | £(Stg.) | £(Stg.) | £(Stg.) | £(Stg.) | £(Stg.) | |
| 1937 | 53,585,000 | 45,109,000 | 48,381,000 | 38,250,000 | 51,905,000 | 40,222,000 |
| 1938 | 46,889,000 | 44,516,000 | 52,215,000 | 46,638,000 | 49,735,000 | 46,219,000 |
| 1939 | 46,439,000 | 39,510,000 | 46,415,000 | 43,657,000 | 46,381,000 | 45,291,000 |
| 1940 | 58,993,000 | 39,198,000 | 47,747,000 | 36,457,000 | 52,687,000 | 36,856,000 |
| 1941 | 53,984,000 | 39,334,000 | 56,944,000 | 38,335,000 | 52,613,000 | 36,948,000 |
| 1942 | 65,028,000 | 43,085,000 | 55,330,000 | 40,472,000 | 59,231,000 | 41,102,000 |
| 1943 | 57,490,000 | 76,194,000 | 60,890,000 | 48,774,000 | 57,370,000 | 57,566,000 |
| 1944 | 62,230,000 | 69,118,000 | 60,202,000 | 76,680,000 | 58,588,000 | 77,992,000 |
| 1945* | 65,229,000 | 44,058,000 | 63,482,000 | 65,289,000 | 69,538,000 | 54,188,000 |
| 1946* | 81,046,000 | 57,307,000 | 71,174,000 | 45,590,000 | 72,727,000 | 50,117,000 |
| 1947* | 103,525,000 | 102,980,000 | 85,949,000 | 65,437,000 | 97,664,000 | 72,818,000 |
TRADE PER HEAD.—The next table shows the total merchandise trade, exports, and imports per head of the population. Values are expressed in terms of New Zealand currency.
| Year. | Exports | Imports. | Total. Trade. | ||||||
|---|---|---|---|---|---|---|---|---|---|
*Provisional. | |||||||||
| £ | s. | d. | £ | s. | d. | £ | s. | d. | |
| 1928 | 38 | 3 | 3 | 30 | 16 | 0 | 68 | 19 | 3 |
| 1929 | 37 | 5 | 7 | 33 | 1 | 6 | 70 | 7 | 1 |
| 1930 | 30 | 2 | 0 | 29 | 14 | 0 | 59 | 16 | 0 |
| 1931 | 23 | 1 | 8 | 17 | 10 | 0 | 40 | 11 | 8 |
| 1932 | 23 | 6 | 5 | 16 | 2 | 10 | 39 | 9 | 3 |
| 1933 | 26 | 12 | 8 | 16 | 12 | 4 | 43 | 5 | 0 |
| 1934 | 30 | 10 | 3 | 20 | 4 | 0 | 50 | 14 | 3 |
| 1935 | 29 | 15 | 9 | 23 | 4 | 11 | 53 | 0 | 8 |
| 1936 | 36 | 0 | 7 | 28 | 1 | 11 | 64 | 2 | 6 |
| 1937 | 41 | 19 | 2 | 35 | 6 | 5 | 77 | 5 | 7 |
| 1938 | 36 | 6 | 8 | 34 | 9 | 10 | 70 | 16 | 6 |
| 1939 | 35 | 12 | 11 | 30 | 6 | 6 | 65 | 19 | 5 |
| 1940 | 45 | 0 | 9 | 29 | 18 | 6 | 74 | 19 | 3 |
| 1941 | 41 | 7 | 6 | 30 | 2 | 11 | 71 | 10 | 5 |
| 1942 | 49 | 11 | 6 | 32 | 16 | 11 | 82 | 8 | 5 |
| 1943 | 43 | 18 | 9 | 58 | 4 | 7 | 102 | 3 | 4 |
| 1944 | 46 | 19 | 7 | 52 | 3 | 7 | 99 | 3 | 2 |
| 1945* | 48 | 2 | 3 | 32 | 9 | 11 | 80 | 12 | 2 |
| 1946* | 57 | 10 | 5 | 40 | 13 | 5 | 98 | 3 | 10 |
| 1947* | 71 | 15 | 9 | 71 | 8 | 2 | 143 | 3 | 11 |
The year 1947 produced figures far in excess of those recorded for any previous trade year. The highest figure of total trade in the past was £102 3s. 4d. in 1943, but it should be remembered that included in the total for that year were heavy imports of a noncommercial character—munitions and war stores. The latter class of import did not figure largely in the 1947 trade accounts, the great bulk of imports representing the record demand of purely commercial buyers.
VISIBLE BALANCE OF TRADE.—As a debtor country New Zealand has normally a substantial excess of exports over imports, imports having exceeded exports in only five (calendar) years since 1885—viz., in 1908, 1920, 1926, 1943, and 1944. The figures for the last twenty years—merchandise only—are as follows:—
| Year. | Visible Excess of Exports. | |
|---|---|---|
*Excess of imports. † Provisional. | ||
| £(N.Z.) | £(Stg.) | |
| 1928 | 10,726,279 | 10,726,279 |
| 1929 | 6,195,591 | 6,195,591 |
| 1930 | 100,863 | 677,000 |
| 1931 | 8,452,547 | 7,695,000 |
| 1932 | 10,963,913 | 9,967,000 |
| 1933 | 15,424,553 | 12,340,000 |
| 1934 | 16,003,295 | 12,803,000 |
| 1935 | 10,221,114 | 8,210,000 |
| 1936 | 12,493,054 | 10,035,000 |
| 1937 | 10,552,684 | 8,476,000 |
| 1938 | 2,954,094 | 2,373,000 |
| 1939 | 8,662,133 | 6,930,000 |
| 1940 | 24,743,464 | 19,795,000 |
| 1941 | 18,312,403 | 14,650,000 |
| 1942 | 27,428,625 | 21,943,000 |
| 1943 | -23,379,732* | -18,704,000* |
| 1944 | -8,610,266* | -6,888, 000* |
| 1945† | 26,463,503 | 21,171,000 |
| 1946† | 29,673,051 | 23,738,000 |
| 1947† | 681,423 | 545,000 |
NOTE.—The 1942–45 figures include imports of lend-lease supplies which did not involve normal transactions in monetary exchange (being cancelled by reciprocal aid provided in New Zealand). To show the true balance of trade they should be eliminated, giving approximate export surpluses for the four years as follows (New Zealand currency): 1942, £38,000,000; 1943, £4,000,000; 1944, £13,000,000; 1945, £34,000,000.
It will be noticed that the balance for the year 1930 is greater on a sterling basis than on a New Zealand currency basis. The apparent anomaly is due to a combination of (1) successive movements in the exchange rate, and (2) the unequal distribution of exports over the year.
A pronounced fall in exports from the previous year's level was responsible for an import excess of £4,542,839 in 1926, and a similar movement accounted for the low excess of exports in 1930 and in 1938. The improvement in 1939 was effected by a reduction in imports under the policy of import selection and control which was inaugurated at the beginning of that year. The excess of exports in 1940 was the highest recorded to that date but this was exceeded by approximately £3,000,000 (New Zealand currency) in 1942. Extremely largo import totals, mainly as the result of the huge expansion of the importation of defence materials and supplies under lend-lease arrangements (which to a large extent invalidates comparisons with earlier years) were responsible for the excess of imports in 1943 and 1944. A substantial fall in imports of defence materials and lend-lease supplies and an increase in exports combined to produce the heavy balance in 1945. Although the value of imports in 1946 exceeded the 1945 total by £16,561,186 despite the cessation of imports of defence materials, a new record balance was achieved owing to the fact that the exports increased to an even greater extent.
The visible excess of exports, which reached the record level of £29,673,051 in 1946, fell away to the very small total of £681,423 in 1947, despite the large increase (28 per cent.) in the value of exports between 1946 and 1947. The explanation for this is to be found in the very considerable increase in the total value of imports, which was no less than 80 per cent. above the 1940 total. Disregarding the import surpluses in 1943 and 1944 (see note under the preceding table), the latest export balance is the lowest since 1930.
The visible balance of trade — i.e., the excess of exports over imports or vice versa —is an essential record valuable for numerous purposes, but with very definite limitations.
In the first place, although this is not the most important factor, the trade statistics themselves contain inevitable errors. For example, it is necessary in many instances to assess the value of exports where goods are not sold until arrival at their destination; again, in the case of imports, an arbitrary assumption is made to cover freight, insurance, and handling charges. While errors arising from such sources do not appreciably affect items or totals of exports or imports, they may conceivably cause significant errors in the visible balance of trade, since there is no guarantee that such errors will be of a compensatory nature. In particular, when a small visible balance emerges from a year's trading in commodities, a relatively small margin of error in the assessment of export or import values (or both) may make a quite significant error in the residual balance. The possible error arising from the necessity of pre-estimating the final realization in the case of certain exports is not likely to be of importance in years of relatively stable prices; but, in periods when world prices are changing rapidly, an appreciable margin of error may result from this cause in the assessment of the total of export valuations for a single year.
Furthermore, there are additional difficulties where trade with individual countries is concerned. The ultimate destination of goods exported is sometimes not known at the time of export. In particular, it is evident from the United Kingdom trade statistics that a considerable proportion of New Zealand's exports to continental countries in normal times is recorded in the New Zealand statistics among exports to the United Kingdom. Such produce may be sold on the United Kingdom markets to continental purchasers; while, again, goods may be diverted to continental markets after arrival in the United Kingdom.
Various factors arising out of the war have further obscured the position in recent years, particularly during the period that the Lend-Lease and the Canadian Mutual Aid Agreements were operating. In considering the 1942–45 balances, the effect of the inclusion in imports of lend-lease supplies should be noted. With the mutual cancellation of any obligations under lend-lease and reciprocal-aid arrangements as announced in the final settlement, it will be apparent that lend-lease imports were not the subject of ordinary transactions in monetary exchange, and their inclusion in imports conveys a false impression in so far as balances of payments are concerned. A further complication in this connection arose during the war period in connection with exports. Considerable quantities of foodstuffs and equipment were exported for the use of Allied Forces. &c., at the direction of the United Kingdom Government. In accordance with the general practice, such exports were credited to the country of final destination—e.g., Egypt, Algeria, Iraq, Italy, India, &c.—although the responsibility for payment rested with the United Kingdom Government.
Of much greater importance is the fact that the visible trade is not the only factor to be taken into account in considering the balance of payments between countries. Debt payments, capital investments and flow of capital, freight payments, tourist expenditure, and the like, are vitally important factors which frequently reverse a credit visible balance of trade into a debit balance of payments. A statement of New Zealand's overseas receipts and payments is given later in this section.
The following table shows for the year 1947 the amount of merchandise exports to, and imports from, each of the principal countries trading with New Zealand. Exports are valued f.o.b. New Zealand ports, and imports at New Zealand import values—i.e., current domestic value in country of shipment plus 10 per cent. allowance for freight, &c. The trade balances therefore represent the differences between exports and imports, both at New Zealand ports. This is the accepted practice internationally in statistics of trade, and it follows that New Zealand trade statistics will yield different results in respect of her trade with any given country than will be obtained from the trade statistics of that country, unless allowance be made for this practice.
TRADE BY COUNTRIES, 1947*
| Country. | Exports. | Imports. | ||
|---|---|---|---|---|
| New Zealand Produce. | Total. | By Country of Shipment. | By County of Origin. | |
| £(N.Z.) | £(N.Z.) | £(N.Z.) | £(N.Z.) | |
| United Kingdom | 98,393,031 | 98,677,777 | 55,387,517 | 55,038,985 |
| Ceylon | 62,354 | 62,354 | 1,947,988 | 1,949,311 |
| India and Pakistan | 486,910 | 491,387 | 4,649,291 | 4,710,521 |
| Malaya and Singapore | 313,469 | 318,455 | 499,859 | 502,880 |
| British West Africa | 5,205 | 5,255 | 418,781 | 423,202 |
| Union of South Africa | 61,378 | 65,064 | 494,169 | 498,685 |
| Canada | 3,049,500 | 3,059,660 | 11,579,725 | 11,609,460 |
| Australia | 3,745,954 | 4,095,981 | 15,476,834 | 14,942,154 |
| Fiji | 342,434 | 441,099 | 2,252,462 | 2,176,521 |
| Western Samoa | 281,410 | 349,348 | 348,060 | 332,836 |
| Other British Commonwealth countries | 642,138 | 780,458 | 990,925 | 1,090,837 |
| Totals, British Commonwealth countries | 107,383,783 | 108,346,838 | 94,045,611 | 93,275,392 |
| Belgium | 1,990,877 | 1,991,010 | 2,334,886 | 2,440,247 |
| Denmark | 451,547 | 451,547 | 25,026 | 28,884 |
| Finland | 44,095 | 44,095 | 389,454 | 398,005 |
| France | 4,445,974 | 4,447,174 | 795,516 | 874,399 |
| Italy | 665,570 | 665,590 | 380,117 | 418,268 |
| Netherlands | 1,717,409 | 1,717,409 | 585,956 | 611,476 |
| Norway | 73,446 | 73,446 | 306,154 | 312,954 |
| Russia | 504,607 | 504,607 | 6,536 | 24,261 |
| Switzerland | 274,960 | 274,960 | 545,433 | 558,374 |
| Sweden | 341,886 | 342,142 | 1,122,470 | 1,148,400 |
| Bahrein Islands | 975 | 975 | 1,089,039 | 1,089,039 |
| Iran | 1,871,324 | 1,883,098 | ||
| China | 201,817 | 207,779 | 189,379 | 233,368 |
| United States of America | 8,153,296 | 8,174,457 | 23,008,787 | 23,329,104 |
| Tuamotu Archipelago | 40,727 | 50,644 | 766,210 | 766,210 |
| Other foreign countries | 1,307,075 | 1,444,652 | 1,262,943 | 1,333,362 |
| Totals, other countries | 20,214,261 | 20,390,487 | 34,679,230 | 35,449,449 |
| Ships' stores | 115,140 | 668,939 | ||
| Totals, all countries | 127,713,184 | 129,406,204 | 128,724,841 | 128,724,841 |
* Provisional.
The progress of, and the trends in the direction of New Zealand's overseas trade, are illustrated by the accompanying diagram. Among the features portrayed are the extent to which New Zealand is dependent on the United Kingdom as a market for its exports, and the huge expansion that took place in commodity trade during 1947, particularly in the case of imports.
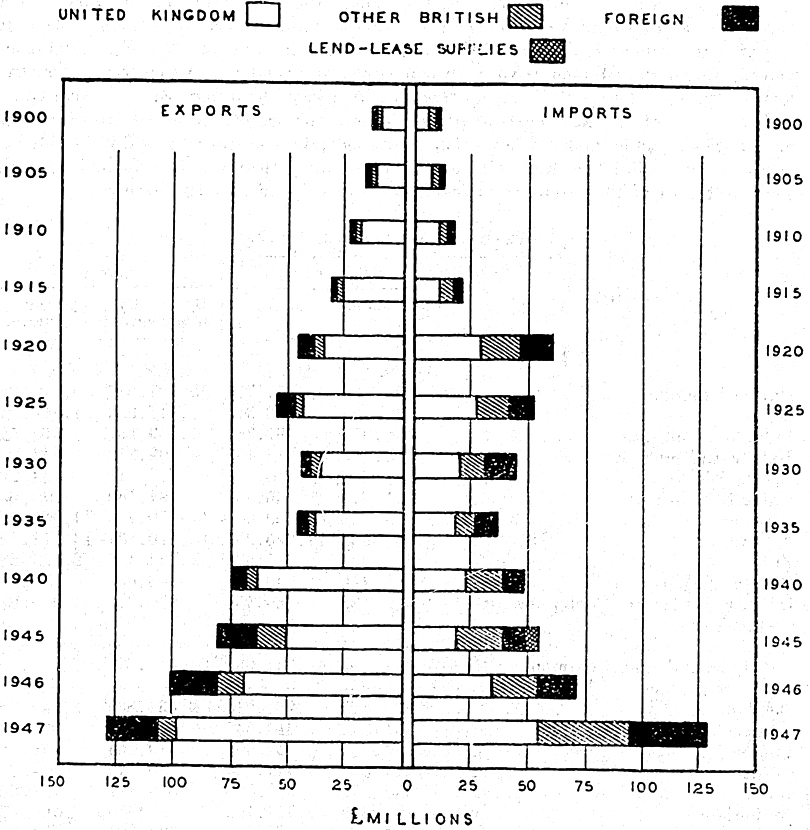
BALANCE OF OVERSEAS PAYMENTS.—For many years the Census and Statistics Department prepared a statement of New Zealand's international balance of payments—that is, receipts from and payments to overseas countries. While reasonably accurate information was available for imports and exports, Government and local authority interest payments and debt movements, and miscellaneous Government receipts and payments, there were a number of important items for which it was necessary to make estimates, all more or less unsatisfactory. It was, for example, extremely difficult to estimate investments of private capital in New Zealand and the amount of outgoings by way of interest or dividends on such capital. Hardly more satisfactory was the position regarding tourist expenditure, both by tourists to New Zealand and by New Zealand tourists abroad. Altogether, the statement did not amount to anything more than a rough approximation.
Since the institution of exchange control in New Zealand, it is now possible through the Reserve Bank, which administers exchange control, to give a complete and detailed statement of the foreign exchange transactions of the country. Following is a classification of the transactions for each of the years ended 31st December, 1943–47.
| — | Year ended 31st December. | ||||
|---|---|---|---|---|---|
| 1943. | 1944. | 1945. | 1946. | 1947. | |
| £N.Z. | £N.Z. | £N.Z. | £N.Z. | £N.Z. | |
| Receipts— | (000) | (000) | (000) | (000) | (000) |
| Exports | 76,686 | 80,546 | 97,574 | 112,054 | 129,045 |
| Interest, dividends, legacies, immigrants' funds, repatriated capital, and private debts due in New Zealand | 4,778 | 5,368 | 7,432 | 13,197 | 17,010 |
| Trade debts due in New Zealand, including overseas earnings of New Zealand firms | 3,135 | 3,958 | 5,112 | 5,665 | 6,602 |
| Commissions, royalties, and insurance | 261 | 275 | 361 | 590 | 582 |
| Donations and allowances | 339 | 429 | 548 | 539 | 682 |
| Travellers' expenses | 223 | 185 | 606 | 653 | 745 |
| Receipts on account of American authorities and personnel | 14,329 | 8,085 | 3,724 | 3,720 | |
| Receipts by High Commissioner in London | 4,463 | 27,623 | 13,796 | 11,714 | 9,855 |
| Unclassified | 264 | ||||
| Total receipts | 104,478 | 126,468 | 129,152 | 148,133 | 164,521 |
| Payments— | |||||
| Imports, excluding payments in respect of Government imports | 28,660 | 30,045 | 31,745 | 60,118 | 115,190 |
| Interest, dividends, legacies, emigrants' funds, repatriated capital, and private debts due overseas | 3,808 | 4,530 | 5,001 | 7,866 | 8,942 |
| Trade debts due overseas, including earnings in Now Zealand of overseas firms and payments on goods imported prior to introduction of licensing system | 2,469 | 1,925 | 2,137 | 2,250 | 4,099 |
| Government debt and other services, including payments in respect of imports | 55,008 | 55,337 | 40,195 | 78,941 | 56,398 |
| Local-authority debt services | 2,375 | 1,117 | 1,578 | 1,397 | 516 |
| Commissions, royalties, and insurance | 845 | 735 | 631 | 652 | 912 |
| Donations and allowances | 754 | 744 | 896 | 1,404 | 1,538 |
| Film-hire and entertainments | 543 | 509 | 564 | 559 | 566 |
| Travellers' expenses | 93 | 181 | 363 | 1,401 | 2,308 |
| American authorities and personnel | 6,752 | 3,641 | 2,887 | 105 | |
| Unclassified | |||||
| Total payments | 101,306 | 98,764 | 85,997 | 154,693 | 190,469 |
| Balance | +3,172 | + 27,704 | +43,155 | -6,560 | -25,948 |
INDEX NUMBERS OF VALUE AND VOLUME OF TRADE.—The table following facilitates appreciation of the movement of external trade in recent years, both in value and in physical volume. Volume of exports and effect of price changes upon exports are dealt with at greater length in the succeeding subsection.
INDEX NUMBERS OF VALUE AND VOLUME OF TRADE. (Base: 1936–38 = 100)
| Year. | Value. | Volume. | ||||||||
|---|---|---|---|---|---|---|---|---|---|---|
| On Gold Basis. | On Sterling Basis. | On New Zealand Currency Basis. | Exports. | Imports. | Total Trade. | |||||
| Exports. | Imports. | Exports. | Imports. | Exports. | Imports. | Total External Trade. | ||||
*Provisional. | ||||||||||
| 1927 | 166 | 178 | 100 | 107 | 80 | 86 | 83 | 70 | 77 | 73 |
| 1928 | 190 | 179 | 114 | 107 | 92 | 86 | 89 | 73 | 81 | 76 |
| 1929 | 187 | 194 | 113 | 117 | 91 | 94 | 92 | 75 | 91 | 82 |
| 1930 | 147 | 169 | 89 | 102 | 74 | 85 | 79 | 77 | 82 | 79 |
| 1931 | 100 | 88 | 65 | 58 | 58 | 51 | 55 | 78 | 51 | 66 |
| 1932 | 79 | 64 | 66 | 54 | 59 | 47 | 54 | 86 | 50 | 70 |
| 1933 | 76 | 55 | 67 | 49 | 68 | 49 | 59 | 101 | 49 | 77 |
| 1934 | 80 | 62 | 78 | 60 | 78 | 60 | 70 | 98 | 61 | 81 |
| 1935 | 76 | 70 | 77 | 70 | 77 | 70 | 74 | 96 | 72 | 85 |
| 1936 | 94 | 86 | 94 | 85 | 94 | 85 | 90 | 102 | 89 | 96 |
| 1937 | 110 | 108 | 110 | 108 | 110 | 108 | 109 | 102 | 106 | 104 |
| 1938 | 95 | 106 | 96 | 107 | 96 | 107 | 101 | 97 | 105 | 100 |
| 1939 | 87 | 87 | 95 | 95 | 96 | 95 | 95 | 98 | 94 | 96 |
| 1940 | 102 | 79 | 121 | 94 | 122 | 94 | 109 | 108 | 79 | 95 |
| 1941 | 93 | 79 | 111 | 94 | 111 | 95 | 104 | 97 | 70 | 85 |
| 1942 | 112 | 87 | 134 | 103 | 134 | 104 | 120 | 114 | 74 | 95 |
| 1943 | 99 | 154 | 118 | 183 | 119 | 183 | 149 | 96 | 128 | 111 |
| 1944 | 107 | 139 | 128 | 166 | 128 | 166 | 146 | 99 | 105 | 102 |
| 1945* | 111 | 88 | 134 | 106 | 135 | 106 | 121 | 95 | 64 | 81 |
| 1946* | 136 | 113 | 166 | 137 | 167 | 138 | 154 | 112 | 75 | 95 |
| 1947* | 174 | 202 | 213 | 247 | 214 | 248 | 229 | 119 | 115 | 117 |
The statistics for the war years 1940–45 need careful interpretation owing to (a) the inclusion of lend-lease supplies in imports, (b) the fact that imports include defence materials and ordnance stores, which rose greatly in wartime, and (c) the supply of very large quantities of New Zealand produce to United States Forces in the Pacific under reverse lend-lease, such supplies not being recorded in the external trade statistics.
The total value of exports (on a New Zealand currency basis) in 1947 was more than twice that of the average of the pre-war years, 1936–38, while the aggregate value of imports was greater to the extent of 148 per cent. Although price changes have contributed materially to these record values of commodity trade, there have also been considerable increases in volume, particularly in regard to imports in 1947. Compared with 1936–38, the volume index of exports for 1947 shows an increase of 19 per cent. and the volume of imports an increase of 15 per cent., while compared with 1946 the latter has risen by over 50 per cent.
IMPORT AND EXPORT CONTROL.—A decline in overseas funds commenced during 1936–37 and—allowing for seasonal fluctuations—continued steadily until 28th November, 1938, when the net overseas funds of the Reserve Bank and the trading banks were under £(N.Z.)8,000,000 (see section on Banking and Currency).
With a view to conserving overseas funds, so as to ensure that overseas debt services would be met and that sufficient funds would be available for essential imports, regulations—effective from 7th December, 1938, and known respectively as the Import Control Regulations 1938, and the Export Licences Regulations 1938—were made by Orders in Council of 5th December, 1938.
The Import Control Regulations prohibit the importation of goods except in pursuance of a licence under the regulations or of an exemption granted by the Minister. Under the Export Licences Regulations, goods (with certain minor exceptions) may not be exported except under licence.
Three classes of export licences are provided for—viz., particular, general, and purchaser's. The particular licence applies to an occasional shipment; the general licence is issuable to exporters who make regular or frequent shipments; and the purchaser's licence is for cases where goods have been purchased for export by means of credits made available from overseas. A condition of the issue of any export licence is that the overseas credits arising from the sale of the goods (or used to finance their purchase) must be sold to a New Zealand bank in exchange for Now Zealand currency.
From 7th December, 1938, also, the Minister of Finance has suspended the obligation of the Reserve Bank to give sterling in exchange for its bank-notes. This obligation was imposed by section 16 (1) of the Reserve Bank of New Zealand Act, 1933, which—as amended by section 8 of the Finance Act, 1934—reads as follows:—
“On presentation at the Head Office of the Reserve Bank in Wellington of notes of the Bank to any amount not less than one thousand pounds, it shall be the duty of the Bank, in accordance with this section, to give in exchange for such notes sterling for immediate delivery in London.”
These measures had the effect of arresting the fall in the overseas funds, and, although there was little improvement during the next twelve months, a series of monthly increases commencing in November, 1939, raised the total to £(N.Z.)27,382,104 by 24th June, 1940. This balance continued to increase, reaching over £(N.Z.)114 million at the beginning of 1947. As already indicated, however, imports reached record proportions during 1947, and this, together with certain debt repayments in London, resulted in overseas funds falling to £(N.Z.)85,000,000 at 31st March, 1948. The exchange adjustment of August, 1948, further reduced the balance by 20 per cent., the total at 24th November, 1948, being £(N.Z.)53,793,533.
MOVEMENT OF SPECIE.—Although there is a fairly considerable production of gold bullion, there is no Mint in New Zealand. Uncoined gold, therefore, ranks as an ordinary export, along with wool, dairy-produce, and other merchandise.
The following table shows exports and imports of specie stated at face value for each of the eleven years 1937–47. Very high figures were recorded in 1934, imports amounting to £1,242,000, and exports to £2,283,900. This record export total was mainly due to gold shipments by the Reserve Bank. A further contributing factor, however, and also the main reason for the high imports of that year and the comparatively high figures of 1935, was the introduction of a distinctive coinage for use in New Zealand. The arrangements made for the withdrawal of British and Australian coins, which formerly constituted the metal currency of the country, and their replacement by the new issue are outlined in the Banking and Currency Section of this Year-Book.
| Year. | Specie imported. | Specie exported. | Excess of Specie Imports (+) or Exports (-). |
|---|---|---|---|
*Provisional. | |||
| £ | £ | £ | |
| 1937 | 318,510 | 3,500 | +315,010 |
| 1938 | 31,274 | 31,805 | -531 |
| 1939 | 25,364 | 2,795 | +22,569 |
| 1940 | 36,646 | +36,646 | |
| 1941 | 205,409 | 10,015 | +195,394 |
| 1942 | 147,010 | 25,375 | +121,635 |
| 1943 | 461,800 | 1,240 | +460,560 |
| 1944 | 159,640 | 400 | +159,240 |
| 1945* | 208,148 | 4,400 | +203,748 |
| 1946* | 418,970 | 4,532 | +414,438 |
| 1947* | 184,990 | 10,375 | +174,615 |
GOVERNMENT CREDITS FOR FINANCING WOOL PURCHASES. — Financial agreements designed to facilitate the sale of New Zealand wool to France and Czechoslovakia were entered into by the New Zealand Government and the French and Chechoslovakian Governments—the former on the 2nd July, 1947, and the latter on the 22nd January, 1948.
The French agreement makes available to France a credit up to £5,000,000 sterling for use in the purchase of New-Zealand-grown wool during the five years ending 30th June, 1952. Other produce may also be brought under the scheme, if mutually agreed. Credit will be made available to the Government of France to the value of one-half of the cost of wool purchased by French buyers, the remaining one-half to be provided in the normal manner. The total advances are to be repaid not later than 31st December, 1957, and interest at the rate of 2½ per cent. per annum is payable.
The Czechoslovakian agreement makes available to Czechoslovakia a credit up to £1,000,000 in Now Zealand currency for use in the purchase of New-Zealand-grown wool during the four years ending 30th June, 1951. Credit will be made available to the Government of Czechoslovakia to the value of one-half of the cost of the wool purchased by its buyers, with the proviso that the total credit drawn to the 30th June, 1948, is not to exceed £(N.Z.)250,000, to the 30th June, 1949, £(N.Z.)500,000, and to 30th June, 1950, £750,000. The total advances are to be repaid not later than 30th June, 1954, and interest at the rate of 2½ per cent. per annum is payable.
INTERNATIONAL TRADE CONFERENCE.—The Economic and Social Council of the United Nations, by a resolution dated 18th February, 1946, resolved to call an International Conference on Trade and Employment for the purpose of promoting the expansion of the production, exchange, and consumption of goods.
This Conference was ultimately held at Havana, Cuba, from 21st November, 1947 until 24th March, 1948, and the following is an extract from the report of the New Zealand delegation to this Conference tracing the events leading up to the Conference and including a resume of the main provisions of the Charter as finally drawn up at Havana.
“The Charter on Trade and Employment recently completed in Havana was the final outcome of the proposals issued by the United States of America on 6th December, 1945, which received the general approval of the United Kingdom. These proposals represented the first attempt to draft a code which could govern the pattern of inter national trade. For a number of years there had been a growing recognition of the need for international co-operation in post-war world trade in order to avoid the restrictive effects of irresponsible unilateral trade measures which since the latter part of the nineteenth century, and more especially between the years 1919 to 1939, had impaired the standards of living and economic development of almost all countries.
“The principles contained in the `Proposals' had their origin in the declaration issued by the Prime Minister of the United Kingdom and the President of the United States of America on 14th August, 1941, which was known as the Atlantic Charter. In this Charter the desirability of fullest international collaboration was expressed as a means of securing for all, improved labour standards, economic advancement, and social security.
“In Article VII of the Mutual Aid Agreement of 23rd February, 1942 (lend-lease), between the Governments of United Kingdom and United States of America the principle was further elaborated.
“The proposals were considered by the Preparatory Committee of the United Nations Conference on Trade and Employment which was constituted on 18th February, 1946, by the Economic and Social Council of the United Nations. This Committee, which had the task of preparing a draft Charter for consideration by the Conference later, consisted of representatives of the Governments of the following countries; Australia, Belgium, Luxemburg, Brazil, Canada, Chile, China, Cuba, Czechoslovakia, France, India, Lebanon, Netherlands, New Zealand, Norway, Union of South Africa, U.S.S.R., United Kingdom, and United States of America.
“The U.S.S.R., however, was not represented at any meetings of the Committee.
“The Preparatory Committee held its first session in London from 15th October, 1946, to 26th November, 1946, and, after examination and discussion of an amplified version of the original United States proposals, a draft Charter was prepared.
“This draft Charter was subsequently submitted for clarification and revision of its text to a Special Committee representative of all countries which attended the London session. This Special Drafting Committee met in New York from 20th January to 25th February, 1947, and revised the text further for submission to the second session of the Preparatory Committee.
“This second session commenced at Geneva on 10th April, 1947, and completed its work on the text of the Charter on 23rd August of the same year. The final draft of the Charter as it emerged from the Preparatory Committee constituted the basis for discussion at the International Conference on Trade and Employment which was held at Havana from 21st November, 1947, until 24th March, 1948. The resultant Havana Charter is accordingly the culmination of many months of discussion and effort.
“Of the seventy-one countries which were invited to the Havana Conference, fifty-eight accepted the invitation and attended. The following thirteen countries were invited but did not accept: Albania, Bulgaria, Byelorussia, Ethiopia, Honduras, Hungary, Paraguay, Roumania, Saudi Arabia, Ukraine, U.S.S.R., Yugoslavia, and Siam. Spain was not invited.
“The Final Act of the Conference was signed by fifty-three countries. The external trade of the countries which, attended was estimated to be approximately 90 per cent. of the total world trade.
“Havana Charter: The Charter as finally drawn up at Havana contains provisions designed to achieve and maintain full employment and improved living standards, and to promote economic development, particularly of underdeveloped countries.
“The Charter also provides for the removal of unnecessary barriers to trade, and the reduction, by negotiation on a mutually advantageous basis, of the general level of tariffs of member countries. A substantial step in this direction was taken at Geneva when the countries represented at the second session of the Preparatory Committee carried out a series of tariff negotiations which were subsequently embodied in a General Agreement on Tariffs and Trade.* Countries not party to the Geneva Agreement will be expected, within two years of their joining the International Trade Organization, to enter into tariff negotiations with a view to a reduction in tariffs on an agreed mutually advantageous basis; failure to do so without justifiable cause will relieve parties to the Agreement from any obligation to extend concessions under that Agreement to the countries making default.
“A general restriction is placed on the use of quantitative regulation of trade subject to certain exceptions, of which one of the most important is that permitting quantitative regulations to safeguard a member's balance of payments position. Also, with the prior approval of the Organization, quantitative regulations may, under certain circumstances, be adopted for purposes of economic development. Non-discrimination in the administration of quantitative regulations is provided for in the text of the Charter, but exceptions are made for periods of world disequilibrium and shortage of currencies.
“Provision is made respecting the use of export subsidies which materially affect international trade. Stabilization schemes for primary products are not prejudiced under the Charter.
“There is in the Charter text a general commercial code affecting such matters as valuation for Customs purposes; marks of origin, dumping, Customs regulations and formalities and freedom of transit. The creation of Customs Unions is permissible within certain defined rules.
“The harmful effect of certain restrictive business practices is recognized, and the Charter lays down procedures for consultation and action by the members for removal of such harmful practices where they are found to exist.
“The Charter sets out procedures designed to avoid as far as possible difficulties arising from production surpluses and price fluctuations in world trade in primary commodities.
“The policy of the proposed International Trade Organization will be framed by the Conference of the Organization in which each member nation will exercise one vote only. The decisions of the Conference will be carried out by an Executive Board of eighteen members selected by the Conference.
*See Subsection D, “Customs Tariff and Revenue.”
“The International Trade Organization when established under the Charter will be a specialized agency of the United Nations. Pending its establishment certain functions will be performed by an Interim Commission which was established by a resolution of the Conference at Havana. The Commission consists of all Governments whose representatives approved the resolution and which are entitled to original membership of the Organization under Article 68 of the Charter. The Commission elected an Executive Committee comprising the following eighteen members to exercise its functions: United States of America, United Kingdom, Canada, France, Benelux, China, India, Brazil, Columbia, El Salvador, Mexico, Egypt, Philippines, Norway, Australia, Italy, Czechoslovakia, Greece.”
It is provided that the Charter shall enter into force on the sixtieth day following that upon which a majority of the Governments signing the Final Act of the Havana Conference have deposited instruments of acceptance with the Secretary-General of the United Nations. In other words, the Charter shall enter into force when twenty-seven acceptances have been deposited. If the required number of acceptances have not been deposited by 24th January, 1949, the Charter would hot enter into force under this provision within one year after the signature of the Final Act at Havana, and in that event the Charter shall enter into force sixty days after twenty Governments have accepted it. If the Charter has not entered into force under either-of the foregoing provisions by the 30th September, 1949, the Governments who have deposited acceptances may consult with each other to determine whether and under what conditions they desire to bring the Charter into force.
At the time of writing (31st January, 1949) the Charter had not come into force.
BULK PURCHASE OF PRIMARY PRODUCE BY UNITED KINGDOM GOVERNMENT.—The bulk purchase of New Zealand's primary produce by the United Kingdom Government originally commenced with the 1939–40 season's produce. It was definitely a wartime measure whereby the United Kingdom Government became the sole purchaser of imported foodstuffs, and in New Zealand the Marketing Department became the authority for the bulk purchase and shipment of most of the produce concerned. The principal products which came within this bulk purchase plan were wool, butter, cheese, meat, tallow, and woolly sheepskins.
With the conclusion of the war, so ended the bulk purchase agreements for wool and sheep-skins, the sale of these products reverting to the open market. Dairy-produce and meat contracts, however, were continued under the bulk-purchase scheme as part of peacetime marketing, and in 1948 new agreements were signed in London extending these contracts up to 1955.
In the case of meat, Britain has agreed to take the whole of the country's exportable surplus for the next seven years to 1955. The one exception is pig-meat, the contract for which rune to 1952, after which the quantities will be the subject of review on two full years' notice. Increased prices were fixed for the 1948–49 season, those for subsequent years being the subject of an annual review with a maximum, variation up or down of 7½ per cent. in any one year. A now agreement was concluded during 1948 between the Government and the New Zealand Meat Producers' Board, whereby the Board will assume responsibility for the handling of meat for export within the terms of the bulk purchase contracts with the United Kingdom Government.
As regards dairy-produce, butter and cheese were the subject of separate agreements, United Kingdom agreeing to take the exportable surplus of both products for the next seven years up to 1955. However, New Zealand had the right to reserve 3 per cent. of the 1948–49 season's surplus for sale at her own discretion. It was further agreed that quantity was to be the subject of review annually, and at any time if necessary, for the procurement of essential commodities from other countries. Like meat, prices for butter and cheese were fixed for the 1948–49 season by the agreement, those for subsequent years being the subject of an annual review, with a maximum variation up or down of 7½ per cent. in any one year. During 1947 the Government set up the Dairy Products Marketing Commission comprising Government members and members representing the dairy industry. The Commission was to take over all the functions of the Marketing Department in respect of butter and cheese sold on the local market or exported from New Zealand.
Tallow is the subject of an annual agreement between the United Kingdom and New Zealand Governments. The latest agreement covering the 1948–49 season is for the exportable surplus of the year's production.
A more detailed account of the above agreements will be found in Section 18, “Agricultural and Pastoral Production.”
STERLING AREA TRADE ARRANGEMENT WITH JAPAN.—The representatives of Supreme Commander Allied Powers, acting in respect of occupied Japan and the representatives of five British Commonwealth countries, have formally concluded an arrangement by which trade to the minimum value of £55,000,000 sterling will be carried on between these countries and occupied Japan from 1st July, 1948, to 30th June, 1949. The British Commonwealth participants are Australia, India, New Zealand, and the Union of South Africa, as well as the United Kingdom and its colonies, except Hong Kong.
The arrangement, which embraces trade through both Government and private channels, aims at maintaining an approximate balance of exports and imports by the two countries in order to avoid dollar expenditure on either side. The arrangement provides that all trade between the two parties shall be conducted on a sterling basis in accordance with the terms and provisions of the over-all sterling payments arrangement which is in force between the Supreme Commander and the sterling area.
The trade plan, which forms the basis of the arrangement, is not a hard-and-fast one and is not intended to constitute commitments binding on either party. It represents, in the light of the best information available to the two parties, the volume of trade which may be expected to flow between them and the character it is most likely to assume.
A further provision in the agreement specifies frequent consultations between the parties to help in the smooth running of the plan and, in particular, provision is made for a general review not later than 15th January, 1949, with the purpose of preparing a trade plan for the subsequent year. Each party has agreed to do everything feasible to ensure compliance with the export-import control, exchange controls, and such other controls that relate to international trade as may he in force from time to time in the areas under the control of the other parties.
The main goods to be exported by occupied Japan under the arrangement are cotton textiles, which accounted for a minimum of over £16,000,000 of the total minimum estimated Japanese sales of some £27,500,000, industrial machinery and parts, raw silk, rolling-stock, caustic soda and other chemicals, rayon, wool and silk manufactures, paper and paper products, and bunker coal. The sterling area participants would furnish a wide range of raw materials and other goods and services to an approximate value of £23,000,000, including raw wool, iron ore, salt, raw cotton, cereals, petroleum, rubber, tin, jute, oil-seeds, wool waste, coal, hides and skins, manganese, gums and resins, and shipping. The balance of approximately £4,500,000 would be offset against' a balance of goods already delivered to occupied Japan during the previous period on open account under governmental trading arrangements.
It is expected that New Zealand's sales to Japan would approximate £625,000 sterling and would include wool and possibly some hides and skins, casein, and seeds, while imports covering a similar amount might range over commodities such as essential classes of textiles, oak timber, and plywood.
IN New Zealand the Department of H.M. Customs requires for every package exported a declared statement of the contents, value, and destination.
In all cases exports are valued “free on board at the port of shipment.” In cases where the goods are not sold till arrival at their destination values must be assessed in New Zealand with reference to current prices. Exports of merchandise are valued in terms of New Zealand currency, which was below sterling parity from the beginning of 1930 to 19th August, 1948, when it was again restored to parity with sterling (vide section on Banking and Currency). The value of total exports, 1937–47, in sterling will be found in the preceding subsection.
The ultimate destination of the goods is distinguished as far as is practicable, but it is impossible to discover what proportion of the exports is intended for home consumption in the country of destination. In the trade records a distinction is made between exports of New Zealand produce and re-exports of imported goods.
CLASSIFICATION OF EXPORTS.—The total merchandise exports (i.e., excluding specie) during the last eleven years ore given in the following table. This table has been revised extensively to bring it into line with the United Kingdom Board of Trade classification. The main changes are the re-allocation of all items previously shown as miscellaneous, the separate classification for parcels post and live animals, and the transfer of tallow from class three “Manufactures” to class two “Raw materials.”
| Year. | Food, Drink, and Tobacco. | Raw Materials and Articles Mainly Unmanufactured.* | Articles Wholly or Mainly Manufactured. | Live Animals. | Parcels Post. | Total Merchandise Exports. |
|---|---|---|---|---|---|---|
* Including uncoined gold and silver. † Provisional. | ||||||
| £ | £ | £ | £ | £ | £ | |
| 1937 | 39,836,459 | 26,022,208 | 671,208 | 148,867 | 34,637 | 66,713,379 |
| 1938 | 40,317,724 | 17,193,613 | 713,067 | 122,263 | 29,616 | 58,376,283 |
| 1939 | 40,017,415 | 17,058,535 | 778,862 | 136,914 | 57,590 | 58,049,316 |
| 1940 | 48,864,002 | 23,735,893 | 982,258 | 118,269 | 40,711 | 73,741,133 |
| 1941 | 45,988,425 | 20,565,014 | 772,141 | 61,058 | 92,775 | 67,479,413 |
| 1942 | 52,278,721 | 27,331,870 | 1,535,559 | 16,736 | 121,751 | 81,284,637 |
| 1943 | 45,404,695 | 22,034,628 | 4,274,341 | 16,114 | 132,820 | 71,862,598 |
| 1944 | 42,848,717 | 21,667,138 | 13,136,107 | 35,451 | 99,533 | 77,786,946 |
| 1945† | 51,795,157 | 21,406,291 | 8,110,357 | 85,474 | 139,152 | 81,536,431 |
| 1946† | 59,599,170 | 37,521,291 | 3,745,570 | 152,351 | 288,783 | 101,307,165 |
| 1947† | 76,956,420 | 48,564,334 | 3,274,351 | 271,671 | 339,483 | 129,406,264 |
Easily the most important class is that for food, drink, and tobacco, which, in the case of exports from New Zealand, is composed almost wholly of foodstuffs, the principal items being butter, cheese, and frozen meat. Of the total exports during the eleven years shown in the table, this class accounted for 62.7 per cent., but in each of the last two years, 1946 and 1947, it has dropped to approximately 59 per cent. The only other class of any magnitude in normal times is that covering raw materials (mainly wool, hides, skins, seeds, tallow, and gold), which during the last eleven years constituted 32.6 per cent. of the total exports. In the last two years, however, this class registered a substantial increase to approximately 37 per cent. of total exports, owing mainly to the abnormally heavy shipments of wool, a considerable quantity of which was from held-over stocks stored in New Zealand as well as from the current season's clip. Prior to the outbreak of war, manufactured goods had not figured very prominently in New Zealand's exports, and during the three years 1937–39 accounted for only 1.2 per cent. of the total. However, during the five years 1942–46, this percentage rose to 7.4 mainly as a result of demands by the Armed Forces for certain manufactured articles including clothing and footwear, fire-fighting appliances, nails and tacks, hardware, concrete-mixers, electrical and wireless apparatus, cardboard, wall-board, leather, brushware, soap, and ordnance supplies. This last item was by far the heaviest, exports for 1944 amounting to approximately £10,000,000 of which £5,000,000 were re-exports. In 1947 manufactured articles represented 2.5 per cent. of the total, but it should be remembered that included in this class are the bulk of New Zealand's re-exports, approximately half of the total.
The extent to which New Zealand relies upon the pastoral industry for her exports is indicated by the following figures showing exports of pastoral products and the percentage which they represent among total exports of New Zealand produce. The percentage supplied by this group was high in the late “nineties,” but after 1898 fell relatively, owing mainly to increased exports of agricultural and mining produce. From 1902 onwards, however, the percentage increased almost continuously, till in 1924 and 1925 it amounted to 94.2 per cent. of the total. The percentage dropped noticeably in the depression years, owing to the relatively greater fall in prices of pastoral products, particularly wool, but with the advent of improved prices recovery was made during subsequent years, the record percentage of 94.6 being reached in 1940. The decline recorded in the aggregate value of pastoral products exported in 1941 was attributable mainly to shipping difficulties, the stocks of a number of items held in New Zealand at the end of that year being heavier than usual, and this factor contributed to the record total for 1942. During the next three years considerable quantities of meat and dairy-produce which would normally have been available for export, were supplied locally to the United States Forces, by way of reverse lend-lease. The approximate value of this produce, which was not treated as an export, even when subsequently shipped to the United States Forces in the Pacific, was: 1943, £7,000,000; 1944, £10,000,000; 1945, £8,000,000. As a consequence decreased quantities of most of the principal pastoral exports were recorded in 1943 and 1944, and this, together with the substantial increase in the export of manufactured articles mentioned earlier, and increased agricultural exports (notably peas and seeds), resulted in the proportion of pastoral exports to total exports falling to a level not experienced since 1913.
During each of the last three years the value of pastoral produce exported has risen enormously, reaching a total of £120,160,000 in 1947, an increase of 111.3 per cent. as compared with the average of the three pre-war years 1937–39. This total is also more than twice that registered in 1944. Heavy shipments of wool and frozen meat in the past two years and of butter during 1947, plus increased export prices in general, have resulted in the large figures shown in 1946 and 1947.
EXPORTS OF PASTORAL PRODUCTS
| Year. | Value. | Percentage.* |
|---|---|---|
* Of total exports of New Zealand produce. † Provisional. | ||
| £ | ||
| 1928 | 51,511,926 | 94.2 |
| 1929 | 50,780,211 | 93.7 |
| 1930 | 41,369,403 | 93.6 |
| 1931 | 32,114,900 | 93.6 |
| 1932 | 32,112,464 | 91.8 |
| 1933 | 37,110,704 | 91.8 |
| 1934 | 43,350,621 | 92.7 |
| 1935 | 42,646,990 | 92.6 |
| 1936 | 52,685,821 | 93.6 |
| 1937 | 62,549,321 | 94.5 |
| 1938 | 54,298,645 | 93.9 |
| 1939 | 53,743,686 | 93.6 |
| 1940 | 69,057,119 | 94.6 |
| 1941 | 62,237,569 | 93.0 |
| 1942 | 74,361,083 | 92.3 |
| 1943 | 61,029,219 | 86.9 |
| 1944 | 58,948,116 | 82.2 |
| 1945† | 68,112,000 | 87.0 |
| 1946† | 89,581,790 | 89.3 |
| 1947† | 120,160,000 | 94.1 |
In the first two decades of the present century exports of crops and orchard products were relatively insignificant; but from 1926 onwards there was a considerable development in the export of apples, pears, peas, and, to a lesser extent, grass- and clover-seeds, and tobacco. Owing to the available refrigerated shipping space being required for the more essential commodities, the export of apples and pears was practically discontinued during the war period, and it was not until 1948 that the export of these fruits was fully resumed. In recent years, the export of unmanufactured tobacco has practically ceased. The quantities of peas and grass- and clover-seeds exported has increased enormously since 1939, and under the stimulus of a wartime demand, a new commodity (linen-flax) achieved some importance. Over a long period of years kauri-gum was the principal item of the forest-produce group, but in later years exports of this commodity have been on a very much reduced scale. Timber exports, which fell to low levels during the depression period, recovered somewhat in 1934 and 1935, hut in 1944 recorded their lowest value for over sixty years. Although there has been some recovery during the last two years, the quantities have not reached pre-war proportions. Mining products have recorded a marked increase since 1931 due to the enhanced price of gold, which led to greater activity in the gold-mining industry, but war factors have resulted in an appreciable decline in the production of this metal since 1940.
Quantity figures of exports of the principal items of New Zealand produce are next given for the years 1939 and 1944–47. For some purposes, especially for comparisons between recent and more remote years, quantities are preferable to values, since the latter are affected by price-variations.
| Commodity (New Zealand Produce). | 1939. | 1944. | 1945.* | 1946.* | 1947.* | |
|---|---|---|---|---|---|---|
* Provisional. † Ounces of the fineness of 20 carats and upwards. | ||||||
| The mine— | ||||||
| Coal | (ton) | 43,990 | 37,687 | 21,989 | 27,536 | 28,035 |
| Pumice, sand and stone | (ton) | 3,681 | 2,345 | 2,185 | 2,539 | 2,410 |
| Gold† | (oz.) | 176,370 | 138,048 | 121,084 | 111,531 | 98,557 |
| Scheelite | (cwt.) | 760 | 2,370 | 1,493 | 425 | 325 |
| Silver | (oz.) | 315,526 | 251,362 | 98,564 | 71,517 | 109,436 |
| Cement | (cwt.) | 170 | 40,809 | 11,259 | 10,385 | 37,978 |
| The fisheries— | ||||||
| Fish | (cwt.) | 43,473 | 23,931 | 31,620 | 35,803 | 54,326 |
| Oysters | (doz.) | 62,899 | 20,616 | 640 | 85,488 | 950 |
| Whale-oil | (gal.) | 116,258 | 31,500 | 62,955 | 216,334 | 206,685 |
| The forest— | ||||||
| Kauri-gum | (ton) | 2,316 | 1,132 | 1,195 | 1,238 | 1,201 |
| Timber, sawn and hewn | (sup. ft.) | 13,172,312 | 4,252,025 | 3,599,557 | 7,989,898 | 9,493,047 |
| Pastoral products— | ||||||
| Butter | (cwt.) | 2,443,297 | 2,306,804 | 2,069,532 | 2,035,875 | 2,552,467 |
| Butterfat, dry | 780 | 594 | 217 | 1,700 | ||
| Casein | 38,518 | 6,007 | 16,102 | 14,860 | 51,833 | |
| Cheese | 1,677,257 | 1,554,059 | 1,748,514 | 1,514,917 | 1,740,879 | |
| Eggs in shell | (doz.) | 12,538 | 1,584 | 4,537 | 4,542 | 5,530 |
| Honey | (lb.) | 440,199 | 331,296 | 188,168 | 67,149 | 80,506 |
| Live sheep | (number) | 14,758 | 486 | 544 | 1,456 | 2,510 |
| Canned meats | (cwt.) | 71,617 | 82,124 | 95,923 | 206,471 | 142,917 |
| Dehydrated meats | (cwt.) | 15,843 | 2,236 | 39 | ||
| Meat extract | (lb.) | 118,377 | 286,420 | 222,002 | 666,739 | 809,202 |
| Frozen and chilled meats | (cwt.) | 5,906,251 | 4,156,054 | 5,653,843 | 6,746,167 | 6,955,603 |
| Milk, dried and condensed | (lb.) | 24,545,704 | 18,429,814 | 33,835,430 | 38,008,445 | 44,753,710 |
| Sugar of milk | 810,780 | 1,373,668 | 1,713,600 | 1,337,672 | 1,131,776 | |
| Sausage-casings | (cwt.) | 40,813 | 38,249 | 40,978 | 48,322 | 43,629 |
| Cattle-hides | (number) | 528,157 | 304,848 | 329,089 | 392,322 | 472,972 |
| Calf-skins | 1,103,182 | 888,250 | 795,184 | 659,645 | 757,186 | |
| Opossum-skins | 82,970 | 307,896 | 663,740 | 392,596 | 692,908 | |
| Rabbit-skins | 11,190,294 | 13,886,065 | 17,670,078 | 15,755,939 | 16,654,496 | |
| Sheep skins and pelts | 15,156,536 | 15,240,690 | 15,228,737 | 15,479,233 | 17,040,138 | |
| Tallow | (cwt.) | 582,740 | 532,480 | 615,220 | 494,260 | 514,500 |
| Lard and refined animal fats | 19,385 | 30,048 | 46,266 | 20,017 | 37,090 | |
| Wool | (lb.) | 277,391,713 | 188,599,359 | 166,225,681 | 365,370,404 | 375,093,061 |
| Agricultural products— | ||||||
| Apples | (lb.) | 37,980,567 | 19,040 | 156,383 | 12,156,054 | 230,719 |
| Pears | 3,925,760 | 690 | 2,765 | 2,965 | 8,505 | |
| Peas | (cental) | 163,755 | 130,480 | 269,587 | 318,478 | 409,497 |
| Hops | (lb.) | 114,541 | 5,358 | 10,358 | 190 | 400 |
| Oatmeal | (lb.) | 5,132 | 6,756,042 | 1,792,956 | 2,409,975 | 5,505,682 |
| Onions | (ton) | 5,042 | 602 | 798 | 1,454 | 1,248 |
| Potatoes | 1,166 | 2,003 | 1,507 | 1,886 | 1,837 | |
| Seeds (grass and clover) | (cwt.) | 45,829 | 158,475 | 166,553 | 150,598 | 147,011 |
| Linen-flax (fibre and tow) | (cwt.) | 54,289 | 27,438 | 12,545 | 15,244 | |
| Phormium fibre and tow | (ton) | 1,593 | 52 | |||
| Miscellaneous— | ||||||
| Ale, stout, and elder | (gal.) | 19,029 | 175,558 | 250,028 | 252,630 | 209,241 |
| Footwear | (doz. prs) | 1 | 15,710 | 8,133 | 5,801 | 3,292 |
| Sugar | (cwt.) | 19,701 | 19,777 | 5,637 | 5,494 | 11,341 |
| Metals, scrap (not precious) | 17,020 | 987 | 2,343 | 5,732 | 253,329 | |
| Nails and tacks | (cwt.) | 210 | 67,360 | 5,003 | 2,333 | 4,745 |
| Blood and blood-and-bone manures | (ton) | 1,930 | 180 | 150 | 2 | |
The values of principal exports are given in the following table.
| Commodity (New Zealand Produce). | 1939. | 1944. | 1945.* | 1946.* | 1947.* |
|---|---|---|---|---|---|
*Provisional. | |||||
| The mine— | £ | £ | £ | £ | £ |
| Coal | 59,971 | 73,130 | 51,212 | 76,433 | 77,430 |
| Pumice, sand and stone | 11,172 | 10,393 | 9,203 | 12,195 | 11,720 |
| Gold | 1,628,526 | 1,423,556 | 1,262,884 | 1,134,783 | 1,035,406 |
| Scheelite | 7,728 | 56,006 | 25,972 | 4,700 | 5,975 |
| Silver | 35,159 | 26,641 | 10,437 | 13,947 | 25,794 |
| Cement | 33 | 9,548 | 2,639 | 2,632 | 10,432 |
| The fisheries— | |||||
| Fish | 162,430 | 128,821 | 187,505 | 225,599 | 358,241 |
| Oysters | 975 | 580 | 18 | 2,819 | 27 |
| Whale-oil | 12,990 | 4,811 | 9,779 | 34,333 | 48,769 |
| Commodity (New Zealand Produce). | 1939. | 1944. | 1945.* | 1946.* | 1947.* |
|---|---|---|---|---|---|
*Provisional. † Including items not enumerated. | |||||
| The forest— | £ | £ | £ | £ | £ |
| Kauri-gum | 112,650 | 74,426 | 94,287 | 111,915 | 120,256 |
| Timber, sawn and hewn | 155,652 | 59,727 | 71,422 | 162,354 | 184,451 |
| Cardboard, pasteboard, &c. | 105 | 120,749 | 142,699 | 78,181 | 14,885 |
| Pastoral products— | |||||
| Butter | 16,111,207 | 18,553,484 | 19,277,704 | 19,841,455 | 28,835,898 |
| Butterfat, dry | 7,471 | 6,238 | 2,356 | 22,007 | |
| Casein | 69,265 | 20,003 | 56,893 | 66,395 | 370,549 |
| Cheese | 5,869,890 | 7,443,632 | 9,519,363 | 8,448,321 | 11,621,088 |
| Eggs in shell | 900 | 162 | 555 | 526 | 740 |
| Honey | 12,376 | 13,435 | 7,511 | 2,516 | 3,053 |
| Foods, infants' and invalids' | 18,253 | 23,659 | 47,876 | 34,120 | 128,541 |
| Live sheep | 64,950 | 13,692 | 12,079 | 50,645 | 64,375 |
| Canned meats | 318,529 | 552,391 | 675,117 | 1,535,312 | 1,147,237 |
| Dehydrated meats | 218,953 | 25,038 | 605 | ||
| Meat extract | 9,032 | 55,934 | 40,509 | 135,766 | 237,717 |
| Frozen and chilled meats | 15,390,801 | 12,482,008 | 17,597,983 | 23,239,585 | 29,353,331 |
| Milk, dried and condensed | 377,506 | 534,716 | 1,021,128 | 1,198,282 | 1,651,396 |
| Sugar of milk | 24,413 | 57,532 | 71,903 | 60,399 | 56,202 |
| Sausage-casings | 698,317 | 1,027,517 | 1,087,407 | 1,393,061 | 1,526,924 |
| Cattle-hides | 505,149 | 468,353 | 649,135 | 938,198 | 1,999,228 |
| Calf-skins | 275,974 | 431,207 | 391,313 | 541,684 | 917,866 |
| Opossum-skins | 24,386 | 116,349 | 217,573 | 145,218 | 145,736 |
| Rabbit-skins | 262,904 | 974,909 | 1,204,791 | 1,451,301 | 1,120,219 |
| Sheep skins and pelts | 1,460,072 | 2,386,648 | 2,402,250 | 2,490,673 | 6,014,194 |
| Tallow | 456,527 | 608,263 | 846,818 | 1,063,156 | 2,366,742 |
| Lard and refined animal fats | 22,501 | 48,301 | 67,052 | 50,121 | 210,499 |
| Wool | 11,665,909 | 12,711,407 | 12,717,034 | 26,593,198 | 31,933,086 |
| Agricultural products— | |||||
| Biscuits | 294 | 632,398 | 926,615 | 167,469 | 29,188 |
| Apples | 520,170 | 286 | 2,059 | 153,353 | 4,067 |
| Pears | 54,534 | 17 | 59 | 55 | 193 |
| Peas | 154,580 | 271,988 | 517,101 | 662,256 | 894,075 |
| Oatmeal | 39 | 140,542 | 37,556 | 51,960 | 114,583 |
| Hops | 6,818 | 707 | 1,366 | 27 | 90 |
| Onions | 74,132 | 11,711 | 16,354 | 29,786 | 31,926 |
| Potatoes | 12,214 | 33,594 | 25,769 | 26,595 | 32,888 |
| Seeds (grass and clover) | 284,514 | 1,453,090 | 1,797,827 | 1,942,072 | 1,663,365 |
| Seeds (various) | 8,290 | 81,330 | 124,989 | 147,191 | 215,756 |
| Linen-flax (fibre and tow) | 511,758 | 252,258 | 119,248 | 140,265 | |
| Phormium, fibre and tow | 25,212 | 1,986 | |||
| Miscellaneous— | |||||
| Ale, stout, and cider | 4,465 | 38,502 | 55,181 | 57,945 | 48,398 |
| Dairying machinery | 35,334 | 17,889 | 20,208 | 11,730 | 59,922 |
| Fire-fighting appliances | 106,285 | 73,239 | 153,657 | 6,414 | |
| Nails and tacks | 355 | 162,581 | 12,726 | 6,955 | 11,803 |
| Electrical apparatus | 2,565 | 96,758 | 83,098 | 255,094 | 75,201 |
| Wireless apparatus | 2,971 | 8,185 | 327,825 | 122,465 | 4,562 |
| Blood - and blood-and-bone manures | 21,853 | 3,600 | 2,700 | 31 | |
| Other manures | 31,096 | 18 | 11 | 2,348 | |
| Metals, scrap (not precious) | 18,042 | 440 | 3,970 | 4,104 | 37,306 |
| Apparel and ready-made clothing | 382 | 338,309 | 582,350 | 584,624 | 181,121 |
| Leather | 3,530 | 6,127 | 13,693 | 61,771 | 67,947 |
| Footwear | 4 | 263,659 | 93,625 | 67,637 | 26,350 |
| Soap | 5,533 | 17,728 | 40,465 | 332,702 | 31,486 |
| Sugar | 15,743 | 30,597 | 9,502 | 9,567 | 24,482 |
| Ordnance stores, explosives, &c. | 6,960 | 5,222,123 | 1,833,974 | 110,470 | 159,753 |
| Totals, New Zealand produce† | 57,448,030 | 71,681,798 | 78,502,946 | 100,333,311 | 127,713,184 |
DESTINATION OF NEW ZEALAND EXPORTS.—The first exports from New Zealand went naturally to the earlier-developed sister colony, and for a considerable time Australia had a monopoly of our trade. In 1865, 70 per cent., and even in 1871, 44 per cent., of the total exports went to Australia. But since the establishment of direct shipping lines the United Kingdom has absorbed the bulk of New Zealand exports, having taken during the forty years 1875–1914, £365,880,997 (78 per cent.) of a grand total of exports amounting to £469,347,969. This percentage, prior to the war of 1914–18, did not vary greatly from year to year, but there have been considerable variations since 1914. In each of the three years 1915–17 approximately 80 per cent. of exports went to the United Kingdom, but there was a sudden drop to 64.1 per cent. in 1918. By 1921 the percentage had risen to 86.4, but a continuous decline then commenced, reaching a low point of 72.9 in 1928. Particularly high figures in this respect were recorded during the depression period, the peak being reached with 88.0 per cent. in 1932. From 1933 to 1937 the general trend was downwards, but the following year saw a sharp rise, with a further increase in 1940. The war years brought marked changes in the distribution of New Zealand's exports. The proportion sent to the United Kingdom fell steadily from 1940 to 1943, the fall in the latter year being particularly heavy. This was compensated for by appreciable increases in the export trade to Egypt, India and Pakistan, Canada, Russia (U.S.S.R.), and the United States of America. The year 1944 saw a substantial rise in the value of exports to the United Kingdom with a corresponding increase in the percentage, and this was maintained in 1945. A feature of the export trade in 1946 was the resumption of activities with European countries, notably France and Germany, and this resulted in a fall in the percentage exported to the United Kingdom despite an increase of £12,288,851 in value. The distribution of exports in 1947 was not dissimilar to that of the immediate pre-war years, the United Kingdom taking 77 per cent. of New Zealand's exports (80 per cent. in 1936–38), while exports to British Commonwealth countries accounted for 84 per cent. of total exports, as compared with 86 per cent. in 1936–38. With the return from the abnormal trading conditions that operated through the war years, exports to India and Pakistan have decreased substantially and are now comparable with pre-war figures.
It should be noted that exports to certain countries during the period 1940–45, particularly Egypt, Italy, and Algeria, and to a lesser extent India, consisted mainly of food, clothing, and munitions and war stores for the use of the Armed Forces. These supplies were exported on the requisition of, and paid for by the United Kingdom Government.
The nomenclature used in the following tables in regard to the countries of destination refers to status and territories in the years indicated and not necessarily to the present position.
The principal destinations of New Zealand's exports of merchandise (including re-exports) during the last twenty years are given in the table below.
| Year. | United Kingdom. | Canada. | Australia. | France. | Germany. | United States of America. | Other Countries.* | Total Merchandise Exports. |
|---|---|---|---|---|---|---|---|---|
* Including ships' stores. † Provisional. | ||||||||
| £ | £ | £ | £ | £ | £ | £ | £ | |
| 1928 | 40,510,075 | 2,469,150 | 2,902,655 | 1,800,897 | 1,290,071 | 4,160,315 | 2,437,218 | 55,570,381 |
| 1929 | 40,417,043 | 3,353,975 | 2,338,410 | 1,768,399 | 1,220,552 | 3,553,427 | 2,278,257 | 54,930,068 |
| 1930 | 36,015,128 | 2,539,212 | 1,562,281 | 519,727 | 401,084 | 2,116,752 | 1,786,333 | 44,940,517 |
| 1931 | 30,739,976 | 256,890 | 1,167,403 | 419,016 | 309,847 | 920,931 | 1,136,635 | 34,950,698 |
| 1932 | 31,344,670 | 244,160 | 1,444,860 | 508,960 | 289,917 | 690,015 | 1,037,337 | 35,609,919 |
| 1933 | 35,275,909 | 560,875 | 1,393,311 | 738,176 | 376,886 | 1,188,972 | 1,471,790 | 41,005,919 |
| 1934 | 38,629,240 | 697,865 | 1,882,516 | 1,228,699 | 944,310 | 1,250,364 | 2,709,853 | 47,342,847 |
| 1935 | 38,921,568 | 656,984 | 1,781,811 | 484,610 | 165,304 | 2,468,066 | 2,060,038 | 46,538,381 |
| 1936 | 45,492,989 | 1,103,008 | 1,843,475 | 1,646,168 | 272,481 | 2,877,752 | 3,516,067 | 56,751,940 |
| 1937 | 50,705,591 | 1,678,403 | 1,824,183 | 1,014,941 | 919,148 | 4,784,099 | 5,787,014 | 66,713,379 |
| 1938 | 48,897,990 | 1,127,124 | 2,189,454 | 1,015,456 | 890,976 | 1,421,630 | 2,833,653 | 58,376,283 |
| 1939 | 46,689,198 | 963,710 | 2,256,007 | 1,579,176 | 390,006 | 2,847,158 | 3,324,061 | 58,049,316 |
| 1940 | 64,129,106 | 1,709,169 | 2,159,339 | 716,752 | 2,825,898 | 2,200,869 | 73,741,133 | |
| 1941 | 52,395,538 | 2,822,334 | 2,400,266 | 5,190,613 | 4,670,662 | 67,479,413 | ||
| 1942 | 60,471,098 | 3,616,646 | 2,717,619 | 5,990,067 | 8,489,207 | 81,284,637 | ||
| 1943 | 46,367,940 | 4,535,207 | 2,849,125 | 6,385,402 | 11,724,924 | 71,862,598 | ||
| 1944 | 55,426,533 | 1,939,814 | 3,092,981 | 5,062,608 | 12,265,010 | 77,786,946 | ||
| 1945† | 58,634,107 | 2,230,907 | 4,353,977 | 9,776 | 7,949,030 | 8,358,634 | 81,536,431 | |
| 1946† | 70,922,958 | 2,803,282 | 3,627,323 | 3,465,375 | 1,639,129 | 9,715,755 | 9,133,343 | 101,307,165 |
| 1947† | 98,677,777 | 3,059,660 | 4,095,981 | 4,447,174 | 78,294 | 8,174,457 | 10,872,921 | 129,406,264 |
The principal “Other Countries” for the last five years are given in the following table.
| Year. | Egypt. | India and Pakistan. | Russia (U.S.S.R.) | Italy. | Belgium. | Netherlands. | Other, including Ships' Stores. | Total. |
|---|---|---|---|---|---|---|---|---|
* Provisional. | ||||||||
| £ | £ | £ | £ | £ | £ | £ | £ | |
| 1943 | 6,358,214 | 2,564,426 | 911,644 | 1,890,640 | 11,724,924 | |||
| 1944 | 5,289,021 | 4,068,326 | 64 | 886,558 | 2,021,041 | 12,265,010 | ||
| 1945* | 2,540,742 | 2,937,757 | 616,331 | 2,930 | 347 | 2,260,527 | 8,358,634 | |
| 1946* | 420,735 | 3,085,919 | 10,560 | 297,412 | 472,256 | 497,518 | 4,348,943 | 9,133,343 |
| 1947* | 201,110 | 491,387 | 504,607 | 665,590 | 1,991,010 | 1,717,409 | 5,301,808 | 10,872,921 |
The statistics quoted in the foregoing table indicate the destination of New Zealand exports as recorded by the Customs Department. In some instances the ultimate destination of exports is not known at the time of export, such goods being entered as exported to the country to which they are being shipped. This consideration applies more particularly to wool, considerable quantities of which are shipped to the United Kingdom, and, in normal times, subsequently re-exported to the Continent. It should be observed, however, that in all instances where the final destination is known at the time of export the exports are credited to that destination in the New Zealand trade statistics. It is possible, of course, that the destination of goods may be changed while in transit; and this, in fact, happens occasionally in the case of wool. In such cases the actual destination will be different from that to which the goods have been credited in the statistics; but it is quite impossible to keep a record of movements of this nature.
A further point of some importance is the fact that an appreciable quantity of wool is exported on an “optional” basis—United Kingdom, option Continent. In these cases, however, subsequent information is received by the Customs Department as to the actual destination of the goods, and the entries are amended.
It will be realized from the considerations outlined above that the actual final destinations of New Zealand exports may vary appreciably from the classification shown in the table. For these reasons it is probable that our exports to Continental countries are normally somewhat higher than the figures indicate; conversely, our exports to the United Kingdom for retention in that country are lower than the totals quoted in the table.
The table which follows shows for each of eleven years the percentage of total exports (excluding specie, and ships' stores), taken by each of the principal countries trading with New Zealand.
| Country. | 1937. | 1938. | 1939. | 1940. | 1941. | 1942. | 1943. | 1944. | 1945.* | 1946.* | 1947.* |
|---|---|---|---|---|---|---|---|---|---|---|---|
* Provisional. | |||||||||||
| Per Cent. | Per Cent. | Per Cent. | Per Cent. | Per Cent. | Per Cent. | Per Cent. | Per Cent. | Per Cent. | Per Cent. | Per Cent. | |
| United Kingdom | 76.30 | 84.17 | 80.99 | 87.60 | 78.15 | 74.97 | 64.88 | 71.75 | 72.36 | 70.35 | 76.66 |
| India and Pakistan | 0.20 | 0.24 | 0.25 | 1.06 | 1.55 | 1.28 | 3.59 | 5.27 | 3.63 | 3.06 | 0.38 |
| Union of South Africa | 0.05 | 0.03 | 0.10 | 0.03 | 0.04 | 0.02 | 0.04 | 0.06 | 0.23 | 0.06 | 0.05 |
| Canada | 2.53 | 1.94 | 1.67 | 2.34 | 4.21 | 4.48 | 6.35 | 2.51 | 2.75 | 2.78 | 2.38 |
| Australia | 2.75 | 3.77 | 3.91 | 2.95 | 3.58 | 3.37 | 3.99 | 4.00 | 5.37 | 3.60 | 3.18 |
| Fiji | 0.14 | 0.17 | 0.25 | 0.26 | 0.26 | 0.47 | 0.78 | 0.46 | 0.48 | 0.31 | 0.34 |
| Other British Commonwealth countries | 0.46 | 0.43 | 0.55 | 0.45 | 0.63 | 0.49 | 0.72 | 0.84 | 1.03 | 1.64 | 1.19 |
| Totals, British Commonwealth countries | 82.43 | 90.75 | 87.72 | 94.69 | 88.42 | 85.08 | 80.35 | 84.89 | 85.85 | 81.80 | 84.18 |
| Belgium | 1.03 | 0.63 | 1.52 | 0.47 | 1.55 | ||||||
| France | 1.53 | 1.75 | 2.74 | 0.98 | 3.44 | 3.45 | |||||
| Germany | 1.38 | 1.53 | 0.68 | 1.63 | 0.06 | ||||||
| Italy | 0.02 | 0.01 | 1.15 | 0.76 | 0.30 | 0.52 | |||||
| Russia (U.S.S.R.) | 0.99 | 2.43 | 1.28 | 0.01 | 0.39 | ||||||
| Egypt | 0.04 | 0.28 | 0.06 | 0.09 | 2.20 | 4.47 | 8.90 | 6.84 | 3.14 | 0.42 | 0.16 |
| Japan | 4.71 | 1.02 | 0.68 | 0.11 | 0.07 | ||||||
| United States of America | 7.20 | 2.45 | 4.94 | 3.86 | 7.74 | 7.43 | 8.93 | 6.55 | 9.81 | 9.64 | 6.35 |
| Other foreign countries | 1.66 | 1.58 | 1.66 | 0.27 | 0.58 | 0.59 | 0.54 | 0.57 | 0.44 | 2.29 | 3.34 |
| Totals, other countries | 17.57 | 9.25 | 12.28 | 5.31 | 11.58 | 14.92 | 19.65 | 15.11 | 14.15 | 18.20 | 15.82 |
Exports to each country, 1939 and 1944–47.—The table following shows the exports (including re-exports, but excluding specie) according to the countries of destination. Reference should be made to remarks made earlier regarding re-exports of New Zealand produce from the United Kingdom.
| Country. | 1939. | 1944. | 1945.* | 1946.* | 1947.* |
|---|---|---|---|---|---|
* Provisional. | |||||
| British Commonwealth of Nations, Protected States, and Trust Territories | £ | £ | £ | £ | £ |
| United Kingdom | 46,689,198 | 55,426,533 | 58,634,107 | 70,922,958 | 98,677,777 |
| Europe— | |||||
| Eire | 114 | 59,051 | 57,242 | 100,615 | 58,851 |
| Malta | 3 | 26,908 | 674 | 61 | |
| 117 | 59,051 | 84,150 | 101,289 | 58,912 | |
| Asia— | |||||
| Aden | 4,316 | 1,366 | |||
| Burma | 1,706 | 76,753 | 136,604 | ||
| Ceylon | 241 | 156,105 | 282,153 | 174,660 | 62,354 |
| Hong Kong | 24,458 | 5,571 | 185,462 | 118,955 | |
| India and Pakistan | 145,548 | 4,068,326 | 2,937,757 | 3,085,919 | 491,387 |
| Malaya and Singapore | 111,006 | 128,130 | 587,166 | 318,455 | |
| Palestine | 3 | 15 | 292 | 95,820 | 17,713 |
| Other | 33 | 25,059 | 6,941 | ||
| 282,995 | 4,228,762 | 3,353,903 | 4,230,839 | 1,153,775 | |
| Africa— | |||||
| Union of South Africa | 60,095 | 48,033 | 184,721 | 58,776 | 65,064 |
| Kenya and Uganda | 618 | 83,880 | 599 | 1,591 | |
| Other | 315 | 224 | 60 | 1,777 | 13,699 |
| 61,028 | 132,137 | 184,781 | 61,152 | 80,354 | |
| America— | |||||
| British West Indies | 62,850 | 43,274 | 133,598 | ||
| Canada | 963,710 | 1,939,814 | 2,230,907 | 2,803,282 | 3,059,660 |
| Other | 164 | 370 | 61 | 9,491 | 13,106 |
| 1,016,724 | 1,940,184 | 2,230,968 | 2,856,047 | 3,206,364 | |
| Pacific— | |||||
| Australia | 2,256,007 | 3,092,981 | 4,353,977 | 3,627,323 | 4,095,981 |
| Fiji | 143,098 | 356,607 | 386,532 | 307,736 | 441,099 |
| Gilbert and Ellice Islands | 5,990 | 707 | 22,650 | 79,990 | |
| Nauru Island | 5,237 | 11,973 | 27,555 | 65,556 | |
| Norfolk Island | 389 | 489 | 294 | 2,172 | 16,714 |
| Papua | 6,109 | 147 | 3,764 | ||
| Solomon Islands | 317 | 1,276 | 3,870 | 5,407 | |
| Tonga | 23,228 | 107,067 | 84,597 | 89,005 | 110,783 |
| Western Samoa | 75,511 | 233,830 | 232,933 | 209,087 | 349,348 |
| Other | 3,320 | 130 | 2,539 | 1,042 | 1,014 |
| 2,519,206 | 3,791,104 | 5,074,828 | 4,290,587 | 5,169,656 | |
| Other Countries | |||||
| Europe— | |||||
| Albania | 5,706 | 12,037 | |||
| Belgium | 874,620 | 2,930 | 472,256 | 1,991,010 | |
| Czechoslovakia | 20,129 | 32,039 | 8,603 | ||
| Denmark | 46,726 | 250,245 | 451,547 | ||
| Finland | 5,111 | 10,261 | 44,095 | ||
| France | 1,579,176 | 9,776 | 3,465,375 | 4,447,174 | |
| Germany | 390,006 | 1,639,129 | 78,294 | ||
| Greece | 35,119 | 82,783 | 86,807 | 106,176 | |
| Italy | 1,565 | 886,558 | 616,331 | 297,412 | 665,590 |
| Netherlands | 266,278 | 347 | 497,518 | 1,717,409 | |
| Norway | 916 | 72,514 | 73,446 | ||
| Poland | 86,712 | 14,472 | 83,184 | ||
| Portugal | 17,672 | 9,852 | 15,398 | ||
| Russia (U.S.S.R.) | 64 | 10,560 | 504,607 | ||
| Spain | 356,795 | ||||
| Sweden | 176,713 | 730 | 278,174 | 342,142 | |
| Switzerland | 2,194 | 2,396 | 72,877 | 274,960 | |
| Yugoslavia | 1,014 | 161,145 | 16,854 | ||
| Other | 17,485 | 15,174 | |||
| 3,521,436 | 969,405 | 632,510 | 7,733,137 | 10,847,700 | |
| Asia— | |||||
| China | 69,639 | 406 | 92,881 | 207,779 | |
| French Indo-China | 5,697 | 22,009 | |||
| Iraq | 19,247 | 7,819 | 686 | 1,872 | |
| Japan | 390,783 | 2,416 | 56,627 | ||
| Indonesia | 7,823 | 38,460 | 47,499 | 130,489 | |
| Philippines | 12,512 | 200 | 99,360 | ||
| Turkey | 44,983 | 28,024 | |||
| Other | 5,856 | 15,704 | 13,787 | ||
| 492,310 | 19,247 | 46,885 | 204,169 | 559,947 | |
| Africa— | |||||
| Algeria | 126,171 | ||||
| Egypt | 34,356 | 5,289,021 | 2,540,742 | 420,735 | 201,110 |
| Morocco | 15,892 | 162,923 | |||
| Other | 700 | 158 | 208 | 778 | 1,084 |
| 35,056 | 5,415,350 | 2,540,950 | 437,405 | 365,117 | |
| America— | |||||
| Argentina | 3,593 | 551 | 1,100 | 20,861 | 38,534 |
| Brazil | 9,361 | 645 | 1,994 | 5 | |
| Chile | 45 | 7,906 | 450 | ||
| Netherlands Antilles | 28,860 | ||||
| Panama Canal Zone | 67,027 | 224 | 7 | ||
| United States of America | 2,847,158 | 5,062,608 | 7,949,030 | 9,715,755 | 8,174,457 |
| Uruguay | 1,865 | 49 | 7,445 | 21,875 | |
| Other | 2,102 | 2,200 | 5,407 | 977 | |
| 2,931,151 | 5,063,159 | 7,953,024 | 9,759,592 | 8,265,165 | |
| Pacific— | |||||
| Hawaii | 55,822 | 277 | 2,254 | 10,333 | 84 |
| New Caledonia | 682 | 2,802 | 19,712 | 14,255 | 26,660 |
| Society Islands | 29,364 | 94,026 | 148,407 | 71,113 | 199,765 |
| Tuamotu Archipelago | 22,669 | 36,821 | 52,464 | 50,644 | |
| American Samoa | 14,742 | 88,865 | 87,300 | 67,445 | 73,595 |
| Other | 52 | 443 | 533 | 1,126 | 1,810 |
| 100,662 | 209,082 | 295,027 | 216,736 | 352,558 | |
| Ships' stores | 399,433 | 532,932 | 505,298 | 493,254 | 668,939 |
Destination of Main Exports.—Full details of quantities and values of commodities exported to various countries are given in Part I of the annual Statistical Report on Trade and Shipping, while in Part II of the same report values of exports of principal commodities to various countries are summarized. The table which follows shows quantities of New Zealand's principal export commodities sent to various destinations during the years 1939 and 1945–47, and, in addition, total value figures are given, together with the values for individual countries for 1947.
| Country to which exported. | 1939. | 1945.* | 1946.* | 1947.* | |
|---|---|---|---|---|---|
| Quantity. | Value. | ||||
*Provisional. | |||||
| Wool | |||||
| lb. | lb. | lb. | lb. | £ | |
| United Kingdom | 154,959,078 | 91,907,967 | 170,127,016 | 208,350,776 | 17,351,413 |
| India and Pakistan | 186,503 | 5,303,674 | 6,405,778 | 1,548,170 | 156,250 |
| Palestine | 541,725 | ||||
| Canada | 8,477,324 | 16,168,646 | 20,493,512 | 18,266,847 | 1,703,760 |
| Australia | 14,644,206 | 358,332 | 1,678,309 | 9,791,549 | 707,053 |
| Belgium | 17,974,138 | 4,124,651 | 13,822,600 | 1,225,314 | |
| Czechoslovakia | 546,713 | 39,489 | 53,180 | 4,535 | |
| Denmark | 812,009 | 2,565,304 | 3,664,160 | 440,858 | |
| France | 37,574,442 | 50,984,107 | 50,259,274 | 3,955,653 | |
| Germany | 5,545,100 | 29,099,298 | 102,255 | 10,520 | |
| Greece | 843,455 | 191,672 | 112,667 | 14,565 | |
| Italy | 35,845 | 341,342 | 3,917,412 | 447,812 | |
| Netherlands | 5,134,562 | 3,876,176 | 12,669,070 | 1,172,779 | |
| Poland | 2,007,928 | ||||
| Portugal | 366,962 | 95,189 | 130,812 | 15,398 | |
| Norway | 10,173 | 841,077 | 673,938 | 73,416 | |
| Russia (U.S.S.R.) | 5,188,858 | 498,567 | |||
| Sweden | 3,224,405 | 2,805,251 | 2,742,235 | 281,544 | |
| Spain | 4,476,131 | ||||
| Switzerland | 21,757 | 858,669 | 2,399,440 | 272,369 | |
| China | 1,231,558 | ||||
| Japan | 8,312,591 | ||||
| Egypt | 634,910 | 509,030 | 249,725 | 23,836 | |
| Morocco | 201,880 | 1,920,893 | 162,923 | ||
| United States of America | 14,428,149 | 52,465,305 | 64,895,475 | 38,950,482 | 3,379,796 |
| Other countries | 441,572 | 219,323 | 278,718 | 34,725 | |
| Total quantity | 277,391,713 | 166,225,681 | 365,370,404 | 375,093,061 | |
| Total value, £ | 11,665,909 | 12,717,034 | 26,593,198 | 31,933,086 | |
| Frozen and Chilled Meat | |||||
| Cwt. | Cwt. | Cwt. | Cwt. | £ | |
| United Kingdom | 5,876,242 | 5,596,004 | 6,715,818 | 6,941,698 | 29,302,502 |
| India and Pakistan | 183 | 37,302 | 23,415 | ||
| Canada | 9,963 | ||||
| United States of America | 12,501 | ||||
| Hawaii | 4,653 | ||||
| Pacific islands (other than Hawaii) | 1,447 | 8,394 | 5,494 | 8,182 | 29,318 |
| Other countries (including ships' stores) | 1,262 | 12,143 | 1,440 | 5,723 | 21,511 |
| Total quantity | 5,906,251 | 5,653,843 | 6,746,167 | 6,955,603 | |
| Total value, £ | 15,390,801 | 17,597,983 | 23,239,585 | 29,353,331 | |
| Butter | |||||
| Cwt. | Cwt. | Cwt. | Cwt. | £ | |
| United Kingdom | 2,391,512 | 2,064,205 | 1,952,729 | 2,437,046 | 27,516,242 |
| Hong Kong | 2,987 | 1,350 | 19,514 | ||
| India and Pakistan | 4,961 | 244 | 7,671 | 94,787 | |
| Malaya and Singapore | 6,563 | 3,310 | 42,595 | ||
| Union of South Africa | 5,600 | 1 | 14 | ||
| Australia | 3 | 16,663 | |||
| British West Indies | 7,765 | 3,223 | 9,687 | 107,818 | |
| Canada | 500 | 45,600 | 495,900 | ||
| China | 1,351 | 670 | 337 | 4,721 | |
| Indonesia | 15 | 1,781 | 59 | 909 | |
| Panama Canal Zone | 9,925 | ||||
| United Slates of America | 1,697 | 56,381 | 32,900 | 357,788 | |
| Hawaii | 5,976 | ||||
| Society Islands | 397 | 2,914 | 2,374 | 3,759 | 53,254 |
| Other countries (including ships' stores) | 4,045 | 2,413 | 1,810 | 10,747 | 142,356 |
| Total quantity | 2,443,297 | 2,069,532 | 2,035,875 | 2,552,467 | |
| Total value, £ | 16,111,207 | 19,277,704 | 19,841,455 | 28,835,898 | |
| Cheese | |||||
| Cwt. | Cwt. | Cwt. | Cwt. | £ | |
| United Kingdom | 1,676,320 | 1,727,701 | 1,513,579 | 1,739,222 | 11,610,366 |
| Hong Kong | 83 | ||||
| India and Pakistan | 87 | 259 | 1,689 | ||
| Malta | 4,937 | ||||
| British West Indies | 58 | 177 | 850 | 5,592 | |
| Canada | 145 | ||||
| Australia | 168 | ||||
| Fiji | 325 | 342 | 292 | 279 | 1,683 |
| Egypt | 14,774 | ||||
| Other countries (including ships' stores) | 71 | 760 | 869 | 269 | 1,758 |
| Total quantity | 1,677,257 | 1,748,514 | 1,514,917 | 1,740,879 | |
| Total value, £ | 5,869,890 | 9,519,363 | 8,448,321 | 11,621,088 | |
| Milk (Dried, Condensed, &c.) | |||||
| lb. | lb. | lb. | lb. | £ | |
| United Kingdom | 20,477,384 | 6,798,268 | 9,633,417 | 26,884,410 | 1,033,585 |
| Burma | 1,120 | 3,431,376 | 106,859 | ||
| Ceylon | 10,080 | 803,617 | 2,196,120 | 448,000 | 20,000 |
| Hong Kong | 41,010 | 700,264 | 277,980 | 8,797 | |
| India and Pakistan | 315,766 | 15,945,628 | 9,605,804 | 3,479,972 | 131,322 |
| Malaya and Singapore | 3,104,302 | 2,551,584 | 7,779,582 | 6,029,452 | 191,128 |
| Palestine | 248,000 | 215,040 | 10,825 | ||
| British West Indies | 18,032 | 341,040 | 13,398 | ||
| Australia | 88,156 | 5,943,673 | 605,785 | 119,092 | 4,769 |
| Fiji | 7,195 | 115,673 | 268,223 | 11,686 | |
| Western Samoa | 25,191 | 69,010 | 106,029 | 4,390 | |
| Greece | 1,290 | 64 | |||
| China | 119,516 | 352,138 | 200,097 | 6,606 | |
| Indonesia | 3,360 | 240,000 | 9,984 | 346 | |
| Egypt | 893,847 | 5,339,504 | 1,881,600 | 69,747 | |
| Panama Canal Zone | 78,400 | ||||
| Society Islands | 224,264 | 413,100 | 329,940 | 518,868 | 19,061 |
| Other countries (including ships' stores) | 30,728 | 300,430 | 977,891 | 541,257 | 18,822 |
| Total quantity | 24,545,704 | 33,835,430 | 38,008,445 | 44,753,710 | |
| Total value, £ | 377,506 | 1,021,128 | 1,198,282 | 1,651,396 | |
| Tallow | |||||
| Ton. | Ton. | Ton. | Ton. | £ | |
| United Kingdom | 19,741 | 16,444 | 18,368 | 25,481 | 2,345,516 |
| India and Pakistan | 4,815 | 913 | 263 | ||
| Canada | 555 | 5,056 | 4,868 | 120 | 10,457 |
| Fiji | 212 | 182 | 168 | 124 | 10,769 |
| Belgium | 336 | ||||
| Germany | 1,740 | ||||
| Netherlands | 411 | ||||
| Siam | 254 | ||||
| United States of America | 566 | 8,166 | 835 | ||
| Other countries | 507 | 211 | |||
| Total quantity | 29,137 | 30,761 | 24,713 | 25,725 | |
| Total value. £ | 456,527 | 846,818 | 1,063,156 | 2,366,742 | |
| Cattle-hides | |||||
| Number. | Number. | Number. | Number. | £ | |
| United Kingdom | 95,497 | 137,383 | 172,564 | 218,984 | 961,871 |
| India and Pakistan | 6,367 | ||||
| Canada | 93,697 | 6,300 | 937 | 500 | 1,940 |
| Australia | 91,693 | 151,002 | 110,273 | 52,781 | 188,207 |
| Belgium | 70,406 | 2,000 | 27,886 | 114,966 | |
| Denmark | 14,087 | ||||
| Finland | 3,792 | 2,808 | 12,490 | ||
| France | 21,674 | 4,794 | 24,101 | 102,208 | |
| Germany | 18,038 | ||||
| Netherlands | 3,400 | 1,492 | 87,368 | 342,894 | |
| Turkey | 18,754 | 7,996 | 28,024 | ||
| Japan | 3,343 | ||||
| United States of America | 101,152 | 34,404 | 81,508 | 5,395 | 21,632 |
| Other countries | 4,411 | 45,153 | 224,996 | ||
| Total quantity | 528,157 | 329,089 | 392,322 | 472,972 | |
| Total value, £ | 505,149 | 649,135 | 938,198 | 1,999,228 | |
| Calfskins | |||||
| Number. | Number. | Number. | Number. | £ | |
| United Kingdom | 95,183 | 227,375 | 69,399 | 190,392 | 214,942 |
| Canada | 191,517 | 160,067 | 230,840 | 145,564 | 189,715 |
| Australia | 25,467 | 100,247 | 236,334 | 109,120 | 123,671 |
| Belgium | 30,200 | 13,500 | 69,922 | 85,241 | |
| Netherlands | 26,869 | 6,563 | 74,565 | 86,163 | |
| United States of America | 733,946 | 307,495 | 101,389 | 138,910 | 183,670 |
| Other countries | 1,620 | 28,713 | 34,464 | ||
| Total quantity | 1,103,182 | 795,184 | 659,645 | 757,180 | |
| Total value, £ | 275,974 | 391,313 | 541,684 | 917,866 | |
| Opossum-skins | |||||
| Number. | Number. | Number. | Number. | £ | |
| United Kingdom | 46,429 | 41,021 | 146,522 | 148,770 | 46,471 |
| Australia | 13 | 21,104 | 4,554 | 11,170 | 5,018 |
| United States of America | 36,528 | 601,615 | 241,020 | 530,010 | 93,353 |
| Other countries | 500 | 2,958 | 894 | ||
| Total quantity | 82,970 | 663,740 | 392,596 | 692,908 | |
| Total value, £ | 24,386 | 217,573 | 145,218 | 145,736 | |
| Rabbit-shins | |||||
| Number. | Number. | Number. | Number. | £ | |
| United Kingdom | 450,263 | 3,499,984 | 3,928,708 | 3,582,683 | 295,217 |
| Canada | 29,940 | 1,103,378 | 931,865 | 38,785 | 6,340 |
| Australia | 1,409,375 | 28,600 | 4,575 | ||
| Belgium | 201,971 | 2,365 | 386,780 | 32,800 | |
| France | 88,356 | 28,692 | 4,104 | ||
| Indonesia | 18,439 | ||||
| United States of America | 8,991,950 | 13,066,716 | 10,893,001 | 12,588,956 | 777,183 |
| Total quantity | 11,190,294 | 17,670,078 | 15,755,939 | 16,654,496 | |
| Total value, £ | 262,904 | 1,204,791 | 1,451,301 | 1,120,219 | |
| Sheep-skins (with Wool) | |||||
| Number. | Number. | Number. | Number. | £ | |
| United Kingdom | 500,433 | 100,430 | 171,336 | 454,495 | 273,023 |
| Canada | 178,621 | 258,149 | 86,396 | 133,974 | 65,261 |
| Australia | 18,615 | 1,385 | 1,858 | 477 | |
| Belgium | 11,886 | 17,057 | 152,058 | 90,586 | |
| France | 604,145 | 149,550 | 411,813 | 175,905 | |
| Germany | 65,444 | ||||
| Netherlands | 22,022 | 8,118 | |||
| United States of America | 531,506 | 546,373 | 351,099 | 255,314 | 140,607 |
| Other countries | 6,277 | 2,637 | |||
| Total quantity | 1,932,672 | 904,952 | 784,941 | 1,415,789 | |
| Total value, £ | 391,245 | 402,644 | 257,566 | 748,496 | |
| Sheep-skins (without Wool) | |||||
| Number. | Number. | Number. | Number. | £ | |
| United Kingdom | 2,404,083 | 3,849,331 | 4,468,278 | 8,300,939 | 2,613,435 |
| Canada | 91,318 | 365,399 | 197,583 | 172,150 | 52,384 |
| Australia | 270,063 | 450,115 | 138,328 | 38,650 | |
| Belgium | 624,451 | 24,168 | 220,727 | 411,418 | 183,453 |
| France | 39,565 | 36,156 | 248,244 | 107,167 | |
| Netherlands | 12,610 | 284,178 | 49,095 | 19,433 | |
| Japan | 78,288 | ||||
| United States of America | 9,698,868 | 10,084,887 | 8,891,130 | 6,205,527 | 2,213,856 |
| Other countries | 4,618 | 146,125 | 98,648 | 37,320 | |
| Total quantity | 13,223,864 | 14,323,785 | 14,694,292 | 15,624,349 | |
| Total value, £ | 1,068,827 | 1,999,606 | 2,233,107 | 5,265,698 | |
| Sausage-casings | |||||
| lb. | lb. | lb. | lb. | £ | |
| United Kingdom | 1,728,054 | 1,578,108 | 2,436,493 | 2,347,761 | 709,964 |
| Canada | 1,362,928 | 1,003,612 | 1,149,224 | 1,079,814 | 403,439 |
| Australia | 149,666 | 369,192 | 293,453 | 346,219 | 30,776 |
| United States of America | 1,330,021 | 1,634,614 | 1,521,136 | 1,107,596 | 381,057 |
| Other countries | 1,521 | 3,958 | 11,718 | 5,025 | 1,688 |
| Total quantity | 4,572,190 | 4,589,484 | 5,412,024 | 4,886,415 | |
| Total value, £ | 698,317 | 1,087,407 | 1,393,061 | 1,526,924 | |
| Peas (Unprepared) | |||||
| Cental. | Cental. | Cental. | Cental. | £ | |
| United Kingdom | 98,763 | 159,655 | 148,651 | 317,041 | 643,199 |
| Ceylon | 77,270 | 2,372 | 1,676 | 3,758 | |
| Eire | 1,640 | 8,039 | 1,814 | 3,976 | |
| Malaya and Singapore | 14,902 | ||||
| Union of South Africa | 6,483 | 4,290 | 17,072 | 1,884 | 5,417 |
| Hong Kong | 3,459 | 52,279 | |||
| Australia | 47,354 | 20,453 | 58,929 | 53,603 | 153,933 |
| Belgium | 4,754 | 6,102 | 18,309 | 35,787 | |
| France | 3,006 | 1,257 | 5,112 | ||
| United States of America | 4,113 | 2,153 | 6,109 | 1,014 | 1,644 |
| Other countries | 2,283 | 667 | 1,017 | 12,899 | 41,249 |
| Total quantity | 163,755 | 269,587 | 318,478 | 409,497 | |
| Total value, £ | 154,580 | 517,101 | 662,256 | 894,075 | |
| Apples (Fresh) | |||||
| lb. | lb. | lb. | lb. | £ | |
| United Kingdom | 24,814,520 | 11,702,968 | |||
| Malaya and Singapore | 100,800 | ||||
| Canada | 2,354,520 | ||||
| Fiji | 136,132 | 117,631 | 400,666 | 192,540 | 3,393 |
| Western Samoa | 13,909 | 24,472 | 19,820 | 15,963 | 298 |
| France | 2,076,720 | ||||
| Germany | 4,232,120 | ||||
| Netherlands | 1,519,640 | ||||
| Sweden | 1,902,840 | ||||
| Indonesia | 97,400 | ||||
| Philippine Islands | 44,000 | ||||
| Brazil | 680,000 | ||||
| Other countries, (including ships' stores) | 10,673 | 14,280 | 32,600 | 22,216 | 376 |
| Total quantity | 37,983,274 | 156,383 | 12,156,054 | 230,719 | |
| Total value, £ | 520,204 | 2,059 | 153,353 | 4,067 | |
| Seeds (Grass and Clover) | |||||
| Cwt. | Cwt. | Cwt. | Cwt. | £ | |
| United Kingdom | 12,140 | 96,661 | 83,913 | 68,483 | 1,039,949 |
| Eire | 2,909 | 4,080 | 2,437 | 43,420 | |
| Union of South Africa | 669 | 107 | 777 | 3,666 | |
| Canada | 1,564 | 3,564 | 2,460 | 3,857 | 51,035 |
| Australia | 19,526 | 34,514 | 31,357 | 19,312 | 152,558 |
| Belgium | 40 | 4,714 | 26,832 | 141,899 | |
| France | 5,046 | 939 | 8,040 | 57,038 | |
| Netherlands | 445 | 301 | 5,415 | 9,013 | 79,815 |
| United States of America | 11,486 | 23,302 | 14,741 | 5,098 | 57,469 |
| Other countries | 269 | 149 | 2,979 | 3,162 | 36,516 |
| Total quantity | 40,139 | 166,553 | 150,598 | 147,011 | |
| Total value, £ | 285,475 | 1,797,827 | 1,942,072 | 1,663,365 | |
| Timber (Sawn and Hewn) | |||||
| Sup. ft. | Sup. ft. | Sup. ft. | Sup. ft. | £ | |
| United Kingdom | 136,932 | 1,584 | 112,308 | 2,547 | |
| Australia | 11,824,388 | 2,737,411 | 6,989,480 | 8,181,754 | 149,720 |
| Fiji | 20,002 | 2,773 | 500 | 58,500 | 1,670 |
| Nauru Island | 3,053 | 120,233 | 9,494 | ||
| Tonga | 159,072 | 110,915 | 179,236 | 39,956 | 1,355 |
| Western Samoa | 1,067,901 | 736,855 | 816,167 | 1,121,514 | 30,662 |
| Other countries | 4,854 | 14,742 | 5,015 | 35,842 | 1,554 |
| Ships' stores | 118,478 | 128,325 | 169,755 | 64,761 | 2,624 |
| Total quantity | 13,334,680 | 3,731,031 | 8,161,737 | 9,734,868 | |
| Total value, £ | 156,696 | 73,857 | 166,077 | 199,626 | |
EXPORTS FOR YEARS ENDED 30th JUNE.—As indicated elsewhere in this section (page 214) farm products account for an extremely high proportion of exports from New Zealand. The farm-production export season fits much more closely to a June year than to a calendar year. The flush of the dairy-production season is spread over the months of October to March, while the whole harvest season, and most of the wool-selling season, occur in the early months of the calendar year. By 30th June, in normal times, the great bulk of the season's farm-produce destined for export is shipped, except held-over wool and a certain amount of dairy-produce and frozen meat kept in cool store to equalize shipments. It is desirable, therefore, for some purposes to tabulate New Zealand exports for years ending in June instead of December, a desideratum which, it may be observed, applies to most countries in the Southern Hemisphere.
EXPORTS OF NEW ZEALAND PRODUCE (QUANTITIES) FOR YEARS ENDED 30TH JUNE
| Commodity. | 1943–44. | 1944–45. | 1945–46.* | 1946–47.* | 1947–48.* | |
|---|---|---|---|---|---|---|
*Provisional. | ||||||
| Butter | cwt. | 2,071,782 | 2,422,940 | 2,110,571 | 2,354,990 | 2,541,099 |
| Butterfat, dry | cwt. | 7,153 | 368 | 430 | ||
| Casein | cwt. | 12,549 | 14,992 | 14,300 | 43,418 | 75,802 |
| Cheese | cwt. | 1,599,999 | 1,860,819 | 1,568,508 | 1,766,238 | 1,664,521 |
| Fish | cwt. | 24,560 | 26,468 | 32,731 | 48,805 | 60,343 |
| Honey | lb. | 77,400 | 285,816 | 173,838 | 69,635 | 90,130 |
| Beef, frozen | cwt. | 59,826 | 125,953 | 856,845 | 1,094,012 | 1,259,597 |
| Lamb, frozen | cwt. | 2,702,278 | 4,035,792 | 3,235,528 | 3,482,933 | 3,714,086 |
| Mutton, frozen | cwt. | 533,430 | 1,844,591 | 1,185,773 | 1,673,195 | 1,427,341 |
| Pork, frozen | cwt. | 4,127 | 53,485 | 204,667 | 111,337 | 217,499 |
| Veal, frozen | cwt. | 113,793 | 136,480 | 123,308 | 160,621 | 156,666 |
| Other frozen meats | cwt. | 209,227 | 191,427 | 263,179 | 319,210 | 392,007 |
| Meats, dehydrated | cwt. | 36,092 | 15,221 | 39 | ||
| Meats, canned | cwt. | 165,369 | 55,790 | 178,623 | 173,260 | 123,172 |
| Meat-extract | lb. | 956,135 | 152,468 | 357,109 | 700,838 | 837,344 |
| Sausage-casings | lb. | 4,163,157 | 4,720,360 | 4,609,852 | 5,279,209 | 5,576,780 |
| Milk, preserved | lb. | 1,279,154 | 6,122,930 | 13,965,084 | 19,735,919 | 18,054,200 |
| Milk, dried | lb. | 15,256,285 | 22,344,023 | 18,218,964 | 32,545,543 | 32,700,232 |
| Apples, fresh | lb. | 9,360 | 153,063 | 5,051,734 | 7,172,453 | 35,697,266 |
| Pears, fresh | lb. | 1,020 | 1,790 | 3,090 | 6,005 | 883,455 |
| Peas | Cental | 120,731 | 167,558 | 354,277 | 264,633 | 559,819 |
| Hops | lb. | 165,107 | 7,817 | 6,235 | ||
| Potatoes | cwt. | 39,708 | 35,519 | 31,849 | 39,792 | 38,252 |
| Calf-skins | No. | 950,878 | 774,566 | 868,345 | 753,958 | 848,437 |
| Cattle-hides | No. | 392,099 | 275,583 | 359,948 | 403,642 | 481,875 |
| Rabbit-skins | No. | 15,362,540 | 13,447,257 | 18,002,058 | 14,927,438 | 15,440,861 |
| Opossum-skins | No. | 243,782 | 546,850 | 382,914 | 822,623 | 305,252 |
| Sheep-skins, with wool | No. | 778,140 | 939,907 | 679,582 | 1,247,829 | 1,175,420 |
| Sheep-skins, without wool | No. | 13,448,425 | 16,226,990 | 12,456,685 | 15,436,807 | 15,396,129 |
| Other hides and skins | No. | 87,420 | 111,665 | 115,347 | 185,555 | 146,226 |
| Wool | bale | 752,082 | 386,972 | 880,940 | 1,268,366 | 1,296,570 |
| Linen-flax (fibre and tow) | cwt. | 47,894 | 39,587 | 26,922 | 14,362 | 9,745 |
| Seeds, grass and clover | cwt. | 107,403 | 158,952 | 188,570 | 140,141 | 157,945 |
| Tallow | ton | 35,162 | 30,130 | 25,743 | 25,911 | 22,330 |
| Coal | ton | 33,090 | 31,366 | 18,913 | 37,943 | 22,506 |
| Kauri-gum | ton | 1,081 | 1,405 | 885 | 1,427 | 923 |
| Gold | oz. | 146,493 | 137,312 | 110,942 | 107,565 | 90,123 |
| Silver | oz. | 214,392 | 252,625 | 4,441 | 109,738 | 152,471 |
| Timber, sawn | sup. ft. | 3,558,298 | 3,264,978 | 6,483,743 | 8,724,846 | 13,054,712 |
| Sugar of milk | lb. | 1,173,592 | 1,865,024 | 1,200,864 | 1,354,824 | 1,378,916 |
EXPORTS OF NEW ZEALAND PRODUCE (VALUES) FOR YEARS ENDED 30TH JUNE
| Commodity. | 1943–44. | 1944–45. | 1945–46. | 1946–47.* | 1947–48.* |
|---|---|---|---|---|---|
* Provisional † Including commodities not enumerated. | |||||
| £ | £ | £ | £ | £ | |
| Butter | 15,019,292 | 21,708,741 | 19,706,460 | 25,080,555 | 31,491,654 |
| Butterfat, dry | 64,980 | 3,840 | 4,453 | ||
| Casein | 39,401 | 52,817 | 51,497 | 314,785 | 542,518 |
| Cheese | 7,268,905 | 9,905,110 | 8,540,756 | 11,176,711 | 12,254,361 |
| Fish | 126,401 | 139,409 | 229,126 | 301,130 | 436,701 |
| Honey | 3,144 | 11,792 | 6,765 | 2,664 | 3,281 |
| Beef, frozen | 144,169 | 286,318 | 2,255,115 | 3,253,058 | 4,005,018 |
| Lamb, frozen | 9,388,201 | 14,577,700 | 12,573,110 | 16,994,286 | 19,195,113 |
| Mutton, frozen | 930,168 | 3,272,283 | 2,369,515 | 4,197,082 | 3,859,395 |
| Pork, frozen | 17,154 | 218,134 | 880,841 | 579,277 | 1,248,462 |
| Veal, frozen | 260,937 | 295,360 | 270, 828 | 519,512 | 521,235 |
| Other frozen meats | 581,155 | 643,774 | 898,804 | 1,330,305 | 1,837,860 |
| Meats, dehydrated | 555,646 | 199,964 | 605 | ||
| Meats, canned | 926,845 | 404,553 | 1,243,469 | 1,401,411 | 952,742 |
| Meat-extract | 186,515 | 31,398 | 75,694 | 181,475 | 230,372 |
| Sausage-casings | 1,037,783 | 1,109,254 | 1,143,644 | 1,576,336 | 2,115,568 |
| Milk, preserved | 48,162 | 184,220 | 406,611 | 610,229 | 594,107 |
| Milk, dried | 404,271 | 660,200 | 586,916 | 1,194,638 | 1,314,243 |
| Biscuits | 1,489,758 | 672,776 | 466,611 | 102,760 | 31,666 |
| Apples, fresh | 147 | 2,057 | 67,669 | 86,812 | 780,386 |
| Pears, fresh | 25 | 36 | 58 | 150 | 21,722 |
| Peas | 198,455 | 327,953 | 680,986 | 616,432 | 1,194,726 |
| Hops | 18,198 | 1,030 | 825 | ||
| Potatoes | 31,898 | 29,623 | 25,770 | 30,928 | 34,943 |
| Calf-skins | 460,884 | 375,107 | 431,860 | 753,077 | 1,194,863 |
| Cattle-hides | 619,586 | 455,183 | 727,982 | 1,332,852 | 2,098,088 |
| Rabbit-skins | 1,232,724 | 863,943 | 1,337,292 | 1,313,318 | 977,105 |
| Opossum-skins | 102,516 | 162,320 | 159,528 | 202,828 | 71,482 |
| Sheep-skins, with wool | 391,199 | 433,336 | 238,980 | 552,776 | 734,029 |
| Sheep-skins, without wool | 1,832,475 | 2,273,494 | 1,774,616 | 4,105,135 | 5,010,651 |
| Other hides and skins | 110,142 | 147,936 | 152,043 | 224,009 | 116,187 |
| Wool | 16,310,924 | 9,123,513 | 20,642,538 | 32,878,666 | 42,849,114 |
| Linen-flax (fibre and tow) | 437,279 | 373,981 | 253,233 | 133,154 | 79,098 |
| Seeds, grass and clover | 915,861 | 1,516,647 | 2,043,625 | 2,077,940 | 1,359,657 |
| Tallow | 849,089 | 788,211 | 838,341 | 1,771,290 | 2,280,575 |
| Coal | 66,538 | 63,778 | 50,001 | 103,446 | 64,045 |
| Kauri-gum | 72,750 | 103,040 | 72,128 | 137,090 | 97,583 |
| Gold | 1,507,431 | 1,424,630 | 1,173,235 | 1,136,263 | 940,532 |
| Silver | 22,672 | 26,785 | 478 | 24,110 | 38,025 |
| Machinery and machines | 314,829 | 354,113 | 859,301 | 273,202 | 249,569 |
| Timber, sawn | 52,545 | 52,432 | 131,707 | 166,482 | 285,952 |
| Sugar of milk | 48,074 | 77,656 | 52,943 | 64,463 | 70,002 |
| Totals† | 70,216,877 | 80,826,843 | 89,043,041 | 120,735,457 | 145,043,498 |
RE-EXPORTS.—Until recent years the forwarding trade of New Zealand has never been of great significance. The bulk of the total amount is made up by various classes of machinery, hardware, metal manufactures, motor-vehicles, textiles, and also items such as electrical apparatus, bunker fuel oil, motor-spirits and oil, and films. Munitions and war stores comprised the bulk of the largo totals shown in 1943, 1944, and 1945.
There is a genuine entrepot trade with the islands of the Pacific, the amount of which is, however, comparatively small. Exports to Cook Islands and Niue, which are treated as part of New Zealand, are not included in the figures of either exports or re-exports.
RE-EXPORTS (EXCLUDING SPECIE) FROM NEW ZEALAND
| £ | |
|---|---|
*Provisional. | |
| 1927 | 925,121 |
| 1928 | 910,016 |
| 1929 | 754,050 |
| 1930 | 731,111 |
| 1931 | 631,454 |
| 1932 | 633,532 |
| 1933 | 597,168 |
| 1934 | 571,554 |
| 1935 | 486,648 |
| 1936 | 488,135 |
| 1937 | 505,322 |
| 1938 | 575,657 |
| 1939 | 601,286 |
| 1940 | 767,597 |
| 1941 | 532,477 |
| 1942 | 739,063 |
| 1943 | 1,627,900 |
| 1944 | 6,105,148 |
| 1945* | 3,033,485 |
| 1946* | 973,854 |
| 1947* | 1,693,080 |
The destination of this re-export trade is shown in the following table.
| Country. | 1943. | 1944. | 1945.* | 1946.* | 1947.* |
|---|---|---|---|---|---|
*Provisional. | |||||
| £ | £ | £ | £ | £ | |
| United Kingdom | 25,948 | 1,644,531 | 248,722 | 47,293 | 284,746 |
| Hong Kong | 545 | 41,303 | |||
| India and Pakistan | 158 | 1,848,245 | 400,016 | 140,509 | 4,477 |
| Canada | 112 | 100 | 78,926 | 1,782 | 10,160 |
| Australia | 90,039 | 633,500 | 945,432 | 126,413 | 350,027 |
| Fiji | 130,859 | 154,332 | 123,733 | 74,751 | 98,665 |
| Tonga | 17,739 | 31,401 | 31,567 | 29,025 | 32,621 |
| Western Samoa | 41,395 | 65,354 | 84,150 | 52,931 | 67,938 |
| Italy | 740,818 | 604,280 | 20 | ||
| Indonesia | 23,554 | 17,463 | 125,090 | ||
| Algeria | 103,422 | ||||
| Egypt | 1,010,178 | 391,010 | 67,658 | 505 | |
| United States of America | 13,846 | 8,829 | 14,149 | 15,573 | 21,161 |
| Other countries | 6,950 | 48,508 | 20,330 | 77,145 | 103,073 |
| Ships' stores | 290,676 | 435,098 | 390,968 | 389,919 | 553,799 |
| Totals (excluding specie) | 1,627,900 | 6,105,148 | 3,033,485 | 973,854 | 1,693,080 |
EFFECT OF PRICES ON NEW ZEALAND EXPORTS. —The incidence of fluctuating prices over a number of years operates to render the currency aggregate of a country's trade of little value as an indicator of movement in the volume of trade—i.e., from a quantity point of view. Owing to the homogeneous nature of the bulk of New Zealand's exports it is possible, fortunately, in nearly every case to obtain the quantity exported as well as the value. By taking the average export values of any particular year, and applying to them the quantities exported for any other year, it is possible to obtain a reliable indication of changes in the volume of exports. A computation on the above basis is particularly applicable in the case of New Zealand, as normally, approximately 97 per cent. of the exports are treated quantitatively. Even in the war years, with high munition exports being recorded, this percentage did not fall below 90.
Comparisons of movement in the volume of exports are usually made over short periods in New Zealand, and therefore a computation of value of exports on the basis of values ruling in the previous year is of interest not only as indicating the effect of price-changes from year to year, but also in that it gives a reliable indication of year-to-year changes in the volume of exports. By establishing the relationship of the various years with their immediate predecessors it is possible to obtain link relatives, and by the application of these link relatives to a given base year or period a series of chain relatives (index numbers) permitting longer term comparisons is obtained. Index numbers on the base 1926=100, and computed by the method indicated above, are given in the next table. As explained earlier however, considerable quantities of New Zealand produce supplied to the United States Forces by way of reverse lend-lease during the years 1943–45 were not included in the export figures, and the volume index for those years has been affected accordingly.
| Year. | Total Exports (New Zealand Produce). | Effect of Price-changes. | Index Numbers of Volume of Exports (N.Z. Produce). | ||
|---|---|---|---|---|---|
| Recorded Value. | Value at Prices of Previous Year. | Gain. | Loss. | ||
*Provisional. | |||||
| £ | £ | £ | £ | (1926=100) | |
| 1926 | 44,339,183 | 54,696,306 | 10,357,123 | 100 | |
| 1927 | 47,571,233 | 48,094,196 | 522,963 | 109 | |
| 1928 | 54,660,365 | 49,091,466 | 5,568,899 | 112 | |
| 1929 | 54,176,013 | 56,465,248 | 2,289,235 | 116 | |
| 1930 | 44,209,406 | 55,655,835 | 11,446,429 | 119 | |
| 1931 | 34,319,244 | 44,630,116 | 10,310,872 | 120 | |
| 1932 | 34,976,387 | 38,128,569 | 3,152,182 | 133 | |
| 1933 | 40,408,751 | 40,999,141 | 590,390 | 156 | |
| 1934 | 46,771,293 | 39,039,192 | 7,732,101 | 151 | |
| 1935 | 46,051,733 | 45,694,497 | 357,236 | 147 | |
| 1936 | 56,263,805 | 49,172,261 | 7,091,544 | 157 | |
| 1937 | 66,208,057 | 55,966,791 | 10,241,266 | 157 | |
| 1938 | 57,800,626 | 62,933,946 | 5,133,320 | 149 | |
| 1939 | 57,448,030 | 58,702,703 | 1,254,673 | 151 | |
| 1940 | 72,973,536 | 63,558,891 | 9,414,645 | 167 | |
| 1941 | 66,946,936 | 65,141,681 | 1,805,255 | 149 | |
| 1942 | 80,545,574 | 78,539,132 | 2,006,442 | 175 | |
| 1943 | 70,234,698 | 67,369,998 | 2,864,700 | 147 | |
| 1944 | 71,681,798 | 68,097,289 | 3,584,509 | 142 | |
| 1945* | 78,502,946 | 71,538,264 | 6,964,682 | 142 | |
| 1946* | 100,333,311 | 94,816,069 | 5,517,242 | 172 | |
| 1947* | 127,713,184 | 106,122,465 | 21,590,719 | 182 | |
As mentioned previously, the comparison of each year with the preceding year brings out the gain or loss resulting from a rise or fall in prices. The gain or loss shown for individual years represents the increase or decrease in value due to rising or falling prices.
A study of the figures given in the Statistical Summary towards the end of this book, showing quantities and values of the principal commodities exported over a lengthy period of years, will give a good idea of the relative effects of increased volume and of price-movements in the huge growth of external trade over the period as measured by the total value of exports.
The following comparison between the year ended 30th June, 1939, and the two latest years—1946–47 and 1947–48—is of interest as showing the influence of altered prices on the value of exports of principal commodities. As mentioned earlier, June yearn are in many respects preferable to calendar years, as they enable a comparison between one season and another.
| Commodity. | Twelve Months ended 30th June, 1939. | Twelve Months ended 30th June 1947.* | Twelve Months, ended 30th June, 1948.* | ||
|---|---|---|---|---|---|
| Recorded Value. | Value at Prices of 1938–39. | Recorded Value. | Value at Prices of 1938–39. | ||
*Provisional. | |||||
| £ | £ | £ | £ | £ | |
| Butter | 15,813,144 | 25,080,555 | 15,126,572 | 31,491,654 | 16,321,987 |
| Cheese | 5,726,523 | 11,176,711 | 6,301,178 | 12,254,361 | 5,938,295 |
| Beef, frozen | 1,078,807 | 3,253,058 | 1,837,503 | 4,005,018 | 2,115,619 |
| Lamb, frozen | 8,768,236 | 16,994,286 | 11,783,250 | 19,195,113 | 12,565,273 |
| Mutton, frozen | 1,812,624 | 4,197,082 | 2,947,726 | 3,859,395 | 2,514,597 |
| Pork, frozen | 1,685,675 | 579,277 | 365,018 | 1,248,462 | 713,070 |
| Veal, frozen | 265,485 | 519,512 | 305,533 | 521,235 | 298,010 |
| Meats, canned | 274,499 | 1,401,411 | 779,386 | 952,742 | 554,072 |
| Sausage-casings | 672,700 | 1,576,336 | 810,359 | 2,115,568 | 856,036 |
| Milk, condensed | 99,242 | 610,229 | 335,511 | 594,107 | 306,921 |
| Milk, dried | 237,272 | 1,194,638 | 472,924 | 1,314,243 | 469,899 |
| Peas | 144,071 | 616,432 | 235,637 | 1,194,726 | 498,480 |
| Calf-skins | 238,737 | 753,077 | 166,127 | 1,194,863 | 186,945 |
| Cattle-hides | 475,227 | 1,332,852 | 354,321 | 2,098,088 | 422,995 |
| Rabbit-skins | 244,191 | 1,313,318 | 317,044 | 977,105 | 327,948 |
| Sheep-skins, with wool | 386,470 | 552,776 | 239,920 | 734,029 | 225,998 |
| Sheep-skins, without wool | 1,045,311 | 4,105,135 | 1,151,092 | 5,010,651 | 1,148,059 |
| Wool | 12,899,397 | 32,878,666 | 18,057,757 | 42,849,114 | 18,275,657 |
| Grass and clover seeds | 240,945 | 2,077,940 | 730,513 | 1,359,657 | 823,320 |
| Tallow | 453,490 | 1,771,290 | 414,651 | 2,280,575 | 357,345 |
| Gold | 1,505,818 | 1,136,263 | 947,906 | 940,532 | 794,200 |
| Totals of above items | 54,067,864 | 113,120,844 | 63,679,928 | 136,191,238 | 65,714,726 |
Exports during 1947–48 of the commodities dealt with realized £70,476,512 more than they would have at prices ruling in 1938–39. In 1946–47 the corresponding gain was £49,440,916. The aggregate recorded value of the items listed above represent 94 per cent. of the total exports of New Zealand produce for the year ended 30th June, 1943, the same percentage being recorded for the previous year.
EXPORTS TO COOK ISLANDS AND NIUE.—Trade with the Cook and other annexed Pacific Islands is not regarded as external to New Zealand, but merely as interchange between different parts of the country, and it is therefore not included in the account of the external trade. The trade of these islands with other countries is also omitted from New Zealand trade statistics. Separate returns are made of the transactions between New Zealand and the annexed islands, and exports to the islands are summarized below.
| Year. | Exports. |
|---|---|
*Provisional. | |
| £ | |
| 1937 | 87,658 |
| 1938 | 64,456 |
| 1939 | 67,968 |
| 1940 | 75,445 |
| 1941 | 75,814 |
| 1942 | 73,673 |
| 1943 | 103,760 |
| 1944 | 93,229 |
| 1945* | 132,880 |
| 1946* | 166,423 |
| 1947* | 254,461 |
Further particulars regarding the trade of the Islands will be found in the section of this book dealing with Island Territories.
THE statistics of imports are compiled from entries passed at the Customs. The value shown for all merchandise imported is the current domestic value in the country of export at the time of exportation, plus an allowance of 10 per cent. to cover freight, insurance, &c. Import values are expressed in terms of New Zealand currency. In Subsection A will be found (in conjunction with export figures) a summary of import totals for recent years, expressed both in New Zealand currency and in sterling, together with a series of index numbers of the volume of import trade and of the value, expressed in terms of gold, sterling, and New Zealand currency. Import totals are exclusive of specie, except where the contrary is expressly stated.
IMPORT CONTROL.—The Import Control Regulations, which came into force on 7th December, 1938, prohibit the importation of all goods into New Zealand except under a licence or unless exemption from a licence is granted by the Minister of Customs. Application for a licence must be made in the prescribed form to the Collector of Customs at the port at which it is desired to import the goods. The policy generally is to ensure that after overseas debt commitments have been met from the sterling funds the maximum funds available will be provided for the importation of essential commodities, with particular regard to the needs of primary and industrial production in New Zealand. During the war period the availability of supplies and shipping and the dictates of a war economy were also factors of material importance. In the consideration of a licence, existing stocks and probable requirements are taken into account, and also the possibility of manufacturing in New Zealand goods which were formerly imported. A further important feature of the policy has been the desire to give the greatest possible preference to the goods of United Kingdom manufacturers.
A summary of the operations of the licensing system from its inception in 1939 up to the 1947 period will be found in the 1946 Year-Book (pp. 846–849).
Licences for the 1948 period (1st January to 31st December) were not issued on the same scale as those for the 1947 period. In view of balance of payments problems affecting the sterling area, the United Kingdom towards the end of 1947 appealed to the New Zealand Government to confine its imports from scarce currency countries to strictly essential goods, and also to limit total imports to an amount which could be met from current income. The availability of 1948 import licences was extended to 28th February, 1949.
A new basis was fixed for the allocation of import licences for the 1949 period. Instead of 1938 imports being used as the basis for allocations supplemented by special licences, where practicable 1948 licences have been taken as the basis in dealing with 1949 allocations, but in some cases it has been necessary to take 1946 or 1947. All licences granted in the new base period—whether such licences were basic or otherwise, except those mentioned below, will be used as a basis for 1949 allocations. However, licences in the new base period which were granted under extraordinary circumstances—such as replacement of licences from an earlier period, no-remittance licences, and special licences covering orders for a particular contract—would not be included as part of the base-year licences to which current allocations were related.
The 1949 importing policy follows that of the 1948 licensing period when a limit was placed on imports to goods which could be paid for out of current income. Imports from scarce currency countries would continue to be confined to strictly essential goods, and, in view of the need to limit dollar expenditure, special considerations would apply in the case of imports from the dollar areas, or from countries where the expenditure of dollars was involved. Allocations would not be related to any base period, but would be made on the merits of individual applications, so far as this class of imports was concerned. A similar procedure would apply to imports from other sources when it was not possible to fix basic allocations.
A further important feature in connection with imports for 1949 was the provision for token imports of certain specified articles from the United Kingdom. No allocation for these imports was made in the licensing schedule. This provision was designed particularly to enable old-established business connections to be maintained. The Government, under this procedure, would give favourable consideration to applications which sought permission for entry of goods (limited to those set out in the list) up to 20 per cent. of the value of similar goods supplied in 1938 to the applicant by a manufacturer in the United Kingdom. In each case it would be necessary for the applicant to furnish, in support of his application, a certificate from the manufacturer to the effect that in 1938 he supplied the applicant with goods, as specified, to a stated f.o.b. value, for each class mentioned in the certificate. Unless this certificate was supplied, applications would not be considered.
Licences for 1949 would relate to the period from 1st January, 1949, to 31st December, 1949, but would be available also for the entry of goods imported not later than 28th February, 1950. They would not, however, be available for imports before 1st January, 1949. As a result of the exchange rate adjustment during 1948, the value of the licences which were granted in the new base period would, in determining the allocation for 1949, be reduced by one-fifth.
CLASSIFICATION OF IMPORTS.—A classification of imports under four broad divisions is given in the following table for the last eleven years. As in the case of exports where a similar table is shown, the figures for previous years have been amended to bring them into line with the classification employed by the United Kingdom Board of Trade. Imports by “parcels post” are classified under the several headings instead of being shown as a separate item as in the case of exports. To enable a proper comparison to be made over the period as a whole, imports of direct war materials as covered by the import item “Ordnance stores and military and naval equipment” have been eliminated from the table for the years 1940–45. Taken in conjunction with a table based on the same classification which is given in Subsection B (Exports), the figures show plainly how New Zealand's export trade is derived predominantly from the products of her primary industries, and her import trade consists very largely of manufactured or partly manufactured goods. The effect of the policy of import selection and control introduced towards the end of 1938 is particularly noticeable in the decline in the value of articles wholly or mainly manufactured between 1938 and 1940, but the further decline in 1941 and 1942 was mainly due to inability to secure supplies owing to war conditions. The sharp rise in 1943 and 1944 was largely attributable to the importation of commodities which became available under the Lend-lease Agreement. There was a sharp decline in 1945, but with the end of the war the figures for 1946 and 1947 in this connection rose to record proportions. It should be noted, however, that the figures for value cannot be taken as an accurate indication of changes in the volume of imports, as prices have risen very substantially, particularly during the last few years. The food, drink, and tobacco group has recorded a very sharp rise during the last two years, partly as a result of increased imports of certain commodities, but here again increased prices have been largely responsible.
| Year. | Food, Drink, and Tobacco. | Raw Materials and Articles mainly unmanufactured. | Articles wholly or mainly manufactured. | Live Animals. | Totals. |
|---|---|---|---|---|---|
*Munitions and war stores excluded for these years. †Provisional. | |||||
| £ | £ | £ | £ | £ | |
| 1937 | 6,701,299 | 1,790,796 | 47,601,362 | 67,238 | 56,160,695 |
| 1938 | 7,132,659 | 2,096,395 | 46,138,320 | 54,815 | 55,422,189 |
| 1939 | 6,516,990 | 2,263,007 | 40,553,474 | 53,712 | 49,387,183 |
| 1940* | 6,460,618 | 2,469,429 | 37,453,409 | 36,777 | 46,420,233 |
| 1941* | 6,082,987 | 2,493,606 | 35,278,019 | 19,296 | 43,873,908 |
| 1942* | 6,884,376 | 1,967,340 | 30,540,642 | 14,821 | 39,407,179 |
| 1943* | 5,740,390 | 2,807,418 | 40,021,689 | 18,185 | 48,587,682 |
| 1944* | 6,986,519 | 2,721,525 | 46,750,741 | 56,816 | 56,515,601 |
| 1945*† | 9,133,616 | 2,183,908 | 39,985,794 | 72,314 | 51,375,632 |
| 1946† | 10,162,464 | 2,761,698 | 58,590,526 | 119,426 | 71,634,114 |
| 1947† | 15,416,354 | 5,046,915 | 108,170,430 | 91,142 | 128,724,841 |
The principal groups of commodities normally imported are clothing and textiles, manufactured fibres and yarns, metals and machinery, sugar, tea, fruits (dried and fresh), wheat, alcoholic liquors, tobacco, paper and stationery, oils, motor-vehicles and accessories, chemicals and drugs, fertilizers, and timber. It will be seen from the above table that in most years articles wholly or mainly manufactured account for upwards of 80 per cent. of total merchandise imports. It should not be assumed, however, that items included in this class necessarily compete with New Zealand manufactures. In the first place, a large proportion of imports of manufactured commodities is comprised of goods which cannot be produced economically in New Zealand or products of industries which have never been established in New Zealand. A further point to be taken into consideration is the fact that many imports of manufactured or semi-manufactured goods form the raw material of further factory processes in the country—e.g., piece-goods.
Since 1914 the statistics of both imports and exports have been classified according to the nature of the commodity, the items being assembled in well-defined classes as shown in the following table, covering merchandise imports for the years 1945, 1946, and 1947.
| No. | Class. | 1945.* | 1940.* | 1947.* |
|---|---|---|---|---|
*Provisional. | ||||
| £ | £ | £ | ||
| I | Foodstuffs of animal origin (excluding live animals) | 312,936 | 367,588 | 1,030,103 |
| II | Foodstuffs of vegetable origin | 6,047,690 | 5,691,574 | 7,839,919 |
| III | Beverages (non-alcoholic) and substances used in making up the same | 1,231,828 | 1,558,442 | 2,814,793 |
| IV | Spirits and alcoholic liquors | 458,456 | 564,549 | 877,000 |
| V | Tobacco and preparations thereof | 1,106,530 | 1,980,311 | 2,854,539 |
| VI | Live animals | 72,314 | 119,426 | 91,142 |
| VII | Animal substances (mainly unmanufactured), not being foodstuffs | 58,600 | 99,900 | 402,212 |
| VIII | Vegetable substances and non-manufactured fibres | 753,328 | 1,108,344 | 1,948,094 |
| IXA | Apparel | 969,210 | 1,802,859 | 5,343,614 |
| IXB | Textiles | 10,258,584 | 12,046,841 | 22,729,632 |
| IXC | Manufactured fibres and yarns | 1,684,317 | 1,771,138 | 3,921,534 |
| X | Oils, fats, and waxes | 3,889,106 | 4,222,355 | 7,247,421 |
| XI | Paints and varnishes | 387,954 | 505,599 | 638,492 |
| XII | Stones and minerals used industrially | 149,040 | 211,991 | 556,025 |
| XIVA | Metal, unmanufactured, partly manufactured, and ores | 799,570 | 798,400 | 1,096,929 |
| XIVB | Metal manufactures, other than machinery and machines | 4,232,797 | 7,356,075 | 11,812,703 |
| XV | Machinery and machines | 7,837,851 | 11,548,810 | 18,418,780 |
| XVIA | Rubber and manufactures thereof (not including tires) | 335,418 | 660,848 | 970,044 |
| XVIB | Leather and manufactures thereof, including substitutes | 210,586 | 314,852 | 728,912 |
| XVIIA | Timber | 399,454 | 479,227 | 1,086,635 |
| XVIIB | Wood, cane, and wicker manufactures | 46,388 | 164,065 | 313,021 |
| XVIII | Earthenware, china, glass, stoneware, cement, and cement materials | 730,509 | 1,212,091 | 2,225,298 |
| XIXA | Paper | 1,396,385 | 2,214,374 | 5,024,437 |
| XIXB | Stationery | 1,010,150 | 1,444,044 | 2,444,139 |
| XX | Jewellery, time-pieces, fancy goods, and sporting requisites | 317,907 | 516,394 | 1,360,376 |
| XXI | Optical, surgical, and scientific instruments | 845,521 | 1,070,421 | 1,517,815 |
| XXIIA | Drugs, chemicals, and druggists' wares | 2,213,911 | 2,931,463 | 4,245,474 |
| XXIIB | Manures | 990,034 | 1,596,531 | 1,780,998 |
| XXIIIA | Vehicles and tires | 1,699,648 | 5,400,239 | 13,162,534 |
| XXIIIB | Miscellaneous | 4,626,906 | 1,875,363 | 4,242,226 |
| Total, merchandise | 55,072,928 | 71,634,114 | 128,724,841 | |
The next classification presented is that according to the purpose or use of commodities, particulars being given for the years 1939 and 1944–47. It should be mentioned that the absence of essential information in regard to actual purpose or use of a number of commodities has created certain difficulties, necessitating the employment of arbitrary decisions in some instances. Also, where certain commodities are used for more than one purpose it has not been possible to segregate the portion applicable to each. In such cases the whole import has been assessed according to the principal use of the article or commodity in New Zealand.
| Class of Merchandise. | 1939. | 1944. | 1945.* | 1946.* | 1947.* |
|---|---|---|---|---|---|
*Provisional. | |||||
| Producers' materials— | £ | £ | £ | £ | £ |
| Building and construction | 3,509,788 | 2,878,835 | 2,229,769 | 3,221,500 | 4,951,892 |
| Farm | 1,332,237 | 1,250,616 | 1,378,743 | 2,281,600 | 2,528,753 |
| Manufacturing— | |||||
| Food | 1,995,760 | 3,651,079 | 5,623,597 | 5,213,800 | 7,113,464 |
| Beverages | 28,940 | 161,162 | 97,536 | 141,700 | 239,274 |
| Tobacco | 550,324 | 628,109 | 1,054,702 | 1,241,500 | 1,108,833 |
| Textiles (apparel or household goods) | 4,394,355 | 10,683,545 | 10,390,780 | 11,821,900 | 20,654,652 |
| Other | 7,841,546 | 10,891,243 | 8,933,398 | 11,969,800 | 20,466,861 |
| Fuels and lubricants | 3,289,754 | 4,211,855 | 3,354,959 | 3,748,800 | 6,445,194 |
| Auxiliary aids to production | 1,081,266 | 1,898,474 | 1,111,505 | 1,088,800 | 3,474,002 |
| Producers' equipment— | |||||
| Farm | 1,159,171 | 1,761,626 | 1,536,867 | 2,123,700 | 2,142,024 |
| Commerce and industry | 5,568,248 | 7,910,343 | 6,987,892 | 10,797,500 | 16,924,838 |
| Transport equipment— | |||||
| Railway | 1,383,994 | 670,888 | 337,876 | 644,900 | 1,425,736 |
| Road | 5,595,957 | 2,435,847 | 1,589,701 | 5,283,100 | 12,931,377 |
| Other | 113,695 | 33,894 | 44,959 | 39,200 | 285,820 |
| Consumers' goods— | |||||
| Food | 1,688,760 | 1,180,209 | 1,190,204 | 1,268,000 | 2,374,446 |
| Beverages | 1,614,256 | 1,384,728 | 1,348,703 | 1,803,300 | 3,065,918 |
| Tobacco | 557,346 | 86,642 | 78,783 | 819,600 | 1,978,624 |
| Clothing and accessories | 1,869,575 | 466,921 | 521,612 | 1,158,100 | 4,717,792 |
| Household equipment | 2,112,350 | 1,553,990 | 1,092,965 | 2,287,800 | 6,826,445 |
| Other | 3,093,614 | 2,775,460 | 2,470,570 | 4,192,300 | 7,804,467 |
| Munitions and War Stores | 603,141 | 29,881,611 | 3,697,296 | 486,700 | 1,264,279 |
| Unclassified | 3,106 | 135 | 511 | 500 | 150 |
| Totals, merchandise imports | 49,387,183 | 86,397,212 | 55,072,928 | 71,634,100 | 128,724,841 |
In the next table particulars are given of New Zealand's import trade for the years 1939 and 1944–47 according to the stage of production or degree of manufacture of commodities, the divisions used, following the classification of the League of Nations, being “crude,” “simply transformed,” and “more elaborately transformed.” The inclusion of munitions and war stores during the war years has obscured the position, and in this and the following table these special items have been excluded for the years 1944 and 1945.
| — | 1939. | 1944. | 1945.* | 1946.* | 1947.* |
|---|---|---|---|---|---|
* Provisional. † Includes unclassified items, but excludes munitions and war stores for the years 1944–45. | |||||
| Producers' materials— | £ | £ | £ | £ | £ |
| Crude | 2,869,358 | 4,132,309 | 6,139,484 | 6,651,600 | 9,020,378 |
| Simply transformed | 6,515,985 | 8,424,907 | 6,812,101 | 8,819,100 | 12,834,434 |
| More elaborately transformed | 10,267,607 | 17,587,333 | 16,756,940 | 20,421,100 | 35,208,917 |
| Fuels and lubricants— | |||||
| Crude | 726,622 | 1,635,627 | 1,034,963 | 934,200 | 1,844,026 |
| Simply transformed | 2,563,132 | 2,576,228 | 2,319,996 | 2,814,600 | 4,601,168 |
| More elaborately transformed | |||||
| Auxiliary aids to production— | |||||
| Crude | |||||
| Simply transformed | 2,275 | 304 | |||
| More elaborately transformed | 1,078,991 | 1,898,474 | 1,111,201 | 1,088,800 | 3,474,002 |
| Producers' equipment— | |||||
| Crude | 52,307 | 56,754 | 71,943 | 119,400 | 88,571 |
| Simply transformed | 129,270 | 104,404 | 72,775 | 90,000 | 88,519 |
| More elaborately transformed | 6,545,842 | 9,510,811 | 8,380,041 | 12,711,800 | 18,889,772 |
| Transport equipment— | |||||
| Crude | |||||
| Simply transformed | 387,653 | 423,261 | 127,091 | 225,500 | 575,589 |
| More elaborately transformed | 6,705,993 | 2,717,368 | 1,845,445 | 5,741,700 | 14,067,344 |
| Consumers' goods— | |||||
| Crude | 1,792,726 | 1,956,412 | 1,918,876 | 2,338,800 | 3,782,903 |
| Simply transformed | 157,926 | 71,940 | 69,888 | 37,100 | 222,619 |
| More elaborately transformed | 8,985,249 | 5,419,598 | 4,714,073 | 9,153,200 | 22,762,170 |
| Total merchandise imports†— | |||||
| Crude | 5,441,013 | 7,781,102 | 9,165,266 | 10,044,000 | 14,735,878 |
| Simply transformed | 9,756,241 | 11,600,780 | 9,402,155 | 11,986,300 | 18,322,329 |
| More elaborately transformed | 34,189,929 | 37,133,719 | 32,808,211 | 49,603,814 | 95,666,634 |
| Totals, all merchandise† | 49,387,183 | 56,515,601 | 51,375,632 | 71,634,114 | 128,724,841 |
An indication of the changes that have occurred during the same period is contained in the next table, which gives the figures for each of the divisions shown in the preceding table as a percentage of total imports.
| — | 1939. | 1944. | 1945*. | 1946.* | 1947.* |
|---|---|---|---|---|---|
*Provisional. †Includes unclassified items, but excludes munitions and war stores for the years 1944–45. | |||||
| Producers' materials— | Per Cent. | Per Cent. | Per Cent. | Per Cent. | Per Cent. |
| Crude | 5.8 | 7.3 | 11.9 | 9.3 | 7.0 |
| Simply transformed | 13.2 | 14.9 | 13.3 | 12.3 | 10.0 |
| More elaborately transformed | 20.8 | 31.1 | 32.6 | 28.5 | 27.3 |
| Fuels and lubricants— | |||||
| Crude | 1.5 | 2.9 | 2.1 | 1.3 | 1.4 |
| Simply transformed | 5.2 | 4.6 | 4.5 | 3.9 | 3.5 |
| More elaborately transformed | |||||
| Auxiliary aids to production— | |||||
| Crude | |||||
| Simply transformed | |||||
| More elaborately transformed | 2.2 | 3.4 | 2.2 | 1.5 | 2.7 |
| Producers' equipment— | |||||
| Crude | 0.1 | 0.1 | 0.1 | 0.2 | 0.1 |
| Simply transformed | 0.3 | 0.2 | 0.1 | 0.1 | 0.1 |
| More elaborately transformed | 13.3 | 16.8 | 16.3 | 17.7 | 14.7 |
| Transport equipment— | |||||
| Crude | |||||
| Simply transformed | 0.8 | 0.7 | 0.2 | 0.3 | 0.4 |
| More elaborately transformed | 13.6 | 4.8 | 3.6 | 8.0 | 10.9 |
| Consumers' goods— | |||||
| Crude | 3.6 | 3.5 | 3.7 | 3.2 | 3.0 |
| Simply transformed | 0.3 | 0.1 | 0.2 | 0.1 | 0.2 |
| More elaborately transformed | 18.2 | 9.6 | 9.2 | 12.8 | 17.7 |
| Total merchandise imports†— | |||||
| Crude | 11.0 | 13.8 | 17.8 | 14.0 | 11.5 |
| Simply transformed | 19.8 | 20.5 | 18.3 | 16.7 | 14.2 |
| More elaborately transformed | 69.2 | 65.7 | 63.9 | 69.3 | 74.3 |
| Totals, all merchandise† | 100.0 | 100.0 | 100.0 | 100.0 | 100.0 |
The group “producers' materials” in 1939 accounted for 39.8 per cent. of total imports. By 1944 this percentage had risen to 53.3, with a further rise to 57.3 in 1945, but by 1947 it had receded to 44.3 per cent. The value of this class in 1939 amounted to £19,652,950 and in 1947 to £57,063,729. “Producers' equipment” in 1939 accounted for 13.7 per cent. of the total imports, and by 1946 had risen to 18 per cent. However, as in the former class, this group fell in 1947 to 14.9 per cent. The value of “producers' equipment” increased from £6,727,419 in 1939 to £19,066,862 in 1947.
Of the four remaining groups the most important are “transport equipment” and “consumers' goods.” “Transport equipment” at £7,093,646 in 1939 (representing 14.4 per cent. of total imports) fell away considerably during the war period. In 1945 this group totalled only £1,972,536 (3.8 per cent. of total imports), but in 1946 rose to £5,967,200, 8.3 per cent of the total, with a further increase in 1947 to £14,642,933 (11.3 per cent.). “Consumers' goods” in 1939 totalled £10,935,901, or 22.1 per cent. of total imports. This group also suffered during the war period, and in 1945 totalled only £6,702,837 (13.1 per cent.), but rose to £11,529,100, or 16.1 per cent. of the total, in 1946, and £26,767,692 (20.9 per cent.) in 1947.
The proportion of commodities described as “crude” and “simply transformed” both rose during the war years at the expense of those classified as “more elaborately transformed,” but in the last two years the percentage of “crude” items fell away to pre-war dimensions.
The “more elaborately transformed” group, after declining during the war years, rose to 74.3 per cent. of the total in 1947, compared with 69.2 per cent. in 1939. The increase here is attributed to the higher percentage recorded by “producers' materials.”
Imports classified as “simply transformed” moved from 19.8 per cent. in 1939 to 25.1 per cent. in 1943, but each subsequent year has witnessed a decrease, the percentage in 1947 being 14.2.
DIRECTION OF IMPORT TRADE.—The import trade of New Zealand, though spread over more countries than the export trade, is confined mainly to the United Kingdom, Australia, the United States of America, and Canada. For the pre-war years 1938 and 1939 these four countries accounted for 81.9 and 80.1 per cent. respectively of the total imports of New Zealand. During the war period, mainly as a result of the severance of trade with Japan, Indonesia, and most. European countries, this concentration of New Zealand's imports was even more marked, and in 1946 the percentage was 85.3. A fall to 81.4 per cent. was recorded in 1947, mainly on account of the resumption of imports from certain European countries.
In the early years of settlement Australia was the source from which the young colony drew most of its supplies, and for a long period imports from Australia overshadowed imports from the United Kingdom. The proportion of imports from Australia, however, decreased steadily from 60 per cent. in 1862 to 7 per cent. in 1929. For some years prior to the outbreak of war the trend had been upwards, and this movement was continued until 1942, when a slight fall was recorded. Particularly heavy imports from certain other countries, notably the United States of America, in 1943 and 1944 caused a sharp fall in the Australian percentages for those years. This was followed by comparatively high figures in 1945 and 1946, but a fall was again recorded in 1947, despite the fact that the actual value of imports from Australia rose from £10,419,768 in 1946 to £14,942,154 in 1947.
Imports from the United Kingdom comprised between 60 per cent. and 70 per cent. of total imports during the “eighties” and “nineties”; so that, at that time, the United Kingdom and Australia between them supplied approximately 80 per cent. of the total imports of New Zealand. In the decade immediately preceding the war of 1914–18 the United Kingdom supplied about 60 per cent. of total imports; but, with the disruption in trading relations during that war, other countries—notably the United States of America and Japan—increased their share of New Zealand's import trade.
The economy of New Zealand and other countries following the war of 1914–18 has been characterized by a marked growth in the diversity of products entering into international trade. Notable examples of important new industries are to be found in the growth of the motor, artificial silk, motion picture, and radio industries. International trade in the products of these and certain other new industries became almost a monopoly of the United States of America; in fact, the dominating position of that country in such spheres of industrial activity has been seriously challenged only recently. The traditional position of the United Kingdom in the forefront of manufacturing activity was shaken severely by circumstances arising from the 1914–18 war, her textile industries, for example, being subjected to acute and increasing foreign competition. In the circumstances, it is not surprising to find that the proportion of goods of United Kingdom origin included in New Zealand's imports of merchandise fell from about 60 per cent. before the First World War to about 46 per cent. in the late “ twenties.”
From 1930 onwards there was a definite improvement in the relative position of the United Kingdom in New Zealand's import trade, partly duo to New Zealand's tariff policy, in which preference to Commonwealth countries plays an important part. During each of the five years, 1931–35, over 50 per cent. of our imports of merchandise were of United Kingdom origin, this recovery having been made despite the growth in imports from Australia of certain goods—e.g., iron and steel—which were formerly almost entirely imported from the United Kingdom. In 1936 and 1937, however, the proportion fell to slightly below 50 per cent., and since then there has been a progressive decline. The decrease in the first two years of the war period was of a comparatively minor nature, but in 1942 the percentage fell to 37, although this was due more to the increase in imports from other countries rather than to the actual fall in the value of goods of United Kingdom origin. Despite the large increase in the value of goods imported from United Kingdom in 1943, the percentage dropped oven lower (34), due to abnormal imports of lend-lease supplies and munitions from the United States of America. With the return to more normal trading conditions in 1946, imports from United Kingdom (£34,194,878) represented 47.7 per cent. of the total, thus re-establishing her pre-war footing as the chief supplier of New Zealand's import requirements. Increased imports from Canada and the United States of America during 1947, plus the re-opening of many pre-war continental markets, resulted in the percentage dropping to 42.8 in 1947.
The United States of America was sending goods to New Zealand almost from the foundation of the colony, and the share of the imports received from that country steadily increased till in the first decade of the present century it was 11 or 12 per cent. The adoption of Imperial preference seems to have caused a temporary drop in the figure to about 7 per cent., though the proportion maintained a steady increase for several years after the 1914–18 war, and, indeed, considerably surpassed its old level. From 1933 to 1940 about one-eighth of the total imports came from the United States. The cutting-off of supplies from the United Kingdom and certain other countries owing to the exigencies of war and the necessity of obtaining war materials resulted in imports of United States origin showing largo increases in the later war years. In 1943 imports from this quarter totalled £34,889,239, or 36.6 per cent. of the total, as against £32,615,873 from the United Kingdom. However, with the decline in munitions and lend-lease supplies, imports from the United States fell to £11,792,750 in 1946, 16.5 per cent. of the total, but rose again in 1947 to £23,329,104, 18.1 per cent. of the total. Both these latter percentages are well above those of the immediate pre-war years.
Imports of Canadian origin gradually rose to 9.8 per cent. of the total (in 1929), but fell during the depression period to 4.5 per cent. (in 1932). By 1939 the proportion had risen to 8.9 per cent., but a very irregular movement operated during the war years, the 1943 figures reaching the high proportion of 12 per cent. Imports from Canada in 1946 were valued at £4,655,986, 6.5 per cent. of the total, and at £11,609,460 in 1947, 9 per cent. of the total.
It should be noted that the nomenclature used in the following tables in regard to countries of origin of imports refers to status and territories in the years indicated and not necessarily to the present position.
The table which follows shows imports during the last eleven years from the United Kingdom, other British Commonwealth countries, and foreign countries.
| Year. | Country of Shipment. | Country of Origin. | Total Merchandise Imports. | ||||
|---|---|---|---|---|---|---|---|
| United Kingdom. | Other British Commonwealth Countries. | Foreign Countries. | United Kingdom. | Other British Commonwealth Countries. | Foreign Countries. | ||
*Provisional. | |||||||
| £ | £ | £ | £ | £ | £ | £ | |
| 1937 | 28,184,891 | 13,750,269 | 14,225,535 | 27,861,275 | 13,430,221 | 14,869,199 | 56,160,695 |
| 1938 | 26,886,475 | 14,522,536 | 14,013,178 | 26,532,688 | 14,238,397 | 14,651,104 | 55,422,189 |
| 1939 | 23,277,004 | 13,811,179 | 12,299,000 | 23,133,872 | 13,512,258 | 12,741,053 | 49,387,183 |
| 1940 | 23,111,974 | 15,105,580 | 10,780,115 | 22,945,386 | 14,760,753 | 11,291,530 | 48,997,669 |
| 1941 | 21,045,407 | 15,947,954 | 12,173,649 | 21,179,813 | 15,433,045 | 12,554,152 | 49,167,010 |
| 1942 | 20,072,322 | 17,028,604 | 16,755,086 | 20,156,851 | 16,505,556 | 17,193,605 | 53,856,012 |
| 1943 | 32,606,532 | 20,419,804 | 36,215,994 | 32,615,873 | 26,230,461 | 36,395,996 | 95,242,330 |
| 1944 | 34,926,909 | 20,782,354 | 30,687,949 | 34,883,155 | 20,556,198 | 30,957,859 | 86,397,212 |
| 1945* | 19,705,286 | 18,624,320 | 16,743,322 | 19,835,980 | 18,297,230 | 16,939,718 | 55,072,028 |
| 1946* | 34,185,082 | 21,146,131 | 16,302,901 | 34,194,878 | 20,828,929 | 16,610,307 | 71,634,114 |
| 1947* | 55,387,517 | 38,658,094 | 34,679,230 | 55,038,985 | 38,236,407 | 35,449,449 | 128,724,841 |
The next table shows in more detail the principal countries from which New Zealand draws its imports, figures on the basis of country of origin being given for the years 1939 and 1944–47.
| Country. | 1939. | 1944. | 1945.* | 1946.* | 1947.* |
|---|---|---|---|---|---|
*Provisional. | |||||
| British Commonwealth of Nations, Protected States, and Trust Territories | £ | £ | £ | £ | £ |
| United Kingdom | 23,133,872 | 34,883,155 | 19,835,980 | 34,194,878 | 55,038,985 |
| Europe | 5,209 | 1,285 | 2,906 | 3,986 | 54,590 |
| Asia— | |||||
| British Borneo | 2,055 | 14 | 23,820 | 244,477 | |
| Ceylon | 823,964 | 853,129 | 868,419 | 1,461,526 | 1,949,311 |
| Hong Kong | 25,724 | 5 | 1,672 | 71,982 | |
| India and Pakistan | 705,088 | 3,265,597 | 2,640,100 | 2,118,912 | 4,710,521 |
| Malaya and Singapore | 426,751 | 5 | 6 | 19,694 | 502,880 |
| Palestine | 5,584 | 13,368 | 11,156 | 9,684 | 148,080 |
| Other | 12,894 | 1,519 | 774 | 2,713 | 11,138 |
| Africa— | |||||
| British West Africa | 33,060 | 205,030 | 239,280 | 137,020 | 423,202 |
| Kenya and Uganda | 25,003 | 9,244 | 8,356 | 29,246 | 78,282 |
| Rhodesia | 10,798 | 32,443 | 51,444 | 49,915 | 46,160 |
| Tanganyika Territory | 846 | 4,249 | 22,968 | 10,932 | 36,821 |
| Union of South Africa | 79,540 | 86,881 | 241,571 | 220,795 | 498,685 |
| Other | 46,204 | 6,542 | 5,840 | 10,983 | 9,000 |
| America— | |||||
| British West Indies | 63,966 | 33,958 | 61,654 | 56,145 | 170,370 |
| Canada | 4,376,912 | 5,104,506 | 5,085,701 | 4,655,986 | 11,609,460 |
| Newfoundland | 12,533 | 10,856 | 18,993 | 19,146 | 23,504 |
| Other | 814 | 60 | 7,015 | ||
| Pacific— | |||||
| Australia | 6,419,469 | 10,277,373 | 8,319,631 | 10,419,768 | 14,942,154 |
| Fiji | 47,960 | 496,985 | 529,254 | 1,258,018 | 2,176,521 |
| Gilbert and Ellice Islands | 57,663 | 1 | 3 | 57,496 | |
| Nauru Island | 201,237 | 20,676 | 78,229 | ||
| Tonga | 17,521 | 25,311 | 26,256 | 52,223 | 31,636 |
| Western Samoa | 90,485 | 120,161 | 155,039 | 230,299 | 332,836 |
| Other | 20,918 | 7,682 | 7,876 | 15,767 | 22,057 |
| Totals, British Commonwealth countries | 36,646,130 | 55,439,353 | 38,133,210 | 55,023,807 | 93,275,392 |
| Other Countries | |||||
| Europe— | |||||
| Belgium | 417,488 | 4 | 6 | 241,570 | 2,440,247 |
| Czechoslovakia | 31,923 | 2,410 | 185,173 | ||
| Denmark | 14,006 | 2,250 | 28,884 | ||
| Finland | 80,376 | 39,548 | 398,005 | ||
| France | 232,428 | 681 | 295 | 73,974 | 874,399 |
| Germany | 872,009 | 1,561 | 295 | 1,941 | 23,230 |
| Italy | 137,835 | 334 | 405 | 8,989 | 418,268 |
| Netherlands | 307,385 | 106 | 4 | 56,700 | 611,476 |
| Norway | 57,461 | 10 | 85,752 | 312,954 | |
| Portugal | 22,899 | 52,355 | 24,838 | 49,898 | 130,269 |
| Russia (U.S.S.R.) | 25,594 | 1,337 | 221 | 980 | 24,261 |
| Spain | 31,587 | 39,811 | 20,042 | 85,961 | 80,823 |
| Sweden | 325,916 | 531 | 127,340 | 508,795 | 1,148,400 |
| Switzerland | 159,161 | 283,081 | 220,714 | 286,805 | 558,374 |
| Other | 43,208 | 686 | 1,726 | 2,081 | 10,200 |
| Asia— | |||||
| Bahrein Islands | 278,493 | 439,349 | 1,089,039 | ||
| China | 117,389 | 39,277 | 35,120 | 135,660 | 233,368 |
| Iran | 29,113 | 124,665 | 273,984 | 457,101 | 1,883,098 |
| Iraq | 35,317 | 61,366 | 67,946 | 68,696 | |
| Japan | 1,038,584 | 72 | 604 | 510 | 6,105 |
| Indonesia | 2,434,826 | 305 | 5,430 | 28,179 | |
| Turkey | 17,980 | 325 | 280 | 2,873 | 48,944 |
| Other | 34,866 | 844 | 440 | 45,569 | |
| Africa— | |||||
| Algeria | 28 | 26,916 | 32,466 | 29,736 | 66,523 |
| Belgian Congo | 482 | 17,243 | 12,017 | 33,295 | 19,885 |
| Egypt | 5,638 | 25,010 | 26,678 | 62,515 | 98,386 |
| Morocco | 4,714 | 51,501 | 28,275 | 41,582 | 148,604 |
| Tunisia | 86,518 | 22,538 | |||
| Other | 5,663 | 7,460 | 683 | 214 | 1,198 |
| America— | |||||
| Argentina | 30,806 | 35,121 | 37,982 | 5,435 | 22,144 |
| Brazil | 16,167 | 21,695 | 28,318 | 8,128 | 74,899 |
| Chile | 18,074 | 128 | 42,679 | 52,121 | 69,545 |
| Netherlands Antilles | 44 | 676,798 | 576,011 | 295,118 | 5 |
| Dominican Republic | 112,924 | 751 | 49 | 182 | 1,747 |
| Peru | 70,284 | 1,308,180 | 1,656,219 | 886,345 | 21,662 |
| United States of America | 5,613,154 | 27,850,833 | 13,072,365 | 11,792,750 | 23,329,104 |
| Uruguay | 11 | 1 | 86,592 | ||
| Other | 14,977 | 2,539 | 9,063 | 14,096 | 60,944 |
| Pacific— | |||||
| Tuamotu Archipelago | 385,835 | 624,565 | 809,885 | 766,210 | |
| Other | 15,725 | 1,864 | 25,108 | 21,941 | 11,502 |
| Totals, other countries | 12,741,053 | 30,957,859 | 16,939,718 | 16,610,307 | 35,449,449 |
| Totals, all countries | 49,387,183 | 86,397,212 | 55,072,928 | 71,634,114 | 128,724,841 |
The following table shows for the last eleven years the percentage of total imports (excluding specie) received from each of the principal countries trading with New Zealand.
IMPORTS (COUNTRY OF ORIGIN)
| Country. | 1937. | 1938. | 1939. | 1940. | 1941. | 1942. | 1943. | 1944. | 1945.* | 1946.* | 1947.* |
|---|---|---|---|---|---|---|---|---|---|---|---|
* Provisional. | |||||||||||
| Per Cent. | Per Cent. | Per Cent. | Per Cent. | Per Cent. | Per Cent. | Per Cent. | Per Cent. | Per Cent. | Per Cent. | Per Cent. | |
| United Kingdom | 40.61 | 47.87 | 46.84 | 46.83 | 43.08 | 37.43 | 34.24 | 40.38 | 36.02 | 47.74 | 42.76 |
| Ceylon | 1.47 | 1.48 | 1.67 | 1.94 | 2.87 | 4.23 | 0.50 | 0.99 | 1.58 | 2.04 | 1.51 |
| India and Pakistan | 1.03 | 1.02 | 1.43 | 2.92 | 2.76 | 3.38 | 3.07 | 3.78 | 4.79 | 2.96 | 3.66 |
| Malaya and Singapore | 0.19 | 0.18 | 0.86 | 0.84 | 0.88 | 0.10 | 0.03 | 0.39 | |||
| Union of South Africa | 0.23 | 0.16 | 0.16 | 0.24 | 0.27 | 0.39 | 0.10 | 0.10 | 0.44 | 0.31 | 0.39 |
| Canada | 8.13 | 8.76 | 8.86 | 5.89 | 6.23 | 4.36 | 12.03 | 5.90 | 9.24 | 6.50 | 9.02 |
| Australia | 11.74 | 12.92 | 13.00 | 15.96 | 16.32 | 15.12 | 10.67 | 11.90 | 15.10 | 14.55 | 11.61 |
| Fiji | 0.17 | 0.20 | 0.10 | 0.12 | 0.27 | 2.28 | 0.63 | 0.58 | 0.96 | 1.76 | 1.69 |
| Other British Commonwealth countries | 0.95 | 0.97 | 1.28 | 2.21 | 1.79 | 0.78 | 0.55 | 0.54 | 1.11 | 0.92 | 1.43 |
| Totals, British Commonwealth countries | 73.52 | 73.56 | 74.20 | 76.95 | 74.47 | 68.07 | 61.79 | 64.17 | 69.24 | 76.81 | 72.46 |
| Belgium | 0.97 | 0.94 | 0.85 | 0.83 | 0.04 | 0.34 | 1.90 | ||||
| France | 0.41 | 0.42 | 0.47 | 0.33 | 0.03 | 0.10 | 0.67 | ||||
| Germany | 1.73 | 2.02 | 1.77 | 0.10 | 0.02 | 0.01 | 0.02 | ||||
| Sweden | 0.66 | 0.73 | 0.66 | 0.42 | 0.04 | 0.02 | 0.23 | 0.71 | 0.89 | ||
| Bahrein Islands | 0.09 | 0.45 | 0.56 | 0.75 | 0.61 | 0.85 | |||||
| Iran | 0.03 | 0.23 | 0.06 | 0.27 | 0.05 | 0.14 | 0.50 | 0.64 | 1.46 | ||
| Japan | 2.90 | 2.18 | 2.10 | 1.65 | 0.44 | 0.02 | |||||
| Indonesia | 3.99 | 3.90 | 4.93 | 4.48 | 4.21 | 0.85 | 0.01 | 0.02 | |||
| Netherlands Antilles | 0.37 | 0.75 | 0.78 | 1.05 | 0.41 | ||||||
| Peru | 0.14 | 1.22 | 0.75 | 1.53 | 3.01 | 1.24 | 0.02 | ||||
| United States of America | 12.40 | 12.37 | 11.37 | 12.44 | 18.58 | 27.80 | 36.63 | 32.23 | 23.74 | 16.46 | 18.12 |
| Tuamotu Archipelago | 0.30 | 0.50 | 0.40 | 0.45 | 1.13 | 1.13 | 0.60 | ||||
| Other foreign countries | 3.30 | 3.20 | 2.89 | 2.05 | 1.23 | 0.73 | 0.40 | 0.70 | 1.10 | 1.55 | 2.99 |
| Totals, other countries | 26.48 | 26.44 | 25.80 | 23.05 | 25.53 | 31.93 | 38.21 | 35.83 | 30.76 | 23.19 | 27.54 |
It will be seen that the great bulk of New Zealand's imports of merchandise are of British origin, the proportion of total imports derived from British countries in normal times being approximately 75 per cent. although for reasons already outlined this proportion fell during the war years. The strong bias towards Imperial preference in the Customs tariff (which, however, is low relative to that of most countries, even for imports of foreign origin), and the virility of British manufacturers, notably Australian and United Kingdom, in meeting foreign competition, have been important factors contributing to the improvement in the proportion of imports of British origin. The Ottawa Agreement, which resulted in increases in the margin of Imperial preference in the tariff on certain commodities, and the placing of several commodities previously dutiable on the free list if of British origin, must also be mentioned as a factor of considerable moment.
One of the outstanding facts brought into relief by the foregoing table is the marked relative expansion in imports from Australia. The fluctuations during certain of the war years and in 1947 were due to abnormal conditions resulting in particularly heavy imports from certain other countries and not to any falling-off in the value of imports from Australia. The increase has been achieved despite the fact that New Zealand's imports of certain natural products—e.g., timber and coal—from Australia are now on a considerably lower level than in earlier years. The decline in imports of these items has been more than compensated for by increased imports from Australia of certain manufactured and semi-manufactured goods notably iron and steel, and more recently motor-tires and tubes, woollen piece-goods and yarns, spirits (beverages) and raw sugar, although Fiji has largely supplanted Australia in the last two years as the principal supplier of the latter commodity. Imports of wheat from Australia have increased very considerably in the last few years. Australian industries have advanced to the stage when they can compete effectively in the New Zealand market with the manufactured products of the older countries. The comparative nearness of Australia to New Zealand is a very strong factor operating to the benefit of Australian firms in the New Zealand import market: the closeness of personal contact possible between importers and the Australian manufacturers, the short period in which goods can be delivered after ordering, and the intimate knowledge of New Zealand requirements, all act strongly to the mutual advantage of the Australian exporter and the New Zealand buyer. Moreover, the New Zealand market presents a very strong attraction to Australian firms, since the potential demand in this country is of sufficient size to represent a very profitable addition to the home market.
Origin of Principal Imports.—The table which follows shows by main countries of origin details of the principal imports into New Zealand for the years 1939 and 1944–47.
| Country of Origin. | 1939. | 1944. | 1945.* | 1946.* | 1947.* |
|---|---|---|---|---|---|
*Provisional. | |||||
| £ | £ | £ | £ | £ | |
| Egg-pulp | |||||
| Australia | 193,231 | 200,890 | 252,724 | 437,373 | |
| Other countries | 246 | 43 | 2,031 | ||
| Totals | 246 | 193,274 | 206,890 | 252,724 | 430,404 |
| Fruits (Dried) | |||||
| Union of South Africa | 4,440 | 33,195 | 4,435 | 26,875 | |
| Australia | 342,367 | 538,103 | 475,212 | 323,520 | 490,999 |
| Iraq | 35,317 | 61,324 | 67,946 | 67,532 | |
| Turkey | 12,734 | 33,545 | |||
| United States of America | 77,529 | 138,874 | 121,610 | 131,502 | 447,033 |
| Other countries | 2,735 | 11 | 11 | 10,864 | 44,680 |
| Totals | 475,122 | 676,988 | 691,352 | 538,267 | 1,110,673 |
| Fruits (Fresh) | |||||
| British West Indies | 30,779 | 14,779 | 17,825 | 26,245 | |
| Australia | 168,629 | 250,629 | 177,931 | 152,819 | 348,198 |
| Fiji | 28,603 | 24,174 | 32,384 | 43,007 | 57,763 |
| Tonga | 15,963 | 21,338 | 22,753 | 45,789 | 26,549 |
| Western Samoa | 81,692 | 16,953 | 45,440 | 47,568 | 41,091 |
| United States of America | 42,486 | 15,839 | |||
| Other countries | 2,339 | 94 | 300 | 114 | |
| Totals | 370,491 | 313,094 | 293,381 | 323,147 | 499,960 |
| Wheat | |||||
| Canada | 26,517 | 2,161,671 | 212,740 | ||
| Australia | 417,194 | 1,002,855 | 158,774 | 1,428,049 | 2,092,798 |
| Totals | 443,711 | 1,002,855 | 2,320,445 | 1,640,789 | 2,092,798 |
| Sugar | |||||
| Canada | 129 | 46 | 32,031 | 17,730 | |
| Australia | 186,538 | 879,716 | 1,501,872 | 864,935 | 337,945 |
| Fiji | 3,260 | 445,067 | 432,406 | 1,154,743 | 2,004,311 |
| Indonesia | 414,252 | ||||
| Argentina | 7,209 | 2,956 | 3,863 | ||
| Dominican Republic | 112,861 | ||||
| Peru | 70,214 | ||||
| United States of America | 58,064 | 92,626 | 47,885 | 29,856 | 162,963 |
| Netherlands | 4,417 | 11,311 | |||
| Other countries | 4,032 | 8 | 190 | 140 | 97 |
| Totals | 853,638 | 1,424,755 | 1,982,399 | 2,084,661 | 2,538,220 |
| Tea | |||||
| Ceylon | 801,527 | 781,902 | 776,578 | 1,146,134 | 1,896,149 |
| India and Pakistan | 37,199 | 159,317 | 129,151 | 129,723 | 207,254 |
| Kenya and Uganda | 20,866 | ||||
| Union of South Africa | 17,282 | ||||
| China | 3,068 | 605 | 1,202 | ||
| Other countries | 516 | 61 | 18 | ||
| Totals | 880,458 | 941,219 | 905,729 | 1,276,523 | 2,104,623 |
| Tobacco and Preparations thereof | |||||
| United Kingdom | 387,354 | 1,191 | 17,438 | 619,043 | 1,232,060 |
| Union of South Africa | 1,868 | 39 | 49 | 70,193 | 16,273 |
| Canada | 137 | 9 | 23 | 60,256 | 532,283 |
| Australia | 78,798 | 32 | 11 | 110 | 23 |
| United States of America | 565,163 | 699,144 | 1,085,556 | 1,223,031 | 1,064,674 |
| Other countries | 2,350 | 116 | 3,453 | 7,675 | 8,737 |
| Totals | 1,035,670 | 700,531 | 1,106,530 | 1,980,308 | 2,854,050 |
| Spirits (Beverages) | |||||
| United Kingdom | 477,907 | 236,729 | 226,370 | 302,296 | 356,970 |
| Union of South Africa | 111 | 7,436 | 8,056 | 380 | 19,168 |
| British West Indies | 13,662 | 5,077 | 1,311 | 7,511 | 18,183 |
| Canada | 1,651 | 22,020 | 22,259 | 13,889 | 58,199 |
| Australia | 9,407 | 100,145 | 97,774 | 104,397 | 171,029 |
| France | 49,373 | 364 | 9 | 1,259 | 34,197 |
| Netherlands | 35,095 | 14,270 | 18,214 | ||
| United States of America | 13,228 | 668 | 250 | 149 | |
| Other countries | 2,959 | 365 | 408 | 3,352 | 8,604 |
| Totals | 590,165 | 385,364 | 356,855 | 447,604 | 684,713 |
| Hosiery | |||||
| United Kingdom | 122,274 | 41,885 | 67,599 | 136,201 | 870,270 |
| Canada | 48,574 | 894 | 1,119 | 23,552 | 52,640 |
| Australia | 6,863 | 8,604 | 38,808 | 96,496 | 96,899 |
| Czechoslovakia | 644 | 1,853 | 53,849 | ||
| Italy | 166 | 5 | 37,709 | ||
| Japan | 59,053 | 26 | |||
| United States of America | 152 | 75,716 | 20,613 | 65,432 | 412,751 |
| Other countries | 4,157 | 1 | 16 | 202 | 20,467 |
| Totals | 241,883 | 127,100 | 128,155 | 323,741 | 1,544,611 |
| Hats, Caps, and Millinery | |||||
| United Kingdom | 126,217 | 131,017 | 141,516 | 197,166 | 343,807 |
| Canada | 33,968 | 42,198 | 57,004 | 72,539 | 124,173 |
| Australia | 10,377 | 33,158 | 15,288 | 35,909 | 25,474 |
| Czechoslovakia | 2,702 | 192 | 2,021 | ||
| France | 8,092 | 611 | |||
| Germany | 37,029 | ||||
| Italy | 16,381 | 540 | 12,099 | ||
| Switzerland | 11,702 | 12,357 | 16,324 | 36,794 | 43,393 |
| China | 13,459 | 7,632 | 10,758 | ||
| Japan | 14,160 | ||||
| Ecuador | 310 | 2,770 | 8,616 | 9,615 | |
| United States of America | 12,537 | 1,404 | 1,364 | 846 | 5,854 |
| Other countries | 7,262 | 1,270 | 865 | 1,035 | 2,685 |
| Totals | 294,196 | 221,404 | 235,131 | 356,269 | 580,490 |
| Miscellaneous Apparel and Ready-made Clothing | |||||
| United Kingdom | 605,506 | 120,755 | 159,325 | 448,608 | 1,426,533 |
| Canada | 57,081 | 1,577 | 1,833 | 4,504 | 10,170 |
| Australia | 15,144 | 2,520 | 15,992 | 31,644 | 82,610 |
| Belgium | 12,350 | 3,224 | |||
| Germany | 24,909 | ||||
| Italy | 12,467 | 5 | 10 | 23,948 | |
| Japan | 32,873 | 54 | 118 | ||
| United States of America | 19,484 | 3,614 | 5,170 | 7,776 | 15,147 |
| Other countries | 32,205 | 362 | 264 | 573 | 8,983 |
| Totals | 811,819 | 128,828 | 182,589 | 493,169 | 1,570,733 |
| Boots and Shoes | |||||
| United Kingdom | 203,945 | 59,732 | 43,825 | 32,446 | 179,068 |
| Hong Kong | 5,973 | 4,436 | |||
| India and Pakistan | 13,099 | 1 | 15 | 19,555 | |
| Rhodesia | 28,949 | ||||
| Canada | 141,040 | 1,361 | 49,268 | 49,031 | 379,762 |
| Australia | 3,679 | 406 | 367 | 705 | 2,385 |
| Japan | 22,820 | 3 | |||
| United States of America | 2,658 | 20,848 | 5,975 | 511 | 1,668 |
| Other countries | 1,544 | 1 | 29 | 7 | 11,134 |
| Totals | 304,758 | 82,349 | 99,464 | 82,718 | 926,957 |
| Miscellaneous Drapery | |||||
| United Kingdom | 390,677 | 259,876 | 194,789 | 360,555 | 1,744,739 |
| India and Pakistan | 626 | 64,412 | 21,534 | 3,546 | 29,091 |
| Canada | 9,733 | 351 | 5,921 | 3,646 | 35,271 |
| Australia | 7,501 | 991 | 3,168 | 6,971 | 81,689 |
| Belgium | 4,331 | 6,986 | 171,005 | ||
| Czechoslovakia | 1,592 | 14 | 16,623 | ||
| Netherlands | 2,867 | 30,125 | |||
| France | 8,658 | 3,779 | 122,270 | ||
| Switzerland | 16,746 | 1,321 | 16,996 | ||
| Japan | 48,686 | 156 | |||
| United States of America | 7,346 | 391,369 | 14,761 | 16,056 | 118,655 |
| Argentina | 37,979 | ||||
| Other countries | 37,283 | 22 | 1,292 | 1,164 | 10,018 |
| Totals | 536,046 | 718,342 | 279,444 | 403,617 | 2,376,638 |
| Floor-coverings | |||||
| United Kingdom | 484,413 | 70,604 | 135,069 | 615,634 | 1,376,289 |
| Hong Kong | 738 | 16,134 | |||
| India and Pakistan | 13,310 | 317,416 | 214,892 | 232,992 | 259,558 |
| Canada | 2,844 | 1,320 | 9,639 | 30,235 | |
| Belgium | 14,196 | 28,505 | 465,071 | ||
| France | 388 | 1,187 | 23,538 | ||
| United States of America | 3,494 | 15,642 | 33,456 | 13,884 | 57,373 |
| Other countries | 12,467 | 342 | 785 | 828 | 14,806 |
| Totals | 531,850 | 405,330 | 384,202 | 902,669 | 2,243,004 |
| Cotton, Linen, and Canvas Piece-goods | |||||
| United Kingdom | 1,418,856 | 3,428,816 | 3,473,484 | 4,530,805 | 4,691,219 |
| Canada | 16,096 | 55,830 | 94,255 | 133,904 | 259,020 |
| Australia | 6,029 | 11,656 | 7,200 | 9,649 | 4,403 |
| India and Pakistan | 5,340 | 322,049 | 1,024,884 | 452,988 | 275,555 |
| Belgium | 4,443 | 14 | 4,230 | 232,294 | |
| Netherlands | 8,029 | 5,090 | 147,825 | ||
| Switzerland | 4,761 | 3,076 | 55,712 | ||
| Japan | 224,905 | 5 | 31 | ||
| United States of America | 16,190 | 1,012,937 | 216,286 | 161,796 | 1,074,374 |
| Other countries | 7,174 | 30 | 108 | 861 | 52,464 |
| Totals | 1,711,823 | 4,831,318 | 4,816,231 | 5,302,404 | 6,792,897 |
| Silk, &c., Piece-goods | |||||
| United Kingdom | 413,596 | 1,861,301 | 1,986,054 | 2,013,541 | 3,118,807 |
| Canada | 34,603 | 114,458 | 86,398 | 129,104 | 487,726 |
| Belgium | 985 | 259 | 29,924 | ||
| France | 25,612 | 11,271 | 222,319 | ||
| Italy | 26,516 | 341 | 152,631 | ||
| Netherlands | 399 | 35,284 | |||
| Switzerland | 11,129 | 2,872 | 76 | 5,930 | 44,895 |
| Japan | 308,284 | 4 | 545 | ||
| United States of America | 31,431 | 170,147 | 132,130 | 88,960 | 1,053,457 |
| Other countries | 64,062 | 127 | 50 | 91 | 15,650 |
| Totals | 916,617 | 2,148,905 | 2,204,708 | 2,249,501 | 5,161,238 |
| Woollen Piece-goods | |||||
| United Kingdom | 740,442 | 1,165,721 | 1,070,006 | 1,248,715 | 1,793,768 |
| Eire | 124 | 47,330 | |||
| Canada | 10 | 22,240 | |||
| Australia | 2,331 | 136,919 | 256,111 | 271,060 | 636,474 |
| Belgium | 4,013 | 2,400 | 132,112 | ||
| Czechoslovakia | 79 | 13,086 | |||
| France | 1,502 | 25,620 | |||
| Italy | 4,375 | 46,713 | |||
| Netherlands | 15,144 | ||||
| United States of America | 60 | 38 | 34,955 | ||
| Other countries | 3,011 | 20 | 3,524 | 256 | |
| Totals | 755,947 | 1,302,698 | 1,326,117 | 1,525,699 | 2,767,698 |
| Bags and Sacks | |||||
| India and Pakistan | 482,138 | 1,329,995 | 570,470 | 477,368 | 2,173,062 |
| Other countries | 2,393 | 1,492 | 1,185 | 2,264 | 6,515 |
| Totals | 484,631 | 1,331,487 | 571,656 | 479,632 | 2,179,577 |
| Yarns | |||||
| United Kingdom | 216,483 | 898,196 | 729,966 | 798,596 | 821,490 |
| India and Pakistan | 919 | 16,445 | 19,871 | 7,320 | 3,846 |
| Australia | 139,523 | 192,024 | 233,265 | 304,711 | 502,880 |
| Italy | 1,859 | 22,431 | |||
| United States of America | 4,403 | 30,990 | 69,475 | 204,389 | |
| Other countries | 9,659 | 319 | 897 | 1,571 | 17,656 |
| Totals | 368,443 | 1,111,387 | 1,014,989 | 1,181,673 | 1,572,692 |
| Motor-spirits | |||||
| British Borneo | 103,462 | ||||
| Malaya and Singapore | 283,765 | ||||
| Netherlands Antilles | 13,930 | ||||
| Bahrein Islands | 261,858 | 393,014 | 924,620 | ||
| Iran | 2,284 | 328,571 | 1,052,584 | ||
| Indonesia | 1,262,664 | ||||
| Peru | 1,192,112 | 1,297,901 | 691,854 | ||
| United States of America | 221,591 | 565,938 | 278,279 | 590,745 | 1,099,464 |
| Other countries | 81 | 72 | 59 | ||
| Totals | 2,029,959 | 1,771,980 | 1,578,464 | 2,004,256 | 3,180,189 |
| Petroleum, Crude | |||||
| British Borneo | 113,827 | ||||
| Australia | 309,131 | ||||
| Bahrein Islands | 7,465 | 10,471 | 96,525 | ||
| Iran | 28,409 | 124,165 | 271,056 | 107,162 | 595,891 |
| Indonesia | 494,315 | ||||
| Netherlands Antilles | 662,160 | 570,951 | 292,068 | ||
| Peru | 41,037 | 158,828 | 106,148 | 15,548 | |
| United States of America | 85,211 | 808,265 | 34,129 | 318,036 | 323,503 |
| Other countries | 458 | 580 | |||
| Totals | 615,858 | 1,635,627 | 1,034,964 | 834,465 | 1,454,425 |
| Mineral Oils (other than Motor-spirits and Crude Petroleum) | |||||
| United Kingdom | 69,768 | 50 | 600 | 6,461 | 8,395 |
| Bahrein Islands | 9,170 | 35,864 | 67,794 | ||
| Iran | 14 | 19 | 20,755 | 190,494 | |
| Indonesia | 88,123 | ||||
| Peru | 26 | 75,022 | 198,381 | 88,315 | 4,211 |
| United States of America | 329,661 | 754,527 | 558,255 | 689,622 | 1,079,408 |
| Other countries | 18,875 | 2,249 | 3,721 | 7,515 | 5,029 |
| Totals | 515,623 | 831,862 | 760,976 | 848,532 | 1,355,331 |
| Paints and Varnishes | |||||
| United Kingdom | 220,091 | 200,105 | 266,434 | 356,394 | 312,569 |
| Union of South Africa | 1,790 | 2,710 | 10,398 | 7,054 | |
| Canada | 11,165 | 6,268 | 6,531 | 21,822 | 43,473 |
| Australia | 114,813 | 83,239 | 82,557 | 86,220 | 99,950 |
| Belgium | 191 | 12,246 | |||
| Netherlands | 8,680 | 585 | 11,826 | ||
| United States of America | 25,481 | 20,276 | 29,489 | 27,672 | 151,072 |
| Other countries | 13,435 | 61 | 233 | 2,508 | 301 |
| Totals | 393,856 | 311,739 | 387,954 | 505,599 | 638,491 |
| Iron and Steel. —Bar, Bolt, and Rod | |||||
| United Kingdom | 121,305 | 63,757 | 24,320 | 148,501 | 98,695 |
| Canada | 9,106 | 23,047 | 16,342 | 14,737 | 23,462 |
| Australia | 265,124 | 285,850 | 210,796 | 248,871 | 346,980 |
| United States of America | 1,368 | 251,135 | 759 | 14,694 | 971 |
| Other countries | 228 | 5 | 2,861 | ||
| Totals | 397,131 | 623,789 | 252,217 | 426,808 | 472,969 |
| Iron and Steel. —Plate and Sheet | |||||
| United Kingdom | 1,000,942 | 119,598 | 58,569 | 684,998 | 992,076 |
| Australia | 206,462 | 164,986 | 127,293 | 206,044 | 261,785 |
| United States of America | 22,071 | 1,198,586 | 528,918 | 622,425 | 579,374 |
| Other countries | 7,332 | 3,746 | 484 | 714 | 596 |
| Totals | 1,236,807 | 1,486,916 | 715,264 | 1,514,181 | 1,833,831 |
| Iron and Steel.—Tubes, Pipes, and Fittings | |||||
| United Kingdom | 439,324 | 47,318 | 116,896 | 436,618 | 257,412 |
| Canada | 60,709 | 199,380 | 141,401 | 120,497 | 77,085 |
| Australia | 41,434 | 145,155 | 127,134 | 224,873 | 364,192 |
| United States of America | 35,890 | 262,774 | 20,907 | 1,721 | 11,359 |
| Other countries | 7,553 | ||||
| Totals | 584,910 | 654,627 | 406,338 | 783,709 | 710,048 |
| Artificers' Tools | |||||
| United Kingdom | 136,788 | 218,329 | 179,164 | 219,390 | 423,652 |
| Canada | 56,243 | 94,300 | 42,373 | 44,731 | 139,222 |
| Australia | 9,259 | 10,906 | 18,004 | 55,478 | 201,773 |
| Germany | 14,415 | ||||
| Sweden | 5,821 | 41 | 1,210 | 5,209 | 11,859 |
| United Stales of America | 72,545 | 194,259 | 185,586 | 127,039 | 263,150 |
| Other countries | 2,215 | 368 | 1,613 | 4,659 | 3,350 |
| Totals | 297,286 | 518,203 | 427,950 | 456,506 | 1,043,006 |
| Fencing-wire.—Plain and Barbed | |||||
| United Kingdom | 124,702 | 95,031 | 7,245 | 87,250 | 43,402 |
| Australia | 58,671 | 38,171 | 987 | 107 | |
| United States of America | 3,337 | 104,410 | 70,329 | 7,838 | 45,082 |
| Other countries | 7,831 | 1,533 | 10,906 | ||
| Totals | 194,541 | 237,612 | 77,574 | 97,608 | 99,497 |
| Iron Wire (other than fencing) | |||||
| United Kingdom | 42,101 | 11,169 | 43,309 | 333,407 | 222,711 |
| Canada | 51,451 | 9,154 | 34,134 | 6,769 | |
| Australia | 134,576 | 49,005 | 66,439 | 67,468 | 119,809 |
| Czechoslovakia | 18,050 | ||||
| United States of America | 3,770 | 165,521 | 186,762 | 13,110 | 50,873 |
| Other countries | 1,437 | 265 | |||
| Totals | 233,335 | 234,849 | 330,644 | 420,754 | 411,708 |
| Railway and Tramway Plant | |||||
| United Kingdom | 1,081,693 | 101,792 | 83,117 | 258,935 | 1,077,663 |
| Canada | 34,723 | 8,571 | 11,078 | ||
| Australia | 49,747 | 184,542 | 84,571 | 80,024 | 66,180 |
| Sweden | 13,259 | 5 | |||
| United States of America | 10,581 | 234,900 | 1,870 | 13,654 | 22,425 |
| Other countries | 306 | ||||
| Totals | 1,155,280 | 555,957 | 178,129 | 363,696 | 1,166,574 |
| Miscellaneous Hardware | |||||
| United Kingdom | 583,974 | 402,258 | 298,231 | 763,685 | 1,673,796 |
| Canada | 31,042 | 8,764 | 16,651 | 28,342 | 102,439 |
| Australia | 53,053 | 20,977 | 41,8.3 | 95,344 | 236,125 |
| Sweden | 16,797 | 75 | 3,924 | 13,370 | |
| United States of America | 53,243 | 173,368 | 42,000 | 185,920 | 95,935 |
| Other countries | 31,941 | 1,381 | 108 | 1,847 | 14,825 |
| Totals | 770,050 | 606,748 | 398,938 | 1,079,062 | 2,136,490 |
| Agricultural Machinery | |||||
| United Kingdom | 70,384 | 73,262 | 76,449 | 122,850 | 131,208 |
| Canada | 34,626 | 78,712 | 22,779 | 30,341 | 62,719 |
| Australia | 24,479 | 26,740 | 52,070 | 64,784 | 113,949 |
| United States of America | 95,771 | 176,715 | 250,057 | 185,857 | 342,243 |
| Other countries | 13,907 | 606 | 540 | 691 | 1,657 |
| Totals | 239,167 | 356,035 | 401,895 | 404,523 | 651,776 |
| Dairying Machinery | |||||
| United Kingdom | 38,172 | 26,172 | 23,760 | 58,939 | 67,743 |
| Australia | 5,347 | 1,246 | 2,880 | 23,704 | 31,439 |
| Denmark | 815 | 1,369 | 7,514 | ||
| Sweden | 34,931 | 39 | 29,223 | 76,554 | |
| United States of America | 9,480 | 38,544 | 10,095 | 11,295 | 44,850 |
| Other countries | 8,010 | 3,594 | 970 | 3,988 | 324 |
| Totals | 96,755 | 69,556 | 37,744 | 128,518 | 228,424 |
| Electrical Machinery and Equipment (including Telephones and Accessories) | |||||
| United Kingdom | 1,749,598 | 1,662,560 | 1,821,810 | 2,783,590 | 3,937,677 |
| Hong Kong | 3,984 | 1 | 37,184 | ||
| India and Pakistan | 1,163 | 15,421 | 1,664 | 20,473 | |
| Canada | 242,531 | 285,819 | 119,505 | 262,352 | 825,376 |
| Australia | 124,623 | 129,827 | 96,850 | 163,849 | 285,807 |
| Belgium | 65,177 | 8,923 | 13,284 | ||
| Germany | 53,330 | 12 | 687 | ||
| Netherlands | 7,674 | 10,564 | 41,610 | ||
| Sweden | 51,823 | 127 | 2,100 | 43,196 | 32,661 |
| United States of America | 196,801 | 1,757,324 | 623,479 | 236,709 | 1,469,450 |
| Other countries | 17,309 | 6,235 | 2,513 | 2,651 | 5,635 |
| Totals | 2,514,013 | 3,841,404 | 2,681,678 | 3,513,499 | 6,669,844 |
| Wireless Apparatus | |||||
| United Kingdom | 148,559 | 316,984 | 139,010 | 115,242 | 131,646 |
| Canada | 2,844 | 120,520 | 18,338 | 2,237 | 6,871 |
| Australia | 39,411 | 104,583 | 67,462 | 11,054 | 63,126 |
| United States of America | 84,699 | 302,836 | 203,760 | 108,115 | 273,525 |
| Other countries | 8,296 | 1,394 | 5,791 | ||
| Totals | 283,809 | 844,923 | 428,570 | 238,042 | 480,959 |
| Tractors (including Parts) | |||||
| United Kingdom | 29,094 | 103,729 | 5,323 | 132,006 | 201,652 |
| Australia | 11,842 | 1,487 | 47,143 | 59,015 | 96,811 |
| United States of America | 499,015 | 1,057,928 | 1,031,601 | 1,287,039 | 990,754 |
| Other countries | 38,163 | 20 | 13 | 2,442 | |
| Totals | 578,114 | 1,163,144 | 1,084,087 | 1,478,073 | 1,291,659 |
| Metal, Wood, Glass, Stone, Working Machines, and Tools | |||||
| United Kingdom | 167,014 | 210,237 | 320,622 | 402,709 | 722,454 |
| Canada | 12,447 | 15,990 | 8,276 | 22,543 | 70,890 |
| Australia | 59,923 | 52,401 | 79,635 | 159,554 | 236,625 |
| Sweden | 11,282 | 12,116 | 11,534 | ||
| United States of America | 71,189 | 208,182 | 214,65 | 209,940 | 392,298 |
| Other countries | 23,038 | 105 | 2,419 | 6,010 | |
| Totals | 344,893 | 486,816 | 623,403 | 809,281 | 1,439,811 |
| Leather and Leather Goods (excluding Boots and Shoes) | |||||
| United Kingdom | 125,558 | 113,810 | 90,882 | 172,573 | 294,578 |
| Canada | 7,558 | 5,847 | 9,024 | 10,816 | 27,745 |
| Australia | 64,737 | 84,737 | 59,353 | 82,031 | 95,013 |
| United States of America | 88,054 | 54,319 | 49,538 | 47,790 | 284,100 |
| Other countries | 12,627 | 233 | 989 | 1,642 | 27,476 |
| Totals | 298,534 | 258,946 | 209,786 | 314,852 | 728,912 |
| Raw Rubber and Manufactures (other than Tires) | |||||
| United Kingdom | 90,389 | 110,383 | 105,646 | 184,996 | 308,129 |
| Ceylon | 794 | 47,143 | 54,220 | 265,991 | 16,474 |
| Malaya and Singapore | 49,873 | 16,907 | 300,486 | ||
| Canada | 64,421 | 34,434 | 53,103 | 63,023 | 155,822 |
| Australia | 21,524 | 25,015 | 23,037 | 45,961 | 71,780 |
| Fiji | 22,580 | 31,683 | 17,009 | 5,290 | |
| Western Samoa | 20,766 | 17,251 | 17,904 | 4,371 | |
| United States of America | 21,478 | 38,119 | 45,478 | 46,312 | 101,423 |
| Other countries | 16,316 | 2,837 | 2,994 | 6,269 | |
| Totals | 264,795 | 301,277 | 335,418 | 661,097 | 970,044 |
| Timber | |||||
| Canada | 51,174 | 58,146 | 71,698 | 108,758 | 552,727 |
| Australia | 458,703 | 214,792 | 248,425 | 340,978 | 366,120 |
| Japan | 52,003 | ||||
| United States of America | 74,711 | 52,807 | 77,778 | 50,410 | 127,845 |
| Other countries | 5,007 | 674 | 1,553 | 2,144 | 13,381 |
| Totals | 641,598 | 326,419 | 399,454 | 502,290 | 1,060,073 |
| Earthernware and Chinaware | |||||
| United Kingdom | 239,357 | 238,253 | 252,787 | 561,186 | 922,065 |
| Australia | 1,277 | 330 | 484 | 115 | 2,069 |
| Japan | 17,208 | 113 | 548 | ||
| United States of America | 197 | 26,443 | 394 | 134 | 459 |
| Other countries | 2,111 | 1 | 32 | 276 | 1,259 |
| Totals | 260,150 | 265,027 | 253,697 | 561,824 | 926,400 |
| Glass and Glassware | |||||
| United Kingdom | 175,698 | 267,584 | 255,520 | 399,830 | 639,448 |
| Canada | 5,133 | 18,089 | 12,001 | 24,487 | 47,605 |
| Australia | 68,589 | 7.5,217 | 69,752 | 93,605 | 175,830 |
| Belgium | 47,190 | 4 | 7,219 | 103,651 | |
| Czechoslovakia | 4,549 | 162 | 21,526 | ||
| United States of America | 22,612 | 40,187 | 49,434 | 31,473 | 59,236 |
| Other countries | 23,743 | 2,935 | 2,678 | 2,378 | 4,538 |
| Totals | 347,514 | 404,016 | 389,385 | 559,154 | 1,051,834 |
| Printing-paper | |||||
| United Kingdom | 255,000 | 26,215 | 31,068 | 98,981 | 266,052 |
| Canada | 358,676 | 745,564 | 619,325 | 771,932 | 1,408,196 |
| Newfoundland | 12,523 | 9,335 | 15,065 | 21,359 | |
| Czechoslovakia | 8 | 17,681 | |||
| Finland | 4,676 | 289 | 37,721 | ||
| Norway | 5,782 | 49,400 | |||
| Netherlands | 2,549 | 1,096 | 84,045 | ||
| Sweden | 3,094 | 40 | 29,283 | ||
| United States of America | 43,050 | 27,916 | 14,485 | 2,819 | 350,846 |
| Other countries | 24,914 | 404 | 14,108 | ||
| Totals | 710,272 | 799,695 | 674,213 | 890,626 | 2,278,691 |
| Paper, other than Printing | |||||
| United Kingdom | 319,815 | 192,989 | 279,629 | 666,183 | 781,874 |
| Canada | 163,106 | 423,787 | 367,834 | 396,843 | 591,897 |
| Australia | 80,112 | 36,092 | 32,960 | 58,769 | 90,562 |
| Finland | 29,768 | 38,861 | 244,899 | ||
| France | 14,473 | 2,071 | 57,055 | ||
| Germany | 34,454 | 1,167 | |||
| Netherlands | 11,316 | 1,136 | 22,505 | ||
| Norway | 23,584 | 69,174 | 204,100 | ||
| Sweden | 83,677 | 1,596 | 39,875 | 353,185 | |
| United States of America | 107,321 | 183,527 | 40,138 | 49,565 | 360,827 |
| Other countries | 21,009 | 14 | 1,273 | 37,675 | |
| Totals | 888,635 | 836,395 | 722,171 | 1,323,755 | 2,745,746 |
| Books, Papers, and Music | |||||
| United Kingdom | 426,914 | 450,520 | 482,251 | 641,667 | 806,434 |
| Australia | 152,845 | 122,746 | 172,086 | 300,165 | 459,802 |
| United States of America | 83,957 | 102,079 | 130,822 | 177,063 | 262,469 |
| Other countries | 6,876 | 2,191 | 1,736 | 3,745 | 11,663 |
| Totals | 670,592 | 677,536 | 786,895 | 1,122,640 | 1,540,368 |
| Miscellaneous Stationery and Paper Manufactures | |||||
| United Kingdom | 237,107 | 145,778 | 133,345 | 235,476 | 520,339 |
| Canada | 11,151 | 18,353 | 20,507 | 20,225 | 46,149 |
| Australia | 81,084 | 31,201 | 44,177 | 47,829 | 78,125 |
| France | 370 | 27 | 3 | 607 | 212,575 |
| United States of America | 33,971 | 32,738 | 24,864 | 15,529 | 37,726 |
| Other countries | 12,306 | 1,042 | 370 | 1,118 | 7,432 |
| Totals | 375,989 | 229,139 | 223,266 | 320,784 | 902,346 |
| Timepieces | |||||
| United Kingdom | 20,193 | 2,421 | 7,439 | 28,379 | 104,747 |
| Canada | 23,860 | 15,689 | 12,032 | 34,510 | 27,036 |
| Australia | 98 | 131 | 4,884 | 2,545 | 2,479 |
| Switzerland | 66,063 | 248,559 | 172,181 | 152,168 | 259,419 |
| United States or America | 5,671 | 19,511 | 5,007 | 3,317 | 10,290 |
| Other countries | 11,307 | 13 | 3,762 | ||
| Totals | 127,192 | 286,311 | 201,543 | 220,932 | 407,733 |
| Manures | |||||
| United Kingdom | 90,1.64 | 46,079 | 33,912 | 63,624 | 77,835 |
| Palestine | 115,228 | ||||
| Seychelles | 41,043 | ||||
| Canada | 59,588 | 27,565 | 7,711 | 13,298 | |
| Australia | 2,232 | 1,236 | 18,901 | 3,910 | 539 |
| Gilbert and Ellice Islands | 57,591 | 51,411 | |||
| Nauru Island | 201,235 | 20,676 | 84,265 | ||
| Belgium | 138,042 | 101,948 | 138,000 | ||
| France | 34,171 | 15,581 | |||
| Germany | 58,620 | ||||
| Algeria | 26,916 | 32,466 | 29,736 | 66,523 | |
| Egypt | 5,371 | 24,847 | 26,116 | 33,956 | 45,991 |
| Morocco | 51,498 | 28,275 | 41,423 | 132,660 | |
| Tunisia | 86,518 | 22,538 | |||
| Chile | 16,241 | 69 | 42,679 | 51,418 | 68,208 |
| Tuamotu Archipelago | 385,805 | 624,551 | 809,774 | 766,210 | |
| United States of America | 116,639 | 155,064 | 432,355 | 122,071 | |
| Other countries | 9,917 | 1,401 | 505 | 31 | |
| Totals | 741,145 | 714,078 | 990,034 | 1,596,531 | 1,770,389 |
| Parts of Motor-vehicles | |||||
| United Kingdom | 173,025 | 155,439 | 201,084 | 297,340 | 453,246 |
| Canada | 40,596 | 28,438 | 63,979 | 85,744 | 198,424 |
| Australia | 30,936 | 30,219 | 28,369 | 66,585 | 119,196 |
| United States of America | 106,191 | 524,697 | 226,455 | 136,410 | 392,238 |
| Other countries | 2,258 | 17 | 41 | 273 | 3,485 |
| Totals | 353,006 | 738,810 | 519,928 | 586,352 | 1,166,589 |
| Motor-cars | |||||
| United Kingdom | 2,065,440 | 770 | 12,989 | 1,720,082 | 4,308,842 |
| Canada | 1,296,356 | 450 | 239,033 | 1,286,958 | |
| United States of America | 171,609 | 247 | 395 | 74,396 | 352,537 |
| Other countries | 8,103 | 689 | |||
| Totals | 3,541,508 | 1,017 | 13,834 | 2,033,511 | 5,949,026 |
| Motor Lorries, Trucks, Vans, and Buses | |||||
| United Kingdom | 201,791 | 190,455 | 413,813 | 1,071,205 | |
| Australia | 100 | ||||
| Canada | 346,545 | 114,345 | 477,153 | 1,091,232 | |
| United States of America | 98,797 | 940,425 | 135,227 | 88,272 | 345,208 |
| Totals | 647,133 | 1,130,880 | 249,572 | 979,238 | 2,507,745 |
| Tires and Tubes for Motor-vehicles and Motor-cycles | |||||
| United Kingdom | 477,876 | 11,647 | 14,672 | 410,019 | 818,257 |
| India and Pakistan | 39,753 | 44,375 | 131,640 | ||
| Canada | 308,229 | 18,201 | 59,014 | 97,097 | 387,806 |
| Australia | 1,755 | 341,035 | 455,094 | 678,346 | 686,707 |
| United States of America | 24,607 | 94,108 | 74,636 | 32,266 | 328,412 |
| Other countries | 1,165 | 3,364 | 76,017 | 29,535 | 22,408 |
| Totals | 813,632 | 468,355 | 719,186 | 1,291,638 | 2,375,230 |
IMPORTS FROM COOK AND OTHER ANNEXED ISLANDS.—Trade with the Cook and other annexed islands is not included in the export and import totals for New Zealand, but is shown separately in official publications. The following table shows imports into New Zealand from the group. Further particulars of the trade of the islands will be found in the section dealing with Island Territories.
| Year. | Imports. |
|---|---|
*Provisional | |
| £ | |
| 1937 | 69,121 |
| 1938 | 90,479 |
| 1939 | 60,635 |
| 1940 | 90,292 |
| 1941 | 86,073 |
| 1942 | 67,662 |
| 1943 | 88,859 |
| 1944 | 97,980 |
| 1945* | 87,897 |
| 1946* | 124,634 |
| 1947* | 129,177 |
The principal articles imported into New Zealand from the Cook and other annexed islands are as follows:—
| Article. | 1939. | 1944. | 1945.* | 1946.* | 1947.* |
|---|---|---|---|---|---|
*Provisional. | |||||
| Fruits, fresh— | £ | £ | £ | £ | £ |
| Bananas | 23,913 | 1,106 | 4,445 | 5,757 | 312 |
| Oranges | 22,013 | 16,486 | 25,729 | 8,675 | 19,303 |
| Tomatoes | 5,514 | 20,991 | 16,392 | 43,621 | 12,307 |
| Other | 390 | 1,859 | 1,646 | 931 | 2,916 |
| Fruit juices | 1,591 | 1,120 | 535 | 389 | |
| Copra | 34,954 | 18,690 | 35,520 | 50,644 | |
| Fancy goods | 5,277 | 5,590 | 3,616 | 2,719 | |
| Other apparel | 2,827 | 1,054 | 7,311 | ||
| Cinematograph films (re-imports) | 3,737 | 978 | 2,119 | 2,945 | 4,325 |
| Arrowroot | 84 | 894 | 1,735 | 5,402 | 4,955 |
| Hats and caps | 736 | 1,207 | 5,630 | 7,576 | |
| Wickerware | 3,034 | 4,723 | 5,698 | 3,978 | |
| All other items | 848 | 7,710 | 3,863 | 6,837 | 12,422 |
THE TARIFF.—The rates of Customs and excise duty in force in New Zealand are set out in the publication entitled “The Customs Tariff of New Zealand,” published by the Government Printer, Wellington.
A summarized historical account of the Customs tariff of New Zealand, setting forth the principal developments and changes from earliest times to 1930, will be found in the 1931 number of the Year-Book. Considerations of space preclude a detailed account of the rates of duty now levied on goods imported into New Zealand, and only a brief survey of the nature of the tariff and of developments since 1930 can be given here.
The basis of Customs taxation is primarily ad valorem, rates of duty being expressed as percentages of the value of imported goods as defined in the Customs Acts, but specific duties are applied to some lines, including several of the principal revenue items such as alcoholic beverages, tobacco, tea, sugar, and motor-spirits.
For duty purposes imported goods are classified according to categories of source, and the form of tariff is therefore “multi-column,” listing rates of duty under the British Preferential Tariff, agreements with certain Commonwealth countries, the Most-favoured-nation Tariff, and the General Tariff.
The last complete revision of the tariff took place in 1934 and the present tariff is that set forth in the First Schedule to the Customs Acts Amendment Act of that year, as modified by a number of subsequent enactments, and in the various Trade Agreement Acts, including the General Agreement on Tariffs and Trade Act, 1948, to which reference is made later in this subsection.
Briefly the Customs tariff, apart from the obtaining of revenue, has for its objects the following:—
The development of New Zealand industries.
The maintenance and extension of markets for New Zealand produce.
The encouragement of intra-Commonwealth trade.
Under the Ottawa agreement of 1932, New Zealand, in common with the other Commonwealth countries was committed to hold an inquiry into the tariff, and, if necessary, to revise it in accordance with certain explicitly stated principles. New Zealand undertook to afford protection against United Kingdom products only to industries which are reasonably assured of sound opportunities for success, and to grant protection on such a level as to enable the United Kingdom producer to compete on the basis of the relative cost of economical and efficient production.
As a result of the Ottawa Conference, dutiable goods, the produce of the United Kingdom or of any British Commonwealth country except Canada, the Union of South Africa, Eire, Newfoundland, or India, were exempted from the surtax on duty previously payable. Reductions were made in the rates of duty charged on confectionery, apparel, hosiery, and silk and artificial silk piece-goods, and an additional preference to British Commonwealth countries was granted by the imposition of a duty or an increase in the existing rate on foreign cocoa-beans, raw coffee, cigars, rum, asphalt and bitumen, certain unground spices, and paper.
A Tariff Commission was set up in 1933 to inquire into the Customs tariff and to recommend for the consideration of the Government any alterations therein with a view to implementing the agreement made at Ottawa, and having regard, inter alia, to the financial, economic, and industrial conditions in New Zealand.
On the basis of the report of this Commission, resolutions amending the tariff were introduced on 10th July, 21st August, and 13th September, 1934, and ratified by the Customs Acts Amendment Act, 1934. Some of the principal alterations made to the British preferential tariff at that time were listed in the 1946 and earlier issues of the Year-Book.
In addition to the ordinary rates of duty imposed on goods entering New Zealand, additional revenue has been obtained in recent years by a surtax on dutiable imports and a primage duty on certain goods otherwise free.
The surtax was imposed in 1930 in lieu of a primage duty of 1 per cent. or 2 per cent. ad valorem previously charged on practically all imports whether free or dutiable. This surtax was not, however, applied to dutiable goods of Australian origin, which continued to pay the primage duty of 1 per cent. or 2 per cent.
The rate of surtax was fixed at one-twentieth of the total duty otherwise payable on certain goods (e.g., spirits, tobacco, timber, sugar, motor-spirits), and nine-fortieths of such duty on all other dutiable goods, except wheat and flour and some other lines which have since been exempted.
As stated above, surtax was not charged on goods which were the produce of the United Kingdom or any British Commonwealth country except Canada, the Union of South Africa, Eire, Newfoundland, or India, on and after the 14th October, 1932, and the primage duty payable on Australian goods in lieu of surtax was also removed as from that date.
A primage duty of 3 per cent. was charged, as from the 31st July, 1931, on imports from all countries which were otherwise free of duty. Certain specified items were, however, exempted from primage duty.
The following is a list of the principal items which are free of duty (and in some cases are also exempt from primage duty) under the Customs Acts Amendment Act, 1934.
Free in any Case.—Live animals; barley (if to be used as stock-food); bran; pollard; seeds; vegetable butters or fats; currants; dates; figs; prunes; glucose and caramel; nuts, except walnuts; rice; acids, other than acetic; inorganic salts of metallic elements, and many other drugs and chemicals; certain surgical appliances; bags and sacks of jute, &c.; woolpacks; raw cotton; hatmakers' materials; buttons; needles and pins; wadding; cotton piece-goods for meat-wraps and cheese-bandages; umbrella-makers' materials; upholsterers' materials; coir, flax, and jute yarns; grindery; leather made from goat and kid skins; patent leathers; bricks, other than firebricks; marble in the rough; grindstones and whetstones; cinema films (subject however to film-hire tax); bookbinders' materials; cardboard and similar boards; parchment find greaseproof paper; printed books, papers, and music; beekeepers' apparatus; percussion caps, detonators, and explosives; hay-rakes, reapers and binders, mowers, and certain other agricultural implements; certain dairying machinery; sewing machines; iron and other metal in ingots, pigs, or billets; fish and vegetable (other than linseed) oils; kerosene and other refined mineral oils not exceeding in specific gravity 0.860 at 60°F. (other than motor-spirits); waxes; cork; crude tanning materials; manures; skins and hides.
Free if British, but dutiable under General Tariff.—Bananas; oranges, mandarins, and grape-fruit; raisins; infants' and invalids' foods; mustard; salt; cocoa-beans; raw coffee; sago and tapioca; cornflour; macaroni; acetic acid; cream of tartar; disinfectants; chloroform and other anaesthetics; antiseptics; manufactured dyes; most surgical, dental, optical, and scientific instruments and materials; felt, cotton, linen, and canvas piece-goods; silk and artificial silk piece-goods; leather-cloth; oil baize; sewing, &c., cottons and threads; elastics; plain tape; tailors' lining materials; cotton, silk, and artificial silk yarns; plain tablecloths, towels, and similar plain articles; belting (other than leather); children's boots and shoes; gum boots; rubber hose; most rubber manufactures, except tires for motor-vehicles; sheet glass; lenses; watch-glasses; pianos and certain other musical instruments; gramophone records; artists' materials; paperhangings; sensitized surfaces; waxed paper; paper (other than wrapping) in large sheets or rolls; ball bearings; bolts and nuts; rivets and washers; buckles; chains; fire-engines, fire-extinguishers, and other fire-extinguishing appliances; adding and computing machines; typewriters; most electrical apparatus; measuring, testing, &c., appliances; sheep-shearing machines; tractors; artificers', &c., tools; machinery peculiar to industrial processes; iron and other metal in bars or sheets; wire and wire netting; metal cordage; rails for railways and tramways; under-carriage springs and metal fittings for vehicles; asphalt and bitumen; table chinaware.
As previously stated, it is impossible to give any account of the range of duties payable on all of the numerous tariff items, but the duties as at the end of 1948 on some of the principal commodities in general use are mentioned hereunder. It should be noted that, in addition, surtax or primage may also be payable.
Tea.—Tea in bulk, when of British origin, was placed on the free list as early as 1907, when the duty on foreign tea was fixed at 2d. per lb. In 1917 a duty of 3d. per lb. was imposed on British tea, the foreign rate being increased to 5d. per lb. British tea in bulk was again placed on the free list in 1923, and the duty on foreign tea reduced to 2d. Rates of 3d. and 5d. per lb. respectively were reinstated as from 31st July, 1931. On and after 26th July, 1948, a duty of 4d. per lb. was introduced on tea in bulk imported from most-favoured nations, and from the same date all tea imported under the British preferential tariff was exempted from surtax.
Sugar.—Sugar also was placed on the free list in 1907, prior to which the duty was ½d. per lb. Refined sugar of foreign origin was charged ½d. per lb. under the 1921 tariff, the rate being altered in 1923 to 5/16d. and in 1924 to ¼d., irrespective of origin. The duty on refined sugar was increased to ¾d. per lb. in 1931; and raw sugar, which is imported for refinement at Auckland, was made dutiable at ½d. per lb., or, alternatively, ½d. per lb. excise duty on manufacture. An additional ½d. per lb. on both refined and raw sugar was imposed as from 9th February, 1933.
Tobacco.—Prior to the imposition of special war-taxation in 1939, the duties on tobacco were as follows: Cigarettes, exceeding in weight 2½ lb. per 1,000, 10s. 6d. per lb.; cigarettes, not exceeding 2½ lb. per 1,000, 25s. 6d. per 1,000; cigars, 12s. per lb. under the British preferential tariff and 14s. or 16s. under the general tariff; manufactured tobacco, cut, 6s. 10d. per lb., and plug, 6s. 8d. per lb.; unmanufactured tobacco for the manufacture of cigarettes, 3s. per lb.; and unmanufactured tobacco for the manufacture of tobacco, cigars, or snuff, 2s. per lb. In order to assist in financing the expenses of the war, further duties, in addition to those set out above, and equal to 25 per cent. of the duties, were levied as from 27th September, 1939. As from 1st May, 1942, this war impost was replaced by the following specific duties additional to the ordinary revenue duties quoted above: Cigarettes, exceeding 2½ lb. per 1,000, 8s. per lb.; cigarettes, not exceeding 2½ lb. per 1,000, 20s. per 1,000; cigars, 8s. per lb.; tobacco, cut and plug, 7s. 2d. per lb.; tobacco, unmanufactured, for cigarettes, 9d. per lb.; tobacco, unmanufactured, for the manufacture of tobacco, 6d. per lb. As from 31st October, 1947, the duties on unmanufactured tobacco were consolidated and the one rate of 3s. 9d. per lb. now applies to all unmanufactured tobacco imported for manufacturing purposes in a bonded tobacco-factory. As from 26th July, 1948, surtax was removed from the duty on all cigarettes and unmanufactured tobacco imported from most-favoured nations or from any British Commonwealth country. A duty of ½d. British preferential tariff or ¾d. general tariff is levied on each sixty cigarette tubes or papers or the equivalent thereof. The excise duties on tobacco, &c., made in New Zealand are shown later under “Excise Duties.”
Alcoholic Beverages.—Prior to the imposition in 1939 of special taxation for war purposes, the rate of duty payable on most spirituous beverages was 40s. per proof gallon, except rum of foreign origin, which was dutiable at 44s. per proof gallon. Sparkling wine was liable to a duty of 10s. per gallon under the British preferential tariff, 9s. 6d. under the trade agreement with the Union of South Africa, and 13s. or 15s. under the general tariff, and still wines to 4s. and 6s. respectively. Australian and South African still wines were liable to a duty of 5s. 6d. per gallon. The duty on imported beer was 1s. 9d. per gallon under the British preferential tariff, and 3s. under the general tariff. In order to assist in financing the expenses of the war, further duties, in addition to those set out above, and equal to 15 per cent. of the duties, were levied as from 27th September, 1939; these were increased to 50 per cent. as from the 1st May, 1942, except in the case of beer, on which the additional duty is 1s. 3d. per gallon.
On 26th July, 1948, rum, brandy, and gin imported from British Commonwealth countries and most-favoured nations were exempted from surtax and a special most-favoured-nation rate of 15s. per gallon (including the additional 1942 duty) was established for champagne. The excise duty on beer produced in New Zealand is given under “Excise Duties.”
Apparel.—Most apparel pays duty at the rate of 20 per cent. or 25 per cent. under the British preferential tariff and 65 per cent. under the general tariff. The duties on apparel of Canadian and Australian origin vary from the British preferential rates to 40 per cent., 45 per cent., and 55 per cent.
Timber.—Certain types of special timbers and Australian hardwoods, if imported in logs, or rough sawn or rough hewn, are admitted free. Some species of oak timber are free of duty under the British preferential tariff, and dutiable at 6s. per 100 sup. ft. under the general tariff. Other kinds of timber, such as Douglas fir (Oregon pine), redwood, Baltic pine, are subject to the following rates: Logs, round, unworked, 25s. per 100 cubic ft; rough sawn or rough hewn, 7s. 6d. or 9s. 6d. per 100 sup. ft. under the British preferential tariff, and 9s. 6d. or 11s. 6d. under the general tariff; dressed, 19s. per 100 sup. ft. British preferential tariff, and 21s. general tariff. As from 26th July, 1948, the following special rates were fixed in respect of imports from most-favoured nations and in each case surtax was removed from the British preferential rate: redwood and Douglas fir, rough sawn or rough hewn, in large sizes, 8s. 6d. per 100 sup. ft.; Douglas fir, rough sawn or rough hewn, in smaller sizes, 10s. 6d. per 100 sup. ft.; Douglas fir and hemlock, dressed, £1 per 100 sup. ft.
Motor-vehicles. —Motor-vehicles imported in an unassembled or completely knocked-down condition are dutiable at 5 per cent. under the British preferential tariff, 40 per cent. under the most-favoured-nation tariff and 50 per cent. under the general tariff. Assembled motor-vehicles are subject to a duty of 15 per cent. if admissible under the British preferential tariff, 50 per cent. under the most-favoured-nation tariff and 60 per cent. if liable to the general tariff. Special rates apply to vehicles of Canadian origin.
Tires for Motor-vehicles.—Previously dutiable at 10 per cent. ad valorem under the British preferential tariff and 40 per cent. under the general tariff, these were in 1934 made subject to a duty based on the weight of the tires. Pneumatic rubber tires for motor-vehicles, inner tubes of rubber therefor, and moulded rubber strip for repair of such tires are now dutiable at 2 ½d. per lb. under the British preferential tariff and 8d. per lb. under the general tariff. Solid rubber tires are liable to a duty of 1d. per lb. and 4d. per lb. under the British preferential and general tariffs respectively.
Motor-spirits.—Towards the end of 1927 the Motor-spirits Taxation Act of that year imposed a duty of 4d. per gallon (increased in 1930 to 6d.) on motor-spirits. The proceeds of this tax were devoted to roading purposes. In 1931 and 1933 an increase in duty of 2d. per gallon in each year was made, and an additional 4d. per gallon duty was imposed as from 2nd August, 1939. The total duty on motor-spirits is now 1s. 2d. per gallon, plus a surtax of one-twentieth of the duty on foreign.
PROHIBITED AND RESTRICTED IMPORTS.—Full particulars of the goods which are prohibited or restricted from being imported into New Zealand are contained in the publication entitled “The Customs Tariff of New Zealand.”
The Import Control Regulations 1938 (made by Order in Council of 5th December, 1938) prohibit the importation of any goods except in pursuance of a licence under the regulations or of an exemption granted by the Minister of Customs. (See pp. 231–232.)
EXCISE DUTIES.—An important excise duty is that on beer, which up to 1915 was charged at the rate of 3d. per gallon. In that year the beer duty was altered so as to increase according to the specific gravity of the worts used, the rate being 3¾d. per gallon when the specific gravity did not exceed 1,047, and increasing by 1/16d. per gallon for every unit of specific gravity up to 1,055, and by ⅛d. thereafter. On the 2nd August, 1917, the minimum rate of duty for beer was increased from 3¾d. to 4¾d. per gallon, and further (on the 15th September, 1917) to 5¾d., with a maximum of 6d. per gallon. In 1921 a rate of 11 ½d. per gallon (increased to 1s. in 1930, and to 1s. 6d. in 1931) was imposed where the specific gravity of the worts used did not exceed 1,047, the rate being increased by 1/16d. for every unit of specific gravity above 1,047. The basic rate of excise duty on beer was reduced from 1s. 6d. to 1s. 3d. per gallon by the Customs Acts Amendment Act, 1934, but was increased to 1s. 9d. per gallon as from 2nd August, 1939. In order to assist in financing the expenses of the war, a further increase to 2s. per gallon was made as from 27th September, 1939. The duty was again increased on the 11th May, 1942, when provision was also made for a lower alcoholic content. When the specific gravity of the worts was 1,036 the now duty was 3s. per gallon, rising by 1d. for every unit of specific gravity above, and falling by 1d. for every unit below, 1,036, but subject to a minimum of 2s. 3d. per gallon. These duties were further amended as from 22nd August, 1947, by abolishing the reduction of 1d. in the basic duty for every unit of specific gravity below 1,036, so that the duty is now 3s. per gallon where the specific gravity of the worts does not exceed 1,036, increased by 1d. for every unit of specific gravity above 1,036. The specific gravity of distilled water at 60° F. is taken as 1,000, and the specific gravity of the worts is determined in relation thereto.
Prior to the introduction of special taxation for war purposes, cut tobacco was charged an excise duty of 4s. 6d. per lb.; other tobacco, 4s. 4d. per lb. Cigars and snuff paid 6s. per lb., and the excise duty on cigarettes made in New Zealand was 13s. 6d. per 1,000 on cigarettes not exceeding in weight 2½ lb. per 1,000, and 5s. 6d. per lb. on cigarettes over 2½ lb. per 1,000. A war surcharge of 25 per cent. of the excise duty on tobacco, cigars, cigarettes, and snuff was levied as from 27th September, 1939, but this was replaced on the 1st May, 1942, by additional taxation similar to that imposed on imported tobacco, &c. (see page 252). An excise duty of ½d. is levied on each sixty cigarette tubes or papers or the equivalent thereof.
The Customs Acts Amendment Act, 1931, imposed an excise duty of ½d. per lb. (increased to 1d. per lb. from 9th February, 1933) on sugar manufactured in New Zealand.
Excise duties were formerly levied direct on certain manufactures the preparation of which involved the use of a considerable proportion of spirits. In lieu of excise duty on the finished manufactured article, however, a special schedule of duties has been provided since 1921 on imported alcohol used in manufacturing these articles in licensed warehouses. The present rates are: On alcohol used in the manufacture of—perfumed spirits, 36s. per proof gallon; toilet preparations, 34s.; culinary and flavouring essences, 20s.; medicinal preparations containing more than 50 per cent. of proof spirit, 4s. 6d. per gallon. In similar medicinal preparations containing less than 50 per cent. the alcohol used is duty-free.
EXPORT DUTIES.—The Gold Duty Act of 1858, amended from time to time, first imposed an export duty on gold. Under the Gold Duty Abolition and Mining Property Rating Act of 1890, the export duty on South Island gold was replaced by a system of rating mining property. The consolidating Gold Duty Act of 1908 maintained an export duty of 2s. per ounce of 20 carats fineness on gold produced in or exported from the North Island. A further export duty of 6d. per ounce (on gold of New Zealand origin only, and exclusive of gold produced by alluvial or dredge mining) was levied by the Mining Act of 1926, and this additional duty applied also to South Island gold. The Customs Acts Amendment Act passed in February, 1933, imposed an additional export duty of 12s. 6d. per ounce troy weight of gold of the fineness of 20 carats and upwards, and covered all gold, with certain minor exceptions, wherever produced or exported. Provision was made for reduction, by Order in Council, of the rate of duty in the event of a reduction in the value of gold in New Zealand. In order to assist in financing the expenses of the war, a further duty was imposed as from 27th September, 1939, of an amount equal to 75 per cent. of the excess of the London market value of gold (expressed in New Zealand currency), an on the date when the gold is laden upon the exporting ship or when it is posted, to an overseas address, over the value of that gold if it is computed at the rate of £9 5s. 8d. (Now Zealand currency) for every ounce troy weight of gold of the fineness of 24 carats. This percentage was reduced to 40 per cent. as from 7th December, 1945, and on the 16th August, 1946, the remainder of this additional duty was removed. On gold exported after 19th August, 1948, the duty of 12s. 6d. per ounce imposed in 1933 was also removed, so that the only duties now applying are those levied under the Gold Duty Act, 1908, and the Mining Act, 1926.
An export duty was also imposed on timber (white-pine and kauri) by Acts of 1901 and 1903, and still operates. The present rates of 5s. per 100 superficial feet on logs, and 3s. or 5s. per 100 superficial feet on flitches, were imposed by the Timber Export Duty Order of 23rd June, 1937. This duty is not payable in respect of sawn timbers.
The Customs Department collects the levies imposed on hides and honey exported. The proceeds (less expenses of collection) are, however, handed over to the respective Boards set up to control the export, &c., of these commodities in the interests of the producers. The Wool Industry Act, 1944, provides for a levy on all wool exported or delivered to a wool-manufacturer for use in New Zealand and the proceeds- less cost of collection, &c., are payable to the New Zealand Wool Board established under the Act, to enable it to carry out its functions. At the present time, however, the provisions in regard to the payment of the levy are suspended, but an equivalent amount is received by the Board from the contributory charge imposed by the Wool Disposal Act, 1945 (see Section 18 C). Prior to the passing of the Wool Industry Act, 1944, a similar levy was payable under the authority of the Wool Industry Promotion Act, 1936, on, wool exported only.
CUSTOMS REVENUE.—In the earlier years of New Zealand's history the revenue derived from Customs and excise duties produced a greater proportion of the total revenue from taxation than it does to-day. For a considerable period prior to 1914, there was a constant tendency for this proportion to decrease, and the taxation legislation of the 1914–18 war period temporarily accelerated the movement. From 1921–22 to 1925–26 the percentage rose continuously, but did not regain its former proportions. A gradual decline then commenced and, with one slight interruption (1935–36) continued up to and including 1945–46. The low percentages following the year 1938–39 were the result of the huge increase in taxation imposed for war purposes, only a small proportion of which was derived from Customs and excise duties. The amount of war taxation received by way of Customs and excise duties in 1945–46 was only £4,574,021 out of a total war taxation of £51,416,847. The rise shown in the latest two years is accounted for by a substantial increase in dutiable imports, particularly so in the year ended 31st March, 1948. The figures for the last twenty years are as follows:—
| Year ended 31st March, | Total Taxation. | Customs and Excise Duties. | |
|---|---|---|---|
| Amount. | Percentage of Total Taxation. | ||
| £ | £ | Per Cent. | |
| 1929 | 17,835,122 | 8,565,736 | 48.03 |
| 1930 | 19,474,091 | 9,517,359 | 48.87 |
| 1931 | 18,880,809 | 8,181,076 | 43.33 |
| 1932 | 17,407,829 | 6,545,428 | 37.60 |
| 1933 | 19,705,676 | 6,785,641 | 34.43 |
| 1934 | 21,473,406 | 7,140,478 | 33.25 |
| 1935 | 24,739,409 | 8,094,605 | 32.72 |
| 1936 | 25,478,598 | 8,876,203 | 34.84 |
| 1937 | 31,181,603 | 10,340,838 | 33.16 |
| 1938 | 36,798,971 | 11,737,170 | 31.90 |
| 1939 | 37,797,904 | 11,727,224 | 31.03 |
| 1940 | 44,522,028 | 11,734,784 | 26.36 |
| 1941 | 61,360,840 | 11,258,370 | 18.35 |
| 1942 | 68,163,255 | 10,622,092 | 15.58 |
| 1943 | 87,940,844 | 12,342,115 | 14.03 |
| 1944 | 100,839,484 | 13,922,574 | 13.81 |
| 1945 | 108,681,814 | 14,869,449 | 13.68 |
| 1946 | 114,954,873 | 15,682,637 | 13.64 |
| 1947 | 113,119,046 | 19,970,492 | 17.65 |
| 1948 | 122,275,911 | 28,794,932 | 23.55 |
The figures for Customs and excise duties are exclusive of tire-tax, and the highways proportion (6d. per gallon) of the motor-spirits tax—two classes of duties collected through the Customs for road-maintenance purposes, and included in total taxation. Figures given under the heading of Customs and excise duties include for 1939–40 and subsequent years the amounts received on account of additional rates imposed on certain commodities for war purposes. Most of these additional rates are still in operation. In this respect they differ from the two subsequent tables, from which this additional taxation has been specially excluded in order to maintain comparability.
The Customs and excise duties received during the last four financial years available are shown in more detail in the next table. The figures have been rounded off to the nearest thousand and are provisional for the two latest years. Primage duties and surtax are included, but not tire-tax or the highways proportion of petrol-tax, which do not really represent Customs taxation, although levied on imports and for the sake of convenience collected through the Customs. The additional revenue received as the result of wartime increases in the rates is also excluded.
| — | 1943–44. | 1944–45. | 1945–46.* | 1946–47.* |
|---|---|---|---|---|
* Provisional. | ||||
| Customs Duties— | £ | £ | £ | £ |
| Wines and spirits | 406,000 | 390,000 | 441,000 | 540,000 |
| Cigars, cigarettes and snuff, and tobacco | 497,000 | 592,000 | 486,000 | 1,262,000 |
| Motor-spirits | 1,828,000 | 2,012,000 | 2,568,000 | 3,335,000 |
| Other duties | 2,030,000 | 2,450,000 | 2,333,000 | 4,706,000 |
| Primage | 379,000 | 446,000 | 414,000 | |
| Surtax | 458,000 | 475,000 | 384,000 | |
| Totals, Customs duties | 5,598,000 | 6,365,000 | 6,626,000 | 9,843,000 |
| Excise Duties— | ||||
| Alcohol used in perfumed spirit, &c., in New Zealand | 42,000 | 33,000 | 37,000 | 47,000 |
| Cigarette papers and tubes | 61,000 | 58,000 | 62,000 | 47,000 |
| Tobacco, cigars, cigarettes and snuff, New Zealand manufactured | 1,464,000 | 1,547,000 | 1,633,000 | 1,677,000 |
| Beer, New Zealand | 2,042,000 | 2,074,000 | 2,309,000 | 2,423,000 |
| Sugar | 553,000 | 616,000 | 594,000 | 679,000 |
| Totals, excise duties | 4,162,000 | 4,328,000 | 4,635,000 | 4,873,000 |
| Revenue per head— | £ s. d. | £ s. d. | £ s. d. | £ s. d. |
| From Customs duties | 3 8 4 | 3 16 6 | 3 17 5 | 5 11 1 |
| From Excise duties | 2 10 10 | 2 12 0 | 2 14 2 | 2 15 0 |
| Totals | 5 19 2 | 6 8 6 | 6 11 7 | 8 6 1 |
The following table furnishes a general view of the ratio of Customs revenue to merchandise imports at intervals since 1895, which is taken as the base year.
| Calendar Year. | Merchandise Imports. | Revenue (excluding Excise Duties). | Percentage of Revenue to Total Imports. | Index Numbers of Customs Revenue compared with Imports. | |||
|---|---|---|---|---|---|---|---|
| Value. | Value per Head. | Amount. | Actual Rate per Head. | Rate per Head at 1895 Ratio. | |||
* Figures relate to twelve months beginning 1st April of year stated, and are provisional. | |||||||
| £ | £ s. d. | £ | £ s. d. | £ s. d. | Per Cent. | ||
| 1895 | 6,115,953 | 8 6 7 | 1,619,970 | 2 4 1 | 2 4 1 | 26.49 | 1000 |
| 1900 | 10,207,326 | 12 14 6 | 2,170,354 | 2 14 1 | 3 7 4 | 21.26 | 803 |
| 1905 | 12,481,178 | 13 13 4 | 2,652,666 | 2 18 1 | 3 12 4 | 21.25 | 802 |
| 1910 | 16,748,223 | 16 1 11 | 2,954,989 | 2 16 9 | 4 5 2 | 17.64 | 666 |
| 1915 | 20,658,720 | 17 19 6 | 3,190,883 | 2 15 6 | 4 15 2 | 15.45 | 583 |
| 1920 | 61,553,853 | 49 10 11 | 7,953,477 | 6 9 7 | 13 5 6 | 12.92 | 488 |
| 1925 | 52,425,757 | 37 17 4 | 8,287,288 | 5 19 9 | 10 0 7 | 15.81 | 597 |
| 1930 | 44,339,654 | 29 14 0 | 7,776,103 | 5 4 2 | 7 17 4 | 17.54 | 662 |
| 1935 | 36,317,267 | 23 4 11 | 6,353,911 | 4 1 4 | 6 3 2 | 17.50 | 661 |
| 1940 | 48,997,669 | 29 18 6 | 7,079,396 | 4 6 6 | 7 18 7 | 14.45 | 545 |
| 1941 | 49,167,010 | 30 2 11 | 6,354,667 | 3 17 11 | 7 19 9 | 12.92 | 488 |
| 1942 | 53,856,012 | 32 16 11 | 5,020,946 | 3 1 3 | 8 13 11 | 9.32 | 352 |
| 1943 | 95,242,330 | 58 4 7 | 5,514,165 | 3 7 5 | 15 8 6 | 5.79 | 219 |
| 1944 | 86,397,212 | 52 3 7 | 6,322,272 | 3 16 4 | 13 16 5 | 7.32 | 276 |
| 1945* | 56,987,882 | 33 6 2 | 6,626,000 | 3 17 5 | 8 16 4 | 11.63 | 439 |
| 1946* | 81,795,677 | 46 2 10 | 9,843,000 | 5 11 1 | 12 4 6 | 12.03 | 454 |
The figures given in the column “Rate per head at 1895 ratio” indicate the amount of revenue per head of population which would have been obtained had the same ratio of Customs taxation to imports prevailed as in 1895.
Substantial reductions in the scale of duties were responsible for the sharp fall in the percentage of revenue to imports between 189/3 and 1920. The percentage rose again after 1920, duo partly to heavier taxation and partly to a rise in the proportion of imports from foreign countries. To some extent also the position is affected by a change from the 1st April, 1926, in the system of computation for British preference purposes in the case of articles only partly manufactured in British Commonwealth countries. The high proportion of duty-free items of defence materials and equipment imported by the Government accounts for the very low percentages recorded during the war years from 1940 onwards.
PREFERENCE AND RECIPROCITY.— Preference to British Commonwealth countries in respect of certain commodities was provided for in the earliest tariff in force in New Zealand—that introduced in 1841. The amended tariff of 1844 involved the dropping of this preference to British goods, but two years later preference was again introduced.
The first definite attempt at reciprocity was made in 1870, when the Colonial Reciprocity Act gave power to the Government to make reciprocal agreements with the Australian States, including Tasmania; but this Act failed to receive the Royal assent and consequently lapsed.
In 1895, however, the Customs Duties Reciprocity Act received the Royal assent, and ratified an agreement which had been tentatively proposed with South Australia, besides giving power to the Government to make further agreements with the other Australian States. In 1907 the New Zealand and South African Customs Treaty was negotiated. A tariff agreement with the Australian Commonwealth has been in operation since 1922, and with Canada since 1932.
Imperial preference proper was introduced in New Zealand by the Preferential and Reciprocal Trade Act, 1903, which followed the lead given by Canada. At first only a few items were covered by the extra duties levied upon goods of foreign origin, but the Tariff Act of 1907 extended this additional preferential duty to a great number of items. The effect of the 1921, 1927, 1930, and 1934 tariffs has been to widen the disparity in the duty as between goods of British Commonwealth countries and those of foreign origin. Under the Ottawa agreement, New Zealand undertook to preserve the existing margins of preference on United Kingdom goods where the margin of preference did not exceed 20 per cent., and where the margin exceeded that figure not to reduce it below 20 per cent. without the consent of the Government of the United Kingdom. In the tariff of 1934, where reductions in duty were made under the British preferential tariff, the rates of duty under the general (foreign) tariff were, except in a few cases, retained.
The following are the classes of goods which are deemed to be the produce or manufacture of countries and which are entitled to be entered for duty at British preferential rates:—
Goods wholly the produce of such countries:
Goods wholly manufactured in such countries from unmanufactured raw material and/or from one or more of the imported partly manufactured raw materials which are enumerated in the regulations:
Goods partially manufactured in such countries, provided that the final process of manufacture has been performed in such countries, and also that the expenditure in material produced in such countries and/or labour performed within such countries in each and every article is not less than one-half of the factory or works cost of such article in its finished state.
The conditions applying to British Commonwealth countries, the products of which are admissable under the British preferential tariff pursuant to agreements made by New Zealand with such countries, may be varied to suit the provisions of such agreements.
Prior to the 1st April, 1926, the minimum mentioned in paragraph (c), which is now one-half, was one-fourth.
In the calculation of the proportion of produce or labour none of the following items is to be included or considered:—
Manufacturer's profit, or the profit or remuneration of any trader, agent, broker or other person dealing in the article in its finished condition:
Royalties payable in respect of the finished goods:
The cost of outside packages or any cost of packing the goods thereinto:
Administrative and general office expenses:
Any cost of conveying, insuring, or shipping the goods subsequent to their manufacture:
Any other charges incurred subsequent to the completion of the manufacture of the goods.
Tea to be entitled to he entered at British preferential rates must have been grown in some part of the British Commonwealth, and the final process of manufacture must also have been performed in some country of the British Commonwealth.
Certain imports from Australia and Canada pay more than corresponding items from other Commonwealth countries.
Reciprocity with the Union of South Africa.—As already stated, there was inaugurated in 1907 a reciprocal arrangement with the Union of South Africa whereby products of that country, when imported direct, were admitted into New Zealand at reduced rates of duty, in return for similar concessions granted by South Africa in respect of New Zealand products. This agreement was revised in 1922, the duties on wines being increased, and tobacco being deleted from the list. A further alteration, whereby maize and dried apples were deleted from the list, was made in 1925. Dried fruits formerly came under the agreement, being admitted free when the general tariff was 4d. per pound and the British preferential rate 2d. On 1st January, 1934, however, the general tariff was reduced to 2d. and the British rate made free.
The items specially provided for in the agreement were feathers, fish, fresh fruit, dried fruit, tea, and wine; while in the case of all other dutiable goods, with the exception of spirits and tobacco, a reduction of 3 per cent. of the duty payable was made.
The legislation giving effect to the arrangement with the Union of South Africa was revoked by the General Agreement on Tariffs and Trade Act, 1948, although that Act provides for the continuation of most of the concessions previously granted.
The following table shows the merchandise trade with the Union of South Africa during the eleven years ended in 1947.
| Year. | Merchandise Imports. | Merchandise Exports to Union of South Africa. | |
|---|---|---|---|
| From Union of South Africa. | Of Union of South Africa Origin. | ||
* Provisional. | |||
| £ | £ | £ | |
| 1937 | 128,073 | 131,970 | 29,554 |
| 1938 | 90,266 | 90,682 | 19,357 |
| 1939 | 76,575 | 79,540 | 60,095 |
| 1940 | 112,478 | 118,142 | 21,699 |
| 1941 | 135,571 | 131,161 | 24,205 |
| 1942 | 207,426 | 210,173 | 19,521 |
| 1943 | 91,273 | 93,389 | 26,882 |
| 1944 | 82,356 | 86,881 | 48,033 |
| 1945* | 232,109 | 241,571 | 184,721 |
| 1946* | 221,511 | 220,795 | 58,776 |
| 1947* | 494,169 | 498,685 | 65,064 |
Reciprocity with Australia.—A trade agreement between Australia and New Zealand was first entered into on the 11th April, 1922. Under this agreement each country granted to goods of the other the benefits of its British preferential tariff, except with regard to certain classes of goods on which special rates were fixed.
During 1933 a Minister of the Commonwealth Government visited New Zealand to discuss the commercial relations between the two countries. A provisional agreement was reached in April, 1933, and confirmed by the Trade Agreement (New Zealand and Australia) Ratification Act, 1933. The new agreement came into operation from 1st December, 1933.
Under the agreement lower duties than those under the British preferential tariff on New Zealand products entering Australia are provided for on many lines, the chief of which are: Stilton cheese; fresh and frozen fish and fish pastes; dried peas; hay; chaff; fresh, smoked, and preserved meats; onions; lucerne-seed; wine; furs; hats; caps; floor-rugs; various agricultural and dairying implements; whale-oil; casein; sugar of milk; and timber.
The agreement provides that goods which are partially manufactured in Australia or New Zealand shall not be regarded as the produce or manufacture of Australia or New Zealand unless the expenditure in material produced in either country and/or labour performed within either country represents not less than one-half of the factory or works cost of the goods in their finished state.
Merchandise trade between New Zealand and Australia during the eleven years ended in 1947 has been as follows:—
| Year. | Imports from Australia. | Imports of Australian Origin. | Exports to Australia. |
|---|---|---|---|
* Provisional. | |||
| £ | £ | £ | |
| 1937 | 6,943,838 | 6,595,605 | 1,824,183 |
| 1938 | 7,468,987 | 7,159,428 | 2,189,454 |
| 1939 | 6,738,988 | 6,419,469 | 2,256,007 |
| 1940 | 8,219,367 | 7,817,601 | 2,159,339 |
| 1941 | 8,865,812 | 8,023,698 | 2,400,266 |
| 1942 | 8,789,804 | 8,142,273 | 2,717,619 |
| 1943 | 10,354,786 | 10,160,380 | 2,849,125 |
| 1944 | 10,483,555 | 10,277,373 | 3,092,981 |
| 1945* | 8,642,660 | 8,319,631 | 4,353,977 |
| 1946* | 10,723,282 | 10,419,768 | 3,627,323 |
| 1947* | 15,476,834 | 14,942,154 | 4,095,981 |
Article IX of the agreement provides that, where with respect to any goods not specially enumerated in the agreement the rate of duty thereon under the New Zealand British preferential tariff is less than the duty under the Australian British preferential tariff, the New Zealand Government may request the Australian Government to admit into the Commonwealth New-Zealand-produced goods of such class at the rate of duty chargeable on goods of that class under the New Zealand British preferential tariff. If within three calendar months after the receipt of the request the Australian Government does not comply therewith, the New Zealand Government may, without further notice, impose on such goods of Australian origin a rate of duty not being greater than the rate of duty for the time being in force in Australia on the like goods under the Australian British preferential tariff. A similar provision is made with respect to the admission of Australian-produced goods into New Zealand.
The rates of duty payable on Australian goods imported into New Zealand and not specifically mentioned in the agreement are automatically affected by changes in the New Zealand British preferential tariff. A modification of the agreement was made in May, 1935, whereunder the duty on certain Australian goods which would otherwise have been reduced or removed from 1st June, 1936, following changes made in the British preferential tariff by the Customs Acts Amendment Act, 1934, remained unaltered.
The duties on many Australian goods were increased as from 1st March, 1938, by an Order in Council made on the 26th February, 1938, while the duties on fresh grapes, canned pineapples, slippers, boots and shoes, and certain types of refrigerating units were reduced as from 26th July, 1948, by the Trade Agreement (Australia) Order 1948.
Reciprocity with Canada.—From October, 1925, reciprocal trade arrangements with respect to certain items of Canada - New Zealand trade were in force, but ceased in May, 1930.
Negotiations between the Canadian and New Zealand Governments bore fruit in a trade agreement which came into force in both countries for a period originally of one year, as from the 24th May, 1932. This agreement has been extended from time to time, and is now to continue in force indefinitely.
By Order in Council dated 21st July, 1948, the duties on canned fish and certain types of refrigerating units were reduced as from 26th July, 1948, and the duties on slippers, boots and shoes, and motor-vehicles were consolidated by the absorption of surtax into the ad valorem rate.
Under the present Canadian tariff on Now Zealand produce are included, inter alia: Butter, 5 cents per lb.; cheese, 1 cent per lb.; and lamb and mutton,½ cent per lb.; while sausage-casings, hides and skins, wool, apples, seeds, kauri-gum, and phormium fibre are amongst commodities admitted free.
The rates of duty payable in New Zealand on certain imports from Canada are as under: Canned fish, 1 ½d. per lb.; silk or artificial silk stockings, 55 per cent.; electric cooking and heating appliances, 30 per cent.; certain agricultural implements, 35 per cent.; timber, 7s. 6d. or 9s. 6d. (rough sawn) and 19s. (sawn and dressed) per 100 sup. ft. Canadian goods not mentioned in the agreement enter New Zealand at the ordinary British preferential rates of duty. In some instances where the British preferential rates of duty were reduced by the 1934 tariff the rates on certain Canadian goods mentioned in the agreement were also reduced to the British preferential level. Special duties are payable on motor-vehicles of Canadian origin, these duties varying according to the Canadian content.
Other Trade Arrangements.—New Zealand is also a party to certain commercial treaties, conventions, or arrangements with countries other than those referred to above. Particulars of the trade agreements with certain European countries are contained in the 1940 and previous issues of the Year-Book, but, owing to the war with Germany and its subsequent effects, these agreements became largely inoperative. In certain instances the agreements referred to became applicable to New Zealand automatically as a member of the British Commonwealth, while in others New Zealand became a party by signifying her willingness to adhere to treaties negotiated by the United Kingdom. New Zealand also in some cases entered into agreements with foreign countries by direct negotiation with those countries, and in others the United Kingdom acted for New Zealand in making trade agreements on her behalf. In some instances the trade involved is insignificant.
By Order in Council of the 21st February, 1934, the duties and exemptions from duty provided for in the Trade Arrangement (Belgium and New Zealand) Ratification Act, 1933, were applied to similar goods being the produce or manufacture of the following countries: Argentina, Brazil, China, Czechoslovakia, Egypt, Finland, Germany, Hungary, Italy, Japan, Norway, and Spain. Sweden was added to the list of countries by Order in Council of the 7th June, 1935, and Greece by Order in Council of 22nd October, 1936. By an Order in Council of the 28th October, 1941, Japan was eliminated from the above list, and after a further Order in Council of the 17th October, 1945, had taken effect, four more countries were eliminated—viz., Finland, Germany, Hungary, and Italy.
Direct trade arrangements were also entered into with the Netherlands and Switzerland.
The Customs (Tariff Preference and General) Regulations, 1936, set out the classes of goods from foreign countries which may be entered at concessional rates of duty applying to any such countries as a result of treaty obligations between New Zealand and such countries, viz:—
Goods wholly the produce of such a country:
Goods wholly manufactured in such a country from unmanufactured raw materials:
Goods partially manufactured in such a country, provided (1) that the final process of manufacture has been performed in that country or in any British country the produce or manufactures of which are entitled to be entered under the British preferential tariff otherwise than pursuant to any agreement or arrangement made between Now Zealand and such country; (2) that the expenditure in material the produce of that country, and/or in labour performed in that country, on each and every article is not less than one-half of the factory or works cost of such article in its finished state.
GENERAL AGREEMENT ON TARIFFS AND TRADE (GENEVA).—At its first meeting in February, 1946, the Economic and Social Council of the United Nations set up a Preparatory Committee to prepare the ground for an International Conference on Trade and Employment, and New Zealand was appointed a member.
At the Committee's first session in London during October and November, 1946, a provisional draft charter for an International Trade Organization was adopted, and the important step was taken of drawing up a procedure for the negotiation of a multilateral trade agreement embodying tariff concessions by the participating countries.
These tariff negotiations took place during the second session of the Preparatory Committee in Geneva in 1947, and the concessions given by each country were embodied in schedules to a General Agreement on Tariffs and Trade. The tariff negotiations themselves were bilateral but all the concessions were applied multi-laterally, so that New Zealand receives the benefit of reductions made by all participants, and, conversely. New Zealand's concessions apply to all the other countries which took part. In addition, existing commitments required that they should be extended to several non-participating countries to which New Zealand had already granted most-favoured-nation treatment.
Concessions are of two kinds—actual reductions of duties and bindings of duties against increase.
The Agreement was applied provisionally by New Zealand on 26th July, 1948.
The tariff concessions made by New Zealand are set out in the First Schedule to the General Agreement on Tariffs and Trade Act, 1948, and, in more detail, showing comparisons with the rates previously ruling, in a pamphlet published by the Government Printer under the title “General Agreement on Tariffs and Trade: Rates of duty proposed under New Zealand Customs Tariff to give effect to the General Agreement on Tariffs and Trade.”
The existing arrangements with Belgium and the Netherlands have been superseded by the General Agreement.
The countries to whose products the concessional rates of duty apply (i.e., the most-favoured nations) were proclaimed in the General Agreement on Tariffs and Trade Provisional Application Order, 1948, and are as follows: Argentina, Belgium (including overseas territories), Brazil, Chile, China, Cuba, Czechoslovakia, Egypt, France (including overseas territories), Greece, Lebanon, Luxemburg, Netherlands (including overseas territories), Norway, Spain, Sweden, Syria, United States of America. By virtue of an existing trade arrangement, most-favoured-nation rates are also applied to certain products of Swiss origin.
Some of the more important products of those countries in respect of which concessions have been made are as follows: onions; tea; raw coffee; raisins; oranges; certain canned fruits; spices; sago; matches; tapioca; cornflour; cigars; cigarettes; tobacco; rum; brandy; gin; wines; flavouring essences; surgical and dental instruments; carpets; linoleum; lace; sewing cotton; woollen piece-goods; belting for machinery; leather manufactures; chinaware; glassware; clocks; fancy goods; toys; sporting requisites; certain musical instruments: gramophones; cameras and photographic goods; toilet preparations; tobacco pipes; paperhangings; certain types of paper; adding and accounting machines; cash registers; typewriters; duplicating-machines; certain lawn-mowers, power operated; engines for motor-cycles, other motor-vehicles, and tractors; certain electrical machinery and appliances; certain mining and quarrying machinery; tractors; certain industrial machinery; refrigerators; hardware; wire; certain pipes and tubes; wire netting; bicycles; motor-cycles; motor-vehicles; certain timbers.
THE tonnage of all shipping arriving at or departing from New Zealand ports is recorded by the Customs authorities. On the arrival or departure of an overseas merchant vessel, foreign or coastwise, the master or owner must “enter” or “clear” the vessel with the Collector of Customs of the port concerned. The same procedure is followed in recording the movement of coastal shipping.
The figures given in this section include all registered merchant vessels trading at New Zealand ports: thus they exclude naval vessels when engaged in their normal duties, private launches, lighters engaged in loading or unloading vessels in roadsteads, trawlers and other fishing vessels, and yachts when not employed in trading. Merchant vessels used in the transport of troops are included.
OVERSEAS SHIPPING.—In recording the following statistics only one entry and one clearance is counted for each voyage: at the first port of call and the port of final departure, regardless of the number of ports visited by the vessel while in New Zealand waters. Movements of overseas shipping between ports in New Zealand are treated as coastwise shipping.
However, statistics are also compiled (vide page 265) showing the relative overseas trade of the various ports, wherein every overseas vessel is recorded, whether entered or cleared, overseas or coastwise.
The following table gives the number and net tonnage of overseas vessels entering and clearing New Zealand ports during the years 1937–47, distinguishing those entered and cleared “with cargo” from those “in ballast.”
| Year. | With Cargo. | In Ballast.* | Total. | |||
|---|---|---|---|---|---|---|
| Vessels. | Tonnage. | Vessels. | Tonnage. | Vessels. | Tonnage. | |
* “In ballast” means (a) inwards—“having no cargo for discharge in New Zealand”; (b) outwards—“having no cargo loaded in New Zealand.” | ||||||
| Entered | ||||||
| 1937 | 567 | 2,461,296 | 64 | 501,584 | 631 | 2,962,880 |
| 1938 | 583 | 2,522,310 | 77 | 562,395 | 660 | 3,084,705 |
| 1939 | 557 | 2,415,352 | 77 | 549,585 | 634 | 2,964,937 |
| 1940 | 518 | 2,172,557 | 82 | 662,810 | 600 | 2,835,367 |
| 1941 | 408 | 1,712,453 | 98 | 604,675 | 506 | 2,317,128 |
| 1942 | 363 | 1,414,632 | 155 | 883,507 | 518 | 2,298,139 |
| 1943 | 320 | 1,230,295 | 161 | 834,199 | 481 | 2,064,494 |
| 1944 | 295 | 1,067,532 | 151 | 721,155 | 446 | 1,788,687 |
| 1945 | 275 | 1,096,385 | 138 | 722,574 | 413 | 1,818,959 |
| 1946 | 344 | 1,485,419 | 118 | 656,107 | 462 | 2,141,526 |
| 1947 | 414 | 1,812,70 | 52 | 245,288 | 466 | 2,057,991 |
| Cleared | ||||||
| 1937 | 419 | 2,035,958 | 193 | 841,971 | 612 | 2,877,929 |
| 1938 | 440 | 2,137,239 | 216 | 964,818 | 656 | 3,102,057 |
| 1939 | 432 | 2,142,675 | 217 | 876,984 | 649 | 3,019,659 |
| 1949 | 389 | 1,917,720 | 212 | 916,779 | 601 | 2,834,499 |
| 1941 | 323 | 1,539,473 | 185 | 769,841 | 508 | 2,309,314 |
| 1942 | 292 | 1,319,805 | 225 | 969,656 | 517 | 2,289,461 |
| 1943 | 250 | 1,019,390 | 222 | 1,026,888 | 472 | 2,046,278 |
| 1944 | 227 | 918,463 | 230 | 864,523 | 457 | 1,782,986 |
| 1945 | 255 | 1,108,877 | 158 | 727,850 | 413 | 1,836,727 |
| 1946 | 284 | 1,343,658 | 151 | 689,169 | 435 | 2,032,827 |
| 1947 | 296 | 1,285,440 | 167 | 769,243 | 463 | 2,054,683 |
The ballast figures include vessels embarking and disembarking passengers only,' or entering for, or clearing with, bunkers and stores only, as well as the normal ballast movement.
Ports of Arrival and Departure.—The next table shows the extent to which various ports were made the first port of arrival or the last port of departure by overseas vessels during the last three years. The figures should not be regarded as indicating the relative overseas trade of the various ports.
| Port. | Entered. | Cleared. | ||||
|---|---|---|---|---|---|---|
| 1945. | 1946. | 1947. | 1945. | 1946. | 1947. | |
| Net Tons. | Net Tons. | Net Tons. | Net Tons. | Net Tons. | Net Tons. | |
| Auckland | 788,527 | 1,049,542 | 1,137,326 | 565,976 | 763,876 | 767,735 |
| Napier | 57,017 | 57,709 | 44,923 | 86,447 | 104,321 | 114,991 |
| New Plymouth | 58,550 | 75,263 | 78,877 | 38,175 | 42,611 | 73,641 |
| Wanganui | 347 | |||||
| Wellington | 610,033 | 644,166 | 533,891 | 757,379 | 752,419 | 672,035 |
| Picton | 4,245 | |||||
| Nelson | 6,021 | 10,689 | 29,303 | |||
| Westport | 4,504 | |||||
| Greymouth | 974 | 321 | 963 | |||
| Lyttelton | 165,611 | 193,545 | 187,010 | 209,512 | 219,752 | 179,706 |
| Timaru | 39,155 | 27,733 | 7,230 | 21,517 | 3,454 | 13,342 |
| Dunedin | 45,884 | 37,472 | 48,289 | 108,461 | 94,580 | 149,949 |
| Bluff | 48,963 | 51,271 | 19,482 | 42,892 | 41,125 | 53,981 |
| Totals | 1,818,959 | 2,141,526 | 2,057,991 | 1,836,727 | 2,032,827 | 2,054,683 |
Figures for the last five years show that 81 per cent. of overseas vessels (on a tonnage basis) arriving in New Zealand made Auckland or Wellington their first port of entry.
For the same period, and again on a tonnage basis, 74 per cent. of overseas vessels finally departing from New Zealand were cleared from either Auckland or Wellington.
Direction of Overseas Shipping.—Particulars of the number and net tonnage of vessels entered and cleared between New Zealand and various countries during 1938 and 1947 are given in the following table.
| — | 1938. | 1947. | ||||||
|---|---|---|---|---|---|---|---|---|
| Entered. | Cleared. | Entered. | Cleared. | |||||
| No. | Tonnage. | No. | Tonnage. | No. | Tonnage. | No. | Tonnage. | |
| United Kingdom | 89 | 604,088 | 121 | 784,683 | 61 | 416,824 | 130 | 772,882 |
| India and Pakistan | 3 | 16,380 | 2 | 10,919 | 5 | 20,617 | 4 | 18,080 |
| Seychelles Islands | 6 | 14,064 | ||||||
| Malaya and Singapore | 4 | 15,665 | 3 | 9,174 | ||||
| Union of South Africa | 3 | 17,028 | 1 | 3,607 | 4 | 19,263 | ||
| Canada | 43 | 234,517 | 14 | 125,036 | 33 | 137,267 | 12 | 44,717 |
| Australia | 308 | 1,358,630 | 333 | 1,412,519 | 167 | 591,634 | 172 | 576,481 |
| Fiji | 15 | 29,170 | 14 | 32,048 | 12 | 39,381 | 9 | 27,038 |
| Gilbert and Ellice Islands | 13 | 39,642 | 11 | 33,253 | 2 | 8,300 | 5 | 20,772 |
| Nauru Island | 19 | 59,362 | 20 | 62,057 | 6 | 21,646 | 7 | 28,012 |
| Tonga | 4 | 13,308 | 7 | 15,151 | 1 | 35 | ||
| Western Samoa | 14 | 11,914 | 12 | 9,048 | 10 | 19,762 | 11 | 21,138 |
| Belgium | 8 | 23,287 | 3 | 16,131 | ||||
| Bahrein Islands | 4 | 22,493 | 2 | 10,355 | 10 | 59,221 | 8 | 42,514 |
| French Indo-China | 10 | 27,431 | 9 | 24,373 | 1 | 4,380 | ||
| Iran | 1 | 4,211 | 24 | 129,608 | 11 | 58,385 | ||
| Indonesia | 42 | 204,313 | 29 | 143,547 | 2 | 8,760 | 7 | 30,963 |
| Japan | 15 | 44,058 | 14 | 41,162 | 2 | 13,268 | 2 | 11,198 |
| Egypt | 1 | 1,426 | 5 | 21,316 | ||||
| Panama Canal Zone | 5 | 29,270 | ||||||
| United States of America | 48 | 317,412 | 48 | 340,850 | 68 | 342,533 | 42 | 230,570 |
| New Caledonia | 4 | 7,429 | 8 | 17,699 | 7 | 19,826 | ||
| Tuamotu Archipelago | 1 | 2,835 | 20 | 84,623 | 14 | 61,027 | ||
| Other countries | 6 | 18,877 | 7 | 23,741 | 34 | 119,588 | 13 | 45,644 |
| Totals | 660 | 3,084,705 | 656 | 3,102,057 | 466 | 2,057,991 | 463 | 2,054,683 |
The net tonnage of all vessels entered in 1947 was 33.3 per cent. less than in 1938, while the number of vessels was less to the extent of 29.4 per cent. The tonnage entered from Australia, although only 43.5 per cent. of the 1938 figure, was still higher than from any other country. The tonnage entered from the United Kingdom showed a decrease of 31.0 per cent., but clearances for the United Kingdom were only slightly below the 1938 figures. The number of vessels entered from the United States of America in 1947 showed an increase of 20 and there was a small increase in the aggregate net tonnage, but there was a very substantial decrease in the tonnage cleared for that country.
The next table shows the net tonnage of shipping between New Zealand and certain principal countries in 1939, and for the four years 1944–47.
| Year. | Australia. | United Kingdom. | United States of America. | Canada. | Pacific Islands. |
|---|---|---|---|---|---|
| Entered | |||||
| Tons. | Tons. | Tons. | Tons. | Tons. | |
| 1939 | 1,205,225 | 674,994 | 283,092 | 197,908 | 175,694 |
| 1914 | 587,959 | 268,942 | 303,155 | 50,833 | 297,679 |
| 1945 | 660,875 | 295,211 | 206,809 | 103,691 | 214,758 |
| 1946 | 575,340 | 445,084 | 420,240 | 125,235 | 201,639 |
| 1947 | 591,634 | 416,824 | 342,533 | 137,267 | 177,384 |
| Cleared | |||||
| Tons. | Tons. | Tons. | Tons. | Tons. | |
| 1939 | 1,370,750 | 733,257 | 289,214 | 144,731 | 175,951 |
| 1944 | 346,943 | 559,693 | 161,154 | 33,921 | 340,540 |
| 1945 | 431,324 | 691,610 | 70,406 | 107,554 | 174,980 |
| 1946 | 461,364 | 779,348 | 228,503 | 54,938 | 163,472 |
| 1947 | 576,481 | 772,882 | 230,570 | 44,717 | 181,708 |
Nationality of Overseas Shipping.—The table following shows the nationality of vessels arriving in New Zealand during the years 1939 and 1943–47. It will be seen that in normal times British Commonwealth ships account for some 80 per cent. of the total overseas tonnage recorded. The number of vessels registered in the United Kingdom represented 68 per cent. of the total tonnage recorded in 1947; the remaining British Commonwealth countries accounted for 12 per cent. and foreign countries for 20 per cent.
A feature of the table is the relatively small totals shown for shipping registered in New Zealand in the more recent years compared with 1939. This is attributable to the breakdown in the shipping service to Australia, which in pre-war years accounted for some 20 per cent. of overseas tonnage recorded inwards.
OVERSEAS SHIPPING INWARDS
(Thousand tons net)
| Country of Registry. | 1939. | 1943. | 1944. | 1945. | 1946. | 1947. |
|---|---|---|---|---|---|---|
| British Commonwealth— | ||||||
| United Kingdom | 1,499 | 702 | 755 | 1,113 | 1,474 | 1,404 |
| New Zealand | 609 | 178 | 169 | 126 | 110 | 153 |
| Other British Commonwealth | 216 | 74 | 100 | 125 | 131 | 86 |
| Cargo | 1,974 | 668 | 682 | 788 | 1,128 | 1,466 |
| Ballast | 350 | 286 | 342 | 576 | 587 | 177 |
| Total British Commonwealth | 2,324 | 954 | 1,024 | 1,364 | 1,715 | 1,643 |
| Percentage of total | 78 | 46 | 57 | 75 | 80 | 80 |
| Other— | ||||||
| Norway | 124 | 132 | 58 | 88 | 35 | 7 |
| Netherlands | 66 | 131 | 58 | 4 | 8 | 21 |
| Panama | 38 | 96 | 89 | 50 | 36 | |
| United States of America | 358 | 789 | 524 | 259 | 314 | 300 |
| Other foreign | 93 | 20 | 29 | 14 | 19 | 50 |
| Cargo | 441 | 662 | 386 | 308 | 357 | 346 |
| Ballast | 200 | 648 | 379 | 146 | 69 | 68 |
| Total foreign | 641 | 1,110 | 765 | 454 | 426 | 414 |
| Percentage of total | 22 | 54 | 43 | 26 | 20 | 20 |
| Grand totals | 2,965 | 2,064 | 1,789 | 1,818 | 2,141 | 2,057 |
TRADE OF PORTS.—The following matters dealing with the trade of ports are covered below: shipping tonnages, cargo statistics, transhipments, and value of imports and exports.
Shipping Tonnages.—This section deals with the tonnage recorded by the various ports in New Zealand and includes overseas and coastal shipping, irrespective of whether the former had been entered or cleared overseas or coastwise. Thus, overseas vessels have been recorded as overseas arrivals and departures on every visit to a New Zealand port, instead of only at the first port of call and the final port of departure as under the earlier heading.
The movement of overseas and coastal vessels on the New Zealand coast is well illustrated in the following table, which gives the aggregate number and tonnage of the total calls made during each of the years 1937–47.
| Year. | Overseas Vessels. | Coastal Vessels. | Total. | |||
|---|---|---|---|---|---|---|
| Number. | Net Tonnage. | Number. | Net Tonnage. | Number. | Net Tonnage. | |
| 1937 | 2,416 | 9,994,644 | 18,386 | 5,155,392 | 20,802 | 15,150,036 |
| 1938 | 2,449 | 10,069,106 | 17,925 | 4,910,761 | 20,374 | 14,979,867 |
| 1939 | 2,490 | 9,766,224 | 17,365 | 4,756,027 | 19,855 | 14,522,251 |
| 1940 | 2,082 | 7,826,043 | 16,261 | 4,583,528 | 18,343 | 12,409,571 |
| 1941 | 1,617 | 5,018,648 | 15,017 | 4,342,047 | 16,634 | 9,360,695 |
| 1942 | 1,666 | 5,491,688 | 13,610 | 3,786,536 | 15,276 | 9,278,224 |
| 1943 | 1,379 | 4,526,542 | 12,050 | 4,007,179 | 13,429 | 8,533,721 |
| 1944 | 1,083 | 3,729,631 | 12,61 | 3,981,700 | 13,244 | 7,711,331 |
| 1945 | 1,088 | 3,827,780 | 12,369 | 3,756,871 | 13,457 | 7,584,651 |
| 1946 | 1,191 | 4,774,613 | 12,770 | 3,709,357 | 13,961 | 8,483,970 |
| 1947 | 1,144 | 4,966,088 | 12,808 | 4,528,941 | 13,952 | 9,495,029 |
Using the figures for 1939 as a standard pre-war guide to the volume of shipping at New Zealand ports, the war years showed a remarkable decline in the number of vessels and net tonnage, particularly in the overseas section. The 1944 figures for the latter represented a fall of nearly 57 per cent. in the number of vessels and 62 per cent. in tonnage. In addition to the large decrease in overseas arrivals in the country during the war period, as shown in the table on page 262, a contributory cause was the limited number of ports visited by overseas vessels, shipping, as a war necessity, being concentrated at the main ports.
Figures for the last two years show a substantial recovery in both the overseas and coastal trade of ports. Coastal trade as portrayed by the net tonnage for 1947 recorded a particularly large increase in that year and is now approaching pre-war proportions.
The following table shows the average number of calls made by overseas ships arriving in New Zealand, based on total arrivals and total entries in New Zealand ports.
| Overseas Vessels. | 1939. | 1942. | 1943. | 1944. | 1945. | 1946. | 1947. |
|---|---|---|---|---|---|---|---|
| Total number entered New Zealand | 634 | 518 | 48 | 446 | 413 | 462 | 466 |
| Total entries in New Zealand ports | 2,490 | 1,666 | 1,379 | 1,083 | 1,088 | 1,191 | 1,144 |
| Average number of calls at New Zealand ports | 3.9 | 3.2 | 2.9 | 2.4 | 2.6 | 2.6 | 2.5 |
This table is only intended to show the reason for the fall in overseas shipping tonnage of ports, and not the actual average calls made. Many vessels—as, for instance, those engaged in the transport of timber and coal, and those merely touching at a New Zealand port while en route between Australia and America—call at only one port in New Zealand; on the other hand, vessels engaged in the United Kingdom trade, which, in the pre-war period, generally called at a number of ports, have curtailed their visits, as evidenced by the figures.
The following table shows for the three years 1945–47 the number and net tonnage of overseas vessels arriving at New Zealand ports, and covers vessels entered overseas or coastwise.
| Port. | 1945. | 1946. | 1947. | |||
|---|---|---|---|---|---|---|
| Number. | Tonnage. | Number. | Tonnage. | Number. | Tonnage. | |
| Whangarei | 18 | 23,813 | 17 | 23,856 | 1 | 2,028 |
| Auckland | 379 | 1,121,584 | 413 | 1,447,312 | 324 | 1,425,258 |
| Gisborne | 1 | 738 | 1 | 738 | 1 | 738 |
| Napier | 51 | 167,678 | 38 | 172,226 | 51 | 245,450 |
| New Plymouth | 29 | 132,583 | 35 | 169,551 | 41 | 212,155 |
| Wellington | 274 | 1,330,995 | 297 | 1,454,690 | 290 | 1,338,350 |
| Picton | 1 | 4,432 | ||||
| Nelson | 10 | 12,905 | 8 | 18,673 | 7 | 29,613 |
| Westport | 14 | 12,265 | 15 | 16,674 | 9 | 3,578 |
| Greymouth | 15 | 14,109 | 7 | 3,808 | 7 | 1,118 |
| Lyttelton | 135 | 525,471 | 179 | 781,536 | 195 | 837,720 |
| Timaru | 49 | 113,611 | 36 | 114,950 | 36 | 125,299 |
| Oamaru | 10 | 12,095 | 1 | 1,864 | ||
| Dunedin | 65 | 234,427 | 101 | 418,942 | 130 | 553,207 |
| Bluff | 37 | 121,074 | 43 | 149,793 | 52 | 191,574 |
| Totals | 1,088 | 3,827,780 | 1,191 | 4,774,613 | 1,144 | 4,966,088 |
Overseas vessels are shown to have called at 15 ports in 1945, 14 in 1946, and only 13 in 1947. In the pre-war years 1936–38, approximately 24 New Zealand ports were visited by overseas vessels. During the war years the concentration of overseas shipping at the main ports was most marked. This concentration is still noticeable in the two years 1946 and 1947. This is demonstrated in the following table, which shows the percentages of overseas shipping tonnage recorded at the ports of Wellington, Auckland, and Lyttelton for the years 1939 and 1944–47. In 1939 these three ports handled 63.1 per cent. of the overseas shipping tonnage, as compared with 81.6 per cent. in 1941 and 72.6 per cent. in 1947.
| Port. | 1939. | 1944. | 1945. | 1946. | 1947. |
|---|---|---|---|---|---|
| Per Cent. | Per Cent. | Per Cent. | Per Cent. | Per Cent. | |
| Auckland | 27.3 | 34.7 | 29.4 | 30.3 | 28.7 |
| Wellington | 24.5 | 35.1 | 34.8 | 30.5 | 27.0 |
| Other North Island | 15.4 | 7.1 | 8.4 | 7.7 | 9.3 |
| North Island | 67.2 | 76.9 | 72.6 | 68.5 | 65.0 |
| Lyttelton | 11.3 | 11.8 | 13.7 | 16.4 | 16.9 |
| Other South Island | 21.5 | 11.3 | 13.7 | 15.1 | 18.1 |
| South Island | 32.8 | 23.1 | 27.4 | 31.5 | 35.0 |
| New Zealand total | 100.0 | 100.0 | 100.0 | 100.0 | 100.0 |
The table below shows for the years 1945–47 the total shipping traffic handled inwards at the ports referred to. Overseas and coastal vessels calling at more than one port in the course of a single voyage have been recorded as entered at every port visited.
| Port. | 1945. | 1946. | 1947. | |||
|---|---|---|---|---|---|---|
| Number. | Tonnage. | Number. | Tonnage. | Number. | Tonnage. | |
| Parengarenga | 162 | 6,430 | 130 | 5,458 | 118 | 4,812 |
| Awanui | 165 | 12,505 | 166 | 12,076 | 128 | 7,829 |
| Mangonui | 81 | 8,406 | 76 | 7,713 | 55 | 7,357 |
| Whangaroa | 178 | 15,506 | 131 | 9,255 | 132 | 11,406 |
| Russell | 181 | 7,821 | 158 | 7,358 | 114 | 6,858 |
| Hokianga | 49 | 3,724 | 39 | 2,964 | 40 | 3,040 |
| Whangarei | 746 | 80,159 | 835 | 92,799 | 920 | 100,130 |
| Kaipara | 2 | 505 | 1 | 375 | ||
| Auckland | 4,359 | 1,376,231 | 4,738 | 1,711,415 | 4,482 | 1,813,973 |
| Onehunga | 108 | 13,492 | 128 | 16,565 | 96 | 12,614 |
| Raglan | 4 | 642 | 6 | 911 | 4 | 640 |
| Kawhia | 4 | 642 | 9 | 1,422 | 7 | 1,120 |
| Thames | 445 | 19,146 | 556 | 21,388 | 543 | 13,338 |
| Coromandel | 168 | 3,043 | 155 | 2,935 | 151 | 2,622 |
| Whitianga | 44 | 966 | 108 | 2,617 | 85 | 2,341 |
| Tauranga | 96 | 11,551 | 99 | 11,881 | 119 | 13,952 |
| Whakatane | 58 | 6,343 | 85 | 8,833 | 108 | 10,902 |
| Opotiki | 39 | 4,066 | 62 | 6,315 | 54 | 5,747 |
| Tokomaru Bay | 68 | 21,788 | 101 | 19,566 | 98 | 16,539 |
| Tolaga Bay | 26 | 7,688 | 32 | 8,008 | 28 | 6,534 |
| Gisborne | 129 | 61,621 | 135 | 50,941 | 132 | 50,073 |
| Napier | 168 | 220,194 | 208 | 223,601 | 245 | 306,436 |
| New Plymouth | 159 | 176,525 | 126 | 202,040 | 103 | 239,617 |
| Patea | 99 | 10,274 | 91 | 9,351 | 119 | 12,156 |
| Wanganui | 239 | 50,650 | 245 | 53,162 | 260 | 59,264 |
| Wellington | 2,105 | 2,616,964 | 2,152 | 2,740,677 | 2,229 | 3,005,025 |
| Picton | 267 | 159,319 | 306 | 161,529 | 354 | 161,386 |
| Wairau | 145 | 10,024 | 122 | 9,328 | 70 | 5,488 |
| Nelson | 795 | 244,351 | 686 | 253,448 | 803 | 273,382 |
| Motueka | 200 | 16,147 | 181 | 17,098 | 185 | 16,103 |
| Waitapu | 65 | 2,752 | 59 | 2,642 | 78 | 3,291 |
| Westport | 317 | 199,408 | 272 | 188,935 | 251 | 193,252 |
| Greymouth | 196 | 137,329 | 174 | 120,882 | 177 | 102,597 |
| Hokitika | 23 | 1,058 | 30 | 1,380 | 18 | 828 |
| Lyttelton | 683 | 1,262,112 | 695 | 1,512,750 | 744 | 1,863,634 |
| Timaru | 159 | 184,251 | 123 | 180,225 | 114 | 188,324 |
| Oamaru | 66 | 60,585 | 62 | 57,228 | 57 | 47,412 |
| Dunedin | 225 | 368,056 | 230 | 520,121 | 255 | 659,197 |
| Bluff | 298 | 184,249 | 309 | 208,204 | 343 | 246,287 |
| Half-moon Bay | 136 | 18,128 | 140 | 20,574 | 133 | 19,523 |
| Totals | 13,457 | 7,584,651 | 13,961 | 8,483,970 | 13,952 | 9,495,029 |
In 1947 Wellington ranked as the first port of New Zealand as regards aggregate tonnage of shipping entered, followed by Lyttelton, Auckland, Dunedin, Napier, Nelson, Bluff, and New Plymouth in that order.
It should be remembered in any comparison of port statistics of shipping tonnages that certain ports are termini of inter-Island passenger services, and this factor adds considerably to the volume of shipping traffic credited to these ports—viz., Wellington, Lyttelton, Picton, and Nelson.
Cargo Statistics.—In order to obtain statistics of the total trade of each port, a system of monthly returns from the various port authorities was instituted in 1922 showing under a number of headings the quantity of goods handled, distinguishing inwards and outwards cargo, coastal and overseas, and transhipments. The resultant statistics show on a tonnage basis the total trade of each port, including all exports, whether placed on the overseas vessel there, sent to a central port for shipment overseas, or despatched coastwise to another port for consumption in New Zealand. No figures were collected during the years 1943–45.
The following table gives a summary of the tonnage of cargo handled at all ports, for the years 1940–42 and 1946–47.
| Year. | Inwards.* | Transhipments. | Outwards.* | Total Manifest Tonnage. | ||
|---|---|---|---|---|---|---|
| Coastal. | Overseas. | Coastal. | Overseas. | |||
*Excluding transhipments. | ||||||
| Tons. | Tons. | Tons. | Tons. | Tons. | Tons. | |
| 1940 | 2,124,205 | 2,209,300 | 286,036 | 2,094,772 | 1,015,981 | 8,076,330 |
| 1941 | 2,210,270 | 1,903,044 | 310,714 | 2,173,675 | 875,193 | 7,783,610 |
| 1942 | 2,182,673 | 1,980,120 | 350,430 | 2,092,338 | 1,137,440 | 8,093,431 |
| 1946 | 2,062,883 | 2,077,881 | 209,911 | 2,008,971 | 1,112,864 | 7,682,421 |
| 1947 | 2,114,964 | 2,790,934 | 231,641 | 1,943,389 | 1,099,150 | 8,411,719 |
The next table shows for each port the total cargo inwards and outwards in 1947. The high proportion of transhipments in the case of Wellington is very noticeable.
| Year. | Inwards.* | Transhipments. | Outwards.* | Total Manifest Tonnage. | ||
|---|---|---|---|---|---|---|
| Coastal. | Overseas. | Coastal. | Overseas. | |||
*Excluding transhipments. | ||||||
| Awanui | 1,186 | 404 | 1,590 | |||
| Mangonui | 5,497 | 2,307 | 7,804 | |||
| Russell | 8,882 | 1,024 | 9,906 | |||
| Hokianga | 5,254 | 3,360 | 8,614 | |||
| Whangarei | 43,096 | 4,000 | 112,582 | 159,678 | ||
| Auckland | 658,535 | 1,231,649 | 52,448 | 246,055 | 356,071 | 2,597,206 |
| Onëhunga | 16,433 | 6 | 25,681 | 42,126 | ||
| Great Barrier | 664 | 354 | 1,018 | |||
| Raglan | 543 | 311 | 854 | |||
| Kawhia | 547 | 1,030 | 1,577 | |||
| Thames | 667 | 562 | 1,229 | |||
| Tauranga | 15,546 | 1,603 | 17,149 | |||
| Whakatane | 20,408 | 15,039 | 35,447 | |||
| Opotiki | 7,894 | 4,560 | 12,454 | |||
| Tokomaru Bay | 5,165 | 4,538 | 962 | 15,203 | ||
| Bay | 568 | 769 | 1,337 | |||
| Gisborne | 52,714 | 9 | 16,836 | 69,568 | ||
| Napier | 74,853 | 35,752 | 7,735 | 14,386 | 103,581 | 244,042 |
| New Plymouth | 41,332 | 148,724 | 5,567 | 73,843 | 269,466 | |
| Patea | 2,186 | 19,370 | 21,556 | |||
| Wanganui | 74,061 | 34,805 | 108,866 | |||
| Wellington | 509,340 | 765,354 | 158,145 | 320,032 | 280,822 | 2,191,838 |
| Picton | 46,476 | 58,968 | 105,444 | |||
| Wairau | 5,083 | 4,701 | 9,784 | |||
| Nelson | 101,528 | 14,625 | 3,306 | 67,112 | 189,877 | |
| Motueka | 11,680 | 16,984 | 28,664 | |||
| Waitapu | 2,817 | 1,675 | 4,492 | |||
| Westport | 5,949 | 70 | 310,613 | 316,632 | ||
| Greymouth | 13,243 | 343 | 220,419 | 234,005 | ||
| Hokitika | 757 | 888 | 1,645 | |||
| Lyttelton | 193,045 | 321,379 | 902 | 232,605 | 105,402 | 854,235 |
| Timaru | 25,686 | 19,584 | 62,337 | 37,183 | 144,790 | |
| Oamaru | 5,523 | 139 | 31,893 | 7 | 37,562 | |
| Dunedin | 107,056 | 232,117 | 4,552 | 78,843 | 62,564 | 489,684 |
| Bluff | 48,761 | 17,198 | 28,067 | 79,677 | 173,703 | |
| Half-moon Bay | 1,989 | 685 | 2,674 | |||
| Totals | 2,114,964 | 2,790,934 | 231,641 | 1,943,389 | 1,099,150 | 8,411,719 |
In any consideration of these statistics it is advisable to note that the term “ton” does not invariably denote a weight of 2,240 lb:, For a portion only of the goods handled is it practicable to obtain the actual weights involved. In other cases close approximations are made by applying uniform formulæ as to the number of bales, cases, sacks, &c., to the ton. In a few instances the tons are “short” tons of 2,000 lb. A considerable portion of trading goods, however, is recorded in “measurement” tons, 40 cubic feet of space being regarded as the equivalent of a ton. As the practice is uniform, comparisons from year to year are not appreciably affected, nor are comparisons between ports, unless there is a radical difference in the class of trade carried on, in which case recourse should, be had to consideration of items of trade. Since a much larger proportion of imports are in “measurement” tons, thus artificially swelling the figures, direct comparison of import cargo tonnage with export is invalid.
The penultimate column of the preceding table shows the quantity of cargo placed on board the overseas vessels at the respective ports, and a table will be found on page 266 showing the number and tonnage of overseas vessels calling at each port. These tables give a good indication of the extent to which each port enters directly into the overseas trade of New Zealand. The following table shows for the year 1947 the total shipments from each port overseas and coastwise (including transhipments) of nine principal commodities exported overseas by New Zealand, and thus shows the extent to which the various ports handle overseas exports, although the goods may be sent outwards coastwise for transhipment at another port.
| Port. | Wool. | Frozen Meat. | Canned Meat. | Butter. | Cheese. | Milk Products. | Tallow. | Hides, Skins, and Pelts. | Seeds. | All Other Goods. | Totals. |
|---|---|---|---|---|---|---|---|---|---|---|---|
| Tons. | Tons. | Tons. | Tons. | Tons. | Tons. | Tons. | Tons. | Tons. | Tons. | Tons. | |
| Awanui | 31 | 6 | 367 | 404 | |||||||
| Mangonui | 115 | 436 | 11 | 1,745 | 2,307 | ||||||
| Russell | 127 | 3 | 894 | 1,024 | |||||||
| Hokianga | 416 | 1,673 | 216 | 49 | 1,006 | 3,360 | |||||
| Whangarei | 562 | 4,244 | 19 | 4 | 12 | 107,741 | 112,582 | ||||
| Auckland | 29,314 | 76,150 | 11,053 | 118,414 | 18,503 | 29,424 | 9,801 | 12,324 | 642 | 348,949 | 654,574 |
| Onehunga | 5 | 81 | 4 | 51 | 182 | 31 | 25,333 | 25,687 | |||
| Great Barrier | 45 | 18 | 96 | 1 | 194 | 354 | |||||
| Raglan | 309 | 2 | 311 | ||||||||
| Kawhia | 1,027 | 3 | 1,030 | ||||||||
| Thames | 4 | 1 | 473 | 84 | 562 | ||||||
| Tauranga | 183 | 1,420 | 1,603 | ||||||||
| Whakatane | 142 | 5,819 | 1,224 | 44 | 7,810 | 15,039 | |||||
| Opotiki | 286 | 2,587 | 33 | 1,654 | 4,560 | ||||||
| Tokomaru Bay | 1,333 | 3,174 | 404 | 329 | 260 | 5,500 | |||||
| Tolaga Bay | 418 | 351 | 769 | ||||||||
| Gisborne | 5,756 | 52 | 148 | 92 | 1,211 | 1,146 | 126 | 8,314 | 16,845 | ||
| Napier | 41,186 | 58,170 | 388 | 2,444 | 237 | 54 | 4,095 | 4,273 | 685 | 14,170 | 125,702 |
| New Plymouth | 2,738 | 30,624 | 9,864 | 25,806 | 1,364 | 2,027 | 1,925 | 5,062 | 79,410 | ||
| Patea | 174 | 19,059 | 137 | 19,370 | |||||||
| Wanganui | 17,477 | 368 | 2,218 | 5,935 | 856 | 1,314 | 6,637 | 34,805 | |||
| Wellington | 55,898 | 77,919 | 1,231 | 17,095 | 44,278 | 6,735 | 5,560 | 11,650 | 1,091 | 537,542 | 758,999 |
| Picton | 1,911 | 3,080 | 123 | 553 | 609 | 52,692 | 58,968 | ||||
| Wairau | 102 | 35 | 4 | 88 | 4,472 | 4,701 | |||||
| Nelson | 1,270 | 1,560 | 861 | 459 | 413 | 332 | 112 | 65,411 | 70,418 | ||
| Motueka | 127 | 10 | 8 | 16,839 | 16,984 | ||||||
| Waitapu | 333 | 791 | 6 | 545 | 1,675 | ||||||
| Westport | 10 | 310,603 | 310,613 | ||||||||
| Greymouth | 1 | 73 | 220,345 | 220,419 | |||||||
| Hokitika | 37 | 851 | 888 | ||||||||
| Lyttelton | 21,110 | 30,014 | 283 | 1,041 | 896 | 6,789 | 5,896 | 12,755 | 260,125 | 338,909 | |
| Timaru | 15,976 | 14,095 | 400 | 1,779 | 685 | 1,288 | 65,297 | 99,520 | |||
| Oamaru | 285 | 7 | 184 | 31,424 | 31,900 | ||||||
| Dunedin | 20,189 | 23,232 | 194 | 175 | 1,366 | 528 | 1,375 | 2,930 | 2,865 | 93,105 | 145,959 |
| Bluff | 17,735 | 35,910 | 588 | 156 | 8,891 | 5,670 | 3,950 | 2,478 | 1,978 | 30,388 | 107,744 |
| Half-moon Bay | 685 | 685 | |||||||||
| Totals | 236,410 | 354,348 | 13,966 | 168,121 | 128,492 | 44,109 | 38,357 | 45,465 | 22,455 | 2,222,457 | 3,274,180 |
Transhipments.—Transhipments of cargo during 1947 totalled 231,641 tons, of which 158,145 tons were transhipped at Wellington. This is considerably less than ten years earlier, when in 1937 total transhipments amounted to 318,067 tons, Wellington's contribution to that total being 215,434 tons. The total manifest tonnage in 1937 was 8,220,712, as compared with 8,411,719 tons in 1947.
Transhipments fall into the following four classes:—
Coastal to Coastal.—Cargo which has been loaded on a vessel at one New Zealand port and is transhipped to another vessel for discharge at another New Zealand port.
Coastal to Overseas.—Cargo which has been loaded in a vessel at a New Zealand port and is transhipped to another vessel for discharge at a port outside New Zealand.
Overseas to Coastal.—Cargo which has come from overseas and is transhipped to another vessel for discharge at a New Zealand port.
Overseas to Overseas.—Cargo which has come from overseas and is transhipped to another vessel for discharge outside New Zealand.
The first class represents purely coastal trade, but each of the others may be added to the appropriate figures of overseas trade shown previously to ascertain the total tonnage of goods arriving from or departing overseas. Thus the total inward tonnage from overseas in 1947, was 2,925,530, and the total outward tonnage going overseas 1,176,464. Comparative figures for 1937 were 2,779,631 and 1,098,736 tons respectively. The following table shows for 1947 the transhipment trade of each port affected.
| Port. | Coastal to Coastal. | Coastal to Overseas. | Overseas to Coastal. | Overseas to Overseas. | Totals. |
|---|---|---|---|---|---|
| Tons. | Tons. | Tons. | Tons. | Tons. | |
| Auckland | 3,070 | 6,396 | 38,281 | 4,701 | 52,448 |
| Onehunga | 6 | 6 | |||
| Tokomaru Bay | 4,538 | 4,538 | |||
| Gisborne | 9 | 9 | |||
| Napier | 35 | 6,891 | 809 | 7,735 | |
| Wellington | 11,615 | 59,090 | 87,440 | 158,145 | |
| Nelson | 3,306 | 3,306 | |||
| Lyttelton | 314 | 32 | 556 | 902 | |
| Dunedin | 1,539 | 204 | 2,809 | 4,552 | |
| Totals | 24,432 | 72,613 | 129,895 | 4,701 | 231,641 |
The next table shows the various items of merchandise, &c., which comprised the transhipment trade in 1947.
| Item. | Coastal to Coastal. | Coastal to Overseas. | Overseas to Coastal. | Overseas to Overseas. | Totals. |
|---|---|---|---|---|---|
| Tons. | Tons. | Tons. | Tons. | Tons. | |
| Beans and peas | 81 | 2,074 | 153 | 2,308 | |
| Butter | 4,466 | 4,466 | |||
| Cheese | 1 | 25,716 | 25,717 | ||
| Coal | 8,006 | 1,420 | 9,426 | ||
| Flour | 521 | 9 | 1 | 104 | 635 |
| Fruit, preserved | 256 | 8 | 2,777 | 3,041 | |
| Fruit, fresh | 7 | 911 | 918 | ||
| Hides, skins, and pelts | 291 | 1,854 | 24 | 2,169 | |
| Manures, artificial | 1,290 | 45 | 2,380 | 30 | 3,745 |
| Meat, frozen (beef, mutton, and lamb) | 3,171 | 7,158 | 10,329 | ||
| Motor-spirit, kerosene, and other fuel oils | 39 | 19,405 | 19,444 | ||
| Seeds | 132 | 391 | 88 | 611 | |
| Sugar | 464 | 11 | 475 | ||
| Tallow | 341 | 2,630 | 2,971 | ||
| Timber | 19 | 2,268 | 5,106 | 66 | 7,459 |
| Wines, spirits, and beer | 354 | 7 | 739 | 63 | 1,163 |
| Wool | 764 | 20,778 | 1 | 21,543 | |
| All other goods | 8,695 | 3,789 | 98,335 | 4,402 | 115,221 |
| Totals | 24,432 | 72,613 | 129,895 | 4,701 | 231,641 |
Value of Imports.—New Zealand has twenty ports of entry for Customs purposes—nine in the North Island and ten in the South Island, plus the port of Waitangi in Chatham Islands.
The following table gives the total value of imports of merchandise for the several ports of entry during the five years 1939 and 1944–47. Kaipara and Waitangi had no overseas imports during this period.
| Port. | 1939. | 1944. | 1945.* | 1946.* | 1947.* |
|---|---|---|---|---|---|
* Provisional. | |||||
| £ | £ | £ | £ | £ | |
| Auckland | 16,508,017 | 24,275,040 | 21,927,860 | 27,448,525 | 49,933,284 |
| Tauranga | 3,595 | 2,245 | 2,200 | 4,548 | 2,021 |
| Gisborne | 127,380 | 32,897 | 51,800 | 62,649 | 135,694 |
| Napier | 530,086 | 270,367 | 310,165 | 416,899 | 857,181 |
| New Plymouth | 632,677 | 439,473 | 503,283 | 852,812 | 1,277,686 |
| Patea | 9,499 | 7,121 | 9,564 | 11,690 | 19,184 |
| Wanganui | 303,059 | 95,254 | 102,191 | 207,670 | 394,584 |
| Wellington | 19,753,155 | 51,396,758 | 21,454,746 | 28,821,157 | 49,602,358 |
| Wairau (including Picton) | 38,740 | 9,191 | 8,303 | 18,131 | 33,720 |
| Nelson | 137,447 | 84,573 | 121,526 | 146,463 | 268,604 |
| Westport | 35,994 | 20,492 | 14,563 | 14,495 | 15,661 |
| Greymouth | 161,754 | 42,747 | 46,538 | 44,799 | 82,420 |
| Hokitika | 3,885 | 842 | 1,483 | 1,433 | 3,034 |
| Lyttelton | 6,382,814 | 5,766,546 | 6,047,135 | 7,728,083 | 15,403,230 |
| Timaru | 377,350 | 161,981 | 216,348 | 204,751 | 476,057 |
| Oamaru | 51,356 | 24,609 | 56,683 | 32,464 | 56,414 |
| Dunedin | 3,578,779 | 3,488,025 | 3,792,910 | 5,011,961 | 9,057,424 |
| Invercargill | 751,596 | 279,051 | 405,630 | 605,584 | 1,106,285 |
| Totals | 49,387,183 | 86,397,212 | 55,072,928 | 71,634,114 | 128,724,841 |
During each of the last three years over three-quarters of the total imports came in by way of Wellington and Auckland, a proportion not greatly in excess of that for 1939. For some years prior to the war the value of imports received at Wellington exceeded the Auckland figure by a considerable margin, hut during the last three years there has been little difference between the two ports in this respect. The high figure for Wellington in 1944 is accounted for by the heavy entry of ordnance stores, &c., a condition of affairs which also obtained in 1943. On the basis of import values, the next most important ports are Lyttelton, Dunedin, New Plymouth, Invercargill, and Napier.
Value of Exports.—From 1914 to 1921 the Customs Department allocated exports, as far as possible, to the appropriate district of production, whether exported through the port for such district or not, and no complementary figures are available to show the export trade from each individual port for this period.
The system, however, did not prove satisfactory in practice, and the method of recording exports according to the port at which the goods are placed on board the vessel by which they leave New Zealand was reverted to from the 1st January, 1922.
The following table shows for the years 1939 and 1944–47 the value of exports according to the port at which they were actually placed on board the overseas vessels.
While, in the case of imports, goods received through parcels-post are allocated according to ports of entry, similar treatment is not possible in the case of exports. The total of goods exported by parcel-post is accordingly shown under the heading “parcels-post.”
| Port. | 1939. | 1944. | 1945.* | 1946.* | 1947.* |
|---|---|---|---|---|---|
*Provisional. | |||||
| £ | £ | £ | £ | £ | |
| Auckland | 20,631,836 | 26,283,548 | 26,499,847 | 34,088,579 | 42,129,055 |
| Tokomaru Bay | 123,292 | ||||
| Gisborne | 847,809 | 106 | |||
| Napier | 3,419,673 | 2,303,088 | 3,455,493 | 8,392,933 | 12,685,902 |
| New Plymouth | 3,906,251 | 3,615,493 | 5,417,282 | 4,957,998 | 8,050,835 |
| Wanganui | 1,213,600 | 69 | 114 | ||
| Wellington | 13,148,444 | 26,594,371 | 21,938,019 | 23,532,868 | 31,260,490 |
| Wairau (including Picton) | 254,858 | 31 | 110 | 125,880 | 10 |
| Nelson | 159,585 | 50,637 | 1,275 | ||
| Westport | 36,280 | 6,367 | |||
| Greymouth | 758,888 | 742,593 | 565,285 | 555,793 | 374,637 |
| Hokitika | 6,887 | 181,663 | 218,188 | 175,180 | 228,582 |
| Lyttelton | 4,749,637 | 7,176,467 | 8,707,731 | 11,829,531 | 12,916,406 |
| Timaru | 1,814,038 | 1,428,152 | 2,981,735 | 3,296,653 | 4,429,955 |
| Oamaru | 352,771 | 120 | 153 | 1,573 | |
| Dunedin | 3,027,997 | 4,238,935 | 5,946,611 | 7,054,190 | 8,236,757 |
| Invercargill | 3,539,880 | 5,116,705 | 5,666,789 | 6,957,987 | 8,751,079 |
| Parcels-post | 57,590 | 99,533 | 139,152 | 288,783 | 339,488 |
| Totals | 58,049,316 | 77,786,946 | 81,536,431 | 101,307,165 | 129,406,264 |
Auckland occupies a commanding position in the export trade of New Zealand, no less than 32.5 per cent. of the value of all exports in 1947 going through that port. Wellington occupied second place with 24.1 per cent., followed by Lyttelton with 10.0 per cent., Napier, 9.8 per cent., Invercargill, 6.8 per cent., Dunedin, 6.4 per cent., and New Plymouth, 6.2 per cent. The concentration of the export trade in the ports of Auckland and Wellington is less marked than with the import trade, the proportion for these two ports in 1947 being 56.6 per cent. for exports and 77.4 per cent. for imports.
NEW ZEALAND SHIPPING REGISTER.—The number and tonnage of vessels on the New Zealand register at 31st December, 1947, were as follows:—
| Port of Registry, | Sailing-vessels. | Steam-vessels. | Motor-vessels. | ||||||
|---|---|---|---|---|---|---|---|---|---|
| Vessels. | Gross Tonnage. | Net Tonnage. | Vessels. | Gross Tonnage. | Net Tonnage. | Vessels. | Gross Tonnage. | Net Tonnage. | |
| Auckland | 33 | 1988 | 1,595 | 44 | 10,024 | 4,846 | 211 | 16,868 | 8,225 |
| Napier | 4 | 257 | 138 | 7 | 2,473 | 1,244 | |||
| Wellington | 8 | 375 | 298 | 51 | 98,006 | 49,883 | 36 | 23,261 | 12,446 |
| Nelson | 6 | 5,321 | 2,300 | 10 | 1,326 | 643 | |||
| Lyttelton | 4 | 1,728 | 1,654 | 9 | 3,257 | 1,178 | 14 | 2,423 | 1,204 |
| Timaru | 1 | 942 | 488 | 1 | 11 | 3 | |||
| Dunedin | 12 | 11,082 | 5,881 | 12 | 4,474 | 2,484 | |||
| Invercargill | 9 | 1,431 | 538 | 6 | 133 | 41 | |||
| Totals | 45 | 4,091 | 3,547 | 136 | 130,320 | 65,252 | 297 | 50,969 | 26,290 |
Auckland is the port of registry of the majority of the vessels forming New Zealand's “mosquito” fleet, the average net tonnage of the 288 vessels on the Auckland register being only 51 tons. At Wellington and Dunedin a number of the vessels of the Union Steam Ship Company of New Zealand are registered, while several are also registered in the United Kingdom and Australia. The figures for vessels registered in New Zealand as at the end of each of the last eleven years are as follows:—
| Year. | Sailing-vessels. | Steam-and Motor-vessels. | Totals. | ||||||
|---|---|---|---|---|---|---|---|---|---|
| Vessels. | Gross Tonnage. | Net Tonnage. | Vessels. | Gross Tonnage. | Net Tonnage. | Vessels. | Gross Tonnage. | Net Tonnage. | |
| 1937 | 51 | 5,232 | 4,587 | 431 | 181,293 | 94,955 | 482 | 186,525 | 99,542 |
| 1938 | 47 | 4,892 | 4,283 | 445 | 172,754 | 89,309 | 492 | 177,646 | 93,592 |
| 1939 | 48 | 4,907 | 4,288 | 450 | 187,379 | 96,831 | 504 | 192,286 | 101,119 |
| 1940 | 47 | 4,134 | 3,592 | 449 | 185,776 | 95,197 | 496 | 189,910 | 98,789 |
| 1941 | 45 | 4,087 | 3,553 | 439 | 179,987 | 92,252 | 484 | 184,074 | 95,805 |
| 1942 | 45 | 4,087 | 3,553 | 429 | 175,343 | 89,623 | 474 | 179,430 | 93,176 |
| 1943 | 45 | 4,087 | 3,553 | 410 | 159,625 | 80,606 | 455 | 163,712 | 84,159 |
| 1944 | 45 | 4,087 | 3,553 | 407 | 159,517 | 80,552 | 452 | 163,604 | 84,105 |
| 1945 | 45 | 4,087 | 3,553 | 406 | 159,203 | 80,376 | 451 | 163,290 | 83,929 |
| 1946 | 44 | 4,075 | 3,541 | 419 | 161,685 | 81,728 | 463 | 165,760 | 85,269 |
| 1947 | 45 | 4,091 | 3,547 | 433 | 181,289 | 91,542 | 478 | 180,380 | 95,089 |
In the next table vessels registered in New Zealand at the end of 1947 have been classified according to whether employed in the coastal or the foreign trade. The totals given therein do not agree with those shown above, as vessels employed exclusively within “restricted limits” have not been included.
| Size of Vessel. | Employed In the Coastal Trade only. | Employed partly in the Coastal and partly in the Foreign Trade. | Employed In the Foreign Trade only. | |||
|---|---|---|---|---|---|---|
| Number of Vessels. | Net Tonnage. | Number of Vessels. | Net Tonnage. | Number of Vessels. | Net Tonnage. | |
| Under 50 tons | 37 | 665 | ||||
| 50 and under 100 tons | 26 | 1,919 | 1 | 68 | 2 | 168 |
| 100 and under 200 tons | 23 | 3,058 | 2 | 292 | ||
| 200 and under 300 tons | 5 | 1,358 | 3 | 704 | ||
| 300 and under 400 tons | 8 | 2,792 | 1 | 368 | ||
| 400 and under 600 tons | 4 | 1,958 | 1 | 586 | ||
| 600 and under 800 tons | 5 | 3,499 | 3 | 2,271 | ||
| 800 and under 1,000 tons | 4 | 3,539 | 1 | 944 | ||
| 1,000 and under 1,200 tons | 1 | 1,000 | 2 | 2,319 | 1 | 1,098 |
| 1,200 and under 1,500 tons | 3 | 4,003 | 3 | 4,087 | 2 | 2,580 |
| 1,500 and under 2,000 tons | 3 | 5,265 | 3 | 5,650 | 3 | 5,456 |
| 2,000 tons and over | 2 | 6,023 | 6 | 28,570 | ||
| Totals | 121 | 35,079 | 13 | 13,196 | 21 | 41,965 |
The number of vessels coming within the above category was 155, of an aggregate net tonnage of 90,240, as compared with 182 vessels and 91,595 tons in 1937. The decrease in the number of vessels is confined to those engaged in the coastal trade only, 121 in 1947, as against 151 in 1937, but the employment of a larger type of vessel in this trade is reflected in the aggregate net tonnage, 35,079, as compared with 29,128. Vessels employed partly in the coastal trade and partly in the foreign trade showed an increase of 3 in number and 4,986 in aggregate net tonnage, while the number of vessels employed in foreign trade only was the same in each year, but there was a decrease of 12,292 in the net tonnage.
MARINE OFFICERS' CERTIFICATES.—The examinations for masters, mates, engineers, &c., of vessels are controlled by the Marine Department, and the regulations relating to these examinations are based upon those of the Imperial Board of Trade, with such modifications as are necessitated by local conditions; but the British Board of Trade recognizes only the following New Zealand certificates as of Imperial validity : Master, extra; master, first mate, and second mate; first- and second-class steam engineers; and first- and second-class motor engineers. It is a condition of such recognition that candidates must, possess service qualifications and pass examinations similar and not inferior to those prescribed by the British Board of Trade.
New regulations for the examination of marine engineers were issued by the Board of Trade in the year 1938, and corresponding regulations were made in this country and came into force on the 1st October, 1939. These regulations provide for the issue of combined steam and motor engineers' certificates (Imperial validity). Provision is also made whereby candidates for first- and second-class examinations (Imperial validity) may take the examinations in two parts. Amendments to the rules for the examination of masters and mates were brought into force on 11th October, 1940.
During the year ended 31st March, 1948, 141 examinations for certificates as masters and mates were held. Of the 84 who passed, 41 obtained certificates as masters and mates of foreign-going ships, 28 as masters and mates of home-trade ships, 8 as masters of river steamers, 4 for compass deviation, 2 for square-rigged endorsement, and 1 for fore and aft endorsement. In addition, 23 secured a partial pass in the examination for foreign-going masters and mates and 9 for home-trade masters and mates.
For the examinations of marine engineers during 1947–48, 132 candidates presented themselves for certificates of imperial validity, of whom 35 secured a full pass and 46 a partial pass. There were 234 examinations for certificates of New Zealand validity only, and 193 certificates were issued. These included 67 third-class steam, 6 river steam, 26 first and second coastal motor, and 94 river oil certificates.
SURVEY OF SHIPS.—Survey certificates were issued in 1947–48 for 6 steam and 8 motor foreign-going ships, 28 steam and 74 motor home-trade ships, and 47 steam and 260 motor restricted-limits ships and launches. Equipment certificates were issued for 12 foreign-going, 29 home-trade, and 1 restricted-limits ships, all of which carry certificates of class issued by classification societies. Surveys were also made in 280 cases for seaworthiness, efficiency of equipment, tonnage, radio-telegraphy, &c., under section 220 of the Shipping and Seamen Act, 1908.
LIGHTHOUSES.—Along the New Zealand coast there are fifty-one lighthouses of various types. In twenty-four cases the lights are watched lights and the apparatus is classed as of the dioptric order—i.e., a central lamp sending its ray through a combination of surrounding lenses—while the remainder of the coastal lighthouses are automatic lights. The buildings housing the lights are of varying kinds, as necessitated by their respective situations.
Fog-signals of the diaphone type are established at Pencarrow Head, Godley Head, Taiaroa Head, and Tiritiri Island; while radio beacons have been established at Baring Head, Stephen's Island, Cape Campbell, Cape Reinga, Tiritiri Island, Portland Island, Cuvier Island, and Mokohinau.
The most powerful light is that of Stephen's Island, which, placed some 600 ft. above high water, is visible at a distance of 32½ nautical miles. Next in order come Cape Brett (altitude 510 ft.) and East Cape (505 ft.), both visible at 30½ miles; Godley Head (altitude 450 ft.), visibility 29 miles; Cuvier Island (altitude 390 ft.) and Mokohinau (altitude 385 ft.), both of which have a visibility of 27 miles. Sixteen other lights have a range of 20 miles or over.
All manually-attended coastal lighthouses are equipped with signalling flags and lamps, the keepers being competent to transmit or receive messages. Coastal lights —i.e., those outside the bounds of the various harbour authorities—are maintained by the Marine Department.
The average cost of erection and equipment of the main coastal lighthouses was about £6,000 per light, the two most costly being Cape Brett Lighthouse (£11,237) on the Auckland Peninsula, and Dog Island Lighthouse (£10,481) in Foveaux Strait. The expenditure on all lighthouses under the control of the Marine Department during the year 1947–48 was as follows: Salaries and wages, £30,503; stores and general maintenance, £65,929; radio-beacons, improvements, &c., £8,241; working-expenses of tender, £34,511; administration expenses, £11,811; depreciation, £24,150; total, £175,145. Light dues for 1947–48 totalled £72,718.
WRECKS.—In the case of any wreck or shipping casualty in New Zealand waters a Collector of Customs, Superintendent of Mercantile Marine, or other person empowered by the Minister of Marine, institutes an inquiry into the cause and circumstances of such casualty. If necessary, a formal investigation is held by a Magistrate, who has power to cancel or suspend the certificate of any officer from whose wrongful act or default damage has resulted.
Should any wreck occur on the coast, the Receiver of Wrecks for that district, usually an officer of the Customs, has the necessary authority to be used in the preservation of life and property.
The number of shipping casualties reported to the Marine Department during the year ended 31st March, 1948, was 49, of which 45 occurred on or near the coasts of New Zealand. There were 2 total losses during the year, and 6 lives were lost. A summary of the casualties is given.
| Strandings— | No. | Tonnage. |
|---|---|---|
| Total loss | 1 | 20 |
| Damaged | 5 | 748 |
| Undamaged | 8 | 10,751 |
| Collisions— | ||
| Total loss | 1 | 4 |
| Damaged | 12 | 15,958 |
| Undamaged | 2 | 5,636 |
| Fires— | No. | Tonnage. |
| Total loss | ||
| Damaged | 4 | 4,779 |
| Undamaged | 1 | 4,490 |
| Miscellaneous | 15 | 15,172 |
| Total casualties | 49 | 57,558 |
RAILWAY history in Now Zealand dates from the year 1860. In that year a contract was let for the construction of a line from Christchurch to Lyttelton, and the first portion of this line was opened on the 1st December, 1863. A line from Invercargill to Bluff Harbour was opened on the 5th February, 1867. The Provincial Council of Auckland in 1883 began the construction of a line from Auckland to Drury.
Although practically the whole of the railways are now State-owned, some were built by private enterprise. Of these the more important were constructed by the Midland and the Wellington-Manawatu Railway Companies.
In the year 1876 the railways of New Zealand passed from the control of the Provincial Governments to the Public Works Department. A few years later the opened lines were handed over to the Working Railways Department, and in 1889 a Board of three Railways Commissioners was appointed. This form of management, however, lasted for only five years, at the end of which period a General Manager, responsible to the Minister of Railways, took over the administration, and this system continued for nearly thirty years. In 1925 the system of railway management was reorganized under the control of a Railways Board of three members, but in 1928 the system of control by a General Manager was again reverted to. Three years later legislation was passed constituting the Government Railways Board of five members. This form of management was in operation from 1st June, 1951, to 31st March, 1936, after which date the system of control by a General Manager, responsible to the Minister of Railways, was again introduced.
The Christchurch—Lyttelton section of railway, including the Lyttelton Tunnel, was electrified in 1928–29; the Otira - Arthur Pass section, including the Otira Tunnel, in 1923; the Wellington-Johnsonville section in 1938; and the Wellington-Paekakariki section in 1940.
MILEAGE OF STATE RAILWAYS.—At the 31st March, 1948, there were 3,526 miles of State railways open for traffic, divided into three distinct sections, as follows:—
| Section | Length (Miles). |
|---|---|
| North Island main line and branches | 1,683 |
| South Island main line and branches | 1,783 |
| Nelson | 60 |
| Total, South Island | 1,843 |
Government railways are constructed by the Works Department, and are transferred to the Railways Department when completed.
The gauge is 3 ft. 6 in., and a steel rail 85 lb. weight per lineal yard has in recent years been adopted as the standard for the permanent-way. Two hundred and twenty-nine miles of this weight have been laid. The previous standard was a 70 lb. rail, and this weight is in use on 1,942 miles of line. In both these instances the mileage given includes miles of double track. The remaining mileage is in 55 lb. and 100 lb., steel rails. Sleepers, which are laid down to the number of 2,500 to the mile, are principally of Australian hardwood and New Zealand silver-pine or totara.
The completion of the South Island Main Trunk Railway linked the Picton section to the main-line system on 15th December, 1945. As part of the deviation and duplication of the line between Wellington and Upper Hutt (20 miles), an extension from Waterloo to Naenae was opened for traffic on 7th January, 1946, and to Taita on 14th April, 1947, this portion of the deviation serving the extensive new State housing development in this area. Materials for the electrification of this line are on order, as well as multiple unit passenger-coaches. On 7th December, 1947, the Turakina—Okoia deviation was brought into use, saving 4 miles 10 chains on the journey between Marton and Wanganui, and by the elimination of a tortuous hill section, permitting the haulage of greater loads by the same locomotives.
COST OF CONSTRUCTION—The capital cost of State railways as at the end of each of the last five financial years is given below.
| — | 31st March, 1944. | 31st March, 1945. | 31st March, 1946. | 31st March, 1947. | 31st March, 1948. |
|---|---|---|---|---|---|
*Equal to £26,941 per mile of open line. | |||||
| Open for traffic— | £ | £ | £ | £ | £ |
| Railway | 68,476,775 | 68,623,125 | 71,514,380 | 72,099,790 | 73,838,317* |
| Lake Wakatipu steamer service | 20,396 | 20,396 | 20,396 | 20,396 | 20,396 |
| Subsidiary services | 2,492,058 | 2,700,157 | 2,922,059 | 3,224,161 | 3,220,422 |
| General | 9,896 | 9,896 | 9,896 | 9,896 | 9,896 |
| Totals | 70,999,125 | 71,353,574 | 74,466,731 | 75,354,243 | 77,089,031 |
| Lines under construction | 3,290,226 | 3,520,471 | 1,546,066 | 1,587,655 | 1,569,897 |
| Grand totals | 74,289,351 | 74,874,045 | 76,012,797 | 76,941,808 | 78,658,928 |
So varied are the geographical features of New Zealand that a great disparity exists in the cost of constructing the individual sections of lines. The numerous mountain-chains and the innumerable rivers make railway-construction in general both difficult and expensive. The Otira Tunnel is 5 miles 26 chains long, and the proposed Rimutaka Tunnel is to be 5 miles 36 chains. The length of the longest bridge, over the Rakaia River, is 5,720 ft., and the largest viaduct, the Mohaka, is 887 ft., long and 318 ft. above water-level.
ROLLING-STOCK.—Information as to the rolling-stock in use on the State railways in 1947–48 is given in the following table.
* In addition, there are 5 battery electric shunting locomotives in use in workshops and 37 diesel and petrol shunting tractors in use at stations. | |
|---|---|
| Locomotives— | |
| Tender | 456 |
| Tank | 165 |
| Electric | 21 |
| Total | *642 |
| Passenger-vehicles— | |
| Sleepers | 15 |
| Combination day-sleepers | 3 |
| First-class | 152 |
| Second-class | 1,231 |
| Composite | 82 |
| Rail cars | 21 |
| Electric multiple units | 17 |
| Postal | 8 |
| Ambulance | 9 |
| Total | 1,538 |
| Wagons— | |
| Horse-boxes | 2 |
| Cattle | 932 |
| Sheep | 3,422 |
| Frozen and chilled meat | 1,182 |
| Cool-storage | 1,131 |
| Covered goods | 862 |
| High-side | 18,304 |
| High-side bogie | 363 |
| Low-side | 1,639 |
| Flat-top bogie | 908 |
| Brake-vans | 497 |
| Other | 3,932 |
| Total | 33,443 |
Since 1901 most of the rolling-stock required has been built in the Department's own workshops, including carriages, diesel-mechanical rail cars, wagons, motor-omnibus bodies, and locomotives, both steam and electric. Special types have been imported from England, notably multiple unit coaches, nine rail cars operating in the South Island, and the prototypes of electric locomotives. On order are the multiple units for the Hutt Valley electrified lines, whilst designs of diesel-electric rail cars and shunting engines are being investigated.
During the war years the resources of the workshops were directed towards munitions and urgent repairs of rolling-stock; consequently, wagon-construction programmes fell far behind schedule, and little headway has since, been made owing to staff and material shortages. To alleviate an acute wagon deficiency, orders for 3,000 four-wheeled LA wagons were placed in the United Kingdom; deliveries commenced in 1947, and Railway workshops carried out the final assembly. Similarly, in 1921–22, 2,500 wagons were imported.
The heaviest types of locomotive used in New Zealand were designed and constructed in Railway workshops, the K class weighing 135 tons in working trim, the KA 142 tons and the KB (with booster) 143 tons. The tenth locomotive of a programme of 35 class JA (109 tons), was completed at Hillside in July, 1948. This type is similar to the J, 40 of which were imported from England in 1939 in anticipation of heavy Centennial Exhibition traffic.
The following steam engines of recent construction deal with the bulk of the traffic.
| Class. | Type. | Traffic. | Weight. | Tractive Force. |
|---|---|---|---|---|
| Tons. | lb. | |||
| AB | 4–6–2 superheated; simple, with tender | Mixed | 85 | 20,000 |
| G | 4–6–2 superheated; simple, with tender | Mixed | 98 | 25,800 |
| J and JA | 4–8–2 superheated; simple, with tender | Mixed | 109 | 24,920 |
| K | 4–8–4 superheated; simple, with tender | Mixed | 135 | 30,815 |
| KA | 4–8–4 superheated; simple, with tender | Mixed | 142 | 30,815 |
| KB | 4–8–4 superheated; simple, with tender (fitted with booster) | Mixed | 143 | 36,815 |
| WAB | 4–6–4 superheated; simple tank engine | Mixed | 71 | 22,250 |
| C | 2–6–2 superheated; simple, with tender | Shunting | 66 | 15,300 |
Standard carriages are 56 ft. in length, fitted with chair seats to accommodate thirty-one to fifty-six passengers, steam-heated, and lighted by electricity. Some 767 carriages were equipped with electric light at 31st March, 1948.
REVENUE AND EXPENDITURE.—The total revenue from and expenditure on the railways (including subsidiary services) during each of the years 1937–38 to 1947–48 were as follows:—
| Year ended 31st March, | Gross Revenue. | Expenditure. | Net Revenue. | Net Revenue per £100 of Capital Cost. | ||
|---|---|---|---|---|---|---|
*The losses were recovered in full as a subsidy from vote, “Economic Stabilization.” | ||||||
| £ | £ | £ | £ | s. | d. | |
| 1938 | 8,634,186 | 8,001,389 | 632,797 | 1 | 3 | 0 |
| 1939 | 9,345,387 | 8,644,324 | 701,063 | 1 | 4 | 7 |
| 1940 | 10,199,070 | 9,010,039 | 1,189,031 | 1 | 19 | 3 |
| 1941 | 11,160,218 | 9,465,574 | 1,694,644 | 2 | 12 | 10 |
| 1942 | 11,938,338 | 10,056,034 | 1,882,304 | 2 | 18 | 0 |
| 1943 | 14,128,993 | 11,302,413 | 2,826,580 | 4 | 6 | 1 |
| 1944 | 15,325,306 | 12,757,336 | 2,567,970 | 3 | 14 | 3 |
| 1945 | 14,459,750 | 13,260,277 | 1,199,473 | 1 | 13 | 9 |
| 1946 | 15,444,847 | 14,384,844 | 1,060,003 | 1 | 9 | 4 |
| 1947 | 15,680,057 | 15,944,270 | -264,213* | |||
| 1948 | 17,070,872 | 17,710,897 | -640,025* | |||
Interest on capital liability amounted to £3,030,033 in 1947–48, compared with £2,992,900 in 1946–47. In each year the working loss was made good by the stabilization subsidies, so the interest debits represented the final deficit. A sum of £1,517,802 was set aside in 1948 for depreciation and track-renewals, while expenditure from these funds amounted to £1,670,957. The amounts standing to the credit of the Depreciation and Renewals Accounts at 31st March, 1948, were £2,133,814 and £1,244,987 respectively.
The revenue and expenditure for the last five years, distinguishing between railway operation and other items, are given in the following table.
| Year Ended 31st March, | Revenue. | Expenditure. | Net Revenue. | |||
|---|---|---|---|---|---|---|
| Railway Operation. | Subsidiary Services, &c. | Railway Operation. | Subsidiary Services, &c. | Railway Operation. | Subsidiary Services. &c. | |
* Net loss. | ||||||
| £ | £ | £ | £ | £ | £ | |
| 1944 | 13,464,979 | 1,860,327 | 11,365,917 | 1,391,419 | 2,099,062 | 468,908 |
| 1945 | 12,448,307 | 2,011,443 | 11,696,895 | 1,563,382 | 751,412 | 448,061 |
| 1946 | 13,104,587 | 2,340,200 | 12,549,724 | 1,835,120 | 554,863 | 505,140 |
| 1947 | 12,823,784 | 2,856,273 | 13,644,779 | 2,299,491 | -820,995* | 556,782 |
| 1948 | 13,964,280 | 3,100,592 | 15,090,091 | 2,620,806 | -1,125,811* | 485,786 |
The various subsidiary services now conducted by the Railways Department, with the revenue and expenditure of each during the last two years, are shown below. Full working-costs, including interest, are charged against these services, and the interest so charged is taken into miscellaneous receipts as revenue.
| Service. | Revenue. | Expenditure. | ||
|---|---|---|---|---|
| 1946–47. | 1947–48. | 1946–47. | 1947–48. | |
| £ | £ | £ | £ | |
| Lake Wakatipu steamers | 12,501 | 12,996 | 16,477 | 16,461 |
| Refreshment service | 340,798 | 325,002 | 333,467 | 331,666 |
| Bookstall service | 205,180 | 238,785 | 202,459 | 236,904 |
| Advertising service | 47,925 | 54,911 | 37,701 | 40,748 |
| Departmental dwellings | 159,816 | 167,582 | 279,598 | 281,318 |
| Leases of bookstalls, &c. | 53,851 | 59,744 | 41,002 | 47,204 |
| Road services—Passengers and goods | 1,555,686 | 1,741,786 | 1,388,787 | 1,666,505 |
| Miscellaneous receipts | 480,516 | 505,786 | ||
| Totals | 2,856,273 | 3,106,592 | 2,299,491 | 2,620,806 |
Revenue.—In the following table the railway operating revenue during 1947–48 and each of the preceding ten years is classified according to the class of traffic, &c., from which it was derived.
| Year ended 31st March, | Passenger-fares. | Parcels, Luggage, and Mails. | Goods and Live-stock. | Labour, Demurrage, &c. | Totals. |
|---|---|---|---|---|---|
| £ | £ | £ | £ | £ | |
| 1938 | 1,698,021 | 318,457 | 5,411,297 | 164,050 | 7,591,825 |
| 1939 | 1,785,646 | 334,170 | 5,694,936 | 190,307 | 8,005,059 |
| 1940 | 2,119,335 | 330,024 | 6,109,293 | 202,985 | 8,761,637 |
| 1941 | 2,345,718 | 317,819 | 6,818,603 | 212,050 | 9,694,190 |
| 1942 | 2,658,778 | 325,897 | 7,174,060 | 225,145 | 10,383,880 |
| 1943 | 3,710,509 | 397,142 | 8,044,563 | 262,866 | 12,415,080 |
| 1944 | 4,275,482 | 435,928 | 8,479,387 | 274,182 | 13,464,979 |
| 1945 | 3,504,453 | 411,021 | 8,261,087 | 271,746 | 12,448,307 |
| 1946 | 3,912,509 | 426,619 | 8,515,673 | 249,786 | 13,104,587 |
| 1947 | 3,253,748 | 440,731 | 8,903,762 | 225,543 | 12,823,784 |
| 1948 | 2,687,767 | 553,366 | 10,486,744 | 236,403 | 13,964,280 |
Revenue from the carriage of goods and live-stock increased steadily up to 1929–30, but from then until 1932–33 successive declines were recorded, due mainly to the economic depression and to motor competition. Commencing in the following year, however, revenue from this source recorded an unbroken series of increases up to 1943–44. A slight reduction occurred in 1944–45, due to a falling off in military freights, but since then the upward trend has continued, and the figures for 1947–48 set a new record in both revenue and tonnage. Goods revenue for 1947–48 was £1,582,982, or 17.8 per cent. in excess of the previous year and £5,582,420, or 113.8 per cent. more than that for 1929–30.
During the period 1926–33 there was a rapid falling off in the amount of revenue from passenger traffic owing mainly in the earlier years to intensive motor competition and later to the depression. This period was followed by a definite upward trend due to the improvement in economic conditions. After the outbreak of war, passenger traffic increased more sharply, the peak being reached in 1943–44, when passenger revenue was more than double that of 1939–40. The large increase during the war years was due to the movements of members of the Armed Forces and to the curtailment of road services and the partial immobilization of private motor-ears, the result of restrictions placed on the use of motor-spirits and rubber tires. Following the cessation of hostilities passenger revenue has receded considerably, being £1,587,715 (37.1 per cent.) less in 1947–48 than in the peak year of 1943–44, owing to the large decline in Armed Forces traffic and to intensified road and air competition. The Department has also been hampered in its activities by a severe shortage of coal, in consequence of which it has been possible to run only a much curtailed passenger service.
Compared with the last pre-war year (1938–39), the revenue from passenger fares in 1947–48 showed an increase of 50.5 per cent. and the revenue from goods and livestock an increase of 84.1 per cent.
As from 14th September, 1947, passenger fares (excluding suburban) were raised 15 per cent., and goods and parcels rates by 20 per cent., these increases being rendered necessary by the continued upward trend of expenditure.
The revenue from passenger-fares during the year 1947–48 represented an expenditure on railway travel of £1 9s. 8d. per head of mean population, including Maoris. The total railway operating revenue was equal to £7 14s. 1d. per head.
Expenditure.—The total railway expenditure in 1947–48 represented 103.75 per cent. of the gross earnings, and the operating-expenses 108.06 per cent. of operating revenue. It is of interest to trace the movement over a series of years, as in the following statement. The figures show the percentage of operating expenditure to operating revenue.
| Year ended 31st March, | Per Cent. |
|---|---|
| 1929 | 84.71 |
| 1930 | 91.62 |
| 1931 | 94.47 |
| 1932 | 91.56 |
| 1933 | 90.54 |
| 1934 | 86.65 |
| 1935 | 86.98 |
| 1936 | 88.46 |
| 1937 | 91.81 |
| 1938 | 96.05 |
| 1939 | 95.73 |
| 1940 | 90.66 |
| 1941 | 86.72 |
| 1942 | 85.73 |
| 1943 | 80.71 |
| 1944 | 84.41 |
| 1945 | 93.96 |
| 1946 | 95.77 |
| 1947 | 106.40 |
| 1948 | 108.06 |
The operating expenditure under various heads is now given for 1947–48 and for each of the previous ten years.
| Year ended 31st March, | Maintenance of Ways and Works. | Maintenance of Signals. | Maintenance of Rolling-stock. | Locomotive Transportation. | Traffic Transportation. | Head Office and General Charges.* | Totals. |
|---|---|---|---|---|---|---|---|
* Including superannuation subsidy. | |||||||
| £ | £ | £ | £ | £ | £ | £ | |
| 1938 | 1,278,980 | 178,892 | 1,792,562 | 1,703,110 | 2,090,471 | 247,770 | 7,291,785 |
| 1939 | 1,375,829 | 186,546 | 1,832,615 | 1,812,857 | 2,208,310 | 247,475 | 7,663,632 |
| 1940 | 1,468,268 | 197,949 | 1,896,366 | 1,891,262 | 2,250,905 | 238,370 | 7,943,120 |
| 1941 | 1,544,202 | 213,623 | 2,043,976 | 2,043,996 | 2,322,492 | 238,501 | 8,406,790 |
| 1942 | 1,615,382 | 238,169 | 2,211,476 | 2,113,918 | 2,479,852 | 243,795 | 8,902,592 |
| 1943 | 1,829,311 | 271,499 | 2,380,260 | 2,430,347 | 2,862,653 | 245,589 | 10,019,659 |
| 1944 | 2,146,448 | 326,190 | 2,868,006 | 2,555,956 | 3,207,782 | 261,535 | 11,365,917 |
| 1945 | 2,250,736 | 332,015 | 2,839,591 | 2,473,581 | 3,460,705 | 340,267 | 11,696,895 |
| 1946 | 2,524,485 | 375,499 | 3,055,303 | 2,627,868 | 3,618,584 | 347,985 | 12,549,724 |
| 1947 | 2,466,020 | 376,458 | 3,241,139 | 2,996,016 | 4,138,817 | 426,329 | 13,644,779 |
| 1948 | 2,528,407 | 426,841 | 3,298,700 | 3,786,756 | 4,550,376 | 499,011 | 15,090,091 |
The increase in expenditure in recent years has been due chiefly to an increased wages bill, mainly the result of higher rates of pay and improved conditions of employment, to the high cost of locomotive fuels, and to a general rise in the price of stores. In an endeavour to overcome an unsatisfactory coal position, the Department has been obliged to import coal from overseas and, in addition, has converted some thirty-five locomotives to burn oil-fuel.
PASSENGERS AND GOODS.—In addition to the traffic figures shown in the following table for 1947–48, 21,537,007 passengers were carried by the Railways Department's road services, as compared with 20,364,278 in 1946–47 and 16,587,833 in 1945–46. Passenger train-miles run during 1947–48 totalled 4,709,653, and the passenger revenue received represents 136.97d. per train-mile and £762 per mile of line operated.
| Year ended 31st March, | Length open (Miles). | Train-mileage (Revenue). | Passengers. | Season Tickets issued. | Goods and Live-stock.* | |
|---|---|---|---|---|---|---|
| Including Season-ticket Holders. | Excluding Season-ticket Holders. | |||||
* Live-stock converted to equivalent tonnage. | ||||||
| Tons. | ||||||
| 1938 | 3,323 | 12,777,852 | 22,441,212 | 8,069,018 | 750,497 | 7,516,049 |
| 1939 | 3,319 | 13,072,615 | 23,265,768 | 7,813,436 | 888,844 | 7,539,012 |
| 1940 | 3,390 | 13,366,798 | 24,454,014 | 8,283,067 | 972,769 | 7,673,950 |
| 1941 | 3,390 | 13,559,646 | 26,276,923 | 9,440,087 | 1,055,742 | 8,426,182 |
| 1942 | 3,390 | 13,978,961 | 28,610,945 | 11,105,627 | 1,167,115 | 8,473,765 |
| 1943 | 3,460 | 15,139,882 | 36,133,268 | 17,171,214 | 1,377,825 | 8,887,089 |
| 1944 | 3,504 | 15,328,987 | 38,611,267 | 18,317,323 | 1,518,045 | 9,026,626 |
| 1945 | 3,504 | 12,802,536 | 32,994,529 | 13,629,523 | 1,394,817 | 8,954,239 |
| 1946 | 3,528 | 13,454,508 | 32,417,675 | 13,553,083 | 1,369,572 | 9,210,466 |
| 1947 | 3,528 | 13,169,233 | 28,869,135 | 10,222,325 | 1,358,453 | 9,329,333 |
| 1948 | 3,526 | 13,712,103 | 25,887,189 | 8,111,417 | 1,347,671 | 9,524,043 |
The number of ordinary passenger journeys in 1947–48 declined by 20.65 per cent. while the tonnage of goods hauled increased by 2.09 per cent. compared with the previous year.
Live-stock carried in 1947–48 was equivalent to a tonnage of 757,750 and included 799,505 cattle, 702,761 calves, 10,817,124 sheep, and 468,447 pigs. Comparative figures for 1946–47 were 780,862 tons, 795,179 cattle, 654,434 calves, 11,517,421 sheep, and 447,564 pigs.
Detailed figures showing the number of rail passengers carried during the last five years are given in the following table.
| — | 1943–44. | 1944–45. | 1945–46. | 1946–47. | 1947–48. |
|---|---|---|---|---|---|
| Ordinary | 8,526,049 | 5,986,609 | 5,860,470 | 5,045,228 | 4,625,465 |
| Suburban | 3,347,661 | 2,838,870 | 2,803,564 | 2,348,181 | 2,226,155 |
| Other reduced fares | 6,443,613 | 4,804,044 | 4,889,049 | 2,828,916 | 1,259,797 |
| Totals | 18,317,323 | 13,629,523 | 13,553,083 | 10,222,325 | 8,111,417 |
| Season tickets issued— | |||||
| Suburban weekly twelve-trip | 424,117 | 407,423 | 403,559 | 429,249 | 427,358 |
| Workers' weekly | 79,016 | 74,322 | 77,753 | 81,936 | 70,020 |
| Weekly twelve-trip | 78,740 | 71,742 | 67,972 | 62,185 | 51,802 |
| Bearer twelve-trip | 76,817 | 65,287 | 62,029 | 58,109 | 65,732 |
| Bearer six-trip | 776,008 | 693,481 | 678,996 | 650,227 | 662,552 |
| School | 24,699 | 24,598 | 22,984 | 22,171 | 18,316 |
| Tourist | 102 | 50 | 49 | 67 | 45 |
| Travellers' annual | 309 | 295 | 244 | 214 | 147 |
| Other | 58,237 | 57,619 | 55,986 | 54,295 | 51,699 |
| Totals | 1,518,045 | 1,394,817 | 1,369,572 | 1,358,453 | 1,347,671 |
The following table gives interesting information as to the constitution of the goods traffic for the year 1947–48. The figures are exclusive of steamer traffic on Lake Wakatipu.
| Commodity. | Tonnage. | Revenue. | ||||
|---|---|---|---|---|---|---|
| Tons Carried. | Percentage of Total. | Tons, One Mile (000 Omitted). | Average Haul. | Total Gross. | Per Ton-Mile. | |
| No. | %. | No. | Miles. | £ | d. | |
| Grain | 340,600 | 3.58 | 21,487 | 63 | 231,593 | 2.58 |
| Meals | 110,355 | 1.16 | 7,236 | 66 | 81,726 | 2.71 |
| Fruit and vegetables | 80,553 | 0.85 | 16,389 | 203 | 145,073 | 2.12 |
| Root crops and fodder | 178,051 | 1.87 | 21,198 | 119 | 172,419 | 1.95 |
| Flax, green and pressed | 5,492 | 0.06 | 794 | 145 | 9,844 | 2.97 |
| Seeds | 44,148 | 0.46 | 3,796 | 86 | 49,843 | 3.15 |
| Cattle, calves, horses | 301,639 | 3.17 | 26,112 | 87 | 393,562 | 3.62 |
| Sheep and pigs | 456,111 | 4.79 | 40,287 | 88 | 642,991 | 3.83 |
| Meat, fresh | 24,434 | 0.26 | 2,540 | 104 | 52,814 | 4.99 |
| Meat, frozen | 338,910 | 3.56 | 14,029 | 41 | 415,515 | 7.11 |
| Butter | 121,866 | 1.28 | 12,456 | 102 | 198,286 | 3.82 |
| Cheese | 88,233 | 0.93 | 5,269 | 60 | 103,100 | 4.70 |
| Wool | 222,268 | 2.33 | 17,182 | 77 | 358,124 | 5.00 |
| Dairy by-products | 49,542 | 0.52 | 4,256 | 86 | 72,006 | 4.06 |
| Fat, hides, and skins | 65,892 | 0.69 | 5,972 | 91 | 111,006 | 4.46 |
| Fish | 14,497 | 0.15 | 2,498 | 172 | 29,021 | 2.79 |
| Agricultural lime | 733,628 | 7.70 | 48,900 | 67 | 329,213 | 1.62 |
| Lime, other | 45,807 | 0.48 | 2,944 | 64 | 24,870 | 2.03 |
| Coal, New Zealand hard | 849,727 | 8.92 | 62,848 | 74 | 470,962 | 1.80 |
| Coal, New Zealand brown | 1,238,245 | 13.00 | 157,374 | 127 | 985,060 | 1.50 |
| Coke | 12,443 | 0.13 | 1,341 | 108 | 14,680 | 2.63 |
| Road-metal | 76,089 | 0.80 | 4,605 | 61 | 48,527 | 2.53 |
| Timber, imported | 18,251 | 0.19 | 1,817 | 100 | 26,801 | 3.54 |
| Timber, New Zealand | 659,876 | 6.93 | 98,851 | 150 | 865,250 | 2.10 |
| Firewood, posts, &c. | 114,836 | 1.21 | 11,972 | 104 | 73,715 | 1.48 |
| Motor spirits, kerosene | 298,443 | 3.13 | 25,291 | 85 | 573,631 | 5.44 |
| Cement | 109,051 | 1.15 | 18,132 | 166 | 178,805 | 2.37 |
| Manure | 800,662 | 8.40 | 72,099 | 90 | 586,688 | 1.95 |
| Miscellaneous | 2,124,394 | 22.30 | 229,747 | 108 | 3,407,670 | 3.56 |
| Totals | 9,524,043 | 100.00 | 937,422 | 98 | 10,652,795 | 2.73 |
The next table shows the tonnage of goods carried, freight train-miles run, and net ton-miles run, together with the respective averages for each of the last eleven years.
| Year ended 31st March. | Tonnage carried. | Freight Train-miles. | Tons One-mile (,000 omitted). | Revenue. | |||||
|---|---|---|---|---|---|---|---|---|---|
| Per' Ton. | Per Freight Train-mile. | Per Ton.-mile. | |||||||
| s. | d. | £ | s. | d. | d. | ||||
| 1938 | 7,516,049 | 7,455,802 | 561,121 | 14 | 8 | 0 | 14 | 9 | 2.35 |
| 1939 | 7,539,012 | 7,521,589 | 574,485 | 15 | 4 | 0 | 15 | 5 | 2.43 |
| 1940 | 7,673,950 | 7,464,466 | 580,777 | 15 | 11 | 0 | 16 | 4 | 2.57 |
| 1941 | 8,426,182 | 7,710,091 | 659,724 | 16 | 5 | 0 | 17 | 8 | 2.52 |
| 1942 | 8,473,765 | 7,996,572 | 688,709 | 17 | 3 | 0 | 18 | 3 | 2.54 |
| 1943 | 8,887,089 | 8,758,310 | 781,379 | 18 | 6 | 0 | 18 | 9 | 2.52 |
| 1944 | 9,026,626 | 8,873,974 | 832,594 | 19 | 2 | 0 | 19 | 6 | 2.50 |
| 1945 | 8,954,239 | 8,199,598 | 814,906 | 18 | 10 | 1 | 0 | 6 | 2.48 |
| 1946 | 9,210,466 | 8,646,417 | 842,542 | 18 | 10 | 1 | 0 | 1 | 2.47 |
| 1947 | 9,329,333 | 8,516,995 | 883,664 | 19 | 5 | 1 | 1 | 3 | 2.46 |
| 1948 | 9,524,043 | 9,002,450 | 937,422 | 22 | 4 | 1 | 3 | 8 | 2.73 |
A classification of goods traffic for the eleven years ended 1947–48 is now given, the figures quoted being in thousands of tons.
| Year ended 31st March. | Agricultural and Pastoral Produce. | Agricultural Lime and Manures. | Timber and Firewood. | Coal. | Motor spirits and Kerosene. | Other. | |||
|---|---|---|---|---|---|---|---|---|---|
| Agricultural Produce. | Dairy-produce. | Meat, Fish, and livestock. | Wool. | ||||||
| 1938 | 585 | 256 | 972 | 159 | 1,368 | 579 | 1,687 | 175 | 1,735 |
| 1939 | 517 | 231 | 940 | 172 | 1,254 | 578 | 1,764 | 188 | 1,895 |
| 1940 | 556 | 215 | 930 | 168 | 1,430 | 587 | 1,756 | 195 | 1,837 |
| 1941 | 596 | 232 | 1,028 | 165 | 1,629 | 664 | 2,034 | 178 | 1,900 |
| 1942 | 589 | 274 | 1,125 | 188 | 1,377 | 653 | 2,086 | 196 | 1,986 |
| 1943 | 696 | 288 | 1,214 | 222 | 1,149 | 758 | 2,049 | 180 | 2,331 |
| 1944 | 757 | 252 | 1,196 | 219 | 1,240 | 757 | 2,084 | 202 | 2,320 |
| 1945 | 752 | 255 | 1,194 | 205 | 1,402 | 715 | 2,084 | 205 | 2,142 |
| 1946 | 795 | 250 | 1,255 | 250 | 1,457 | 692 | 2,097 | 221 | 2,193 |
| 1947 | 733 | 249 | 1,212 | 233 | 1,647 | 701 | 2,062 | 261 | 2,231 |
| 1948 | 759 | 260 | 1,202 | 222 | 1,534 | 793 | 2,088 | 298 | 2,368 |
RAILWAY EMPLOYEES.—The average number of persons employed by the State railways throughout the year ended 31st March, 1948, was 25,950. The staff is divided into two divisions—namely, the first or clerical division, and the second or out-of-door division—and is further classed in five branches, as shown in the following table.
| Year ended 31st March. | General. | Traffic. | Maintenance. | Locomotive Running. | Workshops. | Totals. |
|---|---|---|---|---|---|---|
| 1944 | 2,791 | 7,525 | 4,340 | 3,405 | 5,361 | 23,422 |
| 1945 | 2,932 | 7,455 | 4,683 | 3,391 | 5,541 | 24,002 |
| 1946 | 3,034 | 7,853 | 4,351 | 3,365 | 5,726 | 24,329 |
| 1947 | 3,490 | 8,218 | 4,574 | 3,622 | 6,173 | 26,077 |
| 1948 | 3,592 | 8,196 | 4,578 | 3,572 | 6,012 | 25,950 |
A system of classification, first introduced in 1896, and revised at various times since, applies to railway employees. An Appeal Board is constituted to hear grievances of members dissatisfied with decisions in regard to promotion, loss of status, or breaches of discipline. The Board consists of a Magistrate and two members of the Railways service, one appointed by the Minister of Railways, and the other elected by the members of the Department. The Government Railways Amendment Act, 1944, provided for the establishment of a Tribunal of three members whose principal functions are to prescribe scales of salaries and rates of wages for railway employees; conditions in regard to hours of work, overtime, &c.; and terms and conditions in regard to leave of absence, railway travel concessions, &c. This tribunal, known as the Government Railways Industrial Tribunal, is deemed to be a Commission of Inquiry under the Commissions of Inquiry Act, 1908. The members, who must not be members of the Railways Department or of any of the railway employees' organizations, are appointed for a term of three years.
A superannuation fund in connection with the Railways service was established in 1903. Information concerning this is given in the section dealing with “Social Security, Pensions, Superannuation, &c.” A sick-benefit fund, providing for the payment of weekly allowances for periods up to fifty-two weeks to employees other than salaried staff who are incapacitated by sickness, was instituted in 1929. The fund is subsidized by the Department up to a maximum of £28,000 per annum. The amount claimed in 1947–48 was £7,500. The Sick Benefit Society had a membership of 15,316 at 31st March, 1948.
RAILWAY ACCIDENTS.—The history of the railways in New Zealand has been one of comparative freedom from train accidents of a serious nature. Of two which may be termed disasters, the first occurred near Ongarue in 1923, when seventeen passengers were killed and twenty-six injured as a result of an express train colliding with a fallen boulder on the line; the second was a major derailment of a passenger-train near Hyde on 4th June, 1943, which caused the deaths of twenty-one passengers and more or less serious injuries to forty-six others.
A further serious accident occurred on 25th February, 1948, when the Picton-Christchurch passenger express became derailed two miles south of Seddon Station. A Board of Inquiry set up under the Government Railways Act, 1926, found that the cause of the accident was the overturning of the engine and tender duo to entering a curve at a speed far in excess of that authorized. Six passengers were killed and 61 injured, some seriously. The fireman and driver were also injured.
During the year ended 31st March, 1948, 40 persons were killed and 572 were injured in all kinds of accidents arising from train-working and movements of rolling-stock. Comparative figures for the previous year were 44 killed and 496 injured. These figures do not include employees who were killed or injured whilst engaged on other duties—e.g., railway work-shops.
Of the 40 persons meeting with fatal accidents in 1948, 9 were passengers and 7 were employees; of the remainder who were neither passengers nor employees, 13 were killed at railway-crossings, 1 in a shunting accident, 4 in accidents on the line, and 6 whilst trespassing. Of those injured, 115 were passengers, 400 were employees (chiefly minor accidents), and 57 were neither passengers nor employees. Of the 57 other persons, 36 were injured in crossing accidents.
PRIVATE RAILWAYS.—There are a number of private railways in New Zealand, chiefly lines of light construction serving colliery and sawmilling areas. On the timber tramways, special rolling-stock is used for log-haulage with various types of locomotive, many of interesting design according to the nature of the work required of them. The longest of the private lines connecting collieries to the State system is the 11 miles 67 chains of railway between Birchfield and Wairio, operated by the Ohai Railway Board.
No accurate information is available concerning the mileage of these railways.
SYSTEMS AND OWNERSHIP.—Subject to two exceptions, electric-tramway services in New Zealand have been controlled since their inception by local authorities, the exceptions being—(1) Auckland, where a public company operated from 1902 until 1st July, 1919, when the system was taken over by the Auckland City Council; and (2) Dunedin, where a section of the system was until 1921 operated by a private company. Five of the seven electric-tramway systems operating at the present time are controlled by the council of the city or borough concerned. At Christchurch the Christchurch Tramway Board, and at Auckland the Auckland Transport Hoard, are the controlling authorities.
The local authorities derive their powers for controlling tramways from the Tramways Act, 1908. There are also special Acts empowering the construction, &c., of tramways in certain places.
| System. | Year of Inauguration. | Length of Truck as at 31st March, 1947. | Approximate Population in Area served 31st March, 1947 | |||
|---|---|---|---|---|---|---|
| Thoroughfare. | Single Line (including Loops). | |||||
| M. | ch. | M. | ch. | |||
| Auckland | 1902 | 44 | 60 | 87 | 40 | 232,000 |
| New Plymouth | 1916 | 6 | 24 | 7 | 30 | 21,000 |
| Wanganui | 1908 | 14 | 24 | 16 | 64 | 25,000 |
| Wellington | 1904 | 30 | 34 | 54 | 46 | 129,000 |
| Christchurch | 1905 | 43 | 57 | 56 | 11 | 138,000 |
| Dunedin | 1908 | 14 | 62 | 26 | 31 | 77,000 |
| Invercargill | 1912 | 7 | 42 | 9 | 40 | 26,000 |
Passenger rolling-stock at 31st March, 1947, comprised 714 cars with a capacity of 30,157 passengers, including 15 trolley-buses with a capacity of 568 passengers. The total route mileage was 162 miles, and track mileage (including loops) 258 miles. In addition to the passenger rolling-stock there were 3 freight cars and 1 water-sprinkler.
REVIEW OF OPERATIONS.—Summarized statistics of tramway operations during the last five years are given in the following table.
| Year ended Slat March. | Number of Undertakings. | Number of Employees paid out of Revenue. | Passenger Car-miles run. | Passengers carried. | Number of Passengers per Car-mile. |
|---|---|---|---|---|---|
| 1943 | 7 | 2,966 | 17,116,492 | 200,767,098 | 11.73 |
| 1944 | 7 | 3,035 | 17,734,593 | 220,215,978 | 12.42 |
| 1945 | 7 | 3,068 | 17,726,760 | 219,828,191 | 12.40 |
| 1946 | 7 | 3,196 | 17,663,473 | 215,700,744 | 12.21 |
| 1947 | 7 | 3,373 | 17,515,113 | 202,949,563 | 11.59 |
Successive annual increases in the numbers of passengers carried were recorded from 1933–34 to 1943–44, but in the last three years progressive decreases have been recorded, culminating in the substantial fall of 6 per cent. in 1946–47 as compared with 1945–46. One of the principal factors contributing to the decline in passenger traffic in 1946–47 would be the increase in private motoring made possible by the easing of motor-spirits rationing, while other considerations were the reduced services in some centres owing to the electric-power position and staff shortages. Auckland, Wellington, and Christchurch showed decreases of 7.6 per cent., 5.3 per cent., and 9.0 per cent., respectively. New Plymouth and Dunedin, however, showed increases of 21 per cent. and 4.1 per cent., respectively. The increased volume of passenger traffic during the war years was undoubtedly largely duo to the restrictions imposed on the use of motor-spirits, though the presence of members of the Armed Forces on leave from nearby military camps would also be a contributing factor in some centres.
A summary of all tramways revenue for the last five years, classified under the main headings, is contained in the following table. Compared with the previous year, cash fares in 1946–47 fell by £73,721 (4.3 per cent.) and concession fares by £25,584 (4.4 per cent.)
| Year ended 31st March. | Passenger. | Freight. | Other. | Total. | |
|---|---|---|---|---|---|
| Cash. | Concession. | ||||
| £ | £ | £ | £ | £ | |
| 1943 | 1,575,474 | 507,615 | 5,929 | 21,599 | 2,110,617 |
| 1944 | 1,739,683 | 554,797 | 5,964 | 24,192 | 2,324,636 |
| 1945 | 1,727,680 | 568,255 | 5,934 | 28,111 | 2,329,980 |
| 1946 | 1,701,106 | 581,639 | 5,694 | 29,300 | 2,317,739 |
| 1947 | 1,627,385 | 556,055 | 4,450 | 33,048 | 2,220,938 |
Figures showing details of the total expenditure during the last five years are given in the next table.
| Year ended 31st March. | Operating Expenditure. | Capital Charges. | Other Expenses. | Totals. | ||||
|---|---|---|---|---|---|---|---|---|
| £ | Per Cent. | £ | Per Cent. | £ | Per Cent. | £ | Per Cent. | |
| 1943 | 1,335,125 | 67.66 | 613,805 | 31.10 | 24,542 | 1.24 | 1,973,472 | 100.00 |
| 1944 | 1,438,729 | 64.93 | 754,803 | 34.07 | 22,179 | 1.00 | 2,215,711 | 100.00 |
| 1945 | 1,479,311 | 65.56 | 732,137 | 32.45 | 44,962 | 1.99 | 2,256,410 | 100.00 |
| 1946 | 1,663,527 | 71.31 | 628,164 | 26.93 | 41,072 | 1.76 | 2,332,763 | 100.00 |
| 1947 | 1,658,246 | 74.06 | 551,493 | 24.63 | 29,226 | 1.31 | 2,238,965 | 100.00 |
Operating expenditure has increased by £432,325, or 35.3 per cent., during the last five years, whereas in the same period traffic revenue increased by £385,795 (21.4 per cent.).
An analysis of the capital value of tramway undertakings follows.
| As at 31st March. | Permanent-way. | Electric Equipment of Lines. | Cars and other Vehicles. | Land. | Buildings. | Miscellaneous and Undefined. | Totals. |
|---|---|---|---|---|---|---|---|
| £ | £ | £ | £ | £ | £ | £ | |
| 1943 | 2,020,353 | 462,109 | 1,334,358 | 145,095 | 614,517 | 526,790 | 5,103,222 |
| 1944 | 1,975,330 | 473,448 | 1,365,404 | 144,544 | 608,094 | 457,647 | 5,024,467 |
| 1945 | 1,716,716 | 428,583 | 1,228,252 | 144,269 | 585,704 | 440,619 | 4,544,143 |
| 1946 | 1,715,701 | 429,797 | 1,235,479 | 143,744 | 587,093 | 442,347 | 4,554,161 |
| 1947 | 1,675,450 | 429,298 | 1,237,099 | 137,498 | 588,312 | 424,946 | 4,492,603 |
Following is an analysis of the Accumulated Funds and Reserves for the last five years.
| As at 31st March. | Sinking Fund Reserves. | Depreciation and Renewal Reserves, &c. | Accident Reserves. | Capital Reserves. | |||
|---|---|---|---|---|---|---|---|
| Funded. | Not Funded. | Funded. | Not Funded. | Funded. | Not Funded. | ||
*Not available. | |||||||
| £ | £ | £ | £ | £ | £ | £ | |
| 1943 | 633,132 | 1,209 | 646,995 | 189,456 | 128,934 | 62,527 | * |
| 1944 | 698,247 | 1,262 | 1,029,536 | 210,104 | 165,118 | 39,550 | * |
| 1945 | 538,529 | 43,658 | 1,340,538 | 248,381 | 176,747 | 46,185 | 2,221,619 |
| 1946 | 657,855 | 30,403 | 1,656,885 | 347,321 | 191,435 | 48,925 | 2,168,395 |
| 1947 | 703,981 | 942 | 1,786,543 | 361,176 | 203,756 | 51,736 | 2,374,889 |
SEPARATE SYSTEMS.—A more detailed analysis of the 1946–47 statistics for each undertaking is given in the following pages.
Volume of Traffic.—The number of passengers carried per car-mile is a useful guide to the relative density of traffic handled by the various undertakings. The length of track may be taken into consideration as a relevant factor. No data are available as to the length of journey per passenger.
| System. | Total Passengers carried. | Car-miles run (Passenger Cars and Trailers). | Passengers per Car-mile.* | Average rare per Passenger. |
|---|---|---|---|---|
*Passenger vehicles. | ||||
| d. | ||||
| Auckland | 91,354,550 | 7,240,036 | 12.61 | 2.66 |
| New Plymouth | 3,644,383 | 339,294 | 10.74 | 2.13 |
| Wanganui | 2,705,313 | 401,282 | 6.75 | 2.92 |
| Wellington | 55,781,282 | 4,146,940 | 13.47 | 2.45 |
| Christchurch | 26,210,338 | 3,407,043 | 7.68 | 2.79 |
| Dunedin | 20,173,390 | 1,585,452 | 12.71 | 2.38 |
| Invercargill | 3,080,307 | 395,066 | 7.79 | 2.32 |
| Totals | 202,949,563 | 17,515,113 | 11.59 | 2.58 |
Financial Transactions.—The Auckland and Wellington services provided 72.5 per cent. of the total traffic revenue for 1946–47, the former returning £1,015,377 or 46.4 per cent. of the total, and the latter £571,273, or 26.1 per cent.
Following is an analysis of revenue in each centre in 1946–47.
| System. | Traffic (Passengers and Freight). | Traffic Revenue per Car-mile.* | Other Revenue. | Totals. | |
|---|---|---|---|---|---|
| Cash. | Concession. | ||||
*All vehicles. | |||||
| £ | £ | d. | £ | £ | |
| Auckland | 999,166 | 16,211 | 33.64 | 10,847 | 1,026,224 |
| New Plymouth | 15,939 | 16,393 | 22.87 | 479 | 32,811 |
| Wanganui | 26,628 | 6,459 | 19.79 | 1,164 | 34,251 |
| Wellington | 276,874 | 294,399 | 33.06 | 7,466 | 578,739 |
| Christchurch | 203,500 | 102,580 | 21.56 | 10,120 | 316,200 |
| Dunedin | 102,618 | 97,313 | 30.26 | 2,362 | 202,293 |
| Invercargill | 7,110 | 22,700 | 18.11 | 610 | 30,420 |
| Totals | 1,631,835 | 556,055 | 29.97 | 33,048 | 2,220,938 |
In 1946–47 total expenditure (including operating expenses, capital charges, and other expenditure) exceeded total revenue by £18,027, Auckland, Wellington, and Dunedin being the only undertakings to show a surplus. It should generally be noted, however, that the inclusion with capital charges of reserve fund charges, which, are actually appropriations of profits, has the effect in some cases of understating a surplus or of overstating a loss. Of the total expenditure, operating-costs (£1,658,246) comprised 74.06 per cent., and capital charges (£551,493) 24.63 per cent.
An analysis of the expenditure incurred in respect of each service in 1946–47 is shown below.
| System. | Operating Expenditure. | Capital Charges. | Other Expenses. | Totals. |
|---|---|---|---|---|
| £ | £ | £ | £ | |
| Auckland | 703,670 | 279,669 | 8,747 | 992,086 |
| New Plymouth | 27,128 | 5,431 | 1,433 | 33,992 |
| Wanganui | 34,379 | 15,585 | 1,748 | 51,712 |
| Wellington | 136,992 | 130,636 | 5,760 | 573,388 |
| Christchurch | 263,224 | 82,294 | 9,486 | 355,004 |
| Dunedin | 163,548 | 33,483 | 1,932 | 198,963 |
| Invercargill | 29,305 | 4,395 | 120 | 33,820 |
| Totals | 1,658,246 | 551,493 | 29,220 | 2,238,965 |
The principal item comprised in the total operating expenditure is expenses on account of traffic, which in 1946–47 represented 63.1 per cent.; followed by car-maintenance, 16.8 per cent.; track-maintenance, 8.1 per cent.; cost of power, 8.0 per cent.; and management and office expenses, 4.0 per cent. The distribution of operating expenditure in 1946–47 was as follows:—
| System. | Power. | Traffic. | Car-maintenance. | Track-maintenance (including Electrical Equipment). | Management and Office Expenses. | Totals. |
|---|---|---|---|---|---|---|
| £ | £ | £ | £ | £ | £ | |
| Auckland | 56,425 | 459,744 | 122,006 | 44,024 | 21,471 | 703,670 |
| New Plymouth | 1,800 | 18,211 | 4,406 | 871 | 1,840 | 27,128 |
| Wanganui | 3,434 | 15,781 | 7,056 | 6,327 | 1,781 | 34,379 |
| Wellington | 30,799 | 290,357 | 68,794 | 31,789 | 15,253 | 436,992 |
| Christchurch | 27,546 | 150,499 | 46,801 | 27,806 | 10,572 | 263,224 |
| Dunedin | 9,757 | 96,351 | 23,627 | 19,653 | 14,160 | 163,548 |
| Invercargill | 2,368 | 14,782 | 6,868 | 4,180 | 1,107 | 29,305 |
| Totals | 132,129 | 1,045,725 | 279,558 | 134,650 | 66,184 | 1,658,246 |
Annual capital charges in the way of provision for interest and sinking fund and for depreciation, reserve, and renewal funds comprised 24.6 per cent. of the total expenditure during the year ended 31st March, 1947. The magnitude of these charges is not surprising, having regard to the relatively large capital outlay that is necessary in tramway undertakings. Of the total provision for capital charges for the year ended 31st March, 1947, 20 per cent. consisted of interest charges and 28 per cent. of sinking fund charges. As the Wanganui tramways are unable to meet capital charges out of revenue, the City Council levies a special rate for that purpose. In the case of Invercargill, the bulk of the capital charges is now paid out of withdrawals from the Depreciation Fund, as authorized by the Invercargill City Council Tramway Depreciation Fund Empowering Act, 1940, and is excluded from the figures here presented. The amounts expended on various capital charges by each system in 1946–47 were:—
| System. | Interest. | Sinking Fund Charges. | Depreciation Fund Charges. | Renewal Fund Charges. | Reserve Fund Charges. | Accident Fund Charges. | Totals. |
|---|---|---|---|---|---|---|---|
| £ | £ | £ | £ | £ | £ | £ | |
| Auckland | 54,668 | 75,174 | 100,000 | 40,000 | 3,000 | 6,827 | 279,669 |
| New Plymouth | 2,217 | 2,806 | 408 | 5,431 | |||
| Wanganui | 4,035 | 11,550 | 15,585 | ||||
| Wellington | 18,980 | 26,970 | 38,343 | 38,343 | 8,000 | 130,636 | |
| Christchurch | 24,847 | 25,108 | 28,122 | 4,217 | 82,294 | ||
| Dunedin | 5,901 | 12,470 | 15,112 | 33,483 | |||
| Invercargill | 939 | 2,751 | 385 | 320 | 4,395 | ||
| Totals | 111,587 | 154,078 | 117,863 | 107,258 | 41,343 | 19,364 | 551,493 |
The following table, showing the relationship between revenue and expenditure per car-mile run, gives a useful indication of the relative prosperity of the various undertakings.
| System. | Per Car-mile* run, 1946–47. | ||||
|---|---|---|---|---|---|
| Total Revenue. | Operating-costs. | Capital Charges. | Other Expenditure. | Total Expenditure. | |
*All vehicles. | |||||
| d. | d. | d. | d. | d. | |
| Auckland | 34.00 | 23.31 | 9.26 | 0.29 | 32.87 |
| New Plymouth | 23.21 | 19.19 | 3.84 | 1.01 | 24.04 |
| Wanganui | 20.48 | 20.56 | 9.32 | 1.05 | 30.93 |
| Wellington | 33.49 | 25.29 | 7.56 | 0.33 | 33.18 |
| Christchurch | 22.27 | 18.54 | 5.80 | 0.67 | 25.01 |
| Dunedin | 30.62 | 24.76 | 5.07 | 0.29 | 30.12 |
| Invercargill | 18.48 | 17.80 | 2.67 | 0.07 | 20.55 |
| All systems | 30.42 | 22.72 | 7.55 | 0.40 | 30.67 |
Capital Value.—At the 31st March, 1947, existing electric tramways represented a capital value of £4,492,603, made up as follows:—
| System. | Permanent-way. | Electric Equipment of Lines. | Cars and other Vehicles. | Land. | Buildings. | Miscellaneous and undefined. | Totals. |
|---|---|---|---|---|---|---|---|
| £ | £ | £ | £ | £ | £ | £ | |
| Auckland | 382,361 | 88,081 | 186,796 | 15,400 | 143,050 | 126,798 | 942,486 |
| New Plymouth | 63,444 | 9,158 | 23,895 | 896 | 8,149 | 2,184 | 107,726 |
| Wanganui | 45,550 | 12,320 | 20,710 | 4,950 | 8,624 | 92,154 | |
| Wellington | 515,276 | 143,315 | 518,304 | 52,624 | 211,118 | 80,909 | 1,521,546 |
| Christchurch | 419,577 | 126,829 | 343,132 | 39,258 | 152,066 | 194,149 | 1,275,011 |
| Dunedin | 204,788 | 41,807 | 104,653 | 29,168 | 61,073 | 10,606 | 452,095 |
| Invercargill | 44,454 | 7,788 | 39,609 | 152 | 7,906 | 1,676 | 101,585 |
| Totals | 1,675,450 | 429,298 | 1,237,099 | 137,498 | 588,312 | 424,946 | 4,492,603 |
These figures should be read in conjunction with the next table, which sets out the reserves available for writing down the value of the various assets. The capital values of the Auckland, Wanganui, and Christchurch systems have already been written down by amounts of £1,405,917, £187,884, and £80,780 respectively.
Accumulated funds and reserves at the 31st March, 1947, totalled £5,483,023. Practically the whole of the sinking fund reserves, 78 per cent. of the Depreciation and, Renewals Reserves, and 80 per cent. of the accident reserves are funded in securities outside the tramway undertakings.
Figures of accumulated funds and reserves as at 31st March, 1947, were as follows:—
| System. | Sinking Fund Reserves. | Depreciation Reserves. | Accident Reserves. | Other Reserves. | Totals. |
|---|---|---|---|---|---|
| £ | £ | £ | £ | £ | |
| Auckland | 456,683 | 780,058 | 12,445 | 240,226 | 1,489,412 |
| New Plymouth | 8,585 | 60,041 | 68,626 | ||
| Wanganui | 22,474 | 919 | 23,393 | ||
| Wellington | 110,441 | 383,388 | 151,295 | 1,582,011 | 2,227,135 |
| Christchurch | 98,845 | 181,850 | 56,866 | 723,855 | 1,061,416 |
| Dunedin | 9,088 | 197,525 | 33,967 | 250,697 | 491,277 |
| Invercargill | 7,392 | 57,693 | 56,679 | 121,764 | |
| Totals | 704,923 | 1,609,099 | 255,492 | 2,913,509 | 5,483,023 |
Power Consumption.—With the exception of Christchurch, which generated 962,850 units during 1946–47, the whole of the power used by tramway authorities is drawn from the Government hydro-electric systems, or, as in the cases of New Plymouth and Dunedin, from municipally-owned hydro-stations linked to these systems. As a consequence, the cost per unit of the energy used is comparatively low. In using the per-unit cost figures in the next table it should be borne in mind that in the cases of Christchurch and Wanganui the power purchased is A.C. and is converted by the tramway authority to D.C. power for tramway operation, while the other authorities purchase D.C. power. The figures shown in the second column of the table include for Wanganui and Christchurch operating-expenses in connection with conversion, but not capital charges on the conversion equipment. In the case of New Plymouth the annual power cost is independent of the number of units consumed, the present yearly charge having remained fixed since 1933–34.
Figures for the financial year ended 31st March, 1947, are:—
| System. | Total Units of Electrical Energy used (D.C.). | Cost per Unit (D.C.).† | Units per Car-mile.‡ | Passengers per Car-mile.§ |
|---|---|---|---|---|
* Traction only. Excludes 779,100 units sold or used for other purposes. † Total units. ‡ All vehicles. § Passenger vehicles. | ||||
| d. | ||||
| Auckland | 24,621,750 | 0.55 | 3.40 | 12.61 |
| New Plymouth | 755,790 | 0.57 | 2.23 | 10.74 |
| Wanganui | 1,110,110 | 0.73 | 2.77 | 6.75 |
| Wellington | 11,429,485 | 0.65 | 2.76 | 13.47 |
| Christchurch | 9,064,010 | 0.68 | 2.66 | 7.68 |
| Dunedin | 3,701,763 | 0.63 | 2.33 | 12.71 |
| Invercargill | 639,992 | 0.89 | 1.62 | 7.79 |
| Totals | 51,322,900* | 0.61 | 2.93 | 11.59 |
OMNIBUS SERVICES OPERATED BY TRAMWAY AUTHORITIES.—Omnibus services were carried on by tramway authorities in the following centres in 1946–47: New Plymouth, Wanganui, Wellington, Christchurch, Dunedin, and Invercargill. Statistics for the year 1946–47 show that expenditure exceeded revenue by £24,449. New Plymouth recorded a deficit of £7,213, Christchurch of £6,920, Dunedin of £6,078, Wellington of £3,456, Wanganui of £445, and Invercargill of £337. Persons employed during 1946–47 totalled 178, made up as follows: Traffic, management, and office staff, 135; garage, 43. The number of vehicles in use was 124.
Passengers carried in 1946–47 increased by 3,468,097 as compared with the number carried in 1945–46, and bus-miles run by 656,183. Passengers carried by the various bus services were: Dunedin, 5,009,130; Christchurch, 4,470,216; Wellington, 2,191,028; New Plymouth, 1,168,956; Wanganui, 207,655; and Invercargill, 213,850.
| — | Year ended 31st March, | ||||
|---|---|---|---|---|---|
| 1943. | 1944. | 1945 | 1946. | 1947. | |
| Undertakings No. | 5 | 5 | 5 | 6 | 6 |
| Employees No. | 111 | 117 | 122 | 135 | 178 |
| Salaries and wages £ | 44,601 | 46,412 | 49,487 | 59,586 | 75,331 |
| Capital cost of vehicles £ | 215,489 | 220,956 | 223,904 | 247,670 | 305,760 |
| Depreciation £ | 74,498 | 85,222 | 90,738 | 94,384 | 93,606 |
| Total expenditure £ | 125,003 | 130,981 | 135,172 | 143,454 | 194,912 |
| Revenue £ | 122,697 | 126,683 | 130,526 | 134,662 | 170,463 |
| Passengers carried No. | 8,220,377 | 8,733,725 | 9,507,633 | 9,792,738 | 13,260,835 |
| Bus-miles No. | 1,388,554 | 1,340,580 | 1,438,098 | 1,494,838 | 2,151,021 |
| Average fare per pas- d. senger | 3.56 | 3.47 | 3.27 | 3.26 | 3.03 |
| Passengers per bus-mile No. | 5.92 | 6.51 | 6.61 | 6.55 | 6.16 |
CABLE TRAMWAYS.—There were four cable-tramway systems operating in New Zealand during 1946–47, one in Wellington and three in Dunedin. The three Dunedin systems have all been owned by the Municipality for some years, while the Wellington system was purchased by the Wellington City Corporation during 1946–47. The systems, all of which operate on a 3 ft. 6 in. gauge, extend over routes totalling 4 miles 31 chains. The total revenue in 1946–47 amounted to £57,879, while expenditure totalled £66,083. The total revenue derived from traffic during the year was £57,500, showing an average of 2.15d. per passenger carried. The total capital value stood at £125,944 at 31st March, 1947.
| — | Year ended 31st March, | |||||
|---|---|---|---|---|---|---|
| 1943. | 1944. | 1945. | 1946. | 1947. | ||
*Including 130,077 passengers carried and 7,536 miles run by buses temporarily replacing trains. † Including 79,452 passengers carried and 4,756 miles run by buses temporarily replacing trams. ‡ Includes the revaluation of the Kelburn system on being taken over by the Wellington City Corporation. | ||||||
| Undertakings | No. | 4 | 4 | 4 | 4 | 4 |
| Employees | No. | 72 | 72 | 73 | 73 | 73 |
| Salaries and wages | £ | 24,941 | 25,091 | 26,529 | 31,805 | 36,988 |
| Capital value | £ | 123,048 | 123,048 | 123,073 | 144,260 | 125,944‡ |
| Expenditure— | ||||||
| Operating-expenses | £ | 44,003 | 43,724 | 46,292 | 53,749 | 55,790 |
| Capital charges | £ | 10,324 | 10,709 | 10,341 | 10,695 | 10,293 |
| Total | £ | 54,327 | 54,433 | 56,633 | 64,444 | 66,083 |
| Revenue | £ | 56,301 | 58,565 | 58,129 | 56,878 | 57,879 |
| Passengers carried | No. | 6,822,299* | 7,388,264† | 7,221,815 | 6,568,578 | 6,432,952 |
| Car-miles run (including trailer miles) | No. | 324,840* | 330,481† | 329,585 | 340,260 | 347,740 |
| Passengers per car-mile. | No. | 21.00 | 22.36 | 21.91 | 19.30 | 18.50 |
ROADS AND BRIDGES.—The total mileage of formed roads in New Zealand at 31st March, 1947, was 53,767, in addition to which there were 5,662 miles of bridle-tracks and 17,286 miles of unformed legal roads. Details are given in the following table.
| — | Counties. | Boroughs. | Town Districts. | Road Districts. | Totals. |
|---|---|---|---|---|---|
* Includes 5 miles of wood or stone. † Includes 6 miles clay and shell. ‡ Includes 297 miles of pumice roads. | |||||
| Miles. | Miles. | Miles. | Miles. | Miles. | |
| Formed roads and streets, paved or surfaced with— | |||||
| Bituminous or cement concrete | 152 | 252 | 2 | 14 | 420 |
| Bitumen or tar | 3,831 | 1,992* | 101 | 46 | 5,970 |
| Metal or gravel | 37,167 | 1,446† | 258 | 66 | 38,937 |
| Unmetalled formed roads and streets (i.e., not paved or surfaced) | 8,156‡ | 173 | 93 | 18 | 8,440 |
| Totals, formed roads | 49,306 | 3,863 | 454 | 144 | 53,767 |
| Bridle-tracks | 5,560 | 19 | 4 | 79 | 5,662 |
| Unformed legal roads | 16,878 | 345 | 47 | 16 | 17,286 |
| Totals, all roads | 71,744 | 4,227 | 505 | 239 | 76,715 |
The formation of roads in many parts has been attended with considerable expense and difficulties, arising from the configuration of the country and the abundance of rivers. As illustrating the latter aspect, the following table, showing the number and lengths of bridges incorporated in the roads system as at 31st March, 1947, is of interest. Only bridges 25 ft. or over in length have been taken into account, no official enumeration having been made of the innumerable culverts and short bridges.
| Material of which Bridge constructed. | Counties. | Boroughs. | Town Districts. | Road Districts. | Totals. | |||||
|---|---|---|---|---|---|---|---|---|---|---|
| No. | Total Length. | No. | Total Length. | No. | Total Length. | No. | Total Length. | No. | Total Length. | |
| Ft. | Ft. | Ft. | Ft. | Ft. | ||||||
| All concrete or stone | 928 | 89,765 | 51 | 4,771 | 8 | 568 | 3 | 87 | 990 | 95,191 |
| Steel and concrete | 723 | 66,435 | 72 | 9,814 | 6 | 720 | 801 | 76,969 | ||
| Steel, concrete, and timber | 556 | 52,683 | 31 | 5,552 | 587 | 58,235 | ||||
| Steel and timber | 729 | 55,084 | 14 | 2,967 | 1 | 31 | 744 | 58,082 | ||
| Australian hardwood | 2,032 | 199,093 | 82 | 8,751 | 7 | 1,775 | 2,121 | 209,619 | ||
| Native timbers | 2,690 | 168,643 | 54 | 3,990 | 13 | 620 | 5 | 143 | 2,762 | 173,396 |
| Totals | 7,658 | 631,703 | 304 | 35,845 | 35 | 3,714 | 8 | 230 | 8,005 | 671,492 |
ROADS ADMINISTRATION.—The main statutes covering roads administration in New Zealand are the Public Works Act, 1928, the Counties Act, 1920, and amendments, and the Main Highways Act, 1922, and amendments. The latter receives specific mention later.
Roads which have been declared to be Government roads are under the immediate jurisdiction of the Minister of Works. Urban roads and streets are controlled by city, borough, or town district authorities, and rural roading is controlled by County Councils and Road Boards.
Apart from Government roads, which are maintained by the State, roads and streets are maintained by the respective local authorities out of their own revenue resources. The Government does not assist in financing general road maintenance except in regard to roads which, as is explained Tinder the next heading, have been gazetted as main highways under the Main Highways Act, 1922, or as State highways under an amendment of 1936. In the case of extraordinary maintenance arising from storms or floods, the Minister may give special assistance to rural local authorities by way of subsidy or grant from the Consolidated Fund according to the severity of the damage and the financial position of the authority concerned.
The Government assists towards the construction of roads and bridges in counties and road districts, particularly in areas where better roading facilities are required in the interests of settlement and primary production. The sums granted by the State from the Public: Works Account for this purpose may be by way of free grant or, more generally, on a subsidy basis. County Councils and Road Boards are invited each' year to make application for grants and subsidies on roadworks. Finance available is allocated in the first instance by means of revote to cover commitments already entered upon in previous financial years; the balance is then allocated to new works in order of priority determined by the District Engineer and local authority officials. In many instances construction is carried out by the Works Department, although frequently the respective local authorities arrange for work to be undertaken. In the latter case the standard of construction, &c., must first be approved, and departmental supervision exercised, before the grant or subsidy can be uplifted.
Wherever possible, County Councils arrange to finance their roading operation from revenue, but as a general rule the construction of roads and bridges necessitates the raising of loans. Such borrowing is subject to the approval of the Local Government Loans Board.
MAIN HIGHWAYS.—Prior to the advent of the motor-vehicle only a small proportion of the total road-mileage outside of boroughs was permanently surfaced. The development of motor-traffic, however, entirely changed the complexion of the roading problem in New Zealand, as elsewhere, and better roads were demanded as motor transport became popular. Later on, with the rapid increase in the use if motor-vehicles, particularly heavy ones, it became very evident that the type of road that was suitable for slow-moving horse-drawn traffic was inadequate. It was found that under the strain of motor traffic the roads, particularly those between the main centres running parallel with railways, were deteriorating, while the necessity for changes in both construction and administration became more and more obvious. To meet the situation the Main Highways Act was passed in 1922, under which provision was made for the declaration of roads as main highways, and thus the control of arterial roads became primarily a national concern.
For the administration of the Act the Main Highways Board was constituted. The Board consists of six members—viz., two members appointed by the Government, an officer of the Works Department, two representatives of County Councils, and one representative of owners of motor-vehicles. The Board administers the main highways system, but in most cases delegates its powers of maintenance, control, &c., to the local authority concerned, though at the same time exercising supervision over the standard of work. At 31st March, 1948, the length of main highways totalled 12,468 miles.
Under an amendment to the Act of 1922, passed in 1936, the Board may, with the approval of the Minister of Works, classify any main highway as a “State highway,” the whole cost of maintenance and construction of such a highway (with certain exceptions) being met from the Main Highways Account. As this account was abolished as from the 1st April, 1947, the cost is now met by annual appropriations from the Consolidated Fund, and the Public Works Account. Of the 12,468 miles of main highways, 3,978 miles, comprising the principal arterial traffic routes, have been classified as State highways.
Highway Districts.—In terms of the Act the Board has divided New Zealand into twenty highway districts, composed of counties grouped according to geographic situation and community of interest. For each highway district there is an advisory body, known as the District Highways Council, which is constituted to include an Engineer of the Works Department and one representative of each constituent county. The principal function of these councils is to make recommendations to the Board each year as to which roads within the several districts should be declared main highways and the works which should be undertaken.
Finance.—Under the original Act there were two separate funds within the Main Highways Account—viz., the Revenue Fund and the Construction Fund, but from 1st April, 1936, these funds were amalgamated into the Main Highways Account. Revenue for main highways purposes was until 1st April, 1947, obtained from the following sources of motor taxation:—
Tire-tax (sections 13 and 14, Main Highways Act, 1922).
Motor-spirits tax (section 9 of the Motor-spirits Taxation Act, 1927).
Motor-registration licences, fees, &c. (section 24, Motor-vehicles Act, 1924).
Mileage-tax (section 8, Finance Act, 1946).
As from August, 1939, the tax on motor-spirits was increased from 10d. to 1s. 2d. per gallon for British imports, of which 8d. is ordinary Customs revenue, and from 10 ½d. to 1s. 2 7/10d. for foreign imports, of which 8 7/10d. is ordinary Customs revenue. Ninety-two per cent. of the revenue from the remaining 6d. per gallon was credited to the Main Highways Account until 1st April, 1947, and since then to the Consolidated Fund, while the other 8 per cent. is distributed on a population basis among cities and boroughs having a population of 6,000 or more, for expenditure on streets forming continuations of main highways. For the year ended 31st March, 1948, the amount distributed among these cities and boroughs was £197,155. For those vehicles whose motive-power is not wholly derived from motor-spirits, and for trackless trolley-buses, a mileage-tax is levied, the revenue from this source being divided on a basis similar to the motor-spirits revenue.
The original Revenue Fund received an annual transfer of £35,000 from the Consolidated Fund, and the Construction Fund an annual transfer of £200,000 from the Public Works Fund, but in both cases the transfers have been discontinued since 1930. The amount so transferred from the Public Works Fund totalled £1,226,000, and interest on that sum was debited against the Main Highways Account. Section 5 of the Finance Act (No. 2), 1943, stipulated that the amount in question, until paid, was to constitute a capital liability of the Main Highways Account to the Consolidated Fund; but section 7 of the Finance Act, 1946, repealed this provision and the liability was written off as from 1st April, 1946.
Section 3 of the Finance Act (No. 2), 1947, abolished the Main Highways Account as from the 1st day of April, 1947, and all moneys standing to the credit of that account were transferred to the Public Works Account. All moneys that were previously paid into the Main Highways Account are now paid into the Public Account to the credit of the Consolidated Fund. All moneys that were previously payable out of the Main Highways Account are now payable out of moneys from time to time appropriated by Parliament for the purpose.
Section 7 of the Finance Act, 1948, provided that if the total amount appropriated in any financial year under section 3 of the Finance Act (No. 2), 1947, was less than the net revenues derived in that year which would have been payable into the Main Highways Account if that section had not been passed, the amount so appropriated shall be deemed to be increased to the amount of these net revenues.
All receipts from special taxation of motor-vehicles were not credited to the Main Highways Account (abolished since 1st April, 1947), nor are all such receipts now appropriated from the Consolidated Fund for highways purposes. As already stated, 8 per cent. of the highway-purposes share of the motor-spirits tax and a similar percentage of the tire-tax is distributed among certain cities and boroughs, and, in addition, receipts from drivers' licences and heavy-traffic fees are collected by local authorities. The following table gives a summary of the returns from special taxation of motor-vehicles for the last five financial years.
| Yield of | 1943–44. | 1944–45. | 1945–46. | 1946–47. | 1947–48. |
|---|---|---|---|---|---|
* Share for highway-purposes only (first 6d.). | |||||
| £ | £ | £ | £ | £ | |
| Tire-tax | 6,584 | 128,861 | 154,161 | 210,029 | 246,912 |
| Motor-spirits tax* | 1,200,470 | 1,273,276 | 1,660,397 | 2,268,272 | 2,496,621 |
| Fees, &c., under Motor-vehicles Act, 1924 | 474,026 | 509,564 | 499,484 | 479,412 | 768,898 |
| Mileage-tax | 11,245 | 17,917 | 10,026 | 14,323 | 31,523 |
| Heavy-traffic fees | 346,826 | 392,123 | 427,517 | 485,619 | 572,639 |
| Drivers' licences | 80,792 | 84,337 | 97,397 | 107,400 | 112,505 |
| Totals | 2,119,943 | 2,406,078 | 2,848,982 | 3,565,055 | 4,229,098 |
In the following table are shown the amounts which have been expended on main highways construction, renewal, or maintenance by the Main Highways Hoard during the last five years. Maintenance figures include the cost of flood damage restoration when applicable.
| Class of Expenditure. | 1943–44. | 1944–45. | 1945–46. | 1946–47. | 1947–48. |
|---|---|---|---|---|---|
| £ | £ | £ | £ | £ | |
| Construction and improvement | 102,386 | 124,108 | 183,256 | 577,431 | 1,411,030 |
| Renewal | 92,845 | 169,320 | 217,528 | 250,683 | 316,836 |
| Maintenance, repairs, &c. | 1,178,186 | 1,272,143 | 1,577,546 | 1,795,796 | 2,386,281 |
| Totals | 1,373,417 | 1,565,571 | 1,978,330 | 2,623,910 | 4,114,147 |
An analysis of the actual expenditure on maintenance in each Island, as compared with the number of motor-vehicles in each Island at 31st March of each of the last five years, appears in the following table, the percentages relating to New Zealand totals.
| — | 1943–44. | 1944–45. | 1945–46. | 1946–47. | 1947–48. |
|---|---|---|---|---|---|
| North Island— | |||||
| Maintenance expenditure | 66.01 | 66.29 | 64.71 | 67.56 | 69.99 |
| Motor-vehicles | 66.16 | 65.84 | 66.00 | 66.16 | 66.33 |
| South Island— | |||||
| Maintenance expenditure | 33.99 | 33.71 | 35.29 | 32.44 | 30.01 |
| Motor-vehicles | 33.84 | 34.16 | 34.00 | 33.84 | 33.67 |
The following table shows the mileage of main highways in the North and South Islands as at 31st March, 1948, together with a classification as to the type of construction or surface.
| — | Length of Main Highways. | |||
|---|---|---|---|---|
| Dustless Surface. | Gravel or Macadam Surface. | Clay or Pumice Surface. | Totals. | |
| Miles. | Miles. | Miles. | Miles. | |
| North Island | 2,631 | 4,057 | 248 | 6,936 |
| South Island | 1,292 | 4,233 | 7 | 5,532 |
| Totals | 3,923 | 8,290 | 255 | 12,468 |
Assistance to Local Authorities.—In terms of the Act of 1922, the Main Highways Board was required to provide one-half of the cost of construction or reconstruction of main highways and one-third of the cost of maintenance and repairs. By subsequent legislation, the rate of assistance was increased, and eventually the Board was empowered to determine the basis of subsidy. Since 1st April, 1931, the standard maintenance subsidy rate has been £3 for £1, and only in exceptional circumstances is this increased. The construction or renewal of bridges was subsidized at £2 for £1 until 1st April, 1938, but from that date it was increased to £3 for £1.
In special circumstances the Board may advance money, by way of loan, to local authorities to provide for the proportion of cost payable by a local authority in respect of the construction or reconstruction of a main highway. Such loans must be repaid by instalments extending over a period (not exceeding ten years) to be agreed upon between the Board and the local authority, and interest is payable at a rate approved by the Minister of Finance.
The Board is also empowered to sell roadmaking machinery, plant, and equipment to local authorities on such terms as it thinks fit, including terms for the payment of the purchase-money by instalments extending over not more than four years, with interest on the unpaid balance at such rate as is fixed by the Board. Since this scheme was introduced, plant, &c., has been purchased to the value of £473,035, of which sum £75,125 was outstanding at 31st March, 1948.
Main Highway Standards.—In order to qualify for financial assistance, local authorities are required to carry out works to a standard approved by the Main Highways Board. Subsidies are not payable unless the approved standard is observed, although work of a higher standard may be undertaken provided that the additional expenditure involved is found by the local authorities concerned. From time to time the Board's standards are revised to meet the latest developments in highway practice and engineering design and also to cater for the requirements of increasing traffic. Roadmaking materials used in highway works are subject to standard tests, and during recent years advances have been made in the direction of framing standard specifications which allow of a wider use of certain local materials which formerly were not accepted.
Activity During the Year Ending 31st March, 1948.—During the year ended 31st March, 1948, 182 miles of new sealing was completed, together with 04 miles of priming coat, a total of 246 miles of now work. As part of this was carried out on deviations and reconstructed sections of the older sealed highways, the net increase in dustless surfacing was 205 miles for the year, giving a New Zealand aggregate of 3,923 miles, or 31.5 per cent. of the total mileage of main highways. In addition, a length of 340 miles of existing sealed surfaces received a maintenance coat.
New bridging totalled 2,664 lineal feet, compared with 3,102 lineal feet in the previous year. Additional “Bailey” bridging-material which arrived during the year aided considerably in restoring communications that had been severed by storm damage or other causes.
Motor-ways.—Legislation by means of the Public Works Amendment Act, 1947, as amended by section 44 of the Public Works Amendment Act, 1948, makes provision for the declaration of limited-access highways or, more shortly, motor-ways. It is emphasized that motor-ways are not merely better all-purpose highways. Although work is continually in progress to improve the arterial roads of the country, such improvements will not create the characteristics or allow of the functions of a motor-way.
In addition to providing the most efficient and economic transport service, the main distinguishing features of a motor-way are the control of access and the total elimination of ribbon development, both of which will go far to improve road safety and prevent obsolescence.
The proportion of motor-vehicles to population in New Zealand is greater than in any other country of the world except the United States of America. With the continuing increase of motor-vehicles on the highways, particularly passenger-buses and heavy haulage trucks, it has become apparent that the capacities of the existing main routes adjacent to the chief cities are already being overtaxed. This increases the direct costs of transportation and, of greater importance, adds to the accident potential of these roads.
Hitherto when a route became overtaxed it was a common practice to construct an ordinary new highway to by-pass the town or other congested area. This new highway immediately attracted mushroom settlement, and tended to depreciate values of existing townships by movement of population to the new route, with the result that congestion and high accident rates again occurred. Avoidance of these mistakes will be achieved by means of the now legislation, for until its passing no legal authority was available to prevent ribbon development along new roads or to confer the right of building highways for the exclusive use of motor-vehicles.
By restricting access to specially designed junctions and by prohibiting any building development fronting and stretching out along the by-pass motor-ways, the present community balance will not be disturbed.
Motor-ways will be constructed generally as four-lane routes, with a central strip separating the two up lanes from the two clown lanes. Not only are there such obvious safety features as avoidance of head-on crashes and collisions caused by glare from headlights, &c., but congestion caused by a slow-moving vehicle holding up a column of traffic is also prevented.
All roads, ordinary highways, and railways will be separated from motor-ways by overbridges or subways, thus eliminating the prolific source of accidents resulting from intersection collisions. As the motor-ways will be restricted to usage by motor-vehicles, this will constitute an additional safety measure, since between 40 per cent. and 50 per cent of road accidents involve pedestrians or cyclists. At the same time, vehicular traffic will be removed from the residential areas and townships.
Considerable savings in transport costs will ensue from the provision of motor-ways, by virtue of economies in travelling-time and cost of travel.
There is no intention of building motor-way throughout New Zealand, for motorways are not considered justified until traffic intensities reach an average of three thousand vehicles per day. Only small proportions of the total routes extending over the length of either the North or the South Island carry a volume of traffic of this extent.
While works of oven higher priority such as housing and hydro-electric development absorb at present most of the available materials and man-power, the chief activity on motor-ways consists of the carrying-out of surveys, planning of routes, and acquiring the necessary laud.
REGISTRATION AND LICENSING OF MOTOR-VEHICLES.—Before the Main Highways Act was passed, the Government, by the provisions of the Customs Amendment Act, 1921, and the Finance Act, 1921–22, recognized and applied the principle that motor-vehicle owners should contribute toward the cost of the construction and upkeep of the road-surfaces which were required principally for them. By these Acts an import duty was levied on tires and tubes, the funds so obtained being used for highway construction and maintenance.
Amongst the funds specified by the Main Highways Act as being available for the Revenue Fund was a sum to be derived from the licensing of motor-vehicles. When the Main Highways Act was passed it was expected that a Motor-vehicles Act dealing with the registration and licensing of motor-vehicles would be simultaneously passed, but owing to the difficulty of co-ordinating all interests it was not until November, 1924, that the Motor-vehicles Act became law. This Act provided for the registration and annual licensing of all motor-vehicles.
Registration fees are 10s. for a motor-cycle and 20s. for any other motor-vehicle. Licence fees are as follows: Motor-cycle, 10s.; motor-car, £2; motor-omnibus, £3; trade motor (pneumatic tired), £2; trade motor (solid tired), £8.; traction-engine, £5; motor-vehicle not otherwise specified, £2; trailers (three or more wheels), £3; trailer (one and two wheels), £1. Other fees include drivers' licences, 5s.; Changes of ownership, 5s.; and manufacturers' and dealers' fees. All such fees, except that for a driver's licence, which is payable to the local authorities, were, in terms of the Motor-vehicles Act, credited to the Main Highways Account. With the abolition of this account as from 1st April, 1947, such fees are now credited to the Consolidated Fund. Heavy-traffic fees which are referred to under the next heading, are not levied under the Motor-vehicles Act, and receipts therefrom are distributed among local authorities.
The Motor-vehicles Registration Emergency Regulations 1947 restored as a temporary measure the system operating from 1942–46 whereby licence labels are issued on annual relicensing of motor-vehicles instead of the change of registration plates carried out prior to 1942 and again in 1946. The sum of 6d. was charged for licence stickers, and 2s. for issue or replacement of number-plates.
The Motor-vehicles Amendment Act, 1936, amended the pre-existing law in several important respects. A uniform speed limit of thirty miles per hour was fixed in boroughs and town districts, while authority was taken to extend the operation of this limit to other localities by notice published in the New Zealand Gazette. This speed limit may also be abrogated in specified localities by similar notification. Penalties were provided for careless and inconsiderate driving. The general penalty for offences was increased from £10 to £50; while the pre-existing authority for the issue of regulations was extended to provide for periodical examination of motor-vehicles (fee, 5s.), and for limiting the hours during which, or regulating conditions under which, a person may drive a trade motor-vehicle in use for commercial purposes. Power was taken also to issue regulations governing pedestrian and other traffic. With a view to minimizing wear-and-tear on motor-vehicle tires, regulations issued in July, 1942, imposed a maximum speed limit of 40 miles per hour with certain specified exceptions.
The Transport Law Amendment Act, 1948, amended the Motor-vehicles Act, 1924, principally those sections dealing with driving by unlicensed persons and the penalty for driving a motor-vehicle while disqualified, It also gave power to make regulations fixing temporary speed-limits, where there was a risk of injury or damage. Those duties imposed by the Motor-vehicles Amendment Act, 1936, on motor-drivers in cases of accidents were also revised, while provision was made for the licences of mentally defective persons to be revoked.
The following table shows the numbers of the various types of motor-vehicles licensed as at 31st March in each of the last five years.
| Type of Vehicle. | Licensed as at 31st March, | ||||
|---|---|---|---|---|---|
| 1944. | 1945. | 1916. | 1947. | 1948. | |
| Cars | 199,379 | 198,629 | 200,492 | 201,155 | 216,450 |
| Light trucks (i.e., 2 tons and under, laden) | 27,054 | 28,616 | 30,435 | 33,134 | 36,591 |
| Heavy trucks (i.e., over 2 tons laden) | 19,928 | 21,985 | 23,499 | 25,375 | 28,839 |
| Passenger trucks | 1,454 | 1,576 | 1,947 | 1,997 | 2,100 |
| Omnibuses | 862 | 932 | 1,025 | 1,133 | 1,267 |
| Taxis | 1,737 | 1,764 | 1,853 | 1,912 | 1,974 |
| Rental ears | 500 | 501 | 546 | 828 | 1,047 |
| Private-hire cars | 250 | 241 | 260 | 235 | 257 |
| Service-cars | 550 | 572 | 595 | 637 | 679 |
| Trailers | 15,059 | 17,064 | 20,031 | 22,788 | 25,254 |
| Dealers' cars | 721 | 789 | 933 | 1,282 | 1,421 |
| Local authority, &c., vehicles | 7,430 | 9,611 | 11,903 | 14,451 | 17,549 |
| Government vehicles | 4,687 | 5,207 | 5,814 | 8,296 | 8,455 |
| Motor-cycles | 12,479 | 13,624 | 16,110 | 17,634 | 18,995 |
| Dealers' motor-cycles | 47 | 43 | 57 | 65 | 71 |
| Totals | 292,137 | 301,154 | 315,500 | 330,922 | 360,949 |
As may be expected under war conditions, with a drastic reduction in motor-vehicle imports and the restrictions imposed on the use of motor-spirits and tires, there was a decrease in the number of motor-vehicles licensed in 1941, 1942, and 1943. The number of Government vehicles rose very substantially in 1942 and 1943, owing to the increased mechanization of the Armed Services, but the position in this respect became obscured owing to the operation of the Motor-vehicles Registration Order 1943, which released the Crown from the necessity of registering any motor-vehicle while it was being used exclusively for the purposes of any of His Majesty's naval, military, or air forces. With the release to the public of vehicles no longer required by the Armed Services, however, the 1943–44 figures for most types of vehicles showed increases over those of the previous year and, with the exception of cars, further increases were recorded in 1944–45. Totals for the last three years show the effect of the gradual lifting of restrictions and the further importations of motor vehicles. This is particularly reflected in the 1947–48 figure of cars licensed. The increase in the number of local authority and other vehicles exempted from the annual license fee should not necessarily be taken as an indication of the increase in the number of local authority vehicles, as this includes a miscellaneous collection of machines such as farmers' cars and trucks used solely on the farm, excavators, scoops, trench-diggers, logging machinery, cranes, &c.
The following diagram illustrates the movement that has taken place in the number of motor-vehicles licensed, and in the consumption of motor-spirits since 1930. The fall in consumption of motor-spirits during the depression period, the effects of rationing during the war years, and the post-war recoveries, are clearly demonstrated.
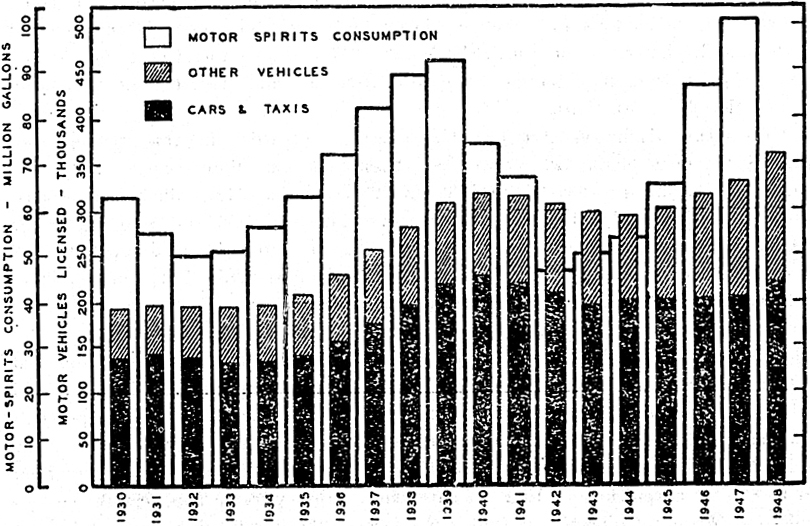
The following table gives particulars of the numbers of motor-vehicles registered during each of the last seven financial years. It must not be assumed, however, that the figures are a record of the number of new vehicles introduced into the country's traffic system each year, since they include an unknown number of vehicles which have been brought back into commission after having been removed from the register. In this connection it may be mentioned that dormant registrations—i.e., vehicles the registrations of which have not been cancelled, but which have not been re-licensed for the current year—are cancelled after two years. If, however, a vehicle is again brought into use after its registration has been cancelled, it is treated as a new registration.
| Year ended 31st March, | Cars, | Motor-cycles. | Other Motor-vehicles. | Total Registrations. |
|---|---|---|---|---|
| 1942 | 2,777 | 1,186 | 8,010 | 11,973 |
| 1943 | 1,432 | 3,888 | 9,880 | 15,200 |
| 1944 | 3,048 | 1,511 | 9,695 | 14,254 |
| 1945 | 3,723 | 2,543 | 12,024 | 18,290 |
| 1946 | 3,558 | 3,139 | 11,950 | 18,647 |
| 1947 | 9,494 | 3,698 | 16,840 | 30,032 |
| 1948 | 18,455 | 2,964 | 18,002 | 39,421 |
The most outstanding feature in the above table is the marked increased in the number of motor-car registrations in 1946–47 and 1947–48. This movement was, of course, to be expected in view of the gradual progression towards more normal conditions since 1946.
ROAD TRANSPORT.—The period following the war of 1914–18 ushered in a rapid development of an already considerable road motor transport which has necessitated extensive legislation, not alone for its control but also for the provision of adequate road-surfaces. Certain principal enactments are referred to briefly in chronological order.
The Customs Amendment Act, 1921, among numerous tariff changes, imposed a tire-tax on rubber tires and tubes, previously duty free. The proceeds were credited to the Main Highways Account until 31st March, 1947, and since then to the Consolidated Fund. For an account of the moneys derived from this and other highways taxation, vide Section 24B (Taxation).
The Main Highways Act of 1922, referred to earlier in this section, constituted the next landmark. Two years later came the Motor-vehicles Act, 1924 (amended in 1927, in 1934–35, in 1936, in 1939, and in 1948), which has received specific mention under the immediately preceding title. At the same time the Public Works Amendment Act, 1924, was passed (later included in the 1928 consolidation of that Act). Under it regulations could be made fixing, in respect of commercial vehicles of over 2 tons gross weight, heavy-traffic fees payable to local authorities for road-maintenance purposes, and also classifying roads and providing other measures. Regulations to this effect were made in 1925, and are now embodied in the Heavy Motor-vehicle Regulations 1940. In the financial year 1947–48 local authorities received £572,639 by way of heavy-traffic fees, the amount in the previous year being £485,619. Present annual licence fees under the Heavy Motor-vehicle Regulations range from £5 4s. to £63 16s. for a pneumatic-tired vehicle, and from £6 to £75 for a vehicle solid-tired on any wheel. Heavy-traffic fees, less the cost of collection, &c., are apportioned among the local authorities having control of roads within each heavy-traffic district, either as may be mutually agreed upon by such local authorities or, in default of such agreement, by the Minister of Transport.
With the object of controlling motor-omnibus competition with tramways, regulations under the Board of Trade Act were issued in 1926. In the same year they were superseded by the Motor-omnibus Traffic Act, itself later repealed by the comprehensive Transport Licensing Act, 1931 (amended in 1933, 1935, 1936, 1939, and 1948).
The Motor-spirits Taxation Act, 1927, imposed a duty of 4d. per gallon (raised in 1930 to 6d. per gallon; further subsequent increases are not connected with road taxation). As previously mentioned, from the net proceeds 92 per cent. is appropriated to main highways purposes, and the balance distributed on a population basis among cities or boroughs of a population of 6,000 upwards.
In 1927 the administration of the Motor-vehicles Act, 1924, was transferred to the Public Works Department, which subsequently issued in draft form regulations containing a uniform code of rules for motor-traffic in New Zealand. After full opportunity for criticism by interested parties the regulations were brought into force in 1928; they were later reissued through the Transport Department as the Traffic Regulations 1936.
The Public Works Act, 1928, contained extensive provisions relating to the construction, maintenance, and use of roads. Almost simultaneously came the Motor-vehicles Insurance (Third-party Risks) Act, 1928—vide Section 29B (Accident Insurance).
In 1929 the Transport Department Act constituted the portfolio of Minister of Transport, and also constituted the Transport Department under a Commissioner of Transport. The Act placed the administration of the following Acts under the Transport Department: Motor-vehicles Act, 1924; Motor-omnibus Traffic Act, 1926; Motor-spirits Taxation Act, 1927; Motor-vehicles Insurance (Third-party Risks) Act, 1928; and Public Works Act, 1928, in so far as it relates to heavy traffic or to motor-vehicles. The Transport Licensing Act, 1931, is also under the administration of the Department.
TRANSPORT LICENSING.—The Transport Licensing Act, passed on 11th November, 1931, is designed to regulate road motor transport with a view to securing co-ordination between it and other forms of transport, and to ensure its organization from the standpoint of maximum utility. The Act was substantially amended in 1933, 1935, 1936, and 1939, the principal amendment being the abolition from 1st April, 1936, of the Transport Co-ordination Board (set up under the amending Act of 1933), the powers previously exercised by the Board being vested in the Minister of Transport. By sections 82–86 of the Statutes Amendment Act, 1941, these powers, so far as they relate to appeals against Licensing Authority decisions, are vested in a Transport Appeal Authority.
The more important provisions of the law as amended were described on pages 344–346 of the 1940 issue of the Year-Book, but considerations of space have prevented their repetition in subsequent issues. There have been, however, two important amendments in connection with the licensing of goods services. Formerly, certain areas in some of the larger centres were exempt from the operation of the licensing system, but these exempted areas have since been abolished. All goods services conducted for hire or reward now require to be licensed except those carried on solely: (1) In connection with funerals; or (2) in connection with the repair or wreckage of vehicles which have met with mishap; or (3) in the carriage of newspapers; or (4) by farmers for the cartage of milk or whey to or from dairy factories for their neighbours; or (5) for relieving settlers affected by earthquake, fire, or flood; or (6) market-gardeners taking their produce to market.
The second amendment provides that goods-services operating on a route parallel to 30 miles or more of Government railway shall be licensed even if they are not conducted for hire or reward. Exceptions may be made in the case of certain services.
The Transport Licensing Act, 1931, was further amended by the Transport Law Amendment Act, 1948, the principal features of which are given below.
A Transport Co-ordination Council was established with functions of inquiry, report, and recommendation on matters referred to it by the Minister of Transport, or on any matter affecting public transport about which the Council may institute inquiries.
The Goods-services Charges Tribunal Emergency Regulations 1943 and amendments were revoked and a Transport Charges Committee established with functions of fixing, reviewing, or altering charges for the carriage of passengers or goods (including mails), or the letting of motor-vehicles on hire, by any transport service. Provision was made in cases where considered desirable for a maximum charge, together with a minimum charge, to be fixed instead of a fixed charge.
The Act also provides for the appointment of the Transport Charges Appeal Authority (a Judge of the Supreme Court or equivalent), to whose general jurisdiction the Transport Charges Committee is subject. The function of the Appeal Authority is to sit as a judicial authority for the determination of appeals from any decision of the Committee.
TRAFFIC ACCIDENTS ON ROADS.—Motor-vehicle accidents involving death or personal injury are required by law to be reported to the police, and since 15th March, 1937, very full particulars of all such accidents have been furnished to the Transport Departments For the year ended 31st December, 1947, 3,570 such accidents were reported, resulting in 206 fatalities, and in injuries to 4,762 other people. Comparative figures for the 1946 and 1945 years were (1945 figures are given in parentheses): Number of accidents, 3,163 (2,494); fatalities, 190 (129); persons injured, 4,144 (3,307). The increase in the traffic flow over the last few years, caused primarily by the progressive easing of the restrictions on the use of motor-spirits, is reflected in the corresponding increase in road accidents. New Zealand has the lowest traffic death rate (based on deaths per 10,000 licensed motor-vehicles) of any of the motorized countries, the New Zealand figure being 6.2. Details of the number and nature of road accidents for the five calendar years ended in 1947, which have been compiled by the Transport Department, are as follows:—
| Nature of Accident. | Number of Accidents. | ||||
|---|---|---|---|---|---|
| 1943. | 1944. | 1945. | 1946. | 1947. | |
| Collisions— | |||||
| Between two or more motor-vehicles | 589 | 559 | 753 | 973 | 1,177 |
| Between motor-vehicle and bicycle | 484 | 476 | 590 | 689 | 771 |
| Between motor-vehicle and pedestrian | 575 | 565 | 570 | 740 | 725 |
| Between motor-vehicle and fixed object | 83 | 78 | 107 | 134 | 145 |
| Between motor-vehicle and animal or horse-vehicle | 31 | 16 | 26 | 29 | 35 |
| Between motor-vehicle and railway-train | 27 | 24 | 28 | 32 | 40 |
| Between motor-vehicle and tram | 34 | 33 | 38 | 46 | 51 |
| Multiple and other collisions | 69 | 98 | 105 | 110 | 145 |
| 1,892 | 1,849 | 2,217 | 2,753 | 3,089 | |
| Non-collisions— | |||||
| Drove off road | 38 | 50 | 62 | 86 | 121 |
| Went over bank | 53 | 54 | 80 | 101 | 144 |
| Overturned on roadway | 74 | 56 | 63 | 100 | 113 |
| Person fell from vehicle | 51 | 75 | 56 | 86 | 78 |
| Other | 4 | 13 | 16 | 37 | 25 |
| 220 | 248 | 277 | 410 | 481 | |
| Total accidents | 2,112 | 2,097 | 2,494 | 3,163 | 3,570 |
Particulars of fatal motor-vehicle accidents included in the foregoing table are now given. It should be noted that the figures relate to the number of accidents and not to the number of deaths, which, as stated above, numbered 206 in 1947.
| Nature of Accident. | Number of Fatal Accidents. | ||||
|---|---|---|---|---|---|
| 1943. | 1944. | 1945. | 1946. | 1947. | |
| Collisions, motor-vehicle with— | |||||
| Pedestrian | 40 | 42 | 33 | 54 | 48 |
| Motor-vehicle | 26 | 15 | 20 | 23 | 41 |
| Train | 11 | 2 | 7 | 12 | 10 |
| Tram | 1 | 6 | 3 | 3 | 1 |
| Bicycle | 20 | 23 | 13 | 23 | 21 |
| Horse-vehicle or animal | 1 | 1 | |||
| Fixed object | 10 | 10 | 10 | 9 | 10 |
| Other | 6 | 9 | 6 | ||
| Went over bank or drove off roadway | 10 | 12 | 8 | 24 | 26 |
| Otherwise | 20 | 24 | 9 | 16 | 24 |
| Totals | 138 | 134 | 109 | 174 | 188 |
Statistics of deaths resulting from motor-vehicle accidents are available for many years from the vital statistics compiled by the Census and Statistics Department, and these figures are discussed briefly on pages 81–82.
The next table shows the distribution of motor accidents on the system of roads and streets during the calendar year 1947.
| Classification of Locality. | Fatal Accidents. | Non-fatal Accidents. | All Accidents. | |||
|---|---|---|---|---|---|---|
| Number. | Percentage of Total. | Number. | Percentage of Total. | Number. | Percentage of Total. | |
| Four main centres | 46 | 24.5 | 1,348 | 39.8 | 1,394 | 39.0 |
| Secondary cities (5) | 14 | 7.4 | 315 | 9.3 | 329 | 9.2 |
| Boroughs 6,000–20,000 population (19) | 11 | 5.9 | 387 | 11.5 | 398 | 11.2 |
| Small boroughs, town districts, and closely populated localities | 17 | 9.0 | 322 | 9.6 | 339 | 9.5 |
| Totals, built-up areas | 88 | 46.8 | 2,372 | 70.1 | 2,460 | 68.9 |
| State highways | 45 | 23.9 | 493 | 14.6 | 538 | 15.0 |
| Main highways | 24 | 12.8 | 271 | 8.0 | 295 | 8.3 |
| Other rural roads | 31 | 16.5 | 246 | 7.3 | 277 | 7.8 |
| Total of open-road accidents | 100 | 53.2 | 1,010 | 29.9 | 1,110 | 31.1 |
| Total accidents | 188 | 100.0 | 3,382 | 100.0 | 3,570 | 100.0 |
During 1947 the New Zealand Road Safety Council was reconstituted. This body was first set up in 1936 to advise the Government on matters of road safety. Subcommittees have now been set up dealing with the following: the motor-driver, motor-vehicle, roads, traffic laws, traffic law enforcement, road accident statistics, road safety publicity, and child education in traffic.
Publicity directed towards road safety is carried out per medium of the press, posters, screen slides, and radio, concentrating on simultaneous presentation, as far as possible, of specific aspects of the problem. Other means employed in furthering road safety consist of traffic instruction in schools, inspection of motor-vehicles, and enforcement of traffic laws.
ADMINISTRATION.—Civil aviation in New Zealand is administered by the Air Department in accordance with the Civil Aviation Act, 1948, which provides for the regulation of civil aviation and gives effect to the Convention on International Civil Aviation signed on behalf of the New Zealand Government at Chicago on 7th December, 1944. This Act replaces the previous authority, the Air Navigation Act, 1931. The Air Navigation Regulations 1933, issued under the authority of the Air Navigation Act, gave effect to the Convention Relating to Aerial Navigation signed at Paris on behalf of the New Zealand Government in 1919. Statutory provisions of local application are contained in the New Plymouth Airport Act, 1937, the Napier Airport Act, 1935, the Whangarei Airport Act, 1937, and the Waikato Airport Act, 1939, which make provision for the control of these airports. This control is exercised by Boards consisting of representatives of the aero clubs and local authorities concerned, together with members appointed by the Minister of Defence.
NATIONAL AIRWAYS CORPORATION.—Provision for complete control of air transport as a national service is contained in the New Zealand National Airways Act, 1945, and its Amendment of 1948. The Act provides for the establishment of the New Zealand National Airways Corporation with a capital of £1,000,000, to be paid by the Minister of Finance as and when required.
The general functions and duties of the Corporation are described in the Act as follows:—
For the purpose of this Act and subject to the provisions thereof, and with full regard to the safety, efficiency, and economy of operation, the Corporation may do all that is necessary or convenient to be done for, or as incidental to, in relation to, or in connection with, the establishment, maintenance, or operation by the Corporation of air services for the transport, for reward, of passengers and goods by air within New Zealand.
It shall be the duty of the Corporation to exercise the powers conferred by the last preceding subsection as fully and adequately as may be necessary to satisfy the need for air services within New Zealand and to carry out the purposes of the Act:
The Corporation may act as agent for any organization engaged in the provision of air-transport services.
The Corporation is also given power to exercise, in relation to air services between New Zealand and overseas countries, powers similar to those possessed in relation to air services in New Zealand. It is also empowered to acquire shares or other interests in any organization operating an air service between New Zealand and any overseas country. The Corporation was authorized to acquire by compulsion any aircraft or other property owned by any organization which on the passing of the Act was the holder of an aircraft-service licence.
One of the initial actions of the Board of Directors of the Corporation after appointment in August, 1946, was to acquire the interests of Union Airways of New Zealand, Ltd., the principal commercial airline operator within New Zealand. It was not considered desirable for the Corporation, as such, to operate services under the New Zealand National Airways Act until its regulations and by-laws were actually gazetted. These were gazetted in March, 1947, and the Corporation first commenced to operate under its own licences on 1st April, 1947. The remaining commercial operator, Air Travel, New Zealand, Ltd., was taken over during 1947.
At 31st March, 1948, the amount of capital advanced by the Government in terms of the New Zealand National Airways Act was £540,000, on which the Corporation pays interest at the rate of 4 per cent. per annum. Operating revenues during the year ended 31st March, 1948, amounted to £678,179, of which passenger fares accounted for £577,017; excess baggage, £4,370; freight, £20,606; mail-money, £39,257; charters, £33,063; and incidental revenue, £3,866. Operating expenses (including depreciation on flight equipment, ground equipment, and buildings) amounted to £664,918, leaving a surplus on operating accounts of £13,261. Non-operating revenue amounted to £4,496 and interest on capital advances £14,331, so that the net surplus for the year was £3,426.
CIVIL FLYING OPERATIONS: Internal Services.—Scheduled air transport operations over specific routes were commenced in December, 1934, on the route Inchbonnie –Hokitika – Franz Josef Glacier on the West Coast of the South Island. In April, 1935, services were commenced between Gisborne and Napier, while later in that year services across Cook Strait between Wellington–Blenheim and Nelson were being operated. Subsequent extensions of services up to the outbreak of war in September, 1939, had covered almost the whole of New Zealand.
On the outbreak of war a total of ten aircraft was taken over from the three operating companies—Union Airways of New Zealand, Ltd., Cook Strait Airways, Ltd., and Air Travel (N.Z.), Ltd. As a result, Cook Strait Airways, Ltd., ceased operations, but the other two companies maintained services on a reduced scale.
During 1946 and 1947 the New Zealand National Airways Corporation absorbed all existing scheduled commercial services, and by adding to the fleet of aircraft was able to commence new services.
At 31st March, 1948, services were being operated on the following routes—
Auckland–Dunedin (via Palmerston North, Wellington, and Christchurch).
Dunedin–Invercargill.
Nelson–Wellington–Blenheim.
Auckland–Wellington (via New Plymouth and Palmerston North).
Auckland–Gisborne (via Tauranga).
Auckland–Gisborne.
Gisborne–Wellington (via Napier and Palmerston North).
Auckland–Kaitaia (via Whangarei and Kaikohe).
Auckland–Christchurch (via Wellington).
Auckland–Christchurch.
Wellington–Hokitika (via Nelson and Westport).
Hokitika–Okuru (via Waiho and Haast).
Traffic statistics for these routes for the year ended 31st March, 1948, were—
| Route. | Hours Flown. | Miles Flown. | Passenger-miles Created. | Passenger-miles used. | Percentage of Seat Utilization. | Passenger Ton-miles. | Baggage Ton-miles. |
|---|---|---|---|---|---|---|---|
* Figures not available for period 1st April, 1947, to 30th September, 1947. | |||||||
| 1 | 6,791 | 1,065,555 | 15,995,715 | 13,972,310 | 87 | 973,346 | 156,425 |
| 2 | 1,021 | 110,362 | 1,038,040 | 669,531 | 64 | 48,259 | 6,393 |
| 3 | 5,882 | 538,908 | 3,238,909 | 2,738,091 | 85 | 196,518 | 29,671 |
| 4 | 1,702 | 209,118 | 2,095,159 | 1,803,392 | 89 | 134,709 | 21,576 |
| 5 | 1,118 | 132,710 | 1,327,100 | 1,128,196 | 83 | 71,620 | 11,763 |
| 6 | 1,029 | 134,805 | 1,354,320 | 1,228,502 | 91 | 82,805 | 14,227 |
| 7 | 1,355 | 155,546 | 1,566,085 | 1,376,417 | 88 | 94,991 | 15,486 |
| 8 | 986 | 102,292 | 1,018,120 | 843,574 | 83 | 53,492 | 8,152 |
| 9 | 2,628 | 353,147 | 8,037,012 | 6,061,834 | 75 | 465,665 | 61,092 |
| 10 | 2,157 | 300,934 | 6,607,355 | 5,192,839 | 79 | 400,205 | 55,768 |
| 11 | 1,353 | 149,818 | 742,454* | 597,951 | 37,004 | 5,908 | |
| 12 | 713 | 67,797 | 117,360* | 82,648 | 3,154 | 479 | |
| Totals | 26,735 | 3,320,992 | 43,137,629 | 35,695,285 | 2,561,768 | 386,940 | |
| Route. | Excess Baggage Ton-miles. | Freight Ton-miles. | Mail Ton-miles. | Total Ton-miles Created. | Total Ton-miles Used. | Percentage of Aircraft utilization. |
|---|---|---|---|---|---|---|
* Figures not available for period 1st April, 1947, to 30th September, 1947 | ||||||
| 1 | 13,554 | 40,563 | 60,010 | 1,673,183 | 1,243,898 | 74 |
| 2 | 347 | 807 | 1,246 | 88,437 | 57,052 | 65 |
| 3 | 2,187 | 12,368 | 1,925 | 351,546 | 242,627 | 69 |
| 4 | 1,590 | 3,015 | 4,151 | 236,007 | 165,041 | 70 |
| 5 | 1,060 | 1,317 | 960 | 129,840 | 86,720 | 67 |
| 6 | 1,359 | 5,154 | 332 | 136,068 | 103,877 | 76 |
| 7 | 1,608 | 2,380 | 3,031 | 170,813 | 117,495 | 69 |
| 8 | 578 | 497 | 852 | 101,161 | 63,571 | 63 |
| 9 | 5,604 | 11,018 | 9,986 | 891,881 | 553,364 | 62 |
| 10 | 5,941 | 9,848 | 10,785 | 636,878 | 482,547 | 76 |
| 11 | 513 | 2,304 | 1,782 | 79,563* | 46,406 | |
| 12 | 100 | 2,298 | 2,250 | 9,713* | 5,995 | |
| Totals | 34,441 | 91,569 | 97,310 | 4,505,090 | 3,168,593 | |
During the year ended 31st March, 1948, 154,329 passengers, 1,211,345 lb. of freight, and 597,231 lb. of mail were carried on these services.
Aircraft used in the operation of services on these routes were—
| Lockheed Lodestar | 7 |
|---|---|
| Lockheed Electra | 5 |
| Douglas D.C.3 | 7 |
| Douglas C.47C (freighter) | 5 |
| D.H.89B Dominie | 6 |
| D.H.89A Rapide | 1 |
| D.H.83 Fox Moth | 2 |
| Total | 33 |
The following table gives the summarized results of the operations of scheduled commercial air services during the last eleven years.
| Year Ended 31st March. | Hours Flown. | Miles Flown. | Passengers. | Freight. | Mail. | Passenger-miles. | Freight Ton-miles.‡ | Mail Ton-miles. |
|---|---|---|---|---|---|---|---|---|
* Does not include freight or mail carried by R.N.Z.A.F. Air Transport. † Includes freight ton-miles and mail ton-miles by R.N.Z.A.F. ‡ Includes excess baggage ton-miles. | ||||||||
| lb. | lb. | |||||||
| 1938 | 11,327 | 1,331,100 | 43,782 | 81,853 | 216,238 | 5,518,363 | 4,301 | 18,205 |
| 1939 | 12,821 | 1,574,395 | 53,039 | 166,278 | 316,380 | 6,787,026 | 9,054 | 29,248 |
| 1940 | 10,541 | 1,326,234 | 51,802 | 223,018 | 234,989 | 6,478,540 | 12,247 | 21,729 |
| 1941 | 5,036 | 645,702 | 37,023 | 206,936 | 130,806 | 4,373,822 | 9,585 | 12,555 |
| 1942 | 5,206 | 688,723 | 38,058 | 194,858 | 165,670 | 5,062,938 | 9,434 | 17,616 |
| 1943 | 5,576 | 685,953 | 30,634 | 174,757 | 220,527 | 4,655,774 | 9,423 | 23,887 |
| 1944 | 6,421 | 832,966 | 37,435 | 191,113 | 244,614 | 6,371,007 | 11,426 | 29,677 |
| 1945 | 7,129 | 965,787 | 51,754 | 272,251 | 313,013 | 9,299,979 | 18,824 | 44,040 |
| 1946 | 8,541 | 1,108,134 | 60,193 | 338,950 | 428,709 | 10,158,221 | 22,587 | 52,935 |
| 1947 | 14,615 | 1,502,494 | 110,767 | 634,495* | 605,086* | 21,870,438 | 90,471† | 85,387† |
| 1948 | 26,735 | 3,320,992 | 154,329 | 1,211,345 | 597,231 | 35,695,285 | 126,010 | 97,310 |
As already indicated, the traffic figures quoted to this stage refer to scheduled services only. The following is a traffic summary of non-scheduled services for the year ended 31st March, 1948.
| Trips | 3,174 |
|---|---|
| Hours flown | 2,034 |
| Miles flown | 234,653 |
| Passengers | 3,199 |
| Freight (lb.) | 13,254,190 |
| Freight ton-miles | 448,891 |
The summary includes the inter-Island (Paraparaumu–Woodbourne) air freight service operated by the New Zealand National Airways Corporation on behalf of the Railways Department, the amount of freight involved being 13,081,232 lb.
It will be seen that the great bulk of air freight traffic was carried by non-scheduled services, 13,254,190 lb., as compared with 1,211,345 lb. by scheduled services.
Overseas Services.—Tasman Empire Airways: An air service from Australia to New Zealand across the Tasman Sea is the last stage of an air route from the United Kingdom to New Zealand. The first survey of this route was undertaken by Imperial Airways, Ltd., of London, in 1937. Subsequently, a company, known as Tasman Empire Airways, Ltd., was formed to operate a proposed trans-Tasman air service. The initial share capital of the company was subscribed by the three Governments in the following proportions: United Kingdom, 38 per cent.; Australia, 23 per cent.; New Zealand, 39 per cent. Operations were commenced on 30th April, 1940.
Details of the company's operations as at 31st March, 1948, are as follows:—
Route and frequency: Auckland–Sydney. Eight trips weekly in each direction.
Number of aircraft: 4.
Description of aircraft: Short 825 flying-boats.
Total seating capacity (per aircraft): 36.
Traffic statistics for the year ended 31st March, 1948, were—
| Hours flown | 6,128 |
|---|---|
| Miles flown | 991,916 |
| Passengers | 18,792 |
| Freight (lb.) | 223,229 |
| Mail (lb.) | 331,926 |
| Passenger-miles created | 26,504,948 |
| Passenger-miles used | 25,194,933 |
| Percentage of seat utilization | 95 |
| Passenger ton-miles | 2,364,653 |
| Excess baggage ton-miles | 22,349 |
| Freight ton-miles | 100,157 |
| Mail ton-miles | 198,556 |
| Total ton-miles created | 3,045,634 |
| Total ton-miles used (including non-revenue ton-miles, 18,636) | 2,704,351 |
| Percentage of aircraft utilization | 89 |
The foregoing figures are inclusive of flights which were carried out by other companies under charter to Tasman Empire Airways, Ltd., during the period 23rd February to 31st March, 1948.
The following is a summary of traffic statistics for Tasman Empire Airways, Ltd., for the years 1941–48:—
| Year Ended 31st March, | Hours Flown. | Miles Flown. | Passengers. | Freight. | Mail. | Passenger-miles. | Freight Ton-miles.* | Mail Ton-miles. |
|---|---|---|---|---|---|---|---|---|
* Includes excess baggage ton-miles. | ||||||||
| lb. | lb. | |||||||
| 1941 | 1,181 | 174,200 | 1,507 | 18,800 | 78,179 | 2,019,380 | 11,246 | 46,768 |
| 1942 | 1,382 | 211,920 | 1,959 | 32,230 | 167,275 | 2,625,060 | 19,280 | 100,066 |
| 1943 | 1,265 | 192,960 | 2,256 | 35,195 | 101,741 | 3,023,040 | 21,054 | 60,863 |
| 1944 | 1,502 | 229,140 | 2,924 | 40,024 | 94,106 | 3,918,160 | 23,943 | 56,296 |
| 1945 | 2,798 | 427,460 | 5,803 | 84,189 | 142,812 | 7,796,020 | 50,363 | 85,432 |
| 1946 | 3,270 | 493,764 | 6,100 | 99,584 | 214,792 | 8,174,000 | 60,019 | 128,492 |
| 1947 | 4,863 | 778,704 | 11,648 | 176,687 | 278,789 | 15,608,320 | 105,697 | 106,776 |
| 1948 | 6,128 | 991,916 | 18,792 | 223,229 | 331,926 | 25,194,933 | 122,506 | 198,656 |
New Zealand National Airways Corporation: The Corporation commenced operating services in the South-west Pacific on 1st November, 1947, over the following routes:—
| Route No. | Route. | Route Miles. | Frequency. |
|---|---|---|---|
| 1 | Auckland–Lambasa (via Suva) | 1,458 | Once weekly in each direction. |
| 2 | Auckland–Norfolk Island | 661 | Once weekly in each direction. |
| 3 | Auckland-Rarotonga (via Norfolk Island, Nandi, Nausori, Tonga, Apia and Aitutaki) | 3,820 | Once fortnightly in each direction. |
| Total route-miles | 5,939 |
The Auckland – Norfolk Island service was suspended on 15th December, 1947, duo to the poliomyelitis epidemic in New Zealand, and recommenced 1st August, 1948, and the Auckland–Lambasa service was suspended from 16th February until the 11th April, 1948, duo to unserviceable aircraft.
Traffic statistics for these routes for the period 1st November, 1947, to 31st March, 1948, were—
| Service. | Auckland–Lambasa. | Auckland–Norfolk Island. | Auckland–Rarotonga. | Total. |
|---|---|---|---|---|
| Hours flown | 306 | 61 | 515 | 882 |
| Miles flown | 46,096 | 9,254 | 77,696 | 133,046 |
| Passengers | 1,104 | 142 | 1,227 | 2,473 |
| Freight (lb.) | 4,439 | 236 | 25,472 | 30,147 |
| Mail (lb.) | 6,559 | 201 | 10,097 | 16,857 |
| Passenger-miles created | 1,198,496 | 175,826 | 1,476,224 | 2,850,546 |
| Passenger-miles used | 864,894 | 93,862 | 540,753 | 1,499,509 |
| Percentage of seat utilization | 72 | 53 | 36 | 53 |
| Passenger ton-miles | 75,146 | 8,692 | 44,277 | 128,115 |
| Excess baggage ton-miles | 1,298 | 211 | 381 | 1,890 |
| Freight ton-miles | 2,191 | 70 | 4,847 | 7,108 |
| Mail ton-miles | 3,582 | 59 | 2,224 | 5,865 |
| Total ton-miles created | 121,611 | 12,533 | 82,259 | 216,403 |
| Total ton-miles used | 82,217 | 9,032 | 51,729 | 142,978 |
| Percentage of aircraft utilization | 67 | 72 | 63 | 66 |
Aircraft employed on these services were three Douglas (D.C.3) aircraft and one Short Sunderland flying-boat.
Pan American Airways Inc.: The service between San Francisco and Auckland via Honolulu, Kingman Reef, and Pago Pago commenced by Pan American Airways after a survey flight from Honolulu to Auckland in December, 1937, was discontinued after an accident to a Clipper aircraft on 11th January, 1938. The service was resumed in 1940 on a reduced schedule, the first flight terminating at Auckland on the 18th July, 1940. Operations ceased in December, 1941, after the outbreak of hostilities with Japan.
This organization recommenced services in the Pacific on 6th June, 1946. The present frequency is one return trip per week over the route Auckland – San Francisco (via Fiji, Canton Island, and Honolulu). Aircraft employed are D.C.4 (Skymaster).
Traffic to and from New Zealand for the year ended 31st March, 1948, was—
| Hours flown | 4,290 |
|---|---|
| Miles flown | 859,044 |
| Traffic entering New Zealand— | |
| Passengers | 1,565 |
| Freight (lb.) | 44,720 |
| Mail (lb.) | 14,842 |
| Traffic leaving New Zealand— | |
| Passengers | 758 |
| Freight (lb.) | 21,851 |
| Mail (lb.) | 4,013 |
British Commonwealth Pacific Airlines Ltd.: The decision to establish British Commonwealth Pacific Airlines was made at a conference held in Wellington during February and March, 1946, the company to operate an air service between Australia and North America, and New Zealand and North America. The organization was set up on a tripartite basis comprised of the United Kingdom, Australia, and New Zealand. In order to commence operations at an early date Australian National Airways were chartered and the first flight from New Zealand left on 25th April, 1947, travelling over the following route: Auckland, Fiji, Canton Island, Honolulu, San Francisco, and Vancouver.
British Commonwealth Pacific Airlines commenced operating on its own account in April, 1948, using Skymaster aircraft and operating one return trip per fortnight.
A formal agreement between the Governments of the United Kingdom, Australia, and New Zealand for the formation of British Commonwealth Pacific Airlines, Ltd., was signed at Canberra on 4th August, 1947. The initial capital was subscribed by the three Governments in the following proportion: Australia, 50 per cent.; New Zealand, 30 per cent.; United Kingdom, 20 per cent.
Traffic to and from New Zealand for the year ended 31st March, 1948, was—
| Hours flown | 1,917 |
|---|---|
| Miles flown | 378,609 |
| Traffic entering New Zealand— | |
| Passengers | 742 |
| Freight (lb.) | 47,317 |
| Mail (lb.) | 3,030 |
| Traffic leaving New Zealand— | |
| Passengers | 232 |
| Freight (lb.) | 16,982 |
| Mail (lb.) | 8,192 |
SUMMARY.—A summary of civil aviation activities for each of the last five financial years is contained in the following table. It should be noted that where the information is available non-scheduled services have been included, and in this respect the figures differ from those quoted previously. The operations of Aero Clubs are not included.
| — | 1943–44 | 1944–45 | 1945–46 | 1946–47 | 1947–48 |
|---|---|---|---|---|---|
| Internal services— | |||||
| Hours flown | 6,643 | 7,391 | 8,776 | 15,525 | 28,769 |
| Miles flown | 855,110 | 993,707 | 1,132,684 | 1,894,811 | 3,555,645 |
| Passengers carried | 38,145 | 52,424 | 60,968 | 110,767 | 157,528 |
| Mail (lb.) | 244,614 | 313,013 | 428,709 | 607,125 | 597,231 |
| Freight (lb.) | 191,114 | 272,251 | 353,514 | 2,769,380 | 14,465,535 |
| Passenger-miles | 6,371,009 | 9,299,979 | 10,158,226 | 21,870,438 | 35,695,285 |
| Mail ton-miles | 29,678 | 44,040 | 52,935 | 74,486 | 97,311 |
| Freight ton-miles | 11,426 | 18,824 | 22,587 | 128,704 | 574,902 |
| Overseas— | |||||
| Hours flown | 1,502 | 2,798 | 3,270 | 7,649 | 13,291 |
| Miles flown | 229,140 | 427,460 | 493,764 | 1,322,006 | 2,384,279 |
| Passengers carried | 2,924 | 5,803 | 6,100 | 13,448 | 23,552 |
| Mail (lb.) | 94,106 | 142,812 | 214,792 | 307,403 | 368,593 |
| Freight (lb.) | 40,024 | 84,189 | 99,584 | 232,809 | 374,432 |
AERO CLUBS.—Practical interest in aviation was greatly stimulated by the first trans-Tasman flight of Kingsford Smith and Ulm in 1928, and to this flight the aero-club movement largely owes its inception. The steady progress made by the movement has been in a great measure due to the scheme initiated by the Government of subsidizing a limited number of light aeroplane clubs. This subsidy (abolished from the 31st March, 1937) took the form of the loan of light aircraft and payments to clubs on account of pupils qualifying for their “A” Hying licences, and for male pilots renewing their licences. The payment of subsidy was discontinued on the institution of the Civil Reserve scheme, by which the Government entered into an agreement with approved clubs for the training of civil reservists and Air Force candidates. On the outbreak of war in September, 1939, the Government took over all aircraft suitable for training purposes, so that training operations of the clubs had, in most cases, to be suspended. However, with the few remaining types of aircraft still available, the following five organizations continued to cater for civil pilots:—
Rotorua and Bay of Plenty Aero Club.
Airworks (N.Z.), Ltd. (Wellington).
New Plymouth Aero Club.
Associated Air Pilots, Ltd. (Palmerston North).
Te Kuiti Aero Club.
Only the first two organizations provided ab initio facilities. On 31st March, 1941, the three clubs and two companies mentioned operated nine aircraft, the majority light American types, and had a total membership of 393 (238 associate and 155 flying). These clubs continued operations until December, 1941, when, after the Japanese entry into the war, all civil flying with the exception of commercial scheduled services, was prohibited under Proclamation issued by the Governor-General. This prohibition was lifted on 24th December, 1945. An immediate resumption of club activities was not possible, chiefly duo to the lack of airworthy aircraft, non-availability of accommodation at aerodromes, and the shortage of qualified instructors. However, by 31st March, 1946, there were four clubs again in operation.
The aircraft which had been purchased from the aero clubs by the Government at the outbreak of war were resold to the clubs to facilitate an early resumption of their activities. Assistance was also given to the clubs through the Air Training Corps flying training plan. This plan, which was inaugurated in 1947, provides for training by the clubs of selected Air Training Corps cadets, and Government subsidies are paid in connection therewith.
In addition to the revenue received by the clubs in respect of the A.T.C. training plan the clubs were assisted during the year 1947–48 by a grant of 20 per cent. of their instructors' salaries.
During the year ended 31st March, 1947, eight clubs which had been operating prior to the war resumed flying, and six new clubs were formed and commenced activities, bringing the total number of operating clubs to eighteen. During the year ended 31st March, 1948, four additional clubs came into operation, making a total of twenty-two active aero clubs.
The following table shows in summarized form, the commercial activities of the aero clubs:—
| Period. | Aircraft in Use. | Trips. | Passengers. | Hours Flown. | Miles Flown. |
|---|---|---|---|---|---|
| 1928 to 31st March, 1933 | 17 | 8,090 | 10,127 | 2,246 | 164,458 |
| Year ended— | |||||
| 31st March, 1934 | 19 | 3,539 | 6,146 | 1,542 | 122,313 |
| 31st March, 1935 | 39 | 4,432 | 7,742 | 1,814 | 149,395 |
| 31st March, 1936 | 34 | 4,487 | 7,225 | 1,542 | 129,308 |
| 31st March, 1937 | 32 | 5,449 | 9,073 | 1,523 | 130,102 |
| 31st March, 1938 | 48 | 4,312 | 8,303 | 1,569 | 148,953 |
| 31st March, 1939 | 62 | 3,962 | 7,263 | 1,152 | 110,917 |
| 31st March, 1940 | 66 | 1,590 | 2,441 | 486 | 47,817 |
| 31st March, 1941 | 9 | 4 | 4 | 1 | 80 |
| April, 1941, to December, 1945 | |||||
| Year ended— | |||||
| 31st March, 1946 | 13 | 127 | 127 | 29 | 2,360 |
| 31st March, 1947 | 73 | 3,172 | 5,512 | 1,514 | 151,636 |
| 31st March, 1948 | 101 | 6,721 | 11,819 | 3,459 | 348,711 |
| Totals | 45,885 | 75,782 | 16,877 | 1,506,050 |
The next table gives a summary of the training activities of aero clubs:—
| Period. | Clubs Operating. | Membership. | Aircraft in Use. | Under Instruction. | Hours Flown. | Licences Current. | ||||
|---|---|---|---|---|---|---|---|---|---|---|
| Associate. | Flying. | Dual. | Solo. | Dual. | Solo. | Private. | Commercial. | |||
* Not available. | ||||||||||
| 1928 to 31st March, 1933 | 10 | * | * | 32 | * | * | 6,051 | 16,185 | 275 | 18 |
| Year ended— | ||||||||||
| 31st March, 1934 | 10 | * | * | 35 | * | * | 2,298 | 6,745 | 315 | 21 |
| 31st March, 1935 | 11 | 1,869 | 483 | 39 | 123 | 43 | 2,660 | 7,823 | 315 | 22 |
| 31st March, 1936 | 11 | 2,562 | 613 | 43 | 171 | 58 | 3,206 | 8,842 | 389 | 19 |
| 31st March, 1937 | 11 | 2,457 | 840 | 39 | 251 | 76 | 3,952 | 9,330 | 483 | 30 |
| 31st March, 1938 | 12 | 2,675 | 915 | 58 | 243 | 118 | 5,748 | 11,978 | 532 | 22 |
| 31st March, 1939 | 13 | 2,742 | 948 | 65 | 275 | 89 | 6,213 | 13,443 | 535 | 19 |
| 31st March, 1940 | 15 | 2,791 | 670 | 66 | 166 | 103 | 4,102 | 7,638 | 401 | 3 |
| 31st March, 1941 | 5 | 238 | 155 | 9 | 31 | 29 | 510 | 1,909 | 115 | 24 |
| Up to December, 1941 | 5 | 255 | 134 | 11 | 37 | 31 | 318 | 1,307 | 66 | |
| January, 1942, to December, 1945 | ||||||||||
| Year ended— | ||||||||||
| 31st March, 1946 | 4 | 562 | 1,138 | 13 | 55 | 25 | 229 | 418 | 79 | 27 |
| 31st March, 1947 | 18 | 2,185 | 2,401 | 73 | 332 | 172 | 3,295 | 10,818 | 736 | 92 |
| 31st March, 1948 | 22 | 2,868 | 2,728 | 101 | 396 | 251 | 7,322 | 19,270 | 972 | 141 |
LICENCES.—The licences and certificates current at the 31st March, 1948, were as follows:—
| Pilot's “A” Licence | 875 |
| Pilot's “B” Licence | 264 |
| Aircraft Engineer's Licence | 171 |
| Navigator's Licence— | |
| First Class | 22 |
| Second Class | 29 |
| Radio Telegraph Licence— | |
| First Class | 20 |
| Second Class | 2 |
| Third Class | 78 |
| Temporary | 14 |
| Radio Telephone Licence | 7 |
| Flying Instructor's Authority | 68 |
| Certificate of Registration | 228 |
| Certificate of Airworthiness | 150 |
| Public Aerodrome Licence | 8 |
METEOROLOGICAL SERVICE.—Meteorological services in New Zealand have been developed to meet the special needs of commercial and military aviation activities. All commercial aircraft, whether operating on internal air lines or on trans-ocean routes, receive for each flight an individual weather forecast from the appropriate meteorological office.
AIR MAILS.—Inland.—From 1920 onwards various attempts were made to operate air-mail services, but it was not until the inauguration of a service between Hokitika and South Westland in January, 1934, that a service of any permanency was established. The district served in this instance is one which possesses very poor transport facilities; and, though the population is sparse and the area small, the carriage of mails by air has great advantages over a land service. It is for this reason that no surcharge is made on the mail-matter carried by this service.
On the 16th March, 1936, the first regular air-mail services linking up the larger centres of population were established between Palmerston North and Dunedin, and between Nelson, Blenheim, and Wellington. As air services increased in frequency and extent the air-mail facilities were correspondingly expanded. The outbreak of war in September, 1939, resulted in the curtailment of air-passenger services, and of necessity the air-mail services were also reduced. This resulted in a decrease of 25 per cent. in the number of letters and of 58 per cent. in the number of parcels carried in 1940–41 as compared with 1938–39, but each year since 1940–41 has recorded a substantial increase, particularly in 1944–45 and during the last two years. Letters carried in 1947–48 were 63 per cent. greater than the number in 1945–46, while the number of parcels showed an increase of 102 per cent.
The rate of postage for inland air-mail correspondence was originally 2d. per ounce, but since October, 1939, has been 3d. per half-ounce. For parcels, up to 28 lb., the rates range from 2s. 2d. to 11s.
The numbers of letters and parcels carried by air in New Zealand during the years 1937–38 to 1947–48 are shown hereunder.
| Year ended 31st March,— | ||
|---|---|---|
| Letters. | Parcels. | |
| 1938 | 1,688,641 | 8,340 |
| 1939 | 2,382,427 | 13,606 |
| 1940 | 1,884,191 | 11,662 |
| 1941 | 1,785,800 | 5,688 |
| 1942 | 2,214,060 | 7,356 |
| 1943 | 3,705,000 | 13,825 |
| 1944 | 4,436,920 | 18,760 |
| 1945 | 7,055,900 | 25,690 |
| 1946 | 7,968,920 | 32,204 |
| 1947 | 11,368,000 | 48,298 |
| 1948 | 13,008,080 | 65,205 |
Overseas.—Although mails had been carried by air across the Tasman on the occasions of special flights in 1934, and one mail was despatched by air across the Pacific, via Pago Pago and Honolulu, to the United States of America in January, 1938, permanent facilities for the despatch of mails by air from New Zealand were not established until April, 1940.
The first flight of the trans-Tasman service took place on the 30th April, 1940, connection being made at Sydney with the Empire service to London. The Empire service had been extended to Sydney in December, 1934, but until the establishment of the direct air link across the Tasman in April, 1940, it was necessary for air mails to be forwarded by sea from New Zealand to Sydney. The postage-rate was 1s. 6d. each half-ounce, and this rate remained in force until July, 1938, when the “all-up” rate of 1 ½d. a half-ounce was introduced. The “all-up” rate continued until September, 1939, when on the outbreak of war there was a reversion to the former surcharge of 1s. 6d. a half-ounce. On the 4th October, 1948, the rate was reduced to 1s. 3d. a half-ounce. In June, 1940, the through service from New Zealand to London was interrupted with the entry of Italy into the war, and it was necessary for air correspondence from New Zealand for the United Kingdom to be forwarded by air via Egypt to South Africa and thence by sea to destination. Following the entry of Japan into the war, the service beyond Australia was totally interrupted in March, 1942; and it was not until the 30th June, 1944, that the through service from Australia to the United Kingdom was restored. Initially, this service was restricted to the conveyance of light-weight air letter-cards addressed to members of the Empire and Allied Forces in the' Middle East, Africa, and Europe, the postage-rate fixed being 6d. a card. The transit time New Zealand – United Kingdom averaged thirteen days. On the 24th August, 1944, the service was extended to provide for the exchange of light-weight cards addressed to civilians in the Middle East, Africa, and Europe, the postage-rate being 8d. a card. It was not until June, 1945, that correspondence prepaid at 1s. 6d. a half-ounce was guaranteed air transit throughout the whole journey, although from the 15th July, 1944, letters prepaid at 1s. 6d. were accepted on the understanding that, if necessary, they would be despatched by sea between Australia and Ceylon.
In June, 1945, Lancastrian aircraft were first used for the carriage of mails between Sydney and London, and as a result the service was greatly improved, all classes of correspondence being carried and the transit time Auckland to London being reduced by five to six days. The service is now (1948) being operated thrice weekly by Constellation and Lancastrian aircraft.
The trans-Pacific service operating on a regular fortnightly schedule commenced on the 20th July, 1940, the route followed being via Noumea, Suva, Canton Island, and Honolulu. This service, which was operated by Pan-American Airways, ceased on the entry of Japan into the war in December, 1941, and it was not until the 20th September, 1945, that arrangements of a temporary nature were made for the resumption of the conveyance of civilian air-mail correspondence for North America by the Royal Air Force Transport Command service, the route followed being via Suva, Canton Island, and Honolulu. The Royal Air Force Transport Command service ceased on the 18th December, 1945. The Pan-American air service was recommenced on the 6th June, 1946, and is now on a regular weekly schedule, the route being via Suva, Canton Island, and Honolulu to San Francisco. On the 25th April, 1947, British Commonwealth Pacific Airways commenced a direct service from Auckland to Vancouver, via Suva, Canton Island, Honolulu, and San Francisco, the service being a fortnightly one. Mails by the British Commonwealth Pacific Airways planes are also forwarded via Sydney and via Fiji to connect with services operating between Sydney and Vancouver.
Services to Norfolk Island, Fiji, Tonga, Samoa, and the Cook Islands operated by the R.N.Z.A.F. in the immediate post-war period were placed under the control of the National Airways Corporation on the 1st November, 1947.
POSTAL BUSINESS.—At the 31st March, 1948, there were 1,533 post-offices in New Zealand.
The following table shows the numbers of articles posted during the calendar years 19–10, 1941, and 1945, and also for the years ended 31st March, 1947 and 1948. Similar information for the intervening period is not available.
| year. | Letters, Letter-cards, and Post-cards. | Registered Articles. | Accounts, Circulars, Newspapers, Packets, &c. | Parcels. |
|---|---|---|---|---|
* Year ending 31st March following. | ||||
| 1940 | 144,747,000 | 2,704,000 | 108,535,000 | 4,784,000 |
| 1941 | 142,996,000 | 3,236,000 | 113,090,000 | 5,784,000 |
| 1945 | 140,355,000 | 2,988,000 | 89,852,000 | 6,637,000 |
| 1946* | 160,680,000 | 3,137,000 | 126,044,000 | 7,602,000 |
| 1947* | 159,778,000 | 3,194,000 | 133,555,000 | 7,734,000 |
The number of letters, letter-cards, and post-cards posted in 1946 showed an increase of 20,325,000 (14.5 per cent.) as compared with 1945, but the number in 1947 was slightly below the 1946 figure Registered articles have recorded a slight increase in each of the last two years. Accounts, circulars, &c., posted in 1946 showed the outstanding increase of 36,192,000 (40.3 per cent.) over the previous year, and a reasonable increase in 1947. The number of parcels posted in 1946 was 965,000 (14.5 per cent.) more than in 1945, and a further rise of 132,000 was recorded in 1947. The despatch of food parcels to the United Kingdom would be a contributing factor, but reference to the figures under the heading of “Overseas Parcel-post” on the next page shows that this was not the solo reason for the increase.
The average numbers of letters, &c., posted in New Zealand per head of population during the, year ended 31st March, 1948, were: Letters, letter-cards, and post-cards, 87.1; registered articles, 1.7; accounts, circulars, newspapers, packets, &c., 72.8; parcels, 4.2.
RURAL MAIL DELIVERY.—The rural-mail-delivery system was instituted in New Zealand about 1900, but owing to the high comparative cost little progress was made with it until 1922. As from the 1st January of that year a scheme was introduced whereby a nominal fee was charged for this service; the rates are 10s. per annum for, a delivery thrice weekly or less frequently, or £1 for a delivery having a greater frequency. These charges do not bear heavily on the farmer, and they enable the Post Office to extend rural-mail-delivery benefits to districts which were previously without such amenities. Every comparatively well-settled district now has its network of deliveries. The rural-mail carrier delivers and collects correspondence and parcels at or near the gates of farmers, sells postage-stamps, and obtains, as required, money-orders and postal notes.
At the end of December, 1947, there were throughout New Zealand 43,572 rural boxholders, an increase of 2,982 on the figures for the previous year. The number in 1920 was 8,700.
AIR-MAIL SERVICE.—Details of the Now Zealand air-mail service are given at the of the preceding section.
OVERSEAS PARCEL-POST.—The facilities afforded for the transmission of parcels through the Post Office to places within and beyond New Zealand have proved of much convenience to the public. The regulations admit of parcels up to 22 lb. in weight being sent to Great Britain and Northern Ireland and many other countries, but to Australia, South Africa, Canada, and a few other countries the weight limit is 11 lb. Inland parcels may weigh up to 28 lb. Particulars of overseas parcels received and despatched in each of the years 1942–45 and 1947 are contained in the following table. Similar information for 1946 is not available.
| Year. | Overseas Parcels received. | Overseas Parcels despatched. | ||||
|---|---|---|---|---|---|---|
| Number. | Weight. | Declared Value. | Customs Duty. | Number. | Weight. | |
| lb. | £ | £ | lb. | |||
| 1942 | 142,829 | 712,924 | 605,430 | 60,113 | 969,187 | 4,794,909 |
| 1943 | 187,544 | 809,385 | 667,182 | 75,623 | 1,556,760 | 7,652,800 |
| 1944 | 279,499 | 1,337,209 | 855,784 | 130,353 | 1,517,869 | 7,607,315 |
| 1945 | 277,300 | 1,325,494 | 800,810 | 107,304 | 971,000 | 4,864,710 |
| 1947 | 265,554 | 2,154,503 | 2,489,309 | 370,883 | 1,365,000 | 12,062,384 |
NEWSPAPERS.—In October, 1948, there were 203 publications on the Post Office Register of Newspapers. Of these, 45 are published daily, 12 being morning papers and 33 evening papers. Eleven appear three times per week, 19 twice per week, 58 weekly, 12 fortnightly, 116 monthly, and 2 at irregular intervals.
Between 1946 and 1948 there has been an increase of 32 in the number of publications on the register, daily papers having increased by 2, twice-weekly papers by 2, weekly papers by 7, fortnightly papers by 2, and monthly publications by 20. Thrice-weekly papers have decreased by 1.
MONEY-ORDERS.—A money-order issued for payment in New Zealand is limited to a maximum of £100, the commission payable being 7d. for the first £10 and 3d. for each additional £5. A money-order transmitted by telegraph also bears a telegraph fee of 1s. 2d. A maximum of £40 is imposed on a money-order issued for payment overseas (some countries £10), the commission varying according to the country in which the order is payable. An exception is made in the case of Fiji, the maximum for a money-order issued for payment in that country being £100.
Of the total money-orders issued in New Zealand during 1947, 39,297 representing an aggregate value of £112,009, were for payment overseas. Of that amount, £39,707 was payable in the United Kingdom, £65,563 in other British Commonwealth countries, and £6,739 in foreign countries. Money-orders issued overseas for payment in New Zealand in 1947 numbered 39,248, the total value represented being £161,696. Of this amount £84,043 was issued in the United Kingdom, £63,132 in other British Commonwealth countries, and £14,521 in foreign countries.
The following table gives particulars of all money-orders issued and paid during each of the last five years.
| Calendar Year. | Number of Offices at End of Year. | Money-orders issued. | Money-orders paid. | |||
|---|---|---|---|---|---|---|
| Number. | Value. | Commission. | Number. | Value. | ||
| £ | £ | £ | ||||
| 1943 | 931 | 786,511 | 5,500,687 | 35,684 | 776,855 | 5,520,090 |
| 1944 | 925 | 762,179 | 5,989,369 | 35,656 | 755,224 | 6,027,118 |
| 1945 | 925 | 769,857 | 7,202,200 | 37,580 | 763,634 | 7,223,053 |
| 1946 | 923 | 903,369 | 10,624,440 | 41,724 | 898,038 | 10,692,472 |
| 1947 | 933 | 917,290 | 10,804,314 | 43,877 | 913,468 | 10,869,381 |
POSTAL NOTES.—Postal-notes in 39 denominations ranging from 1s. to 20s. are issued in New Zealand, the poundage payable being as follows; 1s. to 2s. 6d., 2d.; 3s. to 7s. 6d., 3d.; 8s. to 15s., 4d.; and 15s. 6d. to 20s., 5d. Postal notes are negotiable and sometimes enjoy a certain length of life as currency.
Information regarding the issue and payment of postal notes is given below. It will be seen that the steady rise in the number of money-orders issued is also reflected in the issues of postal notes, although the increase in the latter is less marked.
| Year ended 31st March, | Number of Offices at End of Year. | Postal Notes issued. | Postal Notes paid. | |||
|---|---|---|---|---|---|---|
| Number. | Value. | Commission. | Number. | Value. | ||
| £ | £ | £ | ||||
| 1944 | 1,131 | 2,215,572 | 945,293 | 31,208 | 2,200,233 | 908,452 |
| 1945 | 1,130 | 2,223,041 | 951,989 | 31,343 | 2,215,653 | 919,139 |
| 1946 | 1,103 | 2,266,285 | 982,597 | 32,106 | 2,227,817 | 935,446 |
| 1947 | 1,105 | 2,354,477 | 1,028,111 | 33,394 | 2,329,605 | 985,968 |
| 1948 | 1,106 | 2,464,783 | 1,071,613 | 34,828 | 2,417,149 | 1,035,315 |
British postal orders issued in New Zealand during the year ended 31st March, 1948 numbered 32,810, for a total value of £11,593. Those paid numbered 38,557 and represented £29,757 in value.
TELEGRAPH AND TELEPHONE SERVICES.—Up to the 31st March, 1948, a total sum of £14,897,789 had been expended on telegraph construction, including the construction of telephone exchanges. The amount expended during the financial year 1947–48 was £1,005,840.
During the year ended 31st March, 1948, the revenue from telegrams and toll communications was £2,470,768, of which £569,641 represented ordinary telegrams, £96,002 press telegrams, and £1,805,125 toll communications. To these figures should be added £2,210,087 revenue of telephone exchanges and £200,663 miscellaneous receipts, making a total telegraph and telephone revenue of £4,881,518.
| Year Ended 31st March. | Number of Paid Telegrams and Toll Messages Forwarded During the Year. | Revenue (Including Miscellaneous Receipts). | Total Value of Business. | |
|---|---|---|---|---|
| Telegraph and Toll. | Telephone Exchange. | |||
| £ | £ | £ | ||
| 1944 | 25,455,486 | 1,966,649 | 1,820,289 | 3,786,938 |
| 1945 | 26,934,472 | 2,215,639 | 1,860,196 | 4,075,835 |
| 1946 | 29,122,344 | 2,366,187 | 2,062,355 | 4,428,542 |
| 1947 | 30,604,745 | 2,612,564 | 2,050,313 | 4,662,877 |
| 1948 | 31,482,089 | 2,671,431 | 2,210,087 | 4,881,518 |
The number of paid telegrams forwarded in 1947–48 was 7,609,416, a decrease of 298,855 (3.8 per cent.) as compared with 1946–47, while the number of toll communications (23,872,673) showed an increase of 1,176,199 (5.2 per cent.).
As from 1st October, 1939, the charge for ordinary telegrams on week-days has been 8d. for six words or less, and 1d. for each additional word. The charge for letter-telegrams, which are delivered by post on the morning following the day of lodgment, is a flat rate of 1s. 2d. for twenty-four words, and 1d. for each additional two words. On Sundays and departmental holidays the rate for ordinary telegrams is 1s. for six words or less, and 1 ½d. for each additional word, the total charge being taken to the next penny where necessary. An additional charge of 8d. is made for an urgent telegram, irrespective of the number of words contained in the message.
TELEPHONE-EXCHANGE SERVICE.—Telephone facilities are extensively used in New Zealand. According to the latest data available (1947) compiled by the Chief Statistician of the American Telephone and Telegraph Co., New Zealand ranks fourth equal in the number of telephones per 100 of population, the leading countries being the United States of America (22.4), Sweden (18.6), Canada (16.3), New Zealand (16.6), and Switzerland (15.6). During the war period inability to secure the necessary equipment greatly retarded expansion, and it is anticipated that the figure of 15.6 per 100 of population will be considerably increased when adequate supplies of equipment become available.
At the 31st March, 1948, there were 350 telephone exchanges in New Zealand. Of this number, 327 were of the magneto type, 2 common battery, and 21 automatic. The automatic exchanges are: Whangarei, Auckland, Hamilton, Gisborne, Napier, Hastings, Dannevirke, Stratford, Hawera, Wanganui, Marton, Palmerston North, Masterton, Porirua, Lower Hutt, Wellington, Blenheim, Ngatimoti, Christchurch, Oamaru, and Dunedin.
The following statement shows the automatic-exchange equipment installed and in use in New Zealand on the 31st March, 1948.
| Capacity of Equipment installed. | Equipment in use. | |
|---|---|---|
| No. | No. | |
| Individual lines | 93,290 | 88,457 |
| Party-lines— | ||
| Two-party | 6,730 | 6,276 |
| Four-party | 2,950 | 2,555 |
| Multi-party | 874 | 647 |
| Individual-line stations | 90,677 | |
| Party-line stations | 28,256 | |
| Total of main stations | 118,933 | |
| Extension stations | 56,626 | |
| Total number of automatic-telephone stations connected | 175,559 |
The following table indicates the growth of the New Zealand telephone-exchange service (the figures are as at 31st March of each year shown).
| — | 1940. | 1941. | 1942. | 1943. | 1944. | 1945. | 1946. | 1947. | 1948. |
|---|---|---|---|---|---|---|---|---|---|
* Represents separate instruments (excluding private stations) connected to main telephone system. | |||||||||
| Exchanges | 347 | 348 | 346 | 349 | 347 | 347 | 347 | 348 | 350 |
| Subscribers, main stations | 162,508 | 169,224 | 173,302 | 174,088 | 178,707 | 188,175 | 194,508 | 206,337 | 219,185 |
| Toll and service stations | 4,647 | 4,736 | 4,858 | 4,934 | 4,992 | 4,925 | 4,859 | 4,997 | 5,155 |
| Public call offices | 1,231 | 1,240 | 1,293 | 1,368 | 1,420 | 1,406 | 1,413 | 1,456 | 1,550 |
| Extension stations | 45,883 | 49,446 | 52,187 | 54,151 | 55,634 | 58,120 | 60,783 | 65,251 | 70,662 |
| Telephone-station totals* | 214,269 | 224,646 | 231,640 | 234,541 | 240,753 | 252,626 | 261,563 | 278,041 | 296,552 |
The total number of telephone-stations shows an increase of 82,283, or 38 per cent., during the period covered by the table, the net gain for each of the last live years being 6,212, 11,873, 8,937, 16,478, and 18,511 respectively. The increase in subscribers' main stations during the same period amounted to 56,677 or approximately 35 per cent., while extension stations show an increase of 24,779, or a little over 54 per cent.
In addition to the above, there are 4,000 stations connected by private telephone-lines with departmental toll-stations, making a grand total of 300,552 telephone-stations in New Zealand on the 31st March, 1948. The “party” line system of telephone service is extensively used, particularly by those whose premises are situated at a distance from an exchange. In March, 1948, the number of “party” lines was 25,050 serving a total of 94,189 stations.
The first public call offices (coin-in-the-slot telephones) erected in New Zealand were installed at Wellington in August, 1910. Of the total of 1,514 such instruments in use at the 31st March, 1948, the charge in 1,438 cases was 1d.; in 8, 2d.; and in 68, 3d. The revenue of these slot telephones during the year ended 31st March, 1948, was £107,895. In addition, there are 36 multi-coin slot telephones in use, the first of which was installed at Christchurch in October, 1938. These instruments take penny, sixpenny, and shilling coins and are used for effecting toll calls.
The capital expenditure on the equipment, &c., of the telephone exchanges up to the 31st March, 1947 was £11,569,088.
OCEAN CABLES.—Telegraphic communication between New Zealand and Australia was first established by means of the Eastern Extension Telegraph Company'S cable from Wakapuaka in 1876, this cable being duplicated in 1890. Subsequent developments were the opening of the Pacific cable to Vancouver in December, 1902, with a connection to Australia; the operation of a further cable to Australia in 1912; and the duplication of the Pacific cable in 1926. In 1929 a merger of British cable and wireless companies resulted in the overseas cable services being brought under the control of one authority, and as a consequence one cable to Australia was lifted and the route of another was altered. All overseas cables now terminate at the one centre.
RADIO COMMUNICATION: Government Stations.—The first wireless-telegraph station in New Zealand for communicating with ships at sea was opened at Wellington on the 26th July, 1911.
The principal stations under the control of the New Zealand Government are Awarua, Wellington, and Auckland on the New Zealand mainland, at Apia in Western Samoa, at Rarotonga in the Cook Islands, and at the Chatham Islands. Smaller stations on the mainland or on adjacent islands are those at The Brothers, Centre Island, Cuvier Island, Dog Island, Great Mercury Island, Jackson'S Bay, Raoul Island, Milford Sound, Stephen'S Island, Puysegur Point, and Portland Island. There are also radio-beacon stations at the lighthouses at Cape Reinga, Cuvier Island, Puysegur Point, Portland Island, Stephen'S Island, Baring Head, and Cape Campbell.
Communication is effected with outer islands in the Cook Group by Rarotonga-Radio through small feeder-stations at Aitutaki, Atiu, Mangaia, Manihiki, Mauke, Palmerston, Penrhyn, and Pukapuka. Small stations at Aleipata, Atafu, Fagamalo, Sataua, Palauli, Fakaofo, Nukunono, Salailua, and Tuasivi communicate with Apia-Radio. Nine communicates with both Apia-Radio and Wellington-Radio.
By means of the radio-stations at Wellington, Apia, Rarotonga, and Niue, communication is maintained between New Zealand and the Pacific islands, the last three stations mentioned having direct communication with New Zealand. Wellington - Radio has also direct communication with Papeete - Radio (Tahiti), Nukualofa (Tonga), Noumea (New Caledonia), and San Francisco (U.S.A.).
The radio business transacted by the New Zealand coast stations during the last five years was as follows:—
| Year Ended 31st March, | Forwarded. | Received. | ||||
|---|---|---|---|---|---|---|
| Messages. | Words. | Post Office Revenue. | Message, | Words. | Post Office Revenue. | |
* Includes traffic due to presence of United States Forces in New Zealand. | ||||||
| £ | £ | |||||
| 1944* | 166,555 | 1,304,690 | 15,401 | 48,304 | 859,722 | 13,960 |
| 1945* | 40,749 | 564,997 | 8,470 | 27,662 | 800,753 | 14,592 |
| 1946 | 25,585 | 538,907 | 11,904 | 46,931 | 1,316,292 | 22,470 |
| 1947 | 27,712 | 630,674 | 10,742 | 60,860 | 1,474,149 | 28,050 |
| 1948 | 26,717 | 636,374 | 10,020 | 65,797 | 1,306,963 | 19,164 |
The foregoing table does not include free (service) messages. Facilities exist for the despatch of radio-telegrams to vessels at sea, and special rates operate for vessels registered in New Zealand.
Private Stations.—Private radio-stations are governed by the Radio Regulations, which were gazetted on the 21st July, 1932.
The licences for radio receiving-stations (i.e., ordinary radio licences) are designed to provide for experimental reception as well as for reception from broadcasting stations, and may be obtained at any postal money-order office on payment of the prescribed fee. Further reference to these licences will be found in Section 10, dealing with radio broadcasting.
The licences for private experimental (amateur) stations are intended to provide facilities for experimental transmission to those interested in radio science, and are issued subject to the qualifications of the applicants being satisfactory.
RECEIPTS AND PAYMENTS.—The receipts and payments of the Post and Telegraph Department for the last three financial years are now shown.
| Receipts | 1945–46. | 1946–47. | 1947–48. |
|---|---|---|---|
| £ | £ | £ | |
| Postages | 1,780,052 | 3,062,538 | 3,059,371 |
| Money-order and postal-note commission | 54,620 | 76,365 | 77,962 |
| Private-box and bag rents and rural delivery fees | 70,390 | 75,930 | 80,252 |
| Miscellaneous receipts | 1,038,518 | 1,149,823 | 1,250,468 |
| Telegrams | 637,442 | 669,511 | 665,642 |
| Tolls | 1,425,020 | 1,588,160 | 1,722,584 |
| Telephone-exchange rentals | 2,062,355 | 2,050,313 | 2,118,169 |
| Totals | £7,068,397 | £8,672,640 | £8,974,448 |
| Payments | £ | £ | £ |
|---|---|---|---|
| Salaries | 2,623,184 | 3,445,745 | 3,616,262 |
| Conveyance of mails by sea and air | 168,704 | 294,862 | 424,374 |
| Conveyance of mails by road | 191,182 | 198,965 | 211,423 |
| Conveyance of mails by railway | 134,157 | 132,131 | 212,674 |
| Maintenance and renewal of telecommunication system | 564,031 | 605,110 | 900,070 |
| Motor services and workshops | 216,828 | 342,906 | 359,612 |
| Miscellaneous | 1,749,386 | 1,504,387 | 1,926,132 |
| Interest on capital liability | 712,973 | 738,996 | 746,316 |
| Sick-benefit Fund | 8,574 | 11,169 | 11,730 |
| Post Office buildings | 109,937 | 100,290 | 547,723 |
| Totals | £6,478,956 | £7,374,561 | £8,956,316 |
Receipts and payments for the last eleven years are shown by the following figures.
| Year ended 31st March, | Receipts. | Payments. |
|---|---|---|
| £ | £ | |
| 1938 | 4,302,244 | 4,045,762 |
| 1939 | 4,687,564 | 4,529,358 |
| 1940 | 4,793,691 | 4,445,906 |
| 1941 | 5,106,194 | 4,338,903 |
| 1942 | 5,388,013 | 4,574,136 |
| 1943 | 5,863,621 | 5,089,889 |
| 1944 | 6,251,242 | 5,105,982 |
| 1945 | 6,694,901 | 5,970,244 |
| 1946 | 7,068,397 | 6,478,956 |
| 1947 | 8,672,640 | 7,374,561 |
| 1948 | 8,974,448 | 8,956,316 |
VOLUME OF BUSINESS.—An indication of the volume of business handled during recent years may be obtained from a comparison of the value of transactions, as follows:—
| £ | |
|---|---|
| 1937–38 | 295,000,000 |
| 1938–39 | 286,000,000 |
| 1939–40 | 285,000,000 |
| 1940–41 | 362,000,000 |
| 1941–42 | 392,000,000 |
| 1942–43 | 470,000,000 |
| 1943–44 | 568,000,000 |
| 1944–45 | 583,000,000 |
| 1945–46 | 655,000,000 |
| 1946–47 | 661,000,000 |
| 1947–48 | 665,000,000 |
WORK PERFORMED FOR OTHER DEPARTMENTS.—In addition to its natural functions, the Post and Telegraph Department performs an immense amount of work for other Government Departments, its widespread organization being of inestimable value in this respect. Among the principal activities in this connection are the receipt and payment of moneys on behalf of the various Departments, the more important of which are enumerated below. During 1947–48 the sum handled by the Post Office on behalf of other Departments was £200,000,000.
Receipts.—Land and Income Tax Department (land-tax, income-tax, and social security charge), National Provident Fund, State Advances Corporation, Department of Agriculture (inspection fees, orchard-tax, &c.), Education Department, Marino Department (inspection of machinery fees), Public Trust Office, National Broadcasting Service (radio-licence fees, subscriptions to New Zealand Listener).
Payments.—Treasury Department, National Provident Fund, Social Security Department (social security benefits and war, &c., pensions), Health Department (refunds of medical expenses), Government Superannuation Board, Public Trust Office, Reserve Bank (dividend warrants and interest coupons).
Other services performed by the Post and Telegraph Department are the control of licensing of, and issue of licences in respect of, motor-vehicles and radio apparatus, provision of advice and service on radio matters to the Marine Department and the Civil Aviation Branch of the Air Department, and provision of a fleet of motor-vehicles in the larger centres for hire by other Departments. In the smaller centres Postmasters act as Registrars of Births, Deaths, and Marriages, Registrars of Electors, and agents for the Government Life Insurance Department, State Fire and Accident Insurance Office, and Customs Department.
Other activities, not strictly departmental, include the receipt of premiums under the Motor-vehicles Insurance (Third-party Risks) Act, 1928, and the issue of fishing and game licences on behalf of acclimatization societies.
STAFF.—The large volume and varied nature of the business of the Post and Telegraph Department entail the employment of a large staff. The Department is administered by the Postmaster-General and Minister of Telegraphs, with the Director-General as executive head. The staff at 31st March, 1948, was as follows: Permanent, 10,942; temporary, 4,803; total, 15,745. These figures include 93 employees serving with the armed forces. In addition there were 1,420 country postmasters and telephonists who acted as such in conjunction with other pursuits and did not rank as officers of the Department. There were also 75 officers of the Railways Department who acted as postmasters.
DETAILS of the history and development of the radio broadcasting service in New Zealand are given in the 1942 and earlier issues of the Year-Book.
NEW ZEALAND BROADCASTING SERVICE.—The Broadcasting Act of 1936 established the National Broadcasting Service as from the 1st July, 1930, and vested its control in a Minister of the Grown. All property, rights, liabilities, and engagements of the pre-existing controlling authority (the Broadcasting Board) were transferred to the Crown.
The administration of the Service was placed in the hands of a Director of Broadcasting, appointed by the Governor-General in Council to hold office for a period not exceeding three years. Permanent officers in the employ of the pre-existing Board became officers of the Public Service as from the 1st July', 1936, and the Act contains other provisions relating to the appointment to the Public Service of any other persons who are possessed of technical or other expert knowledge in relation to broadcasting.
Section 9 of the Act allows for the appointment of an advisory body, called the Broadcasting Advisory Council, to consist of not more than five members to be appointed from time to time by the Governor-General on the recommendation of the Minister. Appointment to the Council is for a period of three years, except that members may be reappointed or removed from office by the Governor-General.
The Broadcasting Act, 1936, also authorized the Minister of Broadcasting to establish and operate commercial broadcasting-stations from which advertising matter might be broadcast. For every locality that is served by a commercial station the Minister is required to provide an alternative service from at least one non-commercial station. Advertising over the air is forbidden except from commercial stations authorized under the Act. The Broadcasting Amendment Act, 1937, made legislative provision for the establishment of a National Commercial Broadcasting Service. This provision was repealed by section 4 of the Statutes Amendment Act, 1943, and from the 26th August, 1943, the National Commercial Broadcasting Service became a division of the National Broadcasting Service. In 1946 the designation was changed to the New Zealand Broadcasting Service, which comprises two divisions, the National and the Commercial.
Stations and Programmes.—There were at 1st September, 1948, twenty-three broadcasting-stations, of which two are privately owned (2XM and 4XD) and five are national advertising-stations—marked “(a)”—as follows:—
| Station. | Aerial Energy. | Frequency. | Normal Hours of Transmission per Week. |
|---|---|---|---|
| Kilowatts. | Kilocycles. | Hr. Min. | |
| 1YA, Auckland | 10.00 | 750 | 121 20 |
| 1ZB, Auckland (a) | 1.00 | 1,070 | 126 0 |
| 1YD, Auckland | 0.75 | 1,250 | 46 0 |
| 1YC, Auckland | 0.15 | 880 | 31 0 |
| 2XG, Gisborne | 0.25 | 1,010 | 16 0 |
| 2XM, Gisborne | 0.09 | 1,180 | 16 30 |
| 2YZ, Napier | 5.00 | 860 | 103 30 |
| 2XP, New Plymouth | 0.10 | 1,370 | 21 0 |
| 2ZA, Palmerston North (a) | 0.25 | 940 | 65 42 |
| 2YA, Wellington | 60.00 | 570 | 121 20 |
| 2YC, Wellington | 5.00 | 650 | 37 0 |
| 2ZB, Wellington (a) | 1.00 | 980 | 126 0 |
| 2YD, Wellington | 0.50 | 1,130 | 21 0 |
| 2XN, Nelson | 0.03 | 1,340 | 21 0 |
| 3YZ, Greymouth | 0.10 | 920 | 103 30 |
| 3YA, Christchurch | 10.00 | 690 | 121 20 |
| 3ZB, Christchurch (a) | 1.00 | 1,100 | 126 0 |
| 3YC, Christchurch | 0.30 | 960 | 37 0 |
| 4YA, Dunedin | 10.00 | 780 | 121 20 |
| 4ZB, Dunedin (a) | 1.00 | 1,040 | 126 0 |
| 4YC, Dunedin | 0.15 | 900 | 37 0 |
| 4XD, Dunedin | 0.06 | 1,430 | 13 0 |
| 4YZ, Invercargill | 5.00 | 720 | 103 30 |
A further five stations are expected to commence operating in 1949. These will be situated at Whangarei, Hamilton, Rotorua, Wanganui, and Timaru.
The aggregate transmission time of all stations, both National and Commercial, amounted during the year ended 31st March, 1948, to 72,438 hours. Of the scheduled time, 20 hours were lost owing to technical defects in equipment, and 28 hours on account of failures of the main power-supply, making a total of 48 hours.
At the request of the authorities responsible for the conservation of electric power, broadcasting in recent years has been curtailed at peak hours, more particularly in the winter.
All programmes to be transmitted from the private broadcasting-stations are supervised, and the Minister has authority to prohibit the broadcasting of any programme or part of a programme which in his opinion is unsuitable for broadcasting.
The programmes of the various stations are published in the New Zealand Listener, a weekly paper which was first issued on 30th June, 1939.
Development Plans.—Up to the present broadcasting in New Zealand has been considered from the national aspect—that is, providing the best programmes available without much regard to the locality of artists or stations. The time is now considered opportune for the adoption of a supplementary policy—that of using radio as a local institution to serve as an instrument for developing the cultural life, artistic endeavour, and civic consciousness of towns and districts. The development plans therefore include provision for the establishment of a chain of low-powered local stations throughout New Zealand outside the chief centres, which will to a considerable degree depend for their appeal upon local interest in the artists and their work, or the local significance of talks or relayed ceremonies.
The proposed network of the New Zealand Broadcasting Service when fully developed will be as follows:—
International short-wave stations at Titahi Bay. These commenced regular transmission on 27th September, 1948.
National station—at present represented by 2YA—to provide a means of broadcasting Parliament, events of national importance, and outstanding artists.
District stations—at present represented by 1YA, 2YC, 3YA, 4YA, 2YZ, 3YZ, and 4YZ—will be regarded as serving interests of the larger districts of New Zealand—supplying their best artists to the National station and broadcasting the best of the “local” artists, sometimes rebroadcasting the National station, and sometimes being rebroadcast by the National station.
Alternative stations in main centres—at present represented by 1YC, 3YC, and 4YC—which will present alternative programmes to those of the “district” stations.
“Local” stations—small coverage stations located in smaller towns and populated areas—to serve the immediate locality, to search out and encourage talent, and to act as a feeder of suitable talent to the “district” stations. The extent to which these stations will broadcast commercial programmes, if at all, will depend on local conditions.
Commercial stations, which will present light programmes and provide an additional alternative programme to that available from the “district” stations in the main centres.
Districts not within convenient distance of broadcasting studios will be visited by mobile recording units, which will record the work of artists, musical and dramatic organizations, as well as talks and local activities for broadcasting from appropriate stations.
At least one local programme of first-class reception and an alternative national programme will be available to listeners, while those who are situated in or near one of the four main centres will, in addition, receive an alternative “district” programme and a commercial programme.
The development proposals include plans for orchestral, dramatic, and art development. The extended use of “local” stations and mobile recording units working with educational authorities will encourage children'S efforts by granting broadcasting facilities for important school functions and outstanding work. Local stations will provide a unifying instrument for the entire community, stimulating civic consciousness and cultural endeavour, and embracing the interests of remote country districts.
During the year ended 31st March, 1947, a contract for the replacement of the present equipment of stations 1YA, 2YA, 3YA, 4YA, 1ZB, 2ZB, 3ZB, 4ZB, 2ZA, 2XN, and 3YZ was let. The contract also included a new “district” station for the Bay of Plenty and “local” stations for Whangarei, Hamilton, Wanganui, and Timaru.
The coverage of the National network will be improved as the Bay of Plenty and West Coast (South Island) stations will be of 10 kW. The new equipment of the main stations of the Commercial network will also be of 10 kW. The local stations at Whangarei, Hamilton, Palmerston North, Wanganui, Nelson, and Timaru will all be of 2 kW.
The transmitters of the present YA stations, when replaced, will take over the programmes of auxiliary stations. Listeners will then be able to tune in to either the district station or the auxiliary station, and both will operate at the same output of 10 kW., except 2YC, which will be of 60 kW.
NATIONAL DIVISION.—An analysis of the combined programmes of the National stations for a sample week in February, 1948, showed that, of the total transmitting time, 20.21 per cent. was devoted to serious music; 44.50 per cent. to light music; 8.95 per cent. to modern dance music; 6.29 per cent. to plays, sketches, and dramatic serials; 1.78 per cent. to sporting commentaries; 7.08 per cent. to talks, general and educative; 7.64 per cent. to news and commentaries; 2.09 per cent. to church and devotional services; and 1.46 per cent. to children'S sessions.
The practice is followed of giving broadcasting engagements to the best musical and other talent available in New Zealand. During the year ended 31st March, 1948, there were 2,291 broadcasts by local artists, and 901 by local musical societies, bands, and other musical combinations.
The writing and production of dramatic and other special features in which local actors and actresses are employed are carried out by the Productions Branch of the New Zealand Broadcasting Service, and encouragement is being given to New Zealand writers, 42 scripts by such writers having been purchased during the year.
The recording facilities are a valuable adjunct and the studies are engaged daily in recording plays and programmes written by overseas and New Zealand authors; talks and news bulletins broadcast overseas which are rebroadcast in New Zealand at more convenient times; and historical talks, events, and other features.
The proceedings of the House of Representatives are broadcast from Station 2YA in order to acquaint the public with the provisions of the various Bills and the views of their representatives.
Regular broadcasting programmes for schools are undertaken, the full cost being borne by the New Zealand Broadcasting Service. The weekly schedule consists of two and three-quarter hours, and the following subjects are dealt with: music appreciation, singing, rhythm for juniors, literature, history through literature, nature-study, book reviews, talks on news, social studies and science, and French lessons for post-primary pupils. The Education Department'S Correspondence School also broadcasts two half-hour programmes per week.
Time signals from the Dominion Observatory are broadcast through station 2YA four times each day. The signals take the form of a series of six “dots” at intervals of one second, the last “dot” being the exact minute. These series are broadcast at 28, 29, and 30 minutes of the hour.
The time signals are broadcast daily at—
10.28, 10.29, and 10.30 a.m.
3.28, 3.29, and 3.30 p.m.
7.28, 7.29, and 7.30 p.m.
10.28, 10.29, and 10.30 p.m.
In the event of the failure of any of the above time signals, the signals are broadcast half an hour later.
In addition to the above signals, a series of six “dots” is transmitted from Station 2YA on each hour from 7 a.m. to 7 p.m. inclusive.
Fuller details of this time service may be obtained from the article on time service arrangements published in the Miscellaneous section of this Year-Book (post).
The broadcasting of weather reports and forecasts, which had been discontinued for security reasons since 23rd December, 1940, was resumed on 2nd July, 1945.
Financial Statistics.—The following table shows the expenditure of the national stations for the last five financial years.
| 1943–44. | 1944–45. | 1945–46. | 1946–47. | 1947–48. | |
|---|---|---|---|---|---|
| £ | £ | £ | £ | £ | |
| Programmes | 101,846 | 142,814 | 109,754 | 139,689 | 160,684 |
| Maintenance of plant | 69,880 | 80,780 | 15,664 | 20,070 | 19,139 |
| General administrative and running expenses | 44,864 | 51,454 | 122,468 | 150,488 | 169,723 |
| Subsidies to private “B” stations | 210 | 225 | 225 | 225 | 225 |
| Depreciation of assets | 29,082 | 18,024 | 19,465 | 18,416 | 26,747 |
| Other expenses | 39,281 | 41,818 | 7,423 | 5,840 | 3,899 |
| Total expenditure | £285,163 | £335,115 | £274,999 | £334,728 | £380,417 |
The reduced amounts shown under the heading “Maintenance of Plant” for the years 1945–46, 1946–47, and 1947–48 and the increases in “General administrative and running expenses” are accounted for by the fact that up to 1944–45, the salaries of the technical staff engaged on maintenance were included under the former heading, but during the last three years have been included under the latter. The decrease during the last three years in the amounts shown as “Other expenses” is mainly accounted for by the fact that up to 1944–45 the total expenditure of the New Zealand Listener was included under that heading, but in subsequent years only the net result of this activity has been shown in the accounts.
Income for the year ended 31st March, 1948, amounted to £507,320, including radio-licence fees, £478,274; and net profit on publication of the New Zealand Listener, £3,938. The total income for each of the preceding four years was: 1943–44, £512,474; 1944–45, £540,038; 1945–46, £480,193, and 1946–47, £490,635. The decrease shown in 1945–46 is partially accounted for by the fact that prior to that year the receipts from the sales of and advertising in the New Zealand Listener were shown as income, whereas now only the net result is included in the accounts.
COMMERCIAL DIVISION.—Following the coming into operation of the Broadcasting Act, 1936, the State purchased Station 1ZB, Auckland, which had previously operated as a “B” station, and commenced the broadcasting of programmes which included advertising-matter. Commercial stations were subsequently established at Wellington (2ZB), Christchurch (3ZB), and Dunedin (4ZB), all of which were opened in 1937, while Station 2ZA (Palmerston North) was opened in 1938.
Advertising constitutes the only source of revenue of the Commercial Division no portion of the radio-licence fees being allocated to this section. For the year 1947–48 income totalled £254,771, and expenditure £225,301, making a net profit for the year of £29,470. Corresponding figures for the previous financial year were: Income, £309,740; expenditure, £214,114; net profit, £95,626.
Reductions in broadcasting hours throughout the year owing to power-restrictions caused a decrease in the receipts from sales of station time from £303,114 in 1946–47 to £248,392 in 1947–48. During the latter year local and national community organizations were granted free announcements to the value of £2,461, and Government Departments and non-profit-making organizations were allowed rate concessions valued at £8,790.
The programmes of the commercial stations contain a high percentage of entertainment, as compared with commercial announcements or direct advertising.
Sessions of informative value and services such as the broadcasting for missing cars and persons are provided in addition to the normal programmes.
STATISTICS OF RADIO LICENCES.—The growth in the number of radio-receiving licences is apparent from the following table. Free licences, which are referred to later, are included in the figures. The licence fee for a receiving-station, which from 1st April, 1925, had been £1 10s. per annum, was reduced to £1 5s. per annum as from 1st April, 1935.
| As at 31st March, | Auckland. | Wellington. | Canterbury. | Otago. | New Zealand Totals. | Licences per Hundred of Population. |
|---|---|---|---|---|---|---|
| 1938 | 92,236 | 101,717 | 52,493 | 38,549 | 284,995 | 17.76 |
| 1939 | 101,721 | 114,020 | 58,524 | 43,244 | 317,509 | 19.54 |
| 1940 | 107,843 | 127,117 | 64,294 | 46,428 | 345,682 | 21.07 |
| 1941 | 116,454 | 126,046 | 65,327 | 47,614 | 355,441 | 21.72 |
| 1942 | 122,220 | 131,386 | 67,028 | 50,577 | 371,211 | 22.71 |
| 1943 | 121,194 | 130,453 | 65,935 | 50,539 | 368,121 | 22.53 |
| 1944 | 121,855 | 133,845 | 66,046 | 50,666 | 375,412 | 22.84 |
| 1945 | 126,716 | 133,706 | 68,155 | 50,612 | 379,189 | 22.57 |
| 1940 | 130,445 | 139,243 | 71,367 | 51,943 | 392,998 | 22.35 |
| 1947 | 139,487 | 143,812 | 74,472 | 57,452 | 415,223 | 23.16 |
| 1948 | 144,646 | 146,484 | 74,164 | 55,689 | 420,983 | 22.95 |
A summary of all radio licences in force in New Zealand as at the 31st March, 1948, follows.
| District. | Receiving-stations. | Radio dealers. | Private Experimental. | Other. | Total Licences. | |
|---|---|---|---|---|---|---|
| Amateur. | Research. | |||||
| Auckland | 144,646 | 596 | 507 | 4 | 14 | 145,767 |
| Wellington | 146,484 | 601 | 655 | 3 | 26 | 147,769 |
| Canterbury | 74,164 | 271 | 254 | 25 | 74,714 | |
| Otago | 55,689 | 212 | 201 | 3 | 16 | 56,121 |
| Totals | 420,983 | 1,680 | 1,617 | 10 | 81 | 424,371 |
Licences are issued free of charge to institutions for the blind and also to any blind person. In addition, public hospitals, benevolent and orphan institutions, and other charitable institutions are granted free licence privileges, provided that the sets are used for the benefit of patients or inmates. Free licence privileges have also been extended to the operation of receiving-sets in schools, where such sets are used for educational broadcast purposes. The number of free licences as at the 31st March of each of the last five years was: 1944, 1,585; 1945, 1,635; 1946, 1,702; 1947, 1,787; and 1948, 1,837.
A penalty is attached to the operating of unlicensed radio apparatus, and convictions for this offence during the last five years numbered; 1944, 361; 1945, 358; 1946, 308; 1947, 288; and 1948, 216.
Table of Contents
OCCUPATION OF LAND.—The total area of Now Zealand, excluding the Cook and other Pacific islands annexed in 1901, the Tokelau Islands declared part of New Zealand as from 1st January, 1949, and the trust territory of Western Samoa, but inclusive of the Kermadec Islands and the “outlying islands,” since these form parts of land districts, is 66,390,722 acres. Of this total, 42,792,053 acres were returned in 1948 as being in occupation, including reserves and Maori lands leased, hut excluding areas within borough boundaries, holdings of less than 1 acre in extent, and Maori land held on the communal system.
According to information furnished by the Lands and Survey Department, the following is the condition of the land in New Zealand as at the 31st March, 1918.
| Acres. | Percentage of Total. | |
|---|---|---|
*The greater part of this land is unsuitable for settlement. † Includes certain areas alienated by sale to Europeans. | ||
| Total area sold or granted and held on freehold | 21,869,127 | 32.9 |
| Total area reserved for public purposes | 16,661,565 | 25.1 |
| Total area of Crown lands leased under all tenures (exclusive of reserves leased by the Crown) | 15,890,723 | 23.9 |
| Total area of Crown land available for future disposal* | 2,327,290 | 3.5 |
| Total area of Maori land† | 4,477,524 | 6.8 |
| Land unfit for settlement, including rivers, lakes, roads, &c. | 5,164,493 | 7.8 |
| Totals | 66,390,722 | 100.0 |
The number of holdings and percentages of total holdings in occupation, grouped according to size, as returned in each of the years 1940–41 and 1946–48, are given below.
| Area, In Acres. | Number of Holdings. | Percentages of Total. | ||||||||
|---|---|---|---|---|---|---|---|---|---|---|
| 1940. | 1941. | 1946. | 1947. | 1948. | 1940. | 1941. | 1946. | 1947. | 1948. | |
| 1 and under 10 | 11,206 | 11,265 | 11,380 | 11,566 | 11,450 | 12.98 | 13.04 | 13.20 | 13.24 | 13.30 |
| 10 and under 50 | 14,688 | 14,585 | 14,014 | 13,741 | 13,838 | 17.02 | 16.89 | 16.25 | 16.00 | 15.80 |
| 50 and under 100 | 12,682 | 12,739 | 12,812 | 12,912 | 12,824 | 14.70 | 14.75 | 14.86 | 14.83 | 14.84 |
| 100 and under 200 | 16,585 | 16,646 | 16,699 | 17,131 | 16,926 | 19.22 | 19.27 | 19.36 | 19.57 | 19.69 |
| 200 and under 320 | 9,877 | 9,861 | 9,862 | 10,066 | 9,911 | 11.44 | 11.42 | 11.44 | 11.46 | 11.57 |
| 320 and under 640 | 10,208 | 10,202 | 10,392 | 10,537 | 10,486 | 11.83 | 11.81 | 12.05 | 12.12 | 12.11 |
| 640 and under 1,000 | 4,112 | 4,154 | 4,154 | 4,137 | 4,130 | 4.76 | 4.81 | 4.82 | 4.78 | 4.76 |
| 1,000 and under 5,000 | 5,899 | 5,883 | 5,882 | 5,877 | 5,881 | 6.84 | 6.81 | 6.82 | 6.80 | 6.76 |
| 5,000 and under 10,000 | 548 | 544 | 556 | 540 | 541 | 0.63 | 0.63 | 0.64 | 0.63 | 0.62 |
| 10,000 and under 20,000 | 298 | 294 | 287 | 282 | 292 | 0.35 | 0.34 | 0.33 | 0.34 | 0.32 |
| 20,000 and under 50,000 | 146 | 145 | 145 | 145 | 151 | 0.17 | 0.17 | 0.17 | 0.17 | 0.17 |
| 50,000 and over | 55 | 55 | 56 | 51 | 53 | 0.06 | 0.06 | 0.06 | 0.06 | 0.06 |
| Totals | 86,304 | 86,373 | 86,239 | 86,985 | 86,483 | 100.00 | 100.00 | 100.00 | 100.00 | 100.00 |
Although approximately 44 per cent. of holdings in 1948 were less than 100 acres in extent, the total area of such holdings represented only a little over 3 per cent. of the occupied land of Now Zealand. A further 20 per cent. of the holdings ranged between 100 and 200 acres, but the aggregate area of those amounted to only a little over 5½ per cent. of the total. At the other end of the scale it is found that 67 per cent. of the occupied Land was held in areas of 1,000 acres and upwards, although the number of such holdings was only 8 per cent. of the total. Holdings of 5,000 acres and upwards, of which there were 1,037 in 1948, accounted for just under 40 per cent. of the total area of occupied land.
| Area of Holdings, in Acres. | 1940. | 1941. | 1946. | 1947. | 1948. |
|---|---|---|---|---|---|
| Acres. | Acres. | Acres. | Acres. | Acres. | |
| 1 and under 10 | 51,972 | 52,525 | 52,938 | 53,066 | 53,692 |
| 10 and under 50 | 373,144 | 374,038 | 356,797 | 350,939 | 347,340 |
| 50 and under 100 | 920,201 | 925,878 | 936,146 | 937,483 | 944,077 |
| 100 and under 200 | 2,319,662 | 2,330,867 | 2,338,315 | 2,368,616 | 2,401,690 |
| 200 and under 320 | 2,473,124 | 2,476,209 | 2,468,817 | 2,481,304 | 2,520,944 |
| 320 and under 640 | 4,612,778 | 4,614,325 | 4,697,290 | 4,741,977 | 4,765,157 |
| 640 and under 1,000 | 3,272,236 | 3,307,731 | 3,302,224 | 3,289,742 | 3,290,559 |
| 1,000 and under 5,000 | 11,506,934 | 11,517,582 | 11,498,507 | 11,496,561 | 11,481,587 |
| 5,000 and under 10,000 | 3,759,280 | 3,707,175 | 3,793,591 | 3,676,200 | 3,668,759 |
| 10,000 and under 20,000 | 4,159,916 | 4,133,400 | 4,012,385 | 4,083,186 | 3,959,367 |
| 20,000 and under 50,000 | 4,547,248 | 4,406,409 | 4,408,209 | 4,615,910 | 4,469,876 |
| 50,000 and over | 4,931,333 | 5,042,198 | 5,214,789 | 5,004,840 | 4,889,005 |
| Totals | 42,927,828 | 42,888,337 | 43,080,008 | 43,099,824 | 42,792,053 |
Tenure of Occupied Lands.—The area of land in occupation as at 31st January in each of the years specified, classified according to tenure, is given in the following table. Freehold land includes land held on deferred payment, if occupied by the owner. Figures for intervening years are not available.
| Tenure. | 1940. | 1941. | 1942. | 1947. | 1948. |
|---|---|---|---|---|---|
| Acres. | Acres. | Acres. | Acres. | Acres. | |
| Freehold | 21,294,546 | 21,504,847 | 21,689,218 | 22,233,600 | 22,552,128 |
| Leasehold | 21,633,282 | 21,383,490 | 21,308,182 | 20,866,224 | 20,239,925 |
| Total area occupied | 42,927,828 | 42,888,337 | 42,997,400 | 43,099,824 | 42,792,053 |
Lands in occupation are not strictly comparable with Crown lands alienated or in process of alienation, for certain lands which were never made waste lands of the Crown have passed into the hands of Europeans. It must also be remembered that not all of the freehold land is in occupation, while (as stated previously) holdings within borough boundaries or under 1 acre in extent are excluded from the annual statistics.
Condition of Occupied Land.—The land in occupation in New Zealand at the 31st January, 1948, was classified according to condition and use as follows:—
| Acres. | Percentage or Total. | |
|---|---|---|
* Includes areas also sown with grasses and clovers. | ||
| In cereals and crops for threshing* | 469,017 | 1.10 |
| In green, root, and other crops* | 686,895 | 1.60 |
| In fallow | 122,812 | 0.29 |
| In sown grasses and clovers— | ||
| Cut for hay, seed, or ensilage | 748,465 | 1.75 |
| Not cut for hay, seed, or ensilage | 17,088,810 | 39.93 |
| In vineyards and orchards | 19,606 | 0.05 |
| In passion-fruit vines | 113 | |
| In hop-vines | 624 | |
| In market gardens and nurseries | 14,698 | 0.03 |
| In private gardens and pleasure-grounds | 80,518 | 0.19 |
| In plantations | 871,356 | 2.04 |
| Total area in cultivation | 20,102,914 | 46.98 |
| Unimproved land | 22,689,139 | 53.02 |
| Total area in occupation | 42,792,053 | 100.00 |
Land in cultivation (under crop and in pasture) forms the subject matter of the Section on agricultural and pastoral production immediately following. An indication of the condition and geographical distribution of unimproved land is afforded by the following table, which relates to the position in January, 1948.
| Land District. | Phormium (New Zealand Flax). | Tussock and other Native Grasses. | Fern, Scrub, and Second Growth. | Standing Native Bush. | Barren and Unproductive Land. | Total Unimproved Occupied Land. |
|---|---|---|---|---|---|---|
| Acres. | Acres. | Acres. | Acres. | Acres. | Acres. | |
| North Auckland | 4,540 | 117,377 | 831,101 | 234,585 | 50,986 | 1,238,589 |
| South Auckland | 2,127 | 66,917 | 975,626 | 362,185 | 61,641 | 1,468,496 |
| Gisborne | 12 | 28,137 | 194,113 | 157,581 | 14,011 | 393,854 |
| Hawke's Bay | 131 | 329,025 | 312,199 | 104,316 | 26,901 | 772,572 |
| Taranaki | 30 | 2,432 | 154,993 | 216,928 | 10,530 | 384,913 |
| Wellington | 5,868 | 404,322 | 562,673 | 281,093 | 66,415 | 1,320,371 |
| Marlborough | 2,957 | 1,142,891 | 236,538 | 112,648 | 292,702 | 1,787,736 |
| Nelson | 3,724 | 184,606 | 320,354 | 253,114 | 17,080 | 778,878 |
| Westland | 4,530 | 90,546 | 192,798 | 370,539 | 152,749 | 811,162 |
| Canterbury | 2,688 | 4,504,305 | 183,249 | 68,962 | 558,385 | 5,317,589 |
| Otago | 2,471 | 5,427,811 | 496,938 | 302,621 | 334,885 | 6,564,726 |
| Southland | 6,320 | 1,349,010 | 328,215 | 116,353 | 50,355 | 1,850,253 |
| Totals | 35,398 | 13,647,379 | 4,788,797 | 2,580,925 | 1,636,640 | 22,689,139 |
SCENIC RESERVES, PUBLIC DOMAINS, AND NATIONAL PARKS.—The consolidating Scenery Preservation Act, 1908, with its amendments of 1910, 1915, 1926, 1933, 1938, and 1940, contains the major legislation dealing with the reservation of land, Crown or private, for scenic, thermal, or historic reserves. The Act is administered by a Scenery Preservation Board through the Department of Lands and Survey.
The Public Reserves, Domains, and National Parks Act, 1928, is also a consolidation of earlier measures. For the purposes of this Act public reserves do not include education reserves (vide next subsection), scenic reserves (supra), State forests (vide Section 19.—Forestry), land reserved under the Kauri-gum Industry Act, 1908, or reserves under the Tourist and Health Resorts Control Act, 1908. The Act declares the general right of the public to free access to recreational reserves, but gives limited powers—extended by the Local Authorities Empowering (Aviation Encouragement) Act, 1929—to charge for admission.
Any public reserve for health or recreational purposes vested in or acquired by the Crown may be declared a public domain. Public domains are generally administered by Domain Boards, many of which are already existing local authorities. Domain Boards may purchase land, and land may also be taken for recreation-grounds under the Public Works Act, 1928. In certain limited instances power is given to charge for admission to public domains.
National parks are administered by National Park Boards, which have power, subject to ministerial approval, to fix fees for camping or picnicking within the parks.
The following areas are as at 31st March, 1945:—
| Number. | Acres. | |
|---|---|---|
| Reserves under Seen Preservation Act | 1,230 | 922,760 |
| Public domains | 827 | 80,084 |
| National parks | 10 | 3,061,341 |
LAND TRANSFER AND DEEDS REGISTRATION.—Under the land transfer system introduced in 1870 the title to land is not affected by the execution of documents. Registration is the fundamental principle, and it is only on registration that any interest passes. The Land Transfer Department assumes all responsibility for the registration, and any person named in the register as taking an interest under a registered instrument acquires a practically indefeasible title.
The land transfer system of title by registration has great advantages over the older system of title by deeds, even when the deeds are duly registered. The state of a land transfer title can be ascertained by a search of the register with very much greater facility than can the state of a title under the deeds system, and the powers vested in Registrars under the Land Transfer Act enable them to keep the register simple, clear, and free from doubts; the simplicity of searching and of the preparation of instruments under the land transfer system enables transactions with land under that system to be carried out at less cost than under the deeds system; and under the land transfer system there is the State guarantee of a practically indefeasible title, as mentioned previously.
These considerations led to the passing in 1924 of the Land Transfer (Compulsory Registration of Titles) Act, which has for its object the bringing under the provisions of the Land Transfer Act, 1915, of all land alienated by the Crown and not already under the provisions of that Act, except lands held by Maoris under their customs and usages.
The work of bringing all land titles under the provisions of the Land Transfer Act as required by the Land Transfer (Compulsory Registration of Titles) Act, 1924, has been completed except in the Auckland District. There are also a few titles in other districts that it has been considered unwise to deal with at present owing to grave doubts as to ownership, or for some other reason. It will be some time yet before the work in the Auckland District is completed. Progress during the last few years has been considerably hampered by reason of shortage of staff.
Deeds Registration.—Provision has existed since 1841 and is now contained in the Deeds Registration Act, 1908, for the registration of deeds and instruments affecting land which is not subject to the provisions of the Land Transfer Act. Registration is not essential to the validity of the instrument, but it is highly important as a record and to secure priority. The Act provides that every deed shall be void as against any person claiming for valuable consideration under any subsequent deed duly registered unless the earlier deed was registered before the subsequent one. The Department is not responsible for the form or matter of the instruments registered beyond seeing that they are duly stamped and contain a sufficient description of the land to identify it. Provision is made for the deposit of instruments in the Deeds Registry Office for safe custody and reference, and such deposit operates as a release from any covenant for production. The Deeds Index and all recorded and deposited instruments are open to public inspection, and certified copies may be obtained on payment of the prescribed fees.
Information as to transactions under the Deeds Registration Act for each of the years 1937–38 to 1947–48 is given in the following statement.
| Year ended 31st March, | Deeds recorded. | Fees. £ |
|---|---|---|
| 1938 | 2,008 | 1,658 |
| 1939 | 1,323 | 1,104 |
| 1940 | 731 | 615 |
| 1941 | 488 | 435 |
| 1942 | 257 | 256 |
| 1943 | 263 | 205 |
| 1944 | 261 | 236 |
| 1945 | 196 | 187 |
| 1946 | 221 | 200 |
| 1947 | 139 | 152 |
| 1948 | 135 | 148 |
Land Transfer.—Information as to applications to bring land under the Land Transfer Act during each of the last five years is given in the next table.
| Year ended 31st March, | Number. | Area. | Value. | |
|---|---|---|---|---|
| Town and Suburban. | Country. | |||
| Acres. | Acres. | £ | ||
| 1944 | 11 | 5 | 92 | 4,600 |
| 1945 | 9 | 6 | 20 | 2,405 |
| 1946 | 18 | 14 | 203 | 6,691 |
| 1947 | 13 | 6 | 99 | 4,825 |
| 1948 | 13 | 57 | 118 | 19,185 |
The table next following shows transfers registered under the Land Transfer Act daring each of the last eleven years.
| Year ended 31st March, | Town and Suburban Properties. | Country Properties. | All Properties: Total Consideration. | ||||
|---|---|---|---|---|---|---|---|
| Number. | Area. | Consideration. | Number. | Area. | Consideration. | ||
| Acres. | £ | Acres. | £ | £ | |||
| 1938 | 20,634 | 8,062 | 13,790,446 | 5,635 | 1,020,638 | 9,538,268 | 23,328,714 |
| 1939 | 23,402 | 8,209 | 14,468,273 | 5,563 | 957,820 | 9,190,963 | 23,659,236 |
| 1940 | 22,196 | 7,477 | 13,922,114 | 5,861 | 1,038,901 | 8,197,269 | 22,119,383 |
| 1941 | 22,723 | 8,084 | 15,460,358 | 6,105 | 1,102,752 | 10,277,863 | 25,738,221 |
| 1942 | 23,225 | 11,405 | 16,261,000 | 4,982 | 915,204 | 7,000,191 | 23,261,191 |
| 1943 | 22,893 | 8,505 | 17,251,884 | 4,764 | 733,198 | 6,883,486 | 24,135,370 |
| 1944 | 26,779 | 9,825 | 24,563,740 | 6,922 | 1,404,834 | 13,581,418 | 38,145,158 |
| 1945 | 26,377 | 9,684 | 21,359,326 | 6,907 | 1,282,036 | 11,099,582 | 32,458,908 |
| 1946 | 31,239 | 10,938 | 25,393,089 | 6,821 | 1,310,557 | 12,961,052 | 38,354,141 |
| 1947 | 34,685 | 12,221 | 27,208,158 | 8,309 | 1,844,048 | 17,764,342 | 44,972,500 |
| 1948 | 32,080 | 11,419 | 25,039,505 | 6,721 | 1,756,588 | 15,413,013 | 40,452,518 |
The numbers of transfers shown in the table relate only to transfers of land on sale—i.e., they do not include transfers of land from trustees to beneficiaries or to new trustees, transfers of mortgages, easements, &c. The numbers of these miscellaneous transfers fur each of the years 1937–38 to 1947–18 were 5,082, 5,348, 5,625, 5,123, 4,415, 3,409, 3,936, 4,785, 5,041, 6,930, and 7,548.
Land-transfer transactions were on a particularly heavy scale during the second half of 1943, but following the introduction of the Servicemen's Settlement and Land Sales Act, 1943, referred to later in this Section, they fell away considerably in the first two months of 1944. The totals for the year ended 31st March, 1944, however, showed a substantial increase over the previous year, both town and suburban and country properties contributing to the increase. In the following year the number of transactions in regard to both town and suburban properties and country properties were only slightly below the 1943–44 figures, but in both instances there was a marked fall in the amount of consideration, 13 per cent. in the case of the former and 18.3 per cent. in the latter. In 1945–46 a substantial increase was shown in the number of town and suburban properties transferred, with a corresponding increase in the amount of consideration, while country properties showed a slight decrease in number but a noticeable increase in the amount of consideration. Further substantial increases were recorded in 1946–47, particularly in relation to country properties, and although slight recessions were recorded in 1947–48, activity was nevertheless on a heavy scale. The high figures of the last two years are due in a large measure to the rehabilitation of ex-servicemen, but it is of interest to note that they were well below those for the years immediately following the First World War. In the year ended 31st March, 1920, the total number of transfers was 45,128 and the amount of consideration-money £62,446,574, while in the year ended 31st March, 1921, 55, 746 transfers were registered, the consideration-money being no less than £81,790,063. The area of country land involved in the transactions for these two years was 8,332,579 acres, as compared with 3,600,636 acres for the two years 1946–47 and 1947–48.
As all classes of properties are included, land-transfer figures do not give a precise indication of any changes that may take place in property values. In the case of town and suburban properties, however, the numbers involved are sufficient to smooth out changes from year to year in the proportions of different classes of property included in the total. The average amount of consideration per town and suburban property transferred in 1939–40 was £627, and this rose by successive stages to £917 in 1943–44, the year in which the Servicemen's Settlement and Land Sales Act was introduced. In 1944–45 the average fell to £810, a decrease of £107 as compared with 1943–44, while the figures for subsequent years were £813 in 1945–46, £784 in 1946–47, and £781 in 1947–48.
Further particulars relating to country properties for the year 1937–1938 onwards are contained in the next table, hut in this instance freehold properties only have been taken into account. From these figures in conjunction with those of the preceding table, it will be seen that leasehold properties form a very small proportion of the total transferred in any one year. As indicated previously, very diverse types of property are included in the figures, and the averages should not be taken for more than they purport to show. This is particularly so in the case of country properties, where the number of transactions is comparatively small.
| Year ended 31st March, | Number. | Area. | Consideration. | Average Value per Transaction. | Average Value per Acre. |
|---|---|---|---|---|---|
| Acres. | £ | £ | £ | ||
| 1938 | 5,122 | 849,392 | 9,104,270 | 1,777 | 10.72 |
| 1939 | 5,054 | 804,201 | 8,812,429 | 1,744 | 10.96 |
| 1940 | 5,297 | 874,503 | 7,824,303 | 1,477 | 8.95 |
| 1941 | 5,495 | 918,405 | 9,760,573 | 1,776 | 10.63 |
| 1942 | 4,523 | 746,479 | 6,545,461 | 1,447 | 8.77 |
| 1943 | 4,390 | 607,686 | 6,583,057 | 1,500 | 10.83 |
| 1944 | 6,399 | 1,209,138 | 13,106,993 | 2,048 | 10.84 |
| 1945 | 6,339 | 1,045,833 | 10,504,313 | 1,657 | 10.04 |
| 1946 | 6,212 | 1,063,738 | 12,091,127 | 1,946 | 11.37 |
| 1947 | 7,498 | 1,466,565 | 16,631,882 | 2,218 | 11.34 |
| 1948 | 6,038 | 1,462,982 | 14,539,097 | 2,408 | 9.94 |
Monthly statistics of transfers on sale of land registered under the Land Transfer Act are available and are published regularly in the Monthly Abstract of Statistics.
Certificates of Title issued.—The following table shows the number of certificates issued for the last five years.
| Year ended 31st March, | In lieu of Crown Grants. | Under Transfer Act of 1924. | Ordinary. | Total. |
|---|---|---|---|---|
| 1944 | 602 | 96 | 8,782 | 9,480 |
| 1945 | 496 | 216 | 10,268 | 10,980 |
| 1946 | 308 | 338 | 12,081 | 12,727 |
| 1947 | 547 | 376 | 15,085 | 16,008 |
| 1948 | 664 | 59 | 19,149 | 19,872 |
SERVICEMEN'S SETTLEMENT AND LAND SALES ACT, 1943.—This Act has the dual purpose of providing machinery for the compulsory acquisition of land for the settlement of discharged servicemen and the control of sales and leases of land. Its application in regard to the former aspect is dealt with in the next subsection, and a brief outline of the main provisions in respect of the control of sales and leases is given hereunder.
The Act established a Court of record called the Land Sales Court, and a number of district Land Sales Committees. The Land Valuation Court Act, 1948, however, abolished both the Court and the Committees, as from 1st January, 1919, and established the Land Valuation Court and Land Valuation Committees, which now exercise the powers and functions previously held by the Land Sales Court and the district Land Sales Committees. All transactions for the disposal of any land, whether by way of sale, transfer, or lease, must have the consent of the Court before they can be completed. Each application to the Land Valuation Court for consent is referred to a Land Valuation Committee, which, in considering it, is enjoined to have regard to the desirability of facilitating the settlement of discharged servicemen and of preventing undue increases in the price of land, the undue aggregation of land, and its use for speculative or uneconomic purposes.
Except in cases where the Committee decides that it is not necessary to determine the basic value or basic rent, no application for the consent of the Court shall be granted if the purchase-money, rent, or other consideration exceeds the basic value or basic rent of the land, as the case may be.
In the case of farm land the basic value is deemed to be the productive value, increased or reduced by such an amount as the Committee deems necessary in order to make it a fair value for the purposes of the Act. The productive value is doomed to be an amount equal to the net annual income that can be derived from the land by the average efficient farmer, capitalized at the rate of 4½ per cent. In arriving at the not income there shall be deducted from the gross income all expenses required to he incurred in producing such income, including rates and land-tax, provision for reasonable maintenance, reasonable remuneration for the work performed by the farmer in the production of the income, and interest on the average annual value of the stock and chattels used in the fanning operations, computed at the rate of 5 per cent. per annum. The gross income is determined on the basis of the prices for farm products ruling on 15th December, 1942. In deciding whether it is necessary to make any increase or reduction in the productive value of the land the Committee is required to take into consideration such matters as the nature and extent of the estate or interest of the claimant or, as the ease may be, of the vendor or lessor of the land, the extent to which the value of the improvements on the land exceeds or is less than the value of the improvements normally required, and any special value that the land may have by reason of its locality.
The basic value of land other than farm land is deemed to be the value thereof as at 15th December, 1942, increased or reduced by such an amount as the Committee deems necessary to make it a fair value, taking into consideration such matters as the nature and extent of the estate or interest of the vendor or lessor in the land, and any increase or decrease since 15th December, 1942, in the value of the improvements on the land.
In determining the basic rent of any land the Committee shall have regard to the basic value of the land, the value of the lessee's interest (if any) in the improvements on the land, and all other relevant considerations, including the basic rent or the fair rent (if any) under the Fair Rents Act or the Economic Stabilization Emergency Regulations 1942. In general the rents fixed by the Fair Rents Act and the Economic Stabilization Emergency Regulations were those ruling on 1st September, 1942.
With the passing of the Tenancy Act, 1918, repealing all Fair Bents legislation and revoking certain Economic Stabilization Emergency Regulations 1942, the basic rent or fair rent will be that determined under the authority of this Act.
Applications under the Act.— Applications for consent to transactions filed during the year ended 31st March, 1948, numbered 41,352, as compared with 46,995 in the previous year and 43,899 in the year ended 31st March, 1946. Of the applications filed in 1947–48, rural lands accounted for 5,466, while these made in respect of urban properties numbered 35,886. Corresponding figures for 1946–47 were 6,647 and 40,348 respectively. The following table gives particulars of applications received in the various districts from the operation of the Act (18th October, 1943) to 31st March, 1948.
| Registry. | Applications received. | Grunted without Hearing. | Granted after Hearing. | Granted subject to Conditions. | Refused (or withdrawn). | Number finalized. | Action incomplete at 31st March, 1948 |
|---|---|---|---|---|---|---|---|
| Rural lands— | |||||||
| Auckland | 6,514 | 3,456 | 665 | 1,716 | 510 | 6,347 | 167 |
| Hamilton | 2,894 | 1,902 | 178 | 342 | 329 | 2,751 | 143 |
| Gisborne | 671 | 458 | 45 | 108 | 36 | 647 | 24 |
| Napier | 1,260 | 943 | 30 | 184 | 66 | 1,223 | 37 |
| New Plymouth | 1,598 | 1,111 | 41 | 241 | 147 | 1,540 | 58 |
| Wellington | 1,963 | 1,348 | 79 | 353 | 121 | 1,901 | 62 |
| Blenheim | 323 | 170 | 29 | 88 | 27 | 314 | 9 |
| Nelson | 1,134 | 801 | 30 | 186 | 89 | 1,106 | 28 |
| Hokitika | 173 | 124 | 6 | 30 | 8 | 168 | 5 |
| Christchurch | 3,092 | 2,136 | 119 | 607 | 155 | 3,017 | 75 |
| Dunedin | 1,884 | 1,070 | 26 | 537 | 167 | 1,800 | 84 |
| Invercargill | 2,158 | 1,415 | 121 | 379 | 171 | 2,086 | 72 |
| Totals | 23,664 | 14,934 | 1,369 | 4,771 | 1,826 | 22,900 | 764 |
| Other lands— | |||||||
| Auckland | 44,415 | 27,653 | 3,849 | 10,767 | 1,232 | 43,501 | 914 |
| Hamilton | 10,993 | 7,745 | 549 | 1,562 | 625 | 10,481 | 512 |
| Gisborne | 2,883 | 2,276 | 77 | 444 | 42 | 2,839 | 44 |
| Napier | 7,951 | 5,890 | 153 | 1,427 | 254 | 7,724 | 227 |
| New Plymouth | 6,309 | 4,660 | 108 | 1,200 | 225 | 6,193 | 116 |
| Wellington | 30,895 | 20,963 | 572 | 7,386 | 1,156 | 30,077 | 818 |
| Blenheim | 2,026 | 1,167 | 102 | 677 | 58 | 2,004 | 22 |
| Nelson | 4,303 | 3,076 | 156 | 779 | 197 | 4,208 | 95 |
| Hokitika | 1,696 | 1,185 | 35 | 396 | 46 | 1,662 | 34 |
| Christchurch | 23,927 | 13,182 | 494 | 9,125 | 663 | 23,464 | 463 |
| Dunedin | 13,861 | 8,259 | 108 | 4,339 | 783 | 13,489 | 372 |
| Invercargill | 6,984 | 4,493 | 288 | 1,830 | 212 | 6,823 | 161 |
| Totals | 156,243 | 100,549 | 6,491 | 39,932 | 5,493 | 152,465 | 3,778 |
| Grand totals | 179,907 | 115,483 | 7,860 | 44,703 | 7,319 | 175,365 | 4,542 |
Reductions in consideration-moneys directed by Land Sales Committees during the year ended 31st March, 1948, amounted to £2,733,055, as compared with £2,525,565 in 1946–47. The next table gives particulars of reductions in consideration for the period covered corresponding to that shown in the preceding table—i.e., 18th October, 1943, to 31st March, 1948.
| Registry. | Rural Lands. | Other Lands. | Totals. | |||
|---|---|---|---|---|---|---|
| Number. | Amount. | Number. | Amount. | Number. | Amount. | |
| £ | £ | £ | ||||
| Auckland | 1,578 | 655,929 | 10,529 | 1,559,483 | 12,107 | 2,215,412 |
| Hamilton | 375 | 216,360 | 1,800 | 263,527 | 2,175 | 479,887 |
| Gisborne | 107 | 35,303 | 445 | 36,895 | 552 | 72,198 |
| Napier | 172 | 60,527 | 1,409 | 162,930 | 1,581 | 223,457 |
| New Plymouth | 235 | 105,988 | 1,200 | 168,784 | 1,435 | 274,772 |
| Wellington | 451 | 221,378 | 10,545 | 1,695,063 | 10,996 | 1,916,441 |
| Blenheim | 84 | 32,907 | 671 | 72,039 | 755 | 104,946 |
| Nelson | 203 | 48,397 | 1,024 | 132,392 | 1,227 | 180,789 |
| Hokitika | 30 | 9,837 | 409 | 45,918 | 439 | 55,755 |
| Christchurch | 584 | 243,199 | 9,001 | 1,079,429 | 9,585 | 1,322,628 |
| Dunedin | 453 | 133,410 | 4,215 | 499,434 | 4,668 | 632,844 |
| Invercargill | 330 | 128,442 | 1,518 | 194,810 | 1,848 | 323,252 |
| Totals | 4,602 | 1,891,677 | 42,766 | 5,910,704 | 47,368 | 7,802,381 |
During the period 1,127 appeals were lodged against decisions of Land Sales Committees. Of this number 333 were withdrawn, 270 dismissed, 324 allowed in part, 96 allowed in full, 72 referred back to the Committee, and 32 remained to be dealt with at the end of the year.
THE Crown lands are now administered under the authority of the Land Act, 1948. This Act consolidated into one Act all previously existing legislation relating to the lands of the Crown, and also made certain amendments thereto. The Acts so consolidated and amended were the Land Act, 1924, the Land for Settlement Act, 1925, those provision, of the Education Reserves Act, 1928, which relate to education reserves administered by a Land Board, the Hanmer Crown Leases Act, 1928, the Small Farms Act, 1932–33, and the amendments to those Acts. It also repealed, but did not re-enact, the Discharged Soldiers' Settlement Act, 1915, the Hutt Valley Lands Settlement Act, 1925, the Deteriorated Lands Act, 1925, the Fruit-farms Settlement Act, 1910, and the amendments to those Acts. The distinction that existed between Crown land subject to the various enactments mentioned was abolished by the new Act.
The Minister of Lands is charged with the administration of the Land Act and his executive officer is the Director-General of Lands, who is the Permanent Head of the Department of Lands and Survey.
New Zealand is divided into twelve land districts, the executive officer for each district being a Commissioner of Crown Lands. Prior to passing of the Land Act, 1948, there was a Land Board for each district, but the new Act abolished these Boards and vested their powers, rights, obligations, &c., in a central authority entitled the Land Settlement Board. This Board consists of the Minister of Lands (Chairman), the Director-General of Lands (Deputy Chairman), the Secretary to the Treasury, the Director-General of Agriculture, the Valuer-General, a representative of the State Advances Corporation, the Director of Rehabilitation, the Assistant Director of Lands, the Fields Director of the Department of Lands and Survey, a representative of the New Zealand Returned Services' Association, and not more than two other persons to be appointed by the Governor-General.
The duties of the Board are broadly defined in the Act as follows:—
“It shall be the duty of the Board to carry out the provisions of this Act for the administration, management, development, alienation, settlement, protection, and of Crown land; and to carry out all negotiations for the purchase of land by the Crown under this Act, and the performance and completion of all contracts of purchase so entered into by the Crown.”
To replace the District Land Boards, the Land Settlement Board is required to appoint one or more Land Settlement Committees for each land district, and sixteen of these Committees have been set up. Each Committee consists of three members, including the Commissioner of Crown Lands for the land district as Chairman. The Board may also appoint as an associate member of any Committee any person who in the opinion of the Board possesses expert knowledge of advantage to the Commit too in the execution of its functions, hut associate members have no voting-powers. The Committees have no functions expressly set out in the Act, but the Board has wide powers of delegating to Committees any of its functions.
METHODS OF ACQUIRING CROWN LAND.—A selector may purchase for cash, or on deferred payment, or may select on renewable lease. Every applicant must be of the age of seventeen years or upwards, and may apply for Crown land solely for his own use or benefit, and not directly or indirectly for the use or benefit of any other person. Two or more persons may make application to purchase or take on lease or licence as joint tenants in common. No application for Crown land will be granted if, having regard to the land already owned, leased, held, or occupied under any tenure of more than one year's duration, the acquisition of additional land would, in the opinion of the Board, amount to undue aggregation of land. An application will also be refused if the Board considers that the land is intended to be used for speculation or for uneconomic purposes.
Crown land may be acquired on the following tenures:—
Farm land or urban land—(a) On renewable lease; (b) for cash; (c) On deferred payments. A renewable lease is for a term of thirty-three years with a perpetual right of renewal for the same term, and, except where otherwise provided for, with a right of acquiring the fee-simple. The Board may, however, determine that any specified land may be taken on renewable lease only, but without the right of acquiring the fee-simple.
Commercial and industrial land—(a) On renewable lease for thirty-three years, but without the right of acquiring the fee-simple; (b) on lease for any term, but so that the aggregate term, including the renewals (if any), does not exceed fifty years. The Board may in any special case approve of the land being purchased for cash.
Pastoral land—(a) On pastoral lease for a term of thirty-three years with a perpetual right of renewal for the same term, but with no right of acquiring the fee-simple; (b) on pastoral occupation licence for a term not exceeding twenty-one years.
Short tenancies for grazing or other purposes for a term not exceeding five years.
Land for communal grazing—The Board may grant a lease or licence for any Crown land to any person or group or association of persons, or to any body corporate for use as communal grazing. The term is for a period not exceeding thirty-three years, with or without a right of renewal and subject to such conditions as the Board may decide.
Unclassified Land.—Where in the opinion of the Board any Crown land available for disposal cannot properly be classified as farm land, urban land, commercial or industrial land or pastoral land, the Board may sell or grant a lease for any term not exceeding thirty-three years, with or without a right of renewal, perpetual or otherwise for the same term.
Every holder of a lease or licence is required to effect within a certain specified period such improvements as the Board determines. In most cases the lessee or licensee of any farm or pastoral land is required to commence to reside on the land within one year after the date of his licence.
DISPOSAL OF ENDOWMENTS AND RESERVES.—Education endowments are available for leasing under the Education Reserves Act, 1928, which permits of a lease being granted under the Public Bodies' Leases Act, 1908, as well as under the Land Act, 1948. The freehold of the land cannot be acquired.
Public reserves not vested in trustees or in a local authority may be leased under the Reserves, Domains, and National Parks Act, 1928, for any term not receding twenty-one years, with right of renewal for a further term. The freehold of the land cannot be acquired.
LAND DEVELOPMENT.—The Land Act empowers the Land Settlement Board to carry out such development works as may be required to improve the quality or condition of any Crown land or to make it fit for settlement. This includes the erection of buildings, and the Board may carry on all usual farming activities on land developed or being developed until the time is appropriate for the disposal of the land on permanent tenure.
The Board may also make advances or readvances to lessees or licensees of Crown land to assist them in the development of their holdings. Purposes for which advances may be made include erection, improvement, &c., of buildings; clearing, draining, fencing, cultivation, grassing; provision of electric power, telephone services, and water; purchase of fencing materials, fertilizers, implements, &c.; and purchase of live-stock.
LANDS OPENED FOR SELECTION.—During the year ended 31st March, 1948, an area of 65,644 acres of land was offered for selection under the various tenures provided by the Land Act and the Land for Settlements Act. In addition, 123,329 acres were offered under the Small Farms Act, 1932–33. Of this latter area, 51,860 acres were taken up on renewable lease by ex-servicemen, 1,395 acres by civilians under the same tenure, 4,825 acres by ex-servicemen on agreement for sale and purchase, while the remainder of the area, 65,249 acres, was occupied by ex-servicemen with a promise of a lease or title.
Under renewable lease an area of 1,463 acres was offered, 1 acre being land for settlements, 1,271 acres ordinary Crown land, and 191 acres education endowment. An area of 124,018 acres was offered under the optional system, including the 123,329 acres under the Small Farms Act referred to in the previous paragraph.
The year's transactions included 160 purchases of small town, suburban, and rural lands, aggregating 2,931 acres, offered for sale by auction; ordinary Crown land holdings representing 2,810 acres; land for settlements, 90 acres; educational endowment lands, 1 acre.
The total selections during the year covered an area of 312,119 acres, the number of sections being 1,079 under all headings. These figures include some 505 sections comprising an area of 77,863 acres taken up under miscellaneous leases and licences, so that the selections on permanent tenures numbered 574 sections, covering a total area of 234,256 acres. The lands dealt with comprise both areas offered for the first time and areas which have become available for reoffering through various reasons. These figures do not, however, include the area of 65,249 acres referred to above as occupied by ex-servicemen with promise of a lease or title.
SELECTIONS UNDER SETTLEMENT CONDITIONS.—Areas under this heading include all lands sold for cash or selected on the deferred-payment system, small grazing runs, and leases under the following tenures: renewable lease (including small farms), mining districts land occupation lease, education endowment leases, and pastoral licences in mining districts under special regulations. Lands taken up by discharged servicemen under agreements for sale and purchase are shown on pages 861 and 862.
| Year ended 31st March. | Sold for Cash. | Deferred-payment Licences. | Leases and Licences (Ordinary Settlement). | Small Grazing-runs. | Totals. |
|---|---|---|---|---|---|
| NUMBER | |||||
| 1944 | 70 | 15 | 192 | 277 | |
| 1945 | 93 | 17 | 208 | 318 | |
| 1946 | 85 | 28 | 289 | 2 | 404 |
| 1947 | 104 | 22 | 369 | 1 | 496 |
| 1948 | 160 | 29 | 377 | 1 | 567 |
| AREA (ACRES) | |||||
| 1944 | 2,352 | 2,294 | 23,191 | 27,837 | |
| 1945 | 1,801 | 2,625 | 16,772 | 21,198 | |
| 1946 | 5,441 | 4,005 | 75,722 | 16,546 | 101,714 |
| 1947 | 4,202 | 2,689 | 65,274 | 1,702 | 73,867 |
| 1948 | 2,931 | 2,688 | 90,990 | 5,521 | 102,130 |
CROWN LAND HELD OR MADE FREEHOLD.—The table following shows the position of Crown lands at 31st March, 1948. Settlement lands under the Land for Settlements Act are included in the figures for the various tenures under which they are held.
| Tenure. | Total Number of Selectors | Total Area Held From the Crown. | Total Yearly Rental or Instalment Payable. | Total Area Made Freehold. | ||
|---|---|---|---|---|---|---|
| Number of Purchasers. | Area | Total Price Realized. | ||||
*Figures not available. † In addition to these renewable leases and freeholds, 194 discharged servicemen have been settled on an area of 49,119 acres on fixed charges, but renewable leases and freehold titles have not yet been issued. A further 271 are working on wages and have been promised a lease or title over 119,574 acres. | ||||||
| Acres. | £ | Acres. | £ | |||
| Cash lands | * | 13,345,362 | * | |||
| Deferred payment | 2,348 | 488,899 | 81,145 | 14,924 | 1,679,573 | 3,486,567 |
| Perpetual leases | 134 | 5,760 | 708 | 3,118 | 865,223 | 684,268 |
| Occupation with right of purchase | 529 | 151,824 | 13,128 | 5,971 | 1,468,970 | 1,551,081 |
| Lease in perpetuity | 6,824 | 1,399,759 | 157,655 | 3,788 | 621,230 | 1,286,501 |
| Renewable lease | 9,120 | 2,558,698 | 331,412 | 1,536 | 225,060 | 863,215 |
| Agricultural lease | 6 | 233 | 16 | 1,408 | 140,896 | * |
| Mining districts land occupation leases | 646 | 14,594 | 1,665 | 257 | 6,445 | 19,087 |
| Homestead | 61 | 80,453 | * | |||
| Pastoral licences in mining districts under special regulations | 341 | 69,381 | 1,532 | 150 | 26,875 | 23,381 |
| Small grazing runs | 724 | 2,365,417 | 82,514 | 90 | 115,955 | 251,491 |
| Pastoral runs | 583 | 7,925,475 | 74,376 | 10 | 30,207 | 15,018 |
| Hanmer Crown leases | 139 | 342 | 686 | |||
| Small farms | 762† | 141,774 | 28,704 | 43 | 3,045 | 23,348 |
| Miscellaneous leases and licences | 7,011 | 991,088 | 38,168 | 174 | 19,990 | 67,898 |
| Agreements for Sale and Purchase (Discharged Servicemen) | 154† | 25,357 | 575,924 | |||
| Totals | 29,167 | 16,113,244 | 811,709 | 31,684 | 18,654,641 | 8,847,779 |
| Thermal-springs leases (Rotorua) | 147 | 415 | 710 | 286 | 657 | 60,928 |
| Education endowments— | ||||||
| Primary | 3,814 | 741,440 | 102,995 | 11 | 6,908 | * |
| Secondary | 580 | 38,308 | 12,416 | 4 | 35 | * |
| Totals | 4,541 | 780,163 | 116,151 | 301 | 7,600 | 60,928 |
| Grand totals | 33,708 | 16,893,407 | 927,860 | 31,985 | 18,662,241 | 8,908,707 |
| Other endowment lands | 743 | 327,298 | 11,677 | 15 | 7,311 | 5,747 |
CROWN LANDS MADE FREEHOLD, YEAR ENDED 31ST MARCH, 1948
| Tenure (Immediately prior to acquisition of Freehold). | Area. | Amount realized. |
|---|---|---|
| Acres. | £ | |
| Cash lands sold | 2,986 | 17,241 |
| Freehold acquired under the following tenures:— | ||
| Deferred payment | 36,420 | 134,520 |
| Occupation with right of purchase | 7,181 | 12,896 |
| Lease in perpetuity | 3,217 | 9,859 |
| Mining districts land occupation leases | 17 | 400 |
| Renewable lease | 19,855 | 95,699 |
| Small grazing-runs | 1,871 | 2,229 |
| Pastoral licences in mining districts under special regulations | 100 | 50 |
| Small farms | 68 | 3,850 |
| Thermal-springs leases (Rotorua) | 9 | 2,938 |
| Perpetual lease | ||
| Agreements for Sale and Purchase (Discharged Servicemen) | 4,825 | 123,909 |
| Totals | 76,549 | 403,591 |
PURCHASE OF LAND FOR SETTLEMENT.—The Land for Settlement Act, 1925, and the Small Farms Act, 1932–33, now embodied in the Land Act, 1948, authorized the purchase of privately-owned land on behalf of the Crown. The new Act states that the Board may purchase any private land, or the interest of any lessee or licensee in any Crown land or Maori land, for the purposes of settlement as farming, urban, commercial or industrial, or pastoral land. All private land so purchased is doomed to be Crown land.
The Servicemen's Settlement and Land Sales Act, 1943, also authorizes the purchase of privately-owned land, and, in addition, gives power to acquire land compulsorily for the settlement of ex-servicemen.
ASSISTING PURCHASE OF PRIVATE LAND.—Section 3 of the Land Laws Amendment Act, 1932, provided authority for the making of advances to purchasers of private freehold properties up to 90 per cent. of the purchase-money, all such advances to be secured by way of first mortgage.
LAND FOR DISCHARGED SERVICEMEN.—The Small Farms Amendment Act, 1940, provided that the applications of discharged servicemen were to have preference over the applications of all other classes of persons for any land made available for selection under the Small Farms Act, 1932–33. The Land Laws Amendment Act, 1944, contained a similar provision in respect of ballots for land under the Land Act, 1924, and also provided that a lease or licence of any land administered by a Land Board may be granted without competition to a returned serviceman. As stated earlier, these enactments have been consolidated in the Land Act, 1948.
Land is acquired by the Crown for the purposes of settling ex-servicemen under the following methods:—
By the purchase of privately-owned properties:
By the setting apart for the purposes of the Act of Crown lands subject to the Land Act, 1924, or the Land for Settlements Act, 1925:
By the resumption by the Crown of land already held under Crown lease or licence:
By the compulsory acquisition of farms in terms of section 51 of the Servicemen's Settlement and Land Sales Act, 1943, or by the compulsory acquisition of land in terms of Part II of the same Act. In the latter case the owner, if farming the land himself for the support of himself and his dependants, has the right to retain any part of the land constituting an economic unit and containing the homestead (if any).
The following table contains particulars of land acquired for development and for the settlement of ex-servicemen under (a) and (d) above during the year ended 31st March, 1948, and from the commencement of the scheme to 31st March, 1948. The figures do not include Grown lands made available, nor do they include particulars relating to ex-servicemen who have been assisted by way of rehabilitation loans to purchase established farms on their own account. Further information concerning the settlement of ex-servicemen on the land will be found in Section 46, “Rehabilitation.”
| — | Year Ended 31st March, 1948. | Total to 31st March, March, 1948. | ||
|---|---|---|---|---|
| Area. | Estimated Number of Units. | Area. | Estimated Number of units. | |
| Acres. | Acres. | |||
| Purchased by voluntary negotiation | 137,758 | 202 | 451,391 | 922 |
| Acquired compulsorily under Part II, Servicemen's Settlement and Land Sales Act | 38,465 | 106 | 75,231 | 213 |
| Acquired compulsorily under section 51, Servicemen's Settlement and Land Sales Act, and capable of subdivision | 25,429 | 26 | 84,474 | 195 |
| Acquired compulsorily under section 51, Servicemen's Settlement and Land Sales Act: Single units | 3,597 | 27 | 29,692 | 175 |
| Totals | 205,249 | 361 | 640,788 | 1,505 |
The purchase-money in respect of the 451,391 acres purchased by voluntary negotiation up to 31st March, 1948, was £4,010,134, while the amount of compensation in respect of the 114,166 acres acquired under section 51 of the Servicemen's Settlement and Land Sales Act, 1943, was £1,493,566.
The number of ex-servicemen who have been established on permanent tenure or on wages or other similar basis with the promise of permanent tenure upon completion of the development programme at 31st March, 1948, was 939, while the area involved was 304,478 acres.
Rent under the small farms renewable lease is based on the unimproved value of the land at the date of the lease or renewal, and in the case of discharged servicemen is calculated at the rate of 2 per cent. of such unimproved value for the first year and 3 per cent. for the balance of the first term.
The amount of the value of the improvements on the land at the date of the lease is deemed to have been advanced to the lessee and is secured by mortgage of the lease, the mortgage being secured to the State Advances Corporation, which extends interest concessions and gives the same terms as are given in respect of mortgages of freehold properties. The State Advances Corporation also has power to make advances on its usual terms for stock, chattels, or further improvements.
DEFINITION AND KINDS OF MAORI LAND.—Maori land is of two kinds—namely, customary land and Maori freehold land. Customary land is land which has never been the subject of a Crown grant and is held by Maoris under the customs and usages of the Maori people. It is land in respect of which the ancient customary Maori title as recognized and guaranteed by the Treaty of Waitangi has not yet been extinguished. Such land, since it has not been Crown-granted, remains vested in the Crown, subject, however, to the customary title of the Maoris, and to their right to have the customary title transformed into a freehold title by the Maori Land Court. There is little of this class of land now left in New Zealand.
Customary land has always been restricted from alienation except in favour of the Crown. By the Treaty of Waitangi the exclusive right to purchase such land was reserved to the Crown, and in all statutes since passed the alienation of customary land to private individuals has been prohibited, and this prohibition is now extended to the Crown. Maori freehold land is the land held by Maoris under an ordinary freehold title, though subject to certain restrictions on alienation and other special incidents which are unknown to the ordinary law.
Whether land is Maori or European land depends upon the beneficial ownership of it, and not merely on the legal ownership. If land is held by a European in trust for a Maori, it is Maori land; if it is held in trust by a Maori for a European, it is European land. There arc, however, four exceptions to this:—
When land has once become European land, it never again becomes Maori land unless by special enactment.
Land purchased by a Maori from the Crown for a pecuniary consideration is not Maori land. This does not include an exchange of land, with or without a payment of money by way of equality of exchange.
Land held by a Maori in severalty may be declared to be European land by the Maori Appellate Court.
Under certain circumstances (sec p. 309 of 1942 Year-Book) the Maori owner may have been declared a European.
Even though one of many Maori owners may sell, the land remains Maori land until all have disposed of their interests, or until the purchaser has had his interests partitioned off. The term “Maori” includes a half-caste, or a person intermediate in blood between a Maori and a half-caste.
The Maori Land Act, 1931, and the Maori Purposes Act, 1931, are consolidations, with amendments, of previously existing legislation.
BOARD OF MAORI AFFAIRS.—The Board of Maori Affairs constituted under the Board of Maori Affairs Act, 1934–35, consists of the Minister of Maori Affairs, the Under-Secretary of the Department of Maori Affairs, the Director-General of Lands, the Valuer-General, the Financial Adviser to the Government, the Director-General of Agriculture, and such other members (not exceeding three) as the Governor-General may appoint.
The functions of the Board include, inter alia, the following:—
The control of the development and settlement of Maori land or land owned or occupied by Maoris, undertaken pursuant to Part I of the Maori Land Amendment Act, 1936.
The control of expenditure on farming operations undertaken by Maori Land Boards and the Maori Trustee.
The control of investments by—(a) Maori Land Boards; (b) the Maori Trustee; and (c) the East Coast Commissioner.
The control of negotiations for the acquisition of Maori lands by the Crown.
The control of expenditure on housing operations under the Maori Housing Act, 1935, and its amendment of 1938.
MAORI LAND COURT.—The Maori Land Court consists of a Chief Judge and such other Judges as the Governor-General may think fit to appoint. All powers of the Court may be exercised by a single Judge, but there are certain important powers vested exclusively in the Chief Judge. Commissioners are appointed who exercise such jurisdiction of a Judge as the Governor-General authorizes. The chief matters within the jurisdiction of the Court are:—
The investigation of title to customary land, and transforming it into Maori freehold land.
The exclusive power of partitioning land among the owners.
The sanctioning of exchanges for other Maori land and European land.
Granting probates of wills and succession orders to Maoris.
Making orders for the adoption of children.
Appointing trustees for Maoris who are minors or under other disability.
The incorporation of the owners of Maori land.
The determination of various claims as between Maoris.
To grant confirmation of alienation of Maori land.
Business dealt with in 1947–48 was as follows:—
| Number of sittings | 119 |
| Number of cases notified | 18,487 |
| Number of orders made | 6,207 |
| Number of cases dismissed | 1,338 |
| Number of cases adjourned sine die | 10,942 |
| Number of partitions made | 624 |
| Number of succession orders made | 5,236 |
| Number of other orders made | 3,339 |
The Maori Appellate Court consists of any two or more Judges of the Maori Land Court, provided that two Judges at least shall concur in every decision of the Court. With certain exceptions the Appellate Court determines appeals, whether on law or on fact, from all final orders of the Maori Land Court.
MAORI LAND BOARDS.—There are seven Maori Land Boards, each consisting of two members—viz., the Judge (or, if there be no Judge of the district, a Commissioner of the Court appointed by the Minister of Maori Affairs) and the Registrar of the Maori Land Court district, the Judge acting as President. The chief functions of a Maori Land Board are:—
To administer certain large areas of Maori land vested in the Board in trust for the Maori owners, the Board having extensive powers of sale, lease, and management.
To act as statutory agent of the Maori owners in respect of certain areas of Maori land set apart for Maori settlement.
To control the administration and disposition of Maori land by resolution of the assembled owners.
To assist Maoris in farming their lands.
In the administration of some 660,000 acres of vested lands, the collection and distribution of rents, royalties, and purchase-moneys from these lands, and from freehold areas which have been alienated, the operations of the seven Maori Land Boards are being fully sustained. Besides assisting Maoris to farm their own lands and in certain circumstances acting as agent for Maoris, the Boards are empowered to engage in any industry in the interests of Maoris, to act as receivers for the purpose of enforcing charges imposed by the Maori Land Courts, and to deal with various matters affecting land by meetings of assembled owners.
The financial operations of the Maori Land Boards are shown in conjunction with those of the Maori Trustee and will be found on page 867.
POWERS OF ALIENATION.—The ordinary provisions as to alienation of Maori land do not affect the power to dispose of land by will, but a Maori cannot will to a European except it be a husband or wife or other relative of the person making the will. A Maori cannot dispose of customary land, whether by will or otherwise. No alienation of Maori land by a Maori has any effect until it is confirmed by the Maori Land Court.
The Court, before confirming an alienation, must satisfy itself, inter alia, that it is not contrary to the interests of the Maori alienating; that no Maori is rendered landless by the alienation; that the consideration is adequate; that the purchase-money is paid or secured; and that the alienation is not otherwise prohibited by law.
A lease cannot be for a longer term than fifty years, and a mortgage must have the approval of the Minister of Maori Affairs and confirmation by the Maori Land Court.
With regard to Maori freehold land, the Courts during the year 1947–48 approved of leases comprising 28,218 acres, and confirmed transfers (apart from sales to the Crown) affecting 5,298 acres of freehold land.
PURCHASE OF MAORI LAND FOR CROWN.—Since 5th April, 1935, the duty of undertaking, controlling, and carrying out all negotiations for the acquisition of Maori lands by the Crown, and the performance and completion of all contracts entered into, is imposed upon the Board of Maori Affairs.
Pending any purchase by the Crown the Governor-General may, by Order in Council, prohibit alienation other than to the Crown. Upon the purchase being completed the land is proclaimed Crown land, and is subject to administration under the Land Act, 1948. Where the land is subject to lease when purchased, there may be extended to the tenant the option of purchasing the land from the Crown or having a renewable lease granted to him.
The area of Maori land still held by Maoris in the North Island is estimated at 3,750,000 acres, and in the whole of New Zealand at 4,000,000 acres. In many cases the Maoris are utilizing their land for pastoral and dairying purposes. Other lands are being farmed for them by Maori Land Boards, by the Maori Trustee, and by the East Coast Commissioner.
MAORI LAND DEVELOPMENT.—In the year 1929 legislation was enacted giving sanction to a scheme for the development and settlement of lands owned or occupied by Maoris. Part I of the Maori Land Amendment Act, 1936, which replaces section 522 of the Maori Land Act, 1931, imposes on the Board of Maori Affairs the duty of undertaking and carrying out this work.
To overcome any delays or difficulties arising from the nature of the titles to the lands proposed to be developed, the Board of Maori Affairs is authorized to bring such land under the scope of a development scheme. Upon notification of the fact the owners are prevented from interfering with the work of development, and private alienation of any land within the scheme is prohibited. The funds for development are provided by the Minister of Lands through the Land for Settlements Account. The Board of Maori Affairs is armed with the most comprehensive powers, which it can exercise directly through the Department of Maori Affairs or delegate to any Maori Land Board or to the Maori Trustee. The Board is also empowered to direct a Maori Land Board or the Maori Trustee to use their funds for development. Power is also taken by arrangement between the Minister of Lands and the Board of Maori Affairs to develop Crown lands that adjoin or are surrounded by a Maori land-development scheme, thus removing a further obstacle in the way of development. Special legislative provision has also been made enabling one or other of the Maori Land Boards or the Maori Trustee to undertake farming of specified blocks on behalf of the beneficial owners.
The total area gazetted under Part I of the Maori Land Amendment Act, 1936, to 31st March, 1948, was 655,212 acres, of which 288,102 acres are occupied by 1,808 settlers and a further 240,611 acres are considered suitable for development purposes. The live-stock carried comprised 39,969 dairy cows, 20,191 other dairy stock, 33,412 run cattle, 184,748 breeding-ewes, and 114,294 dry sheep. In addition, seventeen Maori Trust stations and six Maori Land Board stations comprising 51,259 acres and 42,435 acres respectively are running the following stock: 52,871 breeding-ewes, 46,356 dry sheep, and 11,791 dry cattle. The Board of Maori Affairs also exercises a measure of control over seventeen stations of the East Coast Trust aggregating 113,085 acres and carrying 88,621 sheep and 12,327 cattle.
MAORI TRUSTEE.—The administration of Maori funds and Maori reserves, formerly conducted by the Public Trustee, was by statute transferred to the Maori Trustee as from 1st April, 1921. This was part of a comprehensive scheme which seeks to rehabilitate the Maori by inducing him to farm and manage his own lands. As a further means to this end the Maori Trustee, with the approval of the Board of Maori Affairs, advances money to Maoris on the security of their lands, the expenditure of this money and the management of Maori farming-operations generally being supervised in a helpful and sympathetic manner. The Maori Trustee Act, 1930, consolidated existing legislation.
The Maori Trustee acts as trustee or agent for some 10,000 Maori beneficiaries; administers a large number of Maori reserves containing an aggregate area of 94,000 acres located in cities, towns, and rural districts: advances money to Maoris on the security of their lands; and is actively engaged on pastoral operations on a number of sheep-stations comprising a total area of 51,259 acres. The Maori Trustee accepts money on deposit from the Maori Land Boards and acts as banker for the Special Maori Housing Fund and the Maori Purposes Fund.
The following table contains a summary of the financial position of the Maori Trustee and the District Land Boards as at 31st March, 1946, 1947, and 1948. The particulars of receipts and payments are for the twelve months ended in those years.
| — | 1946. | 1917. | 1948. |
|---|---|---|---|
| £ | £ | £ | |
| Total receipts | 802,056 | 897,912 | 1,143,652 |
| Total payments | 722,350 | 874,159 | 1,152,260 |
| Cash balances | 111,954 | 160,111 | 41,410 |
| Investments— | |||
| On deposit with Maori Trustee | 280,932 | 332,656 | 427,792 |
| Government securities | 561,166 | 701,167 | 838,437 |
| Mortgages | 600,888 | 552,668 | 557,718 |
| Farming properties and primary production | 177,914 | 206,823 | 214,077 |
| Amounts held for Maori beneficiaries | 883,586 | 1,000,764 | 1,046,056 |
| Reserves— | |||
| Assurance and Reserve Fund | 205,845 | 212,888 | 216,101 |
| Special | 185,543 | 188,435 | 196,357 |
MAORI HOUSING.—The Maori Housing Act, 1935, with its amendments, makes provision for the better housing of the Maori people, and for that purpose provides for the erection of dwellings and for improved housing-conditions for Maoris. The Board of Maori Affairs is empowered under the Act to make advances, out of moneys appropriated by Parliament, for the erection, repair, alteration, or improvement of any dwelling upon the security of an interest in Maori land and an assignment of rents from Maori land, or any other moneys payable to a Maori. Section 18 of the Maori Housing Amendment Act, 1938, established a fund called “the Special Maori Housing Fund” to provide houses for those Maoris unable to furnish the security or to make the payments which the Board of Maori Affairs would ordinarily require.
During the year ended 31st March, 1948, 103 new houses were erected under the Maori. Housing Act, of which 36 were financed from the Special Maori Housing Fund referred to above, while additions and renovations were made to 77 existing houses., 33 of these being financed from the Special Fund. The total amount authorized under the Maori Housing Act from the inception of the scheme to 31st March, 1948, way £1,364,063, of which £838,748 had been expended.
In addition to the provision of housing for Maoris under the Maori Housing Act, dwellings are provided in the ordinary course of the Maori land-development schemes referred to on page 866. During the year ended 31st March, 1948, 37 new houses were erected in connection with these schemes and additions and alterations were made to 76 others.
In connection with the rehabilitation of Maori ex-servicemen, 56 new houses were erected, 12 dwellings were purchased, and additions and renovations were made to 6 existing houses during the year ended 31st March, 1948.
A summary of the numbers of houses erected, purchased, or renovated from the inception of the various schemes to 31st March, 1948, is now given:—
| Under Maori Housing Act— | ||
| Ordinary | 707 | |
| Special | 546 | |
| 1,253 | ||
| Under Maori land development schemes | 2,036 | |
| Rehabilitation | 115 | |
| Total | 3,404 |
INTRODUCTORY.—The surveys of Crown lands, Maori lands, land purchased under the various Settlements Acts, and lands acquired or taken for public works, are executed under the authority of the Minister of Lands, and are carried out by staff and contract surveyors registered by the Survey Board under the provisions of the Surveyors Act, 1938, which came into operation on 1st July, 1939. This Act provides that in order to undertake surveys all registered surveyors must hold annual practising certificates, issued by the Secretary of the New Zealand Institute of Surveyors.
The surveys of private lands for the purpose of the Land Transfer Act are carried out by private surveyors similarly registered.
Statutory authority for the surveyor to enter upon any land and to place survey marks thereon is contained in several Acts, and the wilful destruction of these marks is subject to a severe penalty.
All surface surveys are made in accordance with regulations laid down and are subject to field check (if thought necessary) and to office examination prior to approval and deposit.
The standard of length is the chain of 22 Imperial yards divided into 100 links, and all linear measurements have to be expressed in terms thereof, and areas in acres, roods, and perches, with decimals of a perch. Standard comparison bands are available in each District Office, as well as at the office of the Surveyor-General.
SURVEY SYSTEM.—Control Survey: Until the abolition of the provincial system of government in 1876, the surveys of New Zealand were conducted by nine survey departments, each independent of the other, and working on no common system. At that date an amalgamation into one department was accomplished. Several of the provincial services had conducted their surveys on a trigonometrical basis, but, as the others were building one survey on another by traverse on magnetic or other azimuthal bearings, without any reference to true meridian or the independent check of triangulation, a state of considerable confusion and uncertainty had arisen in the survey records.
In these circumstances it was necessary to devise a system that would rapidly bring the surveys under control and record, so that settlers might be placed in secure possession of their land, and the Crown be safe to issue titles on reliable plans and descriptions.
The plan adopted was to divide the country into twenty-eight districts, designated “meridional circuits.” At the initial or main station of each, the astronomical meridian was determined from observations of circumpolar stars, and the latitude from observations of stars north and south of zenith. Lines of bearings on the true astronomical meridian of the initial station were extended throughout its circuit to the plains and valleys where surveys were in progress. Within three years these standard bearings had been so extended as to enable all the surveys to be conducted on the true meridian of their respective circuits; for, following immediately on this operation, a base-line was measured, and a minor triangulation of two- and three-mile sides, starting from one of the stations of the standard bearings was spread over the country wherever most required for the check and connection of the settlement surveys. In this way New Zealand was placed very quickly under a system of correct recordable survey, readily adjusted to the requirements of a population rapidly spreading over areas widely apart. The intervening spaces have since been filled in, and the network of triangles is a continuous chain extending over the Islands from north to south, a distance of 1,100 miles. Simultaneously with the minor triangulation of the country, a topographical survey was carried on, giving the positions of rivers, plains, mountains, forests; best lines for future roads: altitudes of valleys, passes, and mountains; and generally a correct representation of the features of the country, to a scale of 2 in. to the mile.
Sectional: Each meridional circuit was subdivided into squares with sides of 1,000 chains in length, the meridian and perpendicular through the initial station being taken as the starting-point. These squares, called “survey districts,” were further divided into sixteen squares called “blocks,” with sides of 250 chains in length. The sections for sale or lease were superimposed upon these and numbered consecutively in each block. Thus each section has for the purpose of record and title registration a complete identification by means of its number, the number of the block, and the name of the district. Unfortunately, it was not found practicable to incorporate in this system the sections which had been alienated prior to 1876, and the provincial registration districts—parishes, hundreds, Crown grant districts, squares, &c.—were perpetuated.
In general, sections were surveyed before selection or disposal, and in these cases the sections were set off with due regard to the topography, thus making each section so far as possible a farm unit with good access, water-supply, and those other factors which make for the economical working of a farm.
The boundary-lines of the sections were marked at all corners by stout pegs and lockspits, with additional marks where lines were long and straight. In bush the lines were cut out and similarly marked at corners.
The main object of the survey is to enable the settlement of lands to proceed on a system which will give the settler the possession of a definite piece of land without fear of future rival claims. The Crown, which guarantees titles, is also freed from embarrassing claims for compensation caused by overlapping boundaries.
Office Computation and Records: The triangulation of each circuit was computed as plane, neglecting the curvature of the earth, and the triangulation stations were co-ordinated on the meridian and perpendicular passing through the initial station. Road and sectional surveys were made by traverses with theodolite and chain, rigidly connected to the triangulation stations, and the traverse points were similarly co-ordinated. All surveys were thus subject to complete mathematical check, and could be recorded by direct plot from co-ordinates. Areas generally were mathematically deduced, graphic methods being used only for those portions bounded by irregular lines such as streams. All surveys were recorded on index maps, on scales varying from 4 inches to a mile in rural districts to 1 chain to 1 inch in urban districts. The original survey plans, field notes, and co-ordinate tabulations are all carefully stored in fireproof strong-rooms and are readily available to surveyors requiring the use of the information contained.
In a new country it is of the first importance that all surveys should stand the mathematical test of reduction to the meridian and perpendicular of a governing trigonometrical survey, for, unlike the surveys of old countries, where time-honoured landmarks and a settled population conserve boundaries, the surveys of a new country have no such aid, but, instead, have to create boundaries in the unoccupied wilderness, which at best can only be marked by perishable surface marks. Then, again, the frequent changes of ownership of land in New Zealand facilitated by the Land Transfer system, and the responsibility of the Government in guaranteeing all titles under it, are cogent reasons why the rigid mathematical system of reduction of traverse to the meridian and perpendicular of the stations of a trigonometrical survey should be adopted and maintained.
GEODETIC SURVEY.—Increasing Accuracy: On completion of the original triangulation in the meridional circuits it was found that there were considerable discrepancies in the lines on the boundaries of the circuits, which were common to two or more. These discrepancies were caused principally by two factors—the accumulation of observational errors in the triangulation and the want of a common standard of length in the measurement of the bases. These differences were not sufficiently large to cause any embarrassment while traverses were made with the gunter chain and early pattern theodolite, but on the invention (by a New-Zealander, Mr. A. Fairburn) of the long steel tape in the early “seventies,” and the increased accuracy of later model theodolites, part of the value of the triangulation was impaired. Thus, while the network of permanent marks still controlled the position of boundaries, the field traverses of equal or even greater accuracy than the triangulation sides could no longer be used as definite checks.
First Order Triangulation: Early in this century it was decided to throw over the country a network of large triangles with a high degree of accuracy and from this to recompute the original minor triangulation to conform. In 1904 twelve steel bands were obtained, each with a Board of Trade certificate as to its correct length at a defined temperature and tension. Base-lines were selected, and five in the North Island were measured between 1909 and 1914, when the outbreak of the War of 1914–18 stopped further progress. In 1922 work was resumed, to be again stopped by the depression in 1931. After five years' cessation this work was resumed in 1936, the first order network observations being completed by the end of 1941, when it was necessary to divert the staff engaged thereon to the urgent task of topographical mapping for the Army. One of the three selected base-lines in the South Island was measured temporarily to provide a more adequate control for the plotting of the topographical map series in the Southland district.
It was expected that the field operations of the geodetic triangulation would be completed in 1948, when all the necessary longitude fixes would have been made. The measurement of the base-lines in the South Island was completed in the 1947 season.
The observational work has been done to an accuracy well within the limits set by the International Association of Geodesy for work of the highest precision.
Second and Third Order Triangulation: It was originally anticipated that the old minor triangulation could be utilized after readjustment to conform to the new first order, but after attempting to do this it was found that larger corrections than could now be tolerated were being introduced into the old work. In some instances this was undoubtedly due to actual displacement of old stations, but in the majority of cases the fault lay in the old triangulation not being of sufficiently high standard. It was therefore necessary to re-observe the old work, and this has been done in three of the circuits to date.
In this way accurate geographical results over New Zealand will be moulded into one harmonious whole on a co-ordinated system and on a basis which gives the correct relation of one part to another, with no possibility of overlapping where different circuits join.
In most districts, over selected areas, the geodetic survey party has simultaneously broken down the first order triangulation into second order and, where necessary, third order triangulation. Until this latter work has been completely related and adjusted to the main network it cannot be brought into general use for land-survey purposes. At present its use is limited to the control of the topographical map series.
Astronomical Positions: Latitude and azimuth observations have been taken in conjunction with the first order triangulation, about one station in every three being so observed. Longitude observations by wireless telegraphy are now being made at stations 100 miles apart, so that in conjunction with latitude and azimuth these stations may be used for Laplace equations to control the entire triangulation.
Precise Levelling: A limited amount of precise levelling has been carried out for the purpose of correlating the level data of irrigation and drainage and other engineering drainage-works. This type of levelling has been carried out in accordance with international standards of accuracy—namely, 002 feet or 024 inches per mile.
These levels are at mean sea-level datum determined from the tidal records of the principal tidal stations or of tide gauges established specially for that purpose. The traverses are referenced at approximately ten-mile intervals by fundamental bench marks and at approximately one-mile intervals by permanent bench marks.
This work must be further extended to meet the requirements of national drainage, irrigation, hydro-electric, and river-control development where related and co-ordinated levels in terms of a fixed datum are essential.
STANDARD SURVEYS.—In order to more adequately correlate and redefine old boundary marks for land-title purposes and to provide a permanent standard of reference for future surveys in cities and boroughs where land values are high and on highways and on main arterial roads where modern road surfaces have eliminated survey marks, a precise survey is carried out, all intersections being referenced with permanent standard marks, normally concrete blocks protected by an iron cover.
These surveys are of two classes—(1) those in the cities and boroughs, being of standard of accuracy of 2 inches to the mile, the cost of which is borne partly by the local authority concerned and partly by the Department, and (2) those carried out on highways and arterial roads to a lesser standard of accuracy for the purpose of referencing survey marks lost or obliterated by road works and surfaces.
These standard traverses will in the future be correlated with precise levelling traverses, thus providing a standard level datum for engineering works.
AERIAL SURVEY AND TOPOGRAPHICAL MAPPING.—The incidence of war emphasized the need for up to-date topographical maps of New Zealand. The use of the aerial photograph for the production of topographical maps had at the same time revolutionized the methods of production requiring the introduction of an entirely new technique.
Up to 1936 several thousand square miles of topographical mapping had been carried out by plane-table methods in scattered localities throughout the country. With the introduction of the aerial photograph for mapping purposes in 1935, a co-ordinated mapping policy was laid down by the Army authorities. A revised map series on a scale of 1 mile to an inch based on an approved map grid was adopted, and an annual output fixed by a co-ordinating committee set up to control the mapping policy of New Zealand.
Two plotting-machines were acquired by the Department, and at the outbreak of war in 1939 an area of 1,000 square miles had been mapped on a scale of 1 mile to an inch in the Hawkes Bay District, one map sheet being published in March, 1939.
During the war period the Department was made responsible for topographical mapping for military purposes. All the available resources of the Department and the services of a private aerial mapping company were concentrated on the production of maps for military purposes. At the 31st March, 1948, the following areas had been mapped:—
1/25000 Series.—A series of maps covering the fortress areas of Auckland, Wellington, Christchurch, and Dunedin, and the training area at Waiouru, were compiled from aerial photographs contoured at 25-foot and 50-foot intervals.
| — | Number of Sheets. | Area (Square Miles). |
|---|---|---|
| Maps published | 35 | 1,070 |
| In hand | 28 | 1,044 |
| Total | 63 | 2,114 |
1/63360 Series.—In accordance with Army priorities, mapping was concentrated in the first place on coastal belt areas that were of military significance and expanded to cover the more settled areas of New Zealand. Fifty per cent. of the area mapped was based on aerial photographs.
| — | Number of Sheets. | Area (Square Miles). |
|---|---|---|
| Maps published | 160 | 46,506 |
| In hand | 25 | 6,836 |
| Total | 185 | 53,342 |
This series now covers 50 per cent. of the area of the country and embraces most of the settled areas.
Owing to post-war activities staff previously employed on topographical mapping are now engaged on other survey work mainly connected with land-settlement. However, arrangements are now in hand to build up field staff so that topographical mapping can again be put in hand and the remaining unmapped area completed.
Extensive use is made of the aerial photographs for other than purely mapping purposes. All types of land and engineering development, investigations into geological resources, afforestation, and town and rural planning are now based on data extracted from the aerial photographs. The Department is responsible for the maintenance of a complete library of aerial photographs which are made available for all national purposes. All orders for photography required by any Department of State are co-ordinated and priorities for such photography fixed by a co-ordinating committee. By such co-ordination it is expected that a basic photographic coverage of the whole country will be completed in the next few years.
Since the war additional plotting equipment for the production of maps from aerial photographs has been acquired, and, as staff is trained and becomes available, mapping operations will be extended to meet all national requirements.
TIDAL SURVEY.—The tidal work carried out by the Department at the commencement of the survey operations in New Zealand consisted of determinations of mean high-water mark (H.W.M.) for the purpose of defining the boundary of land abutting on tidal waters.
Later the adoption of mean sea-level as the datum of reference for the heights shown on the maps of trigonometrical and precise levelling surveys led to a more accurate system of tidal observations being initiated; but it was not until 1909 that a complete tidal survey was inaugurated, at the request of the Admiralty, to include the predictions of the times and heights of high and low water of the ports of Auckland and Wellington in the Admiralty Tide-tables.
The tidal observations are made mainly by self-registering tide-gauges, in which a curve is traced which shows the height of the water at any time above an arbitrary datum. This curve is decomposed, by a process devised by Lord Kelvin, and known as “harmonic analysis,” into its harmonic elements. These components are now computed for the ports of Auckland, New Plymouth, Wellington, Lyttelton, Dunedin, Bluff, and Westport, and from them the predicted times and heights of high and low water are obtained by means of the tide-predictor at the Tidal Institute, University of Liverpool, and published in advance in the “New Zealand Nautical Almanac,” the Admiralty Tide-tables, and several of the maritime publications of foreign nations.
The seven ports for which tide-tables are prepared serve as standards of reference on which to base, by means of tidal difference, the times and heights of high and low water of all the other ports in New Zealand.
GEOGRAPHIC BOARD.—The principal functions of the New Zealand Geographic Board, established under the New Zealand Geographic Board Act, 1946, are as follows:—
To adopt rules of orthography and nomenclature in respect of place-names in New Zealand.
To examine cases of doubtful spelling of place-names, and determine the spelling to be adopted on official maps.
To investigate and determine the priority of the discovery of any geographic feature.
To collect original Maori place-names for recording on official maps.
To determine what alien names appearing on official maps should be replaced by British names.
To investigate and determine any proposed alteration of a place-name.
The Board, which replaced the honorary Geographic Board previously in existence, consists of the Surveyor-General, two representatives of the Maori race, a representative of the New Zealand Geographic Society, a representative of the Federated Mountain Clubs of New Zealand, and two other persons.
MISCELLANEOUS.—The Department, in addition to the activities outlined above, carries out many miscellaneous functions, among which are the drawing of maps and diagrams for special publications, the periodic preparation of maps for census and electoral purposes, the copying of maps and plans by photostat process, the preparation of aerial photograph mosaics and enlargements for departmental purposes, the compilation of maps and data for town and regional planning purposes, the control and administration of the subdivision of land in counties required for housing, the preparation of special topographical maps for land-settlement, engineering and scientific development, the preparation of maps for air navigation requirements, and many other cognate duties requiring the services of the surveyor or the draughtsman.
Recently an agreement has been concluded whereby the Department is responsible for the production of all maps for the Armed Services.
PUBLICATIONS.—Reports: An annual report of the departmental activities is published as a parliamentary paper, C.–1A. At regular intervals a publication called “The Records of the Survey” is issued, the latest volume being numbered five. The publication of professional papers is now discontinued, these being incorporated in the Records.
Maps: The Lands and Survey Department employs a draughting staff specially trained for the purpose of producing maps of various types and scales for publication. A uniform system of lithographic draughting, modelled on the ordnance styles, has been instituted throughout all districts. Gradually the older drawings will be replaced by those drawn in accordance with the uniform system.
The following series of maps are available for sale:—
(1) CADASTRAL MAPS.—(a) Survey District Maps (1 Mile to the Inch): These maps illustrate the “survey districts” into which each meridional circuit is subdivided, being generally square with sides of 1,000 chains length and uniform in size. They are drawn for the purpose of illustrating title boundaries and land designations, being of a cadastral nature, showing sections, areas, roads, streams, and trigonometrical stations.
In all, there are 1,005 survey districts in New Zealand, of which 770 have been drawn and published. The maps not yet published mainly comprise districts which are not closely subdivided or where no detailed surveys have been carried out.
Survey district maps are extensively used by State Departments and the public for illustrating land-title matters and land descriptions.
(b) County Maps (1 Mile to the Inch): These show similar data to that comprised in the survey district series. They vary in size in accordance with the extent and size of the county illustrated. In most cases they are only a reproduction of the survey districts included within the boundaries of the county. Special drawings of county maps are undertaken only when survey district maps are not available for reproduction.
(c) City and Town Maps: Maps of the 12 cities and about 160 of the boroughs, town districts, and towns have been published on scales of 4 to 10 chains to the inch. These maps show all subdivisions and areas. Maps of Wellington, New Plymouth, Napier, Invercargill, and Timaru, showing streets, public buildings, &c., have also been published.
(2) TERRITORIAL MAPS.—(a) 4-Miles-to-the-Inch Maps: This series of thirty-seven sheets covers the whole of New Zealand, each sheet extending for 2° of longitude and 1° of latitude. The projection is a modified conical projection that permits the whole series to be assembled into a homogeneous whole. These maps are uniform in style, showing topographical details, and are excellent maps for general purposes.
(b) 10-Miles-to-the-Inch Maps: These are wall maps showing the North and South Islands separately, two sheets for each. They show towns, topographical features, &c., and the counties are coloured.
(c) 16-Miles-to-the-Inch Map: Also a wall map extensively used for general illustrative purposes. It is published uncoloured and coloured, showing county boundaries.
(d) 1:1,000,000 Scale Map: This series is being drawn as part of the International 1:1,000,000 map (approximately 16 miles to the inch). Three sheets, covering most of the South Island, have been published.
(3) FLYING MAPS.—A series of six maps covering the whole country on a scale of 8 miles to the inch has been published. These maps are specially prepared for aviation purposes.
(4) TOPOGRAPHICAL SERIES.—These maps show contours and all topographical features and are prepared from plane table surveys and aerial photographs. There are two series of these maps. The 1/25000 scale, at present largely covers areas in the vicinity of the main centres—e.g., Auckland, Wellington, Christchurch, and Dunedin. The Waiouru training area is covered by this series also, 35 sheets in all being published.
The 1/63360 series will ultimately cover New Zealand in 350 sheets, and at present 160 of the maps, or approximately 50 per cent. of the total, are now available to the public. Of this number, 73 are in the North Island and 87 in the South Island.
(5) TOPOGRAPHICAL MAP OF NEW ZEALAND (Scale 25 Miles to the Inch).—This map shows general information, and is printed in colour with layer tints of 1,000 ft. intervals to 6,000 ft.
(6) GENERAL AND SPECIAL MAPS.—Maps on various scales besides the foregoing have been published. These comprise a pictorial relief map, and other topographical maps of the whole of New Zealand, or of particular areas.
Table of Contents
NEW ZEALAND is a country specially favoured for primary production. The soil covering is varied in character, a considerable portion of it being of high fertility; but even the poorer soils are largely capable of profitable utilization by reason of the comparatively mild and equable weather conditions. The best grasses and fodder plants flourish in the congenial environment, and the country has gained a world-wide reputation for the quality of its pastures. Numerous streams intersect the country-side and cheap hydro-electric power is available, most farming districts having been reticulated in recent years. Electricity is now put to a variety of uses on the farm, but by far the most important is that of providing power for milking-machinery.
A conspicuous feature of New Zealand farming is that the stock do not require to be stalled in the winter, though the pastures are more or less supplemented by fodder crops in the colder months of the year.
New Zealand is primarily a grazing country, and, while more of the land is every year being given up to the cultivation of fodder crops, its future will, no doubt, be inseparably associated with stock-raising, principally of dairy cattle and of sheep. Though only a little over a century has elapsed since the settlement of New Zealand first began, over 18,000,000 acres of land have been sown down in English grasses.
Grain crops, principally oats and wheat, are grown chiefly in the eastern and southern districts of the South Island. Barley also is grown, but only to a limited extent. Much of the crop of oats produced is chaffed for stock-feeding purposes within the country. Root crops, principally turnips, are grown on a large scale for winter feed and for stock-fattening purposes, more particularly in the South Island. Mangolds are cultivated to an appreciable extent, and farmers realize the great value of lucerne. Ensilage-making, particularly in the stack and trench forms, is a feature in the dairying districts. Also typical of milk-producing operations is the growing of green fodder crops to maintain the milk-supply during the drier months of the year. Thus live-stock in New Zealand are for the most part maintained on food produced on the farm itself.
The North Island.—The North Island of New Zealand is remarkable for the congenial environment it furnishes for many phases of primary production. In very few parts is the winter really severe, and the question of stalling stock during the colder months of the year has not to be considered. It is more a grazing than an agricultural country, and nearly all the crops raised are used for feeding farm stock. The dominant industries are dairying and sheep-farming. The standard of dairy-farming is steadily improving, not only by reason of special fodder being provided for the drier parts of the summer and the colder months of the year, but on account of the fact that the farmer has learned the value of herd testing and culling, and the advantages to be derived from the judicious application of top-dressing fertilizers to pastures, and from rotational grazing.
In various parts of the Island fruitgrowing, principally of apples, pears, and peaches, is carried on extensively. In the northern portion citrus fruits can be successfully produced, and, with the adoption of better storage and marketing methods, lemons in particular are being cultivated on a considerable scale. Both the North and the South Islands have established and normally have carried on an export trade in apples, and to a lesser extent in pears.
The South Island.—The South Island is the portion of New Zealand where agriculture proper was first established, the settlement of the land being greatly facilitated by the fact that on the eastern, southern, and northern portions large fertile plains, rolling downs, and hills were available, devoid of the forests which in a very large portion of the North Island had to be cleared before the land could be utilized by the farmer.
In some sections, particularly in Canterbury, Otago, Southland, and Marlborough, grain-growing is prosecuted on a considerable scale. The Canterbury Plains, extending one hundred and fifty miles north and south and running inland for forty miles from the sea, represent an area of over 3,000,000 acres. This region contains the principal grain-growing areas, wheat and oats being the principal crops. In Otago and Southland oats is the grain principally produced. On some of the richer lands the yield of wheat has reached very high figures, even up to 80 or 90 bushels per acre, while over 100 bushels to the acre have been recorded for crops of oats. In root crops up to 70 tons per acre of turnips have been secured, while the yield of mangolds has frequently reached 90 tons. The growing of the finer wools, and the raising of fat lambs for the frozen-meat industry, are features of primary production in the South Island, while the dairy industry is also well represented, especially in Otago and Southland. The breeding of draught horses of a very fine type is carried on to some extent in certain districts, although, with the increase of mechanical traction for farming operations, this branch of the farming industry is on a declining scale.
While the climate in the southern districts of the South Island is not so genial as that of the northern, there are only a few portions where the winter is at all rigorous. The Nelson district, in the north-west corner of the Island, is noted for its fine climate. Nelson has a sunshine record which is equalled in but few parts of the Temperate Zones. The district is specially suitable for fruitgrowing, which has been developed extensively on commercial lines, and the culture of tobacco-leaf and the hop-vine is well established. At the southern end of the Island, in Central Otago, a peculiar configuration of the country enables fruitgrowing to be prosecuted with great success. The winter is comparatively severe, but the warm summer sun and the comparative absence of wind make it an ideal environment for fruit-growing.
The culture of linen flax, mainly as the result of wartime demands, has recently been established in New Zealand, and certain areas in the South Island have proved to be suited for the production of this valuable crop.
DEPARTMENT OF AGRICULTURE.—Under the control of the Minister of Agriculture, the Department of Agriculture provides a service the main object of which is the advancement of the interests of primary production. Under a Director-General of Agriculture there are Directors of Divisions of Live-stock, Animal Research, Dairy, Extension, and Horticulture.
While the service is primarily educative, it also carries out important inspection work. Under the Live-stock Division, all meat killed at meat-export slaughterhouses and abattoirs is inspected by qualified officers, and periodical inspections are carried out at registered slaughterhouses. The registration of town-milk-supply premises is a function of the Division, and the necessary inspection and supervision are carried out by its officers. A comprehensive service, diagnostic and remedial, is provided in regard to the health of all classes of live-stock. Cattle are examined for tuberculosis and other bovine troubles, and, where necessary, the Department's officers have power to condemn diseased stock. All stock exported and imported is examined by the veterinarians of the Department. Special instruction and advice are given in poultry-keeping, swine husbandry, and wool growing and handling, while other activities include the control of rabbits and noxious-weed destruction.
The Animal Research Division, which was formed in 1939, works in co-operation with the Live-stock, Dairy, and Extension Divisions, and is also in active collaboration with other institutions engaged in animal research, notably the Department of Scientific and Industrial Research, the Cawthron Institute, and Massey and Canterbury Agricultural Colleges. The Division has well-equipped laboratories at Wallaceville and Ruakura, an important function of the former being the provision of a diagnostic service to the officers of the Live-stock Division. A bull-sterility testing service was initiated at Ruakura in 1940–41 and is being availed of to a considerable extent. Investigational work has also been carried out in connection with artificial insemination, and a satisfactory technique has been evolved whereby the use of proven sires can be widely extended by this means as soon as the dairy industry provides the necessary organization. New Zealand's interest in this connection, contrary to the position in most overseas countries, is being concentrated on herd-improvement and not as a method of replacing the bull on the farm.
Instruction in the manufacture of butter, cheese, &c., is given by the Dairy Division. Dairy-produce is inspected and graded prior to shipment, a close supervision being also exercised over the moisture content of butter and cheese, as well as over the weights of such produce; dairy-farm premises are inspected; herd-testing is promoted, and a system of semi-official testing of pure-bred dairy cows is in operation. Milk-samples are tested for dairy companies and farmers. A close liaison is maintained with the Milk Division of the Marketing Department and Dairy Instructors act as field men for the treating-houses.
The Fields and Rural Development Divisions were amalgamated and reorganized as the Extension Division as from 1st August, 1948. The Rural Development Division was established to study farm management and economics, farm engineering, farm forestry, and rural sociology, and to supply statistical, economic, and technical information on primary production. The principal duties of the Fields Division comprised agricultural instruction, the control of experimental areas, advice regarding crops and pastures, grain-grading, hemp-grading, seed-testing, and seed certification. The Rural Development Division and the Fields Division had always worked in close collaboration and the amalgamation of the Divisions has widened the sphere of extension activities of local Instructors in Agriculture and has allowed a wider degree of decentralization in that local research and instruction work of both of the former Divisions is now carried out in each Fields Superintendent's district.
The Horticulture Division is charged with orchard instructional work, instruction to beekeepers and tobacco-growers, and the inspection of fruit and trees imported and offered for sale. It also inspects orchards and apiaries, inspects fruit for export, and grades export honey.
The Department's principal farm establishment is the Ruakura Farm of Instruction at Hamilton, in connection with which a farm training-college for youths is also conducted. The Te Kauwhata Horticultural Station, in the lower Waikato district, is mainly devoted to vine-growing and winemaking. There are also several other smaller experimental and demonstration areas.
The agricultural instructional work covers a comprehensive field, farmers being assisted by visits or by letters of advice. Numbers of farmers also co-operate with the Department in conducting experiments on their farms. A monthly journal, the New Zealand Journal of Agriculture, is published at a low rate of subscription, and bulletins are frequently issued. Any farmer may obtain advice regarding his soil, have seed examined for germination-capacity and purity, milk tested for butterfat content or for the presence of disease, plants identified, and diseases of either animals or plants described and remedies suggested—all these services being rendered free of charge. Among other responsibilities of the Department is the registration of live-stock brands, slaughterhouses, dairies, dairy-factories, fertilizers, orchards, nurseries, market gardens, apiaries, &c.
SUBSIDIES, GRANTS, ETC.—For many years a considerable portion of the vote of the Department of Agriculture was spent in advances, grants, and subsidies to the farming industry. In addition, there was similar assistance from other sources, such as the subsidy to the wheat industry which was formerly paid from the vote of the Department of Industries and Commerce, and assistance to the New Zealand School of Agriculture from the vote of the Education Department.
These subsidies were continued during the war, and the following list shows the most important of those paid in the four financial years ended 31st March, 1948.
| — | 1914–45. | 1945–46. | 1946–47. | 1947–48. |
|---|---|---|---|---|
* Paid from vote “Stabilization.” | ||||
| £ | £ | £ | £ | |
| Carriage of lime | 240,738 | 228,361 | 255,908* | 196,037* |
| Carriage of fertilizers | 161,153 | 192,043 | 383,300* | 334,786* |
| Carriage of farm produce | 78,823 | 83,647 | 81,296* | 52,126* |
| Expenditure, including compensation under Stock Act | 15,425 | 14,586 | 20,822 | 19,743 |
| Expenditure, including compensation under Meat Act | 19,324 | 23,498 | 19,577 | 19,089 |
| Grant to New Zealand School of Agriculture | 33,000 | 51,800 | 66,750 | 78,000 |
| Subsidies to Rabbit Boards | 47,678 | 54,615 | 68,029 | 91,713 |
| Grants to Rabbit Boards | 15,706 | 6,883 | 7,867 | 9,593 |
| Eradication of noxious weeds | 24,735 | 25,365 | 27,023 | 25,601 |
| Cow-testing organizations | 13,771 | 14,474 | 15,000 | 20,000 |
| Destruction of wild pigs | 2,381 | 2,590 | 1,954 | 1,775 |
| Destruction of kea | 242 | 536 | 982 | 627 |
| Assistance to pig industry | 9,624 | 8,727 | 8,843 | 9,921 |
With the outbreak of war the need for subsidies was intensified. First, it was important to prevent the adverse effect which rising costs would have had on production and to give price incentives in certain cases. Secondly, it was desirable to maintain the prices of essential goods within the reach of all consumers and to ensure an equitable system of distribution.
On 15th December, 1942, a comprehensive stabilization policy was evolved for the whole economy. Many of the subsidies previously paid came under the supervision of the Economic Stabilization Commission, which has recommended further subsidies from time to time. Subsidies have, however, been restricted to a minimum and are constantly under review. Before a subsidy is approved a close examination is made of the firm's ability to bear further cost increases and of its efficiency in production.
For convenience, these new subsidies were paid during the war years from the War Expenses Account. Since 1946–47, when departmental estimates were reintroduced, most of the subsidies have been paid from vote “Stabilization,” although they are still administered by the Agriculture, Marketing, or other Departments concerned.
The general subsidies paid to keep down consumer prices were of only indirect benefit to the farmers, but those paid on farm products were naturally of interest to them. In some of these cases subsidies were paid to the producer or merchant to cover higher costs where it would have been undesirable to pass on the costs in price. These include (apart from the subsidy on wheat and flour introduced in 1936) payments to ham and bacon curers, subsidies to butchers, payments to cover the increased cost of producing butter, cheese, and milk for the local market, a premium for eggs passing through egg-floors, and, recently, a subsidy to maintain the cost of wool to local mills at 1941–42 levels. As, however, these are more in the nature of consumer subsidies they have been omitted from the following table of payments in the four financial years 1944–45 to 1947–48 of certain direct farm subsidies which were begun during the war.
| — | 1944–45. | 1945–46. | 1946–47. | 1947–48. |
|---|---|---|---|---|
| Fertilizers— | £ | £ | £ | £ |
| Superphosphate (including sacks) | 2,004,839 | 2,205,434 | 2,626,604 | 1,228,088 |
| Basic slag | 48,044 | 64,578 | ||
| Heskett basic slag | 12,796 | 72,338 | 46,541 | |
| Tobacco fertilizers | 240 | 2,095 | 1,102 | |
| Stock and poultry foods— | ||||
| Maize | 5,434 | 19,341 | 18,979 | |
| Wheatmeal | 42,000 | |||
| Pig crops | 100,008 | 113,163 | 130,348 | |
| Hides | 81,441 | 35,000 | 52,833 | |
| Pelts and woolly sheep-skins | 76,236 | 44,547 | 43,888 | 58,319 |
| Cornsacks | 144,000 | 153,198 | 63,697 | 31,355 |
| Jute woolpacks | 27,444 | 17,531 | 8,424 | 16,951 |
| Milking-machine parts | 4,582 | 9,135 | 49 | |
| Fruit industry | 170,903 | 169,982 | 382,968 | 26,205 |
| Fruit-cases | 6,320 | 8,446 | 26,503 | 22,357 |
| Cow-covers | 15,400 | 21,097 | 28,025 | 19,298 |
| Sheep-dip | 20,208 | 25,445 | 34,796 | 19,741 |
| Potatoes and onions | 33,116 | 35,593 |
Payment of these subsidies in the early war years was made with the general agreement of the farmers. Since the agreement between the Farmers' Federation and the Minister of Marketing on 18th June, 1943, subsidies on the proportions of farm-cost commodities used by the dairy and meat industries have been recoverable from the appropriate stabilization accounts, which are built up by increases of export prices over costs. Under this agreement, recoveries of farm subsidies from stabilization accounts have compared as follows with the total of direct farm subsidies (excluding the subsidies on wheat, potatoes, and onions).
| — | 1942–43. | 1943–44. | 1944–45. | 1945–46. | 1946–47. | 1947–48. |
|---|---|---|---|---|---|---|
| £(000) | £(000) | £(000) | £(000) | £(000) | £(000) | |
| Farm subsidies (March years) | 1,314 | 1,996 | 2,902 | 3,237 | 4,109 | 2,399 |
| Recoveries (from farm stabilization accounts) (July years) | 26 | 1,548 | 2,476 | 2,539 | 2,712 | 755 |
GROSS FARMING INCOME.—Farming occupies such an important position in the economic structure of New Zealand that statistical information relating to farm-production is vested with special interest. The agricultural and pastoral statistics, which form the subject-matter of the next two subsections, deal mainly with the quantitative aspects of farm production; while, from these statistics and from cognate statistics for other industries, estimates are made of the value of commodity production as a whole—including farm production (vide Section 47). Various other classes of official statistics—for example, prices index numbers—throw some light on the economic position of the farming industry.
Statistics of quantitative farm production and prices received by farmers constitute the basic data used in the computation of estimates of aggregate receipts from sales of farm-produce. The figures do not purport to show the aggregate net income from farming after all expenses of farm operations have been met. They are intended to afford an indication of the income available to farmers as a whole to meet current expenses of farm-operation, living costs, interest payments, and all other costs. The estimates have recently been revised to take into account the real income or loss represented by changes in the numbers of live-stock on farms as between the various years.
Except in the cases indicated in the next paragraph, no attempt has been made to exclude from the scope of the compilations that portion of marketable farm-produce which may be consumed on the farm. Similarly, that portion of farm-produce which is sold to other farmers as material for further farm-production is in general included. For example, the value of production of grass-seeds is included under the heading “Agricultural Produce,” although—except for exports—almost the whole of this crop is used for the sowing or renewal of pasture lands. An exception, however, occurs in the case of stud stock sold for breeding purposes, no data being available on which to base an estimate of the aggregate annual value of such sales. With this exception, the totals shown for all farm-produce thus represent the total income (including receipts from sales to other farmers), plus certain allowances for farm-produce used on the farm. On the other hand, products of kitchen-gardens and of other activities more intimately associated with the home than with the farm do not come within the ambit of this inquiry.
Production of green-fodder crops, turnips, and mangolds is not included. The view taken is that production of these crops is a normal and essential part of farm routine to be regarded more in the nature of a farm cost than as production of a saleable commodity. Consequently, the unknown—but, it is believed, very small—proportion sold of the total production of this class of farm-produce is omitted from the totals shown. In the case of production of grasses and clovers, it is arbitrarily assumed that 20 per cent. where cut for hay, and 5 per cent. where cut for ensilage, and in the case of chaff 25 per cent., of the total crop comes within the scope of this inquiry, the remainder being omitted for reasons similar to those advanced in the case of green fodder, &c.
The division into the three groups—(1) Agricultural, (2) Pastoral, and (3) Dairying, Poultry, and Bees—has been made entirely on the basis of the nature of the produce.
The principal items included in the agricultural group are wheat, oats, and other grain crops, grass-seeds, potatoes, onions, tobacco, linen flax, orchard-produce, and produce of market-gardens, nurseries, hop-gardens, &c. The prices at which the various commodities are valued are, in general, the prices received by farmers in the early months of the year, when the crops are harvested.
The estimated cost of sacks, cases, and other containers is excluded, as also are transport charges from farm to market and commission on sales. The fact that the cost of containers is excluded might be regarded as a departure from the general practice adopted in this computation of omitting to take account of costs incurred on the farm. It should be noted, however, that price quotations for some important classes of agricultural produce—e.g., wheat—are in ordinary commercial practice on a “sacks extra” basis, so that the exclusion of the value of containers in the case of other crops has the merit of consistency.
The principal items included in the pastoral group are live-stock and wool-production. Slaughterings of live-stock have been assessed on the basis of values (alive) at freezing-works, deductions being made to cover the cost of transport from farm to works, saleyards, &c., and of commission on sales of live-stock. The value of store stock or young lambs sold by one farmer to another is counted only once—that is, when sold for slaughtering as fat stock.
It should be mentioned that the value of all live-stock production, including pigs, is included in the pastoral group, although pig-production is largely an adjunct of dairying.
Wool-production is valued at the average prices realized at sales or appraisals held during each season, the aggregate arrived at representing the value of wool produced in each season at average sale or appraisal prices ruling during that season. No adjustments are made to cover the unknown increase or decrease in the total ultimate return from the season's production duo to higher or lower prices realized for wool carried over and sold in a subsequent season. Deductions have been made to cover the cost of transport of wool to selling centres, and of woolpacks.
The estimates for the pastoral group have now been revised to take into account the value of real income represented by changes in the numbers of live-stock held on farms, which in individual years may represent a marked accretion or reduction in terms of real income.
The largest individual item included in the dairying, &c., group is the pay-out to suppliers by butter, cheese, and dried milk, &c., factories during each of the dairy seasons shown. An estimate of the value of human consumption of raw milk (at farm-gate prices) is also included, together with the value of butter produced on farms for home use or for sale. The available data permit of only a rough estimate of the value of poultry-products, which, with bee-products, are included in this group mainly for purposes of convenience.
The following table shows figures of gross farming income (in millions of £N.Z.) arrived at for each twenty production years for which the information is available.
| Production Year. | Agricultural Produce. | Pastoral | Produce. | Produce of Dairying, |
|---|---|---|---|---|
| £(m.) | £(m.) | £(m.) | £(m.) | |
| 1928–29 | 7.3 | 35.8 | 25.5 | 68.6 |
| 1929–30 | 7.4 | 29.4 | 24.4 | 61.2 |
| 1930–31 | 6.7 | 18.9 | 17.9 | 43.5 |
| 1931–32 | 6.5 | 14.6 | 17.4 | 37.9 |
| 1932–33 | 6.9 | 14.6 | 16.5 | 38.0 |
| 1933–34 | 7.0 | 24.8 | 17.8 | 49.6 |
| 1934–35 | 6.0 | 22.3 | 18.3 | 46.6 |
| 1935–36 | 7.4 | 27.7 | 23.9 | 59.0 |
| 1936–37 | 7.2 | 39.5 | 27.9 | 74.6 |
| 1937–38 | 7.3 | 34.0 | 29.8 | 71.1 |
| 1938–39 | 8.2 | 29.9 | 30.8 | 68.9 |
| 1939–40 | 9.4 | 31.2 | 33.8 | 74.4 |
| 1910–41 | 9.6 | 39.9 | 36.6 | 86.1 |
| 1941–42 | 10.6 | 38.5 | 35.1 | 84.2 |
| 1942–43 | 12.0 | 39.0 | 33.9 | 84.9 |
| 1943–44 | 13.4 | 38.6 | 33.2 | 85.2 |
| 1944–45 | 14.8 | 46.0 | 40.0 | 100.8 |
| 1945–46 | 14.5 | 45.6 | 36.4 | 96.5 |
| 1946–47 | 15.0 | 53.5 | 44.9 | 113.4 |
| 1947–48 | 15.0 | 69.0 | 52.1 | 136.1 |
Index numbers have also been compiled showing the movements in volume of farm production. For the compilation of these index numbers, a computation has been made for each of the seasons 1928–29 to 1947–48 showing what the aggregate annual value would have been had 1938–39 prices been constant throughout the period. From the resultant aggregates, index numbers have been compiled which measure the movements in the volume of production; for, since prices were assumed to be constant, volume is the only variable factor in the aggregates. The volume indices of farm production entering into gross farming income have been revised and now cover the same items as the volume of farm production series which is quoted in Section 47 of this Year-Book. The index numbers of volume of agricultural and dairy production remain unaltered, but the coverage of the pastoral production series has been widened to include an allowance for changes in the numbers of live-stock on farms.
In the following table, index numbers of value and volume on the base: 1938–39 (= 100) are given, and these give a clearer idea of the extent of year-to-year changes.
| Production Year. | Agricultural. | Pastoral. | Dairying, &c. | All Farm Produce. | ||||
|---|---|---|---|---|---|---|---|---|
| Value. | Volume. | Value. | Volume. | Value. | Volume. | Value. | Volume. | |
| 1928–29 | 89 | 107 | 120 | 79 | 83 | 72 | 100 | 79 |
| 1929–30 | 90 | 105 | 98 | 83 | 79 | 78 | 89 | 83 |
| 1930–31 | 82 | 113 | 63 | 79 | 58 | 80 | 63 | 84 |
| 1931–32 | 79 | 105 | 47 | 79 | 56 | 83 | 55 | 84 |
| 1932–33 | 84 | 136 | 49 | 86 | 54 | 96 | 55 | 96 |
| 1933–34 | 85 | 119 | 83 | 91 | 58 | 102 | 72 | 99 |
| 1934–35 | 73 | 104 | 75 | 90 | 59 | 99 | 68 | 96 |
| 1935–36 | 90 | 123 | 93 | 93 | 78 | 104 | 87 | 101 |
| 1936–37 | 88 | 111 | 132 | 97 | 91 | 109 | 108 | 104 |
| 1937–38 | 89 | 106 | 114 | 101 | 97 | 105 | 103 | 104 |
| 1938–39 | 100 | 100 | 100 | 100 | 100 | 100 | 100 | 100 |
| 1939–40 | 115 | 119 | 104 | 93 | 110 | 107 | 108 | 102 |
| 1940–41 | 117 | 126 | 133 | 114 | 119 | 115 | 125 | 116 |
| 1941–42 | 129 | 128 | 129 | 110 | 114 | 109 | 122 | 111 |
| 1942–43 | 146 | 139 | 130 | 106 | 110 | 102 | 123 | 108 |
| 1943–44 | 163 | 148 | 129 | 102 | 108 | 96 | 124 | 105 |
| 1944–45 | 180 | 160 | 154 | 110 | 130 | 105 | 146 | 113 |
| 1945–46 | 177 | 142 | 153 | 113 | 118 | 92 | 140 | 107 |
| 1946–47 | 183 | 152 | 179 | 108 | 146 | 102 | 165 | 110 |
| 1947–48 | 183 | 144 | 231 | 114 | 169 | 104 | 198 | 113 |
A high point for volume of farm production was reached in 1940–41, but the high point for value was readied in 1947–48.
The record level of farm production as a whole as measured by the gross farming income index for 1947–48 results from increased unit values for farm-produce rather than volume of output or production.
From the aggregate values compiled for the purpose of measuring movements in the value and volume of farm production, the following estimates (shown in the form of percentages of total farm production) of the relative contribution of agricultural, pastoral, and dairying, &c., production to total farm production have been computed.
| Production Year. | Agricultural. | Pastoral. | Dairying, Poultry, and Bees. | All Farm Produce. | ||||
|---|---|---|---|---|---|---|---|---|
| Value. | Volume. | Value. | Volume. | Value. | Volume. | Value. | Volume. | |
| 1928–29 | 11 | 15 | 52 | 45 | 37 | 40 | 100 | 100 |
| 1929–30 | 12 | 14 | 48 | 45 | 40 | 41 | 100 | 100 |
| 1930–31 | 15 | 15 | 43 | 43 | 42 | 42 | 100 | 100 |
| 1931–32 | 17 | 14 | 37 | 43 | 46 | 43 | 100 | 100 |
| 1932–33 | 18 | 16 | 38 | 41 | 44 | 43 | 100 | 100 |
| 1933–34 | 14 | 14 | 50 | 42 | 36 | 44 | 100 | 100 |
| 1934–35 | 13 | 12 | 48 | 43 | 39 | 45 | 100 | 100 |
| 1935–36 | 13 | 14 | 47 | 42 | 40 | 44 | 100 | 100 |
| 1936–37 | 10 | 12 | 53 | 42 | 37 | 46 | 100 | 100 |
| 1937–38 | 10 | 12 | 48 | 44 | 42 | 44 | 100 | 100 |
| 1938–39 | 12 | 11 | 43 | 45 | 45 | 44 | 100 | 100 |
| 1939–40 | 13 | 13 | 42 | 41 | 45 | 46 | 100 | 100 |
| 1940–41 | 11 | 12 | 46 | 45 | 43 | 43 | 100 | 100 |
| 1941–42 | 13 | 13 | 46 | 45 | 41 | 42 | 100 | 100 |
| 1942–43 | 14 | 15 | 46 | 44 | 40 | 41 | 100 | 100 |
| 1943–44 | 16 | 16 | 45 | 44 | 39 | 40 | 100 | 100 |
| 1944–45 | 15 | 16 | 46 | 44 | 39 | 40 | 100 | 100 |
| 1945–46 | 15 | 15 | 47 | 48 | 38 | 37 | 100 | 100 |
| 1946–47 | 13 | 16 | 47 | 44 | 40 | 40 | 100 | 100 |
| 1947–48 | 11 | 14 | 51 | 46 | 38 | 40 | 100 | 100 |
THE SPREAD IN PRICE LEVELS.—The statistics quoted under the previous headings illustrate the growth in farm production since the 1928–29 season, and the changes in gross farming income. While the fall in gross farming income between 1928–29 and 1932–33, despite a considerably enhanced volume of farm production, suggests in itself a period of difficulty for the fanning community, the divergence between price-levels of farm-products, most of which are sold in overseas markets, and internal price-levels generally is the real crux of the agrarian problem in time of depression. Prices of farm-products are particularly sensitive, since the demand for and the supply of most products of the soil are not easily equated. Changing demand conditions for farm-products do not readily result in compensatory supply changes, nor do changing supply conditions readily bring about compensatory demand changes. The slack is normally taken up through fluctuating prices. On the other hand, the cost of debt charges does not fluctuate so readily, while prices of services and of manufactured goods in normal times are also less sensitive than prices of farm-products.
FARM PRODUCTION: EXPORTS AND NEW ZEALAND CONSUMPTION.—Estimates of the relative importance of exports and of consumption within New Zealand in the disposal of farm-produce have been compiled by utilizing the statistics of gross farming income, in conjunction with statistics of trade in farm-products.
In the discussion covering the statistics of gross farming income it is explained that these estimates were framed on the basis of “on the farm” values in order that, they might indicate the gross receipts by the farmer, after making provision for transport charges and other expenses incurred in the marketing of produce.
In compiling the statistics of the relative importance of the New Zealand market and of export markets for farm-products, the value of exports has been assessed at the “farm” value of the commodities concerned, and not at the f.o.b. declared value for export. This adjustment has been made in order to ensure that both sets of statistics from which the comparison is made are on the same value basis. It will be realized, then, that the statistics of value given in this statement indicate the gross returns to the farmer from farm-products exported and from consumption of such products within New Zealand. With the revision of the estimates of gross farming income to include changes in the number of live-stock on farms, the necessary but somewhat arbitrary adjustment has been made to the Now Zealand consumption figure for the purposes of this analysis and the following table.
The statistics of the return to the farmer in respect of Now Zealand consumption of farm-produce have been obtained by deducting exports from total production. In these compilations exports of milk-products have been converted to a butterfat equivalent, the return to the farmer being computed on the basis of butterfat pay-out; while the slaughterings represented by exports of meat products have been taken as the basis on which to estimate the farmer's receipts from exports of meat. In instances where statistics of stocks are available adjustment has been made for the carry-over from one season to another. It has been assumed that stocks of wool, frozen meat, and butter and cheese carried over are held for export, and that stocks of wheat and oats are subsequently consumed within New Zealand.
Since the estimates of Now Zealand consumption are the residual element in the process of compilation, any lack of correspondence between the statistics of production and of trade will affect the accuracy of these estimates. Statistics of production relate to the production-year for each commodity, or group of commodities, coming within the scope of this investigation. In many instances the production-years do not cover identical twelve-monthly periods, so that the aggregate of production of farm-produce includes statistics for a number of yearly periods ending in different months. Exports during any one year do not consist entirely of commodities produced within the same twelve-monthly period to which the export statistics relate. The effect of these various factors is, however, minimized by taking averages for three seasons rather than individual seasons.
The following table, based on the averages of statistics for three production and three export seasons, shows the division of gross farming income into returns from exports of farm-produce and from consumption of such produce within New Zealand.
| Three Production Years. | Annual Average Gross Farming Income from | Percentages of Gross Forming Income from | |||
|---|---|---|---|---|---|
| Total Production. | Exports. | New Zealand Consumption. | Exports. | New Zealand Consumption. | |
| £(m.) | £(m.) | £(m.) | Per Cent. | Per Cent. | |
| Agricultural Produce | |||||
| 1928–29 to 1930–31 | 7.1 | 0.7 | 6.4 | 10 | 90 |
| 1933–34 to 1935–36 | 6.8 | 0.8 | 6.0 | 12 | 88 |
| 1936–37 to 1938–39 | 7.6 | 0.8 | 6.8 | 11 | 89 |
| 1940–41 to 1942–43 | 10.7 | 1.0 | 9.7 | 9 | 91 |
| 1941–42 to 1943–44 | 12.0 | 1.9 | 10.1 | 16 | 84 |
| 1942–43 to 1944–45 | 13.4 | 3.3 | 10.1 | 25 | 75 |
| 1943–44 to 1945–46 | 14.2 | 3.6 | 10.6 | 25 | 75 |
| 1944–45 to 1946–47 | 14.8 | 3.3 | 11.5 | 22 | 78 |
| Pastoral Produce | |||||
| 1928–29 to 1930–31 | 28.0 | 18.6 | 9.4 | 66 | 34 |
| 1933–34 to 1935–36 | 24.9 | 19.3 | 5.6 | 78 | 22 |
| 1936–37 to 1938–39 | 34.4 | 26.8 | 7.6 | 78 | 22 |
| 1940–41 to 1942–43 | 39.2 | 33.1 | 6.1 | 84 | 16 |
| 1941–42 to 1943–44 | 38.8 | 33.1 | 5.7 | 85 | 15 |
| 1942–43 to 1944–45 | 41.2 | 35.2 | 6.0 | 85 | 15 |
| 1943–44 to 1945–46 | 43.5 | 36.7 | 6.8 | 84 | 16 |
| 1944–45 to 1946–47 | 48.4 | 41.4 | 7.0 | 86 | 14 |
| Dairying, Poultry, and Bees | |||||
| 1928–29 to 1930–31 | 22.6 | 15.2 | 7.4 | 67 | 33 |
| 1933–34 to 1935–36 | 20.0 | 14.7 | 5.3 | 73 | 27 |
| 1936–37 to 1938–39 | 29.5 | 20.4 | 9.1 | 69 | 31 |
| 1940–41 to 1942–43 | 35.2 | 22.9 | 12.3 | 65 | 35 |
| 1941–42 to 1943–44 | 34.0 | 21.2 | 12.8 | 62 | 38 |
| 1942–43 to 1944–45 | 35.7 | 23.0 | 12.7 | 64 | 36 |
| 1943–44 to 1945–46 | 36.5 | 24.2 | 12.3 | 66 | 34 |
| 1944–45 to 1946–47 | 40.4 | 27.4 | 13.0 | 68 | 32 |
| All Farm Produce | |||||
| 1928–29 to 1930–31 | 57.7 | 34.5 | 23.2 | 60 | 40 |
| 1933–34 to 1935–36 | 51.7 | 34.8 | 16.9 | 67 | 33 |
| 1936–37 to 1938–39 | 71.5 | 48.0 | 23.5 | 67 | 33 |
| 1937–38 to 1939–40 | 71.5 | 47.8 | 23.7 | 67 | 33 |
| 1938–39 to 1940–41 | 76.5 | 51.8 | 24.7 | 68 | 32 |
| 1939–40 to 1941–42 | 81.6 | 55.0 | 26.6 | 67 | 33 |
| 1940–41 to 1942–43 | 85.1 | 57.0 | 28.1 | 67 | 33 |
| 1941–42 to 1943–44 | 84.8 | 56.2 | 28.6 | 66 | 34 |
| 1942–43 to 1944–45 | 90.3 | 61.5 | 28.8 | 68 | 32 |
| 1943–44 to 1945–46 | 94.2 | 64.5 | 29.7 | 68 | 32 |
| 1944–45 to 1946–47 | 103.6 | 72.1 | 31.5 | 70 | 30 |
Of the total gross farming income during the nineteen production-years 1928–29 to 1946–47, 66 per cent. came from exports of farm-produce, while 34 per cent. was accounted for by consumption of such produce within the country.
MARKETING OF PRIMARY PRODUCE.—Prior to the First World War, internal arrangements for the marketing of primary produce destined for export were the subject of individual negotiation between producers and intermediaries. Organized bulk marketing commenced in 1915 with the establishment of the Imperial Government Supplies Department in Wellington as agent for the New Zealand Government in controlling the export of the various items of primary produce, notably wool, butter, cheese, hides and skins, &c. After the termination of Imperial bulk purchasing by March, 1921, producers of meat and dairy-produce viewed more favourably participation, in some form of common marketing organization, though wool-producers were much less favourably disposed, due to the different circumstances pertaining in regard to overseas markets for wool.
In 1922 and 1923 therefore, attempts to gain at least some of the advantages of organization were apparent in the establishment in the former year of the Meat-producers Board under the authority of the Meat-export Control Act, and of the New Zealand Dairy-produce Control Board in 1924 under the Dairy-produce Export Control Act of the later year mentioned.
The Meat-producers Board arranged for the grading, handling, and storage of meat for shipment and the regulation of shipping, while no valid contract for shipment by exporters could be made without the approval of the Board. This practice continued until in the early stages of the Second World War recourse was again made to bulk purchase between Governments, the Marketing Department taking over the export of meat.
The Dairy Board in a similar manner became responsible for the control of shipping. As an experiment in 1927 it endeavoured to make use of its London office as the sole agent for the sale of butter and cheese, including the fixation of prices by the London agency in conjunction with distributors. This experiment was abandoned shortly thereafter, but a modified form of marketing organization was adopted in the early depression years by the preparation of a list of licensed wholesalers to whom allocations of dairy-produce were made. Further plans for the more complete control of export marketing by the Board were rendered void with the establishment by the Government of the Primary Products Marketing Department (later becoming the Marketing Department) under the Primary Products Marketing Act, 1936. The Department was empowered to acquire primary products and market these either in New Zealand or overseas. During the ensuing period up to the outbreak of war the operations of the Department were confined to dairy-produce, while throughout this period and subsequently payments to butterfat-producers were based on the guaranteed-price scheme. Concurrently with the control of marketing of dairy-produce for export, the Department assumed the responsibility of marketing such products within New Zealand.
The existence of the Marketing Department was thus a factor in achieving a smooth change-over to a system of bulk-purchase agreements between the United Kingdom and New Zealand Governments. This procedure was to remain a dominant feature of marketing during the succeeding years. Shipping and storage difficulties associated with wartime conditions also led to the export of meat becoming a function of the Marketing Department.
In the case of wool, the Government utilized the services of organizations already in existence for the bulk sale of this product. General administration and the financial aspects were dealt with, however, by the Marketing Department.
The Meat Pool, Meat Industry Stabilization, and Dairy Industry Stabilization Accounts received the benefit of price increases occurring during the war years (the first mentioned, of increases in meat prices up to December, 1942; the second, thereafter). The surpluses remaining in the two latter accounts, after payment of subsidies, &c., designed to keep down farm production costs, constituted reserves intended to maintain producer incomes during periods of falling prices and, in the case of the Meat Pool surplus, for the future use of the industry.
In 1947 the Dairy Products Marketing Commission Act was passed, the effect of which was to transfer the marketing of dairy-produce from the Marketing Department to the Dairy Products Marketing Commission (which includes Government and producer representation) established by the Act. The Commission was given the task of determining the guaranteed price to be paid out to producers, while the general conditions to be taken into account in its determination were also specified.
The present position may be summarized as follows: the Dairy Products Marketing Commission negotiates with the overseas buyers—(e.g., United Kingdom Ministry of Food)—in respect of contract prices and quantities of export dairy produce, acquires and provides for the handling of the New Zealand dairy production, determines the guaranteed prices to be paid to local producers for dairy-produce, and regulates the marketing of butter and cheese in New Zealand.
In respect of meat, by arrangement with the Government in early 1948 the Meat-producers Board resumed the regulation of shipping and physical handling of meat and became responsible for the purchase of meat for export and the payment to the freezing companies for such meat. In negotiation of prices, contracts, &c., for the sale of meat and meat products overseas, the representatives of the Board act as advisers in association with the representatives of the New Zealand Government. Meat destined for local consumption is not dealt with by the Meat-producers Board.
The minimum-price system created by the Joint Organization for the disposal of war surplus stocks of wool is continued by the operations of the Wool Disposal Commission, which is prepared to buy at minimum reserve prices wool from current clips offered at public auction but in respect of which prices fail to exceed the reserve fixed. The marketing of wool is carried out by public auction, though a levy on the proceeds of sales is retained and is expended by the Wool Board for the benefit of the industry as a whole.
Bulk Purchase of Primary Produce by United Kingdom Government.—The deterioration in the European situation during 1938 and 1939 had led to the formulation of plans in the United Kingdom and New Zealand for the supply of foodstuffs and other produce in the event of war. These plans, which were put into effect shortly after the outbreak of war, envisaged the United Kingdom Government becoming the sole purchaser of imported foodstuffs, and the Marketing Department becoming the authority in New Zealand responsible for the bulk purchase and shipment of the various food and other products.
In general, the arrangements for the purchase of produce were to continue for the duration of the war and a subsequent period to be agreed upon, except in the case of wool, where the period was fixed for the duration of the war and one season's clip thereafter. The bulk purchases of wool terminated with the sale of the 1945–46 season's clip, but early in 1944 long-term contracts were entered into in regard to butter, cheese, and meat, the period covered in the original agreement being the four production seasons 1944–45 to 1947–48. At the beginning of the 1946–47 season the period of the contracts was extended to 3lst July, 1950, with arrangements to confer in 1948 on the desirability of a further extension. As a result of conferences held in 1948, new long-term agreements were entered into covering the period to the end of the production year which terminates in 1955. These agreements are referred to later under their respective headings.
The principal products which came within this bulk-purchase plan were wool, dairy-produce, meat, tallow, and woolly sheep-skins. A brief history of the contracts entered into in regard to the three main items—wool, dairy-produce, and meat—and of the principal changes that have taken place since the inception of the scheme is contained in the following paragraphs.
Wool.—In the case of wool, the contract commenced with the 1939–40 season's clip and was for the duration of the war and one season's clip thereafter. It was subsequently agreed that the “duration of the war” related to the “global” war, so that, following the cessation of hostilities in August, 1945, the sale of the 1945–46 season's clip marked the end of the contract obligation of the United Kingdom Government. All wool not required for manufacture in New Zealand was covered by the terms of the contract.
The original purchase-price for greasy wool was fixed at 10.55d. sterling per pound f.o.b. This price permitted of an over-all average payment of 12.25d. per pound, in New Zealand currency, to be made to woolgrowers for wool delivered at appraisal warehouses, after allowing for the payments to wool-brokers and wool-appraisers for their services, for costs to f.o.b., and for Marketing Department expenses. The purchase-price for slipe wool was 13.75d. sterling per pound f.o.b., which gave an over-all average payment of 16.9766d. (N.Z.) per pound f.o.b., after allowing for the services of appraisers, Marketing Department's expenses, &c.
Provision was also made for the scouring of certain quantities of wool in New Zealand, payment to be made on a greasy basis, with an allowance of 1½ d. per pound to cover scouring costs and additional handling charges.
In addition to the foregoing, half-profits on subsequent sales of wool outside the United Kingdom were to accrue to the producers. Distribution of profits (if any) was to be made when the accounts for the final season were closed.
The contract made provision for the purchase-prices to be reviewed in May of each year at the instigation of either Government. The prices quoted above remained in force until May, 1942, when the United Kingdom Government announced an increase of 15 per cent, in the ex-store price of wool for the 1942–43 season, not including the additions for storage and handling charges which enter into the total price paid. This raised the appraisal prices to an ex-store over-all average (New Zealand currency) of 14.0875d. per pound for greasy wool and of 19523d. per pound for slipe wool. These rates continued for the 1943–44, 1944–15, and 1945–46 seasons.
In addition to the prices just quoted, the United Kingdom Government paid on greasy wool 0.872d. per pound, being brokers' charges 0.625d., transport and other charges to f.o.b. 0.125d., and Marketing Department costs, including appraisal, 0.122d. On slipe wool the additional amount payable was 0.125d. per pound, being marketing costs, including appraisal.
As a result of the dislocation of normal, trading conditions caused by the war, huge surplus stocks of wool purchased under contract from Australia, South Africa, and New Zealand Lad accumulated by the end of the contract period. The total stocks of United-Kingdom-owned wool b, 30th June, 1945, were estimated at 3,245,000,000 lb., comprised of—
| Pounds (Millions). | |
|---|---|
| 63 per cent. Australian | 2,060 |
| 17 per cent. New Zealand | 540 |
| 20 per cent. South African | 645 |
| Total | 3,245 |
The post-war exportable surpluses of these countries were estimated to average 1,440,000,000 lb. annually, made up of 910,000,000 lb. from Australia, 310,000,000 lb. from New Zealand, and 220,000,000 lb. from South Africa. This amount is approximately the same as the pre-war exportable surplus and may be said to represent the approximate pre-war world consumption of wool from these countries (exclusive of local consumption). On an estimate that consumption of wool originating in the three countries might increase to a level of 20 per cent. above pre-war, the period required to dispose of existing stocks alongside new clips at the estimated rate of future production was estimated at thirteen years from June, 1945.
The problem of dealing with and disposing of the accumulated surplus in a manner that would not detrimentally affect future prospects of the trade has resulted in the formation of a partnership between the Governments of the United Kingdom, Australia, New Zealand, and South Africa. A Joint Organization has been formed and incorporated in England as a private registered company, the capital consisting of eight shares, of which four are held by the nominees of the United Kingdom, two by nominees of the Government of Australia, and one each by nominees of the Governments of New Zealand and South Africa. The company has three subsidiaries acting on its behalf, one in each of the three wool-producing countries. The subsidiary in New Zealand is the New Zealand Wool Disposal Commission established under the Wool Disposal Act, 1945. This Act, which came into force on 1st January, 1946, approved the agreement entered into between the four Governments and established the necessary machinery for the carrying-out of the functions of the Joint Organization in New Zealand.
The Directors of the Joint Organization—the principal company—consist of an independent Chairman appointed by the four Governments jointly, four directors appointed by the United Kingdom (four votes), three by Australia (two votes), and two each by New Zealand and South Africa (one vote each). One of the directors appointed in each case by Australia, Now Zealand, and South Africa is the chairman of the subsidiary in that country, and he is entitled to a vote at any directors' meeting at which he may be present.
The Joint Organization buys, holds, and sells wool as agents for the four Governments. The new wool clips are not acquired by it by way of bulk contracts—the method adopted by the United Kingdom Government during the war—but these, and existing surplus wool, are auctioned as before the war, subject to a system of minimum or reserve prices, at which the Organization itself will buy if no other buyer bids that price or better. Reserve prices are fixed prior to the opening of each wool season, or “at such other times as may be required,” not by the Joint Organization, but by representatives of the four Governments. The price-fixing powers of the Joint Organization are limited to the making of “minor” changes in the general price-level.
Stocks of wool taken over by the Joint Organization for disposal in 1945 amounted to 10,407,000 bales, while the stocks remaining at 30th June, 1949 (inclusive of wool bought at reserve prices), were estimated at 1,718,000 bales. The Now Zealand share of this wool in the two years quoted comprised 1,777,000 bales in 1945 and an estimated 413,000 bales in 1949.
The operating expenses of the Joint Organization are borne equally by the wool-growers and the Joint Organization. The share of the wool-growers is paid from a contributory charge on all sales of current clip wool at auction sales or sales to the Joint Organization at reserve prices. The share of the Joint Organization is met by a deduction from the sales of wool held by it. The rate of the contributory charge in Now Zealand was 7½ per cent, for 1946–47 season, 5 per cent. for 1947–48 and 1948–49, and is to be 2½ per cent. for the 1949–50 season, this percentage being calculated on the sale value of all wool produced in New Zealand. In the case of scoured wool the rate is charged on the greasy equivalent, and in the case of sheep-skins on the value of the wool on the skins.
The following table shows the movement in the average price per pound of greasy wool realized at the 1938–39 New Zealand auctions, through the period of bulk purchasing (1939–40 to 1945–46), and at auction sales held since the termination of bulk purchasing. The reserve prices mentioned earlier are also given for the seasons 1946–47 to 1949–50.
| Season. | Average Price per Pound of Greasy Wool. | Reserve Price per Pound of Greasy Wool. | |
|---|---|---|---|
| Payment to Producers under Bulk Purchasing.* | At Auction Sales. | ||
* After deduction of payments to wool-appraisers, wool-brokers, costs to f.o.b., and administration expenses of Marketing Department. The above prices do not take account of those obtained for wool required for manufacture in New Zealand during the period. † Interim year bulk purchase. | |||
| d. | d. | d. | |
| 1938–39 | 9.17 | ||
| 1939–40, 1940–41, and 1941–42 | 12.25 | ||
| 1942–43, 1943–44, 1944–45, and 1945–46 | 14.0875 | ||
| 1945–46† | 13.88 | ||
| 1946–47 | 18.08 | 16.23 | |
| 1947–48 | 25.60 | 16.23 | |
| 1948–49 | 26.29 | 16.98 | |
| 1949–50 | 16.98 | ||
Dairy-produce.—The contract for dairy-produce commenced with the produce of the 1939–40 season, and the quantities agreed upon were 115,000 tons of butter and 84,000 tons of cheese. The United Kingdom Government also agreed that, subject to shipping space being available, it would endeavour to ship any additional quantities available within the limits of its requirements. The basic price agreed upon for creamery butter was 112s. 6d. sterling per hundredweight finest grade, with specified deductions for lower grades, and 64s. 3d. sterling per hundredweight for finest and first-grade cheese and 62s. 3d. sterling per hundredweight for second-grade cheese. This permitted of an f.o.b. over-all average of 139s. 7¼ d. per hundredweight for butter and 79s. 9d. per hundredweight for cheese (New Zealand currency).
No formal contract was completed for the 1940–41 season, but arrangements were made for 120,000 tons of butter and 107,000 tons of cheese, with prices the same as for the previous season. In addition, although it was not embodied in the contract, an undertaking was reached that the general arrangements for the purchase of dairy-produce were to continue for the duration of the war and for a subsequent period to be agreed upon.
In the publication of the details of the agreement for the 1941–42 season it was stated that for the period of the war and one year thereafter New Zealand would aim to limit production of creamery butter for export to approximately 115,000 tons per annum, this figure to be reviewed annually in the light of storage and shipping situations. The price for 1941–42 was fixed on the same basis as in the previous two years. In regard to cheese, New Zealand was to aim at a production of 160,000 tons annually for the same period as in the case of butter, with a similar proviso in regard to revision of the terms of the agreement. The prices were increased to 70s. sterling per hundredweight and 68s. sterling per hundredweight for first and second grade respectively, the increase being granted to meet costs in Now Zealand of the changeover of supply from butter to cheese manufacture to attain the objective of 160,000 tons of cheese for export.
A reversal of policy was announced at the commencement of the 1942–43 season. Owing to the increase in supplies of cheese from North America, the United Kingdom Government requested that the season's production be reduced to 90,000 tons with a consequential increase in butter-production. In order to meet the costs arising from the change-back from cheese to butter, the United Kingdom Government agreed to an increase of 4s. 6d. sterling per hundredweight for butter and 3s. sterling per hundredweight for cheese. These increases brought the purchase-prices to 117s. and 738. sterling per hundredweight for finest-grade butter and first-grade cheese respectively.
For the 1943–44 season the United Kingdom Government advised that it desired not less than 85,000 tons of cheese and the maximum quantity of butter that could be supplied, and, after making provision for the increased requirements of the United States Armed Forces in New Zealand and the South Pacific Area, it was estimated that from 85,000 to 90,000 tons of cheese and 96,000 to 101,000 tons of butter would be available. During the 1943–44 season, a review of prices took place, and an increase of 26s. 1½ d. sterling per hundredweight of butter and 12s. 6¼ d. sterling per hundredweight of cheese was granted by the United Kingdom Government, the period covered by the increased prices being 1st April, 1943, to 31st July, 1944.
A long-term contract for the purchase of exportable surpluses of butter and cheese was entered into early in 1944. The period of the contract in the first instance was for the four production years 1944–45 to 1947–48, but this was extended in 1946 to cover the 1948–49 and 1949–50 years, with arrangements to confer in 1948 on the desirability of a further extension to 31st July, 1952.
Prices were fixed for the first two years (1944–45 and 1945–46) of the contract period at 150s. 6d. and 89s. sterling per hundredweight for finest-grade butter and first-grade cheese respectively, while provision was made for prices to be reviewed for subsequent years at the instance of either Government on substantial grounds. A review took place in respect of the 1946–47 season, resulting in an increase in price of 24s. 6d. sterling per hundredweight of butter and 13s. 6d. sterling per hundredweight in the case of cheese. The proportions of butter and cheese to be shipped from the production of each season was to be as nearly as possible in accordance with the requirements of the United Kingdom Government, subject to consultation and agreement.
Negotiations in June and July, 1918, between the United Kingdom Ministry of Food and the delegation representing the Dairy Products Marketing Commission resulted in a new long-term agreement (incorporating the unexpired term of the then current contracts) for the period throughout 1948 and up to 31st July, 1955. Agreement was also reached at these discussions in respect of prices for the 1948–49 season, followed by discussions in 1949 at which prices and quantities for the 1949–50 season were agreed upon. The salient features of the 1948 agreement for the ensuing seven-year period were as follows:—
All purchases are to be f.o.b. New Zealand ports and the responsibility for providing shipping for transport rests with the United Kingdom Government.
Payment is to be made in sterling in London as to 97½ per cent. on shipments and as to the remaining 2½ per cent. within sixty days after the date of the last bill of hiding. If the lifting of available supplies is unduly delayed, the United Kingdom Government is to make interim payments.
Prices, terms, and conditions of sale set out in the agreement are to apply throughout the period, unless before the 1st May in each year either party requires reconsideration for the ensuing season. Price variations in any one season are not to exceed 7½ per cent. of the previous season's price.
The United Kingdom Government and the New Zealand Dairy Products Marketing Commission are to consult and agree upon the ratio of butter-production to cheese-production for the season and the quantities of butter and cheese which will be reserved for sale to other countries during the production season.
The agreement for the season 1947–48 had provided that New Zealand was to be at liberty to reserve for sale at her own discretion from that season's production up to 1,500 tons of butter and 1,000 tons of cheese. From this free allocation the Dairy Products Marketing Commission could, and did, sell direct, or through exporters acting as its agents, to other countries for the purpose of maintaining connections in those markets where New Zealand has in the past enjoyed an established trade, and of exploring new markets which are considered to hold prospects of permanent trade in the future. These free allocations are in addition to sales to specified colonies permitted by the United Kingdom Ministry of Food agreements with the Governments of the colonies concerned.
For the 1948–49 season, sales of butter and cheese to the United Kingdom Government, inclusive of the amounts for the colonies as above, will be confined to not less than 97 per cent. of the exportable surplus of butter and cheese, calculated on a butterfat basis. There were no changes from the above quantities involved in the agreement for the 1949–50 season.
The question of long-term contracts for the sale and purchase of the exportable surplus of milk powders were also discussed in 1949 and an agreement reached by which the Ministry of Food undertakes to purchase specified percentages of the exportable surplus of buttermilk powders and skimmed roller milk powder from participating dairy factories for the six-year period 1st August, 1949, to 31st July, 1955.
The following table shows the contract price in sterling per hundredweight of butter and cheese over the period concerned.
| Season. | Butter. | Cheese. | ||||||||||||
|---|---|---|---|---|---|---|---|---|---|---|---|---|---|---|
| Creamery. | Whey. | Finest and First Grade (91 Points and Over). | Second Grade. | |||||||||||
| Finest Grade (93 Points and Over). | First Grade (90–92½ Points). | Second Grade. | First Grade. | Second Grade. | ||||||||||
*Excluded from contract price, as the processing of this butter into dehydrated butterfat in New Zealand for export to the United Kingdom was in view. First-grade butterfat was purchased at 156s. 9d. sterling per hundredweight. In the later season all whey butter was shipped frozen to the United Kingdom, dehydration being discontinued at the request of the Ministry of Food. | ||||||||||||||
| s. | d. | s. | d. | s. | d. | s. | d. | s. | d. | s. | d. | s. | d. | |
| 1939–40 | 112 | 6 | 111 | 3 | 107 | 6 | 104 | 6 | 100 | 6 | 64 | 3 | 62 | 3 |
| 1940–41 | 112 | 6 | 111 | 3 | 107 | 6 | 104 | 6 | 100 | 6 | 64 | 3 | 62 | 3 |
| 1941–42 | 112 | 6 | 111 | 3 | 107 | 6 | 104 | 6 | 100 | 6 | 70 | 0 | 68 | 0 |
| 1942–43 | 117 | 0 | 115 | 9 | 112 | 0 | * | * | 73 | 0 | 71 | 0 | ||
| 1943–44 | 143 | 1½ | 141 | 10½ | 138 | 1½ | * | * | 85 | 6¼ | 83 | 6¼ | ||
| 1944–45 | 150 | 6 | 149 | 3 | 145 | 6 | 142 | 6 | 138 | 6 | 89 | 0 | 87 | 0 |
| 1945–46 | 150 | 6 | 149 | 3 | 145 | 6 | 142 | 6 | 138 | 6 | 89 | 0 | 87 | 0 |
| 1946–47 | 175 | 0 | 173 | 9 | 170 | 0 | 167 | 0 | 163 | 0 | 102 | 6 | 100 | 6 |
| 1947–48 | 205 | 0 | 203 | 9 | 200 | 0 | 197 | 0 | 193 | 0 | 118 | 0 | 116 | 0 |
| 1948–49 | 235 | 0 | 233 | 9 | 230 | 0 | 227 | 0 | 223 | 0 | 133 | 0 | 131 | 0 |
| 1949–50 | 252 | 6 | 251 | 3 | 247 | 6 | 244 | 6 | 240 | 6 | 141 | 6 | 139 | 6 |
Guaranteed Prices for Butter and Cheese.—The fixed prices per pound of butter and cheese for export payable, to dairy factories under the Marketing Act, 1936, and, as from the 1946–47 season, under the Dairy Products Marketing Commission Act, 1947, are as follows, the figures given including total farm- and factory-costs allowances.
| Grading. | Seasons. | |||||||
|---|---|---|---|---|---|---|---|---|
| 1939–40.* | 1943–44. | 1944–45. | 1945–46. | 1946–47. | 1947–48. | 1948–49†. | 1949–50. | |
*These prices remained unchanged for the 1940–41, 1941–42, and 1942–43 seasons. †These prices were increased by 1.1457d. for butter and 0.5226d. for cheese for the last two months (June and July) of the 1948–49 season. | ||||||||
| Creamery Butter. | ||||||||
| Finest— | d. | d. | d. | d. | d. | d. | d. | d. |
| 94 points and over | 15.015 | 16.384 | 18.185 | 19.059 | 21.562 | 23.977 | 24.723 | 25.9944 |
| 93–93½ points (basic grade) | 14.89 | 16.259 | 18.060 | 18.934 | 21.437 | 23.852 | 24.598 | 25.8694 |
| First— | ||||||||
| 92–92½ points | 14.8275 | 16.1965 | 17.9975 | 18.8715 | 21.3745 | 23.7895 | 24.5355 | 25.8065 |
| 90–91½ points | 14.64 | 16.009 | 17.810 | 18.684 | 21.187 | 23.602 | 24.348 | 25.6194 |
| Second | 14.14 | 15.509 | 17.310 | 18.184 | 20.687 | 23.102 | 23.848 | 25.1194 |
| Cheese | ||||||||
| Finest— | ||||||||
| 94 points and over | 8.57625 | 9.35225 | 10.36025 | 10.78425 | 12.08825 | 13.21825 | 13.68225 | 14.40195 |
| 93–93½ points | 8.545 | 9.321 | 10.329 | 10.753 | 12.057 | 13.187 | 13.651 | 14.3707 |
| First— | ||||||||
| 92–92½ points (basic grade) | 8.42 | 9.196 | 10.204 | 10.628 | 11.932 | 13.062 | 13.526 | 14.2457 |
| 91–91½ points | 8.3575 | 9.1335 | 10.1415 | 10.5655 | 11.8695 | 12.9995 | 13.4635 | 14.1832 |
| Second | 8.17 | 8.946 | 9.954 | 10.378 | 11.682 | 12.812 | 13.276 | 13.9957 |
In the 1943–44 season a farm-costs allowance and a factory-costs allowance were made to butter- and cheese-manufacturing companies to cover increases that had taken place in the prices of dairy-farm and dairy-factory requisites, &c. In addition, a factory-labour allowance was granted to cover an increase in the wages of dairy-factory workers. In 1944–15 a farm-labour allowance was introduced to compensate for increased wages-costs on farms. These allowances were increased during the 1945–46 and 1946–47 years. As stated, these allowances have been included in the preceding table.
The prices quoted in the foregoing table enabled efficient dairy companies to pay to suppliers the following amounts in pence per pound of butterfat for butter or for cheese manufacture over the same period. Also given is the average payout to dairy-farmers per pound of butterfat supplied during this period, the amounts shown including farm-costs and farm-labour allowances.
| Season. | Price per Found of Butterfat used for— | |||
|---|---|---|---|---|
| Butter-making (Basic Price). | Cheese-making (Basic Price). | Butter-making (Average Payout). | Cheese-making (Average Payout). | |
*Not yet available. | ||||
| d. | d. | d. | d. | |
| 1939–40, 1940–11, and 1941–42 | 15.880 | 17.880 | 16.087 | 18.060 |
| 1942–43 | 16.490 | 18.490 | 16.569 | 18.577 |
| 1943–44 | 17.257 | 19.257 | 17.597 | 19.655 |
| 1944–45 | 19.377 | 21.377 | 19.790 | 22.055 |
| 1945–46 | 20.394 | 22.394 | 20.568 | 22.884 |
| 1946–47 | 23.391 | 25.391 | 23.691 | 25.753 |
| 1947–48 | 25.907 | 27.907 | 26.218 | 27.943 |
| 1948–19— | ||||
| August, 1948, to May, 1949 | 26.751 | 28.751 | * | * |
| June, 1949, and July, 1949 | 28.146 | 30.146 | * | * |
| 1949–50 | 28.244 | 30.244 | * | * |
The structure of the basic price per pound of butterfat for butter manufacture over the period is given in the next table.
| Season. | Working-costs. | Capital Charges. | Labour Reward. | Total Price per Pound Butterfat. |
|---|---|---|---|---|
| d. | d. | d. | d. | |
| 1938–39 | 5.340 | 3.240 | 8.840 | 15.880 |
| 1939–40 | 5.340 | 3.240 | 8.840 | 15.880 |
| 1940–41 | 5.340 | 3.240 | 8.840 | 15.880 |
| 1941–42 | 5.340 | 3.240 | 8.840 | 15.880 |
| 1942–43 | 5.510 | 3.240 | 9.280 | 16.490 |
| 1943–44 | 6.107 | 3.240 | 9.450 | 17.257 |
| 1944–45 | 6.757 | 3.240 | 10.920 | 19.377 |
| 1945–46 | 7.254 | 3.240 | 11.440 | 20.394 |
| 1946–47 | 8.015 | 3.240 | 13.676 | 23.391 |
| 1947–48 | 10.011 | 3.240 | 14.196 | 25.907 |
| 1948–49— | ||||
| August, 1948, to May, 1949 | 10.179 | 3.240 | 14.872 | 26.751 |
| June, 1949, and July, 1949 | 10.179 | 3.240 | 16.267 | 28.146 |
| 1949–50 | 10.199 | 3.240 | 16.345 | 28.244 |
The total price given in each case is the figure arrived at after adding the three units allowed respectively for farm working and maintenance, capital charges, and labour reward, but after subtracting a return fixed at 1.540d. per pound of butterfat, this being a standard allowance for pigs. The price for butterfat for cheesemaking has been 2d. a pound higher in each year since 1937–38.
Meat.—The quantity of meat agreed upon to be purchased from the production season ended 30th September, 1940, and from the carry-over of the previous season (45,000 tons) was 300,000 tons. This quantity included all classes of meat, also edible offals. In addition, the United Kingdom Government undertook to make every endeavour to provide shipping space for such additional quantities as might be available.
The schedule of prices per pound paid by the United Kingdom Government to the New Zealand Government for the principal classes of frozen meats for the 1939–40 season are shown in the table given later. These prices are on an f.o.b. basis and are expressed in sterling.
The actual liftings of meat for the first contract year were 351,000 tons, leaving a carry-over at 30th September, 1940, of 39,938 tons.
For the 1940–41 season, the contract provided for the purchase of 248,000 tons of meat, shipped or unshipped, from the production season ended 30th September, 1941, and from the carry-over of the previous season. The actual liftings of meat under the second year's contract were 268,650 tons, which left a carry-over of 77,902 tons of export meat. With a few minor exceptions, the prices were the same as those paid for the 1939–40 season.
The contract for the third year (1941–42 season) provided for the purchase of 190,000 tons of frozen meat shipped or unshipped, and 37,150 tons of canned meats. The equivalent in carcase-meat of 37,150 tons of canned meats is 111,500 tons, so that the contract for frozen and canned meats represented a total of 301,500 tons of carcase-meat.
For the calendar year 1943 the United Kingdom Government undertook to purchase up to the total quantity shipped in the calendar year 1942. In arriving at the total tonnages, the calculation included the carcase equivalent of canned meats, dried meat, and also shipments to the Middle East; and, on this basis, the figure of 328,000 tons was arrived at. New Zealand was to provide the maximum quantity possible in the form of canned and dehydrated meats in order to reduce the balance of the 328,000 tons, for which refrigerated space was required, to the lowest possible figure.
For the calendar year 1944 the United Kingdom Ministry of Food undertook to purchase and lift the maximum quantity of meat that New Zealand could make available. New Zealand was asked to take all possible steps to increase production, and it was requested that certain classes of meat which had previously been canned or otherwise disposed of (notably ewe mutton) should be shipped in frozen form. It was estimated that the total quantity of frozen meat which would be shipped to the United Kingdom during the twelve months ended 30th September, 1944, would be approximately 212,617 tons. In addition, deliveries of frozen meat to the United States Joint Purchasing Board were estimated to amount to 43,390 tons, leaving a carry-over of meat for export at 30th September, 1944, of 62,504 tons.
A long-term contract was negotiated covering the period 1944–48 by which the United Kingdom undertook to take the whole of the New Zealand exportable surplus. This agreement was extended to cover the production years 1948–49 and 1949–50, with arrangements to confer in 1948 on the desirability of a further extension of two years. A further agreement was signed in 1948 covering the period October, 1948, to 30th September, 1955, the general scope of this long-term contract for the purchase of the exportable surplus of meat (after providing for domestic consumption and quantities to be mutually agreed upon for supply to other markets) being as follows:—
The arrangement covers the total available supplies of beef, veal, mutton, and lamb, and the frozen sundries and edible offals thereof. All products named are to be as normally graded for export and available for shipment in the period 1st October, 1948, to 30th September, 1955:
During the first four years of the agreement the quantity of pig-meat covered by the contract is to be the total available supplies, the United Kingdom to negotiate in advance the quantities required in the final three years:
The prices are to be reviewed annually, but are subject to a maximum annual variation of 7½ per cent. above or below the previous year's price:
Purchases are to be on an f.o.b. basis, and the responsibility of providing freight rests with the United Kingdom Government. Payment is to be made in sterling in London on the same terms as for dairy-produce (see p. 889):
The United Kingdom Government will progressively resume the importation of chilled beef from New Zealand as and when the shipping position permits.
A review of the contract prices under the bulk-purchase agreements is given in the following table. All prices are in sterling per pound. Where seasons are combined, this indicates that there was no change during the seasons concerned.
| Item. | Season. | ||||||
|---|---|---|---|---|---|---|---|
| 1939–40 and 1940–41. | 1941–42. | 1942–43 and 1943–44. | 1944–45 and 1945–46. | 1946–47 and 1947–48. | 1948–49. | 1949–50. | |
*These price were increased by 0.5d. in the 1943–44 season. | |||||||
| Lambs— | d. | d. | d. | d. | d. | d. | d. |
| Downs (23–36 lb.) | 6.375 | 6.75 | 6.75 | 8.5 | 9.1375 | 10.8375 | 11.6503 |
| Canterbury (23–36 lb.) | 6.3125 | 6.6875 | 6.6875 | 8.4166 | 9.0478 | 10.7312 | 11.5361 |
| Cross broil (23–36 lb.) | 6.1875 | 6.5625 | 6.5625 | 8.25 | 8.8687 | 10.5187 | 11.3076 |
| Seconds (23–36 lb.) | 5.875 | 6.25 | 6.25 | 7.8333 | 8.4208 | 9.9375 | 10.7366 |
| Wethers— | |||||||
| Prime (48 lb. and under) | 4.3125 | 4.5625 | 4.5625* | 5.75 | 6.1812 | 7.3312 | 7.8811 |
| Seconds (56 lb. and under) | 3.6875 | 3.9375 | 3.9375* | 4.9166 | 5.2853 | 6.2687 | 6.7389 |
| Ewes—(64 lb. and under) | 2.75 | 3.0 | 3.0* | 3.6666 | 3.9416 | 4.675 | 5.0256 |
| Quarter beef— | |||||||
| Ox and heifer G.A.Q.— | |||||||
| Hinds | 4.375 | 4.75 | 4.9375 | 5.8333 | 6.2708 | 7.4375 | 7.9953 |
| Fores | 2.5625 | 2.9375 | 3.125 | 3.4166 | 3.6728 | 4.3562 | 4.6829 |
| Ox and heifer F.A.Q.— | |||||||
| Hinds | 3.4375 | 3.8125 | 4.0 | 4.5833 | 4.927 | 5.8437 | 6.2820 |
| Fores | 2.5 | 2.875 | 3.0625 | 3.3333 | 3.5833 | 4.25 | 4.5687 |
| Cow G.A.Q.— | |||||||
| Hinds | 3.25 | 3.625 | 3.8125 | 4.3333 | 1.6583 | 5.525 | 5.9394 |
| Fores | 2.4375 | 2.8125 | 3.0 | 3.25 | 3.4937 | 4.1437 | 4.4545 |
| Pigs— | |||||||
| Porkers— | |||||||
| Full carcases (first qualify) | 6.0 | 6.25 | 7.5 | 8.0 | 8.9 | 10.56 | 11.352 |
| Sides (first quality) | 6.3125 | 6.5625 | 7.875 | 8.4167 | 9.3635 | 11.11 | 11.9422 |
| Baconers— | |||||||
| Full carcases (first quality) | 6.0625 | 6.4375 | 7.725 | 8.0834 | 8.9927 | 10.67 | 11.4702 |
| Sides (first quality) | 6.8125 | 7.1875 | 8.625 | 9.0834 | 10.1052 | 11.99 | 12.8892 |
The prices paid to producers by the packing companies have been drawn up in the form of an “opening schedule” at the beginning of each season by a committee representing producers, processors, and the Marketing Department. Those prices include allowances for skin, wool, and hides, and are therefore adjusted during the season on account of, for example, wool growth. The schedule for the 1939–40 to 1949–50 seasons is given below.
| Item. | Season. | |||||||||
|---|---|---|---|---|---|---|---|---|---|---|
| 1939–40. | 1940–41. | 1941–42. | 1942–43. | 1943–44. | 1944–45. | 1945–46. | 1946–47. | 1947–48 and 1948–49* | 1949–50. | |
*Schedule unchanged from 1947–48 except for holier beef, which rose to 31s. †Canterbury lamb was 8⅛ d. and Seconds (South Island) was 7 ½d. in 1940–41. ‡ From 1947–48 onwards price is given for 720 lb. and under. | ||||||||||
| Price of Lamb, Wether, and Ewe Mutton, in Pence per Pound | ||||||||||
| Lambs— | ||||||||||
| Downs (36 lb. and under) | 8¼ | 8† | 8 3/6 | 8½ | 8½ | 9 | 9½ | 10 | 11⅛ | 11½ |
| Canterbury (36 lb. and under) | ||||||||||
| Crossbred (36 lb. and under) | 8 | 7¾ | 8⅛ | 8¼ | 8¼ | 8¾ | 9¼ | 9¾ | 10⅞ | 11¼ |
| Seconds (36 lb. and under) | 7½ | 7⅜† | 7⅝ | 7¾ | 7¾ | 8¼ | 8¾ | 9⅛ | 9⅞ | 10½ |
| Wethers— | ||||||||||
| Primes (48 lb. and under)— | ||||||||||
| North Island | 5⅛ | 5 | 5¼ | 5¼ | 5¼ | 5¾ | 5¾ | 6½ | 7⅛ | 7½ |
| South Island | 5⅛ | 5 | 5 | 5 | 5 | 5½ | 5½ | 6¼ | 6⅞ | 7¼ |
| Seconds (56 lb. and under)— | ||||||||||
| North Island | 4⅜ | 4¼ | 4½ | 4½ | 4½ | 5¼ | 5¼ | 5¾ | 6⅜ | 6¾ |
| South Island | 4⅜ | 4¼ | 4¼ | 4¼ | 4¼ | 5 | 5 | 5½ | 6⅛ | 6½ |
| Ewes (64 lb. and under) | 3⅛ | 3 | 2⅝ | 2⅝ | 3⅛ | 3⅝ | 3⅝ | 4⅛ | 4¾ | 5⅛ |
| Price, in Shillings and Pence, per 100, of Beef | ||||||||||
| Quarter beef— | ||||||||||
| Ox— | ||||||||||
| G.A.Q. (840 lb. and under)‡ | 32 6 | 34 0 | 34 0 | 34 0 | 34 0 | 40 0 | 42 0 | 46 0 | 51 0 | 57 0 |
| F.A.Q. (all weights) | 27 6 | 29 0 | 29 0 | 29 0 | 29 0 | 35 0 | 37 0 | 40 0 | 43 0 | 49 0 |
| Heifer— | ||||||||||
| G.A.Q. (840 lb. and under)‡ | 32 6 | 32 6 | 32 6 | 33 0 | 33 0 | 39 0 | 41 0 | 45 0 | 50 0 | 56 0 |
| F.A.Q. (all weights) | 27 6 | 27 6 | 27 6 | 28 0 | 28 0 | 34 0 | 36 0 | 39 0 | 42 0 | 48 0 |
| Cow, G.A.Q. (all weights) | 25 6 | 26 6 | 26 6 | 27 6 | 27 6 | 33 6 | 35 6 | 38 6 | 41 6 | 47 6 |
| Boner beef | 22 0 | 25 6 | 15 6 | 20 0 | 22 0 | 23 0 | 23 0 | 26 0 | 28 6 | 34 0 |
THE NEW ZEALAND DAIRY BOARD.—In view of recent changes in the control of marketing, &c., of dairy-produce, the following brief account of the history and functions of the New Zealand Dairy Board may be of interest.
The Dairy-produce Export Control Act, 1923, provided for the establishment of the New Zealand Dairy-produce Control Board, consisting of twelve members. The Board commenced operations in 1924, its function at that time being the control of export marketing of dairy-produce. After preliminary investigations and a short period of active participation in marketing, it relinquished that field to private enterprise, but maintained control of shipping of produce, advertising, and insurance. From 1927 onwards the Board additionally served the dairy industry by disseminating information regarding shipments, prices and stocks of dairy-produce in different parts of the world, and by encouraging dairy research and improvement in the quality of export produce. In 1934 a direct interest in marketing was resumed by supervision through the London office of the Board.
Under the Agriculture Emergency Powers Act, 1934, introduced following the report of the Dairy Industry Commission which investigated the affairs of the dairy industry in that year, the name of the Board was changed to the New Zealand Dairy Board. Its membership was limited to seven, and authority was given to regulate and control the production of dairy-produce in New Zealand and the handling, marketing, transport, and distribution of dairy-produce intended for consumption in New Zealand.
The reorganized Board of 1935 prepared comprehensive plans for both local and export marketing of dairy-produce and also co-operated with the Government in the zoning of supply to dairy companies in order to avoid overlapping. As a result of these activities many proprietary dairy companies were bought out and the industry became almost wholly co-operative. The marketing plan was to have been brought into operation as from 1st August, 1936, but with the change of Government in November, 1935, the Marketing Department was established under the Primary Products Marketing Act, 1936, which also altered the constitution of the Dairy Board.
The Government took over practically the whole organization of the Board, and provided that after 31st July, 1936, the Board would exercise its functions only with the approval of the Minister of Marketing. The number of members was reduced to five, one member being elected by votes of dairy companies in each of the Northern, Middle, and Southern Wards respectively, one being appointed as representative of the New Zealand Co-operative Dairy Co., Ltd., and one being appointed by the Government. Voting was based on one vote per ton of butter or 2 tons of cheese or per 2,000 lb. of butter-fat comprised in any other manufactured product of milk or cream in the annual output of each dairy company. Since the marketing functions of the Board were transferred to the Marketing Department the Board has, after consultation with the Dairy Industry Council (which embraces members of the Board and representatives of the National Dairy Federation, South Island Dairy Association, and Dairy Section of Federated Farmers), represented the industry in negotiations with the Government regarding the guaranteed price, and has also been given other functions in connection with the affairs of the dairy-farming industry, such as the control of herd recording and the general policy of herd improvement, and investigation of problems of production, including nutrition, breeding, fertility, disease, and artificial insemination.
The Board collects general statistical information of interest and value to the dairy industry and is directly represented on the Council of Statistics set up by the Government. It shares with the Government the management and finance of the Dairy Research Institute and also shares with the Government and the Meat and Wool Boards the control of the Veterinary Services Council.
The Board is also represented on the New Zealand Moat-producers Board, the National Pig Council, the New Zealand Bobby Calf Pools Central Executive, the Dairy Factory Managers' Registration Board, and on committees recently set up to examine now buttermaking processes and mechanical improvements in cheese-manufacture.
The Dairy Board also selects three members to be appointed by the Minister to the Dairy Products Marketing Commission and also consults with the Minister regarding the appointment of a Chairman of the Commission.
Under the Dairy Factory Supply Regulations 1936 the Board is made responsible for administration of the regulations governing zoning of supplies of milk and cream to manufacturing dairies.
The Dairy-produce Amendment Act, 1948, provided for the reconstitution of the Board as from 1st July, 1949, and for a membership of eight persons, to consist of one Government appointee, two appointees of the New Zealand Co-operative Dairy Co., Ltd., one elected representative each of North Auckland, South Auckland (excluding New Zealand Co-operative Dairy Co., Ltd.), Taranaki, Wellington (including portions of Hawkes Bay, Marlborough, and Nelson), and one elected representative of the remaining portion of the South Island.
This alteration has been provided to give effect to the expressed wish of the dairy industry to have an administrative head composed of sufficient members to give geographical coverage of the country and maintain efficient contact with dairy companies and with the various associated and subsidiary organizations in which the Board is interested.
FARM MACHINERY ON OCCUPIED HOLDINGS.—The following table contains a summary of farm machinery employed on holdings outside borough boundaries at 31st January in each of the years shown. This information was not collected during the, three years 1943–45.
| — | 1938. | 1939. | 1942. | 1946. | 1947. | 1948. |
|---|---|---|---|---|---|---|
*Not available. †This Item covers only those machines actually used for threshing wheat or oats during the year specified. | ||||||
| Milking-machines | 28,192 | 28,970 | 31,487 | 31,805 | 32,596 | 33,461 |
| Cream-separators | 56,643 | 55,665 | 54,107 | 47,783 | 48,194 | 48,457 |
| Shearing-machines— | ||||||
| Plants | 9,680 | 10,064 | 11,555 | 13,554 | 14,564 | 15,468 |
| Stands | 25,685 | 26,063 | 28,611 | 32,167 | 33,907 | 35,448 |
| Agricultural tractors | 8,031 | 9,639 | 13,967 | 18,940 | 21,156 | 23,423 |
| Rotary hoes and garden tractors | * | * | 813 | 1,224 | 1,646 | 2,253 |
| Electric motors | 46,100 | 51,344 | 85,699 | 76,964 | 82,721 | 88,282 |
| Internal-combustion engines | 22,573 | 22,601 | 23,882 | 21,473 | 23,109 | 24,922 |
| Threshing-machines† | 675 | 740 | 1,129 | 1,520 | 1,641 | 1,708 |
The principal features disclosed by the figures in the foregoing table are the steady increase in the number of milking-machines up to 1942, with a further expansion in the last two years; the decrease in the number of cream-separators, between 1939 and 1946; and the phenomenal increase in the numbers of agricultural tractors, electric motors, and threshing-machines. The increase in the case of the latter is accounted for by a change in harvesting practice, the mobile header harvester having largely supplanted the stationary threshing-mill.
Milking-machines.—Information concerning milking-machines on farms was first collected in 1919, in which year there were 7,577 stands recorded. Since that date the use of milking-machines has expanded rapidly, although, as might be expected, the rate of increase was slowed down somewhat during the war period. During the six years from 1933 to 1939 milking-machines increased at an average rate of 770 per year, while during the six-yearly period 1940–46, the average increase was 430 per year. The subsequent two years showed increases of 791 and 865 respectively. The number of cows in milk on holdings employing milking-machines in 1948 was 1,574,339, which is 91.9 per cent. of the total number of cows in milk. In 1938 the corresponding percentage was 80.0.
The following table shows for the years 1940 and 1948 the number of farms with milking-machines, and the aggregate cow-capacity thereof, classified according to size of plant—i.e., cow-capacity.
| Number of Machines. | Individual Cow-capacity. | Number of Farms. | Aggregate Cow-capacity. | ||
|---|---|---|---|---|---|
| 1940. | 1948. | 1940. | 1948. | ||
| One | 1 | 288 | 909 | 288 | 909 |
| 2 | 6,320 | 7,428 | 12,640 | 14,856 | |
| 3 | 9,040 | 8,854 | 27,120 | 26,562 | |
| 4 | 8,684 | 9,464 | 34,736 | 37,856 | |
| 5 | 1,584 | 1,813 | 7,920 | 9,065 | |
| 6 | 1,60.8 | 2,612 | 9,048 | 15,672 | |
| 7 | 36 | 97 | 252 | 679 | |
| 8 | 139 | 600 | 1,112 | 5,280 | |
| 9 and over | 45 | 136 | 482 | 1,444 | |
| Totals, one machine | 27,644 | 31,973 | 93,598 | 112,323 | |
| Two | 739 | 597 | 5,552 | 4,977 | |
| Three | 83 | 53 | 957 | 683 | |
| Four | 22 | 18 | 358 | 316 | |
| Five and over | 13 | 8 | 352 | 249 | |
| Grand totals | 28,501 | 32,649 | 100,817 | 118,548 | |
A point of interest is that while the total number of farms with milking-machines has risen by 4,148, the number of farms with multiple plants has dropped from 857 to 676. On the other hand, single-unit plants of 6 cow-capacity and upwards have shown a greater relative increase than those below that number.
The following table shows, by size of herd in milk, both the number of farms equipped with milking-machines and farms with dairy cows in milk but no milking-plant. It will be noted that the only decreases in farms with milking-machines are confined to the larger herds, which would appear to follow the drop in multiple plants referred to above.
| Size of Herd (Cows in Milk). | Farms with Milking-machines. | Farms without Milking-machines. | ||
|---|---|---|---|---|
| 1940. | 1948. | 1940. | 1948. | |
*Tills total includes 228 cases of farms with milking-machines but no cows in milk. Comparable figures are not available for 1940. | ||||
| Under 5 | 715 | 898* | 22,755 | 25,809 |
| 5 and under 10 | 747 | 8,790 | 5,162 | |
| 10 and under 20 | 1,648 | 2,565 | 5,784 | 2,221 |
| 20 and under 30 | 4,462 | 4,677 | 2,032 | 621 |
| 30 and under 40 | 5,345 | 5,683 | 562 | 127 |
| 40 and under 50 | 4,497 | 5,108 | 174 | 30 |
| 50 and under 60 | 3,330 | 3,736 | 74 | 9 |
| 60 and under 70 | 2,707 | 2,896 | 30 | |
| 70 and under 80 | 1,803 | 2,015 | 37 | 6 |
| 80 and under 90 | 1,176 | 1,413 | ||
| 90 and under 100 | 842 | 878 | ||
| 100 and under 125 | 1,101 | 1,263 | ||
| 125 and under 150 | 416 | 405 | ||
| 150 and under 200 | 289 | 244 | ||
| 200 and over | 170 | 121 | ||
| Totals | 28,501 | 32,649 | 40,238 | 33,985 |
Agricultural Tractors.—During the ten years from 1938 to 1948 the number of agricultural tractors employed on holdings of 1 acre and over outside borough boundaries rose from 8,031 to 23,423, an increase of 192 per cent. These figures do not include rotary hoes or garden tractors, of which there were 2,253 in 1948, but similar information is not available for the earlier year.
The increase in tractors has been accompanied by a decrease in the number of horses employed on farms, particularly these described as “draught and three-quarter draught.” The total number of horses in 1948 was 203,885, of which 81,871 were classed as draught or three-quarter draught, 32,346 as spring-cart or light artillery (including half-draught), 73,882 as hacks or light working horses, and 15,786 as thoroughbred or other. Comparable figures for 1938 were 278,167, 130,151, 50,607, 81,301, and 16,108 respectively.
In the following table, which gives particulars of tractors and horses as at 31st January, 1918, horses described as “thoroughbred or other” have been excluded. The number of holdings on which tractors were located was 21,039 out of a total of 86,985 whereas horses were present on 55,571 holdings. In 5,280 cases there were tractors but no horses, 39,812 cases in which there were horses but no tractors, while both tractors and horses were present in 15,759 instances.
| Land District. | Tractors, but no Horses. | Tractors and Horses. | Horses, but no Tractors. | ||
|---|---|---|---|---|---|
| One Tractor. | More than One Tractor. | One Tractor. | More than One Tractor. | ||
| North Auckland | 715 | 29 | 1,720 | 63 | 7,646 |
| South Auckland | 722 | 36 | 2,975 | 160 | 8,349 |
| Gisborne | 61 | 9 | 173 | 13 | 1,819 |
| Hawkes Bay | 384 | 41 | 729 | 106 | 2,452 |
| Taranaki | 153 | 5 | 630 | 22 | 3,626 |
| Wellington | 513 | 36 | 1,669 | 162 | 5,586 |
| Totals, North Island | 2,548 | 156 | 7,896 | 526 | 29,478 |
| Marlborough | 102 | 19 | 251 | 26 | 777 |
| Nelson | 271 | 17 | 377 | 30 | 1,126 |
| Westland | 32 | 1 | 133 | 9 | 382 |
| Canterbury | 1,133 | 188 | 2,565 | 592 | 3,291 |
| Otago | 335 | 34 | 1,395 | 184 | 2,806 |
| Southland | 402 | 42 | 1,552 | 223 | 1,952 |
| Totals, South Island | 2,275 | 301 | 6,273 | 1,064 | 10,334 |
| New Zealand, 1948 | 4,823 | 457 | 14,169 | 1,590 | 39,812 |
| New Zealand, 1947 | 3,975 | 377 | 13,281 | 1,438 | 41,512 |
Threshing-machines.—Information collected in 1948 in conjunction with the monthly threshing returns show that a total of 1,708 machines (1,507 header harvesters, 115 threshing-mills, and 86 tin-mills) were engaged in threshing either wheat or oats in 1948, as compared with a total of 675 machines in 1938. The increases in the total number of machines during the ten-year period is accounted for by the change in harvesting methods that has taken place, the mobile header harvester having largely supplanted the stationary threshing-mills. The header harvester was first employed in New Zealand in the harvest of 1930. Exact information concerning the numbers of those machines was not available prior to 1945, but it has been stated that there were about 40 in operation in 1931, over 200 in 1936, and nearly 500 in 1939. Assuming the figure of 200 in 1936 to be approximately correct, the increase in the twelve years ended in 1948 was in the vicinity of 1,300, whereas threshing-mills (including tin-mills) fell from approximately 400 to 201.
The header harvester is used more extensively in connection with the wheat crop, many varieties of which are very well suited to heading, than in oat-threshing, where the threshing-mill still plays a part of major importance. In 1948 header harvesters threshed 84.3 per cent. of the wheat yield from 86.4 of the grain area. Threshing-mills and tin-mills accounted for 11.2 per cent. and 4.5 per cent. of the yield and 9.5 per cent. and 4.1 per cent. of the area respectively. Figures on a similar basis for oats are: header harvesters, 41.0 per cent. of yield and 49.5 per cent. of area; threshing-mills 42.4 per cent. of yield and 35.2 per cent. of area; and tin-mills, 16.6 per cent. of yield and 15.3 per cent. of area.
Of the 1,708 machines engaged in threshing wheat or oats in 1948, 1,137 (1,053 header harvesters, 44 threshing-mills, and 40 tin-mills) were located in the. Canterbury Land District, which produced 69 per cent. of the total wheat yield and 42 per cent. of the oat yield. In Otago there were 216 machines, made up of 182 headers, 21 threshing-mills, and 13 tin-mills, while Southland recorded 141 machines (92 headers, 28 threshing-mills, and 21 tin-mills).
The following table shows the average yields per acre of the main varieties of wheat according to the type of threshing-machine used. The percentages of threshing by each type of machine are also shown. Totals for 1947 are given for purposes of comparison.
| Variety. | Header Harvester. | Threshing-mills. | Tin-mills. | Totals. | ||||
|---|---|---|---|---|---|---|---|---|
| Percentage of Total Yield. | Average Yield per Acre. | Percentage of Total Yield. | Average Yield per Acre. | Percentage of Total Yield. | Average Yield per Acre. | Percentage of Total Yield. | Average Yield per Acre. | |
*Includes all other varieties. | ||||||||
| Bushels. | Bushels. | Bushels. | Bushels. | |||||
| Cross 7 | 89.90 | 36.63 | 7.18 | 43.75 | 2.92 | 41.17 | 100.00 | 37.18 |
| Tuscan | 89.83 | 28.82 | 8.50 | 35.67 | 1.67 | 38.64 | 100.00 | 29.37 |
| Fife Tuscan | 94.71 | 31.00 | 4.59 | 35.22 | 0.70 | 34.65 | 100.00 | 31.19 |
| Dreadnought | 40.22 | 47.16 | 42.23 | 45.56 | 17.55 | 41.79 | 100.00 | 45.46 |
| Tainui | 80.59 | 32.48 | 12.17 | 38.40 | 7.24 | 32.07 | 100.00 | 33.07 |
| Hunters | 21.52 | 32.98 | 61.56 | 38.98 | 16.92 | 38.92 | 100.00 | 37.51 |
| Totals,* 1948 | 84.27 | 35.43 | 11.26 | 42.79 | 4.47 | 39.75 | 100.00 | 36.31 |
| Totals,* 1947 | 82.07 | 36.97 | 12.45 | 45.28 | 5.48 | 41.33 | 100.00 | 38.06 |
The foregoing analysis for 1948 is based on a total of 4,667 crops, covering approximately 80 per cent. of the total wheat area.
There would appear to be a tendency for header yields to he lower than the yields of crops threshed with threshing and tin-mills, but in the absence of such related matters as soil types, &c., no definite conclusions can be drawn. It is mainly on the heavier soil types that threshing-mills and tin-mills have been retained. This is particularly so in the case of the soft-chaffed wheats, Dreadnought and Hunters, which on the whole, are header-harvested only on lighter land.
A similar analysis to that given for wheat is now shown for oats. The number of crops in this instance was 3,785, which covered approximately 76 per cent. of the oat area threshed.
| Variety. | Header Harvester. | Threshing-mills. | Tin-mills. | Totals. | ||||
|---|---|---|---|---|---|---|---|---|
| Percentage of Total Yield. | Average Yield per Acre. | Percentage of Total Yield. | Average Yield per Acre. | Percentage of Total Yield. | Average Yield per Acre. | Percentage of Total Yield. | Average Yield per Acre. | |
| Bushels. | Bushels. | Bushels. | Bushels. | |||||
| White | 37.18 | 41.33 | 46.99 | 55.98 | 15.83 | 52.10 | 100.00 | 48.95 |
| Dun | 40.63 | 28.26 | 35.22 | 37.58 | 24.15 | 32.86 | 100.00 | 32.15 |
| Black | 33.36 | 26.45 | 40.83 | 41.90 | 20.81 | 44.74 | 100.00 | 34.60 |
| Algerian | 67.18 | 28.54 | 16.23 | 40.32 | 16.59 | 43.22 | 100.00 | 31.84 |
| Totals, 1948 | 40.98 | 36.60 | 42.41 | 53.18 | 16.61 | 47.84 | 100.00 | 44.16 |
| Totals, 1947 | 37.77 | 40.77 | 47.07 | 57.62 | 15.16 | 49.45 | 100.00 | 48.78 |
AS indicated in the general remarks included in the introductory portion of the preceding subsection, grassland products account for a very high proportion of the farm output of New Zealand. It must not be assumed, however, on this account, that cropping is of minor importance in the economy of New Zealand. Practically the whole of the internal requirements in respect of agricultural products are grown within the country, the only exceptions of note being tropical or subtropical products such as tea, sugar, cotton, bananas, &c. In most years also it has been found necessary to import certain quantities of wheat, local production being insufficient for the country's needs.
Fruit is grown on a considerable scale, home requirements of all the important fruits and berries grown in temperate zones being satisfied by New Zealand orchard production. Citrus fruits are grown in the sub-tropical northern portion of New Zealand, and grapes are also cultivated in certain localities with a favourable climate. In addition to the needs of local requirements, a substantial export trade in apples—and to a lesser extent in pears—is carried on in normal times.
In rural New Zealand and in many urban localities the kitchen-garden supplies a very considerable proportion of family requirements of vegetables, while there is a substantial area planted in market gardens, both inside and outside borough boundaries. The major commercial cash vegetable crops are potatoes and onions. Local supplies of potatoes are, in most seasons, quite adequate, and occasionally there is a material surplus. In recent years the production of onions has also been more than sufficient for local requirements. Although the importance of vegetable-growing in agricultural production cannot be measured (a considerable, though unknown, proportion being noncommercial), it will be realized that this branch of crop-production is of some consequence in that the requirements of the people are supplied from New Zealand production.
Coincident with the growth of the stock-raising industries, there has been a considerable increase in areas sown for supplementary fodders. While practically throughout the whole of New Zealand animals can be grazed in open pasture for the full twelve months of the year, the winter growth of grass, except in certain favoured localities, requires to be supplemented in order to keep stock in good condition during the colder months, and in some districts supplementary fodders are necessary in the hottest summer months. The supply of supplementary fodders is adequate both in quantity and in quality, so that New Zealand imports animal-feeding stuffs to a very minor extent only.
Hay and ensilage crops are grown almost exclusively on the farms where they are consumed, though there is some degree of localization in the growing of certain other supplementary fodder crops. The bulk of the turnip crop is grown in the South Island, and that Island also usually predominates in the production of both rape and kale, since the colder climate necessitates more extensive supplementary feeding than in the North Island.
The renewal of pasturage requires the annual supply of very considerable quantities of grass-seeds, which are grown almost entirely in New Zealand. There is a small import of certain classes of seeds, but this is almost negligible in relation to requirements: on the other hand, an appreciable export trade in some species of grass-seeds has been developed. A considerable expansion occurred in this trade during the late war-years and the quantity of grass and clover seeds exported in 1947 was well over three times the amount exported in 1939.
GEOGRAPHIC DISTRIBUTION.—Grain-growing is localized to a considerable extent, the Canterbury Land District, with its fertile plains, supplying in 1947–48, 69 per cent. of New Zealand's wheat crop, 42 per cent. of the oats threshed, and 69 per cent. of the barley yield. Maize-growing is largely confined to certain portions of the South Auckland and Gisborne districts. The commercial growing of peas is carried out extensively in Canterbury, and to a lesser extent in Marlborough and Otago, Canterbury alone producing just under half of the total yield. The districts of Canterbury, Otago, and Southland supplied in 1947–48, 79 per cent. of the total production of grass-seeds. While the Canterbury district produces the bulk of the commercial potato crop, the growing of potatoes for the early market is of importance in the North and South Auckland districts.
Commercial orchards in New Zealand are largely confined to certain areas suited by climatic and Boil conditions, while access to markets is also an important factor, particularly in respect of small fruits. The Nelson district is famed for its apple-orchards, a high percentage of the crop from this district normally being exported. Central Otago is well suited to the growing of stone fruits—notably apricots. In several other districts commercial orchard production is successfully carried on: special mention may be made of citrus culture in certain northern districts.
Grape-growing is of importance in North Auckland, Auckland, and Hawkes Bay. Tobacco-growing is mainly confined to the Waimea County, in the Nelson district, hop-growing, also, being largely concentrated in the latter area.
The total area devoted to each crop in the 1947–48 season and the proportions per cent. in each land district are given in the following table.
| Name of Crop. | Area. | Land District Percentages. | |||||||||||
|---|---|---|---|---|---|---|---|---|---|---|---|---|---|
| North Auckland. | South Auckland. | Gisborne. | Hawkes Bay. | Taranaki. | Wellington. | Marlborough. | Nelson. | Westland. | Canterbury. | Otago. | Southland. | ||
| For threshing— | Acres. | ||||||||||||
| Wheat | 123,751 | 4 | 4 | 72 | 14 | 6 | |||||||
| Oats | 63,159 | 1 | 2 | 1 | 53 | 14 | 29 | ||||||
| Barley | 63,398 | 1 | 1 | 2 | 5 | 7 | 2 | 70 | 10 | 2 | |||
| Maize | 7,345 | 7 | 28 | 58 | 7 | ||||||||
| Peas | 52,138 | 1 | 4 | 2 | 4 | 18 | 1 | 47 | 19 | 4 | |||
| Other crops | 27,610 | 1 | 1 | 77 | 14 | 7 | |||||||
| For chaff, hay, or ensilage— | |||||||||||||
| Oats | 69,633 | 2 | 2 | 2 | 5 | 4 | 2 | 36 | 26 | 21 | |||
| Grasses and clovers | 559,956 | 14 | 35 | 2 | 3 | 14 | 9 | 1 | 2 | 8 | 5 | 7 | |
| Lucerne | 46,303 | 1 | 12 | 2 | 9 | 4 | 5 | 2 | 42 | 22 | |||
| Other crops | 1,495 | 6 | 21 | 1 | 5 | 9 | 15 | 3 | 1 | 15 | 10 | 14 | |
| Green fodder— | |||||||||||||
| Oats | 44,460 | 2 | 4 | 4 | 1 | 6 | 7 | 4 | 57 | 11 | 4 | ||
| Rape | 160,554 | 1 | 1 | 8 | 5 | 2 | 1 | 52 | 21 | 9 | |||
| Kale (including chou mœllier) | 76,577 | 4 | 1 | 25 | 4 | 19 | 1 | 19 | 10 | 17 | |||
| Other crops | 25,809 | 6 | 14 | 3 | 5 | 1 | 11 | 3 | 1 | 26 | 18 | 12 | |
| Root crops— | |||||||||||||
| Swedes | 180,587 | 3 | 18 | 2 | 4 | 8 | 1 | 9 | 21 | 34 | |||
| Turnips | 182,360 | 2 | 7 | 1 | 2 | 1 | 5 | 1 | 2 | 48 | 15 | 16 | |
| Turnips and rape | 37,589 | 1 | 2 | 2 | 4 | 1 | 18 | 20 | 52 | ||||
| Potatoes | 21,887 | 7 | 4 | 3 | 6 | 15 | 1 | 3 | 48 | 7 | 6 | ||
| Other crops | 5,547 | 14 | 10 | 2 | 8 | 4 | 23 | 24 | 13 | 2 | |||
| Grasses and clovers for seed | 142,206 | 2 | 5 | 2 | 4 | 1 | 50 | 13 | 23 | ||||
| Linen Max | 4,554 | 91 | 9 | ||||||||||
| Tobacco | 3,402 | 100 | |||||||||||
| Vegetable crops for processing | 1,723 | 23 | 3 | 56 | 16 | 2 | |||||||
| Other field crops | 1,066 | 2 | 3 | 1 | 1 | 9 | 19 | 2 | 13 | 50 | |||
| Orchards | 18,667 | 20 | 9 | 2 | 17 | 1 | 3 | 3 | 20 | 8 | 16 | 1 | |
| Grape-vines | 939 | 48 | 18 | 4 | 29 | 1 | |||||||
| Passion-fruit vines | 113 | 56 | 32 | 6 | 3 | 3 | |||||||
| Hop-vines | 624 | 100 | |||||||||||
BUSHEL WEIGHTS.—For statistical and other purposes, it is at times necessary to convert bushel units to a weight basis. For New Zealand produce, conversion is effected by using the following weights per bushel for the commodities mentioned.
| Produce. | Weight of Bushel. |
|---|---|
| lb. | |
| Wheat | 60 |
| Oats | 40 |
| Barley | 60 |
| Maize | 56 |
| Peas | 60 |
| Ryecorn | 64 |
| Beans | 65 |
| Grasses and clovers | 20 |
AREA UNDER CULTIVATION.—A general summary of the areas under cultivation during each of the last eleven years is given in the following table. The statistics quoted in this and other tables in this subsection relate to holdings of 1 acre or upwards outside borough boundaries.
In addition to the areas shown as under cultivation, there is a considerable area of occupied land still unimproved. In 1947–48 the total area of unimproved occupied land was 22,689,139 acres. Cultivated land accounted in 1947–48 for 47 per cent. of the total area in occupation, unimproved land accounting for the remaining 53 per cent. The area in phormium—a productive asset—is included in the total of unimproved land, while an appreciable proportion of tussock and other naturally established native grasses is also of some economic utility—e.g., for low-grade sheep-grazing, &c.
| Year. | Pasture Land.* | Field Crops. | Plantations. | Orchards | Lying Fallow. | Other Cultivated Land. | Total Cultivated Land. |
|---|---|---|---|---|---|---|---|
* Excluding areas of grasses and clovers cut for seed, hay, or ensilage, which have been Included In Held crops. † Approximate. | |||||||
| Acres. | Acres. | Acres. | Acres. | Acres. | Acres. | Acres. | |
| 1937–38 | 16,731,607 | 1,785,329 | 846,974 | 22,397 | 181,414 | 95,280 | 19,663,001 |
| 1938–39 | 16,783,612 | 1,807,445 | 844,423 | 21,753 | 140,925 | 95,791 | 19,693,949 |
| 1939–40 | 16,632,608 | 1,956,096 | 839,906 | 20,899 | 112,195 | 97,645 | 19,659,349 |
| 1940–41 | 16,788,121 | 2,048,198 | 852,196 | 20,064 | 104,189 | 93,888 | 19,906,656 |
| 1941–42 | 16,742,153 | 2,010,560 | 857,933 | 19,544 | 110,496 | 94,088 | 19,834,774 |
| 1942–43 | 16,992,343 | 1,911,833 | 851,258 | 19,190 | 110,000† | 96,426 | 19,981,050 |
| 1943–44 | 16, 774,304 | 1,965,670 | 859,737 | 19,196 | 110,000† | 101,092 | 19,829,999 |
| 1944–46 | 16,619,713 | 2,013,214 | 867,450 | 19,614 | 110,000† | 102,058 | 19,732,049 |
| 1945–46 | 17,036,822 | 1,839,589 | 891,008 | 18,235 | 121,033 | 90.555 | 19,967,242 |
| 1946–47 | 17,013,057 | 1,984,395 | 869,959 | 18,253 | 123,654 | 94,545 | 20,103,863 |
| 1947–48 | 17,088,810 | 1,904,377 | 871,356 | 18,667 | 122,812 | 96,892 | 20,102,914 |
In the following pages statistics of the principal crops are quoted with explanatory comment. In addition to summary tables, covering in each instance a range of related items, important individual crops are discussed under separate headings.
PRINCIPAL FIELD CROPS.—The areas under each of the principal field crops for the last five years have been as follows:—
| Crop. | 1943–44. | 1944–45. | 1945–46. | 1946–47. | 1947–48. |
|---|---|---|---|---|---|
*Including turnips and rape mixed. † Excluding wheat, oats, barley, maize, and pens fed off. | |||||
| Acres. | Acres. | Acres. | Acres. | Acres. | |
| Wheat | 239,183 | 188,771 | 164,286 | 144,006 | 125,439 |
| Oats | 228,887 | 228,470 | 182,123 | 181,469 | 177,252 |
| Barley | 36,310 | 43,200 | 54,717 | 62,845 | 73,275 |
| Maize | 11,460 | 14,830 | 15,282 | 14,298 | 13,303 |
| Peas | 46,070 | 46,099 | 33,450 | 52,182 | 52,827 |
| Linseed | 1,263 | 4,326 | 10,361 | 12,292 | 18,728 |
| Linen flax | 9,755 | 12,686 | 4,590 | 4,070 | 4,554 |
| Potatoes | 27,178 | 29,774 | 23,228 | 19,276 | 21,887 |
| Turnips and swedes* | 393,243 | 393,415 | 380,693 | 390,243 | 400,486 |
| Mangolds | 4,650 | 4,872 | 4,092 | 3,322 | 2,879 |
| Onions | 1,023 | 1,915 | 1.387 | 1,202 | 1,572 |
| Tobacco | 2,586 | 2,839 | 2,883 | 3,091 | 3.402 |
| Green fodder† | 235,687 | 242,801 | 242,158 | 244,170 | 246.336 |
| Grasses and clovers for seed | 141,612 | 180,542 | 224,638 | 254,268 | 142,206 |
| Grasses and clovers for hay or ensilage | 527,949 | 554,654 | 442,093 | 540,016 | 559,956 |
| Lucerne for hay or ensilage | 45,683 | 46,45.5 | 41,416 | 42,642 | 46,303 |
| Other crops | 13,131 | 17,565 | 12,192 | 15,003 | 13,972 |
| Totals | 1,965,670 | 2,013,214 | 1,839,589 | 1,984,395 | 1,904,377 |
The figures quoted in the foregoing table in respect of wheat, oats, barley, maize, and peas relate to the total areas under these crops for grain or fodder. It should be noted that a considerable portion of the area under certain crops, particularly oats, is cut for chaff or is fed off. In regard to pens it should also he noted that areas of this crop for canning and for domestic consumption in the form of green peas are included elsewhere.
GRAIN AND SEED CROPS.—Details of areas for threshing, total yields, and yields per acre of the principal grain and seed crops during the last five years are set out in the following table.
| Year. | Wheat. | Oats. | Barley. | Maize. | Peas. | Lupins. |
|---|---|---|---|---|---|---|
| AREAS FOR THRESHING | ||||||
| Acres. | Acres. | Acres. | Acres. | Acres. | Acres. | |
| 1943–44 | 233,786 | 39,652 | 28,241 | 5,691 | 44,690 | 3,652 |
| 1944–45 | 183,886 | 77,684 | 37,325 | 8,473 | 43,970 | 6,479 |
| 1945–46 | 161,049 | 57,278 | 48,646 | 7,034 | 32,740 | 2,109 |
| 1946–47 | 141,407 | 55,297 | 53,041 | 7, 865 | 51,481 | 5,282 |
| 1947–48 | 123,751 | 63,159 | 63,398 | 7,345 | 52,138 | 3,677 |
| TOTAL YIELDS | ||||||
| Bushels. | Bushels. | Bushels. | Bushels. | Bushels. | Bushels. | |
| 1943–44 | 7,208,485 | 1,834,310 | 832,783 | 296,081 | 888,709 | 53,933 |
| 1944–45 | 6,992,204 | 4,209,143 | 1,384,957 | 443,151 | 1,037,551 | 134,696 |
| 1945–46 | 5,439,041 | 2,796,877 | 1,872,316 | 350,188 | 816,897 | 28,093 |
| 1946–47 | 5,368,120 | 2,686,211 | 2,026,786 | 396,622 | 1,231,182 | 127,455 |
| 1947–48 | 4,539,017 | 2,853,517 | 2,087,900 | 378,247 | 1,139,325 | 56,467 |
| YIELDS PER ACRE | ||||||
| Bushels. | Bushels. | Bushels. | Bushels. | Bushels. | Bushels. | |
| 1943–44 | 30.83 | 46.26 | 29.49 | 52.03 | 19.89 | 14.77 |
| 1944–45 | 38.02 | 54.18 | 37.11 | 52.30 | 23.60 | 20.79 |
| 1945–46 | 33.77 | 48.83 | 38.49 | 49.79 | 24.95 | 13.32 |
| 1946–47 | 37.96 | 48.58 | 38.21 | 50.43 | 23.92 | 24.13 |
| 1947–48 | 36.68 | 45.18 | 32.93 | 51.50 | 21.85 | 15.36 |
The area sown to linseed has increased very considerably during the last few years, and the acreage harvested in 1947–48 (18.728 acres) was easily a record for this crop. Areas for the five preceding seasons were as follows: 1946–47, 12,292 acres; 1945–46, 10,361 acres; 1944–45, 4,326 acres; 1943–44, 1,263 acres: 1942–43, 354 acres. Details as to yield are not available, but tin's normally averages in the vicinity of 7 cwt. of seed per acre.
Other crops for thrashing in 1947–48 include the following, the resultant yield in each case being given in parentheses: rape. 871 acres (637,503 lb); hale (including chou moellier), 331 acres (121,929 lb.): white-fleshed (soft) turnips, 131 acres (30,574 lb.); yellow-fleshed (hard) turnips, 168 acres (47,343 lb.); swedes. 829 acres (373,004 lb.); mustard. 870 acres (315,993 lb.): beans, 179 acres (4,410 bushels); and ryecorn, 1,680 acres (34,018 bushels).
It was the practice in pre-war years to import considerable quantities of small seeds, but the extension of the conflict in Europe, together with the rapid expansion of Japanese aggression in the Pacific, rendered this no longer possible, and it became necessary to make an effort to raise our full domestic requirements in this direction within the shores of New Zealand. The success of the effort is exemplified in the total areas planted in other crops for seed (i.e., crops other than the principal crops stated above, wheat, oats, barley, maize, peas, lupins, and linseed), which rose from 342 acres in 1938–39 to 6,674 acres in 1942–43. Although there has been some reduction from the peak figure of that year, the area is still substantial, being 5,205 acres in 1947–48 and 4,478 acres in 1946–47. These figures cover such other crops as itemized above, together with a variety of smaller areas relating to crops, such as mangolds, onions, vetches, tares, radish, silver beet, red beet, carrots, pumpkins, marrows, leeks, cauliflower, cabbage, parsnips, &c. It was found in most instances that the locally produced seed was fully up to, and indeed, in some cases (e.g., swede and turnip seed), superior to the standard of that previously imported. It has been shown, for instance, that swede and turnip crops grown from locally produced seed have been comparatively free from the widespread dry-rot disease which formerly attacked these crops when grown from imported seed.
WHEAT.—Wheat, is the most important grain crop grown in New Zealand. The industry enjoys a sliding scale of Customs duties levied on imports of wheat and flour and also regulation of prices on a basis that is calculated to give the grower a satisfactory return for his produce.
Further efforts in encouraging wheat-growing with a view to making New Zealand entirely self-sufficient in respect of requirements of wheat and wheaten products were initiated by the Government in 1936. An Order in Council which came into force in March of that year prohibits the importation of wheat or wheaten flour, except under permit granted by the Minister of Industries and Commerce. With a view to reducing imports of Grade A wheat necessary for mixing purposes, the Wheat Research Institute has been endeavouring to encourage the growing in New Zealand of better-quality varieties which do not require blending with imported wheat. The Institute has already achieved satisfactory results, its most outstanding success being the development of a Tuscan variety known as Cross 7. Cross 7 wheat has been grown in increasing quantities, and in the last six seasons produced over 60 per cent. of the total grain harvested. It possesses the advantages of desirable baking qualities, good yield, and resistance to wind damage Another variety, similarly developed, known as Fife Tuscan, also shows signs of increasing popularity.
Despite the protection and encouragement given to wheat-growers, the results have, in the main, been disappointing. Appreciable increases occurred in the four seasons 1939–40 to 1942–43, but decreased sowings and a low average yield resulted in production for 1943–44 being 2,610,857 bushels below that for 1942–43. A further decline in the acreage sown for 1944–45 season resulted in a further drop in production, this despite the fact that the average yield was the highest yet recorded. As an incentive to increased sowings for the 1945–46 season it was decided to pay a production bonus, linked to the attainment of an increased acreage.
However, a most unfavourable autumn and winter were instrumental in delaying the preparation of the soil, and consequently sowings, to such an extent that the area harvested was one of the lowest on record. In 1946–47 the position deteriorated further, the area for threshing, 141,407 acres, being, with one exception, 1919–20, in which 139,611 acres were threshed, the lowest devoted to the wheat crop since comparable data first became available in 1879. The 1947–48 area fell even below this figure, only 123,751 acres being threshed. Prospects for 1948–49 are for a slight rise to approximately the area recorded in 1946–47.
The following diagram shows the fluctuations that have occurred in the area sown in wheat during the last twenty years, together with the total yield and the average yield per acre.
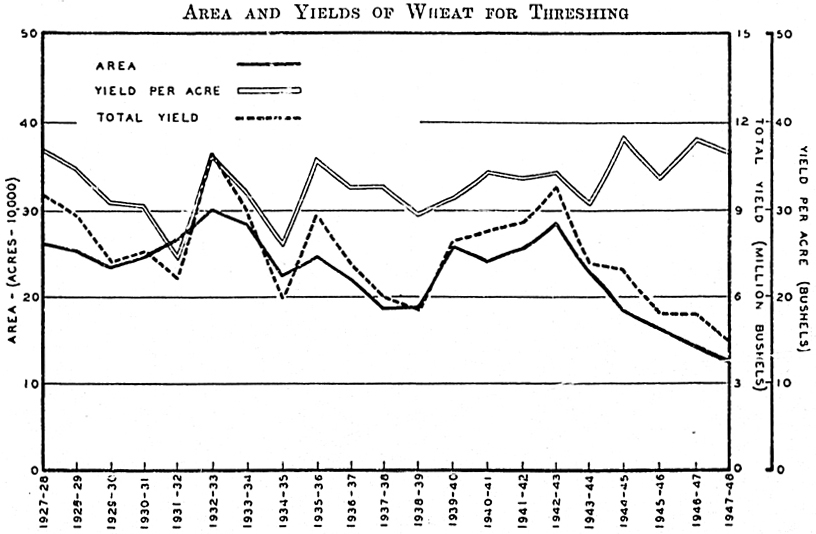
Varieties of Wheat.—The choice of wheat varieties for sowing is influenced by their suitability to local conditions of climate, soil type, &c. Wheatgrowers receive valuable guidance regarding suitable varieties as the result of research work and field trials undertaken by the Wheat Research Institute and the Department of Agriculture. Particulars regarding varieties of wheat were obtained covering 80 per cent. of the total area of wheat threshed for the harvest of 1948. Of the three groups of varieties, Tuscan accounted for 97.8 per cent. of the area and 97.8 per cent. of the yield; Hunter's, 1.3 per cent. of the area and 1.4 per cent. of the yield; and Pearl, 0.9 per cent. of the area and 0.8 per cent. of the yield. Of the individual varieties, Cross 7, previously referred to, produced 67.3 per cent. of the total yield, while Fife Tuscan produced a further 13 per cent. These two varieties accounted for 65.7 per cent. and 15.2 per cent. of the total area respectively.
OATS.—Although, as stated above, wheal is the most important grain crop of New Zealand, the area under oats (for all purposes) normally exceeds that under wheat. Of the total area under oats in 1947–48, 85 per cent. was grown in Canterbury, Otago, and Southland, 6 per cent. in the remainder of the South Island, and 9 per cent. in the North Island. The greater portion of the oat crop is usually converted into chaff without threshing, but the proportion so dealt with depends partly on the condition of the crop and partly on market conditions. In 1944–45, 34 per cent. of the total crop was threshed, but during the preceding five years the area threshed averaged only 21 per cent. of the area sown. The higher proportions of the crop threshed, allied with a record yield per acre, resulted in the highest total yield obtained since 1932–33. Although a high proportion of the crop was also threshed in both 1945–46 and 1946–47—31 per cent. and 30 per cent. respectively—a considerable decrease in the area sown, together with smaller average yields, resulted in a sharp drop in grain-production. The total area under oats showed a further decrease in 1947–48, but the very high proportion of the crop threshed, 36 per cent., which also more than offset the smaller average yield obtained, resulted in an increase in the total production of oaten-grain. Canterbury and Southland each produced 42 per cent. of the total oaten-grain in 1947–48, followed by Otago with 14 per cent., these three districts together accounting for 98 per cent. of the total oaten-grain yield.
The total and average yields of oaten-grain and of chaff, hay, or ensilage for the five seasons ending with 1947–48 were as follows:—
| Season. | Grain. | Chaff, Hay, or Ensilage. | ||
|---|---|---|---|---|
| Total Yield. | Average per Acre. | Total Yield. | Average per Acre. | |
| Bushels. | Bushels. | Tons. | Tons. | |
| 1943–44 | 1,834,310 | 46.26 | 184,985 | 1.56 |
| 1944–45 | 4,209,143 | 54.18 | 188,436 | 1.90 |
| 1945–46 | 2,796,877 | 48.83 | 153,532 | 1.78 |
| 1946–47 | 2,686,211 | 48.58 | 141,058 | 1.85 |
| 1947–18 | 2,853,517 | 45.18 | 122,716 | 1.76 |
Varieties of Oats threshed.—An analysis of the threshing returns relating to the season 1947–48 gave the following percentage distribution of varieties of oats threshed.
| Variety of Oats threshed. | Percentage of Total Area. | Percentage of Total Yield. |
|---|---|---|
| Per Cent. | Per Cent. | |
| White | 71.46 | 79.20 |
| Dun | 9.86 | 7.18 |
| Black | 2.32 | 1.82 |
| Algerian | 16.36 | 11.80 |
| All varieties | 100.00 | 100.00 |
White oats (principally Gartons) are predominantly represented in the above figures with over seven-tenths of the total area threshed and just under four-fifths of the total yield. Gartons, in addition to possessing value as feed oats, are used extensively for milling.
BARLEY.—For many years prior to 1940–41, the area planted in barley did not fluctuate to any marked degree, but the areas sown in 1940–41 and in 1941–42 were substantially above those of previous years, with a consequent increase in grain-production. The areas in the following two years, although still above the average, were well below that of 1941–42, but outstanding increases were recorded in the next four years, the area threshed in 1947–48 (63,398 acres) and the yield of grain (2,087,900 bushels) being the highest yet recorded. One of the reasons ascribed to these increased sowings was that, owing to unfavourable weather conditions in certain years, land which had been intended for wheat could not be prepared in time for that crop and such land was then devoted to barley, which could be sown later. The principal reason, however, would appear to be the inability to procure supplies abroad. Prior to 1945, considerable quantities of barley were imported—mainly for use as stock-food—annual importations for the five calendar years 1940–44 averaging 633,000 bushels. In the three years 1945–47, however, imports averaged only 179,000 bushels. New Zealand production for the five seasons ended with 1947–48 averaged 1,640,900 bushels.
Of the total area grown, 84 per cent. was threshed for grain in 1948, the remaining 16 per cent. being used for stock fodder (mostly feeding off).
Information supplied in the spring by growers regarding varieties sown, or intended to be sown, shows the following percentage distribution for 1946–47 and 1947–48.
| Variety. | Proportion of Estimated Total Area. | |
|---|---|---|
| 1946–47. | 1947–48. | |
| Per Cent. | Per Cent. | |
| Chevallier | 34.95 | 24.89 |
| Research | 6.79 | 15.81 |
| Golden-Archer | 4.04 | 13.54 |
| Spratt-Archer | 14.47 | 10.44 |
| Plumage-Archer | 15.02 | 10.42 |
| Other (and unspecified) malting varieties | 9.29 | 4.66 |
| Cape | 10.38 | 14.09 |
| Skinless | 5.06 | 6.15 |
| Totals | 100.00 | 100.00 |
Chevallier, Plumage-Archer, and Spratt-Archer, are malting varieties. In the aggregate, malting varieties accounted for 88 per cent. of the area in 1945–46 and 85 per cent. in 1946–47.
POTATOES.—The production of potatoes is usually adequate to meet the home market, and in the past a surplus was frequently available for export. The problem of the disposal of such surplus quantities in normal times is rendered difficult by import restrictions on New Zealand potatoes entering Australia, although several thousand tons were admitted during 1940, following an exceptionally high average and aggregate yield from a comparatively small area. The acreage sown in 1940–41 (16,998 acres) was the lowest area to be recorded since 1892, the earliest date for which comparative statistics are available. Consequently, though the average yield per acre compared favourably with that of the previous ten seasons, the aggregate yield was insufficient to meet home requirements, necessitating the importation of a considerable quantity of Australian potatoes to help meet the deficiency. An even more unfavourable position obtained in 1941–42 when, owing to a further decrease in the area planted, it became necessary for the Government to adopt a method of systematic marketing of available supplies. However, in 1942–43 and 1943–44, farmers responded generously to appeals to grow more potatoes, the resultant yields being ample for all requirements. In 1944–45, however, although the area planted was 2,596 acres greater than in 1943–44, the yield was less to the extent of 35,825 tons owing to unfavourable weather conditions. It was estimated that 4,500 acres were completely destroyed owing to flooding, &c. As New Zealand had been called upon to meet heavy requirements of the Armed Forces, importations from Australia were again necessary. Though the area planted in the following two seasons showed a heavy decline, a high average yield in both seasons resulted in total yields sufficient to meet requirements. An increased area of 2,611 acres was planted in 1947–48. This, together with a very high average yield, resulted in a total crop only slightly below that obtained in 1943–44.
Figures for area and yield for the last five years are as follows:—
| Year. | Area. | Total Yield. | Yield Per Acre. |
|---|---|---|---|
| Acres. | Tons. | Tons. | |
| 1943–44 | 27,178 | 161,512 | 5.94 |
| 1944–45 | 29,774 | 125,687 | 4.22 |
| 1945–46 | 23,228 | 140,252 | 6.04 |
| 1946–47 | 19,276 | 115,762 | 6.01 |
| 1947–48 | 21,887 | 155,018 | 7.08 |
The 1947–48 yield was made up of 110,918 tons of table potatoes, 31,103 tons of seed potatoes, and 12,997 tons of pig, &c., potatoes. The corresponding quantities in 1946–47 were 82.421 tons, 25,748 tons, and 7,593 tons.
Since 1936, special statistics of areas and yields of potatoes, classified according to varieties as well as by origin of seed planted (Government certified or otherwise) have been compiled annually. The following figures relating to the 1947–48 season cover over 53 per cent. of the total potato acreage.
| Name of Variety. | Government Certified. | Uncertified. | Not Stated. | Totals. | ||||||||
|---|---|---|---|---|---|---|---|---|---|---|---|---|
| Area. | Total Yield. | Yield Per Acre. | Area. | Total Yield. | Yield Per Acre. | Area. | Total Yield | Yield Per Acre. | Area. | Total Yield. | Yield Per Acre. | |
| Acres | Tons. | Tons. | Acres | Tons. | Tons. | Acres | Tons. | Tons. | Acres. | Tons. | Tons. | |
| Aucklander Short Top | 2,460 | 17,004 | 6.91 | 1,341 | 8,004 | 5.97 | 39 | 257 | 6.59 | 3,840 | 25,265 | 6.58 |
| Arran Chief | 1,099 | 11,804 | 10.74 | 1,098 | 8,213 | 7.48 | 75 | 486 | 6.48 | 2,272 | 20,503 | 9.02 |
| Dakota | 406 | 3,409 | 8.40 | 1,240 | 9,603 | 7.74 | 21 | 97 | 4.62 | 1,667 | 13,109 | 7.86 |
| Arran Banner | 868 | 6,904 | 7.95 | 464 | 3,054 | 6.58 | 46 | 272 | 5.91 | 1,378 | 10,230 | 7.42 |
| King Edward | 173 | 1,497 | 8.65 | 257 | 1,827 | 7.11 | 18 | 143 | 7.94 | 448 | 3,467 | 7.74 |
| Inverness Favourite | 146 | 1,468 | 10.05 | 207 | 1,803 | 8.71 | 4 | 33 | 8.25 | 357 | 3,304 | 9.25 |
| Aucklander Tall Top | 265 | 1,753 | 6.62 | 74 | 553 | 7.47 | 339 | 2,306 | 6.80 | |||
| Gamekeeper and Northern Star | 1 | 5 | 5.00 | 108 | 669 | 6.19 | 52 | 235 | 4.52 | 161 | 909 | 5.65 |
| Epicure | 63 | 412 | 6.54 | 70 | 291 | 4.16 | 1 | 4 | 4.00 | 134 | 707 | 5.28 |
| Iron Duke | 61 | 636 | 10.43 | 45 | 405 | 9.00 | 1 | 3 | 3.00 | 107 | 1,044 | 9.76 |
| Jersey Bennes | 15 | 116 | 7.73 | 78 | 489 | 6.27 | 93 | 605 | 6.51 | |||
| Cliffs Kidney | 38 | 356 | 9.37 | 17 | 133 | 7.82 | 1 | 1 | 1.00 | 56 | 490 | 8.75 |
| Dunbar Standard | 39 | 351 | 9.00 | 14 | 115 | 8.21 | 53 | 466 | 8.79 | |||
| Majestic | 33 | 235 | 7.12 | 16 | 87 | 5.44 | 1 | 6 | 6.00 | 50 | 328 | 6.56 |
| Katahdin | 25 | 170 | 6.80 | 23 | 155 | 6.74 | 48 | 325 | 6.77 | |||
| Sebago | 30 | 296 | 9.87 | 12 | 71 | 5.92 | 42 | 367 | 8.74 | |||
| Chippewa | 12 | 75 | 6.25 | 22 | 180 | 8.18 | 1 | 3 | 3.00 | 35 | 258 | 7.37 |
| Mixed and minor varieties | 144 | 1,162 | 8.07 | 193 | 979 | 5.07 | 9 | 42 | 4.67 | 346 | 2,183 | 6.31 |
| Unspecified | 24 | 162 | 6.75 | 127 | 657 | 5.17 | 70 | 642 | 9.17 | 221 | 1,461 | 6.61 |
| Totals | 5,902 | 47,815 | 8.10 | 5,406 | 37,288 | 6.90 | 339 | 2,224 | 6.65 | 11,647 | 87,327 | 7.50 |
“Government certified” seed is that for which a Government certificate has been issued in respect of purity, &c. Seed obtained from the ensuing crop cannot be so designated unless the requisite certificate is issued by the authorities.
The table plainly indicates the superior yielding-capacity of certified seed. Between them, the three principal varieties—viz., Aucklander Short Top, Arran Chief, and Dakota—for which separate figures were available averaged 8.1 tons per acre from certified seed and 7.0 tons per acre from uncertified seed. The advantage of 1.1 tons per acre in favour of crops from certified seed represents a yield-superiority of 16 per cent. Over all varieties the corresponding advantage amounts to 1.2 tons and 17 per cent. respectively.
ONIONS.—Areas in and yields of onions for the last five years are as follows:—
| Year. | Area. | Total Yield. | Yield Per Acre |
|---|---|---|---|
| Acres. | Tons. | Tons. | |
| 1943–44 | 1,023 | 8,466 | 8.28 |
| 1944–45 | 1,915 | 17,886 | 9.34 |
| 1945–46 | 1,387 | 11,996 | 8.65 |
| 1946–47 | 1,202 | 11,019 | 9.17 |
| 1947–48 | 1,572 | 13,585 | 8.64 |
In earlier years the production of onions was rarely sufficient to supply domestic requirements. As onions are a semi-perishable commodity it was found convenient to export in the flush of the New Zealand season, and to obtain supplies from overseas later in the year. However, a considerable improvement has been effected in the keeping qualities of the varieties grown, and no onions were imported into New Zealand during the four calendar years ended 1948. The large area planted in 1944–45 was mainly due to the requirements of the Armed Forces, not only in New Zealand but in the Pacific area.
SUPPLEMENTARY FODDER CROPS.—Although grass is the main crop of the farmer in New Zealand, at certain periods during the year the pastures need supplementing in order that the grassland may not become unduly exhausted, and also in order to maintain stock in a satisfactory condition. In mid-winter the grass is at a low stage of productivity generally, while under dry summer conditions it loses part of its nutritive value. During these periods, it is necessary that some extra feed should be provided, and this is usually done either by cutting the grass for hay or ensilage when there is an ample surplus on the pastures during the flush of the growing season, or by the provision of green fodder or root crops.
The following table gives detailed figures of the areas of the supplementary fodder crops available during each of the last five years.
| Year. | Chaff, Hay, or Ensilage. | Green Fodder. | Root and Other Crops for Feeding to Stock. | Total Area of Fodder Crops. | ||
|---|---|---|---|---|---|---|
| Cereal Crops. | Grasses and Clovers, including Lucerne. | Cereal Crops. | Other Crops. | |||
| Acres. | Acres. | Acres. | Acres. | Acres. | Acres. | |
| 1943–44 | 120,270 | 573,632 | 88,200 | 237,067 | 400,289 | 1,419,458 |
| 1944–45 | 101,337 | 601,109 | 66,566 | 244,930 | 401,540 | 1,415,482 |
| 1945–46 | 87,779 | 483,509 | 54,622 | 242,868 | 387,682 | 1,256,460 |
| 1946–47 | 78,099 | 582,658 | 66,909 | 244,871 | 396,557 | 1,369,094 |
| 1947–48 | 71,241 | 606,259 | 60,375 | 247,025 | 405,666 | 1,390,566 |
In 1947–48 grasses and clovers cut for hay or ensilage totalled 559,956 acres and lucerne 46,303 acres. Oats was the only cereal crop utilized in any quantity for this purpose, the area of oats cut for chaff, hay, or ensilage being 69,633 acres. Oats, also, was the principal cereal crop fed off to stock, accounting for 44,460 acres out of a total of 60,375 acres utilized for this purpose. The principal green-fodder crops apart from oats are rape (160,554 acres) and kale, including chou moellier, (76,577 acres). Swedes and turnips are the principal root crops grown in New Zealand, the total area sown in these crops in 1947–48 being 400,486 acres (including 37,589 acres of turnips and rape mixed). Other root crops included 2,879 acres of mangolds and 487 acres of carrots and parsnips. Pumpkins and marrows were grown for fodder to the extent of 1,205 acres.
The total and per-acre yields obtained from the various crops cut for chaff, hay, or ensilage during the 1946–47 and 1947–48 seasons are shown in the next table. In the cases of grasses and clovers cut for hay or ensilage, second or catch crops are taken into account in the yield figures, the total yield including crops from areas which had previously yielded some other crop in the season concerned. These areas are not counted twice in the statistics of acreage, and average yields cannot be obtained by the mere division of the total yield by the area figures.
| Crop. | 1946–47. | 1947–48. | ||
|---|---|---|---|---|
| Total Yield. | Yield Per Acre. | Total Yield. | Yield Per Acre. | |
| Tons. | Tons. | Tons. | Tons. | |
| Wheat | 1,535 | 1.85 | 1,723 | 2.13 |
| Oats | 141,058 | 1.85 | 122,716 | 1.76 |
| Barley | 1,507 | 2.06 | 1,340 | 1.95 |
| Maize | 433 | 3.26 | 387 | 3.42 |
| Grasses and clovers for hay | 991,866 | 1.98 | 992,156 | 1.93 |
| Grasses and clovers for ensilage | 159,174 | 3.99 | 189,056 | 4.05 |
| Lucerne | 109,612 | 2.57 | 112,152 | 2.42 |
GRASS-SEED.—The total area of grasses and clovers cut for seed during the 1947–48 season was 142,206 acres, yielding 1,674,208 bushels of 20 lb., as against 3,148,140 bushels from 254,268 acres in 1946–47. Canterbury, Otago, and Southland land districts between them provided 88 per cent. of the area cut.
The areas and yields of the principal grass and clover crops harvested for seed during each of the five years 1943–44 to 1947–48 are given in the table following.
| Crop. | 1943–44. | 1944–45. | 1945–46. | 1946–47. | 1947–48. |
|---|---|---|---|---|---|
* Not available. | |||||
| AREAS | |||||
| Rye-grass— | Acres. | Acres. | Acres. | Acres. | Acres. |
| Perennial | 56,276 | 47,287 | 58,345 | 71,833 | 44,783 |
| Italian | 11,096 | 17,547 | 21,013 | 21,131 | 4,418 |
| Cocksfoot | 10,797 | 15,475 | 18,941 | 11,482 | 6,672 |
| Chewings fescue | 12,036 | 15,181 | 17,161 | 17,663 | 16,537 |
| Crested dogstail | 4,947 | 10,512 | 9,609 | 11,907 | 4,913 |
| Red clover (including cow-grass) | 20,615 | 32,680 | 34,567 | 39,681 | 21,435 |
| White clover | 14,985 | 23,596 | 43,451 | 47,954 | 25,409 |
| Short-rotation (H1) rye-grass | * | 97 | 1,193 | 5,387 | 6,021 |
| YIELDS | |||||
| Rye-grass— | lb. | lb. | lb. | lb. | lb. |
| Perennial | 17,349,345 | 13,789,983 | 20,642,061 | 30,672,778 | 16,784,436 |
| Italian | 4,171,136 | 7,783,563 | 10,157,178 | 10,444,101 | 1,838,903 |
| Cocksfoot | 1,409,139 | 2,171,639 | 3,107,218 | 1,726,331 | 1,051,183 |
| Chewings fescue | 1,676,557 | 2,869,396 | 2,957,705 | 3,375,679 | 2,617,568 |
| Crested dogstail | 720,272 | 1,307,688 | 1,759,332 | 2,735,898 | 1,182,803 |
| Red clover (including cow-grass) | 2,383,389 | 2,357,708 | 3,784,176 | 3,772,555 | 3,540,764 |
| White clover | 1,624,396 | 1,894,142 | 5,336,481 | 5,932,133 | 3,461,284 |
| Short-rotation (H1) rye-grass | * | 72,332 | 539,089 | 2,665,072 | 2,261,232 |
A considerable export of grass-seed has been built up during recent years, especially with the United Kingdom, Australia, and the United States of America. In 1947 a considerable quantity of grass-seed was exported to various continental countries, notably Belgium. The total quantity of locally-produced grass and clover seed exported to all countries in 1947 amounted to 147,011 cwt., with a recorded value of £1,663,365.
Certification of Grass-seed.—The Department of Agriculture in 1930 instituted a scheme of Government certification of grass and clover seeds. First applied to perennial rye-grass and white clover, this scheme has since been extended to include seeds of Italian rye-grass, cocksfoot, red clover, short-rotation rye-grass, timothy, brown-top, Phalaris Tuberosa, and subterranean clover.
In the early stages of the scheme, certification, which has relationship only to the type of the plant and not to the purity or germination of the seed itself, was based on the identification of superior strains of seeds appearing in certain districts as a result of natural selection. At the same time, however, a programme of scientific plant selection was instituted by the Grasslands Division of the Department of Scientific and Industrial Research in an endeavour to still further improve the naturally occurring strains. The results of this selection work now form the basis of seed certification as applied to the first six of the above-mentioned types.
The task of raising seed of artificially selected strains involves in the first instance the testing of a large number of individual plants of the particular species. Only the plants giving the best performance under trial are resowed for further multiplication, possibly half a dozen out of thousands.
These plants are then seeded together to produce small quantities of seed of the selected strain. This seed in turn is multiplied up by the Grasslands Division until sufficient is available to sow areas on a field scale. At this stage the Department of Agriculture takes over the material available and multiplies the seed under contract with selected farmers.
The resultant seed is distributed by the Department as certified Government stock seed, sales being made through mercantile firms to those farmers most favourably situated to make the most use of it for further seed-production. From this stage the selected strain is multiplied under the Department's certification scheme through the stages of certified “pedigree” seed and certified “mother” seed to certified “standard” seed. These seeds are sold through the usual commercial channels.
While in the lower classes of some varieties of certified seed at the present time there may be included also seed from natural strains, the proportion of the latter is being steadily reduced. The purpose of the various classes is to obtain the greatest bulk of good-quality seed in the “standard” class in the shortest time. Thus, while the higher grades are important to seed-producers, farmers sowing for pasture purposes only, need not concern themselves with other than certified “standard” seed.
The first certified Government stock seeds—perennial rye-grass and white clover—were released by the Department in 1935, and the rapid expansion of the scheme is shown by the following figures, which indicate the seeds definitely identified under certification in the 1946–47 season alone as being of “pedigree” strain.
| Perennial rye-grass | 303,000 bushels. |
| Italian rye-grass | 182,000 bushels. |
| Short-rotation (H1) rye-grass | 177,000 bushels. |
| Cocksfoot | 73,000 lb. |
| White clover | 122,000 lb. |
| Red clover | 381,000 lb. |
| Timothy | 37,500 lb. |
It must be remembered that these figures do not include seed of pedigree strain which is included in the same class with seed of natural strain, and, therefore, not readily identifiable.
PASTURE GRASSES.—Researches and experiments in regard to pasture grasses are regular features of the activities of both the Department of Agriculture and the Department of Scientific and Industrial Research. These experiments, which extend right on to individual farms throughout New Zealand, and are conducted in co-operation with the farmers themselves, are wide in their application, and cover all the major phases of pasture management, dealing in particular with such items as pasture mixtures, suitability as to soil types, methods of establishment and management, the efficient use of fertilizers, &c. The results are made available per medium of the Journal of Agriculture and such allied publications, as well as by special pamphlets, which are distributed without charge. The farmer is thus enabled to avail himself of, and profit by, highly specialized knowledge and experience. In addition, a constant endeavour is being made not only to improve existing strains by such measures as seed certification and the provision of pedigreed seed referred to above, but also to evolve new strains. At the beginning of the year 1948 there were 18,091,038 acres under artificially sown grasses (including 748,465 acres cut for seed, hay, or ensilage during the season), and in addition 13,647,379 acres of occupied land still remained in tussock or naturally established native grasses, making a total of 31,738,417 acres of grassland in occupation. The following table shows the respective areas occupied by artificially sown grasses and by tussock and other naturally established native grasses during the five years specified.
| Year. | Artificially Sown Pasture Grasses.* | Tussock and other Naturally Established Native Grasses. | Total Area under Grass.* | |
|---|---|---|---|---|
| Cut for Seed, Hay, or Ensilage. | Not Cut for Seed, Hay, or Ensilage.† | |||
* Includes lucerne. † Includes approximately 200,000 acres also sown with crops. ‡ Approximate. | ||||
| Acres. | Acres. | Acres. | Acres. | |
| 1943–44 | 715,244 | 17,029,225 | 13,850,000‡ | 31,600,000‡ |
| 1944–45 | 781,651 | 16,857,169 | 13,850,000‡ | 31,500,000‡ |
| 1945–46 | 708,147 | 17,246,867 | 13,968,330 | 31,923,344 |
| 1946–47 | 836,926 | 17,239,831 | 13,827,111 | 31,903,868 |
| 1947–48 | 748,465 | 17,342,573 | 13,647,379 | 31,738,417 |
TOP-DRESSING (PASTURE LANDS).—The following figures, covering the year 1947–48, relate only to grassland top-dressed, fertilizers used in connection with field crops not being included.
| Nature of Top-dressing. | North Island. | South Island. | New Zealand. |
|---|---|---|---|
| Acres. | Acres. | Acres. | |
| Artificial fertilizers only | 2,388,169 | 266,252 | 2,654,421 |
| Lime only | 195,344 | 353,117 | 548,461 |
| Both artificial fertilizers and lime | 1,105,698 | 375,645 | 1,481,343 |
| Totals | 3,689,211 | 995,014 | 4,684,225 |
Top-dressing in New Zealand is carried out mainly on cattle-grazing areas, including, of course, dairy-farms; the North Island, which contains 86 per cent. of the total cattle, accounted in 1947–48 for 79 per cent. of the area top-dressed.
The following table shows particulars of areas of grassland top-dressed during the last five years.
| Year. | Area Top-dressed. | |||
|---|---|---|---|---|
| With Artificial Fertilizer only. | With Lime only. | With both Artificial Fertilizer and Lime. | Total Area Top-dressed. | |
| Acres. | Acres. | Acres. | Acres. | |
| 1943–44 | 1,471,067 | 729,683 | 1,169,215 | 3,369,965 |
| 1944–45 | 1,602,887 | 726,467 | 1,317,037 | 3,646,391 |
| 1945–46 | 1,757,762 | 606,744 | 1,288,743 | 3,653,249 |
| 1946–47 | 2,237,300 | 566,018 | 1,456,676 | 4,259,994 |
| 1947–48 | 2,654,421 | 548,461 | 1,481,343 | 4,684,225 |
In the decade prior to 1941–42 top-dressing had been rapidly expanding throughout New Zealand, culminating in the high figure of 4,649,317 acres top-dressed in 1940–41. Subsequent decreases were mainly attributable to the cessation of supplies of rock phosphate from Nauru and Ocean Islands as a direct consequence of military operations in the Pacific. In the three years ended 30th June, 1940, the quantity of phosphate shipped to New Zealand from this source totalled approximately 987,000 tons, and the severance of the supply created a serious problem leading to a system of rationing.
Supplies of artificial fertilizer are now coming to hand in increasing quantities and are approaching pre-war proportions, but it has been estimated that full supplies will not be available until 1950. The area top-dressed with artificial fertilizer in 1947–48, including cases where lime also was used, was 4,135,764 acres, as compared with 4,398,345 acres in the year 1940–41. A noticeable feature has been the increased use of lime during the period that phosphatic fertilizers were in such short supply.
The activities of the Department of Agriculture and the Department of Scientific and Industrial Research in the treatment of experimental plots from the various aspects of soil and crop requirements, and the subsequent data published thereon, have been an important factor in conveying to the farmer the many advantages to be derived from the scientific treatment of pastures.
GARDENS AND PLANTATIONS.—The figures for market gardens, plantations, &c., for the last five years are shown below. State gardens and plantations are covered by these figures. It should be noted that the statistics relate only to holdings of 1 acre or upwards outside boroughs.
| Year. | Market Gardens. | Nurseries. | Private Gardens, &c., | Plantations. |
|---|---|---|---|---|
* Approximate. | ||||
| Acres. | Acres. | Acres. | Acres. | |
| 1943–44 | 16,083 | 871 | 83,000* | 859,737 |
| 1944–45 | 16,826 | 923 | 83,000* | 867,450 |
| 1945–46 | 13,161 | 982 | 75,022 | 861,008 |
| 1946–47 | 13,029 | 1,127 | 78,933 | 869,959 |
| 1947–48 | 13,580 | 1,118 | 80,518 | 871,356 |
The mobilization of large numbers of troops for home-defence purposes early in 1942, the presence of considerable numbers of Allied servicemen in New Zealand, and the demand for vegetables for members of the Allied Forces in the South Pacific, resulted in a considerable expansion in vegetable-production during the 1942–43 season followed by further increases in 1943–44 and 1944–45.
With the passing of this special demand for vegetables, the area in market gardens fell from 16,826 acres in 1944–45 to 13,161 acres in 1945–46, but there was little change during the next two years. Compared with the pre-war year 1938–39, however, the area in 1947–48 showed an increase of 5,774 acres, or 74 per cent.
The Commercial Gardens Registration Act, which came into force on the 1st May, 1943, provides for the compulsory registration of all areas of½ acre or over of certain specified vegetables for sale for human consumption. The following vegetables are covered by the Act: Asparagus, bean, beetroot, Brussel sprouts, cabbage, carrot, cauliflower (including broccoli), celery, cucumber, leek, lettuce, marrow, melon, parsnip, pea, pumpkin, radish, rhubarb, silver beet, spinach, squash, sweet corn, tomato.
ORCHARDS AND THE FRUIT INDUSTRY.—A great impetus to the planting of fruit-trees was given by the discovery that tracts of land, principally in the Nelson land district, which formerly were regarded as being practically useless, were eminently suited for growing fruit, particularly apples. For a time, considerable areas of this and other land were annually added to New Zealand's orchards, but the acreage then declined until it became stabilized in the neighbourhood of 25,000 acres. However, a further decline set in after 1935–36, the 1947–48 figure of 18,667 acres showing a decrease of 6,405 acres as compared with the 1935–36 total of 25,072 acres. These figures refer to orchards of¼ acre or over on holdings of 1 acre or more situated outside borough boundaries.
The following table shows the area outside borough boundaries which has been returned as under fruit-trees at each of the last ten annual enumerations.
| Your. | Acres. |
|---|---|
| 1938–39 | 21,753 |
| 1939–40 | 20,899 |
| 1940–41 | 20,064 |
| 1941–42 | 19,544 |
| 1942–43 | 19,190 |
| 1943–44 | 19,196 |
| 1944–45 | 19,614 |
| 1945–46 | 18,235 |
| 1946–47 | 18,253 |
| 1947–48 | 18,667 |
The production of apples predominates, this crop accounting for over half the total area in orchards. The percentages (estimated) of areas under production of the principal kinds of fruit under cultivation are as follows: Apples, 55.8; pears, 6.1; stone-fruit, 26.8; lemons, 4.7; other citrus, 5.6; other tree fruits, 1.0.
The Orchard-tax Act, 1927 (amended in 1933 and 1934), continuing legislation dating from 1916, provides for the levying in each year of a tax of 2s. per acre on commercial orchards, with a minimum tax of 5s. Of the proceeds, £850 is paid over to the Now Zealand Fruitgrowers' Federation, and the balance credited to the vote of the Department of Scientific and Industrial Research for use as required in assisting the industry. Authority also exists for the imposition of a special orchard-tax in the case of apple, pear, and quince orchards in commercial fruitgrowing districts for the purpose of combating fireblight. Imposition is discretionary, however, on the part of fireblight committees elected by the fruit-growers in the various districts. While the tax may not exceed 5s. per acre, or part of an acre, the specific amount (within the above limits) is at the discretion of the committees, and is collected at their request by the Department of Agriculture. Neither tax is payable in respect of any orchard with fewer than 120 fruit-trees.
Commercial orchards registered as at March, 1948, numbered 3,645, of which 1,911 were taxable and 1,734 non-taxable. The total orchard-tax payable in respect of the year 1947–48 was £1,701.
The relative sizes of taxable orchards in New Zealand are:—
| Acres. | Number. |
|---|---|
| 1 to 5 | 947 |
| 6 to 10 | 503 |
| 11 to 15 | 239 |
| 16 to 20 | 116 |
| 21 to 25 | 41 |
| 26 to 50 | 57 |
| Over 50 | 8 |
The production from commercial orchards for the 1947 season was as follows:—
| Bushels. | |
|---|---|
| Apples | 1,933,000 |
| Pears | 287,000 |
| Stone-fruit | 396,000 |
| Lemons | 106,000 |
| Other citrus | 86,000 |
| Quinces | 22,920 |
The New-Zealand-grown Fruit Regulations 1940 dealt with the grading, packing, and sale of fruit generally, and provided for the collection from growers by means of inspection-fee stamps of a levy of½ d. or 1d. per case (according to the size of the case) of apples, pears, and lemons sold on the local markets. This levy remained in force until February, 1944, when it was abolished.
The growing of outdoor grapes is chiefly confined to the districts situated between the North Cape and Hawkes Bay, the total area returned in vineyards in 1948 being 939 acres. The greater portion of the crop is used for winemaking, several wines of excellent quality being manufactured.
HOPS.—According to returns covering holdings of 1 acre or over outside boroughs there were 624 acres under hop-vines in the season 1947–48. In addition, it is estimated that approximately 80 acres are also grown in boroughs yearly.
Practically the whole of the hop gardens are located in Waimea County. Production per acre usually ranges between 1,200 lb. and 1,500 lb., and the aggregate crop is usually sufficient to satisfy local requirements as well as to provide a surplus for export. However, the industry received a severe setback in the 1946 season when production was estimated at 1,828 bales, as against 3,103 bales in the preceding season. The incidence of black-root disease, which was responsible for the low yield, was again evident in 1947, resulting in another poor yield. Ways and means of combating this disease, which threatens the future of the industry, are now the subject of a special investigation by the Department of Scientific and Industrial Research.
TOBACCO.—Although the cultivation of tobacco-leaf on a commercial basis was initiated comparatively recently, the industry has made marked progress and growers are becoming increasingly familiar with the methods and plant required for the production of cured leaf acceptable to manufacturers. Commercial tobacco-growing is confined to those to whom licences are issued by the Tobacco Board established under the Tobacco-growing Industry Act, 1935, to control the industry. Most of the tobacco produced is flue-cured, producing a yellow-leaf tobacco which is largely used for the manufacture of cigarettes, the balance, air-cured, being used mainly in the manufacture of smoking mixtures and pipe tobacco.
The following particulars relating to tobacco-production have been taken from the annual report of the New Zealand Tobacco Board. It should be noted that the figures relate to the total commercial tobacco-production and not merely to holdings of 1 acre or over situated outside borough boundaries, as is the case with the rest of the statistics contained in this Section.
| Season. | Number of Growers. | Area Planted. | Production. |
|---|---|---|---|
| Acres. | lb. | ||
| 1943–44 | 414 | 3,066 | 3,083,094 |
| 1944–45 | 487 | 3,303 | 3,286,067 |
| 1945–46 | 553 | 3,405 | 4,080,135 |
| 1946–47 | 628 | 3,805 | 4,706,723 |
| 1947–48 | 661 | 4,322 | 4,770,827 |
The production figures represent the weight of the leaf purchased from growers before redrying. Flue-cured leaf accounted for 96.2 per cent. and air-dried leaf for 3.8 per cent. of the 1947–48 crop.
The total leaf purchased from growers in 1947–48 amounted to 4,770,827 lb.
PHORMIUM.—Large areas in various parts of New Zealand are covered with phormium, or New Zealand flax, the fibre of which is largely used for rope-making, &c. An area of 35,398 acres was returned as under phormium on occupied holdings in 1947–48.
LINEN FLAX.—As a result of the exigencies of war, an entirely new industry was inaugurated in New Zealand—the growing of linen flax. Linen fibre is extensively used commercially, but assumed special importance as an essential war commodity. As the United Kingdom had previously imported 90 per cent. of her requirements, mainly from Russia, attention was of necessity paid to the possibility of obtaining supplies elsewhere.
Investigations into the growing of linen flax in New Zealand were first instituted in 1936, and much valuable research work was carried out by the Department of Scientific and Industrial Research in collaboration with the Department of Agriculture. These investigations demonstrated the possibility of the establishment of the industry in New Zealand, and led to an officer being sent abroad to study the industry at first hand and to purchase the necessary processing machinery for an experimental factory.
Though 403 acres of linen flax were grown in 1939–40, the industry was not established on a commercial basis till the 1940–41 season, when 13,118 acres were grown under contract to the Crown in response to a request received from the British Ministry of Supply that New Zealand should grow 15,000 acres. A request that sowings be further extended resulted in 20,200 acres being grown in 1941–42, followed by 21,067 acres in 1942–43. Owing to easement of the position and as a result of discussions with the British Ministry of Supply, it was decided to curtail the acreage in 1943–44, with the result that the area dropped to 9,755 acres. However, the area rose again to 12,686 acres in 1914–45.
With the cessation of hostilities the immediate necessity for linen-flax products for specific war requirements no longer being a vital factor, the demand naturally lessened; consequently, the area grown in 1945–46 fell sharply, only 4,590 acres being grown. This further fell to 4,070 acres in 1946–47, with a slight rise to 4,554 acres in 1947–48. However, the industry would appear to have been firmly established, even if on a reduced scale to that pertaining during the war years. A corporation was formed under the Linen Flax Corporation Act, 1945, to organize and develop the industry, to carry on the business of producing linen-flax products, and to market any such products in New Zealand or overseas. The Act transferred to the Corporation all assets and liabilities held by the Crown for linen-flax purposes, and prohibits the incorporation of any other body for similar purposes.
During the year 1946, 12,545 cwt. of linen flax (fibre and tow), valued at £119,248, were exported, while in 1947 the quantity was 15,244 cwt., and the value £140,265.
SUMMARY OF LIVE-STOCK.—The numbers of live-stock of various kinds at each of the last five annual enumerations were as shown in the following table, Detailed statistics of live-stock, by counties and land districts, are contained in the Statistical Report on Agricultural and Pastoral Production issued annually by the Census and Statistics Department. This publication also contains the summary tables appearing in parliamentary paper H.-25, which is devoted exclusively to a statistical analysis of the annual sheep returns. These returns were not collected in 1946. It should be noted that, unless otherwise stated, the statistics quoted in the tables in this subsection relate to holdings of 1 acre or upwards situated outside borough boundaries.
| — | 1944. | 1945. | 1946. | 1947. | 1948. |
|---|---|---|---|---|---|
* Includes those in boroughs and on holdings under 1 acre. † Not available. | |||||
| Horses | 225,823 | 217,689 | 216,335 | 206,575 | 203,885 |
| Dairy-cows in milk | 1,647,920 | 1,678,943 | 1,661,944 | 1,657,690 | 1,713,532 |
| Cattle (including dairy cows) | 4,439,258 | 4,590,926 | 4,666,782 | 4,633,800 | 4,716,287 |
| Sheep shorn during season | 29,799,229 | 30,284,677 | 30,475,740 | 30,214,772 | 30,075,213 |
| Lambs shorn during season | 5,039,760 | 5,245,191 | 5,335,050 | 4,929,263 | 5,697,455 |
| Lambs tailed during season | 18,421,936 | 19,453,306 | 19,561,458 | 18,642,298 | 19,835,046 |
| Sheep (including lambs) as at 30th April* | 33,200,298 | 33,974,612 | † | 32,681,799 | 32,483,138 |
| Breeding-ewes as at 30th April* | 20,549,716 | 20,865,858 | † | 20,743,782 | 21,055,482 |
| Pigs (total) | 573,362 | 593,828 | 549,391 | 545,874 | 548,177 |
| Breeding-sows | 77,281 | 77,202 | 72,573 | 67,938 | 68,354 |
In the following tables the figures of live-stock are given for each land district. Horses, dairy cows in milk, total cattle, sows, and total pigs are as at 31st January, 1948. Sheep shorn, lambs shorn, and lambs tailed are for the season 1947–48, while breeding-ewes and total sheep are as at 30th April, 1948.
| Land District. | Horses. | Dairy Cows in Milk. | Total Cattle. | Breeding-sows. | Total Pigs. |
|---|---|---|---|---|---|
| North Auckland | 27,093 | 375,071 | 779,525 | 14,897 | 119,619 |
| South Auckland | 41,779 | 608,064 | 1,252,683 | 26,477 | 212,103 |
| Gisborne | 12,856 | 40,788 | 357,979 | 2,297 | 16,643 |
| Hawkes Bay | 14,107 | 50,956 | 396,155 | 1,837 | 14,304 |
| Taranaki | 12,958 | 221,935 | 409,748 | 6,317 | 53,692 |
| Wellington | 28,610 | 214,614 | 862,069 | 8,768 | 66,191 |
| Marlborough | 3,833 | 13,131 | 53,300 | 611 | 4,665 |
| Nelson | 3,714 | 31,867 | 76,146 | 1,811 | 16,316 |
| Westland | 1,522 | 12,585 | 48,327 | 647 | 6,301 |
| Canterbury | 24,713 | 61,399 | 205,426 | 3,101 | 25,067 |
| Otago | 17,590 | 34,847 | 126,147 | 933 | 7,783 |
| Southland | 15,110 | 48,275 | 148,782 | 658 | 5,493 |
| Totals | 203,885 | 1,713,532 | 4,716,287 | 68,354 | 548,177 |
| Land District. | Sheep shorn. | Lambs shorn. | Lambs tailed. | Breeding ewes.* | Total Sheep.* |
|---|---|---|---|---|---|
* Includes those in boroughs and on holdings under 1 acre. | |||||
| North Auckland | 1,113,299 | 341,949 | 692,225 | 752,906 | 1,178,414 |
| South Auckland | 2,998,291 | 898,362 | 2,159,446 | 2,285,033 | 3,291,297 |
| Gisborne | 2,040,599 | 824,404 | 1,080,443 | 1,236,896 | 2,162,783 |
| Hawkes Bay | 3,989,493 | 955,185 | 2,589,506 | 2,792,075 | 4,289,345 |
| Taranaki | 901,388 | 265,080 | 580,667 | 592,083 | 920,607 |
| Wellington | 6,477,494 | 2,083,868 | 4,183,556 | 4,206,986 | 6,653,097 |
| Marlborough | 949,752 | 55,572 | 466,304 | 597,530 | 1,048,670 |
| Nelson | 384,668 | 21,598 | 186,649 | 253,529 | 136,392 |
| Westland | 64,559 | 6,320 | 55,840 | 56,343 | 73,469 |
| Canterbury | 4,730,747 | 175,077 | 3,306,651 | 3,548,033 | 5,196,865 |
| Otago | 3,470,943 | 48,085 | 2,137,271 | 2,366,932 | 3,872,564 |
| Southland | 2,953,980 | 21,955 | 2,396,488 | 2,367,136 | 3,359,635 |
| Totals | 30,075,213 | 5,697,455 | 19,835,046 | 21,055,482 | 32,483,138 |
The next table shows the proportion per cent. of the various kinds of livestock in each land district. The figures show that the dairying and beef-production industries are both largely monopolized by the North Island, which has 86 per cent. of the total cattle and 88 per cent. of the dairy stock. Localizing the dairying industry still further, it is found that over half of the milking-cows in New Zealand are in the area comprised of the land districts of North and South Auckland. Taranaki and Wellington are practically equally important as regards the number of cows in milk; between them they account for over one-quarter of the total.
Taking the number of beef cows two years old and over as a guide to beef-production, Wellington Land District easily leads with nearly one-quarter of the New Zealand total. South Auckland is second, followed by Hawkes Bay, Gisborne, and North Auckland, in that order. These live districts together depasture 82 per cent. of cows reserved for beef-production.
Pig-farming is largely an adjunct of dairy-farming, and consequently the distribution of swine closely follows that of dairy cattle. Taranaki, however, which is mainly a cheese-producing district, has 13.0 per cent. of New Zealand's milking-cows, but only 9.8 per cent. of the pigs, while Canterbury, with only 3.6 per cent. of the cows in milk has 4.6 per cent. of the pig population.
Sheep-farming is more evenly distributed between the North and South Islands, The land districts of major importance are Wellington, Canterbury, Hawkes Bay. Otago, and Southland, in that order, these five districts accounting for 72 per cent. of the total sheep population in 1948.
The location of each class of live-stock according to land districts is now given in percentage form.
| Land District. | Dairy Cows, Two Years Old and over (in Milk). | Cows and Heifers, Two Years Old and over (other than for Dairying). | Total Cattle. | Breeding-sows. | Total Pigs. | Total Horses. | Sheep shorn.* | Lambs shorn.* | Lambs tailed.* |
|---|---|---|---|---|---|---|---|---|---|
* Sheep shorn, lambs shorn, and lambs tailed during season, remaining particulars for stock as at 31st January. | |||||||||
| North Auckland | 21.89 | 9.55 | 16.53 | 21.82 | 21.82 | 13.29 | 3.70 | 6.00 | 3.49 |
| South Auckland | 35.49 | 16.39 | 26.56 | 38.74 | 38.69 | 20.49 | 9.97 | 15.77 | 10.89 |
| Gisborne | 2.38 | 16.06 | 7.59 | 3.36 | 3.04 | 6.31 | 6.78 | 14.47 | 5.45 |
| Hawkes Bay | 2.97 | 16.13 | 8.40 | 2.69 | 2.61 | 6.92 | 13.27 | 16.76 | 13.05 |
| Taranaki | 12.95 | 4.06 | 8.69 | 9.24 | 9.79 | 6.35 | 3.00 | 4.65 | 2.93 |
| Wellington | 12.53 | 23.78 | 18.28 | 12.83 | 12.08 | 14.03 | 21.54 | 36.58 | 21.09 |
| Marlborough | 0.77 | 1.68 | 1.13 | 0.89 | 0.85 | 1.88 | 3.16 | 0.98 | 2.35 |
| Nelson | 1.86 | 1.11 | 1.61 | 2.65 | 2.98 | 1.82 | 1.28 | 0.38 | 0.94 |
| Westland | 0.73 | 1.18 | 1.02 | 0.95 | 1.15 | 0.75 | 0.21 | 0.11 | 0.28 |
| Canterbury | 3.58 | 4.14 | 4.36 | 4.54 | 4.57 | 12.12 | 15.73 | 3.07 | 16.67 |
| Otago | 2.03 | 2.58 | 2.68 | 1.36 | 1.42 | 8.63 | 11.54 | 0.84 | 10.78 |
| Southland | 2.82 | 3.34 | 3.15 | 0.96 | 1.00 | 7.41 | 9.82 | 0.39 | 12.08 |
SHEEP.—Although the first permanent establishment of sheep took place in 1834, when a small flock of Merinos was brought from Sydney and landed on Mana Island, it was not till the early 1840's that flocks were established in the Canterbury and Wellington districts. Other districts followed soon after. These original flocks were Merinos, but experience showed that this breed was not suited to the wetter parts of the North Island. In many districts in the South Island, however, they became firmly established in the high country, where the Merino or Merino crossbred are the only sheep capable of standing up to the conditions occasioned by extremes of climate. In the following two decades a number of English breeds were imported, notably Romneys, Southdowns, Lincolns, and English and Border Leicesters. The Merino ewe furnished the foundation of the crossbred stock, which made Canterbury meat and lamb famous on the British meat markets. Towards the end of the last century systematic inbreeding of Merino-longwool half-bred sheep resulted in the evolution of the now world-known Corriedale breed. The Romney Marsh has long been the most popular sheep, and accounts in the North Island for nearly 94 per cent. of the total flock sheep other than crossbreds. In the South Island, where it is increasing in popularity, this breed accounts for approximately 25 per cent. of flock sheep other than crossbreds.
Owing to staffing and other difficulties arising out of the war, the annual collection of sheep returns was not carried out in 1942 or 1943. The collection was resumed in 1944, and the numbers enumerated as at 30th April of that year constituted a new high figure for New Zealand, being 821,524 above the previous record established in 1938. This was superseded by the 1945 figure of 33,974,612, which represented a further increase of 774,314. The collection of returns was suspended in 1946 owing primarily to printing difficulties but was again resumed in 1947. The number of sheep recorded as at 30th April, 1947, 32,681,799, showed a decrease of 1,292,813 as compared with the 1945 figure. This was attributed largely to heavy killings consequent on severe drought conditions prevailing in the summer and autumn of 1946. The 1948 figure of 32,483,138 showed a further decrease of 198,661. However, the number of breeding-ewes in 1948 rose by 311,700. This would appear to indicate that the fall in the total number of sheep was merely the temporary result of an increased killing programme in 1947–48.
In the following table showing sheep distribution by Islands, the Chatham Islands are included in the South Island, as they form portion of the Canterbury-Kaikoura Sheep District. The figures include sheep in boroughs and on holdings under 1 acre.
| Year. | North Island. | South Island. | Total Sheep at 30th April. |
|---|---|---|---|
| 1935 | 15,749,016 | 13,327,738 | 29,076,754 |
| 1936 | 16,371,844 | 13,741,860 | 30,113,704 |
| 1937 | 17,065,135 | 14,240,683 | 31,305,818 |
| 1938 | 17,705,999 | 14,672,775 | 32,378,774 |
| 1939 | 17,509,222 | 14,387,869 | 31,897,091 |
| 1940 | 17,075,056 | 13,987,819 | 31,062,875 |
| 1941 | 17,862,330 | 13,889,330 | 31,751,660 |
| 1944 | 18,899,656 | 14,300,642 | 33,200,298 |
| 1945 | 19,108,733 | 14,865,879 | 33,974,612 |
| 1947 | 18,123,773 | 14,558,026 | 32,681,799 |
| 1948 | 18,388,446 | 14,094,692 | 32,483,138 |
The following table shows the number of rams, wethers, breeding-ewes, dry ewes, and lambs in New Zealand for the last five years for which figures are available.
| Year. | Rams. | Wethers. | Breeding-ewes. | Dry Ewes. | Lambs. | Totals. |
|---|---|---|---|---|---|---|
| Stud Sheep (entered in Flock-book) | ||||||
| 1941 | 13,256 | 259,681 | 7,262 | 180,251 | 460,450 | |
| 1944 | 13,524 | 301,283 | 6,667 | 217,340 | 538,814 | |
| 1945 | 13,436 | 309,447 | 6,230 | 223,491 | 552,604 | |
| 1947 | 13,361 | 316,203 | 7,250 | 234,254 | 571,068 | |
| 1948 | 12,380 | 314,145 | 6,092 | 237,892 | 570,509 | |
| Sheep of a Distinctive Breed but not entered in Flock-book | ||||||
| 1941 | 541,995 | 921,190 | 4,115,141 | 251,729 | 1,661,294 | 7,491,349 |
| 1944 | 526,397 | 1,121,587 | 5,966,993 | 328,474 | 2,306,629 | 10,250,080 |
| 1945 | 542,063 | 1,035,763 | 5,753,230 | 265,633 | 2,331,515 | 9,928,204 |
| 1947 | 554,158 | 1,095,275 | 6,044,814 | 282,147 | 2,180,881 | 10,157,275 |
| 1948 | 549,463 | 903,173 | 5,420,298 | 212,593 | 2,140,851 | 9,226,378 |
| Crossbred Sheep | ||||||
| 1941 | 5,274 | 1,468,940 | 15,656,111 | 663,642 | 6,005,894 | 23,799,861 |
| 1944 | 4,062 | 1,484,518 | 14,281,440 | 758,151 | 5,883,233 | 22,411,404 |
| 1945 | 4,170 | 1,490,025 | 14,803,181 | 646,282 | 6,550,146 | 23,493,804 |
| 1947 | 5,360 | 1,396,791 | 14,382,765 | 641,418 | 5,527,122 | 21,953,456 |
| 1948 | 9,634 | 1,345,688 | 15,321,039 | 441,909 | 5,567,981 | 22,686,251 |
| Totals | ||||||
| 1941 | 560,525 | 2,390,130 | 20,030,933 | 922,633 | 7,847,439 | 31,751,660 |
| 1944 | 543,983 | 2,606,105 | 20,549,716 | 1,093,292 | 8,407,202 | 33,200,298 |
| 1945 | 559,669 | 2,525,788 | 20,865,858 | 918,145 | 9,105,152 | 33,974,612 |
| 1947 | 572,879 | 2,492,066 | 20,743,782 | 930,815 | 7,942,257 | 32,681,799 |
| 1948 | 571,477 | 2,248,861 | 21,055,482 | 660,594 | 7,946,724 | 32,483,138 |
The average size of the flocks was 979 in 1941, 1,007 in 1944, 1,039 in 1945, 997 in 1947, and 975 in 1948. The subdivision of the largo estates of the pioneering days and the practice of running small flocks on dairy-farms, a typical feature of recent activities, has resulted in a decrease in the average size of flocks as compared with earlier days. Since the beginning of the present century, however, there has been little variation, although an upward tendency was evident between 1939 and 1945, due no doubt to the decrease in dairy stock during the war period. A classification according to size shows the following position.
| Size of Flocks. | 1941. | 1944. | 1945. | 1947. | 1948. |
|---|---|---|---|---|---|
| 1 to 200 | 7,800 | 7,350 | 6,851 | 7,197 | 7,208 |
| 201 to 500 | 7,735 | 7,472 | 7,109 | 7,011 | 7,330 |
| 501 to 1,000 | 7,417 | 7,772 | 7,871 | 8,029 | 8,176 |
| 1,001 to 2,500 | 6,895 | 7,670 | 8,060 | 8,087 | 8,161 |
| 2,501 to 5,000 | 1,853 | 2,002 | 2,064 | 1,910 | 1,839 |
| 5,001 to 10,000 | 580 | 571 | 592 | 531 | 486 |
| 10,001 to 20,000 | 132 | 121 | 120 | 97 | 108 |
| 20,001 and over | 21 | 15 | 16 | 15 | 9 |
| Total flocks | 32,433 | 32,973 | 32,683 | 32,877 | 33,317 |
The numbers of different classes comprising the flocks in April, 1948, were as follows:—
| Breed of Sheep. | Stud Sheep entered in Flock-book. | Sheep of a Distinctive Breed not entered in Flock-book. | Totals. |
|---|---|---|---|
| Merino | 23,229 | 711,060 | 734,289 |
| Lincoln | 2,310 | 3,779 | 6,089 |
| Romney | 276,995 | 5,316,402 | 5,593,397 |
| Border Leicester | 14,485 | 15,200 | 29,685 |
| English Leicester | 5,335 | 7,939 | 13,274 |
| Shropshire | 638 | 936 | 1,574 |
| Southdown | 189,334 | 262,229 | 151,563 |
| Corriedale | 43,381 | 973,518 | 1,016,899 |
| Ryeland | 6,715 | 7,871 | 14,586 |
| Half-bred | 4,562 | 1,918,489 | 1,923,051 |
| Dorset Horn | 719 | 2,987 | 3,706 |
| Cheviot | 1,969 | 5,105 | 7,074 |
| Suffolk | 703 | 808 | 1,511 |
| Other breeds | 134 | 55 | 189 |
| Crossbred rams | 9,634 | 9,634 | |
| Totals | 570,509 | 9,236,012 | 9,806,521 |
| Flock sheep: Crossbreds and others not otherwise enumerated | 22,676,617 | ||
| Grand total | 570,509 | 9,236,012 | 32,483,138 |
WOOL-PRODUCTION.—Although seventh in order in actual size of flocks, in point of production of wool New Zealand is the fourth largest in the world and ranks third in the list of principal exporting countries. New Zealand specializes in the production and export of crossbred wool, and in this field her only serious competitors are Argentina and Uruguay. With the exception of a small annual consumption by local woollen-mills the whole of the wool produced in New Zealand is exported. The quantity used by local mills prior to the war was from 7,000,000 lb. to 8,000,000 lb. per annum, but this was greatly increased during the war period, consumption in 1942–43 being 15,285,048 lb. and in 1943–44, 14,663,242 lb. By 1946–47, however, it had fallen to 10,101,721 lb.
The following are the figures of estimated production in each of the last cloven seasons.
| Year ended 30th June, | Estimated Production. |
|---|---|
| lb. | |
| 1938 | 296,800,000 |
| 1939 | 327,700,000 |
| 1940 | 310,000,000 |
| 1941 | 331,500,000 |
| 1942 | 345,000,000 |
| 1943 | 340,000,000 |
| 1944 | 330,000,000 |
| 1945 | 372,000,000 |
| 1946 | 365,000,000 |
| 1947 | 367,000,000 |
| 1948 | 362,000,000 |
The above estimates have been obtained by a consideration of all available statistical information, and have been computed on a greasy basis.
The Wool Industry Act, 1944, which came into operation on 11th January 1945, provides for the establishment of the New Zealand Wool Board of ten members, this Board replacing the New Zealand Wool Council established under the Wool Industry Promotion Act, 1936, which the present Act repealed. The Board's principal concern is the promotion of the wool industry, particularly in regard to markets, scientific and industrial research in relation to wool and sheep with a view to improvement in quality and quantity, and the discovery of new or improved methods of utilization. Specific matters in relation to which the Hoard may be called upon to exercise certain functions are the production, handling, pooling, appraising, storage, distribution, marketing, and disposal of wool. The Hoard is empowered to act in combination or association with other bodies established outside New Zealand functioning on similar lines. It is also represented on the Wool Disposal Commission. For the purpose of providing funds to enable the Board to carry out its functions, the Act provides for a levy on all wool produced in New Zealand, the rate of the levy to be fixed each season by the Board. At the present time, however, the provisions in regard to the payment of the levy are suspended, but an equivalent amount is received by the Board from the contributory charge imposed by the Wool Disposal Act, 1945 (see page 886).
CATTLE—The total number of cattle recorded at the enumeration of 1948 was 4,716,287, as against 4,633,800 in 1947. The figures for 1948 grouped according to the classification in use, are as follows:—
| Dairy stock— | |
| Breeding-bulls, two years old and over | 57,464 |
| Cows and heifers, two years old and over— | |
| Cows in milk during season | 1,713,532 |
| Heifers not yet in milk | 68,071 |
| Cows not in milk during season, but intended to be used again for dairying | 40,516 |
| Heifers— | |
| One and under two years old | 356,507 |
| Under one year old | 369,289 |
| Bulls and bull calves under two years old to be used for breeding purposes | 32,910 |
| Total, dairy stock | 2,638,289 |
| Beef stock— | |
| Breeding-bulls, two years old and over | 22,874 |
| Cows and heifers, two years old and over | 775,654 |
| Heifers— | |
| One and under two years old | 194,143 |
| Under one year old | 190,804 |
| Steers, two years old and over | 463,686 |
| Steers and bulls— | |
| One and under two years old | 198,563 |
| Under one year old | 232,274 |
| Total, beef stock | 2,077,998 |
| Total, cattle | 4,716,287 |
Most of the leading breeds of the cuttle of Great Britain are represented in New Zealand by herds bred on sound lines. For some time prior to 1933 the development of the beef breeds was somewhat checked, partly owing to the advance taking place in dairying operations and partly through the difficulties of competing with other countries in the British market; but the successful inauguration of chilled beef shipments to the London market led to a marked increase in beef animals. Although the wartime arrangement for the purchase by the United Kingdom Government of New Zealand meat available for export did not include chilled beef, the schedule of prices was so framed that the producers of animals of the type required for the chilled beef trade would not suffer on account of the temporary cessation of the industry. A condition of the long-term contract for the purchase of meat by the United Kingdom Government, referred to on page 892, is that the chilled beef trade is to be progressively resumed as and when the shipping position permits.
Up to 1935 the breeding of dairy cattle made great progress in New Zealand. From then on, up to 1944, with the exception of 1941, when a slight increase was recorded, a series of successive decreases were experienced. The 1945 total of dairy cows in milk during the season, 1,678,943, represented an increase of 31,023 as compared with 1944, and it was hoped, owing to the favourable position shown by the increase in young dairy replacement stock, that the 1945 increase would be the forerunner of a series of improvements in the dairying position. However, drought conditions in the summer and early autumn months were responsible for very heavy cullings, actually resulting in a slight decrease (16,999) being recorded in 1946. A further slight decrease (4,254) was recorded in 1917, but the 1948 enumeration revealed an increase of 55,842 cows in milk as compared with the previous year.
Following is a special analysis made of the number of holdings with dairy cows in milk in the various land districts as at 31st January, 1948, grouped according to size of herd in milk. The figures relate to holdings of 1 acre and over situated outside borough boundaries. Totals for 1946 and 1947 are also given for purposes of comparison.
| Land District. | Number of Cows in Milk. | Total Holdings with Cows in Milk. | ||||||||||
|---|---|---|---|---|---|---|---|---|---|---|---|---|
| 1–9 | 10–19 | 20–29 | 30–39 | 40–49 | 50–59 | 60–69 | 70–79 | 80–89 | 90–99 | 100 and over | ||
| North Auckland | 3,094 | 1,165 | 1,545 | 1,610 | 1,422 | 870 | 673 | 384 | 285 | 162 | 309 | 11,519 |
| South Auckland | 2,410 | 607 | 855 | 1,275 | 1,460 | 1,336 | 1,227 | 930 | 679 | 447 | 1,109 | 12,335 |
| Gisborne | 1,252 | 225 | 227 | 141 | 91 | 72 | 48 | 33 | 21 | 16 | 59 | 2,185 |
| Hawkes Bay | 2,751 | 265 | 208 | 214 | 198 | 131 | 48 | 38 | 18 | 16 | 21 | 3,908 |
| Taranaki | 994 | 238 | 348 | 577 | 653 | 589 | 440 | 334 | 248 | 139 | 312 | 4,872 |
| Wellington | 4,386 | 652 | 728 | 930 | 724 | 479 | 334 | 240 | 139 | 88 | 193 | 8,893 |
| Marlborough | 1,009 | 83 | 85 | 73 | 43 | 17 | 9 | 8 | 3 | 2 | 3 | 1,335 |
| Nelson | 1,286 | 292 | 271 | 184 | 101 | 57 | 24 | 11 | 6 | 2 | 7 | 2,241 |
| Westland | 276 | 41 | 72 | 87 | 76 | 31 | 12 | 8 | 2 | 605 | ||
| Canterbury | 7,209 | 561 | 386 | 282 | 122 | 51 | 36 | 13 | 7 | 3 | 13 | 8,683 |
| Otago | 4,410 | 342 | 208 | 118 | 79 | 40 | 16 | 9 | 5 | 3 | 2 | 5,232 |
| Southland | 3,311 | 815 | 365 | 319 | 169 | 72 | 32 | 8 | 2 | 5 | 4,598 | |
| New Zealand— | ||||||||||||
| 1918 | 32,388 | 4,786 | 5,298 | 5,810 | 5,138 | 3,745 | 2,899 | 2,016 | 1,413 | 878 | 2,035 | 66,406 |
| 1947 | 32,065 | 5,135 | 5,499 | 5,947 | 4,876 | 3,522 | 2,762 | 1,946 | 1,314 | 814 | 1,891 | 65,771 |
| 1946 | 31,371 | 5,148 | 5,478 | 5,859 | 4,766 | 3,438 | 2,779 | 1,949 | 1,374 | 784 | 1,990 | 64,936 |
DAIRY-PRODUCE.—The Hairy Industry Act, 1908 (a consolidation of previous legislation), with its amendments, may in general terms be described as an Act to regulate the production, collection, treatment, preparation, and manufacture, under proper sanitary conditions, of dairy-produce—i.e., milk, cream, butter, cheese, and any other product of milk or cream—intended for sale for human consumption within New Zealand or for export.
Inspectors are empowered to inspect premises used for the production or manufacture of dairy-produce. Any defects affecting the cleanliness and sanitation of the premises, or of the plant, machinery, and apparatus used in connection therewith, may be ordered to be remedied to the satisfaction of the inspector, and until so remedied their use in the production of dairy-produce may be forbidden. Inspectors are authorized to condemn any dairy-produce considered unfit for human consumption, and the sale of unwholesome milk or other dairy-produce is prohibited.
Milk or cream purchased for the manufacture of dairy-produce and paid for according to the percentage of butterfat contained therein must have this percentage determined by the Babcock or the Gerber test. Dairy factories are required by regulations under the Act to pay different prices for different grades of milk or cream supplied for the manufacture of dairy-produce. Factories are also required to furnish to suppliers a certified annual statement of overrun, and provision is made for an independent investigation by the Audit Department where a supplier is dissatisfied with the statement received.
Dairy-produce intended for export must be sound and wholesome in all respects, and must comply with the requirements of the Act as to inspection, grading, and marking. The export of butter containing more than 16 per cent. of water or less than 80 per cent. of butterfat is prohibited. The export of cheese of which the water-free substance consists of less than 50 per cent. of fats wholly derived from milk is also illegal.
Wide powers are conferred to make regulations prescribing mutters of detail with regard to the production, manufacture, sale, and export of dairy-produce. In particular, regulations may be made for the registration of dairies, the licensing of persons carrying on the manufacture of dairy-produce, the registration of brands to be used on dairy-produce, and for the inspection, grading, packing, marking, stamping, and labelling of dairy-produce.
Comprehensive regulations covering all phases of the industry, as regards both “supplying” dairies and manufacturing dairies, are contained in the Dairy-produce Regulations 1938, gazetted on the 28th July, 1938, and consolidating all previous regulations on the subject.
The Dairy Industry Act provides for the registration of co-operative dairy companies. Companies so registered are authorized to accept or to compel the surrender of shares issued in certain cases, subject to the rights of shareholders being safeguarded. A dairy company must not include in its registered name the word “co-operative” unless it is entitled to be registered as a co-operative dairy company under the Act.
Production of Dairy-produce—The quantity of butterfat supplied to dairy factories from farms during 1947–48 was 357,914,000 lb., as compared with 349,352,000 lb. in the previous year, an increase of 2.4 per cent. The preliminary figure of 397,000,000 lb. for 1948–49 shows an increase of 10.9 per cent. over 1947–48. The following series of tables show for the years 1943–44 to 1947–48, the quantities of butterfat received into dairy factories from farms, the utilization in manufacture, and the quantities of butter, cheese, and other dairy products made. Preliminary figures for 1948–49, where available, are also shown.
| Factory Year. | Butterfat received from Farms. | Butterfat recovered from Whey. | Total Butterfat used in Manufacture. | |
|---|---|---|---|---|
| In Milk. | In Cream. | |||
*Not yet available. †Provisional. | ||||
| (000) lb. | (000)lb. | (000) lb. | (000) lb. | |
| 1943–41 | 100,820 | 230,884 | 4,634 | 336,338 |
| 1944–45 | 114,764 | 259,996 | 5,180 | 379,940 |
| 1945–46 | 106,447 | 209,815 | 4,813 | 321,075 |
| 1946–47 | 109,672 | 239,680 | 4,408 | 353,760 |
| 1947–48 | 114,949 | 242,965 | 4,397 | 362,311 |
| 1948–49 | * | * | * | 397,000† |
| Factory Year. | Butterfat used in Manufacture of— | |||
|---|---|---|---|---|
| Creamery Butter. | Whey Butter. | Cheese. | Condensed and Dried Milk, &c. | |
| (000) lb. | (000) lb. | (000) lb. | (000) lb. | |
| 1943–44 | 245,706 | 5,058 | 81,119 | 4,455 |
| 1944–45 | 278,779 | 5,571 | 91,123 | 4,467 |
| 1946–46 | 227,956 | 5,055 | 83,152 | 4,912 |
| 1946–47 | 263,252 | 4,543 | 80,912 | 5,053 |
| 1947–48 | 274,953 | 4,543 | 77,319 | 5,493 |
| Factory Year. | Creamery Butter Made. | Whey Butter Made. | Cheese Made. | Other Whole-milk Products Made. | Skim-milk Products Made. |
|---|---|---|---|---|---|
*Provisional. | |||||
| Cwt. | Cwt. | Cwt. | Cwt. | Cwt. | |
| 1943–44 | 2,673,003 | 54,932 | 1,842,957 | 294,334 | 203,667 |
| 1944–45 | 3,032,745 | 60,604 | 2,073,519 | 287,891 | 247,388 |
| 1945–46 | 2,479,268 | 54,749 | 1,890,607 | 320,950 | 231,233 |
| 1946–47 | 2,864,513 | 50,249 | 1,832,916 | 353,747 | 334,911 |
| 1947–48 | 2,990,425 | 49,205 | 1,728,902 | 394,160 | 361,512 |
| 1948–49* | 3,251,400 | 54,600 | 1,987,200 | 443,000 | 469,600 |
Changes in the usage of butterfat in dairy factories over recent years are indicated by the percentages in the following table. The drought experienced during the 1945–46 season was less severe in the principal cheesemaking areas than elsewhere so that cheesemaking was not depressed to the same extent as buttermaking.
| — | Percentage of Total Butterfat | ||||
|---|---|---|---|---|---|
| 1943–44. | 1944–45. | 1945–46. | 1946–47. | 1947–48. | |
| Butterfat received into factories from farms and used for— | Per Cent. | Per Cent. | Per Cent. | Per Cent. | Per Cent. |
| Buttermaking | 74.2 | 74.5 | 72.1 | 75.4 | 76.9 |
| Cheesemaking | 24.5 | 24.3 | 26.3 | 23.2 | 21.6 |
| Condensed and dried milk, &c. | 1.3 | 1.2 | 1.6 | 1.4 | 1.5 |
| Totals | 100.0 | 100.0 | 100.0 | 100.0 | 100.0 |
Estimates of the total production of butterfat and of the production of butterfat per cow are made each year. The figures represent the butterfat content of milk-production “at the pail,” including the butterfat content of milk fed to the stock, spilt, wasted, &c. The following table shows the estimated total production of butterfat and the estimated yield per cow for each of the last twelve seasons.
| Season. | Total Butterfat-production. | Estimated Yield per Cow in Milk. |
|---|---|---|
*Provisional. | ||
| Million lb. | lb. | |
| 1937–38 | 436 | 247 |
| 1938–39 | 401 | 230 |
| 1939–40 | 432 | 248 |
| 1940–41 | 467 | 262 |
| 1941–42 | 438 | 246 |
| 1942–43 | 408 | 235 |
| 1943–44 | 389 | 233 |
| 1944–45 | 433 | 255 |
| 1945–46 | 374 | 222 |
| 1946–47 | 410 | 244 |
| 1947–48 | 420 | 242 |
| 1948–49 | 460* | 259* |
Climatic conditions for the 1947–48 season were very favourable up to the middle of January, when drought conditions became apparent, particularly in Taranaki and Wellington; the result was that, in spite of the very good start, only a 2½-per-cent. increase in total butterfat production was recorded.
The climatic conditions during the 1948–49 season were excellent throughout and total butterfat-production increased by 9½ per cent. over the previous year; the total of 460,000,000 lb. was the second highest on record, as also was the average yield per cow.
Of the total production of 420,000,000 lb. butterfat in 1947–48 it is estimated that over 316,000,000 lb. (75.5 per cent.) was exported in the form of butter, cheese, and other milk products.
The following diagram shows the progress of the dairy industry during the last forty years, and also illustrates the disparity between the growth in the number of dairy cows and that of pigs.
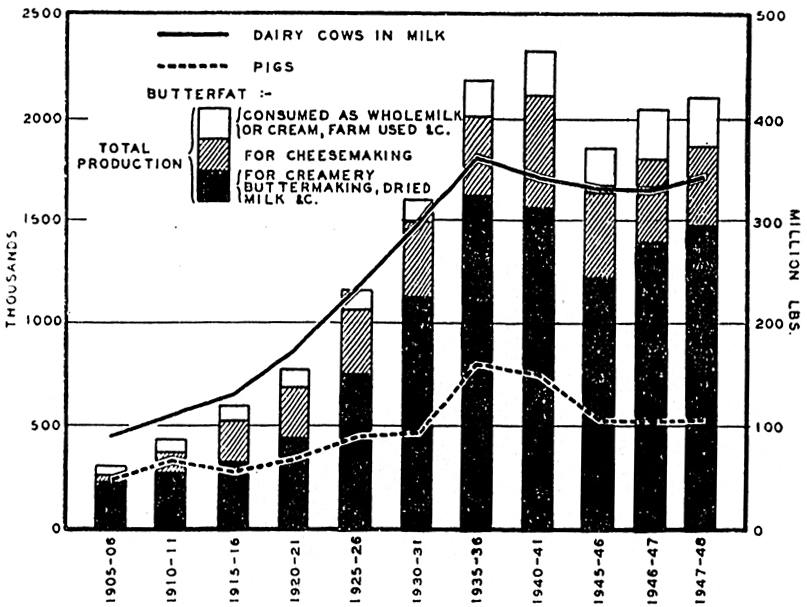
PIGS.—For some years prior to 1937 a quickening of interest in pig-production as an adjunct to dairy-farming raised pig numbers considerably above those noted previously, culminating in the record figure of 808,463 in 1936. However, a decline set in over the next three years, a small decrease in 1937 being followed by successive decreases of 46,000 and 73,000 in 1938 and 1939. Although the 1940 and 1941 figures showed increases of 30,538 and 55,179 respectively, these were practically offset by a decrease of 80,503 in 1942. Further decreases of 76,442 and 31,212 in 1943 and 1944 brought the total pig population to its lowest ebb since 1932. During the year 1944 it became apparent that certain classes of pig-foods were going to be in short supply. In order to overcome the position and as an inducement to further production, the Government made available subsidies on certain fodder crops to be grown for pig-feed, but the results proved disappointing. The total number of pigs recorded in 1945 showed a small increase over 1944, but the increase was confined to young pigs, no improvement being shown in the numbers of breeding-stock. In the following two years the position deteriorated still further, decreases being shown in both the total number of pigs and in the numbers of breeding-stock. The 1948 enumeration would appear to suggest that the decline has been arrested, although the increase was very slight.
| As at 31st January, | Pigs under Six Months Old. | Pigs Six Months and under One Year Old. | Boars One Year Old and over. | Sows One Year Old and over. | Total Pigs. |
|---|---|---|---|---|---|
| 1944 | 481,927 | 14,154 | 77,281 | 573,362 | |
| 1945 | 502,653 | 13,973 | 77,202 | 593,828 | |
| 1946 | 348,987 | 114,660 | 13,171 | 72,573 | 549,391 |
| 1947 | 330,063 | 135,185 | 12,688 | 67,938 | 545,874 |
| 1948 | 330,914 | 136,133 | 12,776 | 68,354 | 548,177 |
LIVE-STOCK SLAUGHTERING: The following table shows the numbers of the different classes of live-stock slaughtered for food during each of the last eleven March years. The figures are total killings—i.e., they include export-works, abattoirs, rural slaughterhouses, and killings on farms. Information in the case of the latter was not collected during the three years ended 31st March, 1945, but estimates have been included for those years.
LIVE-STOCK SLAUGHTERINGS (000 CARCASES)
| Year ended 31st March, | Sheep. | Lambs. | Cattle. | Calves. | Pigs. |
|---|---|---|---|---|---|
*Provisional. | |||||
| 1938 | 3,885 | 10,007 | 598 | 1,086 | 1,127 |
| 1939 | 4,702 | 9,962 | 594 | 1,022 | 1,042 |
| 1940 | 4,439 | 10,160 | 600 | 1,060 | 826 |
| 1941 | 5,151 | 12,037 | 728 | 1,068 | 981 |
| 1942 | 4,633 | 11,700 | 631 | 1,032 | 1,003 |
| 1943 | 4,310 | 11,251 | 769 | 1,045 | 842 |
| 1944 | 4,552 | 10,607 | 697 | 1,047 | 709 |
| 1945 | 4,717 | 10,780 | 610 | 966 | 679 |
| 1946 | 5,440 | 12,742 | 739 | 983 | 727 |
| 1947 | 5,177 | 11,826 | 664 | 1,039 | 604 |
| 1948* | 4,925 | 12,798 | 749 | 1,104 | 647 |
Sheep and Lambs—As the United Kingdom takes the great bulk of the mutton and lamb exported from New Zealand, it is interesting to note the extent to which New Zealand contributes to this market in comparison with importations from other countries.
In the calendar year 1938 New Zealand supplied 63 per cent. of the total frozen mutton imported into the United Kingdom and 50 per cent. of the total imports of frozen lamb. Australia, the next largest supplier in 1938, contributed 23 per cent. of mutton imports and 29 per cent. of lamb imports, while Argentina, which ranked third on the list, supplied 16 per cent. and 13 per cent. respectively.
That New Zealand has more than maintained her position in this connection in the immediate post-war years is evidenced by the figures for 1947 and 1948. In those two years New Zealand supplied 70 per cent. of the frozen mutton and 61 per cent. of the frozen lamb imported into the United Kingdom, whereas the proportions supplied by Australia fell to 6 per cent. for mutton and 13 per cent. for lamb. Imports from Argentina on the other hand, increased to 18 per cent. and 22 per cent. respectively.
Cattle.—New Zealand mutton and lamb form a substantial proportion of the meats imported into the United Kingdom, but New Zealand's frozen beef competes under difficulties with chilled and fresh beef from countries nearer the United Kingdom, with the consequence that the New Zealand share of the United Kingdom's beef imports has been relatively small. However, prospects for expansion brightened considerably when several trial shipments of New Zealand chilled beef were despatched to England in 1933. The experiments proved very successful, and were followed by larger shipments. In 1934 approximately 40,000 cwt. were forwarded to the United Kingdom, and each succeeding year witnessed a steady expansion of the trade, the quantity shipped in 1938 being 350,606 cwt. During the first nine months of 1939, 311,112 cwt. were exported; but, with the outbreak of war, the necessity for conserving shipping-space resulted in the temporary cessation of the industry.
The development of the export trade in chilled beef was not at the expense of frozen beef. Quantities of frozen beef shipped to the United Kingdom in 1937, 1938, and 1939, were 531,160, 544,764, and 672,310 cwt. respectively, as compared with 484,628 cwt. in 1936.
During the war period a considerably greater proportion of beef exports was shipped in boneless form in order to conserve shipping space and this practice was continued into the immediate post-war years. Also much greater quantities were exported in canned form. Consequently, it is not possible to give an exact comparison with pre-war years. It may be mentioned however, that in 1948, New Zealand supplied approximately 17 per cent. of the United Kingdom's imports of frozen and chilled beef (excluding edible offals, &c.), as compared with only 8 per cent. in 1938.
Pigs—As in the case of other frozen meats, New Zealand pork in normal times is shipped almost exclusively to the United Kingdom. During the year 1938 imports of New Zealand frozen and chilled pork into the United Kingdom amounted to 577,505 cwt. out of a total import of 1,180,866 cwt. In 1948, however, the United Kingdom imports of frozen and chilled pork were only 223,351 cwt., of which New Zealand supplied 191,049 cwt. of this class of pork. These figures illustrate the important position held by New Zealand as a supplier.
In international trade, exports of bacon far exceed those of other pig products, with the United Kingdom normally absorbing most of the exports of other countries. Although New Zealand supplies a substantial proportion of the imports of frozen and chilled pork into the United Kingdom, her contributions of bacon are negligible. It should be mentioned, however, that the major portion of the carcasses imported from New Zealand are “baconers” the curing process being carried out in the United Kingdom.
Calves.—Prior to the outbreak of the recent war veal production was displaying evidence of rapid development, and exports of veal had increased appreciably, mainly as a result of the organization of the “bobby” calf trade.
The term “bobby calf” is defined by regulations passed in August, 1947, as being “all calves that have a live-weight of less than 100 lb.”
HORSES—The following table gives numbers of horses by classes recorded, excluding horses in boroughs, figures for which are not available.
| — | 1946. | 1947. | 1948. |
|---|---|---|---|
| Draught and three-quarter draught | 96,677 | 86,694 | 81,871 |
| Spring-cart (including half-draught) | 33,813 | 34,921 | 32,346 |
| Hacks and light working horses | 72,040 | 71,317 | 73,882 |
| Thoroughbred and other horses | 13,805 | 13,643 | 15,786 |
| Total horses | 216,335 | 206,575 | 203,885 |
Since 1911, when the peak number of 404,284 was recorded, there has been, with two minor interruptions, a continuous decline in the number of horses in New Zealand. The two interruptions referred to occurred in the years 1916–18 and 1936–38, wherein slight increases were recorded.
During the last ten years the decrease has amounted to 61,268, or 30 per cent. The greater part of this decrease has occurred in draught and three-quarter draught animals, the numbers of which fell from 124,837 in 1938 to 81,871 in 1948, while those described as spring-cart (including half-draught) horses fell from 48,062 to 32,346. This decline in the numbers of horses of the heavy type has been accompanied by a marked increase in the use of mechanical traction for farm work, the number of agricultural tractors on farms in 1948 being 23,423, as compared with 8,031 ten years earlier. This subject is discussed in more detail in the preceding subsection.
Hacks and light working horses have decreased to a much lesser extent, the difference between 1938 and 1948 amounting to 3,287 only, while the class described as “thoroughbred and other” recorded a small increase of 701.
POULTRY.—A census of poultry has been an ancilliary inquiry associated with the census of population from 1861 onwards, with the exception of the censuses of 1896 and 1901. Until 1936, however, poultry kept by Maori households had not been brought within the ambit of the census. The extension of the inquiry to Maori households in 1936 furnished probably the first statistics in existence on this subject. The total poultry flocks of the Maoris, however, are small (91,976 in 1945 and 107,361 in 1936), and their omission from earlier censuses does not appear to have been of significance.
The following table shows the numbers recorded at the last six censuses. All references to fowls, ducks, &c., are intended to cover both male and female birds.
| Census. | Number of Households keeping Fowls, Ducks, Geese, or Turkeys. | Total Number of Fowls, Ducks, Geese, or Turkeys. | Fowls. | Ducks. | Geese. | Turkeys. |
|---|---|---|---|---|---|---|
*Not available. †Excluding Maori flocks. ‡ Including Maori flocks. | ||||||
| April, 1911 | * | 3,687,583 | 3,215,031 | 329,230 | 45,389 | 97,933 |
| October, 1916 | 134,234 | 3,465,638 | 3,141,354 | 220,808 | 46,955 | 56,521 |
| April, 1921 | 145,993 | 3,991,009 | 3,491,567 | 379,988 | 46,234 | 73,220 |
| April, 1926 | 158,856 | 3,781,145 | 3,308,384 | 352,030 | 43,879 | 76,852 |
| March, 1936† | 159,098 | 3,911,715 | 3,415,793 | 351,608 | 61,418 | 82,896 |
| March, 1936‡ | 166,354 | 4,019,076 | 3,488,516 | 377,791 | 66,667 | 86,102 |
| September, 1945† | 152,229 | 4,378,390 | 4,006,780 | 298,399 | 37,661 | 35,550 |
| September, 1945‡ | 159,333 | 4,470,366 | 4,070,683 | 319,918 | 41,903 | 37,862 |
The comparability of the foregoing figures is affected by the fact that the censuses of 1916 and 1945 were taken in the spring, whereas the other censuses were taken in the autumn. Poultry numbers are subject to considerable seasonal fluctuations, the main breeding season being in the early spring, when there would be considerable numbers of young chickens included in the figures, whereas in the autumn the culling of old birds would have been more or less completed. The increase of 582,167, or 16.7 per cent. in the number of fowls recorded in 1945 as compared with 1936 should therefore be accepted with caution. The principal feature of the 1945 results is the decrease shown for poultry other than fowls, particularly turkeys and geese. Compared with 1936, the number of ducks showed a decrease of 57,873 (15.3 per cent.), geese a decrease of 24,764 (37.1 per cent.), and turkeys a decrease of 48,240 (56.0 per cent.). It will be noted, however, that both ducks and turkeys recorded substantial decreases between the census of 1911, taken in the autumn, and the census of 1916, taken in the spring.
Number and Size of Flocks.—Although poultry-farming is regarded as a definite branch of the farming industry, the following classification as to sizes of flocks indicates that poultry-keeping is generally carried on merely as a sideline. Of the 159,333 households recorded as keeping poultry at the 1945 census, 330 cases were returned where geese or turkeys were kept but not fowls or ducks. These cases have been omitted from the table, and, in addition, only fowls and ducks have been taken into consideration. Of the 159,003 households keeping fowls or clucks, 133,181, or 83.8 per cent. had less than twenty-five birds, the corresponding percentage in 1936 being 80.8. In a further 21,919 eases the number of birds kept ranged from 25 to 99, making a total of 155,100 cases, or 97.5 per cent., in which the flocks consisted of less than 100 birds.
| Provincial District. | Number of Cases in which the Number of Fowls or Ducks was— | ||||||||||
|---|---|---|---|---|---|---|---|---|---|---|---|
| 1 to 12. | 13 to 24. | 25 to 49. | 50 to 99 | 100 to 199. | 200 to 299. | 300 to 399. | 400 to 499. | 500 to 749. | 750 to 999. | 1,000 and over. | |
| Auckland | 28,580 | 20,467 | 6,164 | 1,648 | 674 | 238 | 153 | 92 | 127 | 83 | 208 |
| Hawkes Bay | 4,598 | 3,676 | 992 | 256 | 95 | 31 | 11 | 13 | 12 | 5 | 22 |
| Taranaki | 4,801 | 3, 855 | 1,175 | 248 | 77 | 26 | 15 | 10 | 10 | 9 | 16 |
| Wellington | 13,324 | 8,361 | 1,877 | 429 | 151 | 85 | 37 | 21 | 43 | 22 | 71 |
| Marlborough | 1,200 | 1,155 | 369 | 104 | 24 | 6 | 5 | 3 | 2 | 1 | 2 |
| Nelson | 3,128 | 2,637 | 688 | 209 | 55 | 16 | 5 | 4 | 7 | 3 | |
| Westland | 916 | 633 | 156 | 39 | 9 | 4 | 3 | 2 | 1 | ||
| Canterbury | 11,502 | 7,775 | 2,884 | 1,165 | 376 | 133 | 82 | 48 | 76 | 36 | 89 |
| Otago— | |||||||||||
| Otago portion | 5,185 | 4,012 | 1,368 | 567 | 181 | 80 | 55 | 25 | 29 | 25 | 69 |
| Southland portion | 4,231 | 3,145 | 1,293 | 288 | 49 | 15 | 5 | 4 | 7 | 1 | 9 |
| Totals | 77,465 | 55,716 | 16,966 | 4,953 | 1,691 | 634 | 371 | 220 | 313 | 184 | 490 |
Of the 490 flocks in which the number of birds was 1,000 or over, 334 ranged from 1,000 to 1,999, 82 from 2,000 to 2,999, 43 from 3,000 to 3,999, and 31 exceeded 4,000. In 1936 the number of flocks of 1,000 or over amounted to only 194, but here, as elsewhere, the remarks concerning seasonal fluctuations in poultry numbers made earlier should be taken into consideration. The larger flocks at the time of the 1945 census would be unduly swollen by the inclusion of young chickens held for sale, this being the source from which the small or “backyard” poultry-keeper mainly obtains his flocks.
Poultry Control.—The Poultry Act, 1924, provides for the regulating of poultry-keeping and of the sale and export of poultry and eggs. Provision is made for the appointment of inspectors, on whom certain powers of entry are conferred for purposes of inspection of poultry or of eggs intended for sale or export. Poultry are required to be kept under sanitary conditions, and cruelty to poultry is made an offence. Every owner of poultry is required to notify an inspector of any outbreak of disease among his flock and to comply with the inspector's directions. It is an offence to sell diseased poultry. The Governor-General in Council is empowered to declare diseases, to appoint ports of export, and to appoint grading-stores.
In order to provide finance for the organization and development of the poultry industry, the Poultry-runs Registration Act was passed in December, 1933. The Act makes compulsory the annual registration of every poultry-run, which is defined as land used for the keeping of not less than twenty-five bead of poultry (hens and ducks not less than six months old) and the production of eggs for sale. The fee payable annually for registration is 2s. 6d. if the flock is in excess of twenty-four but does not exceed one hundred head. For each additional hundred (or part thereof) an additional 2s. 6d. is payable. A Board is constituted for the administration of the Act. Figures supplied by the Board show that the number of poultry-runs registered at 31st May, 1948, was 10,773, covering an aggregate of 1,790,048 birds.
BEES.—The rich dairy pastures of New Zealand and other localities where cattle raising is carried on extensively are particularly favourable for apiculture and the production of high-grade honey for the local and export markets; thus the North Island, which contains 86 per cent. of the cattle population, accounts for two-thirds of the total apiarists. The export trade is, of course, small when compared with the main primary industries, but is capable of considerable development. It is estimated that the total production of honey in a normal season is in the vicinity of 3,400 tons.
The Apiaries Act, 1927, which came into operation on the 1st January, 1928, was passed to consolidate and amend the law relating to the bee industry. Stringent regulations have been enacted in order to control foul-brood, bee moths, and other diseases of bees. Beekeepers are required to register all apiaries of one or more hives, and it is an offence to keep bees in an unregistered apiary. Only frame hives may be used, box hives being prohibited.
The introduction into New Zealand of bees, and used appliances for the keeping of bees and the harvesting of their products, is prohibited, save with the prior consent of the Minister of Agriculture. The consent of the Minister in regard to used appliances is restricted to such appliances as are necessary to serve as containers for bees so introduced.
Registrations under the Apiaries Act show that as at the 30th June, 1947, 11,386 apiaries and 154,488 colonies were registered by a total of 7,285 beekeepers.
Exports of honey for the last five years were:—
| Quantity. | Value. | |
|---|---|---|
| Year. | lb. | £ |
| 1943 | 16,456 | 801 |
| 1944 | 331,296 | 13,435 |
| 1945 | 188,528 | 7,531 |
| 1946 | 67,149 | 2,516 |
| 1947 | 80,506 | 3,053 |
A system of control on much the same lines as in the case of meat and dairy-produce was introduced by the Honey-export Control Act, 1924. The Board sot up (after a poll of producers, who decided by a large majority in favour of the scheme) acts in conjunction with the Marketing Department.
Prior to the issue of the Honey (1942–43 season) Emergency Regulations, apiarists had the option of disposing of their honey through the Marketing Department or through the ordinary trade channels. The regulations referred to, however, made it mandatory for a certain specified proportion of the honey produced during the 1942–43 season to be sold to the Marketing Department. Under the Honey Emergency Regulations 1944, apiarists were required to supply 30 lb. of extracted honey for each hive owned in excess of nineteen, provided that a minimum harvest of at least 40 lb. per hive had been achieved. Where the average production fell below 40 lb. the apiarist was entitled to retain the full production from nineteen hives and 10 lb. of extracted honey for every other hive owned by him. However, these regulations were not renewed in 1946, and the disposal of honey again became optional, though subject to a ceiling price. The facilities of the Marketing Department have been placed at the disposal of producers if they desire to avail themselves thereof.
THE administration of State forests and related afforestation activities in New Zealand was for many years under the control of the Lands and Survey Department, but in 1919 a separate Forestry Department was formed. This was reorganized in 1920 as a Department of State, called the State Forest Service, and was given statutory recognition and administrative authority by the Forests Act, 1921–22, which provides for a Minister of the Crown to hold office as Commissioner of State Forests.
Central management and control of the State Forest Service is exercised by the Director of Forestry, with the head office at Wellington. For the purposes of local administration New Zealand is divided into seven conservancies, each under the control of a Conservator of Forests, who is responsible to the Director of Forestry. Public convenience and economy are further achieved by the subdivision of conservancies into districts under the charge of Forest Rangers, who are under the direction of Conservators of Forests. With staff concentrated largely upon administrative reforms and practices in timber sales and upon large-scale exotic forest establishment the Forest Service operated for almost twenty years on a broad organizational basis. Administration was decentralized in conservancies as major territorial charges, but neither in these nor in Head Office was sufficient specialization developed to warrant detailed organization. The appointment of a number of technically qualified forest officers in 1939–40 made it possible to plan for the development of work on a divisional basis. Through the intervention of the war, the reorganization was completed only in 1947 although so far personnel difficulties have allowed staffing of only five divisions—services (clerical, accountancy, legal), engineering development (training and research), commercial (timber sales, logging, sawmilling, &c.), and management (working plans, silviculture, &c.). One other division—public and private forestry—has as yet only a token staff, whilst two others—conservation and industrial—remain to be developed. Research has been centralized at the Forest Experiment Station, Rotorua, where it is associated with the Forest Service Training Centre.
State forests are administered by authority of the Forests Act, 1921–22, its amendments of 1925 and 1926, section 17 of the Finance Act, 1924, sections 24–29 (inclusive) of the Statutes Amendment Act, 1939, section 7 of the Land Laws Amendment Act, 1939, sections 26 to 29 of the Statutes Amendment Act, 1941, and sections 17 to 21 of the Statutes Amendment Act, 1947. The powers conferred by the Forests Act, 1921–22, to deal with forest produce are subject to the provisions of the Coal-mines Act, 1925, the Mining Act, 1926, the Petroleum Act, 1937, and the Iron and Steel Industry Act, 1937. Section 23 of the Mining Amendment Act, 1934, provides for the payment to the Crown of compensation for damage to any land vested in the Crown resulting from mining operations. Such compensation in respect of State forests may be claimed by the Commissioner of State Forests from time to time as damage is caused.
The Timber Emergency Regulations 1939 came into force in September, 1939, after the outbreak of war, and provided for the appointment of a Timber Controller, authority for the control of forests (sale and purchase thereof), the regulation and control of timber-works, and the control of timber materials.
STATE FORESTS.—At the 31st March, 1948, the area of permanent State forest was 6,262,276 acres, and of provisional State forest 2,965,269 acres, these totals including 1,046,429 acres and 846,115 acres respectively of national-endowment lands. The aggregate area (9,227,545 acres) represents 13.9 per cent. of the total area of New Zealand proper.
FOREST RESOURCES.—The areas of indigenous forests estimated at intervals since the colonization of New Zealand have been:—
| Acres. | |
|---|---|
| 1847 | 27,600,000 |
| 1869 | 23,500,000 |
| 1886 | 21,200,000 |
| 1893 | 20,500,000 |
| 1909 | 17,000,000 |
| 1923 | 12,600,000 |
In addition to the above, there were at 31st January, 1947, 869,959 acres of timber trees on holdings of 1 acre or more outside borough boundaries. This area includes land afforested by the State, local authorities, farmers, and commercial concerns. A brief reference to the operations of the last mentioned are given towards the end of this section, under the heading, “Commercial Afforestation.”
A national forest survey is now proceeding.
FOREST POLICY.—The forest policy is essentially one of conservation and expansion—conservation of the indigenous forests for the twofold purpose of counter-erosion and sustained timber-production, and expansion of the exotic forests for the creation of a supplementary timber-supply. Only by the integrated use of both upland and lowland forests for the preservation of their timber productivity and of their counter-erosion, their watershed, and their æsthetic and recreational activities, can the objective of the national forest policy—the enjoyment by the public of the maximum economic and social values, both direct and indirect—be achieved.
Important features of the timber-supply situation are:—
Eighty per cent. of the remaining virgin forests are overmature, and there is no net growth, new growth being offset by decay, &c.:
The conversion of overmature forests into healthy growing stands of indigenous species producing timber to the maximum capacity of the forest soil will necessitate silvicultural management extending over an extremely long period:
Current timber demands are depleting the virgin indigenous forests at such a rate—over 30,000 acres annually—that, without other provision being made, an adequate supply of timber would not be available during the whole of the intervening period:
The establishment of exotic forests to supplement the indigenous-forest resources is therefore of great importance, and large forests of exotic trees have accordingly been established during recent years. The transfer of cutting from indigenous to exotic forests is being given increasing emphasis:
The important part which exotic forests will ultimately play in the forest economy of the country is already apparent. Experience in foreign countries where forestry has been practised over a period of several centuries indicates, however, that exotic species have definite limitations, and for this reason the national policy must envisage the management of the indigenous forests to secure their maximum possible production of timber.
Prominent amongst the departmental activities directed towards the solution of the timber-supply problem are:—
The application of working plans and the development of a comprehensive research programme:
The improvement of housing conditions for forest workers, and the wider use of permanent married employees:
The institution of technical forest management to economize in establishment, maintenance, and utilization activities in both indigenous and exotic forests:
The creation of new exotic forest units in timberless districts remote from timber-supplies:
The establishment of State-owned forest industries, including sawmills, box factories, planing-mills, wood-preservation plants, &c., to act as demonstration control and salvage units in the indigenous and exotic forests.
SOIL EROSION.—As one of the chief features of the forest policy, prevention of avoidable denudation and soil erosion is an important function of the Forest Service. While nothing can be done about the geological erosion which is constantly going on above, and even to some extent below, the vegetation limit of the mountain-ranges, the staying of further avoidable erosion at lower levels is definitely possible. It is well known that erosion results from misuse of the land covering, and in New Zealand at least the fundamental causes have been fire and grazing. It follows that control of these two factors is fundamental to the solution of the erosion problem. Every possible attention to these two matters has been devoted in upland State forests, but the problem is far from being an easy one.
The question of combating erosion is being investigated with a view to establishing demonstration projects, in order that the most practicable and economic methods of checking the destruction and restoring a protective vegetative cover on denuded areas may be ascertained.
A forward step in connection with the erosion problem was taken during the 1941 session of Parliament, when the Soil Conservation and Rivers Control Act was passed. This Act sets up a Soil Conservation and Rivers Control Council, which has the general direction of the administration of the Act; and also makes provision for the setting-up of Catchment Boards, each with jurisdiction over the catchment area of one or more rivers. At 31st March, 1948, twelve Catchment Boards had been constituted under the Act. Close liaison is maintained between the Council and the Forest Service.
FOREST MANAGEMENT.—To preserve the existing indigenous forests to posterity it is not sufficient to fence them against stock, and to protect them from fire. The composition of the forest gradually changes, one type of forest growth succeeding another. Generally the valuable timber-producing species are replaced by weed species such as kamahi, taraire, rewarewa, &c.
Of all the indigenous softwoods amenable to silvicultural treatment kauri is outstanding, and the results of investigations have been most promising. Plans for perpetuating the kauri forests and for rationing the supply of kauri timber are now in operation. Both the remaining virgin stands and the cut-over areas carrying regeneration are being brought under forest working-plans, which govern both the extraction of logs and the silvicultural treatment required to maintain forests in a state of maximum productivity. Permanent extraction routes are now being constructed, over which dead and overmature trees will be extracted along with such large healthy trees as can be removed without endangering subsequent regeneration, and logs will be disposed of on the extraction routes. A minimum diameter cutting-limit of 33 in. breast high has been imposed for virgin stands; and provision has been made for the preservation of exceptional trees and clumps as national monuments and of trees for seeding purposes to assist regeneration.
Preliminary work on the control of cutting in certain podocarp forests is being carried out with the objective of so controlling the cut that regeneration will be encouraged, that timber-production will be regularized over a definite period, and that more efficient utilization will be secured.
Forest working-plans are also being prepared for exotic forests as rapidly as present staff difficulties will allow, and a number are now completed and approved by the Commissioner of State Forests. The history and description of individual compartments are essential preliminary data for working-plans, and the completion of these records for several more of the older exotic State forests is now in view.
A significant feature of managed State forests is their logging by the State and the sale of logs in place of trees. By no other means is it practicable to secure the close control of logging operations, so essential to the preservation of young growth and the encouragement of natural regeneration. Just as the inauguration of block sales in place of “royalty payments off the saw” has effected a marked reduction in forest wastage, so will the adoption of log sales further reduce avoidable waste.
In addition to the supply of logs for the production of sawn timber, the exotic forests are being managed to yield a wide range of raw material for other uses and industries. Firewood, round constructional timbers, posts and poles for creosoting, wood work bolts, peeler logs for plywood, and pulp-wood for the manufacture of pulp and paper products, can all be supplied incidental to the production of saw logs, and plans are well advanced for the establishment of the major industries involved.
The exotic forest capital resource now being established will yield a surplus over the country'S demands, after allowing for the supplies of virgin indigenous timber to be rigidly economized. This calls for a twofold study of national significance—one, economic, covering basic industrial and transport factors, and the other, research, covering the scientific utilization of the entire range of wood products ranging from fuel to cellulose derivatives. Economical production in order to compete in the world'S market is the objective which is now being pursued.
In 1918–19 exotic-pine timbers, as judged by the quantities sawn, ranked only sixth amongst the timbers of New Zealand. By 1938–39 they had reached second place, a position which has since been maintained, the disparity as compared with rimu, which occupies first place, becoming less each year. The annual cut of rough sawn exotic-pine timber in 1918 was 4,000,000 board feet. By 1938–39 the output had risen to 41,868,000 board feet, and reference to the table on p. 336 shows a continued increase in subsequent years, the quantity for 1947–48 (135,300,000 board feet) being 320 per cent. above the 1938–39 total. The light weight, easy seasoning, and easy-working properties of these woods tend to enable them to replace rimu to a very large extent, and to dominate the markets for practically all classes of framing and light construction timber, just as already the same properties have given them dominance in the boxing and crating markets. Even for finishing-work the exotic softwoods, with their light weight and satisfactory glueing properties, find extensive use as core timber for laminated and other built-up construction, while some grades are coming into use also for flooring, weatherboarding, interior finish, and furniture. This will assist in effecting economies in the use of the more valuable indigenous timbers, which will be utilized as veneers, &c., rather than in the solid form.
STATE FOREST UTILIZATION.—The installation of a modern type of log-gang sawmill at Whakarewarewa, to operate in the extensive exotic forests in that locality, was completed early in 1940, and has already fully demonstrated the accuracy of sawing which is inherent in this type of equipment. Associated with the mill are seven kilns for the artificial drying of timber, a boxmaking plant for the production of boxes, crates, and other wood products, and a creosoting plant for the protection of fencing-posts, telegraph-poles, &c.
Current wood-utilization research by the State Forest Service includes studies on decay-causing organisms and wood-destroying insects; also the routine testing of different types of creosote and other wood-preservatives which have promise of general commercial application. The State Forest Service continues to emphasize that measures for the protection of building-timber against both decay and insect attack should be based primarily on good design and maintenance. In conjunction with these measures, the intelligent use of standard preservatives, such as pentachlorphenol in a light oil solvent, is being encouraged, particularly for the protection of those timbers peculiarly subject to attack by virtue of their exposure conditions.
Particular attention has been directed to the use of anti-sapstain chemicals to ensure the production of bright clean stock from the exotic pines, and the excellent results obtained under even the worst conditions of block stacking indicate that the small expenditure involved will result sooner or later in the almost universal use of such treatments for all exotic pine timbers other than those which are to be kiln dried.
The experience of the Service in the use of exotic timbers in its house building and constructional programme has demonstrated forcibly the necessity for further investigating the painting of exotic timbers. The resinous and relatively knotty nature of much of the exotic timber necessitates the development of special paints and painting methods, and to solve these problems a special set of exposure panels has been established and is being kept under close observation.
The adaptation of creosoted timber to a wide range of structures has been investigated. Specimen culverts, bridges, and fire-towers have been made, and prefabricated timbers for both bridges and pontoons supplied. Large quantities of fencing-posts and telegraph and power poles are being produced, and the production of creosoted farm gates is also receiving attention.
FOREST-FIRE PREVENTION.—One of the greatest problems of forest-conservation is that of fire control. Fire lookout stations are now provided in most of the major exotic forest areas, with patrols covering areas of particular danger in both exotic and indigenous forests. Access roads and tracks, tool caches, and telephone communications are being continually improved, and radio-telephone and mobile fire-fighting equipment brought into use. The development of radio for rapid assembly of fire-fighting crews is an acknowledgment of the fact that the fire is most easily fought in its early stages, whilst aircraft, which have already proved invaluable in directing actual fire-fighting work, are now being used for patrol purposes.
A further technical advance has been the setting-up of fire hazard prediction instruments measuring relative humidity and the relative dryness of forest fuels. These factors are co-ordinated with the wind velocity, rainfall deficiency, and air temperature to rate the relative fire hazard. Daily analyses of these data, made possible by radio communication, together with meteorological report permit interpretation of the various factors to predict dangerous conditions.
The 1947–48 fire season was characterized by conditions of moderate hazard over fairly long periods in many localities. Short periods of very high hazard were experienced in several localities in late spring and February-March periods. A large number of fires were reported from lookouts in State Forests, but only 48 of these fires were in State forest areas, involving an area of 4,198 acres, most of which was scrub or fern country.
Fire prevention and control-measures, formerly provided for in the Forests Act and regulations issued thereunder and in the Land Act, were consolidated and extended by the passing of the Forest and Rural Fires Act, 1947. Hitherto the statutory powers dealing with fire prevention and control were confined to areas constituted as fire districts, but the new Act provides for a suitable organization on a national scale devised to deal with the position with speed, economy, and efficiency by giving the necessary powers to local authorities. In this manner man-power and equipment are distributed so as to be available as far as is practicable at the time and place of need, consistent with the wide variation of fire hazard conditions throughout New Zealand.
Provision is made for the constitution of rural fire districts for securing the safety of trees, flax, and other plants, gum-lands, sand-dune areas, and peat lands from damage by fire, and for the declaration of a period during which it is an offence to light a fire except with a permit from a Rural Fire officer. The administering fire authority for a rural fire district is the Commissioner of State Forests or a Rural Fire Committee appointed for the purpose, as the case may require.
In soil-conservation districts the Soil Conservation and Rivers Control Council is the Fire Authority. Each County Council is the Fire Authority for so much of the county as is not included in a rural fire district, a soil conservation district, or a State forest.
Every Fire Authority is required to take effective measures for the prevention and control of fires in the area under its control, and is required to appoint one or more Rural Fire Officers and such other officers and employees as may be necessary for the purposes of the Act. Rural Fire Officers are given wide powers to deal with the prevention and suppression of fires, including the power to requisition the assistance of men over eighteen years of age.
The constitution of Rural Fire Districts is proceeding rapidly, and up to September, 1948, preliminary steps had been taken in twenty-five cases and final action in respect of fourteen districts. Fire districts were previously provided for under the Forest (Fire-prevention) Regulations 1940, but with the passing of the Forest and Rural Fires Act, 1947, all fire districts provisions of the Forests Act have been repealed. Each existing fire district, however, is to remain in existence for a period of twelve months from the passing of the new Act or until it is reconstituted or included in a rural fire district under the Act.
The fire district, with its season of controlled burning, has proved to be a valuable means of reducing the danger to forests from fire. The general public now realize the value of fire districts as a means of preventing indiscriminate fire-lighting and “burning-off” except under expert supervision.
CLASSIFICATION OF THE INDIGENOUS FORESTS.—The forests of New Zealand, as a whole, belong to that great division of the earth'S vegetation called rain-forest—a community with its most extreme development in the tropics. New Zealand rainforest may be naturally divided into two classes, subtropical rain-forest and subantarctic rain-forest, the former, in regard to its trees, being a mixed community of broad-leaved trees and conifers, and the latter a pure community of one or more of the species of beech (Nothofagus). For practical purposes the names rain-forest proper and beech-forest suffice. Between these two classes there are many intermediates, the one graduating into the ether.
Rain-forest proper consists of many kinds of tall, medium-sized, and small trees, together with a dense undergrowth of numerous species of shrubs and ferns. Woody lianes and huge epiphytes are characteristic, and bryophytes abound. This class of forest is generally confined to the coastal, lowland, and montane belts—the upper altitudinal line of the last-named becoming gradually lower in proceeding from north to south.
In regard to appraisal of timber, rain-forest proper is divided into the following groups, to each of which is appended its distribution: The kauri (extending northwards from a line joining Port Waikato to Tauranga); the rimu (throughout all three principal Islands, its heaviest stands being in the central part of the North Island and on the west coast of the South Island); the kahikatea (throughout the North and South Islands, occupying low-lying swampy ground); and the totara (throughout, but mainly in the central part of the North Island).
Beech-forest must be divided into milling-forest and protection-forest. The former consists of (1) forest where the hard beech (Nothofagus truncata) and the black beech (Nothofagus solanderi) are present in quantity, or where there is only the latter (this extends from the south of lat. 38° southwards to northern Nelson, Marlborough, and eastern Canterbury); (2) forest where the silver beech (Nothofagus menziesii) and the red beech (Nothofagus fusca) are either the sole or the principal species (they extend from the Thames mountains through the montane and lower subalpine belts southwards to north-western Nelson, Westland—but absent from the Taramakau River southwards for one hundred miles—and the fiord country of Otago); and (3) forest where the silver beech is pure or nearly so, such occurring principally in southern and western Southland, and extending over the western slopes of the Dividing Range. Protection-forest, where beeches predominate, particularly the mountain-beech (Nothofagus cliffortioides), is essentially high-mountain forest, but on Mount Egmont and on the western side of the Southern Alps, from somewhat north of the Taramakau River for rather more than one hundred miles southwards, the forest is modified rain-forest proper with thin-bark totara (Podocarpus hallii) and kaikawaka (Libocedrus bidwillii) as important trees. In Stewart Island Nothofagus is absent, and the trees of the upper forest are mainly kamahi (Weinmannia racemosa) and southern-rata (Metrosideros lucida).
In addition to the high forests there are scrub forests, of which those made up of manuka (in a wide sense)—Leptospermum scoparium and L. ericoides—are commercially important on account of the value of their wood for fuel, and because, in many instances, they are an early stage of rain-forest.
The foregoing gives merely a general classification of the forests, but, from the aspect of forestry, a division into smaller groups is essential, such to be based on the composition, structure, and life-history of each group. In this regard, altitude, climate, latitudinal change, and the nature of the soil have to be taken into consideration, as well as the combination and forms of the species composing the forest and their arrangement within the forest. In all forests, changes, progressive or retrogressive, are taking place, and, so far as rain-forest proper is concerned (apart from swamp-forest), in the North Island and the northern part of the South Island the tawa (Beilschmiedia tawa) is tending to predominate, and, in the remainder of the South Island and Stewart Island, the kamahi. On the other hand, beech-forest regenerates into similar forest.
Though the forest-tree species of New Zealand number about 112, only a few are of value as timber-trees; in fact, at present only six are being used to any extent by sawmillers, and, of these, five are coniferous (softwood) timbers. There are several—e.g., puriri, kohekohe, pukatea—which possess very high qualities, but which are now to be obtained only in such small quantities that they are of little commercial importance.
Chief Forest Trees.—A brief description of the principal forest-trees, with their distribution and the uses of their timber, is now given. The weights shown for the timber are per cubic foot, air-dry. For a description of additional forest-trees the reader is referred to the 1934 issue of the Year-Book or its immediate predecessors.
KAHIKATEA; WHITE PINE (Podocarpus dacrydioides).—This tree occurs to some extent in all forests except the beech-forests from north to south of the North and South Islands; formerly it was found in almost pure stands in swampy areas, but most of these stands have now been exploited. The average height of the tree is about 120 ft., and the average diameter about 32 in. The sapwood, which comprises the greater part of the log, is white, and the heartwood yellow. The timber (29 lb.) is straight in the grain, easily worked, and long, clean lengths and wide widths can be obtained. The yellow heartwood is durable, but the sapwood is very susceptible to the attacks of the larvæ of the white-pine borer. The timber is inodorous, and is at the present time used mainly for butter-boxes, cheese-crates, and other packages.
KAIKAWAKA; MOUNTAIN CEDAR (Libocedrus bidwillii).—Though the distribution of this tree is often local, its range extends from the Hauraki Gulf to the forests of South Otago. It is most plentiful on the west coast of the South Island. The average height of the tree is about 50 ft., with an average diameter of about 18 in. The timber (27 lb.) is dark red in colour, easy to work, light, and rather weak; it has considerable resemblance to totara, but is not so strong, and generally not so durable. The timber has been used for telegraph-poles, shingles, and palings. It has also been proved suitable for the manufacture of second-grade lead pencils, and at the present time is used for the manufacture of window-frames in the districts where it is obtainable. Being difficult to burn, it is specified for the construction of fireproof doors. Unfortunately, though occurring over a wide area, it is limited in quantity, and, if used freely, the supply would soon be exhausted.
KAURI (Agathis australis).—This, the largest tree of the New Zealand forest and the most celebrated, is rather restricted in its distribution, extending as it does only from a little to the north of lat. 38° S. to the extreme north of the North Island. Its average height is about 100 ft. The maximum diameter which has been measured is 22 ft., and a few trees still exist with diameters of 14 ft. The average diameter is, however, about 40 in. The timber (36 lb.) is light yellowish-brown in colour; it is straight in the grain, strong, easily worked, and remarkably free from knots and defects; probably there is no more generally useful softwood in the world. Though formerly much used for house-building, its present high price confines its use to railway-carriage and boat building, and cabinet and general joinery purposes. Mottled and figured kauri is much prized for cabinet-work. The kauri yields a very valuable resin called kaurigum. It is regrettable that the remaining stands of this valuable timber-tree are now limited.
MATAI; BLACK PINE (Podocarpus spicatus).—This tree occurs more or less plentifully in forests throughout the North, South, and Stewart Islands. Its average height is about 60 ft., and average diameter about 24 in. The timber (38 lb.) is light yellowish-brown in colour, straight in the grain, and easily worked. In the ground it is of second-rate durability, but it is very durable out of the ground. It is used chiefly for weather-boarding, exterior joinery, and flooring, and for the last-mentioned purpose is one of the best timbers in the world.
MIRO (Podocarpus ferrugineus).—This tree occurs in lowland and montane forests from the north of the North Island to the south of Stewart Island, but is most abundant in Southland. The average height is about 65 ft., and the average diameter about 20 in. The timber (36 lb.) is used in house-building, and is often sold as rimu, to which it bears considerable resemblance. The heartwood is brownish in colour, very fine in the grain, easily worked, and of exceptional strength, though not durable in the ground.
RIMU; RED PINE (Dacrydium cupressinum).—This, the principal timber-tree of the New Zealand forest, is to be found more or less in all forests except the pure beech-forests. The average height is about 100 ft., and the average diameter about 30 in. The timber (37 lb.) when first cut is reddish-brown, but it changes when seasoned to a light brown with darker and lighter streaks. It is fairly straight in the grain, easily worked, and is the chief timber used in house-building. It is often beautifully figured, and when so is used for furniture, doors, and panelling. A high grade of kraft pulp may be produced from rimu.
SILVER PINE; YELLOW SILVER PINE; PINK PINE (Dacrydium colensoi, D. intermedium, D. biforme, and D. kirkii).—The group of small podocarps, here taken together, is far from well known, while as commercial timbers there is no uniformity in the timber supplied, that of D. colensoi and D. intermedium being both sold as “silver pine.” In the case of the so-called “yellow silver pine” the timber is white and not yellow. As at present defined, D. colensoi occurs from near Kaitaia (but only occasionally) to the volcanic plateau, where it is fairly common, and in the South Island it forms (or originally formed) considerable stands in north-western Nelson and in Westland. D. intermedium has much the same range in the North Island, but rather wider (Thames mountains, Ruahine-Tararua mountains), and in the South Island it occurs in north-western Nelson, south-west Otago, and Stewart Island. D. biforme; except in the southern part of its range, belongs essentially to the mountains, and extends from the volcanic plateau to Stewart Island, but only where the rainfall is high. D. kirkii is confined to the North Auckland Peninsula from the Manukau Harbour northwards. Considering here only the extremely valuable timber (39 lb.) of the silver pine, it is whitish when first out, but darkening to a light yellowish-brown; it is straight in the grain and easy to work. Owing to its extreme durability it has been used mainly for railway-sleepers, telegraph-poles, and posts; it is occasionally beautifully mottled, and is then used for cabinet-work. The remaining supplies are now limited.
TANEKAHA (Phyllocladus trichomanoides).—This tree occurs, but not in great numbers, throughout the North Island and in the South Island in northern Marlborough and Nelson, extending southwards to near Karamea. In height it ranges from 50 ft. to 70 ft., with a diameter of 1 ft. to 2 ft. The timber (42 lb.) is yellowish-white, free from knots, close-grained, dense, heavy, and very strong, and shrinks very little in seasoning, and for this reason is favoured for the manufacture of astragals in greenhouse, which have to remain straight in varying conditions of heat and moisture. Tanekaha is the strongest New Zealand softwood. It is of uncertain durability in the ground, but is very durable out of the ground. In the past it was used for bridge-building, sleepers, and mine-props. It is now used in railway-carriage construction. The bark is very valuable, for it contains as much as 28 per cent. of tannin.
TOTARA (Podocarpus totara and P. hallii).—These trees, which are very closely related and hybridize freely, extend throughout all three Islands (P. hallii only in Stewart Island and subalpine forests), though in many localities the totara is rare. It is most plentiful in the forests of the central portion of the North Island. The average height is about 80 ft., and the average diameter about 30 in. The timber (30 lb.) is reddish when first cut, seasoning to a reddish-brown. It is straight in the grain, easily worked, but somewhat brittle. Its great durability (P. totara is the more durable) has caused it to be much used for railway-sleepers, wharf-piles, telegraph-poles, and posts. Its high price and its freedom from warping and shrinking are now, however, causing it to be used for such special purposes as window and door frames; it is also much used for veranda-posts, flooring, and steps.
BLACK BEECH (Nothofagus solanderi).—This tree occurs in abundance—but not everywhere—in the lowland and montane belts of the North Island southwards from about lat. 38° S. (but absent in south-western Auckland and western Taranaki), and, in the South Island, in northern Marlborough and Nelson, extending southwards through eastern Marlborough and Canterbury to Banks Peninsula and Alford Forest. The timber (49 lb.) is pale-reddish, or greyish, and frequently streaked with black. Probably it is fairly durable when in the ground, and it is suitable—to say the least—for rough buildings, fencing-posts, and structural purposes. At present it is used only for fencing-posts and firewood.
HARD BEECH (N. truncata).—This tree occurs in a few localities in the North Island from Kaitaia southwards to the Thames mountains, whence its distribution is the same as that of N. solanderi. In the South Island it is abundant in northern Marlborough, and extends through Nelson with its southern limit just north of the Taramakau River. Its height ranges from 60 ft. to 100 ft. or more, and its diameter from 2 ft. to 5 ft. Until recently its timber (48 lb.) was confused with that of the red-beech, but it is harder and probably more durable. When first cut it is pinkish in colour. Its uses are the same as those of its near relative, the red-beech. With the black-beech it forms many hybrids.
RED BEECH (N. fusca).—This tree extends from about lat. 37° S. on the Thames mountains southwards throughput the North Island in the montane belt (Mount Egmont excepted), and throughout the South Island where the rainfall is high (except southwards from the Taramakau River for one hundred miles), and in the south of Southland. It is a tall and massive tree, ranging from 60 ft. to rather more than 100 ft. in height, and 3 ft. to 6 ft. in diameter. The timber (44 lb.) when first cut is a pinkish-rod in colour, turning to a light brown on seasoning; it is hard, strong, easily split, durable, and of about the same weight as English ash. It is difficult to season, being particularly prone to honeycombing in drying, and for this reason has not been much used for house-building, except at one time on the Otago goldfields, where it has proved very durable. Its chief use at present is for posts and mine-props, and it is used to a small extent for sleepers and bridge-work. It is valuable for furniture and bentwood work. With the increasing scarcity of Australian hardwoods it is certain to have a much more extended use in the future.
SILVER BEECH (N. menziesii).—This tree has much the same distribution as the red-beech, but it ascends higher, and is plentiful in the west of Southland, east of the Divide, extending to the Longwood Range. It also occurs at several places near Dunedin, and in the vicinity of Mount Cook and on the Blue Mountains. The average height of the tree is about 80 ft., and the average diameter about 2 ft. The Southland timber (34 lb.) is of a pinkish colour when first cut, but it changes to a light brown with exposure. It is straight in the grain, easily worked, and strong: it is however, not durable in contact with the ground. It is now being used for flooring, interior finish, furniture, bentwood work, agricultural implements, bodies of motor-cars, billiard-tables, tool-handles, dowels, rifle-stocks, shoe-heels, casks, barrels, cheese-crates, and packing-cases, and its use in these and in other directions is sure to extend.
BLACK MAIRE (Olea cunninghamii).—This tree occurs in all forests (except the beech-forests) throughout the North Island, but it is only in the central portion that it is fairly plentiful. In the South Island it is found only in Marlborough, and is very rare. It occasionally reaches a height of 70 ft. and a diameter of 4 ft., but the average height and diameter are 40 ft. and 18 in. respectively. The wood (62 lb.) is light brown, often with dark streaks, and bears considerable resemblance to that of its relative, the European olive. It is extremely dense, heavy, hard, strong, and durable. It has been used to a small extent for framing for machinery and for bridge-building, but owing to its exceptional heat-giving property its chief use has been for firewood.
NORTHERN RATA AND SOUTHERN RATA (Metrosideros robusta and M. lucida).—The first-mentioned of these trees is found in most forests below 2,000 ft. in the North Island; it is rather rare in the South Island, being found only occasionally in the lowland forests of Marlborough and Nelson. This tree generally commences life as a “perching-plant” in the forks of other large trees, and therefrom sends down huge roots, which generally envelop and strangle the supporting tree. These roots usually (but not always) coalesce, and so form a huge bole with an average diameter of about 54 in., which is generally hollow. The southern-rata, though found only rarely in the North Island, is plentiful in the South Island and Stewart Island. It has usually the same habit of growth as an ordinary tree; its average height is about 50 ft., and the average diameter is about 20 in. The timber of both trees is reddish-brown in colour, extremely hard, heavy, strong, and (out of the ground) very durable; it is highly valued as firewood. On account of the difficulty of seasoning southern rata (71 lb.) without excessive twisting and warping it has not the same value as the northern species (55 lb.), which is used to a small extent for cross-arms for telegraph-poles and for wheelwrights work.
TAWA (Beilschmiedia tawa).—This tree is to be found in most forests of the North Island up to an altitude of about 1,700 ft. In the South Island it occurs in the coastal forests of Nelson and Marlborough. The average height of the tree is about 60 ft., and the average diameter about 20 in. The timber (46 lb.) is light brownish-white in colour, rather hard, straight in the grain, but somewhat brittle. It is difficult to season satisfactorily, and requires special treatment to ensure fungus-free timber. At present it is used for clothes-pegs and to a small extent only for inside lining and packing-cases, but, if kiln-dried, should find more extensive employment for flooring and interior finishing. It has been proved suitable for the manufacture of many classes of pulp and paper.
Principal Strength Properties of New Zealand Timbers.—The following table shows the principal strength properties of New Zealand timbers, both native and exotic species. The test samples were in the form of small clear specimens, the air-dry values being adjusted to 12 per cent. moisture content. In two of the exotic species, Douglas fir and insignis pine, tests of timber from two different localities are shown.
| Common and Botanical Name of Species. | Condition at Test. | Weight per Cubic Foot (Pounds). | Modulus of Rupture in Bending (Pounds per Square Inch). | Modulus of Elasticity in Bending (1,000 Bounds per Square Inch). | Maximum Crushing Strength Parallel to Grain (Pounds per Square Inch). | Shear Strength Parallel to Grain (Pounds per Square Inch). |
|---|---|---|---|---|---|---|
| Native Species | ||||||
| Beech, black (Nothofagus solanderi) | Green | 69 | 9,400 | 1,750 | 4,300 | 1,280 |
| Air-dry | 49 | 14,500 | 1,980 | 8,300 | 1,870 | |
| Beech, hard (Nothofagus truncata) | Green | 69 | 10,300 | 1,870 | 4,600 | 1,420 |
| Air-dry | 48 | 13,700 | 2,100 | 7,000 | 1,980 | |
| Beech, red (Nothofagus fusca) | Green | 61 | 9,100 | 1,720 | 3,900 | 1,260 |
| Air-dry | 44 | 11,400 | 1,930 | 7,600 | 1,850 | |
| Beech, silver (Nothofagus menziesii) | Green | 55 | 7,600 | 1,280 | 3,400 | 940 |
| Air-dry | 34 | 12,200 | 1,670 | 6,100 | 1,420 | |
| Black maire (Olea cunninghamii) | Green | 75 | 13,050 | 1,550 | 6,000 | 1,810 |
| Air-dry | 62 | 17,000 | 2,020 | 9,600 | 2,360 | |
| Hinau (Elaeocarpus dentatus) | Green | 70 | 8,800 | 1,590 | 4,300 | 1,380 |
| Air-dry | 45 | 12,300 | 1,610 | 6,600 | 1,610 | |
| Kahikatea or white pine (Podo-carpus dacrydioides) | Green | 51 | 6,300 | 960 | 2,500 | 810 |
| Air-dry | 29 | 9,500 | 1,140 | 5,100 | 1,340 | |
| Kaikawaka (Libocedrus bidwillii) | Green | 61 | 5,600 | 660 | 2,800 | 750 |
| Air-dry | 27 | 6,400 | 870 | 4,100 | 820 | |
| Kamahi (Weinmannia racemosa) | Green | 55 | 7,800 | 1,250 | 3,400 | 1,290 |
| Air-dry | 40 | 10,800 | 1,420 | 5,800 | 1,920 | |
| Kauri (Agathis australis) | Green | 51 | 7,800 | 1,570 | 3,400 | 940 |
| Air-dry | 36 | 13,100 | 1,890 | 5,600 | 1,220 | |
| Kohekohe (Dysoxulum spectabile) | Green | 57 | 7,300 | 1,290 | 3,100 | 790 |
| Air-dry | 34 | 10,900 | 1,400 | 7,100 | 840 | |
| Mangeao (Litsaea calicaris) | Green | 62 | 7,600 | 1,330 | 3,300 | 1,030 |
| Air-dry | 39 | 13,300 | 1,620 | 6,600 | 1,560 | |
| Matai (Podocarpus spicatus) | Green | 68 | 9,000 | 1,230 | 4,000 | 1,000 |
| Air-dry | 38 | 10,800 | 1,320 | 6,800 | 1,600 | |
| Miro (Podocarpus ferrugineus) | Green | 54 | 8,400 | 1,420 | 3,800 | 1,150 |
| Air-dry | 36 | 12,900 | 1,570 | 6,600 | 1,690 | |
| Pokaka (Elaeocarpus hookerianus) | Green | 65 | 6,200 | 1,000 | 3,200 | 1,260 |
| Air-dry | 39 | 10,000 | 1,100 | 5,500 | 1,730 | |
| Pukatea (Laurelia novae-zelandiae) | Green | 61 | 4,200 | 730 | 2,500 | 580 |
| Air-dry | 30 | 11,800 | 1,700 | 4,900 | 1,080 | |
| Rata, Northern (Metrosideros robusta) | Green | 72 | 11,300 | 1,710 | 5,200 | 1,610 |
| Air-dry | 55 | 18,200 | 2,340 | 9,200 | 1,940 | |
| Rata, Southern (Metrosideros lucida) | Green | 79 | 13,000 | 2,150 | 5,800 | 1,640 |
| Air-dry | 71 | 23,000 | 3,150 | 11,500 | 2,570 | |
| Rimu (Dacrydium cupressinum) | Green | 61 | 7,400 | 1,220 | 3,300 | 910 |
| Air-dry | 37 | 11,000 | 1,310 | 5,400 | 1,260 | |
| Silver pine (Dacrydium colensoi) | Green | 54 | 6,400 | 790 | 3,100 | 840 |
| Air-dry | 39 | 8,500 | 1,070 | 5,800 | 1,320 | |
| Taraire (Beilschmiedia taraire) | Green | 72 | 8,600 | 1,410 | 3,900 | 1,000 |
| Air-dry | 42 | 13,000 | 1,790 | 6,600 | 1,910 | |
| Tanekaha (Phyllocladus trichomanoides) | Green | 68 | 9,300 | 1,390 | 4,600 | 1,210 |
| Air-dry | 42 | 14,100 | 1,620 | 6,500 | 1,400 | |
| Tawa (Beilschmiedia tawa) | Green | 67 | 9,700 | 1,590 | 4,400 | 1,100 |
| Air-dry | 46 | 15,700 | 2,060 | 8,400 | 1,780 | |
| Totara (Podocarpus totara) | Green | 59 | 6,500 | 920 | 3,100 | 810 |
| Air-dry | 30 | 7,600 | 1,070 | 5,500 | 1,120 | |
| Exotic Species | ||||||
| Douglas fir (Pseudotsuga taxifolia), Mackenzie County | Green | 36 | 6,300 | 1,100 | 2,800 | 830 |
| Air-dry | 27 | 9,050 | 1,260 | 4,900 | 1,220 | |
| Douglas fir (Pseudotsuga taxifolia), Marlborough County | Green | 39 | 8,000 | 1,210 | 3,800 | 1,030 |
| Air-dry | 36 | 13,400 | 2,000 | 6,600 | 1,340 | |
| Insignis pine (Pinus radiata), Rotorua County | Green | 58 | 5,900 | 1,060 | 2,600 | 870 |
| Air-dry | 28 | 11,200 | 1,340 | 5,600 | 1,550 | |
| Insignis pine (Pinus radiata), New Brighton Borough | Green | 51 | 6,100 | 910 | 2,800 | 1,060 |
| Air-dry | 31 | 9,300 | 1,060 | 4,200 | 1,370 | |
| Macrocarpa (Cupressus macrocarpa), Tuapeka County | Green | 50 | 8,000 | 970 | 3,800 | 1,010 |
| Air-dry | 31 | 10,900 | 1,180 | 5,900 | 1,620 | |
| Larch (Larix decidua), Rotorua County | Green | 41 | 7,500 | 1,320 | 3,200 | 830 |
| Air-dry | 35 | 13,500 | 1,740 | 7,100 | 2,060 |
OUTPUT AND CONSUMPTION OF TIMBER.—For the year 1947–48 timber-production showed a phenomenal increase from approximately 354,000,000 board feet to almost 429,000,000 board feet, and thereby established a now record. The immediate target for post-war timber-production had been set at 420,000,000 board feet to meet the demand for an accelerated housing programme and to enable the accumulated arrears of maintenance to be overtaken as rapidly as possible, and also to permit the restoration of depleted stocks to satisfactory levels. This target has now been exceeded; and, while there is still a shortage of certain grades and qualities, for the first time since the early war years the over-all timber situation is relatively good.
The incidence of production by species did not register any marked change, the increased cut being spread over practically all species with the exception of kauri, which is now permanently reduced to a very low level. However, although the indigenous forests contributed to the increase in production as much as the exotic forests, it must be emphasized that the increased output from the former is purely temporary. Production from the indigenous forests may be maintained at a relatively high level for the next year or two, but the intention is to eventually reduce cutting to the point where a small annual yield of indigenous species can be maintained in perpetuity so that our prized indigenous timbers are not completely cut out and entirely lost to production. On the other hand, the substantial increase in the output of exotic species is merely the continuation of a trend which has been apparent for a number of years now and which is destined to lead within a few years to the dominance of the entire timber output by the exotic species. The fact that the production of insignis pine, which is the principal exotic species, has risen from only 10,000,000 board feet in 1930 to 135,000,000 board feet during 1947–48 provided clear evidence of the increasing popularity of this species and its general suitability for a wide variety of purposes. At the present time it is exceeded in output only by rimu, but within two or three years the position probably will be reversed. Hitherto the major portion of the cut of exotics has come from farm shelter-belts and wood lots, but henceforth these incidental and fortuitous supplies will steadily wane in importance as development of the exotic forests proper proceeds on a larger scale.
The subjoined table gives particulars of output by species for the past five years; quantities are quoted in board feet—i.e., units of 12 in. by 12 in. by 1 in. Figures for the year 1947–48 are subject to confirmation when the official collection of industrial statistics for the year is finalized.
| Species of Timber. | 1943–44. | 1944–45. | 1945–46. | 1946–47. | 1947–48. |
|---|---|---|---|---|---|
| Bd. Ft. | Bd. Ft. | Bd. Ft. | Bd. Ft. | Bd. Ft. | |
| Kauri | 4,308,000 | 2,878,000 | 2,801,000 | 2,283,000 | 1,400,000 |
| Rimu | 190,316,000 | 181,931,000 | 175,125,000 | 170,529,000 | 195,900,000 |
| Kahikatea, white-pine | 20,931,000 | 17,990,000 | 17,043,000 | 15,116,000 | 16,200,000 |
| Matai | 18,373,000 | 19,182,000 | 18,835,000 | 19,674,000 | 25,800,000 |
| Totara | 11,161,000 | 11,252,000 | 10,561,000 | 9,627,000 | 12,500,000 |
| Beech | 12,333,000 | 11,074,000 | 12,123,000 | 11,607,000 | 15,800,000 |
| Insignis pine | 83,229,000 | 85,713,000 | 96,819,000 | 111,591,000 | 135,300,000 |
| Other and unspecified | 10,096,000 | 10,113,000 | 11,416,000 | 13,529,000 | 25,800,000 |
| Totals | 350,747,000 | 340,133,000 | 344,723,000 | 353,956,000 | 428,700,000 |
Details of the 13,529,000 board feet of “other and unspecified” species for the previous year, 1946–47, are as follows:—
| Species. | Hoard Feet. |
|---|---|
| Tawa | 7,615,000 |
| Eucalypts | 1,240,000 |
| Poplar | 940,000 |
| Miro | 1,566,000 |
| Tanekaha | 130,000 |
| Taraire | 308,000 |
| Rata | 179,000 |
| Pukatea | 151,000 |
| Macrocarpa | 241,000 |
| Mangeao | 203,000 |
| Rewarewa | 175,000 |
| Puriri | 134,000 |
| Hinau | 89,000 |
| Other | 558,000 |
| Total | 13,529,000 |
Exports of New Zealand timber during the calendar year 1947 amounted to 8,856,000 board feet, valued at £180,880, the principal species being rimu (1,289,000 board feet), insignis pine (5,834,000 board feet), beech (909,000 board feet), matai (762,000 board feet).
Imports during the year comprised 21,625,000 board feet of sawn timber, including 1,301,000 board feet of Australian hardwoods, 13,400,000 board feet of Oregon pine (Douglas fir), and 3,149,000 board feet of western red cedar. The total value of sawn timber imported was £772,600. The figures of exports and imports of timber during the last five years are:—
| Year. | Exports of New Zealand Timber. | Imports of Timber. | ||||||
|---|---|---|---|---|---|---|---|---|
| Sawn Timber. | Sleepers | Logs unworked. | Total Value.* | |||||
| Quantity. | Value. | Quantity. | Value. | Quantity. | Value. | |||
* Includes other items such as laths, palings, plywood, and shingles amounting to—1943, £2,877; 1944, £13,912; 1945, £2,435; 1946, £56,320 (plywood only); 1947, £140,910 (plywood only). † In addition, pulpwood, equivalent to 636,000 board feet, was exported to Australia for experimental purposes. | ||||||||
| Bd. Ft. | £(N.Z.) | Bd. Ft. | £(N.Z.) | £(N.Z.) | £(N.Z.) | £(N.Z.) | ||
| 1943 | 4,390,585 | 60,942 | 10,607,260 | 231,620 | 57,782 | 14,500 | 306,779 | |
| 1944 | 4,252,025 | 59,727 | 11,411,708 | 247,351 | 63,108 | 2,048 | 326,419 | |
| 1945 | 4,133,000 | 85,730 | 13,512,000 | 318,300 | 69,000 | 3,000 | 392,735 | |
| 1946 | 7,951,000 | 165,100 | 13,760,000 | 295,300 | 141,200 | 33,000 | 525,820 | |
| 1947 | 8,856,000† | 180,880 | 21,625,000 | 772,600 | 153,100 | 126,300 | 1,192,910 | |
SALES OF STATE TIMBER.—Under the timber-sales policy in operation in recent years for the disposal of the mature timber in State forests, the standing timber is appraised and disposed of by public tender as a block sale. As stated earlier in this section, a system of State logging and log sales is now in operation in certain areas.
| Year. | Timber sold. | Sale Price. | Percentage of Total Timber produced. |
|---|---|---|---|
| Bd. Ft. | £ | ||
| 1943–44 | 86,200,900 | 116,177 | 25 |
| 1944–45 | 104,017,500 | 141,467 | 30 |
| 1945–46 | 72,529,000 | 104,239 | 21 |
| 1946–47 | 109,941,000 | 190,153 | 31 |
| 1947–48 | 127,736,000 | 194,909 | 30 |
FOREST FINANCE.—Up to and including the financial year 1915–16 the expenditure on afforestation was provided out of rents and royalties received from State forests and by an annual contribution from the Consolidated Fund. In 1916–17 provision was made for the borrowing of money for forestry purposes, and since that date all receipts and payments are shown in a State Forests Account. Commencing with the year 1933–34, interest on loans is carried forward as a liability to the Consolidated Fund until realization of the plantations.
| Item. | 1943–44. | 1944–45. | 1945–46. | 1946–47. | 1947–48. |
|---|---|---|---|---|---|
* This amount was payable in 1946–47; the amount accrued in 1947–48, £10,886, has subsequently been paid. | |||||
| Receipts | |||||
| Indigenous forests receipts— | £ | £ | £ | £ | £ |
| Timber sales | 114,553 | 121,603 | 135,913 | 155,208 | 212,454 |
| Timber royalties and trespass | 8,588 | 9,250 | 13,451 | 11,481 | 14,585 |
| Leases, grazing | 1,402 | 1,611 | 2,865 | 2,229 | 2,083 |
| Sawmill sites, industrial, &c. | 247 | 308 | 672 | 359 | 378 |
| Miscellaneous | 6,895 | 9,124 | 8,960 | 16,419 | 16,526 |
| Log sales from managed forests | 73,317 | 54,716 | 67,053 | 62,432 | 84,864 |
| Exotic forests: Poles, posts, firewood, &c. | 51,952 | 45,938 | 38,643 | 39,975 | 52,525 |
| Utilization projects— | |||||
| Sawn timber | 16,180 | 22,529 | 63,451 | 98,703 | 109,716 |
| Creosoted products | 15,964 | 45,918 | 17,305 | 17,889 | 7,216 |
| Box shooks | 136,600 | 129,126 | 182,187 | 134,839 | 207,192 |
| Miscellaneous | 2,663 | 9,875 | 9,532 | 12,840 | 23,072 |
| Miscellaneous credits | 16,942 | 10,802 | 48,292 | 37,953 | 32,665 |
| Totals | 445,303 | 460,800 | 588,324 | 590,327 | 763,276 |
| Receipts from national endowment indigenous forests (included in above) | 46,654 | 47,426 | 47,157 | 37,366 | 52,911 |
| Payments | |||||
| Allocation of revenue— | |||||
| Consolidated Fund (portion of revenue from national endowment forests) | 17,455 | 16,196 | 14,235 | 16,023* | |
| Working Railways Account (section 24 (1), Finance Act, 1936) | 549 | 3,539 | 4,329 | ||
| Local authorities | 12,928 | 12,799 | 17,114 | 25,750 | 21,078 |
| General management charges— | |||||
| Salaries | 89,332 | 110,317 | 137,984 | 187,714 | 225,047 |
| General expenses | 41,254 | 56,019 | 102,275 | 130,770 | 144,973 |
| Land purchase | 11,687 | 38,957 | 30,098 | 18,296 | 11,640 |
| Forestry projects under direct management— | |||||
| Exotic | 248,705 | 346,743 | 377,910 | 710,376 | 811,495 |
| Indigenous | 30,521 | 41,912 | 58,808 | 79,023 | 135,698 |
| Utilization: Sawmill, creosote plant, &c. | 104,826 | 125,931 | 133,677 | 174,379 | 318,826 |
| Pulp and paper making | 12,369 | 25,023 | |||
| Totals | 557,257 | 748,874 | 872,101 | 1,342,216 | 1,714,132 |
The revenue from indigenous forests is reduced by statutory payments in favour of local authorities and the Consolidated Fund. During recent years the residue has been little more than sufficient to meet the expenses of supervision and management, and consequently the establishment of State exotic forests has been financed almost exclusively from loan-moneys.
STATE EXOTIC FORESTS.—State afforestation on an organized basis dates from 1896, when an Afforestation Branch of the Lands Department was formed, and forest-tree nurseries were established at Tapanui and Eweburn in the South Island, and at Rotorua in the North Island. Planting commenced in 1898, when a total of 54 acres was established.
Figures of the areas planted by the State Forest Service for five-year periods are shown below.
| Period. | Acres. |
|---|---|
| 1921–22 to 1925–26 | 40,141 |
| 1926–27 to 1930–31 | 230,114 |
| 1931–32 to 1935–36 | 112,963 |
| 1936–37 to 1940–41 | 22,019 |
| 1941–42 to 1945–46 | 8,946 |
The gross area of State exotic forests at the 31st March, 1948, was 735,074 acres, of which the area actually established was 449,698 acres, exclusive of fire-breaks, waste lands, reserves, &c. The new area planted in 1947–48 amounted to 2,819 acres.
While many species were experimented with in the initial stages of the work, the chief species planted in the North Island were European larch (Larix decidua), Austrian pine (Pinus austriaca), Corsican pine (P. laricio), Western yellow pine (P. ponderosa), and a number of eucalypts. In recent years the main species planted have been Douglas fir or Oregon pine (Pseudotsuga taxifolia), Western yellow pine, Insignia pine (P. radiata), and Corsican pine; whilst in the Auckland Conservancy the Southern pines (Pinus palustris, P. taeda, and P. Caribaea) have shown promise.
In the South Island practically all the best-known commercial trees of the Northern Hemisphere have been tried, but many have been discarded as unsuitable for various reasons, until at the present time operations are being conducted with a comparatively small range of conifers which experience has shown will most readily adapt themselves to local conditions. The principal species now being used are Western yellow pine, Corsican pine, Douglas fir, and Insignia pine.
Waitangi Endowment.—The Waitangi Endowment, containing 1,438 acres, is portion of an estate containing the historic site of the signing of the Treaty of Waitangi, presented to the Crown as a national monument by Viscount and Lady Bledisloe in 1932.
By authority of the Waitangi Endowment Act, 1932–33, the Commissioner of State Forests is empowered to administer the land as if it were a State forest, and to develop and use the land for afforestation purposes. To date 533 acres have been planted.
The primary object of these afforestation operations, however, is to reclothe a treeless area to form a scenic background for the portion of the estate known as the Waitangi National Trust, which contains the historic site mentioned.
MISCELLANEOUS FORESTRY PROVISIONS.—The method first adopted in New Zealand for encouraging the planting of trees for the production of timber was by means of “land grants”—a settler being given a free grant of land if he planted a certain portion of his land with suitable trees. Several large plantations were established in Canterbury by this method, which, however, was abandoned in the “eighties.” The Selwyn and Ashburton County Councils are the outstanding examples of local authorities which took advantage of this scheme, and are now receiving substantial revenues from their tree plantations.
Under the system of taxation in operation in New Zealand, encouragement is given to the conservation of indigenous forests and plantations and to the establishment of new plantations, by exempting the trees from land-tax and local rates.
The actual land supporting indigenous forests and plantations is subject to land-tax. The tax, however, is assessed on the unimproved value, which for taxation purposes does not include the value of any trees or the value of the labour or capital expended in planting them.
Local rates on land supporting indigenous forests and plantations are levied on the value of the land only. A County Council is empowered to make an annual levy of ½d. per hundred feet board measure on timber in the county converted from the log into sawn timber; but this levy is not applicable to timber cut from plantations.
Appraisements of timber are not liable to stamp duty if made for the Crown, for a local authority, or for the information of one party only.
Licences granted by the Crown to cut timber are exempt from stamp duty, other licences are not exempt.
Land on which trees of any kind are growing is subject to death duties (estate duty, succession duty, and gift duty), which are assessed on the capital value of the land, which includes the value of the trees.
COMMERCIAL AFFORESTATION.—The planting of exotic forests by commercial concerns was first undertaken in New Zealand in 1923. Two classes of companies have been formed to carry out the various ventures. The first is the ordinary joint-stock company, where the property is vested in the company and the shareholders receive a pro rata share of the profits according to the amount of capital contributed; the second is a company which is registered with a comparatively small capital, but of which the investing public do not become shareholders. The company contracts with each investor that, in consideration of his paying the prescribed amount of cash, it will convey to him at the end of a given term a certain area of land duly planted according to a prescribed agreement. The interests of bondholders are protected by trustees until the time arrives for conveyance to the bondholders. Provision is contained in the Companies (Bondholders Incorporation) Act, 1934–35, whereby bondholders may receive shares in exchange for their bonds and become entitled to the same proportionate interest in the same property and rights as they would be entitled to under their bonds.
The collection of statistical data pertaining to the activities of afforestation companies was commenced with the financial year 1924–25 and continued up to and including 1940–41. Owing to staff and other difficulties arising out of the war, the collection was then suspended and has not yet been resumed.
Of the thirty-one companies engaged in afforestation operations from which returns were received for the year 1940–41, seven were organized on the bond-holding basis, the balance being limited-liability companies. Twenty of the companies carried on operations in the Auckland Provincial District, five in Nelson, two each in Hawkes Bay and Southland, and one each in Taranaki and Otago.
The total area of land held by afforestation companies at 31st March, 1941, was 367,847 acres, the book value of which was £6,545,949. Of the area held, 310,542 acres had been planted, the principal species being as follows: Insignis pine, 279,902 acres; Pinus ponderosa, 18,984 acres; Pinus pinaster, 3,605 acres; redwood, 2,853 acres; Douglas fir (Oregon pine), 945 acres; eucalypts, 848 acres; poplar, 675 acres.
THE principal characteristics of New Zealand'S fisheries are the great length of the coast-line, extensive natural harbours, numerous sheltered bays, and narrow continental shelf. Off its more northerly coasts, which come within the influence of the south equatorial current, a rich variety of subtropical fish is found, as exemplified by such species as the flying-fish, the sunfish, the swordfish, and several shark species. On the other hand, its southern coasts, washed by the Antarctic drift, are the natural haunt of the fur-bearing seal, and yield varieties of fish which are characteristic of cold-water conditions.
Of the many kinds of excellent edible fishes the most important are the snapper (Pagrosomus auratus), which is more particularly abundant in the North; next in importance is tarakihi (Dactylopagrus macropterus), which is taken mainly by trawlers working off the east coast of both North and South Islands. The groper or hapuku (Polyprion oxygeneios) is caught on lines in the deeper water from North Cape to Stewart Island, while the blue cod (Parapercis colias) is the staple product of the southern line fisheries.
The flounder and sole (Pleuronectidae) occur in the more shallow and sheltered waters.
The most productive grounds are in relatively shallow water, and, except for groper and ling fishing by means of long lines, most of the fishing is carried on at depths of less than 40 fathoms. Depths of over 100 fathoms occur at a comparatively short distance from the coast, and up to the present it is not known to what extent these deeper waters may be productive of marketable fishes. The principal methods of fishing are long-lining for groper (hapuku), ling, “hake” or “kingfish,” and snapper; hand-lining for blue cod; trawling and Danish seining, by which flounders, snapper, tarakihi, gurnard, john-dory, and a variety of other fish are taken. In bays and estuaries set-nets are used for flounders, snapper, and mullet, and seines are also employed principally for the capture of flat-fish and snapper. Sardines or pilchards (Sardinia neopilchardus) and oilier species of the herring family are known to occur in large shoals off some parts of the coast from time to time. There is no regular fishery for these kinds except where they have been periodically netted for bait by Cook Strait fishermen in the Marlborough Sounds. Attempts to commercialize these fish have been unsuccessful mainly because their appearances proved extremely irregular and inadequate in quantity.
In order to ascertain the economic position of the fishing industry an investigation committee was set up, under the Board of Trade Act, in 1937. This committee conducted exhaustive inquiries into all aspects of the industry, and reference to the committee'S report (parliamentary paper H-44A, 1937–38) will give detailed information as to the conditions under which the industry then operated.
The fishing industry—that is, “the taking of fish and shell fish for sale”—came wholly under the control of the Marine Department by virtue of the Fisheries Amendment Act, 1945, which provides that any boat used in fishing for purposes of sale must be registered, and that the owner of such a boat must be the holder of a licence authorizing the boat to be so used. In addition, any person employed on a fishing-boat except as an engineer engaged wholly in connection with the propelling machinery, or wholly as a fireman, or as a cook, must be the holder of a crew licence. These provisions were brought into force as from 31st December, 1945, by the Sea-fisheries (Boats and Licences) Regulations 1945.
STATISTICS OF FISHERIES.—Commencing with the year 1944, the Marine Department has adopted the calendar year as a standard for the expression of statistics of fisheries in place of year ended 31st March formerly in use.
The number of licensed fishing-vessels operating in 1947 was 758, as compared with 797 in 1946 and 721 in 1945, while the number of whole-time and part-time men engaged in the production of fish in 1947 was 1,568, as compared with 1,550 in 1946 and 1,413 in 1945.
The total weight of wet fish marketed in 1947 was 438,300 cwt. This is the highest total yet recorded and is the cumulative result of three main factors :—
The return of several large catching units after war service:
Re-engining and replacement of many vessels after the war:
Exceptionally fine weather prevailing in most of the fishing-grounds, especially during the period of seasonal congregation of some of the more important types of fish, coupled with the comparative rest period imposed during the war years.
Of the total catch (438,300 cwt.), 93,721 cwt. (21.38 per cent.) was landed from steam-trawlers, 110,933 cwt. (25.31 per cent.) from motor-trawlers, 96,715 cwt. (22.07 per cent.) from Danish-seine boats, while motor-vessels (line and net fishing) accounted for 134,288 cwt. (30.64 per cent.), and row-boats for 2,643 cwt. (0.60 per cent.).
The most important fishing ports in New Zealand are Auckland, with 32.5 per cent. of the total catch in 1947; Tort Chalmers, 10.2 per cent.; Wellington, 10.1 per cent.; Napier, 5.4 per cent.; Timaru, 4.8 per cent.; Bluff and Stewart Island, 4.5 per cent.; and Lyttelton, 4.0 per cent.
During 1947 the total quantity of fish landed at Auckland was 142,304 cwt., of which 101,470 cwt. was snapper and 22,285 cwt. tarakihi. The total quantity landed at Port Chalmers during 1947 was 44,849 cwt., of which 13,938 cwt. was barracouta and 10,963 cwt. was sole. In Wellington a total of 44,291 cwt. was landed, of which 22,455 cwt. was tarakihi and 8,017 cwt. hapuku.
The estimated total quantity and value of the principal classes of fishery products marketed during each of the last two years were as follows:—
| — | Unit. | Quantity. | Value. | ||
|---|---|---|---|---|---|
| 1946. | 1947. | 1946. | 1947. | ||
| £ | £ | ||||
| Wet fish | Cwt. | 380,321 | 438,300 | 660,096 | 802,496 |
| Whitebait | Cwt. | 6,578 | 7,056 | 73,674 | 79,027 |
| Oysters (dredged) | Sack | 89,356 | 81,518 | 67,017 | 61,138 |
| Oysters (rock) | Sack | 5,103 | 5,280 | 8,933 | 9,240 |
| Mussels | Sack | 10,568 | 16,261 | 3,687 | 5,563 |
| Crayfish | Cwt. | 16,766 | 18,052 | 30,801 | 42,134 |
| Toheroa (canned products) | lb. | 69,043 | 43,400 | 4,567 | 2,871 |
| Whale oil, &c. | Ton | 700 | 640 | 21,000 | 25,000 |
| Total value | 869,775 | 1,027,469 | |||
The next table shows the quantities and values of New Zealand fish and shell-fish exported for each of the four years ended 31st March, 1944, 1945, 1946, and 1947.
| — | 1944. | 1945. | 1946. | 1947. |
|---|---|---|---|---|
| Fish (frozen) Cwt. | 16,628 | 22,663 | 27,698 | 41,800 |
| £ | 73,500 | 104,046 | 139,065 | 235,079 |
| Fish (smoked, dried, pickled, or salted) Cwt. | 3,319 | 4,276 | 2,602 | 4,384 |
| £ | 20,476 | 26,390 | 15,277 | 27,533 |
| Oysters (fresh) Doz | 21,100 | 640 | 85,400 | 950 |
| £ | 578 | 18 | 2,819 | 27 |
| Oysters (canned) Lb. | 764 | 1,924 | 11,885 | 9,193 |
| £ | 57 | 199 | 949 | 803 |
| Toheroa (canned) Lb. | 12,804 | 16,028 | 5,108 | 14,107 |
| £ | 1,013 | 1,313 | 399 | 1,098 |
| Whitebait (canned) Lb. | 116,349 | 197,827 | 287,027 | 265,657 |
| £ | 20,584 | 39,347 | 54,750 | 52,894 |
| Crayfish (frozen) Cwt | 1,921 | 1,346 | 1,487 | 2,335 |
| £ | 6,608 | 6,462 | 7,455 | 17,140 |
| Crayfish (canned) Lb. | 30,915 | 25,892 | 33,472 | 60,351 |
| £ | 3,323 | 3,034 | 4,249 | 8,317 |
| Other kinds (canned) Lb. | 20,506 | 130,107 | 112,552 | 300,257 |
| £ | 835 | 6,572 | 6,271 | 15,327 |
| Value of total exports of New Zealand fish and shell-fish | £126,974 | £187,381 | £231,234 | £358,218 |
FISH-LIVER OIL.—An important development in the utilization of fishery products, hitherto wasted, has taken place as a result of conditions arising out of the war. This consisted of the establishment in 1940 of two factories for the production of fish-liver oils to replace overseas supplies which were threatened as a result of war developments. The quantity of fish-livers processed in 1947 was 698,383 lb., which produced 30,427 gallons of oil, as compared with 670,664 lb. and 29,923 gallons respectively in 1946. A total of 27,025 gallons of oil was exported in 1947, and 19,221 gallons in 1946.
CANNED FISHERY PRODUCTS.—Only a small quantity of the fishery products are canned in New Zealand, the bulk of the total catch being used fresh or frozen. Varieties that are canned include oysters, toheroa, paua, mussels, crayfish, kahawai, trevally, herring, pilchard, kingfish, gurnard, marlin, barracouta, mullet, mackerel, eel, whitebait, and whale-meat.
| The following table sets out the quantities canned in 1947:— | lb. |
| Shellfish (including crayfish) | 275,257 |
| Eel | 223,774 |
| Whitebait | 438,186 |
| Sea-fish generally | 626,520 |
| Whale-meat | 100,800 |
| Total | 1,664,537 |
OYSTER-BEDS.—The principal oyster-beds around the coast of New Zealand are those situated in Foveaux Strait, between South and Stewart Islands, and the rock oyster beds on the east and west coasts of the Auckland Peninsula.
In South Island waters a close season is observed from 1st October to 14th February, and in North Island waters from 1st November to 30th April, in each year. The taking of oysters is governed by the Oyster-fishing Regulations 1946, and vessels operating commercially are subject to the Sea-fisheries (Boats and Licences) Regulations 1945, referred to earlier. During the 1947 season 81,518 sacks of oysters were dredged from Foveaux Strait, compared with 89,356 sacks in 1946 and 76,038 sacks in 1945.
The rock-oyster beds of Auckland were worked for many years under a variety of systems, but, owing to stripping of the beds, close seasons had frequently to be proclaimed. From 1908 the picking and wholesale marketing of rock-oysters from the North Island beds has been undertaken by the State, private picking being prohibited.
Oyster-cultivation work is bring systematically carried on by the Marine Department in the Hauraki Gulf, in the Bay of Islands, and in the Kaipara district.
Rock-oysters picked and sold by the State in 1947 totalled 5,280 sacks, compared with 5,103 sacks in 1946 and 5,476 sacks in 1945.
CRAYFISH.—Marine crayfish occur off many parts of the New Zealand coast and are caught in baited pots for local markets. A small quantity is canned.
WHALING.—With the enormous development of pelagic whaling that has taken place in recent years the whaling industry in New Zealand has greatly declined from the important position which it occupied in the early days of the colony. Only one shore station was in commercial operation during the 1947 whaling season. This station is situated in Tory Channel, Queen Charlotte Sound, and the season'S catch in that area was 111 whales, of which 101 were humpbacks, 9 sperms, and 1 blue whale. The total oil-production was 640 tons, while other products included 100 tons of bonedust and 45 tons of canned whale-meat.
The Whaling Industry Act, 1935, was passed in order to give effect to an International Convention for the regulation of whaling and matters incidental thereto.
SEALS.—The taking of seals in New Zealand waters has been on a restricted scale during the last fifty years, these animals being placed on the protected list in 1894. No sealing was then allowed until 1913, when there was an open season, but with certain restrictions. From 1916 a close season was observed until 1922, when the taking of seals was again permitted, but only till 1924, since when a close season was observed until 1946.
A short restricted open season was permitted during 1946 by the Seal Fisheries Regulations 1946, but a close season is again being observed.
BIG-GAME FISHING.—Swordfish (striped and black marlin, and occasionally broadbill), mako shark, and other big-game fish occur principally off the east coast of the Auckland Provincial District, and attract both New Zealand and visiting big-game fishermen. The principal centres for this sport are Whangaroa, Russell (Bay of Islands), Whitianga (Mercury Bay), and Tauranga, where specially designed and equipped launches in charge of experienced men may be hired. The season lasts from December to May, the best months usually bring February and March. The world'S record black marlin swordfish (976 lb.) was caught off the Bay of Islands in February, 1926.
To preserve this very important fishery, the Fisheries (General) Regulations 1947 were gazetted prohibiting the taking of these fish by other than rod and line, and stipulating that the line was not to be heavier than “No. 39 linen thread line.” In addition, a limit bag of not more than four fish per day has been imposed.
WHITEBAIT.—A fishery that is peculiar to New Zealand with regard both to the product and to the methods of operation, carried on from July to November in the tidal roaches of many rivers, is the whitebait fishery. New Zealand “whitebait” are the young of Galaxias attenuatus, a species that lives for the greater part of its adult life in fresh water, descending to tidal water to spawn in late summer and autumn. The spawn is deposited among grass and similar herbage on the margins of the rivers above the ordinary high-water mark in a zone that is submerged only at the highest spring tides, Here it remains under cover of the herbage and secure from aquatic enemies until it is once more reached by a spring tide about a fortnight or, it may be, a month later. The young then hatch out, and are carried by the ebb tide to the sea. Here they remain until, at the age of about five months, the young fish, then about 2 in. long and still possessing the almost glassy transparency of the larval stage migrate up the rivers in dense shoals. This is the time of the whitebait fishery, when they are caught in nets made of wire gauze or mosquito-netting. The cultivation and drainage of riparian lands have considerably diminished the extent of spawning and feeding areas that were available in earlier times. From these causes, as well as from the intensity of the fishing operations, there are now few rivers where the runs of whitebait show anything like the abundance of former years. The most productive whitebait fisheries are near the mouths of the rivers of the west coast of the South Island and in the lower reaches of the Waikato River. Normally the whitebait fishery gives employment to over three hundred regular fishermen, and a greater number of part-time fishers, and, over a period, of years, produced an average of approximately 3,000 cwt. of whitebait. During the last three years, however, exceptionally good fishing has been experienced, and with improved transport from the more remote rivers, in which aeroplanes play an important part, a substantial whitebait industry is being developed. The estimated quantity marketed in 1945 was 8,698 cwt. (the highest recorded since returns were first collected in 1932), as compared with 6,578 cwt. in 1946 and 7,056 cwt. in 1947.
FRESH-WATER FISHERIES.—Native Fishes: Of fresh-water fishes indigenous to New Zealand the species of most commercial importance at the present time is Galaxias attenuatus, which provides the whitebait fishery already mentioned. Other species of Galaxias are known in the streams and lakes of the country. With the exception of the eels, which frequently attain an extraordinarily largo size compared with those of the Northern Hemisphere, all the native fresh-water fishes are small, and are therefore not considered to possess any sporting value except to the most juvenile of anglers. There are two species of eels—Anguilla australis, the short-finned eel; and Anguilla dieffenbachii, formerly known as Anguilla aucklandii, the long-finned eel. Recent investigations by Marino Department biologists have thrown new light on their distribution. It is now known that all male eels remain in tidal and brackish waters; female long-finned eels are found throughout all accessible fresh waters, while female short-finned eels are restricted to the warmer, deeper, and slowly-flowing waters, and in the South Island are found only in the lower reaches of rivers and in coastal lakes. Eels constituted an important food-supply to the Maoris, who devised very efficient traps for their capture as the adult eels migrated to the sea. This fishery is still carried on by the Maoris of some districts and during recent years some commercial fishing has taken place for home markets and for export. So far as available supplies are concerned, there is scope for considerable development in connection with eel utilization in New Zealand.
The following list shows the definitely known genera of indigenous fresh-water fish and includes all the principal species.
| Scientific Name. | European Name. | Maori Name. | Usual Maximum Size. |
|---|---|---|---|
| Inches. | |||
| Galaxias attenuatus | “Minnow” | Inanga | 7 |
| Galaxias fasciatus | Native trout or mountain trout | Kokopu | 10 |
| Galaxias brevipinnis | “Gudgeon” | Taiwharu or kokopu | 6 |
| Galaxias huttoni | Koaro | 6 | |
| Galaxias burrowsii | Canterbury mudfish | 5 to 6 | |
| Neochanna apoda | Mudfish | Hauhau or waikaka | 8 |
| Retropinna retropinna | Smelt | Paraki | 6 |
| Prototroctes oxyrhynchus | Grayling | Upokororo | 12 |
| Cheimarrichthys fosteri | Torrent-fish or shark-bully | Papanoko | 7 |
| Gobiomorphus gobioides | Bully | Toitoi | 6 |
| Feet. | |||
| Anguilla australis | Short-finned eel | Tuna | 3 to 4 |
| Anguilla dieffenbachii (aucklandii) | Long-finned eel | Tuna | 4 to 5 |
| Geotria australis | Lamprey | Koro-koro or kuna-kuna | 2 |
The “minnow,” smelt, grayling, and, of course, the eels and lamprey, are migratory fish which spend parts of their lives in the sea or in estuarine tidal waters, although at least one species of purely fresh-water smelt is known.
Acclimatized Fishes: Although most of the above-mentioned indigenous fishes—especially the eels, kokopu, and upokororo—provided an appreciable portion of the food-supplies of the Maoris, and have been a welcome addition to the camp provision of surveyors, bushmen, and prospectors since the pioneering days, there were many among the early settlers to whom the New Zealand rivers and lakes appeared uninteresting and unproductive in comparison with their native salmon and trout streams. By means of private agency in some cases, and by more organized efforts on the part of Government and local acclimatization societies, attempts to introduce British salmon and trout were commenced in the early “sixties.” The brown trout was first established in 1867 by means of ova imported from Tasmania, where the species had been acclimatized a few years earlier from English stock. Importations of brown trout besides the Loch Leven and sea-trout varieties have been subsequently made, so that the species is now found in most of the fresh and tidal waters of New Zealand. Rainbow or steelhead trout, first introduced in 1883 from California, are also now widely distributed. In some lakes, notably Taupo and others in the Thermal Region, they have largely displaced the earlier brown-trout population. The American brook trout (Salvelinus fontinalis) was widely planted in the “seventies” and “eighties,” but is now found only in a few back-country streams in the South. The Mackinaw trout, or Great American Lake trout, has been naturalized in Lake Pearson, Canterbury, since 1906. Quinnat salmon, introduced from California in the first five years of the present century, after earlier attempts had failed, are now firmly established, and “runs” of these salmon take place annually between January and June in the larger East Coast rivers of the South Island. They have been taken in smaller and more variable numbers in a few rivers on the West Coast and in the Wellington District. Sockeye salmon, imported at the same time, have given rise to a “land-locked” stock in Lake Ohau, no sea-run examples of this species having yet been identified. The introduction of European Atlantic salmon was attempted at various times in the earlier years, and was finally achieved after 2,000,000 ova had been imported in 1910–12 from British and Continental rivers. The species is now established in the Waiau river system and associated lakes (especially Lake Te Anau) in Southland. It is remarkable that, although there is unimpeded access to the sea, the species has largely adopted “land-locked” habits, most of the fish remaining to feed in fresh water until and after they have reached maturity. Relatively small numbers, however, enter the Waiau from the sea.
Besides the above-mentioned members of the salmon and trout family, other species of fish from the Northern Hemisphere which have been acclimatized in New Zealand are the European perch, tench, and carp, the North American catfish (Ameiurus catus), and the small viviparous Gambusia patruelis introduced about 1930 for its utility as a devourer of mosquito-larvæ.
With the exception of the Rotorua Acclimatization District in the thermal-lakes region and the recently constituted Southern Lakes District in the South Island, which are under the control of the Department of Internal Affairs, the local administration and management of fresh-water fisheries are in the hands of acclimatization societies.
A fishing licence, for which the fee is £1 5s. for the season, enables the holder to fish for acclimatized fish in any part of the South Island except the Southern Lakes District. For an additional fee of 5s. the licence also holds good for the North Island except in the Rotorua Acclimatization District. The North Island licence costs £1 10s. and is available for the whole of New Zealand except the Rotorua and Southern Lakes Acclimatization Districts. For fishing in the Rotorua area the local licence fee is £1 5s. for all male adults, but in the Taupo area of the Rotorua Acclimatization District, which is the most popular of all New Zealand angling resorts, the licence fees for the whole season are £1 10s. for residents in the area, £2 for residents of New Zealand, and £6 for overseas visitors. For all acclimatization districts there is a reduced scale of licence fees for female and juvenile anglers. Half-season, monthly weekly, daily, and single-river licences are also available.
THE law relating to mining and quarrying is contained in the Mining Act, 1926, the Coal-mines Act, 1925, the Coal Act, 1948, the Petroleum Act, 1937, the Quarries Act, 1944, and the Atomic Energy Act, 1945. There have been numerous amendments to these Acts, the most recent of which are the Mining Amendment Acts of 1947 and 1948, and the Coal-mines Amendment Act, 1947. The Coal Act, 1948, which came into force on 1st April, 1949, in addition to amending the Coal-mines Act, 1925, provides for the acquisition by the Crown of the property in all unworked coal. All privately owned coal existing on or below the surface of any land is declared to be the property of the Crown. The Act makes provision for compensation to be paid for privately owned coal and sets up a Coal Valuation Commission for this purpose.
MINERAL PRODUCTION.—The following statement shows the production of metals and minerals during 1946 and 1947.
| Mineral. | 1947. | 1946. | ||
|---|---|---|---|---|
| Quantity. | Value. | Quantity. | Value. | |
| Fuels | ||||
| £ | £ | |||
| Coal | 2,751,725 tons | 4,127,588 | 2,793,870 tons | 4,190,805 |
| Metals | ||||
| Gold | 112,260 oz. | 1,210,537 | 119,271 oz. | 1,262,524 |
| Silver | 221,984 oz. | 53,840 | 224,341 oz. | 59,707 |
| Platinum | 14 oz. | 312 | ||
| Arsenic | 8 tons | 143 | 18 tons | 316 |
| Iron-ore | 6,226 tons | 13,841 | 7,406 tons | 16,422 |
| Copper-ore | 580 tons | 6,255 | ||
| Tungsten-ore | 22 tons | 10,500 | 27 tons | 6,350 |
| Manganese-ore | 402 tons | 1,686 | ||
| Non-metallics | ||||
| Bentonite | 215 tons | 1,049 | 154 tons | 777 |
| Clay for bricks, tiles, &c. | 150,808 tons | 33,893 | 109,809 tons | 26,179 |
| Clay for pottery, fillers, &c. | 11,970 tons | 9,970 | 9,425 tons | 5,186 |
| Diatomite | 436 tons | 709 | 348 tons | 574 |
| Dolomite | 7,034 tons | 3,517 | 3,893 tons | 1,946 |
| Fuller'S earth | 31 tons | 120 | 75 tons | 318 |
| Limestone, marl, &c., for cement | 399,335 tons | 73,769 | ||
| Limestone for agriculture | 1,020,810 tons | 407,759 | ||
| Limestone for industrial uses | 18,401 tons | 6,859 | ||
| Sand, gravel, &c., for roads and ballast | 1,617,953 tons | 478,308 | 2, 701,462 tons | 741,162 |
| Sand, &c., for building aggregate | 375,435 tons | 137,123 | ||
| Dimension stone for building | 14,528 tons | 11,143 | ||
| Stone dust for coal-mines, &c. | 1,298 tons | 270 | ||
| Rock for harbour-work | 41,347 tons | 6,451 | ||
| Magnesite | 362 tons | 253 | 374 tons | 262 |
| Phosphate | 200 tons | 100 | 11,047 tons | 3,314 |
| Pumice | 3,389 tons | 2,635 | 3,409 tons | 12,347 |
| Quartzite | 13 tons | 33 | 18 tons | 33 |
| Serpentine | 31,935 tons | 11,803 | 20,058 tons | 3,966 |
| Silica sand | 14,443 toils | 30,358 | 16,949 tons | 38,921 |
| Totals | 6,638,826 | 6,373,107 | ||
Kauri-gum, the (chiefly) fossilized resin of former kauri forests, is counted as a mineral, but is not included in the above table.
The next statement shows the value of New Zealand minerals and allied substances exported during the years stated.
| Mineral. | 1945. | 1946. | 1947. | Total from 1st January, 1853, to 31st December, 1947. |
|---|---|---|---|---|
| £ | £ | £ | £ | |
| Gold | 1,256,243 | 1,176,396 | 1,026,225 | 117,591,570 |
| Silver | 10,311 | 13,662 | 24,936 | 3,800,514 |
| Tungsten-ore | 25,972 | 4,700 | 5,975 | 543,067 |
| Antimony-ore | 55,440 | |||
| Mercury | 152 | 41,319 | ||
| Other minerals | 9,163 | 14,040 | 17,142 | 692,521 |
| Kauri-gum | 94,287 | 111,915 | 120,256 | 24,426,405 |
| Coal (including bunker) | 51,212 | 76,042 | 77,430 | 8,372,000 |
GOLD-MINING.—The gold-mining industry, which in its early stages contributed greatly to the progress and settlement of New Zealand, but which declined in importance with the exhaustion of the most accessible alluvial-gold deposits and of ore from the zones of enrichment, again came into prominence in the years immediately prior to the war on account of the enhanced price of gold and the revival of gold-dredging.
Gold-dredging possibilities presented an entirely new aspect not only on account of the price of gold, but also on account of the greater depths to which modern machines can work and their low cost of operation per cubic yard. The link-up of the West Coast in recent years with the main hydro-electric scheme of the South Island has been of special importance to dredging concerns by ensuring for the industry an adequate supply of cheap power.
The number of productive dredges operating in 1947 was fifteen, twelve of which were situated on the west coast of the South Island and three in Otago. It is expected that dredges whose construction was deferred because of war conditions will eventually come into operation, but the greater part of the ground suitable for dredging is now either under active or prospective exploitation.
Quartz-mining is now practically confined to the operations of the Martha Mine at Waihi and of the Blackwater Mine on the west coast of the South Island.
Alluvial-mining now occupies a relatively minor place in New Zealand gold-mining, and is confined, to the west coast of the South Island and to Otago and Southland.
Since 1940 there has been a steady decline in the production of gold. Naturally, the decreased importance of gold-mining to the community during the war period has been responsible for man-power problems and difficulties in securing equipment, and the result has been reduced production and discouragement of fresh enterprise. These difficulties were further accentuated by rising costs in the post-war years, although tax remissions to the extent of 34s. 8d. per ounce have been made by the Government since 1945 to meet such costs. The following table gives particulars of the estimated gold content of gold/silver/bullion production for the last three years.
| — | Quantity. | Value | ||||
|---|---|---|---|---|---|---|
| 1945. | 1946. | 1947. | 1945. | 1946. | 1947. | |
| Oz. | Oz. | Oz. | £ | £ | £ | |
| Quartz-mining | 42,804 | 36,352 | 37,496 | 451,238 | 389,155 | 401,327 |
| Alluvial-mining | 3,474 | 3,691 | 3,233 | 36,622 | 36,600 | 33,227 |
| Dredge-mining | 82,086 | 79,228 | 71,531 | 865,347 | 836,769 | 775,983 |
| Totals | 128,364 | 119,271 | 112,260 | 1,353,207 | 1,262,524 | 1,210,537 |
SILVER.—Nearly the whole of the locally produced silver exported from New Zealand has been obtained from the refinement of bullion from the quartz-mines of the Hauraki goldfield, where gold and silver are found alloyed, the ratio of the two metals in the alloy varying greatly. No other silver-mining operations have been carried out profitably in New Zealand. Silver production in 1947 amounted to 221,984 oz., as compared with 224,341 oz. in 1946 and 244,544 oz. in 1945.
IRON-ORES.—The two main sources of iron available in New Zealand are the iron-ore deposits of the Onekaka region, Golden Bay, in the Nelson Provincial District; and the ironsands which are largely concentrated on the beaches of Taranaki, though not limited to that district.
As the result of a systematic prospecting programme of tunnelling and boring carried out by the State during the years 1938 to 1942, the ore reserves of the Onekaka deposits are estimated at 9,500,000 tons, assaying 40 per cent. iron.
Although the whole of New Zealand's iron-bearing sands have not been surveyed, there is no doubt that the total quantity is enormous. As a result of prospecting operations by the State, the titaniferous ironsands in the vicinity of Patea have been estimated as amounting to 45,500,000 tons, assaying 21 per cent. soluble iron, which, by magnetic separation, would yield 14,500,000 tons of concentrates assaying 53 per cent. soluble iron. Preliminary investigation at Wanganui and at Waitara has shown great quantities of sand, but of lower iron content, while deposits at Mokau, Awakino, and Manukau still await investigation.
Many attempts have been made to smelt Taranaki ironsand, but commercial success has not attended any of these efforts. Difficulty has been experienced duo to the fineness of the sand and also to the presence of titanic acid. However, it is considered possible that these sands can be economically smelted if mixed in the proportion of 1 part of sand to 4 of Golden Bay ore.
There has been a small annual production of iron-ore from the Onekaka deposits and certain small deposits in the North Auckland district for use in gas purification, the preparation of stock-licks, and in the cement industry. Production for these uses Amounted to 6,226 tons in 1947, as against 7,406 tons in 1946.
TUNGSTEN.—The principal ore of tungsten in New Zealand is scheelite, though a little wolfram is found in Otago and Stewart Island, but not in economic quantities.
Scheelite occurs at numerous points frequently associated with gold in quartz-veins traversing the schists of Otago and Marlborough. It has also been identified in finely divided form in the concentrates from the gold-saving tables of dredges operating on the west coast of the South Island.
The scheelite-bearing quartz-veins are generally small and broken, while the scheelite is most erratically distributed in the veins, with the greatest concentration of scheelite situated close to the surface or at shallow depths. Further, many of the lodes occur at high altitudes, which allows of only a short working-season; access and transport present difficulties, and production costs are relatively high.
With the exception of two small parcels obtained from Macrae's Flat, production in 1947 was confined to the Glenorchy field. Other producing centres in Otago have been Stoneburn, Hyde, Barewood, and Waipori.
In view of the importance of scheelite as a strategic war mineral, the State during the war assisted private producers to develop claims, while, in addition, it inaugurated a major development programme at two of the main mines in the Glenorchy district. All concentrates produced in New Zealand from the outbreak of the war up to 30th June, 1945, were purchased by the Imperial Government at prices satisfactory to the producers. Since 30th June, 1945, the sale of scheelite concentrates has reverted to the open market.
Production of scheelite concentrates, calculated to the basis of 65 per cent. WO3 per ton, has been 145 tons in 1944,34 tons in 1945, 27 tons in 1946, and 22 tons in 1947, the value of the production in 1947 being £10,500. The total quantity of locally produced ore exported to 31st December, 1947, was 3,370 tons, valued at £543,067.
COPPER.—Ores of copper are found in New Zealand in no fewer than thirty-two localities, but during the last seventy years attempts at their successful exploitation have been unprofitable.
After many years of inactivity, mining was resumed during 1946, when operations were commenced at a copper-ore occurrence at Pakotai, in North Auckland. It was not, however, until 1947 that it was possible to make a shipment to Australia for smelting, when a parcel of 580 tons, averaging approximately 13 per cent. of copper, 3 dwt. of gold, and 33 dwt. of silver per ton, realized £6,255. In order to assist in determining whether sufficient ore existed to warrant the purchase of a furnace, a drilling programme was carried out by the Mines Department, while a geophysical survey of the area was carried out by the Department of Scientific and Industrial Research. The results of these surveys were disappointing, and the future of the property is dependent upon the discovery of additional ore-bodies. The total recorded copper export to the end of 1947 amounted in value to only £25,672, but it is estimated that the total production has amounted to 5,613 tons, valued at £116,133.
MANGANESE.—Manganese-ores are found in many localities, chiefly in the older sedimentary rocks. At Tikiora Hill (near Russell), at Parua Bay (near Whangarei), and especially at Waiheke Island, manganese deposits were mined many years ago, while of recent years there has been some production from deposits at Bombay, Moumoukai, and Otau, all in the Auckland district. Deposits are, however, generally small and shallow and capable of producing only limited tonnages of ore. There was no production during 1947, but a shipment of 402 tons of ore, valued at £1,686, was made from ore produced from the Otau deposit during 1946.
The total quantity of locally produced manganese ore exported to the end of 1947 amounted to 20,978 tons, of a value of £67,947.
MERCURY.—Cinnabar, the principal ore of mercury, is widely distributed in New Zealand, but only in few localities is it found in quantities of economic importance. The most promising deposits of mercury-ore in New Zealand are those of the Puhipuhi district, where for many years efforts have been made to place the production of the metal on a commercial basis. During the war these efforts were revived and production recommenced, the ore being obtained by opencast mining and the mercury recovered in a modern treatment plant with a capacity of 50 tons of ore per day.
Owing to the drastic slump in the price and the need for additional earth-moving equipment, operations were discontinued in 1945. The total production from Puhipuhi during the war period was 33,204 lb. of an estimated value of £32,479.
The total quantity of mercury of New Zealand origin exported up to the 31st December, 1947, was 111,838 lb., valued at £41,319.
ANTIMONY.—The present high price ruling for antimony-ores has again directed attention to the deposits of these ores in Central Otago, and prospecting operations are being carried out at three separate localities in this district, but operations have not progressed beyond the prospecting stage.
TIN.—Cassiterite in the form of “stream tin” occurs near Port Pegasus, Stewart Island, and has been worked to some extent, though the deposits are of small extent. “Lode tin” has been found in the same locality, but the deposit is not of economic value. Small quantities of cassiterite have also been detected in the stream-gravels of the Reefton, Greymouth, and Westport districts. Among other localities in which traces of tin occur are Wet Jacket Arm (Otago) and Campbell Island.
PLATINUM.—In the published lists of minerals of New Zealand platinum is stated to occur in several places, associated generally with gold in gravel. It is only from Southland, however, that platinum has been exported, but quantities produced have been insignificant, and of late years negligible. In 1947 there was no production, while 14 oz. were produced in 1946.
URANIUM.—A concentrated search for uranium-ores has resulted in the discovery that some of the auriferous gravels and sands of the west coast of the South Island contain a small proportion of uranium bearing materials, in particular, uranothorite and monazite. These accumulate in greater concentration upon the gold-saving tables of the dredges, and it is considered that they may be regarded as a possible source of uranium. Investigation of other possible sources of uranium is still proceeding.
The mining and treatment of the ores of uranium and other elements which may be used for the production of atomic energy are now controlled by the provisions of the Atomic Energy Act, 1945.
SULPHUR.—Native sulphur occurs in the thermal districts of the North Island near Rotorua and Lake Taupo, and at White Island, but prospecting work has shown that there is not sufficient quantity to enable the deposits to be economically worked.
While there has been no production of sulphur for many years, exports of New Zealand origin in the past have amounted to an aggregate value of £13,241.
ASBESTOS.—Chrysotile-asbestos occurs at several points in the massive serpentines of Nelson and Otago, but the only deposits of importance so far located are those of Upper Takaka. While these deposits have long been known, difficulties of access have prevented prospecting and exploitation, but of recent years an all-weather motor road has been formed giving access to the area. An experimental treatment plant has been installed, and a systematic prospecting programme of driving and crosscutting carried out. This programme was completed early in 1945, but no further developments have been proceeded with. It is expected, however, that operations will be resumed shortly.
COAL.—Coal in New Zealand has for many years been mined in certain well defined areas, beyond which no coal is known to exist in any significant quantities. The major coal fields, with the class of coal found in each are:—
Bituminous Coal (Coking): Greymouth, Westport (Buller Coalfield).
Sub-bituminous Coal (Non-coking): Waikato (including North Taranaki), Southland (Ohai, &c.), Reefton.
Lignite (Non-coking Low Grade): Southland (Mataura, &c.).
Minor coalfields from which coal is being mined, but which cannot be expected to provide an important contribution to our coal resources are:—
Sub-bituminous Coal: North Auckland (Hikurangi, Kamo), Nelson (Puponga, Westhaven), Otago (Kaitangata).
Lignite: Canterbury (numerous small deposits), Otago, Charleston (Westport).
Close and systematic survey of the coal areas was interrupted by the war need to divert the limited staff of field geologists to investigate problems of immediate importance in the production of coal. A survey of the Greymouth coalfield, however, was recently completed by geologists of the Geological Survey stall, and figures published here regarding that coalfield have been obtained from their reports. As in recent years, the investigation of coal resources was continued by three organizations working in close co-operation. These organizations are (1) The Coal Survey, whose activities are mainly geological and chemical; (2) an organization set up by the Mines Department to follow up the Coal Survey with detailed topographical surveys and shallow prospecting by means of cuts, pits, and hand drilling; (3) the drilling section of the Mines Department carrying out investigations by deep-core drilling. While considerable progress has been made, information is not yet available to warrant any re-estimate of the coal resources, particulars of which are set out below.
While it may be stated, in the light of present knowledge, that there is sufficient coal, both bituminous and cab-bituminous, for requirements as at present for the next twenty years, it is not possible to give close estimates of coal resources in all the coalfields until the survey has been completed.
The next table gives an estimate of the coal resources of New Zealand.
“Proved” coal includes nothing beyond a proportion of coal actually in pillars in developed mines, plus a strip one and a half chains wide beyond the limits of workings, except where such limits are known to be controlled by faults, thinning of the seam, or the incoming of dirty or unmarketable coal. The proportion of coal in pillars is arrived at by a consideration of various factors affecting the individual mines and limiting the quantity which could be extracted in the ordinary way of mining. The expression “proved” is therefore synonymous with “recoverable” or “measured” coal in this sense.
“Probably recoverable” coal relates to extensions of existing and still developing mines, undeveloped seams where fair evidence of a workable seam is available from outcrops or boreholes, and a number of small areas adjacent to abandoned large collieries, where workings on a co-operative basis would probably succeed. It will be evident that there must be constant changes in the estimates of quantities of “proved” and “probably recoverable” coal as mine workings advance and new areas or mines are opened up.
“Inferred” coal resources consist of important blocks likely on geological grounds to contain coal, but which are unbored and too remote from known outcrops to permit of reliable estimates being made.
| Class of Coal. | Proved recoverable. | Probably recoverable. | Inferred. |
|---|---|---|---|
| Tons. | Tons. | Tons. | |
| Anthracite | Very little | Very little | |
| Bituminous (coking) | 14,160,000 | 56,190,000 | |
| Sub-bituminous (non-coking) | 139,094,000 | 103,992,000 | 321,000,000 |
| Lignite (non-coking, low grade) | 147,000,000 | 377,000,000 | |
| Totals | 300,254,000 | 537,182,000 | 321,000,000 |
Reserves of bituminous coal in the Greymouth coalfield have been shown by the recent survey to be much smaller than was anticipated, although it is possible, but not proved, that boring may disclose the existence of some further bituminous coal in the Mount Davy area. The estimate of proved recoverable coal in the Greymouth field is 8,060,000 tons, and of probably recoverable coal 24,000,000. The output in 1945 was 497,982 tons. The figures for the Buller coalfield are—proved recoverable, 5,100,000; probably recoverable, 30,190,000 tons; output in 1945, 464,226 tons; while in the Reefton coalfield (Garvey Creek) it is estimated that there are 1,000,000 tons of proved recoverable coal, and 2,000,000 tons of probably recoverable coal. These figures account for the totals of 14,160,000 tons of proved recoverable and 56,190,000 tons of probably recoverable bituminous coal shown in the foregoing table. The figures for the Buller coalfield are an estimate made by officers of the Mines Department, with the assistance of information supplied by the New Zealand Geological Survey and the Westport Coal Co., Ltd. With the completion of the survey now under way, a much more reliable estimate of coal resources in this area will be possible.
Recent bores in the Kawakawa district, North Auckland, have shown that there is little likelihood of further coal being available in that field, and with the practical exhaustion of the Hikurangi field the only remaining coalfield north of Auckland is the Kamo field, which is of small extent. Surveys of the Waikato, Waitewhena, Reefton, and Ohai areas of sub-bituminous coal are proceeding. Estimates of this class of coal are based on various geological reports combined with information obtained during more recent working of the seams. The figures for lignite are estimates prepared in 1927 by P. G. Morgan, late Director of the Geological Survey, less the amounts produced since that date. While there is evidence of an extensive deposit of lignite in Southland, and some thick seams are being mined, it will be necessary to obtain more accurate figures by close boring.
The following table summarizes coal-mining operations—
| Year. | Output, in Statute Tons. | Persons Ordinarily Employed. | Lives Lost by Accidents In or About Collieries. | ||||
|---|---|---|---|---|---|---|---|
| Above Ground. | Below Ground. | Totals. | Per Million Tons Produced. | Per Thousand Persons Employed. | Number of Lives Lost. | ||
| Prior to 1941 | 95,336,168 | 526 | |||||
| 1941 | 2,639,507 | 1,358 | 3,633 | 4,991 | 1.51 | 0.80 | 4 |
| 1942 | 2,689,041 | 1,338 | 3,659 | 4,997 | 2.24 | 1.20 | 6 |
| 1943 | 2,787,868 | 1,375 | 3,999 | 5,374 | 2.87 | 1.50 | 8 |
| 1944 | 2,805,970 | 1,637 | 3,958 | 5,595 | 4.28 | 2.14 | 12 |
| 1945 | 2,833,576 | 1,660 | 3,932 | 5,592 | 2.12 | 1.07 | 6 |
| 1946 | 2,793,870 | 1,738 | 3,819 | 5,557 | 1.43 | 0.72 | 4 |
| 1947 | 2,751,725 | 1,703 | 3,739 | 5,442 | 1.43 | 0.73 | 4 |
| Totals | 114,628,725 | 570 | |||||
The output of the several classes of coal mined in each inspection district during 1947 can be stated as follows:—
| Class of Coal. | Northern District (North Island). | West Coast District (South Island). | Southern District (South Island). | Total. | Total Output to 31st December, 1947. |
|---|---|---|---|---|---|
| Tons. | Tons. | Tons. | Tons. | Tons. | |
| Anthracite | 1,606 | 1,606 | 16,932 | ||
| Bituminous | 934,365 | 934,365 | 61,387,474 | ||
| Sub-bituminous | 980,020 | 161,385 | 363,537 | 1,504,942 | 46,111,744 |
| Lignite | 59,829 | 250,983 | 310,812 | 7,112,575 | |
| Totals for 1947 | 980,020 | 1,155,579 | 616,126 | 2,751,725 | 114,628,725 |
| Totals for 1946 | 980,649 | 1,157,156 | 656,065 | 2,793,870 | 111,877,000 |
There were 173 coal-mines operating in New Zealand in 1947. Of these 60 were situated on freehold property, the remaining 113 being on Crown land. The total output from all mines was 2,751,725 tons, being 42,145 tons lower than 1946 production. Opencast mining, which has been considerably developed during the last few years, is responsible for the high output maintained. Average production per person employed in the industry was 506 tons, an increase of 3 tons over the 1946 figure, while the number of persons employed was 5,442, a decrease of 115 from 1946.
As in recent years, difficulty was again experienced in meeting the demand for fuel for industry and transport. Restriction of rail services continued to be necessary, while supplies to gasworks have at times been irregular.
The Government is keeping abreast of latest developments in regard to the production of oil from coal by the hydrogenation and the low-temperature carbonization processes. During 1947 considerable progress was made in systematic field surveys and mapping of the coal resources of New Zealand, combined with research work in State laboratories into the physical and chemical properties of the various coals. A largo amount of investigation into fuel problems was also carried out, and many analyses of coal and other fuel samples were made.
Low-temperature carbonization works, using the Lurgi process, established at Rotowaro, 70 miles south of Auckland, in 1931, produced during 1947, 11,353 tons of carbonettes, 188,457 gallons of tar and oil, 158 tons of pitch, and 813 tons of char from 21,682 tons of slack coal, which was part of the output of a group of local mines.
The Sockburn plant, near Christchurch, produced during 1947, 21,624 gallons of tar, 56 tons of briquettes, and 3,574 tons of metallurgical coke.
In order to reduce the economic waste caused by unmarketable slack produced at mines, an amendment to the Coal-mines Act was passed in October, 1935. This enactment gave the Minister of Mines authority to purchase and store slack, to acquire the necessary plant for its treatment, and to manufacture and sell any fuel or other products. In 1936, at the instigation of the Minister of Mines, the coalowners in the Waikato district installed screens of a smaller mesh than formerly in use, and practically all slack made at these mines since then has been disposed of. Similarly, the Southland and Otago coalowners have also adopted a smaller screen mesh.
Opencast Coal-mining.—In New Zealand, along with other countries, considerable attention has been devoted in recent years to the mining of coal by stripping such portions of the seams as are covered by shallow over-burden. Such opencast methods depend upon the use of mechanical strippers and excavators, and during the earlier war years progress was retarded by the lack of necessary equipment. This has now been largely overcome, and the quantity of coal gained by the opencast method has increased enormously during the last four years. Of the total coal production of 2,751,725 tons in 1947, opencast mines produced 644,692 tons (23.4 per cent.), as compared with 528,700 tons (18.9 per cent.) in 1946, 452,680 tons (16.0 per cent.) in 1945, 196,454 tons (7.0 per cent.) in 1944, and 62,037 tons (2.2 per cent.) in 1943. There were fifty-six opencast mines in operation in 1947, and of these, eight operated by the State produced 394,160 tons. All of these State mines have come into production since the beginning of 1944.
Subsidy on Coal-production.—In May, 1940, coal-miners were granted increases of 5 per cent. in the rates for contract workers and 7½ per cent. in day-wages rates. This, with similar increases to colliery officials, was estimated to cost 1s. 1d. per ton on coal-production. Just prior to that date the Price Tribunal had examined applications to increase selling-prices of coal on account of the higher prices of colliery stores, and had advised the Government that costs had risen 5d. per ton on this account.
In accordance with its policy of stabilizing prices during the war period, the Government decided to subsidize mineowners to the extent of 1s. 6d. per ton to cover the increased cost of wages and stores, and thus avoid an increase in the selling-prices of coal. As the result of further increases of 5 per cent. in piece-work rates and 13.8 per cent. in wage rates as from 1st May, 1942, the Government introduced an additional subsidy on coal-production ranging from 6d. per ton to 2s. 7d. per ton, according to the localities in which mines were situated, and costs of production. Since then further subsidies of varying rates have been granted to offset increases in production costs.
12—Ybk.
Shipping companies have also been receiving a subsidy of 2½ per cent. on freight rates, which is now merged in the general subsidy of 15 per cent. payable through the Marine Department. The amount of subsidy paid to the coal industry for the financial year 1947–18 was £1,463,532, and, from the introduction of this subsidy in May, 1940, to 31st March, 1948, the total amount paid to the industry was £5,692,970. Of the amount paid in 1947–48, £715,743 was in respect of State coal-mines and £747,789 in respect of privately owned mines.
Coal Utilization.—The approximate distribution of coal-consumption during each of the four years 1944–47 is shown in the following table. The total quantity is based on actual production in each year plus imports and minus exports (including bunker coal for overseas vessels). Where the information is available, adjustments have been made for stocks on hand at the beginning and end of the year.—
| — | 1944. | 1915. | 1946. | 1947. |
|---|---|---|---|---|
* Includes hospitals, hotels, &c. | ||||
| Railways | 603,000 | 633,000 | 616,000 | 592,000 |
| Coastal shipping | 94,000 | 92,000 | 85,000 | 73,000 |
| Gasworks | 299,000 | 310,000 | 315,000 | 323,000 |
| Factories* | 1,210,000 | 1,197,000 | 1,237,000 | 1,226,000 |
| Households | 573,000 | 594,000 | 540,000 | 597,000 |
| Total consumption | 2,779,000 | 2,826,000 | 2,793,000 | 2,811,000 |
State Collieries.—The Coal-mines Act, 1901, provided for the purchase and working of State coal-mines in New Zealand under the direct control of the Minister of Mines. At 31st March, 1948, there were twenty-two State collieries working. This excludes the Ohai State Opencast and the Glen Afton State Opencast, both of these having been worked out during 1947.
The outputs of marketable coal produced from State coal-mines for the last two financial years are shown below:—
| Mine. | Output, in Tons. | |||
|---|---|---|---|---|
* Mine acquired on 9th April, 1947. † Mine acquired on 2nd May, 1947. ‡ Mine acquired on 28th November, 1947. § All coal extracted prior to 31st March, 1947. || Mine acquired on 25th April, 1947. ¶Mine commenced operations on 1st April, 1947. ** Mine ceased operations on 20th May, 1947. †† Mine acquired on 5th January, 1948. | ||||
| 1947–43. | 1946–47. | Increase, Tons. | Decrease, Tons. | |
| Mossbank | 25,915 | 24,398 | 1,517 | |
| Black Diamond Opencast* | 14,832 | 14,832 | ||
| Wairaki | 60,949 | 65,274 | 4,325 | |
| Star† | 37,166 | 37,166 | ||
| Birchwood‡ | 5,895 | 5,895 | ||
| Ohai Opencast§ | 49,475 | 49,475 | ||
| Liverpool | 80,740 | 95,380 | 14,640 | |
| Strongman | 93,670 | 96,680 | 3,010 | |
| Blackball | 55,585 | 58,356 | 2,771 | |
| Wallsend | 47,133 | 44,664 | 2,469 | |
| Dobson | 61,778 | 57,806 | 3,972 | |
| Paparoa|| | 24,154 | 24,154 | ||
| Burke'S Creek | 18,539 | 13,575 | 4,964 | |
| Garvey Creek¶ | 6,858 | 6,858 | ||
| Wangaloa Opencast | 42,304 | 32,023 | 10,281 | |
| Stockton Mine and Opencast | 258,757 | 231,690 | 27,067 | |
| Mangapehi | 50,808 | 51,549 | 741 | |
| Tatu | 33,621 | 32,375 | 1,246 | |
| Waitewhena Opencast | 44,427 | 21,630 | 22,797 | |
| Kemp'S Opencast | 58,695 | 55,246 | 3,449 | |
| Kimihia Opencast | 69,695 | 42,762 | 26,933 | |
| Glen Afton Opencast** | 5,686 | 15,803 | 10,117 | |
| Wilton | 78,094 | 75,154 | 2,940 | |
| Kamo†† | 9,783 | 9,783 | ||
| Totals | 1,185,084 | 1,063,840 | 206,323 | 85,079 |
The average number of persons employed in and about State mines during the year ended 31st March, 1948, was—underground, 1,722, surface, 803, total, 2,525. Surface workers include 167 employed at the eight State opencast mines operated during the period. During the year ended 31st March, 1947, the men employed at State mines totalled 2,129.
Sales of coal, &c., through the medium of the depots totalled 822,306 tons (value, £1,188,105) for the year ended 31st March, 1948. This compares with 705,925 tons (value, £1,184,450) for the year ended the 31st March, 1947, and 637,213 tons (value, £1,161,824) for the previous year.
PETROLEUM.—Indications of the presence of petroleum are found on the surface in North Auckland, at Moturoa near New Plymouth and elsewhere in Taranaki, over wide areas on the eastern coast of the North Island, and in the South Island at Kotuku, near Murchison, and in the Cheviot district. In curlier years drilling had been carried out in Taranaki, Hawkes Bay, Canterbury, Southland, and Westland, the deepest hole being at Moturoa, near New Plymouth, which attained a depth of approximately 6,000 ft. Petroleum of good quality was proved to exist, but only in limited quantity.
Since the passing of the Petroleum Act, 1937, as amended by section 55 of the Statutes Amendment Act, 1939, and sections 59 to 63 inclusive of the Statutes Amendment Act, 1941, considerable interest was displayed by some of the major oil organizations, and practically all the potential oil-bearing lands in New Zealand were held under petroleum prospecting licences.
A great amount of geological and geophysical work Was carried out on licensed areas by expert staffs using the most modern equipment. In addition to many thousands of feet of core-drilling for geological and geophysical purposes, thirteen deep holes were drilled on favourable structures located by the geological work. The deepest hole attained a depth of 10,925 ft., and the total footage drilled amounted to 73,565 ft. The results of this drilling were consistently disappointing, as all the wells proved dry. All the operating companies have now ceased work, and the licences held by them under the Petroleum Act have been surrendered. At one time five companies held forty-seven licences covering 7,541 square miles, but at the present moment only one licence is current, covering 10 square miles.
During 1947 a production of 82,307 gallons of oil was obtained from the New Zealand Oil Refineries Co.'S wells at New Plymouth, compared with 81,265 gallons in 1946. The total production of crude petroleum to the 31st December, 1947, is estimated at 3,666,714 gallons.
BENTONITE.—The most promising deposits of this mineral occur at Porangahau, in the Hawkes Bay district. Bentonite is mainly used in the preparation of foundry moulding sands, but the mineral has many other uses. With the installation of treatment plant, bentonite in a marketable processed form will now be available instead of the crude lump sun-dried form previously produced. It is expected that production will be increased in consequence of the expanded market available. During 1947, 215 tons of bentonite were produced, of a value of £1,049. The total quantity produced to the end of 1947 was 1,969 tons, of a value of £8,813.
KAURI-GUM.—Production of kauri-gum has decreased in recent years. The industry suffered a severe setback through the restriction of European markets during the period of the 1914–18 war; and, while some recovery was made in the five years immediately following the war, trade in this commodity has since been at a comparatively low level.
A system of control of the trade in and export of kauri-gum was provided by the Kauri-gum Control Act, 1925. The Finance Act (No. 2), 1933, provided for the repeal of the Control Act. The property of the Kauri-gum Control Board was vested in the Crown, the Minister of Lands taking over the powers and obligations of the Board. The Internal Marketing Division of the Marketing Department has, since 1937, materially assisted kauri-gum diggers by arranging minimum prices for various types and qualities of gum, and by assisting in the marketing of their product.
12*
During 1947, 1,201 tons of kauri-gum, valued at £120,256, were exported, the total quantity of gum exported to the end of 1947 being 452,022 tons, valued at £24,426,405.
PHOSPHATE.—The occurrence of phosphate has been reported from many localities in New Zealand, but so far the deposits of Clarendon and Milburn have proved to be the only ones of economic importance. From 1902 to 1924 these deposits were actively worked, and 141,843 tons of medium grade phosphate rock were produced.
During 1942 this field was examined in some detail by officers of the Geological Survey. A new phosphate-bearing horizon was located, and an extensive drilling programme carried out over both horizons. The results of this work were rather disappointing, but active mining commenced again in 1943. During the years 1943 and 1944, 7,488 tons of medium-grade phosphate rock were produced, while from 1943 to 1947 the production of low-grade phosphate rock amounted to 40,887 tons. The resumption of imports of rock phosphates from Nauru has coincided with the exhaustion of the more favourable sections of the deposit, and operations were terminated early in 1947.
SERPENTINE.—Serpentine, which in the South Island forms vast rock masses in Nelson and Otago, and which occurs in smaller amounts in the North Island, is now of value to the fertilizer industry in the preparation of serpentine superphosphate. Production so far has been mainly confined to the smaller occurrences in North Auckland owing to ease of access and transport, but production has now been commenced at much larger deposits near Te Kuiti, in the North Island, and near Mossburn, in the South Island. Production in 1947 amounted to 31,935 tons and in 1946 to 20,058 tons. To the end of 1947, 204,391 tons of serpentine had been mined.
GREENSTONE.—The mineral nephrite, the “pounamu” of the Maori, a deep-green semi-transparent mineral with dark opaque patches, more popularly known as one of the varieties of “greenstone,” occurs as rounded segregations in the talc or talc-serpentine rocks of the Griffin Range of North Westland. The principal supply is obtained from the gravels of the Arahura and Taramakau Rivers, and from gold-sluicing claims of the Kumara district. Some of this has been cut and polished in New Zealand for personal and other small ornaments; the remainder has been exported. Owing to the suspension of sluicing operations, this mineral is now in short supply.
SALT.—An entirely new departure in mineral production is at present in its initial stages at Lake Grassmere, in Marlborough, where it is planned to produce salt by the solar evaporation of sea-water. The low rainfall, long hours of sunlight, and the wind conditions make this locality the most suitable one in New Zealand for this purpose.
BUILDING AND ORNAMENTAL STONES.—New Zealand possesses a great variety of handsome and durable building-stones scattered throughout both Islands. In Auckland there are basalt, andesite, porphyrite, and quartz biotite-diorite, known in the building trade as Coromandel “granite,” a hard, coarsely crystalline rock, capable of taking a fine polish. In addition there are the Whangarei limestone and the Raglan stone, the former an excellent building-stone, the latter a good freestone. Taranaki has the hornblende andesites of New Plymouth and Mount Egmont, and Wellington the andesites of Ruapehu.
In Nelson there are the granite of Tata Island and Tonga Bay and the marble or crystalline limestones of the Pikiruna (Riwaka) Range. West Nelson and Westland are well. provided with granites and limestones of good quality, well adapted for building purposes; and in the Griffin Range, North Westland, there is found an abundance of finely coloured serpentine, unsurpassed as a decorative stone. Building-stone is scarce in Marlborough; but Canterbury is well supplied, having an abundance of Lyttelton bluestone (andesite) and Mount Somers stone, a limestone of exceptional quality. In Otago there is an abundance of excellent building-stone, ranging from the well-known Oamaru stone to the granite, gneiss, and limestones of Fiordland, all close to deep water. In Southland there are the so-called Ruapuke “granite,” the norite of the Bluff, and the granites of Stewart Island.
The lower story of Parliament Buildings is constructed of Corornandel granite, and the upper stories of Takaka marble.
The following table relates to quarries under the Quarries Act showing the output for the year 1947.
| — | Northern. | Hauraki. | West Coast. | Southern. | ||||
|---|---|---|---|---|---|---|---|---|
| Quantity. | Value. | Quantity. | Value. | Quantity. | Value. | Quantity. | Value. | |
| Tons. | £ | Tons. | £ | Tons. | £ | Tons. | £ | |
| Bentonite | 215 | 1,049 | ||||||
| Clay for bricks, &c. | 92,443 | 13,410 | 3,436 | 1,051 | 2,500 | 803 | 52,429 | 18,629 |
| Clay for pottery, &c | 1,353 | 1,791 | 778 | 838 | 9,839 | 7,341 | ||
| Diatomite | 204 | 401 | 232 | 308 | ||||
| Dolomite | 7,034 | 3,517 | ||||||
| Fuller'S earth | 31 | 120 | ||||||
| Limestone for cement | 256,047 | 41,457 | 60,936 | 6,630 | 82,352 | 25,682 | ||
| Limestone for agriculture | 364,827 | 153,774 | 44,656 | 14,146 | 611,327 | 239,839 | ||
| Limestone for industry | 5,475 | 2,664 | 2,683 | 1,073 | 10,243 | 3,122 | ||
| Magnesite | 362 | 253 | ||||||
| Phosphate | 200 | 100 | ||||||
| Pumice | 3,389 | 2,635 | ||||||
| Quartzite | 13 | 33 | ||||||
| Rock for harbour-works | 41,347 | 6,451 | ||||||
| Sand, gravel, &c., for roads and ballast | 973,061 | 287,020 | 211,168 | 80,816 | 11,881 | 1,933 | 421,843 | 108,539 |
| Sand, &c., for building aggregate | 214,034 | 66,721 | 160,801 | 70,402 | ||||
| Serpentine | 28,639 | 6,859 | 3,296 | 4,944 | ||||
| Silica sand | 12,541 | 28,217 | 145 | 145 | 1,757 | 1,996 | ||
| Stone dust for coal-mines | 914 | 174 | 384 | 96 | ||||
| Dimension stone for building | 122 | 549 | 14,406 | 10,594 | ||||
| Totals | 603,806 | 84,728 | 29,545 | 498,043 | ||||
Number of men employed: Northern, 1,127; Hauraki, 216; West Coast, 157; Southern, 648; total, 2,148.
The Quarries Act, 1944, which repealed the Stone-quarries Act, 1910, and its amendments, includes any place with a face of more than 15 ft. in depth, in which persons work in excavating any kind of material from the earth, with the exception of coal, gold, scheelite, or petroleum. It does not apply to any road or railway cutting, or to excavations for buildings, but does include any tunnel of more than 50 ft. in length in the construction of which explosives are used.
PERSONS ENGAGED.—The following table shows the number of persons employed in or about mines and stone-quarries, and in oil-prospecting operations, during each of the last five years.
| — | 1943. | 1944. | 1945. | 1946. | 1947. |
|---|---|---|---|---|---|
| Metalliferous mines | 1,562 | 1,499 | 1,388 | 1,166 | 1,208 |
| Coal-mines | 5,374 | 5,595 | 5,592 | 5,557 | 5,442 |
| Stone-quarries | 1,672 | 1,551 | 1,728 | 1,960 | 2,148 |
| Oil prospecting | 216 | ||||
| Totals | 8,824 | 8,645 | 8,708 | 8,683 | 8,798 |
Accidents in mining and quarrying operations in 1947, with 1946 figures in parentheses, resulted in four (4) deaths in coal-mines, two (nil) in metalliferous mines, and five (1) in quarries. In addition, forty-one (43) persons were seriously injured in coal-mines, five (3) in metalliferous mines, and two (10) in quarries.
STATE AID TO MINING.—State aid to mining in New Zealand is given in several forms—viz., (1) geological survey and bulletins; (2) financial aid to prospecting; (3) schools of mines; (4) subsidized roads to mining-fields.
During the year officers of the Geological Survey were chiefly engaged in regional geological survey as far as pressure of work permitted. Field-work was completed in Motatau Survey District (North Auckland), in Wanganui Subdivision, and in North Otago. It is proceeding in Punakitere Survey District (North Auckland), in the “mineral belt,” Nelson, and in West Southland.
The coalfields of North Auckland, Reefton, Greymouth, Murchison, South Otago, and Southland were under investigation continuously, and the latest information from field-work, drill-holes, and mining was compiled, tested, mapped, and used to guide further work.
Water-supplies were reported on at Whangarei, Auckland, Cambridge, Three Kings, Rotorua, Rangitaiki, Wairakei, North and South Canterbury, Timaru, Waikouaiti, and Southland.
Quartzite and greensand were mapped near Paraparaumu. Glass-sands were sampled from Parengarenga, Helensville, and Mount Somers; bentonite and pozzolana in the Wairarapa and East Coast districts; and diatomite was examined near Taumarunui and Hawera.
Dams, tunnels, roads, quarry-sites, &c., were reported on for Government Departments and local authorities.
From the field geologists, Government Departments, local bodies, prospectors, &c., rocks came in continuously and were tested and reported on by the penologists. Considerable attention was directed to rock aggregates for cements, with reference to those liable to react injuriously.
Volcanological work was proceeded with in the Rotorua-Taupo region, and investigations were made into the utilization of steam and hot water for heating and power purposes.
The following is a summary of work carried out at the Dominion Laboratory during 1947 in connection with mining industries:—
Evaluation of cement-making raw materials from Southland in co-operation with the Geological Survey.
Survey of glass-sand deposits of New Zealand started, and investigation of methods of beneficiating them.
Experimental study of the possibility of using greensand as a flux in the fusion process of phosphatic-fertilizer manufacture.
Examination of concentrates from Taranaki and West Coast (South Island) black-sand deposits with a view to ascertaining uses for iron or pigment production.
Investigation of many clays for ceramic value, including refractory clays from North Auckland and brickmaking clays from Whangarei and Wellington.
Testing of the suitability of local diatomites for filtration use.
The usual large number of analyses of minerals and ores forwarded by prospectors and others, including assays for gold and silver, and limestones for agricultural use. Other samples included mine airs and gases, and stone dusts used in the suppression of the inflammability of coal-dusts.
As part of the survey of the New Zealand coal resources, a very large number of bore core, outcrop, and mine samples were analysed.
As an aid towards the development of the mining industry the Government offers varied and liberal assistance to prospectors in the form of subsidies, expert and technical advice, use of plant, &c. Subject to the provisions of the Mining Act, the holder of a valid minor'S right is entitled to prospect for gold or any other metal or mineral (except coal) on any Crown land. He may also obtain authority from the Governor-General to prospect on Maori land, and he may also prospect on private land with the consent of the owner. Wardens in mining districts and Commissioners of Crown Lands in other districts may, with the consent of the Minister of Mines, grant prospecting licences for coal.
Apart from the subsidy on coal-production referred to on page 353, the total expenditure by way of direct assistance to mining in the year ended 31st March, 1948, with 1947 figures in parentheses, was £6,113 (£21,314), of which £2,786 (£20,500) was advanced to promote and maintain coal-production, £2,560 (£354) to gold-mining, £510 (£40) towards the production of scheelite, and £250 towards copper prospecting. In addition, the Mines Department expended £27,093 (£25,144) in prospecting and development work.
For the education of prospectors and mining students seven schools of mines are subsidized by the Government, in addition to the Otago University School of Mines. The schools of mines are situated at Thames, Waihi, Huntly, West port, Reefton, Runanga, and Ohai. Six scholarships, tenable for four years at the University of Otago, are offered annually by the Mines Department. The expenditure on these schools by the Government during the year ended the 31st March, 1948, was £4,884, as against £5,099 during the previous year.
The expenditure in the form of subsidies and direct grants upon roads and tracks to mining areas during the year ended 31st March, 1948, amounted to £3,476, as compared with £7,015 during the previous year.
Another form of Government assistance to mining consists of the publication of several leaflets as a guide to the prospector. These leaflets may be obtained on application to the Mines Department, and deal with: (a) The description of fields which may be considered to warrant further examination for gold; (b) the description of the best ways of seeking for and of saving gold; (c) a brief summary of the statutory procedure to be followed to obtain a right to prospect or mine for metals or minerals under the Mining Act; (d) notes on the taking of samples of mineral deposits and the valuation of mining prospects; (e) notes for drilling and a method of calculating gold value of alluvial deposits.
Board of Examiners.—The Board of Examiners annually conducts examinations of candidates for certificates as first-class and second-class mine-managers, battery-superintendents, and dredgemasters under the Mining Act, and for certificates as first-class and second-class mine-managers, mine-surveyors, and electricians under the Coal-mines Act. Examinations of candidates for certificates as underviewers and firemen-deputies under the Coal-mines Act are held at intervals when necessary. No candidate is permitted to present himself for examination unless he holds an authority from the Secretary to the Board of Examiners. Thirty-eight certificates were issued in 1947.
Coal-miners' Relief Fund.—The Coal-mines Act, 1925, required the owner of every coal-mine to contribute ½d. per ton on all coal sold, for the relief of coal-miners who may be injured while working, and for the relief of the families of coal-miners who may be killed or injured.
Section 4 of the Coal-mines Amendment Act, 1947, increased this levy from½ to 1d. per ton. This rise was made necessary by the imminent exhaustion of the fund and during 1948 it was also necessary for the State coal-mines to pay £1,000 in levies slightly in advance of the due date so that the current outgoings could be met. These contributions are paid to the Coal-miners' Relief Fund established under the Act, the fund being administered by the Public Trustee with the assistance of local committees.
Receipts for the year ended 31st March, 1948, were £5,750, and expenditure for the year was £7,056. Interest earned amounted to £18, and the balance standing to the credit of the fund on 31st March, 1948, was £554. For the year ended 31st March, 1947, the figures were: receipts, £6,212; expenditure, £8,299; interest, £78; balance as at 31st March, 1947, £1,841. From now on the fund will receive the full benefit of the increased levy and the financial position may be expected to improve.
Information concerning monetary benefits for miners incapacitated by miner'S phthisis or any other occupational disease or heart disease contracted while working as a miner in New Zealand appears in Section 25 (Social Security, Pensions, Superannuation, &c).
Table of Contents
STATISTICS of factory production were collected in New Zealand from 1867 to 1916 in conjunction with the population census; but, commencing with the year 1918–19, the collection became an annual one. An analysis of the statistics for recent years, with a brief summary covering the period 1910–11 to 1946–47, is given in the following pages. More complete statistics will be found in the annual Statistical Report on Factory Production.
It should be noted that the production year does not coincide with the calendar year, the 31st March generally marking the end of the accounting period. In the important semi-primary industries, butter, cheese, and condensed milk manufacture and meat freezing and preserving, the financial years—and, incidentally, the periods covered by the returns from which the accompanying statistics are compiled—are in accordance with the production seasons ending respectively in the following June (or July) and September.
A review of the statistics of factory production for a number of years shows that, following the depression of the early nineteen-thirties, New Zealand industries had been making steady progress up to the outbreak of the Second World War; progress to which the establishment and growth of new industries had contributed considerably. This diversification and expansion, which received a further impetus as the result of the policy of import selection and control instituted by the Government towards the end of 1938, greatly increased the occupational range of factory employment, and local production of raw materials ceased to be the limiting factor in the growth of factory industries, local manufactures being able to meet the country'S needs in many products which previously had been almost exclusively imported. This development stood New Zealand in good stead during the years of the Second World War when heavy calls were made on the industrial community to supply goods no longer obtainable from overseas for both the Armed Forces and civilian requirements. Not only were there large increases in the output of lines for which appropriate manufacturing facilities and skills were available, but new facilities were provided, locally and by importation, and new skills acquired for production in lines not previously attempted in this country. On the other hand, during the war and in the post-war period, labour shortages and difficulties experienced in obtaining overseas sources of supply of plant and raw materials have restricted the supply of certain commodities.
The development of the country'S hydro-electric power resources has been a potent factor in industrial growth. Until the outbreak of the Second World War curtailed deliveries of generating equipment and also led to heavier demands on available supplies owing to the expansion of industry, ample power was available in both Islands at rates comparing very favourably with those in other and more highly industrialized countries. The all-over price per unit retailed in 1946–47 was 0.819d., with much lower rates for industrial supply in the urban areas. Shortage of generating capacity has now necessitated continuous control on the growth of load, and restrictions on the use of current have been necessary in recent winters. The State Hydro-electric Department is now pressing forward extensive hydro-electric-development schemes in both the North and South Islands.
INDUSTRIES COVERED BY STATISTICS.—Under the regulations authorizing the collection of statistics of factory production a “factory” is defined as an establishment engaged in the manufacture, repair, or preparation of articles for wholesale or retail trade or for export, which employs at least two hands or uses motive power, with the exception of the following, which are expressly excluded: Bakeries, butcheries, laundries, smithies, waterworks, shops engaged in retail trade only, and farmers or others using motive power for their own individual and private use. The following are, however, required to furnish returns even though employing less than two hands and not using motive power: Tanneries; bacon, butter, cheese, soap, and candle factories; brickyards; and lime-works.
Such industries as jewellery and watch repairing, boot and shoe repairing, and saddlery repairing, come within the meaning of the term “factory,” and figures relating to these industries were at one time included in the statistics. Since 1919, however, they have been excluded unless they are also engaged in actual manufacture and have at least two persons engaged, or use motive power. Other classes of establishments formerly covered by the statistics but excluded from 1921–22 onwards are those engaged in dressmaking and millinery (unless manufacturing wholesale for sale in retail shops), bespoke tailoring, and establishments engaged in tea blending and packing, liquor-bottling, stone quarrying and crushing, asphalting, and monumental masonry. The latter industries were excluded to bring the statistics into conformity with those of other British Commonwealth countries. In addition, returns are not required from plumbers, from undertakers, or from builders who make joinery solely for their own building contracts.
It should be noted that factory-production statistics do not cover, and do not purport to cover, all establishments registered as factories in New Zealand. “One man” businesses are excluded with the exception of tanneries, bacon, butter, cheese, soap, or candle factories, brickyards, or lime-works; and some small repair-shops (as explained previously) are excluded even though they may employ two or more hands. The effect of these limitations in the scope of the statistical inquiry is seen from the fact that while for the year 1946–47 18,291 factories, employing 152,956 hands, were registered under the Factories Act, only 7,642 factories (with 134,435 persons engaged) were covered by the statistics of factory production.
GENERAL SUMMARY.—The statistics in the table following illustrate the growth of New Zealand'S factory production to its present standing.
| Year. | Number of Establishments. | Persons engaged. | Salaries and Wages paid. | Cost of Materials. | “Other Expenses” (i.e., Expenses of Operation other than Salaries and Wages and Cost of Materials). | Value of Output. | Added Value. |
|---|---|---|---|---|---|---|---|
* Productive employees only. † Not available. | |||||||
| £ | £ | £ | £ | £ | |||
| 1910–11 | 3,483 | 45,924* | 4,786,698* | 18,782,929 | † | 29,317,023 | 10,534,094 |
| 1915–16 | 3,755 | 48,744* | 5,791,704* | 30,197,784 | † | 43,034,033 | 12,836,249 |
| 1920–21 | 4,022 | 69,681 | 13,172,996 | 52,933,494 | † | 77,828,013 | 24,894,519 |
| 1925–26 | 4,794 | 78,708 | 16,153,822 | 51,668,100 | 8,395,921 | 82,358,851 | 30,690,751 |
| 1929–30 | 5,168 | 82,861 | 16,846,286 | 58,484,245 | 9,954,861 | 90,757,981 | 32,273,736 |
| 1930–31 | 5,194 | 77,914 | 15,617,052 | 48,458,356 | 9,388,626 | 77,745,249 | 29,286,893 |
| 1931–32 | 4,969 | 68,697 | 12,642,935 | 42,472,600 | 8,263,065 | 66,588,744 | 24,116,144 |
| 1932–33 | 4,993 | 68,921 | 12,048,148 | 42,726,043 | 8,097,042 | 66,109,455 | 23,383,412 |
| 1933–34 | 5,028 | 72,651 | 12,106,500 | 47,067,564 | 8,108,890 | 71,770,872 | 24,703,308 |
| 1934–35 | 5,270 | 79,358 | 13,244,373 | 52,277,285 | 8,809,912 | 79,324,473 | 27,047,188 |
| 1935–36 | 5,536 | 86,588 | 14,844,367 | 60,172,848 | 9,374,369 | 90,014,748 | 29,841,900 |
| 1936–37 | 5,728 | 96,401 | 18,333,077 | 70,938,165 | 10,481,253 | 105,941,722 | 35,003,557 |
| 1937–38 | 5,924 | 102,344 | 20,981,587 | 75,371,558 | 10,540,208 | 113,691,556 | 38,319,998 |
| 1938–39 | 6,146 | 102,535 | 22,270,010 | 75,634,903 | 10,001,804 | 114,447,426 | 38,812,523 |
| 1939–40 | 6,342 | 108,722 | 24,460,549 | 85,243,383 | 11,043,557 | 129,061,826 | 43,818,443 |
| 1940–41 | 6,395 | 113,999 | 26,946,799 | 98,547,804 | 11,978,820 | 147,153,559 | 48,605,755 |
| 1941–42 | 6,367 | 117,214 | 29,504,299 | 102,260,860 | 12,812,901 | 155,566,195 | 53,305,335 |
| 1942–43 | 6,127 | 114,590 | 32,256,071 | 107,447,799 | 13,331,973 | 165,936,284 | 58,488,485 |
| 1943–44 | 6,202 | 117,864 | 34,433,075 | 112,883,932 | 14,516,235 | 175,686,689 | 62,802,757 |
| 1944–45 | 6,485 | 122,414 | 37,379,062 | 122,695,106 | 15,481,351 | 189,800,764 | 67,105,658 |
| 1945–46 | 6,991 | 128,208 | 41,499,113 | 123,508,438 | 16,278,562 | 195,258,614 | 71,750,176 |
| 1946–47 | 7,642 | 134,435 | 45,336,217 | 137,033,722 | 18,247,043 | 216,606,182 | 79,572,460 |
In the calculation of value of products, values at the factory are taken. Despite instructions to the contrary, however, it was found that some of the returns for 1937–38 and previous years contained an unknown amount of selling and distributing charges. As these charges have been excluded from the figures for 1938–39 and subsequent years, the value of output, added value, and other expenses of manufacture for these years are not strictly comparable with earlier years.
Factory production climbed fairly steadily from 1910–11 until a relatively high level was attained in 1929–30. During the depression of the early “thirties” there was a decided fall, but 1933–34 saw the commencement of a gradual recovery in industrial conditions. The pre-depression level was surpassed in 1936–37, and from then on each successive year has set new record high levels for factory production. During the Second World War there were temporary reductions in the numbers of establishments operating, and a fall in the number of persons engaged occurred in 1942–43 as a result of mobilization for home defence following the entry of Japan into the war.
In the 7,642 establishments recorded in 1946–47 the average number of persons engaged was higher by 6,227 or 4.9 per cent., than in the 6,991 establishments reported in 1945–46. The salaries and wages paid increased by £3,837,104, or by 9.2 per cent. The cost of materials used increased by £13,525,284, or 11 per cent., while the value of output rose by £21,347,568, or 10.9 per cent., resulting in the added value increasing by £7,822,284, or 10.9 per cent.
In making use of the following summary by provincial districts for the year 1946–47 it is necessary to keep in mind the differences in size and population of the respective provincial districts (vide section on “Population”).
| Provincial District. | Number of Establishments. | Persons engaged. | Salaries and Wages paid. | Cost of Materials. | Other Expenses of Operation. | Value of Output. | Added Value. |
|---|---|---|---|---|---|---|---|
| £ | £ | £ | £ | £ | |||
| Auckland | 2,754 | 50,933 | 17,407,867 | 55,491,947 | 7,721,676 | 86,677,888 | 31,185,941 |
| Hawkes Bay | 338 | 4,743 | 1,644,113 | 6,749,745 | 643,094 | 9,722,318 | 2,972,573 |
| Taranaki | 369 | 4,157 | 1,586,269 | 8,487,014 | 676,117 | 11,063,022 | 2,576,008 |
| Wellington | 1,707 | 30,480 | 10,413,342 | 29,273,864 | 3,959,342 | 47,536,202 | 18,262,338 |
| Marlborough | 82 | 728 | 229,743 | 689,289 | 92,834 | 1,017,561 | 328,272 |
| Nelson | 234 | 2,269 | 796,216 | 1,689,945 | 343,947 | 2,972,932 | 1,282,987 |
| Westland | 102 | 1,183 | 441,016 | 409,027 | 152,554 | 1,122,625 | 713,598 |
| Canterbury | 1,132 | 22,723 | 7,143,027 | 18,381,240 | 2,325,038 | 30,477,696 | 12,096,456 |
| Otago— | |||||||
| Otago | 595 | 12,719 | 4,029,158 | 9,336,612 | 1,628,373 | 16,585,156 | 7,248,544 |
| Southland | 329 | 4,500 | 1,645,466 | 6,525,039 | 704,068 | 9,430,782 | 2,905,743 |
| Totals | 7,642 | 134,435 | 45,336,217 | 137,033,722 | 18,247,043 | 216,606,182 | 79,572,460 |
ESTABLISHMENTS AND EMPLOYEES.—There was an increase of 651 in the number of establishments reporting in 1946–47, compared with an increase of 506 in 1945–46. These increases are numerically the highest recorded and compare with the percentage increases recorded after the First World War. The same factors operated after both wars—viz., the re-establishment of businesses closed down during the war periods and the opening of new businesses by returned servicemen. In addition, in recent years the shortage of labour in the principal centres has resulted in branch factories and workrooms being opened in secondary towns to lap the labour resources in those areas.
The industries recording the greatest increases in the numbers of establishments reporting operations in 1946–47 were: coachbuilding, motor and cycle engineering, 181; textile and fur clothing, 109; general engineering, iron and brass founding, 88; furniture and house furnishings, 83.
The following table shows the average (monthly) numbers of wage-earners and of total persons engaged in each of the principal industries and all industries, and the number of establishments operating, during the year 1946–47.
| Industry. | Number of Establishments. | Wage-earning Employees. | Total Persons engaged. | ||
|---|---|---|---|---|---|
| M. | F. | M. | F. | ||
| Meat freezing and preserving | 51 | 9,511 | 404 | 10,674 | 594 |
| Ham and bacon curing | 44 | 485 | 27 | 593 | 76 |
| Butter, cheese, condensed milk, &c. | 389 | 2,786 | 103 | 3,649 | 410 |
| Grainmilling | 46 | 531 | 24 | 665 | 65 |
| Biscuits and confectionery | 65 | 1,156 | 1,014 | 1,333 | 1,136 |
| Jam-making, fruit and vegetable preserving | 28 | 467 | 337 | 531 | 366 |
| Miscellaneous foods | 72 | 502 | 404 | 627 | 497 |
| Brewing and malting | 46 | 1,319 | 1,515 | 73 | |
| Aerated waters, cordials, and ice-cream | 148 | 503 | 76 | 722 | 154 |
| Tobacco and cigarettes | 5 | 273 | 668 | 329 | 716 |
| Soap and candle | 25 | 337 | 239 | 446 | 286 |
| Boiling-down, glue, and manures | 38 | 436 | 19 | 506 | 37 |
| Fellmongering and woolscouring | 33 | 467 | 526 | 8 | |
| Tanning | 19 | 843 | 2 | 922 | 18 |
| Sawmilling, sash and door making | 487 | 6,682 | 22 | 7,650 | 138 |
| Coopering and casemaking | 27 | 334 | 1 | 379 | 12 |
| Woodware and turnery | 212 | 1,801 | 64 | 2,122 | 121 |
| Furniture and house furnishings | 617 | 3,836 | 531 | 4,597 | 698 |
| Paper bag and box making | 32 | 472 | 473 | 566 | 518 |
| Gasworks | 44 | 1,319 | 2 | 1,693 | 107 |
| Electric Supply | 100 | 2,875 | 24 | 3,957 | 442 |
| Printing, publishing, and bookbinding | 348 | 4,507 | 1,510 | 5,612 | 2,093 |
| Lime crushing and burning and cement | 99 | 1,194 | 1,384 | 19 | |
| Brick, tile, and pottery | 56 | 1,172 | 145 | 1,290 | 191 |
| Pumice and concrete products | 132 | 752 | 917 | 26 | |
| Tinned plate and sheet metal | 144 | 1,986 | 375 | 2,266 | 475 |
| General engineering, iron and brass founding | 478 | 7,818 | 219 | 9,093 | 575 |
| Electrical and radio engineering | 152 | 2,095 | 439 | 2,486 | 593 |
| Agricultural and dairying machinery | 84 | 1,239 | 4 | 1,407 | 70 |
| Coachbuilding, motor and cycle engineering | 1,561 | 8,750 | 24 | 10,900 | 716 |
| Saddlery, harness, and leather goods | 136 | 517 | 772 | 710 | 841 |
| Ship and boat building | 36 | 937 | 1,031 | 21 | |
| Chemical fertilizers | 9 | 940 | 1,069 | 40 | |
| Paint and varnish | 24 | 327 | 49 | 407 | 95 |
| Polishes, matches, chemicals, &c. | 179 | 800 | 845 | 1,137 | 1,076 |
| Footwear | 101 | 2,600 | 1,897 | 2,931 | 2,036 |
| Woollen-mills | 21 | 1,588 | 1,263 | 1,694 | 1,304 |
| Hosiery and knitted goods | 56 | 633 | 1,340 | 771 | 1,438 |
| Textile and fur clothing | 654 | 1,969 | 12,363 | 2,885 | 13,075 |
| All other industries | 844 | 7,435 | 1,891 | 8,923 | 2,364 |
| Totals | 7,642 | 84,194 | 27,570 | 100,915 | 33,520 |
The distribution of the sexes among the persons engaged shows a considerable preponderance of males. In the five years prior to the Second World War the proportion of female employees in factories was steady at 25 per cent. After rising rapidly to a peak of 31.5 per cent. in 1942–43 as a result of additional women being recruited for factory work and men being called for military service, the proportion then fell equally rapidly back to the pre-war figure.
In the smaller districts there are few industries employing female labour to any great extent; but the male preponderance is considerably smaller in the four main districts, where female labour is in greater demand. In Wellington and Otago the excess of males is less than in other districts, owing principally to the comparative importance of their clothing and textile industries. Women and girls are chiefly found in the following industries: textile and fur clothing, 13,075; printing, publishing, and bookbinding, 2,093; footwear-manufacturing, 2,036; hosiery and knitted goods, 1,438; woollen-mills, 1,304; biscuits and confectionery, 1,136.
The following figured show that in 1946–47 for approximately ten wage-earners-there was one proprietor (actively engaged), manager, or overseer.
| Group. | 1945–46. | 1945–1946 | ||
|---|---|---|---|---|
| Number of Persons. | Per Cent. of Total. | Number of Persons. | Per Cent. of Total. | |
| Proprietors actively engaged | 2,778 | 2.2 | 3,207 | 2.4 |
| Managers, overseers, &c. | 7,624 | 5.9 | 8,204 | 6.1 |
| Accountants, clerks, &c. | 10,396 | 8.1 | 11,260 | 8.4 |
| Wage-earning employees | 107,410 | 83.8 | 111,764 | 83.1 |
| Totals | 128,208 | 100.0 | 134,435 | 100.0 |
A classification of the establishments, according to the number of persons engaged, is given for the years 1924–25, 1929–30, 1934–35, and 1939–40 to 1946–47.
| Year. | 10 or under. | 11–20. | 21–50. | 51–100. | Over 100. | Totals. |
|---|---|---|---|---|---|---|
| Number of Factories | ||||||
| 1924–25 | 2,972 | 720 | 570 | 155 | 121 | 4,538 |
| 1929–30 | 3,476 | 800 | 591 | 164 | 137 | 5,168 |
| 1934–35 | 3,725 | 764 | 496 | 143 | 142 | 5,270 |
| 1939–40 | 4,218 | 957 | 772 | 212 | 183 | 6,342 |
| 1940–41 | 4,253 | 935 | 777 | 237 | 193 | 6,395 |
| 1941–42 | 4,165 | 967 | 779 | 246 | 210 | 6,367 |
| 1942–43 | 4,038 | 887 | 757 | 244 | 201 | 6,127 |
| 1943–44 | 4,065 | 897 | 791 | 248 | 201 | 6,202 |
| 1944–45 | 4,139 | 1,046 | 833 | 270 | 197 | 6,485 |
| 1945–46 | 4,406 | 1,189 | 921 | 266 | 209 | 6,991 |
| 1946–47 | 4,889 | 1,248 | 1,009 | 288 | 208 | 7,642 |
| Number of Persons engaged | ||||||
| 1924–25 | 12,658 | 10,690 | 18,067 | 11,094 | 24,674 | 77,183 |
| 1929–30 | 15,474 | 11,785 | 17,977 | 11,658 | 25,967 | 82,861 |
| 1934–35 | 14,901 | 11,321 | 15,309 | 9,716 | 28,111 | 79,358 |
| 1939–40 | 17,212 | 14,048 | 23,316 | 14,737 | 39,409 | 108,722 |
| 1940–41 | 17,359 | 13,802 | 23,759 | 16,391 | 42,688 | 113,999 |
| 1941–42 | 17,238 | 14,359 | 23,565 | 16,463 | 45,589 | 117,214 |
| 1942–43 | 16,881 | 13,087 | 23,123 | 16,800 | 44,699 | 114,590 |
| 1943–44 | 17,606 | 13,384 | 24,547 | 17,347 | 44,980 | 117,864 |
| 1944–45 | 18,382 | 15,547 | 25,787 | 18,809 | 43,889 | 122,414 |
| 1945–46 | 19,813 | 17,519 | 28,343 | 17,886 | 44,647 | 128,208 |
| 1946–47 | 21,974 | 18,297 | 31,516 | 19,992 | 42,656 | 134,435 |
The classification according to the number of persons engaged shows clearly that, judged according to the standards of highly industrialized communities, the average size of the industrial unit in New Zealand is small.
The changes brought about by a war economy had their greatest effect on the smaller establishments, the number employing ten persons or fewer having fallen by 215 between 1940–41 and 1942–43, while those employing from 11 to 20 hands fell by 80 in 1942–43. All groups, but particularly the smaller-sized establishments, have shown recoveries in the post-war period.
The two tables which follow give the numbers of male and female wage-earners employed in factories on the fifteenth or nearest representative day of each month of the years 1939 to 1946 and of the first three months of 1947. In addition to the steady increases up to 1941, there are considerable and uniform seasonal movements apparent in the figures for male wage-earners, due almost entirely to the influence on the totals of the figures for the important and highly seasonal industries such as meat freezing and preserving, and butter, cheese, condensed milk, &c., making. Also apparent is the reduction in the male labour force in the earlier months of 1942 as a result of the mobilization of the home-defence Forces following Japan'S entry into the war, but by mid-year 1943, male employment in factories was again back to the 1941 level. Accretions to the labour force became apparent in 1944, and accelerated to an annual gain of approximately 8,000 in 1946, but showed a slowing tendency in the last quarter of that year and the first quarter of 1947.
| — | 1939. | 1940. | 1941. | 1942. | 1943. | 1944. | 1945. | 1946. | 1947. |
|---|---|---|---|---|---|---|---|---|---|
| January | 67,679 | 70,614 | 72,805 | 71,389 | 70,527 | 73,237 | 77,405 | 83,863 | 89,916 |
| February | 69,295 | 71,494 | 73,495 | 70,739 | 70,773 | 74,190 | 77,821 | 85,173 | 90,185 |
| March | 69,702 | 71,121 | 73,347 | 70,291 | 70,477 | 73,064 | 76,624 | 85,225 | 89,725 |
| April | 68,984 | 71,793 | 71,952 | 68,733 | 71,022 | 73,780 | 77,824 | 84,591 | |
| May | 68,309 | 70,372 | 71,154 | 66,881 | 70,807 | 73,352 | 77,721 | 84,551 | |
| June | 66,726 | 67,609 | 69,710 | 65,002 | 69,161 | 72,164 | 75,910 | 82,801 | |
| July | 63,527 | 63,973 | 66,877 | 62,774 | 66,645 | 69,838 | 72,696 | 80,675 | |
| August | 64,516 | 64,515 | 66,113 | 62,607 | 66,800 | 70,019 | 73,021 | 81,148 | |
| September | 64,093 | 65,363 | 66,931 | 63,401 | 66,931 | 70,894 | 73,824 | 82,091 | |
| October | 63,785 | 65,605 | 66,461 | 63,533 | 67,013 | 70,803 | 74,985 | 82,423 | |
| November | 65,391 | 66,279 | 68,098 | 64,215 | 67,464 | 71,596 | 76,436 | 84,092 | |
| December | 68,596 | 70,619 | 71,632 | 68,222 | 70,775 | 75,530 | 81,520 | 87,932 |
In the case of female employment there are no marked seasonal or other cyclical movements to disguise the steady increases which were recorded from 1938 up to April, 1945, but it may be noted that January is generally the month of lowest employment, additions to the staff by mid-January being fewer than the losses sustained at the end of the previous year. The increases referred to reached their highest rate in the second quarter of 1940, and thereafter the rate of accretion fell. In the first quarter of 1946 the losses of female staff were running at the rate of 6,000 annually, but this rate of depletion fell rapidly, a stable level of employment being reached later in the year.
| — | 1939. | 1940. | 1941. | 1942. | 1943. | 1944. | 1945. | 1946. | 1947. |
|---|---|---|---|---|---|---|---|---|---|
| January | 20,759 | 24,020 | 26,885 | 29,060 | 29,812 | 29,240 | 29,440 | 26,683 | 26,030 |
| February | 22,334 | 25,262 | 28,394 | 29,940 | 30,538 | 30,450 | 30,694 | 27,499 | 27,216 |
| March | 22,737 | 25,469 | 28,761 | 30,511 | 30,797 | 30,746 | 30,866 | 27,548 | 27,432 |
| April | 22,771 | 26,422 | 28,967 | 30,750 | 30,845 | 30,979 | 31,016 | 27,467 | |
| May | 23,071 | 26,644 | 29,294 | 30,577 | 30,721 | 30,977 | 30,838 | 27,390 | |
| June | 23,587 | 27,146 | 29,317 | 30,502 | 30,624 | 30,949 | 30,497 | 27,347 | |
| July | 24,011 | 27,548 | 29,607 | 30,038 | 30,485 | 30,925 | 30,393 | 27,414 | |
| August | 24,347 | 27,554 | 29,649 | 30,090 | 30,410 | 30,901 | 29,997 | 27,335 | |
| September | 24,535 | 27,868 | 29,653 | 30,168 | 30,369 | 30,942 | 29,878 | 27,602 | |
| October | 24,761 | 28,142 | 30,094 | 30,226 | 30,284 | 30,887 | 29,545 | 27,684 | |
| November | 24,840 | 28,181 | 30,188 | 30,367 | 30,351 | 30,855 | 29,386 | 27,919 | |
| December | 24,686 | 28,057 | 30,133 | 30,576 | 30,287 | 30,922 | 29,082 | 27,787 |
SALARIES AND WAGES.—The figures relating to the amounts paid as salaries and wages include amounts paid as bonuses and for overtime. Figures illustrative of the rise in the aggregate amount paid in salaries and wages will be found in the first table of this section.
The amounts received by male and female employees (inclusive of all groups—executive, clerical, and wage-earning) and the average amount received per employee of each sex, as recorded in the last five collections, are set out below.
| Year. | Males | Females. | Both Sexes. | |||
|---|---|---|---|---|---|---|
| Total. | Average. | Total. | Average. | Total. | Average. | |
| £ | £ | £ | £ | £ | £ | |
| 1942–43 | 26,762,238 | 341 | 5,493,833 | 152 | 32,256,071 | 281 |
| 1943–44 | 28,585,249 | 350 | 5,847,826 | 162 | 34,433,075 | 292 |
| 1944–45 | 31,097,644 | 362 | 6,281,418 | 172 | 37,379,062 | 305 |
| 1945–46 | 34,964,717 | 377 | 6,534,396 | 184 | 41,499,113 | 324 |
| 1946–47 | 38,839,645 | 385 | 6,496,572 | 194 | 45,336,217 | 337 |
The averages shown relate to all persons engaged, irrespective of age, industry, status, and personal occupation, and year-to year comparisons may be affected by changes in any of these factors. The figures do, however, give an indication of the increased earnings of factory workers in recent years, the average for males having risen by 52 per cent. and for females by 80 per cent. since 1938–39. Of interest also is the relative improvement in the earnings of female wage-earners over the same period; whereas in 1938–39 the figure for average earnings of females was 42.5 per cent. of the corresponding figure for males, in 1946–47 the ratio had increased to 50.4 per cent.
The table following shows the amount of salaries and wages paid in each of the principal industries and the total for all industries during the years 1945–46 and 1946–47.
| Industry. | 1945–46. | 1946–47. | ||
|---|---|---|---|---|
| Males. | Females. | Males. | Females. | |
| £ | £ | £ | £ | |
| Meat freezing and preserving | 4,735,747 | 129,693 | 4,910,830 | 122,546 |
| Ham and bacon curing | 279,628 | 16,401 | 252,100 | 16,075 |
| Butter, cheese, condensed milk, &c. | 1,396, 062 | 79,836 | 1,541,884 | 78,453 |
| Grainmilling | 246,253 | 12,555 | 259,377 | 11,759 |
| Biscuits and confectionery | 461,091 | 246,770 | 522,655 | 219,321 |
| Jam-making, fruit and vegetable preserving | 231,409 | 121,987 | 200,672 | 72,192 |
| Miscellaneous foods | 229,247 | 85,063 | 239,311 | 92,815 |
| Brewing and malting | 638,201 | 16,326 | 693,874 | 16,453 |
| Aerated waters, cordials, and ice-cream | 232,313 | 30,715 | 264,305 | 32,624 |
| Tobacco and cigarettes | 129,904 | 170,348 | 149,024 | 162,471 |
| Soap and candle | 169,321 | 46,419 | 168,718 | 51,609 |
| Boiling down, glue, and manures | 196,862 | 7,912 | 200,554 | 7,492 |
| Fellmongering and woolscouring | 207,928 | 2,064 | 210,510 | 1,778 |
| Tanning | 348,549 | 4,631 | 372,336 | 4,288 |
| Sawmilling, sash and door making | 2,875,591 | 28,694 | 3,093,096 | 27,895 |
| Coopering and casemaking | 153,186 | 3,907 | 135,634 | 2,890 |
| Woodware and turnery | 670,132 | 33,274 | 744,203 | 27,035 |
| Furniture and house furnishings | 1,161,545 | 118,096 | 1,482,498 | 130,486 |
| Paper bag and box making | 167,842 | 97,881 | 215,390 | 93,532 |
| Gasworks | 666,116 | 23,184 | 679,336 | 21,262 |
| Electric supply | 1,534,866 | 93,385 | 1,682,357 | 86,755 |
| Printing, publishing, and bookbinding | 1,950,206 | 375,588 | 2,246,905 | 400,082 |
| Lime crushing and burning and cement | 518,081 | 4,266 | 525,480 | 3,438 |
| Brick, tile, and pottery | 415,492 | 31,540 | 460,127 | 35,696 |
| Pumice and concrete products | 293,422 | 5,997 | 321,990 | 5,066 |
| Tinned plate and sheet metal | 697,894 | 114,206 | 836,582 | 103,585 |
| General engineering, iron and brass founding | 3,120,051 | 178,360 | 3,320,708 | 122,622 |
| Electrical and radio engineering | 746,008 | 136,996 | 825,234 | 127,796 |
| Agricultural and dairying machinery | 486,489 | 12,594 | 482,039 | 12,877 |
| Coachbuilding, motor and cycle engineering | 2,698,405 | 104,207 | 3,560,005 | 122,101 |
| Saddlery, harness, and leather goods | 202,650 | 155,750 | 249,397 | 172,454 |
| Ship and boat building | 584,605 | 7,611 | 425,779 | 5,088 |
| Chemical fertilizers | 372,421 | 8,992 | 456,445 | 8,253 |
| Paint and varnish | 155,733 | 18,994 | 165,540 | 23,105 |
| Polishes, matches, chemicals, &c. | 383,801 | 177,641 | 430,996 | 191,965 |
| Footwear | 884,249 | 374,467 | 1,072,727 | 405,337 |
| Woollen-mills | 611,966 | 358,729 | 629,518 | 261,367 |
| Hosiery and knitted goods | 248,794 | 291,240 | 307,568 | 291,756 |
| Textile and fur clothing | 980,660 | 2,304,192 | 1,197,305 | 2,476,911 |
| All other industries | 2,891,997 | 503,885 | 3,303,636 | 447,342 |
| Totals | 34,964,717 | 6,534,396 | 38,839,645 | 6,496,572 |
Special returns as to employees and wages in a selected week are collected each year. The period covered is the nearest normal week to 31st March, and the data collected include the number of employees engaged at each wage-rate, as well as the total employees and the total earnings during the specified week. Working proprietors, managers, overseers, accountants, and clerks do not come within the scope of this inquiry, which covers wage-earning employees only, and out-workers, if any. All productive employees are covered, irrespective of age or sex, and the figures are therefore inclusive of many juvenile workers receiving comparatively low wages. The following summary table shows totals and averages for all factory industries for each of the last five years.
| Year. | Total Wage-earning Employees. | Earnings during Specified Week. | ||||
|---|---|---|---|---|---|---|
| Total. | Average. | |||||
| Males. | Females. | Males. | Females. | Males. | Females. | |
| £ | £ | £ s. d. | £ s. d. | |||
| 1943 | 70,227 | 30,756 | 456,064 | 91,432 | 6 12 9 | 2 19 5 |
| 1944 | 71,960 | 30,506 | 468,556 | 94,520 | 6 10 3 | 3 2 0 |
| 1945 | 76,249 | 30,710 | 513,956 | 97,922 | 6 14 10 | 3 3 9 |
| 1946 | 85,040 | 27,522 | 611,002 | 94,991 | 7 3 8 | 3 9 0 |
| 1947 | 89,136 | 27,293 | 665,908 | 101,005 | 7 9 5 | 3 14 0 |
Certain reservations must be made in drawing any conclusions from the foregoing table. Since the figures relate to a single week, an unduly late or early season, abnormally wet weather, &c., would affect the usefulness of the data concerning either the number of workers or their earnings as indexes of the volume of employment. Further, the figures given are for actual earnings during the week in question and not for nominal wage-rates. Variations in the amount of overtime or short-time would cause appreciable changes in average earnings even though wage-rates remained unchanged. For example, in 1943–44, 17,091,691 hours of overtime were worked and 641,848 hours of short time (other than time lost through holidays, sickness, and absenteeism) were recorded. In 1946–47 overtime had fallen to 13,645,901 hours and short time to 283,798 hours.
The following table shows the distribution of employees within the various wage-groups for the specified weeks covered by the returns for 1939 and 1947. The wage-categories shown refer in this instance to wage-rates and not to actual earnings.
| Weekly Rate of Wages. | Males. | Females. | ||
|---|---|---|---|---|
| 1939. | 1947. | 1939. | 1947. | |
| Under 20s. | 1,455 | 49 | 1,821 | 32 |
| 20s. and under 30s. | 3,215 | 396 | 3,079 | 618 |
| 30s. and under 40s. | 3,677 | 1,764 | 3,783 | 1,278 |
| 40s. and under 50s. | 3,300 | 1,454 | 4,816 | 1,478 |
| 50s. and under 60s. | 1,851 | 1,377 | 7,458 | 1,453 |
| 60s. and under 70s. | 1,404 | 1,799 | 1,180 | 3,941 |
| 70s. and under 80s. | 966 | 1,242 | 299 | 9,469 |
| 80s. and under 90s. | 2,013 | 1,262 | 95 | 4,824 |
| 90s. and under 100s. | 11,648 | 1,277 | 41 | 2,093 |
| 100s. and under 110s. | 12,610 | 1,095 | 34 | 970 |
| 110s. and under 120s. | 14,855 | 3,968 | 10 | 439 |
| 120s. and under 130s. | 5,675 | 15,566 | 9 | 329 |
| 130s. and under 140s. | 1,889 | 26,747 | 2 | 178 |
| 140s. and under 150s. | 2,305 | 13,072 | 9 | 96 |
| 150s. and under 160s. | 6,547 | 28 | ||
| 160s. and under 170s. | 3,853 | 29 | ||
| 170s. and under 180s. | 1,968 | 5 | ||
| 180s. and under 190s. | 1,427 | 10 | ||
| 190s. and under 200s. | 703 | 4 | ||
| 200s. and under 220 | 2,005 | 1,356 | 4 | 13 |
| 220s. and under 240s. | 729 | 3 | ||
| 240s. and under 260s. | 543 | 2 | ||
| 260s. and under 280s. | 455 | |||
| 280s. and under 300s. | 199 | |||
| 0s. and over | 288 | 1 | ||
| Totals | 68,868 | 89,136 | 22,640 | 27,293 |
These statistics of distribution of wage-rates show that marked changes have occurred in wage distribution, a fact which materially affects the significance of statistics of average earnings. Obviously, if a greater proportion of juvenile workers at starting rates of pay is employed in any particular year, this will tend to bring clown the general average rate of earnings—despite the fact that rates of wages for individual classes of factory work actually may have been raised. On the other hand a slackening in juvenile employment would, other things being equal, raise the average earnings. The table of distribution of wage-rates is thus more informative as an indication of wage-changes than are figures of average earnings, since, if desired, the lower wage-groups comprising mostly juveniles can be excluded from consideration.
In the table which follows there have been brought together, for both male and female wage-earners, figures for (a) minimum adult wage-rates, (b) modal, or representative adult wage-rates, and (c) average earnings in the sample week in March for selected years. Index numbers have been calculated to facilitate comparisons in the movements of the different series. The methods of construction of the two series, minimum adult wage-rates and modal wage-rates, are described in the introductory notes to the 1945–46 issue of the Statistical Report on Factory Production.
| — | Minimum Adult Wage-rates. | Modal Wage-rates. | Average Weekly Earnings. | |||||||||
|---|---|---|---|---|---|---|---|---|---|---|---|---|
| Males. | Females. | Males. | Females. | Males. | Females. | |||||||
| Amount. | Index No. | Amount. | Index No. | Amount. | Index No. | Amount. | Index No. | Amount. | Index No. | Amount. | Index No. | |
| s. | s. | s. | s. | s. | s. | |||||||
| 1939 | 107 | 100 | 51 | 100 | 112 | 100 | 53 | 100 | 98 | 100 | 42 | 100 |
| 1943 | 120 | 112 | 59 | 116 | 123 | 110 | 62 | 117 | 133 | 136 | 59 | 140 |
| 1946 | 132 | 123 | 71 | 139 | 134 | 120 | 74 | 140 | 144 | 147 | 69 | 164 |
| 1947 | 134 | 125 | 75 | 147 | 135 | 121 | 75 | 142 | 149 | 152 | 74 | 176 |
In the case of both sexes it will be seen that the modal rates, or representative rates payable to adults in factories, have followed very closely the minimum rates as prescribed under Arbitration Court awards. In the case of males there appears to be a tendency for the margin payable over award rates to diminish. This apparent reduction in the margin may be due to dilution of labour: the minimum rate for each industry has been calculated on the assumption that the occupational constitution of the industry (based on occupational classifications shown by the 1936 census) has remained unchanged, whereas, in fact, the proportion of highly skilled and consequently higher-paid tradesmen may have fallen.
Average earnings of both sexes have increased considerably more than the weekly rates, but in the case of females, owing to the higher proportion of juveniles, the average earnings have remained lower than the adult rates. Over the whole period several factors have operated to raise average earnings in relation to the weekly rates: (1) more liberal allowances for work under special conditions—(e.g., shift allowances and special payments for work outside the Monday to Friday, five-day week)—only to a small extent, if at all, reflected in the modal rates, and not recorded in the minimum rates, (2) more liberal conditions, and (3) higher rates of pay for overtime work. In addition, the average hours overtime worked per week by each employee were increasing up to 1943, hut subsequently declined. In the earlier war years there was probably considerable dilution of the male labour force due to additional adult and juvenile labour taken on and losses to the Armed Forces of experienced employees. Later this movement was reversed as returned servicemen re-entered industry, while the flow of juvenile recruits fell as a result of the low birth-rate in the early nineteen-thirties.
Comparing the figures for the two sexes it will be seen that both the rates and earnings of females have improved relatively to males. In 1939 the minimum adult rate for females and the modal rate were 48 and 47 per cent. respectively of the male rates, while in 1947 both were 56 per cent. of the male rates. Similarly, in the case of earnings the proportion improved from 43 to 50 per cent.
MOTIVE POWER.—A supply of cheap motive power is essential for industrial development. Mew Zealand industries were formerly somewhat handicapped in this respect, long railway hauls and, in some instances, sea-carriage being involved in the transport of coal from the mines to the factories. The difficulties in the way of obtaining a plentiful supply of cheap motive power have been met by the development by the State of hydro-electric schemes, for which New Zealand is topographically well suited. As mentioned earlier in these notes, conditions resulting from the war have necessitated restrictions in the supply during recent years.
The following table shows the numbers and aggregate horse-power of each class of engine used in factories for 1926–27, 1936–37, and the last three years.
| Class of Engine. | 1926–27. | 1936–37. | 1944–45. | 1945–46. | 1946–47. |
|---|---|---|---|---|---|
| Steam No. | 2,024 | 1,561 | 1,235 | 1,205 | 1,184 |
| H.P. | 134,285 | 141,001 | 136,179 | 132,979 | 133,168 |
| Gas No. | 456 | 145 | 104 | 94 | 84 |
| H.P. | 16,313 | 7,562 | 5,143 | 4,800 | 4,418 |
| Oil No. | 321 | 550 | 1,004 | 1,152 | 1,236 |
| H.P. | 9,894 | 38,336 | 56,458 | 60,629 | 63,691 |
| Electric No. | 11,324 | 23,151 | 50,612 | 55,870 | 62,836 |
| H.P. | 102,816 | 170,263 | 293,775 | 307,617 | 324,240 |
| Water No. | 269 | 218 | 186 | 189 | 183 |
| H.P. | 145,431 | 387,387 | 599,851 | 660,897 | 689,208 |
| Totals | 14,394 | 25,625 | 53,141 | 58,510 | 65,523 |
| H.P. | 408,739 | 744,549 | 1,091,406 | 1,166,922 | 1,214,725 |
The figures relating to horse-power represent the indicated horse-power of the engines installed and not the horse-power actually used. The statistics include the horse-power of turbines, pelton wheels, and other engines used in the generation of electric current.
The following table shows the total number of engines and horse-power in use in the principal industries and the totals for all industries for the years 1936–37 and 1916–47.
| Industry. | 1936–37. | 1946–47. | ||
|---|---|---|---|---|
| Number of Engines. | Horsepower. | Number of Engines. | Horsepower. | |
* Not available. | ||||
| Meat freezing and preserving | 2,290 | 44,134 | 4,103 | 56,117 |
| Ham and bacon curing | 155 | 1,475 | 253 | 1,792 |
| Butter, cheese, condensed milk, &c. | 2,486 | 29,628 | 3,891 | 31,039 |
| Grainmilling | 251 | 5,691 | 398 | 6,342 |
| Biscuits and confectionery | 604 | 5,551 | 1,276 | 7,106 |
| Jam-making, fruit and vegetable preserving | 59 | 311 | 660 | 2 227 |
| Miscellaneous foods | 330 | 1,511 | 725 | 2,699 |
| Brewing and malting | 420 | 3,461 | 938 | 5,420 |
| Aerated waters, cordials, and ice-cream | 513 | 2,747 | 912 | 3,453 |
| Tobacco and cigarettes | 123 | 441 | 254 | 641 |
| Soap and candle | 144 | 991 | 356 | 1,781 |
| Boiling down, glue, and manures | 147 | 2,720 | 359 | 2,859 |
| Fellmongering and woolscouring | 114 | 1,290 | 242 | 2,030 |
| Tanning | 260 | 1,975 | 736 | 4,142 |
| Sawmilling, sash and door making | 1,946 | 36,564 | 3,476 | 71,225 |
| Coopering and casemaking | 198 | 2,366 | 299 | 3,055 |
| Woodware and turnery | 796 | 4,374 | 2,167 | 11,270 |
| Furniture and house furnishings | 1,298 | 5,121 | 3,990 | 9,729 |
| Paper bag and box making | 140 | 597 | 571 | 1,447 |
| Gasworks | * | * | 421 | 5,300 |
| Electric supply | 209 | 499,780 | 192 | 812,390 |
| Printing, publishing and bookbinding | 2,629 | 10,178 | 3,582 | 12,962 |
| Lime crushing and burning and cement | 611 | 23,828 | 1,003 | 24,837 |
| Brick, tile, and pottery | 286 | 6,132 | 476 | 6,549 |
| Pumice and concrete products | 157 | 1,259 | 526 | 2,084 |
| Tinned plate and sheet metal | 295 | 1,878 | 1 391 | 4,268 |
| General engineering, iron and brass founding | 1,779 | 12,236 | 6,329 | 24,493 |
| Electrical and radio engineering | 298 | 541 | 1,813 | 3,090 |
| Agricultural and dairying machinery | 225 | 1,540 | 544 | 2,409 |
| Coachbuilding, motor and cycle engineering | 2,441 | 5,800 | 5,648 | 10,918 |
| Saddlery, harness, and leather goods | 89 | 176 | 548 | 425 |
| Ship and boat building | 80 | 896 | 269 | 1,763 |
| Chemical fertilizers | 473 | 6,100 | 878 | 11,415 |
| Paint and varnish | 75 | 529 | 338 | 2,046 |
| Polishes, matches, chemicals, &c. | 354 | 1,781 | 1,278 | 4,682 |
| Footwear | 357 | 1,383 | 1,618 | 3,336 |
| Woollen-mills | 319 | 5,516 | 928 | 7,844 |
| Hosiery and knitted goods | 215 | 480 | 689 | 1,321 |
| Textile and fur clothing | 1,069 | 1,907 | 4,514 | 4,648 |
| All other industries | 1,390 | 15,661 | 6,932 | 43,571 |
| Totals | 25,625 | 744,549 | 65,523 | 1,214,725 |
A deficiency in the statistics arises from the lack of information relating to the actual or estimated period during which the engines or motors were in use. This is an important aspect of considerations affecting the quantitative measurement of the motive power employed.
CONSUMPTION OF COAL.—During the year 1946–47, 1,110,612 tons of New Zealand coal were used in industries covered by the statistics of factory production, a decrease of 56,310 tons from the 1,166,922 tons recorded the previous year. No imported coal was used in either year.
The gas-making industry accounted for 314,702 tons, or 28 per cent., of the total amount of coal used in industries covered by the factory production statistics. A further 42 per cent. was used by four industries—namely, butter, cheese, and condensed-milk making, 166,312 tons; meat freezing and preserving, 132,372 tons; lime-crushing and cement-making, 107,279 tons; and electric-supply, 61,045 tons.
MATERIALS.—The value of materials used or operated upon does not afford a very satisfactory basis of comparison as between one industry and another, for the reason that the changes wrought during the process of manufacture vary considerably in degree. As an instance, the factory constituent in the products of the four food-processing industries heading the tables shown in this section is comparatively small, whereas the aggregate cost of finished woollen fabrics is far in excess of the value of untreated wool.
The cost of materials used in the principal industries and in all industries during the last four years is given in the table hereunder.
| Industry. | 1943–44. | 1944–45. | 1945–46. | 1946–47. |
|---|---|---|---|---|
| £ | £ | £ | £ | |
| Moat freezing and preserving | 23,131,162 | 26,123,928 | 28,745,485 | 31,952,836 |
| Ham and bacon curing | 2,323,626 | 2,483,436 | 2,405,556 | 2,202,663 |
| Butter, cheese, condensed milk, &c. | 25,719,041 | 29,318,838 | 24,745,847 | 27,602,255 |
| Grainmilling | 2,448,717 | 2,283,908 | 2,275,267 | 2,155,957 |
| Biscuits and confectionery | 1,157,591 | 1,824,787 | 1,624,917 | 1,820,703 |
| Jam-making, fruit and vegetable preserving | 967,180 | 1,260,803 | 1,077,064 | 990,740 |
| Miscellaneous foods | 1,105,683 | 1,404,377 | 1,501,009 | 1,295,740 |
| Brewing and malting | 1,507,016 | 1,636,070 | 1,883,311 | 2,156,842 |
| Aerated waters, cordials, and ice-cream | 479,394 | 434,403 | 492,231 | 573,198 |
| Tobacco and cigarettes | 1,731,087 | 1,705,608 | 1,877,820 | 1,880,219 |
| Soap and candle | 645,038 | 585,066 | 649,898 | 734,891 |
| Boiling down, glue, and manures | 510,184 | 527,193 | 538,759 | 607,797 |
| Fellmongering and woolscouring | 3,269,398 | 2,998,011 | 2,925,682 | 3,514,739 |
| Tanning | 1,053,421 | 985,827 | 982,674 | 1,090,350 |
| Sawmilling, sash and door making | 2,782,598 | 2,772,716 | 3,087,843 | 3,543,535 |
| Coopering and casemaking | 499,338 | 556,232 | 411,217 | 385,960 |
| Woodware and turnery | 853,565 | 922,025 | 1,105,747 | 1,299,835 |
| Furniture and house furnishings | 1,424,232 | 1,546,246 | 1,815,123 | 2,412,517 |
| Paper hag and box making | 723,810 | 783,082 | 865,520 | 1,048,114 |
| Gasworks | 638,995 | 709,362 | 746,670 | 768,305 |
| Electric supply | 6,843,442 | 7,191,228 | 7,539,309 | 8,360,289 |
| Printing, publishing, and bookbinding | 1,887,626 | 2,095,334 | 2,372,163 | 2,764,517 |
| Lime crushing and burning and cement | 338,610 | 351,552 | 366,532 | 350,173 |
| Brick, tile, and pottery | 62,026 | 79,784 | 74,940 | 82,091 |
| Pumice and concrete products | 196,412 | 285,544 | 355,364 | 380,144 |
| Tinned plate and sheet metal | 1,746,565 | 1,686,971 | 1,746,139 | 1,933,505 |
| General engineering, iron and brass founding | 3,723,601 | 3,586,323 | 3,576,812 | 3,594,058 |
| Electrical and radio engineering | 990,347 | 1,162,427 | 1,571,589 | 1,965,649 |
| Agricultural and dairying machinery | 614,615 | 1,133,458 | 1,331,831 | 1,051,491 |
| Coachbuilding, motor and cycle engineering | 2,011,587 | 2,470,530 | 3,203,104 | 4,774,267 |
| Saddlery, harness, and leather goods | 508,844 | 534,054 | 559,980 | 741,751 |
| Ship and boat building | 251,530 | 232,560 | 234,424 | 228,121 |
| Chemical fertilizers | 829,855 | 1,107,655 | 1,196,755 | 1,470,814 |
| Paint and varnish | 996,445 | 1,044,330 | 1,210,901 | 1,459,862 |
| Polishes, matches, chemicals, &c. | 1,581,268 | 1,629,926 | 1,763,912 | 1,939,862 |
| Footwear | 2,007,670 | 2,009,661 | 1,859,549 | 2,000,775 |
| Woollen-mills | 1,077,202 | 1,076,100 | 941,007 | 828,590 |
| Hosiery and knitted goods | 1,151,231 | 1,178,652 | 1,259,804 | 1,143,026 |
| Textile and fur clothing | 4,021,285 | 4,425,149 | 4,829,964 | 5,565,822 |
| All other industries | 8,272,695 | 8,551,950 | 7,756,719 | 8,361,719 |
| Totals | 112,883,932 | 122,695,106 | 123,508,438 | 137,033,722 |
In considering the cost of materials used it should be remembered that the semi-primary industries (e.g., meat freezing and preserving, and butter, cheese, condensed milk, &c.), account for a very large proportion of the total. In 1946–47, for example, the two industries mentioned accounted for £59,555,091 out of a total of £137,033,722 for cost of materials used. Constituting as they normally do close on one-half of the total cost of materials used in all industries, the figures for the semi-primary industries influence the total figures for any year. Indeed, a study of the total cost of materials over a number of years shows that frequent and wide oscillations in primary-produce prices are clearly reflected therein. In this connection, too, it should he mentioned that considerable increases in primary producers' costs over recent years have been met by direct and indirect subsidies rather than higher prices. To an extent, then, the costs of materials of these two semi-primary industries are understated, with a consequent effect on the total cost of materials for all factory industries. Also, difficulty has been experienced in determining what actually constitutes materials in the electric-supply industry. For the purpose of factory-production statistics the figure for materials in respect of this industry is deemed to be the total expenditure for the year, less salaries and wages met out of revenue from the sale of energy.
PRODUCTS.—The value of products is based upon the valuation of goods at the factory-door.
In making use of the gross value of products it must be borne in mind that the figures include the value of raw materials operated upon, which value normally constitutes approximately two-thirds of the value of products. Where the products of one industry—for example, sawmilling—are treated again in other industries, such as furniture-making, joinery, &c., part of the value of the timber shown as products of the former industry appears again as the materials of the latter industry and enters into the value of furniture and joinery made. Duplication of this kind is found in many industries.
The following table shows the gross value of products for the principal industries and for all industries as recorded in each of the last four collections.
| Industry. | 1943–44. | 1944–45. | 1945–46. | 1946–47. |
|---|---|---|---|---|
| £ | £ | £ | £ | |
| Meat freezing and preserving | 29,356,630 | 33,741,360 | 36,576,474 | 40,482,865 |
| Ham and bacon curing | 2,810,406 | 2,997,864 | 2,954,781 | 2,715,522 |
| Butter, cheese, condensed milk, &c. | 28,494,686 | 32,451,578 | 27,883,597 | 31,504,082 |
| Grainmilling | 3,058,993 | 2,869,318 | 2,888,389 | 2,804,644 |
| Biscuits and confectionery | 3,569,314 | 3,364,422 | 3,101,009 | 3,390,348 |
| Jam-making, fruit and vegetable preserving | 1,520,241 | 1,877,832 | 1,712,930 | 1,520,439 |
| Miscellaneous foods | 1,619,169 | 2,073,582 | 2,204,633 | 2,019,527 |
| Brewing and malting | 3,006,206 | 3,135,775 | 3,573,829 | 3,948,426 |
| Aerated waters, cordials, and ice-cream | 1,158,340 | 1,073,289 | 1,241,846 | 1,359,241 |
| Tobacco and cigarettes | 2,757,894 | 2,779,893 | 2,853,744 | 2,964,723 |
| Soap and candle | 1,151,041 | 1,081,935 | 1,157,983 | 1,322,960 |
| Boiling down, glue, and manures | 936,745 | 965,153 | 1,036,141 | 1,104,848 |
| Fellmongering and woolscouring | 3,638,104 | 3,337,780 | 3,279,804 | 3,931,917 |
| Tanning | 1,535,822 | 1,529,630 | 1,575,495 | 1,722,143 |
| Sawmilling, sash and door making | 6,935,702 | 6,993,494 | 7,861,716 | 8,815,840 |
| Coopering and casemaking | 793,156 | 866,174 | 639,482 | 587,579 |
| Woodware and turnery | 1,787,442 | 1,877,187 | 2,189,186 | 2,509,753 |
| Furniture and house furnishings | 2,703,473 | 2,997,870 | 3,675,653 | 4,743,415 |
| Paper bag and box making | 1,210,639 | 1,295,829 | 1,420,964 | 1,701,802 |
| Gasworks | 1,860,234 | 1,959,770 | 2,020,263 | 2,053,607 |
| Electric supply | 8,989,297 | 9,255,205 | 9,696,418 | 10,403,077 |
| Printing, publishing, and bookbinding | 5,408,695 | 6,024,421 | 6,857,067 | 7,723,158 |
| Lime crushing and burning and cement | 1,586,355 | 1,542,670 | 1,592,196 | 1,606,734 |
| Brick, tile, and pottery | 656,874 | 746,807 | 869,141 | 997,686 |
| Pumice and concrete products | 486,177 | 645,906 | 799,897 | 890,172 |
| Tinned plate and sheet metal | 2,919,055 | 2,935,700 | 2,986,147 | 3,414,129 |
| General engineering, iron and brass founding | 8,979,996 | 8,801,591 | 8,657,565 | 9,011,637 |
| Electrical and radio engineering | 2,087,847 | 2,427,476 | 3,122,920 | 3,564,787 |
| Agricultural and dairying machinery | 1,345,388 | 2,030,176 | 2,176,302 | 2,049,896 |
| Coachbuilding, motor and cycle engineering | 4,871,704 | 5,774,055 | 7,506,453 | 10,446,330 |
| Saddlery, harness, and leather goods | 981,663 | 1,031,649 | 1,114,093 | 1,386,851 |
| Ship and boat building | 1,258,447 | 1,282,560 | 1,041,263 | 784,252 |
| Chemical fertilizers | 1,553,287 | 1,890,683 | 2,126,824 | 2,582,509 |
| Paint and varnish | 1,385,026 | 1,429,370 | 1,655,582 | 1,966,942 |
| Polishes, matches, chemicals, &c., | 2,773,689 | 2,872,695 | 3,078,794 | 3,449,730 |
| Footwear | 3,528,535 | 3,657,374 | 3,562,309 | 4,018,471 |
| Woollen-mills | 2,840,126 | 2,835,628 | 2,579,171 | 2,389,209 |
| Hosiery and knitted goods | 2,059,102 | 2,075,334 | 2,223,907 | 2,276,273 |
| Textile and fur clothing | 7,867,783 | 8,674,610 | 9,557,265 | 10,894,031 |
| All other industries | 14,203,406 | 14,597,113 | 14,207,381 | 15,546,627 |
| Totals | 175,686,689 | 189,800,764 | 195,258,614 | 216,606,182 |
ADDED VALUE.—As indicated under the heading of “Products,” the value of products is not always a satisfactory measure of either the absolute or the relative importance of a given industry, for the reason that only part of this value is actually created by the manufacturing processes carried on in the industry itself. In many cases by far the larger portion of the value of products represents the value of the materials used. From a manufacturing standpoint, the best measure of the importance of an industry is the value created by the manufacturing operations carried on within the industry. This value is obtained in New Zealand by deducting the cost of materials used from the gross value of the products, and is referred to as the “added value.”
The table given hereunder shows the added value for the principal industries and the totals for all industries for each of the last four years.
| Industry. | 1943–44. | 1944–45. | 1945–46. | 1946–47. |
|---|---|---|---|---|
| £ | £ | £ | £ | |
| Meat freezing and preserving | 6,225,468 | 7,617,432 | 7,830,989 | 8,530,029 |
| Ham and bacon curing | 486,780 | 514,428 | 549,225 | 512,859 |
| Butter, cheese, condensed milk, &c. | 2,775,645 | 3,132,740 | 3,137,750 | 3,901,827 |
| Grainmilling | 610,276 | 585,410 | 613,122 | 648,687 |
| Biscuits and confectionery | 1,611,723 | 1,539,635 | 1,476,092 | 1,569,645 |
| Jam-making, fruit and vegetable preserving | 553,061 | 617,029 | 635,866 | 529,699 |
| Miscellaneous foods | 513,486 | 669,205 | 703,624 | 723,787 |
| Brewing and malting | 1,499,190 | 1,499,705 | 1,690,518 | 1,791,584 |
| Aerated waters, cordials, and ice-cream | 678,946 | 638,886 | 749,615 | 786,043 |
| Tobacco and cigarettes | 1,026,807 | 1,074,285 | 975,924 | 1,084,504 |
| Soap and candle | 506,003 | 496,869 | 508,085 | 588,069 |
| Boiling down, glue, and manures | 426,561 | 437,960 | 497,382 | 497,051 |
| Fellmongering and woolscouring | 368,706 | 339,769 | 354,122 | 417,178 |
| Tanning | 482,401 | 543,803 | 592,821 | 631,793 |
| Sawmilling, sash and door making | 4,153,104 | 4,220,778 | 4,773,873 | 5,272,305 |
| Coopering and casemaking | 293,818 | 309,942 | 228,265 | 201,619 |
| Woodware and turnery | 933,877 | 955,162 | 1,083,439 | 1,209,918 |
| Furniture and house furnishings | 1,279,241 | 1,451,624 | 1,860,530 | 2,330,898 |
| Paper bag and box making | 486,829 | 512,747 | 555,444 | 653,688 |
| Gasworks | 1,221,239 | 1,250,414 | 1,273,593 | 1,285,302 |
| Electric supply | 2,145,855 | 2,063,977 | 2,157,109 | 2,042,788 |
| Printing, publishing, and bookbinding | 3,521,069 | 3,929,087 | 4,484,904 | 4,958,641 |
| Lime crushing and burning and cement | 1,247,745 | 1,191,118 | 1,225,664 | 1,256,561 |
| Brick, tile, and pottery | 594,848 | 667,023 | 794,201 | 915,595 |
| Pumice and concrete products | 289,765 | 360,362 | 444,533 | 510,028 |
| Tinned plate and sheet metal | 1,172,490 | 1,248,729 | 1,240,008 | 1,480,624 |
| General engineering, iron and brass founding | 5,256,395 | 5,215,268 | 5,080,753 | 5,417,579 |
| Electrical and radio engineering | 1,097,500 | 1,265,049 | 1,551,331 | 1,599,138 |
| Agricultural and dairying machinery | 730,773 | 896,718 | 844,471 | 998,405 |
| Coachbuilding, motor and cycle engineering | 2,860,117 | 3,303,525 | 4,303,349 | 5,672,063 |
| Saddlery, harness, and leather goods | 472,819 | 497,595 | 554,113 | 645,100 |
| Ship and boat building | 1,006,917 | 1,050,000 | 806,839 | 556,131 |
| Chemical fertilizers | 723,432 | 783,028 | 930,069 | 1,111,695 |
| Paint and varnish | 388,581 | 385,040 | 444,681 | 507,080 |
| Polishes, matches, chemicals, &c. | 1,192,421 | 1,242,769 | 1,314,882 | 1,509.868 |
| Footwear | 1,520,865 | 1,647,713 | 1,702,760 | 2,017,696 |
| Woollen-mills | 1,762,924 | 1,759,528 | 1,638,164 | 1,560,619 |
| Hosiery and knitted goods | 907,871 | 896,682 | 964,103 | 1,133,247 |
| Textile and fur clothing | 3,846,498 | 4,249,461 | 4,727,301 | 5,328,209 |
| All other Industries | 5,930,711 | 6,045,163 | 6,450,662 | 7,184,908 |
| Totals | 62,802,757 | 67,105,658 | 71,750,176 | 79,572,460 |
The development of factory production in New Zealand from 1918–19 onward is clearly portrayed in the following diagram, which also shows the relationship between, cost of materials, added value, and value of output.
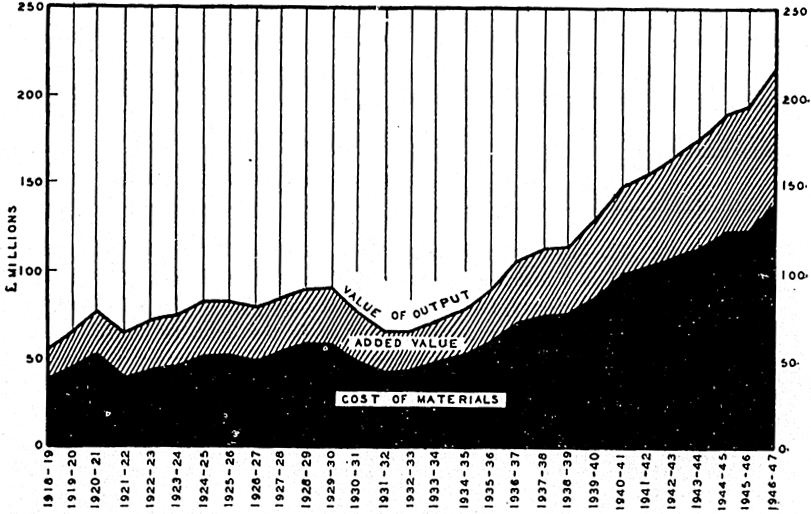
EXPENSES OF OPERATION.—Total operating costs of factory production for the year 1946–47 amounted to £200,616,982, of which salaries and wages accounted for £45,336,217, cost of materials for £137,033,722, and other expenses for £18,247,043, while value of output totalled £216,606,182.
The table below shows the principal items comprised in the figure for expenses of operation, other than salaries and wages and cost of materials, for the last four years.
| Item. | 1943–44. | 1914–45. | 1945–46. | 1946–47. |
|---|---|---|---|---|
| £ | £ | £ | £ | |
| Cost of coal | 1,109,757 | 1,150,888 | 1,169,213 | 1,189,669 |
| Cost of other fuel and power | 1,367,808 | 1,503,965 | 1,526,219 | 1,592,119 |
| Insurance | 1,109,046 | 1,044,416 | 1,095,203 | 1,196,174 |
| Depreciation | 2,538,329 | 2,669,067 | 2,835,467 | 3,531,384 |
| All other expenses | 8,391,295 | 9,113,015 | 9,652,460 | 10,737,697 |
| Totals | 14,516,235 | 15,481,351 | 16,278,562 | 18,247,043 |
The amount paid in insurance premiums by factory industries has doubled since 1938–39. This is mainly attributable to the increase in the amount of wages paid, employers' liability premiums being based on this factor, while the War Damage Act, 1941 (replaced by the Earthquake and War Damage Act, 1944), provided for compulsory insurance against earthquake and war damage (see Section 29D).
The Land and Income Tax Amendment Act, 1945, provided for additional special rates of depreciation on premises and plant acquired, erected, or installed after 1st April, 1945. The effect of this provision and of the higher post-war price level for capital equipment is reflected in the greatly increased figure for depreciation in 1946–47.
CAPITAL INVESTED AND ASSETS.—Information as to the amount of capital invested in manufacturing industries was collected for some years, but the figures obtained were found to be unsatisfactory. The chief factors militating against the collection of reliable information have been the methods of accounting in use in many of the smaller establishments, and the difficulty of apportioning capital where an establishment is only partly manufacturing.
A more satisfactory indication of the capital investment in the manufacturing industry is obtained from figures of manufacturers' fixed and floating assets. Not only are the figures more reliable than those for capital invested, but they do not suffer from the understatement of capital (from the economic viewpoint) which occurs in those cases where the factory premises, or, in some few cases, even the plant, is not owned by the manufacturer, but is rented. In these cases an estimate of the value of the rented asset has been obtained by capitalizing the annual rental shown. Approximations in the figures for fixed assets are also made where one building houses two or more factories carrying on different industries, necessitating an apportionment as between the industries. In most instances, too, fixed assets are stated at their book value, and this may be an overstatement due to insufficient allowance having been made for depreciation, obsolescence, &c., or an understatement owing to-appreciated site-value, excessive allowance for depreciation, or currency depreciation resulting in the assets being understated in terms of their present earning-capacity or replacement cost. It is necessary to bear in mind these limitations to the accuracy of the figures of fixed assets appearing in the following table, which shows the values of the different classes of assets for each of the last eleven years together with an analysis by principal industries for 1946–47.
| Industry. | Fixed Assets. | Floating Assets. | Totals. | ||
|---|---|---|---|---|---|
| Land and Buildings. | Plant, Machinery, and Tools. | Materials, Stocks in Process, Fuel, and Supplies. | Cash, Bills and Accounts receivable, Accounts prepaid, &c. | ||
| Totals— | £ | £ | £ | £ | £ |
| 1936–37 | 24,445,338 | 45,151,927 | 13,121,800 | 13,684,930 | 96,403,995 |
| 1937–38 | 25,573,741 | 47,164,981 | 15,214,115 | 14,517,360 | 102,470,197 |
| 1938–39 | 27,201,642 | 49,296,160 | 15,220,564 | 15,180,004 | 106,898,370 |
| 1939–40 | 28,544,177 | 52,029,298 | 17,615,554 | 17,194,699 | 115,383,728 |
| 1940–41 | 29,229,719 | 54,525,418 | 22,360,740 | 18,013,764 | 124,129,641 |
| 1941–42 | 30,199,298 | 56,928,634 | 24,598,904 | 20,719,840 | 132,446,676 |
| 1942–43 | 30,892,668 | 57,361,104 | 26,041,036 | 24,152,243 | 138,447,051 |
| 1943–44 | 31,733,704 | 59,006,653 | 29,543,244 | 27,952,448 | 148,236,049 |
| 1941–45 | 33,932,727 | 63,058,552 | 30,805,775 | 29,461,541 | 157,258,595 |
| 1945–46 | 35,921,260 | 67,969,258 | 32,557,087 | 31,587,448 | 168,035,053 |
| 1946–47— | |||||
| Meat freezing and preserving | 4,240,061 | 1,995,438 | 2,442,308 | 3,930,593 | 12,608,400 |
| Ham and bacon curing | 336,244 | 135,792 | 311,544 | 185,445 | 969,025 |
| Butter, cheese, condensed milk, &c. | 1,876,795 | 1,651,140 | 913,089 | 2,905,272 | 7,346,296 |
| Grainmilling | 458,778 | 236,860 | 616,549 | 593,454 | 1,905,641 |
| Biscuits and confectionery | 647,789 | 367,439 | 1,074,937 | 501,745 | 2,591,910 |
| Jam-making, fruit and vegetable preserving | 492,607 | 230,813 | 277,973 | 119,807 | 1,121,200 |
| Miscellaneous foods | 368,396 | 255,397 | 516,759 | 404,849 | 1,545,401 |
| Brewing and malting | 746,470 | 682,249 | 710,363 | 1,167,856 | 3,306,938 |
| Aerated waters, cordials, and ice-cream | 510,615 | 410,582 | 235,543 | 418,176 | 1,574,916 |
| Tobacco and cigarettes | 245,169 | 70,535 | 1,619,459 | 234,158 | 2,169,321 |
| Soap and candle | 220,357 | 141,379 | 383,491 | 419,162 | 1,164,389 |
| Boiling down, glue, and manures | 220,538 | 216,817 | 281,173 | 166,147 | 884,675 |
| Fellmongering and woolscouring | 112,921 | 79,486 | 113,281 | 173,759 | 479,447 |
| Tanning | 220,120 | 133,230 | 477,879 | 234,068 | 1,065,297 |
| Sawmilling, sash and doormaking | 1,045,702 | 1,907,763 | 811,954 | 1,698,500 | 5,463,919 |
| Coopering and casemaking | 126,298 | 87,623 | 90,650 | 99,589 | 404,160 |
| Woodware and turnery | 532,568 | 397,251 | 411,026 | 495,697 | 1,836,542 |
| Furniture and house furnishings | 1,137,350 | 388,501 | 1,050,998 | 741,544 | 3,318,393 |
| Paper bag and box making | 250,571 | 186,980 | 248,989 | 195,508 | 882,048 |
| Gasworks | 517,265 | 3,570,251 | 172,102 | 439,710 | 4,699,328 |
| Electric supply | 2,362,814 | 50,484,431 | 3,009,427 | 3,427,296 | 59,283,968 |
| Printing, publishing, and book-binding | 2,254,311 | 1,376,256 | 1,843,708 | 1,586,216 | 7,060,491 |
| Lime crushing and burning and cement | 450,063 | 639,019 | 406,894 | 372,582 | 1,868,558 |
| Brick, tile, and pottery | 511,165 | 331,996 | 142,877 | 240,568 | 1,226,606 |
| Pumice and concrete products | 223,929 | 180,591 | 144,958 | 207,490 | 756,968 |
| Tinned plate and sheet metal | 561,239 | 364,846 | 975,977 | 456,290 | 2,358,352 |
| General engineering, iron and brass founding | 2,048,407 | 1,311,838 | 2,015,039 | 1,907,301 | 7,282,585 |
| Electrical and radio engineering | 723,973 | 280,078 | 1,269,007 | 708,241 | 2,981,299 |
| Agricultural and dairying machinery | 314,147 | 135,062 | 828,313 | 624,579 | 1,902,101 |
| Coachbuilding, motor and cycle engineering | 4,160,310 | 1,205,706 | 2,198,324 | 2,951,476 | 10,515,816 |
| Saddlery, harness, and leather goods | 306,171 | 68,175 | 312,469 | 221,995 | 908,810 |
| Ship and boat building | 122,018 | 57,694 | 169,228 | 80,407 | 429,347 |
| Chemical fertilizers | 563,093 | 548,047 | 652,500 | 479,067 | 2,242,707 |
| Paint and varnish | 318,284 | 133,814 | 688,968 | 209,733 | 1,350,799 |
| Polishes, matches, chemicals, &c. | 858,409 | 362,894 | 1,410,103 | 773,689 | 3,405,095 |
| Footwear | 603,823 | 339,447 | 831,919 | 497,104 | 2,272,293 |
| Woollen-mills | 483,201 | 505,276 | 1,218,865 | 306,677 | 2,514,019 |
| Hosiery and knitted goods | 402,078 | 297,852 | 700,746 | 401,481 | 1,868,157 |
| Textile and fur clothing | 2,553,784 | 679,491 | 2,786,921 | 1,571,001 | 7,591,197 |
| All other industries | 3,932,931 | 3,011,222 | 3,654,191 | 2,904,577 | 13,502,921 |
| Totals, 1946–47 | 38,060,764 | 75,459,261 | 38,080,501 | 35,052,809 | 186,659,335 |
The table includes all items normally found in the assets of a manufacturing concern. Consequently, in considering the figures in the last column as depicting the total capital investment in manufacturing industry it must be remembered that not only proprietors' and shareholders' capital, so called, is represented, but also reserved profits, and, in addition, loans and advances and creditors' current accounts.
Over the ten years from 1936–37 to 1946–47 the total investment in fixed assets has increased from £69,597,265 by 63 per cent., and in current assets from £26,806,730 by 173 per cent. This disproportionate growth may be attributed partly to (1) the deferring of building and plant extensions during the war and post-war period due to shortages of materials, equipment, and man-power; and (2) the depreciation in the value of money referred to earlier : current assets are naturally expressed in terms of the present currency, but it is probable that fixed assets are considerably understated in terms of their present replacement cost, being still valued in terms of the currency at the time of purchase or erection.
The classification indicating the amount of capital investment in the various classes of industry is of interest. Since electric-supply undertakings and gasworks require heavy expenditure on construction work, plant, machinery, reticulation, &c., it is not surprising that the combined value of fixed assets for these two industries is such a largo proportion of the whole, being actually 50 per cent. of the total recorded for all industries in 1946–47. Yet, for the same year, these industries contributed only 5.8 per cent. of the total value of output recorded.
ORGANIZATION OF INDUSTRY.—New Zealand'S industrial progress has been fairly rapid, but industry is as yet organized on a relatively small scale.
The law in New Zealand restricts the membership of a partnership to not more than 20 persons, a private company to not fewer than 2 or more than 25 persons, and a public company to not fewer than 7 persons. Co-operation is characteristic of certain industries engaged in the processing of primary products, mainly butter and cheese manufacturing. Municipal enterprises are confined mainly to public-utility industries—e.g., gasworks and the generation and distribution of electricity—while the State operates the chief central hydro-electric generating stations, and the Government Printing Office.
Information as to the character of organization of the establishments engaged in factory production during 1946–47 is given in the following table.
| Character of Organization. | Number of Establishments. | Persons engaged. | Horsepower available. | Cost of Materials used or operated upon. | Value of Manufactures or Products. | Added Value. | |
|---|---|---|---|---|---|---|---|
| Total. | Per Establishment. | ||||||
| H.P. | £ | £ | £ | £ | |||
| Individual | 2,104 | 10,179 | 20,836 | 4,584,826 | 9,128,977 | 4,544,151 | 2,160 |
| Private firm or partnership | 911 | 5,573 | 12,926 | 2,119,237 | 4,659,554 | 2,540,317 | 2,788 |
| Public registered company | 779 | 38,247 | 161,235 | 39,140,331 | 65,253,739 | 26,113,408 | 33,522 |
| Private registered company | 3,219 | 69,008 | 173,602 | 53,502,119 | 92,507,773 | 39,005,654 | 12,117 |
| Co-operative and miscellaneous | 420 | 4,680 | 32,428 | 28,438,286 | 32,583,133 | 4,144,847 | 9,869 |
| Municipal and Government | 209 | 6,748 | 813,698 | 9,248,923 | 12,473,006 | 3,224,083 | 15,426 |
| Totals | 7,642 | 134,435 | 1,214,725 | 137,033,722 | 216,606,182 | 79,572,460 | 10,413 |
As would be expected, the average size of establishments operated by public registered companies is larger than in any other type of industrial organization, the added value per unit being almost three times as high as that for the next highest non-governmental type (private registered companies). Private companies, however, hold a very high place, both numerically and in the share they contribute to the total added value created in New Zealand factories (49 per cent. in 1946–47, as compared with 33 per cent. in the case of public companies). Municipal and general governmental enterprises accounted for 4 per cent. of the total added value in 1946–47.
Examination of the statistics of added value over a series of years indicates that private companies have increased appreciably in relative importance, while the individual and partnership types of organization have declined, and very little change has occurred in the percentage of total added value attributable to the operations of public companies, or municipal and general governmental undertakings.
CLASSIFICATION OF INDUSTRIES.—In the tables which follow, a classification of industries, according to the nature of the work carried on, is presented. Four classes are distinguished:—
Group I comprises those industries in close association with and dependent on pastoral farm production, being engaged in the processing of pastoral products for the market. The raw material undergoes only slight changes in the factory or works, and consequently the added value is small in relation to the cost of materials. The specific industries falling within this category are meat freezing and preserving; ham and bacon curing; butter, cheese, condensed milk, &c., making; sausage-casing making; fellmongering and woolscouring; and boiling down and manure making.
Group II includes those industries which provide public utility services under monopoly conditions so far as competition within the industry are concerned; they are gasworks and electricity generation and supply.
Group III consists generally of those industries classed as extractive, being concerned with the utilization of natural resources. The added value in these industries is large in proportion to the value of output, and represents principally wages. The following industries come within this group: fishcuring; sawmilling; lime crushing and burning and cement-making; brick, tile, and pottery making; pumice-insulation making; and phormium-flax milling. The processing of the agricultural product, linen flax, is also included in this group.
Group IV comprises all industries for which statistics are available and Which do not come under the previous groups. It includes several industries, such as grain-milling, &c., which may be considered to be on the borderlines of Group I or Group III, and also several industries, such as motor and cycle engineering and repairing, &c., where repair work rather than manufacture in the narrow sense of the term predominates. In the industries in this group the raw material is, generally speaking, subjected to detailed and elaborate processing, and the “added value” is therefore relatively high.
An important purpose served by this classification of industries is the analysis of all factory production in New Zealand to permit of its segregation into the three functional production classes. These three classes are—
“Primary” production, which consists of the production of the farm or extraction from mine, quarry, forest, &c., of raw material and its preliminary processing for the market. The product may be either food in consumable form (e.g., meat and fish) or merely the raw material for further processing. Of the groups distinguished above, I and III fall into this class and would be considered with statistics for farming and mining in assessing primary production in New Zealand.
“Secondary” production comprises the more complete processing or trans-formation in factory or workshop of raw material derived from primary production into the final form required by the consumer (e.g., clothing or prepared foodstuffs) or producer (e.g., machinery). The industries in Group IV come into this class and may be said to cover practically all secondary production in New Zealand, with the exception of building construction.
“Tertiary” production is the term given to the value produced by the transport, communication, wholesale and retail trade and other service industries. Group II industries, which fall into this class, measure a small part of production in this field.
It will be noted that the terms “primary,” “secondary,” and “tertiary” are indicative of function and not of economic importance; in fact, the more developed, is the economy the higher are the proportions of workers engaged, and of value produced, in the “secondary” and “tertiary” production fields relative to the “primary.”
The following table shows the principal statistics for the various groups for the years 1945–46 and 1946–47.
| Group. | Persons engaged. | Salaries and Wages paid. | Materials used. | Other Expenses of Operation. | Products. | Added Value. | Land, Buildings, Plant, and. Machinery. |
|---|---|---|---|---|---|---|---|
| £ | £ | £ | £ | £ | £ | ||
| 1945–46 | |||||||
| I | 17,036 | 7,137,550 | 59,673,454 | 3,789,600 | 72,180,422 | 12,506,968 | 20,177,747 |
| II | 6,012 | 2,317,551 | 8,285,979 | 402,090 | 11,716,681 | 3,430,702 | 58,379,709 |
| III | 11,746 | 4,191,441 | 3,909,470 | 2,328,670 | 11,198,761 | 7,289,291 | 8,787,663 |
| IV | 93,414 | 27,852,571 | 51,639,535 | 9,758,202 | 100,162,750 | 48,523,215 | 80,689,934 |
| Totals | 128,208 | 41,499,113 | 123,508,438 | 16,278,562 | 195,258,614 | 71,750,176 | 168,035,053 |
| 1946–47 | |||||||
| I | 17,291 | 7,428,181 | 66,201,193 | 4,495,275 | 80,203,071 | 14,001,878 | 22,429,534 |
| II | 6,199 | 2,469,710 | 9,128,594 | 403,246 | 12,456,684 | 3,328,090 | 63,983,296 |
| III | 11,533 | 4,384,540 | 4,336,863 | 2,419,064 | 12,109,873 | 7,773,010 | 9,357,926 |
| IV | 99,412 | 31,053,786 | 57,367,072 | 10,929,458 | 111,836,554 | 54,469,482 | 90,888,579 |
| Totals | 134,435 | 45,336,217 | 137,033,722 | 18,247,043 | 216,606,182 | 79,572,460 | 186,659,335 |
Comparisons of Group IV factory industries—for, the years 1945–46 and 1946–47 reveal that persons engaged in 1946–47 increased by 5,998, or by 6.4 per cent., and salaries and wages paid advanced by £3,201,215, or by 11.5 per cent., while materials, used rose by 11.1 per cent., value of products by 11.7 per cent., “added value” by 12.3 per cent., and value of land, buildings, plant, and machinery by 12.6 per cent. Other expenses recorded an advance of 12 per cent.
The next table shows the principal statistics of factories coming within Group IV—classified according to the value of output.
| Factories with Value of Output as under. | Number of Persons engaged. | Value of Products. | Output per Person engaged. | |||||||
|---|---|---|---|---|---|---|---|---|---|---|
| 1936–37. | 1946–47. | 1936–37. | 1946–47. | 1936–37. | 1946–47. | |||||
| Number. | Per. Cent. of Total. | Number. | Per Cent. of Total. | £ | Per Cent. of Total. | £ | Per Cent. of Total. | £ | £ | |
| £ | ||||||||||
| Under 500 | 603 | 0.91 | 162 | 0.16 | 143,899 | 0.34 | 14.233 | 0.04 | 239 | 273 |
| 500– 999 | 1,414 | 2.13 | 706 | 0.71 | 467,028 | 1.12 | 302,766 | 0.27 | 330 | 429 |
| 1,000– 2,499 | 4,800 | 7.23 | 3,463 | 3.48 | 1,901,856 | 4.56 | 2,073,912 | 1.85 | 396 | 599 |
| 2,500– 4,999 | 6,167 | 9.28 | 6,887 | 6.93 | 2,644,979 | 6.34 | 4,717,858 | 4.22 | 429 | 685 |
| 5,000– 9,999 | 6,975 | 10.50 | 10,288 | 10.35 | 3,417,164 | 8.18 | 8,336,870 | 7.45 | 490 | 810 |
| 10,000–14,999 | 5,793 | 8.72 | 6,748 | 6.79 | 2,899,641 | 6.95 | 6,068,686 | 5.43 | 501 | 899 |
| 15,000–19,999 | 3,486 | 5.25 | 5,867 | 5.90 | 1,974,955 | 4.73 | 5,469,372 | 4.89 | 567 | 932 |
| 20,000–49,999 | 12,908 | 19.43 | 21,762 | 21.89 | 7,827,666 | 18.75 | 22,077,971 | 19.74 | 606 | 1,015 |
| 50,000–99,999 | 8,837 | 13.31 | 15,251 | 15.34 | 6,005,403 | 14.38 | 18,819,888 | 16.83 | 680 | 1,234 |
| 100,000 and over | 15,436 | 23.24 | 28,278 | 28.45 | 14,467,859 | 34.65 | 43,924,998 | 39.28 | 937 | 1, 553 |
| Totals, Group IV | 66,419 | 100.00 | 99,412 | 100.00 | 41,750,450 | 100.00 | 111,836,554 | 100.00 | 629 | 1,125 |
The position of the larger scale establishment'S in this group of industries is striking in respect of both value of products and output per person engaged.
More detailed statistics, of the foregoing groups are contained in the annual Statistical Report on Factory Production.
VOLUME OF FACTORY PRODUCTION.—In connection with' the preparation, of the series of index-numbers of volume of production, as given in a later section of this Year-Book, a special series covering volume of production of the factory industries has been constructed; Index-numbers have been computed from 1928–29 onwards for the factory industries as a whole, and also for each of the four groups into which these industries, are divided under the immediately preceding heading. A description of the method adopted in computing these index-numbers of volume of factory production is given in the Statistical Report on Factory Production, 1944–45 1945–46 issue.
(Base: 1938–39 = 100)
| Production Year. | Group I. | Group II. | Group III. | Group IV. | All Groups. | |||||
|---|---|---|---|---|---|---|---|---|---|---|
| Total. | Per Person engaged. | Total. | Per Person engaged. | Total. | Per Person engaged. | Total. | Per Person engaged. | Total. | Per Person engaged. | |
| 1928–29 | 72 | 78 | 67 | 90 | 92 | 98 | 66 | 90 | 71 | 90 |
| 1929–30 | 75 | 81 | 73 | 97 | 95 | 98 | 70 | 91 | 74 | 92 |
| 1930–31 | 78 | 87 | 76 | 95 | 77 | 91 | 64 | 38 | 69 | 90 |
| 1931–32 | 82 | 98 | 74 | 93 | 49 | 87 | 55 | 85 | 60 | 90 |
| 1932–33 | 92 | 106 | 74 | 95 | 46 | 83 | 57 | 88 | 63 | 94 |
| 1933–34 | 93 | 94 | 74 | 92 | 54 | 87 | 59 | 89 | 65 | 92 |
| 1934–35 | 96 | 101 | 77 | 94 | 64 | 87 | 69 | 93 | 74 | 95 |
| 1935–36 | 98 | 99 | 82 | 97 | 79 | 92 | 76 | 93 | 81 | 96 |
| 1936–37 | 103 | 102 | 87 | 97 | 88 | 89 | 91 | 98 | 92 | 98 |
| 1937–38 | 101 | 100 | 93 | 99 | 94 | 91 | 96 | 97 | 97 | 97 |
| 1938–39 | 100 | 100 | 100 | 100 | 100 | 100 | 100 | 100 | 100 | 100 |
| 1939–40 | 110 | 107 | 110 | 106 | 103 | 97 | 111 | 104 | 110 | 103 |
| 1940–41 | 120 | 106 | 119 | 115 | 104 | 99 | 114 | 102 | 114 | 103 |
| 1941–42 | 122 | 102 | 124 | 125 | 103 | 96 | 116 | 100 | 116 | 102 |
| 1942–43 | 124 | 104 | 130 | 137 | 111 | 103 | 120 | 106 | 120 | 107 |
| 1943–44 | 118 | 99 | 138 | 145 | 118 | 103 | 126 | 109 | 125 | 108 |
| 1944–45 | 127 | 103 | 143 | 145 | 114 | 102 | 130 | 107 | 129 | 108 |
| 1945–46 | 124 | 98 | 147 | 139 | 112 | 101 | 134 | 105 | 131 | 105 |
| 1946–47 | 128 | 99 | 154 | 141 | 113 | 104 | 146 | 107 | 140 | 106 |
The falling-off of factory production during the depression period and the subsequent recovery and expansion are illustrated in the accompanying diagram. The diagram is divided into two parts, the first referring to those industries coming within Group IV, as described under the previous heading, and the second to all factory industries. In addition to volume of production, added value is also shown, the index numbers employed being on the same base (1938–39 = 100).
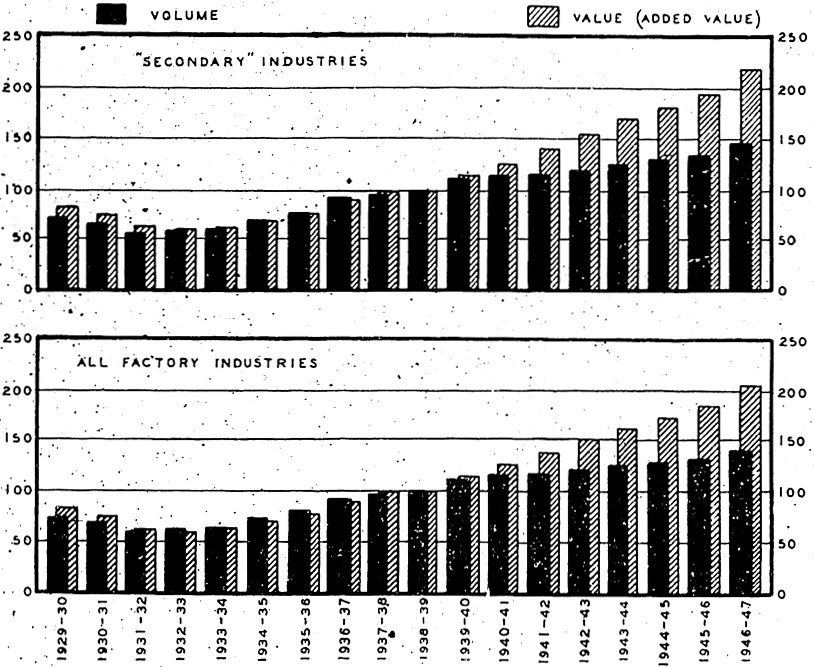
OVERTIME. AND SHORT TIME.—The amount of overtime worked or short time recorded by industries gives a useful indication as to whether an industry has been busy or slack. Statistics of these two phases of factory production have been collected for a number of years, and the tables presented hereunder throw some interesting light on one aspect of industrial production during the last five years.
Overtime for the purpose of this collection is defined as all time worked in excess of the normal daily or weekly hours as prescribed under Arbitration Court awards, which now uniformly prescribe an eight-hour day and forty-hour week for all factory industries. The instructions expressly exclude from overtime all time worked within an employee'S forty hours but paid for at special rates, instances being shift and week-end work. Nevertheless, it is possible that persons filling in returns may have counted some such time as overtime, but the error on this account should not be appreciable. For statistical purposes short time is deemed to be time lost through machinery, tools, &c., being out of order, lack of materials, adverse market conditions, and other related causes. Time lost through holidays (annual, ordinary, or public holidays), sickness, and absenteeism is not counted as short time. Information as to how much short time is attributable to each cause is not available.
The following table summarizes overtime worked and short time recorded in factories in respect of wage-earning employees during the last five years.
| Year. | Overtime. | Short Time. | ||||
|---|---|---|---|---|---|---|
| Males. | Females, | Totals. | Males. | Females. | Totals. | |
| Hours. | Hours. | Hours. | Hours. | Hours. | Hours. | |
| 1942–43 | 12,086,294 | 2,360,439 | 14,446,733 | 579,927 | 58,357 | 638,284 |
| 1943–44 | 14,340,153 | 2,751,538 | 17,091,691 | 604,317 | 37,531 | 641,848 |
| 1944–45 | 14,339,482 | 2,659,612 | 16,999,094 | 482,057 | 3,638 | 485,695 |
| 1945–46 | 12,028,309 | 1,868,342 | 13,896,651 | 280,182 | 9,631 | 289,813 |
| 1946–47 | 12,250,929 | 1,394,972 | 13,645,901 | 278,424 | 5,374 | 283,798 |
Almost 58 per cent. of the total overtime worked in 1946–47 was contributed by ten industries—viz., meat freezing and preserving (2,429,714 hours); sawmilling (944,061 hours); general engineering, iron and brass founding (905,480 hours); electric supply (746,850 hours); coachbuilding, motor and cycle engineering (670,579 hours); printing and publishing (512,325 hours); butter, cheese, &c., manufacture (481,215 hours); clothing (473,047 hours); tinplate and sheet-metal (356,624 hours); and brewing and malting (340,878 hours).
The meat freezing and preserving industry recorded the highest amount of short time (208,931 hours), followed by the sawmilling industry (43,400 hours). Marked seasonal fluctuations occur in the meat-freezing, &c., industry, while the sawmilling industry is affected by adverse weather conditions.
The following table gives for each of the last five years the average number of hours of overtime and short time recorded for wage-earning employees. In computing these averages no cognizance has been taken of the fact that in many cases no overtime was worked or short time recorded.
| Year. | Overtime. | Short Time. | ||
|---|---|---|---|---|
| Males. | Females. | Males. | Females. | |
| Hours. | Hours. | Hours. | Hours. | |
| 1942–43 | 172 | 77 | 8 | 2 |
| 1943–44 | 199 | 90 | 8 | 1 |
| 1944–45 | 188 | 87 | 6 | |
| 1945–46 | 141 | 68 | 3 | |
| 1946–47 | 137 | 51 | 3 | |
The average of 137 hours overtime for the year 1946–47 for each male wage-earner represents an average weekly figure of 2¾ hours. In certain industries the corresponding figure was considerably higher, being over 8½ hours for fruit and vegetable canning and almost 7 hours for cigarette and tobacco manufacturing.
The position in regard to overtime worked and short time recorded is further illustrated by the accompanying diagram, the period covered being 1929–30 to 1946–47.
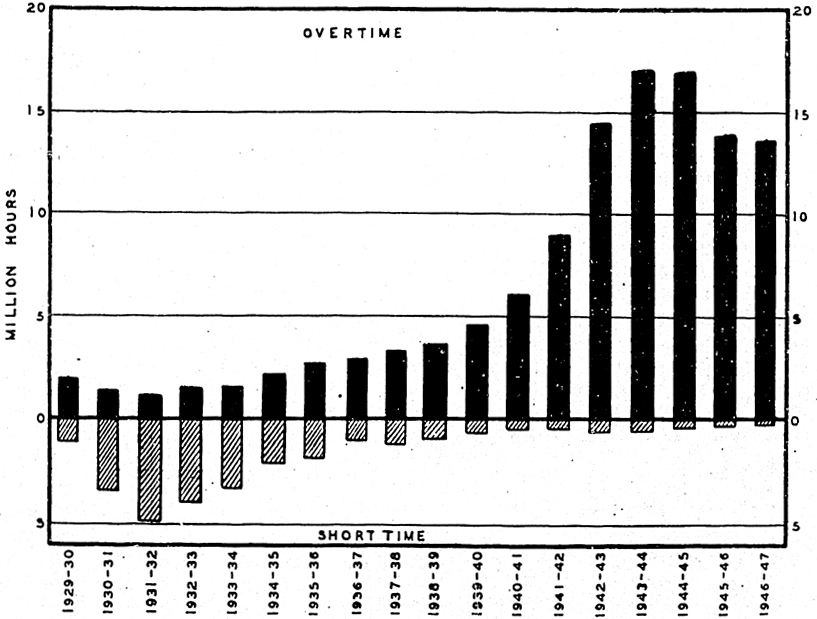
SUMMARY OF OPERATIONS.—The following table contains an analysis of production costs in 1946–47, together with the value of products for each of the principal industries and for all industries.
| Industry. | Production Costs. | Value of Products. | Surplus prior to providing for Taxation.* | |||
|---|---|---|---|---|---|---|
| Salaries and Wages. | Cost of All Materials used. | Other Expenses of Operation. | Total. | |||
* Excess of value of products over production costs. | ||||||
| £(000) | £(000) | £(000) | £(000) | £(000) | £(000) | |
| Meat freezing and preserving | 5,033 | 31,953 | 1,989 | 38,975 | 40,483 | 1,508 |
| Ham and bacon curing | 268 | 2,203 | 136 | 2,607 | 2,715 | 108 |
| Butter, cheese, condensed milk, &c. | 1,620 | 27,602 | 2,091 | 31,313 | 31,504 | 191 |
| Grainmilling | 271 | 2,156 | 184 | 2,611 | 2,805 | 194 |
| Biscuits and confectionery | 742 | 1,821 | 309 | 2,872 | 3,390 | 518 |
| Jam-making, fruit and vegetable preserving | 273 | 991 | 127 | 1,391 | 1,520 | 129 |
| Miscellaneous foods | 332 | 1,296 | 140 | 1,768 | 2,019 | 251 |
| Brewing and malting | 710 | 2,157 | 544 | 3,411 | 3,948 | 537 |
| Aerated waters, cordials, and ice-cream | 297 | 573 | 213 | 1,083 | 1,359 | 276 |
| Tobacco and cigarettes | 312 | 1,880 | 174 | 2,366 | 2,965 | 599 |
| Soap and candle | 220 | 735 | 122 | 1,077 | 1,323 | 246 |
| Boiling down, glue and manures | 208 | 608 | 156 | 972 | 1,105 | 133 |
| Fellmongering and woolscouring | 212 | 3,515 | 96 | 3,823 | 3,932 | 109 |
| Tanning | 377 | 1,090 | 129 | 1,596 | 1,722 | 126 |
| Sawmilling, sash and door making | 3,121 | 3,543 | 1,430 | 8,094 | 8,816 | 722 |
| Coopering and casemaking | 139 | 386 | 45 | 570 | 588 | 18 |
| Woodware and turnery | 771 | 1,300 | 233 | 2,304 | 2,510 | 206 |
| Furniture and house furnishings | 1,613 | 2,412 | 346 | 4,371 | 4,743 | 372 |
| Paper bag and box making | 309 | 1,048 | 111 | 1,468 | 1,702 | 234 |
| Gasworks | 701 | 768 | 403 | 1,872 | 2,054 | 182 |
| Electric supply | 1,769 | 8,360 | 10,129 | 10,403 | 274 | |
| Printing, publishing, and book-binding | 2,647 | 2,764 | 1,013 | 6,424 | 7,723 | 1,299 |
| Lime crushing and burning and cement | 529 | 350 | 553 | 1,432 | 1,607 | 175 |
| Brick, tile, and pottery | 496 | 82 | 312 | 890 | 998 | 108 |
| Pumice and concrete products | 330 | 380 | 101 | 811 | 890 | 79 |
| Tinned plate and sheet metal | 940 | 1,934 | 270 | 3,144 | 3,414 | 270 |
| General engineering, iron and brass founding | 3,143 | 3,594 | 1,075 | 8,112 | 9,012 | 900 |
| Electrical and radio engineering | 953 | 1,966 | 326 | 3,245 | 3,565 | 320 |
| Agricultural and dairying machinery | 495 | 1,051 | 114 | 1,660 | 2,050 | 390 |
| Coachbuilding, motor and cycle engineering | 3,682 | 4,774 | 1,154 | 9,610 | 10,446 | 836 |
| Saddlery, harness, and leather goods | 422 | 742 | 78 | 1,242 | 1,387 | 145 |
| Ship and boat building | 431 | 228 | 93 | 752 | 784 | 32 |
| Chemical fertilizers | 465 | 1,471 | 320 | 2,256 | 2,583 | 327 |
| Paint and varnish | 189 | 1,460 | 149 | 1,798 | 1,967 | 169 |
| Polishes, matches, chemicals, &c. | 623 | 1,940 | 289 | 2,852 | 3,450 | 598 |
| Footwear | 1,478 | 2,001 | 334 | 3,813 | 4,018 | 205 |
| Woollen-mills | 891 | 829 | 370 | 2,090 | 2,389 | 299 |
| Hosiery and knitted goods | 599 | 1,143 | 221 | 1,963 | 2,276 | 313 |
| Textile and fur clothing | 3,674 | 5,566 | 753 | 9,993 | 10,894 | 901 |
| All other industries | 3,751 | 8,362 | 1,744 | 13,857 | 15,547 | 1,690 |
| Totals | 45,336 | 137,034 | 18,247 | 200,617 | 216,606 | 15,989 |
No valid conclusions as to the return on capital invested in different industries can be drawn from the “surplus” figures, recorded in the above table in relation to the capital investment figures shown on page 374. Income-tax and social security taxes, levied on both companies and individuals, are not included in the expenses recorded above; nor, of course, are dividends on shares of incorporated companies. In some cases, however, more particularly in those industries included in the “heat, light, and power” group, where a majority of the undertakings are operated by the State or by local authorities, the capital charges, being interest and amortization charges on loans, are already included in the expenses recorded. Similarly, charges in respect of rented assets, included in the capital investment figures, are already included as rent under the heading of “Other Expenses.”
DETAILS OF CERTAIN PRINCIPAL INDUSTRIES.—The principal statistics regarding leading factory industries for the last three years available are set out in the following pages. Fuller details are given in the annual Statistical Report on Factory Production.
| — | 1944–45. | 1945–46. | 1946–47. |
|---|---|---|---|
* Includes boned mutton, 97,790 cwt. valued at £222,964. | |||
| Meat Freezing and Preserving | |||
| Number of— | |||
| Works. | 42 | 45 | 51 |
| Persons engaged | 10,506 | 10,997 | 11,268 |
| Salaries and wages paid £ | 4,300,437 | 4,865,440 | 5,033,376 |
| Cost of materials used £ | 26,123,928 | 28,745,485 | 31,952,836 |
| Other expenses £ | 1,797,920 | 1,850,503 | 1,988,819 |
| Mutton carcases No. | 2,925,472 | 3,588,931 | 3,072,081 |
| £ | 2,963,007 | 3,417,227 | 3,375,469 |
| Lamb carcases No. | 10,777,738 | 12,122,677 | 11,453,533 |
| £ | 12,520,179 | 14,477,552 | 15,066,559 |
| Mutton and lamb pieces Cwt. | 93,531 | 52,792 | 113,433* |
| £ | 202,728 | 107,645 | 241,946* |
| Quarter beef (bone-in weights) Cwt. | 1,546,758 | 1,099,474 | 1,423,989 |
| £ | 3,366,932 | 2,524,278 | 3,530,626 |
| Boner beef (boned-out weights) Cwt. | 389,727 | 460,950 | 458,385 |
| £ | 742,505 | 928,908 | 960,089 |
| Bobby veal (boned-out weights) Cwt. | 139,551 | 145,419 | 151,776 |
| £ | 308,534 | 333,176 | 338,340 |
| Other veal (bone-in weights) Cwt. | 21,860 | 41,600 | 28,005 |
| £ | 44,023 | 79,504 | 55,196 |
| Pork Cwt. | 476,481 | 376,049 | 377,928 |
| £ | 1,952,917 | 1,673,824 | 1,807,470 |
| Edible offals Cwt. | 295,362 | 331,010 | 353,440 |
| £ | 973,397 | 1,107,319 | 1,231,818 |
| Canned and dehydrated meats Cwt. | 261,794 | 231,399 | 184,395 |
| £ | 1,580,913 | 1,460,390 | 1,565,398 |
| Wool lb. | 45,472,738 | 47,173,266 | 46,288,563 |
| £ | 3,404,354 | 3,552,685 | 4,367,940 |
| Tallow Cwt. | 755,831 | 673,592 | 751,131 |
| £ | 804,985 | 705,629 | 1,096,654 |
| Meat-meal Cwt. | 286,644 | 313,147 | 269,976 |
| £ | 156,897 | 204,416 | 155,650 |
| Manures Cwt. | 546,011 | 641,416 | 701,598 |
| £ | 218,494 | 260,198 | 278,240 |
| Hides— | |||
| Ox and cow No. | 441,945 | 453,956 | 503,058 |
| £ | 625,015 | 673,054 | 829,983 |
| Bobby calf No. | 918,255 | 905,703 | 1,004,278 |
| £ | 437,153 | 534,141 | 764,763 |
| Other calf No. | 14,089 | 29,025 | 18,608 |
| £ | 10,361 | 23,146 | 18,685 |
| Pelts No. | 14,751,543 | 16,774,496 | 14,825,986 |
| £ | 1,998,994 | 2,532,696 | 2,209,709 |
| Rabbit carcases and skins £ | 169,327 | 445,901 | 318,600 |
| Runners and casings £ | 903,159 | 1,156,779 | 1,327,519 |
| Total value of output £ | 33,741,360 | 36,576,474 | 40,482,865 |
| Ham and Bacon Curing | |||
| Number of— | |||
| Works | 45 | 44 | 44 |
| Persons engaged | 760 | 741 | 669 |
| Salaries and wages paid £ | 277,976 | 296,029 | 268,175 |
| Pigs dealt with— | |||
| Carcases No. | 500,432 | 456,239 | 375,130 |
| Cost £ | 2,297,360 | 2,218,994 | 2,019,425 |
| Cost of other materials used £ | 146,371 | 153,778 | 158,666 |
| Other expenses £ | 140,219 | 139,728 | 136,279 |
| Ham and bacon Cwt. | 434,546 | 400,980 | 305,269 |
| Frozen pork Cwt. | 31,595 | 56,184 | 85,549 |
| Lard Cwt. | 20,622 | 20,513 | 14,837 |
| Other fats Cwt. | 14,267 | 12,619 | 7,741 |
| Total value of output £ | 2,997,864 | 2,954,781 | 2,715,522 |
| — | 1944–45. | 1945–46. | 1946–47. |
|---|---|---|---|
* Total expenditure under these heads—i.e., not reduced by wages-costs and factory-costs allowances. † Inter-factory transfers of whole-milk cream and whey cream are included, but payments of farm-costs allowances are excluded. ‡ Wages-costs and factory-costs allowances have been apportioned and included in the values of the products. § Includes Australian flour for blending, 5,639 tons, cost £51,232. | |||
| Butter, Cheese, and Condensed-milk Factories | |||
| Number of— | |||
| Factories | 402 | 394 | 389 |
| Persons engaged | 4,001 | 4,014 | 4,059 |
| Salaries and wages paid* £ | 1,388,254 | 1,475,898 | 1,620,337 |
| Number of suppliers | 56,225 | 54,377 | 54,000 |
| Buttermaking— | |||
| Butterfat in milk purchased lb.(000) | 18,202 | 17,370 | 22,035 |
| Butterfat in cream purchased lb.(000) | 260,577 | 210,586 | 241,217 |
| Butterfat in whey-cream purchased lb.(000) | 2,097 | 1,868 | 1,734 |
| Butterfat recovered from factories own whey lb. (000) | 3,474 | 3,188 | 2,809 |
| Cheesemaking— | |||
| Quantity of milk lb.(000) | 2,089,706 | 1,917,606 | 1,848,770 |
| Butterfat in milk lb.(000) | 91,123 | 83,152 | 80,012 |
| Butterfat used in condensed and dried milk, &c. lb.(000) | 4,467 | 4,911 | 4,655 |
| Butterfat in whole cream sold lb. (000) | 972 | 1,013 | 1,672 |
| Cost of butterfat† £ | 27,764,660 | 23,271,071 | 25,914,430 |
| Cost of other materials* £ | 1,554,178 | 1,474,776 | 1,687,825 |
| Milk and cream cartage* £ | 566,744 | 508,967 | 577,202 |
| Other expenses* £ | 1,106,813 | 1,047,781 | 1,511,511 |
| Creamery butter— | |||
| Quantity Cwt. | 3,032,745 | 2,479,268 | 2,864,513 |
| Value‡ £ | 21,828,713 | 17,873,179 | 20,667,911 |
| Whey butter— | |||
| Quantity Cwt. | 60,604 | 54,749 | 50,249 |
| Value‡ £ | 389,924 | 353,337 | 324,614 |
| Cheese— | |||
| Quantity Cwt. | 2,073,519 | 1,890,607 | 1,832,997 |
| Value‡ £ | 8,276,881 | 7,578,478 | 7,317,389 |
| Condensed and dried milk, &c— | |||
| Quantity Cwt. | 454,956 | 462,730 | 548,453 |
| Value £ | 1,477,272 | 1,609,925 | 2,172,749 |
| Value of other products £ | 478,788 | 468,678 | 890,525 |
| Total value of output‡ £ | 32,451,578 | 27,883,597 | 31,504,082 |
| Grain-mills | |||
| Number of— | |||
| Mills | 46 | 46 | 46 |
| Persons engaged | 736 | 733 | 730 |
| Salaries and wages paid £ | 245,853 | 258,808 | 271,136 |
| Wheat used Bushels | 7,452,286 | 7,080,924 | 6,388,473 |
| Total grain £ | 2,069,473 | 2,019,398 | 1,875,344 |
| Cost of other materials £ | 227,251 | 264,743 | 289,652§ |
| Other expenses £ | 173,986 | 177,407 | 183,974 |
| Flour produced Tons | 152,666 | 154,418 | 151,098§ |
| Wheatmeal and wholemeal Tons | 15,023 | 11,833 | 9,664 |
| Bran and pollard Tons | 53,518 | 49,948 | 37,381 |
| Oatmeal Tons | 5,980 | 6,046 | 6,916 |
| Other oaten products for human consumption Tons | 2,760 | 3,572 | 4,074 |
| Total value of output £ | 2,869,318 | 2,888,389 | 2,804,644 |
| — | 1944–45. | 1945–46. | 1946–47. |
|---|---|---|---|
* Includes establishments (8 in 1946–47) exclusively engaged in the making of malt. † Including beer duty. | |||
| Biscuit and Confectionery Factories | |||
| Number of— | |||
| Works | 56 | 58 | 65 |
| Persons engaged | 2,806 | 2,602 | 2,469 |
| Salaries and wages paid £ | 722,350 | 707,861 | 741,976 |
| Flour used Tons | 15,651 | 10,682 | 9,732 |
| Sugar used Tons | 7,520 | 7,404 | 8,298 |
| Cost of all materials used £ | 1,824,787 | 1,624,917 | 1,820,703 |
| Other expenses £ | 314,970 | 313,551 | 309,025 |
| Biscuits, grain products, and ice-cream cones Tons | 21,058 | 15,603 | 15,414 |
| Confectionery Tons | 11,082 | 11,004 | 12,010 |
| Total value of output £ | 3,364,422 | 3,101,009 | 3,390,348 |
| Jam-making and Fruit- and Vegetable-preserving Factories | |||
| Number of— | |||
| Works | 27 | 28 | 28 |
| Persons engaged | 1,294 | 1,215 | 897 |
| Salaries and wages paid £ | 348,355 | 353,396 | 272,864 |
| Fruit used Tons | 8,026 | 8,914 | 8,531 |
| Vegetables used Tons | 22,636 | 17,280 | 8,938 |
| Sugar used Tons | 3,697 | 3,429 | 4,827 |
| Cost of all materials £ | 1,260,803 | 1,077,064 | 990,740 |
| Other expenses £ | 149,285 | 155,932 | 127,003 |
| Jams and jellies Cwt. | 95,540 | 88,938 | 137,344 |
| Canned or bottled fruit Cwt. | 32,905 | 30,224 | 21,907 |
| Pulped fruit Cwt. | 7,736 | 13,760 | 10,489 |
| Canned vegetables Cwt. | 227,520 | 213,435 | 114,032 |
| Total value of output £ | 1,877,832 | 1,712,930 | 1,520,439 |
| Sauce, Pickle, and Vinegar Factories | |||
| Number of— | |||
| Works | 16 | 18 | 18 |
| Persons engaged | 335 | 382 | 377 |
| Salaries and wages paid £ | 101,503 | 112,528 | 112,403 |
| Cost of materials used £ | 292,450 | 295,527 | 252,116 |
| Other expenses £ | 53,239 | 54,943 | 51,276 |
| Pickles—In bottles Dozen | 100,556 | 120,568 | 94,462 |
| Pickles—In bulk Gallons | 12,284 | 10,727 | 10,199 |
| Sauces—In bottles Dozen | 217,302 | 246,947 | 233,902 |
| Sauces—In bulk Gallons | 48,608 | 97,658 | 27,171 |
| Vinegar Gallons | 674,767 | 692,719 | 674,014 |
| Total value of output £ | 542,753 | 537,791 | 469,724 |
| Breweries and Malt-house* | |||
| Number of— | |||
| Establishments | 46 | 47 | 46 |
| Persons engaged | 1,384 | 1,497 | 1,588 |
| Salaries and wages paid £ | 565,810 | 654,527 | 710,327 |
| Barley used in production of malt Bushels | 1,019,337 | 1,055,482 | 1,144,741 |
| Hops used Cwt. | 6,756 | 7,205 | 6,997 |
| Sugar used Cwt. | 22,241 | 23,285 | 23,196 |
| Total cost of materials used £ | 1,636,070 | 1,883,311 | 2,156,842 |
| Beer duty £ | 3,639,340 | 4,126,251 | 4,307,477 |
| Other expenses £ | 432,530 | 484,625 | 543,641 |
| Ale brewed Gallons | 24,500,750 | 27,374,668 | 28,896,853 |
| Stout brewed Gallons | 1,090,894 | 1,195,267 | 1,043,720 |
| Value of output† £ | 6,775,115 | 7,700,080 | 8,255,903 |
| — | 1944–45. | 1945–46. | 1946–47. |
|---|---|---|---|
| Aerated-water and Cordial Factories | |||
| Number of— | |||
| Works | 106 | 103 | 99 |
| Persons engaged | 514 | 508 | 524 |
| Salaries and wages paid £ | 145,491 | 153,906 | 173,865 |
| Sugar used Tons | 1,751 | 1,671 | 1,926 |
| Total cost of materials used £ | 227,732 | 236,775 | 286,962 |
| Other expenses £ | 76,120 | 73,949 | 82,822 |
| Aerated waters—In bottles Dozen | 3,543,957 | 3,828,621 | 4,271,055 |
| Aerated waters—In bulk Gallons | 99,895 | 104,123 | 105,206 |
| Cordials—In bottles Dozen | 83,140 | 85,434 | 118,049 |
| Cordials—In bulk Gallons | 20,774 | 37,927 | 18,114 |
| Total value of output £ | 522,501 | 562,249 | 652,320 |
| Soap and Candle Works | |||
| Number of— | |||
| Works | 25 | 24 | 25 |
| Persons engaged | 668 | 704 | 732 |
| Salaries and wages paid £ | 180,291 | 205,740 | 220,327 |
| Cost of materials used £ | 585,066 | 649,898 | 734,891 |
| Other expenses £ | 127,883 | 125,072 | 121,993 |
| Soap Tons | 9,748 | 11,024 | 10,296 |
| Toilet soap Tons | 2,169 | 2,243 | 2,681 |
| Soap-powder (including washing-powder) Tons | 5,436 | 5,954 | 7,154 |
| Candles lb. | 806,934 | 1,179,172 | 1,043,104 |
| Total value of output £ | 1,081,935 | 1,157,983 | 1,322,960 |
| Boiling-down, Glue, and Manure Works | |||
| Number of— | |||
| Works | 38 | 38 | 38 |
| Persons engaged | 513 | 528 | 543 |
| Salaries and wages paid £ | 190,619 | 204,774 | 208,046 |
| Cost of materials used £ | 527,193 | 538,759 | 607,797 |
| Other expenses £ | 128,096 | 137,015 | 155,898 |
| Tallow Cwt. | 165,124 | 162,897 | 138,827 |
| Manures Cwt. | 124,729 | 129,427 | 116,090 |
| Oil (whale, neatsfoot, &c.) Gallons | 287,254 | 402,269 | 453,116 |
| Meatmeal Cwt. | 48,739 | 54,321 | 59,655 |
| Total value of output £ | 965,153 | 1,036,141 | 1,104,848 |
| Fellmongering and Woolscouring | |||
| Number of— | |||
| Works | 34 | 32 | 33 |
| Persons engaged | 550 | 544 | 534 |
| Salaries and wages paid £ | 204,091 | 209,992 | 212,288 |
| Cost of materials used £ | 2,998,011 | 2,925,682 | 3,514,739 |
| Materials operated upon— | |||
| Sheep-skins No. | 852,085 | 763,936 | 765,473 |
| Greasy wool lb. | 55,520,554 | 54,203,879 | 55,572,689 |
| Other expenses £ | 79,146 | 82,010 | 96,233 |
| Principal products— | |||
| Scoured and slipe wool lb. | 38,354,899 | 38,173,446 | 38,598,886 |
| Pelts No. | 128,229 | 96,260 | 96,260 |
| Pickled pelts No. | 692,617 | 632,310 | 676,934 |
| Total value of output £ | 3,337,780 | 3,279,804 | 3,931,917 |
| — | 1944–45. | 1945–46. | 1946–47. |
|---|---|---|---|
| Tanning | |||
| Number of— | |||
| Works | 19 | 19 | 19 |
| Persons engaged | 956 | 937 | 940 |
| Salaries and wages paid £ | 335,730 | 353,180 | 376,624 |
| Cost of materials used £ | 985,827 | 982,674 | 1,090,350 |
| Materials operated upon— | |||
| Sheep-skins No. | 276,277 | 292,421 | 336,887 |
| Pelts No. | 799,710 | 877,609 | 959,853 |
| Hides (calf and yearling) No. | 150,078 | 193,265 | 320,323 |
| Other hides No. | 371,242 | 359,851 | 298,406 |
| Bark used Tons | 410 | 226 | 171 |
| Cost of hark extract used £ | 116,384 | 108,248 | 108,017 |
| Other expenses £ | 120,760 | 126,252 | 128,900 |
| Output— | |||
| Leather sold by weight lb. | 8,011,885 | 7,569,822 | 7,437,439 |
| Leather sold by area Sq.ft. | 14,048,699 | 14,216,775 | 16,748,160 |
| Basils lb. | 386,396 | 594,908 | 108,886 |
| Scoured and slipe wool lb. | 402,457 | 264,000 | 220,156 |
| Total value of output £ | 1,529,630 | 1,575,495 | 1,722,143 |
| Sawmills, Sash and Door Factories | |||
| Number of— | |||
| Mills | 447 | 469 | 487 |
| Persons engaged | 7,765 | 7,877 | 7,788 |
| Salaries and wages paid £ | 2,671,027 | 2,904,285 | 3,120,991 |
| Cost of materials used £ | 2,772,716 | 3,087,843 | 3,543,535 |
| Other expenses £ | 1,173,030 | 1,297,925 | 1,430,371 |
| Sawn timber— | |||
| Quantity Ft. b.m. | 340,133,099 | 344,723,089 | 353,954,740 |
| Value £ | 3,801,199 | 4,389,074 | 4,919,824 |
| Posts, rails, &c. £ | 163,503 | 157,967 | 145,414 |
| Planed flooring, skirting, &c.— | |||
| Quantity Ft. b.m. | 56,267,036 | 59,752,119 | 67,831,556 |
| Value £ | 1,375,505 | 1,610,297 | 2,034,441 |
| Doors and sashes £ | 174,607 | 224,597 | 251,038 |
| Other products £ | 1,478,680 | 1,479,781 | 1,465,123 |
| Total value of output £ | 6,993,494 | 7,861,716 | 8,815,840 |
| Cooperages and Packing-case Factories | |||
| Number of | |||
| Establishments | 27 | 26 | 27 |
| Persons engaged | 587 | 454 | 391 |
| Salaries and wages paid £ | 205,940 | 157,093 | 138,524 |
| Cost of materials used £ | 556,232 | 411,217 | 385,960 |
| Other expenses £ | 51,322 | 43,438 | 45,193 |
| Casks No. | 31,344 | 39,193 | 35,268 |
| Butter-boxes No. | 1,810,992 | 1,180,958 | 1,716,371 |
| Cheese-crates No. | 287,038 | 238,450 | 341,970 |
| Fruit and packing cases No. | 3,473,551 | 2,478,450 | 2,263,413 |
| Total value of output £ | 866,174 | 639,482 | 587,579 |
| Furniture-making Works | |||
| Number of— | |||
| Factories | 422 | 474 | 548 |
| Persons engaged | 3,284 | 3,985 | 4,821 |
| Salaries and wages paid £ | 880,529 | 1,162,772 | 1,468,561 |
| Cost of materials used £ | 1,244,078 | 1,478,712 | 1,978,509 |
| Other expenses £ | 196,159 | 245,783 | 308,744 |
| Total value of output £ | 2,496,307 | 3,114,352 | 4,062,519 |
| — | 1944–45. | 1945–46. | 1946–47. |
|---|---|---|---|
| Gasworks | |||
| Number of— | |||
| Works | 44 | 44 | 44 |
| Persons engaged | 1,751 | 1,830 | 1,800 |
| Salaries and wages paid £ | 625,985 | 689,300 | 700,598 |
| Coal used— | |||
| Quantity Tons | 299,780 | 309,872 | 314,702 |
| Cost £ | 706,121 | 742,900 | 761,134 |
| Cost of other materials £ | 3,241 | 3,770 | 7,171 |
| Other expenses £ | 392,203 | 402,090 | 403,246 |
| Total gas generated 1,000 cub. ft. | 5,178,007 | 5,241,358 | 4,881,760 |
| Gas sold 1,000 cub. ft. | 4,533,531 | 4,572,099 | 4,637,396 |
| Coke sold Tons | 98,758 | 93,412 | 88,554 |
| Tar sold Gallons | 2,604,409 | 2,130,194 | 2,331,859 |
| Total expenditure £ | 1,727,550 | 1,838,060 | 1,872,149 |
| Total receipts £ | 1,959,776 | 2,020,263 | 2,053,607 |
| Printing and Publishing Establishments | |||
| Number of works | 341 | 346 | 348 |
| Persons engaged— | |||
| Males | 4,420 | 5,011 | 5,612 |
| Females | 2,042 | 2,054 | 2,093 |
| Salaries and wages paid— | |||
| To males £ | 1,625,678 | 1,950,206 | 2,246,905 |
| To females £ | 353,328 | 375,588 | 400,082 |
| Cost of materials used £ | 2,095,334 | 2,372,163 | 2,764,517 |
| Other expenses £ | 811,590 | 933,405 | 1,013,177 |
| Newspaper revenue £ | 2,578,274 | 2,874,069 | 3,297,352 |
| Job-printing £ | 2,489,884 | 2,976,106 | 3,339,695 |
| Total value of output £ | 6,024,421 | 6,857,067 | 7,723,158 |
| Lime and Cement Works | |||
| Number of— | |||
| Works | 89 | 91 | 99 |
| Persons engaged | 1,366 | 1,423 | 1,403 |
| Salaries and wages paid £ | 494,647 | 522,347 | 528,918 |
| Cost of materials used £ | 351,552 | 366,532 | 350,173 |
| Other expenses £ | 539,822 | 544,756 | 553,275 |
| Cement Tons | 228,871 | 234,912 | 219,471 |
| Agricultural lime Tons | 837,512 | 842,967 | 896,772 |
| Total value of output £ | 1,542,670 | 1,592,196 | 1,606,734 |
| Brick, Tile, and Pottery Works | |||
| Number of— | |||
| Works | 48 | 54 | 56 |
| Persons engaged | 1,229 | 1,374 | 1,481 |
| Salaries and wages paid £ | 369,553 | 447,032 | 495,823 |
| Cost of materials used £ | 79,784 | 74,940 | 82,091 |
| Other expenses £ | 166,968 | 191,856 | 312,063 |
| Bricks manufactured— | |||
| Common No. | 18,998,876 | 20,497,978 | 23,794,722 |
| Fire No. | 1,595,622 | 1,903,324 | 2,092,346 |
| Other No. | 1,675,507 | 3,318,176 | 1,395,792 |
| Value of all bricks £ | 148,666 | 193,388 | 221,392 |
| Drainpipes £ | 226,426 | 25.5,939 | 313,667 |
| Roofing-tiles £ | 54,478 | 74,940 | 86,348 |
| Porcelain insulators £ | 148,777 | 138,778 | 124,520 |
| Total value of output £ | 746,807 | 869,141 | 997,686 |
| — | 1944–45. | 1945–46. | 1946–47. |
|---|---|---|---|
* Excludes the allied industries of range-making, wire-working, and nail manufacture forming part of the groups of industries under this title in previous pages. | |||
| Tinware and Sheet-metal Works | |||
| Number of— | |||
| Works | 129 | 138 | 144 |
| Persons engaged | 2,417 | 2,576 | 2,741 |
| Salaries and wages paid £ | 742,855 | 812,100 | 940,167 |
| Cost of materials used £ | 1,686,971 | 1,746,139 | 1,933,505 |
| Other expenses £ | 224,960 | 236,573 | 269,746 |
| Principal products— | |||
| Tin canisters and containers £ | 1,321,635 | 1,335,034 | 1,275,804 |
| Other tinned ware £ | 155,054 | 140,722 | 322,358 |
| Copperware £ | 254,793 | 263,510 | 273,967 |
| Leadware £ | 137,950 | 167,693 | 235,435 |
| Spouting, ridging, and down-piping £ | 90,886 | 128,312 | 135,170 |
| Other galvanized ware £ | 121,398 | 170,147 | 192,267 |
| Total value of output £ | 2,935,700 | 2,986,147 | 3,414,129 |
| General Engineering, Iron and Brass Founding* | |||
| Number of— | |||
| Works | 335 | 348 | 432 |
| Persons engaged | 8,034 | 7,796 | 8,237 |
| Salaries and wages paid £ | 2,806,738 | 2,781,287 | 2,933,954 |
| Cost of materials used £ | 2,932,764 | 2,828,763 | 2,705,966 |
| Other expenses £ | 966,819 | 854,506 | 934,419 |
| Total value of output £ | 7,568,790 | 7,125,580 | 7,327,074 |
| Agricultural and Dairying Machinery and Implement Making | |||
| Number of— | |||
| Works | 76 | 85 | 84 |
| Persons engaged | 1,309 | 1,474 | 1,477 |
| Salaries and wages paid £ | 412,627 | 499,083 | 494,916 |
| Cost of materials used £ | 1,133,458 | 1,331,831 | 1,051,491 |
| Other expenses £ | 99,909 | 107,995 | 113,936 |
| Total value of output £ | 2,030,176 | 2,176,302 | 2,049,896 |
| Motor and Cycle Engineering, Bodybuilding and Assembly | |||
| Number of— | |||
| Works | 1,194 | 1,380 | 1,561 |
| Persons engaged | 7,121 | 9,135 | 11,616 |
| Salaries and wages paid £ | 2,068,529 | 2,802,612 | 3,682,106 |
| Cost of materials used £ | 2,470,530 | 3,203,104 | 4,774,267 |
| Other expenses £ | 670,041 | 837,641 | 1,153,647 |
| Value of work done— | |||
| Bodybuilding £ | 921,380 | 994,204 | 1,404,454 |
| Motor engineering £ | 4,755,263 | 6,391,692 | 8,785,249 |
| Other £ | 97,412 | 120,557 | 256,627 |
| Ship and Boat Building | |||
| Number of— | |||
| Establishments | 34 | 36 | 36 |
| Persons engaged | 1,746 | 1,428 | 1,052 |
| Salaries and wages paid £ | 780,137 | 592,216 | 430,867 |
| Cost of materials used £ | 232,560 | 234,424 | 228,121 |
| Other expenses £ | 152,980 | 133,675 | 92,735 |
| Total value of output £ | 1,282,560 | 1,041,263 | 784,252 |
| — | 1944–45. | 1945–46. | 1946–47. |
|---|---|---|---|
* Including full-fashioned hose 104,007 dozen pair for 1946–47. † Including ankle-length hose 85,766 dozen pair for 1946–47. | |||
| Chemical-fertilizer Works | |||
| Number of— | |||
| Works | 9 | 9 | 9 |
| Persons engaged | 879 | 967 | 1,109 |
| Salaries and wages paid £ | 320,407 | 381,413 | 464,698 |
| Rock phosphate used Tons | 219,837 | 267,943 | 335,730 |
| Sulphur Tons | 41,819 | 50,134 | 61,134 |
| Nitrate of soda Tons | 1,357 | 1,524 | 2,027 |
| Potash Tons | 1,999 | 883 | 455 |
| Serpentine rock Tons | 27,932 | 16,500 | 35,658 |
| Total cost of materials used £ | 1,107,655 | 1,196,755 | 1,470,814 |
| Other expenses £ | 273,670 | 325,009 | 319,594 |
| Fertilizers Tons | 425,900 | 474,368 | 602,478 |
| Superphosphate content of fertilizers (estimated) Tons | 361,013 | 426,826 | 534,224 |
| Acids Tons | 2,158 | 2,332 | 2,450 |
| Total value of output £ | 1,890,683 | 2,126,824 | 2,582,509 |
| Footwear Factories | |||
| Number of works | 82 | 90 | 101 |
| Number of persons engaged— | |||
| Males | 2,541 | 2,570 | 2,931 |
| Females | 2,028 | 2,090 | 2,036 |
| Salaries and wages paid— | |||
| To males £ | 826,950 | 884,249 | 1,072,727 |
| To females £ | 337,407 | 374,467 | 405,337 |
| Cost of materials used— | |||
| Upper leather— | |||
| Imported £ | 210,349 | 182,741 | 190,116 |
| New Zealand £ | 516,211 | 475,947 | 511,634 |
| Sole leather £ | 579,049 | 537,169 | 543,739 |
| Other materials £ | 704,052 | 663,692 | 755,286 |
| Total £ | 2,009,661 | 1,859,549 | 2,000,775 |
| Other expenses £ | 234,118 | 261,619 | 333,643 |
| Output— | |||
| Adults' boots and shoes Pairs | 2,166,708 | 1,962,310 | 2,001,779 |
| Children'S boots and shoes (including sandals) Pairs | 844,678 | 778,720 | 861,858 |
| Sandals (adults' only) Pairs | 271,484 | 315,469 | 288,011 |
| Slippers and rubber canvas shoes Pairs | 2,055,543 | 1,948,325 | 2,256,401 |
| Total value of output £ | 3,657,374 | 3,562,309 | 4,018,471 |
| Woollen-mills | |||
| Number of— | |||
| Mills | 16 | 18 | 21 |
| Persons engaged | 3,824 | 3,557 | 2,998 |
| Salaries and wages paid £ | 1,009,677 | 970,695 | 890,885 |
| Greasy wool used— | |||
| Quantity lb. | 13,612,934 | 11,890,215 | 9,933,874 |
| Cost £ | 846,809 | 743,059 | 631,326 |
| Cost of other materials used £ | 229,291 | 197,948 | 197,264 |
| Other expenses £ | 428,675 | 400,309 | 370,018 |
| Output— | |||
| Tweed and cloth Yards | 2,948,202 | 2,632,486 | 2,183,851 |
| Flannel Yards | 1,009,540 | 843,673 | 604,370 |
| Blankets Pairs | 201,517 | 142,381 | 135,101 |
| Hosiery Doz. pairs | 156,267 | 133,452 | 87,991 |
| Rugs and shawls No. | 7,316 | 21,353 | 11,820 |
| Yarn lb. | 1,489,313 | 1,403,822 | 1,019,990 |
| Knitted garments £ | 289,986 | 291,924 | 264,156 |
| Total value of output £ | 2,835,628 | 2,579,171 | 2,389,209 |
| Hosiery and Knitted Goods Factories | |||
| Number of— | |||
| Works | 50 | 51 | 56 |
| Persons engaged | 2,187 | 2,113 | 2,209 |
| Salaries and wages paid £ | 486,142 | 540,034 | 599,324 |
| Cost of materials used £ | 1,178,652 | 1,259,804 | 1,143,026 |
| Other expenses £ | 164,621 | 188,701 | 221,154 |
| Output— | |||
| Hose Doz. pairs | 253,452 | 225,723 | 221,140* |
| Half-hose Doz. pairs | 230,517 | 221,857 | 261,419† |
| Knitted garments £ | 1,012,451 | 1,087,808 | 1,379,451 |
| Total value of output £ | 2,075,334 | 2,223,907 | 2,276,273 |
| Clothing Factories | |||
| Number of works | 464 | 496 | 604 |
| Number of persons engaged— | |||
| Males | 1,932 | 2,216 | 2,625 |
| Females | 12,240 | 12,609 | 12,800 |
| Salaries and wages paid— | |||
| To males £ | 762,777 | 910,990 | 1,106,236 |
| To females £ | 2,016,820 | 2,257,007 | 2,420,679 |
| Cost of materials used £ | 4,211,685 | 4,610,569 | 5,259,523 |
| Other expenses £ | 499,558 | 569,270 | 723,316 |
| Output— | |||
| Suits No. | 127,133 | 136,017 | 140,926 |
| Shirts Dozen | 173,776 | 182,616 | 148,414 |
| Hats and caps (men'S and boys') Dozen | 29,376 | 33,182 | 36,685 |
| Dresses No. | 980,289 | 1,019,283 | 720,455 |
| Hats (women'S) Dozen | 78,695 | 69,412 | 67,700 |
| Total value of output £ | 8,273,364 | 9,126,411 | 10,342,771 |
WITHIN the short span of a century New Zealand has been transformed from a virgin wilderness into a country whose community enjoys the amenities of modern social and industrial life. In the pioneer stages of colonization, the development of the resources of the country demanded an almost mushroom growth of building and construction activity in the formation of railways, roads, and harbours, in addition to provision for the housing needs of a rapidly growing population. More recently the utilization of vast resources of water-power has involved major schemes of construction of hydro-electric stations in various parts of New Zealand, and the reticulation of practically the whole of the inhabited portion of the country. Land-settlement and the growth of factory industries have both required extensive building and construction works, rural and urban, while the increasing housing needs of a growing population are reflected in a steady long-term increase in the building of dwellings. The increase in trade and industry, with the resultant growth of the towns, has been accompanied by extensive construction of factories, shops, offices, warehouses, &c.
With the passing of the early stages of social and industrial development, replacements of obsolete and obsolescent structures and general maintenance have recently occupied, and will continue to occupy, a larger place in building and construction activity than was the case formerly, although there have been new avenues of industry requiring further major building and construction operations. For example, the recent development of aviation in New Zealand required the formation of a chain of landing-grounds and air-ports, a work which became more urgent with the outbreak of war. The increase in motor traffic has necessitated a reorientation of roading policy, much new construction and extensive alterations to the surfaces of existing roads being required. The diversification of factory industries in recent years has involved extensive building operations—particularly in the engineering trades—while modernization of factory equipment and of shop and office accommodation has been responsible for a further appreciable proportion of building activity.
The building and construction industry is particularly sensitive to cyclical fluctuations in business conditions, and it is not surprising to note that in New Zealand marked changes in Building activity coincide with the ebb and flow of trade and industry. Governmental policy in regard to public-works construction is, and has been, directed towards accelerating State activity in this direction in times of depression and in the slack seasons of the year with a view to alleviating unemployment. While considerable success has been achieved on various occasions, at other times the expansion of public works has been limited for financial reasons. Private building suffered severely during 1931–33, but revived substantially, particularly after 1935, to reach its pre-war peak in 1938–39. Thereafter a progressive decline in the importation of essential materials, notably steel and iron, took place, with consequential effects on normal large-scale construction. The falling-off in operations, although substantial, during the next two years was not so heavy as might have been expected. After 1941, however, the full effect of war began to have its effect, while Japan'S entry into the war accentuated the diversion of men and building-materials to aerodromes and other defence constructional work. This diversion was maintained as the necessity arose to provide accommodation for Allied Forces in the area. The cumulative effect of these circumstances may be gauged from the record low level of building permits for urban districts in 1942–43, the value of which, £2,661,947, may be compared with the 1938–39 figure of £12,126,458. Thereafter, with the completion of the major portion of defence programmes, a distinct revival of civil building took place, the improvement being progressively maintained despite the hampering effects of shortages of skilled labour and many essential building commodities. By 1944–45 the annual value had exceeded the highest pre-war figure, although it would appear that much of the increase over earlier years was a reflection of higher costs. If the number of permits for new dwellings can be safely used as a guide, then by the 1946–47 year building activity both in volume and value had by far exceeded pre-war figures.
The value of building permits in urban districts for 1946–47 totalled £21,159,504, this figure being surpassed in 1947–48 with a value of £21,426,625.
An interesting feature of building and construction activity in New Zealand is the absence of a marked seasonal decline in the winter months, since winters are not sufficiently severe, except in a few districts, to interfere materially with the building of dwellings or other construction work.
The function of the State in the stimulation of building and construction enterprise is twofold. Public works, involving both new construction and the maintenance of existing works, are in themselves responsible for a large percentage of the total annual building and construction activity. Furthermore, the State encourages private building in various ways—for example, the State Advances Corporation (see Section 24D of this Year-Book) has done much to facilitate home building and land development. As will be seen under a subsequent heading, a comprehensive programme of house-building by the State has been undertaken in recent years.
A collection of annual statistics of building permits issued in cities, boroughs, and town districts was initiated in 1921–22, while a monthly collection on a more restricted scale was begun in 1926. In 1925 an annual collection of returns from builders and contractors was inaugurated, affording, inter alia, an analysis of costs, &c., not available from the building permit statistics. (This collection was temporarily suspended after the 1940–41 collection owing to factors arising out of the war.) These statistics are of too recent origin to give an indication of the long-term progress of building and construction. There are available, however, certain statistical data from which the development of building activity can be deduced, and the 1942 and earlier issues of the Year-Book contain details of the long-term trend in building and construction activity.
THE HOUSING SITUATION.—As will be obvious from a perusal of the statistics of building permits and building construction given later on in this section, building operations fell to small proportions during the depression years. With the advent of better times, accompanied by a large increase in the number of marriages and a growing tendency to discontinue the sharing of homes by two families, there arose in many cities and towns a housing demand far in excess of the available supply. The position was aggravated by the fact that a considerable proportion of the existing dwellings did not comply with modern standards of comfort, convenience, and sanitation.
Although the Government'S housing programme, inaugurated in March, 1937, had made substantial progress and had added considerably to the numbers of houses that were being built, the outbreak of war further aggravated the problem. The transfer of men and materials to urgent defence works, referred to earlier, reduced dwelling construction to almost negligible proportions for a period. The years 1939 and 1940 witnessed a substantial increase in the number of marriages, and, although there was a considerable fall during the next three years, the termination of the war saw a substantial rise, culminating in a new record in 1946. These factors, together with the rehabilitation of ex-servicemen generally, have resulted in an unprecedented demand for housing accommodation. According to the annual report of the State Advances Corporation for the year 1947–48 there were 52,333 unsatisfied applications for tenancies of State rental houses at 31st March, 1948. The report states, however, that there is no reason to suppose that the condition of all these applications is totally unsatisfactory. While it is difficult to give an accurate estimate of the number of units required to overcome the immediate problem, it has been suggested that the provision of 25,000 now tenancies within the next few years would reasonably meet the needs of the most pressing cases, particularly when the considerable activity in building for private owners is taken into account.
Housing Survey.—The question of relieving the shortage of suitable housing-accommodation received governmental attention, and in 1935 a Housing Survey Act was passed as a preliminary towards a planned programme of housing reform. This Act applied to (1) the Councils or Boards of all boroughs and town districts with not less than 1,000 population, (2) two suburban Road Boards, and (3) any other local authority to which the Act might be applied by the Governor-General in Council. Each authority was required to make a housing survey of its district or—with ministerial approval—of a defined area or areas within the district.
Summarized results of the housing surveys carried out in 115 local districts are as follows:—
| Total population | 901,353 |
| Total dwellings | 225,363 |
| Buildings used as dwellings: Unsatisfactory, but repairable | 31,663 |
| Buildings used as dwellings: Totally unsatisfactory | 6,827 |
| Dwelling units in which equipment is only partly satisfactory | 23,768 |
| Dwelling units in which equipment is totally unsatisfactory | 20,096 |
| Dwellings providing accommodation below the minimum standard | 27,214 |
| Surplus persons accommodated in dwellings below minimum standard | 68,405 |
| Dwellings overcrowded | 9,835 |
| Surplus persons in overcrowded dwellings | 14,761 |
The classification of dwellings as to (1) whether satisfactory as regards physical fitness, (2) whether providing adequate accommodation, and (3) whether overcrowded, was made on the basis of standards laid down by regulations under the Housing Survey Act. The standards of physical condition and of minimum accommodation are too detailed for repetition here, but a résumé of the latter will be found on page 650 of the 1940 issue of the Year-Book. Of the 38,490 dwellings which failed to measure up to the standards of physical condition in one or more respects, in 31,663 cases the deficiencies were repairable. Equipment was wholly or partly unsatisfactory in 43,864 of the houses examined, while some 27,214 dwellings failed to reach the standard of minimum accommodation laid down.
Census Statistics.—The census taken for the night of 25th September, 1945, revealed that there were 452,772 dwellings in New Zealand, as compared with 395,061 in 1936, an increase of 57,711, or 14.61 per cent.
For census purposes a dwelling is defined as any place used permanently or temporarily for human habitation, and may be a house, a flat, living-rooms attached to a shop, an hotel, a boardinghouse, an institution, and so forth. The definition also includes vessels, but in the following table vessels have been excluded.
| — | 1936. | 1946. |
|---|---|---|
| Inhabited at census— | ||
| (1) Dwellings occupied by persons other than Maoris | 360,455 | 412,642 |
| (2) Dwellings occupied by Maoris | 13,793 | 16,028 |
| Not inhabited at census— | ||
| (1) Dwellings whose occupants were temporarily absent on holiday, business, &c. | 5,784 | 5,919 |
| (2) Week-end or summer dwellings | 8,435 | 11,047 |
| (3) Untenanted dwellings | 6,594 | 7,136 |
| Total | 395,061 | 452,772 |
| Dwellings in course of erection | 1,484 | 5,362 |
Including cases where the occupants were temporarily absent on census night, there were 434,589 dwellings in occupation in 1945 and 380,032 in 1936. The “week-end or summer dwellings” are mainly country or seaside cottages, “baches,” &c., which are normally inhabited only at week-ends or holiday periods. The thirdgroup, “untenanted dwellings,” comprise the genuinely unoccupied—i.e., empty or vacant dwellings. In view of the apparent housing shortage, which has become extremely acute owing to the drastic curtailment of normal building activity during the war period, and the demand for houses by discharged servicemen, &c., it may be somewhat surprising that there has been an increase in the number of untenanted dwellings, but this has mainly resulted from shifts of population. Of the 7,136 untenanted dwellings in 1945, 3,959 were in the North Island and 3,177 in the South Island.
Further census information regarding dwellings will be found in Appendix (a) of this volume, and includes details of rooms, occupants, tenure, &c.
STATE HOUSE-CONSTRUCTION.—A programme of direct home-building by the Government was commenced in March, 1937. The purpose of this branch of the Government'S activities is to provide homes of a modern standard of comfort to be let at reasonable rentals to people in the medium and lower income groups. The legislative provision for this programme is contained in the Housing Act, 1919, the administration of which was transferred to the State Advances Corporation by the State Advances Corporation Act, 1936. To give effect to the Government'S policy, a special Housing Construction Branch of the State Advances Corporation was set up in September, 1936. Early in 1944 the control of the Housing Construction Branch was transferred to the Ministry of Works.
The State Advances Corporation Act, 1936, made provision for a special Housing Account with the Reserve Bank, and the Statutes Amendment Act, 1936, provided the necessary authority to acquire land under the Public Works Act, 1928, for the purpose of housing. The actual construction work is mainly carried out by contractors, tenders being called for the various contracts. The Housing Division itself has also built a number of houses by direct labour, principally by trainees under the scheme for the rehabilitation of returned servicemen. Up to 31st March, 1948, contracts had been arranged with the Rehabilitation Department for the labour involved in 3,113 houses situated in 41 towns. While most of these houses are situated in the larger towns, in a few instances the rehabilitation trainees have been employed in isolated districts where the Housing Division has been unable to engage private contractors. Although the Housing Division has concentrated mainly upon the building of houses to the exclusion of other buildings, there are instances, by reason of the creation of new communities isolated from normal amenities, where it has been necessary to provide some shopping facilities. At 31st March, 1948, blocks of shops had been completed in Hamilton and Wellington (Wadestown), while other schemes are at various stages of construction in the main State housing areas.
On completion, houses and shops are handed over to the State Advances Corporation for administration.
In addition to the general scheme, the organization of the Housing Division is utilized for the purpose of erecting houses for other Government Departments, and building operations have been effected for 22 Departments of State. Units completed under this arrangement totalled 1,066 up to the 31st March, 1948, with a further 372 in the constructional stage. Two subsidiary schemes within this general framework are of interest. The first covers the erection of houses and oilier farm buildings for land-settlement schemes operated by the Lands and Survey Department. At the 31st March, 1948, 358 houses and 544 ancilliary farm buildings had been completed, while under-construction figures were 141 and 219 respectively. The second scheme has for its object the provision of houses for timber-workers. Difficulty has been experienced in providing suitable living conditions for bush workers, both from the transient nature of the place of employment, which moves with the milling areas, and from the reluctance of builders to undertake work in the isolated back country where mills are operating. The Timber Advisory Committee has therefore sponsored a scheme to provide prefabricated portable houses, which are built in the towns and transported in sections to the site. By the 31st March, 1948, 44 of these units had been completed and erected; 81 more were being erected, with an additional 49 in course of prefabrication.
The following table shows the cumulative progress up to 31st March of each year since the inception of the present housing scheme.
| Cumulative Totals to 31st March. | House advertised. | Contracts let. | Houses completed and handed over to— | House-unit Sections acquired. | |
|---|---|---|---|---|---|
| State Advances Corporation. | Other Government Departments. | ||||
| Units. | Units. | Units. | Units. | Units. | |
| 1938 | 3,172 | 2,507 | 399 | 9,296 | |
| 1939 | 6,698 | 6,188 | 3,064 | 13,949 | |
| 1940 | 11,071 | 10,353 | 6,432 | 27 | 20,421 |
| 1941 | 14,084 | 13,647 | 10,337 | 88 | 23,953 |
| 1942 | 17,029 | 16,522 | 13,525 | 108 | 28,990 |
| 1943 | 17,443 | 16,799 | 14,619 | 273 | 36,613 |
| 1944 | 20,910 | 19,487 | 15,475 | 297 | 40,184 |
| 1945 | 24,581 | 22,349 | 17,392 | 349 | 42,061 |
| 1946 | 27,845 | 25,331 | 20,726 | 478 | 45,838 |
| 1947 | 30,874 | 28,424 | 22,590 | 731 | 48,751 |
| 1948 | 34,918 | 32,128 | 25,465 | 1,066 | 50,510 |
During the recent war, many of the schemes of land-development were considerably retarded and housing activities showed up generally. With the completion of defence works, housing activities were speeded up as quickly as conditions would permit, but the shortage of skilled labour rendered rapid expansion impossible. This position is being gradually overcome, and the total labour force employed directly by the Housing Division and contractors at 31st March, 1948, was 6,215 as compared with 3,645 in 1945.
The next table gives particulars of the cumulative expenditure of the Housing Division up to 31st March of each year since its inception.
| Cumulative Totals to 31st March. | Land and Services | Dwelling Construction. | Plant and Equipment. | Interest during Construction. | Administration. | Total. | |
|---|---|---|---|---|---|---|---|
| Housing Branch. | Other Departments. | ||||||
| £ | £ | £ | £ | £ | £ | £ | |
| 1938 | 298,500 | 1,053,600 | 51,500 | 6,600 | 66,200 | 1,476,400 | |
| 1939 | 890,600 | 4,311,400 | 56,700 | 21,000 | 166,400 | 5,446,100 | |
| 1940 | 1,638,900 | 8,567,200 | 26,700 | 65,500 | 31,000 | 281,300 | 10,610,600 |
| 1941 | 2,549,100 | 13,075,300 | 128,400 | 66,600 | 52,200 | 406,400 | 16,278,000 |
| 1942 | 3,086,400 | 16,376,500 | 191,400 | 65,000 | 93,500 | 539,800 | 20,352,600 |
| 1943 | 3,665,500 | 17,316,200 | 325,200 | 68,300 | 117,600 | 685,700 | 22,178,500 |
| 1944 | 4,212,300 | 18,326,200 | 523,700 | 69,800 | 154,000 | 659,100 | 23,945,100 |
| 1945 | 4,934,000 | 21,690,600 | 678,600 | 76,300 | 226,200 | 785,000 | 28,390,700 |
| 1946 | 5,621,000 | 25,840,800 | 1,203,500 | 88,500 | 276,400 | 985,800 | 34,016,000 |
| 1947 | 6,518,500 | 30,050,500 | 1,864,000 | 105,800 | 353,100 | 1,228,500 | 40,120,400 |
| 1948 | 7,347,100 | 34,629,300 | 2,632,600 | 148,100 | 402,300 | 1,600,000 | 46,759,400 |
In addition to the cumulative net expenditure of £46,759,400 to 31st March, 1948, liabilities and commitments at that date amounted to a further £8,636,667.
The total cost of administration (exclusive of interest charges) from the inception of the scheme to 31st March, 1948, was £1,600,000, or 3.59 per cent. of the net expenditure (excluding administrative costs and interest). The percentage for the year ended 31st March, 1948, was 5.97.
In general, the size of dwelling units built by the Housing Division is determined by the size of the families seeking accommodation. The tendency in later years has been to build a higher proportion of larger-sized houses than formerly. This is illustrated in the following table, which contains an analysis according to the number of bedrooms contained in units built during 1947–48, the total to the end of March, 1948, and of contracts prepared during 1947–48.
| — | Completed, 1947–48. | Total Completed to 31st March, 1948. | Contracts Prepared, 1947–48. | |||
|---|---|---|---|---|---|---|
| Number of Units. | Percentage of Total. | Number of Units. | Percentage of Total. | Number of Units. | Percentage of Total. | |
| Bed-sitting room | 8 | 0.2 | 231 | 0.9 | ||
| One bedroom | 137 | 4.3 | 2,453 | 9.2 | 26 | 0.8 |
| Two bedrooms | 1,214 | 37.8 | 11,528 | 43.4 | 1,159 | 33.4 |
| Three bedrooms | 1,593 | 49.6 | 10,792 | 40.7 | 2,003 | 57.8 |
| Four bedrooms | 253 | 7.9 | 1,453 | 5.5 | 278 | 8.0 |
| Over four bedrooms | 5 | 0.2 | 74 | 0.3 | 1 | 0.0 |
| Totals | 3,210 | 100.0 | 26,531 | 100.0 | 3,467 | 100.0 |
Owing to the acute shortage of all types of building materials, it has been found necessary to erect or sheath houses in whatever material it is possible to obtain at the time and in the particular locality. The following table gives an analysis of the types of houses for which contracts have been prepared during the year ended 31st March, 1948.
| Weatherboard | 1,944 | |
| Brick veneer | 485 | |
| Total brick | 31 | |
| 516 | ||
| Asbestos sheets | 744 | |
| Concrete sheets | 118 | |
| Concrete, concrete blocks, and veneer | 122 | |
| Miscellaneous | 23 | |
| Total | 3,467 | |
In addition to the activities briefly outlined above, the housing policy of the Government includes the provision of loans to local authorities at 3 per cent. per annum for the furtherance of municipal and other housing schemes. There is provision under the Housing Act for the granting of loans to employers, and this' has provided an avenue of assistance for such branches of industry as dairy companies and lime-works. The Rural Housing Act, 1939, and subsequent amendments thereto provide facilities for the granting of financial assistance to farmers requiring new houses for themselves or their employees, or desiring to improve their existing houses. The County Councils have been charged with the duty of investigating the loan applications, and provided they are satisfied with the security, &c., they have authority to approve a loan subject to the prior consent of the Board of Management of the State Advances Corporation. Loans are made to local authorities bearing interest at 3 per cent. and are repayable on the amortization system over terms up to twenty-five years. This enables a rate of 3½ per cent. to be charged to farmer applicants, and such loans, are usually repayable over a term similar to that on which the local authority has borrowed.
Where any farm is situated within any borough, town district, or road district, similar powers are conferred on the local authority concerned.
Separate provision for housing of Maoris is made under the Maori Housing Act, 1935, reference to which will be found in Section 17, Subsection C (Maori Lands).
Reference to the provisions made for the governmental financing of home-building on behalf of private owners is contained in the section of this Year-Book dealing with State Advances (Section 24D).
BUILDING PERMITS: Annual Statistics.—Statistics of building permits issued in cities, boroughs, and town districts during each March year have been collected for 1921–22 and subsequent years—for use, inter alia, as an aid in compiling inter-censal estimates of population. These statistics afford a conspectus of changes in building activity from year to year. There is, however, a factor which may affect to some extent the accuracy of the figures as a guide to short-period fluctuations in building activity. This applies more particularly to buildings other than dwellinghouses, and is found in the fact that the value shown represents, in the great majority of instances, the total contract price or estimated cost of the whole building. A permit for a largo building involves building activity spread over months, or even years, whereas in the permit statistics the value is shown wholly for the year or month in which the permit is issued. This qualification applies with greater force to the monthly statistics than to the annual statistics.
The scope of the collection was widened by the inclusion in 1926–27 of three road districts—increased to six in 1927–28—in Eden County (suburban to Auckland), and was further extended in 1928–29 by the addition of two counties—increased to four in 1929–30—adjacent to Wellington and Christchurch. Of the six road districts in Eden County, two were amalgamated with Auckland City from 1st April, 1928, and two became boroughs, one from 1st April, 1930, and the other from 29th September, 1947.
As a result of the extended scope of the returns, the comparison has been somewhat impaired, and the next table shows the figures under two heads—viz., one giving the totals for all districts covered in the particular year and the second giving the totals for only, cities, boroughs, and town districts.
Commencing with the year 1937–38, returns have been obtained, where possible, and data compiled in respect of building activity in rural areas (vide later in this section).
The following table contains the principal statistics in regard to building permits (including State building operations) issued in urban districts since the inauguration of the collection in 1921–22.
| Year ended 31st March, | All Urban Districts covered. | Cities, Boroughs, and Town Districts. | ||||
|---|---|---|---|---|---|---|
| Number of New Private Dwellings. | Value of New Buildings: All Classes. | Total Value All Buildings (including Alterations And Additions). | Number of New Private Dwellings. | Value of New Buildings: All Classes. | Total Value All Buildings (including Alterations and-Additions). | |
| £ | £ | £ | £ | |||
| 1922 | 4,330 | 4,602,834 | 5,283,012 | 4,330 | 4,602,834 | 5,283,012 |
| 1923 | 5,025 | 6,124,439 | 7,101,681 | 5,025 | 6,124,439 | 7,101,681 |
| 1924 | 6,245 | 7,708,933 | 9,146,479 | 6,245 | 7,708,933 | 9,146,479 |
| 1925 | 5,805 | 7,823,331 | 9,304,160 | 5,805 | 7,823,331 | 9,304,160 |
| 1926 | 6,850 | 8,613,549 | 10,169,530 | 6,850 | 8,613,549 | 10,169,530 |
| 1927 | 7,179 | 9,357,977 | 11,019,389 | 6,752 | 8,944,334 | 10,575,535 |
| 1928 | 5,690 | 8,127,732 | 9,665,216 | 5,388 | 7,843,773 | 9,353,055 |
| 1929 | 5,212 | 7,326,464 | 9,054,421 | 4,871 | 6,988,408 | 8,691,962 |
| 1930 | 5,747 | 7,917,349 | 9,959,877 | 5,228 | 7,362,998 | 9,336,301 |
| 1931 | 3,463 | 4,240,238 | 5,473,395 | 3,200 | 4,056,274 | 5,260,620 |
| 1932 | 1,555 | 1,936,447 | 2,728,486 | 1,415 | 1,847,508 | 2,620,651 |
| 1933 | 1,496 | 1,874,795 | 2,474,866 | 1,306 | 1,773,313 | 2,341,690 |
| 1934 | 2,649 | 3,141,897 | 3,889,890 | 2,416 | 2,987,773 | 3,718,717 |
| 1935 | 2,892 | 2,742,495 | 3,643,688 | 2,655 | 2,612,684 | 3,492,062 |
| 1936 | 4,140 | 4,695,736 | 5,929,803 | 3,835 | 4,468,126 | 5,674,198 |
| 1937 | 4,555 | 4,927,326 | 6,581,233 | 4,207 | 4,675,363 | 6,273,444 |
| 1938 | 6,043 | 8,217,400 | 10,291,613 | 5,568 | 7,876,352 | 9,909,225 |
| 1939 | 8,093 | 10,196,476 | 12,126,458 | 7,425 | 9,555,747 | 11,431,491 |
| 1940 | 8,086 | 9,790,118 | 11,418,434 | 7,429 | 9,156,670 | 10,714,396 |
| 1941 | 7,147 | 9,147,885 | 11,060,101 | 6,099 | 8,024,595 | 9,763,200 |
| 1942 | 5,503 | 6,958,997 | 8,984,177 | 4,989 | 6,436,113 | 8,185,669 |
| 1943 | 863 | 1,363,091 | 2,661,947 | 767 | 1,269,330 | 2,500,240 |
| 1944 | 3,604 | 5,528,583 | 8,309,861 | 3,220 | 4,975,325 | 7,587,983 |
| 1945 | 6,698 | 10,405,115 | 12,756,999 | 6,170 | 9,583,539 | 11,800,649 |
| 1946 | 7,736 | 14,314,686 | 16,944,395 | 7,027 | 13,230,581 | 15,736,941 |
| 1947 | 9,516 | 17,626,543 | 21,159,504 | 8,356 | 15,450,534 | 18,773,002 |
| 1948 | 9,854 | 18,280,334 | 21,426,625 | 8,890 | 16,618,957 | 19,559,814 |
The figures shown for “cities, boroughs, and town districts” cover the districts existing in the year to which the statistics refer. Since these statistics were inaugurated, however, several new boroughs and town districts have been created and are accordingly included, while a few town districts have been excluded consequent on their abolition as town districts and their merger into counties. The net result has, however, been a gradual accession which has tended to raise slightly the figures for later years.
The accompanying diagram, which relates to dwelling permits for all urban districts covered, shows the low level to which building operations fell during the depression period. The subsequent gradual recovery, accelerated by the Government'S programme of house-building which commenced in 1936–37, and then the effect of war conditions, are both clearly illustrated.
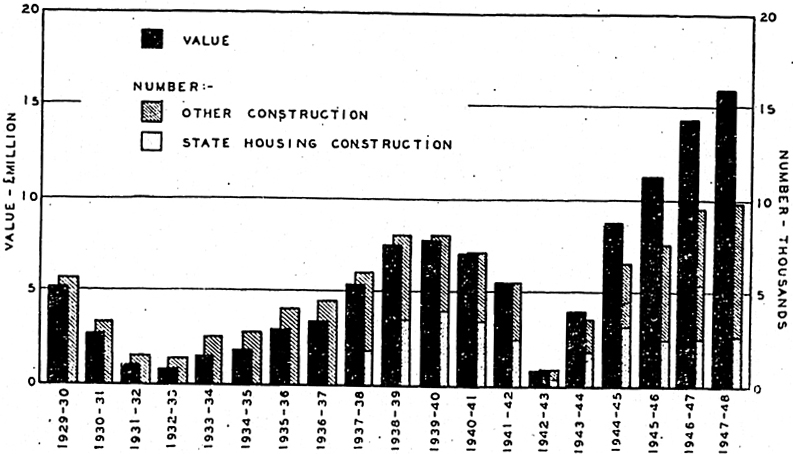
Prior to 1936–37 each block of flats was included as a single dwelling, but since then more information became available and each individual flat is now counted as a separate dwelling. Blocks of flats so included in all districts prior to 1936–37 numbered 34 in 1928–29; 36 in 1929–30; 9 in 1930–31; 4 in 1931–32; 4 in 1932–33: 6 in 1933–34; 34 in 1934–35; and 22 in 1935–36.
The following are the details of blocks of flats included from 1936–37 onwards.
| Year ended 31st March, | All Urban Districts covered. | Cities, Boroughs, and Town Districts. | ||
|---|---|---|---|---|
| Blocks. | Number of Flats. | Blocks. | Number of Flats. | |
| 1937 | 98 | 421 | 96 | 417 |
| 1938 | 128 | 519 | 118 | 490 |
| 1939 | 92 | 374 | 81 | 341 |
| 1940 | 81 | 327 | 78 | 319 |
| 1941 | 110 | 431 | 105 | 414 |
| 1942 | 137 | 611 | 133 | 595 |
| 1943 | 21 | 111 | 16 | 71 |
| 1944 | 41 | 161 | 39 | 149 |
| 1945 | 88 | 398 | 85 | 390 |
| 1946 | 82 | 368 | 79 | 353 |
| 1947 | 81 | 240 | 80 | 238 |
| 1948 | 75 | 265 | 74 | 263 |
These figures cover only buildings erected as blocks of flats. Where conversion of existing private dwellings into flats has taken place, the value is included in alterations and additions.
The statistics quoted in the preceding paragraphs relate only to the main types of building activity. More detailed statistics are included in the annual Statistical Report on Population and Buildings, where, inter alia, permit statistics for individual towns, counties, &c., are given.
Building operations in the year 1946–47 showed a substantial increase over 1945–46. This upward trend was continued in the year 1947–48, and the value of building operations in that year constituted a record for the twenty-seven years during which building statistics have been collected.
BUILDING PERMITS ISSUED.—URBAN DISTRICTS
| — | 1945–46. | 1946–47. | 1947–48. |
|---|---|---|---|
| Private dwellings— | |||
| New buildings— | |||
| Number | 7,736 | 9,516 | 9,854 |
| Value | £11,211,890 | £14,307,310 | £15,906,061 |
| Value of alterations and additions | £1,258,265 | £1,498,231 | £1,613,063 |
| Other buildings— | |||
| New buildings— | |||
| Number | 704 | 729 | 641 |
| Value | £3,102,796 | £3,319,233 | £2,374,273 |
| Value of alterations and additions | £1,371,444 | £2,034,730 | £1,533,228 |
| Total— | |||
| New buildings— | |||
| Number | 8,440 | 10,245 | 10,495 |
| Value | £14,314,686 | £17,626,543 | £18,280,334 |
| Value of alterations and additions | £2,629,709 | £3,532,961 | £3,146,291 |
| Grand total: Value | £16,944,395 | £21,159,504 | £21,426,625 |
The following table arranges districts with building values of over £100,000 in 1946–47 and 1947–48 in descending order.
| 1946–47 | |
| £ | |
| Auckland City | 2,053,376 |
| Christchurch City | 1,518,922 |
| Dunedin City | 1,413,335 |
| Lower Hutt City | 1,210,899 |
| Wellington City | 981,656 |
| Mount Roskill Borough | 731,504 |
| Waimairi County | 693,809 |
| Palmerston North City | 494,688 |
| Upper Hutt Borough | 454,661 |
| Invercargill City | 442,768 |
| Hamilton City | 378,392 |
| Takapuna Borough | 373,740 |
| Hastings Borough | 360,536 |
| Hutt County | 355,311 |
| Mount Albert Borough | 348,975 |
| New Plymouth Borough | 346,306 |
| Gisborne Borough | 341,578 |
| Whangarei Borough | 324,219 |
| Wanganui City | 322,355 |
| Napier Borough | 293,985 |
| Timaru Borough | 265,062 |
| Nelson City | 258,627 |
| Makara County | 232,486 |
| Onehunga Borough | 228,611 |
| Rotorua Borough | 226,737 |
| New Lynn Borough | 215,521 |
| Mount Wellington Road District | 198,092 |
| Papatoetoe Borough | 195,091 |
| Ellerslie Borough | 183,100 |
| Mount Eden Borough | 177,199 |
| One Tree Hill Borough | 172,549 |
| Heathcote County | 168,565 |
| Blenheim Borough | 152,257 |
| Masterton Borough | 142,120 |
| Levin Borough | 137,172 |
| Tauranga Borough | 128,674 |
| Birkenhead Borough | 118,430 |
| Kaitaia Borough | 100,907 |
| 1947–48 | |
| £ | |
| Auckland City | 1,879,837 |
| Christchurch City | 1,464,463 |
| Lower Hutt City | 1,016,379 |
| Wellington City | 930,453 |
| Dunedin City | 919,477 |
| Palmerston North City | 663,936 |
| Invercargill City | 643,006 |
| Waimairi County | 592,245 |
| Mount Roskill Borough | 586,857 |
| Hamilton City | 529,535 |
| Hutt County | 494,824 |
| New Plymouth Borough | 380,585 |
| Napier Borough | 375,763 |
| Wanganui City | 370,959 |
| Hastings Borough | 347,748 |
| Whangarei Borough | 338,836 |
| Timaru Borough | 328,035 |
| Takapuna Borough | 326,317 |
| Gisborne Borough | 315,002 |
| Mount Wellington Road District | 303,66 |
| Nelson City | 294,263 |
| Upper Hutt Borough | 287,131 |
| Rotorua Borough | 269,959 |
| Makara County | 267,765 |
| Onehunga Borough | 234,838 |
| Heathcote County | 194,964 |
| Masterton Borough | 190,474 |
| New Lynn Borough | 186,631 |
| Blenheim Borough | 182,596 |
| Ashburton Borough | 170,600 |
| Manurewa Borough | 165,871 |
| One Tree Hill Borough | 165,462 |
| Papatoetoe Borough | 163,287 |
| Mount Albert Borough | 151,486 |
| Levin Borough | 148,749 |
| Riccarton Borough | 142,100 |
| Johnsonville Town District | 137,546 |
| Otahuhu Borough | 128,821 |
| Birkenhead Borough | 125,932 |
| Mount Eden Borough | 125,188 |
| Oamaru, Borough | 123,843 |
| Foxton Borough | 123,179 |
| Westport Borough | 104,132 |
| Green Island Borough | 101,714 |
| Te Awamutu Borough | 100,582 |
Building Permits in Rural Districts.—In view of the widespread interest evinced in building statistics, particularly in regard to housing, a collection of data from counties was inaugurated in the year ended 31st March, 1938. For some years building statistics had been obtained from the counties of Hutt, Makara, Waimairi, and Heathcote, and the two road districts (Mount Wellington and Panmure Township) of Eden County. The great majority of the population in these counties and road districts is urban, and they were included in order to obtain more complete statistics of building activity for the urban areas of Auckland, Wellington, and Christchurch.
The collection for rural districts was therefore confined to the remaining counties, with the exception of three (Taupo, Sounds, and Fiord) in which the Counties Act is not in operation. Road Boards are functioning within Sounds County and on Waiheke Island, and these were included in the collection. Most rural districts were able to supply the information required, which, in their case, was limited to the number of private dwellings and the total value of all buildings. In the few instances where counties were unable to furnish reliable building data for 1947–48, the Building Controller'S authorizations have been incorporated in the statistics. The use of these figures will result in a slight overstatement if any authorizations are not proceeded with, but for the first time complete coverage has been obtained for rural districts.
Data are available for all Government building in rural districts and have been included in the total for rural building.
Excluding the four counties and two road districts which are included in urban districts, the total of rural building amounted to £5,720,655 in 1946–47 and £7,888,516 in 1947–48. The number of new dwellings included was 3,360 and 4,194 respectively. The following table arranges counties with building values of over £100,000 in 1946–47 and 1947–48 in descending order.
| 1946–47 | |
| County. | £ |
| Kairanga | 532,156 |
| Waitemata | 515,509 |
| Manukau | 494,353 |
| Hawkes Bay | 304,116 |
| Southland | 302,936 |
| Waimea | 259,575 |
| Tauranga | 200,504 |
| Waipa | 168,445 |
| Waikato | 154,354 |
| Matamata | 136,072 |
| Rotorua | 123,399 |
| Rangitikei | 122,907 |
| Marlborough | 105,573 |
| Horowhenua | 102,150 |
| Whakatane | 100,243 |
| 1947–48 | |
| County. | £ |
| Waitemata | 583,568 |
| Manukau | 562,142 |
| Southland | 430,903 |
| Taupo | 325,533 |
| Waimea | 318,375 |
| Hawkes Bay | 267,465 |
| Waipa | 248,390 |
| Tauranga | 238,451 |
| Matamata | 236,267 |
| Rotorua | 162,413 |
| Franklin | 156,950 |
| Whakatane | 152,896 |
| Waikato | 152.255 |
| Whangarei | 151,519 |
| Inangahua | 142,740 |
| Ashburton | 127,530 |
| Clutha | 119,472 |
| Horowhenua | 112,433 |
| Marlborough | 111,543 |
| Paparua | 108,922 |
| Mangonui | 104,798 |
| Rodney | 102,155 |
The total value of building for the four counties and three road districts included in the total for urban districts in 1946–47 was £2,386,502, and the number of new dwellings 1,160. Mount Roskill Road District was created a borough on 29th September, 1947, and the total value in 1947–48 for the four counties and two remaining road districts was £1,866,811, the number of new dwellings being 964.
State Building Operations.—The erection of houses by the Housing Division of the Works Department was commenced in March, 1937, with 22 units in Wellington City. Details for each year are as follows.
| Year. | Urban Districts. | Rural Districts. | Grand Total. | ||
|---|---|---|---|---|---|
| Single-unit Dwellings. | Multiple Dwellings.* | Total Units. | Total Units. | ||
* Including blocks of flats. | |||||
| 1936–37 | 22 | 22 | 22 | ||
| 1937–38 | 1,638 | 125 | 1,890 | 5 | 1,895 |
| 1938–39 | 2,621 | 379 | 3,432 | 13 | 3,445 |
| 1939–40 | 2,768 | 512 | 3,840 | 30 | 3,870 |
| 1940–41 | 2,233 | 599 | 3,486 | 84 | 3,570 |
| 1941–42 | 1,421 | 442 | 2,546 | 59 | 2,605 |
| 1942–43 | 157 | 46 | 283 | 85 | 368 |
| 1943–44 | 1,315 | 238 | 1,845 | 71 | 1,916 |
| 1944–45 | 2,056 | 496 | 3,194 | 61 | 3,255 |
| 1945–46 | 1,796 | 349 | 2,623 | 252 | 2,875 |
| 1946–47 | 2,031 | 285 | 2,603 | 166 | 2,769 |
| 1947–48 | 2,111 | 265 | 2,651 | 414 | 3,065 |
The total of 2,769 units for 1946–47 comprised 2,193 single-unit houses, 286 double-unit houses, and 1 four-unit house. The total of 3,065 units for 1947–48 comprised 2,525 single-unit houses, 260 double-unit houses, and 5 four-unit houses. Houses are also erected by the Maori Affairs Department under its various development schemes, particulars of which will be found in Section 17C.
In addition to the above schemes, dwellings are erected by or for the Works Department, Railways Department, Mines Department, Education Department, &c.
In all, a total of 3,068 Government houses (2,634 in urban and 434 in rural districts) were commenced in 1946–47 and 3,510 (2,933 in urban and 577 in rural districts) in 1947–48.
The following table shows urban districts in which twenty or more houses were commenced during 1946–47 and 1947–48 by the various Government Departments concerned.
| — | New Dwellings. | |
|---|---|---|
| 1946–47. | 1947–48. | |
| Cities and boroughs— | ||
| Whangarei | 34 | 40 |
| Takapuna | 22 | 43 |
| New Lynn | 44 | 24 |
| Auckland City | 297 | 324 |
| Mount Albert | 57 | |
| Mount Eden | 32 | |
| One Tree Hill | 20 | 20 |
| Mount Roskill | 177 | 171 |
| Onehunga | 39 | 40 |
| Otahuhu | 26 | |
| Huntly | 36 | |
| Ngaruawahia | 20 | |
| Hamilton City | 57 | 120 |
| Thames | 28 | |
| Rotorua | 48 | 49 |
| Gisborne | 54 | 64 |
| Napier | 52 | 70 |
| Hastings | 42 | 57 |
| Waipukurau | 20 | |
| New Plymouth | 43 | 70 |
| Wanganui City | 35 | 55 |
| Foxton | 56 | |
| Palmerston North City | 87 | 83 |
| Lower Hutt City | 491 | 384 |
| Wellington City | 75 | 43 |
| Masterton | 39 | 36 |
| Blenheim | 25 | |
| Nelson City | 22 | 33 |
| Westport | 30 | 34 |
| Kaiapoi | 35 | |
| Riccarton | 25 | 26 |
| Christchurch City | 181 | 194 |
| Ashburton | 23 | |
| Timaru | 32 | 64 |
| Oamaru | 21 | |
| Dunedin City | 108 | 103 |
| Invercargill City | 45 | 41 |
| Others | 331 | 334 |
| Total | 2,555 | 2,776 |
| Independent town districts— | ||
| Johnsonville | 25 | 31 |
| Others | 38 | 34 |
| Total | 63 | 65 |
| Dependent town districts | 11 | 15 |
| Counties— | ||
| Hutt | 55 | |
| Others | 5 | 22 |
| Total | 5 | 77 |
| Total, urban districts | 2,634 | 2,933 |
Rural districts in which the number was twenty or more were, in 1946–47, Manukau County (101), Matamata County (20), Rotorua County (26), Whakatane County (20), and Mackenzie County (50), and in 1947–48, Rotorua County (28), Taupo County (177), Whakatane County (26), and Mackenzie County (25).
In addition to the 3,068 houses (value, £4,505,810) commenced in 1946–47, 47 new business premises, &c. (value, £173,554) were commenced. Alterations and additions amounted to £283,497. The total value of all State building operations covered in these statistics in 1946–47 was, therefore, £5,262,861.
In 1947–48, in addition to the 3,510 houses (value, £5,780,681), 84 new business premises, &c. (value, £562,605) were commenced. Alterations and additions amounted to £547,732 and the total value of all State building operations was £6,891,018.
Monthly Permit Statistics.—While the annual statistics of building permits issued afford an indication of year-to-year changes in the value and volume of building activity, short-period movements in building activity are of considerable interest, particularly in times of rapid economic change. With the purpose of providing information as to current changes in building activity, the Census and Statistics Department initiated in 1926 the collection of monthly statistics of building permits issued in the larger centres. These returns cover a little over half the total population but represent a considerably higher proportion of the total New Zealand building.
BUILDING PERMITS IN LARGER CENTRES
| Month. | Alterations to Existing Buildings. | New Buildings. | Totals. | |||||
|---|---|---|---|---|---|---|---|---|
| Dwellings only. | Totals. | |||||||
| No. | Value. | No. | Value. | No. | Value. | No. | Value. | |
| 1946 | £ | £ | £ | £ | ||||
| April | 978 | 201,648 | 562 | 855,099 | 595 | 1,182,133 | 1,573 | 1,383,781 |
| May | 1,328 | 229,660 | 643 | 968,984 | 678 | 1,120,782 | 2,006 | 1,350,442 |
| June | 1,005 | 161,351 | 535 | 815,337 | 578 | 1,049,762 | 1,583 | 1,211,113 |
| July | 1,219 | 342,481 | 769 | 1,195,208 | 816 | 1,463,512 | 2,035 | 1,805,993 |
| August | 1,184 | 224,023 | 586 | 903,815 | 651 | 1,043,175 | 1,835 | 1,267,198 |
| September | 1,074 | 198,355 | 652 | 996,835 | 697 | 1,144,588 | 1,771 | 1,342,943 |
| October | 1,139 | 272,653 | 582 | 921,046 | 617 | 1,014,416 | 1,756 | 1,287,069 |
| November | 947 | 194,516 | 479 | 736,562 | 536 | 976,200 | 1,483 | 1,170,716 |
| December | 905 | 449,050 | 505 | 804,646 | 533 | 984,517 | 1,438 | 1,433,567 |
| 1947 | ||||||||
| January | 775 | 139,459 | 531 | 824,216 | 559 | 1,059,938 | 1,334 | 1,199,397 |
| February | 827 | 289,055 | 539 | 853,877 | 577 | 944,661 | 1,404 | 1,233,716 |
| March | 1,072 | 295,712 | 654 | 1,035,988 | 692 | 1,342,865 | 1,764 | 1,638,577 |
| April | 982 | 220,578 | 601 | 989,049 | 629 | 1,155,285 | 1,611 | 1,375,863 |
| May | 1,110 | 245,153 | 647 | 1,071,965 | 685 | 1,157,747 | 1,795 | 1,402,900 |
| June | 1,015 | 200,144 | 603 | 986,827 | 640 | 1,116,952 | 1,655 | 1,317,096 |
| July | 1,075 | 235,590 | 512 | 881,483 | 556 | 1,053,762 | 1,631 | 1,289,352 |
| August | 853 | 159,800 | 506 | 851,697 | 534 | 1,280,864 | 1,387 | 1,440,664 |
| September | 1,218 | 236,443 | 728 | 1,211,099 | 760 | 1,356,760 | 1,978 | 1,593,203 |
| October | 1,204 | 198,082 | 633 | 1,049,396 | 674 | 1,163,876 | 1,878 | 1,361,958 |
| November | 1,120 | 210,501 | 651 | 1,100,390 | 674 | 1,134,264 | 1,794 | 1,344,765 |
| December | 1,048 | 144,650 | 422 | 701,206 | 442 | 731,374 | 1,490 | 876,024 |
| 1948 | ||||||||
| January | 806 | 218,036 | 478 | 826,163 | 502 | 915,172 | 1,308 | 1,133,208 |
| February | 988 | 192,275 | 656 | 1,148,042 | 690 | 1,271,285 | 1,678 | 1,463,560 |
| March | 1,112 | 277,507 | 722 | 1,106,131 | 771 | 1,479,341 | 1,883 | 1,756,848 |
| April | 1,132 | 223,341 | 647 | 1,143,268 | 675 | 1,325,191 | 1,807 | 1,548,532 |
| May | 1,223 | 267,796 | 640 | 1,115,652 | 663 | 1,379,191 | 1,886 | 1,646,987 |
| June | 1,209 | 234,550 | 595 | 1,044,177 | 611 | 1,072,141 | 1,820 | 1,306,691 |
| July | 1,168 | 263,282 | 610 | 1,059,830 | 638 | 1,152,497 | 1,806 | 1,415,779 |
| August | 1,176 | 249,272 | 603 | 1,060,648 | 634 | 1,494,048 | 1,810 | 1,743,320 |
| September | 1,128 | 263,441 | 671 | 1,188,135 | 710 | 1,257,050 | 1,838 | 1,520,491 |
| October | 1,117 | 251,681 | 625 | 1,106,457 | 655 | 1,332,250 | 1,772 | 1,583,931 |
Table of Contents
THE legislation relating to the custody, administration, and audit of the public moneys and securities is contained in the Public Revenues Act, 1926, which consolidated and amended the then existing enactments on the subject. All public moneys, excepting those payable to or received by the Post and Telegraph Department, the Government Insurance Department, the Public Trust Office, the Maori Trust Office, the State Advances Corporation, the State Fire and Accident Insurance Office, the Government Superannuation Fund, the National Provident Fund, the Broadcasting Account, the Iron and Steel Industry Account, the Meat Industry Account, the Marketing Account, and other special accounts under the Marketing Act, are paid into one account at the bank called the “Public Account,” and are carried to one or other of the following funds or accounts in the books of the Treasury: The Consolidated Fund, the Public Works Account, and separate accounts or funds specially created, including the Social Security Fund and the War Expenses Account. The War Expenses Account was brought into being in September, 1939, and another' subsidiary account, the War Damage Fund, was established in 1941. This fund-was replaced in January, 1945, by the Earthquake and War Damage Fund under the Earthquake and War Damage Act, 1944. The National Development Loans Account was initiated from 1st April, 1942, for the purpose of co-ordinating and simplifying the raising of loan-moneys for public works and other capital purposes. The Electric Supply Sinking Fund Account was abolished as from 31st March, 1944, while the New Zealand Loans Amendment Act, 1947, provided for the abolition of the Public Debt Repayment Account and its incorporation in the Loans Redemption Account from 1st April, 1947. The separate accounts were further reduced by the Finance Act, 1947, and Finance Act (No. 2), 1947, which abolished the Bank of New Zealand Shares Account, and the Main Highways Account respectively, both as from the 1st April, 1947. The Air Defence Fund was created in June, 1948, while the State Forest Account was abolished from the 1st April, 1948, by the Forest Amendment Act, 1948.
The financial year commences on the 1st day of April and ends on the 31st day of March. The receipts of any financial year represent the money received into the Public Account at the bank at Wellington within the year, together with that received into the Public Account at London of which advice is received in time for inclusion in the accounts for the year. The payments represent the money paid (a) at the Treasury within the year, (b) by imprestees, of which accounts are received at the Treasury within the year, and (c) at London, of which advice is received in time for inclusion. The Public Account, formerly held at the Bank of New Zealand, was taken over by the Reserve Bank of New Zealand from 1st August, 1934.
At the end of each financial year the Appropriation Act of that year lapses, but the Minister of Finance is authorized for a period of three months from the commencement of the next financial year to pay money in respect of any service, provided that the amount does not exceed the unexpended balance voted for that purpose in the previous year, together with an amount equal to one-fourth of such vote.
The normal practice is for Parliament to meet at the end of June in each year and to vote supplies from month to month until the estimated expenditure for the year has been approved and the annual Appropriation Act is passed. Where a later session of Parliament is foreseen, a temporary amendment to the provisions set out in the preceding paragraph is made. In the event of a mid-session adjournment, supplies in anticipation of the Appropriation Act may be voted for more than one month.
AUDIT OF EXPENDITURE.—In the audit of expenditure both the pre-audit and post-audit systems are in operation. Pre-audit is applied to vouchers in respect of payments on account of salaries of new appointees; officers claiming more than one month'S salary at any time; interest, loan transactions, and return of deposits; unauthorized expenditure; transfers between Government accounts; or expenditure chargeable against the accounts of local authorities. Post-audit is applied to all other payments.
Vouchers must be certified as correct by the proper officer, and forwarded by him to the head of his Department for approval. Vouchers subject to pre-audit are then forwarded to the Audit Office, and on being found correct are sent on to the Treasury to be entered on requisitions for payment. Vouchers subject to post-audit are transmitted by the head of the Department direct to the Treasury. Payment is made by the Treasury, and the claim is afterwards submitted for audit.
INCOME AND EXPENDITURE.—A system of departmental balance-sheets and statements of accounts was inaugurated on commercial lines in 1920 to show the true cost of the various Departments and services, as distinct from payments out of appropriations on the basis referred to at the beginning of this subsection. These balance-sheets and statements of accounts were published annually in Parliamentary Paper B–1 [Part IV], to which the reader is referred for details of income, expenditure, &c., in respect of certain Departments and services. The publication of these detailed accounts for a number of Departments has now been discontinued.
For a number of years up to and including the financial year 1937–38 statements of income and expenditure, combining the revenue accounts of most Government Departments, and a State balance-sheet, were published. For various reasons the preparation of these documents for years subsequent to 1937–38 has been suspended.
ACCOUNTS AND FUNDS WITHIN THE PUBLIC ACCOUNT.—The records of the Public Account in the books of the Treasury consist of a number of ledger accounts for the special subsidiary funds or accounts including the Consolidated Fund, the Public Works Account, the Social Security Fund, the War Expenses Account, and a number of other accounts established by statute or kept by Treasury under authority of the Public Revenues Act, “to make better provision for accounting for moneys in the Public Account.” In these accounts are recorded for each separate fund or account the receipts, payments, and cash balances so that the bank balance in the Public Account is apportioned among the funds and accounts, and balanced itemized statements of the receipts and payments for each of the funds or accounts are prepared for publication.
The use of the terms “fund” and “account” implying some significant distinction is hardly justified. For all practical purposes the term “Consolidated Fund” is synonymous with “Ordinary Revenue Account” although interpreted strictly the Consolidated Fund also includes “Deposits Account.” The use of the term “Social Security Fund,” for example, does not imply any technical accounting distinction between the Social Security Fund and the Public Works Account or the other accounts within the Public Account.
In addition to those mentioned above, the following accounts and funds were included in the Public Account during the financial year ended 31st March, 1948: Earthquake and War Damage Fund, Electric Supply Account, Land for Settlements Account, Loans Redemption Account, National Development Loans Account, Remittances to London Account, Reserve Fund Account, State Coal-mines Account, State Forests Account, Working Railways Account. As from the 1st April, 1948, the State Forests Account has been abolished, while from June, 1948, the Air Defence Fund Account was created:
Particulars of some of the more important accounts are contained in the following pages, while others are dealt with in the appropriate Sections of this volume. Certain of the accounts represent book entries only. For instance, practically the whole of the receipts and payments of the Loans Redemption Account are nominal, consisting in the main of entries due to the renewal of loan-moneys. The Remittances to London Account merely covers the withdrawal of money in Wellington for remittance from New Zealand, and its crediting to the New Zealand Public Account, London. The Deposits Account represents only lodgments or withdrawals of (mainly) non-Government moneys.
The figures shown under the various headings of this Subsection are on the basis of receipts and payments. In some Sections devoted to the operations of various Departments and activities, the figures are given on an income and expenditure basis and accordingly differ to some extent from those appearing here. In addition, the figures now given will differ in some instances from those presented in issues of the Year. Book prior to the 1946 issue. This is accounted for by changes in the mode of presentation of the public accounts, whereby certain interest and other payments, which formerly ranked as credits in reduction of expenditure, are now treated as receipts, and the figures may be described as being on a gross basis. This change in the mode of presentation was not brought into full operation until 1st April, 1946, but in order to show the various accounts on a uniform basis, back years have been adjusted to bring them into line with present practice.
THE CONSOLIDATED FUND.—The ordinary Revenue Account of the Consolidated Fund covers the ordinary revenue and expenditure of the General Government—i.e., apart from capital items, commercial and special undertakings, advances, &c. Until comparatively recent years its operations afforded an excellent comparison of State revenue and expenditure from year to year, but successive changes in system have largely destroyed the comparability of the figures.
Figures of receipts and payments of the Consolidated Fund over a long period of years will be found in the Statistical Summary near the end of this volume. For the years prior to 1937–38 they are there presented on the old basis—i.e., they have not been adjusted in accordance with the changes referred to earlier.
A summary of receipts and payments for the last eleven years is contained in the following table. Payments for 1941–42, 1942–43, 1943–44, 1944–45, 1946–47, and 1947–48 do not include amounts of £1,726,000, £1,672,000, £4,200,000, £2,200,000, £4,611,000, and £1,786,000 respectively allocated to the War Expenses Account from surplus funds.
| Year ended 31st March, | Receipts. | Payments. | Surplus. |
|---|---|---|---|
| £ | £ | £ | |
| 1938 | 44,809,606 | 43,998,784 | 810,822 |
| 1939 | 43,698,635 | 42,889,267 | 809,368 |
| 1940 | 46,919,491 | 46,600,152 | 319,339 |
| 1941 | 50,980,577 | 49,254,153 | 1,726,424 |
| 1942 | 54,552,701 | 52,880,239 | 1,672,462 |
| 1943 | 55,075,960 | 50,921,382 | 4,154,578 |
| 1944 | 57,561,409 | 55,328,829 | 2,232,580 |
| 1945 | 59,928,872 | 58,714,153 | 1,214,719 |
| 1946 | 63,913,649 | 62,659,499 | 1,2.04,150 |
| 1947 | 108,294,473 | 103,683,455 | 4,611,018 |
| 1948 | 117,116,115 | 115,330,403 | 1,785,712 |
Receipts.—Details of receipts of the Consolidated Fund are given in the next table. Taxation receipts represent only those amounts paid into the Consolidated Fund, and there are substantial amounts of special taxation which are paid to the Social Security Fund and, prior to 1st April, 1946, to the War Expenses Account. Full details of taxation receipts are contained in Subsection B.
| Source. | 1945–46. | 1946–47. | 1947–48. |
|---|---|---|---|
| £ | £ | £ | |
| Taxation— | |||
| Customs | 8,800,016 | 15,718,983 | 24,390,881 |
| Beer duty | 2,308,600 | 4,251,509 | 4,404,051 |
| Sales tax | 4,505,443 | 15,550,547 | 15,945,813 |
| Film-hire tax | 134,472 | 134,918 | 111,155 |
| Highways | 2,324,068 | 2,972,036 | 3,543,954 |
| Stamp duties | 2,802,089 | 9,549,709 | 9,382,555 |
| Land-tax | 937,395 | 939,559 | 854,456 |
| Income-tax | 26,465,912 | 32,085,057 | 36,632,581 |
| National Security tax | 9,404,220 | 772,029 | |
| Miscellaneous | 92,723 | 108,854 | 61,678 |
| Interest on capital liability— | |||
| Railways | 1,059,473 | 100,003 | |
| Post and Telegraph | 712,973 | 738,996 | 746,316 |
| Other accounts | 1,727,779 | 1,355,514 | 2,017,935 |
| Interest on Public Debt Redemption Fund | 355,560 | 358,295 | 300,724 |
| Interest on other public moneys | 2,001,479 | 2,161,292 | 1,937,753 |
| Profits on trading undertakings | 1,124,032 | 1,489,336 | 2,171,755 |
| Departmental receipts | 8,043,345 | 11,375,645 | 13,840,709 |
| Other receipts | 518,290 | 1,770 | |
| Totals | 63,913,649 | 108,294,473 | 117,116,115 |
The increase in the receipts of the Consolidated Fund in 1946–47 and 1947–48 as compared with 1945–46, was mainly due to the inclusion of taxation receipts formerly credited to the War Expenses Account.
Payments.—Payments from the Consolidated Fund are divided into two main groups, according to whether they are made under permanent or under annual appropriation. The latter heading covers the payments under the various departmental votes, while the former covers interest on and amortization of the public debt, disposal of special taxation for main highways, and payments under numerous special Acts. Prior to the financial year 1943–44 the premium on, or cost of exchange on, moneys remitted abroad was charged to a separate item and ranked as a permanent appropriation. The cost of exchange has since been treated as part of the payment from which it arises.
Payments under the main heads of permanent appropriation and each head of annual appropriation during the last three years were as follows:—
| Head. | 1945–46. | 1946–47. | 1947–48. |
|---|---|---|---|
| £ | £ | £ | |
| Permanent appropriations— | |||
| Civil List | 95,441 | 97,033 | 101,724 |
| Debt services— | |||
| Interest | 18,584,434 | 17,558,876 | 17,825,052 |
| Amortization | 3,964,184 | 4,748,499 | 8,577,223 |
| Administration and management | 247,760 | 207,994 | 210,064 |
| Distribution of motor-taxation receipts— | |||
| Transfer to Main Highways Account | 2,174,628 | 2,758,128 | |
| Payment to boroughs, &c. | 144,502 | 197,483 | 219,281 |
| Transfer to War Expenses Account | 3,000,000* | 2,055,000* | |
| Other items | 807,232 | 362,648 | 332,908 |
| 26,018,181 | 28,930,711 | 29,321,252 | |
| Annual appropriations— | |||
| Legislative | 130,154 | 138,676 | 152,506 |
| Prime Minister'S Department | 41,500 | 119,262 | 156,966 |
| External Affairs | 230,300 | 395,570 | 673,909 |
| Treasury | 146,542 | 179,175 | 309,710 |
| Stabilization | 14,539,431 | 14,621,917 | |
| Customs | 206,778 | 247,807 | 272,086 |
| Land and Income Tax | 463,863 | 543,828 | 560,749 |
| Stamp Duties | 179,159 | 148,067 | 169,458 |
| Audit | 90,977 | 105,962 | 104,311 |
| Public Service Commission | 29,336 | 41,130 | 63,872 |
| Internal Affairs | 830,412 | 1,154,957 | 3,184,825 |
| Island Territories | 384,874 | 430,801 | 652,875 |
| Printing and Stationery | 352,725 | 423,959 | 669,451 |
| Marine | 306,880 | 418,526 | 434,283 |
| Labour and Employment† | 134,797 | 222,882 | 935,873 |
| Maori Affairs | 310,745 | 429,248 | 463,807 |
| Valuation | 84,470 | 131,976 | 171,276 |
| Electoral | 28,409 | 168,292 | 35,257 |
| Census and Statistics | 76,322 | 137,135 | 75,557 |
| National Service | 370,813 | 619 | |
| National Employment Service | 186,995 | 671,018 | |
| Rehabilitation | 294,571 | 398,645 | 373,330 |
| Justice and Prisons | 423,161 | 480,979 | 554,872 |
| Crown Law | 10,260 | 12,662 | 12,971 |
| Police | 739,461 | 1,044,953 | 968,836 |
| Navy | 1,309,869 | 1,736,627 | |
| Army | 2,840,749 | 3,470,245 | |
| Air | 2,955,930 | 4,175,219 | |
| Maintenance of Public Works and Services | 4,218,910 | 5,281,124 | 6,405,234 |
| Highways maintenance | 3,404,081 | ||
| Organization for National Development | 14,913 | ||
| Lands and Survey | 602,885 | 726,343 | 1,184,258 |
| Agriculture | 1,495,063 | 1,450,342 | 1,609,709 |
| Industries and Commerce | 1,193,615 | 513,074 | 1,276,855 |
| Tourist and Health Resorts | 308,522 | 359,767 | 452,738 |
| Scientific and Industrial Research | 416,131 | 580,882 | 715,005 |
| Mines | 95,493 | 118,233 | 107,166 |
| Transport | 135,593 | 184,455 | 220,849 |
| Health | 3,031,549 | 3,409,844 | 4,718,733 |
| Mental Hospitals | 940,166 | 1,072,130 | 1,243,332 |
| Education | 6,650,695 | 7,712,490 | 8,883,246 |
| War and other Pensions | 4,199,521 | 4,735,185 | 4,688,312 |
| Payment to Social Security Fund | 7,000,000 | 18,000,000 | 16,000,000 |
| National Provident and Friendly Societies | 112,459 | 117,118 | |
| Other Services not provided for | 172,299 | 809,649 | 68,845 |
| Totals, annual appropriations | 36,641,318 | 74,752,744 | 86,009,151 |
| Grand totals | 62,659,499 | 103,683,455 | 115,330,403 |
As stated earlier, taxation formerly credited to the War Expenses Account was in 1946–47 and 1947–48 paid to the Consolidated Fund, and, per contra, certain expenditure previously charged to the War Expenses Account was met from the Consolidated Fund. Votes coming within this category are Stabilization (£14,539,431 in 1946–47, and £14,621,917 in 1947–48) and Navy, Army, and Air, expenditure of these three votes being £7,106,548 in 1946–47, and £9,382,091 in 1947–48. Also amounts transferred to the Social Security Fund were £18,000,000 in 1946–47, and £16,000,000 in 1947–48, as compared with only £7,000,000 in 1945–46. The items mentioned accounted for £35,645,979 of the increase of £41,023,956 in the total expenditure of the Consolidated Fund in 1946–47 as compared with 1945–46.
The amounts shown under the head of “Education” do not represent the full payment on education services, expenditure under special Acts and from the revenue from certain endowments, &c., not being included. A statement of public expenditure on education is given in Section 6 (Education) of this volume.
PUBLIC WORKS.—For the prosecution of the policy of public works inaugurated in 1870 there was set up a Public Works Fund. For many years all expenditure on public works was borne by this fund, but in course of time separate subsidiary accounts were established to deal with certain special activities. These subsidiary accounts became merged in the General Purposes Account of the Public Works Fund, or ceased to exist on the completion of the work for which they were called into existence. Under section 4 of the Finance Act No. 2, 1943, the Public Works Fund was abolished and a Public Works Account substituted as from 1st April, 1942. The Electric Supply Account and the Electric Supply Sinking Fund Account, which formerly ranked as part of the Public Works Fund, were then shown as separate accounts. The Electric Supply Sinking Fund Account was abolished as from the 31st March, 1944.
The Construction Fund of the Main Highways Account, which was established in 1923–24 to provide finance for the construction, reconstruction, &c., of main highways, was analogous to the Public Works Fund, and its operations were for some years included in the Year-Book statement of public-works receipts and payments. The Construction Fund of the Main Highways Account was later (1st April, 1936) combined with the Revenue Fund, and the figures of public-works receipts and payments quoted below for 1945–46 and 1946–47 are exclusive of operations of the Main Highways Account. With the abolition of the Main Highways Account as from the 1st April, 1947, however, receipts and expenditure on highways construction have been incorporated in the Public Works Account, and are accordingly shown in the 1947–48 amounts given below.
Receipts.—A summary of receipts of the Public Works Account for the last three financial years is contained in the following table.
| — | 1945–46. | 1946–47. | 1947–48. |
|---|---|---|---|
| £ | £ | £ | |
| Linen-flax, sale of produce and disposal of assets | 577,018 | 442,238 | 142,911 |
| Receipts—Education Department | 5,068 | 507,725 | 52,106 |
| Highways construction | 22,226 | ||
| Housing construction | 441,672 | 763,277 | 673,507 |
| Irrigation, water-supply, and drainage | 115,661 | 190,893 | 72,992 |
| Lands, miscellaneous | 45 | 93,219 | |
| Lighthouses and harbour-works | 2,182 | 318 | 4,465 |
| Public buildings | 112,419 | 274,121 | 359,719 |
| Railway construction | 45,831 | 50,972 | 37,444 |
| Roads, &c. | 4,267 | 8,885 | 7,722 |
| Soil conservation and rivers control | 90,121 | 74,628 | 75,180 |
| Loan-money | 6,872,000 | 7,000,000 | 11,400,000 |
| Miscellaneous | 27,577 | 33,980 | 31,528 |
| Totals | 8,293,861 | 9,347,037 | 12,973,019 |
Payments.—Particulars of payments from the account for the three financial years 1945–46 to 1947–48 are now given. Expenditure on highways construction was included in the Main Highways Account until its abolition as from 1st April, 1947.
| — | 1945–46. | 1946–47. | 1947–48. |
|---|---|---|---|
* Includes item of £117,000 on account of Tasman Empire Airways, Ltd., and £150,000 for New Zealand Woolpacks and Textiles, Ltd., under authority of the Finance Act (No. 2), 1939, and Finance Act, 1940, respectively. | |||
| £ | £ | £ | |
| Linen flax, development | 403,809 | ||
| Housing construction | 5,709,995 | 6,193,779 | 6,638,991 |
| Irrigation, water-supply, and drainage | 390,313 | 482,861 | 417,312 |
| Lands, miscellaneous | 59,691 | ||
| Lighthouses and harbour-works | 11,593 | 13,181 | 9,803 |
| Public buildings | 665,264 | 715,889 | 2,136,422 |
| Educational buildings | 1,187,823 | 992,275 | 1,065,870 |
| Railway construction | 308,050 | 231,272 | 122,776 |
| Roads, &c. | 171,604 | 227,426 | 325,534 |
| Soil conservation and rivers control | 212,271 | 270,864 | 326,914 |
| Highways construction | 1,333,303 | ||
| Other | 140 | 12,431 | 267,029* |
| Totals | 9,120,553 | 9,139,978 | 12,643,954 |
In addition to expenditure on roads from the Public Works Account, there is expenditure incurred in roading Crown lands and lands purchased for settlement, which is a charge on the Land for Settlements Account.
ELECTRIC SUPPLY ACCOUNT.—As from 1st April, 1942, the Electric Supply Account, which formerly ranked as part of the Public Works Fund, became a separate account. The main items of receipts and payments of the Electric Supply Account for the last three years were as follows:—
| — | 1945–46. | 1946–47. | 1947–48. |
|---|---|---|---|
| Receipts | |||
| £ | £ | £ | |
| Loan-money | 2,920,000 | 4,000,000 | 5,500,000 |
| Sales of electrical energy | 2,761,145 | 3,058,721 | 3,128,610 |
| Miscellaneous receipts | 145,212 | 184,415 | 250,709 |
| Totals | 5,826,357 | 7,243,136 | 8,879,319 |
| Payments | |||
| £ | £ | £ | |
| Development of water-power, &c. | 4,341,199 | 6,007,448 | 6,942,338 |
| Interest on capital liability | 883,747 | 750,778 | 1,153,027 |
| Debt redemption | 134,538 | 137,042 | 173,742 |
| Taxation— | |||
| Income-tax | 348,317 | 203,098 | 144,076 |
| Social security charge | 30,143 | 30,567 | 21,684 |
| National security tax | 45,214 | 10,189 | |
| Totals | 5,783,158 | 7,139,122 | 8,434,867 |
LAND-SETTLEMENT ACCOUNTS.—Through the closing of several accounts and the merging of these in other accounts or funds, there now remains only one account dealing primarily with land-settlement—viz., the Land for Settlements Account, which covers numerous and diverse activities in connection with land-settlement.
The principal advances accounts, those relating to State advances to settlers, workers, &c., are, as stated earlier in this Subsection, outside the Public Account, and are not included here.
A statement of receipts and payments of the Land for Settlements Account during the last three years is as follows:—
| — | 1945–46. | 1946–47 | 1947–48. |
|---|---|---|---|
| Receipts | |||
| £ | £ | £ | |
| Loan-money | 1,500,000 | 1,500,000 | 1,700,000 |
| Sales and capital receipts | 326,848 | 349,690 | 344,879 |
| Rent and interest | 382,588 | 384,493 | 378,895 |
| Capital receipts: Development of small farms | 327,048 | 865,328 | 684,998 |
| Receipts under Maori Housing Act, 1935 | 29,890 | 40,323 | 58,971 |
| Receipts from development schemes— | |||
| Maori-land settlement | 707,920 | 663,387 | 890,193 |
| Small farms | 741,139 | 946,171 | 1,438,006 |
| Grants from Consolidated Fund— | |||
| Maori-land settlement | 100,000 | 193,000 | 160,000 |
| Small farms | 8,486 | 459,239 | 309,942 |
| Sales of produce, live-stock, and miscellaneous receipts | 13,286 | 32,090 | 138,290 |
| Totals | 4,137,205 | 5,433,721 | 6,104,174 |
| Payments | |||
| £ | £ | £ | |
| Land for settlements | 47,850 | 49,234 | 47,128 |
| Small farms development | 3,168,722 | 3,516,744 | 4,039,625 |
| Maori-land settlement | 929,027 | 1,046,899 | 1,195,452 |
| Interest and other charges on loans | 427,071 | 352,439 | 437,844 |
| Charges on proceeds of sales of lands | 176,604 | 11,631 | 72,532 |
| Other | 45,917 | 3,668 | |
| Totals | 4,749,274 | 5,022,864 | 5,796,249 |
The increase in expenditure during recent years is due to the acquisition and development of land for the repatriation of discharged servicemen per medium of the small-farms scheme.
TRADING ACCOUNTS.—Several important trading operations of the Government are outside the scope of the Public Account, while certain others are included in the Consolidated Fund. The Electric Supply Account also covers both construction and trading operations. Trading accounts, other than those which might be so regarded but have already been dealt with under previous headings, are as follows:—
Working Railways Account.
State Coal-mines Account.
State Forests Account (abolished from 1st April, 1948).
The receipts of these three accounts during the last three years were as follows:—
| Item. | Account. | 1945–46. | 1946–47. | 1947–4.8. |
|---|---|---|---|---|
* Includes stabilization subsidy of £264,000 in 1946–47 and £640,000 in 1947–48. | ||||
| £ | £ | £ | ||
| Railway revenue, including miscellaneous receipts | Working Railways | 16,697,940 | 16,718,669* | 19,238,704* |
| Contributions and subsidy to Railway Employees' Sick Benefit Fund | Working Railways | 25,200 | 24,580 | 7,500 |
| Rents, royalties, sale of coal and wood, &c. | State Coalmines | 2,208,182 | 2,489,765 | 2,862,315 |
| Forests revenue | State Forests | 530,008 | 534,575 | 712,762 |
| Loan-money | Various | 1,501,000 | 1,620,000 | 4,260,000 |
| Interest receipts | Various | 32,546 | 68,800 | 52,459 |
| Miscellaneous receipts | Various | 76,342 | 67,382 | 77,744 |
| Totals | 21,071,218 | 21,523,771 | 27,211,484 | |
Payments during the same three years were composed of the following amounts.
| Item. | 1945–46. | 1946–47. | 1947–48. |
|---|---|---|---|
| Out of appropriations— | |||
| £ | £ | £ | |
| Working railways | 15,541,324 | 18,215,469 | 21,548,102 |
| State coal-mines | 2,605,282 | 2,595,868 | 4,216,949 |
| State forests | 857,866 | 1,338,677 | 1,693,779 |
| Interest | 1,091,318 | 100,003 | |
| Amortization of debt | 36,628 | 44,976 | 49,004 |
| Transfers to other accounts | 14,235 | 3,539 | 20,352 |
| Subsidy to Railway Employees' Sick Benefit Fund | 25,200 | 24,580 | 7,500 |
| Totals | 20,171,853 | 22,323,112 | 27,535,686 |
SOCIAL SECURITY FUND.—The Social Security Fund was established as from the 1st April, 1939, under the authority of the Social Security Act of 1938. Receipts and payments of the fund during the last three years were as follows:—
| — | 1945–46. | 1946–47. | 1947–48. |
|---|---|---|---|
| Receipts | |||
| £ | £ | £ | |
| Social security charge | 14,557,460 | 22,383,884 | 26,176,634 |
| Registration fee | 585,713 | 15,287 | |
| Penalty for late payment of fee | 24,044 | 4,410 | |
| Fines | 91 | 72 | |
| Miscellaneous receipts | 116,200 | 116,166 | 97,323 |
| Transfers from Consolidated Fund | 7,000,000 | 18,000,000 | 16,000,000 |
| Interest | 2,082 | 345 | 110 |
| Receipts due to Employment Promotion Fund | 602 | ||
| Totals | 22,286,192 | 40,520,164 | 42,274,067 |
| Payments | |||
| £ | £ | £ | |
| Administration expenses and emergency benefits | 843,546 | 838,404 | 935,740 |
| Medical, hospital, &c., benefits | 5,564,315 | 6,211,580 | 7,021,488 |
| Monetary benefits | 16,655,822 | 29,775,166 | 32,485,471 |
| Balance of maintenance moneys | 263 | 427 | |
| Services not provided for | 208 | 77 | |
| Totals | 23,063,891 | 36,825,490 | 40,443,126 |
More detailed information concerning payments under the various headings are given in Section 25 of this Year-Book.
MAIN HIGHWAYS ACCOUNT.—The Main Highways Account was concerned with the construction and maintenance of main highways and the payment of subsidies to local authorities. Its receipts consisted mainly of special taxation collected by the Consolidated Fund and paid over less certain deductions, and moneys borrowed for purposes of main highways construction. This account was abolished as from the 1st April, 1947, by the Finance Act (No. 2), 1947, receipts and payments relating to the construction of main highways thereafter being shown in the Public Works Account, and those covering maintenance in the Ordinary Revenue Account of the Consolidated Fund.
The statement of receipts and payments which follows summarizes the operations of the last three years in which the Main Highways Account was functioning.
| Item. | 1944–45. | 1945–46. | 1946–47. |
|---|---|---|---|
| Receipts | |||
| £ | £ | £ | |
| Taxation | 1,801,770 | 2,174,629 | 2,758,128 |
| Loan-money | 60,000 | 100,000 | 317,250 |
| Repayment of advances | 11,867 | 8,356 | 6,766 |
| Interest | 1,554 | 1,663 | 2,318 |
| Miscellaneous receipts | 220,057 | 173,294 | 144,389 |
| Totals | 2,095,248 | 2,457,942 | 3,228,851 |
| Payments | |||
| £ | £ | £ | |
| Main highways | 1,873,763 | 2,187,017 | 3,002,767 |
| Advances to local authorities | 968 | 12,145 | 7,716 |
| Subsidies to local authorities | 215,686 | 219,597 | 217,067 |
| Payments to local authorities in lieu of special road fees | 14,019 | 26,357 | 16,222 |
| Totals | 2,104,436 | 2,445,116 | 3,243,772 |
WAR EXPENSES ACCOUNT.—The War Expenses Account was set up under the provisions of the War Expenses Act of 1939, and all receipts and payments in connection with the war effort have been dealt with through this account. Defence expenditure was previously included as an annual appropriation of the Consolidated Fund, and upon the War Expenses Account being brought into existence the unexpended balances of the 1939–40 appropriations under this heading were transferred to the now account.
Commencing with the 1946–47 financial year, the defence vote was restored to the Consolidated Fund, and current defence expenditure has since been met from that source. Expenditure arising from or consequent upon the Second World War, however, is still paid from the War Expenses Account.
A summary of receipts and payments of the War Expenses Account for the years 1946–47 and 1947–48, with the totals since its inception to 31st March, 1948, is as follows:—
| — | 1946–47. | 1947–48. | 1939–40 to 1947–48. |
|---|---|---|---|
* For details see Subsection B. † Includes £2,287,826 unexpended balances or 1939–40 Defence appropriations. | |||
| Receipts | |||
| £ | £ | £ | |
| Loan-money | 7,964,695 | 303,367,187 | |
| National security tax* | 95,053,166 | ||
| Other war taxation* | 129,960,998 | ||
| Miscellaneous receipts | 10,588,907 | 2,565,592 | 18,258,226 |
| Transferred from Consolidated Fund | 3,000,000 | 6,666,018 | 36,251,844† |
| Transferred from marketing pool accounts | 100,854 | 477,473 | |
| Recovery of expenditure, Armed Forces foodstuffs | 885,344 | 885,344 | |
| Reciprocal aid— | |||
| Lend-lease | 1,654,554 | 106,223,953 | |
| Canadian mutual aid | 55,616 | 6,159,337 | |
| Reverse lend-lease | 725,000 | 725,000 | |
| Disposal of surplus assets | 11,071,365 | 5,425,622 | 31,245,383 |
| Allied military currency issued to Second New-Zealand Expeditionary Force overseas | 12,153 | 2,516,985 | |
| Military currency issued to occupation troops, Japan | 229,155 | 45,696 | 274,851 |
| Rehabilitation: Repayment of advances, &c. | 915,209 | 1,434,220 | 2,871,080 |
| Aeroplane fund | 162,579 | ||
| Fiji Government contribution | 168,750 | ||
| Amount received from U.S.A. Government in reimbursement for war supplies not eligible for reciprocal aid | 3,269,204 | 3,269,204 | |
| Totals | 39,586,712 | 17,022,492 | 737,871,360 |
| — | 1946–47. | 1947–48. | 1939–40 to 1947–48. |
|---|---|---|---|
| Payments | |||
| £ | £ | £ | |
| Navy | 3,985,961 | 2,271,198 | 43,343,778 |
| Army | 10,546,173 | 5,584,197 | 310,464,308 |
| Air Force | 2,603,260 | 685,862 | 148,507,315 |
| Ancillary | 5,658,876 | Cr. 409,029 | 39,380,551 |
| Rehabilitation | 4,742,478 | 5,148,443 | 14,326,294 |
| Reciprocal aid: reverse lend-lease | 1,249,865 | 82,201,517 | |
| Amortization of debt | 3,500,000 | 3,300,000 | 62,005,704 |
| Purchase of aeroplanes for Royal Air Force | 162,579 | ||
| Gratuities | 1,776,596 | 1,049,796 | 20,826,392 |
| Loss on devaluation: occupation currency | 63,359 | 63,359 | |
| Allied military currency repaid | 56,511 | 56,511 | |
| Gifts to Britain | 13,572,964 | 13,572,964 | |
| Totals | 47,692,684 | 17,693,826 | 734,911,272 |
NATIONAL DEVELOPMENT LOANS ACCOUNT.—Since the inauguration of the National Development Loans Account in April, 1942, all loan-moneys raised for public works and other capital purposes are first paid into this account and then transferred to the various accounts covering the activities for which the moneys are required.
Particulars of the amounts transferred from the National Development Loans Account during each of the last three financial years were as follows:—
| — | 1945–46. | 1946–47. | 1947–48. |
|---|---|---|---|
| £ | £ | £ | |
| Public Works Account | 6,872,000 | 7,000,000 | 11,400,000 |
| Electric Supply Account | 2,920,000 | 4,000,000 | 5,500,000 |
| Land for Settlements Account | 1,500,000 | 1,500,00 | 1,700,000 |
| Main Highways Account | 100,000 | 317,250 | |
| State Coal-mines Account | 350,000 | 120,000 | 1,560,000 |
| State Forests Account | 300,000 | 750,000 | 1,050,000 |
| Working Railways Account | 851,000 | 750,000 | 1,650,000 |
| Post Office Account | 100,000 | 600,000 | |
| Iron and Steel Industry Account | 2,000 | 6,000 | 173,000 |
| Loans Redemption Account | 2,121,940 | ||
| Purchase of shares in the British Commonwealth Pacific Airlines, Ltd. | 3,000 | 297,000 | |
| Purchase of shares in the British Petroleum Company of New Zealand, Ltd. | 63,750 | 255,000 | |
| Transfer to New Zealand National Airways Corporation | 300,00 | 240,000 | |
| Transfer to Linen Flax Corporation | 190,000 | ||
| Totals | 12,995,000 | 15,600,000 | 25,946,940 |
EARTHQUAKE AND WAR DAMAGE FUND.—The Earthquake and War Damage Fund, which replaced the War Damage Fund created by the War Damage Act, 1941, was set up under the provisions of the Earthquake and War Damage Act, 1944. During the years 1946–47 and 1947–48 premiums paid into the fund amounted to £402,807 and £482,645, and interest on investments amounted to £89,918 and £121,790 respectively. Payments during the same years amounted to £15,873 and £19,807, leaving balances of £5,238,212 and £5,822,840 in the fund at 31st March, 1947 and 1948 respectively.
A description of the provisions of the Act and further details of the fund will be found in Subsection D of Section 29.
TOTAL TAXATION.—All revenue collected by means of taxation was until the end of the financial year 1921–22 paid into the Consolidated Fund and applied to general purposes. From 1922–23 to the 5th December, 1927, however, certain items were paid into the Main Highways Account to help defray the cost of improving and maintaining roads. From the last-mentioned date all such moneys have been paid into the Consolidated Fund in the first instance, and (with certain exceptions) transferred to the Main Highways Account until the abolition of this account as from the 1st April, 1947. The proceeds of social-security taxation are paid direct into the Social Security Fund, while a similar position obtained in the case of war taxation, receipts from this source having been paid direct into the War Expenses Account. As from 1st April, 1946, all receipts previously included under the heading of war taxation and credited to the War Expenses Account have been paid to the Consolidated Fund.
A summary of taxation revenue during the last ten years is given in the following table. In addition to total taxation the amounts received from direct taxes on income are also shown.
| Year. | Direct Taxes on Income (i.e., Income-tax and War and Social Security Charges on Income). | Total Taxation | |||
|---|---|---|---|---|---|
| Amount. | Percentage of Total Taxation (All Sources). | Amount. | |||
| Total. | Per Head of Population. | Total. | Per Head of Population. | ||
| £ | £ s. d. | £ | £ s. d. | ||
| 1938–39 | 14,296,109 | 8 17 5 | 37.8 | 37,797,904 | 23 9 2 |
| 1939–40 | 20,432,167 | 12 10 2 | 45.9 | 44,522,028 | 27 5 2 |
| 1910–41 | 34,563,737 | 21 2 7 | 56.3 | 61,360.840 | 37 10 3 |
| 1941–42 | 39,845,130 | 24 8 9 | 58.5 | 68,163,256 | 41 16 2 |
| 1942–43 | 53,977,441 | 32 18 2 | 61.4 | 87,940,844 | 53 12 4 |
| 1943–44 | 63,311,965 | 38 13 3 | 62.8 | 100,839,484 | 61 11 7 |
| 1944–45 | 68,438,477 | 41 2 3 | 63.0 | 108,681,814 | 65 5 10 |
| 1945–40 | 71,582,870 | 41 16 9 | 62.3 | 114,954,873 | 67 3 9 |
| 1946–47 | 63,873,162 | 36 0 7 | 56.5 | 113,119,046 | 63 16 2 |
| 1947–48 | 63,581,244 | 35 1 7 | 52.0 | 122,275,911 | 67 9 2 |
Excluding the special taxation levied for social security purposes, taxation revenue in 1947–48 amounted to £96,099,153. Of this amount, £37,404,610, or 38.9 per cent., was received from direct taxes on income.
The following table shows receipts under the various heads of taxation during the last five years.
| Head. | Revenue for Year ended 31st March, | ||||
|---|---|---|---|---|---|
| 1944. | 1945 | 1946. | 1947. | 1948. | |
* See also under war taxation for years 1944 46 inclusive. | |||||
| Consolidated Fund— | £ | £ | £ | £ | £ |
| Customs revenue* | 7,672,083 | 8,471,679 | 8,800,016 | 15,718,983 | 24,390,881 |
| Beer duty* | 2,041,760 | 2,074,457 | 2,308,600 | 4,251,509 | 4,404,051 |
| Motor-vehicles taxation | 1,692,325 | 1,929,618 | 2,324,068 | 2,972,036 | 3,543,954 |
| Land-tax | 987,707 | 952,622 | 937,395 | 939,559 | 854,456 |
| Income-tax* | 23,498,851 | 25,686,050 | 26,465,912 | 32,085,057 | 36,632,581 |
| Other stamps taxation | 2,118,444 | 2,282,152 | 2,802,089 | 3,598,033 | 3,716,383 |
| Sales tax* | 3,762,406 | 4,063,558 | 4,505,443 | 15,550,547 | 15,945,813 |
| Death duties* | 5,951,676 | 5,666,172 | |||
| National-security tax* | 9,404,221 | 772,029 | |||
| Other taxation | 244,043 | 229,260 | 227,195 | 243,772 | 172,833 |
| Totals | 42,017,619 | 45,689,396 | 48,370,718 | 90,715,393 | 96,099,153 |
| Social - security taxation— | |||||
| Social-security charge | 12,796,108 | 13,663,858 | 14,557,460 | 22,383,884 | 26,176,634 |
| Registration fees, &c. | 581,665 | 596,208 | 609,848 | 19,769 | 124 |
| Totals | 13,377,773 | 14,260,066 | 15,167,308 | 22,403,653 | 26,176,758 |
| War taxation— | |||||
| National-security tax | 19,184,056 | 20,526,552 | 21,737,527 | ||
| Income-tax | 7,832,950 | 8,562,017 | 8,821,971 | ||
| Death duties | 4,508,792 | 5,060,548 | 5,024,014 | ||
| Customs revenue | 2,710,358 | 2,788,310 | 2,861,443 | ||
| Beer duty | 1,498,373 | 1,535,003 | 1,712,578 | ||
| Sales tax | 8,980,941 | 9,539,368 | 10,558,975 | ||
| Postage | 600,000 | 600,000 | 600,000 | ||
| Miscellaneous | 128,622 | 120,554 | 100,339 | ||
| Totals | 45,444,092 | 48,732,352 | 51,416,847 | ||
| Total taxation receipts | 100,839,484 | 108,681,814 | 114,954,873 | 113,119,046 | 122,275,911 |
| Taxation receipts per head of mean population— | £ s. d. | £ s. d. | £ s. d. | £ s. d. | £ s. d. |
| Ordinary (Consolidated Fund) | 25 13 2 | 27 9 0 | 28 5 5 | 51 3 5 | 53 0 4 |
| Social security | 8 3 5 | 8 11 4 | 8 17 4 | 12 12 9 | 14 8 10 |
| War | 27 15 0 | 29 5 6 | 30 1 0 | ||
| Totals | 61 11 7 | 65 5 10 | 67 3 9 | 63 16 2 | 67 9 2 |
During the early years of the depression period heavier imposts were made in existing fields of taxation and, in addition, new classes of taxation were imposed, the latter including a sales tax and a scheme of special taxation for the relief of unemployment. Later the need of finance for New Zealand'S war effort necessitated the imposition of new taxes and additional charges under many existing headings.
Compared with 1938–39—the financial year immediately preceding the outbreak of war—revenue from taxation in 1947–48 showed an increase of £84,478,007, or 224 per cent. Of this increased amount, social security taxation (replacing employment-promotion taxation as from 1939–40), accounted for £20,684,626, and taxation for the purposes of the Consolidated Fund £63,793,381. In this connection, it should be noted that receipts of the Consolidated Fund for 1947–48 were called upon to the extent of £16,000,000 for transfer to the Social Security Fund, and £2,055,000 to the War Expenses Account, with an additional £4,611,000 to the latter account from surplus funds. In the previous year (1946–17) £18,000,000 was transferred to the Social Security Fund and £3,000,000 to the War Expenses Account. The total amount transferred to the Social Security Fund since its inception in 1939–10 is £61,809,367, while during the same period £36,251,844 has been transferred to the War Expenses Account.
Total receipts from taxation in 1947–48 exceeded the total for 1946–47 by £9,156,865, or by 8.1 per cent. Taxation for ordinary revenue purposes increased by £5,383,760 (5.9 per cent.) as compared with the previous year, and social-security taxation by £3,773,105 (16.8 per cent.).
In 1947–48 taxation for ordinary revenue purposes accounted for 78.6 per cent. of the total taxation receipts and social-security taxes for 21.4 per cent. If to the total of social-security taxes is added the £16,000,000 transfer mentioned above, the 1947–48 taxation used for social-security purposes amounts to 34.5 per cent. of the total taxation receipts for the year.
As a war measure, an Excess Profits Tax Act was passed in 1940, providing for the imposition of a special tax assessed on excess profits derived by the taxpayer during the income year 1940–41 and subsequent years covering the duration of the war. This Act continued in force until and including the tax-year 1945–46, when it was repealed by the Land and Income Tax Amendment Act, 1946.
The figures under the various headings are to a small extent swollen by the inclusion of penalties for late payment, and of fines for offences under the various taxation Acts. The figure shown for the postage item of war taxation is the amount paid to the War Expenses Account out of postal revenue, following the imposition of increased charges as part of the war-taxation measures.
A comparison of taxation revenue and total private income and national income is afforded by the following table, which also shows taxation as a percentage of private income and national income.
| Year. | Total Private Income. | National Income at Factor Coat. | Taxation Revenue. | ||
|---|---|---|---|---|---|
| Total. | As a Percentage of— | ||||
| Private Income. | National Income. | ||||
| £(m) | £(m) | £(m) | |||
| 1938–39 | 200.1 | 194.1 | 37.8 | 18.9 | 19.5 |
| 1939–40 | 217.0 | 211.4 | 44.5 | 20.5 | 21.1 |
| 1940–41 | 237.3 | 231.9 | 61.4 | 25.9 | 26.5 |
| 1941–42 | 259.3 | 254.4 | 68.2 | 26.3 | 26.8 |
| 1942–43 | 297.9 | 293.7 | 87.9 | 29.5 | 29.9 |
| 1943–44 | 333.1 | 326.9 | 100.8 | 30.3 | 30.8 |
| 1944–45 | 341.0 | 330.0 | 108.7 | 31.9 | 32.9 |
| 1945–46 | 364.4 | 350.0 | 115.0 | 31.6 | 32.9 |
| 1946–47 | 395.3 | 364.9 | 113.1 | 28.6 | 31.0 |
| 1947–48 | 445.7 | 411.2 | 122.3 | 27.4 | 29.7 |
The following diagram shows the extent to which taxation has increased since the year 1921–22. The extent to which employment-promotion taxation and the later social-security taxation have contributed towards this increase and the huge impost for war purposes are also clearly portrayed.
CUSTOMS AND EXCISE TAXATION.— Revenue included under the heading of Customs is exclusive of receipts from tire-tax and from that portion of the motor-spirits tax which is imposed to provide funds for reading purposes, referred to under the next heading. Gold-export duty, and sales-tax receipts are not counted as ordinary Customs revenue, although collected by the Customs Department. The following figures show Customs and excise revenue, for ordinary revenue purposes, for the last five years. Figures for the 1946–47 and 1947–48 years, however, include revenue derived from war imposts which were not counted in the earlier years, although now included in the ordinary Customs revenue or in the total taxation (Consolidated Fund).
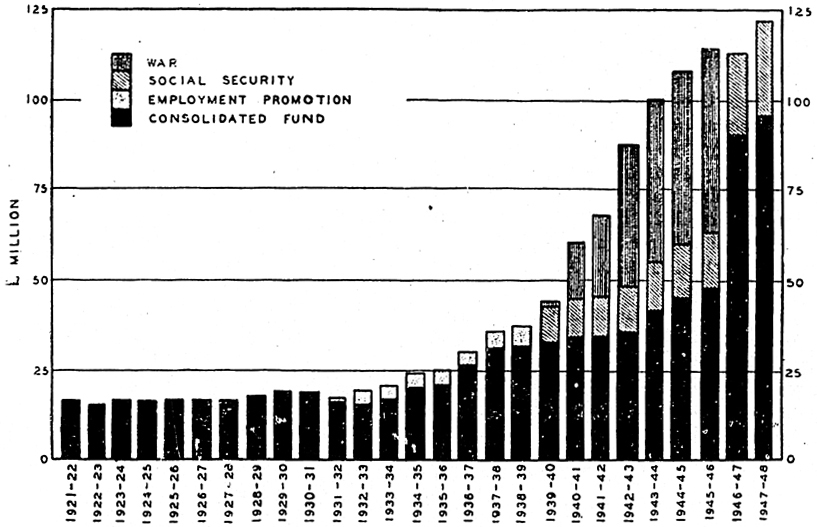
| Year ended 31st March, | Customs Duties.* | Beer Duty. | Total Customs and Excise Duties. | Proportion of Total Taxation. (Consolidated Fund.) |
|---|---|---|---|---|
* Excise duties other than beer duty are here included with Customs duties. | ||||
| £ | £ | £ | Per Cent. | |
| 1944 | 7,672,083 | 2,041,760 | 9,713,843 | 23.12 |
| 1945 | 8,471,679 | 2,074,457 | 10,546,136 | 23.08 |
| 1946 | 8,800,016 | 2,308,600 | 11,108,616 | 22.97 |
| 1947 | 15,718,983 | 4,251,509 | 19,970,492 | 22.01 |
| 1948 | 24,390,881 | 4,404,051 | 28,794,932 | 29.96 |
The total amount of Customs and excise revenue for 1947–48 was £28,794,932, as compared with £11,727,224 in the pre-war year 1938–39. Beer duty included in the foregoing figures amounted to £4,404,051 in 1947–48 and £1,076,796 in 1938–39.
Increases in the rate of beer duty and in the tax on motor-spirits, for general revenue purposes, were brought into operation on 2nd August, 1939. As from 27th September, 1939, additional duties were imposed on certain items (including beer and tobacco, which two items were subject to still further increases in duty as from 11th May, 1942); the additional revenue in these cases was appropriated for war purposes, and paid direct into the War Expenses Account, until the 1st April, 1947, and thereafter into the Ordinary Revenue Account. Information in regard to these increases and Customs and excise duties generally is contained in Section 9D, Customs Tariff and Revenue.
MAIN HIGHWAYS TAXATION.—The Main Highways Act, 1922, laid down that the Revenue Fund (the Revenue and Construction Funds merged as from 1st April, 1936) of the Main Highways Account was to be credited, inter alia, with—
All moneys received as Customs duties imposed in respect of rubber tires, rubber tiring, and inner tubes of rubber for pneumatic tires, n.e.i. (as per the Customs tariff): All moneys received by the Crown under any Act in respect of the licensing of motor-vehicles. The tire-tax was imposed by the Customs Amendment Act, 1921, prior to the passing of which tires had been admitted free. The licensing of motor-vehicles by the Crown became operative in the financial year 1924–25, consequent upon the passing of the Motor-vehicles Act, 1924.
A third class of taxation for main-highways purposes was introduced towards the end of 1927 by the Motor-spirits Taxation Act of that year, which imposed a duty of 4d. per gallon on all motor-spirits imported. The rate was increased to 6d. per gallon in 1930. The duty collected was paid into the Consolidated Fund in the first place, and after deduction of expenses of administration and of refunds (which are provided for in cases where the motor-spirits are used otherwise than for motor-vehicles) the residue was divided between (1) the Main Highways Account, and (2) boroughs with a population of 6,000 or over, in the proportions of 92 per cent. and 8 per cent. respectively. The Main Highways Account was abolished as from 1st April, 1947, but the net revenues as described above are still used for highways purposes, but are now subject to appropriation by Parliament from the Consolidated Fund instead of being dealt with through a special account as formerly. An additional 2d. per gallon was imposed from 7th October, 1931, a further 2d. from 9th February, 1933, and a further 4d. from 2nd August, 1939, but these additional imposts (totalling 8d. per gallon, or 8 7/10d. with the surtax of 7/10d. per gallon on imports from foreign countries) are for general purposes, and the proceeds are treated as part of the ordinary Customs revenue.
By section 19 of the Finance Act, 1932–33 (No. 2), substituted later by section 4 of the Motor-vehicles Amendment Act, 1934–35, a mileage-tax was imposed on motor-vehicles using fuel other than motor-spirits. This tax is allocated in a similar manner to the tax on motor-spirits, part of the receipts being regarded as the equivalent of Customs taxation and the balance after deduction of administration expenses and refunds, being devoted to highway purposes.
Taxation receipts for main highways purposes have been as follows during the last five years. Reference may be made also to the section relating to Roads and Road Transport.
| Year ended 31st March, | Fees, &c., under Motor-vehicles Act. | Tire-tax. | Motor-spirits Taxation. | Mileage-tax. | Total. |
|---|---|---|---|---|---|
| £ | £ | £ | £ | £ | |
| 1944 | 474,026 | 6,584 | 1,200,470 | 11,245 | 1,692,325 |
| 1945 | 509,564 | 128,861 | 1,273,276 | 17,917 | 1,929,618 |
| 1946 | 499,484 | 154,161 | 1,660,397 | 10,026 | 2,324,068 |
| 1947 | 479,412 | 210,029 | 2,268,272 | 14,323 | 2,972,036 |
| 1948 | 768,898 | 246,912 | 2,496,621 | 31,523 | 3,543,954 |
LAND AND INCOME TAX.—A brief history of the various changes in the rates of, and the law relating to, land-tax and income-tax between 1915 and 1939 is contained, in the 1940 and previous issues of the Year-Book. The principal alterations which have taken place since 1936 are as follows:—
As part of the programme of the Labour Government, a graduated scale of land-tax was reintroduced as from 1st April, 1936. An amended scale of income-tax, with somewhat heavier imposts, was also adopted, and various changes were made in regard to exemptions. Under the amended scale the reduction of exemptions with increasing income was discontinued, as was also the special flat-rate tax on incomes over £500. The 1936 amendment, superseded by the 1940 amendment, provides that taxpayers may be required to pay their income-tax by instalments instead of in one sum as formerly.
With a view to obtaining additional revenue for general governmental purposes, legislation was passed in 1939 reducing the general exemption from £210 to £200, and increasing the basic rates of taxation.
In connection with the provision of finance for was purposes, the War Expenses Act of 1939 increased all rates of income-tax for the 1939–40 tax-year by 15 per cent. This surcharge was retained for the 1940–41 and 1941–42 tax-years, and was increased to 33⅓ per cent. for the tax-years 1942–43 to 1945–46, but, commencing with the 1946–47 tax-year, it has been reduced to 15 per cent.
Income derived from farm-lands of an unimproved value of under £3,000 (from 1931–32) was, up to the passing of the Land and Income Tax Amendment Act, 1939, exempt from income-tax. The 1939 Act provides for all profits or gains derived from the use or occupation of any land to be regarded as assessable income. This Act also made provision (amended in 1940 and 1941) for the taxation of income of “proprietary” companies—i.e., companies under the control of not more than four persons.
By the Land and Income Tax Amendment Act of 1940 certain State trading Departments, which were previously exempt, were made liable for the payment of income-tax; the special exemption in respect of children was extended to include children brought to New Zealand under any Government scheme and being supported by any taxpayer; unpaid land-tax, once registered, was constituted a first charge on land until all arrears are paid; and a new scale of basic rates of income-tax was provided.
The Land and Income Tax Amendment Act of 1941 brought the provisions for taxation of banking companies into line with those for other companies.
Under the Finance Act, 1942, the Commissioner of Taxes is empowered to require any person to deduct income-tax from payments duo to defaulting taxpayers and to pay every sum so deducted to the Commissioner.
The Land and Income Tax Amendment Act, 1944, increased the personal exemption of absentees from £50 to £200, and also made provision for deductions from assessable income in respect of deferred maintenance of assets where reasonable and proper maintenance was prevented by conditions arising out of the 1939–45 war.
The Land and Income Tax Amendment Act, 1945, increased, commencing with the tax-year 1946–47, the special exemption in respect of a dependent wife or husband, or of a housekeeper whose duties include the care of a widowed or divorced taxpayer'S child or children, from £50 to £100, and abolished the special exemption of £50 in respect of a dependent child. These adjustments were made as the result of the amendment to the Social Security Act which extended the family benefit to cover all children, irrespective of the income of the parents. Before the abolition of the exemption in respect of a dependent child could be carried into effect, however, the matter was again considered, and the exemption was restored by the Land and Income Tax Amendment Act, 1946. The 1945 amendment also modified the special exemption in respect of a dependent relative, and increased the personal allowance of absentees where the incomes of husband and wife are aggregated. It also made provision for a special depreciation allowance, commencing with the tax-year 1946–47, in respect of any premises, plant, or machinery acquired, erected, installed, or extended by a taxpayer on or after 1st April, 1945, and not later than 31st March, 1948. This allowance is in addition to the ordinary depreciation allowance provided for by the principal Act. The 1945 amendment further provided that, where the income of a taxpayer had been unduly increased upon the sale or other disposition of any live-stock by reason of the adoption of a standard value that was less than the true value, the Commissioner may, upon application in writing before 30th June, 1946, reduce the assessable income for any particular year or years. Provision was also made for the names of persons convicted of tax evasion, &c., to be published in the New Zealand Gazette.
The Land and Income Tax Amendment Act, 1946, made provision for agreements to be made with the Government of any territory outside New Zealand with a view to affording relief from double taxation. This amendment also abolished the excess-profits tax imposed by the Excess Profits Tax Act, 1940.
Statistics relating to the incidence of land and income tax are given later on in this volume (Sections 34 and 36 respectively).
Land-tax.—Land-tax is assessed on the unimproved value of land after deductions provided for by statute have been made by way of special exemption. An owner of land, the unimproved value of which does not exceed £1,500, is allowed an exemption of £500; and where the unimproved value lies between £1,500 and £2,500 there is a similar exemption, diminished, however, by £1 for every £2 over the £1,500 mark, so that no exemption is allowed when £2,500 is reached.
Where the land is subject to a registered mortgage an alternative scale of exemption is provided—viz., £7,500 in cases where the unimproved value does not exceed £7,500, the exemption of £7,500 being diminished by £1 for every £1 above the margin of £7,500 of unimproved value, and disappearing altogether at £15,000. Where the capital value of the mortgage is less than the amount of deduction provided, such capital value is deducted instead.
No special exemption is allowed in the case of land not situated in a borough, when such land has been owned by a person for three years and not improved to the extent of £1 per acre or equal to one-third of the unimproved value, if in the opinion of the Commissioner of Taxes it should have been so improved. In the case of such land, also, the rate of land-tax is 50 per cent. more than the ordinary rate.
In lieu of the special exemptions sot out above, the Commissioner of Taxes has discretionary powers to grant relief in certain specified cases of hardship. Subject to deductions provided, life tenants are liable to tax, and joint owners are assessed jointly as regards the land held in conjunction, and are liable severally in respect of each owner'S interest in such land and any other land. This liability for joint assessment also applies to companies owning land if half of the paid-up capital or half (in nominal value) of the allotted shares of each company is held by or on behalf of shareholders in the other.
In case of default by a taxpayer in respect of land-tax the amount of tax may be demanded from his successor in title, from a tenant of the taxpayer or his successor, or from a mortgagee of the estate or interest concerned. Land-tax constitutes a charge on the land, and, notwithstanding any disposition of it, such land continues to be liable in the hands of a purchaser or other holder thereof for the payment of the tax so long as the charge remains in force. Registration of the charge is required, and no disposition of the land or of any interest in it may be registered while the charge remains in force. Provision is made for relief in cases of hardship.
Where the unimproved value on which land-tax is payable does not exceed £5,000 the present rate of land-tax is 1d. in the pound. This rate is increased by 1/8000 d. for every £1 in excess of £5,000, with, however, a maximum rate of 6d. in the pound.
Income-tax.—Income-tax is payable on the full incomes of registered companies and certain public authorities, and in other cases on income in excess of £200 per annum. A deduction of £100 from assessable income is allowed in respect of a dependent wife, diminished at the rate of £2 for every complete £1 by which the personal income derived by the wife exceeds £50. A similar deduction is allowed in respect of a dependent husband, and an exemption of up to £100 is allowed a widower, widow, or divorced person in respect of a housekeeper whose duties include the care and control of a child or children in respect of whom the taxpayer is entitled to a special exemption; £50 deduction is allowed for each dependent child or grandchild under eighteen years of age, and also in respect of each child, brought to New Zealand under any Government scheme, who is dependent on the taxpayer; and amounts up to £50 contributed towards the support of a relative of the taxpayer are also deductible from assessable income, provided that such relative is not in receipt of a monetary benefit under the Social Security Act. Exemption up to 15 per cent. of assessable income, but with a maximum exemption of £150, is allowed for life-insurance premiums and National Provident. Fund, superannuation, and similar contributions. With the exception of the personal exemption of £200, none of the foregoing exemptions is allowed to absentees. Allowance is made for depreciation of premises and plant used in the production of income, the revised scale of depreciation adopted as from 1st April, 1939, in the case of premises being 2½ per cent. for wooden-frame buildings; 1½ per cent. for brick, stone, or concrete, walled buildings; and 1 per cent. for buildings of reinforced stone or concrete throughout and steel-framed buildings covered with iron, asbestos, or similar material. In addition to the foregoing, provision has been made for a special depreciation allowance commencing with the tax-year 1946–47 in respect of any promises, plant, or machinery erected acquired, installed, or extended on or after 1st April, 1945, and not later than 31st March, 1948. Any allowance made in this connection is to be in respect of the income derived during the five years from the date that the premises, &c., were first used in the production of assessable income. The amount of the deduction is limited in the aggregate to 30 per cent. of the total cost spread over the period as follows: first year, 10 per cent.; second year, 8 per cent.; third year, 6 per cent.; fourth year, 4 per cent.; and fifth year, 2 per cent. Where a taxpayer has been prevented from maintaining assets in a proper or reasonable manner by conditions arising out of the 1939–45 war, a deduction from assessable income may be allowed in respect of deferred maintenance. The minimum amount that may be so allowed is £100, and the amount applied for is to be deposited with the Commissioner of Taxes, and paid to the Consolidated Fund. At any time after the expiration of twelve months from the date of the deposit, the taxpayer may apply for a refund of the whole or a part thereof, but in no case may the amount of the refund be less than £50. Any amount so refunded is deemed to be assessable income for the income year in which the refund is made. A deduction may also be made in respect of any premium paid on account of leased machinery used in the production of income. Certain specified incomes are wholly exempt from taxation.
Income derived from debentures of companies, local authorities, and public authorities is taxable at the source unless a certified list of the debenture-holders (with certain other particulars) is furnished. Where such income is taxed at the source an adjustment is obtainable, so that no taxpayer need pay tax on debenture, interest at a higher rate than on income from other sources.
Companies pay tax on their full income (at the appropriate rate for such income) before distribution of dividends. The recipient of income from dividends does not pay income-tax on such part of his income, but the amount is taken into account in fixing the rate of tax to be paid. This provision also applies in the case of income from “tax-free” Government securities or “tax-free” company debentures.
In respect of stock or debentures issued by the Government of New Zealand, or by any local or public authority, or by the Public Trustee as agent of a land settlement association, interest is not liable to New Zealand income-tax if it is payable out of New Zealand to a person not resident in New Zealand.
Income-tax is payable on the taxable balance—i.e., assessable income less exemptions—and is assessed at the following basic rates, which were laid down in the Land and Income Tax Amendment Act of 1940 and amended by the Finance Act, 1942. In addition, a surcharge of 15 per cent. of the amount assessed is made, subject to a maximum rate of 15s. 6d. per £1.
Debentures issued by Companies and Local and Public Authorities. —(i) Where the income has been derived from debentures issued by a company on terms providing for the payment of income-tax by the company, the rate of tax is 8s. 8d. per £1; (ii) in other cases where the income has been derived by a company or a public authority, the rate of tax is 12s. per £1. Where the income has been derived by any other, taxpayer the rate of tax is 12s. per £1, increased by one-third thereof.
Companies and Public Authorities. —On income not included above, the rate of income-tax for every £1 of taxable income in the case of companies and public authorities is: (i) Where the taxable income does not exceed £6,300, 2s. 6d., increased by 1/100d. for every £1 of taxable income; (ii) where the taxable income exceeds £6,300, 7s. 9d., increased by 1/150d. for every £1 of the taxable income in excess of £6,300, but so as not to exceed in any case the rate of 8s. 8d. per £1.
Other Taxpayers. —On all income not included above, the rate of income-tax is as follows, an addition of one-third being made in the case of unearned income subject to the concessions outlined below. On so much of the taxable income as does not exceed £100, the rate of tax per £1 is 2s. 6d.: for each succeeding £100 or part thereof the rate of tax increases by 3d. until it reaches a maximum of 12s. for every £1 in excess of £3,800. There is a limit of 15s. 6d. in any £1 of taxable income but this rate is not reached in the case of earned income even with the addition of the surcharge of 15 per cent. In the ease of unearned income, however, the maximum rate is reached when the taxable income exceeds £3,100. The Land and Income Tax (Annual) Act, 1948, provided for a rebate in the assessment to the value of £10 from the tax payable, or where this was less than £10, a rebate of the amount of tax. Where an aggregated assessment was made under the Land and Income Tax Amendment Act, 1939, the rebate was to be equal to the sum of the rebates allowable as if the assessments for the husband and the wife had been made separately. This provision was continued in the 1949 annual Act.
The Finance Act, 19–12, provided for a new method of assessing income-tax where two classes of income are involved—e.g., earned and unearned, or earned and nonassessable. In the case of taxable income that is wholly earned or wholly unearned, however, the method remained the same. The Land and Income Tax (Annual) Act, 1947, granted some measure of relief from the addition of one-third of the tax on unearned income, in cases of persons on small incomes. Where the unearned taxable income, or the total of unearned and earned taxable income does not exceed £200, it is subject to earned rates of tax only. Where it exceeds £200 but is less than £400. the amount of unearned income to be treated at earned rates is not to be greater than the difference between the taxable income and £400. The 1948 annual Act repeated this provision.
Legislative authority is given in the Land and Income Tax Amendment Act of 1940 for income-tax to be assessed for any year at the basic rates specified, any change required being in the form of an addition or deduction of a certain percentage.
The following table shows the amount of income-tax payable on various amounts of assessable earned income by individual taxpayers classified according to marital status (married or otherwise) and, in the case of married taxpayers, according to the number of dependent children under eighteen years of age. Limitation of space precludes the inclusion of cases where there are more than three children, but, as stated earlier, an exemption of £50 is allowed for each child. The amounts of tax shown are based on the rates in force (exclusive of the £10 rebate) for the tax-year 1948–49, and thus relate to incomes received during the income year 1947–48. The rates for the tax-year 1949–50 remain unchanged. In addition to the personal and dependant'S exemptions, which have been allowed for in calculating the amount of tax payable, further deductions from the assessable income would be made in respect of life assurance premiums, National Provident Fund, superannuation, and similar contributions. As stated, the amount of assessable income shown is assumed to be “earned” or “personal exertion” income in each case. Where the income is “unearned,” the rate of tax payable is increased by 33⅓ per cent., subject, of course, to the special conditions operating for small incomes already mentioned and also to the maximum rate of 15s. 6d. per £1 of income.
The opportunity has also been taken to show the amount of the social-security charge. This tax, which is payable in addition to income-tax, is referred to under a later heading. The present rate is equivalent to 1s. 6d. per £1 of income, and it should be noted that, unlike income-tax, there are no deductions (personal, dependent relatives, &c.), the charge being levied on the full amount of income.
| Earned Assessable Income. | Social-security Charge. | Income-tax* payable by Persons— | ||||
|---|---|---|---|---|---|---|
| Unmarried. | Married with Dependent Wife. | Married with Dependent Wife and— | ||||
| One Child. | Two Children. | Three Children. | ||||
| * All amounts of income-tax shown in table are to be reduced by £10, this being the value of the rebate granted for the years 1948–19 and 1949–50. | ||||||
| £ | £ s. d. | £ s. d. | £ s. d. | £ s. d. | £ s. d. | £ s. d. |
| 300 | 22 10 0 | 14 7 6 | ||||
| 400 | 30 0 0 | 30 3 9 | 14 7 6 | 7 3 9 | ||
| 500 | 37 10 0 | 47 8 9 | 30 3 9 | 22 5 7 | 14 7 6 | 7 3 9 |
| 600 | 45 0 0 | 66 2 6 | 47 8 9 | 38 16 3 | 30 3 9 | 22 5 7 |
| 700 | 52 10 0 | 86 5 0 | 66 2 6 | 56 15 7 | 47 8 9 | 38 16 3 |
| 800 | 60 0 0 | 107 16 3 | 86 5 0 | 76 3 9 | 66 2 6 | 56 15 7 |
| 900 | 67 10 0 | 130 16 3 | 107 16 3 | 97 0 7 | 86 5 0 | 76 3 9 |
| 1,000 | 75 0 0 | 155 5 0 | 130 16 3 | 119 6 3 | 107 16 3 | 97 0 7 |
| 1,500 | 112 10 0 | 299 0 0 | 267 7 6 | 252 5 7 | 237 3 9 | 222 16 3 |
| 2,000 | 150 0 0 | 478 13 9 | 439 17 6 | 421 3 9 | 402 10 0 | 384 10 7 |
| 2,500 | 187 10 0 | 694 6 3 | 648 6 3 | 626 0 7 | 603 15 0 | 582 3 9 |
| 3,000 | 225 0 0 | 945 17 6 | 892 13 9 | 866 16 3 | 840 18 9 | 815 15 7 |
| 3,500 | 262 10 0 | 1,233 7 6 | 1,173 0 0 | 1,143 10 7 | 1,114 1 3 | 1,085 6 3 |
| 4,000 | 300 0 0 | 1,556 16 3 | 1,489 5 0 | 1,456 3 9 | 1,423 2 6 | 1,390 15 7 |
| 4,500 | 337 10 0 | 1,901 16 3 | 1,832 16 3 | 1,798 6 3 | 1,763 16 3 | 1,729 6 3 |
| 5,000 | 375 0 0 | 2,246 16 3 | 2,177 16 3 | 2,143 6 3 | 2,108 16 3 | 2,074 6 3 |
In interpreting this table as an indication of the incidence of social-security and income taxation in New Zealand, it should be noted that under the provisions of the Social Security Act a family benefit of £26 per annum is paid in respect of each child under sixteen years of age, irrespective of the income of the parents. This has operated from 1st April, 1946. The family benefit is normally paid to the mother, but with her concurrence may be used as an offset against income-tax due. As examples of the effect of this benefit, it will be observed that a married man with an income of £500 per annum and one child would pay £37 10s. social-security charge and £22 5s. 7d. (less £10 rebate) income-tax. He would, however, receive £26 per annum in family benefit. A married man on an income of £500 per year with three children would pay £37 10s. social-security charge and (with rebate) no income tax. The family benefit would amount to £78 per annum in this case, an amount £40 10s. greater than his payments of income tax and social-security charge.
DEATH DUTIES.—The law dealing with these classes of duty is embodied in the Death Duties Act, 1921, as subsequently amended. The main heads of taxation are estate and succession duties, which are generally referred to by the collective title of “death duties.” In addition to these there are gift duties and Maori succession duties.
Estate and succession duties are due and payable to the Commissioner of Stamp Duties on assessment, an additional 5 per cent. penalty, together with interest at 5 per cent. per annum, being payable if duty is not paid within three months after death. On so much of the duties as is paid within fifteen months (this period may be extended in certain cases) after the date of death, however, the rate of interest is reduced to 4 per cent. per annum. Gift duties are payable at the time the gift is made, and Maori succession duties before the registration of the succession order by the Maori Land Court. Generally the decision of the Commissioner of Stamp Duties in regard to matters of fact incidental to the assessment of duty is final, but there is an appeal on points of law or of fact by way of a case stated to the Supreme Court. An appeal on a question of law may be referred to the Court of Appeal.
Part III of the Finance Act, 1939, provides for a reduction in the amount of death or gift duty payable in cases where the margin above the limit of value on which a lower rate is payable is small.
The War Expenses Act, 1939, increased all rates of estate, succession, and gift duty by one-third, for the provision of war finance. The increase in the rate of duty applied to the estates of all persons dying after the 26th September, 1939, and, in so far as it related to gift duty, applied to all gifts made subsequent to 26th September, 1939.
Part IV of the Finance Act, 1940, repealed the provisions of the War Expenses Act, 1939, mentioned previously, and established new and increased rates for all classes of death and gift duties. Section 8 of the same Act provided for all revenue accruing from death and gift duties to be paid direct into the War Expenses Account as from 1st April, 1940. Provision was also made for the exemption from death duties and gift duty of gifts to the Government for war purposes.
The net revenue received for war purposes from death and gift duties during each of the last five years was:—
| Year ended 31st March, | Estate Duty. | Succession Duty. | Gift Duty. | Total Death Duties. |
|---|---|---|---|---|
| £ | £ | £ | £ | |
| 1944 | 3,363,378 | 876,088 | 269,326 | 4,508,792 |
| 1945 | 3,665,959 | 1,105,976 | 288,613 | 5,060,548 |
| 1946 | 3,648,340 | 1,083,984 | 291,690 | 5,024,014 |
| 1947 | 4,236,612 | 1,266,491 | 448,573 | 5,951,676 |
| 1948 | 4,071,151 | 1,160,911 | 434,110 | 5,666,172 |
The provision in regard to the payment of death and gift duties to the War Expenses Account was repealed as from 1st April, 1946, and receipts from these duties are again payable to the Consolidated Fund.
Estate Duty.—When the final balance of the dutiable estate of a deceased person, estimated as at the date of his death, exceeds £500, an estate duty is levied on the amount thereof. In the case of any estate the final balance of which does not exceed £10,000, any interest acquired by the wife of the deceased up to the value of £5,000 and, by the Finance Act, 1947, £500 for each child under 21 years, is exempt from estate duty, provided that the amount of deduction shall not in any case exceed the difference between the final balance and £10,000. The rate of duty on the whole estate must, however, be determined before any deduction is made. The principal Act, as amended in 1939, also provided that the wife, lineal descendant, or lineal ancestor of a soldier who met his death on account of the war of 1914–18 or the 1939–45 war is allowed £5,000 exemption from estate duty, but in the case of a wife or child these exemptions are in substitution for and not in addition to the exemption already mentioned. The value of any life-insurance policy or policies comprised in the estate was, by the Death Duties Amendment Act of 1925, deductible up to a maximum of £1,000, irrespective of the amount of the estate, but the Finance Act of 1939 repealed this provision as From 1st August, 1939.
Up to 1920 duty was leviable on property in excess of £500, and the scale of duties ranged from 1 per cent. in cases where the net estate was between £500 and £1,000 to a maximum of 15 per cent. for large estates. The amendment made to the scale in 1920 considerably increased the duty payable, the rates, which were embodied in the Act of 1921, ranging from 1 per cent. on estates not exceeding £2,000 in value to 20 per cent. on estates of more than £100,000. Part II of the Finance Act, 1930, imposed a rate of 30 per cent. on the amount by which the final balance exceeded £100,000. Part III of the Finance Act, 1939, imposed higher rates of duty, ranging from 1⅕ per cent. on estates not exceeding £2,000 in value to 30 per cent. on estates exceeding £100,000 in value.
The War Expenses Act of 1939 increased all rates of estate duty by one third, but Part IV of the Finance Act, 1940, provided a new scale of duties as follows:—
| Final Balance of Estate. | Rate |
|---|---|
| £ £ | per Cent. |
* Plus additional 1 per cent. for every £500 or fraction thereof in excess of £500. † Plus additional½ per cent. for every £1,000 or fraction thereof in excess of £7,000. ‡ Plus additional ⅓ per cent. for every £1,000 or fraction thereof in excess of £31,000. § Plus additional 1/10 per cent. for every £1,000 or fraction thereof in excess of £70,000. | |
| Up to 500 | Nil |
| Over 500 to 5,000 | 1* |
| 5,000 to 6,000 | 11 |
| 6,000 to 7,000 | 12 |
| 7,000 to 31,000 | 12† |
| 31,000 to 70,000 | 24‡ |
| 70,000 to 100,000 | 37§ |
| 100,000 | 40 |
Succession Duty.—In addition to the estate duty referred to above, a succession duty is payable by any person who acquires a beneficial interest in the estate of a deceased person either by will or by intestacy. An exemption from duty is made in favour of charitable trusts, and special provision is made that the wife, lineal descendant, or lineal ancestor of a soldier who has met his death on account of the war of 1914–18 or the 1939–45 war is allowed a £5,000 exemption in addition to the amounts otherwise provided.
The rates of duty vary according to the degree of relationship of the beneficiary to the deceased person. Part III of the Finance Act, 1939, effected a general increase in the rates, which had remained unaltered since 1920, while all rates were increased further by the War Expenses Act, 1939, and increased still further by the Finance Act, 1940.
The scales of duties as outlined in the Finance Act, 1940, and operative as from 30th June, 1940, are as follows:—
Wife.—The rate varies from 2 per cent. for amounts exceeding £5,000 but not exceeding £6,000, to 12 9/10 per cent. for amounts exceeding £70,000.
Husband.—From 2 per cent. for amounts exceeding £500 but not exceeding £2,000, to 16⅗ per cent. for amounts exceeding £59,000. Children, &c.—From 1 per cent. for amounts exceeding £500 but not exceeding £1,000, to 16 per cent. for amounts exceeding £61,000.
Parents, Brothers, Sisters, &c.—From 3 per cent. for amounts exceeding £200 but not exceeding £500, to 21 per cent. for amounts exceeding £61,000.
Other Relatives.—From 6 per cent. for amounts exceeding £200 but not exceeding £500, to 22⅗ per cent. for amounts exceeding £57,000.
Other Cases.—From 10 per cent. for amounts exceeding £200 but not exceeding £500, to 31 9/10 per cent. for amounts exceeding £44,000.
In all the above cases provision is made to allow for a reduction in the amount of succession duty payable, so that it will not exceed the difference between the estate duty payable in respect of such succession and percentages of the succession ranging from 50 in the case of wife or husband to 60 in cases other than relatives.
In cases where the successor is a child of the deceased and is under the age of twenty-one years at the time of death of the deceased, no succession duty is payable on amounts up to £1,000, and in successions exceeding that amount the full amount of duty is payable only in eases where the balance will not be reduced below £1,000.
In respect of moneys exceeding £1,000 that may be payable to persons domiciled out of New Zealand, and where the beneficiary is not the husband or wife of the deceased or a relative of the deceased within the third degree of consanguinity, there is an additional rate equal to 10 per cent. of the excess over £1,000.
Maori Succession Duty.—Where any succession order is made by the Maori Land Court on the death of a Maori, no death duty in the ordinary way is payable on the property included in it, but a Maori succession duty of 2 per cent. is payable on the value of the property, with a general exemption of £200.
Gift Duty.—A gift means any disposition of property (situate in New Zealand at the time of the gift) which is made otherwise than by will, whether with or without an instrument in writing, without full and adequate consideration in money or its equivalent. No duty is payable on a gift which, together with the value of all other gifts (not exempt from duty by reason of their nature) made at the same time or within twelve months previously or subsequently by the same donor to the same or any other beneficiary, otherwise than by way of a charitable trust, does not exceed the value of £500. Exemption from gift duty is also provided in cases of voluntary discharge of a mortgage debt where the donor and beneficiary are not connected by ties of blood or marriage. Various other exemptions were made by the Death Duties Amendment Act, 1923.
The amount of the gift duty is payable by either the donor or the beneficiary, but the beneficiary is entitled to be indemnified by the donor unless the terms of the gift provide otherwise. Particulars of any gift made are required to be furnished for assessment of duty within one month of the date of the gift, and in default an additional duty of 50 per cent. is payable. Where duty is payable, the rate (since 30th June, 1940) is based on the following scale.
| Value of Gift. | Rate of Duty. Per Cent. |
|---|---|
| Over £500 to £1,000 | 5 |
| Over £1,000 to £5,000 | 9 |
| Over £5,000 to £10,000 | 15 |
| Over £10,000 to £20,000 | 20 |
| Over £20,000 | 25 |
Prior to 1920 there was a flat rate of 5 per cent. on all gifts exceeding £1,000 in value. Gifts between £500 and £1,000 were made dutiable in 1930.
STAMP DUTIES.—The term “stamp duties” covers a miscellany of items of taxation imposed by the Stamp Duties Act, 1923, and subsequent amendments.
The receipts for the last five years are shown under the various heads of stamp duties revenue as used in the public accounts.
| — | Year ended 31st March, | ||||
|---|---|---|---|---|---|
| 1944. | 1945. | 1946. | 1947. | 1948. | |
| £ | £ | £ | £ | ||
| Adhesive stamps | 203,646 | 226,126 | 169,134 | 230,581 | 199,916 |
| Duty on instruments | 508,910 | 437,921 | 508,279 | 600,336 | 579,674 |
| Fines and penalties | 1,758 | 1,509 | 2,243 | 2,986 | 2,399 |
| Impressed stamps | 214,984 | 231,115 | 252,303 | 293,244 | 322,919 |
| Licences to companies | 93,141 | 92,521 | 93,184 | 101,819 | 107,866 |
| Sharebrokers' licences | 1,382 | 1,422 | 1,472 | 1,496 | 6,426 |
| Racing taxation | 908,117 | 1,096,456 | 1,555,247 | 2,082,253 | 2,198,209 |
| Amusements-tax | 148,225 | 155,943 | 178,450 | 226,569 | 221,209 |
| Lottery duty | 27,295 | 27,380 | 28,024 | 27,200 | 27,361 |
| Oversea-passenger duty | 6,898 | 7,122 | 10,231 | 26,938 | 46,133 |
| Mortgagees' indemnity fees | 1,546 | 1,551 | 1,644 | 1,850 | 1,810 |
| Miscellaneous | 2,542 | 3,086 | 1,878 | 2,761 | 2,461 |
| Totals | 2,118,444 | 2,282,152 | 2,802,089 | 3,598,033 | 3,716,383 |
Several of the more important items included in the foregoing table are dealt with in more detail under subsequent headings.
RACING TAXATION.—The Government tax on totalizator (pari mutuel) investments is 5 per cent. of the gross amounts passed through the machines. This percentage was substituted in August, 1930 (by Part I of the Finance Act, 1930), for the former rate of 2½ per cent., which had been in force since March, 1910, prior to which the percentage was 1½. A refund of 2½ per cent., raised from 1¼ per cent. by the Finance Act (No. 2), 1935, of gross totalizator takings (up to a limit of £500) may be made to a racing club, the Minister of Internal Affairs having the right to specify the purpose or purposes for which the amount refunded in any case is to be applied
For some years prior to 1939–40 special provision was made annually for the racing clubs to retain for their own use a proportion of the totalizator duty payable under the Stamp Duties Act. From 1st April, 1932, to 31st March, 1934, the proportion was one-fifth, for the next twelve months it was one-tenth, and from 1st April, 1935, to 31st March, 1939, the former proportion of one-fifth was in operation.
From the 1st November, 1915, a tax of 1 per cent. was imposed on the total value of all stakes, and a tax of 2½ per cent. on totalizator dividends, in addition to the tax on totalizator investments. The tax on dividends is computed on the gross amount paid into the totalizator for any horse-race after deducting 12½ per cent. (raised from 10 per cent. by the Finance Act, 1930) to cover the tax on totalizator investments and the club'S commission. From the 22nd December, 1921, the tax on stakes was increased to 10 per cent. and that on dividends to 5 per cent. From the 1st April., 1924, the tax on stakes was reduced to 5 per cent., with a further reduction to 1 per cent. from 1st August, 1935.
The following figures relate to the racing year, which ends on the 31st July. As a war measure, horse-racing has, since April, 1942, been confined to Saturdays and public holidays, and permits were so reduced that the number of racing days in 1942–43 and 1943–44 was only 163, as compared with 320 in 1938–39. Although racing is still restricted to Saturdays and public holidays, permits have been raised to the extent that the number of racing days in 1947–48 was only 1 less than in 1938–39.
| — | Year ended 31st July, | |||||
|---|---|---|---|---|---|---|
| 1943. | 1944. | 1945. | 1946. | 1947. | 1948. | |
* Retained by the clubs. | ||||||
| Number of racing-days | 163 | 163 | 182 | 316 | 320 | 319 |
| Number of races | 1,301 | 1,298 | 1,455 | 2,521 | 2,554 | 2,552 |
| £ | £ | £ | £ | £ | £ | |
| Amount of stakes | 397,044 | 496,643 | 604,061 | 1,077,566 | 1,246,544 | 1,400,978 |
| Totalizator investments | 8,664,665 | 10,279,036 | 12,030,432 | 19,956,751 | 21,999,374 | 23,209,968 |
| Amount paid in dividends | 7,160,720 | 8,491,695 | 9,944,842 | 16,500,221 | 18,195,596 | 19,189,804 |
| Government taxes— | ||||||
| On totalizator investments | 433,233 | 513,952 | 601,522 | 997,838 | 1,099,969 | 1,160,498 |
| On dividends | 379,022 | 449,648 | 526,268 | 873,001 | 962,356 | 1,016,738 |
| On stakes | 3,970 | 4,966 | 6,040 | 10,776 | 12,465 | 14,000 |
| Totals | 816,225 | 968,566 | 1,133,830 | 1,881,615 | 2,074,790 | 2,191,236 |
| Percentage of totalizator investments retained by clubs | 649,850 | 770,927 | 902,552 | 1,496,757 | 1,649,953 | 1,740,748 |
| Unpaid fractions* | 41,831 | 52,814 | 55,248 | 88,934 | 91,00 | 102,180 |
| Refunds of taxation granted to clubs | 37,103 | 35,739 | 40,057 | 50,226 | 56,27 | 56,724 |
For the financial year ended the 31st March, 1948, Government receipts from racing taxation amounted to £2,198,209, but £59,598 of this was paid back to clubs by way of refunds.
AMUSEMENTS-TAX.—A form of tax first introduced in 1917 is the amusements-tax, levied on payments for admission to entertainments. The present authority is the Amusements-tax Act, 1922, amended in 1923, 1930, and 1937. “Entertainment” is defined as “any exhibition, performance, amusement, game, or sport to which persons are admitted for payment.” The maximum admission charge on which no tax is payable was originally fixed at 9d., but has been successively altered to 1s., 2s., and (in 1930) 1s. 6d. When the payment for admission exceeds 1s. 6d., but is not more than 2s., the tax is 3d.; thereafter, up to 3s., it is 4d.; up to 3s. 6d., 5d.; and above 3s. 6d. 1d. for each 1s. or part thereof, plus 2d. “Payment for admission” includes reservation charges. Provision is made for exemption in certain specified cases—viz., shows promoted by agricultural, pastoral, horticultural, or poultry societies; entertainments, the proceeds or the not proceeds of which are devoted to charitable, philanthropic, patriotic, or educational purposes; any entertainment promoted by any society or institution not established for profit, if the proceeds or net proceeds are devoted to the objects of the society or institution; and any swimming-sports meeting.
The following net amounts have been collected during the last eleven years.
| Year ended 31st March, | Amount collected. |
|---|---|
| £ | |
| 1938 | 98,646 |
| 1939 | 92,993 |
| 1940 | 95,644 |
| 1941 | 92,700 |
| 1942 | 94,415 |
| 1943 | 107,433 |
| 1944 | 148,225 |
| 1945 | 155,943 |
| 1946 | 178,450 |
| 1947 | 226,569 |
| 1948 | 221,209 |
FILM-HIRE TAX.—Part V of the Finance Act, 1930, imposed, as from 1st July, 1930, a film-hire tax, which is payable monthly by holders of renters' licences under Fart IV of the Cinematograph Films Act, 1928.
The film-hire tax payable is assessed on the net monthly receipts derived by the renter from renting sound-picture films. On British films the tax is 10 per cent. and on foreign films 25 per cent., of the net receipts. Films made wholly in New Zealand are exempt from the tax. The film-hire tax yielded a revenue of £137,149 in 1943–44, £128,158 in 1944–45, £134,472 in 1945–46, £134,918 in 1946–47, and £111,155 in 1947–48.
SOCIAL-SECURITY TAXATION.—The Social Security Act, 1938, provided for the establishment of a Social Security Fund with special taxation (as from 1st April, 1939) superseding employment-promotion taxation, information concerning which will be found in the 1941 (p. 515) and preceding issues of the Year-Book.
Under the original Act the contributions to the Social Security Fund consisted of a registration fee and a charge on salaries, wages, and other income for all persons over sixteen years of age. For males over twenty years of age the registration fee was 5s. per quarter, and for all other persons over sixteen years of age 5s. per year; while for all persons over sixteen years of age the charge on salaries, wages, and other income was 1d. in every 1s. 8d. or part thereof. The Finance Act (No. 2), 1945, abolished the registration fee, the effective date being 1st April, 1946. The same Act increased the social-security charge to 1 ½d. for every 1s. 8d., the new rate applying to all salaries and wages in respect of any period after 12th May, 1946 and in the case of income other than salaries and wages to all such income derived during the year ended 31st March, 1946, and subsequent years. The income of companies was exempt from the former employment-promotion taxation, but is liable for social-security taxation.
Social-security taxation yielded £26,176,758 in 1947–48, towards which total the tax on salaries and wages provided £16,105,490, tax on company income and other income £10,071,144, and other receipts, &c., £124.
NATIONAL-SECURITY TAXATION.—National-security taxation was imposed by the Finance Act, 1940, for the purposes of war finance, and came into operation as from 21st July, 1940. This special taxation was assessed in the same manner and levied in respect of the same income as the social-security charge, except that there was no registration fee. The rate of the tax was originally 1d. in every 1s. 8d. or part thereof, but by the Finance Act, 1942, this was increased to 1 ½d. in every 1s. 8d. or part thereof. The increase applied to all salaries and wages derived in respect of any period after 10th May, 1942, and in the case of income other than salaries and wages to all such income derived during the year ended 31st March, 1942, and any subsequent year. This rate remained in force until it was reduced by the Finance Act (No. 2), 1945, to 1 ½d. for every 1s. 8d., the change coinciding with the increase in the social-security charge referred to under the preceding heading, and becoming effective from the same dates. This tax was finally abolished by the Finance Act, 1947, the effective date in relation to salaries and wages being 21st April, 1947, while income other than salaries and wages derived during the year ended 31st March, 1947, was exempt from the charge. The amount of national-security tax collected in 1946–17 was £9,404,221 and in 1947–48, £772,029, while the total yield since its inception in 1940–41 to 31st March, 1948, was £105,229,416. Since 1st April, 1946, the receipts from this source have been credited to the Ordinary Revenue Account of the Consolidated Fund, the total amount being credited to the War Expenses Account therefore remains at £95,053,166.
SALES TAX.—The 9th February, 1933, marked the inauguration of a sales tax in New Zealand. Numerous classes of goods were exempt from the tax, these being, in the main, commodities of primary production, articles used in the primary industries, machinery for use in manufacture, and the more important foodstuffs for household consumption. Goods exported from New Zealand are exempt, as are also certain commodities (e.g., gold, motor-spirits) which are subject to special taxation.
The tax was at the rate of 5 per cent. of the sale value of the goods to which it applied, but in June, 1940, and again in May, 1942, increases of a further 5 per cent. and 10 per cent. respectively were made for war taxation, the extra revenue thus accruing being paid direct to the War Expenses Account. Certain items, such as apparel, footwear, woollen piece-goods and yarns, and certain additional foodstuffs, were exempt from the additional 10 per cent., but in the case of wine manufactured in New Zealand an additional charge of 20 per cent. was added. As from 1st April, 1946, the total receipts from this tax have been credited to the Consolidated Fund. As from 16th August, 1946, a number of classes of goods previously subject to the tax have been exempted, the principal of these being building materials, furniture, clothing, and footwear. Discount ranging from 1¼ to 2½ per cent. (reduced from 5 per cent. in June, 1940) of the amount of tax otherwise payable is allowed for prompt payment. The tax is not a turnover tax, being payable once only and, so far as possible, at the point where the goods pass to the retailer. The Sales Tax Act is administered by the Customs Department. The net amount yielded by the sales tax during each of the last five years has been: 1943–44, £12,743,347; 1944–45, £13,602,926; 1945–46, £15,064,418; 1946–47, £15,550,547; and 1947–48, £15,945,813.
Monthly collections of sales tax during the last four calendar years, including amounts regarded as war taxation up to 31st March, 1946, have been as follows:—
| Month. | Total Sales-tax Receipts. | |||
|---|---|---|---|---|
| 1915. | 1946. | 1947. | 1948. | |
| £ | £ | £ | £ | |
| January | 1,159,521 | 1,384,301 | 1,235,933 | 1,577,591 |
| February | 624,695 | 747,003 | 637,463 | 695,732 |
| March | 1,366,842 | 1,729,094 | 1,336,743 | 1,657,609 |
| April | 1,150,131 | 1,475,359 | 1,218,344 | 1,360,572 |
| May | 1,122,446 | 1,506,703 | 1,210,765 | 1,265,291 |
| June | 1,126,923 | 1,147,457 | 1,067,513 | 1,317,355 |
| July | 1,155,648 | 1,953,053 | 1,394,691 | 1,191,504 |
| August | 1,220,881 | 1,584,564 | 1,275,068 | 1,188,960 |
| September | 1,208,462 | 1,251,778 | 1,447,944 | 1,103,903 |
| October | 1,312,287 | 1,191,996 | 1,522,079 | 1,132,807 |
| November | 1,404,331 | 1,083,124 | 888,811 | 1,213,022 |
| December | 1,486,250 | 1,135,900 | 1,985,854 | 1,292,273 |
The collections during a month relate in general to sales during the preceding month.
The foregoing statistics indicate, in a measure, the comparative distribution of merchandise trading operations throughout the year. The following table of receipts from the sales tax gives some indication of comparative trading operations in the principal centres. These figures and those in the preceding table, are compiled from monthly departmental returns and in most cases differ slightly from the final Treasury figures.
| Year ended 31st March, | Auckland. | Wellington. | Rest of North Island. | Christchurch. | Dunedin. | Rest of South Island. | Total.* |
|---|---|---|---|---|---|---|---|
* Includes receipts through Post and Telegraph Department. | |||||||
| £ | £ | £ | £ | £ | £ | £ | |
| 1944 | 4,229,015 | 4,707,531 | 550,256 | 1,608,022 | 1,183,583 | 438,129 | 12,743,347 |
| 1945 | 4,616,372 | 4,955,778 | 602,295 | 1,768,196 | 1,285,655 | 469,888 | 13,725,252 |
| 1946 | 5,285,755 | 5,014,474 | 726,828 | 2,036,030 | 1,406,709 | 548,454 | 15,047,757 |
| 1947 | 5,077,049 | 5,698,620 | 804,096 | 2,022,696 | 1,349,448 | 549,866 | 15,540,073 |
| 1948 | 4,571,799 | 6,829,914 | 842,613 | 1,928,552 | 1,186,310 | 525,612 | 15,942,001 |
LOCAL TAXATION.—Local-governing authorities have power under various Acts of the Legislature to impose taxes for general or special purposes, as set out in Section 26 of this Year-Book. The amount of revenue collected by local authorities during the five years ended 31st March, 1948, was as follows:—
| Year ended 31st March, | Rates. | Licences and other Taxes. | Total. | Per Head of Population. |
|---|---|---|---|---|
| £ | £ | £ | £ s. d. | |
| 1944 | 7,823,730 | 576,871 | 8,400,601 | 5 2 7 |
| 1945 | 7,895,871 | 642,668 | 8,538,539 | 5 2 7 |
| 1946 | 8,633,329 | 711,825 | 9,345,154 | 5 9 3 |
| 1947 | 9,541,133 | 804,852 | 10,345,985 | 5 16 9 |
| 1948 | 9,806,859 | 906,773 | 10,713,632 | 5 18 3 |
The figures are exclusive of wharfage dues, tolls, &c., received by Harbour Boards, such receipts being regarded as in respect of charges for services.
THE Minister of Finance may raise loans, when authorized by Parliament so to do, by the issue of debentures, or scrip, or stock, in New Zealand or elsewhere at his discretion. When raising a loan, the Minister may prescribe the mode and conditions of repayment, the rates of interest (not exceeding the maximum rate fixed by the authorizing Act), and the times and places of payment of principal and interest respectively. Power is given to convert debentures or scrip into consolidated stock, and the Minister may specify the terms of conversion at the time when a loan is raised, or arrange that terms shall be subsequently agreed upon. For the purpose of paying off or renewing at maturity any debenture, scrip, or other security, new debentures or other securities may be issued and disposed of if necessary. Authority also exists for the conversion of loan-money which has not yet matured, as well as for the redemption and cancellation of securities before maturity. Section 5 of the Finance Act (No. 2), 1934, authorized the Minister of Finance to transfer the management of the public debt to the Reserve Bank of New Zealand, and the transfer was effected as from the 1st October, 1936.
The money composing the public debt has been borrowed on the security of the public revenues of New Zealand. No portion of the public estate is pledged for payment of either principal or interest.
During the 1914–18 war period provision was made for the issue to the public of “Post Office investment certificates” of a face value of £1 and upwards, and in 1920 legislation which sanctioned a continuous issue of these certificates was enacted.
The proceeds of the sale of these certificates were paid into the Post Office Account, and the moneys were available for investment in any loan authorized by Parliament. The term of the certificates, formerly a minimum of five years, was altered in 1927 to such period as the Minister of Finance might determine. They were later issued with a definite currency of six years, the redemption value being calculated at 3 per cent. compound interest.
These certificates remained on issue until the passing of the National Savings Act, 1940, which made wider provisions for the investment of savings. Although the Act provides that investments made in accordance therewith shall be applied in like manner to receipts from the sale of the Post Office investment certificates—i.e., available for the purposes of any loan authorized by Parliament—the immediate object was to assist in financing the 1939–45 war. Two forms of investment were provided:—
Deposits in national savings accounts with the Post Office and certain authorized trustee savings-banks;
Purchase of national savings bonds.
These investments are approved trustee securities, and bear interest at the rate of 3 per cent. per annum.
Deposits in national savings accounts cannot be withdrawn at will, but are invested for a definite period. Moneys deposited up to 30th June, 1943, were repayable on 30th June, 1945, and each subsequent investment period is for a term of two years—i.e., deposits made during the year ended 30th June, 1948, are repayable on 30th June, 1950, and so on. National savings bonds are issued in three denominations—£1, £10, and £100—and are for a term of five years.
At the commencement of the financial year 1943–44 a change in practice was effected in regard to the treatment of exchange on overseas transactions. As from that date the cost of exchange has been treated as a part of the payment from which it arises, and not accounted for in the public accounts under the one heading of “Exchange” as was the previous practice. For example, the cost of remitting interest to London, amounting to £1,314,757 in 1943–44, was included in the item “interest” on the expenditure side of the Ordinary Revenue Account of the Consolidated Fund.
It was further decided that Government funds and investments held in the United Kingdom as at 1st April, 1943, and all subsequent overseas transactions were to be converted into pounds New Zealand at a fixed exchange rate of 25 per cent. and brought into the public accounts at the increased figure. Previously pounds New Zealand and pounds sterling were treated as if they were of the same value, despite the fact that New Zealand currency for many years had been at a discount on sterling.
In keeping with the foregoing decisions, that portion of the public debt domiciled in the United Kingdom, which was previously shown only at the sterling figure, has also been converted to pounds New Zealand, and the whole of the debt as from 1st April, 1943, is shown in the debt tables in New Zealand currency in addition to the nominal amounts. The nominal increase resulting from the adjustment was £39,568,574.
With the adjustment of the exchange-rate as from 20th August, 1948, New Zealand currency is once again on a par with sterling. To facilitate comparison over a period on a common basis the public debt tables in this section have, in general, been so shown that either nominal amounts or the amounts in New Zealand currency can be readily ascertained.
The National Development Loans Act, 1941, provided for the establishment within the Public Account, as from 1st April, 1942, of a National Development Loans Account into which all moneys raised by way of loans for national development are paid. The amounts so raised since the inception of this account to the 31st March, 1948, totalled £72,724,940, of which £25,946,940 was raised in the 1947–48 year, this figure being inclusive of £6,500,000 1 per cent. Treasury bills. Moneys are transferred from this account as required, the amounts transferred during the last three years being given in Subsection A. There was no balance in the account at 31st March, 1948.
GROSS INDEBTEDNESS.—On only four* occasions in the history of New Zealand has a reduction in the gross public debt been effected during the financial year. The first occasion was in 1891–92, when the debt was reduced by £117,282; and the second in 1922–23, when another slight reduction (£101,061) was recorded. The third occasion was in 1934–35, when the huge floating debt of £22,856,981—comprising outstanding Treasury revenue bills amounting to £3,452,109 and Treasury bills for £19,404,872 in resect of the Banks Indemnity (Exchange) Act—was entirely paid off. The fourth occasion was in 1947–48, the debt being reduced by £3,137,445 in New Zealand currency (having regard to exchange rate relationships existing prior to the 20th August, 1948) or £302,044 if nominal amounts only are taken into account.
The gross indebtedness of the General Government and the rate of indebtedness per head of population (inclusive of Maoris) for each of the last seventeen years are given in the following table.
The figures are given in two series, the first showing the debit at the nominal amount throughout the period 1932–48, and the second, covering the period 1940–48, with the debt shown in New Zealand currency. In the latter ease the amount of overseas debt has been converted to New Zealand currency at the rate of exchange ruling during the period.
| As at 31st March. | Amount. | Per Head of Population. |
|---|---|---|
| A—Nominal Amounts | ||
| £ | £ s. d. | |
| 1932 | 255,751,691 | 167 12 11 |
| 1933 | 256,431,849 | 166 14 6 |
| 1934 | 276,600,887 | 178 8 9 |
| 1935 | 254,390,108 | 162 19 4 |
| 1936 | 256,369,989 | 162 17 9 |
| 1937 | 264,479,091 | 164 14 10 |
| 1938 | 264,010,233 | 164 10 11 |
| 1939 | 277,779,163 | 170 19 5 |
| 1940 | 296,716,427 | 180 16 6 |
| 1941 | 323,236,466 | 197 11 0 |
| 1942 | 359,206,624 | 219 15 9 |
| 1943 | 437,634,263 | 267 16 4 |
| 1944 | 500,525,952 | 304 9 6 |
| 1945 | 537,266,707 | 319 15 8 |
| 1946 | 568,140,410 | 323 3 6 |
| 1947 | 578,380,582 | 322 10 9 |
| 1948 | 578,078,538 | 315 3 1 |
| B—In New Zealand Currency | ||
| 1940 | 329,634,468 | 200 17 9 |
| 1941 | 356,281,586 | 217 14 11 |
| 1942 | 391,097,738 | 239 6 0 |
| 1943 | 470,655,061 | 288 0 5 |
| 1944 | 533,755,131 | 324 13 9 |
| 1945 | 570,499,526 | 339 11 9 |
| 1946 | 591,772,704 | 336 12 4 |
| 1947 | 602,012,875 | 335 14 4 |
| 1948 | 598,875,430 | 326 9 10 |
It should be noted that the figures in the foregoing table are exclusive of £(N.Z.)32,738,886 (£26,191,109 sterling) in respect of which interest payments have been suspended by agreement with the Imperial Government from 1931. This amount consists of £(N.Z.)30,125,250 advances from the Imperial Government funded in terms of the Finance Act, 1922, and £(N.Z.)2,613,636 (£2,090,909 sterling) raised for State Advances purposes.
The Hutt Road Act of 1939 made provision whereby the Wellington City Council shall be kept indemnified out of the Main Highways Account (since 1st April, 1947, out of the Consolidated Fund) from all liability in respect of certain loans, which at the time of the passing of the Act amounted to £276,920. The amount outstanding under this heading amounted to £150,600 as at 31st March, 1948, but against this, sinking funds to the value of £120,161 were held at that date by the Public Trustee.
* Vide, however, page 603 of 1940 Year-Book.
In addition to the foregoing, there are certain contingent liabilities consisting of loans guaranteed by the State and State guarantees in respect of various undertakings. At 31st March, 1948, the amount of guaranteed loans outstanding was £58,653,952, of which £58,522,590 was in respect of State Advances Corporation stock and debentures, the major portion of which is at present held by the State in consideration of the transfer of property securities from the State to the Corporation and £89,062 on account of loans to industries by the Corporation. The remainder (£42,300) represented loans to local authorities, against which there were accumulated sinking funds totalling £1,728.
State guarantees cover various items, such as: the State guarantee to policyholders of the Government Insurance Department under the Government Life Insurance Act, 1908; the guarantee to the Reserve Bank under the Finance Act, 1934, in respect of sterling exchange (which was exercised in the cause of the adjustment of the New Zealand currency exchange rate to parity with sterling as from the 20th August, 1948); the guarantee under the Finance Act (No. 2), 1946, in respect of moneys advanced to Governments of other countries to finance the purchase of New Zealand produce; and those to certain undertakings under the State Advances Corporation Act. There were also certain contingent State liabilities in respect of the various Government Superannuation Funds.
CLASSIFICATION OF PUBLIC DEBT.—A broad classification of the public debt according to nature or purpose is contained in the following table, the distinction being made on the basis of whether raised for ordinary purposes, war purposes, or housing (in respect of the 1936 scheme). It should be noted that the debt as at 31st March, 1948, is expressed both in terms of New Zealand currency and of the nominal amount, though for former years nominal amounts only have been given.
| Class. | Gross Debt as at 31st March, | |||||
|---|---|---|---|---|---|---|
| Nominal Amount. | In N.Z. Currency. | |||||
| 1914. | 1920. | 1930. | 1940. | 1948. | 1948. | |
* Excludes debt due to Imperial Government (vide page 432). | ||||||
| £ | £ | £ | £ | £ | £ | |
| Ordinary | 99,730,427 | 121,081,730 | 197,599,818 | 245,217,387 | 291,812,543 | 312,609,435 |
| Housing—(1936 scheme) | 11,558,945 | 41,125,898 | 41,125,898 | |||
| War loans (1914–18) | 80,089,025 | 69,783,525 | 36,854,040 | 34,193,880 | 34,193,880 | |
| War expenses (1939–45) | 3,086,055 | 210,946,217 | 210,946,217 | |||
| Totals | 99,730,427 | 201,170,755 | 267,383,343 | 296,716,427* | 578,078,538* | 598,875,430* |
The total of 1914–18 war loans amounted originally to £82,215,673, of which approximately £24,000,000 had been redeemed to 31st March, 1948. The amount per head of population for each class as at 31st March, 1948, was as follows: ordinary, £159 2s. (nominal) and £(N.Z.)170 9s.; housing, £22 8s.; war, 1914–18, £18 13s.; war expenses, 1939–45, £115 0s. In the latter classes nominal and New Zealand currency values are identical.
A more detailed allocation of the nominal debt as at the 31st March, 1947, and 1948, is now given.
| 1947. | 1948. | |
|---|---|---|
* Excludes debt due to Imperial Government (vide page 432). | ||
| £ | £ | |
| Railways | 78,262,058 | 79,923,906 |
| Hydro-electric schemes | 27,945,630 | 33,271,888 |
| Post and telegraph services | 18,739,708 | 18,749,851 |
| Public buildings, schools, and sites | 23,916,387 | 26,623,962 |
| Roads and highways | 41,779,966 | 43,405,088 |
| Harbours and lighthouses | 1,658,210 | 1,663,911 |
| State forests | 4,927,438 | 5,977,438 |
| Housing | 36,322,906 | 41,125,898 |
| 22,996,623 | ||
| Land settlement and improvement Soil conservation, irrigation, and drainage | 30,796,903 | |
| 7,277,722 | ||
| Shares in Bank of New Zealand | 8,045,165 | 7,994,660 |
| New Zealand National Airways Corporation | 300,000 | 540,000 |
| British Commonwealth Pacific Airlines, Ltd. | 3,000 | 300,000 |
| British Petroleum Co. of New Zealand, Ltd. | 63,750 | 318,750 |
| Linen Flax Corporation of New Zealand | 190,000 | 190,000 |
| Investment in State Advances Corporation | 31,910,788 | 31,910,788 |
| Share in Nauru and Ocean Island phosphates | 192,044 | 192,044 |
| Mining | 2,726,404 | 4,204,191 |
| Tourist resorts | 780,310 | 828,357 |
| Immigration | 1,967,739 | 291,532 |
| War Loans (1914–18) | 34,700,129 | 34,193,880 |
| War expenses (1939–45) | 221,100,463 | 210,946,217 |
| Miscellaneous assets and services | 11,614,026 | 4,382,336 |
| Cash and investments in hand | 437,558 | 769,496 |
| Totals | £578,380,582* | £578,078,538* |
MOVEMENT IN PUBLIC DEBT DURING 1947–48.—A summary of transactions in connection with the public debt during the year ended 31st March, 1948, is as follows. Where the nominal amount differs from that given in New Zealand currency, the nominal amounts are recorded in italics.
| —— | Amount outstanding at | + Increase; - Decrease. | |
|---|---|---|---|
| 31st March, 1947. | 31st March, 1948. | ||
| External debt— | £ | £ | £ |
| London £(N.Z.) | 118,161,468 | 103,984,458 | -14,177,010 |
| Nominal | 94,529,175 | 83,187,566 | -11,341,609 |
| Australia | 861,300 | 779,000 | -82,300 |
| Internal debt— | |||
| Long-term debt | 427,990,107 | 439,111,972 | +11,121,865 |
| Floating debt | 55,000,000 | 55,000,000 | |
| Totals £(N.Z.) | 602,012,875 | 598,875,430 | -3,137,445 |
| Nominal | 578,380,582 | 578,078,538 | -302,044 |
A more detailed statement which shows also the main purposes for which loan-moneys were raised during the year 1947–48 is now given (nominal amounts, if differing from New Zealand currency totals, again being shown in italics):—
External debt decreases—
| 1. London— | |||
| Repayments from— | |||
| New issues in New Zealand | £ | £ | £ |
| £(N.Z.) | 14,000,000 | ||
| Nominal | 11,200,000 | ||
| Loans Redemption Account | |||
| £(N.Z.) | 177,011 | ||
| Nominal | 141,609 | ||
| Decrease, London £(N.Z.) | 14,177,011 | ||
| Nominal | 11,341,609 | ||
| 2. Australia— | |||
| Repayments from Loans Redemption Account | 82,300 | ||
| Total, decrease, £(N.Z.) | 14,259,311 | ||
| Nominal | 11,423,909 | ||
| Internal debt— | ||
| Increases— | ||
| New issues for— | ||
| Purchase of Bank of New Zealand shares | 1,770 | |
| National development purposes— | ||
| Stock | 19,446,940 | |
| Treasury bills | 6,500,000 | |
| Repayments in London | 14,000,000 | |
| Repayments in New Zealand and Australia | 12,021,828 | |
| Total, increase | 51,970,538 | |
| Decreases— | ||
| Loans Redemption Account: | ||
| Stock and debentures | 17,638,745 | |
| Treasury bills | 6,500,000 | |
| National Development Loans Account | 2,121,940 | |
| War Expenses Account | 3,300,000 | |
| Public Debt Redemption Fund | 11,287,988 | |
| Total, decrease | 40,848,673 | |
| Net increase in internal debt | 11,121,865 | |
| Total decrease public debt, £(N.Z.) | -£3,137,446 | |
| Nominal | -£302,044 |
PUBLIC DEBT CONVERSION.—A scheme of conversion of practically the whole of the locally domiciled debt bearing interest higher than 4 per cent. was successfully carried out in the early part of 1933. Holders had the option of dissenting, but interest on the dissented portion was made subject to an interest-tax of 33⅓ per cent. Holders who signified neither assent nor dissent were regarded as having assented.
On the now securities issued in lieu of converted securities the interest-rate was 4 per cent. per annum, except that in the case of securities exempt from income-tax the rate was 3½ per cent. until expiration of the period of exemption and 4 per cent. thereafter. The new securities were spread over six maturity dates, as follows:—
* For securities exempt from income-tax. | |
|---|---|
| 15th January, 1940. | 15th April, 1919. |
| 15th March, 1913.* | 15th May, 1952.* |
| 15th February, 1946. | 15th June, 1955. |
In cases where interest was reduced by not more than 20 per cent., the new securities issued were for the same amount of principal as the converted securities. Where the reduction of interest amounted to more than 20 per cent., the holder received a premium, the conversion scheme thus involving a slight increase (£491,254) in the aggregate gross debt.
The amount of debt to which the conversion scheme applied was £115,000,000. Actual assent to conversion was given in respect of some £110,000,000, and implied assent to approximately £5,000,000, dissents expressed covering only £480,000, or less than½ per cent. of the total.
The successful conversion of £5,000,000 5-per-cent. debt into 3½-per-cent. securities at £97 in October, 1933, was the only external debt operation undertaken during the fiscal year 1933–34.
During 1934–35 and 1935–36 further conversion operations were carried out in respect of external debt. The first comprised £3,989,100 of 4-per-cent. stock, which was converted to 3½-per-cent. stock at par in October, 1934. The second and larger operation concerned £10,135,800 of 5-per-cent. stock maturing in 1945 but with a right to redeem on or after 1st July, 1935. Of this, £8,000,000 was converted to 3-per-cent. stock at £98½, and the remainder (£2,135,800) redeemed.
On 1st August, 1936, the right accrued to redeem £5,869,989 of 6-per-cent. stock, and of this £4,000,000 was converted to 3-per-cent. stock at £98½, and the remainder (£1,869,989) redeemed, mainly by the utilization of funds in the Public Debt Repayment Account.
During the year 1936–37 opportunity was taken to exercise the right to repay £12,426,875 of 4-per-cent. 1937–40 stock and debentures domiciled in New Zealand. Cash and conversion applications totalled £11,440,249, and the balance required for redemption was found by the issue of Treasury bills for £925,000, and by the utilization of £61,626 from debt-redemption resources.
Stock to the value of £17,173,191 fell duo in London on the 1st January, 1940, and to meet this the Government arranged for the issue of a £16,000,000 sterling cash and conversion loan bearing interest at 3½ per cent. per annum at £99 per cent. The remainder of the £17,173,191 was held by New Zealand institutions, and other arrangements were made for its conversion. The £16,000,000 conversion loan issued in January, 1940, was disposed of in January, 1945, when the final instalment fell due. The conversion operations, which took place each half-year over the five years, resulted in £4,605,300 being converted in London and £11,394,700 repaid, the funds for redemption being found from moneys available in New Zealand for debt redemption and from the proceeds of issues in renewal in Now Zealand.
Conversion of £21,273,480 New Zealand domiciled stock nearing maturity was provided for in the 1941 conversion loans, the prospectus of which was issued on 15th May, 1941. Two classes of stock were issued in this case—namely, 3¼ per cent. stock issued at £97 per cent. and repayable on 15th September, 1957–60, and 3 per cent. stock issued at par and repayable on 15th September, 1946–48.
Stock was issued in multiples of £5, and any stock or debentures subject to the offer but not converted was to be repaid at par on the respective conversion dates.
A conversion offer was also made in New Zealand to holders of stock and debentures totalling £9,807,450 maturing on 1st February, 1946, but in respect of which the Government had the option to repay on or after 15th February, 1943. This loan carried interest at 4 per cent., and the conversion offer was for 3 per cent. stock maturing in 1960–63 with a premium of £3 per cent., or 2½ per cent. stock maturing in 1949–51 with a premium of £1 per cent. Applications closed on 11th March, but as the conversion did not take place until May, the accounts for 1943–44 were not affected. Approximately £8,000,000 was converted, and the remainder paid off.
On 1st March, 1944, £7,339,656 sterling domiciled in London was due for repayment, bearing interest at 4½ per cent., and a conversion offer was made of 3½ per cent. securities at par repayable on 1st March, 1960–64. The whole loan was converted into new stock, £6,017,000 sterling being taken up by existing holders in the new issue and the balance by the Reserve Bank of New Zealand.
A conversion offer was made in London to holders of £7,580,907 4 1/2 per cent. stock repayable on 1st March, 1945, and £9,657,280 3 per cent. stock repayable on 1st April, 1945. New stock was offered at 3¼ per cent. maturing on 1st September, 1962–65, with a cash payment of 10s. per cent. to holders who converted. Applications for new stock totalled £14,904,247, and the balance of £2,333,940 was taken up by the Reserve Rank.
A conversion offer in respect of an internal loan totalling £8,931,480 maturing on 15th April, 1949, but in respect of which the Government had the option to repay on or after 15th April, 1946, was made in December, 1945. The new securities offered were 3 per cent. stock issued at par and maturing on 15th April, 1960–63. Holders of stock who did not accept the conversion offer were repaid in cash on 15th April, 1946.
A conversion offer was made in London in June, 1948, to holders of £16,000,000, 4½ per cent. inscribed stock maturing on 1st March, 1958, with the option of repayment at par on or after the 1st March, 1948. New stock at 3 per cent. maturing 1st September, 19966–68 was offered in exchange, while cash applications for the new stock were to be utilized for the redemption of the remaining amount of £3,225,465, 4½ per cent. 1948–58 stock.
WAR LOANS.—A schedule showing the successive war loans during the period 1939–45 is given below. A more detailed exposition of these loans is available in the 1946 issue of the Official Year-Book.
| Year and Month of Issue. | Amount of Loan. | Contribution in the Form of— | Rate of Interest. | Date of Maturity. | Remarks. |
|---|---|---|---|---|---|
| £ | Per Cent. | ||||
| 1940 | 10,000,000 (approx.) | Stock | 2½ | 10ct., 1953 | Compulsory. Non-interest bearing to 1 Oct., 1943. |
| Aug. 1941 | 10,000,000 | Stock (two classes) | 2½ | 1 Aug., 1946 | Oversubscribed £200,000. |
| 3 | 1 Aug., 1951–54 | ||||
| May 1942 | 15,000,000 | Stock (two classes) | 2½ | 15 Sept., 1947 | 1st Liberty Loan. Oversubscribed £2,500,000. |
| 3 | 15 Sept., 1952–55 | ||||
| Oct. 1942 | 10,000,000 | Stock (two classes) | 2½ | 15 May, 1948 | 2nd Liberty Loan. Oversubscribed £500,000. |
| 3 | 15 May, 1953–58 | ||||
| June 1943 | 35,000,000 | Stock (two classes) | 2½ | 15 June, 1947–49 | 3rd Liberty Loan. Oversubscribed £4,275,000. |
| 3 | 15 Dec., 1953–49 | ||||
| Bonds | 3 | Five-year term | |||
| National war savings accounts | 3 | Two- or three-year term | |||
| Aug.-Oct., 1944 | 40,000,000 | Stock (two classes) | 2½ | 15 Feb., 1949–50 | Victory Loan. Oversubscribed £672,104. |
| 3 | 15 Feb., 1955–58 | ||||
| Bonds | 3 | Five-year term | |||
| National war savings accounts | 3 | Two-year term | |||
| May-June, 1945 | 25,000,000 | Stock (two classes) | 2½ | 15 Apr., 1950–51 | Victory Loan. Oversubscribed approx. £500,000. |
| 3 | 15 Apr., 1956–59 | ||||
| Bonds | 3 | Five-year term | |||
| National war savings accounts | 3 | Two-year term |
As stated earlier, the amount of debt outstanding at 31st March, 1948, in respect of the Second World War was £210,946,217, a decrease of £10,154,246 from the total at the end of the previous year. All of this debt is domiciled in New Zealand.
DOMICILE OF DEBT.—The table following shows, for each of the eleven years ending 31st March, 1948, the amount of New Zealand'S public debt domiciled in London, Australia, and Now Zealand. All amounts shown are exclusive of the debt duo to the Imperial Government to which reference has been made elsewhere in this subsection.
| At 31st March, | Amount. | Percentage of Total on New Zealand Currency basis. | |||||
|---|---|---|---|---|---|---|---|
| London. | Australia. | New Zealand. | London. | Australia. | New Zealand. | ||
| £(Stg.) | =£(N.Z.) | £(N.Z.) | £(N.Z.) | Per Cent. | Per Cent. | Per Cent. | |
| 1938 | 130,665,907 | 163,332,384 | 882,600 | 132,461,726 | 55.05 | 0.30 | 44.65 |
| 1939 | 130,661,907 | 163,327,384 | 879,600 | 146,237,656 | 52.61 | 0.28 | 47.11 |
| 1940 | 131,672,161 | 164,590,202 | 879,600 | 164,164,666 | 49.93 | 0.27 | 49.80 |
| 1941 | 132,180,480 | 165,225,600 | 879,600 | 190,176,386 | 46.37 | 0.25 | 53.38 |
| 1942 | 127,664,454 | 159,455,568 | 862,300 | 230,779,870 | 40.77 | 0.22 | 59.01 |
| 1943 | 132,083,189 | 165,103,987 | 862,300 | 304,688,774 | 35.08 | 0.18 | 64.74 |
| 1944 | 132,916,719 | 166,145,898 | 862,300 | 366,746,933 | 31.13 | 0.16 | 68.71 |
| 1945 | 133,091,274 | 166,364,093 | 861,300 | 403,274,133 | 29.16 | 0.15 | 70.69 |
| 1946 | 94,529,174 | 118,161,468 | 861,300 | 472,749,936 | 19.97 | 0.14 | 79.89 |
| 1947 | 94,529,175 | 118,161,468 | 861,300 | 482,990,107 | 19.63 | 0.14 | 80.23 |
| 1948 | 83,187,566 | 103,984,458 | 779,000 | 494,111,972 | 17.36 | 6.13 | 82.51 |
During the period covered by the table the amount of the debt domiciled in London has decreased (on a New Zealand currency basis) by £59,347,926. Practically the whole of this decrease has occurred since 1945, the amount at 31st March of that year being £(N.Z.)166,364,093, as compared with £(N.Z.)103,984,458 at 31st March, 1948. The amount domiciled in New Zealand, on the other hand, has risen during the ten years by £361,650,246.
MATURITY YEARS OF DEBT.—The maturity years of the debt outstanding at the 31st March, 1948, are shown in the following statement, which distinguishes between the various countries of domicile.
| Loans maturing in Year ended 31st March,* | Debt maturing in— | Total. | |||
|---|---|---|---|---|---|
| London. | Australia. | New Zealand. | |||
| Public. | Departmental. | ||||
* In respect of many of the loans the Government has the option to redeem the securities at an earlier date on giving notice. † Interest-free loans are for various periods. ‡ Does not include £(N.Z.)32,738,886 debt due to Imperial Government to which reference has been made elsewhere in this section. | |||||
| £(N.Z.) | £(N.Z.) | £(N.Z.) | £(N.Z.) | £(N.Z.) | |
| Overdue | 3,445 | 3,445 | |||
| Treasury bills | 10,000 | 54,990,000 | 55,000,000 | ||
| Interest free† | 4,802 | 4,802 | |||
| 1949 | 6,981,040 | 272,675 | 7,253,715 | ||
| 1950 | 9,375,000 | 11,375,100 | 5,759,575 | 26,509,675 | |
| 1951 | 1,562,500 | 779,000 | 2,341,500 | ||
| 1952 | 2,603,475 | 5,455,030 | 8,058,505 | ||
| 1953 | 11,342,955 | 1,136,125 | 12,479,080 | ||
| 1954 | 9,153,224 | 9,307,375 | 360,565 | 18,821,164 | |
| 1955 | 6,100,170 | 358,930 | 6,459,100 | ||
| 1956 | 15,000,000 | 17,434,800 | 971,805 | 33,406,605 | |
| 1957 | 29,785,800 | 4,055,790 | 33,841,590 | ||
| 1958 | 24,031,831 | 20,910,695 | 134,783,720 | 179,731,246 | |
| 1959 | 10,006,920 | 63,624,590 | 73,631,510 | ||
| 1960 | 7,147,795 | 1,336,800 | 8,484,595 | ||
| 1961 | 7,889,599 | 18,951,010 | 2,264,415 | 29,105,024 | |
| 1962 | 14,000,000 | 14,000,000 | |||
| 1964 | 9,174,570 | 23,373,675 | 6,044,790 | 38,593,035 | |
| 1965 | 11,157,615 | 8,670,250 | 19,827,865 | ||
| 1966 | 21,547,734 | 1,125,240 | 2,400,000 | 25,072,974 | |
| 1972 | 6,250,000 | 6,250,000 | |||
| Totals | 103,984,458‡ | 779,000 | 187,621,912 | 306,490,060 | 598,875,430‡ |
DEPARTMENTAL INVESTMENTS.—As shown in the preceding table, £306,490,060 of the public debt outstanding at 31st March, 1948, was held by various Government Departments. A summary of these departmental investments is as follows:—
| £ | |
|---|---|
| Investments held by accounts within the Public Account | 26,552,345 |
| National Broadcasting Service | 1,950,000 |
| Marketing Department | 27,453,510 |
| Government Life Insurance | 6,670,860 |
| Maori Trustee | 538,860 |
| Post Office | 144,043,650 |
| Post Office: National savings | 40,250,000 |
| Public Trustee | 14,707,150 |
| Reserve Bank | 42,045,335 |
| State Advances Corporation | 410,250 |
| State Fire Insurance Office— | |
| Accident Branch | 717,500 |
| Fire Branch | 1,150,600 |
| Total | £306,490,060 |
PRICES OF NEW ZEALAND STOCKS.—The following table gives the quotations in London for the principal new stocks (excluding accrued interest) in December of each of the years 1937–44 and at quarterly intervals from March, 1945 to June, 1948.
| Date. | 3 Per Cent., 1952–55. | 3¼ Per Cent., 1962–65. | 3½ Per Cent., 1949–54. | 3½ Per Cent., 1960–64. | 4½ Per Cent., 1948–58. | 5 Per Cent 1956–72. | ||||||||||||
|---|---|---|---|---|---|---|---|---|---|---|---|---|---|---|---|---|---|---|
| £ | s. | d. | £ | s. | d. | £ | s. | d. | £ | s. | d. | £ | s. | d. | £ | s. | d. | |
| 1937—Dec. 2 | 90 | 10 | 0 | 97 | 16 | 3 | 103 | 17 | 6 | 114 | 1 | 3 | ||||||
| 1938—Dec. 1 | 76 | 15 | 0 | 85 | 11 | 3 | 93 | 7 | 6 | 99 | 11 | 3 | ||||||
| 1939—Dec. 7 | 83 | 6 | 0 | 91 | 10 | 0 | 97 | 11 | 3 | 106 | 0 | 0 | ||||||
| 1940—Dec. 5 | 91 | 10 | 0 | 97 | 6 | 3 | 103 | 6 | 3 | 111 | 15 | 0 | ||||||
| 1941—Dec. 4 | 94 | 18 | 0 | 99 | 6 | 3 | 101 | 16 | 3 | 113 | 10 | 0 | ||||||
| 1942—Dec. 3 | 91 | 5 | 0 | 96 | 16 | 3 | 100 | 6 | 3 | 108 | 1 | 3 | ||||||
| 1943—Dec. 2 | 97 | 5 | 0 | 99 | 16 | 3 | 104 | 2 | 6 | 114 | 11 | 3 | ||||||
| 1944—Dec. 7 | 99 | 15 | 0 | 101 | 12 | 6 | 104 | 16 | 3 | 104 | 8 | 9 | 116 | 10 | 0 | |||
| 1945—Mar. 1 | 100 | 0 | 0 | 101 | 5 | 0 | 102 | 12 | 6 | 105 | 0 | 0 | 105 | 0 | 0 | 116 | 18 | 9 |
| June 7 | 100 | 2 | 6 | 101 | 2 | 6 | 101 | 11 | 3 | 104 | 6 | 3 | 104 | 11 | 3 | 117 | 15 | 0 |
| Sept. 6 | 100 | 3 | 9 | 102 | 3 | 9 | 102 | 7 | 6 | 104 | 18 | 9 | 104 | 8 | 9 | 117 | 5 | 0 |
| Dec. 6 | 99 | 17 | 6 | 102 | 10 | 0 | 101 | 12 | 6 | 103 | 11 | 3 | 103 | 1 | 3 | 117 | 5 | 0 |
| 1946—Mar. 7 | 102 | 1 | 3 | 105 | 8 | 9 | 103 | 3 | 9 | 107 | 16 | 3 | 103 | 18 | 9 | 118 | 2 | 6 |
| June 6 | 102 | 15 | 0 | 107 | 13 | 9 | 102 | 17 | 6 | 109 | 7 | 6 | 103 | 17 | 6 | 120 | 1 | 3 |
| Sept. 6 | 102 | 11 | 3 | 108 | 6 | 3 | 102 | 18 | 9 | 109 | 8 | 9 | 103 | 10 | 0 | 119 | 15 | 0 |
| Dec. 9 | 104 | 12 | 6 | 112 | 17 | 6 | 103 | 3 | 9 | 113 | 11 | 3 | 103 | 8 | 9 | 123 | 1 | 3 |
| 1947—Mar. 7 | 104 | 13 | 9 | 112 | 3 | 9 | 102 | 16 | 3 | 112 | 18 | 9 | 102 | 11 | 3 | 123 | 7 | 6 |
| June 6 | 104 | 10 | 0 | 110 | 7 | 6 | 102 | 8 | 9 | 112 | 1 | 3 | 102 | 0 | 0 | 123 | 10 | 0 |
| Sept. 5 | 100 | 18 | 9 | 102 | 18 | 9 | 100 | 18 | 9 | 104 | 8 | 9 | 101 | 3 | 9 | 115 | 5 | 0 |
| Dec. 5 | 99 | 8 | 9 | 103 | 3 | 9 | 101 | 3 | 9 | 106 | 1 | 3 | 105 | 5 | 0 | 102 | 16 | 3 |
| 1948—Mar. 2 | 102 | 6 | 3 | 104 | 0 | 0 | 101 | 16 | 3 | 106 | 2 | 6 | 105 | 5 | 0 | 102 | 17 | 6 |
| June 4 | 101 | 7 | 6 | 103 | 18 | 9 | 102 | 3 | 9 | 106 | 6 | 3 | 104 | 17 | 6 | 103 | 0 | 0 |
INTEREST.—Of the public debt outstanding at 31st March, 1932, approximately 30 per cent. only of the total bore interest at a rate of 4 per cent. or lower. As a result of conversion operations and of a general decline in interest rates for now money, the amount of debt bearing interest at a rate of 4 per cent. or under at 31st March, 1948, was £556,877,099, or nearly 93 per cent. of the total, while £449,878,352, or approximately 75 per cent., did not exceed 3 per cent. Of the debt domiciled in New Zealand at 31st March, 1948, no less than 88 per cent. was at rates of 3 per cent. or under, the remainder (or 12 per cent.) being at rates which did not exceed 4 per cent. A classification of the public debt as at 31st March, 1948, according to the rates of interest payable and domicile is contained in the following table.
| Rate of Interest, Per Cent. | London. | Debt maturing in— | Total. | Gross Annual Interest Charge. | |
|---|---|---|---|---|---|
| Australia. | New Zealand. | ||||
* Excludes debt due to Imperial Government (vide page 432). | |||||
| £(N.Z.) | £(N.Z.) | £(N.Z.) | £(N.Z.) | £(N.Z.) | |
| Overdue | 3,445 | 3,445 | |||
| Free | 4,802 | 4,802 | |||
| 1 | 69,000,000 | 69,000,000 | 690,000 | ||
| 2½ | 150,892,605 | 150,892,605 | 3,764,515 | ||
| 3 | 15,000,000 | 214,977,500 | 229,977,500 | 6,899,325 | |
| 3¼ | 21,547,734 | 20,627,725 | 42,175,459 | 1,370,702 | |
| 3½ | 26,217,393 | 9,157,630 | 35,375,023 | 1,238,126 | |
| 4 | 29,448,265 | 29,448,265 | 1,177,930 | ||
| 4½ | 24,031,831 | 24,031,831 | 1,081,432 | ||
| 5 | 15,625,000 | 15,625,000 | 781,250 | ||
| 5½ | 1,562,500 | 779,000 | 2,341,500 | 128,783 | |
| Totals | 103,984,458* | 779,000 | 494,1,972 | 598,875,430* | 17,132,063 |
The total amount of interest payable on the public debt as at 31st. March, 1948, was £17,132,063, which gives an average rate of £2 17s. 3d. per cent.
The amount of interest and the average rate per cent. payable on the debt domiciled in the various markets were:—
| Average Rate. | ||
|---|---|---|
| £(N.Z.) | £ s. d. | |
| London | 4,016,530 | 3 17 3 |
| Australia | 42,845 | 5 10 0 |
| New Zealand | 13,072,688 | 2 12 11 |
The total of interest payments from the Consolidated Fund during the year ended 31st March, 1948, was £17,825,052. Of this amount, £(N.Z.)4,540,361 was paid in London, and £117,260 in New Zealand on account of debt domiciled in London. An amount of £(N.Z,)44,903 was paid in Australia in respect of debt domiciled in that country, while £13,122,528 was paid in New Zealand in respect of internal debt.
The total amount so credited on account of capital liability during 1947–48 was £2,764,251, the principal contributing accounts being Post and Telegraph, £746,316; Electric Supply, £1,153,027; Housing Account, £488,933; Housing Construction, 1947–48, £49,185; and Land for Settlements, £300,000. Interest is also received from the investment of other public moneys, the total under this heading being £2,238,477, including £300,724 from the Public Debt Redemption Fund, £1,255,054 from the State Advances Corporation, £326,241 from the Public Account Cash Balance Investments Account, and £95,322 from the Deposits Account. The total interest receipts of the Consolidated Fund were thus £5,002,728, leaving the net interest charges for the year £12,822,324, as compared with £12,844,776 in 1946–47.
Certain changes in practice in the treatment of interest receipts and payments of the Consolidated Fund have to some extent invalidated a comparison of interest charges for recent years. Prior to the financial year 1943–44 the premium, or cost of exchange, on interest-moneys remitted abroad as not charged against interest, but was treated as a separate item. Also certain interest recoveries prior to 1944–45 were treated as credits in reduction of expenditure, whereas now all interest credited to the Fund is treated as receipts. In the following table which covers the last eleven financial years, the cost of exchange on interest paid in London, has been added to the gross interest, payments for the years prior to 1943–44 in order to bring them into line with subsequent, years.
| Year ended 31st. March. | Gross Payments. | Receipts | Credits in Reduction. | Gross Payments, less receipts and credits. |
|---|---|---|---|---|
* Included with receipts. | ||||
| £(N.Z.) | £(N.Z.) | £(N.Z.) | £(N.Z.) | |
| 1938 | 11,333,760 | 2,141,365 | 2,340,653 | 6,851,742 |
| 1939 | 11,479,282 | 2,127,446 | 2,658,050 | 6,693,786 |
| 1940 | 12,296,402 | 2,908,746 | 2,932,359 | 6,455,297 |
| 1941 | 12,279,035 | 3,284,846 | 2,798,415 | 6,195,774 |
| 1942 | 12,833,806 | 3,466,364 | 2,781,074 | 6,586,368 |
| 1943 | 13,834,810 | 4,133,277 | 2,844,072 | 6,867,461 |
| 1944 | 15,613,270 | 4,281,922 | 3,250,678 | 8,080,670 |
| 1945 | 17,323,346 | 5,363,807 | * | 11,959,539 |
| 1946 | 18,584,434 | 5,857,264 | * | 12,727,170 |
| 1947 | 17,558,876 | 4,714,100 | * | 12,844,776 |
| 1948 | 17,825,052 | 5,002,728 | * | 12,822,324 |
Administration and management charges in respect of debt services amounted to £210,064 in 1947–18, as compared with £207,993 in 1946–47.
AMORTIZATION OF DEBT: Public Debt Repayment.—With certain exceptions, the repayment of the public debt is now subject to the provisions of the New Zealand Loans Amendment Act, 1947, which repealed the Repayment of the Public Debt Act, 1925, and certain sections of various Finance Acts. For this purpose there is issued annually out of the Consolidated Fund a sum equal to½ per cent. of the total amount of the defined portion of the public debt outstanding at the end of the preceding financial year, plus 4 per cent. of the total amount previously repaid or redeemed under the provisions of the Act. The bulk of the savings in interest on debt paid off is thus applied to further repayments of debt.
The annual contribution from the Consolidated Fund formerly payable to the Public Debt Repayment Account and since the abolition of the latter as from 1st April, 1947, to the Loans Redemption Account, is utilized to redeem such securities as the Public Debt Commission determines, which are a charge upon the public revenues of New Zealand and which are included in the defined portion of the public debt. All other moneys raised or available for the purpose of repayment of any loan forming a charge on public revenues are similarly paid into the Loans Redemption Account and utilized for the redemption of such securities charged upon the public revenues as the Minister of Finance from time to time determines.
Transactions involving merely the exchange of one class of securities for another of the same rate of interest and term, or where the only variation is an extension of the term by not more than two years, are no longer recorded in the Loans Redemption Account.
Under the Repayment of the Public Debt Act, 1925, a capital fund was created termed “The Public Debt Redemption Fund.” This fund was continued and its capital moneys were declared to be, in terms of the New Zealand Loans Amendment Act, 1947, as from the 1st April of that year, the following amounts:—
A sum of £3,250,000, being the balance of the State Advances Corporation stock set aside as an investment of the Fund by section 8 of the Finance Act, 1937.
A sum of £8,037,988 held by the Public Trustee and representing the accumulated balances of the old sinking funds which were constituted part of the Public Debt Redemption Fund by section 8 of the Repayment of the Public Debt Act, 1925.
Power was given by the New Zealand Loans Amendment Act, 1947, for the Public Debt Commission, constituted under this Act, to use these capital moneys for the redemption of public debt. This power was exercised during the 1947–48 financial year, and the result was the reduction of the public debt by £11,287,988 and the extinguishment of the fund.
Repayment of the public debt under the provisions of the New Zealand Loans Amendment Act, 1947, during the year ended 31st March, 1948, totalled £29,086,156, of which £4,456,280 was utilized from the annual contribution from the Consolidated Fund to the Loans Redemption Account, £13,341,888 came from other moneys in the account, and the remaining £11,287,988 from the Public Debt Redemption Fund.
The repayment scheme provided for under the New Zealand Loans Amendment Act, 1947, does not apply to the whole of the public debt, revenue bills and certain classes of the debt for which there are special amortization provisions being excluded. The latter include funded debt, loans raised for State advances, and loans raised in respect of electric supply. Of the total gross indebtedness (exclusive of funded debt) of £(N.Z.)598,875,430 at the 31st March, 1948, £(N.Z.)534,215,481 was subject to the repayment provisions of the Act.
The following table shows the operations of the Public Debt Repayment Account during each of the last five years of its existence as a separate account, together with the interest earnings of the Redemption Fund. To the 31st March, 1947, securities of a nominal value of £41,595,680 had been redeemed. The account had an unexpended balance of £229,695 at 31st March, 1947, which was transferred to the Loans Redemption Account on the 1st April, 1947.
| Year ended 31st March. | Interest on Redemption Fund (paid to Consolidated Fund). | Transfers from Consolidated Fund. | Utilized to redeem and cancel Securities. | Nominal value of Securities redeemed and cancelled. | |||
|---|---|---|---|---|---|---|---|
| 1/2 per Cent. of Debt at Beginning of Year or redeemed under Act. | 3½ per Cent. of Debt redeemed. | Total. | |||||
| Prior to Beginning of Year. | During Year.† | ||||||
* Computed from dates of redemption. | |||||||
| £ | £ | £ | £ | £ | £ | £ | |
| 1943 | 392,203 | 1,667,357 | 851,855 | 46,142 | 2,565,354 | 2,609,045 | 2,609,045 |
| 1944 | 394,361 | 2,067,687 | 943,171 | 42,656 | 3,053,514 | 2,420,480 | 2,420,480 |
| 1945 | 375,780 | 2,557,259 | 1,027,888 | 3,585,147 | 3,973,789 | 3,973,789 | |
| 1946 | 355,561 | 2,747,213 | 1,166,971 | 3,914,184 | 1,083,350 | 1,083,350 | |
| 1947 | 358,295 | 2,843,611 | 1,204,888 | 4,048,499 | 7,170,308 | 7,170,308 | |
Amortization of Funded Debt.—At the 31st March, 1922, £27,532,164 of New Zealand'S public debt was owing to the Imperial Government, all but £1,191,919 of this being on account of war expenditure. Arrangements were made with the Imperial Government in 1922 for the funding of this debt.
The funding was carried out on an annuity basis of 6 per cent., the total payment each year (payable half-yearly at 1st June and 1st December) being £1,651,930. Interest was at the rate of £4 19s. 5.88d. per cent., the balance of the 6 per cent. going to reduction of the debt.
Under the agreement the original amount of £27,532,164 would have been automatically discharged from the public debt by the end of the financial year 1958–59. The Imperial Government, however, following the Hoover proposals regarding war debts, voluntarily suspended New Zealand'S obligations in respect of the funded-debt payments due in and since December, 1931. On the other hand, a provision that any part of the funded debt may be redeemed at any time was taken advantage of in 1924, when £200,000 was paid off the Naval Defence Loan.
At the date of suspension, total payments amounted to £15,067,370, of which £11,635,406 represented interest payments and £3,431,964 (including the £200,000 additional paid off Naval Defence Loan) reduction of principal, leaving the outstanding balance of the funded debt at £24,100,200 (sterling).
The provisions of the New Zealand Loans Amendment Act, 1947, do not apply to the funded debt. This amount, together with £2,090,909 sterling, representing debt raised for State Advances purposes for which interest payments have been suspended by agreement with the Imperial Government since 1931, are excluded from all tables dealing with public debt given in this section.
Sinking Funds.—Special sinking funds exist in respect of certain classes of debts not covered by the New Zealand Loans Amendment Act, 1947.
NET INDEBTEDNESS.—While the sinking funds were annually increasing it was customary to regard the net-indebtedness figures as giving the best comparison of indebtedness between one year and another. The initiation of the present system of amortization, however, destroyed the comparison on this basis, and the gross figures (as shown at the beginning of this subsection) now afford a better and more comparable index. The figures of net indebtedness for the years 1938–48 at the nominal amount, and for the last nine years after making an allowance for exchange on the debt domiciled in London, are as follows:—
| As at 31st March. | Amount. | Per Head of Population. |
|---|---|---|
| Nominal Amount | ||
| £ | £ s. d. | |
| 1938 | 262,780,183 | 163 15 7 |
| 1939 | 277,362,335 | 170 14 3 |
| 1940 | 295,955,524 | 180 7 3 |
| 1941 | 321,830,253 | 196 13 10 |
| 1942 | 358,364,689 | 219 5 5 |
| 1943 | 436,864,876 | 267 6 10 |
| 1944 | 499,351,076 | 303 15 2 |
| 1945 | 533,997,319 | 317 17 3 |
| 1946 | 563,694,449 | 320 12 11 |
| 1947 | 576,131,170 | 321 5 8 |
| 1948 | 573,864,701 | 312 17 9 |
| New Zealand Currency | ||
| 1940 | 328,873,655 | 200 8 5 |
| 1941 | 354,875,373 | 216 17 9 |
| 1942 | 390,255,803 | 238 15 8 |
| 1943 | 469,885,674 | 287 11 0 |
| 1944 | 532,580,255 | 323 19 6 |
| 1945 | 567,270,138 | 337 13 4 |
| 1946 | 587,326,743 | 334 1 9 |
| 1947 | 599,763,463 | 334 9 3 |
| 1948 | 594,661,593 | 324 3 11 |
In general the net indebtedness shown in the foregoing table is merely the balance left after deducting from the amount of debentures and stock in circulation the accrued sinking funds, and the net balances of the Loans Redemption Account and also of the Public Debt Repayment Account until its incorporation in the Loans Redemption Account as from 1st April, 1947. No allowance is made for the fact that a portion of the debt is actually held by the Government itself. In the course of the year'S financial transactions securities are bought and sold by Treasury accounts, and the investments held as at the 31st March in each year, while forming part of the debt, do not represent amounts due directly or indirectly to the public. Public debt held by Treasury accounts as at the 31st March of the last five years has been: 1944, £17,069,645; 1945, £18,981,475; 1946, £21,059,265; 1947, £25,470,995; and 1948, £26,552,345.
In addition to the above, Government investments in corporations, &c., held at the 31st March, 1948 (shown in the return required by the Finance Act, 1947, and published in Parliamentary Paper B–1 [Pt. I]) are given in the following table:—
| Investment. | Amount at 31st March, 1948. |
|---|---|
| £ | |
| Hank of New Zealand | 12,004,716 |
| British Commonwealth Pacific Airlines, Ltd. | 300,000 |
| British Petroleum Co. of New Zealand, Ltd. | 318,750 |
| British Phosphate Commission | 483,900 |
| Linen Flax Corporation | 190,000 |
| New Zealand National Airways | 540,000 |
| New Zealand Woolpack and Textiles, Ltd. | 150,000 |
| Reserve Bank of New Zealand | 1,500,000 |
| State Advances Corporation | 37,798,014 |
| Tasman Empire Airways, Ltd. | 117,002 |
| Westport Coal Co., Ltd. | 890,204 |
| Kamo Collieries, Ltd. | 104,000 |
| Total | £54,396,586 |
GENERAL AND LOCAL GOVERNMENT DEBT.—The statistics given throughout this subsection refer to the indebtedness of the General Government only, and do not include the debt of local-governing authorities., which is dealt with in the section of this volume relating to local government.
Local governing authorities had at the 31st March, 1917, a gross indebtedness equivalent to £(N.Z.)64,007,115, and if this amount be added to the gross debt of the General Government at 31st March, 1947 £(N.Z.)602,012,875, the aggregate becomes £(N.Z.)666,019,990. This latter total is exclusive of £(N.Z.)32,738,886 debt to the Imperial Government funded in terms of the Finance Act, 1922. Allowing for duplication or; account of outstanding loans to local authorities from the State Advances Corporation and the Main Highways Board, and inscribed debt under the Government Loans to Local Bodies Act, the total is reduced to approximately £(N.Z.)661,051,226, which represents a rate of approximately £(N.Z.)369 per head of population.
The figures relating to local authorities' indebtedness in the foregoing paragraph are inclusive of Hospital Boards, and to this extent differ from those given in the section on local government. Hospital Board indebtedness at 31st March, 1947, totalled £4,741,275.
As early as 1892 the Government commenced the purchase of lands for cutting up for sale or lease to private individuals, and two years later the passing of the Advances to Settlers Act, 1894, marked the inauguration of a series of schemes for lending money to settlers, workers, &c., for the purchase of homes, the improvement of farms, and the development of resources and of industries. The schemes varied considerably in detail, but all lay in one of two main classes—those in which the money was advanced on security, and those in which the expenditure was incurred by the Government itself in the first place and recouped from sales or leases. Advances to settlers, workers, and ex-servicemen are the principal examples of the former class, and the purchase of land for settlements (including the settlement of ox-servicemen) is the principal example of the latter.
STATE ADVANCES CORPORATION.—The Mortgage Corporation of New Zealand Act, 1934–35, authorized the creation of a Corporation under a Board composed of directors appointed partly by the State and partly by the shareholders of the Corporation.
By the State Advances Corporation Act, 1936, the private capital invested in the Mortgage Corporation was cancelled, provision being made for repayment to shareholders in respect of shares held in the Corporation. The capital of the Corporation was maintained at £1,000,000, however, by an investment from the Consolidated Fund, while all securities issued by the Corporation carry a State guarantee. The management of the Corporation is vested in a Board of Directors consisting of two joint managing directors appointed by the Governor-General in Council, one or more other directors similarly appointed, and an ex officio member (necessarily a Treasury official) appointed by the Minister of Finance. In the exercise of its powers, the Board is enjoined to have regard to any representations that may be made by the Minister of Finance. Every direction in writing given by the Minister is binding on the Board.
The change in administration and the institution of a State guarantee on securities issued by the Corporation represented the major alterations to the preexisting law. All the functions of the Mortgage Corporation were transferred to the new body, while certain extensions of function were made—e.g., the administration of the Housing Act, 1919. Following is a résumé of the principal functions of the State Advances Corporation:—
The Corporation administers the State Advances, &c., loans previously transferred to the pre-existing Mortgage Corporation, viz.—
Mortgages in respect of advances to bottlers or workers under the State Advances Act, 1913:
Mortgages in respect of advances under the Rural Advances Act, 1926:
Debentures or other securities vested in the State Advances Superintendent in respect of advances to local authorities under Part III of the Local Bodies' Loans Act, 1926, or corresponding provisions of former Acts:
Crown mortgages in respect of advances to ex-servicemen of the 1914–1918 war under the Discharged Soldiers Settlement Act, 1915, or any amendments thereof (including advances under section 11 of the Finance Act, 1933):
In order to provide loan finance the Corporation may issue bonds, stock, or other securities which are State guaranteed.
The Corporation may advance on the security of a first mortgage on land, and normally such advances do not exceed two-thirds of the value of the security, but there is provision for the extension of that margin in certain cases, including the rehabilitation loans referred to later, and for such purposes as the erection of new houses. In cases where the normal margin is exceeded with the approval of the Government, the Minister of Finance guarantees the Corporation against any loss attributable to the granting of advances in excess of two-thirds of the value of the security.
The large majority of the loans granted by the Board are secured by table mortgage for terms varying from ten to forty-five years, but the Board has power to make advances on flat mortgage for a period of five years, but renewals of such mortgages cannot be extended for longer than one further period of five years. There is provision for varying the scheme of table mortgages in special circumstances, part of the mortgage (at least one-half) to be in the form of a table mortgage and the remainder a flat mortgage falling due on the date of the last instalment of the table mortgage.
A mortgagor may be required to effect a policy of life insurance as additional security, such policy to be assigned to the Corporation. A mortgagor may not give any subsequent mortgage or any other charge over land subject to any mortgage to the Corporation except with the written authority of the Board.
Each mortgagor is required to pay an amount equal to 2 per cent. of any mortgage granted by the Corporation as a contribution to the General Reserve Fund. These amounts, which may be borrowed as an addition to the principal sum if so desired, together with the surplus profits referred to below, and certain payments on account of mortgages transferred to the Corporation, form the General Reserve Fund.
The Board is required from time to time to fix the rates of interest to be paid under mortgages to the Corporation, so as to make adequate provision to cover the costs of administration and for all other matters incidental to the proper functioning of the Corporation. After such provision as the Minister of Finance thinks proper has been made for the depreciation of securities or other assets, and for such other matters as in his opinion are necessary for the efficient conduct of the business of the Corporation, the surplus for each financial year is to be paid into the Public Account unless the Minister, in his discretion, authorizes the Board to credit it, in whole or in part, to the General Reserve Fund of the Corporation.
In addition to its primary function of providing cheap long-term finance in the form of first mortgage on property, the Corporation has been authorized to make loans to local authorities out of the Housing Account for the purpose of erecting workers' dwellings or farm dwellings, and also advances for the development of existing industries or the establishment of new industries.
The Corporation is also authorized to act as agent for other Departments of State, more particularly in respect of the inspection and supervision of properties and the collection of moneys payable to such Departments.
As stated earlier, the mortgages securing outstanding advances to ex-servicemen of the 1914–18 war were transferred to the Corporation some years age and now form part of its general investments.
The Corporation acts as the agent of the Rehabilitation Board in obtaining valuations and preparing reports in respect of farm and residential property for submission to the Rehabilitation Loans Committee (or to District Loans Committees acting under delegated authority from the Rehabilitation Loans Committee), which has been appointed to consider and approve of loan applications lodged by ex-servicemen who are eligible for assistance under the Rehabilitation Act, 1941. The administration of such loans, when granted, is the subsequent responsibility of the Corporation. The classes of loans granted and the terms and conditions applicable thereto are set out in Section 46, Rehabilitation. The securities taken in respect of rehabilitation loans for farms or houses are similar to mortgages taken for the purpose of securing advances made under the Corporation'S ordinary lending activities, except that the Reserve Fund contribution on advances within the respective loan-limits, is paid by the War Expenses Account, this account also meeting interest concessions allowed in respect of these rehabilitation loans. In respect of other types of rehabilitation loans such as for businesses and the purchase of furniture and tools of trade, the necessary loan finance is provided from the War Expenses Account and these loans are also administered by the Corporation, on an agency basis. The form of security taken and the terms as to repayment vary according to the type of loan and the circumstances of the borrower.
By Order in Council dated the 5th March, 1937, the Board of Management of the State Advances Corporation was constituted the Rural Intermediate Credit Board established under the Rural Intermediate Credit Act, 1927, superseding the Public Trust Office, which had administered the Board'S business since the inception of the scheme in 1927. This change in control took effect as from 1st July, 1937. In terms of the Rural Intermediate Credit Amendment Act, 1946, the business of the Board was absorbed by the Corporation as from 1st October, 1946 (vide p. 449).
A brief reference to the Housing Act, 1919, and the Government'S housing scheme is given towards the end of this section, and particulars of the numbers of houses erected, financial operations, &c., are contained in Section 23 (Building and Construction).
Summary of Activities.—As already indicated, the Corporation, in addition to its normal lending functions, administers a number of other State activities, and a general summary of the business under administration as at 31st March, 1948, is as follows:—
| (a) Loans on mortgage— | Number. | Principal Investment. £ |
|---|---|---|
| Rural securities | 19,307 | 31,109,415 |
| Urban securities | 40,780 | 31,395,829 |
| (b) Government and local authority investments | 1,600 | 4,817,066 |
| (c) Administration and management of State rental properties involving 25,721 tenancies, representing a capital value of £37,985,322. The properties are the assets of the Housing Account (see Section 23), the funds of which are entirely separate and distinct from the funds of the Corporation. | ||
| (d) Governmental agencies for Treasury and other Departments, excluding rehabilitation loans, representing 720 accounts for a total sum of £180,387. | ||
| (e) Administration work in connection with financial assistance to servicemen. Total authorizations to 31st March, 1946, amounted to £930,220. | ||
| (f) Administration of rehabilitation loans granted to ex-servicemen of the Second World War:— | ||
| Number. | Principal Investment. £ | |
|---|---|---|
| Farm loans | 4,285 | 15,914,870 |
| Residential loans | 14,287 | 16,125,565 |
| Tools of trade | 334 | 4,805 |
| Furniture | 23,296 | 1,418,613 |
| Business | 3,140 | 1,755,203 |
| Miscellaneous | 176 | 45,649 |
The balances outstanding in respect of farm loans and residential loans are included in the figures under (a) above.
Financial.—Balance-sheet figures show that at 31st March, 1948, the authorized capital was £1,000,000, while stock and debentures outstanding were £58,522,590, an increase of £6,700,000 in the case of the latter compared with 31st March, 1947.
The General Reserve Fund, at 31st March, 1948, amounted to £4,753,336, and, in addition, there were specific reserves amounting to £2,805,176, making a total of £7,558,512, as compared with £7,225,871 at 31st March, 1947.
Mortgages and accrued interest at 31st March, 1948, totalled £62,261,350, an increase of £6,927,849 as compared with 31st March, 1947, while Government and local-authority securities at £4,867,965 were greater by £363,557.
The disposition and appropriation of profits in respect of operations during each of the last three financial years are given in the following table.
| — | 1945–46. | 1946–47. | 1947–48. |
|---|---|---|---|
| £ | £ | £ | |
| Gross income | 2,203,172 | 2,322,432 | 2,584,664 |
| Less interest on General Reserve Fund investments | 154,495 | 164,798 | 173,726 |
| Gross income (mortgage and temporary investments | 2,048,677 | 2,157,634 | 2,410,938 |
| Interest on stock and debentures | 1,610,637 | 1,654,141 | 1,839,546 |
| Gross profit | 438,040 | 503,493 | 571,392 |
| Management expenses | 230,021 | 297,404 | 308,318 |
| Administration of rehabilitation advances | 59,688 | 83,733 | 87,735 |
| Earthquake insurance | 9,232 | 10,187 | 9,986 |
| Reserve for losses | 45,000 | 37,775 | 20,038 |
| Transfer, General Reserve Fund | 34,381 | ||
| Net profit | 94,099 | 74,394 | 110,934 |
| Less reserve for taxes | 88,000 | 66,000 | 95,000 |
| Surplus payable to Crown | 6,099 | 8,394 | 15,934 |
The gross income of £2,584,664 in 1947–48 included £2,045,908 interest on mortgages and current accounts, £171,767 interest on Government and local-authority securities and temporary investments, and £366,390 recovery from the War Expenses Account on account of interest concessions to ox-servicemen on rehabilitation advances. Corresponding figures for 1946–47 were £1,893,095, £197,399, and £230,963 respectively.
Ordinary management expenses in 1947–48 were £308,318, against £297,404 in 1946–47. Surplus payable to the Crown rose from £8,394 in 1946–47 to £15,934 in 1947–48.
New Business.—A summary of loan operations (new business) for the last two financial years is given in the following table.
| Loans Authorized. | Year ended March, 1947. | Year ended March, 1948. | ||
|---|---|---|---|---|
| Number. | Value. | Number. | Value. | |
† Excludes the number of Supplementary loans. | ||||
| Urban securities— | £ | £ | ||
| Erection of dwellings | 3,356 | 4,395,383 | 2,865 | 3,801,920 |
| Refinance and other purposes | 3,978 | 3,783,849 | 3,133 | 2,939,425 |
| Supplementary | (4,012) | 593,289 | (3,122) | 467,775 |
| Total urban | 7,334† | 8,772,521 | 5,998† | 7,209,120 |
| Rural securities— | ||||
| Refinance and other purposes | 1,806 | 7,435,552 | 1,149 | 5,293,996 |
| Supplementary | (9) | 4,230 | (15) | 5,745 |
| Loans to industry (under section 29) | 3 | 75,500 | ||
| Local authorities | 19 | 244,500 | 18 | 1,337,120 |
| Grand totals | 9,159† | 16,456,803 | 7,168† | 13,921,481 |
The above figures include rehabilitation loans in respect of farms and houses. Other rehabilitation loans granted by the Rehabilitation Loans Committee and administered by the Corporation were as follows.
| Loans Authorized. | Year ending March, 1947. | Year ending March, 1948. | Total to 31st March, 1948. | |||
|---|---|---|---|---|---|---|
| No. | Value. | No. | Value. | No. | Value. | |
| £ | £ | £ | ||||
| Business | 1,661 | 1,137,119 | 1,344 | 996,878 | 5,940 | 3,650,719 |
| Furniture | 8,131 | 754,509 | 7,954 | 729,058 | 28,429 | 2,613,360 |
| Tools of trade | 169 | 6,297 | 187 | 5,401 | 1,188 | 38,806 |
| Miscellaneous | 118 | 30,077 | 56 | 15,647 | 312 | 67,980 |
| Totals | 10,079 | 1,928,002 | 9,541 | 1,746,984 | 35,869 | 6,370,865 |
A statement is given below of the aggregate number and amount of loans approved by the Board of Management since the Corporation commenced business in 1935.
| Number. | £ | |
|---|---|---|
| Farm (including Supplementary) | 9,847 | 27,912,750 |
| Residential (including Supplementary) | 37,330 | 37,634,261 |
| Local authorities | 539 | 6,994,733 |
| Industries | 22 | 192,015 |
| Totals | 47,738 | 72,733,759 |
The lending rate of the Corporation was maintained during 1947–48 at 4⅛ per cent. Rehabilitation loans to ex-servicemen for houses and farms were, however, at 3 per cent., reducible to 2 per cent. for the first year, and for business loans at 4 per cent., reducible to 2 per cent. for the first year. The amount involved in interest concessions of this kind is recouped from the War Expenses Account. Loans granted under the Corporation'S normal lending business are in general secured by table mortgages for varying periods. The following summary shows the annual cost—i.e., interest and principal payments—per £100 borrowed on table mortgage at 4⅛ per cent. for the various periods.
| Term. | Annual Amount payable. | ||
|---|---|---|---|
| £ | s. | d. | |
| Ten years | 12 | 6 | 2 |
| Fifteen years | 9 | 0 | 2 |
| Twenty years | 7 | 7 | 10 |
| Twenty-five years | 6 | 9 | 0 |
| Thirty years | 5 | 16 | 10 |
| Thirty-five, years | 5 | 8 | 6 |
| Forty years | 5 | 2 | 6 |
| Forty-five years | 4 | 18 | 2 |
The terms of lending for home-building were varied during the year 1937–38 to encourage the erection of further houses. New provisions were—
The previous restriction, limiting advances to persons earning less than £300 per annum (with an increased income limit in the case of those with large families), was removed.
The maximum loan was increased from £1,000 to £1,250, with provision for an increase beyond that figure in special cases.
Provided the applicant could make a reasonable cash contribution towards the cost of a section and dwelling and the proposal was otherwise acceptable, no limit was placed on the percentage to be advanced.
Where little or no cash could be provided by the applicant, he would be considered for a tenancy of a State rental house if such would be available within a reasonable period.
Advances on special loan were to be subject to the Corporation being satisfied as to the character and creditworthiness of the applicant, and the suitability of the section and proposed house.
Ownership of an existing dwelling was to disqualify an applicant for a special loan.
Transfer of a property subject to a special loan must be subject to consent of the Corporation.
Instalments were to be collected at convenient intervals, where possible as a deduction from wages.
In the case of loans to ex-servicemen, the maximum loan is £1,500, and the above provisions are in some other respects inapplicable to this type of loan.
Special plans prepared by leading architects are available in book form, and assistance in calling tenders and in the erection of the houses is available from the Corporation'S expert officers.
RURAL INTERMEDIATE CREDIT.—The Rural Intermediate Credit Board, appointed in terms of the Rural Intermediate Credit Act, 1927, provided a source from which farmers could obtain loan finance on favourable terms for such purposes as the purchase of stock and plant and farm improvements.
Pursuant to the provisions of Part VI of the State Advances Corporation Act, 1936, the former Rural Intermediate Credit Board went out of office on 1st July, 1937, and was replaced by the Board of Management of the State Advances Corporation, whose members became the Rural Intermediate Credit Board.
In terms of the Rural Intermediate Credit Amendment Act, 1946, the business of the Rural Intermediate Credit Board was, as from 1st October, 1946, absorbed by the State Advances Corporation, the Board being abolished as from that date.
Under the Act farmers may obtain assistance in the following manner:—
By borrowing through co-operative rural intermediate credit associations whose formation (with not less than twenty members and with certain defined objects) is provided for by the Act. The application for the loan is received and considered by the association concerned, which, on approving it, applies to the Corporation for its confirmation and for an advance to cover the loan. These loans are repayable on demand, but it has been the policy to arrange for the borrower to repay the amounts advanced in five equal instalments. Extensions beyond that period may be approved in suitable cases. An association may, with the approval of the Corporation, arrange with a bank or other approved financial institution for a loan in cases where the term is not more than six months.
Persons engaged in farming on their own account, trustees, executors, or administrators carrying on fanning operations, may obtain loans direct from the Corporation the conditions being similar to (a) above.
During the twenty-one years from the inception of the Rural Intermediate Credit system up to 31st March, 1948, advances exceeding £2,209,500 have been made.
At 29th February, 1948, there were twelve active co-operative rural intermediate credit associations in operation. The loans made through this channel during the year 1947–48 amounted to £21,392, and there were 206 loans current at the end of the year for an aggregate amount of £46,680. Loans made by associations in the previous year amounted to £31,008, and the amount outstanding at 30th June, 1945, was £69,706.
Loans granted direct by the Corporation in 1947–48 totalled £82,727, as compared with £44,173 in the previous year, the increase being due to the number of rehabilitation loans granted to ex-servicemen. At the close of the year there were 216 direct loans current for an aggregate amount of £132,752.
The interest fixed for advances other than to co-operative rural intermediate credit associations is now 5 per cent. per annum, except in the case of ex-servicemen eligible for rehabilitation assistance, where the interest rate is 4 per cent. per annum (rebated to 2 per cent. for the first year provided the loan conditions are fulfilled). In the case of loans to co-operative rural intermediate credit associations the rate charged is 4 per cent., so that associations may be in a position to make advances to their members at 5 per cent.
15—Ybk.
HOUSING.—The Housing Act of 1919, authorizing the acquisition of land and the erection of dwellings for disposal by way of sale or lease, was originally administered by the Labour Department, but the sections relating to administration were repealed by the State Advances Amendment Act of 1922, and the powers of the Housing Superintendent and of the Housing Board were thereupon transferred to the Slate Advances Superintendent and to the State Advances Board. No provision was made in the Act constituting the Mortgage Corporation of New Zealand for the administrating authority under the Housing Act, and the assets concerned therefore remained under the jurisdiction of the State Advances Superintendent.
Provision was made in section 16 of the State Advances Corporation Act, 1936, for the transference of the powers, functions, duties, and obligations of the State Advances Superintendent and of the State Advances Board to the State Advances Corporation and to the Board of Management respectively.
Under the provisions of the 1936 Act the Housing Account was constituted a separate account, financed from Government sources, and quite distinct from the lending operations of the Corporation. The Corporation is empowered, in connection with housing services, to make such charge against the Housing Account as may from time to time be approved by the Minister of Finance. The Housing Account was opened with the Reserve Bank of New Zealand on the 1st July, 1936, by the transfer of moneys held in the State Advances Account on that date in connection with the Housing Act, 1919.
The principal duties of the Corporation under the Housing Act are the following:—
The recording and investigation of applications for State tenancies by applicants other than ex-servicemen eligible for the preferential allocation of one-half of the available tenancies; the submission of the applications to the Housing Allocation Committees for consideration; and all incidental administration work and correspondence. The applications by eligible ex-servicemen are recorded by the Rehabilitation Department, and allocations to such applicants are approved by the Rehabilitation Committees. The number of current applications recorded with the Corporation as at the 31st of March, 1948, was 38,196. At the same date the Rehabilitation Department held 14,137 applications from eligible ex-servicemen.
The completion of tenancy arrangements with all successful applicants, including those ex-servicemen whose allocations are approved by the Rehabilitation Committees.
The control, management, and maintenance of the State rental houses, of which there were 25,721 of an aggregate value of £37,985,322 as at the 31st March, 1948, and the administration of 189 accounts where dwellings had been sold in terms of the Housing Act, 1919, to purchasers under agreement for sale and purchase, under which the principal sum owing as at that date was £105,800.
The consideration of applications by local authorities (City and Borough Councils) and employers for loans for the erection of houses, and the subsequent administration of loans granted. As at 31st March, 1918, there were 97 loans current under which the advances outstanding amounted to £989,083.
The granting of loans to local authorities (mainly County Councils) under the provisions of the Rural Housing Act, 1939, for re-advancing to farmers for the erection and improvement of farm dwellings. As at the 31st March, 1948, there were 41 loans current, under winch the advances outstanding amounted to £134,280.
Information regarding the operations of the Housing Construction Branch, the control of which was transferred to the Works Department early in 1944, may be found in Section 23 (Building and Construction).
INTRODUCTORY.—The Department of State now known as the Social Security Department has existed only since 1st April, 1939. Hence in setting forth the functions and activities of the Department it may be advisable to give a brief history of the introduction of the principal classes of pensions superseded by the social security scheme, and of the Pensions Department which administered them. This Department, which was totally absorbed into the Social Security Department, and the Employment Division of the Department of Labour, the major portion of which was similarly absorbed, formed the nucleus of the new Department.
HISTORY OF PENSIONS DEPARTMENT.—The Pensions Department came into being on the passing of the Old-age Pensions Act on 1st November, 1898, which represented the birth of social legislation of this type in New Zealand, and also the first statutory provision made by any British Commonwealth country for this form of assistance to aged persons.
On 1st May, 1909, the Department, which was then known as the Old-age Pensions Department, temporarily lost its identity, the Government, as an economy measure at a time of financial depression, deciding to merge the organization with the Post and Telegraph Department, where it remained until 14th November, 1912, when it once more became a separate entity.
An advance in social legislation was made in 1911 with the passing of the Widows' Pensions Act, which became operative on 1st January, 1912. It was in 1912 also that the Military Pensions Act, providing for pensions to veterans of the Maori Wars, was passed. The extent to which the Department had expanded is revealed by the fact that in the initial annual report of the original Department in 1899 it was shown that there were 7,443 pensions in force, representing one class only—namely, old-age pensions—whereas in the first annual report of the re-created Department in 1913 the number had grown to 18,390, representing three classes—old age, widows, and military (Maori War).
The year 1915 marked further advances in the progress of pensions legislation. On 4th August of that year the War Pensions Act, providing for pensions to disabled members of the New Zealand Forces of the war of 1914–18, and to dependants of disabled, deceased, or missing members of such Forces, and on 11th October of the same year, the Miners' Phthisis Act, which introduced pensions for miners who were totally incapacitated for work owing to miner'S phthisis, came into operation.
On 1st April, 1920, the Department assumed control of just under 1,000 epidemic pensions, which, since the influenza epidemic of 1918, had been administered by the Department of Health and paid through local Hospital Boards. On 1st October of the following year the Department'S activities were further extended, when approximately 2,000 Imperial pensions of all classes were taken over from the Treasury Department. In 1922 the branch of the Defence Department dealing with medical treatment of ex-members of the First New Zealand Expeditionary Force was amalgamated with the Pensions Department; this involved the running of an artificial-limb factory from 1922 to 1925.
On 1st April, 1923, the administration of Boer War pensions, Civil Service Act pensions, and other sundry pensions and annuities was transferred to the Department, and in the following year the enactment of the Blind Pensions Act marked a further stage in the progress of social legislation.
The next important advance in this form of social legislation was the passing of the Family Allowances Act, 1926, which came into operation on 1st April, 1927. This Act provided for the granting of allowances towards the maintenance of children of parents of limited income.
In 1935 the War Veterans' Allowances Act was passed to provide for returned servicemen who, apart from any wounds or other injuries received during war service, were ageing prematurely or otherwise becoming unemployable by reason of physical or mental disability. An amendment to the Pensions Act in 1936, not only enlarged the field of civil pension legislation, but made provision for the first time for the payment of pensions to invalids, apart from blind people, who, as stated earlier were first provided for in 1924.
In 1938 very important changes in the law relating to pensions, superannuation, and health services were introduced by the Social Security Act, which came into force on 1st April, 1939. The monetary benefits provided by the Act replaced and extended the existing civil pensions, and, as indicated earlier, the Pensions Department lost its identity from 31st March, 1939, and its staff and records merged into the Social Security Department the following day.
The following table illustrates the growth of the Pensions Department during the forty years of its history, and the development of humanitarian legislation during that period.
| Year. | Number of Pensions administered. | Classes of Pensions and Benefits. | Total Staff. |
|---|---|---|---|
| 1899 | 7,443 | 1 | Less than 12 |
| 1909 | 14,396 | 1 | 14 |
| 1919 | 51,790 | 5 | 175 |
| 1929 | 56,590 | 11 | 173 |
| 1939 | 117,747 | 11 | 337 |
EMPLOYMENT DIVISION (DEPARTMENT OF LABOUR).—In May, 1936, the Employment Promotion Act was passed, consolidating in one measure the whole of the legislation dealing with unemployment relief. The main features of this Act were the abolition of the Unemployment Board, which, originally formed in November, 1930, had been responsible for the promotion of employment and the administration of unemployment relief, and the placing of the responsibility for the administration of the Act on the Department of Labour. In addition, the assessment and collection of the employment-promotion taxation, which was first introduced in December, 1930, was made the responsibility of the Commissioner of Taxes. This employment-promotion tax was abolished on the introduction of the social security scheme. The main activities undertaken by the Employment Division of the Department of Labour were the administration of relief of unemployed persons, the promotion of work and industries for the absorption of surplus labour, and the placement of unemployed persons in industry through the medium of the State Placement Service.
The coming into operation of the Social Security Act ended the operations of the greater part of the organization of the Employment Division, the major portion of the staff being then absorbed into the Social Security Department.
SOCIAL SECURITY.—The Social Security Act, 1938, which came into operation on 1st April, 1939, may be said to have as its principal aim the provision for payment of superannuation and other benefits designed to safeguard the people of New Zealand from disabilities arising from age, invalidity, widowhood, orphanhood, unemployment, sickness, or other exceptional conditions. Its two main objectives were:—
To substitute for the previous system of non-contributory civil pensions a system of monetary benefits on a contributory basis:
The inauguration of a system of medical and hospital benefits and of other related benefits.
The various classes of pensions, &c., which were superseded by monetary benefits of similar application were old-age pensions, widows' pensions, Maori War pensions, miners' pensions, invalidity pensions, and family allowances, while the unemployment benefit replaced the system of sustenance payments previously in force. In addition, four new classes of monetary benefits were inaugurated—the orphans' benefit, the sickness benefit, the emergency benefit (for cases of hardship), and the universal superannuation benefit.
The Social Security Amendment Act, 1945, introduced a further important addition to the social legislation of New Zealand. It established the principle of universal family benefits, and from 1st April, 1946, each mother receives a benefit in respect of each of her dependent children irrespective of the family income or property.
A further development in 1948 occurred with the passing of legislation providing for reciprocity of social security benefits with Australia, and reciprocity in relation to family benefits with Great Britain and Northern Ireland. The respective Acts were entitled the Social Security (Reciprocity with Australia) Act, 1948, the Family Benefits (Reciprocity with Great Britain) Act, 1948, and the Family Benefits (Reciprocity with Northern Ireland) Act, 1948.
The first mentioned of these three Acts repealed the Age Benefits and Invalids' Benefits (Reciprocity with Australia) Act, 1943, and came into force on the 1st July, 1949. In the 1948 Act the classes of benefit were extended and now cover the following: age-pensions and age-benefits, invalid pensions (including wives' and childrens' allowances) and invalids' benefits, widows' pensions and widows' benefits, child endowment and family benefits, unemployment benefits, and sickness benefits.
Administration.—The Social Security Act, 1938, established a Department of State entitled the Social Security Department, under the control of a Commission consisting of not more than three members. The Department administers, under the direction of the Minister of Social Security, Part II of the Act dealing with those monetary benefits to which reference has been made, while Part III of the Act dealing with medical, hospital, and other related benefits, is administered by the Health Department under the direction of the Minister of Health. Provision was made in the Social Security Amendment Act, 1947, for the Social Security Commission, with the written consent of the Minister of Social Security, to delegate to any Registrar or other officer of the Department any of its powers under Part II of the principal Act.
The Act states that the Social Security Department may be divided into two or more divisions, and two have been created each under the control of a Director, one dealing with unemployment and sickness benefits, and the second with all other monetary benefits. The War Pensions Act, 1943 (which consolidated and amended the previously existing legislation on the subject), and the War Pensions and Allowances (Mercantile Marine) Act, 1940, are also administered by the Social Security Department, one of whose directors is also designated Secretary for War Pensions. It should be noted, however, that, unlike the benefits under the Social Security Act, which are paid from the Social Security Fund (referred to later), war pensions are paid through the Consolidated Fund from general taxation.
Financial Provisions.—Finance to enable the provisions of the Act to be carried out is provided for by the establishment within the Public Account of the Social Security Fund. The principal revenue of the Fund is derived from a charge on salaries, wages, and other income, including the income of companies, but the Act also makes provision for the payment to the Fund of such other moneys as may be appropriated by Parliament from time to time, and a substantial and increasing amount has been received from the Consolidated Fund each year.
The social security charge, which had been at the rate of 1d. for every 1s. 8d. or part thereof of income since the inception of the scheme, has now been increased to 1d. for every 13⅓d. or part thereof—i.e., 1s. 6d. in the £1. The increase, in the case of salaries and wages, became effective from and including 13th May, 1946, while “other” income received during the year ended 31st March, 1946, was subject to the increased rate.
Prior to 1st April, 1946, every person of the age of sixteen years and over was required to register under the Act and to pay a registration fee. The fee payable by females and by males between sixteen and twenty years of age was 5s. per annum, and by males over twenty years of age 5s. per quarter. This registration fee was abolished as from the date mentioned.
Part IV of the Social Security Act provides that the assessment, collection, and recovery of the social security contribution shall be administered as if it were income-tax, and that the Commissioner and Deputy Commissioner of Taxes and all officers appointed for the purposes of the Land and Income Tax Act, 1926, shall have, in respect of the social security contribution, the same powers as they have in respect of income-tax, and all provisions of that Act shall apply with respect to the social security contribution in the same manner in all respects as with income-tax.
The Finance (No. 2) Act, 1948, amended the principal Act by providing that the social security charge on income other than salary or wages shall be payable half-yearly on the 1st July and the 1st November in the year following the financial year for which that income was derived. This provision was to apply to the charge on income derived for the year ending on the 31st March, 1949, or for any subsequent year.
The revenue of the fund for the financial years 1943–44 to 1947–48 was made up as follows:—
| —– | 1913–44. | 1944–45. | 1945–46. | 1946–47. | 1947–48. |
|---|---|---|---|---|---|
| £ | £ | £ | £ | £ | |
| Registration fees | 551,064 | 574,436 | 585,713 | 15,287 | |
| Charge on salaries and wages | 8,490,200 | 8,785,454 | 9,161,218 | 13,519,800 | 16,105,491 |
| Charge on company income | 1,432,484 | 2,005,091 | 1,948,684 | 8,864,084 | 10,071,144 |
| Charge on other income | 2,873,424 | 2,873,313 | 3,447,558 | ||
| Penalties and fines | 30,601 | 21,772 | 24,135 | 4,482 | |
| Grants from Consolidated Fund (Social Security Act) | 4,100,000 | 4,500,000 | 7,000,000 | 18,000,000 | 16,000,000 |
| Other receipts | 14,312 | 16,340 | 118,884 | 116,511 | 97,433 |
| Total revenue | 17,492,085 | 18,776,406 | 22,286,192 | 40,520,164 | 42,274,068 |
Payments from the fund during the year ended 31st March, 1948 (with 1946–47 figures in parentheses) totalled £40,443,126 (£36,825,490), of which monetary benefits accounted for £32,485,471 (£29,775,166), medical, &c., benefits for £7,021,488 (£6,211,580), emergency benefits £227,857 (£134,211), administration expenses £707,883 (£704,193), and other payments £427 (£340). Details of the various benefits in force and the amounts paid in respect thereof are given later in this section.
Monetary Benefits.—A brief description of the main provisions relating to the various monetary benefits under Part II of the Act is now given. The rates prescribed for several of the benefits under the principal Act were increased by way of bonus to the extent of 5 per cent. of the maximum rate payable in each case, as from 1st May, 1942. The Social Security Amendment Act, 1943, however, superseded these bonuses with permanent increases as from 1st July, 1943, and further increases were granted in most benefits as from 1st October, 1945. The Social Security Amendment Act, 1947, provided for a further increase in the rate of benefits payable, the effective date being as from 1st October, 1947. The same amendment gave the Commission power to continue superannuation, family and miner'S benefits without review for a period longer than the twelve months to which it was previously restricted. Other benefits subject to a means test may not be granted, or renewed for a period exceeding twelve months without further investigation as to change in circumstances. The Social Security Amendment Act, 1949, also provided for an increase in the basic rates of monetary benefits as from the 1st June, 1949. The rates quoted hereunder are those at present in force (November, 1949).
Payments of benefits, other than invalid'S, miner'S, or Maori War benefits for which separate provision had been made earlier, during temporary absence from New Zealand was made permissible, at the Commission'S discretion by the Finance (No. 2) Act, 1948.
Persons employed outside New Zealand will be deemed to be resident in New Zealand if employed on Government business, and may be so deemed at the Commission'S discretion if employed otherwise, for the purposes of Part II of the principal Act, where liable for the payment of social security charge on their earnings. In each case the wife and children are also included.
Superannuation Benefits.—Every person over the age of sixty-five years who satisfies the prescribed residential qualifications is entitled to a superannuation benefit without conditions as to income or property. The residential qualifications are contained in section 12 of the Act, which reads as follows:—
No person shall be entitled to a superannuation benefit under this Part of this Act unless he satisfies the following conditions, namely:—
In the case of a person who was resident in New Zealand on the fifteenth day of Match, nineteen hundred and thirty-eight (being the date of the passing of the Pensions Amendment Act, 1937), that he has resided continuously in New Zealand for not less than ten years immediately preceding the date of his application for a superannuation benefit:
In any case to which the last preceding paragraph does not apply, that he has resided continuously in New Zealand for not less than twenty years immediately preceding the date of his application for a superannuation benefit.
For the purposes of the last preceding subsection, continuous residence in New Zealand shall not be deemed to have been interrupted by absence therefrom:—
In any case to which paragraph (a) of the last preceding subsection applies:—
If the total period of absence from New Zealand does not exceed one year; or
If the total period of absence from New Zealand exceeds one year but does not exceed that period by more than six months for every year of residence in New Zealand in excess of a period of ten years, and the applicant has been actually resident in New Zealand for the twelve months immediately preceding the date of his application:
In any case to which paragraph (b) of the last preceding subsection applies:—
If the total period of absence from New Zealand does not exceed two years; or
If the total period of absence from New Zealand exceeds two years but does not exceed that period by more than six months for every year of residence in New Zealand in excess of a period of twenty years, and the applicant has been actually resident in New Zealand for the twelve months immediately preceding the date of his application.
Provision is also made to cover absence by a seaman serving on board any ship registered or owned in New Zealand and absence in any capacity as a member of any of His Majesty'S Forces.
The rate of the benefit is £10 per annum commencing on 1st April, 1940, and continuing at that rate for one year, thereafter being increased by £2 10s. per annum. Thus, as from 1st April, 1941, the rate of superannuation benefit was £12 10s. per annum, from 1st April, 1942, £15 per annum, from 1st April, 1949, £32 10s. per annum, and so on until the maximum of £130 per annum is reached on 1st April, 1988.
A superannuation benefit is not payable in addition to any other benefit. For example, a superannuation benefit and an invalid'S benefit cannot be paid to the one person. Similarly, a superannuation benefit and an age-benefit are not payable to the one person. If a beneficiary in receipt of a superannuation benefit is later granted an age-benefit, the maximum benefit payable is £130, the amount of the superannuation benefit being merged in the amount of the age-benefit granted.
Age-benefits.—Every person who has attained the age of sixty years is entitled to receive an age-benefit, subject to satisfying certain qualifications in regard to residence and character. The residential qualifications are the same as those set out under the preceding heading in regard to superannuation benefits. The character qualifications mainly relate to desertion of wife or husband or wilful failure in the case of a married man or widower to provide adequate maintenance for wife or for children under sixteen years of age.
The basic rate of the benefit is £130 per annum, subject to certain deductions on account of income or accumulated property, &c. Particulars of additions to and deductions from the basic rate are as follows:—
Unmarried applicants: The basic rate is reduced by £1 for every complete £1 of income in excess of £52 per annum.
Married applicants: Where husband and wife are both entitled to the benefit, the basic rate is reduced by 10s. for every complete £1 of their combined incomes in excess of £52 per annum. In cases where only one of them is entitled to the benefit, the reduction is at the rate of £1 for every complete £1 of their total income (excluding a family benefit) in excess of £182 per annum. A further provision allows of an extra payment, not exceeding £130 per annum, to a male recipient when his wife is ineligible for any benefit under the Act. This is payable only up to a limit of the total income of the couple plus benefit of £312 per annum.
Age-beneficiaries are entitled to surrender their benefits while their earnings are excessive and to apply for reinstatement immediately the employment ceases. The earnings received during the period that both husband and wife were not on age-benefits are not taken into account.
In addition to the foregoing, a special allowance not exceeding £13 13s. per annum may be paid to any person in receipt of an age-benefit who served as a member of a New Zealand contingent in connection with the South African War or in any of His Majesty'S Forces in that war if he had been born in New Zealand or was domiciled therein at the commencement of the war: Provided that an allowance shall not be granted under this section of such an amount that the total amount from all sources (including the value of any benefits in kind) received by the beneficiary in any year shall exceed the sum of £182.
The Commission may also, in its discretion, increase by an amount not exceeding £26 per annum the rate of any benefit under Part II of the Act (including the age-benefit) payable to any beneficiary who was one of the parents of a deceased member of any of His Majesty'S Forces established in New Zealand whose death was attributable to service with the Forces. Similar powers exist in respect of a parent of a deceased member of the New Zealand mercantile marine within the meaning of the War Pensions and Allowances (Mercantile Marine) Act, 1940, whose death was attributable to the Second World War. The provision also covers from 1st April, 1949, the case of a deceased member of any Force or of the Mercantile Marine of any part of the British Commonwealth other than New Zealand who was domiciled in New Zealand at the commencement of the Second World War and whose death was directly attributable to that war.
In addition to the deductions on account of income set out above, the rate of the benefit is reduced by £1 for every £10 of net capital value of accumulated property in excess of £500. The net accumulated property of a husband or wife for this purpose is half of the total net accumulated property of both.
In computing the net capital value of property no account is taken of the following, but any income derived therefrom is charged as income:—
Any interest in land or house property, or mortgage or other encumbrance over such property:
Any interest in any annuity or in any policy of life-assurance:
Any furniture used in the home of the applicant or any personal effects belonging to the applicant.
Income from a property and the value of the same property are not both charged to reduce the age-benefit—e.g., if shares worth £600 produce an income of £30 per annum, either the value of the shares or the income therefrom may be charged, whichever method provides for the greater reduction.
Where an applicant for an age-benefit is totally blind, the rate of the benefit, together with any benefits and allowances payable to or in respect of the wife or husband of the applicant, is not to be less than the total of benefits and allowances that would have been paid if the applicant had been eligible for an invalid'S benefit.
Widows' Benefits.—Every widow who is the mother of one or more children under sixteen years of age is entitled to a benefit in respect of widowhood. In addition, any widow not being the mother of children under sixteen years of age who satisfies the following conditions is also entitled to the benefit:—
A widow who has had one or more children, provided that the duration of her marriage was not less than fifteen years or, in the alternative, that the aggregate of the period of the duration of her marriage and any subsequent period during which she had the care of at least one of her children under sixteen years of age was not less than fifteen years:
A widow who, on the expiration of not less than five years after the date of her marriage, became a widow after she attained the age of fifty years:
A widow of not less than fifty years of age who became a widow after she had attained the age of forty years, provided that the duration of her marriage was not less than ten years and that not less than fifteen years have expired since the date of her marriage.
It will be noted that no widow under fifty years of age who has not had one or more children can qualify for the benefit.
Provision is also made for other classes of women (not being widows) to receive benefits as if they were widows. Particulars are as follows:—
Any married woman who satisfies the Commission that she has been deserted by her husband and that she has taken proceedings against him for a maintenance order under the Destitute Persons Act, 1910. Any moneys paid by a husband, whether by way of maintenance order or otherwise, are set off against any benefit so granted:
Any married woman in respect of whose husband a reception order is in force under the Mental Defectives Act, 1911 (whether or not he is detained in an institution under the Act), or whose husband is for the time being detained in an institution under that Act, whether as a voluntary boarder or otherwise.
Except in the case of widows with one or more children under sixteen years of age, no widow is entitled to receive the widows' benefit unless she and her husband were both resident in New Zealand for not less than three years immediately preceding the death of the husband.
The term “children” does not include any child born out of New Zealand unless at least one of the following conditions is satisfied—namely, that:—
The mother of the child was only temporarily out of New Zealand at the time of its birth; or
Both parents were resident in New Zealand for the three years immediately preceding the date of the father'S death (in cases where the husband of the applicant is dead); or
Both parents were resident in New Zealand for the three years immediately preceding the desertion of the applicant by her husband or for the three years immediately preceding the making of a reception order in respect of the husband under the Mental Defectives Act or before his admission to an institution under that Act.
The term “child” includes a step-child or a child adopted during the lifetime of the husband of the applicant (in cases where the husband is dead) or adopted while the husband and wife were living together (in cases of desertion, &c.). It may also (at the discretion of the Commission) include any child who is being maintained by the applicant or was at any time maintained by the husband of the applicant.
No woman shall be entitled to receive a widow'S benefit unless the Commission is satisfied that she is of good moral character and sober habits.
The rates of widows' benefits payable are:—
Widows with a child or children under sixteen years of age £130 per annum:
Widows without dependent children, £130 per annum.
In addition to the benefit payable to a widow with dependent children under sixteen years of age, she is entitled to receive a mother'S allowance at the rate of £78 per annum.
Any income received is taken into account in computing the benefit payable, and where such income exceeds £78 the annual rate of benefit is reduced by £1 for every complete £1 of such excess. The maximum of income plus benefit in the case of a widow with dependent children is £286 per annum, and in the case of a widow without dependent children £208 per annum. A widow with dependent children will, of course, receive in addition the universal family benefit of 10s. per week for each child.
Where there are no dependent children, the benefit of widows attaining the age of sixty years is also reducible for the ensuing period in which granted by £1 for every complete £10 of the accumulated property in excess of £500 computed as if she were an applicant for age-benefit. Widows' benefits cease on remarriage.
Orphans' Benefits.—A benefit in respect of complete orphanhood is payable in the case of a child under sixteen years of age who was born in New Zealand or whose last surviving parent was resident in New Zealand for a period of not less than three years preceding the date of his or her death. A step-child or an adopted child comes within the definition of the term, and payment may be made to any person for the time being having the care and control of the child. No payment is made on account of any orphan maintained in a State institution, but payment may be made to the governing bodies of homes and orphanages of religious or other organizations.
The amount payable as an orphan'S benefit is limited to a maximum of £65 per annum less any income received by or for the benefit of the orphan, but a lesser amount may be granted if it is considered that the circumstances of the case warrant it. In any case where the income of the orphan bills below £26 per annum, application may be made for a family benefit of 10s. a week in lieu of orphan'S benefit. For the purpose of assisting in the further education of any child, the Commission may continue or grant the benefit until the end of the year in which the child reaches the age of eighteen years.
Family Benefits.—As from 1st April, 1946, the father or mother of any child or children under sixteen years of age may apply for a family benefit, irrespective of the income or property of the parents or children. Prior to 1st April, 1946, family benefits were payable subject to a means test.
The rate of the benefit is 10s. per week for each child, and in every case is paid to the mother of the children, unless in special circumstances the Commission considers that it should be paid to the father or to some other person for the benefit of the children.
If a beneficiary in receipt of an age or other monetary benefit is the parent of dependent children, payment in respect of the children is made by way of a separate family benefit.
The term “children” includes stepchildren and adopted children, but does not include:—
Any child who has attained the age of sixteen years unless such child is continuing its education as a full-time day pupil at a school or college, in which case the Commission may grant or continue the benefit until it reaches the age of eighteen years.
Any child who is not in fact maintained as a member of the family of the applicant.
Any child in respect of whom any other benefit is payable under the Act.
The Commission may regard as a member of the applicant'S family any child who, although not a child of the applicant, is being maintained as a member of the family. A benefit may also be continued beyond the age of sixteen years in respect of any child who is totally incapacitated from earning a living by reason of some physical or mental defect.
In order to qualify for a family benefit, at least one of the following conditions must be satisfied, namely—
The child was born in New Zealand.
The mother of the child was only temporarily absent from New Zealand at the time of its birth.
The child has been permanently resident in New Zealand for not less than one year.
A benefit is not payable in respect of any child committed to the care of the Child Welfare Department nor in respect of any child residing in an institution under the care of the Division of Mental Hygiene of the Health Department. Family benefits are, however, paid to children of a member of any of His Majesty'S Naval, Military, or Air Forces.
Invalids' Benefits.—Subject to certain residential and other qualifications, every person of the age of sixteen years and upwards who is not qualified to receive an age-benefit is entitled to an invalid'S benefit if he:—
Is totally blind; or
Is permanently incapacitated for work as the result of an accident or by reason of illness or of any congenital defect.
The other qualifications referred to are as follows:—
That he has resided continuously in New Zealand for a period of not less than ten years immediately preceding the date of his application. Continuity of residence is not deemed to be interrupted where the total period of absence does not exceed twelve months, or does not exceed twelve months by more than one month for every year of residence in New Zealand in excess of ten years if the applicant has been actually resident in New Zealand for the twelve months immediately preceding the date of his application. In the case of a totally blind person continuous residence is not deemed to be interrupted by absence for the purpose of vocational training or for treatment in respect of the eyes, or in other cases by any period of absence for the purpose of obtaining any special surgical treatment if the Commission is satisfied that there were good and sufficient reasons for leaving New Zealand to obtain such special treatment.
In the case of an applicant in respect of blindness, that he was born in New Zealand or became blind while permanently resident in New Zealand. In the case of every other applicant, that he was born in New Zealand with the condition to which his incapacity for work is attributable, or that he became incapacitated for work by reason of an accident happening in New Zealand or by reason of illness contracted in New Zealand. These restrictions do not apply to any applicant who was actually resident in New Zealand on the 4th day of September, 1936 (the date of the passing of the Pensions Amendment Act, 1936, which first made provision for invalidity pensions other than for blindness), or to any person becoming resident in New Zealand after that date who has resided continuously in New Zealand for not less than twenty years immediately preceding the date of his application for a benefit.
That incapacity for work was not self-induced or in any way brought about with a view to qualifying for an invalidity benefit.
Applicant must be of good moral character and sober habits.
Provision is made for a medical examination, when necessary, to determine the extent of incapacity. In the event of an application being declined on medical grounds, the applicant has the right of appeal, within three months after the decision of the Commission has been communicated to him, to a Board of three medical practitioners nominated by the Department. An invalid'S benefit may be paid in respect of a period of absence from New Zealand not exceeding two years in the aggregate if the Commission is satisfied that such absence was for the purpose of obtaining any special medical or surgical treatment, or in the case of blindness for the purpose of undertaking vocational training or treatment in respect of the eyes.
The prescribed rates for invalids' benefits, together with the amounts of allowable income are as follows.
| Class of Person. | Rate of Benefit. | Allowable Income. | ||
|---|---|---|---|---|
| Weekly. | Yearly. | Weekly. | Yearly. | |
| £ s. d. | £ s. d. | £ s. d. | £ s. d. | |
| Single, under twenty years | 2 0 0 | 104 0 0 | 1 0 0 | 52 0 0 |
| Widower with dependent children | 2 10 0 | 130 0 0 | 1 10 0 | 78 0 0 |
| Married man | 2 10 0 | 130 0 0 | 1 0 0 | 52 0 0 |
| Wife | 2 10 0 | 130 0 0 | ||
| Married woman | 2 10 0 | 130 0 0 | 3 10 0 | 182 0 0 |
| All other persons | 2 10 0 | 130 0 0 | 1 0 0 | 52 0 0 |
As in the case of other benefits, dependent children are paid for by way of the family benefit at 10s. a week each.
In each case the amount of the benefit is reduced by £1 for every complete £1 of income in excess of the amounts stated as allowable. Deductions on account of property are the same as for age-benefits, which are described under a previous heading. In computing the income for any blind person no account is taken of personal earnings up to £156 per annum. In addition, personal earnings of such persons are subsidized to the extent of 25 per cent. so long as the total income, including any benefit received, does not exceed £286 per annum. The maximum invalid benefit payable plus allowable income is £312 per annum.
The qualifications in respect of property are the same as those applicable to age-benefits.
Where an applicant is a married woman and, by reason of incapacity, necessary nursing or domestic assistance is required to be paid for, the Commission may increase the rate of any benefit which may have been reduced on account of income or property to an amount not in excess of £130 a year, but so that the total income of applicant and husband, inclusive of the benefit, does not exceed £8 a week.
When a person who has been in receipt of an invalid'S benefit in respect of total blindness reaches the age where he qualifies for an age-benefit and he is granted an age-benefit in lieu of invalid'S benefit, the total rate of the benefit payable to the beneficiary and wife (if any) may not be less than that to which he would have been entitled under the provisions governing invalids' benefits.
Miners' Benefits.—Subject to the qualifications set out hereunder, a miner'S benefit is payable to any person who, while engaged as a miner in New Zealand, contracted miner'S phthisis and is thereby permanently and seriously incapacitated for work, or to any person who contracted, while engaged as a miner in New Zealand, any other occupational or heart disease and is thereby permanently and totally incapacitated for work. The term “miner'S phthisis” means pneumoconiosis and includes tuberculosis of the lungs or any other disease of the respiratory organs commonly associated with, or a sequel to, pneumoconiosis. The necessary qualifications are:—
Employment as a miner in New Zealand for not less than two and a half years:
Continuous residence in New Zealand for not less than five years immediately preceding the date of his application for a benefit. Continuity of residence is not deemed to have been interrupted by occasional absences aggregating not more than six months:
Good moral character and sober habits and must not have deserted or wilfully failed to provide for his wife and children during the period of five years immediately preceding the date of application.
That compensation under the Workers' Compensation Acts in respect of the same disability is not being received.
The rates of miners' benefits are £2 10s. per week or £130 per annum, increased by £2 10s. per week, or £130 per annum, for a wife. Dependent children under sixteen years are paid for by way of family benefit at the rate of 10s. per week each.
There is no reduction in the benefit on account of the income or property of the applicant and/or his wife.
Provision is made for medical examination where necessary to determine whether the applicant is permanently incapacitated for work, or the extent of his incapacity.
A special provision is made for the payment from the Social Security Fund of a reasonable contribution towards the funeral expenses of any person who dies while in receipt of a miner'S benefit. The amount to be paid is at the discretion of the Commission.
If a person in receipt of a miner'S benefit dies leaving a widow, such widow is entitled to a benefit of £2 per week, or £104 per annum, during widowhood. This benefit is payable regardless of the circumstances of the widow, her income or property not being considered in the granting of a benefit.
Payment of benefits is not affected by a period of absence from New Zealand not exceeding two years in the aggregate.
Maori War Benefits. —Persons entitled to apply for a Maori War benefit were those who served in any of the Maori wars and were awarded a medal for active service in any such war. Other conditions which an applicant must have fulfilled to qualify were as follows:—
Continuous residence in New Zealand for not less than ten years immediately preceding the date of his application: Provided that the continuity of his residence was not deemed to have been broken by any period of absence during which his home or family was in New Zealand:
That during the five years immediately preceding his application he had not deserted or wilfully failed to provide for his wife or children:
That the applicant was of good moral character and sober habits.
The rate of a Maori War benefit was £2 5s. per week, or £117 per annum up to the 31st May, 1949, and this amount was payable regardless of the circumstances of the applicant, income or property not being taken into consideration. The benefit could be paid for a period not exceeding two years in total while the beneficiary was absent from New Zealand. Since June, 1948, there have been no benefits of this class current.
Unemployment Benefits.—Subject to the conditions set out below, every person over the age of sixteen years who is not qualified to receive an age-benefit is entitled to a benefit in respect of unemployment. An applicant is required to satisfy the Commission in respect of the following:—
That he is unemployed:
That he is capable of undertaking and is willing to undertake suitable work:
That he has taken reasonable steps to obtain suitable employment:
That he has resided continuously in New Zealand for not less than twelve months.
An unemployment benefit is not payable in respect of the first seven days of any period of unemployment, except in special circumstances. In addition, the Commission may postpone, for a period not exceeding six weeks, the commencement of the benefit, or it may terminate the benefit in any of the following circumstances:—
If the applicant has voluntarily become unemployed without good and sufficient reason:
If the applicant has lost his employment by reason of any misconduct as a worker:
If the applicant or beneficiary has refused or failed, without a good and sufficient reason, to accept any offer of suitable employment:
In the case of a seasonal worker, if his earnings for the season are sufficient for the maintenance of himself and his family notwithstanding a period of temporary unemployment.
Unemployment benefits are payable in accordance with the following scale:—
| Weekly Benefit. | |||
|---|---|---|---|
| £ | s. | d. | |
| To applicants sixteen and under twenty years without dependants | 1 | 10 | 0 |
| To all other applicants | 2 | 10 | 0 |
| In respect of the applicant'S wife | 2 | 10 | 0 |
Dependent children are paid for by way of family benefit at the rate of 10s. per week each.
The benefit is payable so long as the beneficiary is unemployed or until he becomes eligible to receive another class of benefit, other than a family benefit—e.g., an age-benefit.
A married woman is entitled to receive the benefit only if her husband is unable to maintain her. If a beneficiary is not receiving a benefit in respect of a wife, an allowance may be made in respect of any person who has the care of his home.
The foregoing rates of benefits may be reduced, having regard to the income received or the property owned by the applicant or his wife.
The following figures show the number of applications for unemployment benefits dealt with during the years ended 31st March, 1946, 1917, and 1948.
UNEMPLOYMENT BENEFITS
| — | 1945–46. | 1946–47. | 1947–48. | ||||||
|---|---|---|---|---|---|---|---|---|---|
| Males. | Females. | Total. | Males. | Females. | Total. | Males. | Females. | Total. | |
| Persons granted benefit | 1,149 | 85 | 1,234 | 790 | 51 | 841 | 368 | 12 | 380 |
| Number of applications declined | 402 | 746 | 1,148 | 503 | 840 | 1,343 | 296 | 851 | 1,147 |
| Number of persons whose applications were declined, but who were granted emergency benefits on the grounds of hardship | 210 | 502 | 712 | 313 | 503 | 816 | 411 | 792 | 1,203 |
| Totals | 1,761 | 1,333 | 3,094 | 1,606 | 1,394 | 3,000 | 1,075 | 1,655 | 2,730 |
Sickness Benefits. —Every person over the age of sixteen years who has resided continuously in New Zealand for not less than twelve months and who satisfies the Commission that he is temporarily incapacitated for work through sickness or accident, and that by reason thereof he has suffered a loss of salary, wages, or other earnings, is entitled to a sickness benefit. The amount of the benefit is limited to the amount by which the weekly earnings of the applicant have been reduced by reason of his incapacity. Where a person is engaged in business on his own account and by reason of sickness or accident is obliged to employ a substitute during the period of incapacity, the remuneration paid to the substitute is regarded as loss of earnings. Every application for a benefit must be supported by a medical certificate, and no benefit is payable for the first seven days of incapacity except under special circumstances.
A married woman shall be entitled to receive a benefit under this section only if the Commission is satisfied that her husband is unable to maintain her.
Subject to the foregoing remarks concerning amount of benefit, the rates of sickness benefits shall be computed as follows:—
In the case of an applicant under twenty years of age without dependants, the benefit shall be at the rate of £1 10s. a week.
In every other case the benefit shall be at the rate of £2 10s. a week, increased (in the case of an applicant with a wife) by £2 10s. a week in respect of his wife.
Any applicant who is maintaining a home and who is not drawing a benefit in respect of a wife may receive a benefit at a rate not exceeding that for a wife in respect of any person who has the care of his home.
Dependent children are paid for by way of family benefit.
Provided that the rate of benefit computed as aforesaid shall be reduced by 1s. for every complete shilling of the total income of the applicant and of his wife or her husband, as the case may be, in excess of 20s. a week or, in any case where the applicant or his wife or her husband, as the case may be, is in receipt of a sick-benefit from a friendly society or a like benefit from any other source, in excess of 40s. a week.
The following figures show the number of sickness benefits dealt with during the years ended 31st March, 1946, 1947, and 1948.
SICKNESS BENEFITS
| — | 1945–46. | 1946–47. | 1947–48. | ||||||
|---|---|---|---|---|---|---|---|---|---|
| Males. | Females. | Total. | Males. | Females. | Total. | Males. | Females. | Total. | |
| Persons granted benefit | 22,493 | 8,154 | 30,647 | 28,232 | 8,479 | 36,711 | 24,073 | 7,282 | 31,355 |
| Number of applications declined | 2,159 | 1,076 | 3,235 | 3,646 | 1,449 | 5,095 | 2,683 | 1,195 | 3,878 |
| Number of persons whose applications were declined, but who were granted emergency benefits on the grounds of hardship | 111 | 331 | 442 | 246 | 434 | 680 | 458 | 614 | 1,072 |
| Totals | 24,763 | 9,561 | 34,324 | 32,124 | 10,362 | 42,486 | 27,214 | 9,091 | 36,305 |
Emergency Benefits.—An emergency benefit may be granted by the Commission on the grounds of hardship to any person who by reason of age, physical or mental disability, domestic circumstances, or any other reason is unable to earn a sufficient livelihood for himself and those dependent on him and is ineligible for any other monetary benefit.
The amount of the emergency benefit is at the discretion of the Commission, which fixes as nearly as possible an amount equal to that payable for the type of benefit for which the applicant most closely qualifies.
Reciprocal Benefits.—The Social Security (Reciprocity with Australia) Act, 1948, which repealed the Age Benefits and Invalids' Benefits (Reciprocity with Australia) Act, 1943, is designed to provide for reciprocity in relation to a wide range of benefits between New Zealand and the Commonwealth of Australia. The Act came into force on 1st July, 1949. A similar Act was passed in Australia and came into force on the same date.
Part II of the Act covers the case of former residents of Australia and applies to any person who, having at any time resided in Australia, is permanently resident in New Zealand inasmuch as he either satisfies the Commission that he is so permanently resident or has been in continuous residence in New Zealand for not less than six months (unless in this case the appropriate authorities in both countries agree that the residence is not to be regarded as permanent).
For the purpose of any application for a benefit in respect of a person covered by this Act, residence in Australia or birth in Australia will be regarded as residence or birth in this country.
Applicants for age, invalids, or widows' benefits must be qualified on residential grounds to receive the corresponding pensions under the Social Services Consolidation Act (Australia) as if his or her residence in New Zealand had been residence in Australia. No male person is entitled to receive an age-benefit unless he has attained the age of sixty-five years. The Act also provides that the Commission shall treat blindness or permanent incapacity fur work occurring in Australia as if it had occurred in New Zealand.
Part III of the Act deals with persons who, although ordinarily resident in New Zealand, are temporarily resident in Australia. Such residence is not a disqualification for a benefit. Benefits may be applied for and paid in Australia, although the Commission may, in its discretion, postpone payment of the whole or any part of the benefit until the return of the beneficiary to New Zealand.
The appropriate reciprocal provisions made in respect of Australia are contained in the Schedule to the Act.
Reciprocity exists in respect of the following classes of pensions, allowances, endowments, and benefits under the respective Acts governing social security provisions:—
Age-pensions and age-benefits.
Invalid pensions (including wives' and children'S allowances) and invalids' benefits.
Widows' pensions and widows' benefits.
Child endowment and family benefits.
Unemployment and sickness benefits.
The total reciprocal benefits in force in New Zealand under the 1943 legislation as at the 31st March, 1948 were: age-benefits, 216; invalids' benefits, 55. Corresponding figures for 1947 were 158 and 53.
As mentioned earlier, reciprocity in respect of family benefits between New Zealand and Great Britain and Northern Ireland was provided for by legislation during 1948.
Medical, Hospital, and other Related Benefits.—The part of the Act dealing with medical and like benefits is of general application to all persons ordinarily resident in New Zealand, and makes provision for medical, pharmaceutical, hospital, maternity, and other related benefits. The Act provided that the various benefits should be available on and after 1st April, 1939, or if for any reason arrangements for the effective administration of benefits of any of the prescribed classes could not be completed before that date, such benefits should be available on or after such later date as might be determined by the Minister (being the earliest possible date on which arrangements for their effective administration could be brought into operation).
The Act also gives authority for the inauguration of supplementary benefits as and when the occasion for providing such benefits arises. Among the supplementary benefits contemplated were specialist and consultant services, radiological services, dental services, home nursing services, and domestic assistance. All of these benefits have been introduced and are referred to under their respective headings.
Medical Benefits.—Under the provisions contained in the Act every person is entitled to such medical treatment as is ordinarily given by medical practitioners in the course of a general practice. Certain services are excluded, the principal of these being as follows:—
The administration of anaesthetics:
Medical services afforded in relation to maternity cases. (These services are covered by maternity benefits and are described under a later heading):
Medical services involved in any medical examination of which the sole or primary purpose is the obtaining of a medical certificate:
Medical services involved in the treatment of any venereal disease in a communicable form. (Treatment in this connection is provided for under the Health Act, 1920):
Medical services involved in or incidental to the extraction of teeth by a medical practitioner:
Medical services in respect of which fees are payable under the Social Security (X-ray Diagnostic Services) Regulations—vide later heading.
The principal Act provided that a registered medical practitioner who wished to come within the scope of the scheme was required to enter into a contract with the Minister, and regulations issued on 19th February, 1941, prescribed the procedure in connection with the initiation of the scheme, the classes of benefits that were to be provided, the obligations of practitioners who undertook to operate the scheme, and the rates of remuneration payable to them. A person entitled to receive medical benefits was required to make application on the prescribed form, which he then presented to the medical practitioner of his choice. If the practitioner was willing to provide the necessary services for the person named in the form, he completed an agreement as between the applicant and himself by attaching his signature thereto. These completed agreements formed the basis of the practitioner'S list of patients, for each of whom he was entitled to receive from the Social Security Fund a capitation fee at the rate of 15s. per annum, plus mileage fees in certain circumstances. This scheme came into operation on 1st March, 1941.
An important change in principle was made by the Social Security Amendment Act, 1941, which provided an alternative to the capitation scheme. This amendment, which came into force on 1st November, 1941, and which was subsequently modified by the 1949 amendment to the principal Act, provides that every medical practitioner who renders any of the prescribed services shall be entitled to receive from the Social Security Fund a reasonable fee not exceeding 7s. 6d. for every occasion on which any such service is provided. Mileage fees are also provided for in certain cases. Regulations dated 22nd October, 1941, issued under the Act, stipulate that where the practitioner is called upon to provide, in response to an urgent request, services on a Sunday, or between the hours of 9 p.m. and 7 a.m., the appropriate fee shall be increased to 12s. 6d. The Act also provides that the practitioner, instead of claiming from the Fund the amount to which he is entitled under the Act, may receive payment from the patient. This refund system, by virtue of the 1949 amendment, is not to apply unless authorized so to do by the Council of the New Zealand Branch of British Medical Association after consultation with the Minister or where the amount is recovered from a registered friendly society. In such cases the patient is entitled to recover from the Fund (such recovery being limited to the prescribed fee), and the practitioner is required to provide the necessary receipt to enable this to be done.
The 1949 amendment to the Social Security Act prohibited practice under the capitation system and fee for service system at the same time. This amendment also laid down conditions in respect of the right to recover fees from patients and for reference of accounts to the Divisional Disciplinary Committee appointed under the Medical Practitioners Amendment Act, 1949.
Pharmaceutical Benefits.—Persons claiming medical benefits are entitled to receive, without cost to themselves, all such medicines, drugs, approved appliances, and materials as are prescribed for their use by a medical practitioner in the course of providing any medical services under the Act. Regulations providing for pharmaceutical benefits were issued on 22nd April, 1941. Under these regulations the proprietor of any pharmacy within the meaning of the Pharmacy Act, 1939, or any other person entitled to sell any drugs or pharmaceutical requirements, may be permitted to become a contractor under the scheme. The regulations stipulate that the Minister shall prepare a drug tariff, which shall contain particulars of maximum quantities, standards of quality, and prices of medicines, drugs, appliances, &c., that may be supplied and charged against the Fund. Hospital Boards are entitled to receive payment for pharmaceutical requirements supplied to out-patients, but not in respect of in-patients. Pharmaceutical benefits came into operation on 5th May, 1941.
Hospital Benefits.—The Act provides for the payment to Hospital Boards and to the proprietors of licensed hospitals and other approved institutions (who have entered into contracts under the Act) of prescribed amounts in respect of hospital treatment afforded by them. The amount paid to a Hospital Board is in full satisfaction of its claim for the treatment of patients; in the case of licensed hospitals and other institutions the amount paid is in partial satisfaction of claims against the patients or other persons liable for the hospital charges.
These benefits came into force on 1st July, 1939, and the present rates (as from 1st April, 1943) are as follows:—
Where treatment has been afforded on not more than two days, the sum of 18s.:
In every other case, the sum of 9s. for every day on which any treatment is afforded:
Provided that the day of admission to hospital and day of discharge therefrom shall together be counted as one day.
Prior to 1st April, 1943, the rates were 12s. and 6s. for (a) and (b) respectively.
The Act also provides that in lieu of payment being made in respect of individual hospital patients, the Minister may from time to time authorize the payment of a grant in respect of hospital treatment afforded in any private hospital or other approved institution.
Hospital benefits are also available in respect of maintenance and treatment afforded to any in-patient of Queen Mary Neurological Hospital, Hanmer Springs, or of the Rotorua Sanatorium. The fees chargeable to patients of these institutions have been reduced by 9s. per day, and corresponding payment is made from the Social Security Fund to the credit of the Departments controlling the institutions.
Regulations issued on 19th March, 1941 (since replaced by the Social Security (Hospital Benefits for Out-patients) Regulations 1947), made provision for free treatment of out-patients at public hospitals. “Hospital treatment” in relation to an out-patient of any public hospital covers the supply of artificial aids, including contact lenses (introduced 1st June, 1947), hearing aids (1st November, 1947) and artificial limbs (1st April, 1948), and all medical, surgical, or other treatment afforded by the staff of the hospital; but does not include dental treatment or services in respect of which fees are payable under specific Social Security Regulations (x-ray diagnostic services, laboratory diagnostic services) referred to under later headings. The amounts to be paid to Hospital Hoards from the Social Security Fund for providing out-patient treatment are determined by the Minister and may not be less than one-half of the expenditure or liability incurred in providing the services.
Menial Hospitals.—The principal Act made provision for the treatment of patients in public mental hospitals without charge as from 1st April, 1939. By section 10 of the Social Security Amendment Act, 1939, a licensed (private) mental hospital may be recognized and approved by the Minister as a hospital for the purposes of the Act, and hospital benefits in respect of treatment therein are payable accordingly.
Up to and including the year 1944–45, an amount estimated to be equivalent to the loss of revenue consequent upon the operation of the Social Security Act was paid to the Mental Hospitals Department from the Social Security Fund, but all expenditure in this connection is now borne by the Consolidated Fund.
Maternity Benefits.—Maternity benefits include ante-natal and post-natal advice and treatment by medical practitioners, and the services of doctors and nurses at confinements in maternity hospitals or elsewhere.
These benefits came into force on 15th May, 1939, but the maternity medical practitioner service was not in full operation until 1st October of that year. The principal Act required that medical practitioners, licensees of private hospitals, &c., and midwives and maternity nurses, who wished to come within the scope of the scheme should enter into a contract with the Minister. While this provision remains in force in regard to hospitals and midwives and maternity nurses, the Social Security Amendment Act, 1939, provides that any medical practitioner who renders medical services to a woman who is entitled to a maternity benefit is entitled to receive certain prescribed fees from the Social Security Fund. The scale of fees, which may be fixed by agreement between the Minister and the New Zealand Branch of the British Medical Association, or in default of such agreement by a special tribunal, is intended to cover the usual services performed in maternity cases. The amount calculated in accordance with the scale of fees for the time being in force shall be accepted by the medical practitioner in full satisfaction of his claims in respect of the services for which payment is made, except in the case of a practitioner who is recognized as an obstetric specialist in accordance with the terms of the Act. Such a practitioner, in addition to the fees payable from the Social Security Fund, may recover additional fees from the patient.
The main provisions in regard to maternity benefits apart from the medical practitioner service are as follows:—
State maternity (St. Helens) hospitals: No charge is made for any services in the St. Helens Hospitals.
Public maternity hospitals or maternity wards under control of Hospital Boards: Payment from Social Security Fund to Hospital Hoard as under:—
One pound in respect of the day of birth of the child and each of the succeeding fourteen days:
A fee of £2 where any patient is actually attended during labour and at delivery by a medical officer employed by the Board.
These amounts are to be regarded as in full settlement of all claims in respect of the maternity benefits afforded by the Board.
Licensed (private) maternity hospitals: Licensees of licensed maternity hospitals who have entered into contracts under the Act are entitled to receive fees from the Social Security Fund at the same rates as stated in (2) (a) and (b) in regard to Hospital Boards. In some cases the licensee'S contract requires him to accept such payment in full satisfaction of his claim in respect of the prescribed period, and in other cases he is permitted under his particular contract to make a specified additional charge on the patient.
Midwives and maternity nurses: Approved midwives and maternity nurses who are in attendance in cases where confinement takes place other than in a maternity hospital are entitled to receive from the Fund fees at the rate of £1 for the day or days of labour (£2 in the case of midwives) and 13s. per day for each of the fourteen days succeeding the birth of the child or 5s. a day if only a visiting obstetric nurse. These amounts are to be regarded as in full satisfaction of a nurse'S claims in respect of the nursing services.
X-ray Diagnostic Services.—The first of the supplementary benefits was introduced by the Social Security (X-ray Diagnostic Services) Regulations 1941, which came into operation on 11th August, 1941. The benefits provided for by these regulations comprise the following:—
The making of X-ray examinations with the aid of a fluorescent screen :
The taking of X-ray photographs :
The supply of any drugs or other substances for the purpose of any such examination or photograph :
The provision of medical services incidental to any such examination or photograph, except medical services of a kind not ordinarily performed by radiologists as such:
The provision of any other incidental services for the purposes of any such examinations or photographs.
X-ray photographs or X-ray examinations made or taken for dental purposes or for the purposes of life assurance are not included in the services that may be provided.
In order to be recognized as a radiologist for the purpose of the regulations a medical practitioner is required to make application to the Minister specifying his academic qualifications and professional experience, and also the nature of the apparatus or equipment in his possession or available for his use in the performance of radiological work. The Minister may give absolute or limited recognition or may refuse recognition. Absolute recognition covers all classes of X-ray diagnostic services, whereas limited recognition may exclude any specified class or classes of service, or may be restricted to certain specified classes of service. An amended scale of fees payable from the fund in respect of services rendered by recognized radiologists is prescribed in a schedule to the Social Security (X-ray Diagnostic Services) Regulation 1941, Amendment No. 1, issued on 28th January, 1942. Where the service is rendered by a medical practitioner employed or engaged by a Hospital Board, the prescribed fees are to be accepted by the Board in full settlement, but in other cases the amount of such fees is deducted from the amount charged to the patient, who is responsible for the balance, if any.
Massage Benefits.—The second supplementary benefit introduced concerns massage treatment by private masseurs, and commenced on 1st September, 1942, in accordance with the Social Security (Massage Benefits) Regulations 1942. The general arrangement for these benefits consists of contracts with individual masseurs under which they are paid from the Social Security Fund a fee of 3s. 6d. for each massage treatment and undertake not to charge the patient any additional fees in excess of 3s. 6d. for treatment afforded in the masseurs' rooms or 7s. for treatment afforded elsewhere.
Specialist Services.—The Finance Act (No. 2), 1942, brought specialist services within the scope of the medical benefits. Specialist services are defined as “medical services that involve the application of special skill and experience of a degree or kind that general practitioners as a class cannot reasonably be expected to possess.” An amount not exceeding 7s. 6d. is payable from the Fund (by way of refund to the patient) in respect of every occasion on which any such services have been provided. The Social Security Amendment Act, 1949, authorizes the making of regulations providing for benefits in respect of any class or classes of specialist medical services and for conditions governing the determination of a scale of fees.
Home-nursing Services.—Home-nursing services free of cost to the recipients were introduced by the Social Security (District Nursing Services) Regulations 1944, which stipulate that no charge may be made for district nursing services provided by any Department of State, Hospital Board, or subsidized association elsewhere than in a hospital or other institution. Provision is made for payment from the Social Security Fund to the Department of State, Hospital Board, or association providing district nursing services, of such amounts as the Minister of Health may determine, having regard to the costs incurred in providing such services.
Domestic Assistance.—The provision of monetary assistance to approved incorporated associations formed for the purpose of providing domestic assistance in homes, or whose objects include the provision of such assistance, is made by the Social Security (Domestic Assistance.) Regulations 1944. Assistance in this connection is restricted by the regulations to the following classes:—
Cases where there are one or more children under twelve years of age permanently residing in a home and the mother or other woman in charge of the home is wholly or partially incapacitated from undertaking her ordinary domestic duties by reason of pregnancy or maternity, or by reason of accident, sickness, &c.
Cases where there are three or more children under twelve years of age permanently residing in the home, and any member of the household requires special care and attention by reason of sickness or infirmity :
Cases where all members of the household of an age or condition to help in the home are wholly or partially incapacitated from work by sickness or otherwise:
Cases where lack of domestic assistance in the home is a cause of undue hardship.
The terms on which the services of a domestic assistant are provided are to be determined by agreement between the association and the householder, and the association is deemed to be the employer.
In fixing the amounts to be paid from the Social Security Fund to any association the Minister shall have regard to the expenses incurred in providing the services of domestic assistants, including expenditure incurred in the organization of any scheme of registration or enrolment or in the training of the assistants, and to the amounts recovered from the householders to whom assistance has been rendered.
Laboratory Diagnostic Services.—The benefits concerning laboratory diagnostic services came into operation on 1st April, 1946, and comprise the supply of all materials or substances required for the purpose of providing laboratory diagnostic services, and the provision of medical services incidental to any laboratory diagnostic service, except medical services of a kind that are not ordinarily performed by pathologists as such, and the provision of any other incidental services for the purposes of laboratory diagnostic services.
The following services are not included :—
Examination of specimens for public health.
Post-mortem examinations.
Laboratory services for dental purposes or for the purposes of life-insurance.
The preparation of sera and vaccines.
A schedule of fees payable in respect of laboratory diagnostic services is prescribed.
Dental Services.—The Social Security (Dental Benefits) Regulations 1946 made provision for the introduction of free dental treatment as from a date to be appointed by the Minister. The regulations restricted the application of dental benefits to persons under nineteen years of age, and provided that they were to be introduced according to such age-groups as the Minister may determine. These benefits commenced on 1st February, 1947, and at present are confined to persons who, for the time being, are under sixteen years of age or were, in the last term of the immediately preceding calendar year, enrolled in a primary or intermediate school or department.
The regulations provide that the services may be provided:—
By a registered dentist or a State dental nurse in a State dental clinic; or
By a contracting dentist pursuant to a contract under the regulations; or
By a contracting authority in a dental department of a public hospital or in a dental school pursuant to a contract under the regulations.
A Schedule to the regulations prescribes the nature of the benefits that may be provided and a scale of fees payable to contracting dentists and authorities in respect thereof.
Benefits and Pensions in Force.—A summary showing particulars of the various social security benefits and the various pensions in force in each of the last three financial years is as follows:—
| Class of Benefit or Pension. | Number in Force at 31st March, | Annual Value at 31st March, 1948. | Payments during | ||||
|---|---|---|---|---|---|---|---|
| 1946. | 1947. | 1948. | 1945–46. | 1946–47. | 1947–48. | ||
* Excluding payments made outside New Zealand totalling approximately £151,000 in 1947–48. | |||||||
| £ | £ | £ | £ | ||||
| Social Security benefits— | |||||||
| Universal superannuation | 56,181 | 57,992 | 61,612 | 1,694,330 | 1,185,508 | 1,349,689 | 1,593,757 |
| Age | 110,060 | 115,287 | 117,161 | 14,223,345 | 9,817,615 | 11,881,119 | 12,976,286 |
| Widows' | 11,507 | 13,133 | 14,145 | 1,949,888 | 1,043,593 | 1,529,010 | 1,709,626 |
| Orphans' | 400 | 397 | 370 | 27,010 | 24,178 | 22,905 | 24,187 |
| Family | 42,637 | 230,021 | 243,137 | 13,542,730 | 2,611,759 | 12,680,778 | 13,798,648 |
| Invalids' | 12,164 | 12,466 | 10,682 | 1,406,285 | 1,183,537 | 1,328,485 | 1,367,300 |
| Miners' | 736 | 718 | 685 | 111,518 | 88,359 | 105,416 | 110,106 |
| Maori War | 1 | 1 | 1 | 117 | 101 | 104 | 111 |
| Unemployment | 205 | 35 | 16 | 31,661 | 24,332 | 8,358 | |
| Sickness | 5,416 | 4,273 | 4,248 | 565,420 | 853,328 | 897,093 | |
| Emergency | 2,094 | 1,845 | 2,141 | 121,959 | 134,288 | 227,857 | |
| Medical | 1,427,309 | 1,760,574 | 2,167,826 | ||||
| Hospital | 2,173,460 | 1,986,288 | 1,949,489 | ||||
| Maternity | 600,209 | 672,989 | 800,030 | ||||
| Pharmaceutical | 1,133,366 | 1,439,686 | 1,558,350 | ||||
| Supplementary | 229,971 | 352,043 | 515,793 | ||||
| Pensions— | |||||||
| War (1914–18) | 20,460 | 20,081 | 19,715 | 2,248,038 | 1,997,390 | 2,036,825 | 2,049,391* |
| War (1939–45) | 26,926 | 30,028 | 28,248 | 2,416,010 | 1,662,227 | 2,080,952 | 2,031,194* |
| War veterans' allowances | 2,029 | 2,277 | 2,617 | 470,798 | 275,029 | 346,694 | 422,275 |
| Boer War (Defence Act, 1909) | 46 | 42 | 42 | 4,013 | 3,547 | 3,502 | 3,689 |
| Mercantile marine | 26 | 27 | 24 | 1,925 | 1,879 | 2,985 | 2,727 |
| Emergency Reserve Corps | 11 | 10 | 11 | 1,404 | 1,351 | 1,336 | 1,368 |
| Sundry pensions and annuities | 162 | 305 | 173 | 27,655 | 17,560 | 21,651 | 24,783 |
| Civil Service Act, 1908 | 3 | 2 | 1,260 | 1,352 | 697 | ||
| Totals | 291,064 | 488,940 | 505,028 | 38,125,066 | 26,198,248 | 40,616,331 | 44,270,941 |
The annual report of the Director-General of Health (parliamentary paper H–31) furnishes the following particulars of expenditure on the various classes of health benefits during the financial year 1947–48.
Medical Benefits.—Capitation fees, £22,945; general medical services, £1,993,806; special arrangements, £37,714; mileage fees, £109,522; purchase of sites, erection of medical officers' residences, &c., £3,839: total, £2,167,826.
Hospital Benefits.—Public hospitals £1,653,802 (in-patients, £1,536,417; outpatients, £117,385); private hospitals and approved institutions, £295,687: total £1,949,489.
Maternity Benefits.—Hospitals, £516,256; medical practitioners, £275,262; nurses, £8,512: total, £800,030.
Pharmaceutical Benefits.—Chemists and medical practitioners, £1,513,494; institutions, £44,856: total, £1,558,350.
Supplementary Benefits.—Radiological services, £209,059; laboratory services, £90,306; massage services, £47,510; specialist services (neuro-surgery), £121; district nursing services £82,756; dental services, £105,109; domestic assistance, £2,865; artificial-aids benefits, £8,067: total, £545,793.
A summary of pensions and social security payments during each of the last eleven years, together with the amount per head of mean population, is now given.
| Year ended 31st March, | Payments during Year. | |
|---|---|---|
| Total. | Per Head of Mean Population. | |
* Pensions only. | ||
| Pensions and Social Security | ||
| £ | £ s. d. | |
| 1938 | 6,312,530* | 3 19 2* |
| 1939 | 6,780,344* | 4 4 2* |
| 1940 | 12,288,340 | 7 10 6 |
| 1941 | 14,072,498 | 8 12 1 |
| 1942 | 15,159,961 | 9 6 0 |
| 1943 | 17,736,066 | 10 16 3 |
| 1944 | 20,261,879 | 12 7 6 |
| 1945 | 22,489,250 | 13 10 3 |
| 1946 | 26,198,248 | 15 6 3 |
| 1947 | 40,616,331 | 22 18 3 |
| 1948 | 44,270,941 | 24 8 6 |
WAR PENSIONS.—The War Pensions Act, 1943, which became operative from 1st July, 1943, consolidated and amended the previously existing legislation relating to war pensions. The principal Acts affected were the War Pensions Act, 1915, and its numerous amendments, the War Veterans' Allowances Act, 1935, and the War Pensions Extension Act, 1940, all of which are now repealed. With the exception of Maori War benefits, which have been covered by the Social Security Act, and pensions and allowances payable under the authority of the War Pensions and Allowances (Mercantile Marine) Act, 1940, as amended by the War Pensions and Allowances (Mercantile Marine) Amendment Act, 1946, all pensions payable to or on account of members of the Forces are governed by the 1943 Act and its subsequent amendments. The War Pensions Act, 1915, provided for the payment of pensions on certain conditions to disabled members of the New Zealand Forces of the war of 1914–18 (as defined by the Act) and to dependants of disabled, deceased, or missing members of such Forces. The object of the War Veterans' Allowances Act, 1935, which was deemed part of the War Tensions Act, 1915, was to make provision for returned servicemen who, apart from any wounds or other disability not directly attributable to war service, were ageing prematurely or otherwise becoming unemployable by reason of mental or physical disability. The War Pensions Extension Act, 1940, extended the provisions of the War Pensions Act, 1915, to cover overseas service in the Second World War, overseas service in any other war in which His Majesty was engaged, and service within New Zealand. This brought Territorials and members of the Permanent Forces within the scope of the war pensions legislation. Pensions to veterans of the South African War were prior to 1940 granted under the authority of the Defence Act, 1909, but the Finance Act, 1940, transferred this authority to the War Pensions Extension Act.
Administration.—The Secretary for War Pensions, who under the Act must be an officer of the Social Security Department, is charged with the administration of war pensions under the general direction and control of the Minister of Defence. The Act also provides for the appointment of a War Pensions Board, which has the responsibility of granting or declining claims for pensions and allowances. This Board consists of not less than three and not more than four members, one of whom must be a registered medical practitioner and one a representative of returned servicemen. Claimants have the right of appeal to the War Pensions Appeal Board, also appointed under the Act. The Appeal Board consists of three members, two of whom must be registered medical practitioners and the third a representative of returned servicemen. The War Pensions Emergency Regulations 1944 made provision for the appointment of such number of additional War Pensions Boards and War Pensions Appeal Boards as the Minister deemed advisable. In July, 1949, there were two War Pensions Boards and one War Pensions Appeal Board operating.
Grounds for Payment of Pensions.—Pensions in respect of the death or disablement of any member of the New Zealand Forces are payable to the dependants of the member (in the case of death) and to the member and his dependants (in the case of disablement) in any of the following cases:—
Where death or disablement occurred while on service overseas as a member of the Forces in connection with any war in which His Majesty was then engaged, or is attributable to such service:
Where death or disablement is attributable to service in New Zealand, or is attributable to service overseas otherwise than in connection with any war:
In any case where the condition which resulted in the death or disablement was aggravated by any service to which either of the last two preceding paragraphs relates.
Special provision is also made for pensions and allowances to members of the Emergency Reserve Corps and their dependants in respect of death or disablement attributable to their duties as members.
The provisions in regard to attributability were considerably liberalized by the new Act, which lays down that the onus of proving that death or disablement was attributable to service, or that the condition which resulted in death or disablement was aggravated by such service, shall not be on the claimant and that the War Pensions Board and the War Pensions Appeal Board shall give claimants the full benefit of all presumptions in their favour. A member who was graded fit for service when he entered the Forces is deemed to have been absolutely fit at that time unless any defects were noted then or within the first two months of service. This presumption does not operate if the member failed to disclose any material fact to the medical examiner. The Act also states that the Boards are not to be bound by technicalities or legal forms or rules of evidence, but shall determine all claims in accordance with their merits.
Rates of Pensions.—The 1943 Act provided for the general rates of disablement pensions being increased by 50 per cent., and for increases in dependants' and economic pensions. Amendments passed in 1946, 1947, and 1949 further increased the rates of pensions for various categories.
The following table sets out the maximum weekly rates of pension at present payable (November, 1949) in respect of the death of a male member of the Forces.
| Rank or Rating. | To Widow. | To Widow with Dependent Child or Children: Mother'S Allowance. | To Each Child. |
|---|---|---|---|
| £s.d. | £s.d. | s.d. | |
| Ranks and ratings below commissioned rank | 210 0 | 1 15 0 | 10 0 |
| Lieutenant (Army); Sub-Lieutenant (Navy); Pilot Officer (Air Force) | 2 15 0 | 1 15 0 | 10 0 |
| Captain (Army); Lieutenant (Navy); Flying Officer, Flight Lieutenant (Air Force) | 3 0 0 | 1 15 0 | 10 0 |
| Major (Army); Lieut.-Commander (Navy); Squadron Leader (Air Force) | 3 7 0 | 1 15 0 | 10 0 |
| Lieut.-Colonel (Army); Commander (Navy); Wing Commander (Air Force) | 3 16 0 | 1 15 0 | 10 0 |
| Colonel (Army); Captain (Navy); Group Captain (Air Force) | 3 18 0 | 1 15 0 | 10 0 |
| Brigadier and upwards (Army); Commodore and up-wards (Navy); Air Commodore and upwards (Air Force) | 4 0 0 | 1 15 0 | 10 0 |
In the case of total disablement of a male member of the Forces, the maximum weekly rates range from £3 10s. to £3 15s. (according to rank or rating) to the member, plus £1 5s. to £1 17s. 6d. to a wife without a dependent child and from £1 15s. to £2 7s. 6d. to a wife with a dependent child or children, together with 10s. for each dependent child.
The weekly rates for total disablement of a female member range from £3 10s. to £3 13., according to rank, while 10s. per week is payable in respect of each dependent child in the case of death or disablement.
These rates may be increased by an amount not exceeding £2 per week if the member is suffering from total blindness or where the member has suffered two or more serious disabilities.
A schedule to the Act prescribes the rates of pensions payable in respect of partial disablement resulting from certain major disabilities. In other cases of partial disablement, the rates are decided by the War Pensions Board or the Appeal Board, regard being had in every case to the nature and probable duration of the disablement.
If a member, while in receipt of a permanent pension of an amount of not less than 70 per cent. of the maximum pension that would be payable in respect of total disablement, dies from any cause not attributable to service as a member of the Forces, a pension may be granted to his widow or dependent children as if death was attributable to service.
Other grants and concessions which may be made to disabled servicemen include the following:—
An allowance not exceeding £5 15s. per week where a pensioner is so disabled as to require the services of a paid attendant:
Additional pensions by way of clothing-allowances of from £16 to £18 per annum to amputees and £10 to others who are obliged to use any mechanical or other appliance:
A free pass on the New Zealand railways to members in receipt of full permanent pensions:
A permit to travel first class at second-class rates on the New Zealand railways to amputees and others suffering locomotor disabilities to a degree of 50 per cent. or over for which they receive permanent pensions:
Free medical and surgical treatment in respect of pensionable disabilities. Surgical appliances such as artificial limbs, &c., are also supplied free and kept in good order and repair.
In addition to pensions for wives and children, a pension may be granted to any member of a deceased or disabled serviceman'S family who was in fact wholly or partially supported by him at any time within the period of twelve months immediately preceding the date on which the serviceman became a member of the Forces. A “member of the family” includes a parent, grand-parent, step-parent, grandchild, step-child, brother, sister, half-brother, half-sister, and mother-in-law. “Child,” in relation to any member of the Forces, means a child under the age of sixteen years, and includes an adopted child (subject to certain conditions as regards date of adoption) and an illegitimate child (also subject to certain conditions).
The amount of pension payable to a dependant other than a wife or child is governed by the value of the benefits received from the member of the Forces on whose case the claim is based during the period of twelve months immediately preceding the date upon which be became a member of the Forces. The rate, however, is limited to the maximum prescribed for the wife of a member, and in eases where a wife or any child is also in receipt of a pension, the rate must not exceed three-fourths of that amount.
The pension payable to a widowed mother, if wholly dependent on the member, is not to be less than the rate granted if the dependant were the wife of the member, or, if partially dependent, the rate is not to be less than £1 10s. a week.
During the year ended 31st March, 1948, the Department received 7,331 applications for war pensions. Of these, 2,406 applications were lodged by ex-servicemen in respect of their own disabilities, the balance being made up of claims by dependants, applications for economic pensions, and war veterans' allowances. The total for the previous year was 14,619, of these 9,531 being in respect of the applicants' own disability.
The following is a summary of the disabilities from which ex-service personnel of the 1939–45 war were suffering at the time of application for pension.
| Class of Disability or Disease. | Type of Service. | Total. | Percentage of Total. | |
|---|---|---|---|---|
| Overseas. | New Zealand. | |||
| Infections and infestations | 133 | 12 | 145 | 6.5 |
| Nervous system | 256 | 31 | 287 | 12.9 |
| Eye, ear, and nose | 231 | 32 | 263 | 11.8 |
| Circulatory and blood systems | 88 | 22 | 110 | 5.0 |
| Metabolism | 19 | 5 | 24 | 1.1 |
| Lungs | 225 | 45 | 270 | 12.2 |
| Digestive system | 192 | 26 | 218 | 9.8 |
| Generative system | 17 | 5 | 22 | 1.0 |
| Gunshot wounds and accidental injuries to bones, and joints and soft tissues | 426 | 99 | 525 | 23.6 |
| Skin | 150 | 14 | 164 | 7.4 |
| Tumours and neoplastic growths | 10 | 2 | 12 | 0.5 |
| Malformations | 2 | 3 | 5 | 0.2 |
| Amputations | 10 | 1 | 11 | 0.5 |
| Urinary tract | 38 | 8 | 46 | 2.1 |
| Sundry minor disabilities | 6 | 1 | 7 | 0.3 |
| Application for pension (no disability) | 101 | 11 | 112 | 5.1 |
| Totals | 1,904 | 317 | 2,221 | 100.0 |
In addition to new applications, cases are constantly coming before the War Pensions Boards for review, renewal, &c. The total number of cases dealt with by the Boards during the year ended 31st March, 1948, was 65,505, made up as follows:—
| Claims for war pension on account of disablement | 2,856 |
|---|---|
| Claims for economic pension | 2,622 |
| Claims for dependants' pensions | 1,709 |
| Cases submitted for renewal and review | 41,062 |
| Cases submitted for reconsideration and reinstatement | 8,726 |
| Cases considered in respect of personnel discharged from Forces on medical grounds, but who did not lodge claims for pension | 986 |
| Claims for war veterans' allowances | 601 |
| Sundry claims and reviews and cases adjourned for further consideration and decision | 6,943 |
| Total | 65,505 |
The next table gives particulars of war pensions current as at 31st March, 1948, distinguishing between the war of 1914–18 and the war of 1939–45.
| Class of Pension. | War, 1914–18. | War, 1939–45. | ||||
|---|---|---|---|---|---|---|
| Number of Pensioners | Number of Children. | Annual Value. | Number of Pensioners | Number of Children. | Annual Value. | |
| £ | £ | |||||
| Ex-members of Forces— | ||||||
| Permanent | 14,088 | 1,631,428 | 6,545 | 378,840 | ||
| Temporary | 324 | 30,667 | 17,971 | 1,512,240 | ||
| Dependants' of disabled ex-members | 2,633 | 1,462 | 191,796 | 1,000 | 621 | 82,981 |
| Widows | 2,291 | 227 | 372,048 | 1,849 | 1,519 | 396,586 |
| Other dependants of deceased members | 379 | 76 | 22,099 | 883 | 756 | 45,363 |
| Totals | 19,715 | 1,765 | 2,248,038 | 28,248 | 2,896 | 2,416,010 |
Mother'S allowance of 30s. a week was paid to 2,539 wives and widows of disabled or deceased ex-servicemen during the year ended 31st March, 1948.
Figures showing the number of pensions in force as at 31st March of each of the last five years are given below.
| At 31st March, | Ex-members of the Forces. | Dependants of Disabled ex-members. | On account of Death. | Total. | ||
|---|---|---|---|---|---|---|
| Permanent. | Temporary. | Widows. | Parents and other Dependants. | |||
| War, 1914–18 | ||||||
| 1944 | 12,548 | 2,753 | 2,855 | 2,044 | 838 | 21,038 |
| 1945 | 13,037 | 2,059 | 2,903 | 2,119 | 731 | 20,849 |
| 1946 | 14,071 | 822 | 2,808 | 2,235 | 524 | 20,460 |
| 1947 | 14,139 | 526 | 2,732 | 2,239 | 445 | 20,081 |
| 1948 | 14,088 | 324 | 2,633 | 2,291 | 379 | 19,715 |
| War, 1939–45 | ||||||
| 1944 | 344 | 9,836 | 832 | 1,541 | 484 | 13,037 |
| 1945 | 926 | 15,897 | 892 | 2,176 | 693 | 20,584 |
| 1946 | 2,562 | 20,284 | 950 | 2,434 | 696 | 26,926 |
| 1947 | 5,014 | 21,020 | 1,114 | 2,106 | 774 | 30,028 |
| 1948 | 6,545 | 17,971 | 1,000 | 1,849 | 883 | 28,248 |
Total payments of pensions to 31st March, 1948, were: War, 1914–18, £46,701,553, war, 1939–45, £8,791,676, and members of Emergency Reserve Corps, £9,737. Figures for the last eleven years were:—
| Year ended 31st March, | Pension Payments, | |
|---|---|---|
| War 1914–18. | War 1939–45.* | |
* Includes Emergency Reserve Corps pensions. | ||
| £ | £ | |
| 1938 | 1,597,524 | |
| 1939 | 1,616,248 | |
| 1940 | 1,673,730 | |
| 1941 | 1,649,076 | 14,379 |
| 1942 | 1,617,481 | 179,197 |
| 1943 | 1,574,062 | 481,462 |
| 1944 | 1,973,069 | 919,259 |
| 1945 | 2,046,005 | 1,408,688 |
| 1946 | 1,997,390 | 1,663,578 |
| 1947 | 2,036,825 | 2,082,288 |
| 1948 | 2,049,391 | 2,032,562 |
The foregoing figures do not include the payments of war veterans' allowances, which in 1947–48 amounted to £422,275, while the total since inception in 1935–36 to 31st March, 1948, was £2,808,547.
During the year 1947–48 medical treatment of war pensioners cost £65,565 (£60,550 in 1946–47), including cost of pensioners resident overseas, while railway concessions to certain classes of war pensioners cost £6,404 (£5,085 in 1946–47).
Medical fees and travelling-expenses of pensioners cost £37,920, as compared with £49,445 in 1946–47; while administrative costs for 1947–48 in respect of war pensions and allowances amounted to £18,858, as against £94,665 in 1946–47.
Economic Pensions.—An “economic pension” is defined as a supplementary pension granted on economic grounds and is in addition to any pension payable as of right in respect of death or disablement. In considering a claim for an economic pension, the Pensions Board is required to take into consideration the ability of the claimant to obtain and retain suitable employment, the personal income and ownership of any property, the cost of living, and other relevant matters. Personal earnings other than from regular employment may be disregarded in the case of a claimant who is in receipt of a total-disability pension.
The maximum weekly rates of economic pensions are £2 5s. to a member, £1 to a widow who has never had a child, and £1 5s. to any other widow, both of the latter payments being in addition to the normal widow'S pension. A partially dependent widowed mother of a deceased member may be granted an economic pension of an amount not exceeding £1 a week in addition to her ordinary pension, but her total income, including pension, must not exceed £2 10s. a week. In the case of total dependency on one son or partial dependency on two or more deceased sons the maximum economic pension is increased to £1 5s. a week and the maximum of pension and income to £3 15s. a week.
Servicemen pensioned for minor disabilities do not receive economic pensions.
Details of economic pensions payable at 31st March, 1948, are now given. The figures contained therein are included in the tables shown under the preceding subheading.
| Class of Pension. | War, 1914–18. | War, 1939–45. | ||
|---|---|---|---|---|
| Number. | Annual Value. | Number. | Annual Value. | |
| £ | £ | £ | £ | |
| Ex-members with permanent pensions | 3,556 | 397,443 | 257 | 29,089 |
| Ex-members with temporary pensions | 76 | 8,427 | 1,375 | 155,097 |
| Widows | 1,265 | 80,655 | 877 | 55,290 |
| Widowed mothers | 26 | 1,274 | 59 | 2,861 |
| Totals | 4,923 | 487,799 | 2,568 | 242,337 |
War Veterans' Allowances.—The object of the War Veterans' Allowances Act, 1935, which is now incorporated in the War Pensions Act, 1943, was to make provision for members of the Forces who, apart from any wounds or other injuries received during war service, were ageing prematurely or otherwise becoming unemployable by reason of mental or physical incapacity. The term “veteran” includes:—
Any male member of the New Zealand Forces who has served as such in actual engagement with the enemy:
Any female member who has served overseas as a member of the New Zealand Forces:
Any other person who, being domiciled in New Zealand at the commencement of any war in which members of the New Zealand Forces have served as such, has served in that war as a member of any of His Majesty'S Forces, other than the New Zealand Forces, with a unit in actual engagement with the enemy.
A condition precedent to the granting of a war veteran'S allowance is a minimum of five years' continuous residence in New Zealand immediately preceding the date of the claim. Continuous residence is not deemed to be interrupted by occasional absences not exceeding six months in the aggregate.
Whether or not a claimant for an allowance is unfit for permanent employment by reason of mental or physical infirmity is a question of fact to be determined by the War Pensions Board. Claimants have the right of appeal to the War Pensions Appeal Board.
The War Pensions Amendment Acts, 1945, 1947, and 1949 provided for increases in war veterans' allowances, and the rates at present payable (November, 1949) are as follows:—
Male veteran without a wife: £130 per annum, diminished by £1 for every complete £1 of his annual income (exclusive of this allowance) in excess of £52:
Male veteran with a wife: £130 per annum in respect of the veteran'S personal claim, £130 in respect of his wife, diminished by £1 for every complete £1 of their combined annual income (exclusive of this allowance) in excess of £52:
Female veteran without a husband: £130 per annum, diminished as in (1) above:
Other female veteran, £130 in respect of her personal claim, diminished by £1 for every complete £1 of the combined annual income (exclusive of this allowance) of the veteran and her husband, in excess of £104.
Where a veteran in receipt of an allowance dies leaving a widow in respect of whom an allowance is also being paid, a gratuity not exceeding twice the total annual allowance in force (in respect of the veteran and his wife) at date of death may, at the discretion of the board, be granted.
In conformity with the policy of granting family benefits under the Social Security Act, the War Pensions Amendment Act, 1945, abolished war veterans' allowances in respect of dependent children, and from 1st October, 1945, these allowances have been paid by way of family benefit.
Emergency Reserve Corps Pensions.—The War Pensions Act, 1943, incorporates that part of the Finance Act, 1940, which made provision for pensions to members of the Emergency Reserve Corps, established under the Emergency Reserve Corps Regulations 1940. These pensions are payable where death or disablement was suffered in the course of service, including training, as a member or was directly attributable to such service.
The rates of pension in respect of the death of a male member are the same as those prescribed for a private in the Army—viz., £2 5s. per week to the widow, plus a mother'S allowance of £1 10s. per week to a widow with a dependent child or children, together with 10s. per week in respect of each dependent child. In respect of total disablement, the maximum weekly rates are £1 15s. for an unmarried member under twenty-one years of age and £3 10s. per week for other members, plus £1 5s. per week for a wife with no dependent child; £1 15s. per week for a wife with a dependent child or children, plus 10s. per week in respect of each dependent child. Pensions in respect of partial disablement are determined in each case by the War Pensions Board. An economic pension may also be granted.
As in the case of war pensions, the amount payable to a dependant other than a wife or child is limited to the average weekly value of the benefits received from the member during the period of twelve months immediately preceding the date of death or disablement, as the case may be.
South African Veterans' War Pensions.—The original authority for the payment of pensions in respect of service in the South African War was the Defence Act, 1909, but the Finance Act (No. 4), 1940, provided that pensions might be granted under Part III of the War Pensions Extension Act, 1940, in respect of death or disablement suffered by members of any New Zealand Contingent who served in South Africa in connection with the South African War. As previously stated, the War Pensions Extension Act, 1940, was repealed by the War Pensions Act, 1943, and pensions to veterans of the South African War are now payable under the general authority of the latter with its amendments. The provisions of the Act are now extended to include a member who served in any of His Majesty'S forces in the South African War if he had been born in New Zealand or was domiciled therein at the commencement of the war.
In addition to war pensions, a South African veteran who is in receipt of an age-benefit under the Social Security Act may receive an additional benefit of £13 13s. per annum, provided that his total income, including pension, does not exceed £182 per annum. Such payments are included with social-security benefits and not with war pensions.
Mercantile Marine Pensions.—The War Pensions and Allowances (Mercantile Marine) Act, 1940, made provision for the payment of pensions and allowances to members of the New Zealand mercantile marine and their dependants in respect of death, disablement, or detention suffered as a result of the Second World War, this being a new departure as far as New Zealand'S war-pension legislation is concerned. An amendment passed in 1943 extended the scope of the Act to permit of pensions being paid to members of any mercantile marine who are in receipt of similar pensions or allowances from any other Government within the British Commonwealth, provided that such members were, immediately prior to the commencement of the war, bona fide residents of New Zealand. A claimant under this new provision must be actually resident in New Zealand, and the amount of pension or allowance that may be granted is limited to a sum which, together with the amount granted out of New Zealand, will not exceed the pension or allowance that would have been payable had the claimant been a member of the New Zealand mercantile marine.
The maximum rates at present in force in respect of the death of a member range from £2 10s. to £3 7s. per week (according to the member'S rank or rating and the tonnage of the vessel on which he was serving) for a widow without dependent children, and in the case of a widow with a dependent child or children there are additional payments of £1 15s. per week by way of mother'S allowance and 10s. per week in respect of each dependent child under sixteen years of age. In the case of total disablement, the maximum weekly rates are £3 10s. to the member, £1 5s. to a wife without a child, £1 15s. to a wife with a dependent child or children, plus 10s. per week in respect of each dependent child under sixteen years of age. The amounts payable in respect of partial disablement are determined by the War Pensions Board in each case. There are no distinctions as regards rank or rating or the tonnage of the vessel in which the member was serving in the case of disablement pensions and allowances.
Where a member suffered detention as a result of his capture or the capture of his ship, the rates of allowances payable corresponded to the pensions payable in respect of total disablement.
In all cases pensions and allowances to dependants other than to a wife or a child are limited to the value of the benefits actually received by the claimant from the member during the twelve months immediately preceding his death, disablement, or detention, as the case may be.
War Pensions Appeal Board.—A claimant may appeal to the War Pensions Appeal Board from a decision of the War Pensions Board within six months of the date on which the decision of the latter was communicated to him. Such an appeal can only be made in so far as it consists of—
The rejection of any claim for a pension in respect of the death or disablement of a member of the Forces on the ground that the death or disablement was not attributable to his service as a member of the Forces or that the condition that resulted in his death or disablement was not aggravated by such service.
The assessment of a pension granted to any member of the Forces in so far as the assessment is based on medical grounds.
The Appeal Board may confirm the decision of the War Pensions Board or may grant a pension, or, within the limits prescribed by the Act, may increase or reduce the amount of any pension.
The following table summarizes the operations of the Appeal Board during the year ended 31st March, 1948, in respect to appeals under war pensions and allied legislation.
| — | War 1914–18. | War 1939–45. | War Pensions and Allowances (Mercantile Marine) Oct., 1943. | War Veterans. | Totals. |
|---|---|---|---|---|---|
| Appeals outstanding 31st March, 1948 | 37 | 347 | 4 | 388 | |
| Appeals lodged, 1947–48 | 129 | 824 | 3 | 1 | 957 |
| Totals to he dealt with | 166 | 1,171 | 3 | 5 | 1,345 |
| Appeals upheld | 48 | 412 | 1 | 461 | |
| Appeals dismissed | 76 | 534 | 2 | 3 | 615 |
| Appeals withdrawn or struck out | 13 | 104 | 1 | 118 | |
| Totals disposed of | 137 | 1,050 | 3 | 4 | 1,194 |
| Appeals outstanding, 31st March, 1948 | 29 | 121 | 1 | 151 | |
| Percentage upheld | 35.0 | 39.2 | 33.3 | 38.6 |
MISCELLANEOUS PENSIONS.—In addition to the various classes of pensions enumerated in the foregoing part of this section there are pensions under the Civil Service Act, 1908, and other miscellaneous pensions and annuities.
The recipients of pensions under the Civil Service Act are ox-officers of the Civil Service who acquired pension rights under a system in operation prior to the introduction of compulsory contributory superannuation schemes. At 31st March, 1947, there were only 2 of these pensions remaining in force while by the 31st March 1948, this class of pension had lapsed entirely. In addition, there were 173 pensions, &c., at the 31st March, 1948, classed as “sundry pensions and annuities.” This class covers ex-officers of the Legislative Department, and ex-members of the Police, Defence, and Naval Forces, certain ox-members of the Legislature, and others, by way of compassionate allowance, &c.
SUPERANNUATION.—The Superannuation Act, 1947, repealed a considerable body of legislation dealing with superannuation. The former law on this subject was largely contained in the Public Service Superannuation Act, 1927, which provided for payments to public servants on their retirement and embraced the State Railways, Public Service (including Police), teachers, and Stipendiary Magistrates. A general scheme which was, and still is, available to all local-authority employees is conducted by the National Provident Fund Board (refer later in this Section).
Under the 1947 Act there was established the Government Superannuation Fund, which replaced (and absorbed the moneys belonging to) the former Public Service Superannuation Fund, the Teachers' Superannuation Fund, and the Government Railways Superannuation Fund. Revenues of the Government Superannuation Fund, which came into operation as from the 1st April, 1948, comprise contributions, subsidies from the Consolidated Fund, interest accruing from the investment of moneys in the Fund, fines, all moneys that would have been paid into the three Funds mentioned if this Act had not been passed, and all other moneys that may be payable into the Fund.
Superannuation benefits are available for a greater number of persons in receipt of State emoluments than was the case under the 1927 Act. The 1947 legislation as amended in 1948 provides for contributions from members of the Government Service, including in this term the Education Service, the Cook Islands Public Service, the Samoan Public Service, and the State Advances Corporation in addition to the Departments of State under the control of the Public Service Commission, the Railways Department, and the Post and Telegraph Department. Separate parts of the Superannuation Act, 1947, relate to the provision of superannuation for members of Parliament, permanent members of the regular Armed Forces, and for Magistrates and Maori Land Court Judges.
Contributions in the case of the Government Service range from 5 per cent. of annual salary if under thirty years of age at commencement of contributory service to 10 per cent. where age exceeds fifty years, the increase being at the rate of 1 per cent. per year for each five-year increase in age category at commencement date. Retiring-allowance is computed at the rate of one hundred and twentieth part of his or her annual salary for each year of contributory service, this amount being increased by a sum equal thereto, but in no case shall the added amount exceed £300, or be less than £3 15s. per year of contributory service. The annual salary for this purpose is deemed to be the average of that paid in each of the five years immediately preceding retirement. The above are general provisions only and need to be supplemented by reference to the Act, in which other provisions given must be considered in respect of age, length of service, sex, sickness, withdrawals, refunds, subsidiary benefits, &c. Contributions and retiring-allowances as above apply generally to permanent members of the Regular Armed Forces. Magistrates and Judges of the Maori Land Court are entitled to retiring-allowances, subject to age and length of service qualifications, equal to one-fortieth of the annual salary at the date of retirement, but in no case is the retiring-allowance to exceed two-thirds of that salary. Contributions normally are at the percentages quoted above. A member of Parliament contributes at the rate of £50 a year, but if at the date of commencement of the retiring-allowance his contributions are less than £250 he is to pay the deficiency into the Consolidated Fund within such time and in such manner as the Minister of Finance may allow. The retiring-allowance, subject to nine years of service and attainment of the age of fifty years, is at the rate of £250 a year for the first nine years of his service, and for each additional year of service an increase of £25, with a maximum rate of allowance of not more than £400 a year.
Details of the transactions of the Government Superannuation Fund for the first year of operation are not yet available.
Information presented in the following pages review the operations of the Teachers' Superannuation Fund and the Railways Superannuation Fund up to the date of merger of these Funds with the Government Service Superannuation Fund. Available; data in respect of the Public Service Superannuation Fund and the Superannuation of Magistrates are also given. In this case the latest figures relate to the 31st March, 1945. A statement of the activities of the National Provident Fund is also appended.
Public Service Superannuation Fund.—The Public Service Superannuation scheme, which included all branches of the Public Service except the Railways Department and that part of the Education Service which came under the operations of the teachers' superannuation scheme, was brought into force on the 1st January, 1908. Certain classes of non-permanent officers could be permitted to join the Fund.
By virtue of the Finance Act (No. 2), 1942, permanent members of the Public Service could become contributors to the Fund in respect of any period of continuous temporary service immediately preceding the date of permanent appointment.
The Police Provident Fund, which was established on the 1st December, 1899, under the Police Provident Act, 1899, was merged in the Public Service Superannuation Fund on the 1st April, 1910.
The Fund was administered by a Board, and consisted of payments by contributors, interest on investments, Government subsidy, and fines imposed on public servants as such.
Persons permanently employed in the Public Service on 1st January, 1908, the date on which the Public Service Superannuation Fund came into operation, were given the option of joining the Fund, but all persons permanently employed thereafter were required to become contributors. This compulsory provision remained in operation until the passing of the Superannuation Amendment Act, 1945, which provided that contribution to the Fund was optional on the part of all persons who were first permanently appointed to the Public Service after 1st January, 1946. This amendment also stipulated that no person could join the Fund until he reached the age of twenty years. A further radical change introduced by the 1945 amendment gave a contributor the right to cease to be a contributor on giving six months' notice, at the end of which period he was entitled to receive the total amount of his contributions, without interest.
The contributions varied with the age on joining the Fund. For ages under thirty they were 5 per cent. of the salary; ages thirty and under thirty-five, 6 per cent.; thirty-five and under forty, 7 per cent.; forty and under forty-five, 8 per cent.; forty-five and under fifty, 9 per cent.; fifty and over, 10 per cent.
The 1945 amending Act provided a new basis for calculating retiring-allowances and also abolished the maximum of £300 per annum laid down by the original Act. Future retiring-allowances were calculated in accordance with the following provisions:—
For every year of service the contributor was to receive one hundred-and-twentieth part of his annual salary, and for every fraction of a year of service the contributor was to receive a proportionate part of one hundred-and-twentieth of his annual salary.
The annual amount of the retiring-allowance payable under paragraph (a) was to be increased by an amount equal thereto, but in no case should the amount added under this paragraph be less than £3 15s. for each year of service or more than £300.
For the purpose of computing the retiring-allowance to be granted to a contributor, his annual rate of pay was to be deemed to be the average rate of pay received by him during the five years immediately preceding his retirement, or if his service was not continued for five years, then during his period of service.
The 1945 amendment increased the pension payable to the widow of a contributor or pensioner during widowhood from £31 to £52 per annum, and extended the age from fourteen years to sixteen years for dependent children in respect of whom an allowance of £26 per annum was payable. In certain cases this age could be extended to eighteen years.
The retiring age was sixty-five years, but contributors might retire after forty years' service. Females could retire after thirty years' service or at the age of fifty-five. In certain cases, and subject to certain terms and conditions, the Minister in charge of a contributor'S Department might reduce the retiring age to sixty years for males and fifty years for females, or reduce the requisite service to thirty-five years irrespective of age, or reduce the retiring-age to fifty-five years if length of service was not less than thirty years.
Since 1931, the retiring qualifications were modified to permit of a further reduction of five years in age or service in the case of contributors compulsorily retired through no fault of their own. Prior to the operation of the Superannuation Amendment Act, 1945, a specially computed reduced superannuation was provided in such cases, but the retiring-allowance was later computed as if the retirement had been on the ground of being medically unfit for further duty. The provisions covered the three major Funds.
At the 31st March, 1945, there were 30,531 contributors, paying £454,163 per annum into the Fund. The pensioners at the same date numbered 4,774, and were entitled to £705,892 per annum, made up as follows:—
| — | Number. | Pensions. | ||
|---|---|---|---|---|
| Males. | Females. | Total. | ||
| £ | ||||
| Retired for age or length of service | 2,092 | 407 | 2,499 | 599,417 |
| Retired for ill-health | 342 | 74 | 416 | 47,287 |
| Police injured on duty | 21 | 21 | 3,792 | |
| Widows | 1,490 | 1,490 | 46,438 | |
| Children | 165 | 183 | 348 | 9,048 |
| Totals | 2,620 | 2,154 | 4,774 | 705,982 |
The following table contains particulars of the public servants who were contributing to the Fund at the 31st March, 1945, grouped according to their respective rates of contribution.
| Rate per Cent. | Number. | Annual Salary. | Annual Contributions. | ||
|---|---|---|---|---|---|
| Male. | Female. | Total. | |||
| £ | £ | ||||
| 5 | 23,083 | 4,232 | 27,315 | 7,470,758 | 373,538 |
| 6 | 1,588 | 109 | 1,697 | 613,113 | 36,787 |
| 7 | 905 | 52 | 957 | 360,534 | 25,237 |
| 8 | 381 | 16 | 397 | 149,683 | 11,975 |
| 9 | 130 | 5 | 135 | 55,671 | 5,010 |
| 10 | 29 | 1 | 30 | 16,160 | 1,616 |
| Totals | 26,116 | 4,415 | 30,531 | 8,665,919 | 454,163 |
Accumulated funds at the 31st March, 1945, amounted to £3,477,914. Total assets, which amounted to £3,538,987, included: investments, £3,122,035; interest, due and accrued, £37,553; contributions in course of transmission, &c., £277,785; cash in hand and at bank, £74,027. The investment figures include £28,851 invested on Stipendiary Magistrates' account.
In his report on the Fund as at 31st March, 1939, more particulars of which may be found in the 1942 issue of the Year-Book, the Government Actuary stated that the estimated subsidy required during each of the years 1940–44 was £357,000 per annum, to which should be added a further £216,000 per annum on account of subsidies short paid in past years.
The subsidy to the Fund was originally £20,000 per annum, rising in 1910 to £22,500, and in the next two years to £23,000. In 1913 it was increased to £48,000, and in 1919 to £86,000. In consequence of the position disclosed by the Actuary as at 31st December, 1919, an additional amount of £100,000 was contributed to the Fund by the Government, divided between the years 1923–24 and 1924–25. An additional amount of £100,000 was also paid in 1929–30, following the actuarial investigation as at 31st March, 1927; while, commencing with 1932–33, additional amounts were paid each year, mainly to compensate the Fund for losses incurred as a direct result of the statutory reduction in interest. The total subsidies paid to the Fund from its inception to 31st March, 1945, amounted to £3,957,843, which included £358,668 to cover increased allowances to widows and children under authority of section 114, Public Service Superannuation Act, 1927. The total amount paid by Treasury to compensate for the statutory reduction in interest was £231,656. This amount is not included with subsidies.
All valuations of the Fund prior to 1924 were made on the basis of interest at 4 per cent., a 4½–per-cent. rate being adopted for the next three periods. As the effective rate of interest earned on the funds had been steadily decreasing since the 1934 valuation and was then considerably below the 4½–per-cent. mark, a 4–per-cent. rate was adopted for the latest valuation. The average rate of interest earned in each of the last ten financial years was as follows:—
| Year ended 31st March, | Average Rate per Cent. |
|---|---|
| £ s. d. | |
| 1936 | 5 6 5 |
| 1937 | 4 18 8 |
| 1938 | 4 15 1 |
| 1939 | 4 5 2 |
| 1940 | 4 1 4 |
| 1941 | 4 4 9 |
| 1942 | 4 6 3 |
| 1943 | 4 3 3 |
| 1944 | 4 0 4 |
| 1945 | 3 19 5 |
The total revenue of the Fund for the year ended 31st March, 1945, was £817,522, including members' contributions £527,389, interest on investments and on contributions £132,164 (which included a special payment of £10,511 from the Consolidated Fund to reimburse the Superannuation Fund on account of the statutory reduction of interest on all classes of securities), and Government subsidy £150,792, the last-mentioned including a special payment of £24,386 on account of increased benefits to widows and children. The total amount expended during the year was £781,043, including retiring and other allowances £655,089, refunds of contributions £114,570, transfers to other funds £2,544, cost of administration £8,466, and other expenditure £374.
A table is now given showing the progress of the Fund for the last five years available.
The Public Service Superannuation Fund was abolished from the 1st April, 1948, its moneys being transferred to the Government Service Superannuation Fund as from that date.
The progress of the Fund during the last eight years is shown in the following table.
| Year ended 31st January, | Number of Contributors. | Amount of Contributions received. | Interest received. | Government Subsidy. | Amount paid in Allowances. | Accumulated Fund. |
|---|---|---|---|---|---|---|
| £ | £ | £ | £ | £ | ||
| 1941 | 9,463 | 170,297 | 42,021 | 166,917 | 333,459 | 974,885 |
| 1942 | 9,827 | 173,508 | 42,362 | 155,627 | 350,188 | 954,640 |
| 1943 | 10,212 | 177,476 | 41,896 | 159,806 | 351,870 | 944,337 |
| 1944 | 10,668 | 192,364 | 51,997 | 146,756 | 358,675 | 933,803 |
| 1945 | 11,180 | 189,684 | 41,062 | 137,938 | 374,584 | 879,994 |
| 1946 | 11,165 | |||||
| 1947 | 10,555 | |||||
| 1948 | 10,555 | 782,887 | 123,695 | 993,230 | 1,451,831 | 1,088,610 |
| 1948 (31st March) | 10,714 |
Since the inception of the scheme the Government has paid £3,909,152 in subsidies to the Fund. As from the 1st April, 1918, this Fund was amalgamated with the Government Service Superannuation Fund.
Government Railways Superannuation Fund.—The Government Railways Superannuation Fund was established on the 1st January, 1903, by the Government Railways Superannuation Fund Act, 1902, subsequently embodied in the Government Railways Act, 1926, and included under the Government Superannuation Fund by the Superannuation Act, 1947.
The general conditions in regard to retiring-allowances, &c., were the same as for the Public Service and Teachers' Superannuation Funds, except that in the Railways Department a male contributor might retire at sixty years of age although he had completed less than forty years contributory service.
From 1st April, 1924, the moneys belonging to the Fund were separately invested by the Public Trustee. The average rate of interest earned during the year 1947–48 was 3.5 per cent.
The income for the year 1947–48 totalled £1,272,205, including members' contributions, £277,074; interest, £20,045; subsidies from Railways Department, £396,106 (including £56,984 on account of increased allowances to widows and children, and £91,118 for the cost-of-living bonus); Consolidated Fund—from Treasury, £81,500—from vote Department of Internal Affairs, £497,000.
The expenditure during the year amounted to £1,187,621, of which retiring-allowances to members represented £815,231; cost-of-living bonus, £91,118, allowances to widows and children, £89,718; refunds of contributions, £102,358; and withdrawal of contributions, £89,196.
At the 31st March, 1948, there were 5,593 persons receiving allowances involving an annual liability of £877,295 on the Fund.
The progress of the Fund during the last five years is shown below.
| Year ended 31st March, | Number of Contributors. | Amount received from Contributors. | Interest earned by Fund. | Amount received from Government. | Amount paid in Allowances. | Accumulated Fund. |
|---|---|---|---|---|---|---|
| £ | £ | £ | £ | £ | ||
| 1944 | 17,570 | 242,322 | 58,652 | 282,673 | 559,898 | 1,151,546 |
| 1945 | 18,018 | 277,260 | 57,827 | 352,274 | 659,134 | 1,130,936 |
| 1946 | 16,985 | 328,108 | 53,162 | 349,251 | 701,197 | 1,080,778 |
| 1947 | 14,013 | 295,478 | 51,778 | 373,547 | 895,056 | 473,090 |
| 1948 | 12,180 | 277,074 | 20,045 | 974,606 | 996,067 | 557,674 |
In accordance with the provisions of the Superannuation Act, 1947, the Government Railways Superannuation Fund ceased to exist as a separate entity on 31st March, 1948, and its assets and liabilities have been taken over by the newly established Government Superannuation Fund.
16*
Superannuation of Magistrates.—The scheme for Magistrates provided for the same rates of contribution as under the Public Service scheme, but gave an annual retiring-allowance for each year of service (whether continuous or not) equal to one-fortieth of the annual salary receivable at the date of retirement, with, however, a limit of two-thirds. The retiring-age was sixty-eight, instead of sixty-five as in the case of the Public Service scheme.
Members' contributions during the year ended 31st March, 1945, the figures for 1944 being in parentheses, totalled £1,416 (£1,493), and interest on investments amounted to £1,166 (£1,212), making the revenue £2,582 (£2,705), exclusive of Government subsidy. Expenditure for the year totalled £5,702 (£6,101), of which retiring-allowances accounted for £5,665 (£6,060), and administration expenses £37 (£41). The assets of the Fund amounted to £28,859 (£31,118).
NATIONAL PROVIDENT FUND.—The National Provident Fund was established by Act in 1910, and came into operation on the 1st March, 1911. The Fund is administered by a Board comprising the Minister of Finance as Chairman, the Secretary to the Treasury, the Director-General of Health, the Valuer-General, the Superintendent of the Fund, and two other members appointed by and holding tenure of office during the pleasure of the Governor-General.
In addition to guaranteeing the benefits payable under the Act, the State provides a subsidy to the extent of one-fourth of the contributions paid into the Fund, and also meets the administrative expenses of the Fund; the total amount required by way of subsidy and administrative expenses is voted by Parliament annually.
The last actuarial examination of the Fund disclosed a satisfactory surplus and the Actuary reported that no additional State subsidy was required.
The Fund provides two distinct services:—
Pensions and subsidiary benefits for members of the general public, with extensions for members of approved friendly societies and employees of firms, &c.
Superannuation for employees of local authorities and various other statutory bodies.
Membership of the public portion of the Fund is open to any person between the ages of sixteen and forty-nine years residing in New Zealand. There is no medical examination on entry, and the method of joining is extremely simple; the applicant fills in a form at any money-order post-office or local office of the Fund and pays a first weekly contribution Subsequent contributions may be met by deduction from salary, wages, or savings-bank account; a liberal discount is attached to contributions paid three or more years in advance.
The contributions for each 10s. step of weekly pension range from 9d. per week in the case of persons joining at age sixteen to 9s. 4d. per week for persons joining at age forty-nine, and full subsidiary benefits attach to the lowest rate of pension.
The following benefits are payable:—
*On Incapacity of Contributor.—After contributing for five years and after three months' incapacity for work, an allowance of 10s. per week for each child under sixteen years of age. No contributions are payable while in receipt of this allowance, which abates in respect of other income in excess of £5 per week.
*On Death of a Contributor.—After contributing for five years, an allowance of 10s. per week for each child under sixteen years of age, and 10s. for the widow so long as any child is under sixteen years of age.
On reaching age sixty, a pension of 10s. to 40s. per week according to the scale of contributions.
On withdrawal, lapse, or death leaving no children under sixteen, a refund to contributor or to personal representative of all contributions paid, less any benefits theretofore received.
* If the child remains at school, these allowances may be continued up to attainment of age eighteen years.
There is provision in the Act for the payment of a maternity allowance of £6 (as State grant) on the birth of a child of a contributor where the joint income of the parents does not exceed £300 per annum and where the maternity benefits as provided under the Social Security Act have not been received in respect of the birth of that child.
In 1916 provision was made for the approval of friendly societies as contributing authorities with reduced contribution rates for pensions and for the payment of maternity allowances to members. Further extensions in 1927 and 1929 provided for the entry of employees of firms, &c., eliminating the existing income bar, and increasing the maximum pension to £4 per week.
The scope of the Fund was extended in 1914, the Board being empowered to entertain applications by local authorities for superannuation on behalf of their employees, and in 1926 Hospital Boards became contributors on behalf of their nursing and clerical employees. With the consent of the Minister of Finance, State Departments also contribute for nurses in the same manner as Hospital Boards, thus facilitating their transfer anywhere within the health services without loss of pension rights.
To achieve uniformity in benefits and to make improved conditions of superannuation available to permanent employees of all local authorities, the Board was empowered in 1946 to vary the conditions and benefits in the original schemes and to issue a notice to all local authorities containing conditions and benefits under which any permanent employee might elect to become a contributing employee. The two independent funds established under authority of the Local Authorities Superannuation Act, 1908, have been merged with the National Provident Fund, and there is now operating one uniform superannuation scheme to which all local authorities in New Zealand contribute; employees may move freely from employment in one local authority to another without sacrifice of accrued superannuation benefits.
The principle of voluntary membership previously introduced into State schemes was also extended to the National Provident Fund and provision made for the recognition, by agreement with the employing local authority, of local-authority service within the British Commonwealth or within New Zealand.
The benefits and contributions are similar to those operating in the Government Superannuation Fund, and there is now provision whereby employees may transfer from local body to State employment, and vice verso, without loss of accrued rights.
On retirement there are several options as to joint and survivorship or variable pensions which enable the income payable after retirement being arranged to me individual needs.
The Fund is now the approved superannuation vehicle for statutory corporations and also provides facilities whereby registered educational institutions may provide superannuation for teachers, thus removing another artificial barrier to the free interchange of teachers and the appointment of the most suitable applicant to any position in the Educational Service.
Since the inauguration of the Fund in 1911, 130,334 persons (93,120 males and 37,214 females) have entered, and of these 104,612 (73,323 males, 31,289 females) have discontinued for one reason or another, leaving 25,722 (19,797 males and 5,925 females) contributors at 31st December, 1947. Of the 4,448 discontinuances in 1947, 3,443 were on account of withdrawal, 472 on account of lapse or cancellation, 94 on account of death, 288 on account of attainment of pension age, and 151 on account of transfer.
The numbers of contributors for the various pension rates as at 31st December, 1947, were as follows:—
| Pensions. | Males. | Females. | Total. |
|---|---|---|---|
| 10s. per week | 11,286 | 708 | 11,994 |
| 20s. per week | 2,231 | 343 | 2,574 |
| 30s. per week | 206 | 49 | 255 |
| 40s. per week | 583 | 132 | 715 |
| Superannuation | 5,491 | 4,693 | 10,184 |
| Totals | 19,797 | 5,925 | 25,722 |
Summarized figures set out below for the years ended 31st December, 1937, 1942, and 1947, form a useful basis for comparative analysis. While there has been a recession in the direct or personal contributors' branch, the net total is little changed, increased contributions and total income figures being attributable to the higher contributions in the expanding superannuation branch.
| — | Year ended 31st December, | ||
|---|---|---|---|
| 1937. | 1942. | 1947. | |
| New contributors | 4,902 | 2,687 | 2,614 |
| Total of contributors | 28,972 | 28,508 | 25,722 |
| Pensioners | 736 | 1,229 | 1,983 |
| £ | £ | £ | |
| Contributions | 266,431 | 342,234 | 622,859 |
| Interest (including fines) | 185,016 | 248,416 | 306,023 |
| Total income (including State subsidy) | 583,420 | 695,648 | 1,099,777 |
| Pension payments | 66,370 | 104,379 | 168,376 |
| Other benefits | 167,816 | 158,043 | 295,488 |
| Total payments | 239,915 | 266,149 | 467,425 |
| Funds at end of year | 4,992,587 | 6,862,358 | 9,586,611 |
| Rate of interest per cent. earned on invested funds | £3 18s. 3d. | £3 15s. 9d. | £3 7s. 0d. |
The amount of the subsidy paid by the State on contributions paid to the Fund during 1947 was £121,334.
The next table presents an alternative comparison, the period covered on this occasion being the five years ended 31st December, 1947.
| Year. | Number of Contributors. | Annual Hate of Contributions Payable. | Total Amount of Fund. | Claims During Year. | ||
|---|---|---|---|---|---|---|
| Incapacity. | Retiring. | Widows' and Children'S. | ||||
| £ | £ | £ | £ | £ | ||
| 1943 | 28,352 | 344,403 | 7,293,137 | 9,803 | 110,233 | 12,844 |
| 1944 | 28,054 | 349,773 | 7,732,833 | 9,631 | 118,900 | 13,767 |
| 1945 | 27,788 | 361,641 | 8,116,044 | 11,254 | 126,517 | 13,835 |
| 1946 | 27,405 | 398,846 | 8,985,360 | 13,687 | 143,658 | 14,352 |
| 1947 | 25,722 | 422,871 | 9,586,611 | 13,399 | 168,376 | 31,483 |
Of the accumulated fund of £9,586,611 at 31st December, 1947, £9,346,449 was invested, mainly in Government securities.
LOCAL government throughout New Zealand is exercised by a number of local authorities constituted under various Acts of Parliament. These Acts provide for the creation of districts over which the local authorities exercise jurisdiction. Different types of district are distinguishable, each type being identified with a specific function or group of functions. Geographically, New Zealand is divided into 129 counties, which comprise its total area, except for certain small islands which are not included within the boundaries of the adjacent counties. Administratively, boroughs and independent town districts, which are contained within the areas of the several counties, are regarded as separate entities. From an administrative point of view, therefore, the fundamental districts are counties, boroughs, and independent town districts. Upon this foundation a considerable superstructure of districts of other types has been erected. These overlapping districts may be divided into two broad classes, viz.: (1) Districts formed from parts of counties—e.g., road districts; and (2) those which are comprised of a group of adjacent districts of other types united for a common purpose—e.g., electric-power districts. The number of local authorities actively functioning at the 1st April, 1948, was 699, made up as follows: County Councils, 125; Borough Councils, 134; Town Boards (independent), 29; Town Boards (dependent), 18; Road Boards, 7; River Boards, 22; Catchment Boards, 12; Land-drainage Boards, 46; Urban Drainage Boards, 3; Water-supply Boards, 2; Fire Boards, 60; Local Railway Board, 1; Harbour Boards (including 22 where the Board is a Borough or County Council, &c.), 46; Electric-power Boards, 42; Hospital Boards, 42; Tramway Board, 1; Transport Board, 1; Gas Board, 1; and Rabbit Boards, 107. In addition to the foregoing there were 26 Milk Authorities constituted by 1st April, 1948, under the Milk Act, 1944, which is referred to later, 2 Nassella Tussock Boards under the Nassella Tussock Act, 1946, and 18 District Councils of the Main Highways Board constituted under the Main Highways Act, 1922. These District Councils of the Main Highways Board, although not local authorities in the strict sense of the term, are nevertheless intimately connected with certain aspects of local government, and have power to make recommendations of considerable importance.
The Soil Conservation and Rivers Control Act, 1941, as amended in 1945, 1946, and 1947, has for its objects the conservation of soil resources, the prevention of damage by erosion, and the making of more adequate provision than in the past for protection of property from damage by floods. A Soil Conservation and Rivers Control Council is established for the general administration of the Act, while for local administration power is given for the constitution of catchment districts, each covering the catchment area of one or more river systems and under the control of a Catchment Board, which is armed with wide powers, including borrowing, rating, &c. To date (1st April, 1948) twelve catchment districts have been created, of which eleven were actively functioning at that date.
Under the Milk Act, 1944, as amended in 1945 and 1947, the Governor-General may by Order in Council constitute and declare any part or parts of New Zealand a milk district for the purpose of ensuring to the inhabitants of that district an adequate supply of milk of a required standard of quality. The principal Act provided that for every milk district there shall be a Milk Authority which may be a Borough Council or a Metropolitan Milk Board, as circumstances require. In any case where the Milk Authority is a Borough Council, the Council is required to appoint a Standing Committee, known as the Milk Committee, and provision is made for the appointment of other persons to the Committee where the milk district includes any area outside the borough. Where the Milk Authority is a Metropolitan Milk Board, the members thereof are elected by the constituent districts comprising the milk district. The Milk Amendment Act, 1947, provides for the constitution of a District Milk Board in any case where the Council of any borough has declined to be the Milk Authority or where there is no borough situated wholly or partly within the district and it is found to be impracticable to establish a Metropolitan Milk Board. The members of a District Milk Board are appointed by the Governor-General from members of local authorities situated wholly or partly within the particular milk district.
The number of Milk Authorities constituted as at 1st April, 1948, was 26, of which a Metropolitan Milk Board was the authority in 5 cases and a Borough Council in 21 cases.
Nassella Tussock Boards have been constituted in Marlborough and North Canterbury under the Nassella Tussock Act, 1946, to make provision for the control and eradication of the plant known as nassella tussock.
Detailed statistics relating to each local authority, other than Hospital Boards, are contained in the Local Authorities Handbook, an annual publication of the Census and Statistics Department. Hospital Boards, which supply their returns in different form, and to the Department of Health, are omitted from the statistics contained in this section, but summarized data relating to them will be found in Section 5B.
The local-authority year now uniformly ends on 31st March, except in the case of most Harbour Boards. In certain cases where the harbour is administered by a County or Borough Council, the year ends on 31st March, but in all other cases on 30th September.
The history of local government in New Zealand may be conveniently divided into two periods associated with two distinct forms of administration, namely—(1) The provincial system, in which the local government of each province was a function of the provincial authorities; and (2) the present county system, which arose on the abolition of the provinces in 1876, and in which the general responsibility for the local government of the whole country was undertaken by the Central Government.
THE PROVINCES.—Although New Zealand was at first (1848) divided into the two provinces of New Ulster and New Munster, it was not until 1853 that the provincial system really commenced. In that year, the two existing provinces were abolished and the colony was divided into the six provinces of Auckland, New Plymouth (altered to Taranaki in 1859), Wellington, Nelson, Canterbury, and Otago. The number was later increased to nine by the separation of Hawke'S Bay from Wellington (1859), Marlborough from Nelson (1860), and Southland from Otago (1861). Subsequently it was reduced to eight by the merging of Southland with Otago (1870), and restored to nine again by the separation of Westland from Canterbury in 1874, Westland having been a county independent of Canterbury from 1867. Each province was presided over by a Superintendent and Council, with power to legislate for its own territory, subject, however, to disallowance by the Governor, and also to the exclusion of such matters as Customs duties, postal affairs, Crown lands, superior Courts of law, coinage, and paper currency, which were to be controlled by the General Assembly (Central Government). The provinces received from the Central Government a capitation allowance for the maintenance of harbours, hospitals, asylums, charitable aid, and police; while each province was expected to provide for the construction and maintenance of roads, bridges, and other public works out of its own revenues, which were derived chiefly from the sale of waste lands.
The Provincial Councils, therefore, were virtually left with the whole responsibility of providing for the details of local administration. The Councils in turn delegated certain of their powers and functions to lesser authorities, and a number of boroughs, towns, and road and highway districts came into being. Owing, however, to the lack of uniformity between the Ordinances of the various Councils on the subject of local government, considerable confusion arose and rendered impossible any satisfactory co-ordination beyond provincial boundaries. Thus main roads were frequently planned without sufficient regard to the linking-up of the country as a whole. With the rapidly increasing population, and consequent extension of settlements, the need for the development of communications along national instead of provincial lines became apparent. That the provinces had definitely outlived the period of their usefulness became abundantly clear during the prosecution of the Vogel policy of immigration and public works initiated in 1870, and in 1875 the Abolition of Provinces Act was passed in the face of strong provincial opposition.
CONSTITUTION OF LOCAL DISTRICTS.—In 1876 local government entered upon an entirely new phase, the Central Government assuming the general responsibility for the local administration of the whole country. All existing legislation on the subject was repealed and new measures were introduced, notably the Counties Act, 1876, which divided the country into sixty-three counties, with provision for administration by elective Councils having powers considerably less than those enjoyed by the Provincial Councils. Another important enactment of the same year was the Municipal Corporations Act, which provided for the incorporation of the thirty-six boroughs then in existence and for the creation of new boroughs. The powers of municipalities were also extended, permitting the construction of tramways, waterworks, and gasworks, while the borrowing-powers of boroughs were placed on a definite and uniform footing. While these measures have long since been repealed, it is upon them that the broad structure of the present system is based.
Since the inception of the county system there has been a great expansion of local government throughout New Zealand. With the growth of population there has been a steady increase in the number of counties, boroughs, and town districts, while entirely now types of districts have been created to cater for special services. A description of each type of local authority may be found in the 19–10 and previous issues of the Year-Book.
FRANCHISE.—The franchise in local government is a variable one, differing materially in certain respects as between urban and country districts. Prior to the passing of the Local Elections and Polls Amendment Act, 1941, the county franchise was based solely on property qualification, with a differential voting-power according to the value of property possessed, whereas in boroughs and town districts every adult possessing the necessary residential qualifications was entitled to be enrolled as an elector for the election of the local-governing authority7. On any proposal relating to loans or rates, however, a ratepaying qualification was necessary. The Amending Act of 1941 made provision for tenants of State houses to be enrolled as electors as if they were ratepayers, but it entitled such persons to one vote only and conferred no voting powers in connection with any proposal relating to loans or rates.
An amendment passed in 1944 further extended the franchise in counties and road districts to include a residential qualification on the same lines as for boroughs, but did not interfere with the multiple voting power conferred by a property qualification. One vote only is allowed in boroughs and town districts, but it is possible, by virtue of property qualification, to have a vote in more than one district. The 1944 amendment introduced compulsory registration of electors for boroughs and town districts, all adult persons not entitled to enrolment by virtue of a property qualification being required to make application for enrolment within a prescribed time. The Act also removed the disability which prevented persons in the employ of local authorities from becoming members thereof. The Local Elections and Polls Amendment Act, 1946, provided that all general elections of local authorities are to be held on the third Wednesday in November of the year in which such elections are due, instead of in May as hitherto. This Act also provided that where a person is entitled to be enrolled for any district of a local authority by virtue of a residential qualification (referred to later), the officer responsible may, without formal application, enter the name of that person on the local authority roll, if his or her name is on the parliamentary roll in respect of an address within the district of the local authority. This provision is permissive and may be used at the discretion of the local authority. Details of the franchise as it affects each type of local district are now given.
Counties.—Any person of twenty-one years of age and over who possesses any one of the qualifications mentioned hereunder is entitled to be enrolled on the county electors roll:—
Rating qualification, which may be held by any person whose name appears in the valuation roll as the occupier of any rateable property within a riding of the county. One vote is allowed where the rateable value does not exceed £1,000, two votes where the value is greater than £1,000 but not in excess of £2,000, and three votes where the value exceeds £2,000.
A residential qualification is held by any British subject (either by birth or by naturalization) who has resided for one year in New Zealand and has had permanent residence of not less than three months in the riding of the county to which the roll relates.
The possession of a miner'S right entitles a person to enrolment provided (a) the holder also holds a mining privilege and is actively engaged in mining, (b) he is resident in the riding of the county and has been continuously so resident for two months immediately preceding the nomination of candidates. The residential or the miner'S right qualification entitles the holder to one vote only.
Boroughs.—Any person of twenty-one years of age and over who possesses any of the following qualifications is entitled to enrolment:—
Freehold qualification—meaning the beneficial and duly registered ownership of a freehold estate in land of a capital value of not less than £25 situated in the borough, notwithstanding that any other person is the occupier thereof.
Rating qualification, which may be held by any person whose name appears in the valuation roll as the occupier of any rateable property within the borough.
A residential qualification may be held by any British subject (either by birth or by naturalization) who has resided for one year in New Zealand and who has had permanent residence during the last three months in the borough to which the roll relates.
An occupier'S qualification, previously valid, was abolished by the Local Elections and Polls Amendment Act, 1946.
As already stated, no person is entitled to vote at a poll taken on any proposal relating to loans or rates by virtue only of a residential qualification.
Town Districts.—The franchise is the same as for boroughs, except that for county electoral purposes in the case of dependent town districts the county qualification is necessary.
Rabbit Districts.—The franchise is based on stock ownership, from one to five votes being allowed according to the number of stock units owned. A sheep is counted as one unit and cattle as live units each. For up to 5,000 units one vote is allowed; over 5,000 but not exceeding 10,000, two votes; over 10,000 but not exceeding 20,000, three votes; over 20,000, but not exceeding 30,000, four votes; over 30,000, five votes.
Other Districts.—Road districts, river districts, land-drainage districts, water-supply districts, and the local railway district all have a franchise similar to that of counties except that the residential qualification applies to road districts only.
Districts composed of a grouping of districts of other types united for a common purpose have a franchise as for the component districts. Such districts are urban drainage districts, electric-power districts, harbour districts, hospital districts, urban transport districts, catchment districts, and the gas district.
GENERAL POWERS.—Local authorities in New Zealand derive their powers from the Acts under which they are constituted, and also from special empowering Acts. In addition to legislation providing for particular types of local authority or for individual local authorities, there are several statutory measures which are more or less applicable to all local authorities, such us the Local Elections and Polls Act, 1925, and the Local Bodies' Loans Act, 1926. In the case of Harbour Boards, there is in addition to a general Harbours Act a special Act for each Board, which is subordinate to the general Act. Certain types of local authority—Urban Drainage Boards, the Local Railway Board, the Tramway and Transport Boards, and the Gas Board—derive their principal powers from special constituting Acts.
Local authorities have general powers of entering into contracts for any of the purposes for which they are constituted; of selling and leasing land; and of taking or purchasing any land which may be necessary or convenient for any public work.
AMALGAMATION.—Various statutory provisions exist for the voluntary amalgamation of local authorities, and these have been availed of from time to time. There have been numerous amalgamations of contiguous boroughs, while the one-time numerous road districts which played a very important part in the scheme of local government in the essentially colonizing days of New Zealand are now largely merged in county areas. Prior to the passing of the Local Government Commission Act, 1946, no provision for compulsory amalgamation existed, although a measure entitled the Local Government (Amalgamation Schemes) Bill was introduced during the parliamentary session of 1936, but was not proceeded with.
The Local Government Commission Act, 1946, set up a Local Government Commission which is a permanent institution deemed to be a Commission of Inquiry under the Commissions of Inquiry Act, 1908, whose functions are to review from time to time the functions and districts of local authorities, and to investigate local-government boundaries in New Zealand, and recommend such changes as may be considered necessary.
The Act provided that the Commission was to consist of—
A Chairman, who was required to have the qualifications necessary for appointment as a Judge of the Supreme Court, and who “as to tenure of office, salary, emoluments, and privileges would have the same rights and be subject to the same provisions as a Judge of the Supreme Court”;
A member, to be appointed by the Governor-General in Council, having a “special knowledge of local government”; and
Two further members to be appointed from a panel of persons nominated by the nominating Associations, one of whom shall have a special knowledge of urban local government, and the other shall have a special knowledge of rural local government.
By Proclamation of the Governor-General dated 28th January, 1947, the following Associations were declared to be nominating Associations for the purposes of the Local Government Commission Act, 1946:—
The Municipal Associations of New Zealand (Incorporated).
The New Zealand Counties' Association.
The Electric-power Boards' and Supply Authorities' Association of New Zealand.
The Hospital Boards' Association of New Zealand.
The Harbour Boards' Association of New Zealand.
The general functions of the Commission are set out in section 12 of the Local Government Commission Act, 1946, as follows:—
“The functions of the Commission shall be to review from time to time the functions and districts of local authorities and to inquire into proposals and prepare schemes for the reorganization thereof, and generally to review and to report to the Minister upon such matters relating to local government as may be determined by the Commission or referred to it by the Minister.”
Its powers are more specifically defined in section 13, as amended in 1947, where it is authorized to draw up a reorganization scheme to provide for any one or more of the following matters:—
The union into one district of two or more adjoining districts, whether districts of the same kind or not.
The merger of any district in any other district.
The constitution of a new district or districts.
The abolition of any district or districts.
The transfer of all or any of the functions of any local authority to any other local authority.
Any alteration of the boundaries of adjoining districts.
The conversion of a district into a district of a different kind.
The inclusion in any district of any area adjoining that district.
Subsection (3) of section 13, however, restricts the powers of the Commission in respect of trading undertakings of counties, boroughs, or Town Boards. A trading undertaking for this purpose is defined as follows:—
“Trading undertaking' means any tramway service, ferry service, or other service for the conveyance of passengers or goods, any gas or electric-light undertaking, any power-supply undertaking, any milk-supply undertaking, and such other undertakings as may from time to time be declared by the Governor-General by Order in Council to be trading undertakings for the purposes of this Act.”
In so far as these trading undertakings are concerned, the Commission is prohibited from transferring the whole or any part of such trading undertakings from any county, borough, or Town Board except on the union, merger, or abolition of the district of such local-governing authority.
The effect of this provision is that the Commission, for instance, could not transfer the electric-power undertaking of a borough to a Power Board. Neither could it set up a Tramway Board to undertake the work of a tramway controlled by a Borough Council.
Most of the general enactments providing for the incorporation of specific types of local authorities provide machinery whereby adjustments of boundaries, amalgamations, and such-like reorganizations can take place.
The actual procedure of the Local Government Commission may be briefly summarized as follows:—
A full investigation by its staff as to the necessity for the change proposed. Only if these investigations establish a prima facie case does the Commission proceed to the next stage.
A full public notification to all parties interested, and an individual notification to all those specifically interested, at least one month before the public inquiry is held. This notification sets out in detail the proposals which the Commission is investigating, and gives an indication that all persons or parties interested may, if they so desire, submit evidence at the inquiry.
A public inquiry, open to the public and the press, at which all parties have the right to submit evidence, and at which authorized representatives of the various parties have a right to examine their own witnesses and cross-examine witnesses of other parties.
Verbatim reports of the evidence are prepared and distributed not only to members of the Commission, but also to the principal parties engaged in the inquiry.
A report setting out the reasons for the Commission'S decisions, and, where necessary, a provisional scheme, is issued to all parties concerned and is publicly notified in the press.
One month'S opportunity is available for objection to the provisional scheme by any interested party.
A final scheme is notified in a manner similar to that for a provisional scheme.
The final scheme is forwarded to the Minister of Internal Affairs for implementation by His Excellency the Governor-General by Order in Council.
The Act provides for objections to be raised to any scheme of reorganization which the Commission may prepare, and the Commission is required to consider any such objection. Provision is also made for the taking of a poll of electors on any proposal for the union, merger, or abolition of any local governing authority. This poll may be taken on the recommendation of the Commission or, if no such recommendation is made, at the request in writing of not less than 20 per cent. of the electors of the district concerned. No scheme, on which a poll of electors is required to be taken, can be given effect to unless a majority of the valid votes recorded is in favour of the proposal.
BORROWING.—Under the Local Government Loans Board Act, 1926, all loan proposals of local authorities, except in regard to money borrowed in anticipation of revenue, require the sanction of the Local Government Loans Board. The Board consists of the Secretary to the Treasury, the Engineer-in-Chief of the Works Department, and five other members appointed by the Governor-General. In cases where a poll of ratepayers is necessary preparatory to raising a loan, the Board'S consent must be obtained before the poll is held. In no case may the Board sanction any application unless provision is made to its satisfaction for repayment of the loan within such period as it deems reasonable, having regard to the probable duration and continuing utility of the works on which the loan-moneys are to be expended.
The principal legislation dealing with the borrowing-powers of local authorities is contained in the Local Bodies' Loans Act, 1926, which is mainly a consolidation of previous measures on the subject. A local authority is thereby empowered to raise a special loan for the construction of any public work, for the purchase of land or buildings, or for the purpose of engaging in any undertaking into which it may lawfully enter. As explained previously, a loan proposal first requires the sanction of the Local Government Loans Board. It must then be sanctioned by the ratepayers at a special poll (except in certain cases, provided for by various enactments, where a poll is not required to be taken), and the proposal is not deemed to have been carried unless at least three-fifths of the valid votes recorded are in favour of it, save in the case of boroughs and town districts, where a bare majority only is necessary. The properties and revenue of the local authority may be pledged as security for the repayment of any principal sum or interest thereon, or a special rate may be levied for the same purpose.
The borrowing activities of certain types of local authority are subject to special provisions. Under the Hospitals Act, 1926, a Hospital Board must first obtain the approval of the Minister of Health before exercising its power to borrow; in the case of Fire Boards the prior consent of the Minister of Internal Affairs is required; and Rabbit Boards must first seek the approval of the Minister of Agriculture. Harbour Boards derive their authority to borrow for harbour-works from special empowering legislation, and similar authority is given for the capital works of certain other local authorities.
RATING.—Local authorities are largely dependent on revenue from rates to carry out their activities, and even loans raised for special purposes are ultimately liquidated by such revenues—known then as special rates. Three broad classes of rates are distinguished:—
General, for general purposes.
Separate rates levied for the construction of public works, for the acquisition of land or buildings, or for the benefit of the whole or part of a local district.
Special rates imposed to secure the repayment of loan-money, being sufficient to produce interest and sinking fund, or interest and instalment of principal, as the case may be. Special rates can be levied only by resolution gazetted, and, unlike general and separate rates, are not subject to any statutory limit.
There are three main systems of rating: (1) Capital (land and improvements) value, (2) annual value, and (3) unimproved value. In a few cases rating is on an acreage basis, and in the case of certain Rabbit Boards the rate is according to the number of sheep and/or cattle owned.
The Rating Act, 1925, provides that the local authority of any district (other than a district wherein the system of rating on the unimproved value is in force) may from time to time by resolution determine whether the system of rating on the annual value or on the capital value shall be in force in the district. The system of rating is upon the basis that 1s. in the £1 on the annual value is deemed to he equivalent to ¾d. in the £1 on the capital value of rateable property; or where in a district not rating on the annual value it is necessary for any purpose to ascertain the annual value of any rateable property, then the annual value thereof is equal to 6 per cent. on the capital value of such property. The annual value is deemed to be the letting-value, less 20 per cent. in the case of houses, buildings, and other perishable property, and less 10 per cent. in the case of land, but in no instance is the rateable value to be less than 5 per cent. of the value of the fee-simple.
The Urban Farm Land Rating Act, 1932, with the object of affording some relief to owners of farm lands subject to rating by a Borough Council, authorizes the preparation of a special farm-land roll, which is deemed part of the valuation roll for rating purposes.
Consequent upon the decline in property values during the depression years, many owners took advantage of the provisions of the Valuation of Land Act permitting individual revaluations. In order to preserve equity in rating, the Valuation of Land Amendment Act, 1933, authorized local authorities to levy rates upon a proportionate part, not being less than 75 per cent., of the values upon the roll. Where individual revaluations have been made, rates are levied either upon the new valuation or upon the proportionate part of the value existing prior to revaluation, whichever is the lower.
Rating on Unimproved Value of Land.—The Rating on Unimproved Value Act, 1896, was passed to afford local authorities the opportunity of adopting the principle of rating expressed in the title of the measure. The Act is now incorporated in the Rating Act, 1925. It is entirely at the option of the ratepayers of local districts to adopt the system, and provision is made for a return to the old system of rating, if desired, after three years' experience of the new one. The poll is taken in the same manner as in the case of a proposal to raise a loan under the Local Bodies' Loans Act, 1926. Under the original Act it was necessary for a minimum number of one-third of the ratepayers to vote, and a majority of their votes carried the proposal. Now the question of adoption or otherwise is decided by a bare majority of the valid votes recorded, irrespective of the number of ratepayers who have voted.
A rescinding proposal can be carried at a poll by the same means as one for adoption, but not until after three years have elapsed; and, vice versa, rejection of a proposal bars its being brought forward for a similar period.
The valuation roll is supplied to the local authority by the Valuer-General under the provisions of the Valuation of Land Act, 1925, and the definitions of “capital value,” “improvements,” “unimproved value,” and “value of improvements” set out in that Act, as subsequently amended, apply also to rating on unimproved value. Provision is made for adjustment of rating-powers given under other Acts by fixing equivalents. Thus, as already indicated, a rate of 1s. in the pound on the annual value is to be considered equal to ¾d. in the pound on the capital value.
It should be noted that some local authorities automatically adopt rating on unimproved value. For example, a town district, borough, or another county formed from part of a county automatically rates on the system in force in the county at the time of the constitution of the new district; also two boroughs amalgamating adopt the system in force in the district with the greater population, unless their Councils agree to the contrary.
A table is given of rating systems in force during the financial year 1946–47, in those types of districts which have power to levy rates.
| — | System of Rating. | Total. | ||||
|---|---|---|---|---|---|---|
| Unimproved Value. | Capital Value. | Annual Value. | Acreage Basis. | On Stock. | ||
* Includes Chatham Islands County, for which import and export dues are charged in lieu of rates on land. † Includes one various. | ||||||
| Counties | 60 | 64 | 125* | |||
| Boroughs | 85 | 17 | 26 | 128 | ||
| Town districts | 25 | 25 | 3 | 53 | ||
| Road districts | 2 | 6 | 8 | |||
| River districts | 9 | 11 | 6† | 26 | ||
| Catchment districts | 10 | 10 | ||||
| Land-drainage districts | 30 | 18 | 48 | |||
| Electric-power districts | 13 | 28 | 41 | |||
| Water-supply district | 1 | 1 | ||||
| Urban drainage district | 2 | 1 | 3 | |||
| Tramway district | 1 | 1 | ||||
| Rabbit districts | 2 | 97 | 6 | 105 | ||
| Totals | 224 | 185 | 30 | 103 | 6 | 549 |
The position in regard to the four major classes of local authorities at 1st April, 1947 (i.e., the beginning of the 1947–48 financial year) is set out in the following table.
| — | Rating on Unimproved Value. | Total for New Zealand* | Ratio of Unimproved Value to Total. | |||
|---|---|---|---|---|---|---|
| No. | Population. | No. | Population. | No. | Population | |
* Exclusive of migratory, &c., population. † Includes the four counties (Eden, Taupo, Sounds, and Fiord) in which the Counties Act Is not wholly in force. | ||||||
| Per Cent. | Per Cent. | |||||
| Counties (excluding all town districts) | 60 | 313,320 | 129 | 656,090† | 46.51 | 47.70 |
| Boroughs | 89 | 717,670 | 131 | 1,096,870 | 67.94 | 65.43 |
| Town districts (independent) | 14 | 16,910 | 31 | 28,290 | 45.16 | 59.77 |
| Town districts (dependent) | 10 | 3,940 | 18 | 6,730 | 55.56 | 58.54 |
| Totals | 173 | 1,051,84 | 309 | 1,787,980 | 55.99 | 58.83 |
For the purposes of the foregoing tables a district is deemed to rate on the unimproved value where the general rate is levied on an unimproved-value basis. In a number of instances, in particular of boroughs, certain of the subsidiary rates are levied on other systems.
TOWN-PLANNING.—The Town-planning Act, 1926, and its amendments provide for the making and enforcement of town, extra-urban, and regional planning schemes. Every town-planning scheme is required to have for its general purpose the development of the city or borough to which it relates (including the reconstruction of an area already built on) in such a way as to promote its healthfulness, amenity, convenience, and advancement. Extra-urban schemes have like objects in regard to their areas.
Regional planning schemes must be preceded by a comprehensive survey of the natural resources of the areas concerned, and of the present arid potential uses and values of all lands in relation to public utilities or amenities. Regional schemes envisage the conservation and economic development of natural resources by classification of lands according to their best uses and by the co-ordination of all such public improvements, utilities, services, and amenities as are not limited to the territory of any one local authority.
The principal Act provided for a Director of Town-planning and a representative Town-planning Board, but the Government has since decided, instead of having a Director of Town-planning, to follow the English precedent of having a Town-planning Officer directly attached to the Government Department controlling town-planning—in this case the Ministry of Works. The Town-planning Board continues to operate. The Chairman of the Board, formerly the Minister of Internal Affairs, is the Minister of Works, the change having been effected by an amendment to the Act passed in 1948.
All cities or boroughs with a population of one thousand or over at the census of 1926, together with certain road districts, were required to prepare town-planning schemes and submit them to the Town-planning Board by the end of 1936. Other boroughs may be added by Order in Council, and smaller boroughs may submit schemes voluntarily. Provision is made for a combined scheme by two or more adjoining local authorities.
Counties, inclusive of smaller boroughs and of town districts, comprise rural areas for the purpose of extra-urban schemes. The authority responsible for the scheme is the County Council, or where more than one local authority is concerned a representative committee approved by the Board.
The Town-planning Amendment Act, 1948, provides that the Minister of Works may prepare a town or extra-urban scheme in any case where a local authority under an obligation to prepare such a scheme fails to do so after being notified in writing. In such a case the costs and expenses incurred by the Minister are recoverable from the local authority, or they may be deducted from any moneys payable from public funds to the local authority.
When a town or extra-urban scheme has been approved by the Board it is the duty of the local authorities having jurisdiction to enforce the requirements of the scheme in respect of all new works of any description. The provisions of a regional planning scheme are not obligatory, but are intended to serve as a guide to the local authorities within the region.
One of the most important divisions of the town-planning legislation deals with betterment, which is defined as the increase in property values attributable to the approval or carrying-out of a town-planning scheme. Briefly, one-half of betterment increase in the value of rateable property constitutes a debt payable to the local authority by the owner of the land. Within prescribed limits, moneys from this source are to be applied, inter alia, to compensate persons whose lands are acquired for town- or extra-urban-planning schemes, or who are otherwise injuriously affected.
HOUSING.—The Housing Survey Act, 1935, was passed in October of that year, its purpose being to ascertain the extent to which the existing housing-accommodation in New Zealand fell short of reasonable requirements. The Act applied to every borough (or city) or town district whose population was estimated by the Government Statistician to be not less than one thousand at 1st April, 1934, to two suburban road districts, and to any other local authority prescribed by Order in Council. An analysis of the results of the survey carried out under the authority of the Act is contained in the 1946 and previous issues of the Year-Book.
Under section 28 of the State Advances Corporation Act, 1936, the Corporation is empowered to make loans to local authorities for the acquisition of land for the erection of workers' dwellings, or for any other purpose in relation to workers' dwellings. As part of the Government'S housing plans, finance has been made available to local authorities at an interest-rate of 3 per cent. for the purpose of erecting municipally-owned workers' dwellings for letting at low rentals. Applications by local authorities for loans under this arrangement must be approved by the Local Government Loans Board and by the Minister of Finance.
By the Rural Housing Act, 1939, local authorities are empowered to advance moneys to a farmer for the purpose of enabling him to provide a dwelling for his own use or for the use of any farm worker who is principally employed by him, the money in the first place being supplied by the State Advances Corporation (refer p. 396 of this volume).
The Local Authorities (Temporary Housing) Emergency Regulations 1944 empower local authorities to establish and maintain transit housing centres for the purpose of providing temporary accommodation for persons who are awaiting the allocation of State rental houses or the provision of other housing accommodation.
RECEIPTS.—The sources from which the various classes of local authorities secure the moneys necessary to exercise their functions vary greatly, according to the nature of the statutory duties of the local authority concerned. Generally, however, receipts fall under one of four main classes, viz.: Rates; revenue from public utilities, licences, rents, &c.; revenue receipts from the General Government; and receipts such as loan-money and special grants and subsidies from the Government which cannot properly be regarded as revenue.
The receipts of local authorities, divided into the various groups mentioned, are given for each of the last eleven years. As stated earlier, the figures quoted here and elsewhere in this section do not cover the operations of Hospital Boards.
| Year ended 31st March. | Revenue from | Total Revenue. | Receipts not Revenue. | Total Receipts. | ||
|---|---|---|---|---|---|---|
| Rates. | Public Utilities, Licences, Rents, &c. | Government. | ||||
| £ | £ | £ | £ | £ | £ | |
| 1937 | 5,994,353 | 9,524,939 | 454,498 | 15,973,790 | 4,252,803 | 20,226,593 |
| 1938 | 6,541,354 | 10,542,197 | 463,096 | 17,546,647 | 4,389,620 | 21,936,267 |
| 1939 | 6,971,550 | 11,275,084 | 475,542 | 18,722,176 | 6,254,792 | 24,976,968 |
| 1940 | 7,289,240 | 12,188,955 | 480,573 | 19,958,768 | 6,772,327 | 26,731,095 |
| 1941 | 7,344,055 | 12,696,676 | 447,540 | 20,488,271 | 4,651,633 | 25,139,904 |
| 1942 | 7,441,704 | 12,955,129 | 444,236 | 20,841,069 | 3,175,467 | 24,016,536 |
| 1943 | 7,764,677 | 13,681,289 | 401,533 | 21,847,499 | 2,640,252 | 24,487,751 |
| 1944 | 7,823,730 | 14,751,120 | 393,624 | 22,968,474 | 2,053,629 | 25,022,103 |
| 1945 | 7,895,871 | 15,057,508 | 415,019 | 23,368,398 | 2,086,275 | 25,454,673 |
| 1946 | 8,633,329 | 15,393,510 | 450,291 | 24,477,130 | 2,743,837 | 27,220,967 |
| 1947 | 9,541,133 | 16,506,818 | 512,029 | 26,559,980 | 3,737,371 | 30,297,351 |
Local authorities received by way of rates in the financial year 1946–47 a total amount of £9,541,133, and the sum of £804,852 was raised by licences, making £10,345,985 altogether from taxation, which sum is equivalent to £5 16s. 9d. per head of the mean population (including Maoris).
During 1946–47 rates formed 35.9 per cent. of the revenue proper; public utilities, licences, rents, and other sources yielded 62.2 per cent.; and 1.9 per cent. came from the General Government.
Of the revenue proper of counties, which amounted to £4,021,372 in 1946–47, no less a sum than £2,704,425, or 67.3 per cent., was raised by way of rates. Town districts, road districts, river districts, land-drainage districts, and urban drainage districts also rely on taxation for the greater part of their income. In the case of boroughs, electric-power districts, and Harbour Boards, on the other hand, rates supply a considerably smaller proportion of the total revenue. During 1946–47 this source of income accounted for 44.6 per cent. of the total revenue of boroughs, the corresponding proportion for Harbour Boards and electric-power districts being 11.7 per cent. and 0.04 per cent. respectively.
The next table shows the receipts for 1946–47 (classified as in the preceding table for each type of local authority).
| — | Revenue from | Receipts not Revenue. | Total Receipts. | ||
|---|---|---|---|---|---|
| Rates. | Public Utilities, Licences, Rents, &c. | Government. | |||
| £ | £ | £ | £ | £ | |
| Counties | 2,704,425 | 1,098,002 | 218,945 | 1,086,016 | 5,107,388 |
| Boroughs | 5,707,189 | 6,879,172 | 215,145 | 1,397,747 | 14,199,253 |
| Town districts | 100,236 | 59,794 | 4,368 | 49,677 | 214,075 |
| Road districts | 67,952 | 12,901 | 1,405 | 3,933 | 86,191 |
| River districts | 95,604 | 25,321 | 25,085 | 146,010 | |
| Catchment districts | 71,495 | 9,159 | 98,024 | 178,678 | |
| Land-drainage districts | 77,660 | 6,404 | 7,445 | 91,509 | |
| Electric-power districts | 1,615 | 4,460,520 | 592,600 | 5,054,735 | |
| Water-supply district | 3,614 | 218 | 3,832 | ||
| Urban drainage districts | 310,571 | 5,191 | 59,136 | 374,898 | |
| Urban transport districts | 46,260 | 1,433,273 | 30,181 | 1,509,714 | |
| Railway district | 23,224 | 23,224 | |||
| Gas district | 80,466 | 51,600 | 132,066 | ||
| Rabbit districts | 83,107 | 52,423 | 67,542 | 16,527 | 219,599 |
| Fire districts | 312,026 | 4,624 | 10,538 | 327,188 | |
| Harbour Boards | 271,405 | 2,048,724 | 308,862 | 2,628,991 | |
| Totals | 9,541,133 | 16,506,818 | 512,029 | 3,737,371 | 30,297,351 |
Revenue proper in 1946–47 was £2,082,850 greater than in 1945–46, while receipts other than revenue increased to the extent of £993,534. Rates accounted for £907,804 of the revenue increase, public utilities, licences, rents, &c., for £1,113,308, and revenue from the General Government accounted for £61,738.
Of the total rates (£9,541,133) collected during 1946–47, general rates levied brought in £4,524,629 and other rates (including penalty on overdue rates) £5,016,504. Of the latter, £3,569,989 was received by boroughs and £1,193,451 by counties. The whole of the rates collected by Harbour Boards (£271,405) were classed as general rates.
It is of interest to note that for the year 1946–47 the total of all rates collected by counties was equal to £8.57 per £1,000 of rateable capital value (land and improvements). The corresponding figure for boroughs was £17.53, for independent town districts £14.90, and for dependent town districts £9.28 (excluding rates levied by County Councils).
Sections in successive Finance Acts from 1930 to 1936 authorized the remission or postponement in whole or in part of the 10-per-cent. penalty on unpaid rates. This authority then lapsed, but was reinstated on a permanent basis and made retrospective by the Statutes Amendment Act, 1938.
Public Utilities, Licences, Rents, &c.—Rates are not the only form of local taxation. Local authorities derive a certain amount of revenue from publicans' licences, heavy traffic fees, motor-drivers' licences, drivers' (other vehicles) licences, auctioneers' and hawkers' licences, building permits, dog-taxes, pound-taxes, tolls, &c. Sources of revenue not classed as taxation are rents, fines and penalties, market dues, sales of material, sales of light and power from gasworks and electric-supply works, tramway and omnibus receipts, interest on deposits, wharf dues, &c.
Of a total revenue of £6,879,172 accruing to boroughs under this head in 1946–17, £1,173,353 represented tramway and omnibus receipts, £2,520,784 sales of electric light and power, and £577,751 sales of gas. Comparable figures for 1915–46 were £6,203,573, £1,163,391, £2,214,232, and £550,701 respectively.
Receipts from General Government.—A statement of revenue receipts by local authorities from the General Government during the five financial years ended 31st March, 1947, is given in the next table.
| — | Year ended 31st March, | ||||
|---|---|---|---|---|---|
| 1943. | 1944. | 1945. | 1946. | 1947. | |
| £ | £ | £ | £ | £ | |
| Rates on Crown and Maori lands | 1,070 | 3,679 | 4,239 | 6,111 | 7,815 |
| One-third of receipts from land sold on deferred payment or held on perpetual lease | 3,135 | 3,572 | 3,124 | 3,073 | 1,960 |
| One-fourth of rents from small grazing-runs | 228 | 260 | 425 | 172 | 164 |
| Timber and flax royalties | 16,498 | 14,476 | 15,186 | 17,433 | 24,409 |
| Goldfields revenue and gold duty | 16,766 | 20,438 | 17,991 | 16,139 | 15,836 |
| Subsidies on rates | 248,351 | 252,048 | 262,259 | 277,359 | 276,809 |
| Motor-spirits tax | 102,179 | 85,500 | 100,628 | 115,892 | 163,862 |
| Fees and fines | 2,898 | 3,518 | 4,417 | 4,926 | 10,001 |
| Other revenue receipts | 10,408 | 10,133 | 6,750 | 9,186 | 11,173 |
| Totals, Revenue Account | 401,533 | 393,624 | 415,019 | 450,291 | 512,029 |
| Loans from State Advances Corporation | 21,211 | 5,280 | 24,251 | 129,810 | 261,658 |
| Advances from Main Highways Account | 2,000 | 3,145 | 8,827 | ||
| Advances from Soil Conservation and Rivers Control Council | 6,700 | 5,500 | 42,178 | ||
| Grants for special works, &c.— | |||||
| From Labour and Employment Department | 214,638 | 107,267 | 95,219 | 89,957 | 68,318 |
| From Main Highways Account | 357,455 | 398,532 | 436,126 | 525,132 | 703,159 |
| Other | 755,967* | 372,164 | 256,811 | 297,769 | 364,105 |
| Total receipts from Government | 1,752,804 | 1,276,867 | 1,234,126 | 1,501,604 | 1,960,274 |
EXPENDITURE.—The expenditure of local authorities during each of the last eleven years has been as follows:—
| Year ended 31st-March. | Works and Utilities (Construction and Maintenance). | Hospital Board Levies. | Administration. | Interest on Loans and Overdraft. | Other. | Total Expenditure. |
|---|---|---|---|---|---|---|
| £ | £ | £ | £ | £ | £ | |
| 1937 | 13,164,376 | 717,084 | 1,001,504 | 3,120,652 | 2,219,099 | 20,222,715 |
| 1938 | 14,672,484 | 821,697 | 1,034,646 | 3,031,793 | 2,490,527 | 22,051,147 |
| 1939 | 17,170,464 | 943,529 | 1,354,249 | 3,029,990 | 2,580,703 | 25,078,935 |
| 1940 | 17,413,242 | 1,093,479 | 1,350,011 | 3,034,753 | 2,817,710 | 25,709,195 |
| 1941 | 16,120,898 | 966,221 | 1,371,434 | 3,030,802 | 3,237,273 | 24,726,628 |
| 1942 | 15,114,255 | 1,066,383 | 1,439,918 | 2,928,172 | 3,523,364 | 24,072,092 |
| 1943 | 13,802,865 | 1,315,997 | 1,385,227 | 2,806,146 | 3,918,199 | 23,228,434 |
| 1944 | 14,222,570 | 1,251,183 | 1,404,105 | 2,725,283 | 4,198,056 | 23,801,197 |
| 1945 | 15,428,590 | 1,313,844 | 1,560,791 | 2,620,406 | 4,300,012 | 25,223,643 |
| 1946 | 17,516,436 | 1,534,819 | 1,676,563 | 2,541,929 | 4,084,886 | 27,354,633 |
| 1947 | 20,319,365 | 1,857,273 | 1,844,117 | 2,475,457 | 3,982,962 | 30,479,174 |
Included in the total of other payments for 1946–47 is an amount of £2,615,907 in respect of amortization of debt and £108,490 for exchange, the bulk of which related to interest payments. Comparable figures for 1945–46 were £2,501,703 and £109,989 for amortization and exchange respectively.
The main items of expenditure of the various classes of local authorities during 1946–47 is shown below.
| — | Works and Utilities (Construction and Maintenance). | Hospital Board Levies. | Administration. | Interest on Loans and Overdraft. | Amortization of Debt. | Total Expenditure.* |
|---|---|---|---|---|---|---|
* Including other items. | ||||||
| £ | £ | £ | £ | £ | £ | |
| Counties | 3,296,275 | 849,488 | 419,338 | 243,537 | 283,333 | 5,225,257 |
| Boroughs | 9,423,895 | 977,202 | 641,243 | 1, 120,348 | 1,252,499 | 14,098,000 |
| Town districts | 134,345 | 18,084 | 24,371 | 13,839 | 15,559 | 209,612 |
| Road districts | 43,597 | 12,499 | 7,226 | 9,354 | 5,711 | 81,141 |
| River districts | 98,366 | 13,079 | 17,923 | 15,068 | 144,996 | |
| Catchment districts | 119,386 | 28,823 | 691 | 23 | 149,834 | |
| Land - drainage districts | 65,125 | 7,359 | 12,725 | 13,639 | 99,190 | |
| Electric - power districts | 3,728,275 | 355,312 | 449,942 | 513,895 | 5,266,267 | |
| Water - supply districts | 2,190 | 537 | 287 | 569 | 3,583 | |
| Urban drainage districts | 112,039 | 27,425 | 110,304 | 70,003 | 337,862 | |
| Urban transport districts | 1,120,767 | 85,271 | 74,405 | 136,358 | 1,549,005 | |
| Railway district | 26,898 | 3,224 | 438 | 30,650 | ||
| Gas district | 98,751 | 5 222 | 8,614 | 10,418 | 123,582 | |
| Rabbit districts | 183,554 | 21,599 | 493 | 116 | 214,807 | |
| Fire districts | 254,986 | 10,562 | 18,047 | 21,219 | 318,289 | |
| Harbour Boards | 1,610,916 | 193,526 | 394,510 | 277,497 | 2,627,099 | |
| Totals | 20,319,365 | 1,857,273 | 1,844,117 | 2,475,457 | 2,615,907 | 30,479,174 |
The table following gives, in respect of boroughs only, the expenditure on new works out of loan-money during the last eleven years, classified under various heads.
| Year ended 31st March. | Roads, Streets, and Bridges. | Drainage and Sanitation. | Waterworks. | Houses, Workers' Dwellings, &c. | Parks, Gardens, Town Halls, Libraries, Art Galleries, and Places of Public Recreation. | Lighting and Power Services. | Other Public Works. | Totals. |
|---|---|---|---|---|---|---|---|---|
| £ | £ | £ | £ | £ | £ | £ | £ | |
| 1937 | 215,760 | 89,269 | 142,970 | 2,005 | 53,270 | 22 | 23,444 | 526,740 |
| 1938 | 226,127 | 165,623 | 78,009 | 121,388 | 33,850 | 9,735 | 109,303 | 744,035 |
| 1939 | 172,797 | 156,457 | 131,451 | 145,916 | 54,535 | 15,735 | 125,227 | 802,118 |
| 1940 | 148,191 | 151,350 | 142,910 | 121,659 | 73,493 | 48,893 | 55,950 | 742,446 |
| 1941 | 135,740 | 103,297 | 125,687 | 17,972 | 49,944 | 82,977 | 24,068 | 539,685 |
| 1942 | 56,083 | 49,003 | 250,698 | 12,826 | 7,484 | 38,428 | 16,539 | 431,061 |
| 1943 | 12,789 | 14,056 | 115,913 | 32,218 | 4,467 | 23,273 | 5,109 | 207,825 |
| 1944 | 24,404 | 23,018 | 137,891 | 4,379 | 6,135 | 18,921 | 12,269 | 227,017 |
| 1945 | 26,324 | 35,816 | 235,064 | 21,037 | 26,921 | 54,757 | 21,012 | 420,931 |
| 1946 | 33,810 | 17,744 | 267,971 | 126,653 | 22,852 | 82,325 | 37,268 | 588,623 |
| 1947 | 51,872 | 31,905 | 295,702 | 317,868 | 22,319 | 115,118 | 26,956 | 861,680 |
ASSETS AND LIABILITIES.—The assets and liabilities of local authorities at the end of the financial year 1946–47 were as shown in the table following.
| — | Assets. | Liabilities. | ||||
|---|---|---|---|---|---|---|
| Cash Assets. | Other Assets (as estimated in published Balance-sheets). | Debentures and other Securities: Net Indebtedness. | Inscribed stock, i.e., Loans from Treasury under Local Bodies Acts. | Other Liabilities (Bank Overdrafts, Temporary Loans, Outstanding Accounts, &c.). | Total Net Liabilities. | |
| £ | £ | £ | £ | £ | £ | |
| Counties | 1,840,513 | 3,015,779 | 4,535,761 | 344,172 | 349,884 | 5,229,817 |
| Boroughs | 8,099,599 | 39,216,482 | 22,489,738 | 216,968 | 1,000,214 | 23,706,920 |
| Town districts | 120,655 | 418,658 | 284,401 | 1,807 | 23,008 | 309,216 |
| Road districts | 25,010 | 163,481 | 205,121 | 4,152 | 209,273 | |
| River districts | 84,947 | 261,991 | 381,277 | 713 | 8,824 | 390,814 |
| Catchment districts | 65,938 | 61,540 | 59,521 | 18,242 | 77,763 | |
| Land - drainage districts | 59,636 | 71,713 | 219,807 | 32,767 | 10,239 | 262,813 |
| Electric - power districts | 3,695,051 | 19,221,405 | 9,782,290 | 1,001,286 | 10,783,576 | |
| Water - supply district | 171 | 1,370 | 5,647 | 67 | 5,714 | |
| Urban drainage districts | 218,891 | 1,361,755 | 2,089,121 | 9,967 | 2,099,088 | |
| Urban transport districts | 1,204,748 | 2,697,352 | 1,214,655 | 115,564 | 1,330,219 | |
| Railway district | 18,833 | 206,473 | 16,328 | 16,328 | ||
| Gas district | 85,552 | 270,404 | 211,639 | 27,125 | 238,764 | |
| Rabbit districts | 128,401 | 46,603 | 2,226 | 16,324 | 18,550 | |
| Fire districts | 128,313 | 1,036,055 | 367,550 | 47,906 | 415,456 | |
| Harbour Boards | 2,406,890 | 16,756,705 | 7,105,949 | 264,318 | 7,370,267 | |
| Totals | 18,183,148 | 84,807,766 | 48,954,703 | 596,427 | 2,913,448 | 52,464,578 |
The figures shown in the column “Other assets” are taken from the respective balance-sheets, but are far from complete, inasmuch as no valuations are made for certain items. This applies particularly to roads, which, although representing considerable wealth to the community, do not figure at all in the assets. In this connection it may be mentioned that the greater part of the expenditure of counties and road districts goes in this direction. In the case of boroughs, although the proportion is very much less, 16 per cent. of the loan-money expenditure during the last ten years was on roads, streets, and bridges. Assets of local authorities as returned for the last eleven years are as under.
| As at 31st March, | Cash Assets. | Other Assets (estimated). |
|---|---|---|
| £ | £ | |
| 1937 | 11,508,744 | 66,688,860 |
| 1938 | 11,361,080 | 69,792,113 |
| 1939 | 9,981,222 | 71,892,826 |
| 1940 | 10,679,406 | 74,492,688 |
| 1941 | 11,119,958 | 75,802,937 |
| 1942 | 11,324,478 | 77,482,820 |
| 1943 | 13,718,190 | 77,937,237 |
| 1944 | 15,627,862 | 78,620,899 |
| 1945 | 17,202,781 | 79,738,843 |
| 1946 | 17,936,375 | 81,773,700 |
| 1947 | 18,183,148 | 84,807,766 |
Cash assets are made up chiefly of loan balances, reserve investments, and cash in hand. Sinking funds, which amounted to £8,217,129 at 31st March, 1947, do not appear in the foregoing table, but are shown as a deduction from the gross loan indebtedness of local authorities. Other assets are comprised mainly of fixed assets and of stocks of stores and materials.
Boroughs are responsible for 45.9 per cent. of the total assets, electric-power districts for 22.3 per cent., and Harbour Boards for 18.6 per cent. Counties show the comparatively low percentage of 4.7, but this is due to the fact that practically the whole of county expenditure goes on roads, bridges, &c., for which no valuation is available.
Hospital Boards, which are not included in the foregoing figures, had assets (excluding outstanding fees and subsidies) amounting to £10,940,751 at 31st March, 1947, bringing the total (excluding sinking funds) for all local authorities to approximately £113,931,665.
INDEBTEDNESS.—Prior to 1935–36 it was customary to classify the local-authority debt into loans from the State Advances Corporation, loans from the Main Highways Account, inscribed debt—i.e., inscribed stock exchanged for debentures under the Roads and Bridges Construction Act, 1882—and non-governmental loans. The last-mentioned comprise by far the greater part of the debt, and consist mainly of debentures issued to the public. Owing, however, to the operation of the Local Authorities Interest Reduction and Loans Conversion Act, 1932–33, a considerable number of State Advances loans have lost their identity through being included in conversion schemes with non-governmental loans, so that it is no longer practicable to show them separately. Loans from the Main Highways Account being comparatively insignificant in total (approximately £24,000), it is felt that no useful purpose is served by a separate classification. Commencing with 1935–36, therefore, the debt appears under two headings only: (1) Debentures and other securities, and (2) inscribed debt. The reason for retaining the identity of inscribed debt is that it is fundamentally different from the usual type of loan. Originating in the early days of the present system of local government, it arose out of a recognition by the General Government that the primary functions of local authorities, such as road-making, were of national importance, and money was advanced on very favourable terms. The loans were for long terms at low interest-rates, with no provision for repayment, the position being that as soon as a local authority met its final instalment of interest the loan was ipso facto extinguished. Loans of this nature are vastly different from what is usually connoted by the term.
The total gross debt of local authorities at 31st March, 1947, was £57,768,259, made up of: Debentures and other securities (including loans from the State Advances Corporation), £57,147,397; loans from Main Highways Account, £24,435; and inscribed debt, £596,427. The net indebtedness (i.e., after deducting accumulated sinking funds from debentures and other securities, and making an actuarial estimate of the liability for inscribed debt on an assumed table-loan basis) was £49,018,128.
It is necessary to observe that figures of local-authority debt given herein are not quoted in uniform currency terms. Debt held in New Zealand (the great majority of the total) is expressed in New Zealand currency; that held in Australia is expressed in Australian currency; and that held in the United Kingdom in expressed in sterling. The total is ascertained by adding the three currencies together without conversion to a common basis. If the amount domiciled overseas is converted to New Zealand currency, the total gross debt at 31st March, 1947, was £(N.Z.)59,265,840.
After the passing of the Local Government Loans Board Act, 1926, borrowing was on a much lower scale than had been the case for some years previously. During the first four years of its operation (April, 1927, to March, 1931) the net increase in the debt aggregated £8,673,789, a yearly average of £2,168,447, or less than half the average increase of the previous eight years. After 1930–31 there was an almost progressive decline for many years, the total decrease to the end of 1937–38 being £4,625,085. A sharp rise of £1,280,296 in 1939–10 was followed by a further decline of £11,718,711 during the next seven years—i.e., to 31st March, 1947. Part of the decrease following 1632–33 was due to conversion operations, in which accumulated sinking funds were utilized for repayment purposes, and it should be noted that in 1936 the whole of the debt of the Southland Electric-power Board (£1,638,134 gross, £1,237,307 net, at 31st March, 1936) was taken over by the General Government.
Reference to the next table will show that borrowing by local authorities was on a much heavier scale during 1946–47 and 1947–48 than for many years past, and the amount of outstanding debt may be expected to show an increase during the next few years. The low figures of the amounts sanctioned for new works during the period 1939–40 to 1945–46 may be ascribed to factors arising out of the war.
The following summary of the operations of the Local Government Loans Board during the last eleven years shows concisely the trend of local authority borrowing during that period. Hospital Boards are included in this instance.
| Year. | Total Applications. | Sanctioned. | |
|---|---|---|---|
| New Works. | Redemption Loans. | ||
| £ | £ | £ | |
| 1937–38 | 3,362,173 | 3,098,445 | 122,758 |
| 1938–39 | 5,138,917 | 3,013,872 | 1,188,525 |
| 1939–40 | 2,674,450 | 1,701,460 | 355,800 |
| 1940–41 | 5,336,640 | 2,769,505 | 1,602,670 |
| 1941–42 | 4,589,653 | 1,898,096 | 1,391,728 |
| 1942–43 | 3,336,780 | 1,497,120 | 1,121,000 |
| 1943–44 | 3,999,665 | 1,349,335 | 2,359,755 |
| 1614–45 | 3,242,327 | 1,737,807 | 698,120 |
| 1945–46 | 3,497,820 | 2,643,935 | 243,235 |
| 1946–47 | 9,843,543 | 7,289,436 | 1,106,430 |
| 1647–48 | 8,324,579 | 6,022,034 | 1,459,880 |
The outstanding loans of local authorities (other than Hospital Boards) at the end of each of the last eleven years are shown in the following table.
| At 31st March, | Debentures and other Securities.* | Inscribed Debt. | Total Debt, | |||
|---|---|---|---|---|---|---|
| Gross Debt. | Net Debt (i.e., less accumulated Sinking Funds). | Gross Debt, | Present Indebtedness (actuarially computed). | Gross Debt. | Net Debt. | |
* Including loans from State Advances Corporation and from Main Highways Account. | ||||||
| £ | £ | £ | £ | £ | £ | |
| 1937 | 66,950,378 | 57,463,370 | 1,609,372 | 457,514 | 68,559,750 | 57,920,884 |
| 1938 | 66,487,013 | 56,995,441 | 1,573,938 | 409,286 | 68,060,951 | 57,404,727 |
| 1939 | 66,678,215 | 56,988,080 | 1,528,459 | 361,442 | 68,206,674 | 57,349,522 |
| 1940 | 68,006,319 | 58,041,746 | 1,480,651 | 314,612 | 69,486,970 | 58,356,358 |
| 1941 | 66,544,307 | 57,631,516 | 1,430,380 | 268,720 | 67,974,687 | 57,900,236 |
| 1942 | 65,332,785 | 56,555,469 | 1,313,205 | 223,639 | 66,645,990 | 56,779,108 |
| 1943 | 63,969,096 | 55,148,551 | 1,161,978 | 180,350 | 65,131,074 | 55,328,901 |
| 1944 | 62,307,743 | 53,394,194 | 955,085 | 143,206 | 63,262,828 | 53,537,400 |
| 1945 | 60,414,638 | 51,354,680 | 823,299 | 112,382 | 61,237,937 | 51,467,062 |
| 1946 | 59,342,332 | 50,029,520 | 683,532 | 85,623 | 60,025,864 | 50,115,143 |
| 1947 | 57,171,832 | 48,954,703 | 596,427 | 63,425 | 57,763,259 | 49,018,128 |
In addition to the scheme of State advances, there exists a system whereby the State guarantee to the payment of interest and principal, in the event of default by the local authority, may be obtained by the borrowing authority. The amount outstanding in respect of local-authority loans guaranteed by the State has fallen to almost negligible proportions during recent years, being only £80,816 at 31st March, 1947, against which there were sinking funds to the value of £30,896. At 31st March, 1940, the amount of these guaranteed loans was £736,806, sinking funds in respect thereof totalling £463,335.
Of the total net indebtedness of £49,018,128 at the 31st March, 1947, boroughs were responsible for £22,515,406, which represents 6.9 per cent. of their rateable capital value. In the case of counties, which have a much less per caput expenditure on works, &c., the aggregate net indebtedness was £4,569,392, and the percentage of rateable capital value only 1.4.
The following table shows, per head of the population, the gross debt of local authorities and the annual charge thereon for the last eleven years.
| As at 31st March, | Population. | Gross Debt. | Annual Loan Charge. | ||
|---|---|---|---|---|---|
| Amount. | Rate per Head. | Amount. | Rate per Head. | ||
| £ | £ s. d. | £ | £ s. d. | ||
| 1937 | 1,587,211 | 68,559,750 | 43 3 11 | 4,446,706 | 2 16 0 |
| 1938 | 1,604,479 | 68,060,951 | 42 8 5 | 4,457,874 | 2 15 7 |
| 1939 | 1,624,714 | 68,206,674 | 41 19 7 | 4,602,062 | 2 16 7 |
| 1940 | 1,640,901 | 69,486,970 | 42 6 11 | 4,726,074 | 2 17 7 |
| 1941 | 1,636,230 | 67,974,687 | 41 10 10 | 4,806,901 | 2 18 9 |
| 1942 | 1,634,338 | 66,645,990 | 40 15 7 | 4,823,847 | 2 19 0 |
| 1943 | 1,634,094 | 65,131,074 | 39 17 2 | 4,822,975 | 2 19 0 |
| 1944 | 1,643,900 | 63,262,828 | 38 9 8 | 4,828,029 | 2 18 9 |
| 1945 | 1,679,972 | 61,237,937 | 36 9 0 | 4,869,749 | 2 18 0 |
| 1946 | 1,758,004 | 60,025,864 | 34 2 11 | 4,994,792 | 2 16 10 |
| 1947 | 1,793,225 | 57,768,259 | 32 4 4 | 4,925,034 | 2 14 11 |
It should be noted that the debt of electric-power districts shown in the following table does not represent the complete local-authority debt on account of electric power activities, since a considerable portion of the borough debt, and a small part of the county and town district debt also, was incurred for that purpose.
| As at 31st March, | Counties and Road Districts. | Boroughs and Town Districts. | Urban Drainage Districts. | Urban Transport Districts. | Electric-power Districts. | Harbour Boards. | Other Districts. | Totals. |
|---|---|---|---|---|---|---|---|---|
| £ | £ | £ | £ | £ | £ | £ | £ | |
| 1937 | 7,209,254 | 31,895,679 | 2,742,338 | 3,141,772 | 12,026,687 | 10,152,128 | 1,391,892 | 68,559,750 |
| 1938 | 7,135,874 | 31,868,457 | 2,744,939 | 3,105,813 | 11,890,031 | 9,894,115 | 1,421,722 | 68,060,951 |
| 1939 | 7,124,335 | 31,774,210 | 2,736,492 | 2,860,522 | 12,471,315 | 9,746,940 | 1,492,860 | 68,206,674 |
| 1940 | 7,156,114 | 31,932,600 | 2,750,239 | 3,070,465 | 13,114,688 | 9,960,639 | 1,502,225 | 69,486,970 |
| 1941 | 7,095,900 | 31,166,801 | 2,751,359 | 2,445,945 | 13,106,774 | 9,927,578 | 1,480,330 | 67,974,687 |
| 1942 | 6,992,930 | 30,722,037 | 2,733,917 | 2,397,459 | 12,499,046 | 9,796,647 | 1,503,954 | 66,645,990 |
| 1943 | 6,685,000 | 29,841,339 | 2,708,418 | 2,232,182 | 12,376,558 | 9,790,659 | 1,496,918 | 65,131,074 |
| 1944 | 6,361,050 | 29,060,001 | 2,666,879 | 2,160,041 | 11,828,508 | 9,700,962 | 1,485,387 | 63,262,828 |
| 1945 | 6,050,099 | 28,334,881 | 2,641,585 | 1,757,786 | 11,535,522 | 9,496,763 | 1,421,301 | 61,237,937 |
| 1946 | 5,810,592 | 27,896,973 | 2,624,458 | 1,720,628 | 11,190,586 | 9,365,149 | 1,417,478 | 60,625,864 |
| 1947 | 5,513,450 | 27,270,513 | 2,616,883 | 1,659,281 | 10,841,813 | 8,406,378 | 1,459,941 | 57,768,259 |
The debt of road districts at 31st March, 1947, which is included with that of counties, was £212,107; the town district debt at the same date was £340,391. The debt of “other districts” at 31st March, 1947, was mainly that of river districts (£415,613), land drainage districts (£304,002), and fire districts (£450,047).
Domicile of Debt.—A five-years summary of the domicile of loans outstanding, other than inscribed debt, is given hereunder.
| At 31st March, | Amount. | Percentage of Total. | ||||
|---|---|---|---|---|---|---|
| New Zealand. | United Kingdom. | Australia. | New Zealand. | United Kingdom. | Australia. | |
| £ | £ | £ | Per Cent. | Per Cent. | Per Cent. | |
| 1943 | 53,656,498 | 8,461,325 | 1,851,273 | 83.88 | 13.23 | 2.89 |
| 1944 | 52,846,060 | 7,837,225 | 1,624,458 | 84.81 | 12.58 | 2.61 |
| 1945 | 51,795,331 | 7,074,925 | 1,544,382 | 85.73 | 11.71 | 2.56 |
| 1946 | 51,253,207 | 6,604,725 | 1,484,400 | 86.37 | 11.13 | 2.50 |
| 1947 | 49,894,724 | 5,990,325 | 1,286,783 | 87.27 | 10.48 | 2.25 |
During 1946–47 the amount domiciled in New Zealand decreased by £1,358,483, that in Australia by £197,617, and that in the United Kingdom by £614,400.
Debt Charges.—Particulars of the annual loan charge of local authorities during each of the last eleven years are as follows:—
| At 31st March, | On Debentures and other Securities. | On Inscribed Debt. | Total. |
|---|---|---|---|
| £ | £ | £ | |
| 1937 | 4,390,025 | 56,681 | 4,446,706 |
| 1938 | 4,402,450 | 55,424 | 4,457,874 |
| 1939 | 4,548,276 | 53,786 | 4,602,062 |
| 1940 | 4,674,022 | 52,052 | 4,726,074 |
| 1941 | 4,756,701 | 50,200 | 4,806,901 |
| 1942 | 4,777,854 | 45,993 | 4,823,847 |
| 1943 | 4,782,324 | 40,651 | 4,822,975 |
| 1944 | 4,794,671 | 33,358 | 4,828,029 |
| 1945 | 4,841,279 | 28,470 | 4,869,749 |
| 1946 | 4,970,906 | 23,886 | 4,994,792 |
| 1947 | 4,904,191 | 20,843 | 4,925,034 |
Amortization charges are included in the above, the amount payable during 1947–48 on debt other than inscribed debt at 31st March, 1947, being £2,604,716. Interest charges payable during 1947–48 on the debt (other than inscribed debt) outstanding at 31st March, 1947, aggregated £2,299,475, payable, according to countries of domicile, as follows: New Zealand, £1,934,010; Australia, £68,275; United Kingdom, £297,190 (excluding exchange).
The loans outstanding, other than inscribed debt, at 31st March, 1947, are classified below according to domicile, and also according to rate of interest. Reference should be made to observations on page 502 in regard to the currencies in which local-authority debts are expressed.
| Rate of Interest per Cent. | Domiciled In New Zealand. | Domiciled In United Kingdom. | Domiciled in Australia. | Totals. |
|---|---|---|---|---|
| £ | £ | £ | £ | |
| Free of interest | 52,834 | 52,834 | ||
| 3 | 1,836,308 | 9,900 | 1,846,208 | |
| 3⅛ | 1,019,338 | 1,019,338 | ||
| 3¼ | 5,535,907 | 5,535,907 | ||
| 3 5/16 | 2,410 | 2,410 | ||
| 3⅜ | 1,095,825 | 1,095,825 | ||
| 3 7/16 | 15,400 | 15,400 | ||
| 3½ | 7,154,981 | 7,154,981 | ||
| 3⅝ | 508,044 | 508,044 | ||
| 3 7/16 | 35,015 | 35,015 | ||
| 3¾ | 1,032,109 | 1,032,109 | ||
| 3⅞ | 296,729 | 296,729 | ||
| 3 729/866 | 417,372 | 417,372 | ||
| 4 | 1,139,184 | 189,400 | 1,328,584 | |
| 4⅛ | 376,110 | 376,110 | ||
| 4¼ | 28,434,799 | 156,000 | 168,400 | 28,759,199 |
| 4 2/5 | 154,777 | 2,795 | 157,572 | |
| 4½ | 272,391 | 1,209,925 | 1,482,316 | |
| 4⅗ | 284,548 | 15,000 | 299,548 | |
| 4⅘ | 5,000 | 185,675 | 190,675 | |
| 4⅘ | 214,278 | 214,278 | ||
| 5 | 3,445 | 2,565,100 | 2,568,545 | |
| 5⅕ | 1,000 | 1,000 | ||
| 5¼ | 1,024,600 | 51,500 | 1,076,100 | |
| 5½ | 920 | 845,300 | 204,922 | 1,051,142 |
| 5 11/16 | 130,000 | 130,000 | ||
| 5¾ | 6,000 | 518,591 | 524,591 | |
| Totals | 49,894,724 | 5,990,325 | 1,286,783 | 57,171,832 |
The average rates of interest work out as follows: New Zealand, 3.88 per cent.; United Kingdom, 4.96 per cent.; Australia, 5.31 per cent.; total, 4.02 per cent. The interest-rates quoted are those applicable to the amount of debt outstanding. They have not been adjusted to the prices at which the respective loans were raised—e.g., where a loan was issued below par the rate of interest on the sum actually received (omitting the question of flotation expenses) would be higher than the rate shown above.
Interest Reduction and Loans Conversion.—As part of a general policy of a reduction in interest-rates, the National Expenditure Adjustment Act, 1932, imposed, inter alia, a stamp duty of 10 per cent. on interest derived from local-authority securities. The proceeds, less 5 per cent. as administrative charges, were paid to the respective local authorities. This duty was abolished by the Local Authorities Interest Reduction and Loans Conversion Act, 1932–33, which followed somewhat similar legislation dealing with the public debt. Interest-rates on local-authority securities in excess of 4½ per cent. per annum were reduced by 20 per cent., or to a minimum of 4½ per cent. Local authorities were also empowered to draw up individual conversion schemes at a lower and more uniform rate of interest. Dissentients to any such scheme were penalized by a reduction of 33⅓ per cent. below the original rate.
The provisions of the Local Authorities Interest Reduction and Loans Conversion Act, 1932–33, ceased to operate on 31st December, 1935, at which date 90 per cent. of the debt convertible at the 31st March, 1933, had been converted; but provision was contained in section 20 of the Finance Act (No. 2), 1935, for voluntary conversion to be carried out under the provisions of the principal Act.
The Local Authorities Interest, Reduction and Loans Conversion Amendment Act, 1934, limited future borrowings to an interest-rate not exceeding 3½ per cent., with provision, however, for varying the rate by Order in Council under the Local Government. Loans Board Act, 1926. In May, 1939, the maximum was raised to 4¼ per cent., but this has since been reduced and the present maximum rate is 3¼ per cent.
Loan Maturities.—The following table classifies loans (other than inscribed debt) according to years of maturity and countries of domicile.
| Years of Maturity (ended 31st December). | New Zealand. | United Kingdom. | Australia. | Total. |
|---|---|---|---|---|
| £ | £ | £ | £ | |
| Prior to and during 1950 | 8,868,692 | 1,276,525 | 38,259 | 10,123,476 |
| 1951–55 | 11,599,364 | 931,800 | 98,708 | 12,629,872 |
| 1956–60 | 14,072,254 | 3,080,000 | 122,600 | 17,274,854 |
| 1961–65 | 10,117,482 | 702,000 | 793,216 | 11,612,698 |
| 1966–70 | 3,751,534 | 3,751,534 | ||
| 1971–75 | 1,264,165 | 234,000 | 1,498,165 | |
| 1976–80 | 262,336 | 262,336 | ||
| 1981–82 | 11,075 | 11,075 | ||
| Unspecified | 7,822 | 7,822 | ||
| Totals | 49,894,724 | 5,990,325 | 1,286,783 | 57,171,832 |
Table loans account for £16,176,571 of the above total, loans in which a number of debentures are redeemed each year for £25,068,616, and loans with one fixed maturity date for £15,926,645. In the case of table loans the year of maturity is taken as that in which the final instalment is payable. Practically the whole of the debt domiciled abroad is composed of loans with one fixed date of maturity.
SYSTEM AND PROCEDURE.—The existing law relating to the valuation of land in New Zealand is contained in the Valuation of Land Act, 1925 (a consolidation of previous legislation), and its amendments of 1926, 1927, 1932, 1933, 1945, and 1946, and in the Land Valuation Court Act, 1948. A brief historical account of earlier legislation appears in the 1932 Year-Book.
The work of the Valuation Department is directed by the Valuer-General. The actual work of valuation is done by District Valuers and assistant valuers. The duty of a valuer is to examine each property and to estimate to the best of his ability (1) the unimproved value of the land contained therein, (2) the value of the buildings (if any) or other improvements (if any) upon such land, and (3) the “capital value” of the property. The Valuation of Land Amendment Act, 1927, provides that, in any revaluation of property in a borough rating on the unimproved value, the unimproved value only or the value of improvements only may be ascertained, the capital value being adjusted accordingly.
Under the New Zealand law the increased value attaching to any piece of land which is duo to the successful working of other lands in the district, or to State or local authority expenditure on public works, or to the general prosperity and development of the country, forms portion of the “unimproved value.” Any increased value, however, which is represented by the improvements effected by the individual possessor, either past or present, does not form part of the “unimproved value.”
Valuers are enjoined not to strain after high values, nor to accept special prices paid for land in exceptional circumstances, but to determine the value neither above nor below the fair selling-value in view of the many and diverse purposes for which the values are used. Land containing or supposed to contain oil, coal, or other mineral deposits is valued as for the surface use only.
THE VALUATION ROLL.—The Valuation of Land Act directs the preparation of a valuation roll for each district, setting forth in respect of each separate property the following particulars:—
The name of the owner of the land and the nature of his estate or interest therein, together with the name of the beneficial owner in the case of land held in trust:
The name of the occupier within the meaning of the Rating Act:
The situation, description, and area of the land:
The nature and value of the improvements on the land:
The unimproved value of the land:
The capital value of the land:
Such other particulars as are prescribed.
The district valuation roll so long as it continues in force is by law the roll from which the valuation roll of every local authority rating on the capital or on the unimproved value is framed.
Section 77 of the Statutes Amendment Act, 1916, provides that every revision of a district valuation roll made after 31st March, 1947, shall be followed by further revisions within five years of each preceding revision. Provision is made, however, to postpone any such revision by Order in Council should circumstances warrant it.
In December, 1932, the Urban Farm Land Rating Act (amended in 1933, 1935, and 1944) was passed with the object of giving some rating relief to farm lands subject to rates levied by Borough (or City) Councils, Independent Town Boards, and certain Road Boards. The Act provides for the preparation of farm-land rolls, which are deemed to be part of the valuation roll for rating purposes.
After the values in a district have been revised a new valuation roll is prepared, and the Valuer-General addresses to each person whose name appears thereon a notice setting forth the values at which his property is entered, and naming a date on or before which all objections (in writing) to the values must be lodged.
LAND VALUATION COURT.—All Assessment Courts established under the Valuation of Land Amendment Act, 1945, were abolished by the Land Valuation Court Act, 1948, and the jurisdictions previously exercised by such Courts were transferred to the Land Valuation Court established under the 1948 legislation. This Court consists of three members appointed by the Governor-General in Council, one of these members being appointed the Judge of the Land Valuation Court.
In addition, Land Valuation Committees were established which, in the exercise of their powers and functions, are subject to the general jurisdiction of the Land Valuation Court.
The Valuer-General refers objections to values to the District Valuer to enable him to review valuations. If after careful reconsideration it is decided that the objections will be allowed or reasonable compromises effected, the valuations are altered accordingly. On the other hand, if the Valuer-General considers that the valuers' estimates are fair, he may disallow the objections or refer them to the Land Valuation Court. If he disallows them, the objector or owner may give notice within twenty-one days that he requires the objections to be heard in the Land Valuation Court. The list of objections, together with copies of these, are filed with a Registrar of the Land Valuation Court, who refers them to the appropriate Land Valuation Committee for hearing and decision.
Each local authority may appoint from time to time a person to be an additional member of the Land Valuation Committee exercising its functions in the district of that local authority. This provision is limited to cases in which objections to valuations of property situated in its area are being heard.
An appeal may be made to the Land Valuation Court by the Crown representative or any person affected from a final order or part thereof made by the Land Valuation Committee provided that the appeal is made within fourteen days of the making of the order.
If the objection to the valuation is allowed, the new valuation is deemed to be entered on the valuation roll, for rating purposes, as at the date of revision as directed by the Governor-General in Council. In the case of objections to revaluations under section 3 of the Valuation of Land Amendment Act, 1933, any amendment made by the Laud Valuation Court shall be deemed to he entered in and to appear on the district valuation roll on the 31st day of March in the year following the calendar year in which notice is duly given to the Valuer-General to make a new valuation. If the objection is disallowed, the owner may, within fourteen days after the hearing by the Court, give notice to the Valuer-General that he requires the capital value to be reduced to the value which he (the objector) considers to be the fair selling-value as specified in his notice (but not less than the aggregate amount owing on mortgages or other charges on the land), or the land to be acquired on behalf of His Majesty at that value or sold in the prescribed maimer.
If the Valuer-General is of the opinion that the value has been fixed at less than its capital value he may, within fourteen days of the hearing, require the owner to consent to what he (the Valuer-General) considers is the fair selling capital value, and, failing such consent being given within thirty days after notice is delivered, he may, with the approval of the Governor-General in Council, acquire the property at that value on behalf of His Majesty.
The decision of the Land Valuation Court on any objection is subject to appeal to the Supreme Court on a question of law. On all other questions the decision of the Land Valuation Court is final. The decision of a majority of the members present constitutes the decision of the Court, but if the majority cannot agree on any matter the decision of the Judge is taken.
Owing to the heavy decline in values during the depression years, and the impracticability of a universal revaluation, the provision in the Valuation of Land Act, 1925, enabling new valuations to be made was taken advantage of by many owners with the object of reducing their rate-payments. In order to maintain rating equity, the Valuation of Land Amendment Act, 1933, authorized local authorities to levy rates upon a proportionate part (not being under 75 per cent.) of values upon the roll. Where an individual owner has obtained a revaluation, the new figure or the proportionate part of the previously existing figure is taken, whichever is the lower.
CAPITAL AND UNIMPROVED VALUES OF LAND.—General valuations of land for the whole of New Zealand were made periodically up to the year 1897–98. Since that year no general valuations for the whole country have been made, but portions are revalued from time to time. As previously mentioned, however, section 77 of the Statutes Amendment Act, 1946, provides that every revision of a district valuation roll made after 31st March, 1947, shall be followed by further revisions within five years of each preceding revision. Provision is made, however, to postpone any such revision by Order in Council should circumstances warrant it. The figures in the following table, showing valuations over a number of years, therefore represent general valuations up to 1897 only, while for subsequent years the figures have been revised to include the latest valuations of small divisions.
GROSS CAPITAL AND UNIMPROVED VALUES
| As at 1st April, | Capital Value (Land and Improvements). | Unimproved Value of Land (included in previous Column). |
|---|---|---|
| £ | £ | |
| 1878 | 99,565,679 | 62,573,868 |
| 1882 | 101,000,000 | |
| 1885 | 113,270,649 | |
| 1888 | 111,137,714 | 75,497,379 |
| 1891 | 122,225,029 | 75,832,465 |
| 1897 | 138,591,347 | 84,401,244 |
| 1902 | 154,816,132 | 94,847,727 |
| 1905 | 197,684,475 | 122,937,126 |
| 1907 | 236,644,536 | 149,682,689 |
| 1909 | 271,516,022 | 172,759,948 |
| 1911 | 293,117,065 | 184,062,798 |
| 1913 | 340,559,728 | 212,963,468 |
| 1915 | 371,076,683 | 230,705,147 |
| 1916 | 389,164,729 | 241,322,255 |
| 1917 | 405,466,071 | 251,087,708 |
| 1918 | 421,383,373 | 260,921,812 |
| 1919 | 445,533,445 | 275,988,409 |
| 1920 | 470,093,697 | 290,880,264 |
| 1921 | 518,584,318 | 317,631,245 |
| 1922 | 544,503,376 | 329,174,337 |
| 1923 | 553,403,794 | 330,790,991 |
| 1924 | 568,500,653 | 333,869,581 |
| 1925 | 587,349,575 | 339,310,260 |
| 1926 | 603,250,306 | 341,047,952 |
| 1927 | 618,264,093 | 341,519,107 |
| 1928 | 631,454,676 | 335,217,075 |
| 1929 | 655,906,887 | 344,757,796 |
| 1930 | 664,571,181 | 338,887,411 |
| 1931 | 667,911,212 | 331,634,774 |
| 1932 | 662,829,264 | 321,798,700 |
| 1933 | 653,707,517 | 314,556,174 |
| 1934 | 650,362,355 | 309,770,390 |
| 1935 | 637,604,203 | 301,137,513 |
| 1936 | 635,801,798 | 295,695,574 |
| 1937 | 632,229,720 | 287,844,804 |
| 1938 | 636,362,641 | 282,326,015 |
| 1939 | 652,898,894 | 282,806,212 |
| 1940 | 660,524,008 | 278,880,855 |
| 1941 | 673,118,250 | 277,541,575 |
| 1942 | 681,921,681 | 276,884,859 |
| 1943 | 684,180,966 | 276,881,168 |
| 1944 | 688,794,796 | 277,038,582 |
| 1945 | 697,365,953 | 277,494,868 |
| 1946 | 710,425,005 | 279,214,040 |
| 1947 | 746,412,384 | 284,274,437 |
Valuations showed a rising tendency for many years, reaching a maximum (so far as unimproved values are concerned) about 1929. After that there was an almost continuous fall to 1943, amounting in all to nearly £68,000,000 (20 per cent.). The fall occurred mainly in rural districts, owing to low prices for farm products in the depression years and to the subsequent writing-down of many mortgages. During the last four years, however, a steady increase has been recorded, the rise over the years 1944–47 amounting to approximately £7,390,000. Between 1931 and 1937 the capital value (which includes unimproved value) recorded a decline of approximately £35,680,000 (5.3 per cent.), but during the next five years an increase of nearly £50,000,000 (7.9 per cent.) took place. Civil building operations fell to a record low level in 1942–43 owing to the large-scale diversion to defence construction with the result that the increase in capital value in that year amounted to only £2,259,285, as compared with an average of £11,389,760 in the preceding four years. With the commencement of the revival of civil building activity the increase in 1943–44 (£4,613,830) was more than double that of the previous year, while in the subsequent three years an increase of nearly £58,000,000 was recorded.
The values shown in the foregoing table and in that following are the gross values; they include the value not only of rateable properties, but also of churches, schools, unoccupied Crown lands, and other lands exempt from local rating.
GROSS VALUES
| As at 1st April, | Number. | North Island. | South Island. | New Zealand. | |||
|---|---|---|---|---|---|---|---|
| Capital Value (Land and improvements). | Unimproved Value of Land (included in previous Column). | Capital Value (Land and Improvements). | Unimproved Value of Land (included in previous Column). | Capital Value (Land and Improvements). | Unimproved Value of Land (included in previous Column). | ||
| £ | £ | £ | £ | £ | £ | ||
| Counties | |||||||
| 1943 | 129 | 220,351,368 | 98,662,194 | 114,437,408 | 64,229,852 | 334,788,776 | 162,232,646 |
| 1944 | 129 | 220,892,635 | 98,677,545 | 114,656,948 | 64,199,718 | 335,546,583 | 162,277,263 |
| 1945 | 129 | 221,970,730 | 98,177,405 | 114,837,770 | 64,147,447 | 336,808,500 | 162,324,852 |
| 1946 | 129 | 225,338,401 | 98,774,423 | 115,188,419 | 64,097,111 | 340,526,820 | 162,871,534 |
| 1917 | 129 | 234,652,422 | 100,469,097 | 117,908,682 | 64,045,537 | 352,560,504 | 164,514,634 |
| Boroughs | |||||||
| 1943 | 127 | 236,627,934 | 79,480,333 | 105,195,802 | 33,186,661 | 341,823,736 | 112,666,994 |
| 1944 | 127 | 239,405,842 | 79,542,549 | 106,164,054 | 33,229,168 | 345,569,896 | 112,771,717 |
| 1945 | 127 | 244,813,576 | 79,892,537 | 108,053,755 | 33,370,686 | 352,867,331 | 113,263,223 |
| 1946 | 128 | 251,669,266 | 80,793,337 | 110,146,760 | 33,519,782 | 361,816,026 | 114,313,119 |
| 1947 | 131 | 272,886,960 | 84,034,623 | 113,596,801 | 33,841,027 | 386,483,761 | 117,875,650 |
| Independent Town Districts | |||||||
| 1943 | 34 | 6,490,172 | 1,708,657 | 1,078,282 | 273,471 | 7,568,454 | 1,982,128 |
| 1944 | 34 | 6,594,125 | 1,715,441 | 1,081,192 | 274,161 | 7,675,317 | 1,982,128 |
| 1945 | 33 | 6,587,977 | 1,631,297 | 1,102,145 | 275,496 | 7,690,122 | 1,906,793 |
| 1946 | 34 | 6,829,663 | 1,713,816 | 1,252,496 | 315,571 | 8,082,159 | 2,029,387 |
| 1947 | 31 | 6,050,747 | 1,565,932 | 1,317,372 | 318,221 | 7,368,119 | 1,884,153 |
| Grand Totals | |||||||
| 1937 | 425,616,361 | 186,608,086 | 206,310,329 | 101,236,718 | 632,229,720 | 287,844,804 | |
| 1938 | 429,671,518 | 183,418,391 | 206,691,123 | 98,907,624 | 636,362,641 | 282,326,015 | |
| 1939 | 440,602,497 | 182,572,667 | 212,296,397 | 100,233,545 | 652,898,894 | 282,806,212 | |
| 1940 | 445,768,496 | 179,372,355 | 214,755,512 | 99,508,500 | 660,524,008 | 278,880,855 | |
| 1941 | 453,472,929 | 178,916,147 | 219,645,321 | 98,625,428 | 673,118,250 | 277,541,575 | |
| 1942 | 460,828,500 | 179,174,197 | 221,093,181 | 97,710,662 | 681,921,681 | 276,884,859 | |
| 1943 | 463,469,474 | 179,191,184 | 226,711,492 | 97,689,984 | 684,180,966 | 276,881,168 | |
| 1944 | 466,892,602 | 179,335,535 | 221,902,194 | 97,703,047 | 688,794,796 | 277,038,582 | |
| 1945 | 473,372,283 | 176,701,239 | 223,993,670 | 97,793,629 | 697,365,953 | 277,494,868 | |
| 1946 | 483,837,330 | 181,281,576 | 226,587,675 | 97,932,464 | 710,425,005 | 279,214,040 | |
| 1947 | 513,590,126 | 186,069,652 | 232,822,255 | 98,204,785 | 746,412,384 | 284,274,437 | |
RATEABLE VALUES.—The values quoted earlier in this section relate to gross values (i.e., the value of all property, whether exempt from local rating or not). The following summary indicates rateable values for counties, boroughs, and independent town districts as at 1st April, 1947.
| — | North Island. | South Island. | New Zealand. | |||
|---|---|---|---|---|---|---|
| Capital Value (Land and Improvements). | Unimproved Value of Land (included in previous Column). | Capital Value (Land and Improvements). | Unimproved Value of Land (included in previous Column). | Capital Value (Land and Improvements.) | Unimproved Value of Land (Included in previous Column). | |
| £ | £ | £ | £ | £ | £ | |
| Counties | 216,595,491 | 94,985,814 | 108,729,482 | 60,935,106 | 325,324,973 | 155,920,920 |
| Boroughs | 244,819,742 | 75,038,313 | 102,294,178 | 31,152,238 | 347,113,920 | 106,190,551 |
| Town districts (independent) | 5,572,225 | 1,438,132 | 1,210,184 | 294,501 | 6,782,409 | 1,732,633 |
| Totals | 466,987,458 | 171,462,259 | 212,233,844 | 92,381,845 | 679,221,302 | 263,844,104 |
Of the gross capital value as at 1st April, 1947, counties represent 47.2 per cent., and boroughs and independent town districts 52.8 per cent. For unimproved value the proportions are 57.9 per cent. and 42.1 per cent. respectively.
On the basis of rateable values, counties possess 47.9 per cent. of capital and 59.1 per cent. of unimproved values, as against 52.1 and 40.9 per cent. for boroughs and independent town districts.
Particulars of values for each county, borough, and independent town district were shown in the 1940 and previous numbers of the Year-Book. This information brought up to date and in much greater detail is contained in the Local Authorities Handbook, where similar data are also given for dependent town districts and for road districts.
BANKING institutions operating in New Zealand may be enumerated as follows:—
The Reserve Bank of New Zealand.
Six trading banks.
The Post Office Savings-bank.
Five trustee savings-banks.
In addition, a number of trading companies, investment societies, &c., perform quasi-banking functions, accepting deposits and granting credits (short-term and long-term) to clients. In some instances deposits are repayable to the client's order at call—virtually a system of cheque-issuing.
Until the establishment of the Reserve Bank, which commenced to function on 1st August, 1934, each of the six trading banks held the right of note-issue, but this right is now vested solely in the Reserve Bank.
A full description of banking practice in Now Zealand is beyond the scope of a Year-Book section, but those desiring information on this subject may usefully refer to the report of the Parliamentary Monetary Committee, Parliamentary Paper B.-3 (1934), and to its minutes of evidence, published as an appendix.
THE RESERVE BANK.—The Reserve Bank was constituted by the Reserve Bank of New Zealand Act, 1933 (amended in minor respects by the Finance Act, 1934), with the primary object of exercising control, within defined limits, over monetary circulation and credit in New Zealand. As originally constituted, the Bank had a share capital of £500,000, composed of 100,000 publicly subscribed shares of £5, bearing a cumulative dividend of 5 per cent. Very important changes in the constitution of the Bank were made by the Reserve Bank Amendment Act, 1936, which, inter alia, abolished the subscribed share capital of the Bank, with provision for the repayment to shareholders (either in cash or in Government stock, at the option of the shareholder) of the value of shares held and accrued dividends. The General Reserve Fund of the Bank is maintained at £1,500,000, made up of a contribution of £1,000,000 by the Government at the passing of the original Act, and £500,000 to replace share capital after the passing of the 1936 Amendment Act. It will be seen that the whole of the reserve fund is now contributed by the State—the Bank being thus State-owned. Additional powers were conferred on the Reserve Bank by the Finance Act (No. 2), 1936, and further important changes were made by the Reserve Bank of New Zealand Amendment Act, 1939.
The general function of the Bank is defined in section 10 (1) of the Reserve Bank of New Zealand Amendment Act, 1936, as follows: “It shall be the general function of the Reserve Bank, within the limits of its powers, to give effect as far as may be to the monetary policy of the Government as communicated to it from time to time by the Minister of Finance. For this purpose, and to the end that the economic and social welfare of New Zealand may be promoted and maintained, the Bank shall regulate and control credit and currency in New Zealand, the transfer of moneys to or from New Zealand, and the disposal of moneys that are derived from the sale of any New Zealand products and for the time being are held overseas.”
These provisions were amplified by section 2 of the amending Act of 1939, which reads as follows: “In the exercise of their functions and powers under the principal Act the Governor and Board of Directors shall have regard to any representations that may be made by the Minister of Finance in respect of any functions or business of the Reserve Bank, and shall give effect to any decision of the Government in relation thereto conveyed to the Governor in writing by the Minister of Finance.”
The principal powers and functions of the Bank under the existing legislation are as follows:—
Make and issue bank-notes (see heading in “Coinage and Currency,” post).
Buy and sell gold and silver coin and bullion.
Accept money on deposit or on current account.
Discount, rediscount, buy, and sell : (a) bills, notes, &c., whether commercial or agricultural, maturing within one hundred and twenty days from date of document or ninety days after sight; (b) agricultural bills, notes, &c., maturing within six months of acquisition; (c) Treasury bills of any Government, or hills of any local authority in any British Commonwealth country, all such bills to be maturing within three months of acquisition.
Grant advances, up to three months, against: (a) gold coin or bullion or relative shipping documents thereof; (b) Government, local authority, or other approved securities readily marketable in New Zealand; (c) bills, &c., as referred to above; (d) promissory notes of banks in New Zealand.
Grant accommodation by way of overdraft (a) to the Government of New Zealand; (b) to any Department of State or statutory authority having power to carry on any business or to borrow moneys on overdraft; (c) to any Board or other authority having statutory powers in relation to the marketing of any New Zealand produce, for the purpose of financing and marketing of any such produce.
Advance moneys to the Government of any other country in respect of the purchase of any New Zealand produce for export to that country, or guarantee any such advance that may be made by another bank. The amount outstanding in respect of any advances or guarantees in this respect shall not at any time exceed in the aggregate the sum of £10,000,000, and any loss suffered in respect of any such transaction is to be borne by the Consolidated Fund.
Buy and sell securities of the New Zealand or United Kingdom Governments, or securities guaranteed by the Government of New Zealand or by the Government of the United Kingdom.
Buy and sell currencies of other countries.
By authority of the Governor-General in Council, underwrite any loan proposed to be raised by the New Zealand Government, or by the State Advances Corporation of New Zealand.
Issue and manage loans for the Government or any local authority or public body in New Zealand.
Borrow moneys outside New Zealand for any purpose connected with the issue, repayment, or conversion of any New Zealand Government securities.
Keep a register of inscribed stock on behalf of a local authority or public body.
Organize a clearing system.
Act as a correspondent for overseas banks or as agent of other reserve banks.
Do any other banking business not prohibited by the Act.
The following gives a summary of those restrictions upon the conduct of business by the Bank as stated in the Reserve Bank of New Zealand Act, 1933, and in later amendments. It may not issue banknotes of a denomination loss than ten shillings; engage in trade or otherwise have a direct interest in any commercial, industrial, or similar undertaking; purchase the shares of any other bank in New Zealand or elsewhere (except shares of the Bank of International Settlements) or grant loans on the security of any shares that the Bank is prohibited from purchasing; make unsecured loans or advances; purchase or make advances on the security of real property, except so far as may be required to enable the Bank to conduct its business; pay interest on any moneys deposited with the Reserve Bank by any other bank or pay interest on any other moneys placed on deposit or on current account with the Bank, except that it may pay interest to the New Zealand Government on Government funds held by the Bank outside New Zealand; allow the renewal of maturing hills of exchange, promissory notes, or other similar documents, purchased or discounted by or pledged to the Bank; draw or accept bills payable otherwise than on demand; and finally it defines the conditions under which accommodation is not to be granted to any state Department, local authority, or public body.
On the commencement of business on 1st August, 1934, the Public Account was transferred to the Reserve Bank, and the management of the public debt was taken over from the Treasury by the Reserve Bank as from the 1st October, 1936.
The net profits of the Bank are paid to the Consolidated Fund, provided that the Bank's General Reserve Fund is not less than £1,000,000. If the Reserve Fund falls below that level, part of the profits must be credited to the Reserve Fund.
Any appreciation or depreciation of assets due to alteration in the exchange rate are to be credited to or borne by the Consolidated Fund. In accordance with this provision, the Reserve Bank was credited with the sum of approximately £21,000,000 from the Consolidated Fund in early 1949 by the Government as a result of the alteration of the exchange rate to parity with sterling as from 20th August, 1948.
The net reserve ratio—that is, the ratio of gold coin and bullion, plus sterling exchange and net gold exchange, minus liabilities in currencies other than New Zealand, to the aggregate amount of notes in circulation and other demand liabilities—maintained a high but oscillating percentage from 1936 to late in 1938. It then dropped steeply, and for most of 1939 was little above the statutory limit of 25 per cent. From the outbreak of war it recovered somewhat, duo to agreements enabling the expeditious crediting of the proceeds from staple exports, which, combined with wartime tardiness in bringing many items to charge, had the effect of raising the level of sterling exchange. During the ensuing period the ratio fluctuated within wide limits, but showed a rising tendency from October, 1944, the average for the calendar year 1947 being 74 per cent. As a consequence of the exchange adjustment bringing the New Zealand currency into parity with sterling as from the 20th August, 1948, there was a sharp fall in the net reserve ratio, the 1948 average being 56 per cent. As explained later, the Minister of Finance has power to vary or suspend the minimum ratio.
Details of the liabilities and assets of the Bank at the end of June for the years 1944–48, and weekly averages for the calendar years 1938–48, are shown in the following tables.
LIABILITIES OF RESERVE BANK
| Year. | Capital and General Reserve Fund. | Bank-notes. | Other Demand Liabilities. | Other Liabilities. | Total Liabilities. | ||
|---|---|---|---|---|---|---|---|
| State. | Banks. | Other. | |||||
| £ | £ | £ | £ | £ | £ | £ | |
| Average for Calendar Year | |||||||
| 1938 | 1,500,000 | 14,072,660 | 4,170,855 | 6,765,985 | 363,689 | 195,244 | 27,068,433 |
| 1939 | 1,500,000 | 16,081,587 | 2,777,617 | 10,742,935 | 313,765 | 499,541 | 31,915,445 |
| 1940 | 1,500,000 | 19,290,855 | 5,894,532 | 14,773,895 | 327,396 | 921,343 | 42,708,021 |
| 1941 | 1,500,000 | 22,045,952 | 8,864,324 | 11,955,995 | 756,503 | 1,121,875 | 46,244,649 |
| 1942 | 1,500,000 | 25,764,322 | 12,091,333 | 18,692,922 | 1,412,164 | 1,435,388 | 66,896,629 |
| 1943 | 1,500,000 | 32,586,608 | 15,575,571 | 26,704,029 | 1,218,758 | 1,763,474 | 79,348,440 |
| 1944 | 1,500,000 | 37,453,367 | 13,231,447 | 32,987,075 | 916,324 | 2,182,408 | 88,273,621 |
| 1945 | 1,500,000 | 41,122,773 | 12,227,830 | 43,971,526 | 1,011,949 | 2,561,206 | 102,395,284 |
| 1946 | 1,500,000 | 45,166,050 | 17,302,431 | 59,731,485 | 523,810 | 3,419,309 | 127,646,085 |
| 1947 | 1,500,000 | 47,682,438 | 13,264,615 | 57,102,327 | 482,936 | 3,410,632 | 123,442,948 |
| 1948* | 1,500,000 | 48,930,097 | 13,227,571 | 57,706,393 | 380,499 | 3,614,572 | 125,359,132 |
| At End of June | |||||||
| 1944 | 1,500,000 | 37,227,482 | 13,711,697 | 36,741,206 | 1,181,609 | 3,104,829 | 93,466,823 |
| 1945 | 1,500,000 | 40,560,461 | 14,334,736 | 39,240,243 | 938,254 | 2,616,201 | 99,189,895 |
| 1946 | 1,500,000 | 44,546,220 | 18,573,078 | 60,212,448 | 818,190 | 3,086,889 | 128,736,825 |
| 1947 | 1,500,000 | 46,984,006 | 9,710,489 | 62,528,167 | 356,441 | 4,510,275 | 125,589,378 |
| 1948 | 1,500,000 | 47,790,756 | 11,996,007 | 62,125,037 | 454,436 | 3,341,089 | 127,207,319 |
ASSETS OF RESERVE BANK
| Year. | Reserve. | Subsidiary Coin. | Advances. | Investments. | Other Assets. | Total Assets. | Net Reserve Ratio.† | ||
|---|---|---|---|---|---|---|---|---|---|
| Gold. | Exchange | Marketing | Other. | ||||||
* On and after the 20th August, 1948, overseas assets and liabilities were converted into New Zealand currency at rate £(Stg.)100 = £(N.Z.)100. † I.e., Reserve, less liabilities in currencies other than New Zealand currency, expressed as a percentage of notes and other demand liabilities. 17—Ybk. | |||||||||
| £ | £ | £ | £ | £ | £ | £ | £ | Per Cent. | |
| Average for Calendar Year | |||||||||
| 1938 | 2,801,791 | 13,089,135 | 222,450 | 4,555,123 | 2,803,174 | 2,862,369 | 134,391 | 27,068,433 | 64.96 |
| 1939 | 2,801,823 | 5,311,963 | 217,403 | 6,095,061 | 13,608,846 | 3,661,654 | 218,695 | 31,915,445 | 27.02 |
| 1940 | 2,801,845 | 11,121,140 | 133,216 | 3,436,832 | 21,791,037 | 3,028,696 | 395,255 | 42,708,021 | 34.41 |
| 1941 | 2,801,874 | 16,101,407 | 63,497 | 4,840,718 | 17,095,672 | 3,795,247 | 1,546,234 | 46,244,649 | 43.22 |
| 1942 | 2,801,878 | 22,468,310 | 48,226 | 6,787,036 | 23,140,193 | 4,189,586 | 1,461,400 | 60,896,629 | 43.50 |
| 1943 | 2,801,878 | 27,518,920 | 45,850 | 4,475,854 | 32,786,808 | 8,964,948 | 2,754,682 | 79,348,440 | 39.74 |
| 1944 | 2,801,878 | 33,719,806 | 54,195 | 2,760,058 | 34,860,962 | 11,509,320 | 2,567,402 | 88,273,621 | 43.09 |
| 1945 | 2,801,878 | 60,064,382 | 29,273 | 2,084,994 | 24,162,642 | 11,797,144 | 1,454,971 | 102,395,284 | 63.87 |
| 1946 | 2,801,878 | 81,332,471 | 36,015 | 961,246 | 35,127,229 | 5,991,198 | 1,396,054 | 127,646,085 | 68.49 |
| 1947 | 2,801,878 | 85,299,962 | 46,676 | 1,157,203 | 28,515,904 | 4,575,771 | 1,045,560 | 123,442,948 | 74.25 |
| 1948* | 2,802,095 | 65,090,053 | 104,372 | 1,698,055 | 37,619,252 | 10,496,117 | 7,549,188 | 125,359,132 | 56.40 |
| At End of June | |||||||||
| 1944 | 2,801,878 | 31,597,132 | 52,282 | 8,444,418 | 35,885,000 | 11,734,340 | 2,951,773 | 93,466,823 | 37.29 |
| 1945 | 2,801,873 | 6 2,417,173 | 24,104 | 1,084,259 | 17,000,000 | 14,345,513 | 1,516,968 | 99,189,895 | 68.58 |
| 1946 | 2,801,878 | 85,516,840 | 43,069 | 34,025,000 | 4,016,242 | 2,330,796 | 128,736,825 | 71.10 | |
| 1947 | 2,801,878 | 93,932,589 | 47,491 | 602,589 | 23,577,677 | 3,868,093 | 759,061 | 125,589,378 | 79.82 |
| 1948 | 2,802,147 | 79,521,722 | 110,353 | 1,838,091 | 34,202,600 | 7,868,093 | 864,313 | 127,207,319 | 67.26 |
TRADING BANKS.—The Banking Act, 1908, which consolidated the law of New Zealand relating to the general business of banking in this country, provides that the incorporation of banks by Royal Charter shall be as effectual within New Zealand as Acts of the General Assembly. The number of directors is prescribed by the Act, and authority is given to any bank to increase its capital on a resolution of the shareholders. Transfers of shares on which there is any liability must be approved by the directors or their duly appointed attorney or attorneys. A sworn copy of an entry in the books of a bank shall in all legal proceedings be evidence of such entry, and a bank is not required in any legal proceedings to which it is not a party to produce its books before a Court unless ordered by a Judge for special cause. Provision is made for the destruction of cheques, drafts, bills of exchange, or promissory notes after the expiration of ten years from the date thereof in the case of documents payable on demand or from the due date in the case of other documents.
Part II of the Bills of Exchange Act, 1908, consolidated the law relating to cheques on a bank.
The provisions of sections 113–115 of the Companies Act, 1933 (relating to branch registers), apply to banks incorporated in New Zealand; and those of Part XIII (imposing restrictions on the sale of shares and debentures) apply to companies incorporated outside New Zealand for the purpose of carrying on banking in New Zealand or elsewhere; otherwise the Companies Act does not apply to banks.
With the establishment of the Reserve Bank of New Zealand, which commenced to function on 1st August, 1934, there was inaugurated an entirely new era in banking practice in New Zealand. The function of note-issue was transferred from the trading banks to the Reserve Bank; while all gold coin or bullion held by trading banks for their own account was required by the Reserve Bank of New Zealand Act, 1933, to be transferred to the Reserve Bank in exchange for equivalent notes of the Reserve Bank or for credit with that Bank. The basis of payment was £3 17s. 10 ½d. per ounce of standard—i.e., eleven, twelfths fine—gold content, which was the price at which such gold (in actual fact, coin only) had originally been acquired by the trading banks. Any profit derived from the sale of this gold overseas by the Reserve Bank accrues to the State and not to the Reserve Bank.
While the regulation of currency exchange is now a function of the Reserve Bank, commercial exchange transactions are still carried out through the medium of the trading banks.
Each trading bank is required to maintain with the Reserve Bank a balance of not less than 7 per cent. of its demand liabilities in New Zealand, and 3 per cent. of its time liabilities in New Zealand. These requirements may be varied by the Governor of the Reserve Bank, acting with the authority of the Minister of Finance, but not so as to be less than the percentages quoted above.
There are six banks trading in New Zealand, two of these institutions—the Bank of New Zealand and the National Bank of New Zealand—being incorporated by special Acts of the General Assembly of New Zealand. The other four banks, which are predominantly Australian institutions, have in the aggregate much greater capital resources, &c., than the two New Zealand banks. The close Australian affiliations of the Australian banks operating in New Zealand resulted in the past in an interlocking between the Australian and New Zealand financial structures, the separation of New Zealand business being one of the major motives leading up to the founding of the Reserve Bank.
Bank of New Zealand.—On the passing of the Bank of New Zealand Act, 1945, which came into operation on 1st November, 1945, the Bank of New Zealand became a State trading bank. Prior to the passing of the Act the Bank was partly State-owned, the New Zealand Government holding preference and certain long-term mortgage shares to the aggregate value of £2,109,375, out of a total paid-up capital of £6,328,125. The Act provided for the acquisition by the Crown of the whole of the remaining shares registered in New Zealand, and also made provision for the purchase by the Crown of shares registered in the United Kingdom or Australia. Two classes of shares were involved, 3,750,000 fully-paid £1 ordinary shares and 468,750 fully-paid £1 long-term mortgage shares. For each ordinary share registered in New Zealand the holder was entitled to receive at his option either £2 5s. in cash, or £2 6s. 8d. in tax-free nontransferable New Zealand Government stock, or £2 13s. 4d. in ordinary New Zealand Government stock. The options in respect of the long-term shares were £1 10s. in cash, or £1 10s. in ordinary New Zealand Government stock.
The shares registered in the United Kingdom or Australia were to be purchased for cash at such price and upon such terms as may be agreed upon by the Minister of Finance and the registered holders of the shares.
The gross profit of the Bank for the year ended 31st March, 1948, was £2,236,477, while expenses amounted to £1,806,681, leaving a net profit of £429,796. Comparable figures for the previous year were £2,100,630, £1,665,386, and £435,250 respectively. The total assets at 31st March, 1948, amounted to £98,485,116, the principal items comprising this total being coin, Reserve Bank-notes, and deposits with bankers, £24,810,947; money at call and short notice, Government securities and other securities in London, £9,613,620; New Zealand Government securities, £10,589,234; and advances, &c., £38,767,749. The principal item of liabilities was deposits (£80,681,281), while bills payable, &c., amounted to £6,360,854. The reserve fund, which is invested in United Kingdom Government securities, amounted to £3,575,000, and provision for taxation to £780,000. The paid-up capital of the Bank remained unaltered at £6,328,125.
Liabilities and Assets of Trading Banks,—Statements of liabilities and assets of the trading banks were gazetted quarterly up to 1934. Since the Reserve Bank commenced operations the trading banks have been required to submit at monthly intervals a return of liabilities and assets in respect of New Zealand business. Averages for calendar years, 1938–48, and figures as at the last Monday in June, 1944–46, and the last Wednesday in June, 1947 and 1948, are given in the next table.
LIABILITIES OF TRADING BANKS
| Year. | Demand Liabilities. | Time Liabilities. | Total Liabilities. | ||
|---|---|---|---|---|---|
| In New Zealand. | Outside New Zealand. | In New Zealand. | Outside New Zealand. | ||
* On and after 20th August, 1948, overseas liabilities were converted into New Zealand currency at rate £(Stg.)100 = £(N.Z.)100. | |||||
| £ (000) | £ (000) | £ (000) | £(000) | £(000) | |
| Average for Calendar Year | |||||
| 1938 | 34,930 | 1,767 | 30,823 | 396 | 67,916 |
| 1939 | 38,042 | 2,216 | 30,178 | 520 | 70,956 |
| 1940 | 47,830 | 2,735 | 30,833 | 272 | 81,720 |
| 1941 | 52,520 | 1,669 | 29,029 | 256 | 83,474 |
| 1942 | 63,560 | 655 | 28,593 | 203 | 93,011 |
| 1943 | 78,549 | 496 | 29,100 | 121 | 108,266 |
| 1944 | 88,644 | 539 | 30,481 | 101 | 119,765 |
| 1945 | 99,836 | 692 | 31,634 | 88 | 132,250 |
| 1946 | 117,071 | 1,334 | 34,414 | 100 | 152,919 |
| 1947 | 128,115 | 4,876 | 37,870 | 317 | 171,178 |
| 1948* | 138,211 | 6,947 | 40,403 | 295 | 185,856 |
| At End of June. | |||||
| 1944 | 90,372 | 606 | 30,409 | 87 | 121,474 |
| 1945 | 96,889 | 589 | 31,173 | 74 | 128,725 |
| 1946 | 116,633 | 1,380 | 33,495 | 86 | 151,594 |
| 1947 | 131,771 | 5,433 | 37,186 | 92 | 174,487 |
| 1948 | 137,907 | 5,900 | 41,646 | 285 | 185,738 |
ASSETS OF TRADING BANKS
| Year. | Coin and Bullion. | Reserve Bank Notes. | Balances held in Reserve Bank. | Overseas Assets. | Securities held. | Advances and Discounts. | Land, Buildings, &c. | Total Assets. |
|---|---|---|---|---|---|---|---|---|
* On and after 20th August, 1948, overseas assets were converted into New Zealand currency at rate £(Stg.)100 = £(N.Z.)100. | ||||||||
| £(000) | £ (000) | £ (000) | £ (000) | £ (000) | £ (000) | £ (000) | £ (000) | |
| Average for Calendar Year | ||||||||
| 1938 | 857 | 3,900 | 6,726 | 9,193 | 7,887 | 55,927 | 1,822 | 86,312 |
| 1939 | 731 | 3,909 | 11,125 | 6,698 | 11,525 | 54,242 | 1,855 | 90,085 |
| 1940 | 703 | 4,292 | 15,211 | 14,335 | 16,830 | 47,720 | 1,876 | 100,967 |
| 1941 | 759 | 4,453 | 12,462 | 13,633 | 21,022 | 49,701 | 1,932 | 103,962 |
| 1942 | 664 | 4,051 | 19,088 | 14,159 | 28,106 | 45,129 | 1,961 | 113,158 |
| 1943 | 622 | 4,645 | 27,650 | 11,873 | 37,672 | 43,021 | 1,931 | 127,414 |
| 1944 | 704 | 5,165 | 33,515 | 12,586 | 38,565 | 46,806 | 1,921 | 139,262 |
| 1945 | 678 | 6,058 | 45,666 | 14,427 | 31,808 | 51,618 | 1,928 | 152,183 |
| 1946 | 727 | 6,880 | 60,186 | 13,976 | 28,462 | 58,337 | 1,957 | 170,525 |
| 1947 | 909 | 7,500 | 57,631 | 18,488 | 23,037 | 76,247 | 2,118 | 185,930 |
| 1948* | 1,410 | 7,872 | 59,531 | 20,706 | 18,896 | 86,470 | 2,180 | 197,065 |
| At End of June | ||||||||
| 1944 | 693 | 4,906 | 36,735 | 11,398 | 38,682 | 45,458 | 1,918 | 139,790 |
| 1945 | 630 | 6,067 | 39,228 | 15,830 | 31,504 | 52,572 | 1,921 | 147,752 |
| 1946 | 722 | 6,710 | 60,182 | 13,617 | 29,058 | 55,343 | 1,930 | 167,562 |
| 1947 | 890 | 7,142 | 62,391 | 17,954 | 23,191 | 73,913 | 2,111 | 187,592 |
| 1948 | 1,515 | 7,252 | 62,030 | 22,355 | 18,327 | 86,850 | 2,157 | 200,486 |
Deposits and Advances.—The weekly averages of total deposits together with the amount per head of mean population, the total advances, and the ratio of advances to deposits for each of the last eleven years, are given in the following table.
| Year. | Deposits. | Advances. | |||||||
|---|---|---|---|---|---|---|---|---|---|
| Not Bearing Interest (Free.) | Bearing Interest (Fixed.) | Ratio of Free to Fixed. | Total.* | Per Head of Population. | Total Amount. | Ratio to Deposits. | |||
* Including Government deposits. | |||||||||
| £ | £ | Per Cent. | £ | £ | s. | d. | £ | Per Cent. | |
| 1938 | 31,999,894 | 32,360,283 | 98.89 | 65,038,690 | 40 | 9 | 7 | 55,650,065 | 85.56 |
| 1939 | 35,216,071 | 31,393,759 | 112.18 | 67,279,451 | 41 | 6 | 3 | 54,745,801 | 81.37 |
| 1940 | 44,046,431 | 32,567,750 | 135.25 | 77,364,430 | 47 | 5 | 0 | 47,954,499 | 61.99 |
| 1941 | 49,202,559 | 30,747,779 | 160.62 | 80,720,101 | 49 | 9 | 10 | 49,746,397 | 61.63 |
| 1942 | 59,513,744 | 30,320,628 | 196.28 | 90,880,339 | 55 | 10 | 6 | 45,439,520 | 50.00 |
| 1943 | 73,977,319 | 31,152,857 | 237.47 | 106,323,897 | 65 | 0 | 1 | 43,249,581 | 40.68 |
| 1944 | 83,680,126 | 32,742,165 | 255.57 | 117,568,290 | 71 | 0 | 1 | 46,773,498 | 39.78 |
| 1945 | 94,627,252 | 34,197,628 | 276.71 | 130,137,939 | 76 | 15 | 10 | 51,766,198 | 39.78 |
| 1946 | 111,289,147 | 37,019,091 | 300.63 | 149,777,364 | 85 | 0 | 8 | 58,270,843 | 38.90 |
| 1947 | 122,068,104 | 40,459,866 | 301.70 | 164,169,520 | 91 | 1 | 5 | 76,475,734 | 46.58 |
| 1948 | 130,940,692 | 42,690,257 | 306.72 | 175,668,670 | 95 | 7 | 10 | 88,159,764 | 50.19 |
The following diagram illustrates the movements that have occurred in deposits and advances from 1929 onwards, the figures used, as in the foregoing table, being the weekly averages for calendar years.
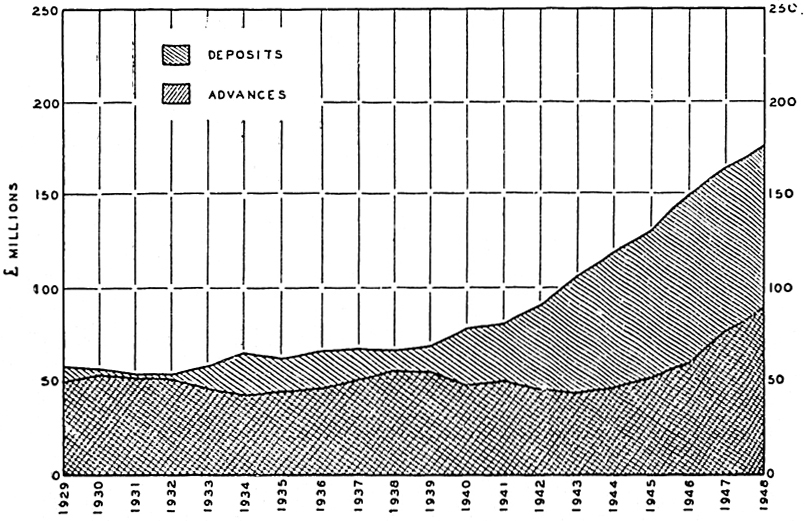
The average amount on deposit during each of the quarter months since March, 1944, is shown in the next table.
| Month. | 1944. | 1945. | 1946. | 1947. | 1948. |
|---|---|---|---|---|---|
| £ | £ | £ | £ | £ | |
| March | 114,124,739 | 124,257,614 | 143,608,272 | 159,147,340 | 175,225,327 |
| June | 118,891,879 | 128,065,374 | 148,454,232 | 167,044,348 | 179,214,485 |
| September | 119,627,473 | 132,646,156 | 152,678,546 | 164,858,457 | 173,980,340 |
| December | 118,359,040 | 140,429,082 | 157,299,553 | 166,421,470 | 177,182,751 |
The average amount of advances outstanding during each of the quarter months since March, 1944, is next shown.
| Month. | 1944. | 1945. | 1946. | 1947. | 1948. |
|---|---|---|---|---|---|
| £ | £ | £ | £ | £ | |
| March | 47,028,352 | 53,520,708 | 57,096,838 | 71,907,996 | 94,149,090 |
| June | 46,242,870 | 52,523,200 | 56,350,591 | 75,246,542 | 89,330,020 |
| September | 46,779,670 | 49,552,351 | 59,354,275 | 79,189,879 | 86,191,481 |
| December | 50,529,657 | 52,458,278 | 65,204,266 | 86,416,629 | 82,929,497 |
The following table shows the movement in advances, Government and other securities held, and deposits during the years 1938–48, the amounts being the averages of the figures for the last Monday of each month, from 1938 to 1946, and the last Wednesday of each month in 1947 and 1948.
| Year. | Advances. | Securities held. | Total Advances and Securities. | Total Deposits. | Ratio of Advances (plus Securities) to Total Deposits. | |
|---|---|---|---|---|---|---|
| Government. | Other. | |||||
| £ | £ | £ | £ | £ | Per Cent. | |
| 1938 | 55,659,434 | 7,612,929 | 273,521 | 63,545,884 | 64,112,559 | 99.12 |
| 1939 | 54,241,254 | 11,263,639 | 261,199 | 65,766,092 | 67,579,824 | 97.32 |
| 1940 | 47,706,725 | 16,490,489 | 339,026 | 64,536,240 | 78,147,410 | 82.58 |
| 1941 | 49,631,073 | 20,333,503 | 688,865 | 70,653,441 | 81,269,157 | 86.94 |
| 1942 | 45,100,676 | 27,192,741 | 913,450 | 73,206,807 | 91,705,843 | 79.83 |
| 1943 | 43,020,539 | 36,103,048 | 1,569,004 | 80,692,591 | 107,151,323 | 75.31 |
| 1944 | 46,812,815 | 36,140,565 | 2,424,299 | 85,377,679 | 118,484,545 | 72.06 |
| 1945 | 51,601,310 | 29,334,721 | 2,473,174 | 83,409,205 | 130,888,109 | 63.73 |
| 1946 | 58,341,772 | 26,168,228 | 2,293,476 | 86,803,476 | 150,682,014 | 57.61 |
| 1947 | 76,245,449 | 20,913,053 | 2,123,549 | 99,282,051 | 164,894,007 | 60.21 |
| 1948 | 86,443,926 | 16,953,475 | 1,942,263 | 105,339,664 | 177,636,660 | 59.30 |
The fall in the value of Government securities held by the trading banks in recent years reflects the policy of the Government, which has been to repay the trading banks' holdings of stocks as they mature, and not to permit reinvestment of the proceeds in Government stocks.
An analysis of advances of the New Zealand trading banks at quarterly intervals is now published by the Reserve Bank of New Zealand, and the classification as at the last Monday in March for the years 1944–46, and the last Wednesday in March for 1947 and 1948 is given in the following table.
| Advances to | At end of March, | ||||
|---|---|---|---|---|---|
| 1941. | 1945. | 1946. | 1947. | 1948. | |
| Farmers— | £ (000) | £ (000) | £ (000) | £ (000) | £ (000) |
| Mainly dairy | 5,59,5 | 5,756 | 6,420 | 7,309 | 7,266 |
| Mainly wool | 5,773 | 6,260 | 6,482 | 6,887 | 6,076 |
| Mainly meat | 1,689 | 1,772 | 1,375 | 1,637 | 1,374 |
| Mainly agricultural | 307 | 396 | 438 | 616 | 713 |
| Mixed | 4,034 | 4,537 | 4,592 | 5,178 | 4,601 |
| Industries allied to primary production— | |||||
| Dairy companies, factories, &c. | 984 | 1,158 | 826 | 1,153 | 846 |
| Freezing-works, meat companies, &c. | 5,701 | 7,012 | 7,756 | 7,694 | 7,409 |
| Woollen-mills | 240 | 611 | 754 | 866 | 1,486 |
| Other | 1,394 | 1,292 | 1,598 | 3,754 | 4,490 |
| Other manufacturing and productive industries | 4,841 | 6,709 | 6,515 | 8,347 | 14,183 |
| Merchants, wholesalers— | |||||
| Mainly importers | 1,487 | 1,976 | 2,455 | 4,262 | 7,962 |
| Others | 1,443 | 1,164 | 919 | 1,402 | 4,924 |
| Retailers | 2,025 | 2,790 | 3,071 | 4,645 | 9,505 |
| Transport— | |||||
| Shipping | 36 | 49 | 85 | 50 | 117 |
| Other | 351 | 635 | 791 | 1,200 | 1,636 |
| Local and municipal authorities, public utility concerns | 319 | 468 | 650 | 662 | 722 |
| Stock and station agents | 844 | 970 | 748 | 972 | 662 |
| Hotels (public and private), restaurants, &c. | 956 | 1,167 | 1,396 | 2,190 | 2,367 |
| Financial companies, societies, &c. | 737 | 1,069 | 830 | 1,117 | 1,541 |
| Professional | 1,176 | 1,377 | 1,447 | 1,713 | 1,968 |
| Private individuals | 4,778 | 5,560 | 6,212 | 7,683 | 8,458 |
| Other | 2,168 | 2,174 | 2,441 | 3,300 | 4,214 |
| Total advances | 46,872 | 54,902 | 57,801 | 72,637 | 92,520 |
Debits and Clearings.—The following table shows weekly averages of bank debits and clearings for each of the years 1938 to 1948.
| Year. | Debits other than Government. | Government Debits. | Clearings. |
|---|---|---|---|
| £ (000) | £ (000) | £ (000) | |
| 1938 | 17,965 | 1,995 | 9,605 |
| 1939 | 18,414 | 2,071 | 9,750 |
| 1940 | 19,353 | 2,391 | 10,800 |
| 1941 | 19,844 | 2,596 | 11,403 |
| 1942 | 20,046 | 3,048 | 12,165 |
| 1943 | 23,008 | 3,604 | 14,211 |
| 1944 | 24,567 | 3,860 | 15,205 |
| 1945 | 26,791 | 4,277 | 16,625 |
| 1946 | 31,912 | 4,764 | 19,388 |
| 1947 | 40,547 | 4,927 | 23,646 |
| 1948 | 43,062 | 5,862 | 25,254 |
Debits represent the total amount debited to customers' accounts at all branches, and clearings show the total outward exchanges delivered at all branches. These figures, which have been compiled from the weekly returns furnished by the six trading banks to the Government Statistician, give a reliable indication of appreciable changes in the volume of business. Following the depression “low” of 1932 there was a substantial recovery which continued until 1938, when a slight recession was recorded. The upward movement was resumed in 1939 and has since continued, the 1946 and 1947 increases being particularly sharp ones. During the period covered by the foregoing table the volume of ordinary debits increased by 140 per cent., while clearings showed an increase of 163 per cent. Government debits with trading banks fell to comparatively small proportions as a consequence of the opening of the Reserve Bank, but an upward movement has been in evidence since 1936.
Averages of debits (other than Government) and of clearings for the four or five weeks ending on the last Monday of each of the quarter months from March, 1944, to 1946, and the last Wednesday for 1947 and 1948, are now given.
| Month. | 1944. | 1945. | 1946. | 1947. | 1948. |
|---|---|---|---|---|---|
| £ | £ | £ | £ | £ | |
| Debits, other than Government | |||||
| March | 29,334,783 | 32,399,030 | 35,860,164 | 44,965,131 | 50,681,408 |
| June | 23,756,399 | 27,434,886 | 32,015,112 | 39,005,993 | 44,859,618 |
| September | 24,376,321 | 25,807,332 | 31,356,633 | 36,689,126 | 41,622,504 |
| December | 28,464,513 | 30,501,455 | 37,025,412 | 48,292,539 | 45,897,766 |
| Clearings | |||||
| March | 19,064,657 | 22,616,905 | 24,970,954 | 28,587,471 | 30,308,954 |
| June | 15,241,057 | 17,137,850 | 19,069,121 | 23,595,476 | 27,344,148 |
| September | 15,468,466 | 15,379,373 | 18,249,472 | 21,397,764 | 23,623,990 |
| December | 16,832,352 | 18,368,976 | 20,749,893 | 27,519,497 | 26,356,214 |
Unexercised Overdraft Authorities.—Particulars of aggregate unexercised overdraft authorities of trading banks are available from April, 1936. Following are the averages for calendar years and the amount at the end of June, for each of the years 1939–48.
| Year. | Average for Calendar Year. | At end of June. |
|---|---|---|
| £ | £ | |
| 1939 | 23,621,391 | 23,973,221 |
| 1940 | 29,257,108 | 29,643,228 |
| 1941 | 32,319,796 | 32,057,178 |
| 1942 | 34,394,491 | 33,891,804 |
| 1943 | 35,847,500 | 36,201,863 |
| 1944 | 37,120,062 | 38,381,075 |
| 1945 | 40,273,686 | 38,827,474 |
| 1946 | 45,040,514 | 46,490,947 |
| 1947 | 46,669,296 | 48,261,554 |
| 1948 | 50,649,891 | 50,215,837 |
NOTES IN CIRCULATION.—As indicated elsewhere, the Reserve Bank assumed the note-issuing function on the 1st August, 1934. As from the 10th January, 1935, the notes of the trading banks ceased to be legal tender, while on 1st August, 1936, the liability for the remaining outstanding trading-bank notes was taken over by the Reserve Rank, thus completing the process of the transfer of the note-issue to the Reserve Bank. The following table shows the weekly-average note-circulation for the calendar years 1938–48, and the position as at the last Monday in June for the years 1944–46, and the last Wednesday for the 1947 and 1948 years.
| Year. | Total Note Issue. | Notes held by Trading Banks. | Net Note Circulation. |
|---|---|---|---|
| £ | £ | £ | |
| Average for Calendar Year | |||
| 1938 | 14,072,660 | 4,083,324 | 9,989,336 |
| 1939 | 16,081,587 | 4,007,735 | 12,013,852 |
| 1940 | 19,290,855 | 4,500,141 | 14,790,714 |
| 1941 | 22,045,952 | 4,611,201 | 17,434,751 |
| 1942 | 25,764,321 | 4,267,621 | 21,496,700 |
| 1943 | 32,586,607 | 4,950,457 | 27,636,150 |
| 1944 | 37,453,367 | 5,351,395 | 32,101,972 |
| 1945 | 41,122,773 | 6,139,732 | 34,983,041 |
| 1946 | 45,169,050 | 6,970,707 | 38,198,343 |
| 1947 | 47,682,438 | 7,555,356 | 40,127,082 |
| 1948 | 48,930,097 | 8,133,753 | 40,796,344 |
| At End of June | |||
| 1944 | 37,227,482 | 4,905,763 | 32,321,719 |
| 1945 | 40,560,461 | 6,066,700 | 34,493,761 |
| 1946 | 44,546,220 | 6,710,491 | 37,835,729 |
| 1947 | 46,984,006 | 7,141,981 | 39,842,925 |
| 1948 | 47,790,750 | 7,251,373 | 40,539,377 |
The following diagram illustrates the expansion in the note issue in recent years, the figures used in this ease being as at the last Monday in March in each year, until 1946, and the last Wednesday for 1947 and 1948.
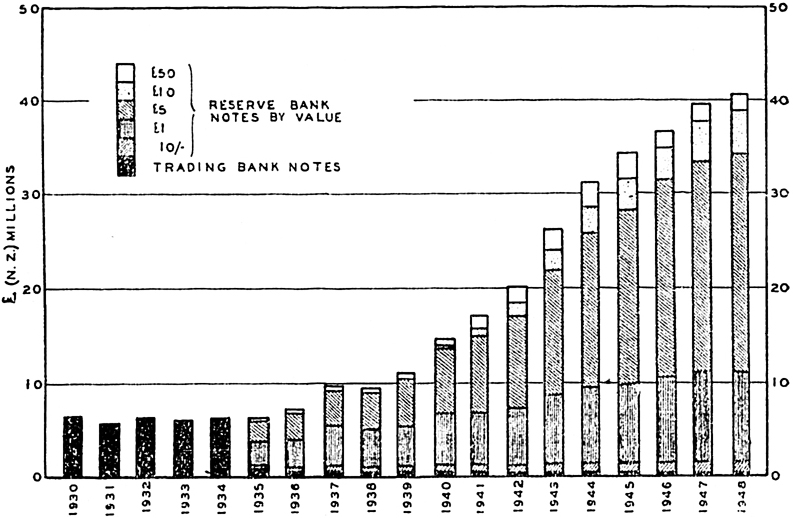
The year 1935 witnessed the commencement of an almost continuous upward movement in the note circulation, due to more favourable economic conditions in association with such factors as the restoration of wage and salary cuts, higher wage-rates, greater activity on public works and housing, increased pensions, &c. Between the months of September, 1935, and September, 1939, the increase in the average note circulation was 98 per cent. Following the outbreak of war, the increase in the note-circulation quickened, the expansion in 1912 and 1943 being particularly sharp. The upward movement has since continued, but at a considerably lesser, rate. Using the average for the month of December as a basis, there was a rise of only £566,036 (1.3 per cent.) in 1948, as compared with £1,429,807 (3.5 per cent.) in 1947 and £5,935,748 (30.9 per cent.) in 1942. Between December, 1939, and December, 1948, the increase amounted to 208.1 per cent.
The following table of index numbers published by the Reserve Bank illustrates the changes that have occurred in the active note circulation in the United Kingdom, Canada, Australia, and New Zealand, since the outbreak of war in 1939. The years selected are 1943, 1945, and 1948, the base being August, 1939 (= 100.)
| —– | 1943. | 1945. | 1948. | |||||||||
|---|---|---|---|---|---|---|---|---|---|---|---|---|
| United Kingdom.* | Canada.† | Australia. | New Zealand. | United Kingdom.* | Canada.† | Australia. | New Zealand. | United Kingdom.* | Canada.† | Australia. | New Zealand. | |
* Notes and coin, excluding notes and coin held by Bank of England Reserve, London clearing banks, and Scottish and Northern Ireland banks. † Chartered bank note circulation and Bank of Canada notes—average of daily figures. | ||||||||||||
| January | 187 | 294 | 302 | 209 | 257 | 434 | 511 | 286 | 272 | 486 | 492 | 346 |
| February | 189 | 301 | 315 | 212 | 257 | 440 | 504 | 281 | 264 | 487 | 488 | 342 |
| March | 192 | 312 | 328 | 216 | 259 | 450 | 498 | 283 | 265 | 494 | 496 | 342 |
| April | 196 | 322 | 342 | 225 | 262 | 454 | 487 | 295 | 265 | 497 | 496 | 343 |
| May | 197 | 321 | 346 | 228 | 266 | 449 | 482 | 295 | 266 | 500 | 492 | 343 |
| June | 197 | 324 | 353 | 232 | 269 | 451 | 485 | 293 | 267 | 501 | 495 | 342 |
| July | 200 | 332 | 360 | 234 | 274 | 458 | 480 | 294 | 271 | 509 | 495 | 342 |
| August | 204 | 342 | 371 | 241 | 280 | 467 | 482 | 297 | 269 | 510 | 495 | 345 |
| September | 205 | 350 | 381 | 243 | 282 | 475 | 485 | 297 | 264 | 522 | 495 | 343 |
| October | 208 | 360 | 395 | 250 | 282 | 483 | 491 | 303 | 263 | 535 | 497 | 345 |
| November | 212 | 360 | 395 | 250 | 282 | 476 | 495 | 305 | 263 | 531 | 499 | 345 |
| December | 222 | 371 | 415 | 263 | 289 | 478 | 509 | 320 | 269 | 517 | 358 | |
An analysis of the net banknote circulation, as at the last Monday in June over the years 1939–46 and the last Wednesday in 1947 and 1948, is compiled by the Reserve Bank of New Zealand, and the figures for the years 1939–48 are contained in the following table.
| Last Balance Day in June. | Reserve Bank Note Issue. | Total Reserve Bank Issue. | Trading Banks' Notes outstanding. | Total Net Note-circulation. | ||||
|---|---|---|---|---|---|---|---|---|
| 10s. | £1. | £5. | £10. | £50. | ||||
| £ (000) | £ (000) | £ (000) | £ (000) | £ (000) | £ (000) | £ (000) | £ (000) | |
| 1939 | 566 | 4,374 | 5,392 | 775 | 11,107 | 425 | 11,532 | |
| 1940 | 644 | 4,922 | 7,166 | 385 | 1,173 | 14,290 | 409 | 14,699 |
| 1941 | 715 | 5,717 | 8,584 | 949 | 1,450 | 17,415 | 399 | 17,814 |
| 1942 | 796 | 6,410 | 10,590 | 1,542 | 1,744 | 21,082 | 387 | 21,469 |
| 1943 | 929 | 7,466 | 14.139 | 2,293 | 2,316 | 27,143 | 381 | 27,524 |
| 1944 | 963 | 8,010 | 17,243 | 2,979 | 2,751 | 31.946 | 376 | 32,322 |
| 1945 | 1,011 | 8,740 | 19,306 | 3,061 | 2,006 | 34,124 | 370 | 34,494 |
| 1946 | 1,114 | 9,443 | 21,652 | 3,510 | 1,751 | 37,470 | 366 | 37,836 |
| 1917 | 1,144 | 9,373 | 22,582 | 4,345 | 2,035 | 39,479 | 363 | 39,842 |
| 1948 | 1,176 | 9,236 | 23,055 | 4,749 | 1,963 | 40,179 | 361 | 40,540 |
OVERSEAS ASSETS OF BANKS.—Under section 46 of the Reserve Bank of New Zealand Act, 1933, the trading banks are required to supply returns to the Reserve Bank at monthly intervals, showing, inter alia, overseas assets held and liabilities incurred on account of New Zealand business. From these statements, published in the New Zealand Gazette, and the weekly gazetted statements of assets and liabilities of the Reserve Bank, the following table has been compiled.
| Year. | Trading Banks' Overseas Assets. | Reserve Bank's Holdings of Sterling Exchange. | Gross, Overseas Assets. | Overseas Liabilities. | Net Overseas Assets. | |
|---|---|---|---|---|---|---|
| In London. | Elsewhere. | |||||
* On and after the 20th August, 1948, overseas assets and liabilities were converted into New Zealand currency at rate £(Stg.)100 = £(N.Z.)100. | ||||||
| £(N.Z.) | £(N.Z.) | £(N.Z.) | £(N.Z.) | £(N.Z.) | £(N.Z.) | |
| Average for Calendar Year | ||||||
| 1938 | 6,011,271 | 3,181,896 | 13,423,970 | 22,617,137 | 2,169,242 | 20,447,895 |
| 1939 | 5,068,134 | 1,629,579 | 5,510,102 | 12,207,815 | 2,765,551 | 9,442,264 |
| 1940 | 12,362,583 | 1,972,411 | 11,706,779 | 26,041,773 | 3,103,086 | 22,938,687 |
| 1941 | 11,053,615 | 2,578,989 | 15,879,503 | 29,512,107 | 1,942,707 | 27,569,400 |
| 1942 | 11,346,981 | 2,812,208 | 22,922,258 | 37,081,447 | 903,320 | 36,178,127 |
| 1943 | 9,955,159 | 1,918,140 | 27,678,177 | 39,551,476 | 714,867 | 38,836,609 |
| 1944 | 10,672,294 | 1,905,710 | 33,817,280 | 46,395,284 | 767,901 | 45,627,383 |
| 1945 | 12,480,821 | 1,946,483 | 61,702,174 | 76,129,478 | 858,963 | 75,270,515 |
| 1946 | 11,638,612 | 2,337,304 | 83,265,081 | 97,240,997 | 1,486,379 | 95,754,618 |
| 1947 | 13,972,510 | 4,516,079 | 85,055,755 | 103,544,344 | 5,442,092 | 98,102,252 |
| 1948* | 17,606,295 | 3,099,314 | 64,102,720 | 84,808,329 | 7,307,368 | 77,500,961 |
| At End of June | ||||||
| 1941 | 10,022,408 | 2,877,119 | 19,967,001 | 32,866,528 | 1,801,283 | 31,065,245 |
| 1942 | 10,991,845 | 2,568,868 | 24,722,575 | 38,283,288 | 977,378 | 37,305,910 |
| 1943 | 8,818,687 | 2,347,988 | 29,684,822 | 40,851,497 | 683,193 | 40,168,304 |
| 1944 | 9,162,716 | 2,235,393 | 31,597,132 | 42,995,241 | 1,957,389 | 41,037,852 |
| 1945 | 13,909,750 | 1,920,310 | 62,417,173 | 78,247,233 | 681,645 | 77,565,588 |
| 1946 | 12,040,798 | 1,576,496 | 85,519,840 | 99,137,134 | 1,518,517 | 97,618,617 |
| 1947 | 12,922,391 | 5,031,709 | 93,932,589 | 111,886,689 | 6,818,407 | 105,068,282 |
| 1948 | 19,592,862 | 2,762,355 | 79,521,722 | 101,876,939 | 6,200,187 | 95,676,752 |
Overseas assets declined heavily during the three years 1937–39, particularly after May, 1938, ascribable to three principal causes—(1) the repatriation of capital temporarily held in New Zealand, (2) over-importation, and (3) investment abroad of New Zealand capital. In December, 1938, the Government took action to check the fall in the sterling funds, and introduced import and export control and also the control of overseas remittances. These measures combined with the earlier crediting of the proceeds of the country's staple exports to the United Kingdom as a result of United Kingdom governmental purchases and other factors arising out of wartime agreements brought about a marked improvement in the exchange position early in 1940. Although there were fluctuations from time to time, each subsequent year witnessed a further improvement in the general level, until the end of 1946, when the net amount was £104,063,073. The 1947 and 1948 values as at the end of December showed successive declines from the previous total and amounted to £75,700,184 and £56,533,714 respectively. The fall in the latter two years is principally due to the financing of a greater volume and value of imports, the repayment of debt domiciled overseas, and, in late 1948, to the alteration in the exchange rate mentioned elsewhere in this Section.
The following diagram shows the movement in the net amount of overseas assets from 1936 onwards. The low level to which they had fallen in 1938, the progressive accumulation up to 1946, and the contraction in 1947 and 1948 are very strikingly illustrated.
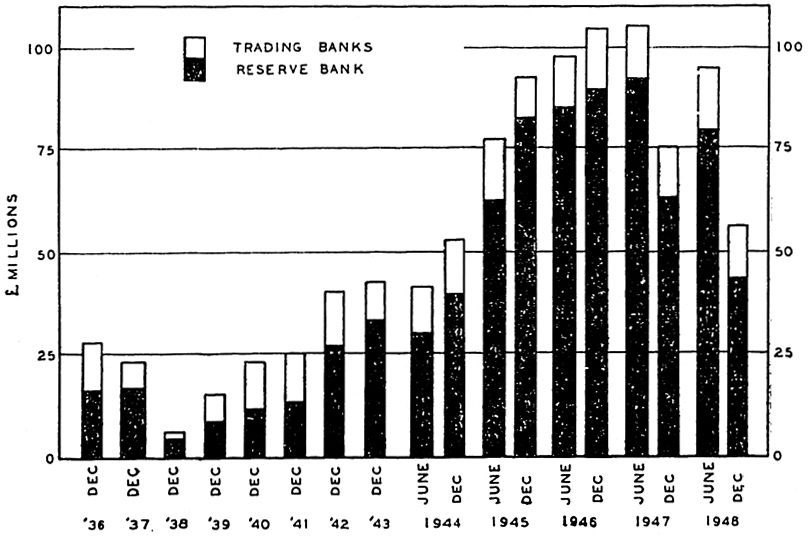
OVERSEAS RECEIPTS AND PAYMENTS.—Since the institution of exchange control in New Zealand the Reserve Bank has been able to make a comprehensive statement of the country's foreign exchange transactions for the period during which the control has been operating. A classification of the transactions for each of the years ended 31st December, 1943–47, is given in Section 9A (External Trade) page 207.
POST OFFICE SAVINGS-BANK.—The establishment of the Post Office Savings-bank was authorized by the Post Office Savings Banks Act, 1865, but actual business did not commence until 1st February, 1867. The present authority is contained in the Post and Telegraph Act, 1928. The minimum deposit receivable, except in certain specified cases, is 1s., and no interest is given on any sum less than £1. The present rate of interest on so much of the deposit as does not exceed £500 is 2½ per cent. per annum (from 1st June, 1942) and on so much as exceeds £500 and does not exceed £2,000 the rate is 2 per cent. No interest is payable to any depositor in respect of any amount of his deposit in excess of £2,000.
The Postmaster-General may pay deposits to a maximum of £200 to the legal representative of a deceased depositor without requiring him to take out letters of administration or to prove the will. This provision, together with another provision whereby a depositor may nominate one or more persons to receive part or all of the amount at credit after the depositor's death, enables a widow or orphan to obtain possession of perhaps much-needed funds without either delay or cost.
The number of post-offices open for the transaction of savings-bank business at 31st March, 1948, was 936. There were 165,588 now accounts opened during the year ended 31st March, 1948, and 128,271 accounts were closed during that period.
| Year ended 31st March, | Number of Depositors at End of Year. | Total Amount of Deposits during Year. | Total Amount of Withdrawals during Year. | Excess of Deposits over Withdrawals. | Interest credited. | Total Amount to Credit of Depositors at End of Year. |
|---|---|---|---|---|---|---|
* Excess of withdrawals over deposits. NOTE.—This statement does not include figures in respect of school savings-bank accounts, or national savings investment accounts, which are referred to later. | ||||||
| £ | £ | £ | £ | £ | ||
| 1938 | 920,805 | 33,041,082 | 29,629,074 | 3,412,008 | 1,669,384 | 63,146,930 |
| 1939 | 946,822 | 30,434,291 | 34,597,708 | -4,163,417* | 1,726,574 | 60,710,087 |
| 1940 | 960,565 | 25,151,287 | 29,462,838 | -4,311,551* | 1,603,467 | 58,002,003 |
| 1941 | 992,792 | 28,607,221 | 25,319,146 | 3,288,075 | 1,666,710 | 62,956,788 |
| 1942 | 1,039,783 | 32,044,734 | 25,376,745 | 6,667,989 | 1,820,605 | 71,445,382 |
| 1943 | 1,086,996 | 38,097,070 | 26,889,339 | 11,207,731 | 1,816,820 | 84,469,933 |
| 1944 | 1,128,936 | 47,648,754 | 35,580,165 | 12,068,589 | 2,075,676 | 98,614,198 |
| 1945 | 1,161,886 | 54,585,120 | 42,158,656 | 12,426,464 | 2,451,628 | 113,492,290 |
| 1946 | 1,203,181 | 67,864,042 | 55,626,419 | 12,234,623 | 2,787,413 | 128,514,326 |
| 1947 | 1,239,948 | 72,380,543 | 62,747,093 | 9,633,450 | 3,094,491 | 141,242,267 |
| 1948 | 1,277,265 | 72,553,414 | 68,660,458 | 3,892,956 | 3,307,081 | 148,442,304 |
The year 1948 saw the attainment of a million and a quarter depositors. The outstanding excess of deposits over withdrawals which was maintained at £12,000,000 during the years 194 1, 1945, and 1946, fell to £9,633,450 in 1947 and to £3,892.956 in 1948. While the value of withdrawals in 1948 showed an increase over the previous year that was comparable with increases experienced over the last five years, the increase of deposits over the previous year was scarcely appreciable.
The number of deposits received during 1947–48 was 3,292,887, with an average deposit of £22. while the number of withdrawals was 2,353,442, the average amount of each withdrawal being £29. The average amount to credit per open account at the 31st March, 1948, was £116, as against £114 in 1947, and £53 at the 31st March, 1933.
The securities standing in the name of the Postmaster-General on account of the Post Office Savings-bank Fund on the 31st March, 1948, represented a nominal value of £162,148,025. This figure includes an amount of approximately £12,000,000 in respect of war gratuity credits, which are not included in the ordinary savings-bank figures quoted. A summary of the investments is as follows:—
| £ | |
|---|---|
| New Zealand Government securities | 158,964,510 |
| Local authority securities | 357,896 |
| Securities held in London | 2,825,619 |
| Total | £ |
SCHOOL SAVINGS-BANKS.—The school savings-bank scheme was introduced in August, 1934, mainly for the purpose of encouraging thrift amongst young people. An account for each school is maintained in the school savings-banks section of the Post Office Savings-bank. On a scholar leaving school, provision is made for his or her account to be transferred to the ordinary section of the Post Office Savings-bank. Marked progress has been made during the period the scheme has been in operation. Each year shows an increase in the number of schools adopting the scheme, with a corresponding increase in the number of depositors and in the amount at credit. The-decrease in deposits in 1947–48 is attributed to the effects of the poliomyelitis epidemic. The following table shows the figures for the last eleven years.
| Year ended 31st March, | Number of Schools operating at End of Year. | Total Number of Deposit Transactions during Year. | Total Amount of Deposits during Year. | Total Number of Withdrawal Transactions during Year. | Total Amount of Withdrawals* during Year. | Excess of Deposits over Withdrawals. | Interest credited. | Total Amount to Credit of Depositors at End of Year. |
|---|---|---|---|---|---|---|---|---|
* Includes amounts transferred to P.O.S.B. | ||||||||
| £ | £ | £ | £ | £ | ||||
| 1938 | 559 | 350,943 | 33,970 | 9,033 | 13,826 | 20,114 | 660 | 49,060 |
| 1939 | 764 | 393,897 | 38,851 | 11,722 | 21,360 | 17,491 | 1,115 | 67,666 |
| 1940 | 905 | 370,062 | 36,809 | 13,553 | 26,687 | 10,122 | 1,519 | 79,307 |
| 1941 | 940 | 365,193 | 37,812 | 13,249 | 29,038 | 8,774 | 1,821 | 89,902 |
| 1942 | 961 | 339,438 | 38,277 | 12,224 | 29,752 | 8,525 | 2,089 | 100,517 |
| 1943 | 983 | 342,187 | 46,491 | 10,373 | 31,043 | 15,448 | 2,431 | 118,396 |
| 1944 | 1,016 | 418,604 | 64,412 | 10,942 | 43,426 | 20,986 | 2,986 | 142,368 |
| 1945 | 1,056 | 119,355 | 71,352 | 11,130 | 48,324 | 23,028 | 3,630 | 169,025 |
| 1946 | 1,102 | 444,672 | 74,021 | 9,892 | 54,952 | 19,069 | 4,242 | 192,336 |
| 1947 | 1,141 | 484,712 | 82,629 | 10,483 | 58,719 | 23,910 | 1,774 | 221,020 |
| 1948 | 1,175 | 434,695 | 73,751 | 10,841 | 64,652 | 9,099 | 5,399 | 235,518 |
TRUSTEE SAVINGS-BANKS.—There are five trustee savings-banks—viz., Auckland, established in 1847; New Plymouth, 1850; Dunedin, 1864; Invercargill, 1864; and Hokitika, 1866. The total amount to the credit of depositors at the 31st March, 1948, was £31,777,946, representing an average account of £93 6s. Figures for the last eleven years are as follows:—
| Year ended 31st March, | Number of Depositors at End of Year. | Total Amount of Deposits during Year. | Total Amount of Withdrawals during Year. | Excess of Deposits over Withdrawals. | Interest credited. | Total Amount to Credit of Depositors at End of Year. |
|---|---|---|---|---|---|---|
* Excess of withdrawals over deposits. NOTE.—This statement does not include national savings investment accounts. | ||||||
| £ | £ | £ | £ | £ | ||
| 1938 | 261,019 | 8,137,472 | 7,638,820 | 498,652 | 360,639 | 13,339,416 |
| 1939 | 269,335 | 8,578,068 | 8,430,467 | 147,601 | 378,659 | 13,865,676 |
| 1940 | 274,471 | 8,184,114 | 8,523,416 | -339,302* | 380,960 | 13,907,334 |
| 1941 | 279,984 | 8,218,895 | 7,763,524 | 455,371 | 395,888 | 14,758,593 |
| 1942 | 285,529 | 8,513,964 | 7,570,149 | 943,815 | 427,550 | 16,129,958 |
| 1943 | 296,140 | 9,127,040 | 7,341,043 | 1,785,997 | 404,294 | 18,320,249 |
| 1944 | 307,224 | 11,013,258 | 8,863,741 | 2,149,517 | 443,982 | 20,913,748 |
| 1945 | 320,372 | 11,228,424 | 9,865,183 | 1,363,241 | 496,721 | 22,773,710 |
| 1946 | 329,348 | 15,954,296 | 12,054,044 | 3,900,252 | 580,106 | 27,254,068 |
| 1947 | 335,821 | 17,306,051 | 14,698,446 | 2,607,605 | 678,051 | 30,539,724 |
| 1948 | 343,149 | 16,136,822 | 15,622,395 | 514,427 | 723,795 | 31,777,946 |
The following table shows the results of the transactions of each of the trustee-savings-banks during the twelve months ended 31st March, 1948.
| Bank. | Number of Depositors at End of Year. | Total Amount of Deposits during Year. | Total Amount of Withdrawals during Year. | Excess of Deposits over Withdrawals. | Interest credited. | Total Amount to Credit of Depositors at End of Year. |
|---|---|---|---|---|---|---|
| £ | £ | £ | £ | £ | ||
| Auckland | 230,815 | 9,507,217 | 9,276,483 | 230,734 | 469,918 | 20,471,485 |
| New Plymouth | 23,574 | 1,223,964 | 1,204,258 | 19,706 | 59,712 | 2,551,615 |
| Hokitika | 2,610 | 111,337 | 94,269 | 17,068 | 7,495 | 328,549 |
| Dunedin | 54,143 | 2,145,808 | 1,972,578 | 173,230 | 118,296 | 5,119,415 |
| Invercargill | 32,007 | 3,148,496 | 3,074,807 | 73,689 | 68,374 | 3,306,882 |
| Totals | 343,149 | 16,136,822 | 15,622,395 | 514,427 | 723,795 | 31,777,946. |
Following is a summary of trustee savings-banks assets at the 31st March, 1948.
| Bank. | Mortgages. | New Zealand Government Securities. | Local Authority Debentures. | Cash in Hand and at Banks. | Total (Including Other Assets). |
|---|---|---|---|---|---|
| £ | £ | £ | £ | £ | |
| Auckland | 3,212,110 | 18,223,060 | 1,346,663 | 1,409,931 | 24,425,246 |
| New Plymouth | 1,075,051 | 1,945,688 | 139,923 | 301,552 | 3,489,869 |
| Hokitika | 187,714 | 125,620 | 20,032 | 25,760 | 369,169 |
| Dunedin | 2,215,317 | 3,874,311 | 794,324 | 241,526 | 7,218,541 |
| Invercargill | 600,440 | 2,446,045 | 292,835 | 244,289 | 3,644,021 |
| Totals | 7,290,632 | 26,614,724 | 2,593,777 | 2,223,058 | 39,146,846 |
NATIONAL SAVINGS.—The National Savings Act, 1940, made provision for the issue of savings bonds, in denominations of £1, £10, and £100, and the opening of special savings accounts with the Post Office and the Auckland, New Plymouth, Dunedin, and Invercargill trustee savings-banks. Investments are for a term of five years in the case of bonds, while moneys deposited in savings accounts are repayable according to the investment period, although the Act makes provision for the withdrawal of moneys before the due date of repayment on the grounds of hardship, emergency, &c. All amounts lodged prior to 30th June, 1943, were repayable on 30th June, 1945; amounts invested between 30th June, 1943, and 30th June, 1944, on 30th June, 1946; between 30th June, 1944, and 30th June, 1945, on 30th June, 1947, and so on. These investments bear interest at the rate of 3 per cent. per annum. All money invested under this scheme, other than that needed to meet taxation charges on interest, has been paid into the War Expenses Account. The national savings scheme is being continued and it is intended to apply the receipts in repayment of earlier war borrowings.
The following table gives particulars of deposits, withdrawals, &c., in regard to national savings accounts from the inception of the scheme to 31st March, 1949.
| Year ended 31st March, | Deposits. | Withdrawals. | Interest to 30th June, Previous Year. | Amount to Credit of Depositors. |
|---|---|---|---|---|
* Six months only. | ||||
| £ | £ | £ | £ | |
| 1941* | 718,077 | 460 | 717,617 | |
| 1942 | 2,476,207 | 9,448 | 10,063 | 3.194,439 |
| 1943 | 2,425,204 | 25,255 | 71,675 | 5,666,063 |
| 1944 | 7,257,538 | 63,815 | 150,475 | 13,010,261 |
| 1945 | 7,267,398 | 178,445 | 357,733 | 20,456,947 |
| 1946 | 7,607,413 | 1,706,754 | 559,775 | 26,917,381 |
| 1947 | 6,175,368 | 2,306.164 | 773,260 | 31,559,845 |
| 1948 | 7,285,423 | 3,680.450 | 905,439 | 36,070,257 |
| 1949 | 7.032,119 | 3,943,079 | 1,037,921 | 40,197,218 |
| Totals | 48,244,747 | 11,913,870 | 3,866,341 | |
The next table gives particulars of national savings bonds sold and redeemed during the same period.
| Year ended 31st March, | Value of Bonds sold. | Value of Bonds redeemed. |
|---|---|---|
| £ | £ | |
| 1941 | 611,709 | |
| 1942 | 2,786,299 | |
| 1943 | 1,356,301 | |
| 1944 | 3,121,859 | |
| 1945 | 2,609,105 | |
| 1946 | 1,313,723 | 520,596 |
| 1947 | 457,041 | 2,089,396 |
| 1948 | 492,697 | 2,936,265 |
| 1949 | 434,687 | 3,169,037 |
| Totals | 13,183,421 | 8,715,294 |
COMPANY, ETC., DEPOSITS.—Statistics of deposits with building and investment societies and trading companies are compiled from returns furnished to the Treasury. The following table shows the amounts held on deposit, classified according to the term of the deposit together with the average rates of interest thereon, as at the 31st March of each of the years 1938–47.
| As at 31st March, | Building and Investment Societies. | Trading Companies. | |||||||
|---|---|---|---|---|---|---|---|---|---|
| At Call and Under Three Months. | Three Months and Under Two Years. | Two Years and Over | Totals, Building and Investment Societies. | At Call and Under Three Months. | Three Months and Under Two Years. | Two Years and Over. | Totals, Trading Companies. | Grand Totals. | |
| Amount on Deposit | |||||||||
| £ | £ | £ | £ | £ | £ | £ | £ | £ | |
| 1938 | 804,443 | 755,811 | 2,680,419 | 4,240,673 | 2,154,307 | 1,045,739 | 1,897,136 | 5,097,182 | 9,337,855 |
| 1939 | 761,388 | 842,317 | 2,956,936 | 4,560,641 | 2,151,353 | 1,005,715 | 1,927,142 | 5,084,210 | 9,644,851 |
| 1940 | 735,746 | 873,444 | 3,205,931 | 4,815,121 | 2,111,470 | 1,148,445 | 1,867,442 | 5,127,357 | 9,942,478 |
| 1941 | 748,676 | 928,109 | 3,333,786 | 5,010,571 | 2,163,553 | 1,439,932 | 1,909,233 | 5,512,723 | 10,523,294 |
| 1942 | 698,724 | 761,865 | 3,588,966 | 5,049,555 | 2,072,634 | 1,101,813 | 2,520,567 | 5,695,014 | 10,744,569 |
| 1913 | 697,615 | 609,747 | 3,669,975 | 4,977,337 | 2,159,064 | 1,060,844 | 2,337,672 | 5,557,580 | 10,534,917 |
| 1944 | 700,125 | 562,605 | 3,869,484 | 5,132,214 | 1,635,665 | 1,209,096 | 2,260,818 | 5,105,579 | 10,237,793 |
| 1945 | 697,109 | 552,109 | 3,938,782 | 5,187,997 | 1,706,039 | 910,238 | 2,180,514 | 4,796,791 | 9,984,788 |
| 1946 | 707,714 | 537,919 | 4,102,331 | 5,347,964 | 2,342,723 | 1,037,871 | 2,095,624 | 5,476,218 | 10,824,182 |
| 1947 | 740,201 | 569,546 | 4,231,453 | 5,541,200 | 2,070,046 | 784,324 | 2,136,703 | 4,991,073 | 10,532,273 |
| Average Rate of Interest | |||||||||
| Per Cent. | Per Cent. | Per Cent. | Per Cent. | Per Cent. | Per Cent. | Per Cent. | Per Cent. | Per Cent. | |
| 1938 | 2.65 | 2.86 | 3.61 | 3.30 | 3.27 | 3.62 | 4.25 | 3.71 | 3.52 |
| 1939 | 2.67 | 2.88 | 3.65 | 3.34 | 3.18 | 3.60 | 4.23 | 3.67 | 3.51 |
| 1910 | 2.69 | 2.85 | 3.72 | 3.40 | 2.96 | 3.58 | 4.24 | 3.56 | 3.48 |
| 1941 | 2.70 | 2.86 | 3.73 | 3.41 | 2.87 | 3.41 | 4.27 | 3.50 | 3.46 |
| 1942 | 2.39 | 2.18 | 3.53 | 3.17 | 1.44 | 2.36 | 3.64 | 2.59 | 2.86 |
| 1943 | 2.08 | 1.85 | 3.31 | 2.96 | 1.43 | 2.12 | 3.55 | 2.45 | 2.69 |
| 1944 | 2.12 | 1.81 | 3.12 | 2.84 | 1.42 | 2.04 | 3.44 | 2.46 | 2.65 |
| 1945 | 2.14 | 1.78 | 3.00 | 2.75 | 1.41 | 2.10 | 3.31 | 2.41 | 2.59 |
| 1946 | 2.13 | 1.78 | 2.93 | 2.71 | 1.40 | 2.07 | 3.24 | 3.23 | 2.47 |
| 1947 | 2.11 | 1.75 | 2.82 | 2.62 | 1.37 | 2.17 | 3.13 | 2.25 | 2.44 |
The amount borrowed by building and investment societies during the year ended 31st March, 1947, was £1,426,329, the amount renewed during the year was £908,923, and the amount repaid £1,232,194. The respective amounts for trading companies were £2,619,560, £607,655, and £3,081,346.
SUMMARY OF BANK DEPOSITS.—In the preceding paragraphs statistics of deposits with each of the various classes of banking institutions are shown. It is of interest to show the position in summary form in respect of all classes of deposits (other than Government deposits and trading-bank deposits with the Reserve Bank).
| As at 31st March, 1948. | |
|---|---|
| £ | |
| Deposits with Reserve Bank (excluding Government and trading-bank deposits) | 579,650 |
| Deposits with trading banks (excluding Government) | 178,794,256 |
| Deposits with Post Office Savings-bank | 148,442,304 |
| Deposits with school savings-banks | 235,518 |
| Deposits with trustee savings-banks | 31,777,946 |
| Deposits in national savings account | 36,070,257 |
| Ex-servicemen's gratuities in Post Office Savings-bank | 12,438,968 |
| Total | £408,338,899 |
The above deposits are bank deposits only. As shown above, there were on 31st March, 1947, deposits of £5,541,200 with building and investment societies and of £4,991,073 with trading companies. It should be noted also that other classes of deposits exist—e.g., the Common Fund of the Public Trust Office.
VOLUME OF MONEY IN CIRCULATION.—The following information, which has been published by the Reserve Bank of New Zealand, sets out in detail the changes that have occurred in the amount of money in circulation in the form of coin, notes, and demand deposits of the Reserve Bank and of the trading banks. The first table shows the volume of such money as at the last balance day in January of each of the years 1939 and 1942–49, the figures quoted being in £(N.Z.) millions.
| — | 1939. | 1942. | 1943. | 1941. | 1945. | 1946. | 1947. | 1948. | 1949. |
|---|---|---|---|---|---|---|---|---|---|
| £ (m) | £ (m) | £ (m) | £ (m) | £ (m) | £ (m) | £ (m) | £ (m) | £ (m) | |
| Coin (estimated) public | 1.3 | 1.8 | 2.2 | 2.4 | 2.6 | 2.9 | 3.0 | 3.3 | 3.1 |
| Notes held by public | 11.0 | 19.2 | 24.9 | 31.2 | 33.6 | 36.9 | 39.7 | 40.9 | 40.9 |
| Demand deposits at—Reserve Bank* | 2.9 | 9.8 | 13.3 | 15.1 | 9.8 | 20.2 | 15.8 | 13.5 | 9.6 |
| Trading banks† | 36.2 | 57.8 | 74.7 | 88.5 | 93.6 | 112.0 | 126.1 | 134.5 | 147.4 |
| Totals | 51.4 | 88.6 | 115.1 | 137.3 | 139.7 | 172.0 | 184.6 | 192.1 | 201.0 |
| Change during year | +0.1 | +9.1 | +26.5 | +22.2 | +2.4 | +32.4 | +12.6 | +7.5 | +8.9 |
The cumulative effect of the changes in the volume of money during the ten years' period covered by the foregoing table is contained in the following summary.
| — | 1939–46 (Seven years). | 1946–49 (Three rears). |
|---|---|---|
* I.e., Government and other demand deposits at Reserve Bank, excluding trading banks' balances at Reserve Bank. † I.e., Trading banks' total demand liabilities in New Zealand. | ||
| £(m) | £(m) | |
| Coin (estimated) | +1.5 | +0.3 |
| Notes held by public | +26.0 | +3.9 |
| Demand deposits at—Reserve Bank* | +17.3 | -10.6 |
| Trading Banks† | +75.8 | +35.4 |
| Totals | +120.6 | +290.0 |
The next table shows the causes of the changes in the volume of money that occurred during the period.
| — | Cumulative Movement 1939–46 (Seven Years). | 1946–47. | 1947–48. | 1943–49. |
|---|---|---|---|---|
* As shown by changes in the Reserve Hank's sterling exchange plus overseas investments and trading banks' assets overseas in respect of New Zealand business, less overseas liabilities. † Minus sign indicates shift from demand to time liabilities. ‡ After allowing for alteration in valuation of net overseas assets arising on and after 20th August, 1943, when overseas assets and liabilities were converted to New Zealand currency at rate, £(Stg.)100 = £(N.Z.)100. ¶ Includes compensation to the Reserve Bank and the trading banks for losses arising from the exchange-rate appreciation on 20th August, 1948. | ||||
| £(m) | £ (m) | £ (m) | £ (m) | |
| Overseas transactions* | +82.8 | +21.0 | -27.5 | -19.8‡ |
| Bank Credit— | ||||
| Reserve Bank— | ||||
| Advances in New Zealand | +23.2 | -13.6 | +17.1 | +8.9 |
| Investments in New Zealand | +5.0 | -7.7 | +3.9 | +26.0¶ |
| Trading banks— | ||||
| Advances and discounts | -4.5 | +15.0 | +20.1 | -6.7 |
| Investments in New Zealand | +19.8 | -2.3 | -6.7 | -4.3 |
| Shift from time to demand liabilities of trading banks† | -3.5 | -2.2 | -3.6 | +0.3 |
| Other items | -2.2 | +2.4 | +4.2 | +4.5 |
| Change during period | +120.6 | +12.6 | +7.5 | +8.9 |
OVERDRAFT AND DISCOUNT RATES.—The trading banks' minimum overdraft rates and rates of discount, which had for many years been at 6½ or 7 per cent., were reduced to 6 per cent. as from 1st September, 1932. This was followed by further reductions to 5 per cent. from 1st May, 1933, to 4½ per cent. from 30th November, 1934, and to 4 per cent. from 1st August, 1941.
The Reserve Bank's minimum discount or rediscount rate for Now Zealand bills was originally 4 per cent., but was reduced to 34 per cent. from 29th July, 1935, to 24 per cent. from 2nd March, 1936, and to 2 per cent. from 29th June, 1936. The rate was restored to the original 4 per cent. on 19th November, 1938, but was reduced to 3 per cent. from 6th September, 1939, to 2 per cent. from 27th May, 1940, and to 14 per cent. from 26th July, 1941.
DEPOSIT AND INTEREST RATES.—Trading Banks.—The following is a schedule (since June, 1912) of the rates paid by the Associated Banks in New Zealand for moneys lodged on fixed deposit.
| Date operative from. | Three Months and under Six Months. | Six Months and under Twelve Mouths. | Twelve Months and under Twenty-four Months. | Twenty-four Months and under Thirty-six Months. |
|---|---|---|---|---|
| Per Cent. | Per Cent. | Per Cent. | Per Cent. | |
| 1st June, 1912 | 2 | 3½ | 4 | |
| 20th January, 1921 | 3 | 3½ | 4 | 4½ |
| 20th June, 1921 | 3½ | 3¾ | 4 | 4½ |
| 11th December, 1926 | 3¾ | 3¾ | 4 | 4½ |
| 9th May, 1927 | 3¾ | 4 | 4½ | 5 |
| 9th July, 1928 | 3¾ | 3¾ | 4 | 4½ |
| 1st February, 1930 | 3¾ | 3¾ | 4¼ | 5 |
| 22nd April, 1930 | 3¾ | 4 | 4¼ | 5 |
| 1st August, 1931 | 3½ | 3¾ | 4 | 4½ |
| 1st June, 1932 | 3 | 3¼ | 3½ | 4 |
| 2nd December, 1932 | 2½ | 2¾ | 3 | 3¼ |
| 11th July, 1933 | 2 | 2½ | 2¾ | 3 |
| 5th July, 1934 | 1½ | 2 | 2½ | 2¾ |
| 2nd November, 1934 | 1¼ | 1¾ | 2¼ | 2½ |
| 18th September, 1940 | ¾ | 1¼ | 2¼ | 2½ |
| 17th July, 1941 | ¾ | 1¼ | 1¾ | 2 |
Post Office Savings-bank.—Following is a statement of the interest rates payable in respect of Post Office Savings-bank deposits since 1914.
| Date operative from. | Amount of Deposit. | ||||
|---|---|---|---|---|---|
| £1–£300. | £301–£500. | £501–£1,000. | £1,001–£2,000. | £2,001–£5,000. | |
* Rate in existence on 1st January, 1914. † See paragraph following. | |||||
| Per Cent. | Per Cent. | Per Cent. | Per Cent. | Per Cent. | |
| 1st January, 1914* | 5 | 4 | 4 | Nil. | Nil. |
| 1st January, 1921 | 4 | 4 | 3¼ | 3¼ | 3¼ |
| 1st April, 1928 | 4 | 4 | 3¼ | 3¼ | † |
| 1st August, 1931 | 3¾ | 3¾ | 3¼ | 3¼ | † |
| 1st April, 1933 | 3 | 3 | 3 | 3 | † |
| 1st August, 1933 | 3 | 3 | 3 | 2¾ | † |
| 1st August, 1934 | 3 | 3 | 2½ | 2½ | † |
| 1st March, 1935 | 3 | 3 | 2¼ | 2½ | Nil. |
| 1st August, 1941 | 3 | 3 | 2 | 2 | Nil. |
| 1st June, 1942 | 2½ | 2½ | 2 | 2 | Nil. |
Prior to 1st January, 1914, the maximum deposit in the Post Office Savings-bank on which interest was payable was £600; but on that date the maximum was raised to £1,000. Between 1st January, 1921, and 1st April, 1928, interest was allowed on deposits up to a maximum of £5,000; but, as from the latter date, the maximum deposit on which any interest is payable has been £2,000. In respect of deposits lodged prior to 1st April, 1928, however, interest at 3¼ per cent. on the excess over £500 was still allowed up to a maximum deposit of £5,000. The rate on the amount between £500 and £5,000 was reduced to 3 per cent. from 1st April, 1933, on the amount exceeding £1,000 to 2¾ per cent. from 1st August, 1933, and on the excess over £500 to 2½ per cent. from 1st August, 1934, and to 2 per cent. from 1st August, 1941. Since 1st March, 1935, interest has not been payable in respect of the excess above £2,000 in any account.
Trustee Savings-banks.—Under the provisions of the Savings-banks Act, 1908, which applied to trustee savings-banks only, these banks were required to pay interest at the rate of 5 per cent. on deposits of £1 and upwards, but not on fractions of £1 or on amounts of under £1. The maximum amount of deposits on which interest was to be paid was fixed at £100 for each depositor; but by the Finance Act, 1921–22, the maximum was raised to £200. It remained at this figure until 1st July, 1945, when it was raised to £500. The banks were empowered to reduce the rate of interest, with the consent of the Governor-General, after three months' notice given by an advertisement published in the Gazette. These provisions were continued in force in the Trustee Savings Banks Act, 1948, which repealed the Savings-banks Act, 1908.
In the National Expenditure Adjustment Act, 1932, provision was made for the fixation by the Governor-General in Council of the maximum rates of interest payable by trustees of savings-banks. Ruling rates immediately prior to July, 1932, varied between 4 per cent. and 4½ per cent.; but, by Order in Council, the maximum interest payable was reduced to 3 per cent. as from 1st July, 1932, and to 3 per cent. as from 1st April, 1933. A further reduction to 2½ per cent. was made as from 1st June, 1942. The 1948 legislation, which replaced the above authority, gave power to the Governor-General to fix from time to time the rates of interest to be paid on deposits, and also provided that different rates may be fixed with respect to different classes of deposits.
Company, &c., Deposits.—Authority was taken in the National Expenditure Adjustment Act, 1932, to fix by Order in Council the maximum rates of interest payable on deposits with stock-and-station agents, trading companies, and building and investment societies. The maximum rates fixed by subsequent Orders in Council have been:—
| Period of Deposit. | Deposits (including Renewals) taken after— | ||||||
|---|---|---|---|---|---|---|---|
| 30th June, 1932. | 31st March, 1933. | 31st July, 1934. | 17th July, 1941. | 31st May, 1942. | 1st Nov., 1945. | 1st July, 1946. | |
| Per Cent. | Per Cent. | Per Cent. | Per Cent. | Per Cent. | Per Cent. | Per Cent. | |
| Stock-and-station Agencies and Trading Companies | |||||||
| At call and under 3 months | 3½ | 3½ | 2½ | 1½ | |||
| 3 months and under 6 months | 4 | 4 | 3½ | 1¾ | |||
| 6 months and under 12 months | 4¼ | 4¼ | 3¾ | 2 | |||
| 1 year and under 2 years | 4½ | 4½ | 4 | 2½ | |||
| 2 years and under 3 years | 5 | 5 | 4½ | 3 | 2¾ | ||
| 3 years and over | 5 | 5 | 4¾ | 3½ | 3 | ||
| Building and Investment Societies | |||||||
| At call and under 3 months | 3 | 2½ | 2 | 1 | |||
| 3 months and under 6 months | 3½ | 3 | 2¾ | 1¼ | |||
| 6 months and under 12 months | 3¾ | 3¼ | 3 | 1½ | |||
| 1 year and under 2 years | 4 | 3¼ | 3¼ | 2 | |||
| 2 years and under 3 years | 4½ | 4 | 3¾ | 2½ | 2¼ | ||
| 3 years and over | 4½ | 4 | 4 | 3 | 2½ | 2¾ | |
| Savings department | 3¾ | 3 | 2½ | ||||
Other Deposit and Interest Rates.—It is of service at this stage to mention briefly the interest rates payable in respect of certain other classes of deposits. The highest rate of interest payable on moneys in the Common Fund of the Public Trust Office (see Section 47) was fixed at 3¼ per cent. by Order in Council dated 26th March, 1945, previous reductions having been made from 5 per cent. in 1928, to 4¾ per cent. in 1931, to 4 per cent. in 1932, and to 3½ per cent. in 1933.
Local authorities may also accept deposits (in practice, only for short periods). The present maximum rates of interest (as from 17th July, 1941) on such deposits, as fixed by Order in Council are: Call and under three months, 1 per cent.; three and under six months, 1¼ per cent.: six months and over, 1½ per cent.
References to rates of interest on mortgages will be found in Section 32 (Mortgages), while interest on Government debt is referred to in Section 24c (State Indebtedness), and interest on local-authority debt in Section 26 (Local Government).
COINAGE AND CURRENCY.—New Zealand Coin.—Section 8 of the Finance Act, 1932–33 (No. 2), authorized the Minister of Finance to arrange with the Master of the Royal Mint (in England) for a special issue of silver and bronze coinage of distinctive design for use in New Zealand. Any coins minted in accordance with this arrangement would conform to the standard Mint requirements of weight, fineness, &c., and were given status as legal tender in New Zealand.
The Coinage Act, 1933, which came into operation on the 1st December, 1933, repealed section 8 of the Finance Act, 1932–33 (No. 2), and made necessary provisions in respect of silver and of bronze or cupro-nickel coins. The Act contains no provision for the issue of New Zealand gold coins. Section 5 (4) of the Act authorized Proclamations declaring that British coins (other than gold coins) should not be legal lender in New Zealand, and a Proclamation was issued declaring British silver coins not legal tender in New Zealand on and after the 1st February, 1935.
Arrangements were made under which the Royal Mint agreed to remint free of charge the Imperial and Australian silver coin circulating in New Zealand, replacing it with the New Zealand coin referred to above, and to allow the New Zealand Government the bullion value of the coin not used in making such replacement.
The profit accruing to the New Zealand Government from the recoinage on this basis arises from the fact that the Australian coinage and a proportion of the British coinage then in circulation in New Zealand contained a larger proportion of silver than the new coin under the standard set out in the Schedule to the Coinage Act, 1933, which is also the standard governing the present production of Imperial silver coin. In addition, the Commonwealth Government agreed to the repatriation at face value of a proportion of Australian coin circulating in New Zealand.
Up to 31st March, 1949, New Zealand coins have been received from the Mint of a total face value of £5,703,503. Statistics of the face values of the various denominations of coin received to 31st March, 1949, and the value of New Zealand silver coin in circulation at 31st March, 1949, are as follows:—
| Total received. | In Circulation. | |
|---|---|---|
* Not available. | ||
| £ | £ | |
| Half-crown | 1,720,100 | 957,849 |
| Florin | 1,739,500 | 909,568 |
| Shilling | 810,000 | 476,153 |
| Sixpence | 583,500 | 380,795 |
| Threepence | 661,975 | 470,176 |
| Penny | 145,150 | * |
| Halfpenny | 43,280 | * |
For the recoinage operations Imperial coin of a nominal value of £946,814 and Australian coin of £266,286 nominal value were forwarded to the Royal Mint, and Australian coin to the nominal value of £82,645 was forwarded to Australia. For the last-mentioned, £82,645 was received, and a further amount of £1,000 in Imperial coin was disposed of at face value to the Royal Mint. Expenses of the Silver and Bronze Coin Account totalled £684,499 to the 31st March, 1949, at which date there was a credit balance of £3,200,864 in the account.
New Zealand silver coinage first came into circulation in 1933, and New Zealand bronze coins were first released for circulation in December, 1939.
Restrictions on Import and Export of Currency.—The Customs Import Prohibition Order now prohibits the importation of all coin (other than silver coin which is over one hundred years old) of whatever metal and wherever and whenever minted, and whether or not it is legal currency in New Zealand or elsewhere. Persons arriving in New Zealand are permitted to have with them on arrival silver coin not exceeding £2 in value. The importation of bank-notes of the Bank of England, and of bank-notes issued by banks in Scotland and Northern Ireland, is prohibited. Persons arriving either directly or indirectly from the United Kingdom are prohibited from bringing with them, in the same ship or aircraft in which they arrive, the following items: Gold bullion; money, including bank-notes and other currency (other than silver coin not exceeding £2 in value) and postal notes and money-orders, of New Zealand or of any other country, and including also promissory notes and bills of exchange; securities for money, including bonds, debentures, debenture stock, and Treasury bills, and including scrip or certificates for and documents representing shares, debenture stock, and other stock, and also all other securities for money. The items enumerated are exclusive of promissory notes, cheques, drafts, and other bills of exchange, for sums expressed in sterling currency of the United Kingdom.
The Customs Export Prohibition Order prohibits the exportation of all coin (other than silver coin which is more than one hundred years old) of whatever metal and wherever and whenever minted and whether or not it is legal currency in New Zealand or elsewhere. Persons leaving New Zealand are permitted to take silver coin not exceeding £2; or, if the journey is by direct route (without transhipment) to Great Britain or Ireland, silver coin to the value of £5 may be taken. In addition to the above, the Finance Emergency Regulations 1940 prohibited the taking or sending of any money out of New Zealand except with the consent of the Minister or except in the case of certain transactions especially exempted.
In the cases of both the Export and the Import Prohibition Orders, power is vested in the Minister to authorize in writing the variation of the provisions mentioned. Prohibitions mentioned in both Orders have effect in addition to and not in substitution for any other prohibition in force relating or applicable to the importation or exportation of any of the items enumerated in the Orders or in any other enactment.
Legal Tender and Issue of Notes.—The Coinage Act, 1933, provides that a tender or payment of money, if made in New Zealand coins of current weight, shall be a legal tender to the following extent:—
Gold, to any amount.
Silver for amounts not exceeding £2.
Bronze for amounts not exceeding 1s.
The position in respect of the bank-note issue in New Zealand was radically altered by the Reserve Bank of New Zealand Act, 1933. Section 15 enacted that on and after a date fixed by Proclamation—the Proclamation was signed on the 26th January, 1934, and fixed the date as the 1st August, 1934—the Reserve Bank had the sole right to issue bank-notes in New Zealand; and thereupon the authority of every other bank to issue or re-issue bank-notes was terminated, and such banks were required to redeem their outstanding notes in Reserve Bank notes or subsidiary coin to the extent to which the latter was legal tender. On the 1st August, 1936, every other bank carrying on business in New Zealand was required to pay over to the Reserve Bank an amount equal to the value of its then outstanding notes issued or payable in New Zealand, and its liability in respect of such notes to the holders was assumed by the Reserve Bank. Bank-notes not presented for payment within forty years, commencing 1st April after date of issue in the case of Reserve Bank notes, or after assumption of liability (as above) in other cases, are deemed not to be in circulation, and an amount equal to the value thereof must be paid into the Consolidated Fund as if unclaimed moneys. The Unclaimed Moneys Act, 1908, provides for the payment to the rightful owner of any moneys paid into the Consolidated Fund under the provisions of the Act.
Reserve Bank notes are constituted legal tender up to any amount. There is a provision in the existing legislation which requires the Bank, on presentation at its head office in Wellington of notes to any amount not less than £1,000, to give in exchange sterling for immediate delivery in London. On similar presentation of gold or of sterling for immediate delivery in London, in either case to an amount of £1,000 or more, the Bank must give its notes in exchange therefor. These requirements may be suspended at the discretion of the Minister of Finance, and actually are in suspension at the present time (since 7th December, 1938). The rate of exchange for the above transactions is fixed by the Bank.
The principal Act requires the Bank to maintain a minimum reserve of not less than 25 per cent. of the aggregate amount of its notes in circulation and other demand liabilities; but the Reserve Bank of New Zealand Amendment Act, 1939, empowers the Minister of Finance to vary or suspend this requirement. The term “reserve” includes:—
Gold coin and bullion in the unrestricted ownership of the Bank.
Sterling exchange, comprising (1) deposits at the Bank of England, (2) British Treasury bills of not more than three months unexpired currency, (3) bills of exchange bearing at least two good signatures and of not more than three months unexpired currency.
Net gold exchange, as defined in section 17 (c) of the Act of 1933.
For the purpose of ascertaining the net reserve ratio the amount of the Bank's Liabilities in currencies other than New Zealand is deducted from the total of the “reserve.”
The gold coin and bullion holdings of the Reserve Bank are shown in the Bank's books at cost value to the bank. The amending legislation of 1939 permits the Minister of Finance to make a revaluation up to the market value of the fine gold contained in the reserve, the premium resulting from such revaluation to be credited to a special reserve to be held on behalf of the Crown. This special reserve is to be used in such manner as the Minister of Finance may from time to time determine; but up to the present, no such revaluation has been made.
The Reserve Bank may not issue bank-notes of a less denomination than 10s., except with the authority of the Governor-General in Council. The present issue of notes consists of the following denominations: 10s., £1, £5, £10, and £50.
Currency other than Legal Tender.—Neither Australian nor other overseas paper money circulates in New Zealand, presumably on account of the exchange fee charged by the banks on receiving it.
No consideration of the amount of credit currency in use at any moment can overlook the very large proportion of payments made by cheque, mainly upon the trading banks, but also upon trustee savings-banks and upon various stock-and-station agencies which act in this respect for their customers in the capacity of banker. Such cheques usually go direct from the payee to the collecting bank, but occasionally they pass from hand to hand.
Government postal notes (issued in thirty-nine denominations of from 1s. to £1) sometimes enjoy a certain length of life in the form of currency.
NEW ZEALAND AND STERLING EXCHANGE.—Although the movement of gold, whether internally or externally, was unrestricted in years prior to the war of 1914–18, certain of the conditions usually considered essential in the full operation of the gold standard were never effective in New Zealand. More correctly, New Zealand was, and still is, upon a sterling-exchange standard. The explanation is that the New Zealand banking system is not self-contained, in that the banks normally hold a large amount of funds in London. In fact, these London balances are the real regulative factor and the key to the whole New Zealand banking system.
While New Zealand currency was at parity with sterling, except for minor fluctuations above or below parity, no necessity existed for distinction between sterling and New Zealand currency. The latter is entitled to be considered as one of the sterling currencies; but, adopting the convenience of a growing usage, sterling is used herein to refer solely to the currency of Great Britain.
The relationship of New Zealand currency to sterling has assumed added significance since December, 1929. Prior to that date the New Zealand currency was at virtual parity with British currency, only slight deviations occurring from time to time, but then commenced to depreciate gradually, reaching, in January of 1931, a level of approximately £110 New Zealand = £100 London for telegraphic transfers. At that level it remained fairly stationary until January, 1933, when as a result of Government intervention it was abruptly depreciated to a further degree. The relationship existing from 20th January, 1933, until the establishment of the Reserve Bank of New Zealand on the 1st August, 1934, was £125 (selling) and £124 10s. (buying) New Zealand = £100 London for telegraphic transfers.
The unusual significance of the currency level in the case of New Zealand depends chiefly upon its position in regard to overseas trade and to overseas borrowings. The course of development of New Zealand has not reached a stage where the country is fully self-contained, and the external trade per caput is greater than that of almost all, if not all, other countries. Most of this external trade is with the United Kingdom, while the function of London as an international clearing-house is also of importance in this connection. New Zealand's borrowings from the London financial market have also, until comparatively recently, been upon a high scale, requiring, as noted elsewhere (vide State and also Local Authority Indebtedness), heavy annual payments in London.
From the 1st August, 1934, Reserve Bank quotations for £100 sterling for immediate delivery in London were: Buying rate, £124; selling rate, £125. It was intimated that the policy of the Bank would aim at retaining these rates unchanged for a long period unless there occurred marked changes in existing conditions. To assist in achieving this measure of stability, the Reserve Bank was prepared to enter into forward exchange contracts with the trading banks. While prepared to fulfil its statutory obligations, the Reserve Bank did not desire to compete for exchange business, provided adequate facilities were available elsewhere.
Following the statement of the Reserve Bank's policy, the trading banks adopted as from the 1st August, 1934, a scale of rates representing a reduction of 10s. per £100 on the rates ruling from the 20th January, 1933, to the 31st July, 1934. The rates were slightly changed on the 21st October, 1938, and further changes were made in the selling rate as from 1st December, and in the buying rate as from 6th November, 1940. During the year 1945–46 the Reserve Lank agreed to certain alterations in the trading banks' on-demand and usance rates, The effect of this alteration was to bring into alignment the on-demand and telegraphic transfer rates. This was considered appropriate because of the inauguration of fast air-mail facilities replacing, as from 31st July, 1945, the airgraph service previously used. The improvement in the mail-services and the consequent reduction in the transit-time between New Zealand and London enabled the trading banks to quote more favourable on-demand and usance buying rates to the public.
The position was very materially altered as from the 20th August, 1948, following on the announcement by the Government on the previous night of the appreciation of New Zealand currency to parity with sterling. The Reserve Bank quotations from 20th August, 1948, for £100 sterling for immediate delivery in London were: Buying rate, £100; selling rate, £101. Consequential adjustments to the scale of rates of trading banks in New Zealand were made, the quotations current for New Zealand on London at end of April, 1949, being given below.
| Category. | Buying (on Basis of £(Stg.)100). | Selling (on Basis of £(Stg.)100). | |
|---|---|---|---|
| Telegraphic transfers (cable) | £(N.Z.)100 | 7s. 6d. | £(N.Z.)101. |
| Air Mail. | Sea Mail. | Air and Sea Mail | |
| Bills, cheques, and drafts payable on demand | £(N.Z.)100 0s. 9d. | £(N.Z.)99 16s. 9d. | £(N.Z.)101 0s. 0d. |
| Bills or drafts 3 days sight | £(N.Z.)100 0s. 0d. | £(N.Z.)99 16s. 0d. | No quotation. |
| Bills or drafts 30 days sight | £(N.Z.)99 17s. 3d. | £(N.Z.)99 13s. 3d. | £(N.Z.)100 19s.3d. |
| Bills or drafts 60 days sight | £(N.Z.)99 14s.0d. | £(N.Z.)99 10s. 0d. | £(N.Z.)100 18s. 6d. |
| Bills or drafts 90 days sight | £(N.Z.)99 10s. 9d. | £(N.Z.)99 6s. 9d. | £(N.Z.)100 17s. 6d. |
| Bills or drafts 120 days sight | £(N.Z.)99 7s. 6d. | £(N.Z.)99 3s. 6d. | No quotation. |
As most of the export credits in normal times are utilized for financing imports, it is advisable to note that the full exchange rate is not operative in respect of dutiable goods. This arises from the fact that, although Customs duties are assessed in sterling, payment of Customs duties is accepted in New Zealand currency without addition of exchange.
The regulation of currency exchange is a function of the Reserve Bank, as noted previously. The Finance Act, 1934, provides that any appreciation or depreciation of the assets of the Reserve Bank (expressed in the currency of New Zealand) due to any alteration that may subsequently be made in the exchange rate, while the value of the local currency is not fixed by statute in terms of sterling, shall he credited to or be borne by the Consolidated Fund. In this respect, as already noted, the Consolidated Fund bore those losses incurred as a result of the 1948 adjustment of the exchange rate.
FINANCE EMERGENCY REGULATIONS STILL IN FORCE—The Finance Emergency Regulations 1940 (No. 2) of the 18th dune, 1940, took the place of earlier regulations gazetted on the 10th April, 1940, but they are also more comprehensive. Amendments to the regulations were issued on 25th September, 1940, 9th December, 1940, 2nd May, 1945, and 22nd May, 1946. The regulations closely resemble similar legislation passed in the United Kingdom shortly before the New Zealand measures came into force. The regulations prohibit the export of money and securities from New Zealand except with the consent of the Minister of Finance, and require that gold coin and bullion and also foreign currency belonging to any New Zealand resident be offered for sale to the Reserve Bank of New Zealand.
Under the regulations owners of foreign securities were prohibited from dealing with their securities in any way and were obliged to register them with the Reserve Bank within a specified period. A Reserve Bank statement of the 30th July, 1940, somewhat eased these restrictions by permitting New Zealand residents to deal in overseas securities on the New Zealand register without the prior consent of the Reserve Bank, subject to the companies concerned agreeing to fulfil certain requirements as to returns, &c. As regards overseas securities held by New Zealand residents but registered outside New Zealand, the selling broker is required to obtain the prior consent of the Reserve Bank. Permission to deal in both these classes of overseas securities is subject to the further condition that a form recording the transaction is completed by both the selling broker and the buying broker and supplied to the Reserve Bank. Sales of overseas securities to other than New Zealand residents require the special permission of the Reserve Bank, and in all such eases the proceeds received overseas must be remitted to New Zealand. The change from one form of overseas investment to another in an Australian market is not permitted.
The regulations empower the Minister to take over any overseas securities for the purpose of strengthening the financial position of New Zealand, at a price not less than the market value at the time of the transfer. The price payable for securities or currency acquired may be in cash, in New Zealand Government stock, or in a combination of both, according to the discretion of the Minister. For gold coin or bullion taken over, the vendor has the option of any of these methods of payment.
Further sections of the regulations empowered the Minister to require contributions to war loans; prohibit, without his consent, the formation of companies, building societies, &c., or the increase of capital of existing companies; regulate the issue of capital other than by a local authority; and empowered the Minister, as he deems necessary in the public interest, to control advances for industrial purposes.
Amending regulations issued on 22nd May, 1946, provided that the consent of the Minister is not required for the formation of a company where the nominal capital does not exceed £10,000, or for an increase of capital of an existing company where the amount of the increase, together with the amounts of all other increases made within one year before that increase does not exceed £10,000.
The Savings-banks Emergency Regulations 1941 (revoked by the Trustee Savings Banks Act, 1948) gave legal authority for the trustees of any savings-bank to invest with the approval of the Minister of Finance, the whole or any portion of the funds of the bank in securities charged upon the public revenues of New Zealand issued in respect of any loan raised or to be raised for war purposes under the authority of the War Expenses Act, 1939, or of any subsequent Act, or in securities issued in renewal or redemption or conversion of any such securities.
Table of Contents
THE statutory provisions affecting life assurance in New Zealand are in the main contained in the Life Insurance Act, 1908, and its amendments of 1920, 1921–22, and 1925; the Inalienable Life Annuities Act, 1910; and the Government Life Insurance Act, 1908, and its amendment of 1912. Any association other than a friendly society which issues policies or grants annuities on human life in New Zealand comes within the scope of the enactments. Every life company must deposit with the Public Trustee money or securities of the statutory character to the value of from £5,000 to £50,000, varying within these limits according to the total amount assured by policies current in its New Zealand business. The aggregate value of such deposits at 31st March, 1948, was £729,635.
In the case of composite offices, provision is made for the receipts of life and annuity business to be treated as a separate fund, and the Act safeguards the interest of the policyholder by making these funds available only for liabilities arising from such business.
The law bearing on industrial assurance received the attention of the Legislature in the Life Insurance Amendment Act, 1920. In this class of assurance the premiums are payable at shorter intervals than three months, and provision is made for its control by regulation. Companies are required to deposit with the Minister of Finance forms of policy tables, rates, and other documents, and policies must contain only such conditions as have been approved by the Governor-General in Council. Restrictions are placed on the forfeiture of policies in default of payments or other requirements.
Annual returns of life assurance are required to be deposited with the Minister of Finance, and it is from these returns that the statistical matter contained in this subsection has been compiled.
Sixteen life-assurance offices were operating in New Zealand during 1947. Of the sixteen, five only are purely New Zealand institutions—namely, the Government Life Insurance Office, the Provident Life Assurance Co., the Dominion Life Assurance Office of New Zealand, Ltd., the F.A.M.E. Insurance Co., Ltd., and the Maoriland Life Assurance Office, Ltd.
The statistics here given relate exclusively to business transacted in New Zealand.
LIFE ASSURANCE.—ORDINARY AND INDUSTRIAL.—The years 1935–37 witnessed a remarkable expansion in the amount of new business transacted, this being due to improved economic conditions following the period of financial stringency. The greater part of the postponed demand for life-assurance cover appears to have been satisfied in 1936 and 1937, and this no doubt is partly responsible for the reduced business transacted in the subsequent three years. Another factor that must be taken into consideration in this connection is the introduction of the scheme of social security, a description of which is contained in Section 25 of this volume.
War conditions generally, including smaller numbers of the companies' field representatives and the transfer of large numbers of men of the predominantly insurable ages to the Armed Forces, were evidently the major factors determining the lower levels of new business during 1940–43. Subsequently, the substantial increases in private incomes, particularly in the later war years, and the return of men to civilian life created a situation favourable to a large expansion in the amount of new business. Although the amount underwritten in 1943 was below the level of pre-war years, it was substantially above the 1942 figure. Each succeeding year has produced a substantial increase, so much so that fresh records were created in 1945, 1946, and 1947, and the total for the latter year was no less than £26,780,267, or 183.6 per cent. greater than the 1942 figure.
The progress of life assurance in New Zealand is illustrated by the following diagram, which shows the amount of new business transacted at intervals over a period of forty-seven years.
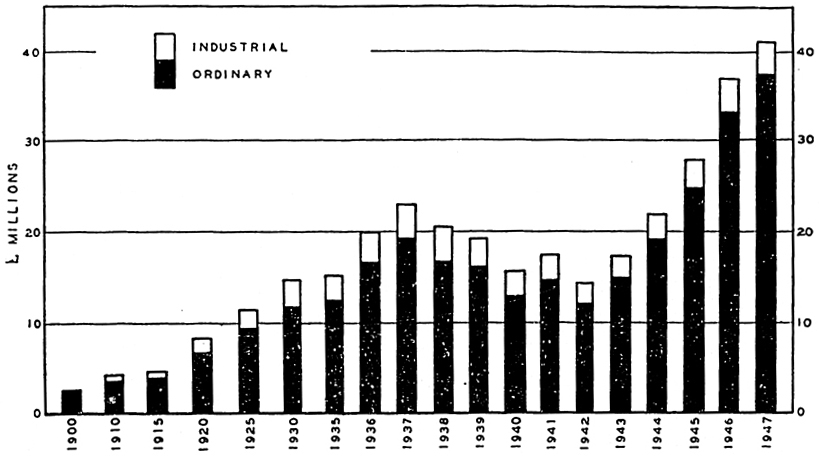
During the second half of the decade 1938–47, discontinuances amounted to £43,000,000, compared with £45,000,000 for the first five years. As the total discontinuances include surrenders and lapses, the general tendency is for discontinuances to follow the same trend as new business, although there is naturally a time lag of, normally, about two years. Therefore discontinuances declined each year from the peak of 1938 (this year was affected by an abnormally large number of maturities) until 1943. An upward movement commenced in 1944, and this has continued in subsequent years, although the increase has been relatively slight when the record figures of new business are taken into account. In the three years 1937–39 the value of policies discontinued on account of all causes represented 45.3 per cent. of the value of new policies issued, as compared with 27.3 per cent. in 1945–47.
Eleven years' figures for new business, discontinuances, and amount in force for the combined departments (ordinary and industrial) are given in the table following.
| Year. | Policies Issued. | Policies discontinued. | Policies existing at End of Year. |
|---|---|---|---|
| £ | £ £ | ||
| 1937 | 23,037,238 | 8,248,524 | 150,801,811 |
| 1938 | 20,506,530 | 10,213,016 | 161,095,325 |
| 1939 | 19,302,511 | 9,982,613 | 170,415,223 |
| 1940 | 15,841,070 | 8,752,438 | 177,503,855 |
| 1941 | 17,753,911 | 8,052,712 | 187,206,560 |
| 1942 | 14,587,951 | 8,035,532 | 193,758,979 |
| 1943 | 17,574,059 | 6,779,764 | 204,192,428 |
| 1944 | 22,115,998 | 7,284,723 | 219,023,704 |
| 1945 | 27,870,468 | 8,298,596 | 238,595,576 |
| 1946 | 37,085,495 | 9,828,464 | 265,852,607 |
| 1947 | 41,368,218 | 10,897,884 | 296,322,941 |
During the ten years from 1938 to 1947 the amount in force has increased by £145,521,130 or 96 per cent. The year 1947 contributed 21 per cent. of the total increase during the decade.
Ordinary Life Assurance.—A table showing the progress of business over a period of eleven years is given below.
| Year. | Policies issued. | Policies discontinued. | Policies existing at End of Year. | ||||||
|---|---|---|---|---|---|---|---|---|---|
| Number. | Sum assured. | Annual Premiums. | Number. | Sum assured. | Annual Premiums. | Number. | Sum assured. | Annual Premiums, | |
| £ | £ | £ | £ | £ | £ | ||||
| 1937 | 50,989 | 19,376,772 | 606,720 | 19,702 | 6,475,775 | 223,508 | 352,419 | 131,598,028 | 4,166,588 |
| 1938 | 44,209 | 16,943,706 | 510,841 | 22,754 | 8,222,169 | 292,821 | 373,874 | 140,319,565 | 4,384,608 |
| 1939 | 40,404 | 16,304,251 | 479,249 | 21,709 | 7,884,027 | 259,907 | 392,569 | 148,739,789 | 4,603,950 |
| 1940 | 81,003 | 13,043,641 | 391,849 | 19,565 | 6,901,236 | 239,399 | 404,007 | 154,882,194 | 4,756,400 |
| 1941 | 33,228 | 14,869,366 | 464,634 | 16,919 | 6,279,161 | 215,145 | 420,332 | 163,473,905 | 5,005,632 |
| 1942 | 24,886 | 12,143,512 | 387,536 | 16,236 | 6,378,095 | 215,214 | 428,982 | 169,239,322 | 5,177,954 |
| 1943 | 28,629 | 15,018,060 | 518,935 | 14,230 | 5,469,650 | 179,622 | 443,381 | 178,426,886 | 5,517,267 |
| 1944 | 35,335 | 19,252,364 | 655,424 | 14,809 | 5,813,624 | 205,979 | 463,907 | 191,865,626 | 5,966,713 |
| 1945 | 44,215 | 24,877,652 | 823,512 | 15,675 | 6,671,405 | 244,020 | 492,447 | 210,071,873 | 6,546,205 |
| 1946 | 57,724 | 33,383,578 | 1,088,168 | 16,927 | 8,006,535 | 287,942 | 533,244 | 235,448,916 | 7,346,430 |
| 1947 | 60,810 | 37,517,115 | 1,237,247 | 18,393 | 8,978,114 | 326,449 | 575,661 | 263,987,917 | 8,257,228 |
The amount of new business transacted fell away considerably following the outbreak of war, the absence overseas with the Armed Forces of large numbers of men of the predominantly insurable ages being a potent factor in this connection.
Between 1943 and 1947 a substantial increase was recorded in each succeeding year, reflecting, no doubt, the return to civilian life of servicemen, and the reviewing of insurance cover to meet changing money values. The greatest increase was recorded in 1946, the amount underwritten in that year being £8,600,000 (34 per cent.) greater than in 1945. In 1947 the total was £4,100,000 (11 per cent.) in excess of 1946.
A prominent feature of new insurances of recent years has been the increase in the average amount of the sum assured per policy. Average amounts per new policy and the increases over the preceding year wove:—
| Year. | Average Amount. | Increase. |
|---|---|---|
| £ | £ | |
| 1940 | 421 | 17 |
| 1941 | 447 | 26 |
| 1942 | 488 | 41 |
| 1943 | 526 | 38 |
| 1944 | 545 | 19 |
| 1945 | 563 | 18 |
| 1946 | 578 | 15 |
| 1947 | 617 | 39 |
From 1938 to 1943 discontinuances became progressively less, the heavy mortality in the war years being more than compensated by the smaller number of lapses and surrenders. The years 1944 to 1947, however, showed the increased discontinuances which normally follow substantial rises in new policy issues. The increases, however were relatively small, and it is of interest to note in this connection that surrenders and lapses in 1937–39 were equivalent to 25.3 per cent. of the amount of new business transacted in those years, whereas the corresponding percentage in the three-year period 1945–47 was 16.2 per cent.
The net result of the transactions for the year 1947 was an increase since the end of the preceding year of £28,539,001 in the sum assured in force, as against corresponding rises of £25,377,043 and £18,206,247 for 1946 and 1945 respectively.
Particulars of policies discontinued during the last five years are contained in the next table.
| Year. | Death. | Maturity. | Surrender. | Lapse. | Other Causes. | Totals. |
|---|---|---|---|---|---|---|
| Number of Policies | ||||||
| 1943 | 4,008 | 4,220 | 3,381 | 2,598 | 23 | 14,230 |
| 1944 | 4,101 | 4,455 | 3,392 | 2,518 | 343 | 14,809 |
| 1945 | 3,791 | 4,768 | 4,016 | 3,164 | -64 | 15,675 |
| 1946 | 3,327 | 5,034 | 4,875 | 4,092 | -401 | 16,927 |
| 1947 | 2,993 | 5,100 | 5,387 | 4,951 | -38 | 18,393 |
| Sum assured | ||||||
| £ | £ | £ | £ | £ | £ | |
| 1943 | 1,697,544 | 967,695 | 1,251,993 | 1,222,854 | 329,564 | 5,469,650 |
| 1944 | 1,788,874 | 1,050,076 | 1,375,884 | 1,206,134 | 392,656 | 5,813,624 |
| 1945 | 1,640,419 | 1,367,823 | 1,801,121 | 1,436,593 | 425,449 | 6,671,405 |
| 1946 | 1,471,920 | 1,388,796 | 2,478,977 | 2,082,819 | 584,023 | 8,006,535 |
| 1947 | 1,434,006 | 1,337,220 | 2,916,481 | 2,580,299 | 710,108 | 8,978,114 |
Deaths accounted for 16.0 per cent. of the total amount written off in 1917, maturities for 14.9 per cent., surrenders for 32.5 per cent., and lapses for 28.7 per cent. Corresponding percentages for 1943 were 31.0, 17.7, 22.9, and 22.4 respectively.
The total amount written off during 1947 represents 3.81 per cent. of the amount in force at the end of the previous year, the same figure as for 1946.
A statement of the aggregate revenue and expenditure of all the companies operating in New Zealand, so far as ordinary business is concerned, further illustrates the course of business during the last five years. The ratios of management expenses to premium income and to total revenue are also given.
| Year. | Revenue and Expenditure. | Expenses of Management. | ||||
|---|---|---|---|---|---|---|
| Total Revenue.* | Total Expenditure.* | Excess of Revenue. | Amount. | Proportion to Premium Income. | Proportion to Total Revenue. | |
* Excluding transfers from or to Head Offices and Branches. | ||||||
| £ | £ | £ | £ | Per Cent. | Per Cent. | |
| 1943 | 7,913,375 | 4,833,690 | 3,079,685 | 690,715 | 12.20 | 8.73 |
| 1944 | 8,493,894 | 5,080,920 | 3,412,974 | 787,791 | 12.80 | 9.27 |
| 1945 | 9,104,919 | 5,536,492 | 3,568,427 | 911,902 | 13.61 | 10.02 |
| 1946 | 9,997,799 | 5,667,254 | 4,330,545 | 1,132,729 | 15.13 | 11.33 |
| 1947 | 11,215,703 | 5,886,978 | 5,328,725 | 1,299,628 | 15.26 | 11.59 |
Excluding commission, the ratio of management expenses to premium income was 6.73, 6.58, 6.42, 6.89, and 7.09 per cent. respectively for the years 1943 to 1947 inclusive.
The next table gives particulars of the principal items of revenue and expenditure during the five years, transfers between head offices and branches are again excluded.
| — | 1943. | 1944. | 1945. | 1946. | 1947. |
|---|---|---|---|---|---|
| Revenue | |||||
| £ | £ | £ | £ | £ | |
| New and renewal premiums | 5,661,980 | 6,152,221 | 6,699,190 | 7,485,287 | 8,517,030 |
| Consideration for annuities | 50,603 | 41,531 | 46,228 | 69,274 | 103,836 |
| Interest, rents, &c. | 2,193,142 | 2,291,244 | 2,359,188 | 2,441,198 | 2,588,671 |
| Other revenue | 7,650 | 8,898 | 313 | 2,040 | 6,166 |
| Total revenue | 7,913,375 | 8,493,894 | 9,104,919 | 9,997,799 | 11,215,703 |
| Expenditure | |||||
| Claims by death and maturity | 3,340,685 | 3,496,772 | 3,751,551 | 3,602,220 | 3,571,281 |
| Annuities | 110,143 | 108,917 | 105,777 | 106,637 | 112,926 |
| Surrenders | 293,454 | 320,254 | 306,892 | 359,790 | 382,945 |
| Cash bonuses | 19,384 | 20,941 | 21,446 | 18,441 | 24,358 |
| Management | 690,715 | 787,791 | 911,902 | 1,132,729 | 1,299,628 |
| Taxes | 222,309 | 209,957 | 362,236 | 356,941 | 436,035 |
| Other expenditure | 157,000 | 136,288 | 76,688 | 90,496 | 59,805 |
| Total expenditure | 4,833,690 | 5,080,920 | 5,536,492 | 5,667,254 | 5,886,978 |
Industrial Assurance.—Here, also, new business began to decline in 1938, and reached the lowest point in 1942. Succeeding years show an upward trend, and the greatest rise appears in 1946, which was £700,000 (24 per cent.) more than 1945. In 1947 the increase, as compared with 1946, was £150,000 (4 per cent.). Between 1939 and 1943 discontinuances decreased by £788,472 (38 per cent.), but, with the rise in new business, from 1944 to 1947 the total rose to 91 per cent. of that of 1939. Discontinuances in 1947 by death, maturity, and surrender, were, respectively, 20 per cent., 78 per cent., and 58 per cent. greater, and lapses were 43 per cent. less than in 1939.
A summary of the progress of industrial assurance business is given in the following table.
| Year. | Policies Issued. | Policies discontinued. | Policies existing at End of Year. | ||||||
|---|---|---|---|---|---|---|---|---|---|
| Number. | Sum assured. | Annual Premiums. | Number. | Sum assured. | Annual Premiums. | Number. | Sum assured. | Annual Premiums. | |
| £ | £ | £ | £ | £ | £ | ||||
| 1937 | 68,630 | 3,660,466 | 218,006 | 35,033 | 1,772,749 | 107,852 | 398,604 | 19,203,783 | 1,130,859 |
| 1938 | 65,396 | 3,562,824 | 210,254 | 37,064 | 1,990,847 | 118,176 | 426,936 | 20,775,760 | 1,222,937 |
| 1939 | 53,531 | 2,998,260 | 177,672 | 37,150 | 2,098,586 | 126,907 | 443,317 | 21,675,434 | 1,273,702 |
| 1940 | 49,671 | 2,797,429 | 163,735 | 32,338 | 1,851,202 | 113,635 | 460,650 | 22,621,661 | 1,323,802 |
| 1941 | 50,256 | 2,884,545 | 164,906 | 31,173 | 1,773,551 | 108,227 | 479,733 | 23,732,655 | 1,380,481 |
| 1942 | 42,498 | 2,444,439 | 141,046 | 29,386 | 1,657,437 | 102,221 | 492,845 | 24,519,657 | 1,419,306 |
| 1943 | 41,685 | 2,555,999 | 146,271 | 23,958 | 1,310,114 | 81,467 | 510,572 | 25,765,542 | 1,484,110 |
| 1944 | 43,876 | 2,863,635 | 162,352 | 26,379 | 1,471,099 | 90,006 | 528,069 | 27,158,078 | 1,556,455 |
| 1945 | 43,353 | 2,992,816 | 170,214 | 23,057 | 1,627,191 | 101,659 | 543,365 | 28,523,703 | 1,625,010 |
| 1946 | 49,369 | 3,701,917 | 201,804 | 30,395 | 1,821,929 | 109,271 | 562,339 | 30,403,691 | 1,717,542 |
| 1947 | 43,789 | 3,851,103 | 184,138 | 30,790 | 1,919,770 | 112,080 | 575,338 | 32,335,024 | 1,739,600 |
As a result of the year's transactions, the amount in force increased during 1947 by £1,931,333, compared with the previous year's increase of £1,879,988.
The average sum assured under each policy of new business effected in 1947 amounted to £88, with an average annual premium of £4 4s. 1d. Corresponding averages for 1943 were £61, and £3 10s. 2d.
A summary of the number of industrial policies and the sums assured written off according to the several causes is now given in the form of a five-year table.
| Year. | Death. | Maturity. | Surrender. | Lapse. | Other Causes. | Total. |
|---|---|---|---|---|---|---|
| Number of Policies | ||||||
| 1943 | 3,591 | 11,397 | 1,839 | 7,080 | 51 | 23,958 |
| 1944 | 3,391 | 12,850 | 2,013 | 8,070 | 55 | 26,379 |
| 1945 | 3,442 | 13,806 | 2,148 | 8,550 | 111 | 28,057 |
| 1946 | 3,135 | 14,941 | 2,745 | 9,394 | 180 | 30,395 |
| 1947 | 2,802 | 15,474 | 2,962 | 9,365 | 187 | 30,790 |
| Sum assured | ||||||
| £ | £ | £ | £ | £ | £ | |
| 1943 | 161,357 | 527,571 | 80,177 | 521,649 | 19,360 | 1,310,114 |
| 1944 | 154,501 | 603,556 | 91,348 | 607,845 | 13,849 | 1,471,099 |
| 1945 | 147,800 | 663,228 | 106,712 | 695,449 | 14,002 | 1,627,191 |
| 1946 | 131,278 | 703,776 | 134,263 | 832,365 | 20,247 | 1,821,929 |
| 1947 | 120,309 | 730,217 | 240,293 | 808,170 | 20,781 | 1,919,770 |
The amount written off in each year is proportionately greater in the industrial than in the ordinary branch. The tendency to a reduction of this disparity, which appeared in recent years, has been checked, and the ratio has remained fairly constant in 1945, 1946, and 1947. Of the insurance in force at the end of the previous year, 3.48 per cent. of the ordinary and 5.99 per cent. of the industrial became void in 1945; 3.81 per cent. of the ordinary and 6.39 per cent. of the industrial became void in 1946; and 3.81 per cent. of the ordinary and 6.31 per cent. of the industrial became void in 1947.
A statement of the aggregate revenue and expenditure for the last five years is contained in the next table, which shows also the ratio of management expenses to premium income and to total revenue.
| Year. | Revenue and Expenditure. | Expenses of Management. | ||||
|---|---|---|---|---|---|---|
| Total Revenue.* | Total Expenditure.* | Excess of Revenue. | Amount. | Proportion to Premium Income. | Proportion to Total Revenue. | |
* Excluding transfers from or to Head Offices and Branches. | ||||||
| £ | £ | £ | £ | Per Cent. | Per Cent. | |
| 1943 | 1,832,826 | 1.259,294 | 573,532 | 389,106 | 26.76 | 21.23 |
| 1944 | 1,931,419 | 1,360,896 | 570,523 | 406,717 | 26.70 | 21.06 |
| 1945 | 2,012,389 | 1,450,780 | 561,609 | 426,204 | 26.65 | 21.18 |
| 1946 | 2,079,929 | 1,526,654 | 553,275 | 465,467 | 27.97 | 22.38 |
| 1947 | 2,192,923 | 1,566,505 | 626,418 | 481,313 | 27.50 | 21.95 |
The difference between the ratio of management expenses to premium income in the industrial branch and the corresponding ratio in the ordinary branch is largely accounted for by the high cost of collection of premiums in the industrial branch, principally in the shape of renewal commission. In the ordinary branch, commission (new and renewal) in 1947 was equivalent to 8.17 per cent. of the premium income, and in the industrial branch to 16.00 per cent. Excluding commissions, the ratio of management expenses to premium income was 11.49 per cent. in the industrial branch, as against 7.09 per cent. in the ordinary.
The principal items of revenue and expenditure in the industrial branch (again excluding transfers between head office and branches) for the five years 1943–47 is now given.
| — | 1943. | 1944. | 1945. | 1946. | 1947. |
|---|---|---|---|---|---|
| Revenue | £ | £ | £ | £ £ | |
| Premiums | 1,454,006 | 1,523,150 | 1,599,212 | 1,664,406 | 1,750,536 |
| Interest, rents, &c. | 369,990 | 399,585 | 411,841 | 414,311 | 425,693 |
| Other revenue | 8,830 | 8,684 | 1,336 | 1,212 | 16,694 |
| Total revenue | 1,832,826 | 1,931,419 | 2,012,389 | 2,079,929 | 2,192,923 |
| Expenditure | |||||
| Claims by death and maturity | 773,194 | 852,806 | 924,818 | 963,815 | 988,237 |
| Surrenders | 27,938 | 31,028 | 36,203 | 42,782 | 47,595 |
| Management | 389,106 | 406,717 | 426,204 | 465,467 | 481,313 |
| Taxes | 46,547 | 38,362 | 45,044 | 37,752 | 38,903 |
| Other expenditure | 22,509 | 31,983 | 18,511 | 16,838 | 10,457 |
| Total expenditure | 1,259,294 | 1,360,896 | 1,450,780 | 1,526,654 | 1,566,505 |
LIFE ASSURANCE DEATH-RATES.-The following table shows for the period 1937–47 the death-rate per thousand policies exposed to risk in each year. In computing these rates all policies which were in force for any portion of the year have been taken into account. The higher rates for the 1941–45 years are mainly due to deaths from war causes.
| Year. | Death-rate per 1,000 Policies. | ||
|---|---|---|---|
| Ordinary Life Assurance. | Industrial Life Assurance. | Ordinary and Industrial combined. | |
| 1937 | 5.46 | 5.47 | 5.46 |
| 1938 | 5.70 | 5.86 | 5.79 |
| 1939 | 5.15 | 5.51 | 5.35 |
| 1940 | 5.43 | 5.37 | 5.40 |
| 1941 | 6.89 | 6.02 | 6.42 |
| 1942 | 9.74 | 6.97 | 8.24 |
| 1943 | 8.76 | 6.72 | 7.66 |
| 1944 | 8.53 | 6.12 | 7.24 |
| 1945 | 7.43 | 6.02 | 6.69 |
| 1946 | 6.05 | 5.29 | 5.66 |
| 1947 | 5.04 | 4.62 | 4.83 |
LIABILITIES AND ASSETS.—Of the five companies transacting industrial business in New Zealand, only one apportions its liabilities and assets over the ordinary and industrial business, for, although the legislation in force requires separate statements of revenue and expenditure, policies issued and discontinued, &c., no such requirement exists in regard to balance sheets. The figures presented in the next two tables accordingly refer to both classes of assurance, and, as indicated earlier in this subsection, relate to New Zealand business only.
The aggregate capital and liabilities at the end of 1947, as compared with the two preceding years, were as follows:—
| 1945. | 1946. | 1947. | |
|---|---|---|---|
| £ | £ | £ | |
| Paid-up share capital | 262,322 | 240,829 | 250,029 |
| Life assurance and annuity funds | 72,224,885 | 77,115,821 | 83,036,931 |
| Depreciation, reserve, and other special funds | 1,149,145 | 1,127,679 | 1,121,308 |
| Claims admitted but not paid | 871,565 | 780,990 | 777,719 |
| Other liabilities | 646,671 | 694,732 | 998,842 |
| Totals | 75,154,588 | 79,960,051 | 86,184,829 |
The assets of the New Zealand Branches at the end of the three years 1945–47 were:—
| Assets. | Amount. | Proportion to Totals. | ||||
|---|---|---|---|---|---|---|
| 1945. | 1946. | 1947. | 1945. | 1946. | 1947. | |
| £ | £ | £ | Per Cent. | Per Cent. | Per Cent. | |
| Mortgages on property | 12,287,346 | 12,139,196 | 13,108,341 | 16.35 | 15.18 | 15.20 |
| Loans on policies | 3,810,849 | 3,575,154 | 3,481,097 | 5.07 | 4.47 | 4.04 |
| New Zealand Government securities | 28,582,066 | 33,867,654 | 37,898,809 | 38.03 | 42.36 | 43.97 |
| Securities of other Governments | 1,696,531 | 2,826,548 | 2,273,890 | 2.26 | 3.53 | 2.65 |
| Municipal and local authority securities | 22,025,406 | 21,352,130 | 22,714,834 | 29.31 | 26.70 | 26.36 |
| Landed and house property | 2,061,238 | 2,146,891 | 2,177,830 | 2.74 | 2.69 | 2.54 |
| Other investments | 735,883 | 888,126 | 1,201,240 | 0.98 | 1.11 | 1.39 |
| Loans on personal security | 100 | 100 | 100 | 0.00 | 0.00 | 0.00 |
| Agents' balances | 818 | 3,126 | 4,885 | 0.00 | 0.00 | 0.00 |
| Outstanding premiums | 440,474 | 469,746 | 537,919 | 0.59 | 0.59 | 0.62 |
| Interest accrued, &c. | 657,092 | 695,795 | 749,291 | 0.87 | 0.87 | 0.87 |
| Cash | 1,362,789 | 907,901 | 888,425 | 1.81 | 1.14 | 1.03 |
| Other assets | 1,493,996 | 1,087,684 | 1,148,168 | 1.99 | 1.36 | 1.33 |
| Totals | 75,154,588 | 79,960,051 | 86,184,829 | 100.00 | 100.00 | 100.00 |
The following diagram illustrates the expansion that has taken place since 1925 in the assets of life-assurance companies operating in New Zealand. This, of course, is a natural consequence of the huge increase in the amount of business. As stated on page 535, receipts of life assurance and annuity business must be treated as a separate fund, and the interests of the policy-holders are safeguarded by the fact that these funds are available only for liabilities arising from such business.
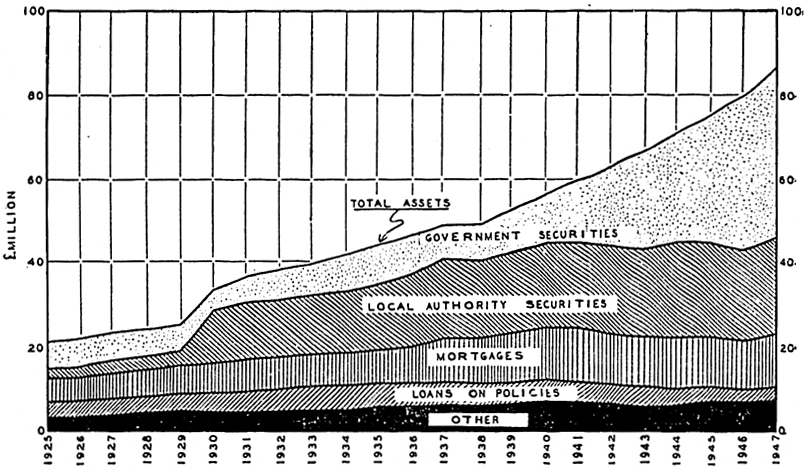
The diagram also shows the trend in the class of security in which the funds have been invested. Considerable changes have taken place in recent years in the proportions represented by the different securities. In 1937 local authority securities represented 37.1 per cent.; loans on mortgage, 21.3 per cent.; Government securities, 17.8 per cent.; and loans or policies, 11.6 per cent. of the total assets. In 1947 the corresponding percentages were: local authority securities, 26.4 per cent.; loans on mortgage, 15.2 per cent.; Government securities, 46.6 per cent.; and loans on policies, 4.0 per cent.
IN terms of the Accident Insurance Companies Act, 1908, accident-insurance policies may be issued by any association, whether incorporated or not, provided such association is not established under any Act relating to friendly societies. The principal classes of accident insurance transacted in New Zealand are as follows:—
Personal accident, covering accident, sickness, &c.;
Employers' liability under statutory or common law;
Motor-vehicle insurance, comprehensive and compulsory third-party risks cover.
Other important classes of accident-insurance policies are in respect of plate-glass insurance and fidelity-guarantee insurance.
Information relating to cash deposits required from companies transacting accident-insurance business is contained in the next subsection, which deals with the cognate subject of fire insurance.
REVENUE AND EXPENDITURE.—The number of insurance offices transacting accident business in New Zealand in 1945 was 61, the head offices of the companies concerned being domiciled as follows: Great Britain, 23; Australia, 12; and New Zealand, 26.
Of the New Zealand offices only 10, including the State Accident Insurance Office, may be stated to be competitive in the ordinary sense of the terra, the remainder having been formed by trade associations, &c., on a more or less co-operative basis. In the main an office of this latter type conducts one class of accident-insurance business only (according to the nature of the association with which it is connected)—e.g., employers' liability insurance, motor-vehicle insurance.
Premium receipts have risen in each succeeding year since 1942. The greatest increase was shown in the 1947 total, winch is £645,479, or 19.7 per cent. in excess of 1946. Some 70 per cent. of this amount is accounted for by motor-vehicle premiums, and the remaining 30 per cent. is spread among the other classes of business. Claims in 1947 were £465,736, or 28.0 per cent. greater than in 1946, approximately 75 per cent. of the increase being motor-vehicle claims. Expenses other than claims totalled £1,328,857 in 1947, as against £1,175,308 in 1946. Taxation expenditure totalled £227,589 in 1946, and decreased to £220,073 in 1947. The excess of premium receipts over total expenditure was £455,619 in 1947, £429,425 in 1946, and £199,040 in 1945.
| Year. | Number of Offices. | Revenue. | Expenditure. | ||||||
|---|---|---|---|---|---|---|---|---|---|
| Premiums. | Other Revenue. | Total.* | Claims. | Commission. | Salaries. | Other Expenses | Total.* | ||
* Excluding unexpired risks reserves. | |||||||||
| £ | £ | £ | £ | £ | £ | £ | £ | ||
| 1937 | 57 | 12,125,207 | 98,136 | 2,223,343 | 1,428,783 | 261,656 | 239,089 | 205,503 | 2,135,031 |
| 1938 | 58 | 2,507,096 | 99,155 | 2,606,251 | 1,559,322 | 305,934 | 256,500 | 214,557 | 2,336,313 |
| 1939 | 58 | 2,711,438 | 108,164 | 2,819,602 | 1,518,035 | 300,901 | 270,193 | 303,268 | 2,392,397 |
| 1940 | 58 | 2,550,127 | 91,070 | 2,641,197 | 1,344,529 | 277,819 | 270,583 | 411,830 | 2,304,761 |
| 1941 | 58 | 2,510,542 | 94,611 | 2,605,153 | 1,221,722 | 261,716 | 266,791 | 477,862 | 2,228,091 |
| 1942 | 58 | 2,280,671 | 110,444 | 2,391,115 | 1,093,874 | 242,175 | 244,135 | 484,806 | 2,064,990 |
| 1943 | 58 | 2,578,169 | 101,822 | 2,679,991 | 1,307,259 | 253,610 | 254,187 | 476,709 | 2,291,765 |
| 1944 | 59 | 2,614,588 | 103,429 | 2,718,017 | 1,345,519 | 275,526 | 281,514 | 529,748 | 2,432,307 |
| 1945 | 60 | 2,851,503 | 109,897 | 2,961,400 | 1,545,468 | 311,405 | 315,110 | 480,480 | 2,652,463 |
| 1946 | 60 | 3,270,989 | 107,634 | 3,378,623 | 1,666,256 | 349,778 | 359,236 | 466,294 | 2,841,564 |
| 1947 | 61 | 3,916,468 | 120,820 | 4,037,288 | 2,131,992 | 420,013 | 402,918 | 505,926 | 3,460,849 |
An interesting review of the expenses incurred in transacting accident insurance is contained in the table following. The fluctuations over a period of five years are shown in the form of percentages of revenue to expenditure under various heads.
| Year. | Ratio per Cent. of— | ||||||
|---|---|---|---|---|---|---|---|
| Claims to Premiums. | Commission to Premiums. | Salaries to Premiums. | Other Expenses to Premiums. | Total Expenses (other than Claims) to Premiums. | Total Expenditure to Premiums. | Total Expenditure to Total Revenue. | |
| 1943 | 50.70 | 9.84 | 9.86 | 18.49 | 38.19 | 88.89 | 85.51 |
| 1944 | 51.46 | 10.54 | 10.77 | 20.26 | 41.57 | 93.03 | 89.49 |
| 1945 | 54.20 | 10.92 | 11.05 | 16.85 | 38.82 | 93.02 | 89.57 |
| 1946 | 50.94 | 10.69 | 10.98 | 14.26 | 35.93 | 86.87 | 84.10 |
| 1947 | 54.44 | 10.72 | 10.29 | 12.92 | 33.93 | 88.37 | 85.72 |
The ratio of claims to premiums receded each year from a peak of 67.23 per cent. in 1937 to 47.96 per cent. in 1942, the latter figure being the lowest recorded since 1921. With the exception of 1946, when there was an appreciable fall, the movement since 1942 has been upwards, and the 1947 ratio is the highest since 1939. The drop in 1946 was clue to the fact that premiums increased to a much greater extent than claims, the only class to show a fall in claims being employers' liability. Working-expenses (excluding taxation) amounted to £810,242 in 1945, £928,222 in 1946, and £1,084,041 in 1947. The ratio of working expenses to premium income was 28.41 per cent. in 1945, 28.38 per cent. in 1946, and 27.68 per cent. in 1947. As will be apparent from the increases in the figures of working-expenses, the decline in the expense ratio was the result of the increase in premium income.
ANALYSIS OF PREMIUMS AND CLAIMS.—In the next table, particulars of premiums and claims for the three main classes of accident insurance are given for the last five years. It will be noticed that there is an apparent discrepancy between the totals of premiums and claims as shown heroin and the figures already quoted. This is accounted for by the fact that, in order to arrive at the net financial results of the year's operations, it is necessary to take into account reinsurance transactions and up to this stage of the discussion premiums and claims have been taken at the net figure. Reinsurance effected outside New Zealand is not taken into account in the figures presented below.
| Year. | Employers' Liability. | Personal Accident. | Motor-vehicle. | Other Forms. | Totals. |
|---|---|---|---|---|---|
| £ | £ | £ | £ | £ | |
| Premiums | |||||
| 1943 | 1,328,097 | 185,616 | 932,168 | 138,470 | 2,584,351 |
| 1944 | 1,310,234 | 197,170 | 965,371 | 156,386 | 2,629,161 |
| 1945 | 1,451,896 | 224,249 | 1,012,419 | 178,425 | 2,866,989 |
| 1946 | 1,604,195 | 265,924 | 1,192,164 | 265,764 | 3,328,047 |
| 1947 | 1,695,239 | 307,135 | 1,650,924 | 328,258 | 3,981,556 |
| Claims | |||||
| 1943 | 746,106 | 65,238 | 432,460 | 43,188 1,286,992 | |
| 1944 | 771,493 | 62,553 | 470,180 | 30,015 | 1,334,241 |
| 1945 | 788,761 | 78,363 | 534,423 | 38,687 | 1,440,234 |
| 1946 | 765,354 | 90,637 | 742,220 | 58,098 | 1,656,309 |
| 1947 | 866,085 | 97,590 | 1,060,152 | 65,216 | 2,089,043 |
Compared with 1946, the 1947 totals are greater, gross premiums by £653,509, or 19.64 per cent., and gross claims by £432.734, or 26.13 per cent. Premiums increased on account of employers' liability insurance by £91,044 (5.68 per cent.), personal accident insurance by £41,211 (15.50 per cent.), and motor-vehicle insurance by £458,760 (38.48 per cent.). Employers' liability claims rose by £100,731 (13.16 per cent.), personal accident claims by £6,953 (7.67 per cent.), and motor-vehicle claims by £317,932 (42.84 per cent.).
Reducing the figures for each of the last three years to a percentage basis, the following results are arrived at.
| Class of Insurance. | Claims to Premiums. | Class of Premium to total Premiums. | Class of Claim to Total Claims. | ||||||
|---|---|---|---|---|---|---|---|---|---|
| 1945. | 1946. | 1947. | 1945. | 1946. | 1947. | 1945. | 1946. | 1947. | |
| Per Cent. | Per Cent. | Per Cent. | Per Cent. | Per Cent. | Per Cent. | Per Cent. | Per Cent. | Per Cent. | |
| Employers' liability | 54.33 | 47.72 | 51.09 | 50.64 | 48.20 | 42.58 | 54.77 | 46.21 | 41.46 |
| Personal accident | 34.94 | 34.08 | 31.78 | 7.82 | 7.99 | 7.71 | 5.44 | 5.47 | 4.67 |
| Motor-vehicle | 52.79 | 62.26 | 64.22 | 35.32 | 35.82 | 41.47 | 37.10 | 44.81 | 50.75 |
| Other forms | 21.68 | 21.86 | 19.87 | 6.22 | 7.99 | 8.24 | 2.69 | 3.51 | 3.12 |
| All classes | 50.24 | 49.77 | 52.47 | 100.00 | 100.00 | 100.00 | 100.00 | 100.00 | 100.00 |
MOTOR-VEHICLES INSURANCE (THIRD-PARTY RISKS).—The Motor-vehicles Insurance (Third-party Risks) Act, 1928, requires owners of motor-vehicles to insure against their liability to pay damages on account of the death of or bodily injury to another person. The payment of the insurance premiums is made annually to Deputy Registrars of Motor-vehicles at the same time as the annual licence fee is paid under the Motor-vehicles Act. Owners of motor-vehicles are required to nominate each year the insurance company with which the contract of insurance is to be made, and the contract is deemed to be complete on the payment of the premium.
Premium rates were reduced during the war as a result of the decrease in claims brought about by the restricted use of motor-vehicles. The relaxation of controls was followed by a rise in premium rates for most classes of motor-vehicles. The 1949–50 schedule includes the following: Trailers, 1s.; tractors, traction-engines, 3s.; motorcycles, £1; private motor-cars, £1 5s.; private motor-cars used wholly or in part for the purpose of trade or business, £2; motor-vehicles (other than trailers and motorcycles) used by fire-brigades, 10s.; hearses, ambulances, &c., £1; trade motors, £2 5s.; manufacturers' and dealers' motor-vehicles, £1 10s.; omnibuses, from £16 to £18 (according to seating-capacity); service-cars from £5 to £6 (according to seating capacity); rental cars, £4 10s.; contract vehicles used to carry employees to or from work, or children to or from school, £1 5s.; private and public motor-cabs, £7 10s. and £15 respectively.
The liability of any insurance company under any contract under the Act is limited to £2,000 in respect of any passenger in the motor-vehicle concerned, and to £20,000 for all claims made by or in respect of passengers. Otherwise there is no limit as to amount.
The liability of the company does not extend to indemnify the owner against any claim made in respect of death of or of injury suffered by any relative of the owner, by any person in the service of the owner at the time of the accident, or by a passenger. The indemnity does, however, cover the case of a passenger for hire in a vehicle plying for hire or carrying passengers for hire.
The following particulars give the experience of the last five years, with a summary covering the ten years to 30th June, 1948. It should be noted that the figures for claims do not represent the amount paid during each year, but refer to accidents happening during each particular period. It should also be noted that the claims figures include amounts on account of the estimated liability in respect of claims still outstanding at 30th June, 1948, and are therefore provisional only. Claims are frequently the subject of lengthy litigation, and until such time as they are finally settled the estimated liability is taken into account. Experience has shown that the insurance companies usually overestimate this liability, and the figures when finalized, at least for the two latest years, may be expected to be considerably less than the amounts now given.
| — | Registration Year ended 30th June— | Total for Ten Years to 30th June 1948. | ||||
|---|---|---|---|---|---|---|
| 1944. | 1945. | 1946. | 1947. | 1948. | ||
| £ | £ | £ | £ | £ | £ | |
| Premiums received | 323,453 | 304,853 | 318,728 | 364,874 | 422,613 | 3,780,295 |
| Claims paid out and estimated liability in respect of claims outstanding at 30th June, 1948 | 194,381 | 256,206 | 272,402 | 424,656 | 512,321 | 2,938,015 |
| Ratio per cent. of claims paid and outstanding to premiums | 60 | 84 | 86 | 116 | 121 | 78 |
IN the legislation dealing with insurance four separate classes of fire-insurance offices are distinguished—namely: (1) Local insurance companies established within the limits of New Zealand; (2) foreign insurance companies established beyond New Zealand; (3) United Kingdom offices similarly established; and (4) mutual fire-insurance associations. To these may be added the State Fire Insurance Office, established under a separate Act of Parliament.
Part XIV of the Companies Act, 1933, provides for the incorporation with limited liability of local insurance companies formed for the insurance of property other than that of shareholders. Such a company requires a paid-up capital of £50,000 intact, and if the amount of paid-up capital falls below this sum the company may not carry on insurance business except with unlimited liability. Insurance companies established or incorporated overseas require to have a like paid-up capital intact. Part II of the Insurance Companies Act, 1940, provides that, in the case of an insurance company of doubtful solvency, inspectors may be appointed to investigate and report on the affairs of the company. Mutual associations are referred to specially at a later stage in this subsection.
DEPOSITS.—Until the passing of the Insurance Companies Act, 1940, no deposit was required from an insurance company incorporated in New Zealand in respect of fire and accident insurance business, unless the company acted merely as an agent for overseas underwriters, or had, since 1933, commenced motor-vehicles third-party risks insurance business. Part I of this Act provides that any New Zealand company which, after the passing of the Act, commences in New Zealand any of the specified classes of business, must deposit with the Public Trustee in money the following amounts: In respect of fire insurance, £22,500; employers' liability insurance, £22,500; and all other classes (except motor-vehicles third-party risks insurance), £5,000. A New Zealand company which, at the commencement of the Act, was carrying on any of the classes of business referred to above was required to deposit cash or approved securities to the value of £1,000, together with a further £1,000 for each complete £2,500 of premium income derived from each class of business during its last financial year, Provision is made for revision of amount of deposit consequent on increase or decrease in business. The maximum deposit is that which would be paid by a newly established company.
The maximum deposits of New Zealand companies are now the same as those required from British companies commencing business in New Zealand after the passing of the Insurance Companies Deposits Act, 1921–22, and its amendment of 1922. The amending Act also provides that a foreign company, before commencing business in New Zealand, must deposit in money the sum of £50,000, which covers all classes of business other than life or marine.
Since 1927, agents operating in New Zealand on behalf of overseas underwriters have been required to make deposits similar in amount to those specified for British companies under the principal Act of 1921–22.
The Finance Act, 1933 (No. 2), required any company thereafter undertaking business in terms of the Motor-vehicles Insurance (Third-party Risks) Act, 1928, to deposit the sum of £10,000. This requirement is, in effect, extended by the Insurance Companies Act, 1940, under which every company undertaking this class of business must, unless it has made the deposit required by the Finance Ant, deposit £1,000, together with £1,000 for each complete £2,500 of premium income from such business. The maximum deposit is £10,000.
Life and marine businesses are not affected by the provisions mentioned in the preceding paragraphs.
The capital amount of deposits held by the Public Trustee as at 31st March, 1948, under the Insurance Companies' Deposits Act on behalf of 61 companies was £1,701,660. The interest earned on these deposits is payable at regular intervals to the depositing companies.
Statistics of fire insurance are collected annually by the Census and Statistics Department. For 1947, statistics were collected from 45 offices carrying on business in New Zealand. The head offices of these were distributed as follows: Great Britain, 24; New Zealand, 14; Australia, 6; United States of America, 1.
LIABILITIES AND ASSETS.—The following table indicates generally the extent to which fire-insurance offices have funds available to meet losses and liabilities. Funds of life departments are added for completeness, but by the Life Insurance Act, 1908 (which follows the provisions of the Imperial statute on the subject), life funds must be accounted for separately, and form a security for life-policy holders which is not available for other classes of insurance transacted. The amount of funds (other than life) in New Zealand and elsewhere is, it will be seen, approximately £550,000,000.
| — | 1947. | 1946 (Totals). | 1945 (Totals). | ||
|---|---|---|---|---|---|
| Overseas Companies. | Local Office | Totals. | |||
| £ | £ | £ | £ | £ | |
| Paid-up capital | 38,256,899 | 3,765,558 | 42,022,45 | 41,927,009 | 39,187,597 |
| Reserves | 335,606,110 | 14,828,719 | 350,434,829 | 316,135,164 | 303,722,082 |
| Other liabilities | 152,387,496 | 4,759,452 | 157,146,948 | 136,910,884 | 130,072,082 |
| Totals | 526,250,505 | 23,353,729 | 519,604,234 | 494,973,957 | 472,981,761 |
| Life funds | 937,682,154 | 23,804 | 937,705,958 | 888,526,165 | 834,294,572 |
| Total liabilities (and assets) | 1,463,932,659 | 23,377,533 | 1,487,310,192 | 1,383,499,222 | 1,307,276,333 |
The following table gives the amount of assets in New Zealand as at the end of each of the last three years classified under various heads. The figures given include all investments in New Zealand securities and do not relate merely to the assets held by the New Zealand branches of the companies concerned.
| Assets in New Zealand. | 1945. | 1946. | 1947. |
|---|---|---|---|
| £ | £ | £ | |
| House and landed property | 1,220,026 | 1,248,827 | 1,278,800 |
| New Zealand Government securities | 8,203,663 | 7,692,376 | 7,889,340 |
| New Zealand local-authority securities | 1,081,576 | 1,040,232 | 994,085 |
| Mortgages, &c. | 146,809 | 151,736 | 155,654 |
| Outstanding premiums | 517,064 | 645,827 | 811,387 |
| Cash and other assets in New Zealand | 3,723,578 | 4,073,795 | 4,831,721 |
| Total New Zealand assets | 14,892,716 | 14,852,793 | 15,960,987 |
SUMMARY OF BUSINESS.—New and renewal business increased, in comparison with the previous year, by £120,383,049 (154 per cent.) in 1946 and by £145,747,891 (16.2 per cent.) in 1947. This would appear to be the result of increases in insurance cover intended to meet rising replacement costs, and also of the post-war activity in housing construction. The average premium rate fell from 6s. 4d. per £100 of cover in 1945 to 6s. 1d. in 1946 per £100 of cover, with a further fall to 5s. 11d. in 1947. As a result gross premium receipts rose by only 10.9 and 13.2 per cent. respectively.
| — | 1945. | 1946. | 1947. |
|---|---|---|---|
* Excluding reinsurances accepted from other offices. | |||
| Amounts underwritten | |||
| Gross amount of insurance cover in force in New Zealand on 31st December* | £708,848,516 | £792,810,330 | £926,803,502 |
| Number of policies representing the foregoing* | 878,241 | 897,882 | 951,055 |
| Gross amount of new and renewal business underwritten during year* | £781,329,505 | £901,712,554 | 1,047,460,445 |
| Number of policies representing the foregoing* | 944,301 | 979,504 | 1,036,923 |
| Premiums | |||
| Total gross premiums charged on business (now and renewal) underwritten during year* | £2,482,281 | £2,752,813 | £3,115,582 |
| Percentage of gross premiums to total amount of business underwritten | 6s. 4d. | 6s. 1d. | 5s. 11d. |
| Total premiums (as shown above), less premiums refunded to insured other than to other offices | £2,300,348 | £2,519,396 | £2,851,200 |
| Losses | |||
| Total number of separate fire losses with which offices were concerned | 7,886 | 8,328 | 9,270 |
| Gross losses | £560,329 | £881,504 | £1,705,307 |
| Percentage of gross loss to amount underwritten (new and renewal) during year (as shown above) | 0.07 | 0.10 | 0.17 |
| Percentage of gross loss to total premiums, less refunds to insured (as shown above) | 24.36 | 34.95 | 59.81 |
| Average loss | £71 | £106 | £184 |
The next table shows the position of premium income and fire losses during the eleven years 1937–1947. Premium income increased steadily until 1944, when, as a result of reductions granted in premium rates, a decrease was recorded. Although premium rates were further reduced in the years 1945–47 premium income recorded further increases in each of these three years, as a result of increases in the amount of business transacted. Between 1944 and 1947 fire losses rose steeply, the amount paid in 1947 being swollen by the inclusion of two exceptionally severe fires, the Rongotai wool-store fire of 1946 and the Christchurch department store of 1947. As a result, the 1947 total of fire losses exceeded the 1946 figure by £823,803 (93.5 per cent.).
| Year. | Premium Income. | Fire Losses. | Percentage of Loss to Premium Income. |
|---|---|---|---|
| £ | £ Per Cent. | ||
| 1937 | 1,678,055 | 446,346 | 26.6 |
| 1938 | 1,749,331 | 613,185 | 35.1 |
| 1939 | 1,849,866 | 625,141 | 33.8 |
| 1940 | 1,941,441 | 627,666 | 32.3 |
| 1941 | 2,034,207 | 481,578 | 23.7 |
| 1942 | 2,126,722 | 856,515 | 40.3 |
| 1943 | 2,296,901 | 717,091 | 31.2 |
| 1944 | 2,206,253 | 547,282 | 24.8 |
| 1945 | 2,300,348 | 560,329 | 24.4 |
| 1946 | 2,519,396 | 881,504 | 35.0 |
| 1947 | 2,851,200 | 1,705,307 | 59.8 |
REVENUE AND EXPENDITURE.—A statement of the total revenue and expenditure, both gross and net, of all offices is now given in respect of New Zealand business. The gross reserve for unexpired risks, it should be noted, is calculated on the assumption that it bears the same proportion to gross premium income as does the actual net reserve to the net premium income.
| — | 1945. | 1946. | 1947. | |||
|---|---|---|---|---|---|---|
| Gross. | Net. | Gross. | Net. | Gross. | Net. | |
* The gross figures are inclusive of reinsurance premiums from other offices. | ||||||
| Revenue | £ | £ | £ | £ | £ | £ |
| Reserve to meet unexpired risks as at beginning of year | 1,105,434 | 623,595 | 1,120,645 | 628,580 | 1,252,236 | 686,681 |
| Amount of fire premiums receivable during year* | 2,716,994 | 1,517,026 | 3,000,901 | 1,642,701 | 3,468,375 | 1,898,960 |
| Interest and dividends on stock, mortgages, &c. | 87,189 | 87,189 | 90,203 | 90,203 | 85,407 | 85,407 |
| Rents | 33,309 | 33,309 | 34,170 | 34,170 | 38,103 | 38,103 |
| Other revenue | 2,480 | 2,480 | 61,315 | 61,315 | 20,955 | 20,955 |
| Totals | 3,945,406 | 2,263,599 | 4,307,234 | 2,456,969 | 4,856,728 | 2,730,106 |
| Expenditure | ||||||
| Amount of fire chums incurred during year, including adjustment and other expenses of settlement, hut less salvage | 560,329 | 370,177 | 881,504 | 546,207 | 1,966,002 | 646,661 |
| Fire Hoard levies | 128,782 | 96,343 | 140,632 | 104,217 | 151,827 | 111,835 |
| New Zealand Government taxes | 503,721 | 369,887 | 372,310 | 297,793 | 295,142 | 252,653 |
| Local-authority rates | 3,415 | 2,740 | 3,660 | 3,061 | 3,396 | 2,755 |
| Licence fees | 5,927 | 5,206 | 5,542 | 5,260 | 5,435 | 5,165 |
| Rents | 25,549 | 23,005 | 26,145 | 23,162 | 25,425 | 22,626 |
| Allowances and commissions on premiums to agents, subagents, and others | 272,313 | 96,904 | 312,280 | 109,483 | 356,173 | 140,067 |
| Salaries and wages, including commissions on profits or bonuses | 306,391 | 274,076 | 344,705 | 309,218 | 373,074 | 333,190 |
| Other expenses of management | 130,223 | 114,449 | 155,451 | 145,145 | 166,396 | 158,635 |
| Reserve to meet unexpired risks as at the end of the year | 1,120,645 | 628,579 | 1,243,888 | 686,681 | 1,422,336 | 782,875 |
| Totals | 3,057,295 | 1,981,366 | 3,486,117 | 2,230,227 | 4,765,206 | 2,456,462 |
The principal items of not revenue and expenditure for 1947 of the two main classes of offices operating in New Zealand are contained in the next table.
| — | Net Revenue. | Net Expenditure. | |||
|---|---|---|---|---|---|
| Premiums. | Total.* | Claims. | Salaries and Commissions. | Total.* | |
* Excluding reserves to meet unexpired risks. | |||||
| £ | £ | £ | £ | £ | |
| Overseas companies | 1,082,093 | 1,107,863 | 456,718 | 245,237 | 984,866 |
| Local companies | 816,867 | 935,562 | 189,943 | 228,020 | 688,721 |
| Totals | 1,898,960 | 2,043,425 | 646,661 | 473,257 | 1,673,587 |
The net premium income and the total not income in 1947 have, in comparison with the corresponding figures for 1946, increased by £256,259 and £215,036 respectively. The excess of net revenue over net expenditure for 1947 amounted to £369,838, as compared with the surpluses of £284,843 and £287,217 for 1946 and 1945 respectively. It should be noted that these figures are exclusive of reserves to meet unexpired risks.
The following table shows the percentage ratio of working-expenses to premium income for the years 1943–47.
It is contended in some quarters that Fire Board levies are not a working-expense, but should be added to the total of fire losses. While this view is not subscribed to in the compilation of the statistics, there is a definite relationship between the items, and this table shows the ratio both inclusive and exclusive of Fire Board levies.
| Items. | 1943. | 1944. | 1945. | 1946. | 1947. |
|---|---|---|---|---|---|
| Per Cent. | Per Cent. | Per Cent. | Per Cent. | Per Cent. | |
| Net working-expenses (excluding taxes) to not premium income | 37.83 | 40.33 | 40.39 | 42.59 | 40.77 |
| Net working-expenses (excluding taxes and Fire Board levies) to net premium income | 31.52 | 33.70 | 34.04 | 36.24 | 34.88 |
| Gross working-expenses (excluding taxes) to gross premium income (including reinsurances from other offices) | 30.63 | 31.82 | 32.12 | 32.72 | 31.12 |
| Gross working-expenses (excluding taxes and Fire Board levies) to gross premium income (including reinsurances from other offices) | 25.84 | 26.78 | 27.38 | 28.03 | 26.74 |
During the first four years shown in the table the ratio increased as a result of reductions in premiums and increased working-costs. In 1947, however, although premium rates were again reduced and working-costs rose still higher, the ratio fell because of the greatly increased premium income.
FIRES AND LOSSES.—The table following gives figures of fires and losses during each of the cloven years, 1936–46. It should be noted that these figures relate to calendar years, and thus differ somewhat from those shown elsewhere, which refer to varying twelve-monthly periods covered by the accounts of the different offices.
The figures quoted herein relate to insured losses only, and in order to arrive at the national property loss by fire some allowance must be made for the uninsured losses. On what is termed a conservative basis, the Inspector of Fire Brigades in his annual report uses the insured-loss figure plus 12½ per cent. for this purpose, and on this assumption New Zealand's property loss through fire in 1946 is estimated to have amounted to £860,000.
| Year. | Separate Fires. | Conflagrations.* | Buildings, etc., affected | Gross Cover.† | Gross Loss. | Ratio of Loss to Cover.† |
|---|---|---|---|---|---|---|
* Included In previous column. For statistical purposes a conflagration is defined as a fire where three or more buildings are affected. † On buildings, &c., affected. | ||||||
| £ | £ | Per Cent. | ||||
| 1936 | 5,318 | 19 | 5,435 | 6,248,835 | 465,804 | 7.45 |
| 1937 | 5,967 | 16 | 6,074 | 8,261,471 | 463,017 | 5.60 |
| 1938 | 5,956 | 21 | 6,087 | 7,004,699 | 596,267 | 8.51 |
| 1939 | 6,373 | 25 | 6,561 | 6,486,979 | 587,032 | 9.05 |
| 1940 | 6,033 | 20 | 6,138 | 8,116,928 | 642,228 | 7.91 |
| 1941 | 6,315 | 10 | 6,384 | 7,880,911 | 714,630 | 9.07 |
| 1942 | 5,406 | 15 | 5,508 | 7,644,555 | 483,707 | 6.33 |
| 1943 | 5,710 | 9 | 5,781 | 8,936,676 | 426,374 | 4.77 |
| 1944 | 6,049 | 10 | 6,099 | 8,817,550 | 477,591 | 5.41 |
| 1945 | 6,519 | 6 | 6,559 | 14,838,243 | 639,372 | 4.31 |
| 1946 | 6,939 | 11 | 7,006 | 12,730,169 | 764,392 | 6.00 |
The next table shows, for each of the four principal urban areas and the remainder of New Zealand, the fires and losses for 1946.
| —– | Separate Fires. | Conflagrations.* | Buildings, &c., affected. | Gross Cover.† | Gross Loss. | Ratio of Lose to Cover.† |
|---|---|---|---|---|---|---|
* Included in previous column. † On buildings, &c., affected. | ||||||
| North Island | £ | £ | Per Cent. | |||
| Auckland urban area | 886 | 886 | 2,692,037 | 60,274 | 2.2 | |
| Wellington urban area | 1,151 | 3 | 1,174 | 3,431,180 | 101,905 | 3.0 |
| Secondary urban areas | 725 | 2 | 731 | 997,580 | 103,091 | 10.3 |
| Remainder of North Island | 1,270 | 1 | 1,281 | 1,673,246 | 186,887 | 11.2 |
| Totals for North Island | 4,032 | 6 | 4,072 | 8,794,043 | 452,157 | 5.1 |
| South Island | ||||||
| Christchurch urban area | 792 | 3 | 804 | 1,159,090 | 121,943 | 10.5 |
| Dunedin urban area | 756 | 759 | 1,161,973 | 62,280 | 5.4 | |
| Secondary urban areas | 441 | 1 | 445 | 364,020 | 20,922 | 5.7 |
| Remainder of South Island | 847 | 1 | 855 | 1,199,338 | 105,798 | 8.8 |
| Totals for South Island | 2,836 | 5 | 2,863 | 3,884,421 | 310,943 | 8.0 |
| Floating, transit, and travelling | 71 | 71 | 51,705 | 1,292 | 2.5 | |
| New Zealand Totals | 6,939 | 11 | 7,006 | 12,730,169 | 764,392 | 6.0 |
Compared with 1945, gross fire loss increases amounting to £46,967 and £92,299 were recorded in 1946 for Wellington and Christchurch urban areas respectively, while in the Auckland and Dunedin urban areas decreases were recorded of £64,158 and £20,992 respectively. Losses in the North Island were £35,897 more than in 1945, and in the South Island the increase was £90,577.
The following table shows the amount of fire-insurance claims paid per head of population (excluding Maoris) during the period 1942–46.
| District. | 1942. | 1943. | 1944. | 1945. | 1946. |
|---|---|---|---|---|---|
* Includes floating, transit, and travelling risks. | |||||
| North Island | s. d. | s. d. | s. d. | s. d. | s. d. |
| Auckland urban area | 7 4 | 4 9 | 6 9 | 9 8 | 4 6 |
| Wellington urban area | 5 7 | 7 0 | 6 4 | 6 5 | 11 5 |
| Secondary urban areas | 3 11 | 5 1 | 7 9 | 6 11 | 12 10 |
| Remainder of North Island | 4 1 | 5 8 | 6 7 | 7 11 | 7 10 |
| Totals for North Island | 5 0 | 5 7 | 6 9 | 7 11 | 8 4 |
| South Island | |||||
| Christchurch urban area | 9 6 | 6 5 | 5 1 | 4 0 | 15 9 |
| Dunedin urban area | 20 10 | 6 10 | 3 3 | 20 0 | 14 6 |
| Secondary urban areas | 3 8 | 4 9 | 13 5 | 11 2 | 6 4 |
| Remainder of South Island | 5 3 | 4 8 | 4 0 | 5 7 | 8 0 |
| Totals for South Island | 8 5 | 5 5 | 5 2 | 8 0 | 10 11 |
| New Zealand Totals | 6 3 | 5 6 | 6 2 | 8 0 | 9 3 |
Causes of Fires.—Particulars regarding causes of fires are contained in the following table which covers the years 1944 to 1946.
| Cause of Fire. | 1944. | 1945. | 1946. | |||
|---|---|---|---|---|---|---|
| Number of Fires. | Amount of Loss. | Number of Fires. | Amount of Loss. | Number of Fires. | Amount of Loss. | |
* Included in various causes from which spread. | ||||||
| £ | £ | £ | ||||
| Electricity | 1,108 | 33,323 | 1,200 | 63,453 | 1,352 | 62,013 |
| Gas | 147 | 3,802 | 155 | 15,199 | 127 | 8,489 |
| Naked lights | 83 | 2,432 | 83 | 1,849 | 89 | 1,760 |
| Defective chimneys and kindred causes | 256 | 20,492 | 241 | 35,602 | 258 | 28,082 |
| Smoking, and careless use of matches | 920 | 26,876 | 889 | 34,850 | 933 | 55,250 |
| Sparks from fireplaces | 2,277 | 30,161 | 2,482 | 39,777 | 2,607 | 46,522 |
| Heating, boiling-down | 117 | 3,580 | 143 | 5,948 | 141 | 5,724 |
| Highly inflammable spirits and materials | 130 | 32,788 | 164 | 26,748 | 211 | 22,703 |
| Incendiarism and arson | 39 | 7,577 | 44 | 31,226 | 31 | 58,861 |
| Outside causes | 156 | 12,816 | 187 | 29,776 | 237 | 62,038 |
| Other causes | 52 | 547 | 42 | 1,827 | 50 | 6,459 |
| Totals, specified causes | 5,285 | 174,394 | 5,630 | 286,255 | 6,036 | 357,901 |
| Fires spread from other buildings* | 58 | 13,181 | 27 | 404 | 56 | 16,118 |
| Floating, travelling, and transit risks | 26 | 981 | 64 | 2,746 | 71 | 1,292 |
| Unknown causes | 738 | 302,216 | 825 | 350,371 | 832 | 405,199 |
| Totals | 6,049 | 477,591 | 6,519 | 639,372 | 6,939 | 764,392 |
It should be remembered that in some instances, more especially where a total or semi-total loss is sustained, the actual cause is a matter of conjecture only. These cases, however, are not numerous as the vast majority of such losses is included in the total of unspecified causes. In 1946 the average loss per fire for specified causes was £59, while the average for the fire where the cause was not specified amounted to £450.
Provision exists for coronial inquiries into fires of suspicious origin, but, as will be seen from page 164, the annual number of such inquests has been small. In 1932, however, a system was instituted whereby extended inquiries are made by the Police Department into all fires where the possibility of incendiarism is not eliminated or where the cause is obscure. The results of such inquiries are considered by a committee consisting of the Commissioner of Police, the General Manager of the State Fire Office, and the Inspector of Fire Brigades, and should the circumstances warrant it a coroner's inquiry is then recommended.
Extent of Loss.—The following table gives particulars of fire losses during the years 1944 to 1946, classified according to the amount of loss. The vast majority of fires cause only minor damage. In 1946 losses of under £100 accounted for 91.8 per cent. of the total number of fires. Corresponding figures for 1944 and 1945 were 91.4 and 91.5 per cent. respectively. The amount of loss in the same category showed an increase of £11,344 (22.4 per cent.) for 1946 when compared with 1944. This is no doubt the result of higher replacement values rather than more severe fires. The number of fires in each of the four component items of the “under £100” loss group recorded increases in 1946 as compared with the preceding year. In categories above this level, however, the numbers of fires have fluctuated from year to year. At the other end of the scale, fires of £5,000 and over normally show only minor variations in numbers, but the amount of loss has differed considerably, and generally the size of these fires has been the principal factor determining the level of the total amount of loss for the year.
| Loss Category. | 1944. | 1945. | 1946. | |||
|---|---|---|---|---|---|---|
| Number of Fires. | Amount of Loss. | Number of Fires. | Amount of Loss. | Number of Fires. | Amount of Loss. | |
| £ £ | £ | £ | £ | |||
| Under 10 | 4,217 | 14,032 | 4,468 | 15,808 | 4,699 | 16,472 |
| 10 and under 25 | 794 | 12,084 | 949 | 14,162 | 1,025 | 15,353 |
| 25 and under 50 | 312 | 10,388 | 346 | 11,737 | 411 | 13,974 |
| 50 and under 100 | 207 | 14,242 | 204 | 14,719 | 234 | 16,291 |
| 100 and under 200 | 154 | 21,127 | 142 | 19,535 | 181 | 25,446 |
| 200 and under 300 | 83 | 20,034 | 92 | 21,681 | 83 | 19,905 |
| 300 and under 400 | 51 | 17,186 | 54 | 18,260 | 62 | 20,858 |
| 400 and under 500 | 40 | 17,381 | 38 | 16,675 | 38 | 16,799 |
| 500 and under 750 | 85 | 50,439 | 83 | 50,137 | 76 | 46,273 |
| 750 and under 1,000 | 24 | 20,647 | 46 | 39,494 | 31 | 26,235 |
| 1,000 and under 2,000 | 49 | 65,058 | 49 | 68,310 | 50 | 66,127 |
| 2,000 and under 3,000 | 16 | 38,597 | 14 | 36,546 | 15 | 36,648 |
| 3,000 and under 4,000 | 3 | 10,665 | 12 | 40,880 | 8 | 28,398 |
| 4,000 and under 5,000 | 1 | 4,648 | 6 | 26,722 | 5 | 22,244 |
| 5,000 and over | 13 | 161,063 | 16 | 244,706 | 21 | 392,969 |
| Totals | 6,049 | 477,591 | 6,519 | 639,372 | 6,939 | 764,392 |
Seasonal Incidence of Fires.—The following table gives particulars of fires and losses, &c., for the years 1944 to 1946 according to the month in which the fire occurred. It will be observed that the greatest number of fires occur in the winter months, the season in which open fireplaces and heating-appliances are used to the greatest extent. The majority of these fires, however, usually result in a very small amount of loss being mainly on account of damage caused to furniture, floor coverings, clothing, &c. Whereas prior to 1945 it could be said that on the average the more serious fires occurred in the drier period of the year (particularly in the first four months), exceptional fires in 1945 and in 1946 have rendered this statement no longer strictly correct.
| Month in which Fire occurred. | 1944. | 1945. | 1946. | |||
|---|---|---|---|---|---|---|
| Number of Fires. | Amount of Loss. | Number of Fires. | Amount of Loss. | Number of Fires. | Amount of Loss. | |
| £ | £ | £ | ||||
| January | 436 | 64,481 | 356 | 34,472 | 473 | 41,083 |
| February | 401 | 42,161 | 320 | 23,109 | 485 | 67,064 |
| March | 389 | 33,633 | 412 | 50,414 | 406 | 58,195 |
| April | 353 | 30,463 | 496 | 41,492 | 405 | 27,942 |
| May | 579 | 37,787 | 563 | 35,929 | 599 | 38,002 |
| June | 666 | 40,665 | 784 | 65,133 | 772 | 30,924 |
| July | 689 | 28,761 | 848 | 65,949 | 795 | 28,521 |
| August | 610 | 28,130 | 660 | 63,214 | 783 | 166,546 |
| September | 575 | 55,651 | 584 | 92,917 | 609 | 102,524 |
| October | 471 | 38,671 | 563 | 30,454 | 550 | 39,663 |
| November | 455 | 37,581 | 470 | 46,628 | 574 | 47,855 |
| December | 425 | 39,607 | 463 | 89,661 | 488 | 116,073 |
| Totals | 6,049 | 477,591 | 6,519 | 639,372 | 6,939 | 764,392 |
The table hereunder shows the daily incidence of fires for the years 1944–46. For classification purposes, a day is regarded as commencing at midnight. On Sundays commercial and household activities are generally more or less confined to essential tasks, and it is not surprising to find that this day shows the lowest fire rate. In the past Monday was traditionally the favourite day for performing the domestic “wash,” and this duty still appears to contribute substantially to Monday's consistent position in the matter of the greatest daily number of fires. The remaining days of the week appear to change position in order of magnitude at random from year to year.
| Day of Week on which Fire occurred. | 1944. | 1945. | 1946. | |||
|---|---|---|---|---|---|---|
| Number of Fires. | Amount of Loss. | Number of Fires. | Amount of Loss. | Number of Fires. | Amount of Loss. | |
| £ | £ | £ | ||||
| Sunday | 795 | 58,936 | 863 | 75,410 | 935 | 76,025 |
| Monday | 913 | 79,105 | 1,054 | 54,949 | 1,155 | 163,832 |
| Tuesday | 898 | 72,152 | 973 | 76,551 | 965 | 106,434 |
| Wednesday | 877 | 49,280 | 953 | 122,975 | 967 | 140,248 |
| Thursday | 827 | 58,008 | 928 | 127,467 | 946 | 113,797 |
| Friday | 828 | 116,599 | 870 | 122,554 | 947 | 71,555 |
| Saturday | 896 | 43,411 | 871 | 58,838 | 983 | 92,200 |
| Not stated | 15 | 100 | 7 | 628 | 41 | 301 |
| Totals | 6,049 | 477,591 | 6,519 | 639,372 | 6,939 | 764,392 |
Class Groups.—Commencing with the year 1940, losses have been classified in broad groups according to the nature of the risk, the figures for the years 1944–46 being presented in the next table. The most numerous group, dwellings, in 1946 represented 82.7 per cent. of the total fires, but only 43.9 per cent. of the total loss. It should he noted that the “contents,” where insured, are included in the various class groups. Consequently, the total for the dwellings group is swollen by the numerous small claims on account of damage to personal effects, &c., the actual building not being affected by the fire in many instances. The miscellaneous risks group also includes those cases where a fire has affected two or more buildings which individually are classifiable into more than one of the other groups shown in the table.
| Class Groups. | 1944. | 1945. | 1946. | |||
|---|---|---|---|---|---|---|
| Number of Fires. | Amount of Loss. | Number of Fires. | Amount of Loss. | Number of Fires. | Amount of Loss. | |
| £ | £ | £ | ||||
| Dwellings, &c. | 5,040 | 189,905 | 5,337 | 198,412 | 5,741 | 335,463 |
| Hotels, &c. | 243 | 13,432 | 258 | 15,619 | 285 | 24,136 |
| Bulk stores, &c. | 20 | 5,435 | 17 | 28,567 | 18 | 2,208 |
| Warehouses | 26 | 2,721 | 19 | 17,723 | 14 | 481 |
| Shops | 231 | 41,685 | 279 | 46,640 | 243 | 25,827 |
| Factories and industrial risks | 225 | 69,616 | 268 | 137,056 | 284 | 151,461 |
| Farm risks and station property (other than dwellings) | 80 | 10,308 | 81 | 8,053 | 86 | 14,255 |
| Theatres and places of public amusement | 29 | 3,930 | 33 | 21,932 | 30 | 11,968 |
| Miscellaneous risks (including unclassified) | 155 | 140,559 | 227 | 165,370 | 238 | 198,593 |
| Totals | 6,049 | 477,591 | 6,519 | 639,372 | 6,939 | 764,392 |
MUTUAL FIRE-INSURANCE ASSOCIATIONS.—Mutual associations are governed by the Mutual Fire Insurance Act, 1908, which allows one hundred or more owners of isolated or farm property to subscribe to a declaration and form themselves into a mutual association to insure against loss by fire to an amount in the aggregate of not less than £40,000. Such associations effect insurance on the premium-note principle, and accept premium notes to be assessed for losses in the proportion of the total amount of such notes. The amount of a member's premium notes limits his liability.
In addition to furnishing returns to the Census and Statistics Department, each mutual association (of which there are three in existence) is required to furnish to the Public Trustee a statement of the condition of the association as at the 31st March in each year. The principal figures for these associations for the last five years appear hereunder.
| Year ending 31st March, | Net Premium Income. | Total Net Income. | Net Losses. | Reserves and Funds. | Assets.* |
|---|---|---|---|---|---|
* Including premium notes. | |||||
| £ | £ | £ | £ | £ | |
| 1944 | 26,127 | 29,174 | 5,964 | 83,531 | 376,431 |
| 1945 | 25,494 | 29,244 | 5,203 | 87,894 | 395,657 |
| 1946 | 26,422 | 29,950 | 2,771 | 94,288 | 429,307 |
| 1947 | 28,846 | 32,627 | 5,789 | 95,109 | 479,159 |
| 1948 | 31,433 | 35,064 | 5,970 | 100,772 | 553,881 |
FIRE BRIGADES.—The following table gives particulars of fire brigades (including branches) in New Zealand for each of the last five years.
| Year. | Stations. | Officers. | Men. | Total Personnel. |
|---|---|---|---|---|
| 1944 | 185 | 535 | 2,200 | 2,735 |
| 1945 | 195 | 561 | 2,390 | 2,951 |
| 1946 | 190 | 582 | 2,415 | 2,997 |
| 1947 | 201 | 592 | 2,588 | 3,180 |
| 1948 | 212 | 612 | 2,670 | 3,282 |
STATE LIFE ASSURANCE.—The Life Insurance Department of the New Zealand Government was founded in 1869 at a time when New Zealanders had comparatively poor facilities in regard to life assurance. Payment of all policies with the State Office is guaranteed by the Government. Industrial assurance is not transacted.
The total income of the Department for 1947 was £1,929,781—viz., premium income, £1,311,990; interest, rents, &c., £558,479; annuity purchase-money, £59,312.
During the year 1947 payments (including bonus additions) to the value of £429,125 were made on account of matured policies, and £256,598 was paid out to representatives of deceased policy-holders. Commission totalled £114,762 and other expenses of management £110,445, making the total management expenses £225,207. The ratio of management expenses to total income was 11.67 per cent. and to premium income 17.17 per cent.
Income and expenditure figures of the Government (Life) Insurance Department are now given for each of the five years 1943–47.
| Year. | Premium Income. | Total Income. | Management Expenses. | Total Expenditure. | Ratio of Management Expenses to Total Income. | Ratio of Management Expenses to Premium Income. |
|---|---|---|---|---|---|---|
| £ | £ | £ | £ | Per Cent. | Per Cent. | |
| 1943 | 849,231 | 1,415,677 | 127,601 | 959,148 | 9.01 | 15.03 |
| 1944 | 924,029 | 1,503,515 | 146,486 | 1,038,510 | 9.74 | 15.85 |
| 1945 | 996,049 | 1,561,670 | 166,415 | 1,172,985 | 10.66 | 16.71 |
| 1946 | 1,126,456 | 1,705,862 | 206,868 | 1,103,748 | 12.13 | 18.36 |
| 1947 | 1,311,990 | 1,929,781 | 225,207 | 1,204,735 | 11.67 | 17.17 |
Figures showing the progress of the Department are contained in the next table. Annuities are excluded.
New business for the year 1947 amounted to 11,510 policies assuring the sum of £7,052,219, the annual premiums thereon being £171,170. Compared with the year 1946 the sum assured recorded an increase of £540,992 (8.3 per cent.) and the number-of policies issued was greater by 324.
| Year. | New Business. | Policies discontinued. | Policies in Force at End of Year. | ||||||
|---|---|---|---|---|---|---|---|---|---|
| Number of Policies. | Sum assured. | Annual Premiums. | Number. | Sum assured. | Annual Premiums. | Number. | Sum assured. | Annual Premiums. | |
| £ | £ | £ | £ | £ | £ | ||||
| 1943 | 5,111 | 2,674,836 | 66,330 | 3,491 | 1,247,610 | 28,148 | 97,895 | 34,815,381 | 840,241 |
| 1944 | 7,075 | 3,842,696 | 83,609 | 3,641 | 1,339,369 | 32,208 | 101,329 | 37,318,708 | 891,643 |
| 1945 | 8,786 | 4,923,809 | 108,892 | 3,659 | 1,404,660 | 39,546 | 106,456 | 40,837,857 | 960,989 |
| 1946 | 11,180 | 6,511,227 | 144,377 | 3,989 | 1,661,977 | 41,340 | 113,653 | 45,687,107 | 1,064,026 |
| 1947 | 11,510 | 7,052,219 | 171,170 | 4,002 | 1,740,284 | 44,261 | 121,161 | 50,999,042 | 1,190,935 |
The Department's balance-sheet as at 31st December, 1947, showed that the total assets amounted to £15,624,995, and were invested as shown in the following statement, which also gives the distribution of the assets at the end of the two preceding years for purposes of comparison.
| Class of Investment. | Amount. | Proportion to Totals. | ||||
|---|---|---|---|---|---|---|
| 1945. | 1946. | 1947. | 1945. | 1946. | 1947. | |
* Mainly due and overdue premiums and interest, and interest accrued. | ||||||
| £ | £ | £ | Per Cent. | Per Cent. | Per Cent. | |
| Mortgages on freehold property | 4,498,268, | 4,212,114 | 4,042,606 | 31.68 | 28.44 | 25.87 |
| Loans on policies | 835,349 | 770,555 | 748,514 | 5.88 | 5.20 | 4.79 |
| Government securities | 4,741,918 | 5,934,244 | 7,210,096 | 33.40 | 40.07 | 46.14 |
| Local authority securities | 2,939,669 | 2,838,342 | 2,723,760 | 20.71 | 19.16 | 17.43 |
| Landed and house property | 507,613 | 495,386 | 493,020 | 3.58 | 3.34 | 3.16 |
| Miscellaneous assets* | 279,418 | 255,794 | 313,624 | 1.97 | 1.73 | 2.01 |
| Cash in hand, on current account, and on deposit | 394,246 | 304,608 | 93,375 | 2.78 | 2.06 | 0.60 |
| Totals | 14,196,481 | 14,811,043 | 15,624,995 | 100.00 | 100.00 | 100.00 |
STATE ACCIDENT INSURANCE.—In the year 1901 the Government (Life) Insurance Department opened an Accident Branch. On 1st January, 1925, the accident business was transferred to the control of the State Fire Insurance Office. General accident business was undertaken, but the branch was opened more especially to conduct insurance under the Workers' Compensation Act. In recent years other forms of accident insurance contributed on an increasing scale to the premium income of the office. The main classes transacted are employers' liability, personal accident, public risk, motor comprehensive, third-party risks, plate glass, and fidelity guarantee.
As from 1st April, 1949, the State Accident Insurance Office has a virtual monopoly of workers' compensation insurance, the only exceptions being the business transacted by certain specified mutual insurance companies. This is provided for by the Workers' Compensation Amendment Act, 1947. This Act also provides for a special account termed the Employers' Liability Account to winch all premiums and other moneys payable under the Act are to be credited and from which all claims and expenditure connected therewith are to be paid. In the event of the account showing a deficiency at any time, the Minister of Finance may advance from the Consolidated Fund such sums as may be necessary to meet the deficiency, or recourse may be had to borrowing.
A summary of revenue and expenditure during the last five years is contained in the following table.
| Year. | Revenue.* | Expenditure.* | Ratio of Claims to Premiums. | Total Assets. | |||
|---|---|---|---|---|---|---|---|
| Premiums. | Total. | Claims. | Working-expenses. | Total. | |||
* Excluding reserves for unexpired risks. | |||||||
| £ | £ | £ | £ | £ | Per Cent. | £ | |
| 1943 | 384,035 | 406,623 | 193,816 | 43,656 | 303,379 | 50.47 | 1,006,522 |
| 1944 | 298,250 | 324,109 | 202,552 | 51,807 | 338,977 | 67.91 | 1,024,826 |
| 1945 | 335,690 | 364,017 | 238,459 | 61,346 | 334,274 | 71.04 | 1,078,779 |
| 1946 | 341,304 | 367,940 | 212,914 | 70,917 | 336,090 | 62.38 | 1,027,712 |
| 1947 | 420,028 | 447,854 | 292,304 | 81,905 | 407,100 | 69.59 | 1,099,225 |
The 1947 premium income is the highest yet recorded by the State Accident Insurance Office, being £78,724 (23 per cent.) in excess of the 1946 total, and £35,993 (9 per cent.) in excess of the 1943 total. The 1943 total, the highest previously recorded, included special insurance effected as a result of Allied war activities within New Zealand.
The ratio of claims to premiums, which dropped from 71.0 per cent. in 1945 to 624 per cent. in 1946, rose to 69.6 per cent. in 1947, mainly on account of motor-vehicle business.
The ratio of working-expenses to premium income in 1947 was 19.5 per cent. compared with 20.8 per cent. in 1946.
The sum of £10,000 from the 1947 surplus was added to the Re-insurance Reserve, and during 1947 £24,623 was disbursed in the form of bonus rebates and sums accrued under profit-sharing schemes.
The total assets at 31st December, 1947, amounted to £1,099,225, including £669,290 invested in Government securities. Reserves and funds totalled £777,800.
STATE FIRE INSURANCE.—The New Zealand State Fire Office was the first competitive State fire-insurance office in the world, and opened for business on 4th January, 1905, with a borrowed capital (long since repaid) of £2,000. The income of the office in its first year was £13,135. In 1917 this had risen to £346,162, and reserves and funds at 31st December, 1947, amounted to £1,429,731.
The premium income figures in the following table include amounts which are returned to policy-holders by way of bonus rebates. At the end of 1936 the bonus rebates then in existence were converted into permanent premium rate reductions, a new series of bonus rebates being instituted at the same time. On 1st March, 1944, premium rates on wooden buildings were further reduced and, in addition, bonus rebates were once more converted into permanent premium rate reductions, a further series of 10 per cent. on wooden risks and 15 per cent. on brick risks being granted at the same time. This series was increased on 1st November, 1917, to 20 per cent. on renewals on both wooden and brick risks.
Apart from claims, and the bonus rebates which amounted to £34,059, the principal items of expenditure for 1947 were as follows: working-expenses, £74,616; Fire Hoard contributions, £16,824; income-tax, £77,476; and social security tax, £11,659.
| Year. | Net Premium Income. | Total Net income.* | Net Losses. | Accumulated Funds. | Assets. |
|---|---|---|---|---|---|
* Excluding reserve for unexpired risks. † Marine insurance business is included. | |||||
| £ | £ | £ | £ | £ | |
| 1943 | 225,037 | 291,019 | 25,018 | 1,266,500 | 1,592,216 |
| 1944 | 183,827 | 213,606 | 38,110 | 1,268,613 | 1,593,996 |
| 1945 | 203,494 | 267,187 | 36,900 | 1,300,785 | 1,617,766 |
| 1946 | 228,429 | 353,318 | 58,483 | 1,375,398 | 1,646,601 |
| 1947† | 262,658 | 346,162 | 47,194 | 1,429,731 | 1,322,733 |
The ratio of claims to premiums in 1947 was 18.0 per cent., as compared with 25.6 per cent. in 1946; the working-expenses (including Fire Board levies) ratio was 34.8 per cent., against 38.6 per cent., while the ratio of taxes to total income rose from 24.6 per cent. in 1946 to 25.8 per cent. in 1947.
EARTHQUAKE AND WAR DAMAGE INSURANCE.—The War Damage Act, 1941, and its amendment of 1942 made provision for the insurance of property against damage suffered as a result of the Second World War. The Act was brought into operation by Proclamation as from 19th December, 1941, but the application of its compulsory provisions was deferred until 1st March, 1942. By virtue of the Earthquake Damage Regulations 1944, any property insured against war damage under the War Damage Act was, as from 1st March, 1944, deemed to be insured to the same amount against earthquake damage also.
The Earthquake and War Damage Act, 1944, which came into force on 1st January, 1945, follows on the same general lines as the War Damage Act, which was repealed. It also revoked the Earthquake Damage Emergency Regulations. A brief outline of the provisions of the new Act is as follows:—
The Act established within the Public Account a separate account called the Earthquake and War Damage Fund, into which are paid all moneys receivable under the Act. The War Damage Fund established under the original Act was abolished, and all moneys standing to the credit of that Fund were transferred to the new account.
The Fund is administered by the Earthquake and War Damage Commission, consisting of the Minister of Finance as Chairman, the Secretary to the Treasury, the State Eire Insurance General Manager, and four other members.
The Act provides for both compulsory and voluntary insurance against earthquake and war damage. Under the compulsory provisions all property insured to any amount under any contract of fire insurance with an insurance company is deemed to be insured to the same amount against earthquake damage and war damage. Under the voluntary provisions of the Act, any person having an insurable interest in any property may make application to the Commission for earthquake or war damage insurance, and a contract may be made for the insurance of any property that is not insured under the compulsory section of the Act, or for the insurance to an additional amount of any property that is so insured. Premiums at the prescribed rates (originally 5s. per £100 of insurance cover, reduced to 1s. per £100 of cover as from 1st March, 1944), are collected by the insurance companies and paid into the Fund. Up to 28th February, 1944, as a war contribution, all insurance companies gave their services, with attendant administrative out-of-pocket expenses, free of all cost to the Fund. As, however, the scheme, on account of the inclusion of earthquake insurance, ceased to be purely a war measure on 1st March, 1944, a commission of 2½ per cent. has been allowed on all premiums collected from that date.
The Act makes provision for advances to be made from the Consolidated Fund if at any time the amount in the Earthquake and War Damage Fund is not sufficient to meet the claims thereon; or, if in the opinion of the Minister of Finance, the whole or any part of the deficiency cannot be conveniently met from the Consolidated Fund, recourse is to be had to borrowing. All moneys so advanced or borrowed constitute a capital liability to the Consolidated Fund. Under the original Act, which when first introduced covered war damage only, any advances required were to be made from the War Expenses Account.
“Earthquake damage” is defined as damage occurring as the direct result of earthquake or of fire occasioned by or in consequence of earthquake. It also includes damage occurring as the direct result of measures taken under proper authority to avoid the spreading of, or otherwise to mitigate the consequence of, any such damage. In addition to damage occurring as a direct result of action by the enemy, “war damage” includes damage occurring as the direct result of measures taken in combating the enemy or precautionary or preparatory measures taken under proper authority with a view to preventing or hindering any enemy or anticipated enemy action. It also includes accidental damage occurring as the direct result of any explosion or fire which involves any explosives or munitions, &c., required for war purposes.
The following statement gives particulars of the Earthquake and War Damage Fund as from the date of its inception to 31st March, 1948. As stated earlier, the Earthquake and War Damage Fund replaced the War Damage Fund as from 1st January, 1945.
| — | 19th December, 1941, to 31st March, 1944. | 1944–45. | 1945–46. | 1946–47. | 1947–48. |
|---|---|---|---|---|---|
| Income— | £ | £ | £ | £ | £ |
| Premium | 3,911,892 | 320,274 | 365,861 | 410,065 | 494,938 |
| Interest | 74,092 | 99,516 | 104,725 | 94,860 | 129,957 |
| 3,985,984 | 419,790 | 470,586 | 504,925 | 624,895 | |
| Outgo— | |||||
| Claims | 1,011 | 82 | 507 | 1,779 | 7,917 |
| Salaries | 8,784 | 2,042 | 2,035 | 2,162 | 2,493 |
| Discount to insurance offices | 943 | 7,891 | 8,733 | 9,965 | 11,843 |
| Other working-expenses | 2,768 | 1,040 | 1,296 | 2,166 | 1,410 |
| 13,506 | 11,055 | 12,571 | 16,072 | 23,663 | |
| Surplus | 3,972,478 | 408,735 | 458,015 | 488,853 | 601,232 |
| Amount of fund | 3,972,478 | 4,381,213 | 4,839,228 | 5,328,081 | 5,929,313 |
MORTGAGEES' INDEMNITY INSURANCE.—The Mortgagees' Indemnity (Workers' Charges) Act, 1927, provides that when mortgages are presented for stamping an additional stamp duty of 1s., known as a mortgagee's indemnity fee, is to be paid. The indemnity fees are paid into the Consolidated Fund, from which losses incurred by mortgagees through the enforcement of charges under the Workers' Compensation Act are met. A section of the Act definitely absolves the mortgagor from any obligation to insure or keep insured the mortgagee against loss of this nature in respect of any mortgage under the Act.
THE legislation dealing with friendly societies is contained in the Friendly Societies Act, 1909, and its amendments. Provision is made for the registration of all societies and branches with the Registrar of Friendly Societies, and also for the general superintendence by the Government of the administration of the funds of the societies.
A scheme for the extension of State benefits to members of friendly societies, on special terms, was introduced by the Finance Act, 1916, and is now embodied in the National Provident Fund Act, 1926—vide Section 25, Social Security, Pensions, Superannuation, &c.
LODGES AND MEMBERS.—The table following gives the number of registrations (i.e., of friendly societies proper, or lodges, together with benevolent societies, working-men's clubs, &c., registered under the Act) and of lodge members as at 31st December of the years shown.
| Name of order. | Registrations. | Lodge Members. | ||||
|---|---|---|---|---|---|---|
| 1945. | 1946. | 1947. | 1945. | 1946. | 1947. | |
* Membership figures rotate to “actuarial” societies only. | ||||||
| Manchester Unity Independent Order of Oddfellows | 261 | 260 | 259 | 30,179 | 29,103 | 28,769 |
| Independent Order of Oddfellows | 205 | 202 | 199 | 9,613 | 9,355 | 9,036 |
| National Independent Order of Oddfellows | 1 | 1 | 1 | 139 | 138 | 119 |
| British United Order of Oddfellows | 1 | 62 | ||||
| Ancient Order of Foresters | 155 | 152 | 150 | 14,639 | 14,180 | 13,618 |
| United Ancient Order of Druids | 145 | 144 | 144 | 18,061 | 17,677 | 17,261 |
| Independent Order of Rechabites | 67 | 67 | 67 | 4,247 | 4,047 | 3,839 |
| Order of Sons of Temperance | 10 | 10 | 10 | 480 | 469 | 444 |
| Sons and Daughters of Temperance | 1 | 1 | 1 | 111 | 108,108 | |
| Hibernian-Australasian Catholic Benefit Society | 81 | 80 | 79 | 3,779 | 3,752 | 3,736 |
| Protestant Alliance Friendly Society of Australasia | 12 | 12 | 12 | 681 | 654 | 634 |
| Grand United Order of Oddfellows | 14 | 14 | 10 | 378 | 303 | 296 |
| Isolated friendly societies | 68 | 70 | 70 | 653* | 660* | 646* |
| Working-men's clubs | 14 | 14 | 15 | |||
| International Order of Good Templars | 11 | 11 | 11 | |||
| Specially authorized societies | 18 | 19 | 19 | |||
| Totals | 1,064 | 1,057 | 1,047 | 83,022 | 80,446 | 78,506 |
Annual returns of receipts, expenditure, &c., of lodges are required by law. For the year 1947 the Registrar of Friendly Societies received returns from 890 lodges, with an aggregate membership of 78,506 at the end of the year, as compared with 901 lodges and 80,446 members for 1946. During the year 2,467 members were admitted by initiation, &c., and 535 by clearance; 1,958 died, 566 left by clearance, and 3,218 by arrears, &c.
The aggregate membership of lodges increased year by year, reaching a peak in 1930, when the total was 107,167. The economic depression probably accounted for the decrease in each of the following three years, the number at the end of 1933 being 100,237. A series of increases then commenced, the 1930 level being passed in 1936, and by 31st December, 1938, a total of 113,709 had been reached. Each of the succeeding nine years, however, has witnessed a fall in membership, the number at the end of 1947 being 35,203 or 31 per cent., less than in 1938. The various benefits under the Social Security Scheme, particularly medical and hospital benefits (sec Section 25), have no doubt had a considerable effect on the membership of friendly societies. Circumstances arising from the war may also have been a contributing factor.
The statistics given subsequently relate to the lodges (890 in 1947) for which returns were received and tabulated.
MORTALITY AND SICKNESS.—In the following statement of the mortality experience for the last five years no account has been taken of age incidence.
| Year. | Deaths of Members. | Per 1,000 Members at Risk. | Deaths of Members' Wives. | Per 1,000 Members at Risk. |
|---|---|---|---|---|
| 1913 | 1,318 | 14.58 | 385 | 4.26 |
| 1944 | 1,350 | 15.48 | 383 | 4.39 |
| 1945 | 1,305 | 15.41 | 351 | 4.14 |
| 1946 | 1,207 | 14.66 | 383 | 4.65 |
| 1947 | 1,158 | 14.57 | 371 | 4.67 |
The number of members sick during 1947 was 15,883, representing 21 per 100 members at risk. The sickness experienced during the year aggregated 324,038 weeks, equal to 20 weeks 2 days per sick member, and 4 weeks 2 days for each member at risk.
FUNDS OF FRIENDLY SOCIETIES.—The total funds of the societies and branches as at the 31st December, 1947, amounted to £6,419,523, made up as follows:—
| Funds | £ |
|---|---|
| Sick and Funeral Funds | 5,242,722 |
| Surplus Appropriation Funds, &c. | 653,063 |
| Management Funds, goods, &c. | 298,202 |
| Distress, Benevolent Funds, &c. | 225,536 |
| Total | £6,419,523 |
| Assets | £ |
| Investments at interest | 5,888,345 |
| Value of land and buildings | 281,245 |
| Cash not bearing interest | 207,571 |
| Value of goods | 18,528 |
| Other assets | 20,705 |
| Owing by Management Funds | 3,129 |
| Total | £6,419,523 |
The net income from investment credited to Sick and Funeral Funds for 1947 amounted to £221.966, the average rate being £4 7s. 6d. per cent., as against £4 8s. 2d. per cent. in 1946.
There has been over many years a continuous increase in the amount of accumulated funds standing to the credit of friendly societies, the increase in the hut ten years amounting to £1,299,398, or 25 per cent. The average capital per member has also appreciably increased, the gain in the last ten years amounting to £36 8s. 4d. (80 per cent.). The substantial fall in membership over the last nine years has resulted in outstanding increases being shown for the average capital per member.
| Year. | Total Funds. | Average Capital per Member. |
|---|---|---|
| £ | £ s. d. | |
| 1937 | 5,120,125 | 45 7 1 |
| 1938 | 5,280,472 | 46 8 9 |
| 1939 | 5,407,601 | 49 11 8 |
| 1940 | 5,534,368 | 52 19 9 |
| 1941 | 5,670,757 | 58 12 1 |
| 1942 | 5,790,521 | 63 5 5 |
| 1943 | 5,897,959 | 67 0 4 |
| 1944 | 6,018,831 | 70 14 8 |
| 1945 | 6,135,413 | 73 18 0 |
| 1946 | 6,278,409 | 78 0 11 |
| 1947 | 6,419,523 | 81 15 5 |
The contributions and entrance fees paid to Sick and Funeral Funds in 1947 amounted to £151,069. Divided by the mean number of members, the average for 1917 was £1 18s., as against £1 18s. 2d. for 1946.
The interest and rent received by the lodges and central bodies amounted to £221,966 in 1947, equal to £2 15s. 10d. per member, as against £2 13s. 2d. for 1946.
The amount of sickness benefit paid was £176,642 in 1947, equal to £11 2s. 5d. per member sick and £2 4s. 5d. per member, as against £10 9s. 3d. and £2 5s. 3d. respectively for 1916. Viewing the amount paid in relation to the weeks of sickness, the average benefit per week is found to be 10s. 11d. in 1917, as against 11s. 4d. for 1946.
The funeral benefit paid amounted to £63,478 in 1947, equal to 16s. per member, as compared with 14s. 8d. for 1946.
The total worth of the Sick and Funeral Funds at the beginning of 1947 was £5,122,801, and at the end of the year £5,242,722.
THE law relating to building societies incorporated in New Zealand is contained in the Building Societies Act, 1908, which is a consolidation of earlier legislation, most of which had been operative since 1880. The Assistant Registrar of Companies in each district acts as Registrar of Building Societies. Rules, as well as subsequent alterations thereof, must be certified before registration as conforming to legal requirements—by a revising barrister appointed by the Governor-General for the purpose. No stamp duties are payable on documents made under the Act, or generally in respect of building society transactions.
Building societies are afforded all the powers and rights of an ordinary mortgagee, a description of which is contained in the next section (“Mortgages”). No reconveyance is needed to discharge a mortgage made under the Act, a receipt endorsed being a sufficient discharge for this purpose.
Authority was taken in the National Expenditure Adjustment Act, 1932, to fix by Order in Council the maximum rate of interest payable on deposits with building societies. A schedule of maximum rates payable on these and other deposits fixed by subsequent Orders in Council is given on pages 528–530.
Returns of each society's operations are furnished annually to the Census and Statistics Department.
A distinction is made between permanent and terminating societies. A permanent society is statutorily defined as one which has not by its rules any fixed date or specified result at which it shall terminate, and a terminating society as one which by its rules is to terminate at a fixed date, or when a result specified in its rules is attained. In practice a terminating society, or a group thereof, closes when every member so desiring has obtained a loan. There is a considerable difference between the two types of societies, the terminating society being a purely co-operative institution belonging to and managed by the members, proprietary interests being discouraged by placing a limit to the number of shares (usually ton) that any member may hold in any one group. There is, however, nothing to prevent a member from holding the maximum number of shares in more than one group. In a typical terminating society contributions are at the rate of 1s. per week per share, each share entitling a member in due course to £200 of loan, with a maximum of £1,200. It is these contributions, together with premiums on loans mentioned later, which make up the funds from which loans are made. Loans are made to members alternately (roughly) by ballot and by auction, the latter going for the highest premium offered. Security is required for the loans, which are repaid, free of interest, in 15½ years, a weekly instalment of 2s. 6d. per £100 of loan being necessary to achieve this result. The weekly payment of 1s. per share is continued, usually till the end of the group, but sometimes only until the total contributions paid in, plus profits credited to the shareholder, equal the amount owing on the loan. The shareholder's credit balance is then transferred to extinguish the loan. The profit of the society is derived from premiums on loans sold by auction.
Permanent societies are more in the nature of finance companies, and, while both investors and borrowers must be members, the borrower is frequently merely a nominal member. Investments in a permanent society may be made in either large or small amounts. Capital may be raised by shares with a fixed rate of interest, or subject to dividends varying according to profits. As will be observed from the statistics which follow, terminating societies do not issue capital shares. Bonds, debentures, and overdraft are other methods of financing. The principal object of a permanent society is to lend money at a profit on land and buildings, either freehold or leasehold. Table mortgages are usually adopted, the term of repayment varying from 10 to 20 years.
NUMBER OF SOCIETIES AND SHARES.—The number of societies in existence in 1946–47 was 90, of which 57 were permanent and 33 terminating. The number of permanent societies has shown little variation during the last ten years, but terminating societies have decreased by 11; there has been but little variation, however, since 1939–40.
Permanent Societies.—The following table shows for the years 1942–43 to 1946–47 particulars of the number of permanent societies, the numbers of shares (distinguishing Investing shares from Capital shares), and the number of members holding each class.
| — | 1942–43. | 1943–44. | 1944–45. | 1945–46. | 1946–47. |
|---|---|---|---|---|---|
| Number of societies | 57 | 57 | 57 | 57 | 57 |
| Investing Shares | |||||
| Number of shares | 282,614 | 308,759 | 317,400 | 320,633 | 327,988 |
| Members holding | 18,447 | 19,239 | 20,759 | 22,030 | 22,442 |
| Aggregate value | £2,261,158 | £2,197,617 | £2,318,526 | £2,505,816 | £2,604,868 |
| Capital Shares | |||||
| Number of shares | 617,011 | 621,406 | 622,244 | 622,176 | 632,706 |
| Members holding | 5,785 | 5,752 | 5,709 | 5,685 | 5,934 |
| Aggregate value | £1,569,182 | £1,578,713 | £1,586,828 | £1,588,623 | £1,620,663 |
The average value of each investing share in 1946–47 was £7 18s. 10d., as compared with £7 16s. 3d. five years earlier, and of each capital share £2 11s. 3d., as compared with £2 11s. 0d. in 1941–42.
Terminating Societies.—Although the number of terminating societies has declined since 1934–35, the number of groups has risen considerably, particularly in the last three years. During the last ten years, the number of members has increased by 33,619 (127 per cent.), and the number of shares by 166,376, or 175 per cent. As stated earlier, one person may hold shares in several groups of a terminating society. The next table allows the progress of terminating societies during the years 1942–43 to 1946–47. It should be noted that the information pertaining to shares relates to investing or contributory shares, there being no capital shares in a terminating society.
| — | Societies. | Groups. | Members holding Shares. | Investing Shares. | |
|---|---|---|---|---|---|
| Number. | Value. | ||||
| £ | |||||
| 1942–43 | 34 | 182 | 35,574 | 136,952 | 2,253,368 |
| 1943–44 | 33 | 184 | 37,140 | 147,143 | 2,395,259 |
| 1944–45 | 34 | 195 | 41,241 | 182,360 | 2,551,502 |
| 1945–46 | 34 | 205 | 47,627 | 215,652 | 2,831,593 |
| 1946–47 | 33 | 226 | 60,094 | 260,990 | 3,204,032 |
The average value per share in 1946–47 was £12 5s. 6d., as compared with £18 8s. 1d. five years earlier, the decrease being accounted for by the large increases in the numbers of new shares taken up in recent years.
RECEIPTS AND PAYMENTS.—Following is a summary of receipts and payments for all societies during each of the five years 1942–43 to 1946–47.
| — | 1942–43. | 1943–44. | 1944–45. | 1945–46. | 1946–47. |
|---|---|---|---|---|---|
| Receipts | £ | £ | £ | £ | £ |
| Investors' subscriptions and capital shares | 658,237 | 729,612 | 815,104 | 896,077 | 1,057,137 |
| Advances repaid | 1,319,950 | 1,435,927 | 1,547,762 | 1,631,237 | 1,713,741 |
| Deposits | 1,274,201 | 1,258,028 | 1,302,816 | 1,329,875 | 1,234,362 |
| Interest | 395,456 | 398,372 | 396,109 | 406,957 | 410,315 |
| Other receipts | 174,605 | 265,220 | 228,885 | 301,989 | 414,841 |
| Total receipts | 3,822,449 | 4,087,159 | 4,290,676 | 4,566,135 | 4,830,396 |
| Payments | |||||
| Withdrawals | 358,865 | 486,377 | 441,076 | 357,224 | 407,936 |
| Advances | 1,478,376 | 1,829,655 | 2,018,968 | 2,220,874 | 2,361,330 |
| Expenses of management | 103,774 | 103,398 | 105,406 | 103,508 | 124,670 |
| Deposits repaid | 1,398,543 | 1,216,890 | 1,143,672 | 1,316,050 | 1,241,098 |
| Interest, dividends, &c. | 436,695 | 506,759 | 465,984 | 518,665 | 617,911 |
| Total payments | 3,776,253 | 4,143,079 | 4,175,106 | 4,516,321 | 4,752,945 |
LOANS.—The number and amount of loans at the end of each of the five years quoted were as follows:—
| Year. | Permanent Societies. | Terminating Societies. | Total. | |||
|---|---|---|---|---|---|---|
| Number. | Amount. | Number. | Amount.* | Number. | Amount. | |
* Includes balance owing on premiums on loans. | ||||||
| £ | £ | £ | ||||
| 1942–43 | 14,544 | 8,218,938 | 8,385 | 2,795,522 | 22,929 | 11,014,460 |
| 1943–44 | 14,554 | 8,393,705 | 8,444 | 2,984,487 | 22,998 | 11,378,192 |
| 1944–45 | 14,806 | 8,624,454 | 8,305 | 3,231,901 | 23,111 | 11,856,355 |
| 1945–46 | 14,780 | 8,891,467 | 8,758 | 3,587,970 | 23,538 | 12,479,437 |
| 1946–47 | 14,700 | 9,170,006 | 8,596 | 4,090,934 | 23,296 | 13,260,940 |
The average amount per loan current at the end of each of the five years quoted was:—
| Class. | 1942–43. | 1943–14. | 1944–45. | 1945–46. | 1946–47. |
|---|---|---|---|---|---|
| £ | £ | £ | £ | £ | |
| Permanent societies | 565 | 577 | 583 | 602 | 624 |
| Terminating societies | 333 | 353 | 389 | 410 | 476 |
| All societies | 480 | 495 | 513 | 530 | 569 |
Particulars of loans granted during each of the years 1942–43 to 1946–47 were as follows:—
| Year. | Permanent Societies. | Terminating Societies. | |||||
|---|---|---|---|---|---|---|---|
| By Ballot. | By Auction. | ||||||
| Number. | Amount. | Number. | Amount. | Number. | Amount. | Premiums. | |
| £ | £ | £ | £ | ||||
| 1942–43 | 1,795 | 881,233 | 496 | 290,051 | 389 | 251,273 | 70,989 |
| 1943–44 | 2,008 | 1,213,990 | 566 | 313,432 | 405 | 254,643 | 83,372 |
| 1944–45 | 2,148 | 1,402,788 | 567 | 333,096 | 565 | 350,211 | 132,433 |
| 1945–46 | 2,260 | 1,484,274 | 620 | 381,623 | 668 | 392,756 | 128,831 |
| 1946–47 | 2,421 | 1,548,873 | 647 | 417,523 | 853 | 534,004 | 152,875 |
The average premium on loans auctioned declined progressively from £27.6 per cent. in 1931–32 to £20.0 per cent. in 1935–36 in sympathy with the downward trend in interest rates. In 1946–47 and 1945–46 the average premiums on these loans were respectively £28.6 per cent. and £32.8 per cent. This is an apparent anomaly in view of the fact that the general level of interest rates has fallen since 1935–36. The explanation is that the average term over which loan repayments are spread has been increased by about five years during this period.
Commencing with the year 1937–38, statistics of building societies were extended to include a classification of loans into (1) loans granted to finance the erection of new dwellings, and (2) loans granted to finance the purchase of dwellings already built. For the purposes of the statistics a new dwelling is deemed to include one which has been built by the borrower within twelve months preceding the granting of the loan. Particulars for 1946–47, with totals for earlier years, are as follows:—
| — | Too Finance the Erection of New Dwellings. | To Finance the Purchase of Dwellings already Built. | For other and unspecified Purposes. | Totals. | ||||
|---|---|---|---|---|---|---|---|---|
| No. | Amount. | No. | Amount. | No. | Amount. | No. | Amount. | |
| £ | £ | £ | £ | |||||
| Permanent societies | 362 | 351,239 | 1,274 | 894,424 | 785,303,210 | 2,421 | 1,548,873 | |
| Terminating societies— | ||||||||
| By ballot | 96 | 69,980 | 290 | 194,895 | 261 | 152,648 | 647 | 417,523 |
| By auction | 175 | 126,393 | 411 | 281,125 | 267 | 126,486 | 853 | 534,004 |
| Totals, all societies— | ||||||||
| 1946–47 | 633 | 547,612 | 1,975 | 1,370,444 | 1,313 | 582,344 | 3,921 | 2,500,400 |
| 1945–46 | 473 | 425,431 | 1,973 | 1,286,413 | 1,102 | 546,809 | 3,548 | 2,258,653 |
| 1944–45 | 306 | 278,317 | 1,917 | 1,328,616 | 1,057 | 479,162 | 3,280 | 2,086,095 |
| 1943–44 | 198 | 170,178 | 2,020 | 1,262,109 | 761 | 349,778 | 2,979 | 1,782,065 |
| 1942–43 | 262 | 215,656 | 1,671 | 878,795 | 747 | 328,106 | 2,680 | 1,422,557 |
The considerable number of loans shown for other and unspecified purposes is duo to the fact that some societies are unable to give the necessary classification, so that it may be taken that the foregoing table understates the number of loans actually granted for the erection and purchase of dwellings.
The transfer of normal building activity to construction work in connection with war activities produced a sharp fall in the amount of loans granted to finance the erection of new buildings, each year from 1940–41 to 1943–44 showing a decrease on the preceding year's figures. In the three years since 1943–44 the amount of loans granted for this purpose has increased rapidly, and the amount of £547,612 for 1946–47 is the largest recorded since the introduction of the classification. During the earlier war years the loans which normally would have been used for the erection of new dwellings were evidently diverted to financing the purchase of dwellings already constructed. Since 1943–44, however, loans for the purchase of existing dwellings have fluctuated about a level of approximately £1,300,000 per annum.
LIABILITIES AND ASSETS.—The liabilities and assets of building societies for each of the years 1942–43 to 1946–47 were as follows:—
LIABILITIES
| Year. | To Shareholders (Including Reserve Funds and Undivided Profits). | Deposits. | Appropriations not taken up, or in Trust. | To Bankers and other Creditors. | Total Liabilities. |
|---|---|---|---|---|---|
| £ | £ | £ | £ | £ | |
| 1942–43 | 7,407,094 | 4,215,140 | 282,682 | 269,776 | 12,174,692 |
| 1943–44 | 7,568,742 | 4,373,389 | 306,848 | 365,248 | 12,614,227 |
| 1944–45 | 7,963,544 | 4,428,236 | 398,996 | 409,288 | 13,200,064 |
| 1945–46 | 8,529,033 | 4,589,615 | 463,988 | 357,954 | 13,940,590 |
| 1946–17 | 9,157,522 | 4,671,793 | 599,789 | 443,713 | 14,872,817 |
ASSETS
| Year. | Advances on Mortgage.* | Other Investments and Assets. | Cash in Hand and at Bank. | Total Assets. |
|---|---|---|---|---|
* Including balance owing on premiums on loans. | ||||
| £ | £ | £ | £ | |
| 1942–43 | 11,014,460 | 708,462 | 451,770 | 12,174,692 |
| 1943–44 | 11,378,192 | 894,346 | 341,689 | 12,614,227 |
| 1944–45 | 11,856,355 | 872,314 | 471,395 | 13,200,064 |
| 1945–46 | 12,479,437 | 968,896 | 492,257 | 13,940,590 |
| 1946–47 | 13,260,940 | 1,174,856 | 437,021 | 14,872,817 |
The ratio of advances on mortgage to total assets has been falling slightly but steadily during the five years shown in the above table. In 1942–43 advances were 90.5 per cent. of total assets, but for 1946–47 the corresponding ratio was 89.2 per cent. Each of the intervening years shows a reduction of approximately 0.3 per cent., compared with the preceding year. Probably this indicates some difficulty, not very pronounced, in finding suitable mortgage investments. This assumption is supported by the fact that loan appropriations not taken up, or in trust, have increased from £282,682 in 1942–43 to £599,789 in 1946–47.
DEPOSITS.—From April, 1932, figures of deposits with building and investment societies have become available under section 44 of the Building Societies Act, 1908, as amended by the National Expenditure Adjustment Act, 1932. Investment societies are included with building societies in the following figures, as the two classes are not distinguished in the returns. The figures relate to the 3Jst March, 1947.
| Rate of Interest (per Cent.). | At Call and under Three Months. | Three Months and under Two Years. | Two Years and over. | Total. |
|---|---|---|---|---|
| £ | £ | £ | £ | |
| Nil | 1,088 | 1,088 | ||
| Under 1½ | 189,424 | 34,244 | 223,668 | |
| 1½ and under 2 | 228,414 | 228,414 | ||
| 2 and under 2½ | 303,888 | 264,491 | 568,379 | |
| 2½and under 3 | 549,689 | 1,459,335 | 2,009,024 | |
| 3 and under 3½ | 2,501,655 | 2,501,655 | ||
| 3½ and under 4 | 2,049 | 2,049 | ||
| 4 and under 4½ | 6,923 | 6,923 | ||
| Totals | 740,201 | 566,546 | 4,234,453 | 5,541,200 |
| Average rate of interest (per cent.) | 2.11 | 1.75 | 2.82 | 2.62 |
MORTGAGE LAW.—Under the Property Law Act a “mortgage” is defined as including a charge on any property for securing money or money's worth; and “mortgage-money” means money or money's worth secured by a mortgage. Under the Land Transfer Act “mortgage” means and includes any charge on land created under the provisions of that Act for securing:—
The repayment of a loan or satisfaction of an existing debt;
The repayment of future advances, or repayment or satisfaction of any future or unascertained debt or liability, contingent or otherwise;
The payment to the holders for the time being of any bonds, debentures, promissory notes, or other securities, negotiable or otherwise, made or issued by the mortgagor before or after the creation of such charge;
The payment to any person or persons by yearly or periodical payments or otherwise of an annuity, rent-charge, or sum of money other than a debt.
Where the ownership of land is registered under the Land Transfer Act (as, vide Section 17A, the great majority of land titles now are) mortgages on that land are granted by virtue of the provisions of that Act: they take effect as securities and do not operate as transfers of the estate or interest charged. In the case of other land or property a mortgage is granted under what is known as the deeds or deeds-registration system; the mortgage in this instance operating as a conveyance or assignment of the land or property mortgaged, for the mortgagee becomes the registered proprietor of the land, subject to the right of the mortgagor to have the property re-registered in his name on the discharge of his obligations under the mortgage. Although in form a mortgage under the deeds system is a conveyance, in equity it is treated as merely a charge on the land.
Property that may be mortgaged.—Any land covered by the definitions of “land” in the Property Law Act, 1908, and the Land Transfer Act, 1915, may be mortgaged. Where, however, property is subject to restrictions upon alienation, these restrictions usually apply to prevent such property being mortgaged. The following are the main instances in which mortgage of property is forbidden by law:—
Family homes registered under the Family Protection Act, 1908.
Maintenance-moneys under the Family Protection Act, 1908.
Inalienable life annuities (Inalienable Life Annuities Act, 1910).
Pensions under the War Pensions Act.
Monetary benefits under the Social Security Act, 1938.
Property subject to restraint upon anticipation, unless by consent of the Supreme Court.
Property subject to restraint upon alienation in accordance with section 24 of the Property Law Act, 1908.
An infant's property, by the infant (Infants Act, 1908, sections 12 and 13).
Redemption.—A memorandum of discharge vacates the mortgage debt and operates as a deed of reconveyance of the estate and interest of the mortgagee in the mortgaged property “to the person for the time being entitled to the equity of redemption”; but the mortgagee may execute a deed of reconveyance “if he thinks fit and the mortgagor requires it.” The Public Trustee is empowered to receive mortgage-moneys on account of absentee mortgagees, and in the case of a deed of mortgage to execute the necessary memorandum of discharge. A mortgagor may redeem in the following cases:—
Before the due date, on payment of interest for the unexpired term of the mortgage. A special provision in the Mortgagors and Lessees Rehabilitation Act extends the powers of a mortgagor to redeem in certain cases before the due date.
At the due date, in accordance with the provisions of the mortgage.
After the duo date, upon giving three months' notice in writing or paying three months' interest in lieu of notice, except where the mortgagee is or Las been in possession or has taken steps to enforce his security, in which case the mortgagor may redeem at any time upon payment of all moneys duo.
After default and before sale by the mortgagee. If the mortgagee has entered into possession of the mortgaged land or part of it, the mortgagor loses his right of redemption after twenty years from the date of the mortgagee's entering into possession, or after twenty years from the last written acknowledgment of the mortgagor's title or of his right to redeem.
The Property Law Act abolished what was formerly known as the doctrine of consolidation of mortgages. Where a mortgagor is liable under more than one mortgage, he may now pay off one mortgage without being called on to pay off any mortgage or mortgages on property not comprised in the mortgage he is paying off.
Rights of Mortgagee.—Under New Zealand law a mortgagee has no power of foreclosure in respect of realty. The following represent his principal rights:—
He is entitled to the custody of the title-deeds of the property mortgaged.
He may sue on the personal covenant contained in the mortgage-deed.
He may enter and take possession. This right is exercisable either by actually entering upon the land or a part of it or by bringing an action for possession. At least one month's notice of the intention to exercise the right must be served on the owner for the time being of the land subject to the mortgage. If there is a tenant whose rights are binding on the mortgagee, the latter can give notice to the tenant to pay the rent to him, and this will be equivalent to taking possession.
He may assign his interest, either absolutely or by way of submortgage.
He may sell, either under the express powers (if any) in the mortgage-deed, or under powers implied by statute, if these have not been negatived in the deed.
Instead of selling, as above, a mortgagee entitled to exercise his power of sale may apply to the Registrar of the Supreme Court to conduct the sale. The mortgagee must state in his application the estimated value of the land, and the date of the sale must be not less than one month and not more than three months from the date of the application. He may bid at the sale and become the purchaser of the land, but in such case the amount paid for the land shall not be less than the value of the land as estimated. If it is, the mortgagor must be allowed in account the full amount of the estimate. As in the case of the right to enter and take possession, no power of sale shall become exercisable unless at least one month's notice of the contemplated action has been served on the owner of the land.
MORTGAGORS AND LESSEES REHABILITATION.—The economic conditions prevailing in New Zealand consequent upon the world-wide depression led to the enactment in the early months of 1931 of legislation designed for the relief of mortgagors. The complexity of the problem necessitated much further legislation, and a consolidating Mortgagors and Tenants Relief Act was passed in December, 1933. The Rural Mortgagors Final Adjustment Act, 1934–35, which was passed in April, 1935, represented a definite attempt on the part of the Government to effect a final clearing-up of the burden of rural indebtedness. Both these enactments, which are described in some detail in the 1936 issue of the Year-Book (pp. 567–70), were repealed by the Mortgagors and Lessees Rehabilitation Act, 1936, a description of which may be found in the 1940 issue of the Year-Book (pp. 743–47).
In addition to the relief granted to mortgagors by way of adjustment of their liabilities, a reduction in interest-rates was effected by Part III of the National Expenditure Adjustment Act, 1932. The reduction in the rate of interest was 20 per cent., but the reduced rate was not to be below 6½ per cent. in the case of chattel mortgages, nor 5 per cent. in the case of other mortgages, except in the case of income-tax-free company debentures to which section 171 of the Land and Income Tax Act, 1923, was applicable. In such cases the minimum was fixed at 4½ per cent. The Act originally applied to interest accruing on or after 1st April, 1932, and before 1st April, 1935, but the reduction was later made permanent. Mortgages (not being for a fixed term, expired or unexpired) securing the repayment of principal, moneys repayable on demand, and mortgages executed after 1st April, 1932, are exempt from the provisions of the Act.
The maximum rates of interest payable under mortgages adjusted in terms of the Mortgagors and Lessees Rehabilitation Act, 1936, were fixed by Order in Council at 4¾ per cent. per annum for first mortgages on land and 6 per cent. for all other mortgages.
The Mortgagors and Lessees Rehabilitation Act set up a Court of Record entitled the Court of Review, and provided for the appointment of Adjustment Commissions. Orders made by these Commissions in adjustment of mortgages, &c., were registered with the Court. The following statement shows the number of applications dealt with.
| — | Farm. | Other. | Totals. |
|---|---|---|---|
| Applications filed | 15,621 | 18,912 | 34,533 |
| Applications withdrawn | 3,223 | 5,071 | 8,294 |
| Voluntary adjustments | 1,327 | 1,303 | 2.630 |
| Orders made | 11,071 | 12,538 | 23,609 |
The next statement indicates the extent to which relief was granted to mortgagors and lessees in those cases where orders were made by Adjustment Commissions and filed in the Court of Review.
| — | Farm. | Other. | Totals. |
|---|---|---|---|
| Principal reduced | 5,406 | 4,081 | 9,487 |
| Interest arrears remitted | 4,982 | 2,639 | 7,621 |
| Term of first mortgages extended | 7,622 | 8,807 | 16,429 |
| Term of second or subsequent mortgages extended | 3,018 | 2,757 | 5,775 |
| Rate of interest reduced | 9,146 | 10,710 | 19,856 |
| Rental reduced | 2,477 | 175 | 2,652 |
| Rental arrears reduced or remitted | 2,327 | 165 | 2,492 |
| Remission of unsecured debts | 3,446 | 478 | 3,924 |
| Amount written off by— | £ | £ | £ |
| Reduction of principal | 5,589,148 | 1,047,666 | 6,636,814 |
| Remission of interest arrears | 1,368,768 | 224,865 | 1,593,633 |
| Reduction or remission of rent arrears | 432,043 | 12,999 | 445,042 |
| Remission of unsecured debts | 1,143,478 | 66,367 | 1,209,845 |
| Totals | 8,533,437 | 1,351,897 | 9,885,334 |
WAR REGULATIONS AFFECTING MORTGAGES.—Following the outbreak of war in September, 1939, the Courts Emergency Powers Regulations 1939 provided that no person could, without the leave of the appropriate Court, do or complete certain acts in respect of existing contracts, &c. These acts included the calling-up of sums secured by mortgage, the exercise of a power of sale under a mortgage, and the commencement or continuation of proceedings for the breach of a covenant under a mortgage other than a covenant for the payment of interests.
The 1939 regulations referred to were superseded by the Debtors Emergency Regulations 1940, and special provisions for the relief of mortgagors were made at the same time (31st July, 1940) by the Mortgages Extension Emergency Regulations 1940. The Mortgages Extension Emergency Regulations applied to all mortgages whether executed before or after the commencement of the regulations, and notwithstanding that any power of sale, rescission, or entry into possession may have been exercised. An amendment in 1941 made special provision in respect of mortgages covering stock on or produce of mortgaged land. An outline of these regulations, which were revoked as from 22nd November, 1947, is contained on pages 546–7 of the 1946 Year-Book.
MORTGAGES REGISTERED AND DISCHARGED.—A table is given showing the amount represented by mortgages registered and discharged during each of the last twenty years.
Year ended 31st March, Mortgages registered. Mortgages discharged.
| £ | £ | |
|---|---|---|
| 1929 | 33,559,932 | 25,269,613 |
| 1930 | 38,869,144 | 28,328,993 |
| 1931 | 30,208,447 | 20,056,691 |
| 1932 | 13,410,581 | 10,036,385 |
| 1933 | 9,161,663 | 8,149,355 |
| 1934 | 7,802,853 | 9,086,847 |
| 1935 | 11,845,634 | 13,732,853 |
| 1936 | 16,227,058 | 17,553,233 |
| 1937 | 19,697,064 | 19,799,186 |
| 1938 | 19,008,184 | 19,344,030 |
| 1939 | 20,041,446 | 16,594,825 |
| 1940 | 17,621,112 | 14,101,049 |
| 1941 | 16,267,274 | 15,933,724 |
| 1942 | 14,549,555 | 15,098,801 |
| 1943 | 12,140,513 | 16,679,795 |
| 1944 | 15,596,790 | 20,029,988 |
| 1945 | 18,099,861 | 21,012,079 |
| 1946 | 22,519,122 | 23,313,916 |
| 1947 | 31,888,750 | 25,947,489 |
| 1948 | 32,041,085 | 25,396,004 |
The figures for the 1928–29 year include duplicate registrations—i.e., cases where a mortgage has been registered in more than one district—but from 1929–30 onwards the extent of duplication has been available and the figures have been adjusted accordingly. It should also be noted that the figures include collateral and guarantee mortgages not representing money indebtedness. On the other hand, no amount is shown as secured in a proportion of cases where a mortgage is given in anticipation of advances, &c. In addition there are numbers of privately arranged advances which are not registered; and stock and crop liens, bills of sale, and instruments under the Chattels Transfer Act are not included in the statistics.
Many discharges are not registered, particularly in the case of leaseholds and also of second or other further mortgages when the power of sale has been exercised by the first mortgagee. The figures for discharges are further affected by the high proportion of table mortgages. This is particularly so in cases where the mortgage is approaching maturity, since the whole amount remains on the register until finally discharged, despite the fact that the original amount of indebtedness has been considerably reduced.
Mortgages registered.—The total amount for which mortgages were registered, both under the deeds-registration system and under the Land Transfer Act, in each registration district during the last five financial years is given in the next table.
| District. | 1943–44. | 1944–45. | 1945–46. | 1946–47. | 1947–48. |
|---|---|---|---|---|---|
| £ | £ | £ | £ | £ | |
| Auckland | 5,191,665 | 5,645,540 | 6,804,264 | 9,489,328 | 9,498,632 |
| Gisborne | 281,564 | 287,951 | 290,062 | 458,983 | 551,194 |
| Hawke's Bay | 758,248 | 944,016 | 1,278,934 | 1,784,584 | 1,925,129 |
| Taranaki | 858,790 | 883,035 | 1,002,591 | 1,696,708 | 1,637,172 |
| Wellington | 3,022,669 | 3,817,018 | 4,775,389 | 6,263,474 | 6,961,872 |
| Marlborough | 202,420 | 266,379 | 319,289 | 447,766 | 479,260 |
| Nelson | 297,737 | 404,210 | 619,190 | 925,649 | 1,010,617 |
| Westland | 111,396 | 149,201 | 219,780 | 270,837 | 330,102 |
| Canterbury | 2,395,515 | 2,861,965 | 3,702,889 | 5,366,128 | 5,309,195 |
| Otago | 1,639,280 | 1,813,007 | 2,185,415 | 3,035,996 | 2,735,598 |
| Southland | 886,543 | 1,034,164 | 1,341,859 | 1,947,047 | 1,873,369 |
| Gross totals | 15,645,827 | 18,106,486 | 22,539,662 | 31,686,500 | 32,312,140 |
| Duplications | 49,037 | 6,625 | 20,540 | 597,750 | 271,055 |
| Net totals | 15,596,790 | 18,099,861 | 22,519,122 | 31,088,750 | 32,041,085 |
Mortgage registrations, which declined appreciably during the first three years following the outbreak of war, commenced to move upwards again early in 1943. In each succeeding year, a substantial increase was recorded, but it was not until 1945–46 that the figures of the pre-war year 1938–39 were exceeded. In the next year (1946–47) a much more substantial increase was shown, the net amount for that year being £8,569,628, or 38.1 per cent., greater than in 1945–46, while a further increase of £952,335 was recorded in 1947–48. The high figures of the last few years have been contributed to in some measure by the registration of mortgages in respect of rehabilitation assistance granted to ex-servicemen. The number of mortgages comprising the net aggregate in 1947–48 was 23,643, an increase of 284 over the total for 1946–47, and an increase of 994 (4.4 per cent.) as compared with 1938–39. These figures are exclusive of registrations in which the amount of consideration was not stated.
Of the net total of £32,041,085 registered in 1947–48, only £25,088 was in respect of mortgages under the deeds system. This amount has been gradually decreasing since the passing of the Land Transfer (Compulsory Registration of Titles) Act, 1924, which provided for the bringing of all land titles under the provisions of the Land Transfer Act. This work has now been completed except in the Auckland District, although there are a few titles yet to be dealt with in other districts owing to doubts as to ownership, &c. (vide Section 17A).
Classification by Amount.—Of the net total of £32,041,085 registered for the financial year 1947–48, mortgages up to £500 in value represented 6.2 per cent. of the total; from 2501 to £1,000, 14.5 per cent.; from £1,001 to £5,000, 57.0 per cent.; and above £5,000, 22.3 per cent. In regard to numbers, however, 27.6 per cent. were for amounts not exceeding £500, 25.2 per cent. for amounts from £501 to £1,000, 43.3 per cent. for amounts from £1,001 to £5,000, and only 3.9 per cent. for amounts exceeding £5,000. The following table gives the number and amount in each registration district according to the sum secured.
| District. | £500 and under. | £501 to £1,000. | £1,001 to £5,000. | Over £5,000. | ||||
|---|---|---|---|---|---|---|---|---|
| Number. | Amount. | Number. | Amount. | Number. | Amount. | Number. | Amount. | |
| £ | £ | £ | £ | |||||
| Auckland | 1,765 | 560,656 | 1,871 | 1,462,190 | 3,159 | 5,772,498 | 247 | 1,703,288 |
| Gisborne | 101 | 32,788 | 88 | 68,259 | 136 | 253,477 | 24 | 196,670 |
| Hawke's Bay | 226 | 65,076 | 296 | 236,771 | 525 | 966,397 | 78 | 656,885 |
| Taranaki | 184 | 59,243 | 250 | 197,429 | 489 | 1,002,809 | 56 | 377,691 |
| Wellington | 1,260 | 358,679 | 1,143 | 898,099 | 2,332 | 4,035,095 | 175 | 1,669,999 |
| Marlborough | 83 | 24,318 | 66 | 49,832 | 115 | 231,690 | 21 | 173,420 |
| Nelson | 281 | 80,370 | 209 | 164,521 | 353 | 605,111 | 23 | 160,615 |
| Westland | 90 | 27,039 | 87 | 64,445 | 96 | 175,073 | 8 | 63,545 |
| Canterbury | 1,169 | 391,775 | 1,007 | 796,562 | 1,666 | 2,777,232 | 148 | 1,343,626 |
| Otago | 1,015 | 275,833 | 674 | 510,201 | 847 | 1,429,557 | 60 | 520,007 |
| Southland | 345 | 102,356 | 275 | 210,431 | 530 | 1,006,219 | 79 | 554,363 |
| Cross totals | 6,519 | 1,978,133 | 5,966 | 4,658,740 | 10,248 | 18,255,158 | 919 | 7,420,109 |
| Duplications | 2 | 1,900 | 4 | 6,175 | 3 | 262,980 | ||
| Net totals | 6,519 | 1,978,133 | 5,964 | 4,656,840 | 10,244 | 18,248,983 | 916 | 7,157,129 |
In addition to the numbers shown above, there were 6,245 mortgages registered in 1947–48 and 6,505 in 1946–47 for which no amounts were shown. Excluding these, the average amount for each mortgage registered in 1947–48 was £1,355, as compared with £1,331 in 1946–47, and £885 in 1938–39.
Mortgages on Urban and Rural Securities.—Figures are available in the case of land transfer mortgage registrations showing for each registration district the amounts advanced on urban and on rural properties. No similar data are available in regard to the insignificant amount registered under the deeds system. The distinction is between “town and suburban” and “country” holdings, but sufficient information to permit of a strictly accurate classification is not always available. Generally, however, mortgages are regarded as town and suburban if secured on properties situated within cities or boroughs, or on small holdings in the nature of building allotments which are not definitely distinguishable as country properties. Mortgages classified as town and suburban in 1947–48 were secured on areas averaging a little more than one-third of an acre in extent, as compared with an average area of some 306 acres in the case of “country” securities.
Town and suburban securities accounted for 75 per cent. of the number and 59 per cent. of the aggregate value of land-transfer mortgages in 1947–48, as compared with 25 per cent. and 41 per cent. respectively in the case of country properties.
The following table gives mortgages registered in the various districts during the year 1947–48 under the Land Transfer Act.
| District. | Town and Suburban. | Country. | ||||
|---|---|---|---|---|---|---|
| Number. | Area. | Amount secured. | Number. | Area. | Amount secured. | |
| Acres. | £ | Acres. | £ | |||
| Auckland | 7,277 | 3,012 | 5,734,404 | 2,625 | 535,727 | 3,741,455 |
| Gisborne | 355 | 174 | 237,519 | 141 | 99,296 | 313,675 |
| Hawke's Bay | 1,084 | 437 | 881,134 | 396 | 152,539 | 1,043,995 |
| Taranaki | 784 | 333 | 664,824 | 534 | 122,742 | 972,348 |
| Wellington | 5,024 | 1,282 | 4,685,425 | 1,097 | 335,613 | 2,276,447 |
| Marlborough | 272 | 165 | 178,141 | 115 | 60,626 | 301,119 |
| Nelson | 717 | 176 | 615,546 | 319 | 88,650 | 392,756 |
| Westland | 276 | 65 | 240,467 | 71 | 18,245 | 89,635 |
| Canterbury | 3,490 | 1,475 | 3,275,287 | 943 | 375,123 | 2,033,908 |
| Otago | 2,272 | 460 | 1,786,217 | 657 | 287,001 | 949,381 |
| Southland | 923 | 435 | 804,454 | 504 | 192,265 | 1,068,915 |
| Totals | 22,474 | 8,014 | 19,103,418 | 7,402 | 2,267,827 | 13,183,634 |
An eleven-year summary upon similar lines is also given. Following the low figures of the depression period, there was an increase in mortgage registrations commencing with the year 1934–35. This upward movement continued up to and including 1936–37 as far as country properties were concerned and for two years later in regard to town and suburban properties, after which there was an almost continuous recession until 1943–44. Each subsequent year up to and including 1946–47 witnessed a substantial increase in mortgages on both urban and rural properties, the increase in 1946–47 being particularly heavy. The amount secured on town and suburban properties by mortgages registered in 1946–47 showed an increase of £4,411,149 (31.5 per cent.), over the previous year, and an increase of £6,646,518, or 56.5 per cent., above the pre-war year 1938–39. The amount secured on country properties by mortgages registered in 1946–47 exceeded the 1945–46 figure by £4,751,602, or 55.8 per cent., while compared with 1938–39 there was an increase of £4,677,815 (54.5 per cent.). The 1947–48 registrations showed little difference from those of 1946–47, the amount secured on town and suburban securities showing an increase of £704,302, while the amount secured on rural properties decreased by £76,430.
| Year ended 31st March, | Number. | Area. | Amount secured. | ||||
|---|---|---|---|---|---|---|---|
| Town and Suburban. | Country. | Total. | Town and Suburban. | Country. | Total. | ||
| Acres. | Acres. | Acres. | £ | £ | £ | ||
| 1938 | 23,761 | 6,244 | 1,889,568 | 1,895,812 | 10,324,943 | 8,547,846 | 18,872,789 |
| 1939 | 24,847 | 5,418 | 1,977,959 | 1,983,377 | 11,752,598 | 8,582,249 | 20,334,847 |
| 1940 | 22,547 | 5,035 | 1,845,656 | 1,850,691 | 9,879,389 | 7,688,126 | 17,567,515 |
| 1941 | 21,618 | 4,954 | 1,698,609 | 1,703,563 | 8,705,451 | 7,706,882 | 16,412,333 |
| 1942 | 20,656 | 4,974 | 1,407,819 | 1,412,793 | 9,137,436 | 5,800,942 | 14,938,378 |
| 1943 | 17,044 | 3,926 | 1,083,750 | 1,087,676 | 7,493,592 | 4,610,392 | 12,103,984 |
| 1944 | 19,903 | 4,668 | 1,477,207 | 1,481,875 | 8,701,321 | 6,880,507 | 15,581,828 |
| 1945 | 21,161 | 5,179 | 1,527,348 | 1,532,527 | 10,542,948 | 7,542,072 | 18,085,020 |
| 1946 | 24,483 | 6,297 | 1,640,729 | 1,647,026 | 13,987,967 | 8,508,462 | 22,496,429 |
| 1947 | 29,860 | 7,467 | 2,321,085 | 2,328,552 | 18,399,116 | 13,260,064 | 31,659,180 |
| 1948 | 29,876 | 8,014 | 2,267,827 | 2,275,841 | 19,103,418 | 13,183,634 | 32,287,052 |
Rates of Interest.—Classified according to the various rates of interest, and including duplicate registrations (to the extent of £271,055 in 1947–48 and £597,750 in 1916–17), the amounts in the mortgage-deeds registered were:—
| Rate per Cent. | 1946–47. | 1947–48. |
|---|---|---|
| £ | £ | |
| Free | 232 | |
| 1 | 8,643 | 3,660 |
| 1½ | 3,630 | 1,222 |
| 2 | 49,166 | 41,928 |
| 2¼ | 2,650 | |
| 2½ | 83,073 | 80,305 |
| 2¾ | 7,065 | 5,000 |
| 3 | 12,163,043 | 11,866,821 |
| 3¼ | 23,116 | 25,450 |
| 3½ | 221,267 | 192.715 |
| 3¾ | 15,155 | 18,100 |
| 4 | 4,197,050 | 4,488,788 |
| 4 1/12 | 635 | |
| 4⅛ | 1,169,540 | 1,248,159 |
| 4⅕ | 6,600 | 9,975 |
| 4¼ | 2,002,838 | 2,342,232 |
| 4 | 765 | |
| 4⅓ | 3,400 | |
| 4½ | 4,862,793 | 4,946,489 |
| 4⅝ | 32,310 | 50,149 |
| 4¾ | 192,017 | 162,174 |
| 5 | 2,731,662 | 2,371,844 |
| 5⅛ | 250 | |
| 5⅙ | 3,000 | |
| 5⅕ | 50 | |
| 5¼ | 45,535 | 143,547 |
| 5½ | 199,967 | 451,477 |
| 5 | 275 | |
| 5¾ | 450 | 2,000 |
| 6 | 269,203 | 342,924 |
| 6⅙ | 4,955 | |
| 6¼ | 30,990 | 33,826 |
| 6½ | 179,049 | 285,898 |
| 6 | 900 | |
| 7 | 109,737 | 173,335 |
| 7½ | 37,247 | 16,550 |
| 8 | 35,667 | 43,477 |
| 8¼ | 500 | |
| 8½ | 175 | 700 |
| 9 | 585 | 2,550 |
| 10 | 23,481 | 41,891 |
| 15 | 372 | |
| 20 | 165 | 1,305 |
| 30 | 52 | 187 |
| Unspecified | 2,980,654 | 2,904,053 |
| Totals | 31,686,500 | 32,312,140 |
The average rate of interest on new mortgages was maintained at over 6 per cent. per annum from 1922 to 1932, but with the advent of the depression period and the effect of the mortgage relief legislation, subsequent years showed decreases. The inclusion of State Advances mortgages from the year 1935–36 onwards has no doubt also had the effect of reducing the average rate and the advent of rehabilitation mortgages to ex-servicemen has also affected the rate during the last few years. State Advances mortgages were excluded from the average computation for some years prior to 1935–36. Averages for recent years have been as follows:—
| Year ended 31st March, | Average Rate per Cent. |
|---|---|
| 1938 | 4.65 |
| 1939 | 4.58 |
| 1940 | 4.69 |
| 1941 | 4.69 |
| 1942 | 4.73 |
| 1943 | 4.72 |
| 1944 | 4.63 |
| 1945 | 4.51 |
| 1946 | 4.10 |
| 1947 | 3.85 |
| 1948 | 3.90 |
As indicated earlier in this section (page 570), rates of interest in recent years have been considerably affected by legislative action. In 1931–32, the financial year immediately preceding the operation of the National Expenditure Adjustment Act, the average rate of interest on mortgages registered was 6.28 per cent., as compared with 4.51 per cent. in 1944–45. The sharp fall to 4.10 per cent. in 1945–46 and the further fall to 3.85 per cent. in 1946–47 were mainly due to rehabilitation loans granted to ex-servicemen by the State Advances Corporation. The rate of interest charged on rehabilitation loans for residential and farm properties is 3 per cent., and of the gross amount of mortgages registered during 1945–46, 1946–47, and 1947–48 no less than 25.8 per cent., 38.4 per cent., and 36.7 per cent. respectively were at this rate, as compared with only 2.0 per cent. in 1944–45. In 1931–32 only 10.2 per cent. of the specified amount was at rates not exceeding 5 per cent., while no less than 43.3 per cent. was at rates exceeding 6 per cent. The corresponding figures for 1947–48 were 94.7 per cent. and 2.1 per cent. respectively.
A further analysis of the position is given below.
| Year ended 31st March, | Not exceeding 3 per Cent. | Over 3 per Cent. to 4 per Cent. | Over 4 per Cent. to 4½ per Cent. | Over 4½ per Cent. to 5 per Cent. | Over 5 per Cent. to 6 per Cent. | Exceeding 6 per Cent. |
|---|---|---|---|---|---|---|
| Amount | ||||||
| £ | £ | £ | £ | £ | £ | |
| 1938 | 71,066 | 864,300 | 9,753,131 | 3,872,391 | 1,008,122 | 720,930 |
| 1939 | 73,754 | 841,835 | 10,267,589 | 4,185,146 | 941,282 | 411,840 |
| 1940 | 100,724 | 682,583 | 7,676,560 | 5,201,375 | 1,220,653 | 350,802 |
| 1941 | 94,615 | 878,837 | 6,275,940 | 4,763,363 | 947,733 | 280,391 |
| 1942 | 112,251 | 537,747 | 6,121,557 | 4,007,150 | 862,531 | 398,889 |
| 1943 | 119,998 | 470,667 | 4,726,366 | 3,545,127 | 538,605 | 237,719 |
| 1944 | 158,358 | 1,122,609 | 6,686,810 | 3,987,689 | 529,353 | 300,820 |
| 1945 | 456,005 | 1,179,991 | 9,333,215 | 3,069,124 | 420,288 | 398,760 |
| 1946 | 5,883,012 | 1,838,447 | 7,970,555 | 3,077,333 | 475,215 | 366,029 |
| 1947 | 12,317,270 | 4,456,588 | 8,043,171 | 2,955,989 | 515,680 | 417,148 |
| 1948 | 11,999,168 | 4,725,053 | 8,550,255 | 2,584,167 | 942,998 | 606,446 |
| Percentage of Total | ||||||
| Per Cent. | Per Cent. | Per Cent. | Per Cent. | Per Cent. | Per Cent. | |
| 1938 | 0.4 | 5.3 | 59.9 | 23.8 | 6.2 | 4.4 |
| 1939 | 0.4 | 5.1 | 61.4 | 25.0 | 5.6 | 2.5 |
| 1940 | 0.7 | 4.5 | 50.4 | 34.1 | 8.0 | 2.3 |
| 1941 | 0.7 | 6.6 | 47.4 | 36.0 | 7.2 | 2.1 |
| 1942 | 0.9 | 4.5 | 50.8 | 33.3 | 7.2 | 3.3 |
| 1943 | 1.2 | 4.9 | 49.0 | 36.8 | 5.6 | 2.5 |
| 1944 | 1.2 | 8.8 | 52.3 | 31.2 | 4.1 | 2.4 |
| 1945 | 3.1 | 7.9 | 62.8 | 20.7 | 2.8 | 2.7 |
| 1946 | 30.0 | 9.4 | 40.6 | 15.7 | 2.4 | 1.9 |
| 1947 | 42.9 | 15.5 | 28.0 | 10.3 | 1.8 | 1.5 |
| 1948 | 40.8 | 16.0 | 29.1 | 8.8 | 3.2 | 2.1 |
The trend in interest-rates is further illustrated in the above diagram, which shows also the movement in mortgage registrations. The total amounts indicated in the diagram do not represent the total registrations in the respective years, as mortgages on which the rate of interest was not specified have been excluded.
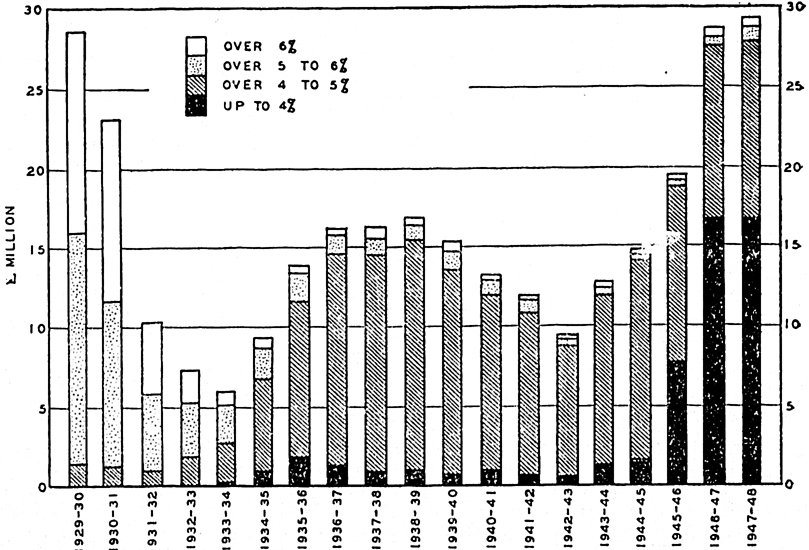
Mortgages discharged.—After a very long period during which the value of mortgages registered substantially exceeded the amount represented by mortgages released, discharges exceeded registrations for a period of five years commencing with the year 1933–34. In the subsequent three years the reverse position obtained, but, commencing with 1941–42, discharges again commenced to exceed registrations, and continued to do so up to 1945–46, although the margin in that year was not very great. In each of the succeeding two years registrations exceeded discharges, the difference being £5,141,261 in 1946–47 and £6,645,081 in 1947–48.
The net amount released in 1946–47 exceeded the previous year's figure by £2,033,573, and, in addition, was higher than in any other year since 1929–30. The 1947–48 total, however, was £551,485 less than that recorded in 1946–47.
The total amount of mortgages discharged, including mortgages under the deeds-registration system, for the last four years is as follows:—
| District. | 1944–45. | 1945–46. | 1946–47. | 1947–48. | ||||
|---|---|---|---|---|---|---|---|---|
| Number. | Amount. | Number. | Amount. | Number. | Amount. | Number. | Amount. | |
| £ | £ | £ | £ | |||||
| Auckland | 8,347 | 6,312,584 | 8,659 | 6,851,302 | 9,868 | 7,972,670 | 8,814 | 6,911,085 |
| Gisborne | 498 | 460,659 | 568 | 536,646 | 626 | 574,550 | 541 | 490,116 |
| Hawke's Bay | 1,245 | 1,287,907 | 1,550 | 1,624,603 | 1,614 | 1,570,393 | 1,473 | 1,653,884 |
| Taranaki | 1,291 | 1,152,516 | 1,356 | 1,084,346 | 1,609 | 1,486,091 | 1,387 | 1,451,651 |
| Wellington | 5,154 | 4,352,620 | 5,764 | 5,678,743 | 6,528 | 6,358,770 | 6,297 | 5,972,355 |
| Marlborough | 374 | 325,886 | 378 | 286,881 | 416 | 382,219 | 368 | 618,165 |
| Nelson | 776 | 410,005 | 869 | 442,978 | 930 | 463,899 | 849 | 541,421 |
| Westland | 224 | 113,335 | 288 | 147,827 | 293 | 169,311 | 299 | 233,120 |
| Canterbury | 4,442 | 3,450,761 | 4,662 | 4,142,769 | 4,938 | 4,600,317 | 4,386 | 4,155,580 |
| Otago | 3,421 | 2,076,605 | 3,499 | 2,509,079 | 3,645 | 2,264,647 | 3,129 | 2,184,918 |
| Southland | 1,644 | 1,070,655 | 1,586 | 909,930 | 1,781 | 1,256,370 | 1,465 | 1,214,584 |
| Gross totals | 27,416 | 21,013,533 | 29,179 | 24,215,104 | 32,248 | 27,099,267 | 29,008 | 25,426,879 |
| Duplications | 2 | 1,454 | 5 | 901,188 | 14 | 1,151,778 | 6 | 30,875 |
| Net totals | 27,414 | 21,012,079 | 29,174 | 23,313,916 | 32,234 | 25,947,489 | 29,002 | 25,396,004 |
THE law relating to bankruptcy in New Zealand is contained in the main in the Bankruptcy Act, 1908 (which is a consolidation of previous enactments), and the Bankruptcy Amendment Act, 1927. Jurisdiction in bankruptcy matters is vested in the Supreme Court. The Governor-General, however, may by Proclamation confer similar jurisdiction on a Magistrate's Court in cases where the liabilities do not exceed £300.
All proceedings in bankruptcy are commenced by a petition filed in the Court. A petition may be filed either by the debtor or by a creditor, a fee of £6 being payable. The filing of a debtor's petition is equivalent to an order of the Court adjudging the debtor a bankrupt, no order being required in this case. Not less than £30 in the aggregate must be owing by the debtor to the creditor or creditors filing a petition.
Immediately on a debtor's petition being filed or adjudication being made on a creditor's petition, the Registrar of the Court gives notice to the Official Assignee in Bankruptcy, in whom all the property of the bankrupt thereupon vests. The bankrupt must hand over his books of account, papers, deeds, &c., to the Official Assignee, and furnish such information as is necessary to enable the Assignee to prepare the bankrupt's balance-sheet of the estate. The bankrupt may also be required to produce statements of accounts, balance-sheets, &c., covering the period of three years immediately prior to the commencement of his bankruptcy, give inventories of his property and debts, and generally assist in the realization of his property. The Assignee may summon the bankrupt before himself, or before a Magistrate, to be examined on oath. The Bankruptcy Amendment Act, 1927, forbids (save with the consent of the Court, on the application of the Official Assignee) the publication of a report of any examination of a bankrupt before the Assignee or of any matter arising in the course of such an examination.
The Official Assignee is empowered to sell the bankrupt's property, to claim debts due to the bankrupt estate, to carry on the business of the bankrupt so far as is necessary or expedient for its beneficial winding-up, or to divide the property among the creditors. The bankrupt may be appointed by the Official Assignee to manage his estate or carry on his business on behalf of the creditors.
Creditors may accept a composition in satisfaction of the debts due to them. In such a case, after approval of the Court, a deed of composition is executed and filed, and the bankruptcy annulled.
On application being made by the bankrupt, the Court is empowered to grant him an order of discharge, either absolute, suspended, or conditional. The application, which must be made within four months after adjudication, may be opposed either by the Official Assignee or by any creditor who has proved his claim. A public examination of the bankrupt may be demanded by the Assignee or by a creditor.
By the Trustee Amendment Act, 1933, protection is afforded to a trustee who pays trust-moneys to a bankrupt in good faith and without knowledge of the bankruptcy.
UNDISCHARGED BANKRUPTS.—Section 14 of the Bankruptcy Amendment Act, 1927, requires the annual compilation of a list showing the names, occupations, and other particulars of all persons who have been adjudged bankrupt since 31st March, 1927, and who have not obtained an order of discharge, or whose order of discharge is suspended for a term, or is subject to conditions remaining unfulfilled.
It was originally laid down that the list was to be published in the New Zealand Gazette, but by section 9 of the Statutes Amendment Act, 1936, this requirement has been discontinued, and the Minister of Justice may now from time to time publish the list, or so much of it as relates to adjudications within any specified period ending on the date of the compilation of the list.
TRANSACTIONS IN BANKRUPTCY.—The number of transactions in bankruptcy during the last five years is given below. A long-term record of the more important features will be found in the Statistical Summary, near the end of this volume.
| Year. | Petitions by Debtors. | Adjudications on Petitions by Creditors. | Cases in which Composition accepted. | Orders of Immediate Discharge granted. | Cases in which Orders of Discharge were suspended. |
|---|---|---|---|---|---|
| 1944 | 41 | 10 | 71 | 6 | |
| 1945 | 32 | 13 | 58 | 5 | |
| 1946 | 45 | 7 | 53 | 6 | |
| 1947 | 59 | 15 | 2 | 56 | 4 |
| 1948 | 115 | 33 | 2 | 40 | 5 |
In the case of a partnership, not only the partnership but each partner is counted in the total of transactions.
The general bankruptcy statistics do not cover private assignments and compositions, but relate only to cases dealt with by Official Assignees. Certain statistics of private assignments are available, and details of these appear at the end of this section.
ASSETS AND LIABILITIES.—Debtors are required to file a statement of the extent of their liabilities and assets, but there is usually a marked difference between these statements and the amounts actually realized by the Official Assignee or the debts subsequently proved by creditors. During the last decade the amounts actually realized by Official Assignees averaged 106 per cent. of assets according to debtors' statements, and 33 per cent. of debts proved.
It should be understood that in the following table the figures in each column refer to all transactions under the respective heads during the year, the amounts realized by Assignees and paid in dividends and preferential claims relating partly to the current year's bankruptcies (many of which, however, are not disposed of during the year) and partly to cases commenced in previous years.
| Year. | Number of Bankruptcies. | Debtors' Statements of Assets, excluding Amounts secured to Creditors. | Amounts realized by Official Assignees. | Amount of Debts proved. | Amounts paid in Dividends and Preferential Claims. |
|---|---|---|---|---|---|
* Including one bankruptcy settled without statement being filed. † Including two deceased persons' estates under Part IV of the Administration Act, 1908 | |||||
| £ | £ | £ | £ | ||
| 1938 | 267 | 118,698 | 64,511 | 230,463 | 30,793 |
| 1939 | 267 | 82,318 | 44,171 | 225,490 | 29,950 |
| 1940 | 213* | 35,372 | 42,418 | 125,289 | 30,288 |
| 1941 | 165† | 24,538 | 35,453 | 71,011 | 34,428 |
| 1942 | 82 | 13,665 | 29,753 | 32,227 | 19,428 |
| 1943 | 45 | 6,148 | 18,883 | 20,052 | 13,136 |
| 1944 | 51 | 13,209 | 13,466 | 51,035 | 16,741 |
| 1945 | 45 | 9,060 | 18,530 | 118,216 | 10,041 |
| 1946 | 52 | 10,663 | 20,942 | 48,506 | 14,328 |
| 1947 | 74 | 21,433 | 15,528 | 44,731 | 12,386 |
| 1948 | 148 | 56,229 | 50,280 | 143,282 | 24,945 |
The table following shows for each of the last eleven years the average amount of debts proved per estate, and also the average dividend paid.
| Year. | Average Debts proved per Estate. | Proportion of Dividends to Debts. |
|---|---|---|
| £ | Per Cent. | |
| 1938 | 863 | 13.36 |
| 1939 | 845 | 13.28 |
| 1940 | 591 | 24.17 |
| 1941 | 430 | 48.48 |
| 1942 | 393 | 60.28 |
| 1943 | 446 | 65.51 |
| 1944 | 1,001 | 32.80 |
| 1945 | 2,627 | 8.49 |
| 1946 | 933 | 29.53 |
| 1947 | 604 | 27.69 |
| 1948 | 968 | 17.41 |
The total payments made in 1947 and 1948 from assets realized were:—
| 1947. | 1948. | |
|---|---|---|
| £ | £ | |
| Dividends to creditors (excluding preferential and secured claims) | 11,593 | 23,750 |
| Preferential claims (rents, wages, &c.) | 793 | 1,195 |
| Secured claims | 1,513 | 7,417 |
| Government commission | 1,387 | 2,843 |
| Cost of actions, solicitors' and supervisors' fees | 448 | 1,633 |
| Expenses incurred in carrying on estates | 950 | 1,485 |
| Other charges | 1,614 | 2,113 |
| Totals | £18,298 | £40,436 |
Balances in bank to the credit of estates aggregated £20,871 on 31st December, 1948, compared with £11,025 at the end of the previous year.
AMOUNT OF LIABILITIES.—The following table shows for each of the last five years a classification of bankruptcies according to the amount of liabilities.
| Liabilities. | 1944. | 1945. | 1946. | 1947. | 1948. |
|---|---|---|---|---|---|
* Including a partnership, counted once only. | |||||
| Under £50 | 3 | 1 | 1 | 6 | |
| £50 and under £100 | 8 | 6 | 2 | 6 | 8 |
| £100 and under £250 | 16 | 9 | 12 | 17 | 28 |
| £250 and under £500 | 6 | 10 | 9 | 18 | 39 |
| £500 and under £1,000 | 6 | 9 | 13 | 19 | 30 |
| £1,000 and under £2,000 | 5 | 3 | 9 | 13 | 23 |
| £2,000 and under £5,000 | 2 | 5 | 6 | 1 | 10 |
| £5,000 and over | 3 | 2 | 4 | ||
| Totals | 49* | 45 | 52 | 74 | 148 |
Liabilities in the bulk of failures are for comparatively small amounts. Of a total of 368 bankruptcies over the period quoted, 41 (11 per cent.) were for amounts of less than £100, 123 (33 per cent.) for amounts of leas than £250, and 205 (56 per cent.) for amounts of less than £500. In 282 cases (77 per cent. of the total) the amount of the liabilities was less than £1,000.
OCCUPATIONS OF BANKRUPTS.—The following table shows in broad industrial groups the occupations of those adjudged bankrupt in the last five years.
| 1944. | 1945. | 1946. | 1947. | 1948. | |
|---|---|---|---|---|---|
* Excluding one partnership. The occupations of the individual partners are included (refer page 579). | |||||
| Agricultural and pastoral | 6 | 9 | 2 | 8 | 10 |
| Forest occupations | 1 | 3 | |||
| Fishing and trapping | 1 | 2 | |||
| Mining and quarrying | 1 | ||||
| Processes relating to chemicals, animal and vegetable products, n.e.i. | 1 | ||||
| Processes relating to metals, machines, tools, electric fittings, conveyances, jewellery, &c. | 1 | 1 | 1 | 14 | |
| Processes relating to fibrous materials, textiles, and dress | 1 | 2 | 1 | ||
| Processes relating to harness, saddlery, and leatherware | 1 | ||||
| Processes relating to food, drink, and tobacco | 2 | 1 | 2 | 2 | 5 |
| Processes relating to wood, basketware, furniture, &c. | 2 | 2 | 1 | ||
| Processes relating to paper, stationery, printing, photography | 1 | 1 | |||
| Construction or repair of buildings, roads, and railways | 5 | 4 | 14 | 17 | 35 |
| Transport and communication | 3 | 7 | 7 | 4 | 12 |
| Ships, boats, &c. | 1 | ||||
| Commerce and finance | 9 | 9 | 7 | 13 | 32 |
| Public administration, clerical, and professional | 1 | 4 | 5 | 6 | 4 |
| Entertainment, sport, and recreation | 1 | 1 | |||
| Personal and domestic service | 5 | 2 | 4 | 5 | |
| Indefinite occupations | 14 | 6 | 7 | 17 | 23 |
| Totals | 50* | 46 | 52 | 74 | 148 |
The grade of occupation of persons adjudged bankrupt during each of the calendar years 1938–48 is given in the following table.
| Year. | Grade of Occupation. | |||
|---|---|---|---|---|
| Working for Wages. | Employer of Labour. | Working on Own Account but Not Employing Labour. | Totals. | |
* Includes 8 partnerships. † Includes 2 partnerships. ‡Includes 1 partnership. The occupation of each partner is included, but not the partnership. | ||||
| 1938 | 133 | 66 | 60 | 267* |
| 1939 | 149 | 49 | 67 | 267† |
| 1940 | 110 | 43 | 60 | 213 |
| 1941 | 88 | 27 | 50 | 165 |
| 1942 | 42 | 14 | 26 | 82 |
| 1943 | 21 | 9 | 15 | 45 |
| 1944 | 26 | 10 | 14 | 51‡ |
| 1945 | 22 | 5 | 18 | 45 |
| 1946 | 16 | 17 | 19 | 52 |
| 1947 | 27 | 18 | 29 | 74 |
| 1948 | 48 | 36 | 64 | 148 |
PRIVATE ASSIGNMENTS.—Official bankruptcies, as explained earlier, do not comprise all financial failures and, in order to obtain completeness, the bankruptcy statistics have been supplemented since 1928 by the collection of data relating to private assignments. The statistics cover all operations arising out of deeds of assignment made under section 167 (2) of the Stamp Duties Act, 1923.
If private assignments be added to bankruptcies, the total number of failures in 1947 was 97, made up of 74 bankruptcies and 23 assignments. The corresponding total for 1946 was 62 (52 bankruptcies and 10 assignments).
Amount of Liabilities.—The following table classifies estates assigned during the last five years available according to the amount of liabilities.
| Liabilities. | 1943. | 1944. | 1945. | 1946. | 1947. |
|---|---|---|---|---|---|
* Includes one estate in which the assignor was subsequently adjudged bankrupt, also one re-registration of a previously assigned estate. | |||||
| Under £100 | 1 | ||||
| £100 and under £250 | 1 | 1 | |||
| £250 and under £500 | 2 | 2 | 4 | ||
| £500 and under £1,000 | 1 | 1 | 4 | ||
| £1,000 and under £2,000 | 2 | 4 | 3 | 1 | 6 |
| £2,000 and under £5,000 | 4 | 6 | 6 | 3 | |
| £5,000 and over | 1 | 1 | 2 | 1 | |
| Unspecified | 2 | 2 | 3 | 5 | |
| Totals | 11 | 8 | 17 | 10 | 23* |
Twenty-five per cent. of the specified estates in the five years 1943–47 show liabilities below £1,000. In the case of official bankruptcies the corresponding figure was 77 per cent.
Occupations of Assignors.—The occupations of assignors in broad industrial classes during the last five years available were as follows:—
| 1943. | 1944. | 1945. | 1946. | 1947. | |
|---|---|---|---|---|---|
* Includes one estate in which the assignor was subsequently adjudged bankrupt, also one re-registration of a previously assigned estate. | |||||
| Forestry | 1 | ||||
| Processes relating to stone, clay, lime, cement, &c. | 1 | ||||
| Fibrous materials, textiles, &c. | 1 | ||||
| Clothing and dress | 1 | ||||
| Processes relating to wood, basketware, furniture, &c. | 1 | 1 | |||
| Construction or repair of buildings, roads, and railways | 5 | 3 | 8 | 5 | 10 |
| Transport and communication | 1 | 2 | 1 | ||
| Commerce and finance | 6 | 3 | 2 | 2 | 8 |
| Public administration, clerical and professional | 1 | ||||
| Personal and domestic service | 2 | ||||
| Indefinite occupations | 2 | 2 | |||
| Totals | 11 | 8 | 17 | 10 | 23* |
Of the 1947 total, 17 were employers of labour, and 6 were working on own account.
FOR many years it was customary to compile annually an estimate of the national wealth, the estimate of private wealth being based on data relating to estates passed for probate. War factors, including the loss of many young men on military service, have had the effect of making this source of information at present less reliable for an estimate of this nature, and this consideration has led to a temporary abandonment of the annual estimate. The resumption of the estimate as at 31st December, 1945, was contemplated, but an investigation disclosed that, on account of staff shortages, an abnormally large number of estates relating to deaths during the period under review had not been finally certified for estate duty by 31st December, 1945. Difficulties were also encountered in connection with the deaths and estates of members of the Armed Forces overseas. These factors, together with changing money values, still exert a marked influence on the calculation and, at present, make an estimate compiled from this source rather too unreliable. Any errors or omissions in the basic data are, of course, multiplied many-fold by the system of weighting the average value of estates for each quinquennial age-group by the number of living persons in the corresponding age-group. In this issue of the Year-Book the estimate computed from the estate data for the years 1938–40 has accordingly been repeated, and the public wealth figure has not been carried beyond 31st March, 1941.
PUBLIC WEALTH.—For many years the Treasury compiled annually, from details recorded in departmental balance-sheets, a State balance-sheet which was published in parliamentary paper B–1 [Pt. IV]. For various reasons arising out of war conditions, it was decided to suspend the preparation of this statement, and it has not yet been resumed. The statement last published showed the position as at 31st March, 1938. The total of State assets according to this amounted to £402,556,454; but, in order that the public debt may be fully accounted for, nominal assets were inserted for outstanding loan expenditure on war and other purposes in respect of which no material asset now exists. Partly on this account, and partly because certain State expenditure is already reflected in the value of property (public or private), it is necessary to make certain deductions from the “assets” in order to arrive at a figure which may be used as a component unit of an estimate of the value of property or wealth in New Zealand. The balance-sheet in summarized form, and particulars of the deductible items, may be found on pages 763–764 of the 1910 issue of the Year-Book. The resultant figure, which may be accepted as a rough approximation of the value of State property at 31st March, 1938, was £270,000,000. Later information is not available, but during the three years to 31st March, 1941, the increase in indebtedness in respect of items included was £32,000,000, and State assets at 31st March, 1941, may be assessed at £300,000,000.
In arriving at an estimate of the aggregate public wealth, as distinct from private wealth, it is also necessary to take into account the assets of local authorities. These (including sinking funds) amounted to approximately £96,000,000 at 31st March, 1938, and to £102,000,000 at 31st March, 1941 (refer page 426 of 1943 Year-Book).
It should be noted, however, that some £7,500,000 of the local authorities' total indebtedness at 31st March, 1941, was owing to the General Government, and allowance must be made for this amount. The public wealth at 31st March, 1941, based on the foregoing would thus be £300,000,000, plus £102,000,000, minus £7,500,000, making a net total of approximately £395,000,000.
PRIVATE WEALTH.—Estimates of the private wealth have been arrived at on the assumption that the wealth per head of the living is approximately equal to the average amount left by persons dying. The fact that the younger and more numerous members of the population do not possess as much accumulated wealth as the older members, taken in conjunction with the fact that the death-rate varies with age, renders it necessary for this purpose to divide the population into age-groups. The average wealth of persons dying within any one age-group being known, the average wealth of living persons belonging to that age-group was assumed to be identical, and an estimate of the total private wealth was arrived at by weighting the average wealth of persons in each quinquennial age-group by the number of persons in that group.
The average wealth of deceased persons was obtained by a consideration of the estates certified for stamp duty. The number of estates dealt with in any period, however, is usually equal to about one-third only of the total deaths registered during that period; and as most persons leave some estate, however small, it was necessary to make some allowance for estates which were not passed through the Stamp Duties Office. Estate and succession duties are based on the size of the estate and the degree of relationship of the beneficiary, and certain exemptions, particulars of which may be found in Section 24B, are provided for. Consequently, small estates on which no duties are payable are not to any large extent passed for probate or letters of administration. An arbitrary allowance was made for unrecorded estates of persons aged fifteen years and over. No allowance at all was made for estates of persons under fifteen.
Based on the estate and death figures for the triennium 1938–40, the aggregate private wealth estimate at the end of 1940 was £718,000,000, of which £497,000,000 represented the wealth of men and £221,000,000 that of women. Excluding Maoris, this total was equal to £458 per head of population, and £683 per head of population if only those aged twenty years and over were taken into account.
It is obvious that estimates of private wealth based on the probate system are approximate only, owing to the various factors involved. For example, part of the wealth of deceased estates consists of insurance policies. In the probate returns the maturity value of the policy is taken, whereas among the living the average surrender value of policies in force is much below the maturity value. Against this, however, is the fact that pensions and annuities enjoyed by the living do not enter into deceased estates, while there is also a tendency towards conservatism in the valuation of personal property for death duty purposes. Further, a not inconsiderable amount of property is disposed of before death by way of gift and does not appear in the probate returns.
It should be explained that the computation of private wealth relates to the population exclusive of Maoris. The inclusion of Maoris would not affect the per caput rate to any extent, but would involve an addition to the total. An addition for Maoris of 4 per cent. to the aggregate figure previously given for 1940 would bring the estimated private wealth at that date to £747,000,000.
Estates passed for Death Duty.—A table is now given showing the number and value of estates finally passed during 1943 to 1947 inclusive, classified according to amount. Estates of Maoris are here included.
| Amount. | 1943. | 1944. | 1945. | 1946. | 1947. |
|---|---|---|---|---|---|
| £ £ | Number of Estates | ||||
| Under 500 | 3,289 | 3,087 | 3,204 | 3,273 | 2,766 |
| 500 and under 1,000 | 1,930 | 1,840 | 1,949 | 1,879 | 1,831 |
| 1,000 and under 2,000 | 1,408 | 1,457 | 1,765 | 1,855 | 1,749 |
| 2,000 and under 3,000 | 631 | 677 | 788 | 821 | 768 |
| 3,000 and under 4,000 | 338 | 371 | 424 | 467 | 426 |
| 4,000 and under 5,000 | 238 | 214 | 268 | 292 | 307 |
| 5,000 and under 7,500 | 315 | 320 | 371 | 438 | 439 |
| 7,500 and under 10,000 | 177 | 167 | 217 | 216 | 252 |
| 10,000 and under 15,000 | 140 | 159 | 199 | 227 | 216 |
| 15,000 and under 20,000 | 68 | 65 | 78 | 88 | 103 |
| 20,000 and over | 116 | 135 | 146 | 141 | 164 |
| Totals | 8,650 | 8,492 | 9,409 | 9,697 | 9,021 |
| Amount. | 1943. | 1944. | 1945. | 1946. | 1947. |
|---|---|---|---|---|---|
| Aggregate Net Value of Estates | |||||
| £ | £ | £ | £ | £ | £ |
| Under 500 | 779,638 | 727,835 | 766,275 | 781,983 | 690,281 |
| 500 and under 1,000 | 1,398,757 | 1,325,848 | 1,421,839 | 1,368,884 | 1,343,358 |
| 1,000 and under 2,000 | 2,012,031 | 2,046,746 | 2,513,109 | 2,635,872 | 2,501,431 |
| 2,000 and under 3,000 | 1,547,448 | 1,647,798 | 1,931,051 | 2,004,243 | 1,869,620 |
| 3,000 and under 4,000 | 1,178,883 | 1,289,592 | 1,465,693 | 1,628,750 | 1,474,001 |
| 4,000 and under 5,000 | 1,074,332 | 955,905 | 1,195,890 | 1,310,376 | 1,367,588 |
| 5,000 and under 7,500 | 1,933,988 | 1,972,661 | 2,268,944 | 2,666,917 | 2,680,127 |
| 7,500 and under 10,000 | 1,523,814 | 1,446,599 | 1,860,343 | 1,860,212 | 2,171,904 |
| 10,000 and under 15,000 | 1,690,971 | 1,932,492 | 2,385,907 | 2,790,105 | 2,606,152 |
| 15,000 and under 20,000 | 1,189,267 | 1,117,535 | 1,327,867 | 1,499,582 | 1,759,138 |
| 20,000 and over | 4,676,740 | 5,538,836 | 6,944,728 | 5,917,698 | 6,350,672 |
| Totals | 19,005,869 | 20,001,847 | 24,081,646 | 24,464,622 | 24,814,272 |
The table below shows for the period 1943 to 1947 the total number of estates, classified according to age of deceased and amount of estate. These figures are inclusive of “nil” estates, but exclusive of Maoris.
| Age. | Under £500. | £500 to £999. | £1,000 to £1,999. | £2,000 to £2,999. | £3,000 to £3,999. | £4,000 to £4,999. | £5,000 to £7,499. | £7,500 to £9,999. | £10,000 to £14,999. | £15,000 to £19,999. | £20,000 and over. | Totals. |
|---|---|---|---|---|---|---|---|---|---|---|---|---|
| Under 5 years | 5 | 1 | 6 | |||||||||
| 5 and under 10 | 4 | 1 | 5 | |||||||||
| 10 and under 15 | 10 | 3 | 1 | 14 | ||||||||
| 15 and under 20 | 51 | 17 | 3 | 71 | ||||||||
| 20 and under 25 | 1,240 | 560 | 179 | 32 | 6 | 6 | 7 | 3 | 3 | 1 | 2 | 2,039 |
| 25 and under 30 | 837 | 695 | 355 | 82 | 24 | 15 | 23 | 3 | 4 | 3 | 3 | 2,044 |
| 30 and under 35 | 475 | 352 | 274 | 82 | 34 | 14 | 27 | 9 | 3 | 1 | 5 | 1,276 |
| 35 and under 40 | 355 | 225 | 170 | 70 | 35 | 16 | 22 | 6 | 11 | 4 | 4 | 918 |
| 40 and under 45 | 383 | 192 | 162 | 74 | 37 | 25 | 24 | 11 | 4 | 7 | 3 | 922 |
| 45 and under 50 | 495 | 275 | 251 | 108 | 55 | 40 | 43 | 17 | 11 | 6 | 6 | 1,307 |
| 50 and under 55 | 675 | 393 | 403 | 198 | 98 | 49 | 77 | 32 | 30 | 15 | 16 | 1,986 |
| 55 and under 60 | 1,071 | 636 | 631 | 239 | 125 | 86 | 123 | 62 | 49 | 29 | 39 | 3,090 |
| 60 and under 65 | 1,474 | 907 | 919 | 393 | 214 | 158 | 213 | 102 | 87 | 37 | 50 | 4,554 |
| 65 and under 70 | 1,714 | 1,164 | 1,103 | 504 | 299 | 196 | 266 | 175 | 134 | 59 | 101 | 5,715 |
| 70 and under 75 | 1,809 | 1,236 | 1,161 | 563 | 335 | 203 | 302 | 180 | 180 | 63 | 125 | 6,157 |
| 75 and under 80 | 1,582 | 1,141 | 1,082 | 562 | 314 | 203 | 286 | 191 | 167 | 58 | 130 | 5,716 |
| 80 and under 85 | 1,241 | 835 | 786 | 397 | 243 | 181 | 241 | 117 | 148 | 64 | 106 | 4,359 |
| 85 and under 90 | 669 | 421 | 437 | 238 | 129 | 81 | 139 | 95 | 83 | 36 | 68 | 2,396 |
| 90 and under 95 | 227 | 168 | 181 | 74 | 43 | 37 | 45 | 25 | 19 | 17 | 27 | 863 |
| 95 and over | 43 | 36 | 31 | 21 | 11 | 8 | 12 | 7 | 4 | 6 | 179 | |
| Unspecified | 436 | 147 | 91 | 38 | 21 | 5 | 11 | 9 | 4 | 1 | 5 | 768 |
| Totals | 14,796 | 9,404 | 8,221 | 3,675 | 2,023 | 1,323 | 1,861 | 1,044 | 941 | 401 | 696 | 44,385 |
| Per Cent. | 33.3 | 21.2 | 18.5 | 8.3 | 4.6 | 3.0 | 4.2 | 2.3 | 2.1 | 0.9 | 1.6 | 100.0 |
AN ESTIMATE OF NATIONAL WEALTH.—The public wealth of New Zealand at 31st March, 1941, has been estimated (supra) at approximately £395,000,000, and the private wealth, including that of Maoris, at the end of 1940 at approximately £750,000,000. In the probate figures used as a basis of computation of private wealthy, deductions are made on account of debts, mortgages, and other charges against property. As, however, these in general will rank as assets when estates to which the charges are owing are in their turn passed for probate, the general effect is negligible, except in so far as such items as State advances and debts owing overseas are concerned. The State advances outstanding are included in the public wealth figure.
In the case of the public wealth the figure given practically represents gross assets, no deduction having, of course, been made on account of indebtedness of the General Government and of local governing authorities. Were the whole of this indebtedness owing outside New Zealand, no deduction on this account would be necessary for the purpose of the present computation, which is merely to ascertain an approximation of the wealth of the country, without taking account of the fact that there are external charges against that wealth. In arriving at the sum of public and private wealth, however, it is necessary to make allowance for the internal indebtedness of the General Government and of local governing authorities, this being included in the private wealth estimate.
Of the gross indebtedness of the General Government at the 31st March, 1941, £190,000,000 was domiciled in New Zealand. Of the gross debt of local governing authorities (including Hospital Boards) at the same date, £50,000,000 was domiciled internally exclusive of the £7,500,000 borrowed from the General Government, allowance for which has already been made in the estimation of the approximate public wealth.
The Hospital Boards' debt may be assumed to be mainly domiciled in New Zealand. The debt of the General Government and all local authorities domiciled in New Zealand thus aggregated £240,000,000, which requires to be deducted from the aggregate of public and private wealth in order to arrive at an estimate of the national wealth. The figures, in round numbers, are:—
| £ | |
|---|---|
| Approximate public wealth | 395,000,000 |
| Estimated private wealth | 750,000,000 |
| Total | 1,145,000,000 |
| Less public and local-authority debt domiciled in New Zealand | 240,000,000 |
| Estimated national wealth | £905,000,000 |
It appears scarcely necessary to recapitulate reasons why the estimate given can be regarded at best as a rough approximation only. No practicable system has yet been devised that will permit of a reliably close estimation of national wealth being arrived at, and the difficulties in this respect are increased enormously during a period of changing values.
VALUE OF LAND HOLDINGS.—The bulk of the wealth of New Zealand is represented by land and improvements thereon. Particulars of the valuation of land are given in Section 27 of this book. Further information concerning the value of land, with particular reference to the distribution of land ownership among the population and also the utilization of land, is obtainable from the returns of land which are required to be furnished annually to the Commissioner of Taxes for the purpose of land-tax assessment. Statistics compiled from these returns were inaugurated for the land-tax year 1924–25 and were continued, with the exception of the year 1927–28, up to and including the tax-year 1929–30. The statistics were then discontinued for some years, and were resumed again commencing with the tax assessment-year 1939–40. Owing to staff difficulties arising out of the war it was again found necessary to suspend the compilation, and the latest figures are for the tax-year 1941–42. The complete statistical data compiled for 1941–42 were published in the Statistical Report on Prices, Wage-rates, &c., 1941, and a discussion of the results appears in the 1945 and earlier Year-Books. In the following pages, however, only the principal data are given.
The unimproved value of land used in these statistics is the value determined in accordance with the provisions of the Valuation of Land Act, 1925, and amendments. Information regarding the basis of valuation will be found in Section 27 of this Year-Book.
The ordinary exemption of up to £500 unimproved value which is allowed in nearly all instances excludes from the statistics a very large percentage of land holdings used solely for residential purposes. Freehold lands used or occupied by public or semi public interests are not taxable and are consequently not included in the statistical data. The general position is, therefore, that the statistics cover only those freehold lands which are used or occupied for private gain and which exceed £500 in unimproved value. Maori lands are only included in cases where the land is not in the occupation of the Maori owner or his trustee.
All land subject to one ownership is included in one return, irrespective of the situation of the land. Leased land is incorporated in the owner's return and not in the lessee's return unless the former belongs to one of the classes which are completely exempted from land-tax. Leased Crown lands are included when the lessee is taxable—i.e., in those cases where the unimproved value exceeds the capitalized value of the rent.
The table which follows summarizes the principal heads of information disclosed by the tabulation for the tax-year 1911–42, and relates to land held as at the 31st March, 1941.
The total unimproved value of land on the 1st April, 1941, was £277,541,575, and 64 per cent. of this amount is covered by these statistics. The exemption of holdings of less than £500 in value (of which a large number are suburban residential properties) is principally responsible for the wide difference between the coverage of rural and urban lands. Land classified in these statistics as rural, which approximately corresponds to land situated in counties, represents 73 per cent. of the total unimproved value of county land. The £51,756,191 unimproved value classed as urban, however, represents only 45 per cent. of the aggregate value of land in boroughs and independent town districts. The mixed rural and urban land has been disregarded in the calculation of the latter percentages.
LAND-TAX STATISTICS.—CLASS BY TYPE, TAX-YEAR 1941–42
| Type. | Number of Returns. | Number of Taxpayers. | Total Area. | Unimproved Value of Land. | Total Mortgages owing. | Tax assessed. |
|---|---|---|---|---|---|---|
| Acres. | £ | £ | £ | |||
| Class I.—Individuals and Partnerships | ||||||
| Rural or farming lands | 36,418 | 20,556 | 18,109,787 | 97,561,767 | 84,260,948 | 355,629 |
| Town lands or business-sites | 18,125 | 13,563 | 62,159 | 26,341,312 | 16,104,036 | 90,439 |
| Partly rural and partly town lands | 553 | 414 | 153,042 | 1,460,363 | 890,878 | 6,494 |
| Totals | 55,096 | 34,533 | 18,324,988 | 125,363,442 | 101,255,862 | 452,562 |
| Class II.—Deceased Persons' Estates, Trusts, &c. | ||||||
| Rural or farming lands | 3,718 | 2,929 | 2,497,409 | 14,275,659 | 8,087,710 | 91,933 |
| Town lauds or business-sites | 3,326 | 2,852 | 18,532 | 8,012,938 | 2,966,396 | 56,550 |
| Partly rural and partly town lands | 122 | 111 | 68,320 | 630,611 | 180,556 | 7,481 |
| Totals | 7,166 | 5,892 | 2,584,261 | 22,919,208 | 11,234,662 | 155,964 |
| Class III.—Maoris, Maori Land Hoards, Maori Trusts, &c. | ||||||
| Rural or farming lands | 1,731 | 1,728 | 858,359 | 3,251,327 | 101,090 | 7,645 |
| Town lands or business-sites | 41 | 41 | 802 | 489,120 | 23,000 | 1,747 |
| Partly rural and partly town lands | ||||||
| Totals | 1,772 | 1,769 | 859,161 | 3,740,447 | 124,090 | 9,392 |
| Class IV.—Companies | ||||||
| Rural or farming lands | 595 | 434 | 1,555,773 | 4,074,956 | 2,716,002 | 40,470 |
| Town lands or business-sites | 2,212 | 1,523 | 14,284 | 16,912,821 | 14,912,781 | 243,404 |
| Partly rural and partly town lands | 81 | 73 | 146,045 | 3,395,772 | 697,568 | 71,799 |
| Totals | 2,888 | 2,030 | 1,716,102 | 24,383,549 | 18,326,351 | 355,673 |
| Summary | ||||||
| Rural or farming lands | 42,462 | 25,647 | 23,021,328 | 119,163,709 | 95,165,750 | 495,677 |
| Town lands or business-sites | 23,704 | 17,979 | 95,777 | 51,756,191 | 34,006,213 | 392,140 |
| Partly rural and partly town lands | 756 | 598 | 367,407 | 5,486,746 | 1,769,002 | 85,774 |
| Grand Totals | 66,922 | 44,224 | 23,484,512 | 176,406,646 | 130,940,965 | 973,591 |
It should be explained that as the assessments are primarily based on ownership they may include both urban and rural lands. It is not possible, therefore, to classify completely lands included in land-tax returns according to whether they are urban or rural. To prevent the overstatement of the real position in regard to mixed lands through such a matter as the inclusion of a suburban section in a return otherwise covering a considerable area of farm land, the classification provides that where 75 per cent. or over of the total unimproved value represents rural or urban lands, as the case may be, the whole return is so classed. The mixed lands thus include only cases where neither rural nor urban land constitutes 75 per cent. of the total unimproved value.
Values of Holdings.—The next table shows the distribution, according to the amount of unimproved value, of all the holdings covered by the statistics. The insignificant total for holdings of under £500 unimproved value is due to the fact that, with few exceptions, such holdings are exempt from land-tax. Owing to the operation of the various exemptions, no fewer than 22,698, or 34 per cent., of the holdings covered by the statistics were not assessed for tax.
LAND-TAX STATISTICS.—AMOUNT OF UNIMPROVED VALUE, TAX-YEAR 1941–42
| Amount of Unimproved Value. | Number of Returns. | Number of Tax-payers. | Total Area. | Unimproved Value of Land. | Total Mortgages owing. | Tax assessed. |
|---|---|---|---|---|---|---|
| £ £ | Acres. | £ | £ | £ | ||
| Under 500 | 171 | 168 | 6,370 | 46,968 | 10,901 | 124 |
| 500– 599 | 5,713 | 3,967 | 426,413 | 3,207,729 | 2,052,668 | 1,432 |
| 600– 699 | 6,510 | 4,667 | 547,149 | 4,176,664 | 2,933,501 | 3,468 |
| 700– 799 | 5,092 | 3,490 | 486,759 | 3,780,177 | 2,944,431 | 3,698 |
| 800– 899 | 4,107 | 2,715 | 437,199 | 3,462,607 | 2,886,175 | 3,835 |
| 900– 999 | 3,509 | 2,292 | 444,105 | 3,309,547 | 2,713,278 | 4,467 |
| 1,000– 1,999 | 19,793 | 11,978 | 3,678,870 | 27,855,071 | 24,848,727 | 41,721 |
| 2,000– 2,499 | 4,830 | 2,844 | 1,522,002 | 10,753,094 | 9,801,054 | 18,886 |
| 2,500– 2,999 | 3,280 | 1,959 | 1,216,825 | 8,957,510 | 7,626,468 | 17,812 |
| 3,000– 3,999 | 4,056 | 2,469 | 1,814,042 | 13,928,258 | 11,563,367 | 26,504 |
| 4,000– 4,999 | 2,535 | 1,580 | 1,470,359 | 11,245,004 | 9,051,213 | 20,682 |
| 5,000– 5,999 | 1,603 | 999 | 1,210,658 | 8,765,584 | 7,335,623 | 17,016 |
| 6,000– 6,999 | 1,137 | 741 | 1,079,445 | 7,351,139 | 5,940,530 | 14,968 |
| 7,000– 7,499 | 461 | 312 | 418,320 | 3,327,234 | 2,623,314 | 7,308 |
| 7,500– 7,999 | 386 | 366 | 399,615 | 2,991,390 | 2,251,054 | 7,224 |
| 8,000– 8,999 | 676 | 658 | 776,181 | 5,726,929 | 4,616,669 | 17,189 |
| 9,000– 9,999 | 528 | 511 | 904,167 | 4,992,408 | 3,868,394 | 17,634 |
| 10,000– 14,999 | 1,328 | 1,304 | 2,497,169 | 15,961,945 | 11,820,812 | 104,422 |
| 15,000– 19,999 | 483 | 480 | 1,204,192 | 8,291,071 | 4,964,430 | 94,427 |
| 20,000– 29,999 | 412 | 412 | 1,447,919 | 9,903,371 | 4,353,343 | 141,834 |
| 30,000– 39,999 | 136 | 136 | 505,051 | 4,667,861 | 2,217,722 | 92,500 |
| 40,000– 49,999 | 66 | 66 | 283,372 | 2,953,652 | 943,668 | 66,345 |
| 50,000– 99,999 | 79 | 79 | 351,499 | 5,306,786 | 2,584,297 | 119,529 |
| 100,000 and over | 31 | 31 | 356,831 | 5,444,647 | 989,326 | 130,538 |
| Totals | 66,922 | 44,224 | 23,484,512 | 176,406,646 | 130,940,965 | 973,591 |
Figures are now given showing, by amount of unimproved value, the number of returns and the aggregate unimproved values held by each of the four classes of owners. The classes, which are here referred to by numbers, are shown in the table on page 587.
LAND-TAX STATISTICS.—CLASSES, BY AMOUNT OF UNIMPROVED VALUE, TAX-YEAR 1941–42
| Amount of Unimproved Value. | Number of Returns. | Total Unimproved Value. | ||||||
|---|---|---|---|---|---|---|---|---|
| Class I. | Class II. | Class III. | Class IV. | Class I. | Class II. | Class III. | Class IV. | |
| £ £ | £ | £ | £ | £ | ||||
| Under 500 | 105 | 48 | 18 | 28,941 | 13,949 | 4,078 | ||
| 500–599 | 4,902 | 508 | 187 | 116 | 2,758,611 | 281,282 | 103,900 | 63,936 |
| 600–699 | 5,536 | 631 | 205 | 138 | 3,551,958 | 405,223 | 131,176 | 88,307 |
| 700–799 | 4,319 | 495 | 169 | 109 | 3,206,810 | 366,411 | 125,920 | 81,036 |
| 800–899 | 3,431 | 408 | 154 | 114 | 2,892,442 | 343,964 | 130,103 | 96,098 |
| 900–999 | 2,983 | 309 | 116 | 101 | 2,812,879 | 291,655 | 109,324 | 95,689 |
| 1,000–1,999 | 16,627 | 1,968 | 534 | 664 | 23,375,580 | 2,787,816 | 749,064 | 942,611 |
| 2,000–2,499 | 4,065 | 474 | 108 | 183 | 9,041,788 | 1,062,720 | 241,087 | 407,499 |
| 2,500–2,999 | 2,699 | 368 | 64 | 149 | 7,372,918 | 1,003,339 | 173,801 | 407,452 |
| 3,000–3,999 | 3,236 | 506 | 87 | 227 | 11,107,857 | 1,741,426 | 295,103 | 783,872 |
| 4,000–4,999 | 2,001 | 325 | 36 | 173 | 8,881,176 | 1,442,994 | 157,489 | 763,345 |
| 5,000–5,699 | 1,273 | 213 | 24 | 93 | 6,962,954 | 1,164,419 | 129,055 | 509,156 |
| 6,000–6,999 | 863 | 172 | 15 | 87 | 5,581,426 | 1,113,149 | 97,320 | 559,244 |
| 7,000–7,499 | 361 | 57 | 4 | 39 | 2,605,927 | 412,485 | 28,440 | 280,382 |
| 7,500–7,999 | 303 | 54 | 4 | 25 | 2,347,174 | 419,813 | 31,049 | 193,354 |
| 8,000–8,999 | 489 | 114 | 6 | 67 | 4,143,389 | 962,013 | 50,879 | 570,648 |
| 9,000–9,999 | 381 | 81 | 5 | 61 | 3,597,613 | 769,660 | 47,368 | 577,767 |
| 10,000–14,999 | 925 | 203 | 12 | 188 | 11,057,874 | 2,418,977 | 139,546 | 2,315,548 |
| 15,000–19,999 | 288 | 92 | 3 | 100 | 4,933,386 | 1,585,835 | 51,306 | 1,720,544 |
| 20,000–29,999 | 213 | 93 | 8 | 98 | 5,107,311 | 2,248,303 | 191,024 | 2,356,733 |
| 80,000–39,999 | 54 | 28 | 3 | 51 | 1,826,151 | 950,104 | 103,306 | 1,788,300 |
| 40,000–49,999 | 25 | 11 | 6 | 24 | 1,110,073 | 492,944 | 262,997 | 1,087,638 |
| 50,000 and over | 17 | 8 | 4 | 81 | 1,059,204 | 610,727 | 387,112 | 8,694,390 |
| Totals | 55,096 | 7,166 | 1,772 | 2,888 | 125,363,442 | 22,919,208 | 3,740,447 | 24,383,549 |
Reference has already been made to the principles adopted in classifying holdings according to the type of land, and the next table shows the number of returns and the aggregate unimproved values of rural, urban, and mixed lands respectively.
LAND-TAX STATISTICS.—TYPE, BY AMOUNT OF UNIMPROVED VALUE, TAX-YEAR 1941–42
| Amount of Unimproved Value | Number of Returns. | Total Unimproved Value. | ||||
|---|---|---|---|---|---|---|
| Rural. | Urban. | Mixed. | Rural. | Urban. | Mixed. | |
| £ £ | £ | £ | £ | |||
| Under 500 | 59 | 112 | 16,341 | 30,627 | ||
| 500–599 | 2,274 | 3,397 | 42 | 1,261,955 | 1,921,554 | 24,220 |
| 800–699 | 2,902 | 3,560 | 48 | 1,866,656 | 2,278,711 | 31,297 |
| 700–799 | 2,545 | 2,515 | 32 | 1,891,558 | 1,864,746 | 23,873 |
| 800–899 | 2,208 | 1,850 | 49 | 1,862,846 | 1,558,442 | 41,319 |
| 900–999 | 1,983 | 1,483 | 43 | 1,871,988 | 1,397,136 | 40,423 |
| 1,000–1,999 | 13,504 | 6,073 | 216 | 19,306,481 | 8,244,087 | 304,503 |
| 2,000–2,499 | 3,682 | 1,091 | 57 | 8,209,742 | 2,417,363 | 125,989 |
| 2,500–2,999 | 2,608 | 637 | 35 | 7,119,152 | 1,742,098 | 96,260 |
| 3,000–3,999 | 3,164 | 837 | 55 | 10,831,821 | 2,854,743 | 191,694 |
| 4,000–4,999 | 2,034 | 475 | 26 | 9,052,668 | 2,077,998 | 114,338 |
| 5,000–5,999 | 1,282 | 292 | 29 | 7,012,883 | 1,595,970 | 156,731 |
| 6,000–6,999 | 889 | 230 | 18 | 5,746,327 | 1,485,932 | 118,880 |
| 7,000–7,499 | 354 | 100 | 7 | 2,556,785 | 720,189 | 50,260 |
| 7,500–7,999 | 307 | 72 | 7 | 2,379,717 | 557,426 | 54,247 |
| 8,000–8,999 | 538 | 126 | 12 | 4,560,443 | 1,064,768 | 101,718 |
| 9,000–9,999 | 424 | 96 | 8 | 4,007,964 | 907,518 | 76,926 |
| 10,000–14,999 | 977 | 330 | 21 | 11,691,248 | 4,005,697 | 265,000 |
| 15,000–19,999 | 331 | 137 | 15 | 5,678,347 | 2,356,828 | 255,896 |
| 20,000–29,999 | 271 | 131 | 10 | 6,515,291 | 3,147,137 | 240,943 |
| 30,000–39,999 | 69 | 61 | 6 | 2,359,857 | 2,097,094 | 210,910 |
| 40,000–49,999 | 29 | 32 | 5 | 1,284,431 | 1,434,442 | 234,779 |
| 50,000–99,999 | 24 | 50 | 5 | 1,482,371 | 3,427,203 | 397,212 |
| 100,000 and over | 4 | 17 | 10 | 546,837 | 2,568,482 | 2,329,328 |
| Totals | 42,462 | 23,704 | 756 | 119,163,709 | 51,756,191 | 5,486,746 |
Area of Holdings.—The area figures are of little value in the case of urban and mixed lands, as the returns are correct to the nearest quarter-acre only, and sections of less than one-eighth acre are treated as having no area at all. Furthermore the area is of less importance as a criterion of the value of an urban holding than is the case where a rural holding is concerned. The following summary, which gives information regarding area and value in conjunction, accordingly relates only to lands classified as rural.
LAND-TAX STATISTICS.—AREA AND UNIMPROVED VALUE, RURAL LANDS, TAX-YEAR 1941–42
| Area, in Acres. | Number or Returns. | Number of Tax-payers. | Total Area. | Unimproved Value. | ||||
|---|---|---|---|---|---|---|---|---|
| Total. | Per Return. | Per Acre. | ||||||
| Acres. | £ | £ | £ s. d. | |||||
| Under | 5 | 67 | 46 | 264 | 36,161 | 540 | 130 19 6 | |
| 5 and under | 10 | 473 | 348 | 3,515 | 354,955 | 750 | 100 19 8 | |
| 10 and under | 15 | 610 | 436 | 7,336 | 519,511 | 852 | 70 16 4 | |
| 15 and under | 20 | 514 | 391 | 8,875 | 471,316 | 917 | 53 2 1 | |
| 20 and under | 30 | 1,183 | 883 | 28,895 | 1,210,385 | 1,023 | 41 17 9 | |
| 30 and under | 40 | 1,090 | 795 | 38,346 | 1,241,849 | 1,139 | 32 7 8 | |
| 40 and under | 50 | 1,306 | 866 | 58,179 | 1,491,057 | 1,142 | 25 12 7 | |
| 50 and under | 75 | 3,642 | 2,149 | 219,590 | 4,526,166 | 1,243 | 20 12 3 | |
| 75 and under | 100 | 3,356 | 1,924 | 293,250 | 4,926,734 | 1,468 | 16 16 0 | |
| 100 and under | 150 | 5,924 | 3,163 | 712,106 | 10,110,084 | 1,707 | 14 3 11 | |
| 150 and under | 200 | 3,754 | 2,080 | 649,394 | 7,555,056 | 2,013 | 11 12 8 | |
| 200 and under | 250 | 3,133 | 1,714 | 693,342 | 6,921,317 | 2,209 | 9 19 8 | |
| 250 and under | 320 | 2,981 | 1,652 | 846,740 | 7,459,681 | 2,502 | 8 16 2 | |
| 320 and under | 400 | 2,382 | 1,401 | 854,984 | 6,669,493 | 2,800 | 7 16 0 | |
| 400 and under | 500 | 2,299 | 1,318 | 1,024,624 | 6,980,452 | 3,036 | 6 16 3 | |
| 500 and under | 640 | 2,286 | 1,398 | 1,289,206 | 7,979,082 | 3,490 | 6 3 9 | |
| 640 and under | 750 | 1,172 | 702 | 809,562 | 4,573,534 | 3,902 | 5 13 0 | |
| 750 and under | 1,000 | 1,733 | 1,062 | 1,496,538 | 7,567,477 | 4,367 | 5 1 2 | |
| 1,000 and under | 2,000 | 2,626 | 1,797 | 3,625,129 | 15,869,894 | 6,043 | 4 7 7 | |
| 2,000 and under | 3,000 | 818 | 594 | 1,972,486 | 7,079,783 | 8,655 | 3 11 9 | |
| 3,000 and under | 4,000 | 388 | 312 | 1,329,417 | 4,543,480 | 11,710 | 3 8 4 | |
| 4,000 and under | 5,000 | 200 | 166 | 890,353 | 2,410,456 | 12,052 | 2 14 2 | |
| 5,000 and under | 7,500 | 240 | 206 | 1,442,112 | 3,514,796 | 14,645 | 2 8 9 | |
| 7,500 and under | 10,000 | 93 | 91 | 847,279 | 1,587,028 | 16,194 | 1 17 6 | |
| 10,000 and under | 15,000 | 92 | 74 | 1,110,482 | 1,610,018 | 17,500 | 1 9 0 | |
| 15,000 and under | 20,000 | 39 | 31 | 663,057 | 676,717 | 17,352 | 1 0 5 | |
| 20,000 and under | 30,000 | 30 | 25 | 718,744 | 515,396 | 17,180 | 0 14 4 | |
| 30,000 and under | 40,000 | 10 | 9 | 350,956 | 165,039 | 16,504 | 0 9 5 | |
| 40,000 and under | 50,000 | 8 | 6 | 369,290 | 164,641 | 20,580 | 0 8 11 | |
| 50,000 and over | 8 | 8 | 667,277 | 432,151 | 54,019 | 0 12 11 | ||
| Totals | 42,462 | 25,647 | 23,021,328 | 119,163,709 | 2,806 | 5 3 6 | ||
THE most striking advance made in recent years in the presentation of economic statistics has been the growth, in most countries, of some form of national social accounting. Involving as it does a comprehensive and detailed accounting of the nation's economic transactions, an analysis of this nature provides a background of statistical data indispensable towards a proper understanding of current economic trends, and, perhaps even more important, it enables informed estimates of probable future trends to be made. Full information of the nature, and a proposed schemata for the construction, of social accounts has been published by the United Nations Organization,* and in terms of this report the social accounting approach may be defined briefly as follows:—
“Instead of seeking to build up a single total, such as the national income, an investigation is first made of the classification of accounting entities, of the types of accounts that they keep, and of the transactions into which they enter. In this way all the transacting entities of an economic system are classified into broad sectors such as productive enterprises, financial intermediaries, and final consumers, and a series of accounts for each of these sectors is set up, in which the separate entries represent economically distinct categories of transaction. Economic activity is represented by money flows and related book-keeping transactions, actual or imputed, between accounts. The national income and other similar aggregates are obtained from the system by selecting and combining the constituent entries in the accounts.”
Because of the lack of the necessary statistical information it is not yet possible in New Zealand to present a broad classification of this nature, and of necessity attention has been focused primarily on the relevant aggregates mentioned. The principal of these aggregates is that of “National Income,” which, in general terms, measures the total value of all incomes (before deduction of taxation) earned by the residents of New Zealand in producing the current output of goods and services.
Income can be earned in a variety of ways and accrues to individuals according to the manner in which they participate in current production. Salary and wage payments represent the return to labour for services rendered and include in this concept supplementary income in “kind” such as board and keep provided by the employer. Of considerable importance during the war years, the item “pay and allowances of Armed Forces,” while analagous to salary and wage payments when considering the source of such income, does not necessarily fit in with this concept when the former civilian occupation of the serviceman is considered. This fact must be taken into account in comparing the distributive shares of the various groups in the national income over the war period. Clothing, food, accommodation, and other income in “kind” supplied to members of the Armed Forces are included under this heading, as are also deferred-pay, mufti-allowance, and war-gratuity payments.
Rental value of owner-occupied houses is a non-monetary item representing the imputed not rental value (before payment of rates, but after deductions for depreciation, mortgage interest, insurance, and repairs and maintenance) of all owner-occupied houses (except farm houses).
“Other personal income” (excluding company dividends) represents the aggregate income of professional men, farmers, and individual traders, as well as income “Other than salary and wages” of salary and wage earners—e.g., rent, interest, &c. Included under this heading as current income are changes in balances of primary-produce stabilization accounts.
Company income represents the total income (distributed and undistributed) of companies. This means that dividends distributed to individuals are included under this heading, and to this extent the total of “Other personal income” is understated.
Apart from these incomes which result from current productive activities on the part of individuals receiving them, there are other incomes of a “non-productive” nature in the form of social security benefits, pensions, and interest on public debt.
* “Measurement of National Income and the Construction of Social Accounts”: Report of the subcommittee on National Income Statistics of the League of Nations Committee of Statistical Experts.
These “transfer” incomes, as they are called, do not arise from the current production of goods and services and must therefore be excluded from the national income. They do, however, form part of the intermediate concept of “private income,” which represents the aggregate of earned incomes and unearned “transfer” incomes received by or accruing to persons. Capital receipts—e.g., from deceased person's estates, repayment of debt, &c.—are, however, excluded both from “private income” and “national income.” It includes as income accruing but not actually received, undistributed incomes of companies. The deduction of direct taxation gives the concept of “private disposable income.”
It is generally accepted that only those incomes arising from production of goods and services of a “marketable” nature should be included as national income, and for this reason no attempt has been made to impute an income in cases where goods or services are both produced and consumed within the household—e.g., services of housewives, and produce of home gardens.
The addition to private income of Government and local-authority trading profits and lump-sum payments from the United Kingdom Government, and the deduction of “transfer” incomes as detailed above, gives the concept of “net national income at factor cost” or, more briefly, “national income,” which can be defined as the income (before tax) earned by, or accruing to the factors of production, in or only temporarily absent from New Zealand, in producing the current output of goods and services of all kinds. The further addition of indirect taxes (net of subsidies) is necessary to bring the net national income to market price valuation.
Gross national product is obtained by adding depreciation allowances to net national income at market prices, and represents the value of current output before deduction of allowances for depreciation and obsolescence and is equal on the expenditure side to “gross national expenditure.”
The following table shows the principal of the above aggregates and the manner in which they are derived one from the other for the years 1938–39 to 1948–49:—
PRINCIPAL INCOME AGGREGATES £ (million)
| —– | 1938–39. | 1939–40. | 1940–41. | 1941–42. | 1942–43. | 1943–44. | 1944–45. | 1945–46. | 1946–47. | 1947–48. | 1948–49.* |
|---|---|---|---|---|---|---|---|---|---|---|---|
* Provisional. NOTE.—The numbers in parentheses after the items refer to items in the tables given on pages 596–598. | |||||||||||
| Private income (26) | 200.1 | 217.0 | 237.3 | 259.3 | 297.9 | 333.1 | 341.0 | 364.4 | 395.3 | 445.7 | 462.0 |
| Plus Government trading income (6) | 8.7 | 10.4 | 11.9 | 13.4 | 16.6 | 17.9 | 14.5 | 15.3 | 14.5 | 13.4 | 12.0 |
| Lump-sum payments from United Kingdom Government (7) | 3.0 | 3.0 | 3.0 | 3.0 | 3.0 | 5.0 | 5.0 | 5.0 | 5.0 | ||
| Less transfer incomes— | |||||||||||
| Social security benefits and pensions (22) | -7.7 | -11.5 | -12.5 | -12.9 | -14.4 | -15.8 | -17.6 | -20.9 | -34.8 | -37.6 | -39.5 |
| Interest on public debt paid in New Zealand (8) | -7.0 | -7.5 | -7.8 | -8.4 | -9.4 | -11.3 | -12.9 | -13.8 | -15.1 | -15.3 | -15.5 |
| Net national income at factor cost (National Income) (9) | 194.1 | 211.4 | 231.9 | 254.4 | 293.7 | 326.9 | 330.0 | 350.0 | 364.9 | 411.2 | 419.0 |
| Plus indirect taxation (10) | 20.6 | 21.0 | 22.3 | 23.2 | 27.9 | 31.8 | 34.0 | 37.3 | 43.0 | 53.0 | 46.0 |
| Less subsidies (11) | -0.6 | -0.5 | -1.6 | -2.7 | -3.3 | -3.1 | -4.6 | -6.6 | -11.8 | -13.6 | -12.0 |
| Net national income at market prices (12) | 214.1 | 231.9 | 252.6 | 274.9 | 318.3 | 355.6 | 359.4 | 380.7 | 396.1 | 450.6 | 453.0 |
| Plus depreciation allowances (13) | 15.0 | 16.0 | 16.0 | 16.0 | 17.0 | 17.0 | 19.0 | 20.0 | 22.0 | 25.0 | 27.0 |
| Gross national product (14) | 229.1 | 247.9 | 268.6 | 290.9 | 335.3 | 372.6 | 378.4 | 400.7 | 418.1 | 475.6 | 480.0 |
The estimates are based primarily on details of receipts from the social security charge under the Social Security Act of 1938. This charge is levied at a flat rate on the incomes of all individuals over the age of sixteen years and on all companies trading in New Zealand. The charge is deductible at source in the ease of salary and wage payments, but is payable during the year following that in which the income is earned in the case of income “other than salaries and wages” of individuals and company incomes.
No allowance has been made for possible evasion of taxation in the estimates, nor has it been possible to take into account “negative” income, or losses of previous years allowed as a set off against current profits for taxation purposes.
The various aggregates are conventionally measured over a given period of time and this in New Zealand is taken as the year ending 31st March. Values in all cases are in terms of New Zealand currency.
Full details of the methods used and a description of the items shown in the following tables are given in the report entitled “Official Estimates of National Income and Expenditure, 1938–39 to 1948–49,” issued as a supplement to the June-July, 1949, issue of the Monthly Abstract of Statistics.
NATIONAL INCOME AND EXPENDITURE.—Despite considerable difficulty as a result of a lack of certain necessary statistical information, preliminary estimates of national expenditure have been made covering the years 1938–39, 1943–44, and 1946–47 to 1948–49. These estimates should be used with caution, but, provided their limitations are realized, they give a broad indication of the manner in which the national expenditure has been channelled over a period covering the last, pre-war year, the peak war year, and three years of reconversion following the cessation of hostilities.
Unfortunately, the method necessarily adopted does not allow a check to be made on the present national income aggregates, in which no allowances have been made for any possible understatement of incomes shown in the taxation returns on which the estimates are based. Neither do they take into account “negative” incomes nor losses of previous years allowed as a set-off against current profits for taxation purposes. Any understatement of the gross product total arising from these omissions will therefore be reflected in a similar understatement of “personal consumption” which is shown as a residual item in the break-up of national expenditure (refer table on page 596). Direct estimates are made of current Government expenditure on goods and services, gross capital formation in New Zealand, and the balance of overseas payments on current account (exports less imports).
This treatment has the advantage in an analysis of private income and outlay (table on page 597) of allowing an estimate of private savings to be made, again as a residual item, by deducting direct taxation, and “personal consumption” from total private income. Being a residual item, “personal consumption” will naturally incorporate all the errors of the estimates, but the major apparent error—i.e., that of understatement for the purpose of tax evasion—is cancelled out by a similar error in both the private income and personal consumption totals. Thus private savings, while necessarily including other errors of the estimates, is not distorted by the factor mentioned above.
The various tables are given and their derivation and composition discussed later in this Section, but before presenting this detail it is of interest to examine the relationships existing between some of the more important aggregates. The following table gives the principal of these.
PRINCIPAL AGGREGATES AND THEIR RELATIONSHIPS
| —– | 1938–39. | 1943–44. | 1946–47. | 1947–48. | 1948–49.* |
|---|---|---|---|---|---|
* Provisional. NOTE.—The numbers in parentheses after the items refer to items in the tables given on pages 596–598. | |||||
| National income (9) £(m.) | 194 | 327 | 365 | 411 | 419 |
| Gross national product (14) £(m.) | 229 | 373 | 418 | 476 | 480 |
| Personal consumption (15) £(m.) | 150 | 180 | 260 | 295 | 310 |
| As percentage of gross national product | 66 | 48 | 62 | 62 | 65 |
| Gross capital formation in New Zealand (17) £(m.) | 53 | 36 | 73 | 123 | 99 |
| As percentage of gross national product | 23 | 10 | 17 | 26 | 21 |
| Current Government expenditure £(m.) on goods and services (16) | 32 | 161 | 55 | 63 | 65 |
| As percentage of gross national product | 14 | 43 | 13 | 13 | 14 |
| Private income (26) £(m.) | 200 | 333 | 395 | 446 | 462 |
| Private savings (29) £(m.) | 26 | 78 | 57 | 74 | 59 |
| As percentage of private income | 13 | 23 | 14 | 17 | 13 |
The influence of the war on the economy is clearly indicated in this table by the marked changes that have occurred in the figures over a relatively short space of time. National income has more than doubled over the eleven years, moving from £194(m.) in 1938–39 to £419(m.) in 1948–49, an increase of 116 per cent. In 1948–49, however, an increase of only 2 per cent. is shown over the previous year. This small change following the 13-per-cent. increase in the national income in 1947–48 indicates a levelling-off as the economy reaches its peak of post-war reconversion.
From comparative normality in 1938–39, when 66 per cent. of the gross national product was expended on personal consumption and 23 per cent. on gross capital formation in New Zealand, these percentages had changed by 1943–44, the peak war year, to 48 per cent. and 10 per cent. respectively. The percentage of the gross national product going to finance current Government expenditure on goods and services (including all expenditure on war and defence) had increased over the same period from 14 per cent. to 43 per cent. Thus, after allowing for normal Government expenditure, at the peak of the war approximately one-third of our national expenditure was being used to finance our war effort.
The reconversion to a peacetime economy is shown by the trends indicated for the years 1946–47, 1947–48, and 1948–49. Personal consumption has almost regained its pre-war level, having risen to 65 per cent. of gross national product in 1948–49, while gross capital formation in New Zealand, which took 17 per cent. of gross national product in 1946–47, had risen to take 26 per cent. in 1947–48, this percentage falling again to 21 per cent. in 1948–49. The reason for this fluctuation can be found in the very heavy investment in stocks taking place in 1947–48 and in lesser measure in 1948–49, during which years to a large extent wartime depletions in inventories were overcome. Private savings over the five years have shown marked variations, moving from 13 per cent. of private income in 1938–39 to 23 per cent. in 1943–14. By 1946–47 this ratio had dropped again to 14 per cent., but in 1947–48, owing mainly to the time-lag between assessment and payment of the main direct taxes, had risen to 17 per cent. In 1947–48 taxation shown as a deduction from that year's income was mainly attributable to 1946–47 income, which was at a much lower level. Correspondingly a large part of the direct taxation paid on 1947–48 incomes is not deducted until 1948–49. Thus in 1947–48, when a substantial increase in private income took place, an increase in savings is shown, partly due to this difference between tax due on the income earned in that year and tax paid from that income. After making due allowance for this factor, however, the trend of savings as a percentage of private income indicates a steep rise during the war years followed by a return to the pre-war position by 1946–47, but levelling-off somewhat and dropping further in 1948–49. It must be realized that private savings in this sense is obtained from the identity that private income = personal consumption + direct taxation + private savings, and therefore savings is that part of private disposable income that is not spent on personal consumption and will thus include, besides direct monetary saving, capital expenditure by persons from current income, principally in the form of property purchase and construction. It also includes undistributed profits of companies and such items as changes in balances of primary produce stabilization accounts, so that no direct comparison can be made between the series given and any series showing purely monetary savings.
The following four tables give the complete detail of the various aggregates already mentioned and the manner in which they are derived from the accounts covering the different sectors of the economy.
National Income and Expenditure.—This table gives the composition of the gross national product and the manner in which it has been expended—i.e., gross national expenditure. As mentioned previously, “personal consumption” is obtained as a residual item in this table, all other aggregates being obtained by direct assessment.
Private Income and Outlay.—This table gives in detail the break-up of private income into the various factor incomes and, on the expenditure side, the manner in which these incomes are spent on personal consumption, paid in direct taxation, or saved. A breakup of “other personal income” is given for each of the years except 1943–44, when this detail was not available. The total of personal consumption derived from the preceding table is carried forward to this table, and this time private savings is obtained as a residual item. The limitations of these two residual items have already been mentioned (refer to page 593) and, for the reasons given, care should be taken in their use.
It is not possible at present to analyse company income further, and for this reason “other personal income” excludes company dividends, and private savings necessarily includes undistributed company profits.
General Government and Local Authority Revenue Account.—The Government sector is discussed in more detail later in this Section, but this table gives a consolidated statement of General Government and local authority revenue and expenditure, showing as a balance that portion of the revenue which is made available for capital investment in the ease of a surplus, or the call on private savings made necessary by a deficit. The effects of the heavy war expenditure in 1943–44 are indicated by the exceptional expenditure on goods and services in that year (principally on war and defence), and the consequent negative balance of £63(m.) in the account.
Combined Capital Account.—This account indicates the manner in which finance for capital formation has been made available (a) from private savings, (b) from revenue surpluses of Government, and (c) from amounts set aside as depreciation allowances from income. Gross capital formation represents the construction in New Zealand or purchase from overseas of durable capital assets both by the private and Government sectors, plus the net investment in stocks by trading concerns. This latter figure is one on which little information is at present available, and the allowances made to cover it are based on indirect assessments made with reference to such things as the abnormal level of imports in a given year, and for this reason may be subject to considerable variation when more detailed information becomes available. The net change in overseas assets is the contra item to “exports less imports” shown in the national income and expenditure table, and, in the absence of comprehensive balance of payments figures for New Zealand, is an estimate of the change in overseas investments consequent on this movement in the balance of payments on current account. Once again the effects of war finance are clearly discernible, in 1943–44 the major part of total available funds going to finance the Government deficit principally incurred on account of war expenditure. The process of reconversion from 1946–47 onwards, apart from abnormal restocking by trading concerns, is indicated by the figures of gross capital formation which indicate that, notwithstanding shortages of certain essential materials, wartime-enforced postponements of purchase and construction of capital equipment are being gradually overcome.
These four tables, then, give a comprehensive picture in broad terms of the changing pattern of New Zealand's economy over a period of eleven years which have seen the dislocating effects of a major war. One important point to consider when examining this picture, however, is that all the figures given represent “values,” and consequently are inflated to a greater or less extent by price movements over the period. In the absence of any price index of a sufficiently wide coverage to deflate the various aggregates, it is necessary to recognize this fact and wherever possible make some allowance for it.
The following are the four tables mentioned:—
NATIONAL INCOME AND EXPENDITURE £(million)
| Income. | 1938–39. | 1943–44. | 1946–47. | 1947–48. | 1948–49.* |
|---|---|---|---|---|---|
* Provisional | |||||
| 1. Salary and wage payments | 111 | 141 | 187 | 211 | 226 |
| 2. Pay and allowances of Armed Forces | 1 | 58 | 8 | 6 | 4 |
| 3. Rental value, owner-occupied houses | 6 | 8 | 9 | 9 | 10 |
| 4. Other personal income | 54 | 73 | 108 | 128 | 133 |
| 5. Company income | 20 | 37 | 48 | 54 | 50 |
| 6. Government and local-authority trading income | 9 | 18 | 15 | 13 | 12 |
| 7. Lump-sum payments from United Kingdom Government | 3 | 5 | 5 | ||
| 8. Less public debt interest paid in New Zealand | -7 | -11 | -15 | -15 | -16 |
| 9. Net national income at factor cost | 194 | 327 | 365 | 411 | 419 |
| 10. Plus indirect taxation | 21 | 32 | 43 | 53 | 46 |
| 11. Less subsidies | -1 | -3 | -12 | -13 | -12 |
| 12. Net national income at market prices | 214 | 356 | 396 | 451 | 453 |
| 13. Plus depreciation allowances | 15 | 17 | 22 | 25 | 27 |
| 14. Gross national product | 229 | 373 | 418 | 476 | 480 |
| Expenditure. | 1938–39. | 1943–44. | 1946–47. | 1947–48. | 1948–49.* |
| 15. Personal consumption | 150 | 180 | 260 | 295 | 310 |
| 16. Current Government expenditure on goods and services | 32 | 161 | 55 | 63 | 65 |
| 17. Gross capital formation in New Zealand | 53 | 36 | 73 | 123 | 99 |
| 18. Exports less imports | -6 | -4 | 30 | -5 | 6 |
| 19. Gross national expenditure | 229 | 373 | 418 | 476 | 480 |
PRIVATE INCOME AND OUTLAY £(million)
| Income. | 1938–39. | 1943–44. | 1946–47. | 1947–48. | 1948–49.* |
|---|---|---|---|---|---|
* Provisional. | |||||
| 20. Salary and wage payments | 111 | 141 | 187 | 211 | 226 |
| 21. Pay and allowances of Armed Forces | 1 | 58 | 8 | 6 | 4 |
| 22. Social security benefits and pensions | 8 | 16 | 35 | 38 | 39 |
| 23. Rental value of owner-occupied houses | 6 | 8 | 9 | 9 | 10 |
| 24. Other personal income:— | |||||
| (a) Professional occupations | 5 | 9 | 11 | 12 | |
| (b) Commerce, trade, or business | 9 | 21 | 24 | 26 | |
| (c) Farming | 25 | 47 | 60 | 64 | |
| (d) Changes in balances in primary produce stabilization accounts | -2 | 73 | +10 | +12 | +9 |
| (e) Interest, rent, &c. | 15 | 16 | 16 | 16 | |
| (f) Other | 2 | 5 | 5 | 6 | |
| 25. Company income (before distribution) | 20 | 37 | 48 | 54 | 50 |
| 26. Private income (before tax) | 200 | 333 | 395 | 446 | 462 |
| Outlay. | 1938–39. | 1943–44. | 1946–47. | 1947–43. | 1948–49.* |
| 27. Personal consumption | 150 | 180 | 260 | 295 | 310 |
| 28. Direct taxation | 24 | 75 | 78 | 77 | 93 |
| 29. Private savings | 26 | 78 | 57 | 74 | 59 |
| 30. Private outlay | 200 | 333 | 395 | 446 | 462 |
GENERAL GOVERNMENT AND LOCAL AUTHORITIES—REVENUE ACCOUNT £(million)
| Revenue. | 1938–39. | 1943–44. | 1946–47. | 1947–48. | 1948–49.* |
|---|---|---|---|---|---|
* Provisional. | |||||
| 31. Taxation— | |||||
| (a) Direct | 24 | 76 | 79 | 79 | 94 |
| (b) Indirect | 21 | 32 | 43 | 53 | 46 |
| 32. Trading income | 9 | 18 | 15 | 13 | 12 |
| 33. Less direct taxes paid by Government trading undertakings | -1 | -1 | -2 | -1 | |
| 34. Lump-sum payments from United Kingdom Government | 3 | 5 | 5 | ||
| 35. Total revenue | 54 | 128 | 141 | 148 | 151 |
| Expenditure. | 1938–39. | 1943–44. | 1946–47. | 1947–48. | 1948–49.* |
| 36. Current expenditure on goods and services | 32 | 161 | 55 | 63 | 65 |
| Transfers to Private Income— | |||||
| 37. Social security benefits and pensions | 8 | 16 | 35 | 38 | 39 |
| 38. Interest on public debt paid in New Zealand | 7 | 11 | 15 | 15 | 16 |
| 39. Subsidies | 1 | 3 | 12 | 13 | 12 |
| 40. Balance of revenue available for capital formation | 6 | -63 | 24 | 19 | 19 |
| 41. Total expenditure (+ or - revenue balances) | 54 | 128 | 141 | 148 | 151 |
COMBINED CAPITAL ACCOUNT £(million)
| Revenue. | 1938–39. | 1943–44. | 1946–47. | 1947–48. | 1948–49.* |
|---|---|---|---|---|---|
* Provisional. | |||||
| Savings | |||||
| 42. Private savings | 26 | 78 | 57 | 74 | 59 |
| 43. Revenue balances: General Government and local authorities | 6 | -63 | 24 | 19 | 19 |
| 44. Depreciation allowances | 15 | 17 | 22 | 25 | 27 |
| 45. Total funds available | 47 | 32 | 103 | 118 | 105 |
| Expenditure. | 1938–39. | 1943–44. | 1940–47. | 1947–48. | 1948–49.* |
| Investment | |||||
| 46. Gross capital formation in New Zealand | 53 | 36 | 73 | 123 | 99 |
| 47. Net change in overseas assets | -6 | -4 | +30 | -5 | + 6 |
| 48. Total investment | 47 | 32 | 103 | 118 | 105 |
THE GOVERNMENT SECTOR.—The part played by Government, including in this sense local authorities as well as the General Government, in redirecting the expenditure of that portion of the national income transferred to it from the private sector by way of taxation and trading Department profits, becomes of increasing importance as the Government assumes wider responsibilities in the social and economic fields. The changes in these directions in New Zealand are quite apparent from an examination of the tables of General Government and local authority revenue and expenditure covering the years 1938–39, 1943–44, and 1946–47 to 1948–49, which are given later in this Section.
General Government.—The revenue account of the General Government has been obtained by an analysis of the various accounts within the public account, and represents a consolidated statement of Government revenue and expenditure. In the case of trading Department operations, which are treated separately, profits only are brought into the main account as a revenue item. Expenditure has been taken “net” in all cases, sundry departmental receipts, &c., being set-off against departmental expenditure. The account covers only revenue items, and therefore excludes capital receipts and payments of all kinds, thus accounting in part for the differences between the details given here and those given in the published statement of the public accounts in parliamentary paper B-1 [Pt. I]. In order that the differences between these two sets of figures may be appreciated a reconciliation table is also given later.
Varying movements in different avenues of Government expenditure are apparent from the next table. Current expenditure on goods and services moved from £23,400,000 in 1938–39 to £154,700,000 in 1943–44, the peak war year, when expenditure on war and defence was at an unprecedented level. By 1948–49 expenditure on goods and services stood at £52,300,000, but while in actual amount this represented an increase of 124 per cent. over 1928–39, expressed as a percentage of gross national product the increase was only from 10 per cent. in the former year to 11 per cent. in the latter year. The large increases in transfers to private income by way of monetary social security benefits and interest on the public debt, from £12,400,000 in 1938–39 to £52,800,000 in 1948–49, and in subsidies from £600,000 to £12,000,000 over the same period are largely due to Government social legislation. They have undoubtedly been the principal cause of the substantial increase in taxation over the eleven years, but when their over-all effect and purpose is realized, that of merely redistributing the national income among different income groups and not reducing it in any way, the large increases shown are seen in their correct perspective principally as pure “transfer” items.
The balance of revenue available for capital formation represents the excess of revenue over expenditure after net expenditure on normal current Government activities has been allowed for. This balance is available for the carrying-out of necessary capital works and purchase of equipment, or the repayment of debt. Where there is an excess of expenditure over revenue, as was the case in 1943–44, the deficit must be met by a call on private savings in New Zealand, or a decrease in net overseas investments.
Local Authorities.—The revenue account of local authorities is in all respects similar to that of the General Government and has been obtained by an analysis of the accounts of all local authorities, including Hospital Boards. The limitations in the scope of local-government activities as compared with those of the General Government does not call for a detailed analysis of expenditure items, and therefore current expenditure on goods and services by local authorities is shown as a single total in the table following relating to local authorities.
The comparatively unvarying nature of total local authority revenue and expenditure is shown by the small movements that have taken place in the figures over a period of eleven years, current expenditure on goods and services moving only from £8,400,000 in 1938–39 to £12,800,000 in 1948–49. Expressed as a percentage of gross national product, this represents an actual decrease from 4 per cent. to 3 per cent. over the period.
GENERAL GOVERNMENT—REVENUE ACCOUNT
| £(million) | |||||
|---|---|---|---|---|---|
* Provisional. † Employment promotion. | |||||
| Revenue. | 1938–39. | 1943–44. | 1946–47. | 1947–48. | 1948–49.* |
| 1. Taxation— | |||||
| (a) Direct— | |||||
| Income-tax | 9.3 | 31.3 | 32.1 | 36.6 | 49.0 |
| Social security taxation | 5.5† | 13.4 | 22.4 | 26.2 | 29.4 |
| National security tax | 19.2 | 9.4 | 0.8 | ||
| Land-tax | 1.1 | 1.0 | 0.9 | 0.9 | 0.9 |
| Death duties | 1.8 | 4.5 | 6.0 | 5.7 | 6.0 |
| Other | 0.1 | 0.2 | 0.1 | ||
| Totals | 17.8 | 69.6 | 70.9 | 70.2 | 85.3 |
| (b) Indirect— | |||||
| Sales tax | 3.6 | 12.7 | 15.6 | 15.9 | 14.1 |
| Customs and excise duty | 11.7 | 13.9 | 20.0 | 28.8 | 23.7 |
| Motor-vehicles taxation | 3.1 | 1.7 | 3.0 | 3.5 | 3.6 |
| Other | 1.6 | 2.9 | 3.6 | 3.9 | 3.7 |
| Totals | 20.0 | 31.2 | 42.2 | 52.1 | 45.1 |
| 2. Total, all taxation | 37.8 | 100.8 | 113.1 | 122.3 | 130.4 |
| 3. Trading Income | 5.4 | 13.3 | 10.7 | 9.9 | 8.8 |
| 4. Less direct taxation paid by trading Departments | -0.2 | -1.0 | -1.1 | -1.4 | -1.2 |
| Totals | 5.2 | 12.3 | 9.6 | 8.5 | 7.6 |
| 5. Lump-sum payments from United Kingdom Government | 3.0 | 5.0 | 5.0 | ||
| 6. Total revenue | 43.0 | 116.1 | 127.7 | 135.8 | 138.0 |
| 7. Current Expenditure on Goods and Services— | |||||
| (a) General Administration | 2.2 | 1.8 | 3.6 | 5.0 | 7.9 |
| (b) Interest on General Government debt paid overseas | 6.8 | 6.6 | 4.7 | 4.7 | 3.3 |
| (c) Law and order | 0.8 | 0.8 | 1.1 | 1.1 | 1.3 |
| (d) Development of primary and secondary industries | 0.7 | 1.3 | 2.0 | 3.3 | 4.0 |
| Social Services— | |||||
| (e) Health | 0.8 | 1.4 | 2.1 | 2.4 | 2.8 |
| (f) Education | 4.2 | 4.8 | 7.0 | 8.4 | 9.2 |
| (g) Non-monetary social security benefits | 4.5 | 6.2 | 7.0 | 7.9 | |
| (h) Other | 3.3† | 0.4 | 0.4 | 0.4 | 0.4 |
| (i) Defence and war | 2.1 | 131.2 | 11.6 | 11.9 | 8.0 |
| (j) Rehabilitation | 0.4 | 2.5 | 2.8 | 2.4 | |
| (k) Maintenance of public works and services | 2.5 | 1.5 | 4.6 | 5.3 | 5.1 |
| Totals | 23.4 | 154.7 | 45.8 | 52.3 | 52.3 |
| Transfers to Private Income— | |||||
| 8. Monetary social security benefits and pensions | 7.7 | 15.8 | 34.8 | 37.6 | 39.5 |
| 9. Interest on General Government debt paid in New Zealand | 4.7 | 9.0 12.9 | 13.1 | 13.3 | |
| Totals | 12.4 | 24.8 | 47.7 | 50.7 | 52.8 |
| 10. Transfers to Local Authorities— | |||||
| (a) Hospital Boards | 0.9 | 1.1 | 2.0 | 3.2 | 4.9 |
| (b) Other | 4.2 | 1.3 | 1.6 | 1.7 | 1.7 |
| Totals | 5.1 | 2.4 | 3.6 | 4.9 | 6.6 |
| 11. Subsidies— | |||||
| (a) Shipping, transport, and incidental | 0.2 | 1.2 | 3.1 | 2.6 | |
| (b) Coal production and distribution | 0.5 | 1.7 | 1.5 | 1.9 | |
| (c) Primary production | 0.4 | 0.8 | 1.2 | 1.4 | 0.6 |
| (d) Essential clothing and foodstuffs | 0.2 | 1.6 | 7.5 | 7.5 | 6.8 |
| (e) Miscellaneous | 0.2 | 0.1 | 0.1 | ||
| Totals | 0.6 | 3.1 | 11.8 | 13.6 | 12.0 |
| 12. Total expenditure | 41.5 | 185.0 | 108.9 | 121.5 | 123.7 |
| 13. Balance of revenue available for capital formation | 1.5 | -68.9 | 18.8 | 14.3 | 14.3 |
| 14. Total revenue | 43.0 | 116.1 | 127.7 | 135.8 | 138.0 |
LOCAL AUTHORITIES—REVENUE ACCOUNT
£(million)
| Revenue. | 1938–39. | 1943–44. | 1946–47. | 1947–48. | 1948–49.* |
|---|---|---|---|---|---|
* Provisional. | |||||
| 15. Taxation— | |||||
| (a) Direct: Rates | 6.2 | 6.9 | 8.4 | 8.6 | 9.0 |
| (b) Indirect: Licence fees | 0.6 | 0.6 | 0.8 | 0.9 | 0.9 |
| Totals | 6.8 | 7.5 | 9.2 | 9.5 | 9.9 |
| 16. Trading income | 3.3 | 4.6 | 3.8 | 3.5 | 3.2 |
| 17. Grants from General Government | 5.1 | 2.4 | 3.6 | 4.9 | 6.6 |
| 18. Total revenue | 15.2 | 14.5 | 16.6 | 17.9 | 19.7 |
| Expenditure. | 1938–39. | 1943–44. | 1946–47. | 1947–48. | 1948–49.* |
| 19. Current expenditure on goods and services | 8.4 | 6.6 | 9.1 | 10.8 | 12.8 |
| 20. Interest on local-authority debt paid in New Zealand | 2.3 | 2.3 | 2.2 | 2.2 | 2.2 |
| 21. Total expenditure | 10.7 | 8.9 | 11.3 | 13.0 | 15.0 |
| 22. Balance of revenue available for capital formation | 4.5 | 5.6 | 5.3 | 4.9 | 4.7 |
| 23. Total revenue | 15.2 | 14.5 | 16.6 | 17.9 | 19.7 |
RECONCILIATION BETWEEN CONSOLIDATED FUND SURPLUS AND BALANCE OF REVENUE AVAILABLE FOR CAPITAL FORMATION PER NATIONAL INCOME ACCOUNTS
£(million)
| — | 1938–39. | 1943–44. | 1946–47. | 1947–48. | 1948–49.* |
|---|---|---|---|---|---|
* Provisional. | |||||
| 24. Receipts: Consolidated Fund, General Revenue Account | 45.7 | 48.8 | 108.3 | 117.1 | 141.5 |
| 25. Payments : Consolidated Fund, General Revenue Account | 44.9 | 46.6 | 103.7 | 115.3 | 138.9 |
| 26. Surplus | 0.8 | 2.2 | 4.6 | 1.8 | 2.6 |
| Plus— | |||||
| 27. Transfers to other accounts— | |||||
| Main Highways Account | 2.8 | 1.6 | 2.8 | ||
| War Expenses Account | 7.5 | 3.0 | 2.1 | 2.0 | |
| Social Security Fund | 4.1 | 18.0 | 16.0 | 15.0 | |
| 28. Revenue receipts other accounts— | |||||
| Employment Promotion Fund | 5.5 | ||||
| Social Security Fund | 13.4 | 22.5 | 26.3 | 29.4 | |
| Reserve Fund | 0.1 | ||||
| War Expenses Account | 45.5 | 11.1 | 3.8 | 1.1 | |
| 29. Amortization of debt charged to Consolidated Fund | 1.8 | 3.2 | 4.7 | 8.6 | 9.2 |
| 30. Capital expenditure charged to Consolidated Fund | 0.1 | 0.1 | 2.1 | 1.4 | 1.5 |
| 31. Transfer to Air Defence Fund | 1.6 | ||||
| 32. Recoveries from farm stabilization accounts reallocated | 1.2 | ||||
| 33. Gratuity, &c., payments re-allocated | 4.1 | 1.0 | 1.3 | ||
| 34. Lump-sum payments from United Kingdom Government | 3.0 | 5.0 | 5.0 | ||
| Less— | |||||
| 35. Non-capital payments from other accounts— | |||||
| Employment Promotion Fund | -6.4 | ||||
| Social Security Fund | -17.6 | -36.8 | -40.4 | -43.0 | |
| Main Highways Account | -2.2 | -1.7 | -2.6 | ||
| War Expenses Account | -128.8 | -22.7 | -12.2 | -5.6 | |
| Reserve Fund | -0.5 | ||||
| 36. Transfers to local authorities from Public Works Account | -1.4 | -6.9 | -1.1 | -1.2 | -1.3 |
| 37. Gratuity, &c., payments re-allocated | -6.6 | ||||
| Adjustment for trading income— | |||||
| 38. Profits of trading departments | 5.4 | 13.3 | 10.7 | 9.9 | 8.8 |
| 39. Less transfers to Consolidated Fund | -4.9 | -8.5 | -6.6 | -7.8 | -7.8 |
| 40. Balance of revenue available for capital formation per national income accounts | +1.5 | -68.9 | +18.8 | +14.3 | +14.3 |
The reconciliation given indicates the fundamental differences between the analysis of the public accounts made for national income purposes and that published in parliamentary paper B–1 [Pt. I].
Firstly, it has been necessary to bring into account revenue and expenditure received and incurred by the Government other than that recorded within the limited confines of the Consolidated Fund—General Revenue Account. This is done by including details of the Employment Promotion Fund, Social Security Fund, War Expenses Account, Main Highways Account, and Reserve Fund Account for the years in which they were operative.
Secondly, adjustments have been made to Consolidated Fund revenue and expenditure. Capital receipts and payments (purchase or construction of capital assets and amortization of debt) have been eliminated. Actual profits of trading Departments earned in a given year are brought into account and transfers by these to the Consolidated Fund deducted. This ensures that only profits for the year in question are included. Transfers to the Consolidated Fund do not necessarily relate to profits earned in the year in which the transfer is made, nor do they cover total profits of all trading departments.
In the case of gratuity, &c., payments, and recoveries of subsidies from primary produce stabilization accounts, treatment for national income purposes necessitated the re-allocation of these items over a period other than that in which the actual payment was made. These amendments are shown in the reconciliation.
The effect of this reconciliation is to amend the limited Consolidated Fund surplus to a consolidated balance of total Government revenue and expenditure, which represents the balance, after payment for all current items, left for necessary capital expenditure of all kinds both by Government administrative Departments and Government trading undertakings. Because of the strictly “cash” basis on which the public accounts are constructed, however, no allowance has been made for depreciation on the national assets, other than those administered by the trading Departments, before arriving at the revenue balance. To this extent, therefore, it represents an overstatement of the true balance on current account.
THE DISTRIBUTION OF PRIVATE INCOME.—A detailed survey of private income and outlay has already been given (refer table on page 597) for the years 1938–39, 1943–44, and 1946–47 to 1948–49. An analysis of private income, in less comprehensive form, is given below for each of the eleven years 1938–39 to 1948–49 (inclusive). Group totals are shown in value form, as percentages of private income, and expressed as index numbers on base 1938–39 (= 100).
PRIVATE INCOME
| — | 1938–39. | 1939–40. | 1940–41. | 1941–42. | 1942–43. | 1943–44. | 1944–45. | 1945–46. | 1946–47. | 1947–48. | 1948–49.* |
|---|---|---|---|---|---|---|---|---|---|---|---|
* Provisional. NOTE.—The numbers in parentheses after the items refer to items in the tables given on pages 596–598. | |||||||||||
| Salary and wage payments (1)— | |||||||||||
| £(m.) | 111.1 | 110.6 | 117.9 | 121.2 | 127.6 | 141.5 | 147.8 | 162.4 | 187.0 | 210.6 | 226.0 |
| Per cent. | 55.5 | 51.0 | 49.7 | 46.7 | 42.8 | 42.5 | 43.3 | 44.6 | 47.3 | 47.3 | 48.9 |
| Index No. | 100 | 100 | 106 | 109 | 115 | 127 | 133 | 146 | 168 | 190 | 203 |
| Pay and allowances of Armed Forces (2)— | |||||||||||
| £(m.) | 0.9 | 3.1 | 16.7 | 26.5 | 47.1 | 57.9 | 48.3 | 40.0 | 8.2 | 6.4 | 4.0 |
| Per cent. | 0.5 | 1.4 | 7.0 | 10.2 | 15.8 | 17.4 | 14.2 | 11.0 | 2.1 | 1.4 | 0.9 |
| Social security benefits and pensions (22)— | |||||||||||
| £(m.) | 7.7 | 11.5 | 12.5 | 12.9 | 14.4 | 15.8 | 17.6 | 20.9 | 34.8 | 37.6 | 39.5 |
| Per cent. | 3.9 | 5.3 | 5.3 | 5.0 | 4.8 | 4.7 | 5.2 | 5.7 | 8.8 | 8.4 | 8.5 |
| Index No. | 100 | 149 | 162 | 168 | 187 | 205 | 229 | 271 | 452 | 488 | 513 |
| Rental value of owner-occupied houses (3)— | |||||||||||
| £(m.) | 6.2 | 6.7 | 7.2 | 7.7 | 7.9 | 8.3 | 8.8 | 9.1 | 9.3 | 9.5 | 10.0 |
| Per cent. | 3.1 | 3.1 | 3.0 | 3.0 | 2.7 | 2.5 | 2.6 | 2.5 | 2.4 | 2.1 | 2.2 |
| Index No. | 100 | 108 | 116 | 124 | 127 | 134 | 142 | 147 | 150 | 153 | 161 |
| Other personal income (excluding company dividends) (4)— | |||||||||||
| £(m.) | 54.3 | 60.1 | 59.0 | 63.0 | 67.7 | 72.9 | 80.3 | 90.0 | 107.7 | 127.9 | 132.5 |
| Per cent. | 27.1 | 27.7 | 24.9 | 24.3 | 22.7 | 21.9 | 23.5 | 24.7 | 27.2 | 28.7 | 28.7 |
| Index No. | 100 | 111 | 109 | 116 | 125 | 134 | 148 | 166 | 198 | 236 | 244 |
| Company income(before distribution) (5)— | |||||||||||
| £(m.) | 19.9 | 25.0 | 24.0 | 28.0 | 33.2 | 36.7 | 38.2 | 42.0 | 48.3 | 53.7 | 50.0 |
| Per cent. | 9.9 | 11.5 | 10.1 | 10.8 | 11.2 | 11.0 | 11.2 | 11.5 | 12.2 | 12.1 | 10.8 |
| Index No. | 100 | 126 | 121 | 141 | 167 | 184 | 192 | 211 | 243 | 270 | 251 |
| Private income (26)— | |||||||||||
| £(m.) | 200.1 | 217.0 | 237.3 | 259.3 | 297.9 | 333.1 | 341.0 | 364.4 | 395.3 | 445.7 | 462.0 |
| Per cent. | 100.0 | 100.0 | 100.0 | 100.0 | 100.0 | 100.0 | 100.0 | 100.0 | 100.0 | 100.0 | 100.0 |
| Index No. | 100 | 108 | 119 | 130 | 149 | 166 | 170 | 182 | 198 | 223 | 231 |
The distribution of private income, as indicated by this table, is affected to a considerable extent by the movement in the item “pay and allowances of the Armed Forces” over the period. In 1943–44, the peak war year, 17.4 per cent. of total private income was received in this form. Its effects on aggregate “salary and wage payments” of civilians, which decreased as a percentage of private income, from 55.5 per cent. in 1938–39 to 42.5 per cent. in 1943–44, and “other personal income,” which decreased similarly from 27.1 per cent. to 21.9 per cent. over the same years, can be clearly seen. It is usual to regard pay and allowances of the Armed Forces as similar to salary and wage payments, but if this is done it has the effect of temporarily inflating “salary and wage payments” at the expense of “other personal income,” since many Armed Forces personnel are not salary and wage-earners as civilians. This can lead to misleading results where a series of years covering a war and post-war period is being considered, as in the present case, and consequently care must be used in interpreting the figures shown.
Another item which is playing an increasingly important part in altering the distribution of private income is “social security benefits and pensions,” which as a percentage of private income increased from 3.9 per cent. in 1938–39 to 8.5 per cent. in 1948–49. If these payments are considered as supplements to normal earned incomes, then they would have the effect of considerably lessening the drop shown in salary and wage payments (including pay and allowances of Armed Forces), from 56 per cent. of private income in 1938–39 to 49.8 per cent. in 1948–49, a major portion of social security benefits and pensions being received by this group. That is, however, going past the present analysis of private income, which is a study of the distribution of “factor incomes” rather than the distribution of incomes received by the various income earning groups—i.e., “salary and wage payments” are here being considered, not “income of salary and wage-earners.”
Company income, as can be expected, is less subject to the factors already mentioned affecting other income items, and, apart from a temporary fall in 1940–41, shows a steady rise, increasing from £19,900,000 in 1938–39 to £53,700,000 in 1947–48. In 1948–49, however, provisional estimates indicate a drop in company income to £50,000,000. Even with this fall, however, company income still continues to show the greatest percentage increase over the eleven-year period—151 per cent., as compared with 105 per cent. for salary and wage payments (including pay and allowances of the Armed Forces) and 144 per cent. for other personal incomes.
Private income itself has increased from £200,100,000 in 1938–39 to £462,000,000 in 1948–49 (131 per cent.).
The Effects of Taxation on the Distribution of Private Income.—The redistributive effects of taxation on private income, especially by the use of steeply progressive taxation rates, can be very great. Before examining the effects on New Zealand private income, however, it is of value to compare total taxation with private income and obtain some idea of the extent to which private income is affected by this transfer to the State.
The following table shows total taxation expressed as a percentage of private income for each of the years 1938–39 to 1948–49.
PRIVATE INCOME AND TOTAL TAXATION
£(million)
| — | 1938–39. | 1939–40. | 1940–41. | 1941–42. | 1942–43. | 1943–44. | 1944–45. | 1945–46. | 1946–47. | 1947–48. | 1948–49.* |
|---|---|---|---|---|---|---|---|---|---|---|---|
* Provisional. † Excluding direct taxes paid by Government trading Departments. NOTE.—The numbers in parentheses after the items, refer to items in the tables given on pages 596–598. | |||||||||||
| Private income (26) | 200.1 | 217.0 | 237.3 | 259.3 | 297.9 | 333.1 | 341.0 | 364.4 | 395.3 | 445.7 | 462.0 |
| Direct taxation (28)* | 23.8 | 30.5 | 45.6 | 51.4 | 66.4 | 75.5 | 81.2 | 85.0 | 78.2 | 77.4 | 93.1 |
| Indirect taxation (10) | 20.6 | 21.0 | 22.3 | 23.2 | 27.9 | 31.8 | 34.0 | 37.3 | 43.0 | 53.0 | 46.0 |
| Less subsidies (11) | -0.6 | -0.5 | -1.6 | -2.7 | -3.3 | -3.1 | -4.6 | -6.6 | -11.8 | -13.6 | -12.0 |
| Total taxation less subsidies (2) | 43.8 | 51.0 | 66.3 | 71.9 | 91.0 | 104.2 | 110.6 | 115.7 | 109.4 | 116.8 | 127.1 |
| Total taxation as a percentage of private income | 21.9 | 23.5 | 27.9 | 27.7 | 30.5 | 31.2 | 32.4 | 31.8 | 27.7 | 26.2 | 27.5 |
Subsidies in this table are treated as negative indirect taxes and deducted from total taxation. Taxation as a percentage of private income increased steadily from 21.9 per cent. in 1938–39 to 32.4 per cent. in 1944–45, falling again, however, to 26.2 per cent. in 1947–48. In 1948–49 it rose again to 27.5 per cent. The latest movement in the trend can be very largely attributed to the fact that total taxation in any one year represents actual receipts for that year. In the case of certain taxes—e.g., income-tax—receipts for one year are in respect of income earned in the previous year. To this extent the comparison is between income earned and tax paid from that income and not tax paid in respect of that income. Thus in 1948–49, when private income shows only a moderate increase as compared with 1947–48, the increased taxation (mainly assessed on 1947–48 incomes) is compared with a proportionately smaller increased private income total. Company income, a major source of taxation, showed a fall in 1948–49.
Included in both income and taxation figures in the previous table are certain transfer payments from the private sector to Government as taxation and from the Government back to the private sector as interest on the public debt, social security benefits, and pensions. Taxation raised for such purposes is not a true indication of the levy made on the private sector as a whole for its contribution to the cost of the provision of Government services, and therefore in the following table such transfer items have been eliminated both from taxation and from incomes, the remainders then being compared to give the true picture of the real contribution made to the State from private income.
The payment of non-monetary social security benefits also has the effect of disturbing the comparison between taxation and private income in the years before and after their introduction. The aggregate of private income before taxation is not affected by the change, the only difference being that former direct payments for services rendered by doctors, &c., are now paid by the Government from the proceeds of taxation. For the purposes of the following table payments of this nature, by Government, are deducted from total taxation before obtaining a true comparison with total private income.
PRIVATE INCOME AND TOTAL TAXATION (EXCLUDING TRANSFER INCOMES AND PAYMENTS)
£(million)
| — | 1938–39. | 1939–40. | 1940–41. | 1941–42. | 1942–43. | 1943–44. | 1944–45. | 1945–46. | 1946–47. | 1947–48. | 1948–49.* |
|---|---|---|---|---|---|---|---|---|---|---|---|
* Provisional. † Excluding mental hospital benefits. NOTE.—The numbers in parentheses after the items, refer to items in the tables given on pages 596–598. | |||||||||||
| Private income before tax (26) | 200.1 | 217.0 | 237.3 | 259.3 | 297.9 | 333.1 | 341.0 | 364.4 | 395.3 | 445.7 | 462.0 |
| Less transfer payments (8 + 22) | -14.7 | -19.0 | -20.3 | -21.3 | -23.8 | -27.1 | -30.5 | -34.7 | -49.9 | -52.9 | -55.0 |
| Private income (excluding transfer payments) | 185.4 | 198.0 | 217.0 | 238.0 | 274.1 | 306.0 | 310.5 | 329.7 | 345.4 | 392.8 | 407.0 |
| Total taxation (less subsidies) | 43.8 | 51.0 | 66.3 | 71.9 | 91.0 | 104.2 | 110.6 | 115.7 | 109.4 | 116.8 | 127.1 |
| Less— | |||||||||||
| Transfer payments (as above) | -14.7 | -19.0 | -20.3 | -21.3 | -23.8 | -27.1 | -30.5 | -34.7 | -49.9 | -52.9 | -55.0 |
| Non-monetary social security benefits† | -0.9 | -1.6 | -2.3 | -3.5 | -4.5 | -5.0 | -5.6 | -6.2 | -7.0 | -7.9 | |
| Total taxation (excluding transfer payments and subsidies) | 29.1 | 31.1 | 44.4 | 48.3 | 63.7 | 72.6 | 75.1 | 75.4 | 53.3 | 56.9 | 64.2 |
| Total taxation as a percentage of private income (excluding transfer payments) | 15.7 | 15.7 | 20.5 | 20.3 | 23.2 | 23.7 | 24.2 | 22.9 | 15.4 | 14.5 | 15.8 |
The incidence of direct taxation on the various “factor income” groups comprising private income is shown in the next table. The balance in each case represents disposable income and the deduction of total taxation from private income gives the concept of private disposable income.
PRIVATE INCOME AND INCIDENCE OF DIRECT TAXATION
£(million)
| — | 1938–39. | 1939–40. | 1940–41. | 1941–42. | 1942–43. | 1943–44. | 1944–45. | 1945–46. | 1946–47. | 1947–48. | 1948–49.* |
|---|---|---|---|---|---|---|---|---|---|---|---|
* Provisional † Excludes direct taxes on Government trading profits NOTE The numbers in parentheses after the items, refer to items in the table given on pages 596-598 | |||||||||||
| Salary and wage payments (1) | 111.1 | 110.6 | 117.9 | 121.2 | 127.6 | 141.5 | 147.8 | 162.4 | 187.0 | 210.6 | 226.0 |
| Less direct taxes | 4.9 | 8.0 | 12.5 | 15.6 | 19.4 | 23.4 | 24.5 | 26.8 | 23.7 | 24.5 | 27.1 |
| 106.2 | 102.6 | 105.4 | 105.6 | 108.2 | 118.1 | 123.3 | 135.6 | 163.3 | 186.1 | 198.9 | |
| Pay and allowances of Armed Forces (2) | 0.9 | 3.1 | 16.7 | 26.5 | 47.1 | 57.9 | 48.3 | 40.0 | 8.2 | 6.4 | 4.0 |
| Less direct taxes | 0.8 | 1.1 | 3.2 | 3.5 | 3.8 | 3.3 | 1.2 | 0.3 | 0.5 | ||
| 0.9 | 3.1 | 15.9 | 25.4 | 43.9 | 54.4 | 44.5 | 36.7 | 7.0 | 6.1 | 3.5 | |
| Social security benefits and pensions (22) | 7.7 | 11.5 | 12.5 | 12.9 | 14.4 | 15.8 | 17.6 | 20.9 | 34.8 | 37.6 | 39.5 |
| Other personal income (including rental value of owner-occupied houses) (3 + 4) | 60.5 | 66.8 | 66.2 | 70.7 | 75.6 | 81.2 | 89.1 | 99.1 | 117.0 | 137.4 | 142.5 |
| Less direct taxes | 11.8 | 13.3 | 18.8 | 20.7 | 24.2 | 25.9 | 26.3 | 29.4 | 29.3 | 30.1 | 35.1 |
| 48.7 | 53.5 | 47.4 | 50.0 | 51.4 | 55.3 | 62.8 | 69.7 | 87.7 | 107.3 | 107.4 | |
| Company income (before distribution) (5) | 19.9 | 25.0 | 24.0 | 28.0 | 33.2 | 36.7 | 38.2 | 42.0 | 48.3 | 53.7 | 50.0 |
| Less direct taxes | 7.1 | 9.2 | 13.5 | 14.0 | 19.6 | 22.7 | 26.6 | 25.5 | 24.0 | 22.5 | 30.4 |
| Private income (26) | 200.1 | 217.0 | 237.3 | 259.3 | 297.9 | 333.1 | 341.0 | 364.4 | 395.3 | 445.7 | 462.0 |
| Less direct taxes (28)* | 23.8 | 30.5 | 45.6 | 51.4 | 66.4 | 75.5 | 81.2 | 85.0 | 78.2 | 77.4 | 93.1 |
| Private disposable income | 176.3 | 186.5 | 191.7 | 207.9 | 231.5 | 257.6 | 259.8 | 279.4 | 317.1 | 368.3 | 368.9 |
The effect of direct taxation in altering the distribution of the factor incomes is shown quite clearly by a comparison of the table given below with the table on page 603. Both show similar detail, the table presented earlier giving private income before tax, and the table following, after tax, expressed in value form, as percentages of private income, and as index numbers, on base 1938–39 (= 100). For the purposes of the latter table, it is necessary to group “rental value of owner-occupied houses” with “other personal income.”
PRIVATE DISPOSABLE INCOME
| — | 1938–39. | 1939–40. | 1940–41. | 1941–42. | 1942–43. | 1943–44. | 1944–45. | 1945–46. | 1946–47. | 1947–48. | 1948–49.* |
|---|---|---|---|---|---|---|---|---|---|---|---|
* Provisional. NOTE.—The value totals given in this table are those derived in the table given on page 605. | |||||||||||
| Salary and wage payments— | |||||||||||
| £(m.) | 106.2 | 102.6 | 105.4 | 105.6 | 108.2 | 118.1 | 123.3 | 135.6 | 163.3 | 186.1 | 198.9 |
| Per cent. | 60.2 | 55.0 | 55.0 | 50.8 | 46.7 | 45.9 | 47.4 | 48.5 | 51.5 | 50.5 | 53.9 |
| Index No. | 100 | 97 | 99 | 99 | 102 | 111 | 116 | 128 | 154 | 175 | 187 |
| Pay and allowances of Armed Forces— | |||||||||||
| £(m.) | 0.9 | 3.1 | 15.9 | 25.4 | 43.9 | 54.4 | 44.5 | 36.7 | 7.0 | 6.1 | 3.5 |
| Per cent. | 0.5 | 1.6 | 8.3 | 12.2 | 19.0 | 21.1 | 17.1 | 13.1 | 2.2 | 1.7 | 1.0 |
| Social security benefits and pensions— | |||||||||||
| £(m.) | 7.7 | 11.5 | 12.5 | 12.9 | 14.4 | 15.8 | 17.6 | 20.9 | 34.8 | 37.6 | 39.5 |
| Per cent. | 4.4 | 6.2 | 6.5 | 6.2 | 6.2 | 6.1 | 6.8 | 7.5 | 11.0 | 10.2 | 10.7 |
| Index No. | 100 | 149 | 162 | 168 | 187 | 205 | 229 | 271 | 452 | 488 | 513 |
| Other personal income (including rental value of owner-occupied houses)— | |||||||||||
| £(m.) | 48.7 | 53.5 | 47.4 | 50.0 | 51.4 | 55.3 | 62.8 | 69.7 | 87.7 | 107.3 | 107.4 |
| Per cent. | 27.6 | 28.7 | 24.7 | 24.1 | 22.2 | 21.5 | 24.2 | 25.0 | 27.6 | 29.1 | 29.1 |
| Index No. | 100 | 110 | 97 | 103 | 106 | 114 | 129 | 143 | 180 | 220 | 221 |
| Company income (before distribution)— | |||||||||||
| £(m.) | 12.8 | 15.8 | 10.5 | 14.0 | 13.6 | 14.0 | 11.6 | 16.5 | 24.3 | 31.2 | 19.6 |
| Per cent. | 7.3 | 8.5 | 5.5 | 6.7 | 5.9 | 5.4 | 4.5 | 5.9 | 7.7 | 8.5 | 5.3 |
| Index No. | 100 | 123 | 82 | 109 | 106 | 109 | 91 | 129 | 190 | 244 | 153 |
| Private disposable income— | |||||||||||
| £(m.) | 176.3 | 186.5 | 191.7 | 207.9 | 231.5 | 257.6 | 259.8 | 279.4 | 317.1 | 368.3 | 368.9 |
| Per cent. | 100.0 | 100.0 | 100.0 | 100.0 | 100.0 | 100.0 | 100.0 | 100.0 | 100.0 | 100.0 | 100.0 |
| Index No. | 100 | 106 | 109 | 118 | 131 | 146 | 147 | 158 | 180 | 209 | 209 |
Whereas “salary and wage payments” (including pay and allowances of the Armed Forces) formed 49.8 per cent. of private income before tax in 1948–49, “other personal income” (including rental value of owner-occupied houses) 30.9 per cent., and “company income” 10.8 per cent., these proportions changed to 54.9 per cent., 29.1 per cent., and 5.3 per cent. respectively after deduction of direct taxes, and expressed as a percentage of private disposable income. A factor of some importance which affects the comparability of these figures is the introduction of non-monetary social security benefits over the period. Taxation taken to pay for these benefits reduces private disposable income, but at the same time this income is indirectly increased by a reduction in private expenditure on the items covered by the benefits. It is not feasible to make any allowance for this factor at this point, but it should be borne in mind.
INCOMES AND TAX ASSESSMENT.—A system of annual statistics from the particulars on the income-tax returns was inaugurated in 1923 and was continued up to and including the tax-year 1931–32, but was then discontinued for reasons of economy. The compilation was later resumed, commencing with the tax-year 1934–35, but following the 1941–42 tabulation, it was again found necessary to suspend activities in this connection owing to shortages of staff, &c., arising from war conditions. The compilation of these statistics has again been resumed commencing with the tax assessment year 1946–47.
Information concerning the system of income-tax in New Zealand is given earlier under the heading of “Taxation” (vide pp. 420–423). The statistical data relating to income-tax given in this section more properly belong to the Taxation section referred to, but it is considered preferable to treat the figures relating to the incidence of tax with those showing the distribution of the incomes on which the tax is assessed.
It should be explained that the incomes returned in any tax-year are those for the preceding income-year; thus, the statistics for the tax-year 1946–47 relate to incomes received during the year 1945–46, which, in general, may be taken as the twelve months ended 31st March, 1946.
The returns from which these statistics are compiled are required from all taxpayers. In addition, whether taxpayers or not, all companies and public or local authorities engaged in any profession, trade, manufacture, or undertaking carried on for pecuniary profit, irrespective of the amount of income derived, and all persons in receipt of incomes of £200 or over, are required to furnish returns. The statistical compilation is, however, limited to taxpayers and to persons whose assessable incomes amount to £200 or over.
The reference to persons whose assessable incomes are £200 or over should not be interpreted as meaning that there is a complete coverage of incomes over that amount. Certain types of non-assessable income (these are referred to later in this section) are not included in the returns, and are therefore completely omitted from these statistics. The coverage of the returns is also incomplete in one other respect. It is known that a number of persons with assessable incomes of between £200 and £300 fail to furnish returns. The first £200 of assessable income is exempted, and the great majority of missing returns for incomes over £200 represent persons who are known to be entitled to other exemptions which would bring them into the non-taxpaying category.
SUMMARY OF INCOMES, EXEMPTIONS, AND TAX.—The following table briefly summarizes the main items of information for each of the last five tax-years available.
| Item. | 1938–39. | 1939–40. | 1940–41. | 1941–42. | 1946–47. |
|---|---|---|---|---|---|
* Excluding company income, where distinction between earned and unearned Income is not made for taxation purposes. † Proprietary income is excluded from assessable income and included in returnable income. | |||||
| Number of assessments | 222,059 | 264,523 | 306,099 | 323,379 | 401,025 |
| Number of taxpayers | 139,800 | 182,128 | 216,333 | 235,721 | 319,718 |
| £(000) | £(000) | £(000) | £(000) | £(000) | |
| Earned income* | 70,518 | 82,282 | 102,652 | 111,456 | 171,903 |
| Assessable income† | 99,268 | 112,184 | 138,861 | 149,597 | 221,866 |
| Returnable income† | 103,189 | 116,456 | 146,332 | 157,519 | 231,026 |
| Exemptions— | |||||
| Personal | 43,159 | 49,258 | 58,791 | 61,659 | 79,880 |
| Other | 13,042 | 15,987 | 19,352 | 21,649 | 37,965 |
| Taxable balance | 43,068 | 46,940 | 60,718 | 66,289 | 104,021 |
| Tax assessed | 8,985 | 12,012 | 18,815 | 20,124 | 31,799 |
Probably the most striking feature disclosed by these figures is the cumulative effect of the large increases shown in each individual year. A strict comparison is, however, not possible, as changes in compilation practice and numerous amendments in income-tax law have affected the comparability of one year's figures with those of another. The inclusion, commencing with the tax-year 1940–41, of all farming incomes in excess of £200 has had a considerable effect on the statistics.
CLASSES OF TAXPAYERS.—“Individuals” comprise all assessments for individual persons, and include estates of deceased persons. Partnership returns are ignored in the compilation, as the individual shares of partnership income are included in the individual tax assessments.
The term “companies” not only covers companies incorporated under the Companies Act, 1933, and other Acts relating to the formation of companies, but also includes local and public authorities, associations (incorporated or unincorporated), and aggregations of individuals (other than partnerships) which form separate and distinct entities for income-tax purposes.
Non-resident traders are not now separately classified, but are included either as individuals or as companies.
A classification on the basis of class is given in the following table for each of the last three available tax-years.
| Class. | Number of Assessments. | Number of Taxpayers. | Aggregate Assessable Income.* | ||||||
|---|---|---|---|---|---|---|---|---|---|
| 1940–41. | 1941–42. | 1946–47. | 1940–41. | 1941–42. | 1946–47. | 1940–41. | 1941–42. | 1946–47. | |
* Excluding proprietary income. † Included as companies or individuals. | |||||||||
| £(000) | £(000) | £(000) | |||||||
| Individuals | 298,222 | 315,093 | 392,233 | 208,456 | 227,435 | 310,926 | 112,276 | 122,145 | 180,380 |
| Companies | 7,360 | 7,916 | 8,792 | 7,360 | 7,916 | 8,792 | 26,351 | 27,240 | 41,486 |
| Non-resident traders | 517 | 370 | † | 517 | 370 | † | 234 | 213 | † |
| Totals | 306,099 | 323,379 | 401,025 | 216,333 | 235,721 | 319,718 | 138,861 | 149,597 | 221,866 |
The numbers of assessments for individuals in the 1946–47 tax-year covered 337,790 males and 61,745 females, a total of 399,535. The figures quoted for males and females include in their respective sexes the number of husbands and wives who were issued with combined assessments under the provisions relating to the aggregation of the incomes of husband and wife. In the statistical tables, such combined assessments are counted as one assessment only.
The number of males included in assessments was 63.4 per cent. of the male population of twenty-one years of age and over (excluding Maoris) and 60.9 per cent. (including Maoris). Corresponding figures for females Mere 11.3 per cent. and 10.9 per cent. respectively.
Amount of Income.—The broad principle adopted in calculating the assessable income is that any expenditure or loss exclusively incurred in the production of the assessable income for any year may be deducted from the total income from any assessable source for that year. Depreciation is allowed, varying rates for different classes of assets being fixed. Where the operations of a source of income which would be assessable for income-tax have resulted in a loss for the year, the loss may be set off against assessable profits from other sources (if any) or, in default thereof, may be set off against assessable profits in the three following years. Capital profits are not assessable and capital losses are not deductible.
Incomes Of Individuals: Assessable Income.—Summarized figures according to amount of assessable income of individuals are now given for the last three tax-years available.
| Amount of Assessable Income. | Number of Assessments. | Aggregate Assessable Income.* | ||||
|---|---|---|---|---|---|---|
| 1940–41. | 1941–42. | 1946–47. | 1940–41. | 1941–42. | 1946–47. | |
*Excluding proprietary Income. | ||||||
| £ £ | £(000) | £(000) | £(000) | |||
| Under 300 | 139,792 | 131,854 | 93,877 | 34,450 | 32,269 | 23,454 |
| 300– 399 | 88,812 | 101,336 | 117,839 | 29,989 | 34,386 | 41,190 |
| 400– 499 | 29,548 | 35,855 | 82,253 | 12,969 | 15,752 | 36,421 |
| 500– 599 | 13,704 | 15,992 | 40,277 | 7,402 | 8,647 | 21,806 |
| 600– 699 | 7,634 | 8,616 | 19,486 | 4,895 | 5,538 | 12,509 |
| 700– 799 | 4,756 | 5,375 | 10,787 | 3,538 | 3,997 | 8,029 |
| 800– 899 | 3,271 | 3,739 | 6,828 | 2,757 | 3,153 | 5,769 |
| 900– 999 | 2,102 | 2,457 | 4,292 | 1,987 | 2,321 | 4,055 |
| 1,000–1,999 | 6,931 | 7,987 | 13,505 | 9,113 | 10,487 | 17,894 |
| 2,000–2,999 | 1,126 | 1,247 | 2,131 | 2,651 | 2,906 | 5,055 |
| 3,000–3,999 | 316 | 389 | 574 | 1,077 | 1,318 | 1,961 |
| 4,000–1,999 | 120 | 132 | 199 | 527 | 582 | 882 |
| 5,000–9,999 | 89 | 101 | 165 | 592 | 630 | 1,069 |
| 10,000 and over | 21 | 13 | 20 | 330 | 158 | 287 |
| Totals | 298,222 | 315,093 | 392,233 | 112,276 | 122,145 | 180,380 |
Of the 392,233 individual assessments covered in 1946–47, 23.9 per cent. returned assessable income of less than £300, 51.0 per cent. from £300 to £499, 20.8 per cent. from £500 to £999, 3.4 per cent. from £1,000 to £1,999, and 0.8 per cent. from £2,000 upwards.
Of the assessable income of individuals 56.0 per cent. came within categories of under £500; 28.9 per cent. in categories of £500–£999; and 9.9 per cent. in categories of £1,000–£1,999; 4.4 per cent. in categories of £2,000–£4,999; and 0.7 per cent. in categories of £5,000 and over.
Assessable Earned Income.—Earned income is defined as all income derived from any source by a taxpayer (not being a company or a public or local authority) by reason of his personal exertions. Pensions and superannuation are regarded as earned income. It should be noted, however, that war pensions and social security benefits (including the family benefit) are not taxable, and are not required to be included in income-tax returns. Earned income is, of course, not subject to the surtax of 33⅓ per cent. on standard rates which is payable on unearned income of individuals but not of companies.
The next table shows the amount of earned income included in the total assessable income of individuals for the various categories according to the size of assessable income.
| Amount of Assessable Income. | Assessable Earned Income.* | Proportion of Assessable Income. | ||||
|---|---|---|---|---|---|---|
| 1940–41. | 1941–42. | 1946–47. | 1940–41. | 1941–42. | 1946–47. | |
*Excluding proprietary income. | ||||||
| £ £ | £(000) | £(000) | £(000) | Per Cent. | Per Cent. | Per Cent. |
| Under 300 | 32,476 | 30,161 | 22,225 | 94.3 | 93.5 | 94.8 |
| 300– 399 | 28,563 | 32,850 | 39,964 | 95.2 | 95.5 | 97.0 |
| 400– 499 | 11,919 | 14,635 | 35,426 | 91.9 | 92.9 | 97.3 |
| 500– 599 | 6,628 | 7,776 | 21,060 | 89.5 | 89.9 | 96.6 |
| 600– 699 | 4,291 | 4,876 | 11,897 | 87.7 | 88.0 | 95.1 |
| 700– 799 | 3,038 | 3,457 | 7,538 | 85.9 | 86.5 | 93.9 |
| 800– 899 | 2,328 | 2,702 | 5,366 | 84.4 | 85.7 | 93.0 |
| 900– 999 | 1,669 | 1,940 | 3,748 | 84.0 | 83.6 | 92.4 |
| 1,000–1,999 | 7,545 | 8,666 | 16,306 | 82.8 | 82.6 | 91.1 |
| 2,000–2,999 | 2,121 | 2,323 | 4,594 | 80.0 | 79.9 | 90.9 |
| 3,000–3,999 | 833 | 1,014 | 1,742 | 77.3 | 77.0 | 88.8 |
| 4,000–4,999 | 395 | 429 | 792 | 75.0 | 73.7 | 89.8 |
| 5,000–9,999 | 500 | 489 | 968 | 84.6 | 77.6 | 90.6 |
| 10,000 and over | 306 | 139 | 276 | 92.1 | 88.0 | 96.2 |
| Totals | 102,612 | 111,457 | 171,903 | 91.4 | 91.2 | 95.3 |
Generally speaking, the proportion of earned income falls as the size of the assessable income increases, although exceptions to the rule will be observed.
Proprietary Income.—The income-tax year 1940–41 saw the introduction of this classification of income. There are two factors which must be present before the income of a company can be proprietary income in the hands of the shareholder. The first is that the control must be in the hands of not more than four persons. If this is the case, then the company is a proprietary company. The second factor is that a shareholder of a proprietary company is not a proprietary shareholder unless he is entitled to receive not less than one-fifth of the company's income. Only in the case of a proprietary shareholder in a proprietary company is the shareholder's proportion of the company's income transferred to the shareholder's assessment. A proprietary shareholder may be an estate or another company.
Where proprietary income is transferred to the shareholder's assessment, that income becomes assessable income in the hands of the shareholder. The tax is assessed on the taxable balance (including proprietary income), provision being made for a credit in respect of tax already paid on that income by the company. In the statistics such proprietary income is included only in the returnable income. It has been excluded from the assessable earned, the assessable, and the taxable incomes.
Returnable Income.—In addition to the proprietary income which is included in returnable income, certain classes of non-assessable income are taken into account in determining the amount of tax, &c. Returnable income is obtained by adding to the assessable income the amount of any non-assessable income of the classes used for rate determination. The classes concerned mainly comprise dividends from companies trading in New Zealand, interest on New Zealand Government securities issued free of tax, and interest on company debentures issued free of tax or with a floating rate of interest.
These classes constitute the greater part of any non-assessable income received by persons whose returns are included in the statistics.
The following table gives particulars of the number of assessments and total returnable income of individuals according to size of income.
| Amount of Returnable Income. | Number of Assessments. | Returnable Income.* | ||||
|---|---|---|---|---|---|---|
| 1940–41. | 1941–42. | 1946–47. | 1940–41. | 1941–42. | 1946–47. | |
*Including proprietary income. | ||||||
| £ £ | £(000) | £(000) | £(000) | |||
| Under 300 | 138,189 | 130,213 | 92,518 | 34,106 | 31,927 | 23,128 |
| 300– 399 | 88,018 | 100,597 | 117,271 | 29,721 | 34,130 | 40,990 |
| 400– 499 | 29,369 | 35,699 | 81,848 | 12,895 | 15,686 | 36,238 |
| 500– 599 | 13,629 | 16,015 | 40,130 | 7,367 | 8,666 | 21,731 |
| 600– 699 | 7,707 | 8,714 | 19,495 | 4,944 | 5,604 | 12,518 |
| 700– 799 | 4,839 | 5,502 | 10,753 | 3,598 | 4,094 | 8,002 |
| 800– 899 | 3,449 | 3,910 | 6,836 | 2,907 | 3,301 | 5,775 |
| 900– 999 | 2,309 | 2,612 | 4,472 | 2,184 | 2,469 | 4,227 |
| 1,000–1,999 | 8,001 | 8,980 | 14,537 | 10,698 | 11,928 | 19,432 |
| 2,000–2,999 | 1,608 | 1,654 | 2,763 | 3,825 | 3,931 | 6,618 |
| 3,000–3,999 | 548 | 621 | 888 | 1,878 | 2,118 | 3,041 |
| 4,000–4,999 | 246 | 247 | 342 | 1,086 | 1,098 | 1,511 |
| 5,000–9,999 | 248 | 272 | 324 | 1,672 | 1,731 | 2,102 |
| 10,000 and over | 62 | 57 | 56 | 1,028 | 881 | 805 |
| Totals | 298,222 | 315,093 | 392,233 | 117,909 | 127,564 | 186,116 |
From a comparison of the foregoing table with that based on the amount of “assessable” income, it will be observed that the larger income categories are most affected by the inclusion of non-assessable and proprietary income. In the tax-year 1946–47 there were 184 cases where the amount of “assessable” income of individuals was over £5,000, the aggregate assessable income being £1,344,000: on the basis of returnable income there were 380 cases, aggregating £2,907,000, with incomes exceeding £5,000.
Aggregation of Incomes: Husband and Wife.—A further innovation in income-tax procedure was introduced in the tax-year 1940–41 by the aggregation of incomes of husband and wife, if (a) they are living together, and (b) the returnable income in each case exceeds £200. The income of the wife is deemed to be the income of the husband, and an aggregate assessment is made in the name of the husband. In such cases a personal exemption of £200 is allowable for the wife, in addition to that allowable to the husband. Provision is made for separate assessments if written application is made by either the husband or wife before an aggregate assessment has been made.
The following table shows the numbers of “aggregate” assessments for 1940–41, 1941–42, and 1946–47 according to the amount of assessable income. In this, as in the other tables, an “aggregate” assessment is counted as one assessment only. Each assessment, however, includes two returns of income.
| Amount of Assessable Income. | Number of Assessments. | ||
|---|---|---|---|
| 1940–41. | 1941–42. | 1946–47. | |
| £ £ | |||
| Under 400 | 22 | 32 | 10 |
| 400–499 | 128 | 143 | 232 |
| 500–599 | 307 | 425 | 1,196 |
| 600–699 | 272 | 332 | 1,787 |
| 700–799 | 189 | 231 | 1,325 |
| 800–899 | 132 | 183 | 760 |
| 900–999 | 81 | 143 | 428 |
| 1,000–1,999 | 423 | 548 | 1,181 |
| 2,000–2,999 | 112 | 150 | 240 |
| 3,000–3,999 | 40 | 61 | 79 |
| 4,000–4,999 | 17 | 24 | 29 |
| 5,000 and over | 14 | 16 | 35 |
| Totals | 1,737 | 2,288 | 7,302 |
It should be noted that the above table includes only those cases where there is no election by the husband or wife to receive separate assessments at the rate of tax appropriate to the aggregated taxable incomes. It is evident that there are a considerable number of cases where there is an election to receive separate assessments, but the actual number is not available from these statistics.
Sources of Income.—In the compilation of the statistics a distinction is made as to the source from which assessable income is derived, incomes being divided into ten groups according to source as follows:—
| Source No. | Source. |
|---|---|
| 0 | Salary or wages. |
| 1 | Following professional occupation on own account. |
| 2 | Commerce, trade, or business. |
| 3 | Industry or manufacture. |
| 4 | Farming. |
| 5 | Provision of transport or communication. |
| 6 | Building or construction. |
| 7 | Mining or extraction. |
| 8 | Investments and the like. |
| 9 | Provision of or engaging in entertainment. |
Actual figures as to the amount of income derived from the various sources are not available on account of the fact that, in a considerable proportion of cases, income is obtained from more than one source. The rule followed in such cases in compiling the statistics is to include the whole income under the principal source from which assessable income is derived. As an indication of the extent to which the figures are affected, source 0 (salary or wages) includes £2,092,000 unearned assessable income, and source 8 (investments and the like) includes £512,000 assessable earned income.
The following table shows the distribution of incomes of individuals from the various sources, the average assessable and returnable incomes, and also the proportion of assessable income to returnable income for the tax-year 1946–47.
| Source of Assessable Income. | Number of Assessments. | Assessable Income.* | Returnable Income. | Average Assessable Income. | Average Returnable Income. | Proportion of Assessable to Returnable Income. |
|---|---|---|---|---|---|---|
*Excluding proprietary income. | ||||||
| £(000) | £(000) | £ | £ | Per Cent. | ||
| 0 | 307,594 | 126,181 | 129,033 | 410 | 419 | 97.8 |
| 1 | 4,707 | 4,957 | 5,251 | 1,053 | 1,116 | 94.4 |
| 2 | 22,999 | 15,511 | 16,398 | 674 | 713 | 94.6 |
| 3 | 890 | 805 | 922 | 904 | 1,036 | 87.3 |
| 4 | 41,674 | 25,441 | 25,742 | 610 | 618 | 98.8 |
| 5 | 1,578 | 880 | 888 | 558 | 563 | 99.1 |
| 6 | 2,052 | 1,264 | 1,299 | 616 | 633 | 97.3 |
| 7 | 168 | 85 | 86 | 506 | 512 | 98.8 |
| 8 | 10,458 | 5,195 | 6,433 | 497 | 615 | 80.8 |
| 9 | 113 | 62 | 63 | 549 | 558 | 98.4 |
| Totals | 392,233 | 180,380 | 186,116 | 460 | 475 | 96.9 |
Exemptions.—In the case of individuals, certain statutory deductions are made from the assessable income, and income-tax is paid on the balance. Absentees are not usually entitled to the benefit of exemptions other than the personal exemption of £200. The exemptions in force during the tax-year 1946–47 were—
A personal exemption of £200.
An exemption of £100 in respect of a dependent husband or wife whose personal income did not exceed £50.
An exemption not exceeding £100 in respect of a housekeeper employed by a widow, widower, or divorced person to have the care and control of any child or children.
An exemption for contributions not exceeding £50 towards the support of a relative by blood, marriage, or adoption who is dependent on the taxpayer. Children of the taxpayer are included in this definition. The exemption is not allowed if the relative is in receipt of a monetary benefit (other than a family benefit for children) from the Social Security Fund.
Life-assurance premiums, National Provident Fund, superannuation, and similar contributions. An exemption is allowed up to a maximum of 15 per cent. of assessable income or £150, whichever amount is the less.
A tax rebate of £26 is allowed in lieu of the exemption if the exemption for a wife, a housekeeper, or a dependent relative, would reduce the amount of tax payable by more than £26 in respect of any such exemption. If the income is wholly earned income, the tax rebate in lieu of the exemption for a wife operates when the taxable income (the assessable income less any exemptions, including the wife's exemption) exceeds £808. In the case of a relative, the tax rebate comes into effect when the taxable earned income exceeds £2,658. In both these cases it is assumed that the full exemption of £100 or £50, as the case may be, would apply.
In the statistics the exemptions are applied in the order in which they appear in the foregoing list. For example, a married man with two children is entitled to the following exemptions: Personal, £200; wife, £100; relatives £100; and (say) £15 life-assurance premiums, &c. The total exemption is thus £415. Assuming that his assessable income is £375, the exemptions are reduced to a total sufficient to make the taxable balance “nil” and are recorded as personal, £200; wife, £100; and relatives, £75.
The next table shows the average amount of exemption allowed in the tax-year 1946–47 for each £100 of assessable income.
| Amount of Assessable Income. | Exemptions per £100 of Assessable Income. | ||||
|---|---|---|---|---|---|
| Personal. | Wife, Housekeeper. | Children and Relatives. | Life Assurance. &c. | Total. | |
| £ £ | £ | £ | £ | £ | £ |
| Under 300 | 80.0 | 6.6 | 0.4 | 1.1 | 88.1 |
| 300– 399 | 57.2 | 16.9 | 6.1 | 1.3 | 81.5 |
| 400– 499 | 45.3 | 16.3 | 11.6 | 2.3 | 75.6 |
| 500– 599 | 38.0 | 14.0 | 11.7 | 3.2 | 66.9 |
| 600– 699 | 34.0 | 10.9 | 9.5 | 3.5 | 58.0 |
| 700– 799 | 30.2 | 9.0 | 7.8 | 3.9 | 50.8 |
| 800– 899 | 26.3 | 7.6 | 7.0 | 4.1 | 44.9 |
| 900– 999 | 23.3 | 6.8 | 6.3 | 4.1 | 40.4 |
| 1,000–1,999 | 16.4 | 2.1 | 4.3 | 4.1 | 27.0 |
| 2,000–2,999 | 9.3 | 0.2 | 2.1 | 3.6 | 15.3 |
| 3,000–3,999 | 6.6 | 0.1 | 0.4 | 2.8 | 9.9 |
| 4,000–4,999 | 5.2 | 0.1 | 0.2 | 2.4 | 7.8 |
| 5,000–9,999 | 3.7 | 0.1 | 1.8 | 5.6 | |
| 10,000 and over | 1.4 | 0.7 | 2.1 | ||
| Totals | 44.3 | 11.5 | 7.1 | 2.5 | 65.3 |
The total exemptions granted to individuals during the tax-year 1946–47 amounted to £117,845,000, of which “personal” accounted for £79,880,000; wife, &c., £20,705,000; children and relatives, £12,746,000; and life-assurance premiums, &c., £4,514,000. The comparatively low figure shown as exemptions for children and relatives is partly due to the application of the previously mentioned rule relating to the reduction of potential exemptions in the case of non-taxpayers.
Taxable Balance and Tax assessed.—After all exemptions have been deducted from the assessable income the balance of income (if any) is taxed in accordance with the schedule relating to the particular tax-year.
Exemptions being practically limited to individuals, this is the only class in which the assessable income and taxable balance are not generally identical. The next table gives for this class particulars of taxable balance and of tax assessed for the various income categories in 1946–47 and the two preceding available tax-years.
| Amount of Assessable Income. | Taxable Balance. | Tax assessed. | ||||
|---|---|---|---|---|---|---|
| 1940–41. | 1941–42. | 1946–47. | 1940–41. | 1941–42. | 1946–47. | |
| £ £ | £(000) | £(000) | £(000) | £(000) | £(000) | £(000) |
| Under 300 | 2,944 | 3,017 | 2,790 | 463 | 487 | 426 |
| 300– 399 | 5,262 | 6,023 | 7,605 | 807 | 925 | 1,167 |
| 400– 499 | 4,007 | 4,879 | 8,900 | 643 | 780 | 1,392 |
| 500– 509 | 3,147 | 3,681 | 7,218 | 531 | 617 | 1,167 |
| 000– 699 | 2,462 | 2,811 | 5,257 | 436 | 495 | 891 |
| 700– 799 | 2,002 | 2,262 | 3,949 | 376 | 420 | 706 |
| 800– 899 | 1,704 | 1,942 | 3,180 | 335 | 376 | 602 |
| 900– 999 | 1,291 | 1,504 | 2,415 | 266 | 307 | 478 |
| 1,000–1,999 | 6,743 | 7,791 | 13,067 | 1,684 | 1,907 | 3,079 |
| 2,000–2,999 | 2,245 | 2,466 | 4,283 | 760 | 837 | 1,444 |
| 3,000–3,999 | 965 | 1,179 | 1,767 | 394 | 505 | 737 |
| 4,000–4,999 | 481 | 535 | 812 | 218 | 270 | 394 |
| 5,000–9,999 | 564 | 597 | 1,010 | 284 | 342 | 586 |
| 10,000 and over | 323 | 154 | 281 | 166 | 95 | 188 |
| Totals | 34,140 | 38,841 | 62,535 | 7,362 | 8,363 | 13,257 |
While the foregoing table shows the aggregate taxable balance and amount of tax assessed in respect of individuals in receipt of the various amounts of assessable income, it does not indicate the number of individuals with taxable balances of different amounts or the tax-assessed categories.
Tables showing the analyses by size of taxable balance and by size of tax assessed were last published in the 1941 issue of the Statistical Report on Prices, &c., but space limitations preclude their repetition here. In the tax-year 1946–47, 310,926 individuals contributed to the income-tax revenue, and of these, 50,464 were assessed for under £5 of tax, 50,860 for over £5 and under £10, and 188,011 for over £10 and under £100. At the other end of the scale, 1,033 individuals had incomes which were liable for a tax of £1,000 or over.
Rates of Tax: Individuals—For the three tax-years shown the rate of tax was 2s. 6d. in the £1 on so much of the taxable income as did not exceed £100. For each succeeding £100 or part thereof the rate of tax was increased by 3d. up to a maximum rate of 12s., which was reached at incomes of £3,800. These rates, introduced in 1940–41, are known as basic rates, and are subject to a percentage increase or decrease each year in accordance with the provisions of the annual taxing Act fixing rates for that year. An additional tax of 33⅓ per cent. on those rates was imposed in respect of unearned incomes. The above rates were increased by 15 per cent. for 1940–41, 33⅓ per cent. for 1941–42, and 15 per cent. for 1946–47. There was, however, a limit of 15s. 6d. in the pound. Tax is payable on the amount of the taxable balance, but non-assessable income is included for purposes of determining the actual rate of tax. This is explained earlier under the heading of “Returnable Income.”
The next table gives, in respect of incomes of individuals, particulars for the last three tax-years of the amount of tax assessed for each of the ten groups of sources, together with various averages for 1946–47.
| Source. | Tax assessed. | Average Tax assessed, 1946–47. | |||||||
|---|---|---|---|---|---|---|---|---|---|
| 1940–41. | 1941–42. | 1946–47. | Per Assessment | Per Taxpayer. | Per £1 Assessable Income. | Per £1 Taxable Balance, | |||
| £(000) | £(000) | £(000) | £ | £ | s. | d. | s. | d. | |
| 0 | 3,001 | 3,537 | 6,275 | 20.4 | 25.7 | 1 | 0 | 3 | 7 |
| 1 | 444 | 436 | 941 | 199.9 | 221.8 | 3 | 10 | 5 | 8 |
| 2 | 1,116 | 826 | 2,081 | 90.5 | 111.6 | 2 | 8 | 5 | 1 |
| 3 | 57 | 42 | 174 | 195.5 | 244.7 | 4 | 4 | 6 | 10 |
| 4 | 1,345 | 1,886 | 2,662 | 63.9 | 86.5 | 2 | 1 | 4 | 6 |
| 5 | 54 | 38 | 69 | 43.7 | 564 | 1 | 7 | 3 | 10 |
| 6 | 105 | 66 | 128 | 62.4 | 80.7 | 2 | 0 | 4 | 5 |
| 7 | 5 | 7 | 6 | 35.7 | 43.5 | 1 | 5 | 3 | 5 |
| 8 | 1,233 | 1,523 | 914 | 87.4 | 94.7 | 3 | 6 | 6 | 7 |
| 9 | 2 | 2 | 6 | 53.1 | 68.2 | 1 | 11 | 4 | 0 |
| Totals | 7,362 | 8,363 | 13,257 | 33.8 | 42.6 | 1 | 6 | 4 | 3 |
Geographical Distribution.—The decentralization of the Land and Income Tax Department afforded the opportunity of obtaining data on a geographical basis. The following table shows for the 1946–47 tax-year the amounts of assessable and returnable incomes for each of the fourteen districts, which are indicated by the name of the town in which the branch office is situated.
| Income-tax District. | Number of Assessments. | Assessable Income. | Returnable Income. | Average Assessable Income. | Average Returnable Income. |
|---|---|---|---|---|---|
| £(000) | £(000) | £ | £ | ||
| Whangarei | 10,398 | 4,463 | 4,514 | 429 | 434 |
| Auckland | 82,716 | 38,075 | 39,775 | 460 | 481 |
| Hamilton | 41,849 | 18,920 | 19,245 | 452 | 460 |
| Napier | 20,009 | 9,554 | 9,788 | 477 | 489 |
| New Plymouth | 14,494 | 6,695 | 6,803 | 462 | 469 |
| Wanganui | 13,547 | 6,458 | 6,617 | 477 | 488 |
| Palmerston North | 18,165 | 8,774 | 8,931 | 483 | 492 |
| Wellington | 65,552 | 30,903 | 32,202 | 471 | 491 |
| Nelson | 10,406 | 4,764 | 4,881 | 458 | 469 |
| Christchurch | 42,984 | 18,870 | 19,451 | 439 | 453 |
| Greymouth | 9,975 | 4,372 | 4,454 | 438 | 447 |
| Timaru | 12,750 | 5,815 | 5,930 | 456 | 465 |
| Dunedin | 32,921 | 14,655 | 15,246 | 445 | 463 |
| Invercargill | 16,467 | 8,063 | 8,278 | 490 | 503 |
| Totals | 392,233 | 180,380 | 186,116 | 460 | 475 |
Company Incomes.—It is perhaps desirable to draw attention to the fact that the term “companies” as it is used in connection with these statistics has been given a wider meaning than that which is commonly assigned to it. A definition of the term will be found on page 608.
The various statutory exemptions which are granted to individuals do not apply in the case of companies. The numbers of assessments and taxpayers, also the amounts of assessable income and the taxable balance, are identical in the case of companies.
The following table gives particulars of the number of taxpayer companies and their aggregate assessable incomes for 1947–48 and the two preceding available tax years.
| Amount of Assessable Income. | Number of Assessments. | Assessable Income.* | ||||
|---|---|---|---|---|---|---|
| 1941–42. | 1946–47. | 1947–48. | 1941–42. | 1946–47. | 1947–48. | |
*Excluding proprietary income. | ||||||
| £ £ | £(000) | £(000) | £(000) | |||
| Under 100 | 1,714 | 1,217 | 1,475 | 62 | 48 | 54 |
| 100– 199 | 774 | 681 | 703 | 111 | 98 | 103 |
| 200– 299 | 665 | 507 | 578 | 159 | 124 | 142 |
| 300– 399 | 527 | 479 | 430 | 181 | 166 | 150 |
| 400– 499 | 387 | 376 | 451 | 172 | 168 | 203 |
| 500– 599 | 366 | 383 | 422 | 198 | 208 | 228 |
| 600– 699 | 279 | 336 | 384 | 179 | 217 | 244 |
| 700– 799 | 228 | 265 | 304 | 171 | 199 | 227 |
| 800– 899 | 202 | 258 | 320 | 171 | 218 | 271 |
| 900– 999 | 186 | 200 | 258 | 176 | 190 | 245 |
| 1,000– 1,999 | 971 | 1,483 | 1,730 | 1,353 | 2,103 | 2,438 |
| 2,000– 2,999 | 443 | 732 | 821 | 1,084 | 1,770 | 1,996 |
| 3,000– 3,999 | 275 | 381 | 519 | 945 | 1,319 | 1,793 |
| 4,000– 4,999 | 144 | 276 | 342 | 644 | 1,226 | 1,527 |
| 5,000– 5,999 | 116 | 201 | 248 | 630 | 1,102 | 1,349 |
| 6,000– 6,999 | 81 | 148 | 177 | 524 | 958 | 1,135 |
| 7,000– 7,999 | 71 | 97 | 141 | 531 | 725 | 1,052 |
| 8,000– 8,999 | 46 | 68 | 96 | 391 | 581 | 808 |
| 9,000– 9,999 | 30 | 63 | 64 | 284 | 596 | 605 |
| 10,000–19,999 | 162 | 290 | 391 | 2,330 | 4,076 | 5,482 |
| 20,000–29,999 | 92 | 113 | 131 | 2,243 | 2,760 | 3,236 |
| 30,000–39,999 | 42 | 58 | 69 | 1,465 | 2,009 | 2,350 |
| 40,000–49,999 | 25 | 33 | 39 | 1,134 | 1,469 | 1,697 |
| 50,000–99,999 | 47 | 85 | 93 | 3,296 | 6,063 | 6,453 |
| 100,000 and over | 43 | 62 | 72 | 8,805 | 13,093 | 15,762 |
| Totals | 7,916 | 8,792 | 10,258 | 27,240 | 41,486 | 49,549 |
Returnable Income.—The table hereunder shows the amounts of returnable income of companies and tax assessed thereon, classified according to the size of the assessable income.
| Amount of Assessable | Returnable Income.* | Tax Assessed. | ||||
|---|---|---|---|---|---|---|
| 1941–42. | 1946–47. | 1947–48. | 1941–42. | 1946–47. | 1947–48. | |
*Including proprietary income. | ||||||
| £ £ | £(000) | £(000) | £(000) | £(000) | £(000) | £(000) |
| Under 100 | 338 | 443 | 516 | 14 | 10 | 10 |
| 100– 199 | 133 | 216 | 192 | 16 | 15 | 16 |
| 200– 299 | 252 | 177 | 194 | 27 | 20 | 23 |
| 300– 399 | 193 | 252 | 163 | 29 | 29 | 24 |
| 400– 499 | 342 | 196 | 300 | 29 | 31 | 38 |
| 500– 599 | 200 | 267 | 272 | 34 | 37 | 41 |
| 600– 699 | 183 | 651 | 249 | 32 | 41 | 43 |
| 700– 799 | 268 | 249 | 237 | 31 | 37 | 41 |
| 800– 899 | 219 | 241 | 275 | 32 | 42 | 51 |
| 900– 999 | 234 | 200 | 275 | 34 | 37 | 47 |
| 1,000– 1,999 | 1,443 | 2,271 | 2,570 | 294 | 465 | 531 |
| 2,000– 2,999 | 1,149 | 2,055 | 2,059 | 290 | 484 | 530 |
| 3,000–3,999 | 1,005 | 1,359 | 2,037 | 295 | 422 | 570 |
| 4,000– 4,999 | 659 | 1,519 | 1,593 | 236 | 453 | 558 |
| 5,000– 5,999 | 784 | 1,114 | 1,914 | 260 | 459 | 557 |
| 6,000– 6,999 | 593 | 989 | 1,150 | 241 | 436 | 513 |
| 7,000– 7,999 | 564 | 786 | 1,121 | 260 | 365 | 507 |
| 8,000–8,999 | 469 | 591 | 820 | 196 | 291 | 404 |
| 9,000– 9,999 | 291 | 617 | 627 | 143 | 302 | 305 |
| 10,000–19,999 | 2,449 | 4,303 | 6,015 | 1,167 | 2,073 | 2,760 |
| 20,000–29,999 | 2,333 | 2,835 | 3,411 | 1,090 | 1,408 | 1,615 |
| 30,000–39,999 | 1,497 | 2,024 | 2,503 | 734 | 1,012 | 1,147 |
| 40,000–49,999 | 1,199 | 1,513 | 1,758 | 571 | 713 | 861 |
| 50,000–99,999 | 3,464 | 6,236 | 6,835 | 1,591 | 3,030 | 3,164 |
| 100,000 and over | 9,481 | 13,807 | 16,057 | 4,051 | 6,329 | 7,536 |
| Totals | 29,740 | 44,910 | 53,142 | 11,695 | 18,542 | 21,891 |
The figures shown in respect of returnable income, classified according to the size of that income, do not vary greatly from the figures in the foregoing table. The difference between the assessable income and the total returnable income for 1947–48 amounted to only £3,593,000.
Rates of Tax: Companies.—For 1941–42 the rate of tax payable by a company was 2s. 6d., increased by 1/100 d. for every £1 of taxable income up to £6,600. From 1942–43 onwards the rate was 2s. 6d., increased by 1/100d. for every £1 of taxable income up to £6,300. Above £6,300 the rate was 7s. 9d., increased by 1/150d. for every £1 of taxable income in excess of £6,300, with a maximum of 8s. 8d. in £1. In addition to the foregoing, a further amount equal to 15 per cent. of the above rates was imposed for the years 1941–42, 1946–47, and 1947–48. Companies do not pay the additional tax of 33⅓ per cent. on unearned income. Further information concerning rates of taxation will be found on page 421.
Income-tax levied on companies in 1947–48 was equal to 44.2 per cent. of the assessable income for that year. For returnable income the tax assessed was equal to 41.2 per cent.
The table hereunder shows the various sources from which the incomes of companies were derived. Where more than one source of income is involved, the whole income of the company is classed according to the principal source of assessable income.
| Source. | Number of Assessments. | Assessable Income.* | ||||
|---|---|---|---|---|---|---|
| 1941–42. | 1946–47. | 1947–48. | 1941–42. | 1946–47. | 1947–48. | |
*Excluding proprietary income. | ||||||
| Commerce, trade, or business— | £(000) | £(000) | £(000) | |||
| Banks and Insurance Other | 4,306 | 136 | 134 | 15,860 | 5,076 | 5,176 |
| Other | 4,562 | 5,129 | 19,686 | 23,633 | ||
| Industry or manufacture | 1,136 | 1,805 | 2,126 | 7,524 | 12,556 | 16,471 |
| Farming | 167 | 189 | 229 | 196 | 310 | 434 |
| Transport or communication— | ||||||
| Shipping | 263 | 28 | 31 | 1,153 | 539 | 293 |
| Other | 276 | 385 | 610 | 832 | ||
| Building or construction | 117 | 195 | 260 | 274 | 540 | 650 |
| Mining or extraction | 121 | 49 | 83 | 538 | 276 | 293 |
| Investments and the like | 1,619 | 1,291 | 1,617 | 1,312 | 1,056 | 953 |
| Entertainment, sport, or recreation | 187 | 261 | 264 | 383 | 836 | 815 |
| Totals | 7,916 | 8,792 | 10,258 | 27,240 | 41,486 | 49,549 |
Non-resident Traders.—A non-resident trader is defined as any person who, being in New Zealand, carries on business there without having any fixed and permanent place of business or abode in New Zealand. Returns made by agents for non-resident traders, and returns by the consignees of overseas goods sold on consignment account, are included in this class. Non-resident traders are now included in the statistics either as individuals or companies, as the case may be.
PRICE FIXATION.—In New Zealand, as in other countries, increased regulation of prices by governmental control has been a feature of economic policy over a considerable period of years. Nation-wide control of prices of essential commodities was resorted to during the war of 1914–18, the motives behind legislation and regulations towards that end being the necessity of purchasing at reasonable prices commodities required for war purposes, and the protection of the consumer from the full force of the abnormal rises in prices caused by the scarcity of many necessary commodities.
The administration of these price-fixing measures was in the hands of the Hoard of Trade, set up under the provisions of the Cost of Living Act, 1915, regulations being issued from time to time fixing maximum prices for various commodities—e.g., sugar, timber, wheat, &c. The Board of Trade Act, 1919 (a consolidation and amendment of the pre-existing legislation), contained provisions for the establishment of the Department of Industries and Commerce and for a Board of Trade, the Board to consist of the Minister of Industries and Commerce (President) and not more than four other members. By an amendment in 1923 the Board was abolished, its functions being taken over by the Minister. Authority was also taken under the Act “for the establishment of fixed minimum or maximum prices or rates for any classes of goods or services or otherwise for the regulation or control of such prices or rates.” The Act also includes provisions especially aimed at the prevention of profiteering.
The control of prices initiated during the war years continued in some instances well into the post-war period, the dates of cessation of control in certain important individual cases being: Bacon and ham, February, 1920; butter, August, 1921; sugar, August, 1923. Control of prices of building-materials was resorted to in 1920 and 1921, during a period of acute shortage of these materials.
Wheat, flour, and bread prices have been controlled almost without intermission since 1914–15, superphosphates since October, 1931, and motor-spirits from 1933. Road services have been subject to regulation in regard to fares and freight rates since 1931; aircraft fares are also regulated. [For fuller details see pp. 785–786 of the 1940 Year-Book.]
A Prevention of Profiteering Act was passed in 1936, prohibiting the making of unreasonable increases in the prices charged for goods and services.
In June, 1939, a Price Investigation Tribunal was constituted from the members of the existing Advisory Board under the Board of Trade Amendment Act, 1923, and restrictions were placed on increasing prices of goods and services without prior application to this Tribunal; prices were also to be fixed by the Tribunal for goods that had not previously been on the market.
Price Regulation during Second World War.—Pursuant to a Proclamation of Emergency under the Public Safety Conservation Act, regulations were made on 1st September, 1939, with the object of stabilizing prices. These regulations provided that prices of goods and services should not be raised above the prices ruling on 1st September, 1939, except as might be specifically authorized by the Minister of Industries and Commerce. A clause in the regulations also prohibited the hoarding of goods. These regulations were superseded by the Control of Prices Emergency Regulations of 29th December, 1939, which constituted what is virtually the present Price Tribunal.
Foodstuffs generally, and sugar, wheat, and flour specifically, were brought under the control of the Government by emergency regulations made on 4th September, 1939.
In October, 1940, the Economic Stabilization Conference (which the Government had convened) put forward recommendations designed to stabilize prices, wages, and costs. In furtherance of these recommendations the retail prices of thirty-eight commodities, comprising the more important foodstuffs, clothing, fares, fuel, and lighting, were stabilized as from 1st September, 1941.
In December, 1942, as a result of the deliberations of the Economic Stabilization Committee set up in September, 1941, measures were taken to ensure as far as possible that the level of retail prices should not exceed the level ruling in that month. A varied range of essential items of household consumption was selected, and their prices stabilized; food, clothing, hardware, furniture, stationery, &c., were all represented in this list of approximately 110 items. Provision was made for the stabilization of weekly rentals, and of wage-rates, &c. These provisions were embodied in the Economic Stabilization Emergency Regulations 1942, by which also the Committee was reconstituted as the Economic Stabilization Commission.
The principal new feature of price control in 1943 was the fixation of maximum retail prices for many kinds of vegetables, apples, pears, and certain other fruits; these maxima made full allowance for seasonal variations.
No new element of control was introduced in 1944, 1945, or 1946 as the price orders of those years either revised earlier orders or covered additional items.
POST-WAR PRICE REGULATIONS.—By the Control of Prices Act, 1947, which consolidated the powers and functions formerly exercised mainly under Emergency Regulations, the principle of permanent price control was given legislative recognition. It defined the general duties and functions of the Price Tribunal as the fixing of prices for goods and services, the investigation of complaints with respect to prices, maintenance of a survey of the prices of goods or services, the institution of legal proceedings for offences in relation to prices, and the taking of such other steps as in its opinion might be necessary to prevent profiteering or the exploitation of the public. It provided that, except in special circumstances, the sittings of the Tribunal should be open to the public.
The appointment of a Director of Price Control, in charge of the Price Control Division of the Department of Industries and Commerce, freed the Tribunal from administrative and enforcement duties, while provision was made for the delegation of pricing powers to the Director, subject to a right of appeal to the Tribunal.
The Price Tribunal has power to—
Make Price Orders fixing, in such manner as it thinks fit, the actual or the maximum or the minimum price for any goods sold in a specified market and under specified conditions. Price Orders are published in the New Zealand Gazette, and must generally be displayed in any shop where the goods to which they relate are sold.
Authorize selling-prices, which may be of general or special application.
Outside Price Orders or special price authorizations by the Tribunal or Director, the general stabilization of prices at levels obtaining on 1st September, 1939, continues in force.
Since the passing of the Act the Tribunal has, in the case of many commodities, issued Price Orders which prescribe that maximum prices are to be calculated by adding specified percentages to costs.
In November, 1948, all fruits and vegetables (except potatoes, apples, pears, imported citrus fruits, New Zealand lemons, other than Meyer lemons, bananas, New Zealand walnuts, and all imported nuts) were released from direct price control.
By order gazetted on 13th January, 1949, meat prices were also freed from control during certain months in each year.
The Economic Stabilization Act of 1948 removed the Economic Stabilization Commission from an emergency to a permanent status.
The Transport Law Amendment Act, 1948, established a Transport Charges Committee and a Transport Charges Appeal Authority. The chief function of the Committee is to fix passenger fares and freight charges upon application or by direction of the Appeal Authority. The Authority sits for the determination of appeals from decisions of the Committee.
STATE MARKETING.—Certain fields of price fixation are intimately connected with the functions of the Marketing Department, although the relevant price orders are still in many instances issued by the Price Tribunal. The prices to be paid for apples and pears are determined by the Minister of Marketing after consultation with the New Zealand Apple and Pear Marketing Board. The Minister has not an absolute discretion in price fixing, and the price declared for each season must lie within fixed limits above or below a declared “cost of production” figure.
The Marketing Act, 1936, which established the Marketing Department, transferred to the latter many of the functions previously exercised by the New Zealand Dairy Board and made provision for the fixation by the Department of prices of butter and cheese for export and for consumption in New Zealand, regulations in this behalf being subsequently issued from time to time. By the Dairy Products Marketing Commission Act 1947, however, these functions were transferred to the New Zealand Dairy Products Marketing Commission.
The Marketing Amendment Act of 1937 set up the Internal Marketing Division within the Marketing Department and specifically brought eggs, fruit, and honey within the scope of the principal Act, while subsequent regulations added hops and potatoes.
Control of prices of export meat was assumed in 1939 by the Marketing Department under the authority of the Marketing Amendment Act, 1939; Meat Marketing Orders being issued annually until 1947. As from the 1st May, 1948, however, the New Zealand Meat Producers Board (constituted by the Meat Export Control Act, 1921–22) was entrusted with routine administration of shipping and payments to freezing companies for all meat destined for export under bulk purchase agreements negotiated by the Government with the United Kingdom (vide Section 18A).
The control and distribution of bananas and imported citrus fruits were placed in the hands of the Internal Marketing Division early in 1938, and in August, 1940, regulations regarding grading and packing of all New-Zealand-grown fruit (other than berries) were gazetted.
Control of prices of milk in Wellington was formerly in the hands of the Wellington City Council, which was granted a monopoly (with certain minor exceptions) of the sale of milk in Wellington by a local Act passed in 1919. The Auckland Metropolitan Milk Act, 1933, similarly authorized the Auckland Metropolitan Milk Council to fix prices for milk sold in Auckland City and suburbs, only that in this instance a monopoly was not created, though it was an offence to sell or deliver milk in the district except under licence from the Council. These local Acts were superseded by the Milk Act, 1944, referred to on page 487, which created the Milk Marketing Division (of the Marketing Department) and made provision for an extension of the system of local control in regard to the sale of milk. Under this Act the Wellington City Council remained the major distributor and became the Milk Authority for the capital city. Prices in the various milk districts are the subject of Price Orders pursuant to the Control of Prices Act, 1947 (formerly pursuant to the Control of Prices Emergency Regulations 1939).
By the Marketing Amendment Act, 1948, the Export Division, the Internal Marketing Division, and the Milk Marketing Division were abolished as separate divisions of the Marketing Department.
WARTIME PRICE INDEX.—Part IV of the Economic Stabilization Emergency Regulations 1942 provided, inter alia, for the preparation of a special wartime price index, for the purpose of recording as from 15th December, 1942, any increases or reductions in the prices of such commodities and services (including rents) as the Minister of Industries and Commerce might direct. The wartime price index was gazetted quarterly by the Government Statistician from March, 1943 to December, 1948.
Detailed information regarding the wartime price index will be found in parliamentary paper H–43 of 1944. The composition of this index differed from that of previous retail prices index numbers in several respects, viz.:—
Numerous alterations were made in the schedule of commodities, &c., covered by the various groups and sub-groups.
Weights generally were revised to represent relative wartime consumption of the various commodities and groups covered by the index.
A new group was introduced covering fresh fruit and vegetables other than potatoes and onions, which—as in previous index numbers—were included in the groceries group.
The dwellings covered by the rent group were subdivided to give correct relative weights to private and Government rental houses.
Clothing and footwear were divided into subgroups to give correct relative weights to the requirements of men, women, and children respectively.
The indices for the clothing, footwear, and household drapery group, and for most subgroups of the miscellaneous group, were arrived at by the aggregate expenditure method, thus bringing them into line with the remaining groups. The technique of geometric means entered into the wartime price index only as regards two miscellaneous sub-groups (Papers, Periodicals, and School Stationery; and Postages and Telegrams).
In view of the purpose of the wartime price index, prices of milk, eggs, meat, potatoes, onions, and fresh fruit and vegetables were adjusted on the basis of normal seasonal variations in the prices of these commodities.
The following table shows the wartime price index from December, 1942, to December, 1948 (the last date of its compilation):—
WARTIME PRICE INDEX
Base 15th December, 1942 (= 1000)
| Year. | 15th March. | 15th June. | 15th September. | 15th December. |
|---|---|---|---|---|
| 1943 | 1011 | 1000 | 996 | 1001 |
| 1944 | 1005 | 1001 | 1003 | 1004 |
| 1945 | 1006 | 1005 | 1001 | 1003 |
| 1946 | 1009 | 1007 | 1007 | 1008 |
| 1947 | 1013 | 1027 | 1032 | 1085 |
| 1948 | 1103 | 1110 | 1098 | 1107 |
CONSUMERS' PRICE INDEX.—In 1948 an Index Committee was appointed by the Government “to investigate the need and method of establishing a revised cost-of-living index.” In the Committee's report to the Government (parliamentary paper H–48, 1948) it was recommended that a new retail price index, to be known as the Consumers' Price Index should replace existing series of retail price indices. The new index accordingly commenced at the first quarter of 1949, the regulations authorizing the wartime price index being revoked in February of the same year. A further report describing the initiation of the Consumers' Price Index has been prepared by the Government Statistician, and is given in Appendix (e) of this issue of the Year-Book. The index numbers for the first and second quarters of 1949 are given in the following tables:—
CONSUMERS' PRICE INDEX.—QUARTERLY INDEX NUMBERS (ALL GROUPS), TWENTY-ONE TOWNS COMBINED
Base: Weighted average twenty-one towns, first quarter, 1949 (=1000)
| 1949. | Food. | Housing. | Fuel and Lighting. | Clothing and Footwear. | Miscellaneous. | All Groups. | ||||||||||
|---|---|---|---|---|---|---|---|---|---|---|---|---|---|---|---|---|
| Meat and Fish. | Fruits, Vegetables, and Eggs. | Other Foods. | All food. | Rent. | Other Housing. | All Housing. | Clothing. | Footwear. | Clothing and Footwear. | Household Durable Goods. | Other Commodities. | Services. | All Miscellaneous. | |||
| First Quarter | 1000 | 1000 | 1000 | 1000 | 1000 | 1000 | 1000 | 1000 | 1000 | 1000 | 1000 | 1000 | 1000 | 1000 | 1000 | 1000 |
| Second Quarter | 1006 | 978 | 1020 | 1007 | 1000 | 1000 | 1000 | 1001 | 1000 | 1003 | 1001 | 998 | 998 | 1000 | 999 | 1002 |
CONSUMERS' PRICE INDEX.—QUARTERLY INDEX NUMBERS FOR INDIVIDUAL TOWNS AND GROUPINGS
Base: Weighted average twenty-one towns, first quarter, 1949 (= 1000)
| — | Quarter Ended 31st March, 1949. | Quarter Ended 30th June, 1949. | ||||||||||
|---|---|---|---|---|---|---|---|---|---|---|---|---|
| Food. | Housing. | Fuel and Lighting. | Clothing and Footwear. | Miscellaneous. | All Groups. | Food. | Housing. | Fuel and Lighting. | Clothing and Footwear. | Miscellaneous. | All Groups. | |
* In calculating these all-groups index numbers, the missing aggregates for the Clothing and Footwear and Miscellaneous groups were supplied from the first ten towns. | ||||||||||||
| Auckland | 997 | 1036 | 1005 | 1026 | 983 | 1006 | 992 | 1036 | 1005 | 1025 | 983 | 1004 |
| Wellington | 984 | 1027 | 926 | 1005 | 1012 | 1000 | 997 | 1027 | 926 | 1001 | 1010 | 1003 |
| Christchurch | 1003 | 1009 | 961 | 936 | 1010 | 991 | 1016 | 1009 | 968 | 948 | 1008 | 997 |
| Dunedin | 1003 | 991 | 790 | 988 | 995 | 988 | 1000 | 991 | 789 | 988 | 994 | 986 |
| Four chief centres | 996 | 1023 | 949 | 999 | 998 | 999 | 999 | 1023 | 950 | 999 | 997 | 1001 |
| Hamilton | 1017 | 955 | 1032 | 987 | 993 | 995 | 1034 | 955 | 1031 | 986 | 992 | 1000 |
| Napier | 983 | 938 | 1123 | 1023 | 1012 | 996 | 1020 | 938 | 1123 | 1020 | 1009 | 1007 |
| New Plymouth | 1021 | 953 | 1092 | 1017 | 992 | 1004 | 1034 | 953 | 1092 | 1013 | 988 | 1007 |
| Palmerston North | 1018 | 964 | 1017 | 1035 | 1017 | 1012 | 1036 | 964 | 1020 | 1037 | 1016 | 1018 |
| Nelson | 1002 | 1000 | 1129 | 1002 | 1020 | 1011 | 1051 | 1000 | 1125 | 1004 | 1014 | 1026 |
| Invercargill | 1055 | 965 | 1040 | 996 | 1004 | 1015 | 1029 | 965 | 1040 | 993 | 1005 | 1005 |
| Six provincial towns | 1016 | 958 | 1067 | 1012 | 1006 | 1005 | 1032 | 958 | 1067 | 1011 | 1004 | 1010 |
| Whangarei | 1024 | 930 | 1249 | 1007* | 1013 | 930 | 1250 | 1003* | ||||
| Tauranga | 1029 | 974 | 1000 | 1001* | 1042 | 974 | 1004 | 1005* | ||||
| Rotorua | 1008 | 972 | 1099 | 998* | 1021 | 972 | 1099 | 1002* | ||||
| Gisborne | 965 | 943 | 1342 | 995* | 999 | 943 | 1343 | 1006* | ||||
| Wanganui | 989 | 946 | 1140 | 1004* | 1006 | 946 | 1140 | 1010* | ||||
| Masterton | 1011 | 950 | 1203 | 1007* | 1029 | 950 | 1202 | 1012* | ||||
| Blenheim | 1000 | 971 | 1266 | 1011* | 1031 | 971 | 1266 | 1020* | ||||
| Greymouth | 1007 | 932 | 1051 | 986* | 1014 | 932 | 1051 | 990* | ||||
| Ashburton | 1002 | 910 | 1378 | 990* | 1015 | 910 | 1389 | 997* | ||||
| Timaru | 993 | 970 | 984 | 982* | 1004 | 970 | 984 | 988* | ||||
| Oamaru | 999 | 929 | 1040 | 986* | 999 | 929 | 1040 | 985* | ||||
| Eleven other towns | 1001 | 949 | 1140 | 996* | 1014 | 949 | 1141 | 1001* | ||||
CONSUMERS' PRICE INDEX.—MONTHLY INDEX NUMBERS (FOOD AND FUEL AND LIGHTING) TWENTY-ONE TOWNS COMBINED
Base: Weighted average twenty-one towns, first quarter, 1949 (= 1000)
| — | Meat and Fish. | Fruits, Vegetables, and Eggs. | Other Food. | All Food. | Fuel and Lighting. |
|---|---|---|---|---|---|
| Month— | |||||
| 1949–January | 997 | 1063 | 1000 | 1014 | 1000 |
| February | 1000 | 1012 | 1000 | 1003 | 1000 |
| March | 1002 | 925 | 1000 | 984 | 1000 |
| April | 1006 | 995 | 1018 | 1010 | 1000 |
| May | 1006 | 969 | 1018 | 1004 | 1001 |
| June | 1008 | 971 | 1024 | 1008 | 1001 |
CONSUMERS' PRICE INDEX.—MONTHLY INDEX NUMBERS FOR INDIVIDUAL TOWNS AND GROUPINGS
Base: Weighted average twenty-one towns, first quarter, 1949 (= 1000)
| — | January, 1949. | February, 1949. | March, 1949. | April, 1949. | May, 1949. | June, 1949. | ||||||
|---|---|---|---|---|---|---|---|---|---|---|---|---|
| Food. | Fuel and Lighting. | Food. | Fuel and Lighting. | Food. | Fuel and Lighting. | Food. | Fuel and Lighting. | Food. | Fuel and Lighting. | Food. | Fuel and Lighting. | |
| Auckland | 1008 | 1005 | 1001 | 1005 | 983 | 1005 | 1002 | 1005 | 983 | 1005 | 993 | 1005 |
| Wellington | 991 | 925 | 990 | 927 | 971 | 926 | 994 | 926 | 997 | 926 | 1001 | 926 |
| Christchurch | 1023 | 961 | 1003 | 961 | 984 | 961 | 1019 | 961 | 1015 | 972 | 1014 | 972 |
| Dunedin | 1032 | 790 | 1007 | 790 | 970 | 790 | 1011 | 788 | 995 | 789 | 994 | 789 |
| Four chief centres | 1009 | 949 | 999 | 949 | 978 | 949 | 1004 | 949 | 994 | 951 | 999 | 951 |
| Hamilton | 1029 | 1032 | 1016 | 1032 | 1007 | 1032 | 1035 | 1032 | 1037 | 1031 | 1030 | 1031 |
| Napier | 1006 | 1123 | 975 | 1121 | 971 | 1123 | 1006 | 1123 | 1022 | 1123 | 1031 | 1123 |
| New Plymouth | 1035 | 1090 | 1022 | 1092 | 1006 | 1092 | 1029 | 1092 | 1031 | 1092 | 1042 | 1092 |
| Palmerston North | 1033 | 1017 | 1018 | 1017 | 1002 | 1017 | 1035 | 1020 | 1036 | 1020 | 1037 | 1020 |
| Nelson | 1001 | 1130 | 1001 | 1130 | 1005 | 1127 | 1041 | 1125 | 1059 | 1125 | 1052 | 1125 |
| Invercargill | 1064 | 1040 | 1075 | 1040 | 1027 | 1040 | 1037 | 1040 | 1019 | 1040 | 1031 | 1040 |
| Six provincial towns | 1029 | 1067 | 1018 | 1067 | 1002 | 1067 | 1029 | 1067 | 1032 | 1067 | 1036 | 1067 |
| Whangarei | 1033 | 1249 | 1028 | 1250 | 1012 | 1250 | 1023 | 1250 | 1006 | 1250 | 1011 | 1250 |
| Tauranga | 1040 | 1000 | 1028 | 1000 | 1019 | 1000 | 1042 | 1004 | 1045 | 1004 | 1039 | 1004 |
| Rotorua | 1019 | 1099 | 1007 | 1099 | 999 | 1099 | 1021 | 1099 | 1022 | 1099 | 1022 | 1099 |
| Gisborne | 982 | 1342 | 959 | 1342 | 954 | 1342 | 986 | 1343 | 1001 | 1343 | 1011 | 1343 |
| Wanganui | 1004 | 1140 | 990 | 1140 | 974 | 1140 | 1004 | 1140 | 1006 | 1140 | 1009 | 1140 |
| Masterton | 1017 | 1203 | 1019 | 1202 | 997 | 1202 | 1026 | 1202 | 1029 | 1202 | 1033 | 1202 |
| Blenheim | 1006 | 1266 | 1000 | 1266 | 996 | 1266 | 1017 | 1266 | 1039 | 1266 | 1037 | 1266 |
| Greymouth | 1023 | 1051 | 1006 | 1051 | 991 | 1051 | 1014 | 1051 | 1015 | 1051 | 1011 | 1051 |
| Ashburton | 1022 | 1378 | 1001 | 1378 | 983 | 1378 | 1017 | 1382 | 1015 | 1392 | 1012 | 1392 |
| Timaru | 1013 | 984 | 994 | 984 | 972 | 934 | 1009 | 984 | 1003 | 984 | 1000 | 984 |
| Oamaru | 1027 | 1040 | 1003 | 1040 | 966 | 1040 | 1010 | 1040 | 994 | 1040 | 992 | 1040 |
| Eleven other towns | 1015 | 1140 | 1001 | 1140 | 986 | 1140 | 1014 | 1140 | 1014 | 1141 | 1014 | 1141 |
WHOLESALE PRICES.—In most countries index numbers of wholesale prices are compiled from the price data available in trade journals or from the published reports of wholesale markets. In New Zealand wholesale markets scarcely exist, and consequently price data for the wholesale-prices investigation have been collected from wholesale merchants and traders who, from the volume of the business they transact, are able to supply representative information.
Since 1917 such wholesale-price quotations have been collected monthly, the inquiry being for the most part confined to the four chief centres. In the case of a few commodities (e.g., newsprint), of which there is a consumption so large that the article can scarcely be omitted from the price-index, yet for which no actual market exists within New Zealand, the inclusion of the commodity in the index number has been rendered possible by ascertaining movements of prices from the import statistics. Statistics of imports and exports as a source of price data have, however, been avoided as far as possible, on the ground that where quotations are obtained from traders care can be taken to ensure that the grade, &c., quoted is kept constant. A considerable volume of data as to wholesale prices was secured from merchants and traders (and in a few cases from import figures) by means of retrospective investigations covering the years 1891 to 1917, and sufficient information was secured to permit of the compilation for each year from 1891 onwards of a “general” wholesale prices index number based on the prices of 106 commodities.
During 1926 a revision of the wholesale prices index was effected, and was so designed, inter alia, as to permit of the inclusion in the index number of several commodities such as motor-spirits, &c., the importance of which had increased enormously since the index was originally instituted. The list of commodities represents a wide range, covering articles of local production and of foreign production, and of farm, mine, marine, factory, &c., origin.
In 1937 a further revision of the wholesale prices index was put in hand, but except for the new base-period (which is 1926–30=1000) these indices do not differ essentially from those of the previous series. The revision consisted mainly of adjustment of the weights in accordance with changed consumption, the elimination, as far as possible, of “double counting” (the inclusion of a commodity in its raw state and again in a processed condition), the adoption of some new items, and the omission of some others, previously included, which had proved unsatisfactory. A detailed account of the method of computation of the index is given in the Statistical Report on Prices, &c., for 1937.
Indices in the present series have been prepared, annually from 1913 onward, and monthly commencing with 1936.
WHOLESALE PRICES.—GENERAL INDEX NUMBERS.—BASE: 1926–30 (= 1000)
| Year. | Index Number. |
|---|---|
| 1913 | 724 |
| 1914 | 748 |
| 1915 | 805 |
| 1916 | 882 |
| 1917 | 1024 |
| 1918 | 1225 |
| 1919 | 1282 |
| 1920 | 1536 |
| 1921 | 1428 |
| 1922 | 1194 |
| 1923 | 1115 |
| 1924 | 1120 |
| 1925 | 1114 |
| 1926 | 1053 |
| 1927 | 1001 |
| 1928 | 994 |
| 1929 | 988 |
| 1930 | 963 |
| 1931 | 901 |
| 1932 | 878 |
| 1933 | 902 |
| 1934 | 907 |
| 1935 | 936 |
| 1936 | 945 |
| 1937 | 1022 |
| 1938 | 1036 |
| 1939 | 1071 |
| 1940 | 1195 |
| 1941 | 1311 |
| 1942 | 1416 |
| 1943 | 1513 |
| 1944 | 1558 |
| 1945 | 1584 |
| 1946 | 1589 |
| 1947 | 1649 |
| 1948 | 1837 |
The wholesale prices index is purely a commodity index, no attempt having been made to cover the wholesale prices of services such as the supply of electric power, transportation, &c. The index relates only to commodities consumed in New Zealand, each item included in the make-up of the index being weighted by a factor representing production, plus imports, less exports (i.e., local consumption). The wholesale prices index numbers are compiled by the aggregate expenditure method, and where applicable, sales tax is included in the prices used in the index.
The following table shows annual wholesale prices index numbers by groups.
WHOLESALE PRICES.—INDEX NUMBERS BY GROUPS.—BASE: 1926–30 (= 1000)
| Group. | 1914. | 1939. | 1944. | 1945. | 1946. | 1947. | 1948. |
|---|---|---|---|---|---|---|---|
| 1. Foodstuffs, &c., of vegetable origin— | |||||||
| A. Agricultural produce | 642 | 1328 | 1562 | 1588 | 1539 | 1577 | 1735 |
| B. Fresh fruit and vegetables | 764 | 1055 | 1256 | 1239 | 1223 | 1315 | 1646 |
| C. Milled agricultural products | 644 | 776 | 757 | 757 | 757 | 790 | 869 |
| D. Other foods and groceries of vegetable origin | 613 | 1189 | 1846 | 1850 | 1858 | 1940 | 2142 |
| A–D. Four subgroups combined | 634 | 1124 | 1544 | 1550 | 1544 | 1610 | 1789 |
| 2. Textile manufactures | 535 | 815 | 1692 | 1727 | 1724 | 1739 | 2024 |
| 3. Wood and wood products | 582 | 1184 | 1440 | 1504 | 1581 | 1652 | 1772 |
| 4. Animal products— | |||||||
| A. Meats | 941 | 1011 | 1284 | 1364 | 1445 | 1712 | 1691 |
| B. Semi-manufactured animal products (not foods) | 838 | 691 | 867 | 867 | 873 | 878 | 878 |
| C. Leather | 676 | 1129 | 1367 | 1367 | 1390 | 1615 | 1732 |
| D. Other foods and groceries of animal origin | 785 | 965 | 1070 | 1071 | 1081 | 1140 | 1216 |
| A–D. Four subgroups combined | 843 | 992 | 1189 | 1224 | 1267 | 1433 | 1468 |
| 5. Metals and their products | 919 | 1277 | 2172 | 2220 | 2199 | 2148 | 2401 |
| 6. Non-metallic minerals and their products— | |||||||
| A. Mineral oils | 1164 | 1235 | 1611 | 1599 | 1517 | 1593 | 1691 |
| B. Coal | 539 | 1085 | 1091 | 1091 | 1091 | 1141 | 1338 |
| C. Other non-metallic minerals and their products | 600 | 1023 | 1308 | 1363 | 1427 | 1402 | 1525 |
| A–C. Three subgroups combined | 821 | 1140 | 1353 | 1356 | 1331 | 1380 | 1522 |
| 7. Chemicals and manures | 954 | 861 | 1059 | 1062 | 1086 | 1327 | 1821 |
| All groups combined | 748 | 1071 | 1558 | 1584 | 1589 | 1649 | 1837 |
In the next table index numbers are given by classes. These index numbers should be taken for no more than they purport to represent—viz., the movement in wholesale prices of those commodities, covered by the wholesale prices inquiry, which belong to the respective classes. The figure for Class III, for instance, does not purport to show the movement in building costs, nor should that for imported items be confused with the index number of import prices. The table also shows the separate index numbers for imported items and locally-produced items included in the wholesale prices series and affords an interesting comparison, particularly since the outbreak of the Second World War. The 1948 index for imported commodities shows an increase of 92.7 per cent. as compared with 1939, while the index for locally-produced commodities advanced by 42.5 per cent. during the same period.
WHOLESALE PRICES.—INDEX NUMBERS BY CLASSES.—BASE: 1926–30 (= 1000)
| Year. | Consumers' Goods. | Producers' Materials, &c. | Classes I and II combined. | Classes III and IV combined. | Locally-produced Commodities. | Imported Commodities. | All Classes combined. | ||
|---|---|---|---|---|---|---|---|---|---|
| Class I: Foodstuffs. | Class II: Non-Foods. | Class III: Materials for Building and Construction. | Class IV: Materials for other Industries. | ||||||
| 1938 | 992 | 979 | 1215 | 1043 | 986 | 1081 | 987 | 1072 | 1036 |
| 1939 | 1088 | 1000 | 1206 | 1057 | 1051 | 1090 | 1053 | 1084 | 1071 |
| 1940 | 1121 | 1145 | 1373 | 1214 | 1131 | 1249 | 1078 | 1281 | 1195 |
| 1941 | 1228 | 1280 | 1560 | 1308 | 1249 | 1364 | 1139 | 1439 | 1311 |
| 1942 | 1335 | 1468 | 1664 | 1374 | 1389 | 1438 | 1193 | 1581 | 1416 |
| 1943 | 1350 | 1678 | 1793 | 1466 | 1483 | 1539 | 1205 | 1742 | 1513 |
| 1944 | 1381 | 1759 | 1832 | 1506 | 1534 | 1579 | 1233 | 1800 | 1558 |
| 1945 | 1401 | 1781 | 1923 | 1520 | 1554 | 1610 | 1257 | 1827 | 1584 |
| 1946 | 1422 | 1779 | 1908 | 1522 | 1566 | 1608 | 1278 | 1821 | 1589 |
| 1947 | 1557 | 1774 | 1823 | 1605 | 1645 | 1653 | 1368 | 1859 | 1649 |
| 1948 | 1651 | 1952 | 1968 | 1870 | 1773 | 1892 | 1501 | 2089 | 1837 |
Of the total base aggregate expenditure, Class I represents 27.1 per cent., Class II 19.2 per cent., Class III 11.9 per cent., and Class IV 41.8 per cent., while the imported items aggregate 57.7 per cent. of the total.
EXPORT PRICES.—Monthly and annual index numbers of export prices are compiled, based on the declared export values of the principal commodities of New Zealand produce exported. The prices are related to the base period 1909–13 (= 1000), but the weight allotted to each of the various commodities included is the average quantity of that commodity exported during the five preceding export seasons—i.e., years ended 30th June. This system of weighting permits of more reliable comparisons between neighbouring years than over long periods.
Most of the export commodities are homogeneous, but in some instances—e.g., wool—the average export value in any month may be affected by changes in the relative quantities of the various grades or classes exported. This difficulty latterly has been obviated by taking export values based on the average prices realized for greasy wool at New Zealand wool sales.
Index numbers for calendar years are shown in the next table, compiled for each group on the base 1909–13 (= 1000).
EXPORT PRICES.—INDEX NUMBERS.—BASE: 1909–13 (= 1000)
| Calendar Year. | Group I: Dairy-produce. | Group II: Meat. | Group III: Wool. | Group IV: Other Pastoral Produce. | Groups I–IV: All Pastoral and Dairy Produce. | Group V: Agricultural Produce. | Group VI: Timber. | Group VII: Minerals. | Groups I–VII: All Groups combined. |
|---|---|---|---|---|---|---|---|---|---|
| 1938 | 1210 | 1752 | 1176 | 947 | 1340 | 1411 | 2752 | 1816 | 1367 |
| 1939 | 1231 | 1635 | 1098 | 943 | 1290 | 1543 | 2729 | 1954 | 1324 |
| 1940 | 1324 | 1796 | 1505 | 1287 | 1501 | 1379 | 2465 | 2207 | 1524 |
| 1941 | 1347 | 1806 | 1505 | 1501 | 1527 | 1508 | 2498 | 2270 | 1553 |
| 1942 | 1384 | 1805 | 1505 | 1800 | 1563 | 1333 | 2779 | 2317 | 1586 |
| 1943 | 1431 | 1835 | 1677 | 1712 | 1627 | 1453 | 2783 | 2364 | 1650 |
| 1944 | 1566 | 1907 | 1720 | 1701 | 1711 | 1665 | 2763 | 2359 | 1733 |
| 1945 | 1799 | 2034 | 1720 | 1755 | 1846 | 1803 | 3379 | 2457 | 1865 |
| 1946 | 1869 | 2252 | 1897 | 2317 | 2024 | 1913 | 3647 | 2582 | 2040 |
| 1947 | 2189 | 2725 | 2460 | 3827 | 2559 | 2333 | 4171 | 2587 | 2555 |
| 1948 | 2405 | 2694 | 3134 | 4002 | 2834 | 2657 | 4767 | 2572 | 2825 |
The next table shows export-prices index numbers for all pastoral and dairy produce groups and for all groups combined in respect of each year from 1914 to 1948.
| Year. | Index Numbers. | |
|---|---|---|
| All Pastoral and Dairy Produce. | All Groups combined. | |
| 1914 | 1095 | 1089 |
| 1915 | 1251 | 1239 |
| 1916 | 1478 | 1460 |
| 1917 | 1663 | 1655 |
| 1918 | 1691 | 1684 |
| 1919 | 1787 | 1776 |
| 1920 | 1824 | 1806 |
| 1921 | 1725 | 1713 |
| 1922 | 1352 | 1363 |
| 1923 | 1619 | 1610 |
| 1924 | 1806 | 1788 |
| 1925 | 1914 | 1893 |
| 1926 | 1541 | 1540 |
| 1927 | 1529 | 1525 |
| 1928 | 1700 | 1683 |
| 1929 | 1634 | 1623 |
| 1930 | 1279 | 1283 |
| 1931 | 965 | 984 |
| 1932 | 870 | 892 |
| 1933 | 867 | 896 |
| 1934 | 1089 | 1109 |
| 1935 | 1072 | 1102 |
| 1936 | 1228 | 1250 |
| 1937 | 1423 | 1440 |
| 1938 | 1340 | 1367 |
| 1939 | 1290 | 1324 |
| 1940 | 1501 | 1524 |
| 1941 | 1527 | 1553 |
| 1942 | 1563 | 1586 |
| 1943 | 1627 | 1650 |
| 1944 | 1711 | 1733 |
| 1945 | 1846 | 1865 |
| 1946 | 2024 | 2040 |
| 1947 | 2559 | 2555 |
| 1948 | 2834 | 2325 |
The all-groups index for 1940 was 200 points in advance of the previous year; the principal cause of this increase was the purchase of the exportable surplus of New Zealand's meat, wool, and dairy-produce by the United Kingdom Government at prices somewhat in advance of those ruling in the 1938–39 season. Although the other pastoral produce, timber, and mineral groups advanced considerably from 1940 to 1942, there was little change in the indices for the major groups, and the all-groups index for 1942 was only 62 points above that for 1940. The increased price for wool granted to producers as from the 1942–43 realizations, was the major cause of the 64-point increase in the 1943 index; in 1944 the increased prices obtained for meat and for dairy-produce, and the full effect of the wool-price increase, are reflected in both the individual index numbers and in the all-groups index. The 1945 index showed an increase of 132 points mainly as a result of the new agreements in regard to dairy-produce and meat.
The post-war period has continued to bring forth substantial increases amounting to 175, 515, and 270 points in 1946, 1947, and 1948 respectively. These increases reflect, in the main, advances in prices under long-term contracts with the United Kingdom Government, or, in the case of wool, the brisk demand for New Zealand wool displayed at the resumption of auction sales in September, 1946, and repeated in each of the two subsequent seasons. The credit for the 1945–46 movement is shared by meat, wool, and other pastoral products, with a smaller contribution from dairy-produce. In 1946–47 each of these four groups rose sufficiently to move up the all-groups number by over 100 points, the “other pastoral” group (hides, skins, tallow, &c.) with a group index rise of 1510 points, having the greatest influence. Two-thirds of the 1947–48 increase was attributable to wool and the greater part of the remainder to dairy produce price movements.
The fact that the calendar year does not coincide with the farm-production year is especially significant in New Zealand, since the great bulk of export goods are farm-produce. For a number of purposes the next table, giving annual average export prices index numbers for years ended 30th June, will be more useful. As in the previous table, index numbers are based upon prices in New Zealand currency.
EXPORT PRICES.—INDEX NUMBERS (JUNE YEARS).—BASE: 1909–13 (= 1000)
| Year ended 30th June, | Group I: Dairy-produce. | Group II: Meat. | Group III: Wool. | Group IV: Other Pastoral Produce. | Groups I–IV: All Pastoral and Dairy Produce. | Group V: Agricultural Produce. | Group VI: Timber. | Group VII: Minerals. | Groups I–VII: All Groups combined. |
|---|---|---|---|---|---|---|---|---|---|
| 1937 | 1054 | 1623 | 1705 | 1437 | 1379 | 1362 | 2334 | 1752 | 1397 |
| 1938 | 1196 | 1725 | 1254 | 1257 | 1364 | 1378 | 2621 | 1805 | 1386 |
| 1939 | 1212 | 1677 | 1104 | 877 | 1291 | 1444 | 2743 | 1857 | 1320 |
| 1940 | 1310 | 1734 | 1457 | 1158 | 1456 | 1292 | 2614 | 2140 | 1479 |
| 1941 | 1333 | 1782 | 1505 | 1265 | 1498 | 1501 | 2368 | 2246 | 1524 |
| 1942 | 1373 | 1821 | 1505 | 1669 | 1554 | 1331 | 2647 | 2324 | 1577 |
| 1943 | 1415 | 1809 | 1580 | 1701 | 1589 | 1383 | 2762 | 2363 | 1613 |
| 1944 | 1437 | 1898 | 1720 | 1732 | 1658 | 1523 | 2755 | 2363 | 1681 |
| 1945 | 1741 | 1960 | 1720 | 1702 | 1797 | 1836 | 2812 | 2416 | 1817 |
| 1946 | 1802 | 2101 | 1720 | 1949 | 1881 | 1923 | 3357 | 2522 | 1903 |
| 1947 | 2067 | 2569 | 2165 | 3235 | 2339 | 1954 | 3927 | 2587 | 2336 |
| 1948 | 2393 | 2746 | 3012 | 3987 | 2811 | 2643 | 4560 | 2578 | 2803 |
IMPORT PRICES.—A series of import prices index numbers based on the year 1926 (= 100) and weighted in accordance with average quantities imported during the years 1926–30, was instituted in 1933. While the basic data were deficient in many respects, nevertheless the index served a very useful purpose. With the passage of time, however, certain inherent weaknesses in this series became apparent, while information previously lacking in some cases became available.
Accordingly, a revised series of index numbers was computed, based in the case of individual items on average quantities imported during the three years 1936–38. Group weights were instituted in the new series, to accord to the various groups their relative importance, and these were based on the average total value for the respective groups during the three years 1936–38. Even with the improved coverage and method now possible they are not sufficiently accurate to be quoted as other than a three-figure index.
The difficulty, inherent in an index number of imports, of obtaining sufficient coverage to provide a reliable indication of changes in prices for any one group, was overcome in the revised series by the utilization of figures of exports to New Zealand, obtained in detail from the published trade figures of certain overseas countries.
In order to avoid any possible confusion between the import prices index number and the wholesale prices index number for imported commodities, it seems desirable to draw attention to the fact that the price quotations on which the import prices index is based are declared values of commodities for import—i.e., prices in the exporting country plus 10 per cent. to cover freight, &c., expressed in terms of New Zealand currency.
The import prices index also covers some two hundred and fifty items, as compared with approximately one hundred items included in the wholesale prices index for imported commodities.
A comparative table of index numbers of the various related prices series from the year 1927 onward is as follows. All index numbers are quoted on a New Zealand currency basis, and on the base 1936–38 (= 100).
| Year. | Import Prices. | Export Prices. | Wholesale Prices. | Retail Prices (All Groups). | |||
|---|---|---|---|---|---|---|---|
| Pastoral and Dairy Produce. | All Groups. | Locally produced Commodities. | Imported Commodities. | All Groups. | |||
| 1927 | 119 | 115 | 113 | 104 | 97 | 100 | 110 |
| 1928 | 113 | 128 | 124 | 106 | 95 | 99 | 110 |
| 1929 | 111 | 123 | 120 | 106 | 94 | 99 | 110 |
| 1930 | 110 | 96 | 95 | 102 | 92 | 96 | 107 |
| 1931 | 102 | 73 | 73 | 90 | 90 | 90 | 99 |
| 1932 | 97 | 65 | 66 | 84 | 90 | 88 | 92 |
| 1933 | 99 | 65 | 66 | 83 | 95 | 90 | 87 |
| 1934 | 98 | 82 | 82 | 85 | 94 | 91 | 88 |
| 1935 | 96 | 81 | 82 | 92 | 94 | 94 | 92 |
| 1936 | 96 | 92 | 92 | 95 | 94 | 94 | 95 |
| 1937 | 102 | 107 | 107 | 102 | 102 | 102 | 101 |
| 1938 | 102 | 101 | 101 | 104 | 103 | 103 | 104 |
| 1939 | 102 | 97 | 98 | 111 | 104 | 107 | 108 |
| 1940 | 118 | 113 | 113 | 113 | 123 | 119 | 113 |
| 1941 | 131 | 115 | 115 | 120 | 139 | 131 | 118 |
| 1942 | 144 | 118 | 117 | 125 | 152 | 141 | 121 |
| 1943 | 159 | 122 | 122 | 127 | 168 | 151 | 124 |
| 1944 | 167 | 129 | 128 | 130 | 173 | 156 | 127 |
| 1945 | 170 | 139 | 138 | 132 | 176 | 158 | 128 |
| 1946 | 190 | 152 | 151 | 134 | 175 | 159 | 129 |
| 1947 | 226 | 192 | 189 | 144 | 179 | 165 | 133 |
| 1948 | 234 | 213 | 209 | 158 | 201 | 184 | 144 |
The following diagram, which is based on the index numbers shown in the preceding table, further illustrates the fluctuations that have occurred in the export and wholesale series.
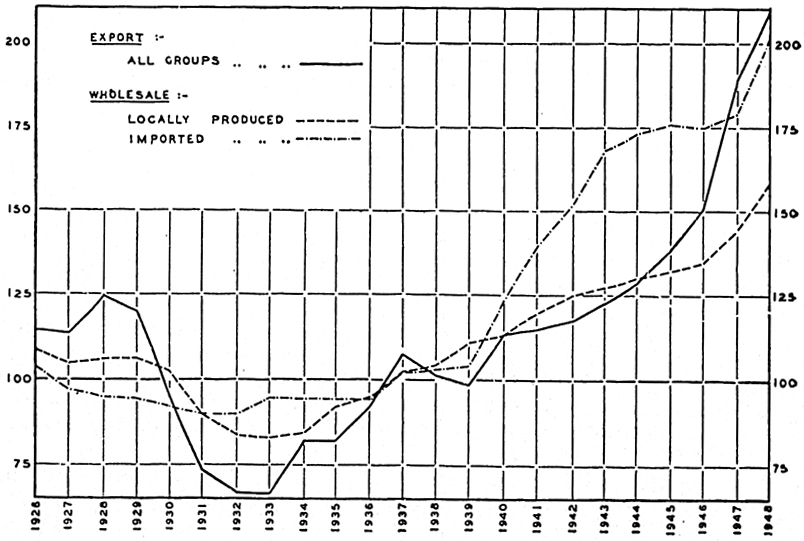
SHARE PRICES.—Changes in the market value of shares listed on the Stock Exchange give a very sensitive indication of changes in business conditions generally. A series of index numbers of share prices on base: 1926 (= 1000), and instituted in 1932, was published by the Census and Statistics Department for some considerable time, but in conformity with the usual international practice of revising index numbers at intervals, and advancing the base to a later period in point of time, the present revised series of index numbers is based on the year 1938. The market-prices—as on the last trading day in each month—of shares of forty-six representative companies, with shares listed on the New Zealand Stock Exchanges, form the basis on which the indices have been computed. The selection of the shares for inclusion in the index number was made with the object of reflecting New Zealand economic conditions; and, consequently, with one or two exceptions, only companies whose business is conducted largely or wholly in New Zealand are included. The index numbers are for ordinary shares, the prices of which vary directly with the profits of the company.
The market prices on which the index numbers are based have been extracted from Stock Exchange lists of individual exchanges prior to September, 1929, and from the list of share prices included in the Stock Exchange Gazette and its successor, the Official Record of the Stock Exchanges of New Zealand, since that date. The prices quoted relate to the last trading day in each month; so that the “monthly” index numbers compiled from these data relate to that day only, while the annual averages represent the averages of the monthly index numbers. Each individual share price, and each group, is weighted in accordance with the number and value of shares held in Now Zealand. The index numbers of New Zealand share prices give an indication of changes in share values as compared with the base year. In particular, they are intended to indicate the changes in value of a parcel of representative ordinary shares as compared with their 1938 value. The base adopted in this revised series is the average price ruling during the year 1938 (= 1000).
Shares in industrial companies and in finance, &c. companies have been computed separately, and the annual index numbers from 1927 to 1948 on base: 1938 (= 1000) are as follows:—
| Year. | Industrial Groups. | Finance, &c., Groups. | All Groups. |
|---|---|---|---|
| 1927 | 851 | 1254 | 1073 |
| 1928 | 879 | 1301 | 1111 |
| 1929 | 960 | 1330 | 1163 |
| 1930 | 835 | 1147 | 1007 |
| 1931 | 674 | 921 | 810 |
| 1932 | 667 | 852 | 769 |
| 1933 | 804 | 972 | 897 |
| 1934 | 996 | 1097 | 1051 |
| 1935 | 1102 | 1120 | 1112 |
| 1936 | 1075 | 1043 | 1057 |
| 1937 | 1073 | 1067 | 1069 |
| 1938 | 1000 | 1000 | 1000 |
| 1939 | 959 | 945 | 952 |
| 1940 | 1024 | 978 | 999 |
| 1941 | 1021 | 984 | 1001 |
| 1942 | 1005 | 1014 | 1010 |
| 1943 | 1156 | 1188 | 1174 |
| 1944 | 1249 | 1304 | 1279 |
| 1945 | 1285 | 1400 | 1346 |
| 1946 | 1372 | 1601 | 1486 |
| 1947 | 1444 | 1697 | 1570 |
| 1948 | 1430 | 1609 | 1520 |
The fluctuations in share prices since 1926 are clearly shown in the accompanying diagram, which is based on the foregoing index numbers.
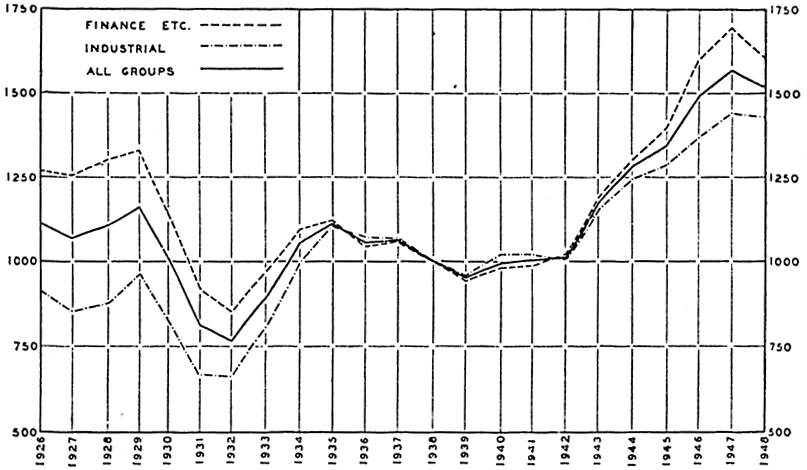
An indication of movements in the index numbers for individual groups may be gauged from the following tables, the first of which is confined to the industrial groups.
SHARE-PRICES: INDEX NUMBERS BY GROUPS
Base: Average for each group, 1938 (= 1000)
| Year. | Frozen Meat. | Woollens. | Gas. | Timber. | Minerals. | Miscellaneous (Industrial). | All Industrial Groups. |
|---|---|---|---|---|---|---|---|
NOTE.—Index numbers in the above tables are comparable vertically but not horizontally. | |||||||
| 1938 | 1000 | 1000 | 1000 | 1000 | 1000 | 1000 | 1000 |
| 1939 | 900 | 1019 | 852 | 1034 | 953 | 988 | 959 |
| 1940 | 1055 | 1225 | 897 | 1022 | 1018 | 1035 | 1024 |
| 1941 | 1012 | 1291 | 789 | 1051 | 1027 | 1057 | 1021 |
| 1942 | 1151 | 1418 | 782 | 1050 | 984 | 996 | 1005 |
| 1943 | 1438 | 1617 | 847 | 1217 | 1050 | 1159 | 1156 |
| 1944 | 1613 | 1753 | 900 | 1360 | 1087 | 1253 | 1249 |
| 1945 | 1693 | 1746 | 894 | 1432 | 1096 | 1297 | 1285 |
| 1946 | 1874 | 1941 | 909 | 1555 | 1086 | 1399 | 1372 |
| 1947 | 2067 | 2005 | 894 | 1650 | 1262 | 1432 | 1444 |
| 1948 | 2092 | 1955 | 875 | 1542 | 1321 | 1404 | 1430 |
| Year. | All Industrial Groups. | Banks. | Insurance. | Loan and Agency. | Miscellaneous (Other). | All Finance, &c., Groups. | All Groups combined. |
|---|---|---|---|---|---|---|---|
| 1938 | 1000 | 1000 | 1000 | 1000 | 1000 | 1000 | 1000 |
| 1939 | 959 | 923 | 973 | 856 | 1005 | 945 | 952 |
| 1940 | 1024 | 933 | 1071 | 856 | 1014 | 978 | 999 |
| 1941 | 1021 | 895 | 1175 | 840 | 992 | 984 | 1001 |
| 1942 | 1005 | 895 | 1232 | 895 | 1043 | 1014 | 1010 |
| 1943 | 1156 | 988 | 1492 | 1095 | 1279 | 1188 | 1174 |
| 1944 | 1249 | 1059 | 1619 | 1201 | 1492 | 1304 | 1279 |
| 1945 | 1285 | 1097 | 1749 | 1269 | 1590 | 1400 | 1346 |
| 1946 | 1372 | 1152 | 1861 | 1446 | 1830 | 1601 | 1486 |
| 1947 | 1444 | 1284 | 1876 | 1729 | 1940 | 1697 | 1570 |
| 1948 | 1430 | 1171 | 1770 | 1715 | 1893 | 1609 | 1520 |
Monthly index numbers of share prices throughout the years 1932, 1935, 1939, 1940, and 1944 to 1948 are given in the following table.
| Month. | 1932. | 1935. | 1939. | 1940. | 1944. | 1945. | 1946. | 1947. | 1948. |
|---|---|---|---|---|---|---|---|---|---|
* Interpolated. | |||||||||
| Industrial Groups | |||||||||
| January | 668 | 1086 | 956 | 1045 | 1215 | 1240 | 1310 | 1383 | 1496 |
| February | 632 | 1075 | 954 | 1046 | 1242 | 1247 | 1347 | 1430 | 1465 |
| March | 621 | 1071 | 938 | 1052 | 1255 | 1252 | 1338 | 1434 | 1424 |
| April | 618 | 1103 | 941 | 1098 | 1254 | 1267 | 1360 | 1440 | 1414 |
| May | 630 | 1097 | 968 | 1013 | 1266 | 1270 | 1382 | 1447 | 1429 |
| June | 646 | 1112 | 948 | 959 | 1263 | 1276 | 1393 | 1442 | 1439 |
| July | 669 | 1132 | 958 | 988 | 1277 | 1305 | 1417 | 1456 | 1437 |
| August | 701 | 1106 | 939 | 1002 | 1264 | 1321 | 1423 | 1419 | 1416 |
| September | 738 | 1090 | 927 | 1033 | 1246 | 1321 | 1378 | 1431 | 1415 |
| October | 718 | 1111 | 959 | 1019 | 1241 | 1315 | 1360 | 1461 | 1416 |
| November | 699 | 1123 | 1004 | 1014 | 1232 | 1300 | 1377 | 1491 | 1411 |
| December* | 662 | 1117 | 1022 | 1014 | 1236 | 1305 | 1381 | 1494 | 1403 |
| Finance, &c., Groups | |||||||||
| January | 865 | 1136 | 947 | 997 | 1270 | 1315 | 1520 | 1660 | 1653 |
| February | 824 | 1101 | 942 | 1003 | 1283 | 1325 | 1583 | 1704 | 1624 |
| March | 823 | 1107 | 933 | 1003 | 1296 | 1334 | 1560 | 1743 | 1578 |
| April | 815 | 1136 | 921 | 1036 | 1296 | 1355 | 1573 | 1817 | 1615 |
| May | 809 | 1125 | 946 | 958 | 1305 | 1376 | 1616 | 1759 | 1654 |
| June | 812 | 1126 | 934 | 917 | 1318 | 1401 | 1615 | 1734 | 1658 |
| July | 869 | 1139 | 950 | 961 | 1343 | 1425 | 1626 | 1731 | 1645 |
| August | 901 | 1155 | 941 | 964 | 1311 | 1432 | 1639 | 1631 | 1569 |
| September | 920 | 1117 | 927 | 983 | 1301 | 1414 | 1610 | 1621 | 1570 |
| October | 897 | 1099 | 949 | 972 | 1305 | 1404 | 1585 | 1646 | 1575 |
| November | 875 | 1097 | 974 | 972 | 1306 | 1502 | 1634 | 1660 | 1588 |
| December* | 818 | 1092 | 978 | 975 | 1310 | 1511 | 1647 | 1656 | 1584 |
| All Groups | |||||||||
| January | 777 | 1114 | 951 | 1019 | 1245 | 1281 | 1415 | 1521 | 1575 |
| February | 738 | 1094 | 947 | 1022 | 1265 | 1290 | 1465 | 1567 | 1545 |
| March | 732 | 1091 | 935 | 1025 | 1277 | 1297 | 1449 | 1589 | 1501 |
| April | 726 | 1121 | 930 | 1064 | 1277 | 1315 | 1466 | 1628 | 1515 |
| May | 728 | 1113 | 956 | 983 | 1288 | 1328 | 1499 | 1603 | 1541 |
| June | 738 | 1120 | 940 | 936 | 1293 | 1345 | 1504 | 1588 | 1548 |
| July | 779 | 1136 | 954 | 973 | 1314 | 1371 | 1521 | 1593 | 1541 |
| August | 811 | 1133 | 940 | 981 | 1290 | 1382 | 1531 | 1525 | 1492 |
| September | 838 | 1105 | 927 | 1006 | 1276 | 1372 | 1494 | 1526 | 1493 |
| October | 817 | 1105 | 953 | 993 | 1276 | 1364 | 1473 | 1553 | 1495 |
| November | 796 | 1109 | 987 | 991 | 1273 | 1401 | 1505 | 1575 | 1499 |
| December* | 748 | 1103 | 998 | 993 | 1277 | 1408 | 1514 | 1575 | 1494 |
Yields on Market Prices of Shares.—A series of index numbers of yields on market prices of New Zealand domiciled ordinary shares has been compiled covering the same companies and using the same group weights as for the share-prices series.
The yield figures forming the basis of the index numbers are in most cases based on those published in the Official Record of the Stock Exchanges of New Zealand and the monthly figures relate to the market price ruling at the end of the month and the rate of dividend last paid by the particular company.
Average annual index numbers of yields have been compiled back to the year 1931 on base: average for each group, 1938 (= 1000) and are as follows:—
| Year. | Industrial Groups. | Finance, &c., Groups. | All Groups. |
|---|---|---|---|
| 1931 | 1347 | 1434 | 1395 |
| 1932 | 1234 | 1278 | 1258 |
| 1933 | 881 | 890 | 886 |
| 1934 | 806 | 777 | 790 |
| 1935 | 749 | 813 | 784 |
| 1936 | 823 | 860 | 843 |
| 1937 | 886 | 884 | 885 |
| 1938 | 1000 | 1000 | 1000 |
| 1939 | 1042 | 1067 | 1055 |
| 1940 | 997 | 1032 | 1016 |
| 1941 | 991 | 1016 | 1005 |
| 1942 | 943 | 991 | 969 |
| 1943 | 735 | 819 | 781 |
| 1944 | 698 | 754 | 729 |
| 1945 | 676 | 714 | 697 |
| 1946 | 632 | 697 | 664 |
| 1947 | 657 | 698 | 677 |
| 1948 | 680 | 725 | 703 |
Monthly index numbers of yields are available as from the beginning of 1945 on base: average for each group, 1938 (= 1000) and are given hereunder for each month of the years 1945 and 1948:—
| Month. | 1945. | 1948. | ||||
|---|---|---|---|---|---|---|
| Industrial Groups. | Finance, &c., Groups. | All Groups. | Industrial Groups. | Finance, &c., Groups. | All Groups. | |
| January | 703 | 747 | 727 | 646 | 720 | 683 |
| February | 700 | 745 | 724 | 661 | 736 | 698 |
| March | 698 | 737 | 719 | 683 | 760 | 721 |
| April | 698 | 725 | 713 | 689 | 740 | 715 |
| May | 699 | 714 | 707 | 693 | 722 | 707 |
| June | 688 | 702 | 696 | 690 | 725 | 708 |
| July | 664 | 694 | 680 | 693 | 730 | 712 |
| August | 655 | 692 | 675 | 677 | 718 | 697 |
| September | 652 | 701 | 679 | 681 | 718 | 700 |
| October | 652 | 705 | 681 | 678 | 708 | 693 |
| November | 656 | 722 | 689 | 680 | 714 | 697 |
| December | 644 | 721 | 682 | 685 | 717 | 701 |
SUMMARY OF PRICE MOVEMENTS.—The following table gives a summary on base 1926–30 (= 1000) for the last eleven years available of the movements in the more important series of price index numbers.
| Year. | Retail. | Wholesale. | Export. | Import.* | Share Prices, All Groups. | ||||
|---|---|---|---|---|---|---|---|---|---|
| Food. | All Groups. | Locally-produced Items. | Imported Items. | All Groups. | All Pastoral and Dairy-produce. | All Groups. | |||
* Base: 1926–30 (= 100). | |||||||||
| 1938 | 991 | 951 | 987 | 1072 | 1036 | 872 | 893 | 88 | 916 |
| 1939 | 1052 | 990 | 1053 | 1084 | 1071 | 839 | 865 | 89 | 872 |
| 1940 | 1076 | 1035 | 1078 | 1281 | 1195 | 977 | 995 | 102 | 915 |
| 1941 | 1104 | 1073 | 1139 | 1439 | 1311 | 994 | 1014 | 114 | 917 |
| 1942 | 1127 | 1109 | 1193 | 1581 | 1416 | 1017 | 1036 | 124 | 925 |
| 1943 | 1134 | 1134 | 1205 | 1742 | 1513 | 1059 | 1078 | 138 | 1075 |
| 1944 | 1152 | 1155 | 1233 | 1800 | 1558 | 1113 | 1132 | 144 | 1171 |
| 1945 | 1151 | 1170 | 1257 | 1827 | 1584 | 1201 | 1218 | 147 | 1233 |
| 1946 | 1153 | 1180 | 1278 | 1821 | 1589 | 1317 | 1332 | 164 | 1361 |
| 1947 | 1224 | 1217 | 1368 | 1859 | 1649 | 1665 | 1669 | 196 | 1438 |
| 1948 | 1382 | 1314 | 1501 | 2089 | 1837 | 1844 | 1845 | 203 | 1392 |
The extent of the rise in prices in the various groups since the outbreak of the Second World War is shown in the following table, which has August, 1939, the last pre-war month, as the base for each column.
SUMMARY OF PRICE INDEX NUMBERS, AUGUST, 1939, TO AUGUST, 1948
Base: August, 1939 (= 1000)
| — | Retail. | Wholesale. | Export. | Share. | |||||
|---|---|---|---|---|---|---|---|---|---|
| Food. | All Groups. | Locally-produced Items. | Imported Items. | All Groups. | All Pastoral and Dairy-produce. | All Groups. | Industrial. | All Groups. | |
| 1939— | |||||||||
| August | 1000 | 1000 | 1000 | 1000 | 1000 | 1000 | 1000 | 1000 | 1000 |
| 1940— | |||||||||
| August | 1009 | 1049 | 1002 | 1220 | 1130 | 1152 | 1144 | 1067 | 1044 |
| 1941— | |||||||||
| August | 1031 | 1078 | 1065 | 1338 | 1225 | 1199 | 1190 | 1114 | 1086 |
| 1942— | |||||||||
| August | 1067 | 1124 | 1128 | 1490 | 1339 | 1208 | 1205 | 1081 | 1094 |
| 1943— | |||||||||
| February | 1055 | 1129 | 1119 | 1528 | 1358 | 1234 | 1227 | 1196 | 1205 |
| August | 1072 | 1144 | 1120 | 1608 | 1404 | 1271 | 1260 | 1243 | 1273 |
| 1944— | |||||||||
| February | 1073 | 1149 | 1165 | 1646 | 1446 | 1289 | 1273 | 1323 | 1346 |
| August | 1082 | 1163 | 1134 | 1653 | 1437 | 1279 | 1265 | 1346 | 1372 |
| 1945— | |||||||||
| February | 1069 | 1169 | 1169 | 1663 | 1458 | 1426 | 1400 | 1328 | 1372 |
| August | 1085 | 1176 | 1168 | 1682 | 1468 | 1443 | 1415 | 1407 | 1470 |
| 1946— | |||||||||
| February | 1073 | 1180 | 1180 | 1694 | 1481 | 1467 | 1448 | 1435 | 1559 |
| August | 1090 | 1191 | 1193 | 1701 | 1490 | 1606 | 1584 | 1515 | 1629 |
| 1947— | |||||||||
| February | 1087 | 1184 | 1243 | 1637 | 1471 | 1854 | 1805 | 1523 | 1667 |
| August | 1113 | 1212 | 1240 | 1683 | 1497 | 2058 | 1995 | 1511 | 1622 |
| 1948— | |||||||||
| February | 1277 | 1304 | 1386 | 1889 | 1678 | 2217 | 2156 | 1560 | 1644 |
| August | 1314 | 1328 | 1402 | 1974 | 1734 | 2214 | 2155 | 1508 | 1587 |
The prices of the majority of locally-produced commodities are capable of control to a very large extent, but the same measure of control cannot be exercised over the prices of imported commodities, which are affected by overseas factors, and which were subject to increased freight and insurance charges during the war period. A reflection of these factors is contained in a comparison of the index for locally-produced items included in the wholesale prices series with that for imported items.
THE material used in the compilation of statistics of wage-rates in New Zealand is, with certain exceptions, taken from the awards of the Arbitration Court. It is recognized that the rates specified in such awards are minimum rates, and that wages may in some cases be above the prescribed minima, so that a rise or fall in the award rates does not necessarily involve an immediate change in the wage-rates of those workers who are being paid more than these rates. Nevertheless, for the purpose of tracing the movement in wage-rates over any considerable space of time, the award rates form a more reliable basis than any information which could be collected directly from employers or trade-union secretaries as to the ruling or predominant rates in any industry. Prior to the passing of the Agricultural Workers Act, 1936, no fixed rates of wages for farm employees existed; and for this group figures of ruling wage-rates were reported by Inspectors of Factories attached to the Labour and Employment Department.
The Industrial Conciliation and Arbitration Amendment Act, 1932, contained, inter alia, a provision that, in the event of the parties to an industrial dispute being unable to come to agreement before the Conciliation Council, the award lapsed. In cases where district awards lapsed under this provision figures were interpolated, based on fluctuations in corresponding rates in other districts. The Industrial Conciliation and Arbitration Amendment Act, 1936, restored the full powers of the Court (see next section, Labour Laws and Allied Legislation).
The award rates for the four principal districts—Northern, Wellington, Canterbury, and Otago and Southland—are in general taken as being representative of the ruling wages throughout New Zealand. For such industries as are carried on in the towns these rates are quite satisfactory; in cases where the important centre of an industry is situated outside the geographical boundaries of the four principal districts the award rates for that centre are used. For instance, the rates used for coal-mining and sawmilling in the Canterbury District are those prescribed by the awards for the Westland Industrial District.
The system of compilation of wage-rates index numbers was revised in 1936, and the index numbers appearing in the following pages are on the same base period as in the case of the wholesale-prices index—viz., the average of the five years 1926–30 (= 1000). The industrial grouping also underwent some modification, consisting principally of the dispersal of the old groups “Other Manufactures” and “Miscellaneous” amongst existing groups, and the introduction of three new groups (“Provision of Power, Heat, and Light”; “Working in Stone, Clay, Glass, and Chemicals”; and “Working in Skins, Leather, &c.”); while the old group “Textiles and Weaving” was combined with “Clothing and Footwear.”
The index numbers of wage-rates shown throughout this section relate to nominal wage-rates only—that is, they are based on actual or equivalent money rates without making any allowance for changes during the period under review in the prices of those goods and services which are purchased out of wages earned. It is obvious that this factor is of considerable importance, for a rise in wage-rates may he offset by a fall in the purchasing-power of the monetary unit, while, on the other hand, a fall in money wages may be offset by a rise in the purchasing-power of money. For the purpose of estimating movements in effective wage-rates, these index numbers of nominal wage-rates should be examined in conjunction with the index numbers of retail prices shown in Section 37 and Appendix (e) of this volume. In any such comparison it should not be overlooked that the index numbers of nominal wage-rates apply only to full-time employment at award rates of pay. They do not take into account either overtime earnings or short-time deductions or wages-tax—particulars of wages-tax imposed are given on page 636—nor do the retail-prices index numbers take cognizance of all items of household expenditure; income-tax, charitable and other gifts, cost of domestic help, &c., and particularly expenditure on alcoholic liquors and private motoring, being omitted. Having regard to opportunities for spare-time gainful occupation, a comparison with movements in the index numbers of hours of labour shown later in this section is also relevant.
WAGE-RATES OF ADULT MALE WORKERS: Method of Weighting.—The weights used in the computation of the indices were derived mainly from three sources—viz., (1) the occupations statistics of the 1926 census, (2) the annual factory production statistics, and (3) the membership rolls of trade-unions registered under the Arbitration Act. Weights have been allocated to the individual occupations included in these computations, and, although in some few cases absolute accuracy in weighting could not be hoped for, the data were sufficiently accurate for the purpose in view, since minor differences in weighting do not affect the accuracy of the index number. Occupations are grouped into industries, with an appropriate weight for each occupation and each industry; while industries are grouped into fourteen principal industrial groups, these also being given appropriate weights. The weights for the individual occupations and industries have been derived from the census or the factory production statistics; while the industrial-group weighting has been taken partly from these sources and partly from the membership of trade-unions registered under the Arbitration Act. In the case of workers on the land, use was also made of information formerly obtained by means of the annual collections of agricultural and pastoral statistics. Full details of the weighting appeared in the Statistical Report on Prices, &c., for the year 1935.
Nominal Weekly Wage-rates Index Numbers.—Index numbers of annual averages of nominal weekly wage-rates of adult males over the period 1914–48 are given in the following table. The index numbers for the years 1915–25 have been interpolated on the basis of movements recorded in the earlier series of index numbers. The base in this case is the weighted average of weekly wage-rates for adult males in 1926–30 (= 1000).
NOMINAL WEEKLY WAGE-RATES INDEX NUMBERS (ADULT MALES), ALL INDUSTRIAL GROUPS
Base: 1926–30 (= 1000)
| Year. | Index Number. |
|---|---|
* Interpolated. | |
| 1914 | 623 |
| 1915 | 659* |
| 1916 | 679* |
| 1917 | 711* |
| 1918 | 742* |
| 1919 | 794* |
| 1920 | 887* |
| 1921 | 956* |
| 1922 | 939* |
| 1923 | 925* |
| 1924 | 938* |
| 1925 | 952* |
| 1926 | 966 |
| 1927 | 985 |
| 1928 | 1016 |
| 1929 | 1017 |
| 1930 | 1017 |
| 1931 | 942 |
| 1932 | 864 |
| 1933 | 833 |
| 1934 | 839 |
| 1935 | 858 |
| 1936 | 950 |
| 1937 | 1036 |
| 1938 | 1081 |
| 1939 | 1100 |
| 1940 | 1130 |
| 1941 | 1170 |
| 1942 | 1222 |
| 1943 | 1261 |
| 1944 | 1274 |
| 1945 | 1381 |
| 1946 | 1434 |
| 1947 | 1489 |
| 1948 | 1588 |
The wage-rates on which the foregoing index numbers are based are gross rates, no account having been taken of the fact that from August, 1931, wages have been subject to certain forms of taxation not previously in operation. The first of these taxes was the “emergency unemployment charge,” which was at the rate of 1d. for every 6s. 8d. of wages and of other income, with certain specified exemptions. This rate remained until the end of April, 1932, when it was increased to 1d. for every 1s. 8d. of wages, &c. Subsequent changes in the rate of this tax, which was later called “employment promotion taxation” were reductions to 1d. for every 2s. as from 1st October, 1934, and to 1d. for every 2s. 6d. from 1st October, 1935. The latter rate remained in force until the employment promotion taxation was superseded by the social security charge, which came into operation on 1st April, 1939. The rate of this charge was 1d. for every 1s. 8d. A further tax on wages, &c., the national security tax, for the purposes of war finance, was imposed as from 21st July, 1940, the rate being 1d. for every 1s. 8d., at which it remained until 10th May, 1942, when it was increased to 1 ½d. for every 1s. 8d. This rate continued in force until 12th May, 1946, when it was reduced to ½d. for every 1s. 8d., but at the same time, the social security charge was raised to 1 ½d. for every 1s. 8d. The national security tax was finally abolished as from 21st April, 1947. A summary of these taxes on wages since their introduction is as follows:—
| 1st August, 1931–30th April, 1932 | 1d. for every 6s. 8d. |
| 1st May, 1932–30th September, 1934 | 1d. for every 1s. 8d. |
| 1st October, 1934–30th September, 1935 | 1d. for every 2s. 0d. |
| 1st October, 1935–31st March, 1939 | 1d. for every 2s. 6d. |
| 1st April, 1939–20th July, 1940 | 1d. for every 1s. 8d. |
| 21st July, 1940–10th May, 1942 | 1d. for every 10d. |
| 11th May, 1942–12th May, 1946 | 1d. for every 8d. |
| 13th May, 1946–20th April, 1947 | 1d. for every 10d. |
| 21st April, 1947 | 1d. for every 1s. 1⅓d. |
The more important changes in rates of wages and other factors which are reflected in the fluctuations shown by the preceding table of index numbers are now given in chronological order:—
1919–21. War bonuses varying from 2 ½d. to 3¾d. per hour, authorized by the War Legislation and Statute Law Amendment Act, 1918, were incorporated in wage-rates.
1922–23. Cost-of-living adjustments under the Industrial Conciliation and Amendment Act, 1921–22, reduced wages in two steps:—
Per Month. Per Week. Per Day. Per Hour. (1) As from 1st May, 1922— £ s. d. s. d. d. d. Male adult workers 1 1 8 5 0 10 1¼ Female adult workers 0 10 10 2 6 5 ¾ Juvenile workers 0 6 6 1 6 3 1/2 (2) As from 4th December, 1922— Male adult workers 0 13 0 3 0 6 ¾ Female adult workers 0 6 6 1 6 3 ⅜ Juvenile workers 0 4 4 1 0 2 ¼ 1924–29. The recovery from the post-war slump period of 1922–23 is reflected in the steady upward movement in the wage-rate index numbers until a peak was reached in 1929.
1931–33. A 10-per-cent. reduction in wage-rates as from 1st June, 1931, became effective in terms of the Finance Act, 1931. In addition, the Industrial Conciliation and Arbitration Amendment Act, 1932, made provision for the review of existing awards. During 1932 and 1933 the rates of pay prescribed in several awards were reduced in new awards; and, again, wage-rates of two classes of labour not covered by awards (railway employees and permanent farm hands) suffered further reductions—in 1932 in the former case and in 1932 and 1933 in the latter case. Also in most instances the ruling rates of pay, in cases where previously existing awards had been cancelled, were below the former award rates.
1936. Complete restoration to the pre-depression level of award (and other) rates of wages and salaries as from 1st July, 1936, was effected by the Finance Act, 1936. A further measure of importance was the Agricultural Workers Act, passed in September, 1936, which is discussed in some detail in the next Section (Labour Laws and Allied Legislation).
1940. The Court of Arbitration awarded an increase of 5 per cent. in all rates of remuneration in awards, industrial agreements, and apprenticeship orders as from 12th August, 1940, as the result of an application under the Rates of Wages Emergency Regulations 1940.
1942–49. The Court of Arbitration awarded a further increase of 5 per cent. as from 7th April, 1942, but with the following limitations: (a) In the case of males twenty-one years of age and over, on earnings up to £5 per week only; (b) In the case of females twenty-one years of age and over, on earnings up to £2 10s. per week only; (c) In the case of males or females under twenty-one years of age, and apprentices, on earnings up to £1 10s. per week only.
In addition, certain classes of agricultural workers were granted wage increases as from 1st August in each of the years 1942, 1943, and 1944; and seamen, who were granted a war-risks bonus in May, 1941, had the rate of the bonus increased in July, 1942, and again in May, 1943.
As from the 15th December, 1942, rates of remuneration, already brought under control by the Rates of Wages Emergency Regulations 1940, were stabilized by the Economic Stabilization Emergency Regulations 1942. The provisions of these regulations are set out in detail in Section 39 (Subsection C), together with notes on the operations of the basic-wage and minimum-wage legislation, and of the general orders and standard rates pronouncements issued by the Court of Arbitration. The terms of the general orders of 1940 and 1942 are shown above, and the actual standard rates pronounced in 1945, 1947, and 1949 are given on page 670.
The index numbers of rates of wages shown in the foregoing table, being based almost exclusively on award rates, have not been influenced by either “basic wage” rates or the “minimum wage” rates (which have, in effect, superseded the basic rates), “minimum wage” rates themselves having no practical application where awards exist. The effects of the two general orders and of the standard rates pronouncements of 1945 and 1947 are, however, clearly visible in this table. Further movement in the index may be expected to appear in 1949 and 1950 following the 1949 pronouncement.
Stabilization of wage-rates, even apart from general increases granted in either of these ways by the Court of Arbitration, has not been absolute. The Court in making or amending any award is required to have regard to the restoration or preservation of a proper relationship with other rates of remuneration. These “other rates” have a wider bearing than other minimum award rates prescribed by the Court itself, and include “basic rates” as defined by the Economic Stabilization Emergency Regulations and actual rates approved by the Wages Commissioner or other special tribunals. (The Court itself has no jurisdiction over actual rates except as a Court of Appeal against decisions of the Wages Commissioner.) Thus while the index ignores the varying margin between actual rates and minimum award rates it has, during the period of stabilization, shown a certain progressive upward movement due to the Court's de facto recognition—in part at least—of actual rates in the process of framing or amending awards.
The next table shows the index numbers of nominal weekly wage-rates of adult males for each industrial group and for all groups combined. Where board and (or) lodging is a usual perquisite attached to any occupation, an allowance estimated to cover the value of such has been added to the money wage-rate. The base in this instance is the New Zealand weighted average wage-rate for all groups combined, 1926–30 (= 1000).
NOMINAL WEEKLY WAGE-RATES INDEX NUMBERS (ADULT MALES)
Base: All groups combined, 1926–30 (= 1000)
| Industrial Group. | 1914. | 1939. | 1940. | 1941. | 1942. | 1943. | 1944. | 1945. | 1946. | 1947. | 1948. |
|---|---|---|---|---|---|---|---|---|---|---|---|
NOTE.—The index numbers in this table are comparable both vertically and horizontally. | |||||||||||
| Provision of— | |||||||||||
| Food, drink, &c. | 665 | 1266 | 1299 | 1344 | 1390 | 1411 | 1413 | 1524 | 1533 | 1583 | 1678 |
| Clothing, footwear, and textiles | 607 | 1122 | 1165 | 1204 | 1256 | 1290 | 1299 | 1399 | 1464 | 1517 | 1601 |
| Building and construction | 654 | 1126 | 1160 | 1197 | 1241 | 1262 | 1272 | 1377 | 1413 | 1478 | 1553 |
| Power, heat, and light | 656 | 1194 | 1220 | 1263 | 1299 | 1313 | 1316 | 1427 | 1474 | 1535 | 1616 |
| Transport by water | 654 | 1217 | 1286 | 1434 | 1513 | 1637 | 1680 | 1739 | 1763 | 1780 | 1796 |
| Transport by land | 617 | 1116 | 1158 | 1202 | 1262 | 1298 | 1333 | 1423 | 1460 | 1470 | 1579 |
| Accommodation, meals, and personal service | 660 | 1077 | 1095 | 1119 | 1113 | 1154 | 1154 | 1245 | 1326 | 1405 | 1475 |
| Working in or on— | |||||||||||
| Wood, wicker, sea-grass, and fibre | 634 | 1179 | 1215 | 1251 | 1295 | 1310 | 1310 | 1418 | 1445 | 1535 | 1632 |
| Metal | 717 | 1241 | 1268 | 1303 | 1346 | 1362 | 1364 | 1469 | 1504 | 1560 | 1651 |
| Stone, clay, glass, and chemicals | 584 | 1139 | 1172 | 1209 | 1254 | 1268 | 1269 | 1370 | 1401 | 1438 | 1515 |
| Paper, printing, &c. | 757 | 1250 | 1276 | 1313 | 1355 | 1369 | 1370 | 1484 | 1523 | 1602 | 1671 |
| Skins, leather, &c. | 600 | 1116 | 1184 | 1247 | 1291 | 1305 | 1305 | 1393 | 1384 | 1441 | 1499 |
| Mines and quarries | 664 | 1117 | 1162 | 1196 | 1279 | 1317 | 1330 | 1413 | 1445 | 1546 | 1647 |
| The land (farming pursuits) | 519 | 859 | 866 | 874 | 927 | 992 | 1002 | 1139 | 1259 | 1322 | 1470 |
| All groups combined | 623 | 1100 | 1130 | 1170 | 1222 | 1261 | 1274 | 1381 | 1434 | 1489 | 1588 |
The distinction of having the highest index number, which was surrendered by the “paper, printing, &c.,” group to the “food, drink, &c.,” group in 1938, was in 1941 acquired by the “transport by water” group, and has been held by the same group in each subsequent year.
The lowest index for 1948 was that for the group “working on the land” (1470), followed by “accommodation, meals, and personal service” (1475). These two groups have consistently occupied the same positions relative to the other groups each year since 1926. The former gained perceptibly on the latter, however, in 1948. This was principally due to the adoption of a new formula (see page 672) for determining shearers' wages for the 1948–49 season, coupled with a sharp rise in wool prices for the 1947–48 season on which the formula is based. In both these groups, as also in the “transport by water” group, the estimated value of board and lodging is, where applicable, added to the money wage-rate in order to make a legitimate comparison with other industries. In the case of waterside workers (an important subgroup of the “water transport” group) this allowance is not, of course, applicable.
Movement in Individual Groups.—The index numbers in the preceding table being on a national all-groups base, comparisons between movements in individual groups cannot be readily made; an increase in a group in which the index numbers are consistently low being considerably smaller numerically than would be an increase of the same percentage in one where the index numbers are higher. The following table brings out the movements in the various groups more clearly. The respective bases are the New Zealand average weekly wage-rates for each industrial group 1926–30 (= 1000).
NOMINAL WEEKLY WAGE-RATES INDEX NUMBERS (ADULT MALES)
Base: Each group separately, 1926–30 (= 1000)
| Industrial Group. | 1926–30. | 1914. | 1939. | 1944. | 1945. | 1946. | 1947. | 1948 |
|---|---|---|---|---|---|---|---|---|
| Provision of— | ||||||||
| Food, drink, &c. | 1000 | 601 | 1144 | 1277 | 1377 | 1385 | 1431 | 1516 |
| Clothing, footwear, and textiles | 1000 | 596 | 1100 | 1274 | 1372 | 1435 | 1488 | 1570 |
| Building and construction | 1000 | 637 | 1097 | 1240 | 1342 | 1376 | 1440 | 1513 |
| Power, heat, and light | 1000 | 600 | 1090 | 1201 | 1303 | 1346 | 1402 | 1476 |
| Transport by water | 1000 | 592 | 1100 | 1518 | 1572 | 1594 | 1609 | 1624 |
| Transport by land | 1000 | 588 | 1063 | 1269 | 1355 | 1390 | 1400 | 1504 |
| Accommodation, meals, and personal service | 1000 | 680 | 1109 | 1187 | 1281 | 1365 | 1446 | 1518 |
| Working in or on— | ||||||||
| Wood, wicker, seagrass, and fibre | 1000 | 588 | 1094 | 1216 | 1316 | 1341 | 1425 | 1515 |
| Metal | 1000 | 647 | 1120 | 1230 | 1326 | 1357 | 1407 | 1490 |
| Stone, clay, glass, and chemicals | 1000 | 576 | 1112 | 1239 | 1339 | 1368 | 1405 | 1480 |
| Paper, printing, &c. | 1000 | 637 | 1050 | 1151 | 1247 | 1279 | 1346 | 1404 |
| Skins, leather, &c. | 1000 | 574 | 1068 | 1249 | 1333 | 1324 | 1379 | 1434 |
| Mines and quarries | 1000 | 637 | 1071 | 1276 | 1355 | 1386 | 1483 | 1580 |
| The land (farming pursuits) | 1000 | 675 | 1116 | 1303 | 1480 | 1637 | 1719 | 1912 |
| All groups combined | 1000 | 623 | 1100 | 1274 | 1381 | 1434 | 1489 | 1588 |
Care must be exercised in drawing inferences from this table, for, while horizontal comparisons are quite valid, the vertical comparison between the various groups is valid only in so far as it shows in which groups the greater or the smaller movements have occurred. For example, the 1948 index for the “ paper, printing, &c.,” group is 176 points below that for “ mines and quarries,” the reason being that wages of workers in the former group have increased to a lesser degree than have those in the latter, although the actual rates of wages are considerably higher, as may be seen by reference to the previous table on the all-groups base.
Indices of Hourly Wage-rates.—Legislative reductions in weekly hours of labour during recent years rendered it desirable that indices of hourly wage-rates should be made available. The indices given hereunder show clearly the effect of the shorter working-hours prescribed mainly by the 1936 legislation, the Shops and Offices Amendment Acts of 1945 and 1946, and the Factories Amendment Act, 1945. It will be noticed that these indices (as is also the case in respect of the indices of weekly hours of labour) cover thirteen only out of the fourteen industrial groups commonly adopted, since working-hours on farms (which would be essential to the fourteenth group) cannot for this purpose be satisfactorily treated statistically. The base is the New Zealand average hourly wage-rate (computed as described after the following tables) for all groups combined, 1926–30 (=1000).
HOURLY WAGE-RATES INDEX NUMBERS (ADULT MALES)
Base: All groups combined, 1926–30 (=1000)
| Industrial Group. | 1914. | 1939. | 1944. | 1945. | 1946. | 1947. | 1948. |
|---|---|---|---|---|---|---|---|
| Provision of— | |||||||
| Food, drink, &c. | 548 | 1253 | 1403 | 1550 | 1654 | 1709 | 1810 |
| Clothing, footwear, and textiles | 568 | 1181 | 1367 | 1479 | 1580 | 1638 | 1728 |
| Building and construction | 619 | 1216 | 1373 | 1486 | 1525 | 1595 | 1676 |
| Power, heat, and light | 579 | 1283 | 1413 | 1533 | 1583 | 1657 | 1745 |
| Transport by water | 560 | 1248 | 1723 | 1784 | 1814 | 1891 | 1908 |
| Transport by land | 552 | 1153 | 1377 | 1470 | 1514 | 1587 | 1704 |
| Accommodation, meals, and personal service | 466 | 1130 | 1210 | 1307 | 1417 | 1517 | 1592 |
| Working in or on— | |||||||
| Wood, wicker, seagrass, and fibre | 597 | 1273 | 1414 | 1530 | 1559 | 1657 | 1762 |
| Metal | 665 | 1340 | 1472 | 1586 | 1623 | 1683 | 1782 |
| Stone, clay, glass, and chemicals | 532 | 1221 | 1361 | 1472 | 1511 | 1552 | 1635 |
| Paper, printing, &c. | 747 | 1349 | 1479 | 1602 | 1644 | 1729 | 1803 |
| Skins, leather, &c. | 540 | 1158 | 1324 | 1442 | 1493 | 1555 | 1617 |
| Mines and quarries | 633 | 1205 | 1435 | 1525 | 1559 | 1668 | 1850 |
| All groups combined | 589 | 1235 | 1429 | 1536 | 1586 | 1659 | 1752 |
The same table is now given with a different base—viz., the New Zealand average hourly wage-rate for each group individually, 1926–30 (= 1000).
HOURLY WAGE-RATES INDEX NUMBERS (ADULT MALES)
Base: Each group separately, 1926–30 (= 1000)
| Industrial Group. | 1926–30. | 1914. | 1939. | 1944. | 1945. | 1946. | 1947. | 1948. |
|---|---|---|---|---|---|---|---|---|
| Provision of— | ||||||||
| Food, drink, &c. | 1000 | 533 | 1219 | 1364 | 1508 | 1609 | 1662 | 1761 |
| Clothing, footwear, and textiles | 1000 | 583 | 1211 | 1403 | 1517 | 1621 | 1680 | 1773 |
| Building and construction | 1000 | 631 | 1239 | 1399 | 1515 | 1554 | 1625 | 1708 |
| Power, heat, and light | 1000 | 585 | 1277 | 1406 | 1526 | 1576 | 1649 | 1736 |
| Transport by water | 1000 | 584 | 1301 | 1795 | 1859 | 1890 | 1970 | 1988 |
| Transport by land | 1000 | 579 | 1208 | 1442 | 1540 | 1586 | 1662 | 1785 |
| Accommodation, meals, and personal service | 1000 | 534 | 1293 | 1385 | 1496 | 1622 | 1736 | 1822 |
| Working in or on— | ||||||||
| Wood, wicker, seagrass, and fibre | 1000 | 585 | 1253 | 1392 | 1506 | 1536 | 1632 | 1735 |
| Metal | 1000 | 611 | 1232 | 1354 | 1458 | 1493 | 1548 | 1639 |
| Stone, clay, glass, and chemicals | 1000 | 571 | 1298 | 1447 | 1565 | 1607 | 1650 | 1738 |
| Paper, printing, &c. | 1000 | 623 | 1126 | 1234 | 1337 | 1372 | 1443 | 1505 |
| Skins, leather, &c. | 1000 | 573 | 1229 | 1405 | 1530 | 1585 | 1651 | 1716 |
| Mines and quarries | 1000 | 627 | 1194 | 1422 | 1511 | 1545 | 1653 | 1833 |
| All groups combined | 1000 | 589 | 1235 | 1429 | 1536 | 1586 | 1659 | 1752 |
The figures shown in the last two tables differ from those published in earlier issues of this volume. It is considered logical that the movement in hourly rates combined with that in weekly hours worked at these rates should give the movement in weekly rates; but by this criterion the published series have hitherto been anomalous. Accordingly the former method of calculating index numbers of hourly rates has been discarded, the figures now adopted being derived from average hourly rates calculated in every case by dividing the corresponding average weekly rate by the average number of hours worked in the week.
WAGE-RATES OF ADULT FEMALE WORKERS.—Index numbers showing movements in wage-rates of women workers are compiled, using the award rates of the Arbitration Court as representative of the ruling rates of wages. A much smaller list of occupations is used than is the case in computing index numbers of wage movements for male workers. Although only fifteen occupations are taken into consideration in the case of women workers, these occupations normally cover a largo proportion of the total women in industry—more than sufficient to constitute a representative sample for measuring movements in wages. With the extension of the employment of women under war conditions, however, the sample for those years was not so representative as previously. The weights used have been computed from data as to occupations from the 1926 census results.
The following table shows index numbers of women's wage-rates on base: New Zealand all-groups weighted average, 1926–30 (= 1000), divided into the principal industries in which women workers are normally engaged. It should be noted that domestic servants employed in private homes, numerically an important branch of women workers at one time, are not represented in the compilation of these indices; also, that in the case of hotel workers (where board and lodging is a usual perquisite) and of restaurant employees (where meals are usually provided) the value of such additions has been added to the money-wage rates.
NOMINAL WEEKLY WAGE-RATES INDEX NUMBERS (ADULT FEMALES)
Base: All groups combined, 1926–30 (= 1000)
| Industrial Group. | 1914. | 1939. | 1944. | 1945. | 1946. | 1947. | 1948. |
|---|---|---|---|---|---|---|---|
| Provision of— | |||||||
| Food, drink, &c. | 390 | 950 | 1142 | 1291 | 1331 | 1465 | 1628 |
| Clothing, footwear, and textiles | 534 | 1029 | 1265 | 1426 | 1509 | 1577 | 1735 |
| Accommodation, meals, and personal service | 836 | 1334 | 1426 | 1601 | 1672 | 1775 | 1913 |
| Working in paper, printing, &c. | 487 | 1110 | 1221 | 1331 | 1365 | 1446 | 1565 |
| All groups combined | 602 | 1103 | 1297 | 1459 | 1533 | 1614 | 1764 |
Movements in Individual Groups.—Movements within the various groups are brought out more clearly in the next table, the base in this case being the New Zealand weighted average weekly rate of each group, 1926–30 (= 1000). As with the similar table relating to male wage-rates (p. 639) horizontal comparisons are valid, but vertical comparisons merely show in which groups the greater or smaller movements have occurred.
NOMINAL WEEKLY WAGE-RATES INDEX NUMBERS (ADULT FEMALES)
Base: Each group separately, 1926–30 (= 1000)
| Industrial Group. | 1926–30. | 1914. | 1939. | 1944. | 1945. | 1946. | 1947. | 1948. |
|---|---|---|---|---|---|---|---|---|
| Provision of— | ||||||||
| Food, drink, &c. | 1000 | 459 | 1124 | 1352 | 1528 | 1576 | 1734 | 1927 |
| Clothing, footwear, and textiles | 1000 | 578 | 1120 | 1376 | 1552 | 1641 | 1715 | 1888 |
| Accommodation, meals, and personal service | 1000 | 670 | 1074 | 1148 | 1289 | 1346 | 1429 | 1540 |
| Working in paper, printing, &c. | 1000 | 559 | 1055 | 1161 | 1266 | 1298 | 1375 | 1488 |
| All groups combined | 1000 | 602 | 1103 | 1297 | 1459 | 1533 | 1614 | 1764 |
WEEKLY WAGE-RATES: ALL ADULT WORKERS.—A series of index numbers has been computed (on the base 1926–30 = 1000) for all adult workers; this varies but little from the index for adult males, owing to the preponderance of men in industry. Index numbers for the last twelve years available are:—
NOMINAL WEEKLY WAGE-RATES INDEX NUMBERS (ADULT MALES AND FEMALES COMBINED), ALL INDUSTRIAL GROUPS
Base: 1926–30 (= 1000)
| Year. | Index. |
|---|---|
| 1937 | 1034 |
| 1938 | 1080 |
| 1939 | 1100 |
| 1940 | 1132 |
| 1941 | 1172 |
| 1942 | 1223 |
| 1943 | 1262 |
| 1944 | 1274 |
| 1945 | 1385 |
| 1946 | 1440 |
| 1947 | 1497 |
| 1948 | 1597 |
WAGE-RATES OF JUVENILE WORKERS.—During 1936, the compilation of index numbers of wage-rates of juveniles was undertaken for the first time, and the results appeared in the introductory notes to the 1935 and 1936 issues of the annual Statistical Report on Prices, &c.
Owing to the fact that a number of industries utilize juvenile labour to a limited extent only, or not at all, it has not been possible to cover a very wide field, but thirty-two occupations representing twelve out of the fourteen industrial groups are included in the case of juvenile males, and four occupations representing three industrial groups in the case of juvenile females.
Wherever possible the weekly wage-rate adopted in the compilation of the indices is that provided for a worker having attained the age of eighteen years or having completed three years' service, according to the terms of the award.
In the table which follows the base is, in each case, the New Zealand all-groups weighted average of weekly wage-rates, 1926–30 (= 1000).
NOMINAL WEEKLY WAGE-RATES INDEX NUMBERS (JUVENILE WORKERS)
Base: All groups combined, each sex separately, 1926–30 (= 1000)
| Industrial Group. | 1914. | 1939. | 1944. | 1945. | 1946. | 1947. | 1948. |
|---|---|---|---|---|---|---|---|
* No provision made In awards for juvenile females. | |||||||
| Juvenile Males | |||||||
| Provision of— | |||||||
| Food and drink | 665 | 1260 | 1521 | 1661 | 1712 | 1811 | 1935 |
| Clothing, footwear, and textiles | 544 | 1032 | 1239 | 1444 | 1732 | 1801 | 1937 |
| Building and construction | 592 | 1073 | 1205 | 1582 | 1866 | 1949 | 2079 |
| Transport by land | 609 | 1156 | 1371 | 1479 | 1509 | 1475 | 1533 |
| Accommodation, meals, and personal service | 562 | 1136 | 1229 | 1477 | 1740 | 1817 | 1923 |
| Working in or on— | |||||||
| Wood, wicker, seagrass, &c. | 554 | 1156 | 1229 | 1558 | 1755 | 1830 | 1961 |
| Metal | 487 | 1209 | 1314 | 1659 | 1813 | 1935 | 2055 |
| Stone, clay, glass, and chemicals | 511 | 1294 | 1398 | 1529 | 1570 | 1635 | 1704 |
| Paper, printing, &c. | 609 | 974 | 1059 | 1639 | 1834 | 1972 | 2174 |
| Skins, leather, &c. | 746 | 1209 | 1379 | 1542 | 1540 | 1625 | 1682 |
| Mines and quarries | 1142 | 2028 | 2523 | 2645 | 2706 | 2809 | 3154 |
| The land (farming pursuits) | 680 | 1217 | 1469 | 1680 | 1838 | 2034 | 2235 |
| All industrial groups | 619 | 1191 | 1379 | 1653 | 1819 | 1949 | 2108 |
| Juvenile Females | |||||||
| Provision of— | |||||||
| Food and drink | 512 | 1287 | 1398 | 1581 | 1641 | 1829 | 2010 |
| Clothing, footwear, and textiles | 640 | 1318 | 1530 | 1708 | 1866 | 2000 | 2204 |
| Working in paper, printing, &c. | * | 1380 | 1496 | 1755 | 1837 | 1966 | 2207 |
| All industrial groups | 616 | 1320 | 1504 | 1693 | 1824 | 1966 | 2171 |
It will be seen that the fluctuations in the all-groups indices for juvenile males differ appreciably from the corresponding figures for adult males, this being largely due to the influence of movements in farm wages, which have a weight of approximately 36 per cent. of the total in the case of juveniles, as against 23 per cent. in the ease of adults. The substantial increases in the all-groups indices for juvenile males in 1945 and subsequent years are largely the result of a Commission of Inquiry into Apprenticeship in 1945, the findings of which were later validated by the Apprenticeship Amendment Act, 1946, and also incorporated in the Apprentices Act, 1948. The scale of wages in apprenticeship orders is now based on a percentage of the ruling minimum rates for journey-men in the industry concerned. Consequently, the wage-rate index numbers for juvenile males will now tend to move in sympathy with the index numbers of male adult wage-rates.
AVERAGE RATES OF WAGES.—Schedules showing the unweighted averages of award rates of wages for all occupations as prescribed in awards of the Arbitration Court are contained in the 1940 and previous issues of the Year-Book, but considerations of space preclude their inclusion in later issues. For the latest data in this connection, readers are referred to the Report on Prices, Wages, and Labour Statistics, 1947.
HOURS OF LABOUR.—The following table shows index numbers of the number of hours constituting a full week's work in the various industrial groups for 1914, 1937, 1939, and for each year from 1945 to 1948. The material from which the index numbers have been compiled has been taken from the awards of the Arbitration Court in most cases; but where hours were not prescribed in the awards, reference was made to the Factories Act and the Shops and Offices Act. It has been necessary to omit the agricultural and pastoral workers group from these computations, since, with certain exceptions (and those only in recent years), hours of farm labour are not fixed. For each sex, the base is the New Zealand weighted average for all industrial groups combined, 1926–30 (= 1000).
INDEX NUMBERS OF AVERAGE HOURS OF LABOUR
Base: All groups combined, each sex separately, 1926–30 (= 1000)
| Industrial Group. | 1914. | 1937. | 1939. | 1945. | 1946. | 1947. | 1948. |
|---|---|---|---|---|---|---|---|
NOTE.—The index numbers in each section of the above table are comparable both vertically and horizontally. | |||||||
| Adult Males | |||||||
| Provision of— | |||||||
| Food and drink | 1135 | 947 | 944 | 919 | 866 | 866 | 866 |
| Clothing, footwear, and textiles | 1000 | 888 | 888 | 884 | 866 | 866 | 866 |
| Building and construction | 988 | 866 | 866 | 866 | 866 | 866 | 866 |
| Power, heat, and light | 1061 | 902 | 870 | 870 | 870 | 866 | 866 |
| Transport by water | 1093 | 911 | 911 | 911 | 909 | 880 | 880 |
| Transport by land | 1044 | 905 | 905 | 905 | 901 | 866 | 866 |
| Accommodation, meals, and personal service | 1325 | 891 | 891 | 890 | 875 | 866 | 866 |
| Working in or on— | |||||||
| Wood, wicker, seagrass, &c. | 993 | 866 | 866 | 866 | 866 | 866 | 866 |
| Metal | 1008 | 866 | 866 | 866 | 866 | 866 | 866 |
| Stone, clay, glass, and chemicals | 1026 | 872 | 872 | 870 | 866 | 866 | 866 |
| Paper, printing, &c. | 948 | 896 | 866 | 866 | 866 | 866 | 866 |
| Skins, leather, &c. | 1039 | 901 | 901 | 903 | 866 | 866 | 866 |
| Mines and quarries | 981 | 866 | 866 | 866 | 866 | 866 | 832 |
| All groups combined | 1041 | 890 | 888 | 885 | 877 | 867 | 866 |
| Provision of— | |||||||
| Adult Females | |||||||
| Food and drink | 976 | 867 | 867 | 867 | 867 | 867 | 867 |
| Clothing, footwear, and textiles | 1006 | 901 | 901 | 899 | 867 | 867 | 867 |
| Accommodation, meals, and personal service | 1217 | 891 | 891 | 891 | 877 | 867 | 867 |
| Working in paper, printing, &c. | 976 | 903 | 867 | 867 | 867 | 867 | 867 |
| All groups combined | 1054 | 898 | 896 | 894 | 870 | 867 | 867 |
The index numbers in the foregoing table being on a national all-groups base, comparisons between movements in individual groups cannot be readily made. The following table brings out the movements in the various groups more clearly, the respective bases being the New Zealand average for each industrial group, 1926–30 (= 1000).
INDEX NUMBERS OF AVERAGE HOURS OF LABOUR
Base: Each group separately, each sex separately, 1926–30 (= 1000)
| Industrial Group. | 1926–30. | 1914. | 1937. | 1939. | 1945. | 1946. | 1947. | 1948. |
|---|---|---|---|---|---|---|---|---|
NOTE.—Vertical comparisons are indicative merely of the relative changes in the length of the working-week in the different industries, not of the actual respective number of hours for the different industrial groups. | ||||||||
| Provision of— | ||||||||
| Adult Males | ||||||||
| Food and drink | 1000 | 1128 | 942 | 938 | 914 | 861 | 861 | 861 |
| Clothing, footwear, and textiles | 1000 | 1023 | 908 | 908 | 904 | 886 | 886 | 886 |
| Building and construction | 1000 | 1011 | 886 | 886 | 886 | 886 | 886 | 886 |
| Power, heat, and light | 1000 | 1041 | 885 | 854 | 854 | 854 | 850 | 850 |
| Transport by water | 1000 | 1014 | 845 | 845 | 845 | 843 | 817 | 817 |
| Transport by land | 1000 | 1016 | 880 | 880 | 880 | 877 | 842 | 842 |
| Accommodation, meals, and personal service | 1000 | 1275 | 857 | 857 | 856 | 842 | 833 | 833 |
| Working in or on— | ||||||||
| Wood, wicker, seagrass, &c. | 1000 | 1002 | 874 | 874 | 874 | 874 | 874 | 874 |
| Metal | 1000 | 1058 | 909 | 909 | 909 | 909 | 909 | 909 |
| Stone, clay, glass, and chemicals | 1000 | 1009 | 857 | 857 | 855 | 851 | 851 | 851 |
| Paper, printing, &c. | 1000 | 1021 | 965 | 933 | 933 | 933 | 933 | 933 |
| Skins, leather, &c. | 1000 | 1003 | 869 | 869 | 871 | 835 | 835 | 835 |
| Mines and quarries | 1000 | 1016 | 897 | 897 | 897 | 897 | 897 | 862 |
| All groups combined | 1000 | 1041 | 890 | 888 | 885 | 877 | 867 | 866 |
| Provision of— | ||||||||
| Adult Females | ||||||||
| Food and drink | 1000 | 1000 | 889 | 889 | 889 | 889 | 889 | 889 |
| Clothing, footwear, and textiles | 1000 | 1016 | 911 | 911 | 908 | 877 | 877 | 877 |
| Accommodation, meals, and personal service | 1000 | 1169 | 856 | 856 | 856 | 843 | 833 | 833 |
| Working in paper, printing, &c. | 1000 | 1013 | 938 | 900 | 900 | 900 | 900 | 900 |
| All groups combined | 1000 | 1054 | 898 | 896 | 894 | 870 | 867 | 867 |
The Industrial Conciliation and Arbitration Amendment Act, 1936, contained, inter alia, provisions aimed at the establishment of a forty-hour week, without reduction in the weekly wage-rate. New awards contain a provision to this effect, except that the Court may fix longer hours, but is required to state its reasons for so doing. Awards in existence at the time the amendment was passed might be reviewed on application of the unions concerned with a view to the fixing of a forty-hour week. The Factories Amendment Act, 1936, required the fixing of a forty-hour week in factories, but made provision for the Arbitration Court to grant exemptions on application, but the exemption provisions were repealed by the Factories Amendment Act, 1945. The Shops and Offices Amendment Act, 1936, reduced the working-hours in shops from forty-eight to forty-four per week, and a further reduction to forty hours was made by later amendments passed in 1945 and 1946. With one or two exceptions, there was little or no change in the indices between 1938 and 1944, but with the operation of the Factories Amendment Act, 1945, and the Shops and Offices Amendment Acts of 1945 and 1946, a slight decrease was recorded in 1945, followed by a more substantial one in 1946. The effect of the Shipping and Seamen Amendment Act, 1946, which reduced seamen's hours to forty per week, is apparent in the 1947 figures. Employees in wood and coal yards, motor and horse drivers, and restaurant workers also obtained a forty-hear week in the same year. The only variation in hours of labour during 1948 was the introduction, as from the 5th April, of a thirty-five hour week for underground workers in coal-mines.
SUMMARY OF INDEX NUMBERS.—The following table gives a summary for the years 1936–48 of the movements in index numbers covering both wage-rates and hours of labour.
WEEKLY WAGE-RATES, HOURLY WAGE-RATES, AND HOURS OF LABOUR: ALL INDUSTRIAL GROUPS COMBINED
Base: 1926–30 (=1000)
| Year. | Nominal Weekly Wage-rates. | Hourly* Wage-rates: Males, Adult. | Hours of Labour. | |||||
|---|---|---|---|---|---|---|---|---|
| Adults. | Juveniles. | Males. * | Females. | |||||
| Males. | Females. | Combined. | Males. | Females. | ||||
* Excluding the agricultural and pastoral group. | ||||||||
| 1936 | 950 | 961 | 951 | 986 | 1078 | 996 | 963 | 962 |
| 1937 | 1036 | 1015 | 1034 | 1124 | 1248 | 1154 | 890 | 898 |
| 1938 | 1081 | 1055 | 1080 | 1164 | 1289 | 1212 | 888 | 896 |
| 1939 | 1100 | 1103 | 1100 | 1191 | 1320 | 1235 | 888 | 896 |
| 1940 | 1130 | 1137 | 1132 | 1217 | 1372 | 1275 | 888 | 896 |
| 1941 | 1170 | 1174 | 1172 | 1243 | 1429 | 1326 | 888 | 896 |
| 1942 | 1222 | 1234 | 1223 | 1302 | 1468 | 1381 | 888 | 896 |
| 1943 | 1261 | 1292 | 1262 | 1355 | 1504 | 1414 | 888 | 896 |
| 1944 | 1274 | 1297 | 1274 | 1379 | 1504 | 1429 | 888 | 896 |
| 1945 | 1381 | 1459 | 1385 | 1653 | 1693 | 1536 | 885 | 894 |
| 1946 | 1434 | 1533 | 1440 | 1819 | 1824 | 1586 | 877 | 870 |
| 1947 | 1489 | 1614 | 1497 | 1949 | 1966 | 1659 | 867 | 867 |
| 1948 | 1588 | 1764 | 1597 | 2108 | 2171 | 1752 | 866 | 867 |
Table of Contents
HISTORICAL INTRODUCTION.—In 1858 the New Zealand Parliament enacted that the laws of England as existing on 14th January, 1840, should, as far as applicable, be deemed to apply in New Zealand also. But in what was an essentially agricultural and pioneer country, conditions demanding labour legislation were not present, so that there was but little early progress in labour legislation. Initially, labour administration was interpreted in the light of English statutes, but such interpretations were largely ineffective, owing to the vast difference between English and New Zealand conditions.
One industry, however, was as important to New Zealand as to the British Isles—the shipping industry. In 1854 Britain passed a consolidating Merchant Shipping Act, which contained numerous safety clauses and included a series of regulations aimed at the well-being of the crew, such as a wage-paying code and provisions as to seamen's accommodation, diet, and medical comfort. In 1858 the New Zealand Parliament extended these regulations of the working-conditions of seamen to all British ships under the jurisdiction of New Zealand. A series of Merchant Shipping Acts Adoption Acts was passed in 1869, 1873, and 1874, taking over certain provisions of the British Merchant Shipping Acts of 1862, 1872, and 1873, while other Acts followed in 1877, 1885, and 1890.
Apart from the regulation of working-conditions on board ship, early New Zealand social legislation concerned itself mainly with such general social problems as the care of orphans and the encouragement of thrift by means of suitable institutions. The Master and Apprentices Act of 1865 and the apprentice protection sections of the Offences against the Person Act of 1867 regulated the apprenticeship of young persons to farmers and tradesmen, stipulating that they were to be provided with food, clothing, bedding, and a moral education. These provisions were apparently intended to safeguard the training and interests of destitute children. In 1856 a law was passed to facilitate the formation of friendly societies in New Zealand, and the establishment of savings-banks was to be stimulated by an Act of 1858. The Act providing for the establishment of the Post Office Savings-bank was passed seven years later. A Distress and Replevin Act (1868) regulated the conditions under which goods and chattels might be seized as a distress for arrears of rent.
Trade-unions legislation commenced with the Trade-unions Act passed in 1878, affording unions protection from prosecution for conspiracy by reason merely that their purposes were in restraint of trade. The Inspection of Machinery Act, 1882, provided for the inspection of machinery in factories, &c., and required that persons in charge of boilers be properly qualified. An Employers' Liability Act was passed in 1882, legislating in the matter of industrial accidents with the object of mitigating the consequences to the worker without recourse to expensive litigation at common law.
Legislation specifically governing the conditions of employment of women and girls—particularly in respect of hours of labour—was introduced in 1873, there being several amendments to the Act in later years, while the legislation was amended and consolidated in 1881. Regulation of the hours of labour of children was also provided for. With the existence of slump conditions in the “eighties” allegations of “sweating” arose; and, since such complaints became increasingly numerous, a Commission was set up in 1889 to inquire into this evil. The Commission found that the Employment of Females Act was ineffective owing to the lack of the necessary powers of enforcement. The Commission declared that actual sweating conditions were not present, though a minority report differed from this view, but pointed out that with increasing industrialization such conditions would rapidly become prevalent if no attempt were made to check them. The Commission made recommendations for future labour legislation, and, as the result of its findings, the Factories Act of 1891 was passed.
Depression, discontent, and a growing labour force—despite depression, the number of hands employed in factories increased by approximately 16½ per cent. between 1885 and 1890—formed an economic background favourable to social legislation. Meanwhile the maritime strike of 1890, which caused even further distress throughout the country, proved to the trade-unions that they were not sufficiently strong to obtain their demands by direct action, and diverted their activities to the political field. The strike also aroused public opinion to the necessity for preventing such industrial strife. Political opportunity was still further opened by Sir George Grey, who in 1889 obtained Parliamentary approval for the abolition of the last remnant of plural voting at the elections to the House of Representatives. The extension of the franchise to women followed four years later.
In January, 1891, a Liberal Government came into power under the leadership of Ballance, with Reeves (Labour) and Seddon (Public Works) in the portfolios directly concerned with labour matters. The economic and political background demanded social change, and the change came to such a degree that New Zealand—still in the pioneer stage of economic development—acquired world fame as the land of advanced social legislation. The labour code enacted in the “nineties” was not so much socialistic as a correction of the more manifest injustices of an individualist system. There was not so much State control as an improved framework within which laissez faire could operate. This policy was most clearly seen in the realms of housing and farming, in which the Government aimed at making it easier for the worker to build or to settle on land, by the provision of finance through the State Advances Department (established in 1894). The Family Homes Protection Act, 1895, provided protection for homes from the legal processes resulting from bankruptcy proceedings, &c. The only encroachment on laissez faire principles was the fostering of co-operation on public works from 1891 onwards.
Working-conditions were improved by legislative regulation in four types of industry (factory work, shipping, shops and offices, and coal-mining), wages being also safeguarded though not directly increased.
The great achievement of this administration, however, was the evolution of machinery—the Conciliation Councils, the Arbitration Court, and the Labour Department—which not only administered the labour code efficiently, but could also modify it rapidly to suit the changing economic background. This dynamic machinery was far more effective than the all too soon antiquated improvements by the more normal procedure of static legislative enactment. An adjustable labour code was of special advantage to a primary-produce exporting country which is, of all countries, most open to the fluctuations of economic progress, and it is another example of the British empiricism that delights in suiting action to the conditions of the moment.
This code, and the resulting constant political intervention in labour conditions, profoundly modified labour organization. Since resort to judicial rather than to militant action became the accepted means of settling industrial disputes, much of the bitterness usually associated with the struggle for improved wages and working-conditions was lost. Moreover, the close association with the Courts led to the growth of a strong political bias in the aims of unionism. This was but natural, for, since the legislative code ensured to the workers many benefits for which they would otherwise have had to fight keenly, it was felt that the further amelioration of living-conditions would best be attained by legislation rather than by direct action.
Subsequent progress has been determined largely by this code, although the swing visible in the development of English labour legislation from Salisbury's Factory Acts to Lloyd George's pension schemes—from concrete intervention in working-conditions to attempts at ensuring a more equitable distribution of the national income—is also evident in New Zealand. For example, the rate of age-benefit (formerly old-age pension) has been increased considerably—from £18 per annum (1898) to £45 10s. (1925), to £52 (July, 1936), to £58 10s. (December, 1936), to £78 (April, 1939), to £81 18s. (May, 1942), to £84 10s. (July, 1943), to £104 (October, 1945), to £117 (October, 1947), and to £130 (June, 1949). Again, although interrupted to some extent during the war years by the needs of a war economy, much progress has been achieved in connection with the Government's housing scheme (commenced in March, 1937) of erecting homes of a good standard, which are let to tenants at a reasonable rental (vide pp. 394–396).
Prior to the passing of the Social Security Act, 1938 (vide Section 25), the initial pre-eminence of New Zealand in respect of social legislation generally had been largely lost. Hitherto the only governmental provision towards sickness insurance was the National Provident Fund established in 1911. This scheme is a voluntary one, State aid being in the direction of administration, together with a subsidy. The Social Security Act is much wider in scope than similar legislation in most other countries; but it is worthy of note that compulsory health insurance, operative in Now Zealand only from 1st April, 1939, was in operation for many years in several other countries—e.g., Germany (1883), Great Britain (1911).
National provision for the relief of unemployment did not become law in this country until 1930, whereas in Great Britain legislation dealing with this subject has been in force since 1911. The earliest legislative action specifically focused on unemployment-insurance matters was taken, as far as can be ascertained, in Denmark, in the year 1907. Other countries in which the years of initiation of unemployment-insurance were antecedent to that of New Zealand were: Austria, 1920; Queensland (Australia), 1922; Italy, 1923; and Germany, 1924.
A Workers' Compensation Amendment Act was passed in October, 1936, liberalizing the scale of payments in respect of accidents. The Social Security Act has rectified the pre-existing deficiencies in New Zealand legislation in regard to medical benefits and unemployment, as compared with the position in other countries.
Up to 1936 progress in other spheres was limited to technical improvement on the original Ballance-Seddon code, except perhaps in the case of the fluctuating fortunes of the Arbitration Court. During the twenty-six years of prosperity from 1895 to 1921 (there was but a slight setback in 1909–10) the scope of the Court's awards was gradually expanded, the most important step being the power conferred in 1898 of prescribing minimum rates of wages. Whereas the Court was originally more concerned with conditions of work, and not at first with wages, there has been a gradual transformation, till in recent years the attention of the Court has been mainly focused on the wages question. As the Court is progressive, or at least not static, its influence expanded at the cost of stationary measures, such as Factories Acts, which, in practice, became a dead-letter as affecting workers under the jurisdiction of the Court. During the depressed years following 1921 wages were reduced, to the dissatisfaction of the workers, yet not fast enough for employers, so that the value of the Court was increasingly questioned till a National Industrial Conference was summoned in 1928 to discuss, inter alia, compulsory arbitration. In the boom years between 1927 and 1930 no action was taken; but in 1932, under stress of depressed conditions, amendments were made to the Act which in effect abolished the system of compulsory arbitration. The Industrial Conciliation and Arbitration Amendment Act, 1936, restored the full powers of the Court.
Though no great inroads have been made on the wages system, there has been definite governmental and legislative encouragement of co-operation. In 1891 much public-works construction, such as road and railway formation, was first organized on this principle. The plant, explosives, &c., were supplied to the men by the State at cost price or on low hire terms. A modified form of the system then adopted is still followed, and its scope was increased in 1936. Similarly, the Companies Empowering Act of 1924, the provisions of which were embodied in the Companies Act, 1933, attempted to encourage the principle of profit-sharing among workers. Any company registered under the Companies Act is empowered to issue to its employees labour shares, which are not transferable, have no nominal value, and do not form part of the ordinary capital of the company. Except as otherwise provided, these shares entitle the holders to the same privileges as the ordinary shareholders. In the event of an employee leaving his employment or dying, the shares must be surrendered in cash or in capital shares to him or to his heirs. Another Act in the early “twenties” aimed at fostering co-operation among farmers, but it became, in practice, a dead-letter.
There was in the original labour code a definite policy of ensuring greater opportunities for the masses by financing farming and house-building projects, through the State Advances Department. This provision of easy credit to put workers on the land was the rural aspect of the labour code, for, apart from some provision for the inspection of housing, there were no other measures designed for the agricultural labourer. Even the Arbitration Court in 1908, 1919, and 1925 refused to make any award covering permanent farm labour. Full provision for the application of standard rates of wages, &c., to farm workers was made in 1936 (see Agricultural Workers Act, post). The policy of social lending survived the years of prosperity, and was employed to cope with part of the rehabilitation necessitated by the war of 1914–18; but the policy was reversed a little later, and the Rural Advances Act of 1926 was a definite attempt to put State Advances loans on a more economic basis, eliminating much of the social background. This tendency was completed by the creation of the Mortgage Corporation in 1935, which definitely marked the subordination of social to economic ends. The agricultural bias and the workers' loans of up to 95 per cent. of their security were both eliminated, in theory at least. At the same time loans for housing were reintroduced for Maoris late in 1935, and further activity in this sphere was foreshadowed by the Housing Survey Act of 1935. The Government was also empowered to lend to farmers, through the Lands Department, by the Dairy Industry (Emergency Powers) Act of the same year.
The State Advances Corporation Act, 1936, marked a definite reversal of the previous Government's policy in regard to State Advances loans. The Mortgage Corporation was abolished, its powers having been taken over by the State Advances Corporation (see Section 24D), while the general purpose of the 1936 Act was definitely in the direction of a liberalization of the lending policy of the State.
During the depression period there was a cessation of the move towards better working-conditions; and, on the grounds of economic circumstances and the danger of inconveniencing still further already bankrupt employers, the various inspection duties that usually preserve the labour code were curtailed. The rates of pensions and of public servants' salaries and wages were reduced, while award rates of wages were also compulsorily reduced. At the same time heavy unemployment liabilities were undertaken and immigration control was made more rigid. Steps were also taken to reduce farmers' mortgage liabilities and to maintain farmers on their land.
In no case do the provisions laid down by any particular labour law cancel the worker's rights at common law: but since, naturally enough, better conditions are laid down by statute than the worker is entitled to at common law, it is unusual to find in these days litigation under the common law affecting master and servant. It sometimes happens, however, notably in workers' compensation cases, that appeal is made at common law instead of under the Act, there being no statutory limits to the damages which may be obtained at common law. Since, with the exception of such of the labour statutes as are of general application, no labour legislation exists as yet affecting certain classes or workers—e.g., domestic servants—their relations with their employers are still governed mainly by the common law affecting master and servant.
New Zealand has been relatively backward in protection for permanent farm labour, for while seasonal labour is in general covered—awards existing both for shearers, musterers, and shed hands and for threshing-mill workers—the Arbitration Court has made no awards in respect of permanent farm hands. In general, conditions of work on farms were not covered by any specific legislation—except as regards inspection of housing-accommodation—until, in 1936, the Agricultural Workers Act (described in some detail later) was passed, containing definite provision as to wages of dairy-farm workers (extended later to cover other classes of farm workers) and better provision for the housing of agricultural workers generally. Similar legislation has existed in many of the older countries for years past. Further improvement in the position of agricultural workers was made by the Share-milking Agreements Act, 1937, which defined, inter alia, minimum percentages of the milking returns to be received by share-milkers.
The general trend of labour legislation since 1936 has been conditioned by three major influences. The first of these was primarily economic in origin, legislation being necessary to cope with continuing and derived problems associated with the economic depression and subsequent recovery. The second, with its origin in the international political developments culminating in war during 1939, was responsible for a considerable volume of wartime and post-war legislation. The third element was of a more general nature, being the direct motivating force behind some major items of legislation and often indirectly influencing the content of other Acts and amendments passed during the various sessions. Briefly, it can be described as full acceptance of the principle that society, through its representative institutions, should take active steps towards the improvement of the working, living, and social circumstances of its individual members. The appropriate action in many instances has required legislative sanction to provide for either direct control or regulation by the Government.
As a point of possible interest, although not of particular relevance to labour legislation, it is possible to discern two other main lines of approach to law-making. One of these is due to the increasing participation by New Zealand in international affairs consequent on its enhanced national status and acceptance of responsibility in the wider issues of the present era. The other is domestic; it is concerned with the welfare and social development generally of both the rapidly growing Maori population and the inhabitants of New Zealand's island and trust territories.
The economic depression and subsequent recovery was substantially the background for the major labour measures listed below commencing from the 1936 session. In addition, extensive amendments to pre-existing labour laws were made by the Labour Government (first elected in November, 1935) towards the formulation of a more liberal code of social legislation. Provisions novel to New Zealand were also made with the same object in view—e.g., the Agricultural Workers Act, and the provision for the declaration of a basic wage contained in the 1936 amendment to the Industrial Conciliation and Arbitration Act. A list of Acts dealing directly with labour questions follows:—
Employment Promotion Act, 1936.
Industrial Conciliation and Arbitration Amendment Acts, 1936, 1937, and 1939.
Factories Amendment Act, 1936.
Shops and Offices Amendment Act, 1936.
Agricultural Workers Act, 1936.
Coal-mines Amendment Acts, 1936 and 1937.
Workers' Compensation Amendment Act, 1936.
Mining Amendment Act, 1937.
Share-milking Agreements Act, 1937.
Wages Protection and Contractors' Liens Act, 1939.
In addition to the Acts mentioned above, provisions in. several other Acts dealt with matters which can properly be regarded as coming within the subject-matter of this section. The following Acts, or provisions in Acts, may be referred to in this connection:—
Certain provisions in the Finance Act, 1936, dealing with restoration of wages and salaries.
Distress and Replevin Amendment Act, 1936.
Fair Rents Act, 1936.
Family Allowances Amendment Act, 1936.
Pensions Amendment Acts, 1936 and 1937.
Prevention of Profiteering Act, 1936.
Mortgagors and Lessees Rehabilitation Act, 1936.
State Advances Corporation Act, 1936.
Iron and Steel Industry Act, 1937.
Petroleum Act, 1937.
As previously mentioned, the war period was productive of much legislative activity of relevance to labour conditions. In some instances the object was essentially precautionary, while in others it was designed to cope with situations as these emerged or developed. Principal measures with some application to industrial conditions were as follows:—
Industrial Conciliation and Arbitration Amendment Act, 1939.
Emergency Regulations Act, 1939, and later amendments.
War Pensions Extension Act, 1940.
War Pensions and Allowances (Mercantile Marine) Act, 1940.
Various provisions of the Finance (Nos. 2, 3, and 4) Acts, 1940.
Rehabilitation Act, 1941, and 1944 amendment.
War Damage Act, 1941, and 1942 amendment.
Servicemen's Settlement and Land Sales Act, 1943.
War Pensions Act, 1943 (consolidation and amendment).
More comprehensive legislation directly governing wartime labour activities was contained in the series of emergency regulations and amendments issued during 1939–45, including orders made under the authority of the latter. For further reference to the scope of the regulations listed below the reader should consult pages 625–629 of the 1946 Year-Book, wherein the subject-matter is presented in greater detail. A summary of the relevant regulations and orders is now given:—
Labour Legislation Emergency Regulations 1940 (superseding regulations of a similar nature in 1939).
Various Labour Legislation Suspension Orders 1940.
Shop Labour Legislation Suspension and Modification Order 1941.
Factory Industries Labour Legislation Suspension Order 1941.
Holidays Labour Legislation Modification Order 1941.
Overtime and Holidays Labour Legislation Suspension Order 1941.
Agricultural Workers Labour Legislation Modification Order 1941.
Industrial Man-power Regulations 1942 (consolidating and re-enacting those provisions of the National Service Emergency Regulations 1940 and their subsequent amendments which related to the question of national service outside the Armed Forces).
The Industrial Man-power Regulations 1942 were subsequently revoked and reissued as the Industrial Man-power Regulations 1944.
Waterfront Control Commission Emergency Regulations 1940.
Rates of Wages Emergency Regulations 1940 and amendments.
Economic Stabilization Emergency Regulations 1942 and amendments. These were issued as a reprint in 1944.
Occupational Re-establishment Emergency Regulations 1940, superseding 1939 regulations of similar title.
Industrial Rest Period Emergency Regulations 1943, the provisions of which were replaced by permanent legislation in the Annual Holidays Act, 1944.
The principal features of the war-inspired legislation quoted above are now briefly discussed. An essential over-all measure, the Labour Legislation Emergency Regulations 1940 gave the Minister of Labour power to modify or suspend, by order published in the Gazette, the provisions of any Act, or of any award or industrial agreement under the industrial Conciliation and Arbitration Act, or of any voluntary agreement, in so far as they related to conditions of employment. The object of these regulations, intended to be temporary in nature, was to overcome the effects of the shortage of skilled workers in certain industries which were essential to the efficient prosecution of New Zealand's war effort. Provision was therefore made by these regulations and the various orders issued under their authority for the working of shifts, extending the number of hours that could be worked in any one week, and relaxing apprenticeship conditions, while in certain trades the basic-wage provision was modified to enable women workers over twenty-one years of age without previous experience to be employed.
The National Service Emergency Regulations 1940, which with amendments were reprinted in 1944, empowered the Minister of Industrial Man-power to declare any industry to be an essential industry. Special provisions applied with respect to employment in essential undertakings—for example, a person could not, in general, leave his employment or be dismissed or be permitted to give his services in any other undertaking without seven days' notice on either side and the permission of the District Man-power Officer first being obtained. Every employee in an essential industry was entitled to a minimum weekly payment equivalent to his ordinary weekly wage, subject to certain maxima specified by regulations. Other provisions detailed offences under these regulations, protected employees called up for military service from dismissal, and prevented employment of deserters from the Armed Forces or military defaulters, &c.
In addition to controlling those avenues in which industrial effort was expended, and its corollary entailing the direction of man-power, a third general feature was supervision over the field of transportation. The Waterfront Control Commission Emergency Regulations 1940 provided for a Waterfront Control Commission with very extensive powers, including the employment of labour, the prescription of terms and conditions of such employment, and rates of remuneration.
It was early realized that the effects of wartime shortages of supplies and of manpower would have repercussions on prices and wage-rates. In an endeavour to minimize such movements and preserve a reasonable degree of stability in both these sectors of the economy, regulations were issued in 1939 and 1940 dealing with the control of prices and regulation of wage-rates respectively. Further information on price control is given in Section 37 of this issue. The Rates of Wages Emergency Regulations 1940 provided that the Arbitration Court from time to time, on the application of any industrial union or association of workers, might amend by general order the provisions of all awards and industrial agreements in force in so far as they determined rates of remuneration.
These regulations were superseded by the Economic Stabilization Emergency Regulations 1942, providing for the stabilization of all rates of wages and remuneration at the levels ruling on the 15th November, 1942. A special wartime price index was provided for the purpose of recording, as from the 15th December, 1942, any increase or reduction in the prices of such commodities and services (including rents) as the Minister of Industries and Commerce might direct. In the event of any movement, amounting to 2½ per cent. initially and 5 per cent. in subsequent variations, in the general level of prices included in the wartime price index, the Court of Arbitration was enjoined to issue a general order adjusting rates of remuneration similarly by an amount equivalent to the variation disclosed by the index. Apart from the adjustment of strictly defined anomalies, these regulations limited the powers of the Court in dealing with wages to the issue of general orders as outlined above. The February, 1945, amendment gave the Court power to amend existing awards and agreements so as to adjust disparities in wage levels. Power was also given to issue pronouncements specifying the standard wages for skilled, semi-skilled, and unskilled workers for the purposes of the regulations.
In June, 1945, a further amendment to the regulations was issued, and in making any general order regarding wages the Court was required to take into account—
“(a) The economic and financial conditions affecting trade and industry in New Zealand.
“(b) Any rise or fall in the cost of living as indicated by the wartime price index since the 15th December, 1942.
“(c) Any increase or reduction in rates of remuneration since the 15th December, 1942.
“(d) Any other consideration that the Court deems relevant.”
Wartime legislation covering the above points was in part placed on a permanent basis by virtue of the passing of the Economic Stabilization Act, 1948. This Act revoked Parts II and V of the Economic Stabilization Emergency Regulations 1942 while other specified emergency regulations were continued in force as stabilization regulations as if they had been made under the authority of the 1948 Act. Provision was made for the establishment of an Economic Stabilization Commission with the principal function of making recommendations to the Minister of Industries and Commerce, after inquiry and investigation, in relation to the economic stabilization of New Zealand and the functions of the Minister under this Act. Besides general administration, these latter functions cover in particular the stabilization, control, and adjustment of prices of goods, and services, rents, other costs, and rates of wages, salaries, and other incomes.
The Economic Stabilization Emergency Regulations 1942 were amended in several important respects in February, 1949. This amendment revoked the Rates of Wages Emergency Regulations 1940 and subsequent amendments, and also amended the principal regulations chiefly in the following ways. In making pronouncements specifying standard rates of wages for skilled, semi-skilled, and unskilled workers, or in making general orders, the Court of Arbitration is now required to take into account—
The general purpose of these regulations.
Any rise or fall in retail prices as indicated by any index published by the Government Statistician.
The economic conditions affecting finance, trade, and industry in New Zealand.
Relative movements in the incomes of different sections of the community.
All other considerations that the Court deems relevant.
Provision is also made for a general order to be made on any application for a standard-wage pronouncement, and vice versa. In either ease no general order shall be made to take effect, or any pronouncement be made, less than one year from the date of a previous order becoming effective or of a previous pronouncement having being made. In addition, the Court is empowered to extend the above provisions to apprenticeship orders unless such orders are automatically covered through the amendments made to awards or industrial agreements.
Two other classes of legislation due to the impact of war on labour questions may be mentioned briefly. The first covers the reinstatement of employees after military service, the re-establishment in civil life of discharged servicemen, and the reconstitution of wartime industries on a peacetime basis. Legislation concerned with these aspects include the Occupational Re-establishment Emergency Regulations 1940 and the Rehabilitation Act, 1941, and amendments. Further details are given in Section 46 of this issue.
The second class of legislation dealt with the necessity for definite rest periods for workers, particularly in view of the heavy demands made on a very-large section of them by a wartime economy. Early provisions for a minimum rest period were contained in the Industrial Rest Period Emergency Regulations 1943, later replaced by permanent legislation embodied in the Annual Holidays Act, 1944. This Act provides for an annual holiday of two weeks' duration on full pay for all workers, whether permanently or casually employed, who are not otherwise catered for in this respect.
Reference has been made earlier to the fact that much New Zealand social legislation—particularly in recent years—is designed to mitigate the effects of inequalities in the distribution of incomes. Foremost in this category is the Social Security Act, 1938, which at the same time introduced monetary benefits on an increased scale in substitution for pre-existing pensions benefits and extended the specific tax provisions contained in pre-existing unemployment legislation to cover the wider social security benefits. A system of medical, hospital, and other related benefits was also inaugurated. In addition to the supersession of the various classes of pensions by monetary benefits of similar application, new classes of monetary benefits were begun, such as orphans' benefits, sickness benefits, emergency benefits, and the universal superannuation benefit. Further evidence of this trend is shown by a series of regulations extending the scope and character of social security benefits, and by the amending Acts of 1941, 1943, 1945 (which made family benefits universal from 1st April, 1946), 1947, and 1949 increasing the amount payable for specified benefits. Related legislation includes the Social Security (Reciprocity with Australia) Act, 1948; the War Pensions Act, 1943; War Pensions and Allowances (Mercantile Marine) Act, 1940; Family Benefits (Reciprocity with Great Britain) Act, 1948, and a similar Reciprocity Act with Northern Ireland in the same year.
Several measures dating from 1936 are focussed on the theme of compensation for injury or death. Amendments to the Workers' Compensation Act, 1922, were passed in 1936, 1943, 1945, and 1947. The 1943 amendment made it compulsory for an employer to insure against his liability under the Act, while by the 1947 amendment, under section 6, workers' compensation insurance becomes, with certain exceptions, a monopoly of the branch of the State Fire Insurance Office known as the Accident Insurance Office. Other provisions of the latter amendment relate to accident prevention; occupational training of seriously disabled workers; an increase in the maximum amount of compensation payable in respect of death, incapacity, or permanent physical injury; accidents to the crew of a New Zealand aircraft; accidents to workers travelling to and from work; the provision of artificial limbs; and the conveyance of injured workers. Dependency is also to be determined as at the date of death of the worker. The Law Reform Act, 1936, and the Statutes Amendment Act, 1937, also included clauses relating to the Deaths by Accidents Compensation Act. Allied to this subject is the Contributory Negligence Act, 1947, which provides for the apportionment of damages where the person suffering damage has himself been guilty of contributory negligence.
A desire to improve still further working-conditions is evident in the Coal-mines Amendment Acts of 1936, 1937, 1941, and 1947, the Mining Amendment Acts of 1937, 1941, 1947, and 1948, and the Quarries Act, 1944. These contained provisions towards the improvement of working-conditions in mines or quarries. Somewhat similar provisions, for example, regarding hours of labour are to be found in the Factories Act, 1946 (a consolidation measure), the Shops and Offices Amendment Acts of 1936, 1945, and 1946, and the Shipping and Seamen Amendment Acts, 1946 and 1948.
Further instances of the broader social emphasis in labour legislation occur in the Legal Aid Act, 1939; the Wages Protection and Contractors' Liens Act, 1939; the Employment Act, 1945, with its object of promoting and maintaining full employment at all times; and the Minimum Wage Act, 1945, providing for a minimum wage for all adult workers. More extensive coverage of legislation concerned with safety provisions was accomplished with the passing of the Municipal Corporations Amendment Act, 1938, the Bush Workers Act, 1945, and the Scaffolding and Excavation Amendment Act, 1948, while the Dairy Industry Amendment Act, 1938, and the Meat Act, 1939, contain clauses dealing with inspection requirements in their appropriate spheres.
Acts covering the working-conditions and rates of remuneration for States employees during the period 1936–48 are the Government Railways Amendment Acts, 1936 and 1944, Post and Telegraph Amendment Act, 1944, and the Government Service Tribunal Act, 1948.
Other items of legislation concerned with labour-force activities generally are now briefly mentioned. The Industrial Conciliation and Arbitration Amendment Act, 1943, authorized recovery of money due under an award, while the 1947 amendment provides for the appointment of Deputy Judges of the Court of Arbitration and also for the taking of a secret ballot by every industrial union of workers or of employers on questions relating to strikes and lockouts. The Statutes Amendment Act, 1948, also included clauses relating to wages recovery under an award, and for retrospective payments. Amendments were made in 1947 and 1948 to both the Strike and Lockout Emergency Regulations 1939 and to the Waterfront Industry Emergency Regulations 1946. A consolidation and amendment measure relating to apprenticeship was passed in 1948, being the Apprentices Act of that year. The entire body of fair-rents legislation commencing with the 1936 Act was revoked by the passing of the Tenancy Act, 1948. Finally amendments were made in 1948 to both the Fisheries Act, 1908, and the Shipping and Seamen Act, 1908.
GENERAL.—Working-conditions of women and girls in factories were the subject of legislation as early as 1873; but the first legislation of this nature applying to all factory workers was the Inspection of Machinery Act of 1874, which provided for the inspection of machinery in factories, &c., and required that persons in charge of boilers should be properly qualified: while three years later an ineffective Factory Act was passed. But it was the Ballance and Seddon Governments which really initiated legislation in this sphere with five main Acts that have served as a basis for all subsequent legislation on this subject and determined the lines along which progress was to be made—the Factories Act, 1891, the Coal-mines Act, 1891, the Shops and Shop-assistants Act, 1892, the Shipping and Seamen Act, 1894, and the Industrial Conciliation and Arbitration Act, 1894. The Agricultural Workers Act, 1936, represents a definite extension of the scope of this legislation.
A considerable proportion of the persons comprising the labour force of New Zealand have their working-conditions determined either directly or indirectly by virtue of the provisions of the six Acts quoted above. Legislative authority covering the working-conditions of substantially the greater portion of the remaining participants in the labour force is contained in the following:—
Public Service Act, 1912, and the Government Service Tribunal Act, 1948.
Government Railways Act, 1926, and the Government Railways Amendment Acts, 1936 and 1944.
Post and Telegraph Act, 1928, and Post and Telegraph Amendment Act, 1944.
Police Force Act, 1947.
Education Act, 1914.
Hospitals Act, 1926, and the Hospital Employment Regulations 1948.
Public Works Workers' Agreement, 1936, and since 1949, the Government Service Tribunal Act, 1948.
Waterfront Industry Emergency Regulations 1946 and amendments.
It will not be out of place here to mention that working-conditions were subject to considerable modification during the war period by the operation of various emergency regulations. The principal regulations involved were the Labour Legislation Emergency Regulations 1940 and its amendments; the Industrial Man-power Regulations 1944; the Waterfront Control Emergency Regulations 1940, replaced by the Waterfront Industry Emergency Regulations 1946; and the Rates of Wages Emergency Regulations 1940, the latter largely superseded by the Economic Stabilization Emergency Regulations 1942 and amendments. Of these, the Industrial Man-power Regulations 1944 were revoked in 1946 and the Rates of Wages Emergency Regulations 1940 in 1949, while most of the various suspension or modification orders issued under the authority of the Labour Legislation Emergency Regulations 1940 have also been revoked. The emergency wages and stabilization regulations were given permanent legislative effect by the Economic Stabilization Act, 1948.
It is proposed in the following pages to survey in broad perspective the working-conditions laid down by legislation for the components of the labour force. In so doing it is considered that the best approach is to deal with the major specific Acts concerned.
ANNUAL HOLIDAYS ACT.—In addition to the specific measures mentioned earlier relating to working-conditions, an Act of general application, except in cases where more favourable conditions already existed in awards, &c., was passed during the war entitled the Annual Holidays Act, 1944. This Act provides for an annual holiday of two weeks' duration on full pay for all workers, whether permanently or casually employed, who are not otherwise provided for in this respect. If a holiday benefit to which a worker is entitled under any other provision is more favourable than that provided for by the Act, such benefit is not affected, but if the benefit is less favourable the worker is entitled to the holiday provided for by the Act.
The holiday is to be given within six months after it becomes due, but if the employment is terminated before it has been taken, the employer is required to pay the amount of holiday pay due. If any special holiday for which the worker is entitled to payment under any Act, award, or agreement, or under his contract of service, occurs during the period of the annual holiday, the length of the annual holiday is increased by one day in respect thereof. An amendment passed in 1945 provided that not less than seven days' notice must be given by the employer of the day on which the annual holiday is to commence, unless an agreement has been made to the contrary.
Where a worker has been employed for not less than three months and for less than one year, on termination of employment he is entitled to payment equal to one twenty-fifth of his ordinary pay for the period of employment. The same rate applies for periods of less than three months, but in this case uncancelled or revenue stamps to the equivalent value are to be affixed to the worker's holiday card, while the employer also enters particulars of employment thereon. After the expiration of one year from the beginning of the earliest period of employment on the card the worker, by surrendering it at a money order office, will receive the cash value of all uncancelled stamps, &c., affixed to it.
An employer is required to keep a record (holiday-book) containing particulars of employment, annual holidays, and amounts paid in respect of each worker in his employment.
FACTORIES ACT.—A brief summary of the earlier factory legislation of New Zealand may be found on page 825 of the 1940 issue of the Year-Book. It covers the Factories Acts of 1891, 1908, and 1921–22, with their amendments. The last-mentioned enactment and subsequent amendments to it was, however, recently consolidated by the passing of the Factories Act, 1946. In the ensuing paragraphs, various phases of factory legislation as the law now stands, have been selected for individual exposition.
Prior to 1936 the term “factory” had included all establishments where two persons were employed, as well as all places using mechanical power, all bakeries, laundries, gasworks, and several other enumerated establishments. The 1936 Act extended the term “factory” to all establishments where one person was employed, while the Factories Act, 1946, which consolidated and amended the existing legislation, further extended the term “factory” to include places where milk is pasteurized, abattoirs, and “every building or place in which any noxious handicraft, process, or employment is carried on.” The definition was further enlarged to include “any building, office, or place in which two or more persons are engaged … directly or indirectly, in any handicraft, or in preparing or manufacturing goods for trade or sale.” The 1946 Act also brought Government-owned factories within the scope of the legislation.
Hours of Work and Overtime.—A forty-hour week was prescribed by the 1936 amendment as the legal maximum for an ordinary working-week in place of the pre-existing maximum of forty-eight hours (women and boys, forty-five hours). The number of hours per day was fixed at eight, while work could not be continued for more than four hours and one-quarter (previously five hours) without an intermission of at least three-quarters of an hour. Certain industries which were previously exempt from the forty-eight-hour maximum—meat-freezing works, dairy factories, fellmongery, fish-curing, jam-making, bacon-curing—were also exempt from the operation of these provisions, but the Factories Amendment Act, 1945, extended the principle of the forty-hour week to all factories. These provisions, as amended, were re-enacted in the consolidation measure entitled the Factories Act, 1946.
No boy or girl under sixteen years of age is permitted to work overtime. In the case of all workers over sixteen years of age in laundries, and of women in other factories, not more than three hours' overtime may be worked in one day (excluding time worked before noon on Saturday) and not more than nine hours in any week, nor ninety hours in any year, nor on more than two consecutive days in any week. Thirty hours (above the ninety) may be authorized by an Inspector of Factories, and a further thirty upon the consent of the Minister of Labour. The overtime rate is time and one-half, and the minimum rate, which had been raised to 1s. 6d. per hour by the Factories Amendment Act, 1936, was further increased to 1s. 9d. per hour by the Factories Act, 1946.
There are special provisions in regard to overtime work for certain industries—e.g., laundries, and for fruit-canning factories and jam-making factories for the period between 1st January and 1st April.
Section 16 of the Statutes Amendment Act, 1948, extends the Minister's power to consent to additional voluntary overtime by women in factories or by men and women in laundries up to a maximum of eighty hours in a year.
Holiday Provisions.—The number of paid holidays granted to factory workers was increased from six days to eight days by the 1936 amendment and was extended to cover all workers—not only boys under eighteen and women as previously. For five of these days wages were payable to all persons employed at any time during the preceding fortnight, and for the other days to those employed on any four days of the preceding week. By section 17 of the Statutes Amendment Act, 1938, as amended by section 25 of the Statutes Amendment Act, 1941, payment for each whole holiday mentioned in the Factories Act was made to apply to all persons employed at any time in the fortnight ending on the day of which the holiday occurs. Special provisions have been made requiring extra payment to be made for work done on Sundays or holidays. Generally speaking, treble time is counted for work done on statutory whole holidays (where the worker would be paid ordinary time if not working), double time on Sundays, and time and one-half on half-holidays. In connection with holidays, reference should also be made to the Annual Holidays Act, 1944, the provisions of which are outlined on page 655.
There are also special provisions in regard to holiday work for industries such as dairy factories, milk-preserving factories, and newspaper printing or publishing. It should be noted also that the Public Holidays Amendment Act, 1948, gives rules which shall be applicable to the provisions of any Act, award, or industrial agreement when Christmas Day and New Year's Day fall on a Saturday or when an Anniversary Day falls on a Saturday or Sunday. The effect of this amendment is as follows: Where Acts, awards, or industrial agreements provide for the granting of a holiday, or the observance of certain hours of labour, or the payment of certain specified rates of wages on the days specifically mentioned, these provisions will apply on the next succeeding Monday. If, however, provision is made for granting a holiday on a Saturday, such provisions apply without modification.
Section 15 of the Statutes Amendment Act, 1948, repealed the special definition of the terms “holidays” and “Sundays” in their application to morning newspapers and replaces them by new definitions which relate to all newspapers. A “day” for holiday and overtime purposes is defined as from noon on one day to noon on the following day in the case of newspaper offices and works.
Restrictions on Employment.—No boy or girl under fifteen years of age may be employed in any factory, except in a case authorized by an Inspector. Such an authorization may only be given if the boy or girl is over fourteen years of age and is exempted from the general obligation to attend school until the age of fifteen years is reached. No boy or girl under sixteen years of age may be employed in any factory unless a certificate of fitness is issued by an Inspector of Factories, and no such certificate may be granted unless the proposed employer obtains at his own expense a medical certificate of fitness from a Medical Officer of Health or from a registered medical practitioner nominated by a Medical Officer of Health.
Minimum Rates of Pay.—The minimum rate of pay was raised by the Factories Amendment Act, 1936, from 10s. to 15s. per week, rising by half-yearly increments of 4s. per week until the end of the third year, when a minimum of £2 per week operated. The Factories Act, 1946, further increased the minimum to 22s. 6d. per week, with half-yearly increments of not less than 5s. per week until a weekly rate of £2 12s. 6d. is reached. Those rates are, however, subject to the provisions of the Minimum Wage Act, 1945, in respect of workers of twenty-one years of age and over.
Safety, Health, and Welfare.—The 1936 amendment extended the application of rules for the safety and welfare of factory workers, and further provisions in this connection are contained in the 1946 Act. The safety measures have reference to machinery, dangerous liquids, means of access and safety of places of employment, and means of escape in case of fire, &c. The employer is required to keep a register of all accidents of which he has any knowledge, and first-aid appliances must be provided and maintained. The health and welfare provisions are very extensive and include reference to such matters as air space, cleanliness, ventilation, canteens, the care of employees, amenities and other things to be supplied by the employer to secure employees' health or welfare, and to the making of regulations laying down standards as to what may be regarded as adequate, effective, sufficient, or suitable health and welfare requirements.
Other Provisions.—In addition to repealing previous factory Acts and amendments the Factories Act, 1946, specifically stated that the Act shall bind the Crown. It also includes the normal provisions relating to powers of inspection, registration, maintenance of records and exhibition of notices, requisitions by Inspectors, and the prescription of offences, penalties, and procedure. Finally it provides for awards and industrial agreements to be read subject to the provisions of the Factories Act.
SHOPS AND OFFICES ACT.—As in the case of the Factories Act, important amendments were made to the Shops and Offices Act in 1936, when further advances in keeping with those made in other branches of industrial legislation were put into operation. These were supplemented by further amendments in 1945 and 1946.
A “shop” in the principal Act (The Shops and Offices Act, 1921–22) is defined to include a hotel, a restaurant, a hairdressing-saloon, and an auction-market, but special provisions relating to hotels and restaurants as well as to chemists, fruiterers, tobacconists, and other particular shops are contained in the principal and amending Acts.
An “office” covers any building in which any person is employed, directly or indirectly to do any clerical work in connection with any mercantile or commercial business carried on by the occupier, but does not include solicitors' offices or mining offices except in respect of minimum-wage-rates provisions.
The definition of the term “shop assistant” was extended by the 1936 amendment to include those employed in the general management or control of a shop, subject to a wage qualification.
Hours of Work and Overtime.—The 1936 amending Act reduced the hours of work from forty-eight to forty-four per week, and a further reduction was made by the Shops and Offices Amendment Act, 1945, which came into operation on 7th December, 1945. The latter amendment provides for a forty-hour week for shop-assistants, but the Court of Arbitration is empowered, on the application of any party (by order in the case of any existing award or in any new award), to extend the hours to forty-four where it is of the opinion that it would be impracticable to carry on efficiently the particular class of business without such extension, but the time worked beyond forty hours is to be paid for at overtime rates—namely, time and a half, with a minimum of 1s. 9d. per hour.
Hours must be worked continuously—i.e., not exceeding eight per day, but up to eleven on one day in the week—except for meal-times and breaks for refreshments. If the meal-time exceeds one hour, the extra time over the hour is to be regarded as time worked. Extension of the weekly hours from forty to forty-four was permitted up to the end of June, 1946, but a forty-hour limit was imposed thereafter if extension by the Court was not authorized by that date. Awards and agreements are required to be read subject to the amending Act but the existing rates of wages were not to be reduced nor the existing working-hours increased.
Limited overtime (to be paid for at time and a half rates) may be worked for stocktaking and on special occasions. A break of not less than one hour for a meal must be allowed after four and one-quarter hours' continuous work, except that an extension to live hours may be made if ten-minutes' rest is allowed at the end of a working-period of three hours.
All assistants employed in hotels and restaurants are brought under special provisions as to hours, overtime, &c. As in the case of shop-assistants, hotel and restaurant employees must be allowed an interval of an hour for a meal after four and one-quarter hours' continuous work. The 1945 amendment did not cover hotel and restaurant workers as far as the reduction in hours was concerned, but they were brought into line by a further amendment passed in 1946. This amendment came into force on 13th October, 1946, but provision was made for hotel or restaurant workers to be employed up to forty-four hours per week until 30th June, 1947, provided that time and a half rates were paid in respect of the hours exceeding forty. As in the case of shop workers, the Court of Arbitration may, upon application by any party bound or to be bound by any award covering assistants in hotels or restaurants, authorize employment up to forty-four hours per week if it is considered impracticable to carry on efficiently the business of the class of hotels or restaurants specified in the authorization without such extension of hours. Any such extended hours must be paid for at overtime rates. Up to 120 hours per annum additional overtime is permissible under the Act.
The Lour of commencing work must not be earlier than 7 a.m., except in certain specified instances—e.g., bakers (4 a.m.), butchers (6 a.m.). Persons engaged in delivering milk may be required to start work at 3 a.m. or—in accordance with conditions approved by the Minister, but not otherwise—earlier than 3 a.m. The above exceptions do not apply in the case of boys or girls under sixteen years of age. The latest hour to which a male shop-assistant may be employed in any trade is 10.30 p.m., or 11 p.m. on one day in the week in certain instances; while boys under eighteen or females may be employed until 9.30 p.m., but there are exceptions on certain days—e.g., Christmas Eve. The principal Act provided that female assistants and boys under eighteen could be employed in restaurants up to 10.30 p.m., but not after that hour. The 1946 amendment, however provides that where parties to an industrial dispute agree in the matter and incorporate their agreement in an award or industrial agreement, female assistants over the age of twenty-one years may be employed up to 11.30 p.m. In any such case satisfactory provision for convoying such assistants to their homes must be made. There is no limit under the Act to the time at which adult male hotel and restaurant employees may be required to commence or cease work, although the total hours per day and per week are fixed as above.
Offices are required to close at noon on the statutory half-holiday and at five o'clock on every other working-day, certain exceptions—e.g., shipping offices, railway offices, and newspaper offices—being allowed. The list of exemptions from this provision has been substantially reduced by the 1936 Act, banks and insurance offices being important cases previously exempt. In practice, a five-day week is worked in most offices. Limited employment after office-hours is permitted for such purposes as making up balances, &c., payment for overtime at the rate of time and a half and meal-allowance being mandatory in respect of such overtime.
Opening and Closing Hours of Shops.—The closing-hours of shops in any district have for many years been fixed pursuant to the Act by “requisition” of a majority of the shopkeepers if desired either in the whole of the local district or in any trade in the local district. The hours of closing have been thus determined in very many trades and districts.
In 1920, an amendment to the Act prescribed compulsory closing-hours at 6 p.m. on four days of the week and 9 p.m. on one day in the well-populated areas, except in certain exempted trades, thus incorporating by statute the closing-hours as already determined by “requisition” in many cases. With the passing of the 1945 amendment the Court of Arbitration now has power when making an award in any trade to fix the opening and closing hours of all shops in the particular trade in that locality, and also to provide that such shops shall not be open for business on one working-day in each week or on any award holiday. Before the Court exercises any of these powers, however, it is required to have regard to all relevant considerations. In very many instances these powers have been exercised and the result of the 1945 amendment has been that the majority of shops are open for five days in the week only.
The occupier of every shop, whether employing assistants or not, is deemed to be an employer within the meaning of the Industrial Conciliation and Arbitration Act, and therefore bound by an award relating to shop-assistants for the purpose of bringing his premises within the closing provisions fixed in an award.
A Magistrate may grant exemption (a) from any opening-hours fixed by the award, (b) from any provision that shops shall close for the whole of one working-day, and (c) from any provision that shops shall be closed on holidays.
Holiday Provisions.—The number of paid holidays provided by the Shops and Offices Act is seven, and employees not otherwise provided for are entitled to the benefits of the Annual Holidays Act, 1944. The provisions of the Public Holidays Amendment Act, 1948, also apply (refer page 657).
In regard to the closing of shops, a weekly half-holiday from noon is compulsory with a few exceptions. The closing-day is fixed in each district by the local authority, except where it is decided by a poll of the electors taken on petition of a certain number. Even in the exempted trades, a half-holiday must be given to each assistant on a day to be fixed by the occupier.
Special provisions operate in respect of holidays for all assistants employed in hotels and restaurants.
Minimum Rates of Pay.—The minimum rates of wages payable to shop-assistants under the Shops and Offices Act are the same as those provided for by the Factories Act (refer p. 657). As in the case of factories, higher rates may be fixed by awards and industrial agreements. The provisions of the Minimum Wage Act, 1945, also apply.
The minimum wage-rates applying to shop-assistants apply also to office-assistants. Prior to the 1936 amendment, office-assistants did not come within the scope of the provision for minimum wages. This particular provision also applies to solicitors' offices and mining offices, which do not come within the definition of the term “office” in respect of other provisions of the Act.
Safety, Health, and Welfare Provisions.—The Act also makes provision for the comfort, health, and safety of assistants—viz., in regard to seating-accommodation, ventilation, healing, sanitation, and hygiene.
Other Provisions.—Each trade in any district may, by a majority vote, obtain an order of the Minister of Labour prohibiting the sale in such district, during the time the shops in such trade are required to be closed, of the goods the sale of which is comprised in such trade. This provision is inserted to meet those cases where there is over-lapping of the trades of various shopkeepers, only some of whom are required to close at a certain hour. The provisions enabling a majority of the shopkeepers in any trade to fix the closing-hours for that trade applies only to those who are principally engaged therein; if the latter are desirous that other shopkeepers carrying on the trade as a minor portion of their business should cease selling the same goods at the closing-hours fixed, they may apply to the Minister for an order prohibiting such sales.
No premium may be received by the occupier of any shop in respect of the employment of any shop-assistant or in respect of the teaching or training of any person in any trade or business carried on in the shop, unless the shop is approved by the Chief Inspector appointed under the Factories Act, 1946, as a school for learners in a trade or business, and the payment is made pursuant to a written agreement that is approved by the Chief Inspector. The Chief Inspector cannot approve of any shop as a school for learners in any trade or business unless he is satisfied that reasonable facilities are provided for learning the trade or business, and he may at any time withdraw his approval if he ceases to be so satisfied. The Chief Inspector must not approve of any agreement under this section unless he is satisfied that the terms of the agreement are reasonable.
Provision is made for the keeping of a time-table of hours of duty of fruiterers' assistants; and, under certain conditions, shops which sell smoking-requisites in addition to carrying on other business may be compelled to close early in the evenings.
There are also the usual provisions governing powers of inspection, requisition, and the prescription of offences and penalties.
Awards and industrial agreements covering shop and office workers are to be read, subject to the provisions of the Shops and Offices Act—i.e., the conditions, &c., laid down in such awards and agreements must be at least equal to those prescribed in the Shops and Offices Act.
MINING LEGISLATION.—Since the passing of the original Coal-mines Act of 1886, legislation relating to coal-mines has always been set out separately from that regulating all other mines. The present law relating to mining and quarrying will therefore be found for the most part in the Coal-mines Act, 1925, and subsequent amendments, the Mining Act, 1926, and amendments, and the Quarries Act, 1944. A noteworthy feature of mining Acts is the appointment of Inspectors of Mines with wide powers.
Application of Mining Acts.—A “mine” under the Mining Act means generally any mine other than a coal-mine, while by the Quarries Act, 1944, a quarry is defined as any place in which persons work in excavating any kind of material from the earth. A quarry does not include any place in which mining or searching for coal, gold, scheelite, or petroleum is carried on; any road-cutting or railway-cutting; any tunnel in whoso construction explosives are not used and which is less than 50 ft. long; or any excavation under the Scaffolding and Excavations Act, 1922.
Hours of Work, Overtime, Holidays, and Rates of Pay.—In common with the practice pertaining for many other industrial groups of workers, the current working-conditions for miners and quarry-men generally are determined in the awards made by the Industrial Conciliation and Arbitration Court from time to time, rather than by existing statutory provisions. In the construction of awards, conditions may be, and probably are, more favourable than these required by statute, but in no case can the award provisions be less favourable. These comments apply in particular to questions of hours of work, overtime, holidays, and wage-rates for workers in those industries covered by the mining and quarrying Acts. Two of the more relevant statutory provisions are as follows: Both principal mining Acts prohibit employment in or about mines on Sundays unless the previous authority of an Inspector of Mines has been obtained; and the 1948 amendment to the Mining Act, 1926, provided that every workman employed underground shall be paid overtime for all time so spent in excess of seven hours in any one day. This was in lieu of the former eight-hour limit.
Restriction on Employment.—The following legislative restrictions are operative on the employment of women, youths, and boys. No female of any age or any lad under the age of fourteen years may be employed in or about a mine or coal-mine except in a clerical capacity or, by virtue of a 1937 amendment, as nurses or charwomen. A similar restriction is imposed by the Quarries Act, 1944, except that the age-limit for youths is raised to sixteen years. At the present time, also, no male under the age of sixteen years may be employed underground in any coal-mine, or in any alluvial mine, or on or about any dredge; while the minimum age in respect of underground work in a quartz-mine was raised by the 1948 amendment to the Mining Act from eighteen to nineteen years of age. In addition, the employment of youths in specified occupations is prohibited both in coal and other mines, while no youth under twenty-one years is permitted to be in charge of certain types of machinery used in coal-mining. No youth may be employed in a mine for more than eight hours per day or forty-eight hours per week except in cases of emergency. As stated earlier the employment of manual labour on Sundays without the previous consent of an Inspector of Mines is prohibited, while any time so worked must be paid for at higher rates.
Safety, Health, and Welfare Provisions.—In general the provisions of the Coal-mines Act, 1925, resemble those of the Mining Act, 1926, in so far as safety, &c., is concerned although, of course, to combat the special risks of coal-mining additional regulation is necessary. Naturally enough, a very large part of each major mining or quarrying Act deals directly with the subject-matter of this paragraph. The appropriate provisions are now considered under the respective mining acts.
Mining Acts.—The 1926 Act required that a person acting in the capacity of mine manager of any mine where there are more than twelve men employed at any one time above ground, or more than six underground, must hold a certificate granted after examination by a Board of Examiners empowered under the Act to grant such certificates. Provision is made for proper ventilation in mines, the air temperature must not exceed 80° Fahrenheit in any working-place, special care is required to be taken in handling explosives, dangerous places must be properly timbered, and special regulations are made as to hauling-machinery, &c.
All machinery used to supply motive power is subject to the provisions of the Inspection of Machinery Act, 1908, as far as these provisions apply. Sufficient water must be supplied where it is necessary for the laying of dust in a mine. The Mining Amendment Act, 1927, provides, inter alia, that a mine where twenty men or over are employed on one shift must have two outlets.
The Mining Amendment Act, 1941, lays down that every person in charge of electrical apparatus in a mine must be the holder of a mine electrician's certificate. The appointment of an Electrical Inspector of Mines is provided for.
Comprehensive amending regulations pursuant to the Mining Act were issued in August, 1945. These regulations, in addition to other matters relating to mining, prescribe the conditions and subjects relating to the examinations for mine-managers, battery-superintendents', and dredge-masters' certificates. The regulations also lay down the types of electrical apparatus that may be used in any mine, the conditions under which it may be used, and the safeguards that must be employed.
Coal-mining Acts.—For every coal-mine there must be a duly qualified manager, who must be either the owner of the mine or some person appointed by the owner, and who is responsible for the control, management, and direction of the mine. Section 8 of the Statutes Amendment Act, 1944, prescribes the present qualifications that are required to be held by managers of coal-mines. These vary according to the number of men employed in the mine, and also according to whether all the workings are opencast of otherwise. Inspectors of Coal-mines appointed under the Act must hold certificates as first-class mine-managers under the Act. Certain sections of the Act deal with the control of coal-dust, the use of safety-lamps, the prohibition of work in places where the presence of gas is suspected, and the inspection of the mine before the commencement of work, &c. Suitable housing-accommodation must be supplied for workers if required by notice of the Minister of Mines. Comprehensive regulations pursuant to the 1925 Act, and known as the Coal-mines Regulations, were issued in 1939 and amended in the same year and in 1942.
A levy of ½d. per ton—increased to 1d. per ton as from 1st January, 1948, by the Coal-mines Amendment Act, 1947—on every ton of marketable coal raised from, mines is made under the terms of the Act, such moneys forming a fund for the relief of miners injured in the course of employment and of their dependants in the case of death. Information as to miners' pensions (now miners' benefits under the Social Security Act, 1938), provided for originally by the Miner's Phthisis Act of 1915, is contained in Section 25 of this book.
By an amending Act passed in 1927 wages for a period not exceeding six months, payable by the owner of a coal-mine in respect of mining operations, constitute an equitable charge on plant and machinery, with priority over mortgages, &c. Proceedings for the enforcement of the charge must be commenced within twelve months.
An amending Act passed in 1936 provided further measures for the safety of miners. Additional precautions were provided to ensure that unlawful lights, &c., are not taken into mines, and further safeguards were made to alleviate the danger to the health of miners from the presence of dust in mines. Prevision was also made for the Minister to establish central rescue stations in coal-mining areas.
The Coal-mines Amendment Act, 1937, contains many provisions designed to ensure the greater safety of workers engaged in coal-mines. No person under the age of twenty-three years may be employed as a mine-manager or other mine official, while certificates of competency as underviewers or firemen deputies must be periodically endorsed by an Inspector of Mines to the effect that the official has passed certain specified efficiency tests. Certain appliances by which coal may be, in effect, screened or sized may not be used underground. A further provision as to housing-accommodation for miners is also included in the amending Act. The Minister may require a mine-owner to pay part of the cost of conveyance of workers to the mine in lieu of providing housing-accommodation. In accordance with section 9 of the Statutes Amendment Act, 1944, the Minister may require underground transport to be provided for workmen where he considers it necessary.
The Coal-mines Amendment Act, 1941, provides that an Inspector may, if he considers it expedient, require a mine, which on the basis of the number of employees might be managed by a person with a certificate lower than that of a second-class mine-manager, to be managed by a person with a higher certificate than that prescribed by the principal Act. He may also require the appointment, for any shift, of officials additional to those normally required. Stricter provision is made regarding the use of lamps. The appointment of an Electrical Inspector of Coal-mines is provided for, and the Board of Examiners is enlarged by the addition of a registered electrical engineer or wireman nominated by the Electrical Wiremen's Registration Board.
Quarries Act.—The Quarries Act, 1944, makes better provision for the regulation of quarries by consolidating (with amendments) the Stone-quarries Act, 1910, and its amending Acts. The Act contains provisions as to Inspectors, and the appointments, qualification, and duties of quarry-managers. In all cases where three or more men are engaged in quarrying operations at any one time, or where explosives are being used, a qualified quarry-manager must be in charge. This is modified by section 67 of the Statutes Amendment Act, 1945, which provides that a permit to act in the capacity of a manager may be granted to a person who does not hold the necessary certificate in the case of any quarry in which no explosives are used and all the workings are above ground. Adequate rules are provided for the safety of workers, and the prevention of accidents.
SHIPPING AND SEAMEN LEGISLATION.—The first statute relating to this subject was passed in 1858, when the New Zealand Parliament extended the provisions of the Merchant Shipping Act passed by the British Parliament in 1854 to all British ships under the jurisdiction of New Zealand. This Act contained a series of regulations designed for the safety of passengers and crew, and for the amelioration of working-conditions on board ship. Further Merchant Shipping Acts Adoption Acts were passed in 1869, 1873, and 1874, while other Acts followed. A consolidating and amending Act was passed in 1903, which was consolidated with a few minor amendments in 1908, the present law being embodied in that Act.
The Shipping and Seamen Act, 1908, stated that the general superintendence of matters relating to merchant ships and seamen in New Zealand is with the Marine Department. Provision is also made for the registration of ships in New Zealand. It is stated, moreover, that the Act does not apply to ships belonging to His Majesty, nor to ships belonging to the Government of New Zealand. The collision and salvage sections do, however, apply to Government-owned ships. Other provisions relate to masters, officers, and seamen, although some of them do not apply to pleasure yachts, missionary ships, and fishing-boats.
In the following paragraphs a “home-trade ship” refers to a ship employed in trading between any ports of New Zealand, plying in any navigable waters therein, or which goes to sea and returns without proceeding further than fifty miles from the coastline. The outlying islands, annexed islands, and the Chatham Islands, mentioned in Section 1, for the purposes of the Act are deemed to be places outside New Zealand. A “foreign-going” ship accordingly covers any ship not included in the above category.
Hours of Work, Overtime, Holiday, and Wages Provisions.—Under the Shipping and Seamen Amendment Act, 1946, the normal hours of work of seamen, whether at sea or in port, are restricted to eight per day or forty per week. Seamen may be required to work hours in excess of these, but shall be recompensed for the excess (by payment at a higher rate or by the allowance of time off on pay) as may be prescribed by an award or industrial agreement under the Industrial Conciliation and Arbitration Act or by an agreement under the Labour Disputes Investigation Act. Where no such provision in an award or agreement applies, recompense will be made in such manner as may be prescribed by an order of the Court of Arbitration made on the application of a party concerned. “Hours of work” is defined as “time during which the seaman is required by the orders of a superior to do any work on account of the ship or the owner, or to be at the disposal of a superior outside the seaman's quarters.”
Time spent in certain specified work is excluded from the normal hours of work and is not subject to the special recompense for time worked in excess of normal hours. This includes work required for the safety of the ship when in immediate peril or to give assistance to other vessels or persons in immediate peril; musters, fire, lifeboat, and similar drills; normal and necessary work by officers to determine the position of the ship or to take meteorological observations; and work required for the normal relieving of watches.
Holiday provisions are negotiated in the construction of the award applicable, while the benefits of the Annual Holidays Act, 1944, operate as the minimum permissible limit.
The wage-rates on foreign-going ships trading between New Zealand ports are to equal the current rates of wages for such work paid in New Zealand at the same time. This does not apply to ships arriving from abroad, not trading in New Zealand further than to ship or discharge overseas passengers or cargo.
The clearances of foreign-going ships winch are required to pay the coastal rate of wages are to be withheld until such wages are paid.
Competence, Safety, Health, and Welfare Provisions.—Adequate provision is made to ensure competence on the part of the controlling officers of ships. Home-trade steamships of 60 tons register and upwards, and home-trade sailing-ships of 100 tons register, must carry certificated mates, and such ships of 100 tons register and upwards trading more than three hundred miles between terminal ports must have second mates. A foreign-going ship is required to carry two certificated mates. Foreign-going certificated mates are entitled to ship as mates in the home trade. It is an offence for a master or owner to engage a certificated officer for the purpose only of enabling the ship to clear and not for the purpose of making the voyage.
Provision is made for issuing certificates of competency to second mates of home-trade ships, and for recognizing as valid in New Zealand certificates of masters, mates, and engineers granted in any part of the British Commonwealth.
Any master or mate may, at any time, be required by the shipowner or the Minister of Marino to be examined in sight tests by the Government Examiners.
Further sections dealing with the safety of the ship require the adjustment of compasses to be carried out under regulations; and power is given to the Minister to define restricted trading limits for steamers and for vessels propelled by oil, gas, &c. The Governor-General in Council is empowered to make regulations as to the loading and stowage of ballast and the loading of grain cargo in bulk. It is an offence to ship wool, flax, tow, or skins in such a condition as to be liable to spontaneous combustion.
Since 1909 there has been a gradual extension of the type of ship required by law to be equipped with radio installations. The regulations now define the nature of the installations and service, and the number and grade of operators in different classes of vessels, and provide for inspection thereof.
The provisions regarding working-conditions on vessels require, inter alia, proper sanitary, hospital, and lavatory accommodation, including bathrooms, to be provided for the crew, together with an adequate supply of hot water for those employed in connection with the engines, while a prescribed minimum of space for the seamen's quarters is also laid down. Masters and officers who assault seamen on the high seas are liable to imprisonment or fine.
Intercolonial ships—i.e., those trading between New Zealand and Australia, or New Zealand and the central Pacific islands—in addition to home-trade ships are made liable to pay the wages, maintenance, and medical expenses of seamen taken ill in the service of the ship for the remainder of the agreement, not exceeding three months; and, in the case of intercolonial ships, if the agreement expires within one month from the commencement of the illness, payment is to be made for one month after the expiry. The illness which entitles a man to the benefits provided for is one which requires medical treatment for fourteen days.
An amendment made in 1948 to the Shipping and Seamen Act, 1946, prescribes fines not exceeding £100 in any case of the breach of any safety rules made expressly for these small craft not subject to the provisions of the principal Act relating to survey, &c.
Other Provisions.—Desertion is defined, and deserters who cannot be dealt with before their ship sails can afterwards be prosecuted by the owner or agent, and copies of the agreement and the entries in the log-book are to be accepted by Courts as evidence. Forfeited wages are to be paid into the Public Account.
It is unlawful for any person other than the owner, master, mate, or engineer of a ship, or a Superintendent of Mercantile Marine, to engage or supply seamen for ships, and only seamen who have a knowledge of the English language are allowed to ship.
The law as to inquiries into shipping casualties is on the lines of the Imperial Merchant Shipping Act, and provision is made for rehearings, for Magistrates to order a change of venue, and, by the 1948 amendment, for Superintendents of Mercantile Marine to hold a preliminary inquiry where a shipping casualty has occurred. Inquiries are not to be held in Police Courts unless other suitable buildings are not available; and in cases where there has been loss of life, but no damage to the ship, the inquiries may be held by Coroners.
The risks run and sacrifices made by the crows of vessels under war conditions were recognized by the Government in the passing of the War Pensions and Allowances (Mercantile Marine) Act, 1940. This Act, which made provision for the payment of pensions and allowances to members of the New Zealand mercantile marine and their dependants in respect of death, disablement, or detention as a result of the Second World War, is referred to in some detail in Section 25 of this Year-Book. Seamen also received special bonuses to compensate for the hazardous nature of their occupation during the war period.
For the purposes of the Small Farms Act, 1932–33, and amendments, the Rehabilitation Act, 1941, and the Servicemen's Settlement and Land Sales Act, 1943, any person who served during the Second World War in any British ship, which while he was serving therein was damaged or destroyed as the result of enemy action, or who served in any other British ship other than a home-trade ship, is included in the term “serviceman,” thus rendering such person eligible for rehabilitation benefits.
AGRICULTURAL WORKERS ACT.—The primary purpose of the Agricultural Workers Act, 1936, was to make better provision for the accommodation of agricultural workers, and to make special provisions for the remuneration of workers on dairy-farms and for the conditions of their employment. The Act also includes provision for the extension of these special provisions to other classes of agricultural workers, and, as indicated later, Orders in Council have been issued under this provision. Section 4 of the Statutes Amendment Act, 1945, provides that where proposals for the extension to any specified class of agricultural workers have been submitted as required by the principal Act, and the parties are unable to agree, the matters in dispute may be referred to the Court of Arbitration for a recommendation to the Minister. The administration of the Act is in the hands of the Labour Department, which also administered the Agricultural Labourers' Accommodation Act, 1908 (repealed by the present Act).
Another important measure dealing with farm workers is the Share-milking Agreements Act, 1937, which defined the respective responsibilities of employers and share-milkers in farm-management and control of stock, and prescribed the minimum percentages of returns to share-milkers. The Act contains provision for terms and conditions to be altered by Order in Council, and the latest agreement is contained in the Share-milking Agreements Order 1946, which came into operation on 4th September, 1946.
Orders in Council extending the operation of the provisions of the Act to other classes of farm workers have been issued from time to time—orchard workers as from 1st February, 1937; workers on farms or stations used for the commercial production of wool, meat, or grain (including seed), whether exclusively or together with any other purpose, as from 1st May, 1937; agricultural workers in market gardens, nurseries, &c. in the Wellington, Nelson, Canterbury, Otago and Southland, and Northern Industrial Districts as from various dates between 22nd April, 1938, and 29th May, 1939; and agricultural workers employed in the tobacco industry, as from 1st October, 1941. The orders do not apply to workers covered by awards or agreements under the Industrial Conciliation and Arbitration Act.
Hours of Work and Overtime.—In the case of orchard workers the maximum hours that may be worked without payment at overtime rates are eighty per fortnight from, the 1st June to the end of September, and eighty-eight per fortnight from the beginning of October to the 31st May. These are to be worked from Monday to noon Saturday except in necessitous cases and in the picking of stone-fruit. In the shorter period the maximum hours to be worked at ordinary rates are not to exceed eight daily, and in the longer period ten hours per clay. Overtime rates are payable in respect of hours worked outside the limits mentioned.
The ordinary hours of work for those employed in market gardens, nurseries, &c., are not to exceed forty-four in any one week and are to be worked within the five and half days, Monday to noon Saturday inclusive. In addition, no worker is to be employed for more than five hours continuously without an interval of three-quarters of an hour for a meal. Time worked beyond the limits quoted are to be paid for at overtime rates.
Agricultural workers employed in the tobacco industry during the months of May to December work at ordinary rates for eight hours daily from Monday to Friday, with a maximum of forty hours a week. Those employed in the field section during the remaining months may be worked an additional eight hours per week. Otherwise, employment is given remuneration at overtime rates. A three-quarters of an hour interval is allowed for a meal in the case of shed workers and an hour for those in the field section.
Holiday Provisions.—Every agricultural worker who is employed on a dairy-farm for not less than four weeks continuously is to be allowed a holiday on full pay plus an amount not less than one-half the lodging-allowance rate. The duration of the holiday is to be not less than seven days in the aggregate for every twelve weeks of employment, and a proportionate period for every broken period of employment. If a regular weekly half-holiday commencing at noon is allowed, a holiday of fourteen days a year (or proportionate duration for a lessor period of employment) will be regarded as sufficient compliance with the Act. The provisions of the Annual Holidays Act, 1944, apply generally to agricultural workers. The following specific conditions pertain, however, in respect of workers on farms and stations: Farm workers are entitled to seven statutory holidays; twelve working-days' annual leave on full pay for each twelve months' service, with a proportionate allowance for service of less than one year; and a half-day each week, amounting in the annual aggregate to not fewer than twenty-six half-days per annum; while the sum total of all three classes is not to be less than thirty-four days in each year. Orchard workers are allowed nine days, while workers in the tobacco industry (field section), and in market gardens are allowed eight days on full pay in addition to normal annual holidays.
Minimum Rates of Pay.—By the principal Act minimum weekly rates of pay were prescribed for workers on dairy-farms. The Act fixed the rates to operate from 1st October, 1936 (the date the Act came into force), until 31st July, 1937, and subsequently rates of pay were to be fixed by Orders in Council. In fixing such rates, the guaranteed prices paid in respect of primary produce were to be taken into account, but future rates were not to be lower than those fixed by the Act. The 1949 minimum rate is £6 6s. 6d. per week, increased by £1 5s. per week if the worker is not provided with board and lodging by the employer. This rate is taken to include allowance for work done at weekends and on holidays as part of the normal week's work. Minimum rates of pay for casual workers are contained in all the extension orders made so far. At present (November, 1949) the minimum rate for workers in casual employment and for permanent adult male workers on tobacco farms amounts to 3s. 5d. per hour, with lesser rates for male and female workers according to specified ages. In the case of workers on farms and stations, for whom the hours of work are not definitely laid down, the rates applicable are given in the Agricultural Workers (Farms and Stations) Extension Order 1949, the minimum rate for an adult male worker being £5 6s. 6d. per week, increased by £1 5s. per week if the worker is not provided with board and lodging by the employer, or by £1 per week if provided with only lodging or free house The minimum rate of wages for persons permanently employed in orchards and on market gardens are prescribed on the appropriate 1949 extension orders—e.g., £7 per week in the case of adult male workers in orchards, &c.
Restrictions on Employment.—No child under the age of fifteen years may be employed for hire on a dairy-farm or in market gardens, except for the harvesting of peas, beans, tomatoes, and soft fruits.
Health and Welfare Provisions.—The sections of the Act in relation to the accommodation of agricultural workers lay down definite requirements for the comfort of such workers, and Inspectors of Factories have power to inspect the accommodation and to require that improvements be made where necessary. In the various extension orders made under the authority of the principal Act, regulations are made dealing explicitly with questions of accommodation, sanitation, ventilation, &c. A number of orders also prohibit the lifting by females of excess weights.
Other Provisions.—Provision exists for the employment of “under-rate” workers with the consent of the Inspector of Factories. An amendment to the main Act made by a section in the Statutes Revision Act, 1936, permits the Inspector to apply the underrate provisions in respect both of money wages and of the amount (if any) payable in lieu of board and lodging in cases of female workers employed on farms. This amendment is of considerable importance since the employment of women workers for short periods of the day—notably at milking-time—is common on dairy-farms. Regulations governing the employment of “under-rate” workers are now included in all the extension orders now current.
INDUSTRIAL CONCILIATION AND ARBITRATION LEGISLATION.—Working-conditions given in the preceding pages were those contained in some specific statute or regulations made thereunder. However, for a largo proportion (approximately one-third) of the labour force the determining factor is the series of awards and agreements issued by the Court of Arbitration under the authority of the Industrial Conciliation and Arbitration Act, 1925, and amendments. The number of awards and agreements in force is quite large—575 on the 31st March, 1948—and as each is subject to individual negotiation by the unions or associations concerned during its construction, it is evident that possible variations preclude any systematic treatment herein of the provisions of such a large number.
The 1936 amendment to the principal Act stated that where it is deemed practicable the Court must fix the maximum hours of work per week (exclusive of overtime) at forty, while existing awards may be reviewed to this end on application. At present the provision of a forty-hour week is quite general. Included in the respective awards and agreements are provisions covering the hours of work, overtime, holidays, safety, health, and welfare. Rates of remuneration, subject particularly in the lower limits to the more widely applicable decisions covering the basic wage, general orders, standard-wage pronouncements, and minimum wages, are also decided and incorporated in the relevant award or agreement.
It will be realized from the above comments that for information on the actual working-conditions governing employment in any particular industrial activity, reference must be made to the award or awards applicable.
LEGISLATION GOVERNING WORKING-CONDITIONS IN THE VARIOUS BRANCHES OF THE GOVERNMENT SERVICE.—The principal measures which are concerned with the majority of persons employed either directly or indirectly by the State and which have reference to their working-conditions are given in the succeeding paragraphs.
The Public Service Act, 1912, as amended by the Public Service Amendment Act, 1946, provided for the control of the Public Service by a Commission as from the 1st November, 1946. Included in the functions of the Commission are the control of recruitment, maintenance of discipline and of a fair and efficient system of promotion, and also the regulation of a variety of points connected with personnel control—e.g., leave, hours of work, payment of allowances, &c.
The Government Service Tribunal Act, 1948, provided for the establishment of a tribunal with functions, in relation to the remuneration and conditions of service of employees, of making (a) principal and other orders, and (b) recommendations to the Prime Minister on any matters other than those contained in the principal orders.
The Government Railways Act, 1926, with its 1936 and 1944 amendments furnish the legislative framework for determination of the working-conditions of railway employees. The 1944 amendment established the Government Railways Industrial Tribunal, the principal functions of which are to prescribe scales of salaries and rates of wages; conditions in regard to hours of work, overtime, &c.; and terms and conditions in respect of leave of absence, railway travel concessions, &c.
Working-conditions for Post and Telegraph Department employees are determined by the administrating authority, the Postmaster-General and Minister of Telegraphs, with the Director-General as executive head. Power is vested in the Minister by virtue of the Post and Telegraph Act, 1928, while the 1944 amendment established a Post and Telegraph Staff Tribunal whose function it is to make recommendations to the Minister on such matters as may be referred to it by the Minister, the Director-General, or the Post and Telegraph Employees' Association and Officers' Guild.
Other legislative enactments which apply to the relevant sections of General Government employees are as follows: Members of the Police Force are governed by the Police Force Act, 1947, which consolidated and amended the 1913 Act of the same title and its amendments. The three lighting Services are controlled by the Defence Act, 1909, the Naval Defence Act, 1913, the Army Board Act, 1937, and the Air Force Act, 1937, together with their amending Acts.
The Education Act, 1914, and later amendments provide the legislative background authorizing, either by regulation or through the agency of Education Boards, the determination of the conditions of employment, pay, leave of absence, &c., for the members of the teaching profession.
In 1948 the Hospitals Amendment Act was passed which altered the title of the principal Act by omitting the words “and Charitable Institutions.” In consequence, the provisions relating to working-conditions of Hospital Board employees such as nurses, &c., will be found in the Hospitals Act, 1926, and its amendments, while the Hospital Employment Regulations 1948 bear directly on these matters.
Before concluding this subsection, reference must be made to two further groups of workers. The first of these consists of public-works employees, while the other comprises those persons coming within the scope of the Waterfront Industry Emergency Regulations 1946.
The Minister of Works in a statement of public-works policy laid before Parliament in 1936 outlined the Government's policy in relation to public-works employees. An agreement was drawn updating from the 1st June, 1936, the main provisions of which were embodied in subsequent agreements, although subjected to amendment and revision from tune to time to meet changing conditions. With the termination of the latest agreement in March, 1949, the Government Service Tribunal, established under the 1948 Act of similar title, became the authority for determination of rates of remuneration and working conditions generally for public-works employees.
The Waterfront Industry Emergency Regulations 1946, as amended in 1948, established two bodies to provide for the more efficient control of waterside work. The superior of these two—viz., the Waterfront Industry Authority—is charged with deciding the conditions under which any persons may be employed for waterside work, the terms of any such employment, including remuneration, holidays, guaranteed minimum payment, &c., whereas the subordinate authority, known as the Waterfront Industry Commission, is more concerned with the day-to-day details of administration. In particular, the Commission may not issue or amend any order prescribing any conditions or terms of employment which are of general application except in accordance with a decision or direction from the Authority or as a result of a unanimous resolution of the Commission. Appeals from decisions or orders of the Commission are determined by the Authority.
WAGES AND WAGE-RATES—GENERAL.—The amounts of wage-rates generally have been influenced largely by the rates specified for individual industries and occupations in awards and industrial agreements registered under the Arbitration Act. As mentioned previously, certain classes of workers for many years had no legal protection in the matter of wage-rates; while, again, until the passing of the Shops and Offices Amendment Act, 1936, many classes of office workers were in a similar position.
More than one criterion has been employed in the derivation of minimum rates of pay. Changes in the cost of living have been taken into account at certain times; on some occasions family considerations have entered into the determination; while the size of the working population covered by the minimum-rate provisions differs appreciably according to the particular variant of minimum rate or wage considered.
For the convenience of the reader the essential differences between the various expressions of the minimum wage-rates are here summarized. The basic wage (a defined amount) was intended to enable a man to maintain a wife and three children in a reasonable standard of comfort. As prescribed by the Industrial Conciliation and Arbitration Court in a general order in 1936, the basic wage became a minimum wage for all workers governed by awards. Standard rates or standard wage pronouncements prescribe basic rates (not amounts) for different grades of labour—e.g., skilled, semiskilled, or unskilled workers—for use as general principles governing the construction of award rates. There is no automatic application to awards, each being amended individually on application, or on the Court's own motion, or on a fresh award being made. General orders, on the other hand, have the effect of amending all awards and ruling rates simultaneously as from the date, specified in the order. The Minimum Wage Act, 1945, prescribes minimum amounts of wages for adult males and females, but these differ from the basic wage, which in effect they have superseded, in that no reference is made to the maintenance of any defined standard in the former. An important feature of the 1945 minimum-wage legislation is the much wider section of the working population to which its provisions relate. The minimum wages specified therein apply whether an award exists or not, and also notwithstanding anything contained in any award.
Against the background of these general remarks it is now intended to survey each of the various forms of minimum wage-rates.
Basic Wage.—The New Zealand Arbitration Court functioned for many years before the question of a basic wage was specifically dealt with by the Court. (It is of interest at this point to mention that a basic wage was brought into operation by the Federal Arbitration Court in Australia in 1907.)
The Industrial Conciliation and Arbitration Amendment Act, 1936, inter alia, requires the Arbitration Court to fix basic wages for adult male and female workers. Orders of the Court made to this end may be amended at not Jess than six-monthly intervals by a subsequent general order. The basic wage for adult male workers is required to be fixed at a weekly sum which will, in the opinion of the Court, be sufficient to maintain a man, wife, and three children in a fair and reasonable standard of comfort. A general order fixing basic wages for adult male and female workers was issued by the Arbitration Court on 2nd November, 1936. The weekly amounts were fixed at £3 16s. for adult male workers and at £1 16s. for adult female workers. The basic wage applies (as an absolute minimum) to all workers twenty-one years of age and over (excepting casual workers and those working under apprenticeship contracts) the conditions of whose employment are fixed by any award or industrial agreement. The basic wage, still nominally in force, although in effect superseded by the minimum wage, has not up to the present time (November, 1949) come up for review by the Court.
Minimum Wage.—The Minimum Wage Act, 1945, as stated earlier, makes provision for a minimum wage for all workers of twenty-one years of age and upwards with certain minor exceptions, notwithstanding anything to the contrary contained in any enactment, award, industrial agreement, or contract of service. A contrast may here be drawn between the procedure adopted in the case of the minimum wage with that pertaining in regard to the basic wage or standard rates of wages. The former is directly stated in legislation, while the latter appear through the medium of the Arbitration Court.
The Minimum Wage Act may be amended from time to time as fresh pronouncements of standard rates are made if it is desired to preserve a balance between minimum wages and standard rates. In this reference it will be noted that the minimum wage for males is set at a rate which is lower than the standard rate for unskilled labour.
The Act came into force on 1st April, 1946. Since that date the Minimum Wage Amendment Acts 1947 and 1949 have been passed, the prescribed minima to operate from 1st September, 1949, being as follows, while those for the earlier periods are also shown.
| Category. | In Force from 1st April, 1946, to 30th November, 1947. | In Force from 1st December, 1947, to 31st August, 1949. | In Force from 1st September, 1949, Onwards. | ||||||
|---|---|---|---|---|---|---|---|---|---|
| Males— | |||||||||
| £ | s. | d. | £ | s. | d. | £ | s. | d. | |
| Paid by hour or by piecework | 0 | 2 | 9 | 0 | 3 | 0 | 0 | 3 | 3 |
| Paid by day | 1 | 2 | 0 | 1 | 4 | 0 | 1 | 6 | 0 |
| Otherwise (per week) | 5 | 5 | 0 | 5 | 15 | 0 | 6 | 5 | 0 |
| Females— | |||||||||
| Paid by hour or by piecework | 0 | 1 | 8 | 0 | 1 | 11 | 0 | 2 | 2 |
| Paid by day | 0 | 13 | 4 | 0 | 15 | 4 | 0 | 17 | 4 |
| Otherwise (per week) | 3 | 3 | 0 | 3 | 13 | 0 | 4 | 3 | 0 |
Standard Rates of Wages.—Under the War Legislation and Statute Law Amendment Act, 1918, the Court was required to review on application existing awards and industrial agreements, taking into consideration, inter alia, changes in the cost of living. The Court in April, 1919, made a pronouncement fixing, in effect, standard rates of wages for skilled, semi-skilled, and unskilled workers. No definite family unit was stated as the basis on which these standard rates were calculated, the minimum pre-war award rates for unskilled labour, with appropriate adjustment, being apparently used as a base. A cost-of-living bonus, varied at half-yearly intervals in sympathy with movements in the cost of living; was added to these standard rates. In September, 1925, a further pronouncement was made by the Court, standard minimum rates being fixed as follows:—
| Per Hour. | ||
|---|---|---|
| s. | d. | |
| Skilled workers | 2 | 3 |
| Semi-skilled workers | 1 | 11 to |
| 2 | 1½ | |
| Unskilled workers | 1 | 10 |
The legislation by which the Court was empowered to make general orders having expired, the now rates—which represented an increase on those operating before—were brought into operation as individual awards expired. As in the 1919 pronouncement, no definite family unit was taken as the basis of assessment of the standard rates, which were, in general, stated to be somewhat in excess of 60 per cent. above the rates ruling in 1914.
No further pronouncements directly relevant to the subject were made until 1931. The Finance Act of that year empowered the Arbitration Court to amend, by general order, awards or industrial agreements with respect to rates of remuneration. Rates of remuneration under awards or industrial agreements were reduced by 10 per cent. as from 1st June, 1931, with certain minor exceptions.
Full or partial restoration of this cut was effected in the case of several individual awards made in 1934 and 1935, while complete restoration was effected in respect of all awards by a section in the Finance Act, 1936. This Act went further: it required the restoration as from 1st July, 1936, of all cuts in wages and salaries imposed during the depression period, whether the workers concerned were working under an Arbitration Court award or not.
In September, 1937, the Arbitration Court made a pronouncement on standard wages. The following minimum rates were set out in the Court's pronouncement:—
| Per Hour. | ||
|---|---|---|
| s. | d. | |
| Skilled workers | 2 | 9 |
| Semi-skilled workers | 2 | 5 to |
| 2 | 7½ | |
| Unskilled workers | 2 | 4 |
In March, 1945, the Court of Arbitration made a further pronouncement specifying standard rates of wages in accordance with the provisions of the June, 1945, amendment to the Economic Stabilization Emergency Regulations 1942. These rates were as follows:—
| Per Hour. | ||
|---|---|---|
| s. | d. | |
| Skilled workers | 3 | 0½ |
| Semi-skilled workers | 2 | 8½ to |
| 2 | 11 | |
| Unskilled workers | 2 | 7½ |
The 1945 rates were net rates, for the full minimum wage-rates would have to take into account in addition the provisions of the two general orders, effective from the 12th August, 1940, and 7th April, 1942, respectively, issued by the Court under the Rates of Wages Emergency Regulations 1940. (The first of these orders awarded a 5-per-cent. increase in all rates of remuneration in awards, industrial agreements, &c. while the second authorized a further 5-per-cent. increase subject to certain limitations.)
An application made pursuant to Regulations 39B and 39C of the Economic Stabilization Emergency Regulations 1942 for a pronouncement specifying standard rates of wages resulted in new standard rates being set out to apply from 1st October, 1947. In this case full minimum rates of wages were prescribed, thus eliminating references, to the application of the general orders. The standard rates from 1st October, 1947, were as follows:—
| Per Hour. | ||
|---|---|---|
| s. | d. | |
| Skilled workers | 3 | 7 |
| Semi-skilled workers | 3 | 2½ to |
| 3 | 5¼ | |
| Unskilled workers | 3 | 1½ |
In February, 1949, two applications for a new standard-wage pronouncement were laid before the Court of Arbitration. The occasion was unique, in that one of the applications was supported by the New Zealand Federation of Labour and the other supported by the New Zealand Employers' Federation. Both were made under Regulation 39B of the Economic Stabilization Emergency Regulations 1942. Before any steps had been taken for the hearing of the applications, a further amendment in February, 1949, was made to the Economic Stabilization Emergency Regulations 1942. This amendment redefined the considerations which the Court was to take into account in making a pronouncement on standard rates and also provided that the new amendment was to apply to every application under the principal regulations that was pending at the time of issue of the amendment. There were other provisions, the effects of which have also been incorporated in the following article on stabilization (refer page 672).
The Court, subsequent to the hearing, made a pronouncement on standard rates of wages on the 12th April, 1949, as given briefly below. It also provided that any consequential amendments to awards, &c., were to date from the 1st June, 1949.
| Per Hour. | ||
|---|---|---|
| Adult male workers— | s. | d. |
| Skilled workers | 3 | 11 |
| Semi-skilled workers | 3 | 6 to |
| 3 | 8¾ | |
| Unskilled workers | 3 | 5 |
It is noted that the margin between the standard rate for unskilled workers and that for skilled workers has been increased from 5 ½d. per hour to 6d. per hour. The reasons given for this increase may be of interest.
Over a number of years the effective margin of the artisan in terms of purchasing-power has been steadily declining, while efforts have been made simultaneously to increase the skilled-labour force. Measures have been or are being taken to revitalize the apprenticeship system and improve the training of tradesmen, including the proposed inauguration of more comprehensive and exacting trade examinations. In these circumstances, it was thought that an improvement in the flat margin for skill should be granted.
In the amendment of awards and industrial agreements as a result of the 1949 pronouncement, the rates for adult female workers are to be increased in general by such an amount as will bring them to a level approximately 10s. per week above the rates operating from the 1st October, 1947. Rates for junior workers of both sexes are to be adjusted proportionately.
A standard rate pronouncement is not itself a general wage order and has therefore no operative effect. It is merely an indication of the rates of wages up to which the rates prescribed for skilled, semi-skilled, and unskilled workers in a certain number of awards and industrial agreements are likely to be brought by means of individual amendments. They do not, of course, affect those variations in wage-rates prescribed in the different awards, &c., which are due to variations in skill required and in working-conditions generally in different industries or occupations.
Standard rates of wages can be regarded as serving two purposes. The first is to servo as general principles to which the Court will have reference in the implementation or amendment of existing award rates. The second is that they, in effect, serve as general standard minima for casual labour. They are not necessarily applicable when employment is regular throughout the year.
Award Rates.—Under section 99 of the Industrial Conciliation and Arbitration Act, 1925, the Court is empowered to fix minimum rates of pay in individual awards. The nature of award rates is generally understood, and as the rates may and do vary as between awards there is no necessity to further elaborate here.
General Orders.—The Arbitration Court had power under the Rates of Wages Emergency Regulations 1940 to make general orders amending all rates prescribed in awards as from the dates specified in the orders. Two such orders were made increasing wages as from 12th August, 1940, and from 7th April, 1942 respectively. As stated above, the effect of these orders was taken into account in the 1947 standard wages pronouncement. An amendment made in March, 1949, to the Economic Stabilization Emergency Regulations 1942 (which, incidentally, continue in force under the Economic Stabilization Act, 1948) revoked the Rates of Wages Emergency Regulations 1940. General orders may, however, still be made under the Economic Stabilization Emergency Regulations 1942. This aspect is more fully treated later in the remarks covering stabilization of rates of wages.
Special Provisions Covering Wages of Certain Groups of Workers.—Certain groups of workers have their wages fixed by special authorities. Minimum rates for agricultural workers are prescribed by the Agricultural Workers Act, 1936, and the various Extension Orders made pursuant to section 20 of that Act. Rates of remuneration for waterside work are now fixed by the Waterfront Industry Authority, constituted under the 1948 amendment to the Waterfront Industry Emergency Regulations 1946. Determination of wages in coal-mines lies within the scope of the Coal-mines Council, established under the Coal-mines Council Emergency Regulations 1940. Rates of pay for workmen engaged on public-works construction were formerly found in the public works workers' agreements between the Minister of Works and the New Zealand Workers' Union and renewed or revised from time to time, the latest of which terminated on 31st March, 1949. Since that date the rates have been determined by the Government Service Tribunal and issued in the form of principal and other orders by that Tribunal.
Salaries and wages in the railways are, by the Government Railways Amendment Act, 1944, to be prescribed by the Government Railways Industrial Tribunal. The legislative authority covering rates of remuneration for employees of the Post and Telegraph Department is contained in the Post and Telegraph Act, 1928, and the 1933 amendment, while certain questions may be referred to the Post and Telegraph Staff Tribunal, established by the 1944 amendment to the principal Act.
Public servants in the Professional and Clerical Divisions were paid according to rates prescribed under regulations authorized by section 19 of the Appropriation Act, 1920, and those in the General Division according to scales determined by the Public Service Commission (vide Public Service Act, 1912, section 22). In 1948, however, the Government Service Tribunal Act was passed vesting the Tribunal with powers of making principal and other orders in relation to remuneration.
Pay and allowances for the Armed Services are prescribed in regulations under the Defence Act, 1909, the Naval Defence Act, 1913, and the Air Force Act, 1937, respectively. Salary and wage rates for Hospital Board employees are covered by the Hospitals Act, 1926, and the Hospital Employment Regulations 1948. Two other groups of employees may be also mentioned, members of the Police Force coming under the Police Force Act, 1947, and finally members of the teaching profession, whose rates of remuneration are generally determined by authority of the Education Act, 1914, and amendments.
An interesting innovation made by the Arbitration Court in 1928 was the award of that year whereby the wages of shearers and other wool-shed hands were fixed at a rate fluctuating with the movement of wool prices as determined by the Government Statistician's index number for export prices of wool. The system did not operate between 1931 and 1933, workers and employers being unable to agree as to rates, though both parties expressed approval of the principle. The award of 1933 contained provision for the resumption of the sliding-scale system. Commencing with the award for the 1948–49 season, a variation was made in the method of calculating the rates of pay for shearers and other wool-shed hands. The new procedure is that rates shall be adjusted proportionately with the movements of an index number to be prepared by the Government Statistician based on average prices realized at New Zealand sales for greasy wool (calculated for June years).
In referring to the general question of wage-rates it is relevant to draw attention to the supplementary income which is provided by several of the benefits available under the Social Security Act, while the War Pensions Act is of significance also in this connection (see Section 25).
STABILIZATION.—Stabilization as an explicitly stated object of policy came to the foreground early in the Second World War. It had long been realized that in wartime the normal supply or flow of goods would be restricted, particularly so in the case of imports, but also in some degree in the field of local production. This factor, reinforced by others such as the progressive withdrawal of elements of the labour force for service with the Armed Forces, changes in the extent and character of industrial activity and in the labour force generally, and the necessity of financing a costly war, would inevitably exert an upward pressure on the wage and price structures of the country. It was equally necessary to limit or confine upward movements in these structures in so far as this procedure could be made effective or practicable. Measures to this effect were authorized, evolving into a fairly comprehensive system of regulations covering the general fields of price control, wages stabilization, rent stabilization, direction of man-power, subsidies, &c. After the close of war some of these measures were dispensed with, while others were retained and relieved of their emergency status by further legislation.
While wages stabilization is the main theme of the following paragraphs, other aspects of stabilization will be found elsewhere in this issue (rents, page 691; prices, Section 37; and subsidies, Section 18A).
The initial legislative step in the control of wages and remuneration was the gazetting of the Rates of Wages Emergency Regulations 1940, which with its amendments were revoked by the 1949 amendment to the Economic Stabilization Emergency Regulations 1942. The 1940 regulations provided that the Arbitration Court from time to time, on application, might amend by general order the provisions of all awards and industrial agreements, but that in making such a general order the Court was to take into account certain economic conditions. As these qualifications were largely superseded by the Economic Stabilization Emergency Regulations issued in 1942, it will be more profitable to proceed to a survey of the latter.
In regard to the Economic Stabilization Emergency Regulations 1942, as subsequently amended up to and including the amendment of February, 1949, the main features of importance may be summarized as follows. Basic rates of remuneration were defined as the actual rates as at the 15th December, 1942, or as determined by the Wages Commissioner or Commissioners (formerly Conciliation Commissioner) appointed under the regulations. These basic rates were not to be exceeded except with the approval of the Wages Commissioner, which might be granted wholly or in part on the following grounds:—
That the person was employed in any additional position, employment, duties, or work, or in work involving additional risk to life or health.
That an increase was necessary for removal of anomalies.
That when the basic rate was determined, remuneration was being paid at an abnormally low rate or no remuneration was being paid.
That an increase was necessary to restore or preserve a proper relationship with rates of remuneration of other classes of workers or with any standard pronouncement made by the Court of Arbitration for the purposes of these regulations. Appeals against the decisions of the Wages Commissioner could be made to the Court of Arbitration.
An important regulation provides that the Court, in exercising its functions in relation to the making or amendment of awards or apprenticeship orders, or in approving any industrial agreement, shall have regard to the general purpose of these regulations and also to restoring or preserving a proper relationship with other rates of remuneration. A similar provision covers applications for revised tool and special clothing allowances, &c. In determining award rates, a clause now deleted provided that no regard should be made to fluctuations in the cost of living. This factor was and still is subsumed under those conditions to be taken into account in pronouncements of standard rates or in the making of general orders.
Again, subject to the provisions of the Economic Stabilization Emergency Regulations 1942, the Court is empowered from time to time of its own motion or on application of any industrial union or association to make pronouncements specifying standard rates of wages for skilled, semi-skilled, and unskilled workers. On application the Court may also amend, by general order, those provisions of all awards and industrial agreements for the time being in force which determine the rates of remuneration. Any change specified in such a general order is also applicable to any case wherein the actual rate of remuneration exceeds that to which the worker is entitled under an award. Provision now exists for a general order to be made on an application for a standard-wage pronouncement, and vice versa. In either case no further pronouncements or general orders may be made within one year of the date on which a previous pronouncement has been made or a general order has taken effect.
To assist in the furtherance of the objects of stabilization generally, the regulations lay down that the Court shall take into consideration the following conditions in making any pronouncement or general order:—
The general purpose of these regulations.
Any rise or fall, in retail prices as indicated by any index published by the Government Statistician.
The economic conditions affecting finance, trade, and industry in New Zealand.
Relative movements in the incomes of different sections of the community.
All other considerations that the Court deems relevant.
The condition (b) quoted above was substituted by the February, 1949, amendment for the earlier one requiring an index of prices known as the Wartime Price Index to be prepared and published quarterly for the purposes of the regulations.
Most of the features outlined are similarly applicable to apprenticeship orders, except where these are already covered by reason of the fact that rates of remuneration of apprentices may in some cases be fixed as proportions of the rates fixed from time to time for journeymen.
In pursuance of the policy of stabilization, and probably indicative of its importance in the post-war era, the passing of the Economic Stabilization Act, 1948, is indeed of significance. The general purpose of this Act (as of former Emergency Regulations also) is to promote the economic stability of New Zealand. In addition to the administration of the Act, the Minister of Industries and Commerce is charged with the general function of doing what is considered necessary for the general purpose of this Act, and in particular for the stabilization, control, and adjustment of prices of goods and services, rents, other costs, and rates of wages, salaries, and other incomes. Authority for the appointment of a Director of Stabilization was also given. The Act further provided for the establishment of the Economic Stabilization Commission with the principal function of making recommendations, after inquiry and investigation, in relation to the economic stabilization of New Zealand and the functions of the Minister under the Act. In effect, the Director and the Commission authorized under Emergency Regulations were placed on a permanent basis.
By Order in Council, stabilization regulations may be made from time to time for giving full effect to the provisions and administration of the Act, including regulations for all or any of the following purposes:—
Regulating the marketing of any goods or classes of goods for the general purpose of the Act.
Equalizing, as far as possible, the net returns received or payable in respect of any goods or classes of goods, and for that purpose imposing levies on any goods or classes of goods.
Recovery of subsidies paid out of public moneys in respect of any goods or classes of goods.
Providing for the appointment of officers and committees and other bodies, and denning their functions and powers.
From the point of view of this section it is of interest to note that certain of the Economic Stabilization Emergency Regulations 1942 (as summarized earlier) are continued in force as stabilization regulations. The necessary powers are also given enabling information required for the purposes of the Act or any stabilization regulation to be obtained, and also for the prescription of offences and penalties.
PROTECTION OF WAGES.—Workers' wages were first safeguarded by the Truck Act of 1891, which ensured them the payment of their wages in full in coin of the realm. This was followed by a series of Acts—the Contractors' and Workmen's Lien Act, 1892, the Workmen's Wages Act, 1893, the Threshing-machine Owners' Lien Act, 1895, the Wages Attachment Act, 1895, and the Wages Protection Act, 1899–all aimed at making the payment of wages more certain and secure, and at limiting creditors' rights to attach future earnings.
This code was consolidated into the Wages Protection and Contractors' Liens Act of 1908, which operated until it was superseded by the Wages Protection and Contractors' Liens Act, 1939. The re-enactment is substantially the same as the 1908 Act except for the omission of several sections relating solely to wages protection, which were largely duplicated by the sections dealing with workers' liens.
Some of the more salient provisions of the Act, as it now operates, are set out below.
In the absence of any written agreement to the contrary, wages of manual workers are to be paid at intervals of not more than a week, and of other workers at intervals of not more than a month. The attachment of workers' wages for debt is prohibited except in the case of any surplus over £2 a week or when specific provision is made in any other Act for attachments on a lower minimum. Exceptions are made by the Industrial Conciliation and Arbitration Act, 1925; the Child Welfare Act, 1925; and the Destitute Persons Act, 1910. The Coal-mines Amendment Act, 1941, provides for deduction from wages, with the written consent of the employee, of sums towards repayment of principal or payment of interest, &c., in respect of advances by the mine-owner to the worker for the purpose of acquiring a home.
The Act prohibits payment of wages being made in goods (truck) or in any other way than in money or by approved cheque, and also prohibits any stipulation as to how the wages-money is to be expended. The truck provisions do not, however, apply where the employer supplies house accommodation, board and lodging, fuel, medical assistance, materials, tools, and the like required for the work, nor to seamen or farm workers.
A contractor, subcontractor, and any worker is entitled to obtain liens on the lands or chattels of the employer upon giving due notice, and the employer must then retain in his hands sufficient of the contract-moneys to satisfy and guarantee payment of the claimant's dues, but the total amount recoverable may not exceed the amount duo under the contract. In addition, the Act (as amended by section 59 of the Statutes Amendment Act, 1940) directs that the employer or contractor (where a subcontract is entered into) shall retain in his possession, whether or not he has received notice of any lien or charge, one-quarter of so much of the contract price as has for the time being become immediately payable, until thirty-one days have elapsed after the completion of the contract.
In the matter of priority of liens and charges the order is as follows : (1) The claims of workers for wages not exceeding three months' wages and not exceeding £50; (2) the claims of workers for wages not included in the foregoing, and the claims of subcontractors; and (3) the claims of contractors. If notice of a lien or charge is not made before the completion of the contract or within thirty days of the completion, the claim will lose priority as against other claims of its own class, but will come before claims of the succeeding class.
All attachments or assignments granted by any employer or contractor are void against the charges or hens of subcontractors or workers for money duo under the contract, except in the case of mortgages on land registered before the liens, in that case the mortgage has priority over the lien. If the mortgagee is a party to the contract, or if the mortgage secures any money that is advanced after notice of the lien has been given to the mortgagee, the lien has priority over the mortgage. If, in the case of the death or bankruptcy of a person entitled to a lien or charge, the debt secured by the lien or charge passes to any other person, the right to the lien or charge passes with it.
No deduction from workers' wages may be made for purposes of insurance against compensation for accident.
Liens to be imposed as security for miners' wages or earnings are dealt with under the Mining Act, 1926, and the Coal-mines Act, 1925.
Wages are further safeguarded by certain sections of the Bankruptcy Act, which give priority of payment for wages or salaries of workers (with certain limitations as to amount and period) in preference to certain other debts, and since the passing of the Bankruptcy Amendment Act, 1927, wages take precedence over rents. Similarly, under the Companies Act wages (with the same limitations as under the Bankruptcy Act) are a first claim on the assets of a company being wound up. Under the Workers' Compensation Amendment Act, 1936, compensation payments rank with wages as a first charge on the assets of a bankrupt.
Various individual labour laws contain provisions with the special intent of protecting the payment of wages of the workers to whom such legislation applies.
LABOUR DISPUTES.—Trade-unionists were early protected by the Trade-unions Act of 1878 from prosecution for conspiracy by reason merely that the purposes of the trade-unions were in restraint of trade. They were further protected by the Conspiracy Law Amendment Act of 1894, which laid down that any act by a union in furtherance of a trade dispute should not be deemed unlawful so as to render such persons liable to criminal prosecution for conspiracy, if such act committed by one person would not be deemed unlawful. This removed a very serious handicap under which unionists up to that time had suffered.
Industrial Conciliation and Arbitration Act.—The original Industrial Conciliation and Arbitration Act was placed on the New Zealand statute-book in 1894. Its object was to encourage the formation of industrial unions and associations, and to facilitate the settlement of industrial disputes by conciliation and arbitration. It provided for the registration as “industrial unions” of societies of workers or employers in the various industrial districts, and as “industrial associations” of any council or other body representing any number of such unions; for the making of industrial agreements pursuant to the Act, and the filing of such in the Supreme Court; for the formation of industrial districts, the election of Boards of Conciliation, and the setting-up of a Court of Arbitration.
In 1898 an amendment was passed empowering the Court in its awards to prescribe minimum rates of wages, with special provision for a lower rate being paid in the case of workers unable to earn the prescribed minimum. An important amendment passed in 1903 prohibited any employer, worker, union of workers, or union of employers from taking proceedings to defeat any of the provisions of an award during its currency. It forbade an employer to dismiss any employee merely because he happened to be entitled to the benefit of an award or merely because be was a member of a union. Under the present law dismissal, or prejudicial alteration of position, of an employee who within the preceding twelve months had acted in any of certain specified capacities, or was entitled to or had claimed certain benefits, renders the employer liable to a penalty unless he proves that the dismissal or alteration of position was due to some other reason. An industrial union of workers may take action for a penalty in this connection.
In 1905 an amendment was passed providing for the punishment by fine of any worker or employer, bound by an award or industrial agreement affecting an industry, who takes part in a strike or lockout in that industry. In 1908 an additional penalty was added in the case of certain “public utility” industries, such as gas-manufacture, the supply of milk or meat, tramway services, &c. By this amendment the constitution of Conciliation Boards was altered to provide for the appointment of four Conciliation Commissioners, whose duty it is to call together representatives of employers and employees in the event of a dispute arising, and to sit with these representatives as a Conciliation Council to endeavour to effect a settlement. The decision of the Council is not binding, but disputes must be referred to a Council before they may be referred to the Arbitration Court.
A further amendment in 1911 empowered the Court to make an industrial agreement into an award, provided such agreement does not conflict with an existing award or is not contrary to the public interest. It also provided that recommendations of Conciliation Councils become in effect industrial agreements if none of the parties to a dispute disagrees with such recommendations.
Section 18 of the War Legislation and Statute Law Amendment Act, 1918, empowered the Court to amend during the term of an award or industrial agreement the provisions of the award or agreement, in so far as they related to rates of remuneration or hours of employment. In varying the conditions, the Court was to take into account the movement in the cost of living and any changes in the special conditions affecting the industry concerned. This measure, which was designed to meet the abnormal conditions caused by the war of 1914–18, remained in force till 1923.
The law as it existed in 1925 was consolidated in that year, previous consolidations having been effected in 1900, 1905, and 1908.
In 1927 a Bill was introduced into Parliament to exclude from the jurisdiction of the. Arbitration Court the farming industry and certain associated industries. The Bill met with considerable opposition and was not proceeded with. An amending Act was, however, passed providing that no award relating to any agricultural, pastoral, or dairying operations, or to any other work effected on a farm, or to the manufacture or production of butter, cheese, or other milk products, should be made before 1st September, 1928. The provisions of the amendment of 1927 were re-enacted in 1928, another amendment extending for twelve months the period during which awards in the industries mentioned were not to be made, and also providing that no awards in these industries were to be altered or amended in the meantime without the consent of all parties concerned. The provisions referred to lapsed on 1st September, 1929.
A second amendment passed in 1928 permits of industrial agreements and (with the consent of the parties concerned) awards being made for or extended to a term of five years. This amendment also allows of an award or industrial agreement, in lieu of prescribing minimum rates of wages, prescribing a method or basis for calculating minimum rates.
As a result of depression conditions the Court was empowered by the Finance Act, 1931, to amend by general order awards or industrial agreements in respect of rates of wages, though power was given for the exclusion of any class or section of workers from the operation of a general order. In the next year compulsory arbitration was abolished; conciliation was still compulsory, but disputes could be referred to the Court only by mutual consent. Provision was also made for the review of existing awards.
The Industrial Conciliation and Arbitration Amendment Act, 1936, restored the full jurisdiction of the Arbitration Court, and also made several other amendments, the more important of which are summarized below:—
The Court is required to fix basic wages for adult male workers based on the needs of a man, wife, and three children, and also a basic wage for adult female workers. It must make general orders prescribing the basic wages, which will apply to workers in any industry to which any award or industrial agreement relates. (See previous subsection—Basic Wage, &c.)
Restrictions are imposed on the formation of new unions in districts where a union in respect of the same industry exists; in fact, no such new union may be registered unless with the concurrence of the Minister of Labour.
Provision is made for the registration of New Zealand unions covering all existing workers or employers, if all or the majority of district unions concur. In cases where no district union exists a New Zealand union may be formed, subject to compliance with the requirements of the principal Act in respect of registration of unions.
All workers who are subject to any award or industrial agreement registered under the Act must become members of a union. (This applies also in respect of awards or agreements in force at the time of the passing of the amending Act.) It is not lawful for an employer to employ or continue in employment, in any position or employment subject to an award or industrial agreement, any adult person who is not a member. (An amendment passed in 1943 provides that, where a person who is obliged to become a member of a union fails to do so, he is deemed to have committed a breach of the award or industrial agreement to which his employment is subject, and is liable to a penalty not exceeding £5 in respect of every such breach.) Non-members may, however, be employed in cases where union membership is limited and there are no union members available.
The Court may confer on union officials the right of entry on employers' premises.
Where it is deemed practicable the Court must fix the maximum hours of work per week (exclusive of overtime) at forty; while the Court may review existing awards to this end on application. The hours in such a review are to be fixed at forty, unless in the opinion of the Court such hours are impracticable. No reduction hi weekly pay is to be made in consequence of reduced hours—i.e., the hourly rates are to be increased proportionately. The provisions stated in this paragraph came into operation on 1st September, 1936.
By the principal Act the maximum weekly union subscription had been fixed at 1s. This limitation was removed.
The 1947 amendment to the principal Act provides for the appointment of Deputy Judges of the Court of Arbitration. There is a section in the amendment dealing with the question of appeals to the Court from any decision of a Deputy Judge.
The administration of the Industrial Conciliation and Arbitration Act is in the hands of the Labour and Employment Department, and Inspectors of Factories are charged with the duty of seeing that the provisions of awards and agreements are carried out. The following paragraphs indicate the procedure followed in regard to industrial disputes under the Act:—
An industrial union (or association of unions) of workers registered under the Act may cite a union or association of unions of employers, or an employer, or a number of employers, before a Council of Conciliation for the hearing of an industrial dispute before a Commissioner and assessors appointed from either side.
An industrial union (or association of unions) of employers registered under the Act, or an individual employer, or employers, may cite a union of workers in a similar manner. The workers may compel any of their employers to come under the Act; but the employers cannot compel their workers to come under it, unless the latter have registered as an industrial union or association thereunder; registration is voluntary.
If a settlement of a dispute is arrived at by the parties in the course of an inquiry held before a Council of Conciliation, the terms of the settlement are set forth as an industrial agreement. Applications for exemption from the terms of the agreement must be made within one month after it has been filed. The Court is empowered to grant or to refuse such applications. Where an agreement applies to the employers employing the majority of workers in the industry to which it relates, the agreement may be made binding on all employers, whether parties or not.
Every such agreement must be executed on behalf of the parties by the assessors representing the parties. If settlement cannot be arrived at before the Conciliation Council the matter is referred to the Court. The Council may at the same time submit a recommendation for the settlement of the dispute; whereupon the parties are notified of such recommendation, and if acceptable to them the recommendation is made an industrial agreement; failing agreement the matter is referred to the Court.
If a dispute comes before the Court, argument is heard upon the matters in debate, and the Court then makes its award, which becomes binding upon the employers specified in the award, upon any employers commencing business in the district subsequently to the date of the award, and upon all persons working for such employers. In all cases where an industrial agreement or accepted recommendation or award is filed, it becomes binding on all the parties. When an award or industrial agreement has been filed, a strike or lockout becomes unlawful. Section 21 of the Statutes Amendment Act, 1948, makes it mandatory for the Court to make the wages provisions retrospective to the date fixed for the first hearing of the Conciliation Council unless the Court considers that in the particular circumstances a later date should be fixed.
Section 35 of the Statutes Amendment Act, 1944, stipulates that no industrial dispute shall be referred for settlement to a Council of Conciliation by an industrial union (or association of unions) unless the proposed reference has been approved by resolution by the committee of management of the union or of each of the unions concerned, as the case may be.
The Statutes Amendment Act, 1946 (sections 34–37), stipulates that where an application has been made to a Conciliation Commissioner for the hearing of an industrial dispute by a Council of Conciliation, the claims made by the applicant may be amended or withdrawn at any time, whether before or during the hearing. Where any industrial dispute has been referred to the Court for settlement or any application has been made to the Court under the principal Act, the reference or application may be withdrawn by the applicants at any time, whether before or during the hearing.
An important amendment to the Act was passed during the 1939 session. This empowers the Minister of Labour, if he is satisfied that any discontinuance of employment brought about wholly or partly by any industrial union of employers or of workers has caused, or is likely to cause, serious loss or inconvenience, to cancel the registration of the union concerned or to cancel any award or industrial agreement so far as it relates to it. The 1947 amendment provides for the taking of a secret ballot by every industrial union of workers or of employers on questions relating to strikes and lockouts.
Section 22 of the Statutes Amendment Act, 1948, extends the time within which action may be commenced for recovery of arrears of wages payable under an award or industrial agreement from twelve months to two years.
Reference has been made in an earlier stage of this Section to the stabilization of wages, &c. In this connection the Economic Stabilization Emergency Regulations 1942 stipulated that no variation was to be made in the minimum rates of remuneration or the principal conditions of employment applying to any award, industrial agreement, or apprenticeship order except such adjustments of anomalies as the Court approves having regard to the general purpose of the regulations. In February, 1945, amending regulations were issued giving the Court power to amend existing awards and agreements so as to adjust disparities in wages-levels. For the present situation in regard to the powers of the Court under these regulations the reader is referred to the paragraph on stabilization on page 673.
Labour Disputes Investigation Act.—Machinery for dealing with all disputes to which the Industrial Conciliation and Arbitration Act does not relate is contained in the Labour Disputes Investigation Act, 1913.
Under this Act, if a dispute concerning wages or other conditions of employment arises between a society (or societies) of workers, whether registered or not, that is not bound by any award or industrial agreement, and its employers, the society must, before it may strike, give to the Minister of Labour formal notice of the dispute, setting forth the names of the parties to the dispute and the claims made by the society. The Minister then refers the dispute to a Conciliation Commissioner to call a conference, or to a “Labour Disputes Committee” for investigation and recommendation. Such a committee consists of from one to three members chosen from each side, with an independent chairman. In the event of no settlement being arrived at, a secret ballot is taken by the Registrar of Industrial Unions among the members of the society as to whether, in the case of no recommendation having been made, a strike should eventuate; or, in the case of a recommendation having been made, as to whether the recommendation should be adopted. Seven days' notice must be given to the employers should a strike be decided upon.
Similar provisions apply with reference to the filing of a dispute and to a lockout by the employers.
In the event of an agreement being arrived at it may be filed with the Clerk of Awards. It is then enforceable in the same manner as an industrial agreement under the Industrial Conciliation and Arbitration Act.
By this Act the principle of settlement of industrial disputes by conciliation and arbitration is extended to workers outside the scope of the Arbitration Court, so that definite restrictions on the right to strike or to lockout exist over the whole field of industry in New Zealand. The powers under this Act are not, of course, as far-reaching as those under the Industrial Conciliation and Arbitration Act, its main object being that workers or employers should take time for consideration of the points at issue and not precipitate themselves into industrial strife.
Strike and Lockout Emergency Regulations 1939.—Provision also exists under the Strike and Lockout Emergency Regulations 1939 and amendments for the setting-up of Emergency Disputes Committees or tribunals with the powers of Commissions of Inquiry under the 1908 Act. The Minister of Labour may by notice to the appropriate tribunal require that it decide any dispute which in the opinion of the Minister is likely to result in a strike or lock-out or has resulted in a strike or lockout. The fact of notice by the Minister shall be conclusive evidence that a dispute, as described above, had arisen.
If the dispute arises in an industry which is covered by an award of the Court of Arbitration or an industrial agreement in which provision exists for the setting-up of a dispute committee, this will become the appropriate tribunal. However, if the Minister considers it undesirable for any reason that the dispute should be referred to such a disputes committee, or if the committee reports that it has been unable to reach a final decision, then the Minister may refer the dispute to an Emergency Dispute Committee sot up under these regulations.
The decision of the appropriate tribunal in respect of any dispute or of any matter connected with it will be final and binding on all parties directly concerned with the dispute. No such decision shall be questioned on the grounds that it is inconsistent with the provisions of an award or industrial agreement, notwithstanding anything to the contrary in section 151 of the Industrial Conciliation and Arbitration Act, 1925.
The regulations prescribe offences and penalties, the latter being enforceable in the same manner as if they were penalties under the Industrial Conciliation and Arbitration Act, 1925.
APPRENTICESHIP LEGISLATION.—The statutory regulation of apprenticeship goes back as far as 1865, when a Masters and Apprentices Act was passed which provided for indentures of apprenticeship binding children above twelve years of age to farmers, tradesmen, and artisans for a term not exceeding five years. Every indenture was to contain a covenant on the part of the master that he would provide the apprentice with suitable food, clothing, and bedding, give particular attention to his morals, and pay certain sums into the savings-bank for him after his apprenticeship had exceeded two years. The Act was thus obviously framed with a view to providing for the welfare of orphans and destitute children.
Another Act was passed in 1875 which made provision for the apprenticing of boys to Government Departments for a term of not less than three nor more than seven years. The Departments made available in the first instance were the Government Printing Office and the Railway Workshops. Wages were to be paid, no provision was made for board, and the Act was clearly intended primarily to meet the case of boys whose parents were alive.
The Master and Apprentice Act of 1908 consolidated the above two Acts into an Act of two Parts, but made no essential change.
A Master and Apprentice Amendment Act was passed in 1920, with a view to facilitating the apprenticing of immigrant or New Zealand boys between the ages of fifteen and nineteen to the occupation of farming until they were twenty years of age. Part I of the principal Act of 1908 (dealing with the relations between master and apprentice) was to apply with some slight modifications.
Until 1923 no legislation was passed to make special provision for the apprentice who worked by the day for the private employer.* His case was regulated by the laws of England in so far as they were applicable to New Zealand, and by such provisions in regard to apprenticeship as the Arbitration Court might have included in its awards. The Apprentices Act of 1923 was a landmark, in so far as it provided an elaborate administrative machinery to safeguard the interests of apprentices.
The Act stated that from time to time the Arbitration Court should make orders regulating the wages, hours, and conditions of apprenticeship, the proportion of apprentices to journeymen that might be employed in any industry, the period of apprenticeship, and the minimum age of apprentices. It might also require employers to engage such number of apprentices as the Court might consider necessary to ensure an adequate supply of journeymen in the interests of the industry, order the transfer of an apprentice from one employer to another, order the attendance of any apprentice at a technical school or training establishment, prohibit any employer from employing an apprentice, enter the premises where an apprentice was employed in order to inquire into his welfare, and exercise a number of other powers. The Act applied to male apprentices only. Provision was made for the modification of apprenticeship conditions in the case of adults or of persons who were already partly trained. It also made provision for registration of every contract of apprenticeship and for the setting up of Apprenticeship Committees.
The Secretary for Labour was to act as Registrar of Apprentices, and any Inspector of Factories might be appointed a District Registrar of Apprentices. Apart from registering contracts, these Registrars were to have the duty of ensuring that the Act was complied with, and they were to take proceedings for every breach of an apprenticeship contract. They were also given considerable scope for developing a system of vocational guidance, in so far as they were given powers to demand reports from the head teacher of any school as to the attainments and qualities of any child.
*The Shipping and Seamen Act of 1903 included some sections regulating the apprenticing of boys to ships.
An amending Act of 1927 cancelled the power of the Court of Arbitration to determine the proportion of apprentices to journeymen that might be employed in any industry, while the amending Act of 1930 made some improvements in administration, dealt with the case of the unsatisfactory apprentice, and brought in further protective regulations. If an apprentice proved unsatisfactory, the employer might apply to the appropriate Apprenticeship Committee for the right to discharge him, The employer or the apprentice might appeal against this decision to a Stipendiary Magistrate. The interests of the apprentice were protected by regulations safeguarding his wages in the event of the employer's bankruptcy. The employer was to keep a wages and time book, and a copy of the apprenticeship order was to be affixed in a place where it might be easily read by the apprentice.
The economic depression had an unfavourable effect on the apprenticeship system. The Finance Act of 1931 conferred power on the Arbitration Court to vary the rates of remuneration payable under apprenticeship orders (though such a variation was not to apply to any contract of apprenticeship already in force). The Finance Act of 1932 stated that either party to an apprenticeship contract might apply to a Stipendiary Magistrate to have the contract of apprenticeship amended, cancelled, or suspended. If the Magistrate was satisfied that, owing to the economic conditions affecting the industry concerned or the particular business of the employer, the employer could not reasonably be expected to carry out the terms of his contract, he might cancel the contract.
The economic depression and its attendant legislation had thus considerably lessened the security and remuneration of the apprentice. The Finance Act of 1936 restored the rates of remuneration to the 1931 level and repealed the provision of the 1932 Finance Act in respect of the cancellation of apprenticeship contracts. Section 7 of the Statutes Amendment Act of the same year made partial provision for those whose contracts had been cancelled, in so far as it stated that any person of eighteen years or over might, with the approval of the Minister of Labour, enter into a special contract of apprenticeship with an employer.
The Second World War raised two now problems : that of the apprentice absent on military service for short periods, and the need for increasing production in certain industries, irrespective of whether they were carried on in private or public undertakings. Hence the Suspension of Apprenticeship Emergency Regulations, issued in 1939 and subsequently renewed, which provided that if apprentices were away on military service and returned within a period of six months, the period of absence should be regarded as time served under the apprenticeship contract. Section 52 of the Statutes Amendment Act of 1941 permitted the temporary transfer of an apprentice from Government to private employment and vice versa subject to the consent of the apprentice and his parent.
The Suspension of Apprenticeship Emergency Regulations 1914 revoked the previous suspension orders, and made provision for apprenticeships which were deemed to be suspended as a result of military service, to be revived within a period of six months of the termination of such service. Where a contract of apprenticeship was revived in accordance with these regulations, the term of the contract was to continue for the unexpired period as at the date of suspension, or for three years, whichever was the lesser period. The apprentice could, however, be credited with any period of his military service during which he performed trade work of the same class, or of a class related to that to which he was apprenticed.
Other provisions dealt with the wages payable under these revived contracts, special reference being made to cases in which the apprentice had reached the age of twenty-one years or whose term of apprenticeship as proscribed by the contract had expired. Limitations contained in any Act, award, apprenticeship order, or agreement as to the age or number of apprentices, or the proportion of apprentices to journeymen, were deemed to have no application to such revived contracts.
The Apprentices Amendment Act, 1946, which came into force on 1st January, 1947, was the legislative consequence of the report of the Commission of Inquiry into apprenticeship and related matters set up in 1944. This Act made widespread changes in the traditional apprenticeship system of the country. These changes were incorporated in the Apprentices Act, 1948, which consolidated and amended the law dealing with apprentices. In the first place it made provision for the appointment of a Commissioner of Apprenticeship and of four District Commissioners, who were to take over the functions of the District Registrars of Apprentices under the original Act. In industries where there are organizations of employers and workers, these organizations may agree to set up New Zealand Apprenticeship Committees, which may be registered in the usual way. These New Zealand Committees, which operate in addition to the existing “local” Committees, have a number of functions, which, broadly, may be described as to supervise the flow of youths into the skilled trades, to apply to the Court of Arbitration for apprenticeship orders, to ensure proper training of apprentices and to consider whether it is practicable and desirable to introduce educational training during normal working-hours, and to consider the question of a practical test for each apprentice before the completion of his apprenticeship. The Act provided that certain powers of the Court of Arbitration in respect of apprentices may be delegated by it, partly to local Committees and partly to New Zealand Committees. From the date of the commencement of the Act no apprenticeship orders may be made in respect only of a specified locality, but must be made in respect of each industry or branch of industry for the whole of New Zealand.
In future apprenticeship orders the Court of Arbitration is empowered to apply the conditions of awards for the industry to apprentices, and to determine the wages of apprentices by reference to those of journeymen in the industry. The Court may, in an order, require an employer to pay to an apprentice wages for time taken during the day to attend a technical school, and may shorten the period of apprenticeship in the event of an apprentice obtaining a special qualification. On the making of a new order all contracts in force at the time are to be read subject to the new order and to be deemed modified by it. The hours of apprentices under eighteen years of age are limited to forty per week and eight per day, and, where shift-work is involved, between 7 a.m. and 6 p.m. These limits may be exceeded if an apprenticeship order provides for the working of overtime by apprentices under eighteen years of age. Regulations may be made providing for the payment to any apprentice who is obliged to live away from home of amounts by way of lodging-allowance. Such allowances are to be paid out of moneys appropriated by Parliament for the purpose.
The Court may also make apprenticeship orders in respect of females, and, in that event, the Act applies to such females.
An important provision contained in the amendment was that requiring the previous consent of the appropriate Committee before a contract of apprenticeship is entered into. The provision for apprenticeship of persons of eighteen years or over contained in section 7 of the Statutes Amendment Act, 1936, was repealed, and such apprenticeships may now be entered into subject to the approval of the Court of Arbitration, to which any proposed contract must be submitted, together with the recommendations of the District Commissioner or the local Committee. Where any employer is considered not to be able to provide adequate training, a local Committee or District Commissioner may transfer his apprentice to another employer who is willing and able to undertake the obligations of the original employer, notwithstanding that the second employer's proportion of apprentices to journeymen would thereby be exceeded. If in such a case no employer to whom the apprentice might be transferred can be found, the Court may, with the consent of the appropriate Minister, transfer him to a State Department.
In 1948 the opportunity was taken to re-enact the provisions of the Apprentices Act, 1923, and its amendments by the passing of a consolidating and amending measure entitled the Apprentices Act, 1948. More modern forms of words were employed in the new legislation, and the clauses were arranged in a more logical sequence. However, the principles of the existing legislation have not been altered although some slight amendments, which are described below, were made. The 1948 Act also repealed the Master and Apprentice Act, 1908, and the Apprentices Act, 1923.
In the 1948 legislation the term “industry” has been redefined so as to correspond with that given in the Industrial Conciliation and Arbitration Act, 1925.
A series of minor amendments covers the constitution of the Apprenticeship Committees. Where the Committee is appointed in respect of a group of industries it is to consist of four representatives of employers and four representatives of workers. Other clauses limit the term of office of members of Committees to three years, provide for a quorum and for the replacement of members who die or resign, and further authorizes a Committee to delegate its powers of inspection to two non-members of the Committee where it would be inconvenient for members to exercise those powers.
Additional provisions contained in the 1948 Act state that contracts of apprenticeship shall have no validity until consent is given in accordance with the Act; define procedure when an apprentice is transferred; amplify the law applicable when an apprentice loses his employment through the insolvency of his employer; afford a parent or guardian an opportunity of being heard when an application is made to discharge an apprentice; and provides for notice to be given to the appropriate Committee in the event of an appeal against the granting or refusal of leave to discharge an apprentice.
Moneys duo under a contract of apprenticeship may be recovered in the same manner as that provided in respect of recovery of wages in the Industrial Conciliation and Arbitration Act, 1925. The Apprentices Act further provides that proceedings for breaches of the Act may be taken by an Inspector of Factories.
TRADES CERTIFICATION.—The Trades Certification Act, 1948, provided for the establishment of the New Zealand Trades Certification Board, consisting of the following members:—
Three persons to be appointed on the recommendation of the Director of Education, one of the three to be appointed as Chairman of the Board on the Director's recommendation:
Two persons to be nominated by the New Zealand Employers' Federation and two by the New Zealand Federation of Labour:
Two persons to be nominated by the New Zealand Technical School Teachers' Association and one by the Technical Education Association:
The person for the time being holding the office of Commissioner of Apprenticeship:
Three other persons, one of whom is to be nominated by the New Zealand Electrical Wiremen's Registration Board, one by the New Zealand Motor Trade Certification Board, and one by the Plumbers' Board of New Zealand:
Additional members of whom one shall be nominated by each other authority which conducts examinations and issues certificates for the whole of New Zealand in connection with a particular trade or trades, and which the Board recommends should be represented on the Board for the time being.
The members of the Board, other than the Commissioner of Apprenticeship, are to be appointed by the Minister of Education for a term of three years. Provision is made for reappointments, removals from office, &c.
The functions of the Board are to make provision for the examination of persons practising or intending to practise any trade who desire from time to time to present themselves for examination, and, secondly, to grant or issue, either independently or in conjunction with any other examining body, diplomas or certificates to any such persons in recognition of proficiency in any trade, or in any art, science, or matter relating to any trade.
The Board may also (a) co-opt if necessary any person or persons for advice in connection with any trade; (b) make representations to the appropriate New Zealand Apprenticeship Committee in regard to the pro-requisite education for apprentices wishing to enter any industry, or in regard to other educational matters affecting apprentices; appoint, with approval of the Minister, Advisory or Technical Committees to advise the Board on such matters within the scope of its powers and functions as are referred to them by the Board, and appoint any person to be a member of such a Committee even if he is not a member of the Board; and, in addition, charge fees for entry for any examination.
Payments incurred for the expenses of the Board and for administration generally are paid from the proceeds from fees and otherwise, and where the amounts from such sources are insufficient the deficiency is to be met from the annual vote for the Education Department.
WORKERS' COMPENSATION.—Common-law rights of the worker in respect of compensation were early increased by the Employers Liability Act of 1882; while the Deaths by Accidents Compensation Act, 1908, gave a right of action which did not previously exist at common law to certain of the relatives of a person killed by a wrongful act.
The Law Reform Act of 1936 contained several provisions of particular relevance to the subject of workers' compensation. The Act, inter alia, created a charge on all insurance-moneys payable as indemnity for compensation, and made the charge apply immediately on the happening of the event giving rise to the claim. Similar provisions (now repealed) existed in the Workers' Compensation Act, 1922, but under that Act no charge was created unless the insured was insolvent or became bankrupt. The Workers' Compensation Amendment Act, 1943, made it obligatory on the part of an employer to insure against his liability under the principal Act unless he was able to satisfy the Compensation Court that he had adequate financial resources to meet all probable claims. Another provision of particular interest in the Law Reform Act, 1936 was the abolition of the defence of “common employment,” which defence depended on a rule that damages could not be recovered from an employer in respect of the negligence of a fellow-servant. A similar provision in the Workers' Compensation Act (but with a limit of £1,000 damages) was consequentially repealed.
The Contributory Negligence Act, 1947, is also of relevance to the question of workers' compensation. This Act provides for an apportionment of damages where a person suffering damage has himself been guilty of contributory negligence. Section 4 makes appropriate provisions in the case of claims by workers against employers. The Act was amended by section 4 of the Statutes Amendment Act, 1948, which removed any possible doubt by expressly stating that the principal Act was to bind the Crown.
The Workers' Compensation Act, 1922, with its amendments of 1922, 1926, 1936, 1933 (Statutes Amendment Act), 1943, 1944 (Statutes Amendment Act), 1945, 1947, 1948 (Statutes Amendment Act), and 1949, represents the existing law on workers' compensation—subject to the provisions briefly outlined in the preceding paragraph. The 1936 amendment, which came into force on 1st January, 1937, contained several important amendments to the previous legislation. The definition of “worker” was extended to include share-farmers and drivers of vehicles who receive a share in the takings as payment for their services, or who pay a fixed sum for the hire of the vehicle (other than under the terms of a hire-purchase agreement). While a share-farmer now comes within the provisions of the Act, he is still regarded as the employer in respect of persons employed by him. The 1945 amendment further extended the scope of the Act to include industrial life-assurance agents.
The 1936 amendment contains a provision whereby claims for compensation rank equally with wages in the distribution of the assets of a bankrupt.
“Worker,” for purposes of the Workers' Compensation Act, means any person who has entered into, or works under, a contract of service or apprenticeship with an employer, whether by way of manual labour, clerical work, or otherwise, and whether remunerated by wages, salary, or otherwise. Prior to the commencement of the amending Act of 1945, non-manual workers whose remuneration exceeded £400 per annum were not covered, but this disqualification has now been removed, and all workers (manual and non-manual) are now afforded the protection of the Act, irrespective of the amount of remuneration. The Act applies only to the employment of a worker under a contract of service or apprenticeship either in and for the purposes of any trade or business carried on by the employer, or in any of the following occupations, irrespective of whether or not carried on for purposes of the employer's trade: mining, quarrying, excavation, cutting of standing timber and scrub, clearing land, erection or demolition of buildings and other structures, manufacture and use of explosives, handling power machinery in motion, driving vehicles, domestic service (engagement for not less than three days), and any occupation in which a worker incurs a risk of falling any distance exceeding 12 ft., if the injury to, or death of, the worker results from such a fall. For purposes of this provision, an employer may have more than one trade or business. In general, persons working as independent contractors are not under contracts of service or apprenticeship, and are consequently not “workers.” But by way of exception, persons who have contracted to perform any work in a gold- or coal-mine, or to cut standing timber or scrub, or to clear land of stumps or logs, and who do not sublet the contract or employ labour (or who, if they do employ labour, actually perform part of the work themselves), though not “workers,” are yet covered by the Act.
The worker is not entitled to compensation unless he sustains by accident arising out of and in the course of his employment, and happening within New Zealand or on a New Zealand ship or aircraft, personal injury incapacitating him from carrying on his occupation. The Workers' Compensation Amendment Act, 1947 replacing largely similar provisions in the 1943 amendment, provides that, where an accident causing personal injury occurs while travelling to or from work by a means of transport provided by the employer primarily for the purpose of conveying workers in his employment, or expressly or impliedly authorized by him, such accident shall be deemed to arise out of and in the course of the employment. The Act also applies in cases where an employer has arranged with the worker or appropriate union for the transportation of the worker and has paid or is liable to pay for his fare or cost of carriage. No compensation is payable in respect of any accident as above defined which is attributable to the serious and wilful misconduct of the worker injured, unless the injury results in death or serious and permanent disablement. No compensation is payable in respect of the death of a worker following on, or incapacity resulting from or aggravated by, unreasonable refusal to submit to medical or surgical treatment.
Diseases are deemed to be personal injuries by accident if they arise within twelve months previous to the date of disablement and are due to the nature of the employment. If the worker contracts any disease in respect of which he would be entitled to a miner's benefit under the Social Security Act, 1938, he is not entitled to receive any compensation under the principal Act while receiving such benefit. Nor can a benefit be paid for any period during which the worker is receiving compensation, and no lump-sum compensation is to be paid for any incapacity caused by such diseases.
Generally speaking, the employer is the person liable to pay compensation; and for this purpose “employer” includes any body of persons, corporate or unincorporate, the Crown (with certain minor exceptions), and the representatives of a deceased employer. Where a person (the principal), in the course of and for the purposes of his trade or business, contracts with another (the contractor) for the execution by the latter of work undertaken by the former, a workman employed by the contractor on meeting with an accident may claim compensation from either the principal or the contractor, except in certain cases. If the principal pays, he may, however (with certain minor exceptions), recover the amount from the contractor. The 1943 amendment introduced the principle of compulsory insurance, all employers being required to insure against their liability in relation to workers' compensation under the Act. Exceptions may be made where the Court is satisfied that the employers have adequate financial resources to meet all probable claims and that their workers can be given indemnities as great as those provided by employers not so exempted. The principal is not liable unless the accident occurs on or about his land, premises or ship; or on or about land, premises, or ship on or in which the principal has contracted to do the work in connection with which the accident happens. Provision was made in the 1947 amendment for the principal Act to apply to any accident which happens to an airman employed on a New Zealand aircraft in any employment covered by this Act, whether the accident happens in New Zealand or elsewhere, or on board the aircraft or elsewhere. Where the injury for which compensation is payable has resulted under circumstances creating a legal liability in some person other than the employer to pay damages in respect thereof, the person by whom the compensation is paid or payable is entitled to indemnification by the person so liable.
The Workers' Compensation Amendment Act, 1947, is also of importance by virtue of its provisions relating to employers' indemnity. Under section 6 of the amendment, workers' compensation insurance became, with certain exceptions, a monopoly of the Branch of the State Fire Insurance Office known as the Government Accident Insurance Office. By the Act an automatic indemnity is provided for every employer who employs a worker or workers to whom the principal Act applies, while it also provides for the compulsory payment of premiums by employers. Other sections included in the amendment relate to accident prevention and the occupational training of seriously disabled workers. The 1949 amendment exempted the National Airways Corporation and the Linen Flax Corporation from the provisions of employers' indemnity, while Commonwealth shipping companies belonging to mutual protecting clubs may also be exempted.
The Workers' Compensation Amendment Acts of 1926, 1936, 1947, and 1949 amended the Act of 1922 in the direction of raising the limits of compensation. The compensation payable at present is as follows:—
In case of death: Reasonable expenses of medical or surgical attendance including first aid, and of funeral (maximum, £50), plus—
Where he leaves total dependants, a sum equal to 250 times his average weekly earnings, or the sum of £750, whichever is the larger, but not exceeding £1,750; or
Where he leaves partial dependants only, a sum reasonable and proportionate to the injury to those dependants, but not exceeding the sums specified in (a).
Where the amount of compensation payable in respect of death plus the sum of any weekly payments (or lump sum in lieu) paid by way of compensation for the accident prior to the death of the injured worker, exceeds £2,000, the excess is deducted from the amount payable in respect of death.
In case of injury : At the discretion of the Court, either—
During total incapacity, weekly payments equal to 75 per cent. of the worker's weekly earnings at the time of the accident, notwithstanding that he may not have actually worked or the employment may not have actually continued for a full week (maximum £6 per week; minimum £2); during partial incapacity, weekly payments amounting to 75 per cent. of the difference between the amount of the weekly earnings before the accident and the weekly amount which the worker is earning or able to earn in suitable employment or business after the accident, but not exceeding £6 per week; or
A lump sum equal to the present value at 3 per cent, per annum compound interest of the aggregate weekly payments which, in the opinion of the Court, would probably become payable to the worker under (a).
The aggregate amount of weekly payments is not to exceed £1,750. In the case of the temporary incapacity of an apprentice or a worker under twenty-one years of age, the weekly payment must not exceed an amount equal to a full week's earnings at the time of the accident.
Weekly payments of compensation may not be discontinued or diminished except in the following cases:—
Where the weekly payment is in respect of total disablement and the worker has actually returned to work:
By agreement with the worker:
With leave of the Compensation Court:
By judgment or order of a Court of competent jurisdiction.
If the employer wrongfully terminates or diminishes weekly compensation payments, he is liable to pay double compensation to the worker.
A sum not exceeding £1 is payable in respect of medical and surgical attendance and first aid to the worker in respect of his injury. In addition, amendments to the Act make provision for the transport of the injured worker to a hospital, medical practitioner, and/or place of residence, and also for the provision of or payment of expenses of transport, meals, or lodging up to a maximum of £25 where an injured worker is required to travel to and from another town in order to obtain necessary medical or surgical treatment. The 1947 amendment also states that the employer is liable to pay, in addition to any of the compensation moneys payable under the principal Act, the cost of an artificial limb, &c., which may become necessary or desirable.
No compensation is payable if incapacity lasts less than three days. In the case of certain injuries involving permanent disability (e.g., dismemberment or loss of use), compensation is assessed according to a special scheme representing a proportion (varying according to the nature of the dismemberment) of the compensation payable in the case of total incapacity. Compensation is also recoverable in respect of a period of illness resulting from such an injury, but any sum so received in excess of £250 is taken into account in estimating the compensation payable in accordance with this scheme. In the case of injury to workers whose earnings at the date of the accident are low by reason of their being at the time under twenty-one, or of their being apprenticed to a trade, &c., the amount of compensation in cases of permanent incapacity is based on the adult rates of pay. Section 69 of the Statutes Amendment Act, 1944, extended this provision to cover partly-trained workers over twenty-one years of age.
Proceedings under the Act in respect of compensation for injuries are not maintainable by a worker unless written notice of the accident has been given to the employer as soon as possible after its occurrence; though the Court has power to excuse failure, due to reasonable causes, to give that notice on the part of the person injured, or if it is clear that the absence of such notice has not prejudiced the employer's position. Except where the Court excuses delay resulting from mistake or other reasonable cause, proceedings must be taken within six months of the date of the accident or the date of the last payment of compensation in respect of injury, or the date of the death of the person injured, whichever is the later. Formerly such proceedings were taken in the Arbitration Court, but regulations issued on 1st March, 1940, under authority of section 70 of the Statutes Amendment Act, 1939, established a separate Court known as the Compensation Court for the hearing of workers' compensation cases. The new Court has all the powers inherent in a Court of record, and all references in the Workers' Compensation Act, 1922, or in the Workers' Compensation Rides 1939, to the Court of Arbitration are now deemed to be references to the Compensation Court. In certain cases proceedings are heard in a Magistrate's Court. The Court may accept, admit, and call for such evidence as in equity and in good conscience it thinks fit, irrespective of whether strictly legal evidence or not. Costs lie at the discretion of the Court. There is no' right of appeal, but for good cause, orders or agreements in respect of compensation may be reviewed and even set aside by the Court at any time.
The right of a dependant who survives a worker to receive compensation for the death of that worker survives the dependant; and compensation can be recovered by the representative of that dependant. In addition to redefinition of the terms “total dependants” and “partial dependants,” the 1947 amendment provided that dependency is to be determined as at the date of death of the worker. Section 47 of the Statutes Amendment Act, 1948, states that in assessing compensation no account is to be taken of any gain to dependants consequent on the death of a worker. It thus applies to claims for compensation under the Workers' Compensation Act, 1922, the same provisions as apply by virtue of section 7 of the Law Reform Act, 1936 in cases of claims for damages under the Deaths by Accident Compensation Act, 1908.
EMPLOYMENT AND UNEMPLOYMENT LEGISLATION.—Prior to the depression period of the early “thirties,” there was little permanent effective legislation to cope with the problem of unemployment. In 1895 a Servants Registry Act provided for the inspection of servants registry-offices and regulated the fees charged therein. The Labour Department was founded in 1891 and attempted, particularly through its Employment Bureaux, to cope with the problem. In 1928 a Committee was set up to examine this matter, which was becoming increasingly more serious; and, following on the presentation of its report, an Unemployment Act was placed on the statute-book during the 1930 session of Parliament.
An Unemployment Board was established to assist in the administration of the Act. The Board, as reconstituted in 1931, consisted of the Minister charged with the administration of the Act (Chairman), the Commissioner of Unemployment, and three members appointed by the Governor-General. The main functions of the Board as set out in the Act were: (1) To make arrangements with employers or prospective employers for the employment of unemployed persons; (2) to take such steps in accordance with the provisions of the Act as it considered necessary to promote the growth of primary and secondary industries in New Zealand, so that an increasing number of workers would be required for the efficient carrying-on of such industries; (3) to make recommendations for the payment of sustenance allowances out of the Unemployment Fund.
The Act of 1930 authorized the payment of sustenance allowances out of the Unemployment Fund, but the activities of the Board were directed towards the placing of men in employment in preference to the payment of sustenance, the funds being mainly devoted to the subsidizing (or refunding in full) of wages of men for whom work was provided under various relief schemes. A 1934 amendment to the Act, inter alia, repealed a subsection of the original Act, which, in effect, had limited to a maximum of thirteen weeks the unbroken period during which sustenance might be paid to any one individual.
The Immigration Restriction Amendment Act of 1931, which empowered the Governor-General to make regulations restricting the number of immigrants entering the country, aimed, inter alia, at preventing an unwanted inflow increasing the number of those unemployed. Its operation was extended in 1933 and 1935, and it expired on 31st December, 1936.
The Employment Promotion Act, 1936, replaced and repealed the Unemployment Act, 1930, and other legislation relating to unemployment. The Unemployment Board was abolished, the now Act being administered by the Department of Labour. An Employment Promotion Fund was established (deemed to be the same fund as the Unemployment Fund established under the Unemployment Act, 1930), the revenue of the Fund being derived from the employment tax, fees, and penalties under the Act, and any other moneys appropriated by Parliament for the purpose. The main purposes for which the moneys in the Fund were to be utilized were defined as follows:—
The development of primary and secondary industries in New Zealand, and the establishment of new industries, so that an increasing number of workers would be required for the efficient carrying-on of such industries:
The making of arrangements with employers or prospective employers for the employment of persons who were out of employment:
The assistance, in accordance with the provisions of the Act, of persons who were out of employment or were otherwise in need of assistance.
By the Social Security Act, 1938, provision was made for unemployment benefits, superseding the former sustenance payments, to become available as from 1st April, 1939. The Employment Promotion Fund was abolished as from 30th September, 1939, and the moneys transferred to the Social Security Fund. The amounts of, and qualifications for, benefits will be found on page 461 of this Year-Book.
Although the Employment Promotion Act was repealed by the Social Security Act, the functions of the Employment Division of the Labour Department continued to include the promotion of work and industry for the absorption of surplus labour, and the placing in close contact of employers with employees through the medium of the State Placement Service. The Employment Division was placed under the control of the National Service Department (a wartime creation) but the Employment Act, 1945, created out of the National Service Department a Department of State known as the National Employment Service, the principal function of which is broadly defined as the “promotion and maintenance of full employment at all times.” In 1947 the National Employment Service and the Department of Labour were amalgamated to form the Department of Labour and Employment. Further reference in regard to its activities is included in Section 41, Employment and Unemployment.
HOUSING LEGISLATION.—The first legal provision in connection with housing was contained in the Factories Act of 1891, which gave Inspectors of Factories power to inspect accommodation provided for shearers and to demand improvements where necessary. More effective powers in this connection were contained in the Shearers' Accommodation Act, 1898. The Agricultural Labourers' Accommodation Act of 1908 extended this legislation and provided for the inspection of housing of agricultural labourers and flax-mill workers. In 1912 the sawmill worker was also included. The Agricultural Workers Act, 1936, and regulations issued thereunder, laid down detailed specifications as to what constituted satisfactory accommodation and superseded the Act of 1908. Statutory regulations issued in 1937 prescribed further details, and stated that the regulations were to apply to the accommodation of persons employed in agricultural, pastoral, horticultural, flax-milling, and sawmilling work.
The Family Homes Protection Act, 1895, consolidated in the Family Protection Act, 1908, made it possible, on certain conditions, to register any piece of land not exceeding £1,500 in value as a family home, so that the estate and interest of the settler and his family in it continue absolute and unaffected by any bankruptcy assignment, judgment, &c.
The advances to settlers legislation of 1894 provided for State advances on mortgage to the owners of farming lands and in 1899 this provision was extended to urban lands. Many of these advances would, no doubt, be used for building purposes, but no direct effort in the matter of providing housing-accommodation was made until 1905. In that year a Workers' Dwelling Act was passed authorizing the Minister of Labour to erect dwellings to be let to bona fide workers at a rental of 5 per cent. per annum of the capital value of such dwellings; and, in the following year, a system of advances to workers for the purpose of acquiring homes was instituted. By an amendment passed in 1922, workers could borrow for this purpose up to 95 per cent. of the value of their security. To cope with the post-war demobilization, the Housing Act of 1919 provided for the erection of dwellings not only by the State, but also by local authorities, employers, associations of public servants, and public-utility societies, the State advancing the money. The administration of this Act was later transferred to the State Advances Department, now the State Advances Corporation. Local authorities are also empowered to obtain special loans from the State Advances Corporation to erect workers' dwellings for lotting, and are granted certain concessions in carrying out this activity by the Municipal Corporations Act, 1933. There is much incidental legislation, as in the Coal-mines Act and the Government Railways Act, where provision is made for the suitable housing of employees.
Housing regulations are contained in the Municipal Corporations Act, where definite measurements are laid down to prevent overcrowding, and provision is made for the appointment of Inspectors to reduce fire-risk and other dangers. Similarly the Health Act of 1920, which replaced the Public Health Act of 1908, provides for medical inspection and for sanitation minima; an owner may be ordered to cleanse or demolish his building, or to close it till certain alterations are made. The Town Planning Acts of 1926 and 1929 aimed to develop and reconstruct areas in such a way as to promote their healthfulness and convenience.
In 1935, as a preliminary to measures for remedying the existing position in regard to housing, a Housing Survey Act was passed, instructing local authorities to ascertain as far as possible the extent to which the existing housing accommodation in their respective districts fell short of reasonable requirements. At the same time a Maori Housing Act empowered the Board of Maori Affairs to make advances to Maoris for the purchase, erection, or repair of dwellings. A section of the Maori Housing Amendment Act, 1938, established a special fund to provide houses for those Maoris unable to furnish the security or to make the payments which the Board would ordinarily require. In addition to the provision of housing under the Maori Housing Act, dwellings for Maoris are provided in the ordinary course of the Maori land development schemes. Particulars of the numbers of houses erected, &c., are included in Subsection C of Section 17.
Further provision with respect to the improvement of housing conditions is contained in the Housing Improvement Act, 1945. The Act authorizes the making of regulations prescribing the standard of fitness of houses, and gives local authorities certain powers of enforcing the regulations or of assisting owners to comply with them. In default by the local authority the Minister of Works is given power to act, or he may act under agreement with the local authority. Provision is also made for regulations requiring local authorities to keep a register of houses and to acquire land where a house is unfit for habitation or an area is below the minimum standard. The Act also deals with the reclamation of overcrowded areas, and gives power to local authorities with respect to the proclamation of reclamation areas and the re-subdivision and improvement of such areas.
The provision of housing facilities for workers is a very important part of the policy of the Government. Apart from the facilities for the building of homes provided for in the State Advances Corporation Act (see Section 24D), the Government launched in March, 1937, a comprehensive housing plan whereby the legislative machinery provided in the Housing Act, 1919, is being used to build homes to be let to workers at a reasonable rental. Provision is contained in the Finance Act (No. 3), 1943, for the tenant of a State rental house to make arrangements whereby, in consideration of special payments, he becomes entitled to remain the occupier of the dwelling rent free or at a reduced rental on attaining a specified age. The arrangement may also permit his widow to become the occupier on the same terms, or entitle him to nominate any of his children to become the tenant after his death. An account of the Government's housing programme under the Housing Act, and its progress to date, is included in Section 23, Building and Construction. Further provision of housing facilities in rural localities is contained in the Rural Housing Act, 1939, which empowers local authorities to advance money to a farmer to enable him to provide a dwelling for his own use or for the use of any farm worker principally employed by him.
The Local Authorities (Temporary Housing) Emergency Regulations 1944 give power to local authorities to establish transit housing centres for the purpose of providing temporary accommodation for persons who are awaiting the provision of permanent housing accommodation.
TENANCY AND RENTS LEGISLATION.—Certain sections of the War Legislation Amendment Act of 1916 dealt with house-rents, the maximum rent being fixed at 8 per cent. per annum of the capital value of the dwelling. Material alterations in the law were made by the Rent Restriction Act, 1926. Rent-restriction provisions were kept in force by annual continuing statutes up to 31st October, 1936, when the earlier legislation was superseded by the Fair Rents Act, 1936.
The Distress and Replevin Amendment Act, 1936, protects personal effects, furniture, &c., to the value of £50 from seizure under a distress order for rent. The pre-existing legislation on this subject did not protect such effects from seizure.
Provisions for statutory reductions in rent and interest payments were contained in the National Expenditure Adjustment Act of 1932, continued by the Finance Act, 1934, and made permanent in 1936; while Courts were given power to reduce rents and mortgage interest by the mortgage-relief legislation of the depression period, consolidated in the Mortgagors and Tenants Relief Act, 1932. The Fair Rents Act, 1936, replacing various measures referred to above, is briefly described in the following paragraphs.
The Fair Rents Act, 1936, made temporary provision for the restriction of increases in the rent of certain classes of dwellinghouses, and for the determination of fair rents in respect of such houses. The Act applied, generally speaking, to dwellings actually let at the time the Act was passed (June, 1936) or let at any time between 27th November, 1935, and the date of the passing of the Act. It did not apply to other dwellings or to any dwelling let at a rent exceeding £156 per annum. The rent of a dwelling coming within the scope of the Act could not be raised beyond the “basic rent” which was defined as the rent payable on 1st May, 1936; or, in the case of dwellings not let on that date, the rent last payable before that date. On application of either the landlord or the tenant, a Stipendiary Magistrate was empowered to declare a fair rent in respect of any dwelling to which the Act applied, having regard to various specified conditions—e.g., the relative circumstances of landlord and tenant. The fair rent was not to exceed the basic rent or the rent (if any) payable on 27th November, 1935. The grounds for the recovery of possession were limited by the Act, while restrictions were imposed on the right of the landlord to distrain. The Act was to remain in force until 30th September, 1937, but its operation was extended from time to time, and in fact its provisions remained in force until superseded by those of the Tenancy Act, 1948.
The 1936 Act did not apply to fats and apartment-houses, but an amendment passed in 1939 extended its provisions to cover buildings constructed for letting as more than two separate flats or apartments, all flats or apartments not originally constructed for letting separately, and flats and apartments where parts of premises were shared. The 1939 amendment also made provision for the making of regulations for the purpose of regulating charges in respect of residential accommodation with attendance or services.
The Fair Rents Amendment Act, 1942, extended the application of the principal Act to all premises let as dwellinghouses, including those where part only was used as such. The “basic rent” was now defined as follows:—
With reference to a dwellinghouse let as such on 1st September, 1942, the rent payable on that date:
With reference to a dwellinghouse that was not let on that date, the rent that was last payable.
The Act made it an offence to refuse to let a dwelling on the grounds that the applicant had children. It also provided certain safeguards in respect of members of the Armed Forces in their capacity as tenants or landlords.
The application of the Fair Rents Act was further extended by section 27 of the Statutes Amendment Act, 1946, to include premises occupied for residential purposes by two or more persons severally. In such cases the total of the several amounts payable was deemed to be the rent of the premises. Section 28 of the same Act also extended the provision of the Fair Rents Act to cover premises where meals or food were provided by the landlord, unless the value of the meals or food formed a substantial portion of the rent.
As previously stated, the Fair Rents Act applied only to premises let as dwelling-houses, but the Economic Stabilization Emergency Regulations 1942 provided for the stabilization of all other rents, whether on account of land or buildings. The basic rent under these regulations had the same meaning as in the case of the Fair Rents Act, and rents that might be charged were restricted accordingly. On the application of the landlord or tenant of any property the Court might make an order determining the fair rent of that property.
The basic rent or fair rent (if any) of any land established under the Fair Rents Act or the Economic Stabilization Emergency Regulations is taken into account in determining the basic rent of such land for the purposes of the Servicemen's Settlement and Land Sales Act, 1943.
The Fair Rents Amendment Act, 1947, included the following provisions. The basic rent for a dwellinghouse was not to be affected by variations in tenancies as to furniture, &c., or by subletting; tenancy registers were to be kept by the landlord; no fine or premium was to be chargeable for tenancy or renewal or transfer, while provision was made for recovery of possession of a dwellinghouse for a serviceman who vacated it to become a serviceman, and also modified the absolute protection of a serviceman tenant.
A further part of the 1947 amendment was concerned with the letting of unoccupied houses. It empowered local authorities to serve notice to the owners requiring them to let such houses. Conditions were laid down governing appeals against notices given by local authorities to the above effect. On default of action by the owner, the house could be let by the State Advances Corporation, the rent received to be paid to the owner, less commission and expenses. Power was given to enter and inspect any premises for the purposes of this portion of the Act to any person so authorized by any local authority.
The Tenancy Act, 1948, repealed the considerable body of the Fair Rents legislation passed during the period 1936–47. In effect, however, it consolidated the former legislation, including Part III of the Economic Stabilization Emergency Regulations 1942, while at the same time it introduced several important amendments. The main alterations to the existing law are referred to below.
The provisions as to rent restriction relates to dwellinghouses and to all leased properties, whether urban or agricultural, except that the definition of the term “property” has been amended so as to exclude agricultural properties leased for not less than two years and so subject to Part III of the Servicemen's Settlement and Land Sales Act, 1943. The definition of the term “rent” has also been extended to include money's worth. Two machinery changes involved were the appointment of Rents Officers to exercise the functions of Inspectors of Factories under the Fair Rents Act, 1936, and authorized persons under the revoked regulations, and defining the Court for fixing the fair rent of licensed premises as the Land Sales Court or the Land Valuation Court.
A new section has the effect of extending to all properties the earlier provision which prevented the original basic rent from being affected by including furniture in the tenancy. The provision for restoring the original basic rent and deeming any existing higher rent to be a fair rent was extended to cover properties other than dwellinghouses. As far as a “fair rent” is concerned, the Court can now fix the fair rent payable by the landlord where he is himself a tenant. Provision is also made for the method of determining the fair rents of flats and apartments. Instead of ceasing to have effect at the end of one year or when a new tenant occupies the premises as under the previous legislation, a fair rent fixed for a dwellinghouse now continues in force until a subsequent order takes effect.
The earlier clause relating to fines, premiums, &c., has been extended so as to prohibit a landlord or outgoing tenant from receiving from a new tenant any consideration other than—
The rent:
The price of any chattels not exceeding the fair selling value, or the replacement cost of stock in trade:
Such consideration as may be approved by the Land Sales Court or the Land Valuation Court.
The time within which excess payments of rents may be recovered from the landlord by the tenant or deducted from current rent is extended from six months to twelve months.
Important additions are made to the list of grounds governing the issue of orders for recovery of possession. These provide for recovery without having to provide alternative accommodation or prove greater hardship in the following cases: (a) where the dwellinghouse is not reasonably required for occupation as such by the tenant, (b) where an age-beneficiary has owned the dwellinghouse for two years, and (c) where any other landlord has owned the dwellinghouse for five years. However, the relative hardship of landlord and tenant will still be taken into account. Other new conditions give the landlord a right to apply for an order for the recovery of excess land for building purposes, or for an order authorizing him to convert a dwellinghouse into flats, one to be let to the existing tenant with appropriate adjustment of rent payable; provide that the special protection of servicemen and their families expires on the 31st March, 1949, or one year after the serviceman's discharge or death, whichever is the later; extend from six months to two years the period of the restriction on the letting or sale of promises when possession is recovered for the landlord's own occupation; and also make it an offence for a landlord to evict a tenant without an order of a Court or the tenant's consent.
Some new miscellaneous provisions were also incorporated in the Tenancy Act, 1948. Included in this category are the extensions of protection of tenancy in case of death to members of the deceased's family; the preservation of a tenancy for the wife or husband of the tenant in cases of separation or desertion; the prescription of conditions implied in tenancies; requiring receipts to be given for rent payments; and make it an offence for a landlord to deprive a tenant of his amenities, as by cutting off electric power, gas, or water. Finally, the case of unauthorized occupiers is dealt with, together with exemption from the provisions of the Act by prior agreement approved by a Rents Officer of a short-term tenancy of the landlord's home during his temporary absence.
IN New Zealand dual provision for the registration and protection of unions of workers and employers exists in the Trade-unions Act and the Industrial Conciliation and Arbitration Act, and further provision has been made in the Industrial Conciliation and Arbitration Amendment Acts of 1936, 1943, and 1947, references to which are made in the preceding section of this volume. The 1936 Amendment resulted in a considerable increase in membership of unions both of employers and of workers.
Provision was made under section 7, subsection (17), of the Industrial Conciliation and Arbitration Act, 1900 (now section 17 of the Industrial Conciliation and Arbitration Act, 1925), for the furnishing of an annual return showing the number and membership as at 31st December of unions registered under the Act. It is from this return (vide parliamentary paper H—11) that the tables in this section have been compiled. Very little information is available as to registration of unions under the Trade-unions Act, which is now practically inoperative. The number of unions registered under this Act as at the end of 1948 was three only. Unions registered under the Trade-unions Act may also be registered under the Industrial Conciliation and Arbitration Act.
INDUSTRIAL UNIONS OF EMPLOYERS.—The numbers and membership of industrial unions of employers registered under the Industrial Conciliation and Arbitration Act as at the end of each of the last five years are shown in the following table.
| As at 31st December, | Industrial District. | |||||||||||
|---|---|---|---|---|---|---|---|---|---|---|---|---|
| Northern. | Wellington. | Canterbury. | Otago and Southland. | Taranaki. | Marlborough. | Nelson. | Westland. | North Island. | South Island. | New Zealand. | Totals. | |
| Number of Unions | ||||||||||||
| 1944 | 47 | 84 | 43 | 36 | 12 | 3 | 8 | 6 | 4 | 1 | 24 | 268 |
| 1945 | 48 | 84 | 42 | 36 | 12 | 3 | 8 | 7 | 4 | 3 | 24 | 271 |
| 1946 | 49 | 85 | 42 | 37 | 12 | 3 | 8 | 7 | 5 | 3 | 23 | 274 |
| 1947 | 50 | 86 | 42 | 36 | 12 | 4 | 9 | 7 | 5 | 3 | 24 | 278 |
| 1948 | 46 | 85 | 42 | 36 | 12 | 4 | 9 | 8 | 5 | 3 | 27 | 277 |
| Membership | ||||||||||||
| 1944 | 3,105 | 2,341 | 1,378 | 1,332 | 457 | 25 | 174 | 98 | 69 | 16 | 6,859 | 15,854 |
| 1945 | 3,377 | 2,411 | 1,408 | 1,412 | 466 | 23 | 203 | 126 | 78 | 75 | 7,324 | 16,903 |
| 1946 | 3,455 | 2,537 | 1,408 | 1,468 | 456 | 27 | 227 | 124 | 70 | 73 | 6,188 | 16,033 |
| 1947 | 3,787 | 2,680 | 1,389 | 1,554 | 456 | 53 | 257 | 132 | 77 | 76 | 6,462 | 16,923 |
| 1948 | 3,828 | 2,876 | 1,470 | 1,568 | 493 | 62 | 269 | 132 | 65 | 73 | 6,975 | 17,811 |
The number of unions of employers and their membership rose gradually to 149 unions, with 5,819 members, in 1914, the year following that of the prolonged waterside workers' strike. From that year until the passing of the 1936 Act, membership figures remained fairly constant, the only major variations taking place in the years 1931, 1932, and 1933, when successive decreases were recorded. The effects of the 1936 Act may be judged from the fact that the 1945 figure of membership showed an increase of approximately 290 per cent. over the 1935 total. The 1948 membership total of 17,811 is the highest yet recorded. A good deal of duplication, however, exists in employers' union membership, many employers belonging to two or more unions.
INDUSTRIAL UNIONS OF WORKERS.—Industrial unions of workers and their membership are shown in the next table as at the end of each of the last five years. It should be noted that the statistics cover only unions registered under the Industrial Conciliation and Arbitration Act.
The membership of workers' unions rose year by year, without exception, from 17,989 in 1900 to 73,991 in 1914. It fell off during the period of the 1914–18 war, but a phenomenal rise was recorded in 1919, the year immediately following the cessation of hostilities. The total for 1928 (103,980) was the highest recorded up to and inclusive of 1935, but is far below the present figures. The 1936 Act, which provided for compulsory union membership on the part of workers subject to an award or industrial agreement, has, of course, been responsible for the high figures of recent years.
From 1910 to 1913 the decreased membership reflected to a certain extent the withdrawal of men from industry consequent on the prosecution of the war, but in each of the subsequent years 1944 to 1948 increases in membership were recorded. Compared with 1935, the year prior to the introduction of compulsory union membership, the 1948 figure (271,100) shows an increase of 190,171, or 235 per cent.
| As at 31st December, | Industrial District. | |||||||||||
|---|---|---|---|---|---|---|---|---|---|---|---|---|
| Northern. | Wellington. | Canterbury. | Otago and Southland. | Taranaki. | Marlborough. | Nelson. | Westland. | North Island. | South Island. | New Zealand. | Totals. | |
| Number of Unions | ||||||||||||
| 1944 | 88 | 65 | 43 | 93 | 20 | 8 | 20 | 21 | 2 | 1 | 33 | 394 |
| 1945 | 86 | 61 | 42 | 89 | 20 | 8 | 18 | 22 | 2 | 1 | 33 | 382 |
| 1946 | 85 | 59 | 41 | 87 | 18 | 8 | 17 | 21 | 2 | 1 | 35 | 374 |
| 1947 | 85 | 58 | 41 | 87 | 18 | 8 | 17 | 20 | 2 | 1 | 36 | 373 |
| 1948 | 86 | 59 | 40 | 86 | 18 | 7 | 17 | 20 | 3 | 1 | 37 | 374 |
| Membership | ||||||||||||
| 1944 | 54,294 | 35,139 | 22,881 | 21,617 | 3,623 | 1,146 | 1,664 | 3,500 | 2121 | 32 | 77,010 | 223,027 |
| 1945 | 45,321 | 34,874 | 22,588 | 21,806 | 3,527 | 1,046 | 1,583 | 3,205 | 2424 | 33 | 92,696 | 229,103 |
| 1946 | 51,109 | 36,888 | 23,876 | 22,206 | 2,776 | 989 | 1,530 | 3,384 | 2763 | 34 | 101,943 | 247,498 |
| 1947 | 53,608 | 38,909 | 24,459 | 22,824 | 3,303 | 1,080 | 1,681 | 3,370 | 2768 | 36 | 108,341 | 260,379 |
| 1948 | 54,587 | 42,143 | 25,047 | 23,773 | 2,879 | 753 | 1,770 | 3,646 | 2909 | 32 | 113,561 | 271,100 |
A further picture of the progress that has taken place in the membership of workers' unions is afforded by the accompanying diagram, which shows the numbers at five-yearly intervals from 1905 to 1940, and annually thereafter.
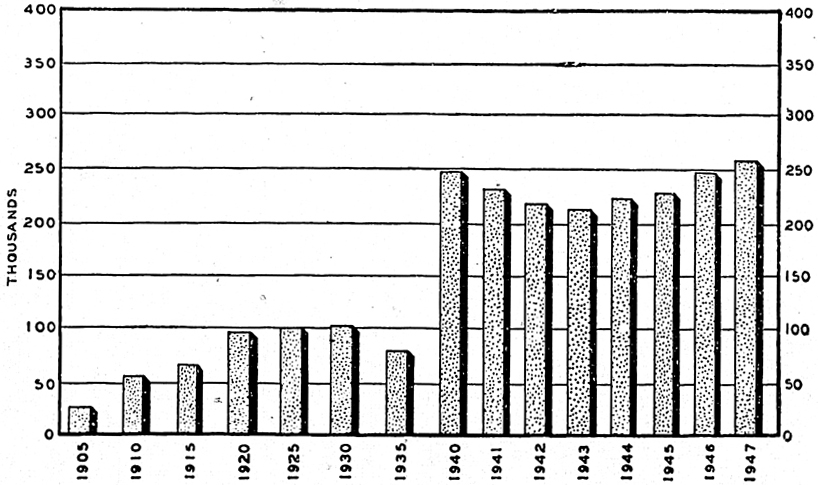
In the following table industrial unions of workers are classified according to membership.
| Year. | Under 50. | 50 and under 100. | 100 and under 200. | 200 and under 300. | 300 and under 500. | 500 and under 1,000. | 1,000 and under 2,000. | 2,000 and under 3,000. | 3,000 and over. | Totals. |
|---|---|---|---|---|---|---|---|---|---|---|
| Number of Unions | ||||||||||
| 1901 | 99 | 43 | 30 | 19 | 5 | 4 | 1 | 1 | 202 | |
| 1911 | 120 | 62 | 53 | 26 | 23 | 14 | 8 | 1 | 307 | |
| 1921 | 139 | 100 | 70 | 36 | 28 | 28 | 11 | 3 | 3 | 418 |
| 1931 | 162 | 77 | 58 | 31 | 30 | 29 | 14 | 3 | 1 | 405 |
| 1941 | 113 | 71 | 70 | 38 | 38 | 32 | 27 | 13 | 17 | 419 |
| 1944 | 104 | 67 | 59 | 38 | 39 | 32 | 26 | 13 | 16 | 394 |
| 1945 | 95 | 65 | 61 | 34 | 36 | 38 | 24 | 12 | 17 | 382 |
| 1946 | 88 | 60 | 60 | 33 | 42 | 36 | 24 | 14 | 17 | 374 |
| 1947 | 86 | 59 | 59 | 36 | 37 | 41 | 23 | 14 | 18 | 373 |
| 1948 | 80 | 66 | 60 | 38 | 33 | 38 | 24 | 12 | 23 | 374 |
| Membership | ||||||||||
| 1901 | 2,759 | 3,018 | 4,032 | 4,815 | 2,073 | 2,520 | 1,651 | 2,900 | 23,768 | |
| 1911 | 3,502 | 4,019 | 7,686 | 6,360 | 8,879 | 9,685 | 9,414 | 6,084 | 55,629 | |
| 1921 | 4,147 | 7,075 | 9,708 | 9,182 | 11,066 | 18,527 | 14,580 | 7,433 | 16,001 | 97,719 |
| 1931 | 4,304 | 5,665 | 7,966 | 7,578 | 11,244 | 20,602 | 18,566 | 6,744 | 7,857 | 90,526 |
| 1941 | 2,961 | 4,948 | 9,768 | 9,207 | 15,060 | 22,841 | 35,417 | 31,012 | 99,835 | 231,049 |
| 1944 | 2,789 | 4,954 | 8,440 | 9,026 | 15,021 | 22,368 | 36,056 | 31,942 | 92,431 | 223,027 |
| 1945 | 2,530 | 4,719 | 8,627 | 8,294 | 13,409 | 26,115 | 32,498 | 28,344 | 104,567 | 229,103 |
| 1946 | 2,567 | 4,325 | 8,561 | 7,883 | 16,146 | 25,515 | 32,800 | 34,562 | 115,139 | 247,498 |
| 1947 | 2,459 | 4,375 | 8,049 | 8,630 | 13,985 | 29,324 | 32,067 | 34,690 | 126,800 | 260,379 |
| 1948 | 2,196 | 4,733 | 8,728 | 9,199 | 12,417 | 25,915 | 32,239 | 28,344 | 147,329 | 271,100 |
| Percentage of Total Membership | ||||||||||
| 1901 | 11.6 | 12.7 | 17.0 | 20.3 | 8.7 | 10.6 | 6.9 | 12.2 | 100.0 | |
| 1911 | 6.3 | 7.2 | 13.8 | 11.4 | 16.0 | 17.4 | 16.9 | 11.0 | 100.0 | |
| 1921 | 4.2 | 7.3 | 9.9 | 9.4 | 11.3 | 19.0 | 14.9 | 7.6 | 16.4 | 100.0 |
| 1931 | 4.8 | 6.3 | 8.8 | 8.4 | 12.4 | 22.8 | 20.5 | 7.4 | 8.6 | 100.0 |
| 1941 | 1.3 | 2.2 | 4.2 | 4.0 | 6.5 | 9.9 | 15.3 | 13.4 | 43.2 | 100.0 |
| 1944 | 1.3 | 2.2 | 3.8 | 4.1 | 6.7 | 10.0 | 16.2 | 14.3 | 41.4 | 100.0 |
| 1945 | 1.1 | 2.1 | 3.8 | 3.6 | 5.8 | 11.4 | 14.2 | 12.4 | 45.6 | 100.0 |
| 1946 | 1.0 | 1.7 | 3.5 | 3.2 | 6.5 | 10.3 | 13.3 | 14.0 | 46.5 | 100.0 |
| 1947 | 0.9 | 1.7 | 3.1 | 3.3 | 5.4 | 11.3 | 12.3 | 13.3 | 48.7 | 100.0 |
| 1948 | 0.8 | 1.7 | 3.2 | 3.4 | 4.6 | 9.6 | 11.9 | 10.5 | 54.3 | 100.0 |
There has been a more or less steady growth in the average size of workers' unions, the trend being to a certain extent obscured at times by the cancellation of registration by some large unions. An average membership of 118 in 1901 increased in 1921 to 234, in 1941 to 551, and in 1948 to 725.
INDUSTRIAL AND GEOGRAPHICAL DISTRIBUTION.—In the next table industrial unions of employers as at the end of 1948 are shown according to industrial group, and membership according to industrial group and district.
| Industrial Group. | Membership—Industrial Districts. | Number of Unions. | |||||||||||
|---|---|---|---|---|---|---|---|---|---|---|---|---|---|
| Northern. | Wellington. | Canterbury. | Otago and Southland. | Taranaki. | Marlborough. | Nelson. | Westland. | North Island. | South Island. | New Zealand. | Totals. | ||
| Provision of— | |||||||||||||
| Food, drink, &c. | 1,906 | 707 | 336 | 811 | 336 | 14 | 134 | 35 | 79 | 4,358 | 59 | ||
| Clothing, footwear, and textiles | 41 | 67 | 67 | 11 | 12 | 2,831 | 3,029 | 12 | |||||
| Building and construction | 1,146 | 915 | 396 | 316 | 71 | 28 | 91 | 9 | 2,972 | 45 | |||
| Power, heat, and light | 85 | 51 | 101 | 103 | 340 | 7 | |||||||
| Transport by water | 17 | 23 | 21 | 11 | 8 | 4 | 6 | 4 | 23 | 117 | 14 | ||
| Transport by land | 97 | 66 | 56 | 41 | 12 | 9 | 62 | 343 | 9 | ||||
| Accommodation, meals, and personal service | 254 | 419 | 369 | 154 | 57 | 16 | 30 | 84 | 18 | 561 | 1,962 | 39 | |
| Working in or on— | |||||||||||||
| Wood, wicker, seagrass, and fibre | 55 | 57 | 34 | 7 | 401 | 554 | 9 | ||||||
| Metal | 163 | 230 | 29 | 59 | 46 | 210 | 737 | 20 | |||||
| Stone, clay, glass, and chemicals | 3 | 46 | 6 | 5 | 21 | 81 | 11 | ||||||
| Paper, printing, &c | 104 | 107 | 42 | 45 | 9 | 9 | 1 | 317 | 22 | ||||
| Skins, leather, &c | 9 | 19 | 13 | 3 | 44 | 7 | |||||||
| Mines and quarries | 1 | 4 | 5 | 3 | |||||||||
| Land (farming pursuits) | 32 | 74 | 37 | 8 | 23 | 2,520 | 2,694 | 12 | |||||
| Miscellaneous | 61 | 13 | 184 | 258 | 8 | ||||||||
| Totals | 3,828 | 2,876 | 1,470 | 1,568 | 493 | 62 | 269 | 132 | 65 | 73 | 6,975 | 17,811 | 277 |
Similar information to that given for industrial unions of employers is now given for workers' unions, as at the end of 1948.
| Industrial Group. | Membership—Industrial Districts. | Number of Unions. | |||||||||||
|---|---|---|---|---|---|---|---|---|---|---|---|---|---|
| Northern. | Wellington. | Canterbury. | Otago and Southland. | Taranaki. | Marlborough. | Nelson. | Westland. | North Island. | South Island. | New Zealand. | Totals. | ||
| Provision of— | |||||||||||||
| Food, drink, &c. | 9,057 | 7,267 | 3,592 | 4,856 | 223 | 302 | 32 | 7,396 | 32,725 | 51 | |||
| Clothing, footwear, and textiles | 7,948 | 5,228 | 4,662 | 3,257 | 12 | 21,107 | 18 | ||||||
| Building and construction | 3,964 | 3,976 | 2,264 | 2,593 | 447 | 23 | 27 | 27 | 11,192 | 24,513 | 37 | ||
| Power, heat, and light | 316 | 320 | 160 | 89 | 885 | 5 | |||||||
| Transport by water | 1,653 | 1,272 | 76 | 595 | 9,668 | 13,264 | 21 | ||||||
| Transport by land | 3,386 | 2,559 | 1,550 | 1,428 | 465 | 140 | 288 | 180 | 22,315 | 32,311 | 20 | ||
| Transport by air | 73 | 73 | 1 | ||||||||||
| Communication | 30 | 30 | 1 | ||||||||||
| Accommodation, meals, and personal service | 6,108 | 5,287 | 2,747 | 2,537 | 381 | 190 | 230 | 438 | 17,918 | 26 | |||
| Working in or on— | |||||||||||||
| Wood, wicker, sea-grass, and fibre | 1,302 | 1,116 | 845 | 541 | 16 | 38 | 271 | 1,002 | 5,667 | 10,798 | 20 | ||
| Metal | 841 | 1,055 | 601 | 941 | 87 | 21 | 2,534 | 23,393 | 29,473 | 28 | |||
| Stone, clay, glass, and chemicals | 599 | 329 | 384 | 110 | 98 | 765 | 2,285 | 17 | |||||
| Paper, printing, &c. | 65 | 4,730 | 4,795 | 5 | |||||||||
| Skins, leather, &c. | 817 | 299 | 128 | 33 | 1,277 | 6 | |||||||
| Mines and quarries | 2,132 | 52 | 504 | 92 | 5 | 1,203 | 3,988 | 22 | |||||
| Land (farming pursuits) | 194 | 44 | 25 | 17,931 | 18,194 | 5 | |||||||
| Miscellaneous | 16,240 | 13,391 | 8,370 | 5,950 | 1,256 | 362 | 628 | 763 | 10,504 | 57,464 | 91 | ||
| Totals | 54,587 | 42,143 | 25,047 | 23,773 | 2,879 | 753 | 1,770 | 3,646 | 2,909 | 32 | 113,561 | 271,100 | 374 |
INDUSTRIAL ASSOCIATIONS.—At 31st December, 1948, there were 22 industrial associations of employers and 35 of workers, the former having 150 affiliated unions and the latter 186. The following summary shows the number of industrial associations of employers and workers in each industrial group, with the number of affiliated unions in each case. In most cases the associations cover the entire country.
| Industrial Group. | Employers. | Workers. | ||||||
|---|---|---|---|---|---|---|---|---|
| Associations. | Affiliated Unions. | Associations. | Affiliated Unions. | |||||
| 1947. | 1948. | 1947. | 1948. | 1947. | 1948. | 19473. | 1948. | |
| Provision of— | ||||||||
| Food, drink, &c | 5 | 5 | 38 | 39 | 3 | 3 | 16 | 16 |
| Clothing, footwear, and textiles | 4 | 3 | 17 | 13 | ||||
| Building and construction | 3 | 3 | 34 | 37 | 3 | 3 | 26 | 25 |
| Transport by water | 1 | 1 | 10 | 10 | 2 | 2 | 5 | 5 |
| Transport by land | 1 | 1 | 4 | 4 | 1 | 1 | 12 | 12 |
| Accommodation, meals, and personal service | 2 | 2 | 25 | 26 | 3 | 3 | 17 | 17 |
| Working in or on— | ||||||||
| Wood, wicker, seagrass, and fibre | 1 | 1 | 4 | 4 | 2 | 2 | 10 | 10 |
| Metal | 2 | 2 | 9 | 4 | 4 | 4 | 12 | 13 |
| Stone, clay, glass, and chemicals | 2 | 2 | 7 | 7 | 2 | 2 | 5 | 4 |
| Paper, printing, &c. | 2 | 2 | 11 | 11 | ||||
| Skins, leather, &c | 1 | 1 | 3 | 3 | 1 | 4 | ||
| Mines and quarries | 3 | 3 | 10 | 10 | ||||
| Land (farming pursuits) | 1 | 1 | 3 | 2 | 1 | 1 | 3 | 3 |
| Miscellaneous | 1 | 3 | 7 | 7 | 52 | 54 | ||
| Totals | 21 | 22 | 148 | 150 | 35 | 35 | 185 | 186 |
PROPORTION OF UNIONISTS.—The following table, showing the proportion of workers belonging to unions registered under the Industrial Conciliation and Arbitration Act to the total number of wage-earners in the country, is of interest as manifesting the movement in and the extent of unionism during the period under review. The figures given for total wage-earners are derived from census enumerations and would include professional, business, and other classes in which unionism prior to the passing of the amending Act of 1936 did not exist, and agricultural and pastoral occupations where it was practically non-existent. In addition, females are included in both sets of figures, although the proportion of women unionized prior to 1936 was negligible.
| Year. | Total Wage-earners. | Year. | Numbers of Workers on Rolls of Registered Unions. | Percentage of Wage-earners on Rolls of Registered Unions. |
|---|---|---|---|---|
| 1901 (March) | 224,346 | 1900 (December) | 17,989 | 8 |
| 1906 (April) | 269,039 | 1905 (December) | 29,869 | 11 |
| 1911 (April) | 304,272 | 1910 (December) | 57,091 | 19 |
| 1916 (October) | 302,161 | 1916 (December) | 71,587 | 24 |
| 1921 (April) | 370,692 | 1920 (December) | 96,350 | 26 |
| 1926 (April) | 414,673 | 1925 (December) | 100,540 | 24 |
| 1936 (March) | 496,563 | 1935 (December) | 80,929 | 16 |
| 1945 (September) | 473,684 | 1945 (December) | 229,103 | 48 |
PRIOR to the establishment in 1946 of the National Employment Service the only comprehensive source of information on employment in Now Zealand was the periodical census inquiry. After each census a volume containing statistics of industries and occupations is published, and in respect of those of 1926 and 1936 there was an additional volume on unemployment. Certain specific fields—factories, public works, and local bodies—were, however, also covered by annual collections. The activities of the National Employment Service and the scope of the knowledge of employment matters at present available are dealt with in detail on later pages of this Section.
UNEMPLOYMENT.—Except for occasional returns relating to State unemployment relief which were presented to Parliament from time to time, practically no direct statistical evidence as to the extent of unemployment in New Zealand prior to 1892 is available.
Unemployment was well known to have been acute in the middle and late “sixties,” owing to the paralysing effect of the Maori wars in the North Island and to the collapse of the alluvial-gold booms in Otago and Westland. With the inauguration, at the beginning of the “seventies,” of the Vogel policy of public works and assisted immigration, employment was available for largo numbers of new arrivals. At the beginning of the “eighties” scarcity of funds for the prosecution of public works, along with other considerations, necessitated the checking for a space of the stream of assisted immigrants. By 1883 the position had materially improved; but unemployment once more became serious in the late “eighties” and early “nineties,” mainly owing to the fall in the prices that New Zealand's products (notably wool) were realizing overseas, and to a further slackening of the rate of prosecution of public works. During both of these periods the unemployment position was so acute as to be responsible for a considerable exodus of male population to Australia and elsewhere.
Direct statistical evidence as to the extent of unemployment in New Zealand is available from the census (since 1896) and from the records of the Labour Department (since 1892). In addition, statistics of unemployment among trade-unionists were collected from trade-union secretaries by the Census and Statistics Department from 1925 to 1930.
CENSUS DATA ON UNEMPLOYMENT.—The great disadvantage of the Census inquiry as an indicator of the trend of unemployment is that it provides data at quinquennial intervals only, up to April, 1926, since when only two censuses have taken place, one on 24th March, 1936, and the other on 25th September, 1945.
| Census. | Number of Males Unemployed. | Proportion per Thousand Male Wage-earners. |
|---|---|---|
| 12th April, 1896 | 14,759 | 100 |
| 31st March, 1901 | 8,467 | 48 |
| 12th April, 1906 | 8,189 | 39 |
| 2nd April, 1911 | 7,152 | 30 |
| 15th October, 1916 | 5,920 | 26 |
| 17th April, 1921 | 11,061 | 39 |
| 20th April, 1926 | 10,694 | 34 |
| 24th March, 1936 | 35,774 | 96 |
| 25th September, 1945 | 5,823 | 18 |
The 1936 figure includes men on rationed relief work, but excludes men (16,222) partly unemployed but not on relief work. The 1945 figure included ex-servicemen recently returned from overseas and not yet returned to work.
UNEMPLOYMENT BENEFIT.—In the years immediately preceding 1939 two forms of unemployment relief were available: the provision of work for unemployed under various employment promotion schemes, and the payment of sustenance without work (refer 1942 and earlier issues of the Year-Book). Measures for the promotion of employment are still in operation, but the payment of sustenance without work was discontinued on the introduction of a system of unemployment benefits under the Social Security Act, 1938. These benefits came into force on 1st April, 1939, and monthly figures of the number of benefits current for the seven years ended 1948 are as follows:—
| Month. | 1942. | 1943. | 1944. | 1945. | 1946. | 1947. | 1948. |
|---|---|---|---|---|---|---|---|
| January | 1,033 | 443 | 320 | 315 | 265 | 72 | 14 |
| February | 906 | 411 | 272 | 222 | 220 | 43 | 9 |
| March | 841 | 373 | 292 | 198 | 205 | 35 | 16 |
| April | 815 | 365 | 289 | 193 | 190 | 32 | 16 |
| May | 826 | 379 | 286 | 186 | 190 | 38 | 22 |
| June | 848 | 390 | 288 | 242 | 183 | 41 | 41 |
| July | 886 | 489 | 353 | 254 | 202 | 51 | 51 |
| August | 863 | 454 | 396 | 270 | 197 | 63 | 41 |
| September | 803 | 445 | 398 | 297 | 154 | 93 | 61 |
| October | 734 | 415 | 382 | 377 | 100 | 46 | 48 |
| November | 618 | 370 | 306 | 338 | 71 | 27 | 33 |
| December | 549 | 322 | 368 | 346 | 91 | 27 | 40 |
PROMOTION OF EMPLOYMENT.—Reference to earlier issues of the Year-Book will show the measures taken during the depression and post-depression years to relieve unemployment and in particular to promote employment. Under Scheme 5 a maximum of 45,000 men were in receipt of part-time work in 1932 and 1933. Some of the schemes introduced are still in operation, though to a very minor extent. In recent years the labour situation has been characterized by a general high level of employment and a high number of vacancies in industry, and the only employment-promotion measures initiated have been small-scale seasonal schemes which provide work for a number of men in the winter months. Apart from these the only employment-promotion measure continuing in operation to any extent is Scheme 13, under which 228 men were employed at 31st March, 1948, as compared with 280 on 31st March, 1947. Most of these men are fit for light work only and are located in districts where employment opportunities are limited. Everything possible is done to place them in suitable private employment when the opportunity arises. Their wages are subsidized to an extent which brings their earnings up to the award rate for the type of work performed. They are allocated to different local bodies, charitable institutions, &c., and are engaged on work such as vegetable-production, maintenance of parks and reserves and school grounds, and lime-production.
The operation of employment-promotion schemes is a function of the Department of Labour and Employment.
Information concerning the measures in operation for the rehabilitation of ex-servicemen will be found in Section 46.
STATE PLACEMENT SERVICE.—Provision for Government Employment Bureaux was made as early as 1891. These bureaux were under the control of the Department of Labour, and had the object of finding employment for those who chose to register with them. The number of placements effected through the agency of the bureaux was usually from 2,000 to 6,000 per year. The great depression of the early “thirties” led to a rapid increase in the number of those who registered with the bureaux, and in November, 1930, their number reached 7,000. In that month an Unemployment Board was appointed, which made registration at a Government bureau a condition for receiving relief. This caused largo numbers (over 11,000 in December, 1930) to register with the bureaux as a pro-requisite to receiving relief rather than with the hope of obtaining employment, and the bureaux, instead of being placement services as in the first instance, now largely came to function as unemployment registration bureaux. The Unemployment Board was abolished in 1936, and its activities were transferred to the Employment Division of the Department of Labour. The old bureaux were replaced in 1936 by a State Placement Service, which once more concentrated on the original function of the Government Employment Bureaux—that of providing employment. At first confined to males, the Service was extended to women and girls in April, 1939.
A summary of placements (males only) by the State Placement Service for the years 1937–41 is given below.
| Year. | Permanent. | Temporary. | Casual. | Totals. |
|---|---|---|---|---|
| 1937 | 17,650 | 12,051 | 17,092 | 46,793 |
| 1938 | 12,885 | 9,416 | 17,354 | 39,655 |
| 1939 | 11,370 | 8,569 | 12,879 | 32,818 |
| 1940 | 10,827 | 9,224 | 11,262 | 31,313 |
| 1941 | 12,303 | 9,207 | 10,293 | 31,803 |
No information is available regarding female placements prior to the 1st October, 1939. For the six months ended 31st March, 1940, 1,284 placements were effected; for the year ended 31st March, 1941, there were 3,553 placements; and for the year ended 31st March, 1942, there were 3,474 placements.
As from January, 1942, the State Placement Service was absorbed by the Industrial Man power Division of the National Service Department. Placements by this Department as distinct from directions of man-power are not however available. In April, 1946, the newly constituted National Employment Service began to function as a separate Department, but was merged a year later with the Department of Labour. Further information as to its activities is given later in this Section.
VOCATIONAL GUIDANCE.—Since 1938 full responsibility for the work of vocational guidance of pupils at post-primary schools, which for some years previously had been carried on almost entirely by voluntary organizations, has been taken by the Department of Education. A youth centre was established in each of the four main centres, and the work of guidance and placement was undertaken jointly by officers of the Education and National Service Departments. Particulars of placements by vocational guidance centres during the five years ended 31st March, 1945, are as follows:—
| Year ended 31st March. | Boys. | Girls. | Totals. | ||||
|---|---|---|---|---|---|---|---|
| Permanent. | Temporary. | Total. | Permanent. | Temporary. | Total. | ||
| 1941 | 2,233 | 430 | 2,663 | 1,961 | 1,961 | 4,624 | |
| 1942 | 2,008 | 331 | 2,339 | 2,077 | 204 | 2,281 | 4,620 |
| 1943 | 2,546 | 513 | 3,059 | 3,221 | 268 | 3,489 | 6,548 |
| 1944 | 3,425 | 77 | 3,502 | 4,768 | 62 | 4,830 | 8,332 |
| 1945 | 4,760 | 50 | 4,810 | 5,141 | 86 | 5,227 | 10,037 |
The Education Department assumed full control of the youth centres (now called Vocational Guidance Centres) in 1943, and, in addition to the four main cities, has opened a branch at Wanganui.
The numbers of those enrolled who were placed in employment during each of the calendar years 1945 to 1948 were as follows:—
| Year ended 31st December. | Number Placed by Centres. | Number Self-placed. | Totals. |
|---|---|---|---|
| 1945 | 2,285 | 6,443 | 8,728 |
| 1946 | 2,689 | 1,762 | 4,451 |
| 1947 | 1,723 | 1,203 | 2,926 |
| 1948 | 1,441 | 843 | 2,284 |
INDUSTRIAL MOBILIZATION.—Control of man-power was essential to the most efficient distribution of men and women available during the war years, and authority was given by the Industrial Man-power Emergency Regulations 1942. Pursuant thereto were the declaration of the most important industries as “essential” (thus putting restrictions on employees leaving the industry and giving authority to direct new personnel thereto) and the registration of certain special classes of workers. From mid-1942 to 31st March, 1946, 176,088 directions were complied with.
A comprehensive historical and statistical survey of the Industrial Man-power Division of the National Service Department from 1940, to August, 1945, is given in parliamentary paper H.–11A, 1945; a résumé of this paper was given in the 1945 Year-Book. The 1946 H.–11A extends this survey to 31st March, 1946.
POST-WAR INDUSTRY.—The termination of hostilities in August, 1945, reoriented the scope of the Department of National Service. Preliminary steps were the withdrawal of “direction” from returned servicemen, all married women, and older men and women generally.
From August, 1945, there was a progressive lifting of the declarations of essentiality, first from the lighter industries, then from the Public Service other than the Second Division of the Railways and the Works Department. On 31st January, 1946, all direction was lifted, with the exception of the coal-mining industry, dairy factories, freezing-works, hospitals, prisons, sawmilling, and tramways, with some of their subsidiaries.
On 30th June, 1946, all man-power control was lifted. This freedom of movement brought problems in its train, for although approximately 90,000 had by then been released from the Armed Forces, all types of labour were in very short supply.
NATIONAL EMPLOYMENT SERVICE.—As from 1st April, 1946, the National Employment Service was established with the principal function of promoting and maintaining full employment in New Zealand. The new Department was set up under the Employment Act, 1945. Prior to 1942 a State Placement Service had operated a widely used system of local labour exchanges. From 1942 to the end of March, 1946, this became merged in the Industrial Man-power Division of the National Service Department, and, with an augmented staff, carried out the wider and more complex functions of man-power direction and control. In this work it developed a much greater emphasis on the collection and use of employment and other economic data, on the research and planning aspects of employment, and on the co-ordination of industrial activities with man-power resources. The National Employment Service was built upon these foundations. After twelve months' activity as a separate Department it was, however, on the 1st April, 1947, amalgamated with the Department of Labour to form the present Department of Labour and Employment.
The main activities of the Department on the employment side are: the collection of employment information and the application of this information towards securing a continuing adjustment of matters affecting employment so as to maintain a policy of full employment at the highest productive level; assisting persons to secure work or more suitable work, and employers to secure labour by maintaining twenty-six district employment offices, by operating camps and hostels for workers, and by other measures which may include occupational training or retraining; the administration of subsidized employment schemes for those unfit to compete in the ordinary labour market; and the operation of a Home Aid Service to provide domestic help to families in urgent circumstances.
The total number of residents (including stall) of camps and hostels—comprising industrial workers' camps and hostels, immigration hostels, Public Service hostels and miners' hostels—operated by the Department* was 2,125 at 31st March, 1948.
During 1947–48 special attention has been directed to the problem of Maori employment. Outstanding features of the Maori population are its rate of growth and the fact that the Maori people are largely resident in localities remote from the main centres of industrial activity. The Government has therefore set up a Maori Education and Employment Committee representative of six State Departments, including that of Labour and Employment, whose broad function is to determine practical measures for ensuring the continuing absorption of the Maori race into full employment, including employment promotion in areas of Maori population.
The Employment Act, 1945, provides for the establishment of Advisory Councils and Committees to assist the Department in the effective administration of its employment service. Membership comprises representatives of workers' and employers' organizations under the chairmanship of a departmental officer. District committees are functioning in some dozen industries and national committees in the clothing, freezing, and tramways industries.
Immigration matters, including the maintenance of immigration hostels, are also handled by the Department. Reference to assisted immigration has been made on page 26 of this volume. Government sponsorship is extended to fare-paying passengers in certain cases (e.g., those of key technical and professional people urgently required here in the national interest), but to married people only where it is known that suitable living-accommodation is available Consideration has also been given to the question of child migration, and a commencement has now been made by bringing a number of British children to New Zealand at Government expense. To advise the Minister of Immigration on immigration matters and to aid the Department in the implementing of immigration policy an Immigration Advisory Council was established in April, 1947. The Permanent Head of the Department is Chairman of the Council, other members being representatives of the New Zealand Federation of Labour, the New Zealand Manufacturers' Federation, the New Zealand Employers' Federation, the New Zealand Farmers' Union, the New Zealand Workers' Union, the Returned Services' Association, the Rehabilitation Board, and also two women members appointed by the Government. In each of the twenty-six districts where there are employment offices there is also an Immigration Welfare Committee representing the churches, local bodies, the Returned Services' Association, employers' and workers' associations, the Federated Farmers, and other organizations. The function of these Committees is to co-ordinate welfare activities in respect of new settlers, whether Government assisted or not.
Half-yearly Surveys.—Commencing in 1946 the Department has carried out at half-yearly intervals a general survey of employment in New Zealand. These surveys are conducted by means of inquiries sent out to employers of labour, the results being published in the “Half-yearly Survey of Employment.” Returns are required from all establishments in which at least two persons (including working proprietors) are engaged. Government and local-authority employment is included. Each return covers six consecutive months, the initial survey (apart from a pilot survey taken for April, 1946) relating to the period May to October, 1946. Employers in farming, hunting, trapping, fishing, and waterfront work are not required to submit half-yearly returns. Seasonal industries (comprising meat-processing, fruit and vegetable preserving, dairy-factories, threshing and chaffcutting, and wool-stores) have since August, 1946, been covered by a separate monthly inquiry. Following are tables showing a summary of the result of the first five surveys, a dissection being provided into the chief industrial groups. Separate tables are given for males and females, working proprietors are distinguished from employees, and the number of establishments covered is appended. Particulars of working proprietors and number of establishments are available at half-yearly intervals only.
*Two women's hostels are operated by the Young Women's Christian Association on behalf of the Department.
EMPLOYMENT IN INDUSTRY ON THE 15TH DAY OF EACH MONTH
MALES
| — | Food, Drink, and Tobacco (Other than Seasonal). | Textiles, Clothing, and Leather. | Building Materials and Furnishings. | Engineering and Metal Working. | Miscellaneous Manufacturing. | Power and Water Supply. | Building and Construction. | Totals, Secondary Industry (Other than Seasonal). |
|---|---|---|---|---|---|---|---|---|
| Employees | ||||||||
| 1946 | ||||||||
| May | 8,415 | 11,819 | 15,039 | 36,122 | 12,827 | 7,635 | 29,844 | 121,701 |
| June | 8,423 | 11,896 | 15,002 | 36,519 | 13,045 | 7,708 | 30,102 | 122,695 |
| July | 8,465 | 12,019 | 15,190 | 37,063 | 13,214 | 7,770 | 30,508 | 124,229 |
| August | 8,490 | 12,077 | 15,241 | 37,621 | 13,321 | 7,816 | 30,832 | 125,398 |
| September | 8,507 | 12,265 | 15,293 | 37,874 | 13,408 | 7,823 | 31,294 | 126,464 |
| October | 8,566 | 12,263 | 15,329 | 38,171 | 13,556 | 7,803 | 31,609 | 127,297 |
| November | 8,836 | 12,467 | 15,866 | 38,642 | 13,669 | 7,782 | 31,727 | 128,989 |
| December | 8,936 | 12,377 | 15,792 | 38,755 | 13,652 | 7,909 | 31,664 | 129,085 |
| 1947 | ||||||||
| January | 8,824 | 12,218 | 15,536 | 38,304 | 13,327 | 7,820 | 31,066 | 127,095 |
| February | 8,801 | 12,269 | 15,751 | 38,663 | 13,484 | 7,730 | 31,973 | 128,671 |
| March | 8,883 | 12,353 | 15,764 | 38,823 | 13,505 | 7,774 | 31,886 | 128,988 |
| April | 8,895 | 12,382 | 15,703 | 39,015 | 13,618 | 7,783 | 31,839 | 129,235 |
| May | 8,872 | 12,561 | 16,107 | 39,868 | 13,798 | 7,844 | 32,246 | 131,296 |
| June | 8,807 | 12,622 | 16,134 | 40,312 | 13,847 | 7,896 | 32,444 | 132,062 |
| July | 8,809 | 12,666 | 16,177 | 40,601 | 14,057 | 7,962 | 32,756 | 133,028 |
| August | 8,805 | 12,825 | 16,209 | 40,955 | 14,169 | 7,987 | 33,054 | 134,004 |
| September | 8,844 | 12,838 | 16,383 | 40,929 | 14,352 | 7,994 | 33,170 | 134,510 |
| October | 8,865 | 12,813 | 16,487 | 40,834 | 14,335 | 7,940 | 33,231 | 134,505 |
| November | 8,924 | 12,934 | 16,783 | 41,120 | 14,375 | 7,922 | 33,369 | 135,427 |
| December | 9,062 | 12,865 | 16,764 | 41,164 | 14,346 | 7,931 | 33,115 | 135,247 |
| 1948 | ||||||||
| January | 8,977 | 12,646 | 16,520 | 40,610 | 14,125 | 7,890 | 32,820 | 133,588 |
| February | 9,070 | 12,798 | 16,703 | 41,104 | 14,345 | 7,905 | 33,353 | 135,278 |
| March | 9,052 | 12,768 | 16,704 | 41,166 | 14,198 | 7,884 | 33,327 | 135,099 |
| April | 8,984 | 12,813 | 16,764 | 40,995 | 14,294 | 7,833 | 33,355 | 135,038 |
| May | 8,939 | 12,758 | 16,890 | 41,394 | 14,276 | 8,045 | 33,940 | 136,242 |
| June | 8,883 | 12,821 | 16,991 | 41,490 | 14,327 | 8,084 | 34,343 | 136,939 |
| July | 8,889 | 12,916 | 17,117 | 41,537 | 14,337 | 8,231 | 34,688 | 137,715 |
| August | 8,902 | 12,893 | 17,208 | 41,400 | 14,370 | 8,229 | 34,815 | 137,817 |
| September | 8,953 | 12,901 | 17,262 | 41,572 | 14,351 | 8,121 | 34,754 | 137,914 |
| October | 8,978 | 12,825 | 17,219 | 41,298 | 14,356 | 8,165 | 34,942 | 137,783 |
| Working Proprietors | ||||||||
| 1946 | ||||||||
| October | 989 | 1,094 | 1,083 | 2,995 | 731 | 5 | 3,470 | 10,367 |
| 1947 | ||||||||
| April | 991 | 924 | 1,059 | 2,891 | 652 | 4 | 3,480 | 10,001 |
| October | 1,029 | 950 | 1,117 | 3,053 | 659 | 6 | 3,380 | 10,194 |
| 1948 | ||||||||
| April | 1,069 | 923 | 1,090 | 3,142 | 640 | 5 | 3,497 | 10,366 |
| October | 1,113 | 1,024 | 1,166 | 3,268 | 680 | 5 | 3,611 | 10,867 |
| — | Primary Industry (Other than Farming, Fishing, and Hunting). | Secondary Industry. | Transport and Communication (Other than Waterfront Work). | Distribution and Finance. | Domestic and Personal Services. | Administration and Professional. | Seasonal Industries. | Totals, All Industries Covered. |
|---|---|---|---|---|---|---|---|---|
*Not available. † Excluding seasonal industries. | ||||||||
| Employees | ||||||||
| 1946 | ||||||||
| May | 14,140 | 121,701 | 42,568 | 49,576 | 8,683 | 34,754 | * | 271,422† |
| June | 14,159 | 122,695 | 43,010 | 49,771 | 8,733 | 34,936 | * | 273,304† |
| July | 14,129 | 124,229 | 43,294 | 50,165 | 8,790 | 35,245 | * | 275,852† |
| August | 14,043 | 125,398 | 43,639 | 50,431 | 8,836 | 35,447 | 12,347 | 290,141 |
| September | 14,119 | 126,464 | 43,773 | 50,806 | 8,940 | 35,570 | 12,961 | 292,633 |
| October | 14,197 | 127,297 | 44,071 | 50,855 | 9,016 | 35,511 | 13,142 | 294,089 |
| November | 14,151 | 128,989 | 44,459 | 51,184 | 9,092 | 35,700 | 14,906 | 298,481 |
| December | 14,211 | 129,085 | 44,592 | 51,613 | 9,184 | 35,689 | 19,337 | 303,711 |
| 1947 | ||||||||
| January | 14,075 | 127,095 | 44,599 | 51,525 | 9,178 | 35,516 | 22,973 | 304,961 |
| February | 14,168 | 128,671 | 44,834 | 51,880 | 9,200 | 36,007 | 22,727 | 307,487 |
| March | 14,287 | 128,988 | 44,976 | 52,204 | 9,223 | 35,890 | 22,036 | 307,604 |
| April | 14,340 | 129,235 | 45,062 | 52,289 | 9,203 | 35,929 | 20,887 | 306,945 |
| May | 14,510 | 131,296 | 44,834 | 52,411 | 9,109 | 35,613 | 19,530 | 307,303 |
| June | 14,592 | 132,062 | 44,855 | 52,571 | 9,126 | 35,656 | 17,306 | 306,168 |
| July | 14,731 | 133,028 | 44,973 | 52,795 | 9,212 | 35,992 | 14,153 | 304,884 |
| August | 14,816 | 134,004 | 45,180 | 52,939 | 9,248 | 36,186 | 13,503 | 305,876 |
| September | 14,805 | 134,510 | 45,328 | 53,146 | 9,305 | 36,237 | 13,910 | 307,241 |
| October | 14,855 | 134,505 | 45,413 | 53,138 | 9,334 | 36,186 | 14,293 | 307,724 |
| November | 15,045 | 135,427 | 45,510 | 53,681 | 9,428 | 36,232 | 15,803 | 311,126 |
| December | 15,137 | 135,247 | 45,795 | 54,529 | 9,626 | 36,332 | 21,014 | 317,680 |
| 1948 | ||||||||
| January | 15,057 | 133,588 | 45,867 | 54,235 | 9,588 | 36,378 | 24,456 | 319,169 |
| February | 15,355 | 135,278 | 46,214 | 54,487 | 9,590 | 36,868 | 23,792 | 321,584 |
| March | 15,386 | 135,099 | 46,097 | 54,545 | 9,589 | 36,868 | 22,646 | 320,230 |
| April | 15,397 | 135,038 | 46,297 | 54,665 | 9,587 | 36,881 | 20,872 | 318,737 |
| May | 15,449 | 136,242 | 46,648 | 54,963 | 9,612 | 36,908 | 18,319 | 318,141 |
| June | 15,573 | 136,939 | 46,841 | 54,938 | 9,587 | 37,073 | 15,669 | 316,620 |
| July | 15,649 | 137,715 | 47,030 | 55,011 | 9,597 | 37,219 | 13,301 | 315,522 |
| August | 15,772 | 137,817 | 47,144 | 54,911 | 9,643 | 37,232 | 13,585 | 316,104 |
| September | 15,890 | 137,914 | 47,332 | 54,999 | 9,704 | 37,263 | 14,077 | 317,179 |
| October | 15,850 | 137,783 | 47,473 | 54,877 | 9,711 | 37,277 | 14,098 | 317,069 |
| Working Proprietors | ||||||||
| 1946 | ||||||||
| October | 453 | 10,367 | 1,570 | 7,498 | 2,171 | 814 | 108 | 22,981 |
| 1947 | ||||||||
| April | 490 | 10,001 | 1,575 | 7,161 | 2,315 | 529 | 119 | 22,190 |
| October | 539 | 10,194 | 1,507 | 7,143 | 2,268 | 423 | 88 | 22,162 |
| 1948 | ||||||||
| April | 571 | 10,366 | 1,549 | 6,936 | 2,256 | 419 | 120 | 22,217 |
| October | 624 | 10,867 | 1,619 | 7,142 | 2,367 | 396 | 96 | 23,111 |
FEMALES
| — | Food, Drink and Tobacco (Other than Seasonal). | Textiles, Clothing and Leather. | Building Materials and Furnishings. | Engineering and Metal Working. | Miscellaneous Manufacturing. | Power and Water Supply. | Building and Construction. | Totals, Secondary Industry (Other than Seasonal). |
|---|---|---|---|---|---|---|---|---|
| Employees | ||||||||
| 1946 | ||||||||
| May | 4,417 | 20,187 | 987 | 3,648 | 5,750 | 543 | 735 | 36,267 |
| June | 4,394 | 20,129 | 975 | 3,653 | 5,776 | 539 | 741 | 36,207 |
| July | 4,405 | 20,211 | 990 | 3,657 | 5,753 | 545 | 741 | 36,302 |
| August | 4,420 | 20,165 | 994 | 3,610 | 5,775 | 535 | 743 | 36,242 |
| September | 4,500 | 20,506 | 1,002 | 3,620 | 5,775 | 554 | 748 | 36,705 |
| October | 4,467 | 20,372 | 1,019 | 3,614 | 5,850 | 551 | 768 | 36,641 |
| November | 4,654 | 20,672 | 1,063 | 3,637 | 5,882 | 543 | 752 | 37,203 |
| December | 4,757 | 20,624 | 1,070 | 3,648 | 5,933 | 536 | 750 | 37,318 |
| 1947 | ||||||||
| January | 4,527 | 19,520 | 1,026 | 3,559 | 5,576 | 548 | 744 | 35,500 |
| February | 4,591 | 20,426 | 1,059 | 3,651 | 5,760 | 543 | 756 | 36,786 |
| March | 4,603 | 20,618 | 1,068 | 3,684 | 5,772 | 556 | 725 | 37,026 |
| April | 4,635 | 20,597 | 1,074 | 3,753 | 5,776 | 563 | 730 | 37,128 |
| May | 4,622 | 20,703 | 1,018 | 3,755 | 5,847 | 543 | 719 | 37,207 |
| June | 4,606 | 20,864 | 1,017 | 3,781 | 5,878 | 549 | 717 | 37,412 |
| July | 4,616 | 20,848 | 1,007 | 3,820 | 5,897 | 547 | 721 | 37,456 |
| August | 4,648 | 21,017 | 1,035 | 3,843 | 5,937 | 563 | 714 | 37,757 |
| September | 4,676 | 21,155 | 1,050 | 3,832 | 6,020 | 558 | 716 | 38,007 |
| October | 4,724 | 21,243 | 1,047 | 3,865 | 6,096 | 559 | 722 | 38,256 |
| November | 4,726 | 21,336 | 1,085 | 3,916 | 6,142 | 544 | 745 | 38,494 |
| December | 4,761 | 21,329 | 1,101 | 3,966 | 6,128 | 543 | 748 | 38,576 |
| 1948 | ||||||||
| January | 4,595 | 20,263 | 1,037 | 3,883 | 5,684 | 555 | 739 | 36,756 |
| February | 4,702 | 20,883 | 1,075 | 3,904 | 5,863 | 556 | 745 | 37,728 |
| March | 4,658 | 21,128 | 1,064 | 3,863 | 5,808 | 560 | 741 | 37,822 |
| April | 4,641 | 21,152 | 1,069 | 3,868 | 5,764 | 560 | 744 | 37,798 |
| May | 4,625 | 21,100 | 1,030 | 3,824 | 5,718 | 570 | 740 | 37,607 |
| June | 4,588 | 21,205 | 1,000 | 3,798 | 5,776 | 563 | 753 | 37,683 |
| July | 4,593 | 21,269 | 1,011 | 3,779 | 5,694 | 559 | 759 | 37,664 |
| August | 4,597 | 21,321 | 1,042 | 3,774 | 5,673 | 553 | 761 | 37,721 |
| September | 4,690 | 21,471 | 1,028 | 3,765 | 5,727 | 568 | 766 | 38,015 |
| October | 4,741 | 21,450 | 1,018 | 3,732 | 5,743 | 568 | 768 | 38,020 |
| Working Proprietors | ||||||||
| 1946 | ||||||||
| October | 351 | 392 | 14 | 41 | 81 | 879 | ||
| 1947 | ||||||||
| April | 352 | 390 | 13 | 33 | 77 | 865 | ||
| October | 342 | 422 | 13 | 42 | 74 | 893 | ||
| 1948 | ||||||||
| April | 351 | 447 | 14 | 50 | 80 | 942 | ||
| October | 387 | 500 | 21 | 67 | 84 | 1,059 | ||
| — | Primary Industry (Other than Farming, Fishing and Hunting). | Secondary Industry. | Transport and Communication (Other than Waterfront work). | Distribution and Finance. | Domestic and Personal Services. | Administration and Professional | Seasonal Industries. | Totals, All Industries Covered. |
|---|---|---|---|---|---|---|---|---|
*Not available. † Excluding seasonal industries. | ||||||||
| Employees | ||||||||
| 1946 | ||||||||
| May | 256 | 36,267 | 6,201 | 29,583 | 12,377 | 31,658 | * | 116,342† |
| June | 263 | 36,207 | 6,082 | 29,564 | 12,429 | 31,455 | * | 116,000† |
| July | 261 | 36,302 | 5,946 | 29,695 | 12,411 | 31,440 | * | 116,055† |
| August | 258 | 36,242 | 5,800 | 29,673 | 12,414 | 31,509 | 1,281 | 117,177 |
| September | 273 | 36,705 | 5,731 | 29,696 | 12,547 | 31,435 | 1,265 | 117,652 |
| October | 273 | 36,641 | 5,725 | 29,671 | 12,624 | 31,328 | 1,232 | 117,494 |
| November | 246 | 37,203 | 5,716 | 29,400 | 12,638 | 31,199 | 1,273 | 117,675 |
| December | 230 | 37,318 | 5,701 | 30,534 | 12,911 | 31,052 | 1,337 | 119,083 |
| 1947 | ||||||||
| January | 225 | 35,500 | 5,798 | 29,528 | 12,818 | 30,741 | 1,273 | 115,883 |
| February | 233 | 36,786 | 5,724 | 29,547 | 12,803 | 31,116 | 1,310 | 117,519 |
| March | 248 | 37,026 | 5,712 | 29,670 | 12,809 | 31,460 | 1,435 | 118,360 |
| April | 248 | 37,128 | 5,680 | 29,570 | 12,783 | 31,424 | 1,410 | 118,243 |
| May | 252 | 37,207 | 5,688 | 29,404 | 12,645 | 31,490 | 1,398 | 118,084 |
| June | 254 | 37,412 | 5,725 | 29,460 | 12,593 | 31,435 | 1,428 | 118,307 |
| July | 260 | 37,456 | 5,761 | 29,552 | 12,547 | 31,564 | 1,444 | 118,584 |
| August | 262 | 37,757 | 5,750 | 29,586 | 12,606 | 31,542 | 1,432 | 118,935 |
| September | 261 | 38,007 | 5,809 | 29,736 | 12,652 | 31,576 | 1,405 | 119,446 |
| October | 259 | 38,256 | 5,862 | 29,744 | 12,644 | 31,560 | 1,299 | 119,624 |
| November | 255 | 38,494 | 5,959 | 30,138 | 12,942 | 31,409 | 1,358 | 120,555 |
| December | 255 | 38,576 | 6,138 | 31,449 | 13,154 | 31,373 | 1,368 | 122,313 |
| 1948 | ||||||||
| January | 251 | 36,756 | 6,114 | 30,278 | 13,089 | 31,236 | 1,437 | 119,161 |
| February | 254 | 37,728 | 6,144 | 30,376 | 13,134 | 31,776 | 1,489 | 120,901 |
| March | 257 | 37,822 | 6,183 | 30,346 | 13,044 | 31,994 | 1,565 | 121,211 |
| April | 256 | 37,798 | 6,220 | 30,276 | 13,059 | 32,136 | 1,438 | 121,183 |
| May | 252 | 37,607 | 6,282 | 30,397 | 13,058 | 32,060 | 1,415 | 121,071 |
| June | 250 | 37,683 | 6,285 | 30,278 | 13,016 | 32,141 | 1,356 | 121,009 |
| July | 251 | 37,664 | 6,287 | 30,267 | 12,977 | 32,298 | 1,318 | 121,062 |
| August | 255 | 37,721 | 6,289 | 30,180 | 12,952 | 32,201 | 1,294 | 120,892 |
| September | 252 | 38,015 | 6,337 | 30,273 | 13,025 | 32,157 | 1,248 | 121,307 |
| October | 250 | 38,020 | 6,334 | 30,307 | 13,074 | 32,242 | 1,184 | 121,411 |
| Working Proprietors | ||||||||
| 1946 | ||||||||
| October | 1 | 879 | 32 | 1,289 | 1,321 | 212 | 8 | 3,742 |
| 1947 | ||||||||
| April | 1 | 865 | 29 | 1,329 | 1,360 | 215 | 8 | 3,807 |
| October | 1 | 893 | 25 | 1,365 | 1,337 | 214 | 8 | 3,843 |
| 1948 | ||||||||
| April | 2 | 942 | 29 | 1,355 | 1,427 | 195 | 13 | 3,963 |
| October | 5 | 1,059 | 29 | 1,430 | 1,511 | 186 | 6 | 4,226 |
NUMBER OF ESTABLISHMENTS COVERED BY NATIONAL EMPLOYMENT SERVICE STATISTICS
| — | Food, Drink, and Tobacco (Other than Seasonal). | Textiles, Clothing and Leather. | Building Materials and Furnishings. | Engineering and Metal Working. | Miscellaneous Manufacturing. | Power and Water Supply. | Building and Construction. | Totals, Secondary Industry (Other than Seasonal). |
|---|---|---|---|---|---|---|---|---|
| 1946 | ||||||||
| October | 1,232 | 1,625 | 1,327 | 3,155 | 1,017 | 221 | 3,156 | 11,733 |
| 1947 | ||||||||
| April | 1,273 | 1,665 | 1,392 | 3,286 | 1,029 | 223 | 3,106 | 11,974 |
| October | 1,312 | 1,724 | 1,472 | 3,461 | 1,067 | 222 | 3,134 | 12,392 |
| 1948 | ||||||||
| April | 1,378 | 1,894 | 1,591 | 3,692 | 1,096 | 225 | 3,203 | 13,079 |
| October | 1,438 | 1,947 | 1,644 | 3,808 | 1,128 | 223 | 3,313 | 13,501 |
| — | Primary Industry (Other than Farming, Fishing and Hunting). | Secondary Industry. | Transport and Communication (Other than Waterfront Work). | Distribution and Finance. | Domestic and Personal Services. | Administration and Professional. | Seasonal Industries. | Totals, All Industries Covered. |
|---|---|---|---|---|---|---|---|---|
| 1946 | ||||||||
| October | 570 | 11,733 | 2,030 | 11,059 | 3,540 | 3,128 | 649 | 32,709 |
| 1947 | ||||||||
| April | 584 | 11,974 | 2,052 | 11,140 | 3,576 | 3,105 | 721 | 33,152 |
| October | 633 | 12,392 | 2,072 | 11,274 | 3,582 | 3,091 | 651 | 33,695 |
| 1948 | ||||||||
| April | 677 | 13,079 | 2,687 | 11,640 | 3,706 | 3,054 | 729 | 34,972 |
| October | 697 | 13,501 | 2,128 | 11,805 | 3,754 | 3,031 | 663 | 35,579 |
In addition to these half-yearly surveys of the employment position as a whole, the Department maintains a month-to-month record of vacancies, placements, and disengaged persons seeking work.
Notified Vacancies.—There is at present a persistent lack of sufficient labour to satisfy the demands of industry, the extent and distribution of this shortage being measured to some extent by the number of unsatisfied vacancies at the end of each month. Particulars of such vacancies at the end of each month of 1947 and 1948 (together with monthly averages for 1946), classified according to broad industrial groups, are contained in the following table. This table does not necessarily cover the same establishments as in the preceding tables derived from half-yearly surveys; on the one hand, vacancies on farms and in domestic service are included in the following table; on the other hand, there is no obligation on employers to notify their vacancies to the Department.
| — | Primary-Industry. | Building and Construction. | Other Secondary Industries. | Transport and Communication. | Domestic and Personal Services. | Public Administration and Professional. | Other. | Totals. |
|---|---|---|---|---|---|---|---|---|
*Excluding New Zealand Hallways Department. | ||||||||
| 1946 | ||||||||
| Monthly average | 930 | 1,678 | 11,469 | 966* | 1,293 | 2,383 | 1,088 | 19,807 |
| 1947 | ||||||||
| January | 997 | 1,538 | 14,328 | 1,204* | 1,305 | 2,973 | 1,702 | 24,047 |
| February | 938 | 1,770 | 14,569 | 1,297* | 1,322 | 2,682 | 1,687 | 24,265 |
| March | 871 | 1,661 | 14,654 | 993* | 1,243 | 2,671 | 1,888 | 23,981 |
| April | 873 | 1,648 | 14,248 | 808* | 1,204 | 2,571 | 1,775 | 23,127 |
| May | 846 | 1,650 | 13,059 | 3,869 | 1,170 | 2,383 | 1,736 | 24,713 |
| June | 901 | 1,680 | 12,932 | 3,865 | 1,071 | 2,304 | 1,674 | 24,427 |
| July | 923 | 1,657 | 12,850 | 3,828 | 1,102 | 2,447 | 1,620 | 24,427 |
| August | 922 | 1,561 | 12,804 | 3,566 | 1,121 | 2,419 | 1,614 | 24,007 |
| September | 980 | 1,295 | 12,472 | 3,594 | 1,102 | 2,519 | 1,753 | 23,715 |
| October | 1,105 | 1,328 | 12,119 | 3,627 | 1,183 | 3,040 | 1,896 | 24,298 |
| November | 1,152 | 1,494 | 13,377 | 3,645 | 1,207 | 3,373 | 1,915 | 26,163 |
| December | 1,066 | 1,385 | 13,009 | 3,710 | 1,110 | 3,405 | 1,893 | 25,578 |
| 1948 | ||||||||
| January | 974 | 1,338 | 13,155 | 3,760 | 1,133 | 3,345 | 1,876 | 25,581 |
| February | 854 | 1,510 | 13,657 | 3,880 | 1,219 | 3,143 | 1,922 | 26,185 |
| March | 759 | 1,507 | 13,334 | 4,027 | 1,233 | 3,161 | 1,879 | 25,900 |
| April | 667 | 1,377 | 12,911 | 3,795 | 1,214 | 3,241 | 1,888 | 25,093 |
| May | 801 | 1,455 | 12,406 | 3,787 | 1,110 | 3,229 | 1,734 | 24,522 |
| June | 714 | 1,407 | 12,262 | 3,597 | 1,095 | 3,167 | 1,702 | 23,944 |
| July | 773 | 1,251 | 11,940 | 3,508 | 1,103 | 3,138 | 1,736 | 23,449 |
| August | 869 | 1,232 | 10,834 | 3,393 | 1,097 | 3,178 | 1,485 | 22,088 |
| September | 918 | 1,290 | 10,104 | 3,234 | 1,093 | 3,163 | 1,514 | 21,316 |
| October | 864 | 1,297 | 9,891 | 3,153 | 1,039 | 3,210 | 1,577 | 21,031 |
| November | 807 | 1,335 | 10,086 | 3,240 | 1,176 | 3,211 | 1,630 | 21,485 |
| December | 793 | 1,368 | 9,777 | 3,350 | 1,118 | 3,199 | 1,645 | 21,250 |
A classification covering the same period by district grouping is now given.
| — | Auckland. | Wellington and Lower Hutt. | Other North Island. | Christchurch. | Dunedin. | Other South Island. | Totals. |
|---|---|---|---|---|---|---|---|
| 1946 | |||||||
| Monthly average | 5,109 | 5,978 | 2,384 | 2,626 | 2,365 | 1,345 | 19,807 |
| 1947 | |||||||
| January | 5,601 | 7,673 | 2,736 | 3,414 | 2,871 | 1,752 | 24,047 |
| February | 5,610 | 7,828 | 2,693 | 3,417 | 2,856 | 1,861 | 24,265 |
| March | 5,518 | 7,957 | 2,498 | 3,275 | 2,900 | 1,833 | 23,981 |
| April | 5,075 | 7,645 | 2,453 | 3,236 | 2,823 | 1,895 | 23,127 |
| May | 4,270 | 8,258 | 3,535 | 3,522 | 2,931 | 2,197 | 24,713 |
| June | 4,076 | 8,395 | 3,502 | 3,357 | 3,099 | 1,998 | 24,427 |
| July | 4,107 | 8,674 | 3,442 | 3,043 | 3,121 | 2,040 | 24,427 |
| August | 3,977 | 8,325 | 3,532 | 3,042 | 3,087 | 2,044 | 24,007 |
| September | 4,042 | 8,077 | 3,485 | 3,040 | 3,087 | 1,984 | 23,715 |
| October | 4,518 | 7,944 | 3,422 | 3,172 | 3,155 | 2,087 | 24,298 |
| November | 4,912 | 8,212 | 3,890 | 3,812 | 3,173 | 2,164 | 26,163 |
| December | 4,550 | 8,341 | 3,621 | 3,835 | 3,163 | 2,068 | 25,578 |
| 1948 | |||||||
| January | 4,555 | 8,528 | 3,450 | 3,863 | 3,127 | 2,058 | 25,581 |
| February | 5,054 | 8,498 | 3,727 | 3,886 | 3,014 | 2,006 | 26,185 |
| March | 5,044 | 8,425 | 3,596 | 3,824 | 3,022 | 1,989 | 25,900 |
| April | 4,747 | 8,200 | 3,332 | 3,825 | 3,060 | 1,929 | 25,093 |
| May | 4,360 | 8,229 | 3,277 | 3,614 | 3,208 | 1,834 | 24,522 |
| June | 4,240 | 8,030 | 3,086 | 3,685 | 3,213 | 1,690 | 23,944 |
| July | 4,173 | 7,927 | 3,124 | 3,529 | 3,108 | 1,588 | 23,449 |
| August | 4,132 | 7,767 | 2,981 | 2,489 | 3,080 | 1,639 | 22,088 |
| September | 4,020 | 7,053 | 3,001 | 2,596 | 2,990 | 1,656 | 21,316 |
| October | 3,948 | 6,887 | 2,979 | 2,541 | 2,934 | 1,742 | 21,031 |
| November | 3,802 | 7,125 | 3,253 | 2,609 | 2,943 | 1,753 | 21,485 |
| December | 3,627 | 7,282 | 3,054 | 2,647 | 2,871 | 1,769 | 21,250 |
Placements.—An industrial analysis of placements by the National Employment Service during the months of 1947 and 1948 (with totals for 1946) follows: not all these placements were, however, of disengaged persons.
| — | Primary Industry. | Building and Construction. | Other Secondary Industries. | Transport and Communication. | Domestic and Personal Services. | Public Administration and Professional. | Other. | Totals. |
|---|---|---|---|---|---|---|---|---|
| 1946 (totals) | 4,756 | 3,680 | 8,322 | 1,803 | 1,456 | 1,958 | 2,517 | 24,492 |
| 1947 | ||||||||
| January | 719 | 235 | 809 | 79 | 157 | 165 | 350 | 2,514 |
| February | 718 | 248 | 756 | 95 | 132 | 196 | 286 | 2,431 |
| March | 966 | 186 | 686 | 99 | 137 | 180 | 225 | 2,479 |
| April | 498 | 218 | 554 | 101 | 124 | 95 | 221 | 1,811 |
| May | 234 | 255 | 664 | 149 | 153 | 166 | 276 | 1,897 |
| June | 220 | 278 | 496 | 124 | 130 | 114 | 185 | 1,547 |
| July | 274 | 260 | 588 | 168 | 126 | 148 | 198 | 1,762 |
| August | 283 | 248 | 515 | 100 | 111 | 122 | 183 | 1,562 |
| September | 252 | 188 | 521 | 79 | 122 | 163 | 199 | 1,524 |
| October | 384 | 214 | 574 | 85 | 116 | 154 | 187 | 1,714 |
| November | 346 | 163 | 516 | 79 | 110 | 123 | 218 | 1,555 |
| December | 289 | 139 | 463 | 85 | 74 | 126 | 244 | 1,420 |
| 1948 | ||||||||
| January | 828 | 189 | 618 | 56 | 122 | 158 | 261 | 2,172 |
| February | 548 | 221 | 701 | 69 | 157 | 260 | 190 | 2,146 |
| March | 437 | 182 | 605 | 127 | 112 | 199 | 202 | 1,864 |
| April | 1,493 | 243 | 584 | 126 | 119 | 164 | 153 | 2,882 |
| May | 191 | 235 | 475 | 130 | 95 | 163 | 134 | 1,423 |
| June | 253 | 327 | 493 | 131 | 86 | 156 | 106 | 1,552 |
| July | 226 | 389 | 388 | 90 | 88 | 177 | 122 | 1,480 |
| August | 270 | 265 | 462 | 78 | 149 | 135 | 123 | 1,482 |
| September | 197 | 266 | 404 | 59 | 107 | 110 | 109 | 1,252 |
| October | 246 | 207 | 379 | 49 | 107 | 145 | 78 | 1,211 |
| November | 362 | 136 | 509 | 67 | 123 | 119 | 161 | 1,477 |
| December | 288 | 87 | 477 | 48 | 92 | 127,205 | 1,324 |
A classification of these placements by district grouping is contained in the next table.
| — | Auckland. | Wellington and Lower Hutt. | Other South Island. | Christchurch. | Dunedin. | Other South Island. | Totals. |
|---|---|---|---|---|---|---|---|
| 1946 (totals) | 2,921 | 2,804 | 7,983 | 3,033 | 2,690 | 5,061 | 24,492 |
| 1947 | |||||||
| January | 256 | 263 | 652 | 354 | 228 | 761 | 2,514 |
| February | 299 | 303 | 610 | 265 | 236 | 718 | 2,431 |
| March | 291 | 227 | 499 | 180 | 191 | 1,091 | 2,479 |
| April | 182 | 211 | 463 | 191 | 190 | 574 | 1,811 |
| May | 225 | 336 | 581 | 201 | 232 | 322 | 1,897 |
| June | 152 | 214 | 539 | 178 | 157 | 307 | 1,547 |
| July | 168 | 252 | 525 | 237 | 165 | 415 | 1,762 |
| August | 193 | 259 | 487 | 175 | 142 | 306 | 1,562 |
| September | 186 | 221 | 530 | 167 | 144 | 276 | 1,524 |
| October | 240 | 339 | 510 | 133 | 101 | 391 | 1,714 |
| November | 179 | 209 | 527 | 185 | 132 | 323 | 1,555 |
| December | 103 | 238 | 379 | 198 | 221 | 281 | 1,420 |
| 1948 | |||||||
| January | 198 | 320 | 581 | 207 | 92 | 774 | 2,172 |
| February | 243 | 439 | 495 | 257 | 195 | 517 | 2,146 |
| March | 243 | 286 | 492 | 262 | 124 | 457 | 1,864 |
| April | 224 | 285 | 484 | 207 | 109 | 1,573 | 2,882 |
| May | 224 | 264 | 419 | 176 | 111 | 229 | 1,423 |
| June | 193 | 246 | 542 | 154 | 117 | 300 | 1,552 |
| July | 167 | 209 | 555 | 200 | 74 | 275 | 1,480 |
| August | 206 | 238 | 476 | 186 | 131 | 245 | 1,482 |
| September | 163 | 143 | 421 | 172 | 105 | 248 | 1,252 |
| October | 136 | 165 | 375 | 150 | 107 | 278 | 1,211 |
| November | 162 | 173 | 421 | 203 | 155 | 363 | 1,477 |
| December | 154 | 156 | 348 | 188 | 216 | 262 | 1,324 |
Summary.—The following table contains a summary of the numbers of notified vacancies, placements, and disengaged persons for each month of the period January, 1947, to December, 1948, inclusive, together with monthly averages for 1946.
| — | Vacancies at End of Month. | Placements During Month. | Disengaged Persons at End of Month. | ||||||
|---|---|---|---|---|---|---|---|---|---|
| Males. | Females. | Total. | Males. | Females. | Total. | Males. | Females. | Totals. | |
| 1946 | |||||||||
| Monthly average | 8,422 | 11,385 | 19,807 | 1,771 | 270 | 2,041 | 368 | 18 | 386 |
| 1947 | |||||||||
| January | 11,198 | 12,849 | 24,047 | 1,885 | 629 | 2,514 | 90 | 9 | 99 |
| February | 11,749 | 12,516 | 24,265 | 1,852 | 579 | 2,431 | 92 | 16 | 108 |
| March | 11,324 | 12,657 | 23,981 | 1,606 | 873 | 2,479 | 67 | 7 | 74 |
| April | 10,573 | 12,554 | 23,127 | 1,351 | 460 | 1,811 | 62 | 8 | 70 |
| May | 12,821 | 11,892 | 24,713 | 1,591 | 306 | 1,897 | 99 | 9 | 108 |
| June | 12,956 | 11,471 | 24,427 | 1,325 | 222 | 1,547 | 117 | 12 | 129 |
| July | 12,967 | 11,460 | 24,427 | 1,616 | 246 | 1,762 | 121 | 14 | 135 |
| August | 12,408 | 11,599 | 24,007 | 1,330 | 232 | 1,562 | 101 | 5 | 106 |
| September | 11,992 | 11,723 | 23,715 | 1,298 | 226 | 1,524 | 96 | 10 | 106 |
| October | 12,163 | 12,135 | 24,298 | 1,447 | 267 | 1,714 | 84 | 2 | 86 |
| November | 13,506 | 12,657 | 26,163 | 1,293 | 262 | 1,555 | 38 | 6 | 44 |
| December | 13,041 | 12,537 | 25,578 | 1,087 | 333 | 1,420 | 32 | 9 | 41 |
| 1948 | |||||||||
| January | 13,085 | 12,496 | 25,581 | 1,528 | 644 | 2,172 | 24 | 8 | 32 |
| February | 13,920 | 12,265 | 26,185 | 1,483 | 663 | 2,146 | 25 | 7 | 32 |
| March | 13,684 | 12,216 | 25,900 | 1,305 | 559 | 1,864 | 26 | 5 | 31 |
| April | 12,964 | 12,129 | 25,093 | 1,540 | 1,342 | 2,882 | 37 | 6 | 43 |
| May | 12,748 | 11,774 | 24,522 | 1,182 | 241 | 1,423 | 113 | 6 | 119 |
| June | 12,190 | 11,754 | 23,944 | 1,293 | 259 | 1,552 | 133 | 8 | 141 |
| July | 11,599 | 11,850 | 23,449 | 1,261 | 219 | 1,480 | 77 | 5 | 82 |
| August | 11,309 | 10,779 | 22,088 | 1,181 | 301 | 1,482 | 61 | 7 | 68 |
| September | 10,972 | 10,344 | 21,316 | 1,038 | 214 | 1,252 | 90 | 4 | 94 |
| October | 10,824 | 10,207 | 21,031 | 981 | 230 | 1,211 | 48 | 6 | 54 |
| November | 11,348 | 10,137 | 21,485 | 1,118 | 359 | 1,477 | 41 | 4 | 45 |
| December | 11,295 | 9,955 | 21,250 | 1,005 | 319 | 1,324 | 58 | 3 | 61 |
The accumulated demand for female labour is demonstrated by the number of placements in relation to the number of vacancies.
The number of disengaged persons still enrolled for placement by the National Employment Service reached its lowest level (31) at the end of March, 1948. The number was 61 at the end of December, 1948, and it was stated that a considerable proportion of those concerned were suffering from some form of disability, making placement in suitable employment a matter of some difficulty.
EMPLOYMENT IN FACTORIES.—The annual manufacturing census taken by the Census and Statistics Department includes information on employment in factories in New Zealand, and statistics derived from this source are shown in Section 22, especially on pages 362–365.
The definition of a “factory” for the purpose of these statistics (refer page 360) does not, however, agree with that of “manufacturing industries” adopted by the National Employment Service in the “Half-yearly Survey of Employment”—i.e., all secondary industry except building and construction. The following industries are excluded from the former, though included in the latter: slaughtering in abattoirs, bread and cake, &c., baking, tea blending and packing, bespoke dressmaking and tailoring, footwear repair, timber storage, joinery manufacture by builders for their own contracts, monumental masonry, asphalting, blacksmithing, motor-vehicle testing, watch-repairing, making of musical instruments, and water-supply. On the other hand, certain classes of factories fall inside the former definition but outside the latter, though, with the exception of bush sawmilling, these are of little practical importance. It should be observed that seasonal factory industries—i.e., meat processing, &c., fruit and vegetable preserving, and dairy products manufacture—though treated in National Employment statistics as manufacturing industries, are included separately in the seasonal group. Further information on these seasonal industries is given later. Attention may also be drawn to the fact that the National Employment tabulations differ from Factory Production statistics in including managers and foremen, clerical workers, and distributing staff attached to manufacturing establishments in one figure with factory operatives.
PUBLIC WORKS.—Figures are published in the Monthly Abstract of Statistics showing the average numbers engaged during each month on the various classes of public works throughout New Zealand. Average totals under the various headings are as follows, for each of the last five years:—
| Year Ended 31st March, | Roads. | Hydroelectric Works. | Land Improvement, irrigation, &c. | Public Buildings. | Aerodromes. | Railways. | Other Works. | Totals. |
|---|---|---|---|---|---|---|---|---|
| 1944 | 2,660 | 2,079 | 318 | 548 | 761 | 471 | 5,662 | 12,499 |
| 1945 | 2,822 | 2,784 | 400 | 520 | 243 | 473 | 3,117 | 10,359 |
| 1946 | 2,944 | 3,045 | 504 | 699 | 314 | 434 | 2,401 | 10,341 |
| 1947 | 3,547 | 3,328 | 545 | 719 | 378 | 388 | 2,240 | 11,145 |
| 1948 | 4,343 | 3,725 | 496 | 646 | 384 | 189 | 1,984 | 11,767 |
EMPLOYMENT BY LOCAL AUTHORITIES.—Employment by local authorities comprises principally the construction and maintenance of roads and streets, and the operation and maintenance of public-utility industries (gas, electric supply, and tramways) and social services.
Particulars relating to wage-earning employees employed by the various classes of local authorities during the five year period 1943–44 to 1947–48, are presented in the next table. The figures shown are averages of the numbers employed at 15th (or nearest representative day) of each month. The statistics do not cover Hospital Boards, Fire Boards, or Electric-power Boards. Employees of Electric-power Hoards are included in the figures for manufacturing industries, published in the Annual Statistical Report on Factory Production, while employees of Hospital Boards are shown in a subsequent table. There were 487 wage-earning employees of Fire Boards at 31st March, 1948.
| Class of Local District. | Number of Wage-earners (Average of Twelve Mouths Ended March) | ||||
|---|---|---|---|---|---|
| 1944. | 1945. | 1946. | 1947. | 1948. | |
| Boroughs | 7,686 | 8,160 | 8,440 | 8,919 | 9,017 |
| Counties | 3,056 | 3,307 | 3,420 | 3,496 | 3,509 |
| Harbour Boards | 2,322 | 2,334 | 2,310 | 2,306 | 2,480 |
| Urban transport districts | 1,645 | 1,723 | 1,757 | 1,959 | 2,003 |
| River districts | 103 | 123 | 149 | 132 | 83 |
| Urban drainage districts | 149 | 153 | 149 | 163 | 170 |
| Rabbit districts | 334 | 393 | 381 | 389 | 434 |
| Town districts | 147 | 153 | 160 | 143 | 135 |
| Land-drainage districts | 84 | 82 | 84 | 81 | 72 |
| Road districts | 35 | 38 | 39 | 40 | 12 |
| Gas district | 41 | 44 | 63 | 50 | 45 |
| Railway district | 15 | 14 | 20 | 19 | 24 |
| Water-supply district | 1 | 2 | 1 | 7 | 6 |
| Catchment Boards | 2 | 6 | 38 | 156 | |
| All districts | 15,618 | 16,528 | 16,979 | 17,742 | 18,146 |
During the period covered above, employment by local authorities rose steadily to regain approximately its 1928–29 level. Figures for the “depression” years had shown greatly inflated totals, the peak of 50,955 (for all districts covered) being reached in 1933–34. Much of this labour was, of course, paid for out of subsidies granted by the General Government for the relief of unemployment.
The institutional staff of public hospitals and charitable institutions under the control of Hospital Boards was as follows for the last five years ended 31st March.
| Nature of Staff. | 1944. | 1945. | 1946. | 1947. | 1948 |
|---|---|---|---|---|---|
| Stipendiary medical | 560 | 608 | 660 | 724 | 751 |
| Other professional and technical | 486 | 560 | 610 | 655 | 760 |
| Nursing | 6,394 | 6,796 | 6,413 | 6,657 | 6,885 |
| Indoor domestic | 3,802 | 4,066 | 4,059 | 4,270 | 4,418 |
| Outdoor | 722 | 802 | 914 | 999 | 1,045 |
| Miscellaneous | 426 | 474 | 498 | 537 | 575 |
| Totals | 12,390 | 13,306 | 13,154 | 13,842 | 14,434 |
There has been some increase in recent years in the visiting medical staff of Hospital Boards. The figures for the last available five years ended 31st March are as follows: 1944, 390; 1945, 394; 1946, 396; 1947, 466; and 1948, 487.
SEASONAL FLUCTUATIONS IN EMPLOYMENT.—The adoption of the maintenance of full employment as a desideratum in many countries has prompted research into various employment problems, including that of the fluctuation or periodicity of employment. Information on the annual cycle of employment in New Zealand is available from several sources.
National Employment Statistics.—The following table shows in greater detail the month-to-month variations (already recorded on previous pages) in male employment in seasonal industries for the latest thirteen months available—i.e., October, 1947, to October, 1948. The seasonal changes in female employment are less marked, such fluctuations as are evident originating mainly in the fruit and vegetable preserving industry.
| — | Meat Processing, &c. | Fruit and Vegetable Preserving. | Dairy Factories. | Threshing and Chaff-cutting. | Wool Stores. | Totals, Seasonal Industry. |
|---|---|---|---|---|---|---|
| 1947 | Males | |||||
| October | 8,594 | 616 | 3,823 | 40 | 1,220 | 14,293 |
| November | 9,292 | 608 | 4,033 | 32 | 1,838 | 15,803 |
| December | 13,676 | 638 | 4,059 | 39 | 2,602 | 21,014 |
| 1948 | ||||||
| January | 17,011 | 739 | 3,977 | 64 | 2,665 | 24,456 |
| February | 16,511 | 724 | 3,744 | 276 | 2,537 | 23,792 |
| March | 16,066 | 706 | 3,417 | 193 | 2,264 | 22,646 |
| April | 15,050 | 684 | 3,014 | 178 | 1,946 | 20,872 |
| May | 13,487 | 651 | 2,728 | 64 | 1,389 | 18,319 |
| June | 11,457 | 665 | 2,457 | 59 | 1,031 | 15,669 |
| July | 9,174 | 635 | 2,479 | 52 | 961 | 13,301 |
| August | 9,098 | 622 | 2,795 | 46 | 1,024 | 13,585 |
| September | 8,921 | 579 | 3,621 | 39 | 917 | 14,077 |
| October | 8,343 | 565 | 4,077 | 32 | 1,081 | 14,098 |
Factory Production Statistics.—The chief features of seasonality in factory employment are shown in the following table, which covers the thirteen months ended March, 1947. The object of including a thirteenth month is to facilitate elimination of the secular trend which is superimposed upon the seasonal variations.
| — | Males. | Females. | |||||||||
|---|---|---|---|---|---|---|---|---|---|---|---|
| Seasonal Industries. | All Other Factory Industries. | All Factory Industries. | Seasonal Industries. | All Other Factory Industries. | All Factory Industries. | ||||||
| Meat Freezing and Preserving. | Butter, Cheese, &c., Factories. | Sausage - casing Manufacture. | Chemical Fertilizers. | Totals. | Meat Freezing and Preserving. | Fruit Preserving and Jam-making. | |||||
| 1946 | |||||||||||
| March | 13,299 | 2,761 | 318 | 801 | 17,179 | 68,046 | 85,225 | 479 | 481 | 26,588 | 27,548 |
| April | 11,865 | 2,462 | 225 | 859 | 15,411 | 69,180 | 84,591 | 511 | 393 | 26,563 | 27,467 |
| May | 11,206 | 2,181 | 205 | 930 | 14,522 | 70,029 | 84,551 | 460 | 323 | 26,607 | 27,390 |
| June | 9,423 | 1,716 | 167 | 968 | 12,274 | 70,527 | 82,801 | 429 | 328 | 26,590 | 27,347 |
| July | 6,773 | 1,679 | 95 | 953 | 9,500 | 71,175 | 80,675 | 417 | 328 | 26,669 | 27,414 |
| August | 6,326 | 2,158 | 73 | 956 | 9,513 | 71,635 | 81,148 | 406 | 296 | 26,633 | 27,335 |
| September | 6,060 | 2,864 | 63 | 972 | 9,959 | 72,132 | 82,091 | 406 | 260 | 26,936 | 27,602 |
| October | 5,573 | 3,319 | 69 | 1,015 | 9,976 | 72,447 | 82,423 | 407 | 264 | 27,013 | 27,684 |
| November | 6,551 | 3,561 | 101 | 1,010 | 11,223 | 72,869 | 84,092 | 400 | 286 | 27,227 | 27,919 |
| December | 10,271 | 3,569 | 295 | 953 | 15,088 | 72,844 | 87,932 | 411 | 283 | 27,093 | 27,787 |
| 1947 | |||||||||||
| January | 13,387 | 3,469 | 306 | 881 | 18,043 | 71,873 | 89,916 | 379 | 304 | 25,347 | 26,030 |
| February | 13,060 | 8,228 | 277 | 905 | 17,470 | 72,715 | 90,185 | 401 | 347 | 26,468 | 27,216 |
| March | 12,848 | 2,959 | 248 | 884 | 16,939 | 72,786 | 89,725 | 415 | 448 | 26,569 | 27,432 |
An examination of these figures of male employment indicates: (1) A fluctuation of approximately 8,500 in the seasonal industries with a crest in January and a trough in July; (2) a total increase of 4,500 during the year covered, to which, however, the seasonal industries made no contribution; (3) over 75 per cent. of the annual gain in non-seasonal industries occurred during the five months from March to August, and there was an actual decline in December and January; and (4) it thus appears that a proportion (estimated at one-fifth) of the man-power released from seasonal factory industries during the slack months was taken up by general factory industries.
Generalizations made from these results (which refer only to a single year) must of course be made with caution. Statistics for earlier years are more difficult of interpretation on account of the masking of normal seasonal movements by callings up for military service on the one hand and demobilizations on the other. In periods of greater unemployment the temporary diversion of labour from non-seasonal to seasonal manufacturing industries during the busy months might not occur.
The table of female employment shown above reveals little, if any, seasonal variation with the exception of the January recession. This recession is due partly to the practice adopted by some women operatives of leaving work temporarily after the Christmas period for an extended summer vacation, but partly also through withdrawals from factory work in favour of domestic duties, &c., tending to be higher at the end of a calendar year, these losses not being offset until later by the entry of juvenile and other recruitments.
Public Works.—Since 1935 figures have been available which include not only the number of workers in the direct employ of the Works Department, but also those employed by contractors for public works, and those employed by local authorities on (a) works which are financed wholly or partly by the Works Department, and (b) highway or road construction and maintenance. In the next table monthly figures on this basis are given for the last five years.
| Month. | 1944. | 1945. | 1946. | 1947. | 1948. |
|---|---|---|---|---|---|
| January | 11,534 | 9,928 | 10,487 | 11,092 | 11,254 |
| February | 11,487 | 10,127 | 10,445 | 11,300 | 11,578 |
| March | 11,643 | 10,177 | 10,532 | 11,089 | 11,578 |
| April | 11,278 | 10,194 | 10,303 | 11,403 | 11,540 |
| May | 11,240 | 10,288 | 10,742 | 11,539 | 11,783 |
| June | 10,844 | 10,339 | 10,848 | 11,708 | 11,818 |
| July | 10,391 | 10,191 | 11,483 | 12,023 | 11,931 |
| August | 9,956 | 10,123 | 11,357 | 12,205 | 12,293 |
| September | 10,045 | 10,202 | 11,615 | 12,286 | 12,110 |
| October | 10,071 | 10,322 | 11,600 | 12,268 | 12,133 |
| November | 10,077 | 10,522 | 11,265 | 11,746 | 12,059 |
| December | 10,174 | 10,448 | 11,042 | 11,621 | 11,819 |
The seasonal pattern has in recent years tended to a peak in August or September.
Local Authorities Statistics.—The following five-year table of employment by local authorities exhibits no significant seasonal fluctuation with the exception of a slight January recession. In 1939–40 and some earlier years a maximum in August was observed. Employees of Electric-power Boards are included here as well as in factory employment. Those of Hospital Boards and Fire Boards are not included.
| Month. | 1943–44. | 1944–45. | 1945–46. | 1946–47. | 1947–48. |
|---|---|---|---|---|---|
| April | 16,555 | 17,475 | 17,746 | 18,951 | 19,403 |
| May | 16,704 | 17,626 | 17,727 | 19,162 | 19,520 |
| June | 16,768 | 17,487 | 17,729 | 19,511 | 19,562 |
| July | 16,918 | 17,905 | 18,214 | 19,495 | 19,752 |
| August | 16,939 | 17,677 | 18,181 | 19,589 | 19,810 |
| September | 16,852 | 17,982 | 18,201 | 19,495 | 19,841 |
| October | 16,787 | 18,033 | 18,748 | 19,616 | 19,971 |
| November | 16,389 | 18,150 | 19,117 | 19,494 | 20,051 |
| December | 17,126 | 18,075 | 19,011 | 19,495 | 20,116 |
| January | 16,911 | 17,738 | 18,653 | 19,251 | 19,848 |
| February | 17,072 | 18,051 | 19,363 | 19,229 | 20,078 |
| March | 17,294 | 17,953 | 19,239 | 19,322 | 19,845 |
Effect of Seasonal Variations on Unemployment.—The following propositions have been enunciated:—
When unemployment is at low levels (as for instance in 1925, 1926, and 1927) there is usually a peak unemployment point in each year which corresponds with the slackest period for seasonal activities, but the fluctuations in unemployment levels are small compared with changes in employment in seasonal activities.
During periods of mass unemployment (e.g., 1931–1934) the employment fluctuations in the more important seasonal industries are reflected in the unemployment figures, and in the worst years almost all those whoso services are not required for seasonal work during the off season are added to the ranks of the unemployed.
Under the existing (1949) conditions of labour shortage the seasonal fluctuation in unemployment levels is very small and the effect of seasonal activities on the supply and demand for labour is reflected in the higher incidence of labour shortage during the peak of seasonal activity each year. Labour shortage thus concentrates attention on the supply side (the recruitment of labour for work in seasonal industries during the busy season) rather than on the demand side (the provision of alternative employment for seasonal workers during the off season).
Seasonal movements on both demand and supply sides, as estimated by the National Employment Service for present-day conditions of full employment, are indicated in the two following tables. The figures are in thousands and August is taken as zero month throughout. Thus 7 entered under December indicates a demand (or supply) 7,000 greater in December than in August.
SEASONAL LABOUR DEMAND
| — | July. | Aug. | Sept. | Oct. | Nov. | Dec. | Jan. | Feb. | Mar. | April. | May. | June |
|---|---|---|---|---|---|---|---|---|---|---|---|---|
| Industries engaged in processing farm products | 1 | 2 | 7 | 10 | 10 | 9 | 7 | 5 | 3 | |||
| Seasonal activities on farms— | ||||||||||||
| Peak milk-yield | 1 | 2 | 3 | 3 | 3 | 2 | 1 | |||||
| Shearing | 1 | 3 | 4 | 2 | ||||||||
| Harvesting, fruit-picking, tobacco work, &c. | 2 | 4 | 5 | 4 | 1 | |||||||
| Christmas shopping season | 3 | |||||||||||
| Totals | 1 | 4 | 8 | 19 | 19 | 17 | 14 | 8 | 5 | 3 |
SEASONAL LABOUR SUPPLY
| — | July. | Aug. | Sept. | Oct. | Nov. | Dec. | Jan. | Feb. | Mar. | April | May. | June |
|---|---|---|---|---|---|---|---|---|---|---|---|---|
* Below August level. | ||||||||||||
| Diversions from other industries— | ||||||||||||
| Industries (e.g., hunting and trapping) with a winter peak | 1 | 2 | 2 | 3 | 2 | 2 | 1 | |||||
| Government and local authority works tapered off | 1 | 1 | 1 | 1 | 1 | 1 | 1 | |||||
| Maintenance, &c., work on farms temporarily reduced | 1 | 2 | 2 | 3 | 1 | 1 | ||||||
| Lower-paid industries from which labour is attracted to freezing-works, &c. | 1 | 2 | 2 | 2 | 2 | 1 | 1 | 1 | ||||
| Temporary accessions to labour force— | ||||||||||||
| Small - holders, &c. (for extra earnings) | 1 | 1 | 2 | 3 | 3 | 2 | 2 | 1 | 1 | |||
| Students (during long vacation) | 1 | 2 | 3 | 2 | ||||||||
| Married women and others— | ||||||||||||
| For harvesting, fruit-picking, &c. | 1 | 2 | 3 | 3 | 1 | |||||||
| For Christmas shopping | 3 | |||||||||||
| Seasonal changes in juvenile labour force | 1 | -1* | -1* | -1* | 1 | 4 | 4 | 4 | 3 | 2 | 1 | |
| Totals | 1 | 1 | 3 | 7 | 18 | 19 | 17 | 14 | 8 | 5 | 3 | |
The situation depicted above applies only in a typical year of a full employment economy. The resultant approximate balance is liable to disturbance at any time by such influences as abnormal weather conditions affecting the time of the seasonal peak, or changes in Government policy with regard to the school leaving age or in the direction of greater concentration on works programmes.
THE compilation of statistics regarding industrial disputes was first undertaken by the Census and Statistics Department at the beginning of the year 1920. Information concerning disputes prior to that year was obtained by examination of the records of the Labour Department.
Under the system originated in 1920, returns furnished by Inspectors of Factories from inquiries made in each district form the main source from which information is obtained. It is considered that the statistics based on these reports are less liable to bias than would be the case if parties to the dispute or other private persons were relied on to furnish the information. It is the duty of an Inspector, during the course of a dispute in his industrial district, to collect all available particulars relating to it. The Inspectors have power to make the necessary inquiries, and thus are able to obtain complete information.
In these tabulations the term “industrial dispute” refers only to those disputes which result in a strike or a lockout, or where organized “go slow” or other passive resistance methods are clearly manifested. Many disputes are, of course, settled without recourse to such measures; these are not recorded for statistical purposes.
It occasionally happens that there are strikes in different centres with the same or similar objects, and occurring at or about the same time; in such cases the several disturbances are treated as one if the available evidence is sufficient to justify such a course, while the duration is taken as the maximum duration in any centre.
Reference to enactments framed to mitigate the severity of industrial disputes will be found in Section 39 of this Year-Book (Labour Laws and Allied Legislation).
NUMBER AND MAGNITUDE.—Although the records of the Labour Department contain certain information regarding industrial disputes which occurred prior to 1920 (the year in which the present system of reporting was instituted), the details are not sufficiently complete to permit of a full comparison with later years. This applies also in some measure to 1920, as information under some headings did not become available until 1921. Consequently, the following summary has been divided into two parts—viz., 1906–20 and 1921–48.
In the first part only the total number of disputes occurring during the period is shown, together with the number of disputes and workers involved where such information is available.
| Year. | Total Disputes. | Disputes where Complete Details available. | |
|---|---|---|---|
| Number. | Workers involved. | ||
| 1906 | 1 | 1 | 88 |
| 1907 | 6 | 5 | 558 |
| 1908 | 2 | 2 | 63 |
| 1909 | 1 | ||
| 1910 | 15 | 9 | 255 |
| 1911 | 22 | 17 | 1,375 |
| 1912 | 24 | 22 | 5,746 |
| 1913 | 73 | 70 | 13,400 |
| 1914 | 20 | 19 | 4,089 |
| 1915 | 8 | 6 | 295 |
| 1916 | 15 | 9 | 899 |
| 1917 | 45 | 25 | 2,734 |
| 1918 | 40 | 29 | 4,056 |
| 1919 | 45 | 32 | 4,030 |
| 1920 | 77 | 77 | 15,138 |
The more detailed figures for the period 1921–48 are as follows:—
| Year. | Strikes. | Lockouts. | Total Disputes. | Firms affected. | Workers involved. | Working-days lost. | Estimated Loss in Wages. |
|---|---|---|---|---|---|---|---|
| £ | |||||||
| 1921 | 77 | 77 | 112 | 10,433 | 119,208 | 90,477 | |
| 1922 | 58 | 58 | 67 | 6,414 | 93,456 | 60,782 | |
| 1923 | 49 | 49 | 79 | 7,162 | 201,812 | 114,074 | |
| 1924 | 34 | 34 | 58 | 14,815 | 89,105 | 62,732 | |
| 1925 | 81 | 2 | 83 | 93 | 9,905 | 74,552 | 49,149 |
| 1926 | 59 | 59 | 67 | 6,264 | 47,811 | 32,355 | |
| 1927 | 38 | 38 | 40 | 4,476 | 12,485 | 11,819 | |
| 1928 | 37 | 2 | 39 | 56 | 9,258 | 21,997 | 22,304 |
| 1929 | 46 | 1 | 47 | 60 | 7,151 | 25,889 | 26,940 |
| 1930 | 38 | 38 | 44 | 5,467 | 31,669 | 37,299 | |
| 1931 | 23 | 1 | 24 | 37 | 6,356 | 48,486 | 44,544 |
| 1932 | 23 | 23 | 67 | 9,355 | 108,605 | 105,715 | |
| 1933 | 15 | 15 | 43 | 3,558 | 65,099 | 59,334 | |
| 1934 | 24 | 24 | 37 | 3,773 | 10,393 | 7,121 | |
| 1935 | 12 | 12 | 65 | 2,323 | 18,563 | 15,266 | |
| 1936 | 43 | 43 | 128 | 7,354 | 16,980 | 12,886 | |
| 1937 | 52 | 52 | 73 | 11,411 | 29,916 | 32,129 | |
| 1938 | 72 | 72 | 103 | 11,388 | 35,456 | 42,104 | |
| 1939 | 66 | 66 | 636 | 15,682 | 53,801 | 60,394 | |
| 1940 | 56 | 1 | 57 | 99 | 10,475 | 28,097 | 28,062 |
| 1941 | 89 | 89 | 97 | 15,261 | 26,237 | 34,552 | |
| 1942 | 65 | 65 | 78 | 14,345 | 51,189 | 63,179 | |
| 1943 | 69 | 69 | 114 | 10,915 | 14,687 | 20,179 | |
| 1944 | 148 | 1 | 149 | 269 | 29,766 | 52,602 | 74,012 |
| 1945 | 154 | 154 | 1,255 | 39,418 | 66,629 | 92,546 | |
| 1946 | 96 | 96 | 122 | 15,696 | 30,393 | 40,112 | |
| 1947 | 134 | 134 | 234 | 26,970 | 102,725 | 187,669 | |
| 1948 | 101 | 101 | 885 | 28,494 | 93,464 | 195,985 |
A refusal by seamen in 1947 to perform overtime work is not included in these figures.
The figures for strikes include cases where, following a recognized stop-work meeting, the employees; did not resume work for some hours or until next day. This class of strike has assumed considerable importance recently, the number of such cases in the five years 1944–48 being 93, involving 20,856 workers and the loss of 19,263 working-days and of £29,940 in wages.
In calculating the number of working-days lost, it is assumed that work would have been continuous if no dispute had taken place. No allowance is made for loss of work from unemployment or other causes which might have occurred even if there had been no dispute, nor is the possibility taken into account of strikers being replaced with non-union labour. In some cases, such as shearing, there is a definite amount of work to be done, and a stoppage of work does not decrease the total amount of it, but only postpones its completion. In those cases the figures are perhaps more or less fictitious, but in the great majority of cases they represent a real loss.
From the preceding tables it will be seen that the number of disputes occurring in any one year was comparatively small until 1913, the high point for that year coinciding with the watersiders' and slaughtermen's strikes of the period. The total for 1913 was not surpassed until 1920 and 1921, the present system of recording industrial disputes being commenced in the latter year. In 1921 the number of disputes was at a relatively high level, but from then onwards, with the exception of one or two temporary fluctuations, the general trend in both number of disputes and number of workers involved showed a downward tendency, culminating in the low figure of 12 disputes involving 2,323 workers in 1935.
The following ten years exhibited a significant reversal of this trend, although the upward movement was temporarily arrested in 1940 and 1943. In 1945, records (not since broken) were established for the number of disputes (154) and the number of workers involved (39,418). The greatest number of working-days lost in any one year, however, is still 201,812 in 1923, but the estimated loss in wages during that year (£114,074) has now been exceeded by the 1947 and 1948 totals of £187,669 and £195,985 respectively. Compared with the two previous years, 1946 evidenced a marked general decline, but the 1947 and 1948 figures again showed increases under most headings, the number of working-days lost in 1947 (102,725) being with one exception (108,605 days in 1932) the highest since 1923.
The practice of members of a union returning home after a stop-work meeting or absenting themselves from work for a period as a “protest only” against an alleged injustice has increased greatly over the last few years. In 1945 these practices were responsible for 52 out of 154 stoppages, in 1946 for 22 out of 96 stoppages, in 1947 for 36 out of 134 stoppages, and in 1948 for 38 out of 101 stoppages.
The maximum figure for time lost, recorded in 1923, reflected the serious disputes which occurred in that year in the coal-mining and shipping industries. Next in order came 1921 (marked by strikes of waterside workers), 1932 (chiefly strikes of waterside workers and coal-miners), 1947 (stoppages among waterside workers, freezing-workers, and coal-miners), and 1948 (disturbances in the coal-mining, waterfront, and building and construction industries).
NATURE AND DURATION.—The next table shows the nature of the disputes and the number of workers involved during the years 1937–48.
| Year. | Nature of Dispute. | Number of Workers Involved. | ||||||||
|---|---|---|---|---|---|---|---|---|---|---|
| Direct Strike. | Sympathetic Strike. | Partial Strike.* | Lockout. | Total | Direct Strike. | Sympathetic Strike. | Partial Strike.* | Lockout. | Total. | |
*, where no actual cessation of work, but a “go slow” or other policy of protest adopted. | ||||||||||
| 1937 | 51 | 1 | 52 | 10,411 | 1,000 | 11,411 | ||||
| 1938 | 70 | 1 | 1 | 72 | 11,107 | 55 | 226 | 11,388 | ||
| 1939 | 65 | 1 | 66 | 14,811 | 871 | 15,682 | ||||
| 1940 | 52 | 1 | 3 | 1 | 57 | 8,630 | 614 | 1,197 | 34 | 10,475 |
| 1941 | 88 | 1 | 89 | 15,247 | 14 | 15,261 | ||||
| 1942 | 63 | 1 | 1 | 65 | 13,934 | 211 | 200 | 14,345 | ||
| 1943 | 66 | 3 | 69 | 10,689 | 226 | 10,915 | ||||
| 1944 | 144 | 2 | 2 | 1 | 149 | 28,893 | 578 | 232 | 63 | 29,766 |
| 1945 | 145 | 1 | 8 | 154 | 36,698 | 334 | 2,386 | 39,418 | ||
| 1946 | 92 | 1 | 3 | 96 | 15,283 | 270 | 143 | 15,696 | ||
| 1947 | 123 | 4 | 7 | 134 | 19,495 | 1,958 | 5,517 | 26,970 | ||
| 1948 | 90 | 3 | 8 | 101 | 23,745 | 480 | 4,269 | 28,494 | ||
The table following illustrates the duration of disputes during 1948 (1947 being shown below in italics).
| Duration. | Number of Disputes. | Number of Workers involved. | Number of Working-days lost. | Estimated Loss In Wages. |
|---|---|---|---|---|
| £ | ||||
| 1 day and less | 65 | 17,113 | 12,651 | 20,698 |
| 73 | 9,505 | 8,334 | 13,429 | |
| Over 1 day but not over 2 | 5 | 1,096 | 575 | 2,991 |
| 16 | 2,439 | 3,361 | 4,835 | |
| Over 2 days but not over 3 | 4 | 1,309 | 3,900 | 5,224 |
| 10 | 1,041 | 2,595 | 3,944 | |
| Over 3 days but less than 1 week | 8 | 866 | 3,131 | 4,264 |
| 10 | 1,012 | 3,817 | 6,930 | |
| 1 week but less than 2 weeks | 7 | 1,831 | 4,110 | 11,390 |
| 17 | 6,420 | 33,811 | 53,287 | |
| 2 weeks but less than 4 weeks | 5 | 1,141 | 13,155 | 25,602 |
| 2 | 1,281 | 16,860 | 20,022 | |
| 4 weeks but less than 8 weeks | 3 | 2,830 | 41,101 | 93,881 |
| 4 | 5,200 | 33,605 | 77,736 | |
| 8 weeks and over | 4 | 2,308 | 14,841 | 31,935 |
| 2 | 72 | 342 | 7,486 | |
| Totals | 101 | 28,494 | 93,464 | 195,985 |
| 134 | 26,970 | 102,725 | 187,669 |
GEOGRAPHICAL DISTRIBUTION.—The following table shows the number of disputes in each industrial district for the last five years and also the number of workers involved. In 1948 the Northern District had the greatest number both of strikes and of workers involved, the coal-mining industry being strongly represented, followed by the waterfront and the meat-freezing and the building and construction industries.
| Year. | Northern. | Taranaki. | Wellington. | Marlborough. | Nelson. | West-land. | Canterbury. | Otago and Southland. | Totals. |
|---|---|---|---|---|---|---|---|---|---|
| Number of Disputes | |||||||||
| 1944 | 43 | 24 | 32 | 15 | 35 | 149 | |||
| 1945 | 65 | 15 | 1 | 35 | 6 | 32 | 154 | ||
| 1946 | 45 | 14 | 3 | 13 | 6 | 15 | 96 | ||
| 1947 | 62 | 1 | 11 | 1 | 31 | 14 | 14 | 134 | |
| 1948 | 51 | 2 | 20 | 1 | 10 | 8 | 9 | 101 | |
| Number of Workers involved | |||||||||
| 1944 | 10,861 | 7,096 | 6,292 | 1,165 | 4,352 | 29,766 | |||
| 1945 | 18,859 | 6,106 | 17 | 10,118 | 455 | 3,863 | 39,418 | ||
| 1946 | 7,929 | 2,642 | 187 | 2,444 | 760 | 1,734 | 16,696 | ||
| 1947 | 11,629 | 225 | 2,698 | 150 | 6,435 | 4,044 | 1,789 | 26,970 | |
| 1948 | 16,393 | 331 | 5,547 | 7 | 1,870 | 2,260 | 2,086 | 28,494 | |
INDUSTRIAL DISTRIBUTION.—In the following table industrial disputes are classified according to the industrial groups in which disputes took place, this grouping being the same as that used in the compilation of wage and trade-union statistics.
| Industrial Group. | 1944. | 1945. | 1946. | 1947. | 1948. |
|---|---|---|---|---|---|
| Number of Disputes | |||||
| Provision of— | |||||
| Food, drink, &c. | 31 | 27 | 29 | 29 | 16 |
| Clothing, footwear, and textiles | 1 | 4 | 1 | 1 | 2 |
| Building and construction | 1 | 1 | 1 | 7 | 13 |
| Power, heat, and light | 3 | 2 | 2 | ||
| Transport by water | 29 | 15 | 12 | 17 | 20 |
| Transport by land | 2 | 6 | 2 | 6 | 4 |
| Accommodation, meals, and personal service | 3 | 1 | |||
| Working in or on— | |||||
| Wood, &c. | 6 | 7 | 3 | 4 | 4 |
| Metal | 6 | 6 | 4 | ||
| Stone, clay, glass, chemicals, &c. | 5 | 3 | 3 | 7 | 1 |
| Paper, printing, &c. | 1 | 1 | 1 | ||
| Skins, leather, &c. | 1 | ||||
| Mines and quarries— | |||||
| Coal-mines | 66 | 75 | 40 | 53 | 37 |
| Gold-mines | 2 | ||||
| The land (farming pursuits) | 2 | 1 | 1 | ||
| Miscellaneous | 2 | 1 | 2 | 1 | |
| Totals | 149 | 154 | 96 | 134 | 101 |
| Industrial Group. | 1944. | 1945. | 1946. | 1947. | 1948. |
|---|---|---|---|---|---|
| Number of Workers invoked | |||||
| Provision of— | |||||
| Food, drink, &c. | 4,303 | 4,689 | 4,389 | 6,399 | 3,785 |
| Clothing, footwear, and textiles | 1,581 | 1,318 | 27 | 42 | 142 |
| Building and construction | 3 | 257 | 42 | 233 | 5,573 |
| Power, heat, and light | 538 | 119 | 364 | ||
| Transport by water | 8,484 | 2,560 | 3,689 | 6,931 | 5,694 |
| Transport by land | 747 | 4,547 | 61 | 408 | 3,346 |
| Accommodation, meals, and personal service | 317 | 35 | |||
| Working in or on— | |||||
| Wood, &c. | 186 | 2,957 | 91 | 54 | 111 |
| Metal | 6,767 | 331 | 384 | ||
| Stone, clay, glass, chemicals, &c. | 337 | 246 | 293 | 894 | 235 |
| Paper, printing, &c. | 49 | 179 | 180 | ||
| Skins, leather, &c. | 247 | ||||
| Mines and quarries— | |||||
| Coal-mines | 13,313 | 15,192 | 6,754 | 11,122 | 9,224 |
| Gold-mines | 145 | ||||
| The land (farming pursuits) | 98 | 16 | 3 | ||
| Miscellaneous | 127 | 41 | 133 | 12 | |
| Totals | 29,766 | 39,418 | 15,696 | 26,970 | 28,494 |
Out of a total of 634 disputes during the five years, 273, involving 55,750 workers occurred in connection with mining and quarrying; 132, involving 23,565 workers in the group covering provision of food, &c. (mainly meat-freezing); while in the group covering transport by water there were 93 disputes involving 27,358 workers. A more detailed analysis of disputes occurring during 1947 and 1948 is given below.
| Industrial Group. | Number of Firms Affected. | Number of Workers Indirectly Involved. | Number of Working-days Lost. | Estimated Loss in Wages. | ||||
|---|---|---|---|---|---|---|---|---|
| 1947. | 1948. | 1947. | 1948. | 1947. | 1948. | 1947. | 1948. | |
| Provision of— | ||||||||
| £ | £ | |||||||
| Food, drink, &c. | 39 | 24 | 350 | 165 | 28,950 | 6,031 | 50,168 | 14,907 |
| Clothing, footwear, and textiles | 1 | 2 | 20 | 168 | 18 | 240 | 22 | |
| Building and construction | 7 | 683 | 29 | 1,139 | 23,081 | 1,474 | 45,726 | |
| Power, heat, and light | 2 | 1,187 | 1,740 | |||||
| Transport by water | 71 | 54 | 24 | 1,622 | 38,761 | 27,960 | 81,048 | 67,926 |
| Transport by land | 27 | 21 | 231 | 536 | 2,615 | 657 | 3,219 | |
| Accommodation, meals, and personal service | ||||||||
| Working in or on— | ||||||||
| Wood, &c. | 6 | 4 | 38 | 385 | 33 | 420 | ||
| Metal | 6 | 49 | 3 | 3,193 | 160 | 5,436 | 305 | |
| Stone, clay, glass, chemicals, &c. | 12 | 3 | 1,251 | 1,499 | ||||
| Paper, printing, &c. | 1 | 2,070 | 3,500 | |||||
| Skins, leather, &c. | ||||||||
| Mines and quarries— | ||||||||
| Coal-mines | 60 | 45 | 215 | 1,150 | 25,408 | 33,214 | 41,874 | 63,460 |
| Gold-mines | ||||||||
| The land (farming pursuits) | ||||||||
| Miscellaneous | 2 | 24 | ||||||
| Totals | 234 | 885 | 641 | 3,168 | 102,725 | 93,464 | 187,669 | 195,985 |
CAUSES.—In the next table the causes of disputes which occurred during the last five years are shown. Under the heading “Wages” are included disputes concerning wages, overtime, or rates for piecework.
Disputes concerning the employment or non-employment of certain classes of persons are included under the heading “Employment.” This question usually arises in connection with trade-union affairs, such as, for instance, the dismissal of a worker on allegedly insufficient grounds, or, until recently, the employment of non-unionists. Since 1936, however, all adult workers who are subject to any award or industrial agreement have been required to be members of a union, and unless there are no unionists available an employer may not employ a non-unionist.
“Other working conditions” are of diverse nature, but some may be mentioned as follows: Distribution of work in coal-mines and on wharves, conveyance to and from work, atmospheric conditions in coal-mines, accommodation on ships, numbers of men to be allocated to certain duties, supply of food, method of handling cargo.
Under the heading “Sympathy” are included all disputes caused by workers striking, not on account of a grievance arising out of their own wages or conditions, but in sympathy with the demands of other workers.
| Cause. | 1944. | 1945. | 1946. | 1947. | 1948. |
|---|---|---|---|---|---|
| Number of Disputes | |||||
| Wages | 34 | 42 | 21 | 57 | 30 |
| Hours | 4 | 3 | 7 | 4 | 4 |
| Employment | 14 | 32 | 12 | 24 | 12 |
| Other working-conditions | 76 | 37 | 36 | 14 | 13 |
| Sympathy | 2 | 1 | 1 | 4 | 5 |
| Other causes | 19 | 39 | 19 | 31 | 37 |
| Number of Workers involved | |||||
| Wages | 5,662 | 17,438 | 3,588 | 13,780 | 8,398 |
| Hours | 1,404 | 374 | 1,177 | 434 | 2,440 |
| Employment | 1,273 | 5,727 | 1,193 | 3,092 | 3,496 |
| Other working-conditions | 14,992 | 8,361 | 6,576 | 2,733 | 4,809 |
| Sympathy | 578 | 334 | 270 | 1,958 | 620 |
| Other causes | 5,850 | 7,184 | 2,892 | 4,973 | 8,731 |
The following table gives further details for the year 1947 and 1948.
| Cause. | Number of Firms Affected. | Number of Working-days Lost. | Estimated Loss in Wages. | |||
|---|---|---|---|---|---|---|
| 1947. | 1948. | 1947. | 1948. | 1947. | 1948. | |
| £ | £ | |||||
| Wages | 130 | 424 | 72,686 | 33,476 | 139,679 | 70,432 |
| Hours | 4 | 11 | 2,328 | 1,091 | 3,504 | 1,771 |
| Employment | 24 | 16 | 7,015 | 24,866 | 11,990 | 47,284 |
| Other working-conditions | 15 | 28 | 5,306 | 24,992 | 7,995 | 59,125 |
| Sympathy | 9 | 14 | 8,874 | 455 | 14,076 | 449 |
| Other causes | 52 | 392 | 6,516 | 8,584 | 10,425 | 16,924 |
| Totals | 234 | 885 | 102,725 | 93,464 | 187,669 | 195,985 |
METHODS OF SETTLEMENT.—Following is a table showing the methods of settlement of disputes during the last five years. “Negotiations under Act” covers negotiations under both the Industrial Conciliation and Arbitration Act and the Labour Disputes Investigation Act. Other headings are self-explanatory.
| Method of Settlement. | 1944. | 1945. | 1946. | 1947. | 1948. |
|---|---|---|---|---|---|
| Number of Disputes | |||||
| Negotiations under Act | 27 | 30 | 17 | 28 | 16 |
| Private negotiations between parties | 39 | 32 | 32 | 37 | 20 |
| Intervention of third party | 27 | 35 | 21 | 23 | 8 |
| Substitution | 1 | 1 | 1 | 2 | |
| “Protest” absence and extension of stop-work meeting | 48 | 52 | 22 | 36 | 38 |
| Other | 7 | 5 | 3 | 9 | 17 |
| Number of Workers involved | |||||
| Negotiations under Act | 7,245 | 8,934 | 3,504 | 6,384 | 7,353 |
| Private negotiations between parties | 4,834 | 6,893 | 3,908 | 5,484 | 2,180 |
| Intervention of third party | 4,666 | 8,183 | 4,579 | 2,667 | 3,071 |
| Substitution | 17 | 3 | 47 | 28 | |
| “Protest” absence and extension of stop-work meeting | 12,718 | 14,165 | 3,666 | 11,079 | 11,821 |
| Other | 286 | 1,243 | 36 | 1,309 | 4,041 |
Further information for the years 1947 and 1948 is given in the next table.
| Method of Settlement. | Number of Working-days Lost. | Estimated Loss in Wages. | ||
|---|---|---|---|---|
| 1947. | 1918. | 1947. | 1948. | |
| £ | £ | |||
| Negotiations under Act | 30,463 | 59,039 | 46,67 | 124,076 |
| Private negotiations between parties | 18,937 | 5,712 | 29,755 | 11,786 |
| Intervention of third party | 6,427 | 13,969 | 17,320 | 31,125 |
| Substitution | 141 | 70 | 33 | 84 |
| “Protest” absence and extension of stop-work meeting | 32,018 | 9,767 | 77,681 | 16,495 |
| Other | 14,739 | 4,907 | 16,210 | 12,419 |
| Totals | 102,725 | 93,464 | 187,669 | 195,985 |
RESULTS.—In compiling the table which follows, no dispute has been included as ending in favour of either employers or workers unless the result has been beyond question. In cases where workers have made more than one demand, succeeding in one or more and failing in one or more, or where they have made one or more demands and in respect of each have been partially successful only, the result has been treated as a compromise. Where strikers have returned to work without any definite decision being arrived at regarding the demands made, or where (as in the case of a sympathetic strike) no definite demand has been made, or where a strike is merely by way of a protest, the result has been recorded as indeterminate.
RESULTS OF DISPUTES
| Result. | 1944. | 1945. | 1946. | 1947. | 1948. |
|---|---|---|---|---|---|
| Number of Disputes | |||||
| In favour of workers | 34 | 40 | 31 | 48 | 21 |
| In favour of employers | 25 | 17 | 16 | 15 | 16 |
| Compromise | 16 | 21 | 21 | 21 | 5 |
| Indeterminate | 74 | 76 | 28 | 50 | 59 |
| Number of Workers involved | |||||
| In favour of workers | 5,803 | 8,881 | 2,933 | 7,568 | 4,363 |
| In favour of employers | 2,928 | 2,092 | 3,627 | 2,089 | 3,305 |
| Compromise | 1,842 | 5,551 | 3,390 | 4,774 | 2,064 |
| Indeterminate | 19,193 | 22,894 | 5,746 | 12,539 | 18,762 |
| Number of Working-days lost | |||||
| In favour of workers | 19,030 | 19,049 | 4,828 | 15,732 | 4,917 |
| In favour of employers | 3,644 | 3,202 | 5,302 | 15,663 | 18,844 |
| Compromise | 1,878 | 14,923 | 11,420 | 23,924 | 13,882 |
| Indeterminate | 28,050 | 29,455 | 8,843 | 47,406 | 55,821 |
Of disputes ending definitely in favour of one party or the other during the five years, workers succeeded in 174 instances and employers in 89. In the previous five years (1939–43) workers were successful in 96 instances and employers in 84.
In the following table the causes and results of disputes occurring during 1948 (1947 being shown below in italics) are shown in conjunction.
| Result. | Cause. | ||||||
|---|---|---|---|---|---|---|---|
| Wages. | Hours. | Employment. | Other Working-conditions. | Sympathy. | Other. | Totals. | |
| Number of Disputes | |||||||
| In favour of workers | 9 | 4 | 6 | 2 | 21 | ||
| 24 | 2 | 10 | 5 | 1 | 6 | 48 | |
| In favour of employers | 7 | 2 | 4 | 2 | 1 | 16 | |
| 10 | 5 | 1 | 5 | ||||
| Compromise | 3 | 1 | 1 | 5 | |||
| 11 | 1 | 5 | 2 | 1 | 1 | 21 | |
| Indeterminate | 11 | 2 | 3 | 5 | 5 | 33 | 59 |
| 12 | 1 | 4 | 7 | 2 | 24 | 50 | |
| Number of Workers involved | |||||||
| In favour of workers | 2,300 | 380 | 1,362 | 321 | 4,363 | ||
| 3,111 | 77 | 1,248 | 1,834 | 340 | 958 | 7,568 | |
| In favour of employers | 1,066 | 277 | 247 | 1,688 | 27 | 3,305 | |
| 1,672 | 417 | 2,089 | |||||
| Compromise | 777 | 1,255 | 32 | 2,064 | |||
| 2,816 | 227 | 192 | 79 | 1,060 | 400 | 4,774 | |
| Indeterminate | 4,255 | 2,163 | 1,614 | 1,759 | 620 | 8,351 | 18,762 |
| 6,181 | 130 | 1,235 | 820 | 558 | 3,615 | 12,539 | |
| Number of Working-days lost | |||||||
| In favour of workers | 2,907 | 219 | 1,407 | 384 | 4,917 | ||
| 7,803 | 236 | 2,250 | 3,825 | 340 | 1,278 | 15,732 | |
| In favour of employers | 3,593 | 277 | 375 | 14,504 | 95 | 18,844 | |
| 15,387 | 276 | 15,663 | |||||
| Compromise | 10,077 | 3,765 | 40 | 13,882 | |||
| 13,472 | 2,043 | 369 | 66 | 6,424 | 1,550 | 23,924 | |
| Indeterminate | 16,899 | 814 | 20,507 | 9,081 | 455 | 8,065 | 55,821 |
| 36,024 | 49 | 4,120 | 1,415 | 2,110 | 3,688 | 47,406 | |
AS a result of an international conference of official statisticians held at Geneva in 1923, under the auspices of the International Labour Office set up by the League of Nations, the collection and compilation of statistics of industrial accidents on substantially uniform lines was undertaken in virtually all of the principal countries. From the administrative standpoint, the principal types of industrial accidents occurring in New Zealand may be classified as follows:—
Factory Accidents.—The Factories Act, 1946, requires that all accidents likely to incapacitate the injured person for at least forty-eight hours be reported to an Inspector of Factories. Reports are prepared by Inspectors of Factories in connection with each such accident causing loss of work amounting to three days or more—i.e., compensable accidents. These reports are ultimately forwarded to the Census and Statistics Department for statistical analysis.
Scaffolding Accidents.—The procedure adopted in connection with the compilation of statistics of scaffolding accidents is identical with that in connection with factory accidents.
Bush-working Accidents.—By section 14 of the Bush-workers' Act, 1945, a similar procedure was proscribed for bush-working accidents also; these are accordingly included for the first time in the 1946 statistics.
Accidents to Employees of the Railways, Works, Printing and Stationery, and Post and Telegraph Departments.—Individual reports of all accidents involving loss of work for three days or more are supplied by the respective Departments to the Census and Statistics Department for detailed analysis and tabulation. Commencing with the year 1946, the Stale Forest Service has been added to the list of Departments supplying reports.
Accidents to Employees in Mines and Quarries.—Certain particulars of accidents to employees in metalliferous mines, in coal-mines, and in quarries and other places under the Quarries Act, are given in successive numbers of the Mines Statement, Parliamentary Paper C.-2. Commencing with the year 1938, individual reports of all accidents involving loss of work for three days or more are now being furnished, although information as to duration of disability and as to compensation paid is not available.
Other Industrial Accidents.—There are numerous types of industrial accidents for which it has not as yet been found practicable to collect and compile statistics. The principal classes of such accidents are those occurring to persons engaged in land transport (other than railway operation), in waterside work, and in marine navigation. Waterside and marine accidents are reported to the Marino Department, the former under authority of the General Harbour Regulations 1935 (made pursuant to the Harbours Act, 1923), and the latter under the Shipping and Seamen Act, 1908.
FREQUENCY RATES.—For the purpose of computing frequency rates in respect of industrial accidents in Now Zealand, data as to the number of employees in establishments coming under various industrial headings have been compiled by the Census and Statistics Department from returns furnished annually for the purpose by the Labour Department's Inspectors of Factories; while information as to the hours worked has been ascertained from awards, and supplemented by the statistics of short time and overtime compiled from data collected with the annual census of factory production. Similar data have been obtained from the records of the Post and Telegraph, Works, and Railways Departments. One hour's work performed by one man is taken as a unit. Data as to man-hours are not available in the case of mining, scaffolding, or (as yet) bush-working operations, nor are compensation data in respect of mining accidents. The compensation figures shown throughout the section include damages, if any, awarded by a judgment of the court, medical expenses and, in the case of fatal accidents, funeral expenses also.
| Year. | Total Accidents. | Accidents per 100,000 Man-hours worked.* | Accidents where Particulars of Compensation available. | Total Compensation† or Damages paid In such Cases. | Compensation per Case where known. |
|---|---|---|---|---|---|
* Excluding scaffolding, mining, and bush-working accidents. † Excluding mining accidents. ‡ Including forestry and bush-working accidents. | |||||
| £ | £ | ||||
| 1942 | 16,031 | 3.646 | 11,680 | 245,619 | 21.0 |
| 1943 | 17,787 | 3.805 | 12,747 | 277,895 | 21.8 |
| 1944 | 15,514 | 3.196 | 10,961 | 266,524 | 24.3 |
| 1945 | 14,527 | 2.984 | 10,277 | 237,216 | 22.9 |
| 1946‡ | 15,123 | 3.016 | 11,289 | 258,621 | 22.9 |
Compared with the previous year (excluding forestry and bush-working accidents) the 1946 total shows an increase of 109 or 0.8 per cent., the greatest numerical movement (a decrease of 329) being in the mining accidents, and the greatest percentage movement (a decrease of 44 per cent.) having occurred in the scaffolding group.
The distribution of industrial accidents in 1946 according to the source of information (accidents to Printing and Stationery Department employees being included in the Factory group) is indicated in the following table.
| Class. | Total Accidents. | Accidents per 100,000 Man-hours worked. | Accidents where Particulars of Compensation available. | Total Compensation or Damages paid in such Cases. | Compensation per Case where known. |
|---|---|---|---|---|---|
* No information available. † Excluding scaffolding, mining, and bush-working accidents. ‡ Excluding mining accidents. | |||||
| £ | £ | ||||
| Factory | 6,385 | 2.298 | 6,375 | 141,863 | 22.3 |
| Public works | 1,009 | 5.736 | 1,005 | 33,224 | 33.1 |
| State Forest | 321 | 11.017 | 321 | 1,602 | 14.3 |
| Bush-workers | 166 | * | 166 | 4,006 | 24.1 |
| Scaffolding | 55 | * | 54 | 6,538 | 121.1 |
| Railways | 2,927 | 6.130 | 2,920 | 58,137 | 19.9 |
| Post and Telegraph | 448 | 2.072 | 448 | 1.0,251 | 22.9 |
| Mining | 3,812 | * | * | * | * |
| All classes | 15,123 | 3.016† | 11,289‡ | 258,621‡ | 22.9‡ |
It is usual for scaffolding accidents to involve the highest compensation per accident, owing to the proportionately greater number which terminate fatally or result in permanent disability. There were five accidents causing permanent partial disability and three fatal accidents in this small group during 1946, while the group having the next highest average compensation per accident (public works) included seventeen accidents causing permanent partial disability and six fatalities.
In the table following, industrial accidents during the year 1946 are classified into certain important industrial groups. Details for individual industries, under this and other headings, are published in the annual Statistical Report on Industrial Accidents issued by the Census and Statistics Department.
| Industrial Group. | Total Accidents. | Accidents per 100,000 Man-hours worked. | Accidents where Particulars of Compensation available. | Total Compensation or Damages paid in such Cases. | Compensation per Case where known. |
|---|---|---|---|---|---|
*A few State hydro-electric accidents included with “Building and construction” would be more correctly classified under “Power, heat, and light” † Data on which to compute not available. ‡ Excluding scaffolding, bush-working, and mining accidents. § Excluding milling accidents. | |||||
| Provision of— | £ | £ | |||
| Food, drink, &c. | 4,111 | 6.305 | 4,106 | 61,058 | 14.9 |
| Clothing, footwear, and textiles | 231 | 0.396 | 229 | 5,141 | 22.5 |
| Building and construction— | |||||
| Public works* | 993 | 6.406 | 989 | 33,036 | 33.4 |
| Scaffolding | 55 | † | 54 | 6,538 | 121.1 |
| Power, heat, and light— | |||||
| Public works* | 16 | 0.766 | 16 | 188 | 11.8 |
| Factories | 66 | 0.863 | 66 | 4,658 | 70.6 |
| Communications and land transport— | |||||
| Post and Telegraph | 448 | 2.072 | 448 | 10,251 | 22.9 |
| Railways | 2,927 | 6.130 | 2,920 | 58,137 | 19.9 |
| Personal services | 9 | 0.188 | 9 | 819 | 91.0 |
| Working in or on— | |||||
| Wood, seagrass, &c.— | |||||
| Factories | 583 | 2.074 | 582 | 27,228 | 46.8 |
| State Forest | 321 | 11.017 | 321 | 4,602 | 14.3 |
| Bush-workers | 166 | † | 166 | 4,006 | 24.1 |
| Metal | 687 | 1.090 | 687 | 21,949 | 31.9 |
| Stone, clay, glass, &c. | 525 | 2.196 | 524 | 16,053 | 30.6 |
| Paper, printing, &c. | 132 | 0.900 | 132 | 3,437 | 26.0 |
| Skins, leather, &c. | 32 | 0.393 | 32 | 1,125 | 35.1 |
| Mines and quarries | 3,812 | † | † | † | † |
| Miscellaneous | 9 | 0.226 | 8 | 395 | 49.3 |
| All groups | 15,123 | 3.016‡ | 11,289§ | 258,621§ | 22.9§ |
A few of the industrial groups listed showed a lower frequency rate—i.e., accidents per 100,000 man-hours worked—than in 1945, notably public-works (i.e., the Works and State Hydro-electric Departments employees engaged thereon) and the food, drink, &c., group. The leading increases were recorded by factory workers in wood, seagrass, &c., and the Post and Telegraph Department. On the whole, there was little general movement in this rate. The lowest figure was shown by the personal-services group, and the highest by the State Forest Service (the first year of inclusion in the statistics). The comparatively high rate recorded for the food, drink, &c., group was largely contributed to by accidents occuring in the meat-freezing industry, which usually has the highest frequency rate for any individual sub-group.
The following table shows, for the last five years available, the average compensation paid, in conjunction with the extent of disability.
| Year. | Temporary Disability. | Permanent Disability. | Fatality. | Total. | ||||
|---|---|---|---|---|---|---|---|---|
| Number of Cases.* | Average Amount of Compensation. | Number of Cases.* | Average Amount of Compensation. | Number of Cases.* | Average Amount of Compensation. | Number of Cases.* | Average Amount of Compensation. | |
* Where amount of compensation known. | ||||||||
| £ | £ | £ | £ | |||||
| 1942 | 11,416 | 13.0 | 235 | 288.6 | 29 | 1005.6 | 11,680 | 21.0 |
| 1943 | 12,489 | 15.6 | 228 | 331.9 | 30 | 858.2 | 12,747 | 21.8 |
| 1944 | 10,722 | 13.9 | 213 | 418.6 | 26 | 1100.0 | 10,961 | 24.3 |
| 1945 | 10,187 | 14.2 | 165 | 385.5 | 25 | 1160.7 | 10,377 | 22.9 |
| 1946 | 11,052 | 13.9 | 206 | 352.6 | 31 | 1043.4 | 11,289 | 22.9 |
The maximum amount, irrespective of medical and funeral expenses, which may be paid in respect of fatalities under the Workers' Compensation Act was until 1st April, 1948, £1,000, at which date it was increased to £1,500. Since the 1947 amendment, no deduction is made from this amount on account of any weekly payments due to incapacity prior to the occurrence of death unless these payments exceed £250 in total. In 1949 the maximum amount was further raised to £1,750. Until recent years the average amount paid in respect of fatalities was considerably below the maximum. This is explained by the fact that in cases where a deceased worker had no dependants, only medical and funeral expenses art paid; and that in cases of partial dependency the amount paid as compensation varies in proportion to the extent of such dependency. Should, however, the worker's dependants take proceedings at common law (where negligence must be proved) the amount of compensation depends on the verdict of the jury, and it is not limited to the statutory maximum under the Act. There were several cases of this kind following fatalities in 1944, 1945, and 1946, and this accounts for the marked increase in the average amount of compensation (inclusive of damages) paid. Similar action has also been taken by the worker himself in some cases of permanent disability.
CAUSE OF ACCIDENT AND EXTENT OF INJURY SUSTAINED.—In regard to the extent and degree of the disability sustained, it is usual to distinguish fatal accidents, accidents causing temporary disability, accidents causing permanent partial disability, and accidents causing permanent total disability. Very few cases of permanent total disability occur in New Zealand, practically the whole of the cases shown under “permanent disability” resulting in partial disability only.
In the actual compilation of the statistics difficulty occasionally arises as to whether a particular injury should be regarded as temporary or permanent; and in cases of doubt the conservative practice has been adopted of classifying the injury in the temporary-disability class. The following table, showing cause of accident in conjunction with degree of disability, relates to the five-year period 1942–46.
| Cause. | Temporary Disability. | Permanent Disability.* | Fatality. | Total. | Percentage of Total Accidents. |
|---|---|---|---|---|---|
*Including permanent total disability cases as follows: 1942, 1; 1943, 1; 1944, 3; 1945, 2; 1946, 3; total 10. | |||||
| Machinery— | |||||
| Prime movers | 107 | 3 | 110 | 0.1 | |
| Transmission | 222 | 23 | 10 | 255 | 0.3 |
| Lifting-machinery | 2,118 | 78 | 11 | 2,207 | 2.8 |
| Power-working machines | 5,419 | 569 | 12 | 6,000 | 7.6 |
| Vehicles | 10,574 | 125 | 55 | 10,754 | 13.6 |
| Explosions, fires, and hot substances | 1,605 | 27 | 13 | 1,645 | 2.1 |
| Poisonous and corrosive substances | 1,173 | 1,173 | 1.5 | ||
| Electricity | 192 | 7 | 13 | 212 | 0.3 |
| Falls of persons— | |||||
| From elevations | 3,273 | 58 | 20 | 3,351 | 4.2 |
| Into excavations | 652 | 2 | 1 | 655 | 0.8 |
| Slipping and stumbling on the level | 4,677 | 30 | 1 | 4,708 | 6.0 |
| Stepping on or striking against fixed objects— | |||||
| Stepping on | 454 | 454 | 0.6 | ||
| Striking against | 4,397 | 19 | 4 | 4,420 | 5.6 |
| Falling objects, not being handled by the person injured | 2,520 | 27 | 11 | 2,558 | 3.2 |
| Falls of earth | 2,333 | 96 | 41 | 2,470 | 3.1 |
| Handling of objects— | |||||
| Heavy | 14,925 | 106 | 1 | 15,032 | 19.0 |
| Sharp | 4,954 | 26 | 4,980 | 6.3 | |
| Hand-trucks, &c. | 1,926 | 10 | 1,936 | 2.5 | |
| Continual handling | 1,016 | 1 | 1,017 | 1.3 | |
| Hand-tools— | |||||
| In hands of person injured— | |||||
| Glancing of tool | 8,144 | 100 | 1 | 8,245 | 10.4 |
| Breaking of tool | 68 | 68 | 0.1 | ||
| Flying particles | 1,821 | 14 | 1,835 | 2.3 | |
| Other | 1,378 | 16 | 1 | 1,395 | 1.8 |
| In hands of other than person injured | 355 | 6 | 361 | 0.5 | |
| Animals | 319 | 3 | 1 | 323 | 0.4 |
| Miscellaneous— | |||||
| Strains, sprains, and septic wounds undefined as to cause (sustained while slaughtering) | 912 | 3 | 915 | 1.2 | |
| Doors, windows, covers, gates (ex-eluding elevators) | 759 | 7 | 766 | 1.0 | |
| Other | 1,117 | 14 | 6 | 1,137 | 1.4 |
Any consideration of avenues of accident prevention requires information concerning the relative importance of the various causes of accident, which are also set out in the foregoing table.
The next table gives similar information according to the principal types of industrial accidents.
| Class. | Temporary Disability. | Permanent Disability.* | Fatality. | Total. | Percentage of Total Accidents. |
|---|---|---|---|---|---|
*Including permanent total disability cases as follows: 1942, 1; 1943, 1; 1944, 3; 1945, 2; 1946, 3; total, 10. †Information for 1946 only. | |||||
| Summary | |||||
| Factories | 33,395 | 809 | 50 | 34,254 | 43.4 |
| Public works | 5,788 | 120 | 31 | 5,939 | 7.5 |
| State Forest† | 320 | 1 | 321 | 0.4 | |
| Scaffolding | 481 | 28 | 15 | 524 | 0.6 |
| Bush-workers† | 163 | 3 | 166 | 0.2 | |
| Railways | 13,972 | 103 | 43 | 14,118 | 17.9 |
| Post and Telegraph | 1,781 | 9 | 5 | 1,795 | 2.3 |
| Mines | 21,510 | 298 | 57 | 21,865 | 27.7 |
| Totals | 77,410 | 1,370 | 202 | 78,982 | 100.0 |
LENGTH OF EXPERIENCE AT PROCESS : Factory Accidents only.—In recent years information has been obtained regarding the length of experience of the employee at the work on which he was engaged at the time of the accident. The information thus obtained in respect of factory accidents is given below for the years 1942–46. The necessary information was not available in all eases, the number covered representing approximately 95 per cent. of the total.
| Length of Experience at Process. | 1942. | 1943. | 1944. | 1945. | 1946. | |||||
|---|---|---|---|---|---|---|---|---|---|---|
| No. of Cases. | Per Cent. of Total. | No. of Cases. | Per Cent. of Total. | No. of Cases. | Per Cent. of Total. | No. of Cases. | Per Cent. of Total. | No. of Cases. | Per Cent. of Total. | |
| Under 6 months | 2,274 | 31.1 | 1,858 | 24.7 | 1,641 | 25.7 | 1,746 | 29.4 | 1,939 | 32.1 |
| 6 months and under 1 year | 1,008 | 13.8 | 885 | 11.8 | 682 | 10.7 | 582 | 9.8 | 509 | 8.4 |
| 1 year and under 2 years | 900 | 12.3 | 983 | 13.1 | 698 | 10.9 | 553 | 9.3 | 553 | 9.1 |
| 2 years and under 3 years | 813 | 11.1 | 926 | 12.3 | 680 | 10.7 | 476 | 8.0 | 499 | 8.3 |
| 3 years and under 4 years | 379 | 5.2 | 631 | 8.4 | 565 | 8.9 | 483 | 8.1 | 377 | 6.2 |
| 4 years and under 5 years | 243 | 3.3 | 331 | 4.4 | 338 | 5.3 | 389 | 6.5 | 648 | 5.8 |
| 5 years and under 10 years | 713 | 9.7 | 804 | 10.7 | 833 | 13.1 | 851 | 14.3 | 908 | 16.0 |
| 10 years and under 20 years | 573 | 7.9 | 680 | 9.0 | 606 | 9.5 | 566 | 9.5 | 614 | 10.2 |
| 20 years and over | 412 | 5.6 | 422 | 5.6 | 333 | 5.2 | 301 | 5.1 | 298 | 4.9 |
| Totals | 7,315 | 100.0 | 7,520 | 100.0 | 6,376 | 100.0 | 5,947 | 100.0 | 6,045 | 100.0 |
The preceding table should be studied in conjunction with the following one showing percentage distribution according to age-group. Both tables were showing an abnormal distribution in 1942 as compared with earlier years, on account of the withdrawal of man-power from industry at, a critical period of the war. A more normal distribution is now in evidence, except that the recent rise in the proportion of accidents occurring to factory workers with under six months' experience (from 24.7 per cent. in 1943 to 32.1 per cent. in 1946) indicates more frequent changes of employment. The age distribution is also still reflecting the employment of older men in industry. Accidents to workers aged 35 years and over comprised 27.7 per cent. of the total in 1939 and 40.5 per cent. in 1946.
| Age, in Years. | 1942. | 1943. | 1944. | 1945. | 1946. | |||||
|---|---|---|---|---|---|---|---|---|---|---|
| No. of Cases. | Per Cent. of Total. | No. of Cases. | Per Cent. of Total. | No. of Cases. | Per Cent. of Total. | No. of Cases. | Per Cent. of Total. | No. of Cases. | Per Cent. of Total. | |
| Under 16 | 193 | 2.6 | 153 | 2.0 | 98 | 1.5 | 64 | 1.0 | 54 | 0.9 |
| 16 to 20 | 1,012 | 13.6 | 1,279 | 16.8 | 1,039 | 15.9 | 023 | 15.1 | 857 | 13.5 |
| 21 to 24 | 834 | 11.2 | 921 | 12.1 | 880 | 13.5 | 807 | 13.2 | 930 | 14.7 |
| 25 to 34 | 2,182 | 29.4 | 2,160 | 28.3 | 1,925 | 29.5 | 1,800 | 29.5 | 1,921 | 30.4 |
| 35 to 44 | 1,577 | 21.3 | 1,582 | 20.8 | 1,379 | 21.1 | 1,341 | 22.0 | 1,360 | 21.5 |
| 45 to 54 | 989 | 13.3 | 903 | 11.8 | 700 | 10.7 | 716 | 11.7 | 718 | 11.3 |
| 65 and over | 640 | 8.6 | 623 | 8.2 | 505 | 7.8 | 456 | 7.5 | 485 | 7.7 |
| Totals | 7,427 | 100.0 | 7,621 | 100.0 | 6,526 | 100.0 | 6,107 | 100.0 | 6,325 | 100.0 |
NATURE OF INJURY.—A classification of accidents according to the nature of the injuries sustained gives the following results for the years 1942–46.
| Nature of Injury. | 1942.* | 1943.* | 1944.* | 1945.* | 1946. | Totals, 1942–46. |
|---|---|---|---|---|---|---|
*Excluding accidents to forestry-workers and bush-workers. †Traumatic only. In addition there were: in 1942, 55 surgical amputations; in 1943, 51; in 1944, 54; in 1945, 32; and in 1946, 36. | ||||||
| Contusions and abrasions | 4,686 | 4,809 | 4,472 | 3,729 | 3,759 | 21,455 |
| Burns and scalds | 568 | 675 | 530 | 539 | 629 | 2,941 |
| Concussions | 79 | 102 | 50 | 52 | 57 | 340 |
| Cuts and lacerations | 3,984 | 3,921 | 3,512 | 3,418 | 3,837 | 18,672 |
| Punctures | 670 | 771 | 657 | 663 | 833 | 3,594 |
| Amputations† | 167 | 139 | 114 | 103 | 143 | 666 |
| Dislocations | 52 | 56 | 46 | 43 | 42 | 239 |
| Fractures | 507 | 553 | 465 | 429 | 564 | 2,518 |
| Sprains and strains | 4,540 | 5,142 | 4,320 | 4,010 | 4,066 | 22,078 |
| Other and ill-defined | 778 | 1,619 | 1,348 | 1,541 | 1,193 | 6,479 |
| Totals | 16,031 | 17,787 | 15,514 | 14,527 | 15,123 | 78,982 |
| Cases where septic poisoning followed— | ||||||
| Number | 2,208 | 2,468 | 2,032 | 1,861 | 2,191 | 10,760 |
| Percentage of all accidents | 13.8 | 13.9 | 13.1 | 12.8 | 14.5 | 13.6 |
A feature of special interest brought out by this table is the relatively high proportion of accidents in which septic poisoning followed.
PART OF BODY AFFECTED.—Informative figures showing the number of cases in which the different parts of the body were affected by industrial accidents which occurred during the years 1942–46 are given in the following table.
| Part of Body affected. | 1942.* | 1943.* | 1944.* | 1945.* | 1946. | Totals, 1942–46. |
|---|---|---|---|---|---|---|
*Excluding accidents to forestry-workers and bush-workers. | ||||||
| Head | 267 | 305 | 258 | 244 | 220 | 1,294 |
| Eyes | 685 | 775 | 690 | 650 | 651 | 3,451 |
| Rest of face | 193 | 219 | 184 | 211 | 216 | 1,023 |
| Neck | 65 | 88 | 82 | 87 | 78 | 400 |
| Back | 1,720 | 1,942 | 1,809 | 1,699 | 1,605 | 8,775 |
| Thorax and contents | 699 | 725 | 649 | 645 | 629 | 3,347 |
| Abdomen and contents | 260 | 316 | 328 | 280 | 240 | 1,424 |
| External genitals | 28 | 38 | 33 | 33 | 25 | 157 |
| Upper limbs— | ||||||
| Collarbone and shoulder | 562 | 638 | 510 | 482 | 486 | 2,678 |
| Arm | 937 | 1,104 | 973 | 943 | 986 | 4,943 |
| Hand and wrist | 2,158 | 2,453 | 2,194 | 1,955 | 1,955 | 10,715 |
| Finger and thumb | 4,257 | 4,362 | 3,813 | 3,684 | 4,141 | 20,257 |
| Lower limbs— | ||||||
| Pelvis, hip, and thigh | 414 | 403 | 352 | 327 | 351 | 1,847 |
| Leg | 1,514 | 1,776 | 1,512 | 1,401 | 1,519 | 7,722 |
| Ankle and foot | 1,861 | 2,120 | 1,787 | 1,655 | 1,795 | 9,218 |
| Undefined or multiple | 411 | 523 | 340 | 231 | 226 | 1,731 |
| Totals | 16,031 | 17,787 | 15,514 | 14,527 | 15,123 | 78,982 |
Accidents to the fingers and hands form a large proportion of the total, no less than 30,972 (39.2 per cent.) out of an aggregate of 78,982 in the five years covered by the above table coming within that category. Next in order came eases in which an injury to the ankle or foot was sustained with 11.7 per cent., the back with 11.1 per cent., the leg with 9.8 per cent., the arm with 6.3 per cent., and eyes with 4.4 per cent.
A tabulation made for 1946, correlating nature of injury with part of body affected, showed that the most common type of accident was to the fingers and thumbs, resulting in cuts or lacerations: 2,460 of the 15,123 accidents tabulated came under this category. Of the 179 cases of amputations (of which 143 were traumatic and 36 were surgical), 165 resulted in loss of some part of the fingers or thumbs. Contusions of the fingers and thumbs numbered 813, of the hands 539, of the thighs and legs 706, and of the foot 553; cuts and lacerations of the hands amounted to 571. Of the 4,066 sprains, 1,376 resulted in injury to the back, while sprained thighs, legs, and feet accounted for 1,214.
DURATION OF INCAPACITY.—A further measure of the extent of disability is furnished in cases of temporary disability by data as to the duration of absence from work as the result of the accident. A summary of this aspect, together with the number of cases of permanent partial disability and fatality, is given below for the years 1943–46, together with the totals for the five year period, 1942–46. Information as to time lost, is not available for mining accidents, and these are excluded.
| Duration. | 1943.* | 1944.* | 1945.* | 1946. | Totals, 1942 to 1946. | |||||
|---|---|---|---|---|---|---|---|---|---|---|
| Number. | Per Cent. | Number. | Per Cent. | Number. | Per Cent. | Number. | Per Cent. | Number. | Per Cent. | |
*Excluding information for forestry-workers and bush-workers. | ||||||||||
| 1 week or under | 2,359 | 18.5 | 2,113 | 19.3 | 2,102 | 20.2 | 2,340 | 20.7 | 11,174 | 19.6 |
| Over 1 week to 2 weeks | 4,095 | 32.1 | 3,608 | 32.9 | 3,507 | 33.8 | 3,822 | 33.8 | 18,839 | 33.0 |
| Over 2 weeks to 4 weeks | 3,6.41 | 28.6 | 2,977 | 27.1 | 2,762 | 26.6 | 2,908 | 25.7 | 15,545 | 27.2 |
| Over 4 weeks to 6 weeks | 1,076 | 8.4 | 939 | 8.6 | 806 | 7.8 | 886 | 7.8 | 4,654 | 8.1 |
| Over 6 weeks to 13 weeks | 983 | 7.7 | 760 | 6.9 | 723 | 7.0 | 809 | 7.1 | 4,092 | 7.2 |
| Over 13 weeks to 6 months | 246 | 1.9 | 235 | 2.1 | 211 | 2.0 | 210 | 1.9 | 1,144 | 2.0 |
| Over 6 months | 91 | 0.7 | 89 | 0.8 | 76 | 0.7 | 77 | 0.7 | 419 | 0.7 |
| Total specified cases of temporary disability | 12,491 | 97.9 | 10,721 | 97.7 | 10,187 | 98.1 | 11,052 | 97.7 | 55,867 | 97.8 |
| Cases where employee did not return or duration not stated | 7 | 0.1 | 4 | 0.0 | 4 | 0.0 | 14 | 0.1 | 33 | 0.1 |
| Permanent disability | 234 | 1.8 | 221 | 2.0 | 168 | 1.6 | 214 | 1.9 | 1,072 | 1.9 |
| Fatality | 31 | 0.2 | 27 | 0.3 | 27 | 0.3 | 31 | 0.3 | 145 | 0.2 |
| Totals | 12,763 | 100.0 | 10,973 | 100.0 | 10,386 | 100.0 | 11,311 | 100.0 | 57,117 | 100.0 |
In many cases the injured employee did not cease work immediately, a considerable period intervening in some instances. The following table shows, for such cases occurring during the year 1946, the length of time elapsing before the employee left work, and the final cause of cessation of work.
| — | Factories. | Public Works | State Forest. | Bush-workers. | Scaffolding. | Railways. | Post and Telegraph. |
|---|---|---|---|---|---|---|---|
| Period elapsing | |||||||
| 1 week or less | 1,037 | 76 | 25 | 18 | 4 | 946 | 121 |
| Over 1 week and up to 2 weeks | 152 | 18 | 8 | 1 | 75 | 8 | |
| Over 2 weeks | 96 | 21 | 4 | 1 | 65 | 9 | |
| Final cause | |||||||
| Incipient septic poisoning | 689 | 52 | 19 | 10 | 1 | 270 | 30 |
| Strains | 262 | 29 | 10 | 4 | 409 | 62 | |
| Other causes | 334 | 34 | 8 | 6 | 3 | 407 | 46 |
| Totals | 1,285 | 115 | 37 | 20 | 4 | 1,086 | 138 |
| Percentage of all accidents (i.e., percentage of delayed-action cases to total accidents in each class) | 20.1 | 11.4 | 11.5 | 12.0 | 7.3 | 37.1 | 30.8 |
The preceding table indicates that many employees suffering from minor injuries pay little attention to such injury, especially in the case of slight cuts, strains, or abrasions. This neglect often causes more severe pain (or with cuts and abrasions, septic poisoning), and the absence then enforced is usually longer than if the injury had received immediate attention. Lost time usually entails a reduction in wages, especially if the injury results in under three days' absence, in which case no compensation is payable. Further, in the case of apprentices, lost time has to be made up at the termination of the period of apprenticeship, and these two considerations are likely to militate against the worker ceasing work immediately on account of a minor injury.
ACCIDENT SEVERITIES.—In view of the fact that the age of the individual is not particularly relevant to the character of the hazard from which the injury has occurred, for the purpose of calculating the accident-severity rates shown below a constant loss of 9,545 calendar days is counted for each fatality irrespective of the age of the person at the time of death. The effect of taking into account the actual age is shown in the Statistical Report on Industrial Accidents. In respect of permanent partial disablement an international scheme for the apportionment of loss of earning-power caused by this type of accident has been drawn up by the International Labour Office. Under this scheme, which has been adopted with some slight modifications in the treatment of New Zealand statistics, time lost on account of permanent partial disability is assessed on the basis of a proportionate part of the time lost in connection with injuries resulting in death or permanent total disablement. For example, dismemberment or the loss of the use of a hand is regarded as a 50-per-cent. disability—that is, the time lost on account of impaired working capacity in this case is assessed as 50 per cent. of 9,545 calendar days—i.e., 4,773 calendar days.
The severity rate for all accidents during the period 1942–46 has varied between 1,367 (in 1945) and 1,545 (in 1944). The extent of the toll on industry exacted by industrial accidents is realized when it is considered that during the five years 1942–46 one hour was lost as a result of such accidents out of every sixty-eight hours worked in the industries covered by the following table. Reports on mining, bush-working, and scaffolding accidents do not provide the necessary data for inclusion in that portion of the table.
| — | 1942. | 1943. | 1944. | 1945. | 1946. |
|---|---|---|---|---|---|
*Excluding mining accidents. †Excluding bush-working, scaffolding, and mining accidents. | |||||
| Total cases resulting in— | |||||
| Temporary disability | 15,711 | 17,443 | 15,185 | 14,267 | 14,804 |
| Permanent disability | 282 | 300 | 284 | 221 | 283 |
| Fatality | 38 | 44 | 45 | 39 | 36 |
| Total | 16,031 | 17,787 | 15,514 | 14,527 | 15,123 |
| Calendar days lost per accident* | 76 | 75 | 89 | 81 | 84 |
| Hours lost per 100,000 man-hours worked (i.e., severity-rate)† | 1,480 | 1,532 | 1,545 | 1,367 | 1,388 |
Comparison of the severity rates as between different industrial groups is affected by the varying proportions of serious accidents and fatalities in different industries in different years. In the main groups covered by the cumulative table for the five years 1942–46 shown below, the effect of this factor is minimized by the relatively large number of accidents classified.
| Industrial Group. | Number of Accidents resulting in | Calendar Days lost per Accident. | Hours lost per 100,000 Man-hours worked (Severity Rate). | |||
|---|---|---|---|---|---|---|
| Temporary Disability. | Permanent Disability. | Fatality. | Total. | |||
*Data on which to compute not available. †Information for 1946 only. ‡Excluding mining accidents. § Excluding bush-working, scaffolding, and mining accidents. | ||||||
| Provision of— | ||||||
| Food, drink, &c. | 23,265 | 241 | 8 | 23,614 | 38 | 1,691 |
| Clothing, footwear, and textiles | 1,161 | 46 | 2 | 1,209 | 96 | 227 |
| Building and construction— | ||||||
| Public works | 5,552 | 120 | 28 | 5,700 | 135 | 5,194 |
| Scaffolding | 481 | 28 | 15 | 524 | 512 | * |
| Power, heat, and light | 448 | 16 | 7 | 471 | 248 | 1,927 |
| Communication and land transport— | ||||||
| Post and Telegraph | 1,781 | 9 | 5 | 1,795 | 68 | 654 |
| Railways | 13,972 | 103 | 43 | 14,118 | 72 | 2,574 |
| Personal services | 31 | 4 | 35 | 219 | 195 | |
| Working in or on— | ||||||
| Wood, seagrass, &c.— | ||||||
| Factories | 2,550 | 236 | 15 | 2,801 | 187 | 2,132 |
| State Forest† | 320 | 1 | 321 | 49 | 3,057 | |
| Bush-workers† | 163 | 3 | 166 | 65 | * | |
| Metal | 3,308 | 162 | 9 | 3,479 | 111 | 791 |
| Stone, clay, glass, &c. | 2,223 | 64 | 11 | 2,298 | 114 | 1,501 |
| Paper, printing, &c. | 506 | 28 | 534 | 138 | 715 | |
| Skins, leather, &c. | 102 | 10 | 112 | 255 | 475 | |
| Mines and quarries | 21,510 | 298 | 57 | 21,865 | * | * |
| Miscellaneous | 37 | 2 | 1 | 40 | 316 | 436 |
| All groups | 77,410 | 1,370 | 202 | 78,982 | 81‡ | 1,460§ |
ACCIDENT PRONENESS.—In two consecutive years investigation was made as to the total number of individuals suffering accidents in mines as distinct from the total number of mining accidents. It was found that approximately 25 per cent. of those injured were involved in two or more accidents.
EXTENT OF DISABILITY AND LOSS OF EARNING-POWER.—There were 231 cases of permanent physical disability in 1946 in which the extent of the disability could be assessed. Of these, 99 suffered a 5 per cent. or less disability (in most cases the loss of, or loss of the use of, a finger), 66 over 5 per cent. and up to 20 per cent., 46 over 20 per cent. and up to 50 per cent., 17 cases over 50 per cent. and under 100 per cent., and 3 cases of total disability.
Provision is also made in certain cases for the actual impairment of wage-earning capacity to be stated. Of the 283 cases of permanent partial incapacity in 1946, the question as to what wages the employee would earn on resumption was answered in 120 cases. In 109 of these cases it was reported that though dismemberment or disablement had occurred, no diminution of earning-power had taken place. In 11 cases, however, definite and serious impairment eventuated.
HOUR OF OCCURRENCE.—The following tabulation of industrial accidents, according to the hour of occurrence, shows the effects of fatigue during the working-day.
| Time of Occurrence to Nearest Hour. | Year. | Causes, 1942–46 | Totals, 1942–46. | ||||||||
|---|---|---|---|---|---|---|---|---|---|---|---|
| 1942.* | 1943.* | 1944.* | 1945.* | 1946. | Machinery. | Falls of Persons. | Handling Objects. | Hand Tools. | Other. | ||
*Excluding accidents to forestry-workers and bush-workers. | |||||||||||
| 8 a.m. | 552 | 597 | 501 | 472 | 451 | 274 | 410 | 678 | 379 | 832 | 2,573 |
| 9 a.m. | 1,331 | 1,522 | 1,271 | 1,216 | 1,334 | 763 | 743 | 2,098 | 1,176 | 1,894 | 6,674 |
| 10 a.m. | 2,083 | 2,381 | 2,132 | 2,019 | 1,972 | 1,108 | 1,052 | 3,142 | 1,750 | 3,535 | 10,587 |
| 11 a.m. | 2,174 | 2,483 | 2,221 | 2,121 | 2,168 | 1,204 | 1,122 | 3,246 | 1,839 | 3,756 | 11,167 |
| 12 noon | 1,135 | 1,359 | 1,113 | 1,011 | 1,084 | 645 | 666 | 1,528 | 962 | 1,901 | 5,702 |
| 1 p.m. | 642 | 781 | 664 | 621 | 627 | 423 | 404 | 687 | 442 | 1,379 | 3,335 |
| 2 p.m. | 1,681 | 1,821 | 1,675 | 1,444 | 1,641 | 969 | 793 | 2,184 | 1,421 | 2,895 | 8,262 |
| 3 p.m. | 1,974 | 1,991 | 1,619 | 1,638 | 1,660 | 1,036 | 980 | 2,595 | 1,468 | 2,803 | 8,882 |
| 4 p.m. | 1,400 | 1,501 | 1,188 | 1,162 | 1,288 | 815 | 815 | 2,066 | 1,035 | 1,808 | 6,539 |
| 5 p.m. | 748 | 873 | 731 | 644 | 616 | 377 | 479 | 1,075 | 557 | 1,124 | 3,612 |
| Other hours | 1,803 | 1,893 | 1,701 | 1,622 | 1,499 | 826 | 1,158 | 2,043 | 660 | 3,831 | 8,518 |
| Not stated | 301 | 312 | 242 | 228 | 325 | 115 | 91 | 411 | 189 | 602 | 1,408 |
| Not applicable | 207 | 273 | 456 | 329 | 458 | 17 | 1 | 1,212 | 26 | 467 | 1,723 |
| Totals | 16,031 | 17,787 | 15,514 | 14,527 | 15,123 | 8,572 | 8,714 | 22,965 | 11,904 | 26,827 | 78,982 |
This table indicates that accidents are definitely most numerous during the middle and later part of the morning; there is another peak in mid-afternoon, but this does not reach the same high point.
A more definite indication is given by considering the length of time the employee had worked on the day when the accident occurred.
| Number of Hours already worked. | 1942.* | 1943.* | 1944.* | 1945.* | 1946. | Totals, 1942–46. |
|---|---|---|---|---|---|---|
*Excluding accidents to Post and Telegraph employees, forestry-workers, and bush-workers. | ||||||
| Under 1 | 799 | 870 | 733 | 764 | 847 | 4,013 |
| 1 and under 2 | 1,685 | 1,854 | 1,607 | 1,573 | 1,603 | 8,322 |
| 2 and under 3 | 2,107 | 2,409 | 2,102 | 2,011 | 2,028 | 10,657 |
| 3 and under 4 | 2,177 | 2,524 | 2,264 | 2,120 | 2,276 | 11,361 |
| 4 and under 5 | 1,187 | 1,425 | 1,148 | 1,119 | 1,145 | 6,024 |
| 5 and under 6 | 1,418 | 1,596 | 1,387 | 1,330 | 1,550 | 7,281 |
| 6 and under 7 | 2,040 | 2,156 | 1,876 | 1,722 | 1,8.14 | 9,608 |
| 7 and under 8 | 1,645 | 1,803 | 1,433 | 1,395 | 1,561 | 7,837 |
| 8 or over | 1,266 | 1,355 | 1,147 | 892 | 811 | 5,471 |
| Not stated | 1,213 | 1,128 | 1,044 | 944 | 1,032 | 5,361 |
| Not applicable | 199 | 269 | 451 | 325 | 456 | 1,700 |
| Totals | 15,736 | 17,389 | 15,192 | 14,195 | 15,123 | 77,635 |
The foregoing tabulation shows that the greatest number of accidents occurred during the third and fourth hours worked in the day. Overtime accidents (eight hours or more already worked) decreased from 8.0 per cent. of all accidents in 1942 to 5.4 per cent. in 1946.
STATISTICS of consumption cannot be compiled with absolute accuracy, owing to the impossibility of obtaining exact comparability in component statistics of production, exports, and imports. Nevertheless, a sufficient degree of comparability can normally be attained to permit of the compilation of statistics of consumption with a reasonable approach to accuracy. There are several serious deficiencies in the statistical data at present available, the most serious being occasioned by the lack of statistics illustrating the distribution among individuals of the annual flow of commodities entering into consumption.
VALUE OF GOODS AVAILABLE FOR USE.—Statistics of the value of production, of exports, and of imports have been compiled regularly for many years. From these statistics an estimate of the annual value of goods available for New Zealand consumption can be made, the value of exports being deducted from that of production, and the value of imports added to the residuum. The result of this computation gives a close approach to the value of all goods available for use in the country.
Various additional factors have bad to be taken into account in preparing estimates covering the war period and quoted in the tables. In some cases rather arbitrary figures have had to be accepted for adjustment purposes. The following descriptive notes under the respective headings will serve to indicate the scope of these estimates.
Production.—The series of value and volume of production figures as quoted in Section 47 of this Year-Book form the basis of the tables which follow. The figures relate to the production year, which, in most cases, approximates closely to the year ended 30th June.
Exports.—The official export figures (f.o.b.) for the years ended 30th June have been adjusted to exclude charges incurred between the stages of production and export.
Goods (normally exported) supplied under the reverse lend-lease procedure, shipments by the Armed Services, and Red Cross and food parcels have all been treated as additional exports in the tables which follow.
Adjustments have been made for changes in stocks awaiting shipment, so that the export figures quoted in this section represent the segment of production in any year exported, or ultimately destined for export.
The volume indices have been adjusted to make allowance for the above-mentioned inclusions.
Imports.—The official import figures (c.i.f.) for the years ended 30th June, excluding ordnance, have been adjusted for the war period to take into account additional freight and insurance charges above the nominal 10 per cent. allowed in the official figures of imports.
Further adjustments have been made for the lump-sum payments received from the United Kingdom Government as a set-off against the high level of import prices, and for the realization on certain war assets.
Unfortunately, statistics of retail and wholesale merchandise stocks are not available, so that the figures illustrate goods available for use and not necessarily goods actually used during each of the years.
The following table gives the position in regard to value of goods, but care should be exercised in interpreting the table in view of the substantial upward trend in unit values that took place over the period covered by the table. In addition to the statistics for the last twelve years, figures for the years 1928–29 and 1932–33 are also given.
| Year ended 30th June, | Produced in New Zealand. | Imported. | All Goods available for Use in New Zealand. | ||||
|---|---|---|---|---|---|---|---|
| Total. | Exported. | Available for use in New Zealand. | Total. | Per Head. | |||
| Total. | Per Head. | ||||||
| VALUES | |||||||
| £(m.) | £(m.) | £(m.) | £ | £(m.) | £(m.) | £ | |
| 1929 | 126.2 | 54.1 | 72.1 | 49.2 | 46.5 | 118.6 | 81.0 |
| 1933 | 83.7 | 35.7 | 48.0 | 31.3 | 25.3 | 73.3 | 47.8 |
| 1936 | 113.8 | 52.4 | 61.4 | 39.1 | 39.5 | 100.9 | 64.3 |
| 1937 | 135.9 | 62.0 | 73.9 | 46.7 | 50.1 | 124.0 | 78.4 |
| 1938 | 135.8 | 59.1 | 76.7 | 48.0 | 57.5 | 134.2 | 84.0 |
| 1939 | 136.1 | 55.6 | 80.5 | 49.8 | 56.5 | 137.0 | 84.7 |
| 1940 | 144.8 | 63.7 | 81.1 | 49.6 | 46.1 | 127.2 | 77.7 |
| 1941 | 160.4 | 72.0 | 88.4 | 54.1 | 42.2 | 130.6 | 79.9 |
| 1942 | 163.8 | 73.5 | 90.3 | 55.4 | 41.4 | 131.7 | 80.7 |
| 1943 | 170.2 | 81.1 | 89.1 | 54.3 | 40.8 | 129.9 | 79.2 |
| 1944 | 175.9 | 94.8 | 81.1 | 49.4 | 54.3 | 135.4 | 82.5 |
| 1945 | 196.7 | 119.2 | 77.5 | 46.3 | 48.7 | 126.2 | 75.4 |
| 1946 | 201.0 | 91.3 | 109.7 | 63.4 | 57.5 | 167.2 | 96.7 |
| 1947 | 230.9 | 112.2 | 118.7 | 66.6 | 88.8 | 207.5 | 116.4 |
| VALUE INDEX NUMBERS 1938–39 (= 100) | |||||||
| 1929 | 93 | 97 | 90 | 99 | 82 | 87 | 96 |
| 1933 | 61 | 64 | 60 | 63 | 45 | 54 | 56 |
| 1936 | 84 | 94 | 76 | 79 | 70 | 74 | 76 |
| 1937 | 100 | 112 | 92 | 94 | 89 | 91 | 93 |
| 1938 | 100 | 106 | 95 | 96 | 102 | 98 | 99 |
| 1939 | 100 | 100 | 100 | 100 | 100 | 100 | 100 |
| 1940 | 106 | 115 | 101 | 100 | 82 | 93 | 92 |
| 1941 | 118 | 129 | 110 | 109 | 75 | 95 | 94 |
| 1942 | 120 | 132 | 112 | 111 | 73 | 96 | 95 |
| 1943 | 125 | 146 | 111 | 109 | 72 | 95 | 93 |
| 1944 | 129 | 171 | 101 | 99 | 96 | 99 | 98 |
| 1945 | 145 | 214 | 96 | 93 | 86 | 92 | 89 |
| 1946 | 148 | 164 | 136 | 127 | 102 | 122 | 114 |
| 1947 | 170 | 202 | 147 | 134 | 157 | 151 | 137 |
A comparison of statistics of value of goods available for consumption and of private disposable income—i.e., private income excluding direct taxation—indicates the widening spread between goods and income during the war period and a narrowing tendency commencing with the year 1945–46. The statistics of private disposable income in any year include the amount set aside as savings, cost of wholesaling and retailing, and the incomes of those engaged in purely service industries; while the statistics of goods available for consumption are based on producers' and import prices and not on retail prices. Consequently, a considerable spread between the two series is to be expected, even in normal times.
| Year. | Goods available for Consumption. | Private Disposable Income. | Exercise of Private Disposable Income over Goods available for Consumption. | |
|---|---|---|---|---|
| £(m.) | £(m.) | £(m.) | Per Cent. | |
| 1938–39 | 137.0 | 176.3 | 39.3 | 28.7 |
| 1939–40 | 127.2 | 186.5 | 59.3 | 46.6 |
| 1940–41 | 130.6 | 191.7 | 61.1 | 46.8 |
| 1941–42 | 131.7 | 207.9 | 76.2 | 57.9 |
| 1942–43 | 129.9 | 231.5 | 101.6 | 78.2 |
| 1943–44 | 135.4 | 257.6 | 122.2 | 90.3 |
| 1944–45 | 126.2 | 259.8 | 133.6 | 105.9 |
| 1945–16 | 167.2 | 279.4 | 112.2 | 67.1 |
| 1946–47 | 207.5 | 317.1 | 109.6 | 52.8 |
AGGREGATE VOLUME OF GOODS AVAILABLE FOR CONSUMPTION.—Index numbers of volume of total production, based in most cases on figures of actual physical production, and index numbers of volume of exports and of imports, form the basis on which figures indicating the volume of goods available for New Zealand consumption are estimated. Attention is drawn to the notes on adjustments, &c., applied under the various headings and explained under the preceding title. Quantitative figures of exports are readily available from the official statistics, and as the great bulk of the export trade is confined to a relatively small number of items it is a comparatively simple matter to compile an index number of volume for years ending with the month of June. Prior to the year ended 30th June, 1946, a similar position did not hold in the case of imports, as they are far more diversified in nature, and full detail was not available for other than calendar years. Index numbers of volume of imports for calendar years are compiled, and up to the year 1945–46 an average of the indices for two calendar years was used to approximate years ending with the month of June. Commencing with the year ended 30th June, 1946, a special index number of volume of imports has been compiled. By the use of quantitative figures of production, exports, and imports, reasonably accurate figures of movements in volume may be ascertained, and figures indicating the volume of goods available for New Zealand consumption arrived at. In the process of ascertaining an index number of the volume of goods available for New Zealand consumption, figures of value based on unit values ruling in 1938–39 are used.
Index numbers of volume covering similar years and for similar headings to those given in the earlier table are given below.
INDEX NUMBERS OF VOLUME OF GOODS BASE 1938–39 (= 100)
| Year ended 30th June, | Produced in New Zealand. | Imported. | All Goods available for Use in New Zealand. | ||||
|---|---|---|---|---|---|---|---|
| Total. | Exported. | Available for use in New Zealand. | Total. | Per Head. | |||
| Total. | Per Head. | ||||||
| 1929 | 77 | 74 | 79 | 88 | 86 | 82 | 91 |
| 1933 | 83 | 96 | 74 | 78 | 50 | 64 | 68 |
| 1936 | 93 | 105 | 86 | 88 | 81 | 84 | 86 |
| 1937 | 99 | 104 | 95 | 97 | 98 | 96 | 98 |
| 1938 | 100 | 102 | 99 | 100 | 106 | 102 | 103 |
| 1939 | 100 | 100 | 100 | 100 | 100 | 100 | 100 |
| 1940 | 105 | 106 | 104 | 103 | 84 | 96 | 95 |
| 1941 | 113 | 111 | 113 | 112 | 69 | 95 | 94 |
| 1942 | 110 | 109 | 110 | 109 | 58 | 88 | 88 |
| 1943 | 109 | 116 | 104 | 102 | 58 | 85 | 84 |
| 1944 | 107 | 132 | 91 | 89 | 66 | 81 | 79 |
| 1945 | 113 | 155 | 83 | 80 | 63 | 75 | 72 |
| 1946 | 111 | 110 | 111 | 104 | 71 | 95 | 88 |
| 1947 | 116 | 112 | 119 | 108 | 93 | 108 | 98 |
The low point, both in respect of total and per head volume of goods available for use, was recorded in 1931–32, the decreases from the 1928–29 levels amounting to 26 and 29 per cent. respectively. The 1928–29 level of total volume of consumption was regained in 1935–36, while the per head level was regained in 1936–37.
In conjunction with the previous table, it is interesting to consider the proportions of New-Zealand-produced goods and of imported goods in the total quantum of goods entering into consumption. Over the period for which the break-up is available, locally produced goods supplied 64 per cent. and imported goods 36 per cent. of the total.
Comparisons in this respect for individual years are given hereunder.
| Year. | Locally produced. Per Cent. | Imported. Per Cent. |
|---|---|---|
| 1928–29 | 57 | 43 |
| 1929–30 | 57 | 43 |
| 1930–31 | 62 | 38 |
| 1931–32 | 66 | 34 |
| 1932–33 | 68 | 32 |
| 1933–34 | 67 | 33 |
| 1934–35 | 63 | 37 |
| 1935–36 | 60 | 40 |
| 1936–37 | 58 | 42 |
| 1937–38 | 57 | 43 |
| 1938–39 | 59 | 41 |
| 1939–40 | 64 | 36 |
| 1940–41 | 70 | 30 |
| 1941–42 | 73 | 27 |
| 1942–43 | 72 | 28 |
| 1943–44 | 66 | 34 |
| 1944–45 | 65 | 35 |
| 1945–46 | 69 | 31 |
| 1946–47 | 65 | 35 |
While strict accuracy cannot be claimed for these figures—particularly in respect of single years—a definitely higher proportion of New-Zealand-produced goods in the total is observed from 1930–31 to 1934–35 and again from 1939–40 onwards. The falling-off in the volume of imports during the depression years was considerably greater than that for locally produced goods consumed in New Zealand. The policy of import control introduced in December, 1938, and the dictates of a war economy were responsible for the relatively low proportion of imported goods to total consumption evident from 1939–40 onwards.
CONSUMPTION OF NEW ZEALAND PRODUCE.—Statistics of the value of production and of exports render it possible to compute the ratio of internal consumption of New Zealand produce to exports, a feature which is of peculiar significance to New Zealand in view of its high per caput overseas trade.
It is first necessary to deduct from the production totals (miscellaneous group) the value represented by buildings and by road and railway construction, &c., for these items are not capable of being exported. In order to avoid such fluctuations as are caused by the unequal incidence of price-changes or by the holding of wool stocks, &c., the aggregate of five years has been adopted. For production, figures have been taken for the production years (terminating at varying dates for different commodities) 1942–43 to 1946–47; for exports the calendar years 1943–47 have been adopted. In addition to recorded exports, an allowance has been made for goods supplied under the reverse lend-lease arrangements, Red Cross parcels, military supplies, &c.
| Produce. | Consumed in New Zealand. Per Cent. | Exported. Per Cent. |
|---|---|---|
| Agricultural and pastoral | 23 | 77 |
| Forest | 95 | 5 |
| Mining | 75 | 25 |
| Factory and other | 87 | 13 |
| Total | 48 | 52 |
The term “Factory and other” includes fisheries, factory (added value), and other industrial production; but it should be noted that the output of butter and cheese factories and of meat-freezing works is treated herein under agricultural and pastoral, and not under factory production. Similarly, sawmill output is included with forest produce.
While the statistical data discussed in the foregoing pages afford an indication of movements in the value and volume of consumption of important classes of commodities in the aggregate, considerable interest attaches to the statistics for individual commodities of importance. Estimates of the consumption of a selection of individual commodities are given in the following paragraphs. No indication of the distribution of consumption of these commodities among individual classes of consumers is available; but with the full employment and wide distribution of wealth that prevails in New Zealand it is beyond question that the per caput rates of consumption of various commodities shown later are truly representative of general living standards.
Figures showing, for some of the more important food products in which an export trade is maintained, the respective proportions of the total production in 1946–47 which were consumed in New Zealand and destined for export are as follows:—
| Consumed in New Zealand. Per Cent. | Exported. Per Cent. | |
|---|---|---|
| Butter | 17 | 83 |
| Cheese | 6 | 94 |
| Beef | 44 | 56 |
| Mutton | 38 | 62 |
| Lamb | 3 | 97 |
| Pig-meat | 71 | 29 |
The proportion of pig-meat consumed locally has increased very considerably in recent years owing to a decline in pig-farming and to increased consumption of bacon and ham. Cheese-consumption also has increased, a noteworthy feature being the growing popularity of processed cheese, which now accounts for nearly one-third of total cheese-consumption.
PER CAPUT QUANTITIES OF PRINCIPAL FOODSTUFFS AVAILABLE FOR CONSUMPTION.—Estimates of annual consumption for the civilian population have been made for the principal items of foodstuffs for a pre-war period and for the year 1947. The effect of restrictions placed on the consumption of certain commodities during the war, particulars of which are given later in this section, is apparent. Basic statistical data are rather scanty in the case of some items, particularly fresh vegetables, and the estimates may be subject to correction as further information comes to hand.
Dairy-produce.—The proportion of New Zealand's total butterfat production which is utilized for local human consumption in various forms is approximately 21 per cent. Estimated figures of annual civilian consumption levels for individual items of dairy-produce, pre-war and for 1947 are given below.
| Pre-war. | 1947. | |
|---|---|---|
* Available for restricted classes of consumers only. †1947–48 | ||
| Whole-milk (pint) | 220 | 320 |
| Cream (pint) | 6.9 | * |
| Ice-cream (pint) | 3.2 | 11.5 |
| Cheese (lb.) | 4.5 | 5.3† |
| Butter (lb.) | 41 | 31† |
| Milk-powder and condensed milk (lb.) | 5.0 | 8.4 |
In the following comparison of butter and cheese consumption in various countries the butter figures for countries other than New Zealand have been taken from a recent publication of the Food and Agriculture Organization of the United Nations. The pre-war figures are mostly the average of the years 1934 to 1938; for New Zealand they relate to the immediate pre-war period.
For cheese, details (other than for New Zealand) are from the 1948 Review of Dairy Produce issued by the Intelligence Branch of the Commonwealth Economic Committee.
BUTTER AND CHEESE CONSUMPTION PER CAPUT
| — | Butter. | Cheese. | ||
|---|---|---|---|---|
| Pre-war. | 1946–47. | Pre-war. | 1946 or 1946–47. | |
* 1947–48. | ||||
| lb. | lb. | lb. | lb. | |
| United Kingdom | 24.4 | 10.1 | 8.9 | 10.0 |
| Denmark | 18.5 | 27.1 | 14.1 | 18.1 |
| Netherlands | 12.3 | 10.1 | 17.0 | 10.8 |
| France | 10.6 | 7.3 | 14.6 | 10.6 |
| United States of America | 16.9 | 12.3 | 5.8 | 6.9 |
| Canada | 30.8 | 26.4 | 3.6 | 4.2 |
| Argentina | 4.0 | 5.3 | 6.2 | 10.3 |
| Australia | 31.7 | 26.2 | 4.3 | 6.1 |
| New Zealand | 41.0 | 31.0 | 4.5 | 5.3* |
In considering New Zealand's relatively high consumption of butter it should be noted that the use of margarine as a spread, common in some countries, is unknown in New Zealand.
Meats.—In estimating the average annual civilian consumption of meats an allowance has been made in the case of each item for killings on farms and for condemnations. The consumption levels for the various items are as follows, the weights in each case being on a bone-in dressed carcase basis.
| Pre-war. | 1946–47. | |
|---|---|---|
| Beef (lb.) | 112 | 92 |
| Veal (lb.) | 7.5 | 5.5 |
| Mutton (lb.) | 60 | 61 |
| Lamb (lb.) | 6.5 | 7.1 |
| Pork—including chopper meat (lb.) | 9 | 7.8 |
| Ham and bacon (lb.) | 17 | 23 |
The following table compares New Zealand's consumption of meat with that of other countries. The figures for other countries are taken from a recent publication of the Food and Agriculture Organization of the United Nations, which points out that for some countries, owing to unsatisfactory or incomplete statistics, the figures are rough approximations only. Information regarding the Union of Soviet Socialist Republics is not available. Meat in all cases is expressed as the bone-in carcase weight of beef, veal, mutton, lamb, and pig-meat; it also includes edible offal.
As no comparison of meat consumption is complete without a consideration of poultry, the consumption of which is much higher in the United States of America, Canada, Argentina, Australia, and Denmark than in New Zealand, figures are given for both meat, and meat and poultry combined. The pre-war meat consumption is also shown, being the yearly average of 1934 to 1938 for most countries. For New Zealand it is the yearly average of 1937 to 1939, this figure, although not so accurate as recent figures of consumption, being reasonably reliable.
MEAT CONSUMPTION PER CAPUT
| — | Pre-war (Meat Only). | 1947.* | |
|---|---|---|---|
| Meat. | Meat and Poultry. | ||
* Poultry figures for most countries represent an estimate for 1946–47; for France and the Netherlands they relate to 1945–46. | |||
| lb. | lb. | lb. | |
| United Kingdom | 132 | 112 | 116 |
| France | 90 | 79 | 88 |
| Netherlands | 92 | 51 | 53 |
| Denmark | 123 | 110 | 118 |
| Germany | 108 | 35 | 35 |
| Norway | 86 | 62 | 65 |
| Sweden | 95 | 92 | 95 |
| United States of America | 136 | 169 | 193 |
| Canada | 119 | 125 | 146 |
| Argentina | 295 | 268 | 277 |
| Australia | 253 | 198 | 210 |
| New Zealand | 220 | 207 | 211 |
It is not surprising that, in general, the highest consumption rates are found in countries with surpluses for export. The United States of America and Canada are alone in showing rates above pre-war levels.
Fresh Vegetables and Fruits.—Estimates under this heading have been made, particularly in the case of vegetables, with considerable difficulty owing to a number of factors, not the least being the fact that domestic garden production must of necessity be taken into account. Where there is no evidence as to changes in consumption habits, the estimates for both pro-war and 1947 have been treated as on an equality. Consumption levels for individual items are estimated as follows:—
| Pre-war. | 1947. | |
|---|---|---|
| Potatoes (lb.) | 130 | 130 |
| Kumeras (lb.) | 7.5 | 7.5 |
| Cabbages and greens (lb.) | 100 | 100 |
| Carrots (lb.) | 30 | 30 |
| Tomatoes (lb.) | 20 | 20 |
| Apples (lb.) | 44 | 45 |
| Pears and quinces (lb.) | 6 | 6 |
| Stone-fruits (lb.) | 12.5 | 9.2 |
| Citrus fruits (lb.) | 23 | 16.3 |
| Bananas (lb.) | 21 | 13 |
| Pineapples (lb.) | 1 | 0.6 |
Canned Fruit and Vegetables.—Owing to the lack of satisfactory details for earlier years, the pre-war consumption of these items is shown as the average of 1938 and 1939.
| Pre-war. | 1947. | |
|---|---|---|
| Canned fruit (lb.) | 10.5 | 3.2 |
| Canned vegetables (lb.) | 1.6 | 8.9 |
Before the war approximately 75 to 80 per cent. of canned fruit requirements was imported and consisted mainly of pineapple, peaches, and apricots. The war considerably upset this trade, which is now less than a fifth of its former volume. With no development in the local canning of fruit it is not surprising that consumption has fallen to about 30 per cent. of its pre-war scale.
The consumption of canned vegetables, on the other hand, due in some measure to the striking wartime expansion of the industry, is now at a record high level. Before the war there were some imports of peas and beans, but all requirements are now met from local production. Green peas, as in pre-war years, account for more than half the production, but there has also been considerable development in asparagus, baked beans, green beans, carrots, and mixed vegetables. Rehydrated peas (soaked after threshing) were canned on a very large scale for the United States Armed Services and a certain quantity found its way on to the local market, but the small hold they obtained is waning.
Other Foodstuffs.—Estimated annual civilian consumption levels for other items of foodstuffs are given hereunder.
| Pre-war. | 1947. | |
|---|---|---|
* Average of 1941–45. † Reserved for Asiatics, ships' stores, and hospitals. | ||
| Poultry (lb.) | 3.9 | 4.0 |
| Fresh fish—edible portion (lb.) | 11.0 | 14.6 |
| Shell-fish—edible portion (lb.) | 0.9 | 1.2 |
| Eggs (dozen) | 20 | 18 |
| Honey (lb.) | 2.1 | 4.2 |
| Refined sugar (lb.) | 106 | 94.4 |
| Dried peas and beans (lb.) | 1.6 | 3.8* |
| Flour wheaten (lb.) | 185 | 188 |
| Cornflour (lb.) | 2.4 | 3.7 |
| Oatmeal, oaten products (lb.) | 10.5 | 9.2 |
| Rice (lb.) | 5.3 | 2.3† |
| Tea (lb.) | 6.8 | 6.5 |
| Cocoa (lb.) | 1.0 | 1.0 |
Beer, Wine, Spirits, and Tobacco.—As the consumption of these items is particularly susceptible to economic conditions, the depression and immediate post-depression years have been avoided in ascertaining the pre-war consumption. The figures for wine are probably not as accurate as those relating to the other items, for the reason that production figures only are available for locally-made wine which naturally (for maturity purposes) is not usually placed on the market until some years after production. Wine-production has been steadily increasing during the last decade, the 1947 figure being more than double the immediate pre-war output, and accounting for about two-thirds of total local consumption.
| Pre-war. | 1947. | |
|---|---|---|
| Beer (gallons) | 10.3 | 16.1 |
| Wine (gallons) | 0.20 | 0.35 |
| Spirits (proof gallons) | 0.28 | 0.16 |
| Tobacco (lb.) | 3.9 | 5.3 |
In interpreting the big increase in beer-consumption it should not be overlooked that as a war measure the alcoholic strength of beer was, on the 11th May, 1942, reduced by about one-quarter. Although this restriction was removed at the beginning of 1949 the additional duty on beer exceeding the reduced strength has had much the same effect. The supply of spirits is inadequate to meet a demand greater than in pre-war years, and there is unofficial rationing by the trade. The 1947 figure for tobacco, which was in short supply during the later war years, is probably an over-statement of actual consumption in 1947, for it is likely that there was some building-up of retail stocks in that year.
Wartime Restrictions on Consumption.—Shortages or prospective shortages of imported goods, brought about or accentuated by the war, created the need for a controlled distribution. The rationing of such domestic produce as meat and butter was necessary to cope with the heavy demands of the Armed Forces, both British and allied, and at the same time to maintain supplies to the United Kingdom.
To ensure an equitable distribution of the more essential commodities, rationing by coupons was introduced for the following items: tea, sugar, butter, meat, household linen, blankets, clothing, and footwear. Eggs are subject to a preference rationing to children under five years of age, expectant mothers, and invalids suffering from specific ailments. Baby wool is reserved for, and rationed to, expectant mothers.
During 1948 rationing was lifted from the following important commodities; tea, 31st May; sugar for domestic use, 27th August; sugar for manufacturing purposes, 29th November; meat, 27th September.
Details of the rationing provisions and other restrictions relating to the various principal commodities, including those now free of rationing, are as follows:—
Tea.—The rationing of tea was introduced on 1st June, 1942, with a ration over the whole population (except infants under six months) of 8 oz. per calendar month, but children under ten years of age were eliminated from the scheme on 1st November of the same year. The ration was changed to 2 oz. per week on 1st November, 1943, at which level it remained to the end of rationing. Additional allowances of 4 oz. were granted for each of the following months: December, 1942, and March, April, and December, 1943. Permits were granted for the requirements of collective consumers such as hotels, restaurants, &c., and for morning and afternoon teas for workers in factories, offices, &c. The tea absorbed for these purposes, together with the special allowance for old people presently referred to, accounted for about 18 per cent. of the total consumption in 1947. On 1st August, 1946, persons seventy years of age and over were granted an additional allowance equivalent to 4 lb. per annum. This had the effect of raising the annual per caput consumption from 6.3 lb. in 1945 to 6.4 lb. in 1946, and, with a full year's commitments in 1947 to 6.5 lb. in that year. The difference between the latter rate and the pre-rationing level of 6.8 lb. represented an annual saving of approximately 500,000 lb.
Sugar.—The rationing of sugar commenced on 27th April, 1942, with a ration of 12 oz. per person per week. The basic rate was adjusted to 3 lb. per person per calendar month as from 1st August, 1942; 2½ lb. per person per calendar month as from 1st October, 1942; and back to 3 lb. per person per calendar month as from 1st December, 1942. From 1st November, 1943, to 18th March, 1945, the ration allowance was 3 lb. every four weeks (12 oz. per week), but from 19th March to 30th September, 1945, it was reduced to 10 oz. per week, after which the allowance of 12 oz. was reverted to, Additional allowances per person for jam-making were granted as follows: 1942, 6 lb.; 1943, 12 lb.; 1944, 12 lb.; 1945, 9 lb.; 1946, 9 lb.; 1947, 9 lb.; 1948 (to end of rationing), 6 lbs. As for tea, provision was made for the supply of sugar to collective consumers.
The industrial use of sugar was restricted to from 50 to 100 per cent. of the 1941 usage. The application of rationing in this field revealed to what a very great extent the use of sugar is woven into the fabric of industry. Apart from its obvious part in the manufacture of such commodities as cakes and pastry, biscuits and confectionery, jam, preserved fruits, condensed milk, ice-cream, honey, jelly crystals, beer, wine, &c., sugar has many lesser-known ramifications in such activities as meat-canning, bacon and ham curing, the tanning of leather, the manufacture of patent foods of all kinds, of yeast, coffee essence, medicines, tobacco, and even of fly-paper and ant-killer. All these uses, and others, make in the aggregate very considerable demands on the sugar-supply. It is not surprising, therefore, that of the total consumption in the last year of rationing approximately 44 per cent. was used for manufacturing purposes.
The great diversity of the uses of sugar in an industry which has undergone substantial development during the war and post-war periods makes it difficult to forecast what effect the removal of rationing will have. Limited household supplies of sugar (with the short supply of butter an added factor in some instances) have restricted home-baking and created a greatly enhanced demand for cakes, pastry goods, biscuits, confectionery, and jam. People are now consuming more patent foods, ice-cream, and processed milk; they are drinking more beer and wine. In addition, certain supplies of some of the foregoing sugar-users which were formerly imported have been replaced by an expanded local production. These are the main factors pointing to a usage, in a free market, probably greater than the pre-rationing scale. A possible limiting factor will be the considerably higher price now prevailing.
Subject to the above qualifications, the saving of sugar in the last year of rationing, as measured by the difference between the then and the pre-rationing levels of consumption, was about 10,000 tons.
Butter.—Butter rationing commenced on 28th October, 1943, with an allowance of 8 oz. per person per week. A further reduction to 6 oz. per week came into operation as from 11th June, 1945, but provision was made whereby expectant mothers and persons seventy years of age and over receive 8 oz. per week. Additional allowances of 4 oz. per week are granted to certain classes of workers on account of special working-conditions, and an extra ration allowance is permitted to persons suffering from certain ailments. Manufacturers using butter, and collective consumers, were allowed one-half of the quantities previously used. It is estimated that the 6 oz. per week rationing scale permitted a saving of about 8,000 tons of butter per annum although this figure may be slightly high because of a possible insufficient allowance for the increase in farm-made butter, and also because of the greatly increased use of industrial margarine which may to some extent become a permanent feature of New Zealand's economy. From the 24th October, 1949, the ration was increased to the amount allowed on the introduction of rationing, namely, 8 oz. per week.
Cream.—The consumption of cream, as such, is now prohibited except for persons suffering from certain ailments, while cream for ice-cream manufacture is limited to one-half of the quantity previously used.
Cheese.—The amount of cheese released by factories for local consumption is subject to regulation by the Food and Rationing Controller.
Margarine.—The use and sale of margarine and other edible fats are limited to the 1945 level. Practically the whole output of margarine is required for industrial purposes, for, in spite of a production more than double the pre-war figure, it is in considerable demand as a butter substitute in the manufacture of biscuits, cakes, &c.
Meat.—The first restrictions on meat applied to pig-meat and arose out of the very considerable requirements, particularly of bacon and ham, of the United States Armed Services in the South Pacific Area. As from the 3rd May, 1943, the local consumption of fresh pork, except for limited purposes, was prohibited. In the following month bacon and ham curers were placed on a quota of a certain number of pigs per month. The restrictions on pork were lifted on the 17th December, 1945, although this class of meat remained subject to general meat-rationing until the abolition of the latter.
The increased requirements of the Armed Services, together with the need for maintaining maximum supplies to the United Kingdom, led to the introduction of general meat-rationing on the 6th March, 1944. Rationing was on a value basis and applied to practically all fresh carcase meat, an exception being mutton skirts. The value of the original adult weekly ration, estimated to purchase on the average 2½ lb. of meat, was fixed at 1s. 9d., increasing to a maximum of 2s. according to seasonal price changes. Children under five years (excluding infants under six months) were allowed half-rations. On the 11th June, 1945, the ration was reduced to 1s. 6d.–1s. 9d. (2 1/7 lb.) per week. With the removal of the meat subsidy on the 29th September, 1947, a corresponding increase was made in the value of the ration to bring it up to 1s. 11d.–2s. 2d. so that it would still yield 2 1/7 lb. of meat.
Additional allowances were granted to certain classes of workers because of special working-conditions, and to persons suffering from certain ailments. Manufacturers (of pies, &c.) were allowed two-thirds of their pre-rationing usages. Canned corned beef and corned mutton were not available for local consumption, except by workers in isolated districts where there was difficulty in obtaining fresh meat. Although there was no restriction on the local sale of canned tongues they were practically unobtainable, for the policy of assuring maximum supplies for the United Kingdom was achieved by price differentiation. A similar policy was adopted for rabbits. There was no restriction on wet packs, that is, mixtures of meat and vegetables. Freezing companies were instructed to limit deliveries of edible offal to the local market to the pre-rationing level. Poultry and fish were not rationed.
Mainly owing to the lack of precise information concerning meat-consumption prior to rationing, it is possible to give only a rough approximation of the saving attributable to rationing. It was probably about 10,000 tons in the last year of rationing.
Eggs.—A scheme of priority egg rationing was introduced in all the principal districts throughout New Zealand on 20th March, 1944. Basically, the scheme guarantees a minimum of three eggs per week to all children up to the age of five years, and six eggs per week to expectant and nursing mothers. In addition, supplies are available to persons suffering from certain ailments.
Clothing, Footwear, and Household Linen.—Rationing of these items was introduced on 29th May, 1942, on a coupon system. Each person was allowed a certain number of coupons for each rationing period, varying coupon values being assigned to the different articles. Special coupons were provided for household linen. The rationing of items mentioned in this paragraph was abolished at the end of 1947. Baby wool is still reserved for expectant mothers.
The items enumerated in this section relate only to food, drink, tobacco, and clothing. Many other commodities are subject to control, probably the most important being the group comprising the numerous building materials and fittings. Oil-fuel and rubber tires were also rationed during the greater part of the war-period. Motor-spirits rationing was abolished on the 1st June, 1946, but was reintroduced on the 1st November, 1947, rationing being left to resellers. This method proved unsatisfactory, and on the 1st March, 1948, the wartime coupon system was reinstituted.
STATE DEVELOPMENT OF WATER-POWER.—Owing to its high relief, copious and well-distributed rainfall, and numerous lakes at moderate altitudes, New Zealand is well endowed with a plentiful supply of water-power, which is accordingly the principal agency used in the generation of electrical energy, fuel plants occupying a place of minor utility for stand-by or peak-loading purposes. Although the first public hydro-electric supply plant (which is still in operation) was installed at Reefton in 1887, comparatively little development had taken place prior to 1900. By 1903, however, water-power to the extent of 9,911 horse-power had been developed. During the four following decades this figure was progressively increased to 34,956, 54,244, 328,708, and 553,763 horse-power respectively, and the total at 31st March, 1948, was 767,271. Of a total of 2,589,620,153 units generated by public utilities in 1947–48, hydro-electric installations accounted for 2,478,259,805 units, or 95.7 per cent.
The Electricity Act, 1945, established a Department of State called the State Hydro-electric Department, which is charged with the administration of enactments relating to water-power and electrical energy. Prior to the passing of this Act, the controlling authority was the Public Works Department.
Part XIII of the Public Works Act, 1928 (now administered by the State Hydroelectric Department) vests in the Crown the sole right to use the water-power of New Zealand, subject to any existing rights, and gives the Government the right to develop such power, or to delegate the right to any local authority, or, outside a mining district, to any person or company, subject to certain conditions.
The regulations covering the delegation of this right, which were amended in June, 1934, provide that permission shall be obtained from the Minister in Charge of the State Hydro-electric Department by any person, &c., desiring to obtain a licence to generate power by this means. The regulations provide for an annual rental to be paid to the Crown by the licensee, such rental, except in special cases, to be at the rate of £1 per kVA. of maximum demand per annum, with a minimum annual payment of £10. A number of local authorities and private concerns have taken advantage of this provision of the Act.
Persistent demands that the Government itself should develop the power resources of New Zealand culminated in the passing of the Aid to Water-power Works Act in 1910, and the Lake Coleridge scheme for the supply of electricity to Christchurch City and to the Canterbury Provincial District was selected for development. Operations were commenced on these works in 1911 and completed in 1915, the station having a capacity of 4,500 kW., which was extended to 27,000 kW. in 1926, and to 34,500 kW. in 1930. After this successful development, plans for interconnected power systems in both the North and South Islands were drawn up.
The principal power source in the North Island is the Waikato River, which in its course of 200 miles from Lake Taupo has a total fall of 1,170 ft. and a final discharge of over 10,000 cusecs. In 1919 the State acquired the Waihi Gold-mining Company's 6,300 kW. station at Horahora on this river, and the capacity was increased to 10,300 kW. in 1925. In 1925 also a commencement was made with the Arapuni development, the first unit being brought into operation in 1929 and the station linked with Horahora. An earth movement necessitated the closing-down of the station in 1930, but, after remedial measures had been taken, the station resumed operation in 1932. Eight units with a total capacity of 157,800 kW. are now in service, the final unit having been brought into operation in 1946. The construction of the Karapiro station was commenced in 1940, and the station (with three units, each of 30,000 kW.) came into operation in 1947–48, resulting in the closing-down of the Horahora station, the site of which was submerged in the new lake.
To ensure adequate water-supplies to these and future developments on the Waikato River during the periods of peak loading in the winter months, the heavy spring and summer run-off has, since 1941, been conserved by means of control works which regulate the level of Lake Taupo and its outflow into the river.
A generating station at Mangahao, was commenced in 1922, the full development of 19,200 kW. being completed in 1925.
Following the completion of the Mangahao station the development of the middle (or Tuai) station at Waikaremoana was commenced in 1926. This was opened in 1929 with a capacity of 32,700 kW., extended in 1939 to 52,000 kW. Work was then commenced on the lower (40,000 kW.) station at Piripaua which was completed by March, 1944. Work on the upper development at Kaitawa followed and the station (32,000 kW.) was completed towards the end of 1948. The natural outlet of Lake Waikaremoana is by seepage through the upper levels of the natural dam impounding the water, and, in order to utilize to the best advantage the water storage available, an intake tunnel has been constructed and steps are being taken to seal the seepage outlets.
These North Island stations—viz., Arapuni, Karapiro, Mangahao, and Waikaremoana—have been linked up and are operated as one system while connections also exist with all the larger generating stations (hydro or thermo) operated by supply authorities. Steam and Diesel standby plants are also maintained by the Government at Auckland and Penrose.
In the South Island, after the completion of the Lake Coleridge scheme, the Waitaki River was selected as the next source of power. This station was opened in 1935, and now comprises five units each of 15,000 kW. rating. Measures are being taken to control the outflow of Lakes Pukaki and Tekapo to ensure an adequate supply of water to the Waitaki station during the winter months, and a single unit of 25,200 kW. is being incorporated in the control works of the latter lake. Another single unit of 25,200 kW. has been installed at Highbank to make use of the surplus water available in the winter months in the Rangitata irrigation race. This station was opened in June, 1945.
In 1936 the Government took over the Southland Electric-power Board's system including the generating station at Lake Monowai, and in 1938 acquired the Grey Electric-power Board's generating plant at Kaimata, on the Arnold River. During 1939 a grid system similar to that in the North Island was established by linking these two stations with the Coleridge and Waitaki stations, already interconnected.
The Dunedin City Council's hydro-station at Waipori is also linked with the system, as are some local-authority steam stations and the small Government-owned Diesel plant at Dobson.
Construction of a generating station on the Cobb River with a capacity of 12,000 kW. was originally undertaken by a private enterprise, but the undertaking was acquired by the Government and has now been completed. This station commenced supplying power to the Nelson district in June, 1944, and to Marlborough in January, 1945. The station, which could be doubled in capacity, will also ultimately be linked with the main South Island grid. It is already connected with several municipal and State stand-by plants in the northern portion of the Island.
The advances in installed capacity indicated above were no more than able to meet the increasing demands for power. Up to 1941, and from then on, through delays resulting from the war in the delivery of plant on order overseas, the demand, first in the North Island and eventually in the South Island, began to outstrip the capacity of the systems. This necessitated the encouragement of economies, and eventually the enforcement of restrictions on the use of electric power.
The position was further aggravated by a succession of dry summers, commencing with 1943–44, causing poor hydraulic conditions, particularly at Lakes Taupo and Waikaremoana, where the lakes remained at very low levels for considerable periods.
In this connection a table of index numbers is supplied showing how the average daily consumption of electrical energy has increased during the Inst twenty-three years. This table is based on units retailed or supplied free of charge by all supply authorities, separate series of numbers being given for the North and South Islands from 1936 onwards. For each series the base is the daily average over the year ended 31st March, 1939 (= 100).
| Year ended 31st March, | North Island. | South Island. | New Zealand. |
|---|---|---|---|
| 1926 | 19 | ||
| 1927 | 26 | ||
| 1928 | 32 | ||
| 1929 | 38 | ||
| 1930 | 45 | ||
| 1931 | 53 | ||
| 1932 | 55 | ||
| 1933 | 57 | ||
| 1934 | 60 | ||
| 1935 | 64 | ||
| 1936 | 69 | 73 | 70 |
| 1937 | 76 | 80 | 77 |
| 1938 | 87 | 90 | 88 |
| 1939 | 100 | 100 | 100 |
| 1940 | 115 | 114 | 115 |
| 1941 | 131 | 128 | 130 |
| 1942 | 140 | 137 | 139 |
| 1943 | 148 | 145 | 147 |
| 1944 | 154 | 157 | 155 |
| 1945 | 159 | 169 | 162 |
| 1946 | 165 | 181 | 169 |
| 1947 | 173 | 200 | 181 |
| 1948 | 177 | 203 | 185 |
It will be seen that from 1926 to 1931 the annual growth for New Zealand averaged 22 per cent. per annum, from 1931 to 1936, 5.5 per cent., from 1936 to 1941, 13.2 per cent., and from 1941 to 1948, the period during which restrictions and the encouragement of economics took place, only 5.2 per cent.
In order to meet future requirements in the North Island a comprehensive scheme was announced in October, 1943, envisaging the ultimate development of ten large stations, including Arapuni, to utilize practically the whole of the fall in the Waikato River from Lake Taupo to Cambridge. The grand total of the power available from such a chain of stations would approximate 800,000 kW. The scheme called for the development of four new stations within the next seven or eight years. The first of these, that at Karapiro, with a capacity of 90,000 kW., was completed in 1948, and work is proceeding on the next and largest station at Maraetai, which will have a capacity of 180,000 kW. Investigational work is almost complete for the next station to follow at Whakamaru, and is proceeding at the sites of two other proposed stations.
Plans for considerable extensions to the South Island chain of stations are also under way. The principal project in this scheme is a proposed station on the Clutha River above Roxburgh, where the Ministry of Works has carried out chives, shaft-sinking, and boring to prove the foundations. This scheme will necessitate the building of control works at the outlets of Lakes Wakatipu, Wanaka, and Hawea. Investigational work has also been done in regard to a further station on the Waitaki River at Black Jack's Point, while similar work is proceeding in connection with a proposed major scheme based on the water storage in Lakes Rotoroa and Rotoiti in the Nelson Provincial District.
The following table gives the present and ultimate installed capacity of each of the Government generating stations in operation or for which contracts for the supply of machinery have been let; the static head is also given.
| Name of Station. | Present Installed Capacity. | Ultimate Installed Capacity. | Static Head (Feet). | ||||
|---|---|---|---|---|---|---|---|
| No. of Units. | kW. | kVA. | No. of Units. | kW. | kVA. | ||
* Work is proceeding on these stations. † Extensions to this scheme are under investigation. | |||||||
| Arapuni | 8 | 1,57,800 | 180,000 | 8 | 157,800 | 180,000 | 175 |
| Karapiro | 3 | 90,001 | 100,000 | 3 | 90,000 | 100,000 | 100 |
| Maraetai* | 5 | 180,000 | 200,000 | 200 | |||
| Mangahao | 5 | 19,200 | 24,000 | 5 | 19,200 | 24,000 | 895 |
| Waikaremoana— | |||||||
| Kaitawa (upper station) | 2 | 32,000 | 38,000 | 2 | 32,000 | 38,000 | 440 |
| Tuai (middle station) | 3 | 52,000 | 62,200 | 3 | 52,000 | 62,200 | 675 |
| Piripaua (lower station) | 2 | 40,000 | 44,400 | 2 | 40,000 | 44,400 | 370 |
| Cobb River | 4 | 12,000 | 15,000 | 4† | 12,000 | 15,000 | 1,920 |
| Arnold River (Kaimata) | 2 | 3,060 | 3,600 | 2 | 3,060 | 3,600 | 52 |
| Lake Coleridge | 9 | 34,500 | 40,640 | 9 | 34,500 | 40,640 | 486 |
| Highbank | 1 | 25,200 | 28,000 | 1 | 25,200 | 28,000 | 330 |
| Waitaki | 5 | 75,000 | 83,333 | 5 | 75,000 | 83,333 | 70 |
| Lake Tekapo* | 1 | 25,200 | 28,000 | 80–105 | |||
| Lake Monowai | 3 | 6,000 | 7,050 | 3 | 6,000 | 7,050 | 154 |
The following table covers those State systems in actual operation in each of the last five years. In this and following tables relating to all stations the figures for the Cobb River scheme, which came into operation in June, 1944, were first included for the year 1944–45.
| — | 1943–44. | 1944–45. | 1915–46. | 1946–47. | 1947–48. |
|---|---|---|---|---|---|
*Includes fuel generation which in 1947–48 amounted to 49,425,547 units. | |||||
| £ | £ | £ | £ | £ | |
| Capital outlay | 22,975,871 | 26,539,988 | 29,755,489 | 34,324,574 | 39,462,259 |
| Total revenue | 2,579,886 | 2,697,176 | 2,885,973 | 3,098,716 | 3,253,269 |
| Power purchased | 267,398 | 229,371 | 280,522 | 516,842 | 398,446 |
| Working and management expenses | 712,918 | 808,695 | 993,644 | 1,002,630 | 1,055,807 |
| Interest | 717,644 | 773,217 | 848,576 | 883,802 | 1,072,255 |
| Sinking fund | 173,685 | 134,538 | 137,042 | 173,743 | 225,177 |
| Depreciation | 267,320 | 406,034 | 294,166 | 353,748 | 263,053 |
| Taxation | 440,921 | 443,853 | 423,674 | 243,854 | 165,760 |
| Total costs | 2,579,886 | 2,795,708 | 2,977,624 | 3,174,669 | 3,180,498 |
| kWh. | kWh. | kWh. | kWh. | kWh. | |
| Units generated* | 1,907,065,941 | 1,996,565,277 | 2,096,439,758 | 2,203,807,654 | 2,349,256,657 |
ELECTRIC-POWER BOARDS.—The policy of the Government generally is to supply power in bulk, leaving the reticulation and retail supply in the hands of the local authorities. Initially the only local authorities available for this purpose were the cities, boroughs, counties, and town districts, but to facilitate the extension of electric supply into the country areas a wider organization became necessary. This was first provided under the Electric-power Boards Act of 1918, which provided for several local districts to combine for the purpose of electric-power distribution, and to set up a special Electric-power Board to carry out the work, with rating-powers over the district concerned. The legislation was consolidated and amended in the Electric-power Boards Act, 1925, amendments to which were enacted in 1927 and 1928. Forty-four Boards constituted under these enactments are in existence, and the total population included in all licensed areas—i.e., power districts, cities, boroughs, &c.—is approximately 98.2 per cent. of the total population of New Zealand. Not all of the population in the licensed areas is as yet, however, served with distribution lines; but in this connection it is of interest to note that the Electricity Act, 1945, in addition to setting up a separate Department of State—the State Hydro-electric Department—for the purpose of controlling the Government generating stations, selling power in bulk, &c., also established a Rural Electrical Reticulation Council. This Council is empowered to collect from each supply authority a levy on sales of energy, and out of the proceeds to grant subsidies to rural authorities towards capital charges on reticulation extensions in sparsely populated areas. An Act of 1930 established an Association of Electric-power Boards and municipal electric-lighting authorities.
So far only one of the four main cities—viz., Auckland—has been included in the reticulation area of a power district, but of the secondary centres the cities of Wanganui and Lower Hutt, and the boroughs of Gisborne, Hastings, Petone, Masterton, Blenheim, Greymouth, Ashburton, and Oamaru are so included.
Forty-two Boards were engaged in the distribution of electric power during 1947–48. Of these, twenty-seven do not operate generating stations but are distributing power purchased in bulk, principally from Government stations. Eleven Boards, although operating small generating stations, are also mainly dependent on Government stations for supplies. The remaining four Boards operate their own water-power stations, but two of them find it necessary to make small bulk purchases. Two Boards were not actively functioning during 1917–48, while the area formerly administered by the Southland Electric-power Board now operates under Government control (since October, 1936).
The following is a summary of the financial operations of actively functioning Electric-power Boards.
| — | Year Ended 31st March, | ||||
|---|---|---|---|---|---|
| 1944. | 1945. | 1946. | 1947. | 1948. | |
| £ | £ | £ | £ | £ | |
| Capital outlay | 15,517,353 | 15,833,793 | 16,486,870 | 17,597,265 | 19,249,760 |
| Revenue— | |||||
| Retail sales | 3,737,333 | 3,836,269 | 3,946,975 | 4,116,879 | 4,328,993 |
| Bulk sales and inter-change | 177,999 | 186,437 | 215,038 | 256,144 | 247,845 |
| Profit on trading | 19,376 | 22,188 | 27,812 | 35,249 | 41,305 |
| Other | 42,591 | 50,122 | 56,030 | 52,248 | 42,811 |
| Totals | 3,977,299 | 4,095,016 | 4,245,855 | 4,460,520 | 4,660,954 |
| Expenditure— | |||||
| Operating— | |||||
| Power purchased | 1,608,239 | 1,689,107 | 1,786,965 | 1,924,861 | 2,027,052 |
| Generating costs | 66,730 | 39,502 | 40,215 | 57,008 | 46,293 |
| Transmission and distribution | 420,241 | 465,886 | 527,116 | 564,254 | 615,492 |
| Total operating | 2,095,210 | 2,194,495 | 2,354,296 | 2,546,123 | 2,688,837 |
| Management and general | 302,614 | 321,263 | 360,192 | 400,387 | 453,915 |
| Capital charges | 1,095,879 | 1,102,225 | 1,104,872 | 1,137,605 | 1,130,542 |
| Appropriations | 209,088 | 256,344 | 260,120 | 323,540 | 251,079 |
| Totals | 3,702,791 | 3,874,327 | 4,079,480 | 4,407,655 | 4,524,373 |
Revenue in the foregoing table is exclusive of moneys derived from rates, which yielded £3,361 in 1947–48. Capital charges are inclusive of interest, sinking-fund, and depreciation payments, while operating charges include wages, stores, fuel, distribution, and street-lighting expenses.
ALL STATIONS.—In addition to the Government undertakings controlled by the State Hydro-electric Department, the Tourist Department's station at Rotorua, and those undertakings operated by Electric-power Boards, there were, during 1947–48, thirty-seven establishments operated by other organizations, four of which represented private enterprise, the rest being local authorities of various classes. A general summary covering all stations in operation for the last three years is given hereunder.
| — | Year ended 31st March, | |||
|---|---|---|---|---|
| 1946. | 1947. | 1948. | ||
| Stations | No. | 100 | 100 | 97 |
| Persons engaged (both sexes) | No. | 4,182 | 4,399 | 4,342 |
| Salaries and wages | £ | 1,628,251 | 1,769,112 | 1,798,874 |
| Consumers | No. | 486,278 | 493,620 | 511,781 |
| Number of— | ||||
| Ranges | 146,142 | 160,808 | 180,989 | |
| Water-heaters | 175,310 | 192,817 | 212,749 | |
| Prime movers— | ||||
| Hydro | b.h.p. | 659,917 | 688,302 | 767,271 |
| Thermo | b.h.p. | 124,032 | 124,088 | 121,683 |
| Total | b.h.p. | 783,949 | 812,390 | 888,954 |
| Generators (capacity)— | ||||
| Main D.C. | kW. | 442 | 292 | 191 |
| A.C. | kW. | 438,666 | 455,621 | 509,088 |
| kVA. | 511,155 | 529,593 | 588,241 | |
| Standby D.C. | kW. | 1,842 | 1,842 | 1,964 |
| A.C. | kW. | 89,597 | 92,978 | 91,721 |
| kVA. | 112,023 | 115,490 | 113,890 | |
| Totals | kW. | 530,547 | 550,733 | 602,964 |
| Route-miles of lines | Miles | 30,723 | 31,747 | 35,527 |
| Revenue— | ||||
| Sales of current— | ||||
| Retail | £ | 6,504,379 | 6,816,253 | 7,031,505 |
| Bulk and interchange | £ | 3,004,658 | 3,420,553 | 3,423,150 |
| Other (including rates) | £ | 187,381 | 166,271 | 172,451 |
| Total revenue | £ | 9,696,418 | 10,403,077 | 10,627,106 |
| Expenditure— | ||||
| Power purchased (including interchange) | £ | 3,027,937 | 3,461,769 | 3,487,223 |
| Generating costs | £ | 737,029 | 898,178 | 776,223 |
| Transmission and distribution costs | £ | 1,172,308 | 1,287,266 | 1,361,026 |
| Management and general | £ | 839,544 | 854,698 | 991,549 |
| Capital charges | £ | 2,775,937 | 3,004,264 | 3,203,197 |
| Total expenditure | £ | 8,552,755 | 9,506,175 | 9,819,218 |
| Appropriations (including taxation) | £ | 1,045,536 | 879,221 | 626,305 |
| Capital outlay— | ||||
| Total expenditure to date | £ | 54,295,507 | 60,325,604 | 67,401,027 |
| Expenditure during year | £ | 4,060,158 | 6,182,129 | 6,699,721 |
| Units (kWh.)— | ||||
| Generated | (000) | 2,364,960 | 2,520,626 | 2,589,620 |
| Per head of mean population Units | 1,382 | 1,422 | 1,428 | |
| Sold (retail) | (000) | 1,891,227 | 1,997,873 | 2,035,711 |
The figures given in respect of employees refer only to those whoso salaries and wages are met out of revenue from the sale of energy.
Employees and Wages.—The following summary, covering all stations, shows for the year ended 31st March, 1948, the principal details for employees, and for salaries and wages paid.
| Class of Employment. | Persona engaged. | Salaries and Wages paid. | ||||
|---|---|---|---|---|---|---|
| Males. | Females. | Totals. | To Males. | To Females. | Totals. | |
| (a) Salaries or Wages paid out of Revenue from Sale of Energy | ||||||
| £ | £ | £ | ||||
| Secretaries, managers, engineers | 202 | 202 | 144,506 | 144,506 | ||
| Clerical staff | 777 | 395 | 1,172 | 321,826 | 84,824 | 406,650 |
| Wage-earning employees | 2,931 | 37 | 2,968 | 1,241,413 | 6,305 | 1,247,718 |
| Totals | 3,910 | 432 | 4,342 | 1,707,745 | 91,129 | 1,798,874 |
| (b) Salaries or Wages not paid directly out of Revenue from Sale of Energy | ||||||
| £ | £ | £ | ||||
| House-wiring | 186 | 186 | 62,769 | 62,769 | ||
| Trading departments | 121 | 17 | 138 | 46,852 | 3,392 | 50,244 |
| New construction-works | 1,232 | 12 | 1,244 | 513,053 | 3,171 | 516,224 |
| Totals | 1,539 | 29 | 1,568 | 622,674 | 6,563 | 629,237 |
| Grand totals | 5,449 | 461 | 5,910 | 2,330,419 | 97,692 | 2,428,111 |
Capital Outlay.—The following figures of capital expenditure during 1947–48 and of capital outlay to 31st March, 1948, include capital invested in trading departments and in other activities.
| Class of Expenditure. | Expenditure during Year ended 31st March, 1948. | Total Capital Outlay to 31st March, 1948. |
|---|---|---|
| £ | £ | |
| Land in connection with power-house | 351,527 | 916,968 |
| Headworks, pipe-lines, &c. | 2,974,329 | 10,841,678 |
| Power-house buildings, cottages, &c. | 493,300 | 2,827,435 |
| Generating plant | 746,510 | 4,505,740 |
| Special standby plant | 41,411 | 1,513,297 |
| Main transmission-line and main substations | 1,315,428 | 14,043,202 |
| Distribution system, substations, land, cottages, &c. | 1,016,884 | 16,812,199 |
| Public (street) lighting | 3,661 | 492,020 |
| Office and store buildings, workshops, garages, houses, and service buildings | 108,102 | 1,536,588 |
| Loose tools, meters, instruments, furniture, trucks, motor-cars, equipment, and stocks | 452,427 | 3,243,444 |
| Interest during construction | 281,207 | 2,808,029 |
| Loan conversion premiums | Cr. 215 | 63,573 |
| Miscellaneous (work under construction, cost of raising loans, law-costs, &c., and other capital expenditure) | Cr. 1,084,850 | 7,796,854 |
| Total capital outlay | 6,699,721 | 67,401,027 |
| Capital cash on hand and investments of capital | 306,557 | |
| Capital funds used to finance advances to consumers and trading departments | 163,097 | |
| Total capital assets | £67,870,681 |
Additions to the capital value of all electrical systems during 1947–48 totalled approximately £7,100,000, while deductions—i.e., sales and amounts written off—amounted to approximately £400,000. The previous table shows for each item the net expenditure only during the year, including amounts transferred for work completed, previously shown as work under construction, and totalling approximately £4,000,000.
Of the total capital additions during 1947–48 of £7,100,000, £5,300,000 was contributed by the Government, £1,480,000 by Electric-power Boards, £330,000 by other local authorities, and negligible amounts by companies. The chief items of Government expenditure were—£700,000 on the Whakamaru-Otahuhu and Whakamaru-Bunnythorpe 220 kV. transmission lines and the Otahuhu and Bunnythorpe substations; £600,000 on additions to the transmission, distribution, and communications systems and substations generally; £2,000,000 on the construction of the Maraetai power scheme; £825,000 on the Tekapo and Pukaki control works; £250,000 on the Kaitawa power-station at Waikaremoana; £375,000 on the Karapiro, Waitaki, and Cobb power-stations; £75,000 on the Roxburgh scheme; and £130,000 on exploration surveys in the Waikato Valley.
Local-authority expenditure during 1947–48 included £1,000,000 on distribution systems and £325,000 on transmission systems.
Capital Receipts.—The various sources for the capital expenditure shown in the previous table are summarized in the following table:—
| Total loans raised— | £ | £ |
|---|---|---|
| Loan liability at 31st March, 1948 | 46,135,889 | |
| Reserve created by loan repayments to date | 12,433,621 | |
| 58,569,510 | ||
| Appropriations from revenue | 9,030,663 | |
| Other capital reserves—i.e., capital profits and accretions | 90,457 | |
| Temporary advances, capital creditors, &c. | 180,051 | |
| Total capital receipts | £67,870,681 |
The loan liability was increased by £5,102,796 during 1947–48, representing new loans raised during the year, and reduced by £757,118, representing loan repayments during the year.
Where assets have been scrapped or written down, and the capital expenditure thereby reduced, corresponding amounts have been written off the appropriate capital reserves, i.e., reserves created by loan repayments and the capital expenditure out of revenue.
General Balance Sheet.—The following table summarizes the general assets and liabilities—i.e., capital items are excluded—as as 31st March, 1948, in addition to setting out the reserves and invested funds.
| Liabilities | £ | |
|---|---|---|
| Sundry creditors | 2,386,673 | |
| Advances from capital for trading departments, &c. | 163,097 | |
| Reserves— | £ | |
| Sinking fund reserve | 1,765,840 | |
| Depreciation reserve | 3,149,820 | |
| Renewal fund reserve | 1,274,460 | |
| General reserve | 1,245,794 | |
| Other reserves | 257,999 | |
| 7,693,913 | ||
| Credit balance, net revenue accounts | 1,455,192 | |
| £11,698,875 | ||
| Assets | £ | |
|---|---|---|
| Trading Department assets, stocks, &c. | 2,690,863 | |
| Cash, debtors, and other current assets | 3,269,664 | |
| Invested Reserve Funds— | £ | |
| Sinking funds | 1,694,353 | |
| Depreciation funds | 1,483,171 | |
| Renewal funds | 1,169,444 | |
| Other reserve funds | 1,391,380 | |
| 5,738,348 | ||
| £11,698,875 | ||
Power Plant.—Particulars relating to the power plant in use during the year ended 31st March, 1948, are sot out hereunder.
| Source of Power. | Main Plant. | Standby Plant. | Totals. | |||
|---|---|---|---|---|---|---|
| No. | B.H.P. | No. | B.H.P. | No. | B.H.P. | |
| Steam-engines | 22 | 93,282 | 22 | 93,282 | ||
| Water-turbines | 79 | 753,909 | 32 | 13,362 | 111 | 767,271 |
| Gas-engines | 4 | 1,475 | 4 | 1,475 | ||
| Oil-engines | 8 | 666 | 38 | 26,260 | 46 | 26,926 |
Current.—The following table sets out the number of units generated and their disposal, the second and third columns comprising energy sold in bulk by one authority (in most cases the State Hydro-electric Department) and purchased by another (e.g., an Electric-power Board). The excess of bulk purchases over bulk sales represents the surplus generation of certain freezing-works, collieries, &c., which is bought in by supply authorites, usually through the State Hydro-electric Department. This supply, generated by other than public supply authorities, finds no place in either of the first two columns of the table.
| Year ended 31st March, | Units kWh. | |||||
|---|---|---|---|---|---|---|
| Generated. | Sold in Bulk. | Purchased in Bulk. | Net Totals. | Sold (Retail). | Lost in Transmission, &c.* | |
* Includes energy supplied free of charge amounting to 24,171 thousand kWh. in 1947–48. | ||||||
| Thousand | ||||||
| 1944 | 2,170,194 | 1,884,279 | 1,886,093 | 2,172,008 | 1,737,616 | 434,392 |
| 1945 | 2,273,839 | 1,934,104 | 1,935,144 | 2,274,879 | 1,803,402 | 471,477 |
| 1946 | 2,364,960 | 2,058,323 | 2,060,288 | 2,366,925 | 1,891,227 | 475,698 |
| 1947 | 2,520,626 | 2,233,685 | 2,241,220 | 2,528,170 | 1,997,873 | 530,297 |
| 1948 | 2,589,620 | 2,284,105 | 2,293,867 | 2,599,382 | 2,035,711 | 563,671 |
Analysis of Units retailed.—Following is a classification of units retailed according to the various purposes for which the energy was sold. In this table “Domestic” includes domestic water-heating units, and “Commercial” both commercial and dairy water-heating units.
| Year ended 31st March, | Units sold kWh. | |||||||
|---|---|---|---|---|---|---|---|---|
| Domestic. | Commercial. | Electric Motors. | Street Lighting. | Tramways. | Electric Railways. | Other Purposes. | Total. | |
| Thousand | ||||||||
| 1944 | 900,210 | 317,489 | 427,286 | 11,871 | 55,619 | 15,792 | 9,349 | 1,737,616 |
| 1945 | 941,740 | 325,489 | 445,482 | 12,188 | 56,330 | 14,249 | 7,924 | 1,803,402 |
| 1946 | 1,024,548 | 297,849 | 476,706 | 13,073 | 56,492 | 14,574 | 7,985 | 1,891,227 |
| 1947 | 1,122,401 | 315,787 | 471,506 | 11,932 | 51,953 | 16,443 | 7,851 | 1,997,873 |
| 1948 | 1,140,878 | 303,609 | 508,217 | 11,164 | 49,425 | 15,996 | 6,422 | 2,035,711 |
The expansion in the use of electric power since 1929–30 is strikingly portrayed in the following diagram, which shows also the principal purposes for which the energy was sold.
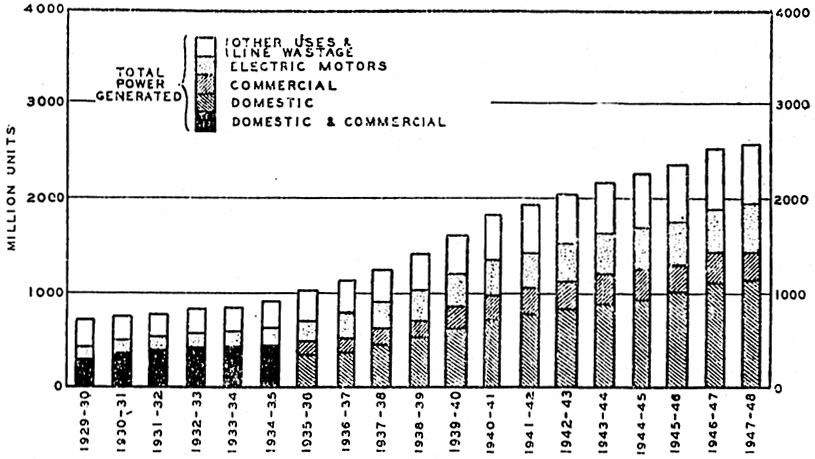
Revenue.—Revenue is derived chiefly from the sale of energy, and in 1947–48 this source was responsible for over 97 per cent. of the total. The amount of revenue derived from rates showed a steady decrease until 1947–48, when a substantial increase was recorded. The amount, however, represented less than one-twentieth of 1 per cent. of the total. The following table sets out the revenue of all stations.
| Year ended 31st March, | Sale of Energy (Retail). | Profits, Sale of Apparatus. | Miscellaneous. | Interest. | Rates. | Totals.* |
|---|---|---|---|---|---|---|
* Excluding revenue from interchange of power. | ||||||
| £ | £ | £ | £ | £ | £ | |
| 1945 | 6,307,304 | 37,857 | 106,212 | 21,604 | 2,572 | 6,475,549 |
| 1946 | 6,504,379 | 44,309 | 118,770 | 22,021 | 2,281 | 6,691,760 |
| 1947 | 6,816,253 | 60,303 | 86,707 | 16,560 | 2,201 | 6,982,524 |
| 1948 | 7,031,505 | 68,301 | 89,565 | 11,224 | 3,361 | 7,203,956 |
Expenditure.—Of the total expenditure, excluding cost of interchange of power in bulk, recorded in the year ended 31st March, 1948, (£6,396,068), 65.6 per cent. represented overhead costs (comprising management expenses and capital charges), while operating-expenses or prime costs stood at 344 per cent.
Energy may be sold more than once in bulk before reaching the retailing authority, and in these tables the revenue from such interchange of power between authorities is sot off against the cost, the net figure for cost of power purchased representing the cost to the industry of purchases from outside sources. In this connection mention may he made of certain contracts existing between the Government and some local authorities, whereby the latter are required to maintain their standby plants and to operate them, whenever called upon, to supplement the State hydro-electric supply. The units so generated, often by fuel plants, are purchased by the Government and resold, in most cases to the generating authority, for distribution.
The table following gives an analysis of expenditure.
| Item. | Year Ended 31st March, | |||
|---|---|---|---|---|
| 1945. | 1946. | 1947. | 1918. | |
* Does not include the interchange of power between supply authorities. | ||||
| Operating Expenditure | ||||
| £ | £ | £ | £ | |
| *Cost of power purchased | 11,586 | 23,279 | 41,216 | 64,073 |
| Cost of generation | 187,980 | 201,133 | 219,048 | 225,853 |
| Fuel | 257,995 | 322,754 | 500,145 | 374,643 |
| Stores | 2,772 | 2,155 | 1,728 | 1,903 |
| Repairs | 37,487 | 37,374 | 37,649 | 29,810 |
| Standby plant | 144,837 | 173,613 | 139,608 | 144,014 |
| Cost of transmission | 253,221 | 248,947 | 276,595 | 308,106 |
| Cost of distribution | 733,384 | 892,121 | 976,602 | 1,026,378 |
| Public (street) lighting | 27,334 | 31,240 | 34,069 | 26,542 |
| Totals | 1,656,596 | 1,932,616 | 2,226,660 | 2,201,322 |
| Miscellaneous Expenditure | ||||
| £ | £ | £ | £ | |
| Cost of management | 649,683 | 773,822 | 758,989 | 881,990 |
| Insurance | 31,564 | 32,865 | 38,750 | 43,624 |
| Losses from trading | 3,047 | 2,723 | 4,131 | 5,037 |
| Other expenditure | 24,208 | 30,134 | 52,828 | 60,898 |
| Totals | 708,502 | 839,544 | 854,698 | 991,549 |
| Capital Charges | ||||
| £ | £ | £ | £ | |
| Interest | 1,383,761 | 1,429,984 | 1,453,576 | 1,621,445 |
| Sinking fund | 476,577 | 493,816 | 546,140 | 578,734 |
| Renewals | 83,562 | 78,038 | 112,834 | 124,167 |
| Depreciation | 511,074 | 458,875 | 564,541 | 471,421 |
| Loan repayment | 245,141 | 267,913 | 291,742 | 404,852 |
| Exchange | 44,819 | 47,311 | 35,431 | 2,578 |
| Totals | 2,744,934 | 2,775,937 | 3,004,264 | 3,203,197 |
| Grand totals | 5,110,032 | 5,548,097 | 6,085,622 | 6,396,068 |
The distribution of the expenditure per unit sold retail is given hereunder.
| — | Year Ended 31st March, | |||
|---|---|---|---|---|
| 1945. | 1946. | 1947. | 1948. | |
| d. | d. | d. | d. | |
| Operating-expenses | 0.221 | 0.245 | 0.267 | 0.259 |
| Miscellaneous expenses | 0.094 | 0.106 | 0.103 | 0.117 |
| Capital charges | 0.365 | 0.351 | 0.361 | 0.378 |
| Totals | 0.680 | 0.702 | 0.731 | 0.754 |
Appropriation of Surplus.—The following table shows the appropriations of net surplus for years ended 31st March.
| — | 1945. | 1946. | 1947. | 1948. |
|---|---|---|---|---|
| £ | £ | £ | £ | |
| Renewal Fund | 191,874 | 123,920 | 71,295 | 56,109 |
| Reserve Fund | 139,272 | 92,602 | 41,231 | 41,365 |
| Taxation | 456,678 | 430,431 | 252,639 | 177,476 |
| Other | 383,811 | 398,583 | 514,056 | 351,355 |
| Total appropriated | 1,171,635 | 1,045,536 | 879,221 | 626,305 |
HYDRO-ELECTRIC POWER IN USE.—The following table shows the hydroelectric horse-power actually developed in the various machinery inspection districts at the 31st March in each of the last five years. The figures cover all hydro-plants exceeding one horse-power, whether main or standby, with the exception of plants not exceeding six horse-power used exclusively for farming purposes.
| District. | 1944. | 1945. | 1946. | 1947. | 1948. |
|---|---|---|---|---|---|
| H.P. | H.P. | H.P. | H.P. | H.P. | |
| Auckland North | 4,074 | 4,074 | 4,074 | 4,074 | 4,071 |
| Auckland | |||||
| Auckland South | 181,950 | 181,950 | 206,950 | 236,950 | 305,750 |
| Gisborne | 140,028 | 140,028 | 140,040 | 140,040 | 140,040 |
| Hawke's Bay | |||||
| Taranaki North | 14,605 | 14,465 | 14,465 | 14,465 | 14,465 |
| Taranaki | 1,485 | 1,485 | 1,592 | 1,592 | 1,592 |
| Wellington North | 32,020 | 32,020 | 32,020 | 32,020 | 32,020 |
| Wellington | 3,035 | 3,035 | 3,035 | 3,035 | 3,035 |
| Marlborough | |||||
| Nelson | 1,375 | 19,375 | 19,375 | 19,375 | 19,375 |
| Westland | 10,100 | 9,100 | 9,250 | 9,250 | 9,270 |
| Canterbury | 59,604 | 59,604 | 95,554 | 95,554 | 95,751 |
| Canterbury South | |||||
| Otago | 121,209 | 121,239 | 121,209 | 121,209 | 128,744 |
| Southland | 11,446 | 11,446 | 11,446 | 11,446 | 11,446 |
| Totals | 580,931 | 597,821 | 659,010 | 689,010 | 765,565 |
The following table gives an analysis of the purposes for which plants were generating power as at the 31st March, 1948.
| District. | Mining. | Electric Supply. | Flax-mills. | Farming. | Freezing-works. | Paper-mills. | Miscellaneous. | Totals. |
|---|---|---|---|---|---|---|---|---|
| H.P. | H.P. | H.P. | H.P. | H.P. | H.P. | H.P. | H.P. | |
| Auckland North | 4,070 | 4 | 4,074 | |||||
| Auckland | ||||||||
| Auckland South | 305,750 | 305,750 | ||||||
| Gisborne | 140,000 | 40 | 140,040 | |||||
| Hawke's Bay | ||||||||
| Taranaki North | 14,460 | 5 | 14,465 | |||||
| Taranaki | 1,592 | 1,592 | ||||||
| Wellington North | 32,020 | 32,020 | ||||||
| Wellington | 3,035 | 3,035 | ||||||
| Marlborough | ||||||||
| Nelson | 19,375 | 19,375 | ||||||
| Westland | 170 | 8,800 | 300 | 9,270 | ||||
| Canterbury | 95,745 | 9 | 95,754 | |||||
| Canterbury South | ||||||||
| Otago | 128,345 | 183 | 216 | 128,744 | ||||
| Southland | 9,686 | 8 | 750 | 1,000 | 2 | 11,446 | ||
| Totals | 170 | 762,878 | 8 | 236 | 750 | 1,000 | 523 | 765,565 |
The figures shown in the above table do not, of course, indicate the ultimate consumption of hydro-electric power in the industries specified, since by far the greatest proportion of the total horse-power used in industry would be drawn from the electric-supply stations and not generated in separate plants.
THE Rehabilitation Act, 1941, and its amendments make provision for the re-establishment in civil life of discharged servicemen and for the reconstitution of wartime industries on a peacetime basis. The Rehabilitation Department, controlled by the Minister of Rehabilitation, has been set up under the authority of the Act, which also provides for the constitution of a Rehabilitation Hoard and a National Rehabilitation Council. The principal function of the Council is to make recommendations to the Minister (after investigation) in relation to the re-establishment of discharged servicemen in civil life. Particular matters mentioned in the Act in this regard include the following:—
The reinstatement of discharged servicemen in civil employment or occupation:
The necessary training required to qualify them for entry into civil employment and the granting of financial assistance during such training:
The making of special arrangements concerning the passing of examinations, the completion of apprenticeships, or the obtaining of practical experience, &c.:
The granting of financial assistance to discharged servicemen and to service men's widows to enable them to acquire homes and furniture, or to acquire land, stock, implements, tools of trade, &c., to commence any employment or occupation.
The Council consists of the Minister of Rehabilitation as Chairman, the members of the Board, and such other persons as the Governor-General may from time to time appoint. At 31st March, 1948, the total number of members was twenty-five. The Board consists of the Minister as Chairman, the Director of Rehabilitation, the Secretary to the Treasury, one of the Joint Managing Directors of the State Advances Corporation, the Under-Secretary for Lands, the Under-Secretary of Maori Affairs, the Commissioner of Works, and five other persons appointed by the Governor-General. The general functions of the Board are to organize the establishment in civil life of discharged servicemen or servicemen's widows, and to co-ordinate and use the services available in Departments of State and elsewhere for the carrying-out of its functions. The Board also determines the nature and extent of the assistance that may be granted to any class or classes of servicemen, and approves the granting of such assistance.
The Board has the assistance of District Rehabilitation Committees, which keep in touch with discharged servicemen and act in an advisory capacity concerning rehabilitation matters in their respective districts. These Committees investigate and make recommendations in regard to applications for financial assistance or loans, report on the suitability of the applicant for the trade or business for which the assistance is required, and other relevant matters. The Committees also have limited powers in regard to making grants of small sums for immediate assistance, and allocate State rental houses to discharged servicemen, 50 per cent. of all houses becoming available under the Government's housing scheme being allotted for this purpose. The number of Committees operating at 31st March, 1948, was 112.
Other legislative measures designed for the purpose of rehabilitating discharged service men are the Servicemen's Settlement and Land Sales Act, 1943, which provides machinery for the compulsory acquisition of land for the settlement of servicemen, and the Small Farms Amendment Act, 1940, which provides that applications of discharged servicemen shall have preference over the applications of all other classes of persons for any land made available for selection under the Small Farms Act, 1932–33. The Land Laws Amendment Act, 1944, contains a similar provision in respect of ballots for land under the Land Act, 1924, and also provides that a lease or licence of any land administered by a Land Board may be granted without competition to a discharged serviceman. These matters are referred to in more detail in the section of this Year-Book dealing with land tenure and settlement.
TRADE TRAINING.—The “A” Class training scheme provides in a number of the building trades full-time intensive theoretical and practical indoor classes, followed by full-time advanced practical work under the supervision of the Board's Instructors. At 31st March, 1948, full-time training units were in operation at twenty-one centres. Full-unit carpentry schools were in operation at Wellington (2), Auckland (3), Gisborne, Hamilton, Christchurch, and Dunedin, and half-units at Kaikohe, Whangarei, Thames, Masterton, Oamaru, Rotorua, Napier, Hastings, Palmerston North, New Plymouth, Wanganui, Nelson, Westport, Timaru, and Invercargill. A full centre provides for the training of twenty-six trainees, and a half-unit fourteen trainees, per class, with three classes per year intake at each centre. Painting, bricklaying, and plastering were also being taught at Auckland, Wellington, Christchurch, and Dunedin. Painting centres are also established at Hamilton and Palmerston North. Classes in these courses vary as to complement between twelve and eighteen men. Auckland and Christchurch each have two painting centres in operation.
The over-all number of ox-servicemen under “A” Class training increased from 542 in March, 1945, to 2,998 in March, 1948. The number of men who had completed training had risen from 616 to 2,450.
During their period of advanced practical training, trainees are engaged on the construction of houses under the Government's housing scheme, and from a modest beginning in 1942 the output has increased to the extent that the Rehabilitation Department is now one of the biggest contractors for State houses.
In the earlier stages of the “A” Class training scheme, provision was also made for the training of ex-servicemen in general engineering, welding, and the footwear-manufacturing industry.
The following table contains a summary of the results of the “A” Class training scheme up to 31st March, 1948.
| Class. | Ex Overseas. | Ex Home Service. | Total Training at 31st March, 1948. | Total Completed Training | ||
|---|---|---|---|---|---|---|
| Training at 31st March, 1948. | Completed Training | Training at 31st March, 1948. | Completed Training. | |||
| Carpentry | 2,093 | 1,364 | 266 | 277 | 2,359 | 1,641 |
| Plastering | 132 | 70 | 19 | 1 | 151 | 71 |
| Bricklaying | 186 | 64 | 16 | 4 | 202 | 68 |
| Painting and paper-hanging | 225 | 323 | 39 | 31 | 264 | 354 |
| Joinery | 18 | 6 | 4 | 22 | 6 | |
| Roof-tiling | 26 | 4 | 30 | |||
| Engineering | 69 | 38 | 107 | |||
| Welding | 91 | 37 | 128 | |||
| Footwear | 24 | 21 | 45 | |||
| Totals | 2,654 | 2,037 | 344 | 413 | 2,998 | 2,450 |
The “B” Class scheme of training provides for contracts between employers and trainees and the Board for engagement and training over suitable periods. The wages are subsidized by the Board at a gradually decreasing amount as the training progresses and the trainee's skill and production value increases. Where “A” Class training centre facilities in the trade concerned exist, single men are required to undertake training at such centres, and “B” Class training is confined, in such trades, to married men who would suffer inconvenience by being required to leave home to undertake “A” Class training.
Certain trades such as boot-repairing, watchmaking, jeweller-manufacturing, &c., are peculiarly suited to the needs of disabled men, and, so far as is reasonably possible, training in such vocations is reserved for ex-servicemen suffering from major disabilities.
Consequent upon the gazetting of the Rehabilitation (Plumbers) Regulations 1945, the Plumbers Board of New Zealand has discretionary powers to permit an ex-serviceman to sit the registration examination after haying been engaged for not less than three years either as an apprentice or as a rehabilitation trade trainee, provided not less than six months of this period has been undertaken after completion of military service, and to grant registration to an ex-serviceman who has passed the examination and who has been engaged for not less than four years as an apprentice or a trade trainee. This means that the period of training for an ex-serviceman without previous experience has been reduced from six to four years, and the Rehabilitation Board subsidizes wages in the plumbing trade on this basis.
Arrangements similar to those in regard to trade training have been made for the training of ex-servicemen with a suitable educational background as clerical workers and in a number of the professions such as law, accountancy, surveying, architecture, and journalism.
The following table summarizes the results of the “B” Class training scheme up to 31st March, 1948.
| — | Under Training. | Completed Training. | Total. |
|---|---|---|---|
| Carpentry trade | 161 | 69 | 230 |
| Joinery | 65 | 12 | 77 |
| Bricklaying | 16 | 9 | 25 |
| Other building trades | 206 | 39 | 245 |
| Clerical and professional | 317 | 101 | 418 |
| Engineering and metal trades | 397 | 156 | 553 |
| Electrical trades | 115 | 83 | 198 |
| Foodstuffs | 76 | 33 | 109 |
| Footwear and leather trades | 64 | 110 | 174 |
| Furniture trades | 247 | 120 | 367 |
| Motor trades | 345 | 96 | 441 |
| Other mechanical trades | 27 | 18 | 45 |
| Painting and paperhanging | 75 | 88 | 163 |
| Plastering | 45 | 18 | 63 |
| Printing trades | 63 | 29 | 92 |
| Retail trades | 123 | 216 | 339 |
| Roof-tiling | 3 | 2 | 5 |
| Textile and clothing trades | 110 | 53 | 163 |
| Miscellaneous trades | 82 | 63 | 145 |
| Totals | 2,537 | 1,315 | 3,852 |
The “C” Class training scheme caters for the resumption of apprenticeships interrupted by war service. The Suspension of Apprenticeship Emergency Regulations 1944 provide that an apprentice on reviving his contract shall receive at least the apprenticeship rate of wages that he would then be receiving had his employment been continuous. If the expiry date of the contract (calculated on the basis of an apprenticeship term of not more than five years) has passed, the employer is called upon to pay the apprentice the final contract rate, and similar payment must he made if the apprentice has reached the age of twenty-one years and has at least twelve months' home service or has rendered military service overseas. Where a contract is revived after the original expiry date (five-year basis) has passed, or where the contract expires after revival, the wage payable is appreciably less than the journeyman's rate which would have been payable had the full contract term been served. As this is an obvious financial hardship arising directly from military service, the Board makes available a subsidy over and above the amount which the regulations require the employer to pay, in order to bring the apprentice's wage up to the journeyman rate. Generally, in the case of twenty-one-year-old apprentices the expiry date of whose contract has not been reached, the Rehabilitation Board makes available a limited subsidy, provided they have had any overseas service. This limited subsidy will normally continue until the apprentice becomes eligible for the full subsidy at the expiry date of the contract. At 31st March, 1948, 1,367 ex-servicemen were undergoing training under this scheme, 1,988 had completed their training, and 311 had discontinued training for various reasons.
Disabled Servicemen.—The Disabled Servicemen's Re-establishment League acts as the agent of the Rehabilitation Board in the training of disabled ex-servicemen. Whilst many men who have been disabled as a result of war service have, as a result of medical treatment, been able to return to their pre-service occupations, there are many others who have been obliged to seek a complete change of occupation, and it is largely for this class that the League caters. Vocational training centres are established in several towns and workshops, and retail shops for the disposal of the products are operated in connection therewith. The number of men undergoing training with the League at 31st March, 1948, was 206, while up to that date 332 had been absorbed into industry after completing their training.
The Blinded Servicemen's Trust Board acts as agent for the Rehabilitation Board in the training and care of those ex-servicemen of the 1939–45 war who lost their sight or suffered serious visual disablement.
FARM TRAINING AND SETTLEMENT.—Applications for assistance for the purpose of settling on the land are referred in the first place to the local Rehabilitation Committee, which considers whether the applicant is eligible for assistance of this nature. If the Committee decides that the applicant has a claim for assistance, he is referred to an appropriate Farming Sub-committee, thirty-three of which are now operating throughout New Zealand. These Sub-committees then grade the applicants into the following classes:—
“A” : Fully experienced and qualified for immediate settlement:
“B”: Partly experienced, but in need of further training before settlement would be prudent:
“C”: Inexperienced, but suitable for training with a view to ultimate settlement:
“D”: Not suitable, for one or more reasons, for settlement:
Men graded “A” require no further training and are eligible for immediate assistance, but “B” and “C” Grade men must undergo prescribed training before they are regraded to “A.” Training measures include—
Subsidized training with approved private farmer employers:
Training on blocks being developed by the Lands and Survey Department:
Training on Rehabilitation Board training-farms:
Training at agricultural colleges:
Training for disabled ex-servicemen at the special training-farm established near Palmerston North by the Disabled Servicemen's Re-establishment League.
The Farming Sub-committee is required to nominate the term of training and subsidy rate appropriate to the farming experience, if any, of the trainee.
The training of applicants on blocks of land administered by the Lands and Survey Department is an alternative to training with private farmers, and the conditions of employment are the same, the Lands and Survey Department being regarded for this purpose as the employer.
Trainees placed on one or other of the two training-farms (Homewood, at To Puke; and Wairarapa, near Masterton) administered on behalf of the Board are employed for as long as may be necessary on the indicated class of work, and are paid in full by the Board.
Full-time tuition is provided for student-trainees placed at Canterbury and Massey Agricultural Colleges. The majority of the men selected for these courses have had a background of practical experience, and short courses at the colleges serve a very useful purpose in giving the men an insight into the most up-to-date farming methods.
Full-time training on a special farm is provided for physically disabled ex-servicemen who have a rural background and in respect of whom there are prospects of ultimate successful settlement as farmers, although possibly in a different class of farming from that previously followed. The administration of the farm is in the hands of the Disabled Servicemen's Re-establishment League, while the wages paid to trainees are subsidized by the Board.
The following table shows the results under the farm-training scheme up to 31st March, 1948.
| Class of Training. | Applications Approved. | Failed to Complete Training. | Under Training. | Completed Training. | ||||
|---|---|---|---|---|---|---|---|---|
| Ex Overseas. | Ex Home Service. | Ex Overseas. | Ex Home Service. | Ex Overseas. | Ex Home Service. | Ex Overseas. | Ex Home Service. | |
| Dairy | 2,112 | 7 | 447 | 1 | 371 | 851 | 2 | |
| Sheep | 1,007 | 8 | 172 | 243 | 5 | 432 | 1 | |
| Mixed (sheep and dairy) | 426 | 2 | 88 | 74 | 195 | |||
| Sheep and agriculture | 607 | 1 | 113 | 137 | 1 | 272 | ||
| Pigs | 12 | 8 | 1 | 1 | ||||
| Poultry | 87 | 3 | 36 | 1 | 8 | 32 | 1 | |
| Bees | 44 | 8 | 12 | 17 | ||||
| Fruit, horticulture, agriculture, hops, tobacco, &c. | 529 | 28 | 113 | 3 | 129 | 6 | 226 | 12 |
| Totals | 4,824 | 49 | 985 | 5 | 975 | 12 | 2,026 | 16 |
Of the 987 men shown as under training, 847 were employed with private farmers under subsidy, 100 were receiving training at agricultural colleges, and 40 were at rehabilitation training-farms.
At 31st March, 1948, a total of 5,148 men had been settled on the land with rehabilitation assistance, while a further 5,583 who had been declared eligible for assistance and who had been graded “A” were awaiting settlement.
To 31st March, 1948, 451,391 acres had been purchased by voluntary negotiation for subdivision and settlement of ex-servicemen, 75,231 acres had been acquired compulsorily under Part II of the Servicemen's Settlement and Land Sales Act, 1943, and a further 114,166 acres had been taken under section 51 of the Act. The total area purchased specifically for ex-servicemen was therefore 640,788 acres. In addition, 74,610 acres of Crown land had been sot aside for ex-servicemen settlement. At 31st March, 1948, 304,478 acres, providing 939 units, had been allotted either on permanent tenure or on wages with the promise of a title, while a further 366,055 acres, estimated to provide 807 units, was being prepared for settlement. These figures do not include cases of ex-servicemen (4,209) who have been assisted by way of rehabilitation loans to purchase established farms on their own account. Particulars of financial assistance will be found under a later beading.
Education.—Educational facilities are provided by the Rehabilitation Hoard for ex-servicemen in the way of bursaries, payment of fees, provision of text-books, &c.
Full-time bursaries for study at New Zealand University colleges and some private institutions and colleges include all tuition and examination fees, together with a book allowance limited to £5 per annum. Subsistence allowances for the academic period are also granted at the rate of £5 15s. per week for married men and £3 8s. per week for single bursars. For some courses at the agricultural colleges, students are required to live at the colleges. In such cases their board and lodging are paid, and, in addition, allowances of £4 5s. and £2 per week are paid to married and single men respectively towards their living-expenses.
Assistance for part-time study at University colleges, State institutions, and private institutions is also given, and consists of tuition and examination fees, plus an allowance for books.
It should be noted that these forms of assistance are granted in relation to career training only and not for purely cultural studies. In deciding the type of bursary and the period for which, assistance will be granted, factors such as interruption to study through service, length and type of service in the Armed Forces, relation to pre-service career, and prospects upon qualification and suitability for the particular course of study are all taken into account.
To meet the needs of men who, after a long break on service, experience difficulty in settling down to their studios, the Rehabilitation Board has provided the University colleges with the necessary finance to conduct special extra tutorial classes for ex-servicemen.
In certain cases bursaries are granted to enable an ex-serviceman to pursue a course of studies overseas. These are only granted to men with long service and a serious interruption to study or career, or for courses of study which are not available in New Zealand. A full overseas bursary usually includes subsistence allowance at the rate of £328 per annum sterling for married bursars and £250 per annum for single bursars, payable from the time of arrival in the United Kingdom until the earliest date a bursar can obtain a return passage to New Zealand after the completion of his course. Tuition and examination fees, refund for text-books purchased up to £5 per academic year, tourist-class passages from and to New Zealand, voyage allowances at the rate of 16s. 5d. per day for married men and 5s. 3d. per day for single men, and reasonable travelling-expenses in New Zealand and the United Kingdom (from home address in New Zealand to port of embarkation and port of disembarkation to place of study, with similar assistance on the return journey) are also payable.
Although renewals of educational facilities granted in previous years now form the greater part of educational assistance, some 399 bursaries were granted during the year ended 31st March, 1948, for full-time study in New Zealand, and 95 ex-servicemen were granted assistance for study overseas. However, it is by part-time study at University colleges and other educational institutions that the great majority of ex-servicemen desire to improve their trade and professional qualifications, and 3,061 new applications were approved during the year for this class of assistance. During 1947–48, 984 full-time and 4,996 part-time bursaries were renewed, and 98 miscellaneous small grants, such as travelling-expenses, adjustments to examination fees, &c., were made.
Particulars of educational facilities granted to 31st March, 1948, are contained in the following table.
| Facilities. | Ex Overseas. | Ex Home Service. | Total. |
|---|---|---|---|
| Full-time assistance— | |||
| (a) In Now Zealand | 2,898 | 173 | 3,071 |
| (b) Overseas | 608 | 3 | 611 |
| Part-time assistance | 10,763 | 2,045 | 12,808 |
| Renewals— | |||
| (a) Full-time | 2,346 | 122 | 2,468 |
| (b) Part-time | 10,392 | 1,614 | 12,006 |
| Miscellaneous facilities | 2,466 | 330 | 2,796 |
| Totals | 29,473 | 4,287 | 33,760 |
Children of Deceased or Totally Disabled Servicemen.—In conjunction with the Education Department, the Rehabilitation Board is also concerned with the education of the children of deceased ex-servicemen where death has been the direct result of war injuries and of the children of ex-servicemen who through war disability are totally incapacitated for work. The responsibility for the education of these children through the primary- and secondary-school stages is undertaken by the Education Department. A bursary up to £25 per annum is available to eligible children attending post-primary schools. Assistance for post-secondary education and career training may be granted by the Rehabilitation Board, the assistance taking the form of tuition and examination fees and a contribution towards the cost of books. Where full-time study is approved, a subsistence allowance is payable, varying from £2 10s. per week to £3 8s. per week at the age of twenty-one years. So that duo encouragement is given to any children wishing to train for a worth-while trade or career the Board will, where necessary, consider a payment to bring their wages up to £3 8s. net per week where required to live away from home or £2 15s. per week when living at home.
FINANCIAL.—The following is a summary of loan limits and interest-rates applicable to the various types of loan granted by the Rehabilitation Board.
| — | Maximum Amount. | Rate of Interest. |
|---|---|---|
| £ | Per Cent. | |
| (a) Tools of trade | 50 | Free |
| (b) Furniture | 100 | Free |
| (c) Business | 500 | 4 |
| (d) Farms— | ||
| Going concerns— | ||
| Dairy | 5,000 | 3 |
| Sheep | 6,250 | 3 |
| Stock only | 1,500 | 4 |
| (e) House | 1,500 | 3 |
In the case of business, farm, and house loans the interest-rate for the first year is reduced to 2 per cent. per annum. In certain circumstances application for business loans in excess of £500 will be considered, particularly when the venture is regarded as of national value and the finance required cannot be economically arranged on a partnership basis. Supplementary interest-free loans, which are repayable only in the event of sale of the security, are available in appropriate cases where in the acquisition of a farm or house property the price approved by the Land Sales Court exceeds normal lending values as determined by the Rehabilitation Loans Committee.
Special grants may be authorized in cases of hardship, and rehabilitation allowances may also be made.
Particulars of the various classes of loans authorized during the year ended 31st March, 1948, and the totals to that date are as follows:—
| Class of Loan. | Year Ended 31st March, 1948. | Totals to 31st March, 1948. | ||
|---|---|---|---|---|
| Number. | Amount. | Number. | Amount. | |
| £ | £ | |||
| Purchase of farms, &c. | 1,107 | 5,197,269 | 4,716 | 19,237,489 |
| Housing loans | 6,535 | 6,705,060 | 20,194 | 23,752,605 |
| Tools of trade | 187 | 5,401 | 1,188 | 38,806 |
| Furniture | 7,954 | 729,038 | 28,429 | 2,613,360 |
| Businesses | 1,344 | 996,878 | 5,940 | 3,650,719 |
| Miscellaneous | 56 | 15,647 | 312 | 67,980 |
| Totals | 16,183 | 13,649,313 | 60,779 | 49,360,959 |
The next table shows the expenditure of the Rehabilitation Department and loans authorized on rehabilitation for the year ended 31st March, 1948, and the total amount to 31st March, 1948.
| Item. | Year Ended Totals to 1948. | Totals to 31st March, 1948. |
|---|---|---|
| £ | £ | |
| Administration expenses | 373,330 | 1,334,603 |
| Educational facilities, including books, tuition fees, and subsistence allowances | 416,024 | 950,296 |
| Farm training, including fees and subsistence allowances at approved agricultural colleges and training-farms and subsidies to approved employers | 127,546 | 370,173 |
| Training of blind ex-servicemen | 16,176 | 51,047 |
| Grants to Disabled Servicemen's Re-establishment League | 47,822 | 131,798 |
| Land and building vocational training centres | 45,614 | 214,235 |
| Plant, machinery, and equipment | 2,365 | 7,207 |
| Purchase of artificial-limb factory | 19,016 | 27,141 |
| Special grants to ex-servicemen | 3,261 | 30,035 |
| Special grants to Returned Services' Association | 4,470 | 28,261 |
| Therapeutic employment for ex-servicemen | 1,565 | 25,092 |
| Trade training— | ||
| Centres operated by Rehabilitation Department (includes establishment and operational charges, trainees' wages, separation allowances and travelling-expenses, tools, plant, and equipment) | 1,165,137 | 2,669,756 |
| Private firms and Disabled Servicemen's Re-establishment League (includes subsidies to employers and separation allowances) | 382,445 | 1,024,827 |
| Travelling-expenses of ox-servicemen, including fares, furniture removals, and loss of earnings | 4,718 | 38,830 |
| Advertising and publicity | 3,873 | 13,929 |
| Motor-vehicles, purchase of | 6,636 | 10,251 |
| Plans and specifications | 115 | 3,729 |
| Tool-store (cost of tools for resale to ex-servicemen tradesmen) | 80,379 | 99,225 |
| Small Farms Act leases | 33,884 | 55,327 |
| Losses on rehabilitation loans | 2,025 | 2,861 |
| Rehabilitation allowances | 192 | 431,810 |
| Loans (farms, businesses, housing, tools of trade, furniture, &c.) | 13,649,313 | 49,360,959 |
| Purchases of lands for settlement, development, and other expenses in connection therewith (less £2,522,525 taken over under heading of “Loans”) | 2,700,630 | 8,426,725 |
| Miscellaneous | 346 | 4,541 |
| Totals | 19,086,882 | 65,312,658 |
Housing.—Owing to the prevailing housing shortage, the housing of ex-servicemen has been one of the Rehabilitation Board's main problems. Assistance in this connection consists of a certain priority in the allocation of State rental houses, and provision of finance for the erection of now, and the purchase of existing, dwellings.
During the year ended 31st March, 1948, 1,603 State rental houses and flats were allocated to ex-servicemen, making a total allocation to that date of 8,242. At the same time, 14,137 applications from ex-servicemen were still pending.
The number of loan authorizations during 1947–48 for the erection of new homes was 2,629, making a total of 8,321 to 31st March, 1948.
Loans for the purchase of existing dwellings were authorized in 2,906 cases during the year, while the total to date was 11,873.
As stated under the preceding heading, interest-free supplementary loans may be granted to bridge the gap between present-day costs and normal values. These loans are not repayable so long as the ex-serviceman or his dependants continue in occupation of the property. The number of such loans granted to 31st March, 1948, was 11,536, involving a total amount of £1,728,587.
DEMOBILIZATION.—Demobilizations as recorded by the Rehabilitation Department are shown in the following table:—
| Year Ended 31st March. | Demobilization. | |
|---|---|---|
| For Year. | Total to Date. | |
| 1943 | 19,294 | 19,294 |
| 1944 | 23,362 | 42,656 |
| 1945 | 26,019 | 68,675 |
| 1946 | 82,725 | 151,400 |
| 1947 | 31,110 | 182,510 |
| 1948 | 19,755 | 202,265 |
MAORI REHABILITATION.—The following table gives particulars of assistance afforded to Maori ex-servicemen up to 31st March, 1948. Maoris are entitled to the same assistance and under the same general conditions as Europeans, although special measures have been introduced to meet their particular needs. At 31st March, 1948, 4,995 Maori ex-servicemen had been demobilized, of whom 3,706 had served overseas.
| Type of Assistance. | Number of Ex-servicemen. | Amount Authorized. |
|---|---|---|
| £ | ||
| Farm-land purchased | 278,405 | |
| Farm loans | 96 | 202,057 |
| Housing loans | 370 | 357,915 |
| Furniture loans | 532 | 49,500 |
| Business loans | 119 | 64,890 |
| Tools-of-trade loans | 57 | 1,979 |
| Miscellaneous.' loans and grants | 37 | 4,118 |
| 1,211 | 958,864 | |
| Educational assistance | 84 | |
| Trade training— | ||
| “A” Class | 489 | |
| “B” Class | 37 | |
| “C” Class | 8 | |
| Other | 68 | |
| 602 | ||
| Farm training | 110 | |
| Total number assisted | 2,007 |
PUBLIC TRUST OFFICE.—In the early years of settlement in New Zealand those who wished to make provision for the administration of their estates on their deaths often experienced difficulty in selecting a suitable person competent and willing to act as trustee. That difficulty was natural in a new country where the colonists were fully occupied with their own affairs, and were unable to give to the property or business of another the close attention that was demanded. Even if an otherwise suitable trustee could be found, his solvency—an essential element in a trustee—might be in doubt, particularly when the value of colonial property fluctuated considerably and the financial position of an individual could quickly change for the worse. Again, changes of residence were frequent, and the trustee appointed might have left the colony or have moved to another part of it just at the time when his presence and services were most required.
In these circumstances the Public Trust Office was established in 1872 (it is now constituted under the Public Trust Office Act, 1908), under the administration of the Public Trustee, who was constituted a corporation sole with perpetual succession and a seal of office. The main purpose of the original Act was to provide a means of overcoming the difficulties that have been mentioned and to make available to the public a trustworthy administration of the estates of deceased persons at a minimum cost, the integrity of the Public Trustee and his officers being guaranteed by the State. That continues to be the chief function of the Office, but since its establishment the range of service has been very considerably extended and the Public Trustee now acts in many diverse capacities—e.g., as administrator in intestate estates; executor and trustee under wills; trustee under marriage and other settlements; trustee of benefit or relief funds; agent or attorney for absentees or persons desiring to be relieved of business worries; Sinking Fund Commissioner for local authorities; administrator of unclaimed lands and property; statutory administrator of the estates of mental patients (other than Maoris) where no committee of the estate has been appointed by the Court; manager (when so appointed by the Court) of the estates of aged and infirm persons unable to administer their own affairs; administrator of compensation-moneys payable in respect of the death of a worker (unless the Court orders otherwise); statutory administrator of the estates of all convicts (other than Maoris); and agent for the investment of the moneys of the National Provident Fund and certain State superannuation finds, together with the supervision of the investments made on behalf of those funds. The wills of persons desiring the Public Trustee to act as their executor are prepared and held in safe custody by him, free of charge.
In accordance with a provision in the Public Trust Office Act and its amendments, the Public Trustee may elect to administer both testate and intestate estates where the gross value is estimated not to exceed £400. This obviates application for a grant of probate or administration and greatly facilitates the administration of these estates, eliminates a good deal of time, and effects an appreciable reduction of costs.
The experiment of establishing the Public Trust Office—one of the earliest examples of a State service—has proved an unqualified success and a striking testimony to the foresight of the Hon. E. C. J. Stevens, who first suggested the appointment of a Public Trustee, and Sir Julius Vogel, who was largely responsible for legislative effect being given to the proposal. Ample evidence of this is to be found in the fact that 19,612 estates and funds of a total value of £59,879,674 were under the Public Trustee's administration at the 31st March, 1948, as compared with the 257 estates, of a total value of £17,500, that were under administration in 1873. The beneficial results achieved have not passed unnoticed outside New Zealand and have led to the establishment of similar offices in England and other parts of the British Commonwealth.
The progress that has been made in the present century is illustrated by the following table.
| Year ended 31st March, | Estates and Funds under Administration. | Wills of Living Persons on Deposit. | |
|---|---|---|---|
| Number. | Value. | ||
| £ | |||
| 1900 | 2,667 | 2,192,594 | 675 |
| 1920 | 14,679 | 20,860,686 | 25,792 |
| 1930 | 18,549 | 53,049,437 | 68,253 |
| 1940 | 19,468 | 62,622,175 | 97,675 |
| 1947 | 20,218 | 66,833,004 | 136,058 |
| 1948 | 19,612 | 59,879,674 | 139,791 |
The decrease in the number of estates under administration is accounted for by the winding-up of numerous estates where, as a result of favourable market conditions, properties which had previously proved unsaleable were realized to advantage.
The decrease in the value of estates and funds under administration as at 31st March, 1948, is solely attributable to the withdrawal of Government securities totalling over £8,000,000 held by the Public Trustee on behalf of the Public Debt Redemption Fund for application in reduction of the public debt.
The following is a classification of the estates and funds that came under administration during the year ended 31st March, 1948, and of all estates and funds under administration at that date.
| — | New Estates and Funds during 1947–48. | Estates and Funds under Administration at 31st Starch, 1948. | ||
|---|---|---|---|---|
| Number. | Value. | Number. | Value. | |
| £ | £ | |||
| Wills estates | 1,895 | 4,275,077 | 8,367 | 22,471,145 |
| Trusts and agencies | 213 | 1,663,361 | 2,476 | 9,081,400 |
| Intestate estates | 551 | 413,662 | 2,240 | 1,339,047 |
| Mental patients' estates | 738 | 974,285 | 3,491 | 4,137,515 |
| Miscellaneous estates and funds | 165 | 1,598,716 | 3,038 | 22,850,567 |
| Totals | 3,562 | 8,925,101 | 19,612 | 59,879,674 |
Capital moneys becoming available for investment either form part of the Common Fund of the Office or, at the option of the testator or settlor, are invested in such securities as he may specify. Interest is allowed on moneys in the Common Fund at the rate fixed from time to time by the Governor-General in Council and is free of all commission and other charges. Both capital and interest are guaranteed by the State, thus affording the complete security that it is the object of the Office to provide. On the other hand, moneys directed to be invested in specified securities do not carry the State guarantee, and, subject to the Public Trustee's ordinary liability as a trustee, any loss resulting from their investment falls upon the estate concerned. Commission is charged on the collection of the interest. Recognizing that the safety of the moneys is thereby assured, the great majority of testators and settlors desire their funds to be placed in the Common Fund.
New investments completed during the year ended 31st March, 1948, excluding short-term deposits, totalled £2,827,416, compared with £2,260,826 for the year ended 31st March, 1947. The investments held by the Office at 31st March, 1948, inclusive of special investments made on behalf of estates and funds, was £34,877,040, representing a net decrease of £7,041,657 for the year. The decline is more than accounted for by the withdrawal, pursuant to the provisions of the New Zealand Loans Amendment Act, 1947, of Government securities totalling over £8,000,000 held by the Public Trustee on behalf of the Public Debt Redemption Fund and applied in reduction of the public debt. The foregoing figures relate exclusively to investments made by the Office and do not include investments which constituted assets of estates when the latter came under the Public Trustee's administration and which are still held as assets of those estates.
During the year ended 31st March, 1948, 6,820 wills were deposited with the Public Trustee, and 3,087 were withdrawn on account of the death of the testator or for other reasons, the net increase for the year being 3,733. The number of wills on deposit at the 31st March, 1928, appointing the Public Trustee executor was 58,065; by the 31st March, 1938, it had increased to 90,474; with a further increase to 139,791 at 31st March, 1948. In addition to preparing the will of the testator in the first instance, the Office prepares any subsequent will or codicil that may be necessary to give effect to alterations desired by him. During the year ended 31st March, 1948, effect was given in 6,233 cases to changes desired by testators.
JOINT-STOCK COMPANIES.—For thirty years following the enactment of the Companies Act of 1903, no comprehensive revision of statute law relating to companies was made in New Zealand, and the essential provisions of company law remained substantially unaltered. In 1930 the Attorney-General appointed an advisory committee, including representatives of the business community and of the professions of law and accountancy, to act with the Law Draftsman in framing a new measure, which, in the form of the Companies Act, 1933, came into force on 1st April, 1934. In groat part the measure is an adaptation of the Imperial Act of 1929 to suit the special conditions of New Zealand.
A noteworthy step in the history of company legislation was taken by the Companies (Bondholders Incorporation) Act, 1934–35, which provided machinery for the incorporation of the holders of bonds issued by certain afforestation and other companies.
The position of certain investment companies in 1934 led to the appointment of a Commission of Inquiry and the passing of a novel series of legislative enactments designed to investigate their affairs and to protect the investors. The Acts passed comprised the Companies (Special Investigations) Act, 1934; the Companies (Special Liquidations) Act, 1934–35; and the Companies (Temporary Receivership) Act, 1935.
A company, to acquire legal entity, must be incorporated, and under the Companies Act, 1933, incorporation is granted after the registration of the memorandum of association with the Registrar of Companies. A company incorporated overseas is not required to re-register in New Zealand, but must deliver to the Registrar of Companies for registration a certified copy of its instrument of constitution, as well as a list of its directors and the name of its authorized representative in New Zealand.
The Finance Emergency Regulations 1940 (No. 2), which replaced similar regulations issued in the same year, prohibited the registration of companies, building societies, &c., or the increase of capital of existing companies without the prior consent of the Minister of Finance. Amending regulations issued on 22nd May, 1946, removed this restriction in so far as it related to the formation of a company where the nominal capital did not exceed £10,000, or to an increase of capital of an existing company where the amount of the increase together with the amounts of other increases made within one year before that increase did not exceed £10,000.
The numbers of companies registered during the earlier war years fell to very low proportions, but commenced to rise again in 1944, when 464 companies were registered. Sharp increases in the numbers of registrations were recorded in 1945 and 1946. The increase in 1947 was, however, proportionately much smaller than in the two previous years. The table following gives a classification of companies registered in 1947 according to the amount of nominal capital.
| Amount of Nominal Capital. | Private Companies. | Public Companies. | Overseas Companies. | |||
|---|---|---|---|---|---|---|
| Number. | Aggregate Nominal Capital. | Number. | Aggregate Nominal Capital. | Number. | Aggregate Nominal Capital. | |
| £ | £ | £ | ||||
| Under £1,000 | 286 | 127,879 | 3 | 650 | ||
| £1,000 and under £2,000 | 455 | 558,126 | ||||
| £2,000 and under £3,000 | 341 | 737,606 | 1 | 2,000 | 1 | 2,000 |
| £3,000 and under £4,000 | 221 | 691,382 | 1 | 3,000 | ||
| £4,000 and under £5,000 | 100 | 414,625 | ||||
| £5,000 and under £6,000 | 118 | 596,801 | 1 | 5,000 | 2 | 10,000 |
| £6,000 and under £7,000 | 59 | 357,767 | 1 | 6,000 | ||
| £7,000 and under £8,000 | 48 | 348,600 | ||||
| £8,000 and under £9,000 | 24 | 194,794 | ||||
| £9,000 and under £10,000 | 17 | 156,300 | ||||
| £10,000 and under £15,000 | 69 | 703,200 | 7 | 70,000 | ||
| £15,000 and under £20,000 | 13 | 209,720 | 1 | 16,000 | 1 | 16,000 |
| £20,000 and under £50,000 | 25 | 656,885 | 1 | 30,000 | ||
| £50,000 and over | 5 | 450,200 | 8 | 3,125,000 | 2 | 400,000 |
| Limited by guarantee | 2 | |||||
| Totals | 1,781 | 6,203,885 | 23 | 3,257,000 | 9 | 428,650 |
There has been a considerable change in the amounts of nominal capitals of private companies registered during the past ten years. Companies with nominal capitals of under £1,000 and also those of £10,000 and over have decreased in relative numbers when comparing the 1947 and 1937 figures. The first-mentioned group shows both a small absolute decline and a very considerable relative decline in numbers. Companies with capitals of £10,000 and over have decreased relatively, although the actual number of such companies was greater in 1947 than in 1937. The following table shows the numbers of companies registered expressed as percentages of the total registrations for the year. These figures refer to private companies only.
| Amount of Nominal Capital. | 1937. | 1947. |
|---|---|---|
| Per Cent. | Per Cent. | |
| Under £1,000 | 36.9 | 16.1 |
| £1,000 and under £5,000 | 46.5 | 62.7 |
| £5,000 and under £10,000 | 9.2 | 14.9 |
| £10,000 and over | 7.4 | 6.3 |
| Totals | 100.0 | 100.0 |
The next table shows the number and aggregate nominal capital of each of the three classes of companies registered during the last six years.
| Year. | Private Companies. | Public Companies. | Overseas Companies. | |||
|---|---|---|---|---|---|---|
| Number. | Aggregate Nominal Capital. | Number. | Aggregate Nominal Capital. | Number. | Aggregate Nominal Capital. | |
| £ | £ | £ | ||||
| 1942 | 190 | 676,897 | 7 | 154,500 | 1 | 130,000 |
| 1943 | 261 | 881,284 | 6 | 48,880 | 3 | 617,200 |
| 1944 | 451 | 1,408,216 | 13 | 82,000 | ||
| 1945 | 720 | 3,196,541 | 18 | 114,000 | 3 | 72,100 |
| 1946 | 1,414 | 8,102,471 | 13 | 2,846,250 | 8 | 116,000 |
| 1947 | 1,781 | 6,203,885 | 23 | 3,257,000 | 9 | 428,650 |
In comparing one year with another, as in the following table, it should not be overlooked that re-registrations on account of reconstruction of companies or for other reasons are included. Such re-registrations may have a considerable effect on the year's total, where large companies are concerned.
| Year. | Number. | Aggregate Nominal Capital. |
|---|---|---|
*Refer letterpress. | ||
| £ | ||
| 1928 | 736 | 10,984,907 |
| 1929 | 903 | 12,472,057 |
| 1930 | 893 | 6,702,675 |
| 1931 | 795 | 8,283,581 |
| 1932 | 812 | 6,865,769 |
| 1933 | 830 | 7,300,999 |
| 1934 | 933 | 200,739,139* |
| 1935 | 810 | 24,238,018 |
| 1936 | 942 | 9,934,903 |
| 1937 | 888 | 6,113,476 |
| 1938 | 824 | 6,575,619 |
| 1939 | 681 | 8,910,167 |
| 1940 | 391 | 3,779,277 |
| 1941 | 288 | 11,245,789 |
| 1942 | 198 | 961,397 |
| 1943 | 270 | 1,547,364 |
| 1944 | 464 | 1,490,216 |
| 1945 | 741 | 3,382,641 |
| 1946 | 1,435 | 11,064,721 |
| 1947 | 1,813 | 9,889,535 |
Overseas companies which filed documents, as required by Part XII of the Companies Act, 1933, are included in the above table. The extraordinarily high figure for 1934 is due to the inclusion of overseas companies (numbering 187 and with an aggregate nominal capital of £193,023,363) which previous to 1934 had established places of business in New Zealand and which were required to deliver documents to the Registrar of Companies before 1st October, 1934.
Companies carrying on Business.—Statistics of companies carrying on business in New Zealand were first compiled for the year 1926, and a further tabulation on the same basis—i.e., classification according to the size of the capital—was made for 1932. For the third compilation, covering all companies functioning at the 31st December, 1938, an additional classification was made according to the type of business. A strictly accurate classification under this heading was not possible, as a company may be empowered by its memorandum of association to carry out a diversity of objects. In such circumstances a company was classified according to what appeared to be its principal activity.
Tables classifying public and private companies (separately) according to the amount of their nominal capital and the type of business in which they were engaged appeared in the 1940 and 1941 numbers of the Year-Book. A further table classifying overseas companies according to type of business also appeared in the 1941 number. A summary of the principal heads of information available in respect of public and private companies at 31st December, 1926, 1932, and 1938, is bore given.
| At 31st December, | Number. | Nominal Capital. | Subscribed Capital. | Paid-up Capital. | Amount owing under Charges. |
|---|---|---|---|---|---|
*Not available. | |||||
| £ | £ | £ | £ | ||
| Public Companies | |||||
| 1926 | 1,630 | 89,544,858 | 58,807,519 | 49,982,593 | 16,181,126 |
| 1932 | 1,732 | 97,553,578 | 71,021,736 | 59,106,902 | 15,453,164 |
| 1938 | 1,626 | 100,172,978 | 73,170,411 | 64,932,446 | 17,477,939 |
| Private Companies | |||||
| 1926 | 3,439 | 36,060,343 | * | * | * |
| 1932 | 6,083 | 48,363,106 | * | * | * |
| 1938 | 7,399 | 55,793,621 | * | 49,270,544 | 20,460,066 |
The apparent decrease in the number of public companies between 1932 and 1938 is probably duo to the fact that the figure for the earlier year included a number of companies in liquidation or otherwise in a more or less moribund state, while the number for 1938 referred only to companies actively functioning. Nevertheless, the effective capital employed by public companies (paid-up capital plus charges owing) shows an increase in 1938 of £7,850,000 over the 1932 amount and of £16,250,000 over the 1926 figure. These increases do not necessarily represent new money invested in industry or other activities, as increases due to the conversion of previously existing organizations into companies are also included.
The number of private companies more than doubled during the period 1926 to 1938, while the nominal capital increased by just under £20,000,000. The effective capital employed by private companies at the end of 1938 was approximately £69,750,000, which, added to that of public companies, gives a total of £152,000,000. This amount, of course, is exclusive of company reserves.
In addition to the public and private companies covered above, there were 212 overseas companies operating in New Zealand at 31st December, 1938. These had a total nominal capital of £195,934,469, but there is no information showing the amount of capital employed in New Zealand, which obviously must be only a very small proportion of the amount shown.
There were, at the end of 1938, 29 companies limited by guarantee, 14 unlimited companies, 27 rural intermediate credit associations, and 5 companies of a miscellaneous character.
CINEMATOGRAPH THEATRES.—The statistics of cinematograph theatres shown hereunder relate only to picture-theatres, and do not purport to show employees, revenue, and expenditure of the motion-picture industry as a whole. In particular, the full revenue and expenditure in connection with screen advertising, and also head-office expenses of controlling companies (including such items as interest on debentures and mortgage charges), unless recovered from exhibitors, are not recorded in the statistics. The item “Rent” under “Theatre Expenditure” does not represent the rental value of all theatres, but only the rent paid where theatres were leased or rented. The collection of statistics relating to cinematograph theatres was inaugurated in 1938–39, and continued annually until 1945–46; there was no collection in 1946–47, but one was again made in 1947–48. The principal data for the last three years available are given below.
| 1944–45. | 1945–46. | 1947–48. | |
|---|---|---|---|
*Adult admission charges (excluding amusements-tax). †Including amusements-tax. ‡I.e., Shop rentals and rents received in respect of cinematograph theatres let for other purposes. § Representing rent paid; not including rental value of freehold premises. ‖ See explanatory letterpress above. | |||
| Theatres (number) | 551 | 568 | 570 |
| Persons engaged— | |||
| Males (number) | 1,543 | 1,543 | 1,491 |
| Females (number) | 1,837 | 1,770 | 1,782 |
| Total (number) | 3,380 | 3,313 | 3,273 |
| Salaries and wages paid— | |||
| To males (£) | 299,767 | 322,132 | 348,128 |
| To females (£) | 193,058 | 208,634 | 217,044 |
| Total (£) | 492,825 | 530,766 | 565,172 |
| Seating-accommodation— | |||
| Seats at under 1s. 6d.* (number) | 68,614 | 64,432 | 53,416 |
| Seats at 1s. 6d.* (number) | 149,338 | 151,926 | 156,177 |
| Seats at 2s.* (number) | 41,652 | 43,179 | 47,249 |
| Seats at over 2s.* (number) | 14,889 | 14,409 | 13,918 |
| Total seats available (number) | 274,493 | 273,946 | 270,760 |
| Paid admissions during year (number) | 35,520,450 | 36,965,771 | 34,078,349 |
| Theatre revenue— | |||
| Admission receipts† (£) | 2,588,111 | 2,817,646 | 2,634,730 |
| Screen advertising (£) | 51,488 | 61,258 | 96,038 |
| Rentals‡ and other receipts (£) | 46,784 | 54,513 | 78,258 |
| Total theatre revenue (£)‖ | 2,686,383 | 2,933,417 | 2,809,026 |
| Theatre expenditure— | |||
| Salaries and wages (£) | 492,825 | 530,766 | 565,172 |
| Film hire (£) | 778,257 | 851,779 | 759,354 |
| Freight (£) | 38,979 | 37,948 | 42,524 |
| Advertising (£) | 149,901 | 159,017 | 176,396 |
| Amusements-tax (£) | 110,241 | 131,199 | 123,034 |
| Rent§ (£) | 285,156 | 324,137 | 315,588 |
| Repairs and maintenance (£) | 66,222 | 89,987 | 155,212 |
| Depreciation (£) | 60,875 | 49,329 | 48,640 |
| Other expenses (£) | 243,852 | 294,337 | 279,451 |
| Total theatre expenditure (£)‖ | 2,226,308 | 2,468,499 | 2,465,371 |
Of the total number of persons engaged in 1947–48, 1,850 were part-time employees, whose salaries and wages amounted to £151,937. After reaching a peak of 38.25 million in 1943–44, paid admissions to cinematograph theatres fell to 35.5 million in 1944–15, recovered to 37 million in 1945–46, but again fell to 34 million in 1947–48. Concomitantly with this last reduction there was a decrease of £182,916, or 6.5 per cent., in admission receipts, partly offset by an increase of £58,525 in screen advertising, rental, and other receipts, giving a net reduction in total theatre revenue of £124,391. A comparison of the expenditure items in the two latest collections shows reductions of £92,425 in film hire and of £32,289 in other items almost balanced by increases totalling £121,586 (of which repairs and maintenance accounted for £65,225 and salaries and wages for £34,406), so that total theatre expenditure fell by only £3,128.
The next table shows a classification of theatres, according to number of screening days per week, and of circuit operators.
| Screening. | Theatres. | Persons engaged. | Salaries and Wages. | Seating-accommodation. | Paid Admissions. | Average Admission Charge.* |
|---|---|---|---|---|---|---|
*Including amusements-tax. | ||||||
| No. | No. | £ | No. of Seats | No. | d. | |
| Six days per week | 199 | 2,379 | 473,461 | 171,020 | 29,073,558 | 19.0 |
| Odd days per week | 210 | 752 | 71,890 | 68,437 | 3,936,222 | 15.7 |
| Circuit | 161 | 142 | 19,821 | 31,303 | 1,068,569 | 16.4 |
| Totals | 570 | 3,273 | 565,172 | 270,760 | 34,078,349 | 18.6 |
A classification of theatre revenue and expenditure on a similar basis is now given.
| Screening. | Theatre Revenue. | Theatre Expenditure.* | |||
|---|---|---|---|---|---|
| Admission Receipts.* | Screen Advertising. | Other. | Total. | ||
*Including amusements-tax. | |||||
| £ | £ | £ | £ | £ | |
| Six clays per week | 2,303,526 | 80,796 | 70,861 | 2,455,183 | 2,138,784 |
| Odd days per week | 258,102 | 11,984 | 6,050 | 276,136 | 254,847 |
| Circuit | 73,102 | 3,258 | 1,347 | 77,707 | 71,740 |
| Totals | 2,634,730 | 96,038 | 78,258 | 2,809,026 | 2,465,371 |
The 35 circuit or itinerant operators in 1947–48 screened in 161 theatres or halls.
PATENTS, DESIGNS, AND TRADE-MARKS.—The total number of applications for the grant of letters patent and for the registration of designs and trademarks during the calendar year 1948 was 4,137, which was 523 less than the previous year. It is evident from the figures since 1946, in which year the record number of 5,142 applications were received, that most of the applications deferred during the war years have now been lodged, and that henceforth only the normal volume of business may be expected.
Patents.—The first patent legislation in New Zealand was enacted on 27th October, 1860, but nearly eighty-eight years were to elapse before a total of 100,000 applications were received in the Patent Office, this number being reached on 19th August, 1948. The number of applications for letters patent in 1948 was 2,469, as compared with 2,753 in 1947 and 3,025 in 1946. Although the figures for the last two years are substantially below the record number of 1946, they are still considerably above those of the pre-war years.
The applications received during 1948 may be broadly classified as follows: mechanical engineering, 737; electronics, 583, chemistry, 360; primary industries, 272; building and construction, 244; and miscellaneous, 273.
In the last four years approximately two-thirds of the applications for letters patent came from overseas. A feature of the 1948 figures in this connection was that New Zealand with 853 applications assumed the lead from Britain (636), followed by United States of America (447), Australia (207), and Netherlands (159), with the remainder (167) distributed among fifteen different countries.
Trade-Marks.—The number of applications in respect of trade-marks during 1948 was 1,439, as compared with 1,670 in 1947 and 1,766 in 1946. Classes 5 (pharmaceutical, veterinary and sanitary substances) and 25 (clothing) again predominated with 190 and 184 applications respectively; and they were followed by Class 3 (soaps, cosmetics, &c.), 138; Class 24 (tissues—piece-goods), 97; Class 1 (chemical products used in industry), 73; Class 30 (groceries), 63; and Class 9 (electrical apparatus), 62.
The countries from which the applications originated were: New Zealand, 510; Great Britain and Northern Ireland, 482; United States of America, 189; Australia, 115; Switzerland, 54; France, 22; Canada, 11; with the remainder (56) distributed between eleven other countries.
Renewal of the registration of 1,401 trade-marks was affected during the year.
Designs.—Application for the registration of designs in 1948 totalled 229, as compared with 237 in 1947 and 351 in 1946. The total number of applications since the inception of design registration in New Zealand is 5,840.
The following table shows the number of applications for patents and for the registration of trade-marks and designs in each of the last eleven years.
| Year. | Patents. | Trademarks. | Designs. |
|---|---|---|---|
| 1938 | 1,960 | 860 | 160 |
| 1939 | 1,821 | 694 | 137 |
| 1940 | 1,277 | 626 | 108 |
| 1941 | 1,214 | 534 | 108 |
| 1942 | 1,104 | 398 | 60 |
| 1943 | 1,384 | 678 | 61 |
| 1944 | 2,045 | 924 | 104 |
| 1945 | 2,651 | 1,320 | 188 |
| 1946 | 3,025 | 1,766 | 351 |
| 1947 | 2,753 | 1,670 | 237 |
| 1948 | 2,469 | 1,439 | 229 |
The total receipts of the Patent Office for 1948 amounted to £24,498, of which patent fees amounted to £17,833; trade-mark fees, £6,367; and design fees, £167. Payments during 1948 amounted to £17,407, leaving a surplus of £7,091.
INSPECTION OF MACHINERY.—The Inspection of Machinery Act is designed to promote the safety of life and limb in the operation of steam boilers, digesters, other steam-pressure vessels, and air-receivers; hydraulic, electric, and other lifts; all types of power-driven cranes and power-driven machinery on land; and machinery used on vessels afloat that are not self-propelled. Nothing in the Act applies to any machinery driven by manual or animal power, or to any machinery the motive power of which does not exceed one horse-power. Machinery which is used exclusively for farming purposes and does not exceed six horse-power is also exempt from annual inspection.
Boilers, pressure-vessels, air-receivers, lifts, and cranes are required to be of approved design and workmanship, and the moving parts of machinery must be adequately guarded.
All boilers and machinery are inspected and certificated once per year and lifts twice per year. It is illegal to work a boiler or other pressure-vessel or any machinery, including a crane or a lift, which does not carry a current certificate of inspection issued by the Marine Department.
Particulars of inspections of boilers and machinery during the years ended 31st March, 1917 and 1948, were as follows:—
| Boiler inspections— | 1946–47. | 1947–48. |
|---|---|---|
| Fired boilers | 4,593 | 4,583 |
| Air-receivers | 4,154 | 4,853 |
| Other unfired pressure vessels | 6,905 | 7,002 |
| Total boilers | 15,652 | 16,438 |
| Machinery inspections— | ||
| Lifts | 3,561 | 3,536 |
| Cranes | 595 | 682 |
| Hoists | 1,999 | 1,985 |
| Machines driven by steam power | 7,234 | 7,622 |
| Machines not driven by steam power | 87,074 | 88,136 |
| Electric-power supply station units | 138 | 137 |
| Tractors | 337 | 297 |
| Total machinery | 100,938 | 102,395 |
| Grand total | 116,590 | 118,833 |
Boiler inspections in 1947–48 included 93 new power boilers, 99 now air-receivers, and 834 new unfired pressure vessels other than air-receivers, while machinery inspections included 24 cranes and 21 lifts inspected for the first time.
The Act provides that where loss of life or serious bodily injury to any person occurs by reason of the explosion of a boiler, or as a result of an accident caused by machinery, the explosion or accident must be reported by the owner, and the cause investigated by an Inspector of Machinery. There were no boiler explosions during the year 1947–48. The number of accidents reported as caused by machinery were 4 fatal and 121 non-fatal, as compared with 7 fatal and 107 non-fatal accidents in 1946–47.
Revenue and expenditure in connection with inspection of machinery for the last seven years available have been as follows:—
| — | 1940–41. | 1941–42. | 1942–43. | 1943–44. | 1944–45. | 1946–47. | 1947–48. |
|---|---|---|---|---|---|---|---|
| Revenue— | £ | £ | £ | £ | £ | £ | £ |
| Inspection fees, &c. | 21,739 | 22,797 | 22,198 | 23,557 | 23,826 | 25,489 | 26,244 |
| Examination fees, &c. | 409 | 596 | 453 | 419 | 449 | 759 | 439 |
| Totals | 22,148 | 23,393 | 22,651 | 23,976 | 24,275 | 26,248 | 26,683 |
| Expenditure | 22,653 | 22,844 | 22,935 | 25,000 | 27,965 | 29,236 | 35,280 |
The Act also provides for the issue of certificates to those who pass the prescribed examinations for land engineers and engine-drivers in charge of boilers and machinery, for winding-engine drivers for mining purposes, for drivers employed on locomotives working on railway-lines not under the control of the Government Railways Department, and for the drivers of traction-engines on roads. Certificates are also issued to electric-tram drivers, as provided by the Tramways Amendment Act, 1910, and cable tram-drivers, certificates in pursuance of section 75 of the Statutes Amendment Act, 1946. The issue of these certificates is controlled by a Board of Examiners set up under the Act, the Chairman being the Chief Inspector of Machinery.
The total number of candidates examined during the year 1947–48 was 621, and of this number 509 were successful.
VALUE OF PRODUCTION.—Complete statistics covering all phases of production are not available; and, in compiling the following statistics, estimates of production have been made in several cases where direct data are not obtainable. Since statistical information as to production in each of the major productive activities is readily available, the items for which estimates must be made are, with the exception of one group of commodities, relatively unimportant. Although the value of products made in the home—e.g., home-made clothing, jams, kitchen-garden products, &c.—must, in the aggregate, account for a considerable annual value, it is impossible to estimate with any reasonable degree of accuracy the value of such production, which is, on this account, omitted from the statistics of the value of production.
It should be noted that production of material commodities only is taken into consideration in these statistics.
The general principle followed in assessing values has been to value products as near as possible to the actual point of production. For example, live-stock is valued at “on the hoof” prices, while values at the factory are used in the case of factory products. In some few eases, however, reliable data as to values at or near the point of production cannot be obtained; and in those cases export valuations or wholesale price quotations have been used in assessing values. Although absolute uniformity of treatment in the basis of valuation as between different commodities has not been possible, the basis of valuation gives comparable aggregate values for the period covered. The statistics thus afford a fairly accurate indication of fluctuations in the value of production from year to year, although the absolute figures for any individual year must be regarded as an approximation only.
Since the basis of valuation is (as far as possible) at the point of production, transport costs are only partly represented in the values shown, while the accretions to the value of commodities caused by the services of retailers and other distributors of finished products are not included in the statistics.
In classifying the value of production into the principal groups care has been taken to avoid duplication, products of one group which constitute the raw material of another group being counted once only. For example, the gross value of agricultural products in 1946–47 is estimated at £36,800,000; but, as the major part of these products was utilized for the purpose of adding value to live-stock, the net value only (£15,600,000) is classified under the heading “Agricultural,” since live-stock and live-stock products are included in either the “Pastoral” or the “Dairying, &c.,” group.
Products have been classified into the groups to which they most logically belong from a production point of view, butter and cheese, for example, being classified under “Dairying, &c.,” and not as factory products. The figure shown under the heading “Factory” is the aggregate value added to materials by the process of manufacture, excluding industries which are already included in other groups (e.g., butter and cheese making, meat-freezing, fish-curing, and saw-milling). The total value of output of factory industries is included in cases where the materials are produced in New Zealand and are not already included as production in some other group.
The estimates of value of production from the year 1900–01 onwards are quoted in the following table and are in terms of New Zealand currency. A global estimate such as this is, from its nature, subject to amendment from time to time as additional data on production become available, and improvements in technique are effected. Minor amendments in the estimates are incorporated in the figures appearing hereunder.
VALUE OF PRODUCTION
| Year. | Agricultural. | Pastoral. | Dairying, Poultry, and Bees. | Total Farming Groups. | Mining. | Fisheries. | Forestry. | Factory. | Building and Miscellaneous. | Totals (All Groups). |
|---|---|---|---|---|---|---|---|---|---|---|
| £(m) | £(m.) | £(m.) | £(m.) | £(m.) | £(m). | £(m.) | £(m.) | £(m). | £(m.) | |
| 1900–01 | 4.1 | 12.2 | 3.7 | 20.0 | 2.9 | 0.1 | 2.0 | 5.4 | 3.5 | 33.9 |
| 1905–06 | 4.3 | 17.2 | 5.3 | 26.8 | 4.2 | 0.1 | 2.6 | 6.8 | 5.3 | 45.8 |
| 1910–11 | 4.0 | 20.4 | 7.4 | 31.8 | 4.6 | 0.2 | 2.8 | 8.1 | 5.9 | 53.4 |
| 1915–16 | 7.6 | 31.1 | 11.5 | 50.2 | 4.8 | 0.3 | 1.9 | 9.7 | 5.4 | 72.3 |
| 1920–21 | 8.8 | 29.4 | 26.2 | 64.4 | 3.1 | 0.4 | 4.6 | 18.6 | 8.4 | 99.5 |
| 1921–22 | 9.5 | 28.3 | 21.8 | 59.6 | 2.9 | 0.5 | 4.5 | 17.2 | 8.7 | 93.4 |
| 1922–23 | 8.1 | 30.8 | 25.2 | 64.1 | 3.0 | 0.4 | 4.5 | 18.0 | 10.3 | 100.3 |
| 1923–24 | 7.1 | 32.7 | 24.6 | 64.4 | 3.2 | 0.5 | 4.7 | 19.2 | 11.9 | 103.9 |
| 1924–25 | 8.1 | 43.3 | 26.2 | 77.6 | 3.1 | 0.5 | 4.8 | 20.8 | 12.7 | 119.5 |
| 1925–26 | 8.4 | 32.0 | 25.2 | 65.6 | 3.2 | 0.6 | 4.7 | 22.3 | 14.0 | 110.4 |
| 1926–27 | 8.8 | 31.8 | 24.7 | 65.3 | 3.5 | 0.5 | 4.0 | 23.0 | 14.8 | 111.1 |
| 1927–28 | 9.6 | 38.5 | 27.2 | 75.3 | 3.6 | 0.5 | 3.5 | 22.8 | 13.9 | 119.6 |
| 1928–29 | 9.9 | 42.4 | 29.3 | 81.6 | 3.6 | 0.5 | 3.4 | 24.0 | 13.1 | 126.2 |
| 1929–30 | 9.1 | 35.6 | 28.4 | 73.1 | 3.7 | 0.6 | 3.6 | 25.6 | 13.9 | 120.5 |
| 1930–31 | 8.8 | 24.4 | 22.2 | 55.4 | 3.6 | 0.5 | 2.9 | 23.3 | 11.5 | 97.2 |
| 1931–32 | 8.0 | 19.2 | 21.9 | 49.1 | 3.4 | 0.4 | 1.7 | 18.6 | 10.1 | 83.3 |
| 1932–33 | 8.9 | 20.3 | 21.2 | 50.4 | 3.4 | 0.4 | 1.7 | 17.7 | 10.1 | 83.7 |
| 1933–34 | 8.7 | 31.7 | 22.5 | 62.9 | 3.5 | 0.4 | 2.0 | 18.6 | 11.0 | 98.4 |
| 1934–35 | 7.9 | 28.0 | 23.0 | 58.9 | 3.8 | 0.4 | 2.6 | 20.7 | 10.3 | 96.7 |
| 1935–36 | 9.2 | 33.8 | 28.8 | 71.8 | 4.0 | 0.4 | 3.0 | 23.2 | 11.4 | 113.8 |
| 1936–37 | 8.8 | 46.3 | 33.3 | 88.4 | 4.0 | 0.5 | 3.6 | 26.7 | 12.7 | 135.9 |
| 1937–38 | 8.6 | 40.1 | 35.1 | 83.8 | 4.2 | 0.6 | 4.1 | 30.0 | 13.1 | 135.8 |
| 1938–39 | 9.2 | 36.7 | 36.0 | 81.9 | 4.4 | 0.6 | 4.0 | 30.5 | 14.7 | 136.1 |
| 1939–40 | 10.1 | 38.0 | 37.9 | 86.0 | 4.9 | 0.6 | 4.4 | 33.5 | 15.4 | 144.8 |
| 1940–41 | 10.1 | 47.8 | 40.8 | 98.7 | 5.1 | 0.6 | 4.5 | 37.1 | 14.4 | 160.4 |
| 1941–42 | 11.2 | 46.5 | 39.6 | 97.3 | 5.4 | 0.6 | 4.5 | 41.2 | 14.8 | 163.8 |
| 1942–43 | 12.6 | 47.8 | 38.2 | 98.6 | 5.3 | 0.6 | 5.0 | 45.2 | 15.5 | 170.2 |
| 1943–44 | 14.0 | 47.2 | 37.7 | 98.9 | 5.7 | 0.7 | 5.3 | 49.4 | 15.9 | 175.9 |
| 1944–45 | 15.4 | 56.1 | 44.9 | 116.4 | 5.8 | 0.7 | 5.4 | 51.1 | 16.4 | 196.7 |
| 1945–46 | 15.1 | 56.4 | 41.3 | 112.8 | 6.0 | 0.9 | 6.1 | 54.7 | 19.6 | 201.0 |
| 1946–47 | 15.6 | 64.9 | 50.9 | 131.4 | 6.4 | 1.0 | 6.6 | 61.7 | 23.8 | 230.9 |
The total value of production reached a record level of £230,900,000 in 1946–47, and recorded an increase of £29,900,000, or 14.9 per cent., as compared with the previous year. Compared with the pre-war year, 1938–39, there has been an increase of £94,800,000, or 69.7 per cent.
The total estimated value of farm production for 1946–47 was £131,400,000, an increase of £18,600,000 or of 16.5 per cent. over the previous year's estimate. In comparison with the year 1938–39 farm production increased in value by £49,500,000, or by 60.4 per cent. The increase in volume of farm production over this period amounted to 9 per cent., so that the main factor contributing to the increase over 1938–39 was higher prices.
All the individual groups showed record levels for value in 1946–47, the group showing the greatest relative increase over the previous year being dairying, &c., mainly on account of the recovery in butterfat production as compared with the 1945–46 season.
The building and miscellaneous group in 1946–47 reflects the increased activity in the building and construction industry in that year, while the factory group shows for both value and volume a continuation of the upward trend which commenced in 1933–34. It should be borne in mind that the amount shown as factory production in the value of production statistics does not include the value of production in the industries processing primary products. Production in such cases is credited to the appropriate primary-production group (dairying, pastoral, forestry, &c).
VOLUME OF PRODUCTION.—The method of computation of the volume series is somewhat involved and is based on figures of physical volume of output where available (as for practically all farm, mining, forestry, and fishery production). For factory industries, quantity figures—either of products or of materials used—have been utilized where available, and in the case of other factory industries a figure closely indicative of volume movements has been arrived at by applying to the cost of materials used an index of wholesale prices of the principal materials used in the industry.
Information as to the number of dwellinghouses erected, classified according to number of rooms, is normally available, and from a consideration of this data, value figures for other classes of building activity have been converted into equivalent dwelling-or room-units. The composite total of actual and equivalent dwelling- or room-units is a sufficiently reliable indicator of actual volume of building production to permit of its incorporation in an index measuring the year-to-year movement in the volume of total production. Similarly, for those physically productive occupations (representing only a small percentage of aggregate production) not included in any of the groups mentioned above, a reasonably close approximation of movement is afforded by a consideration of the numbers of men engaged, with allowance for changes in working-hours and also for the relative productive output of different classes of labour.
The following table gives figures of value, and index numbers of value and volume of production, for the principal headings.
VALUE AND VOLUME OF PRODUCTION
Base of index numbers: 1938–39 (= 100)
| Year. | Farm. | Factory.* | Total (Including Other). | ||||||
|---|---|---|---|---|---|---|---|---|---|
| Value. | Index Number, of Volume. | Value. | Index Number, of Volume. | Value. | Index Number, of Volume. | ||||
| Total. | Index Number | Total. | Index Number | Total. | Index Number | ||||
* Excluding factory Industries Included in other groups. | |||||||||
| £(m.) | £(m.) | £(m.) | |||||||
| 1928–29 | 81.6 | 100 | 79 | 24.0 | 79 | 68 | 126.2 | 93 | 77 |
| 1929–30 | 73.1 | 89 | 83 | 25.6 | 84 | 72 | 120.5 | 89 | 81 |
| 1930–31 | 55.4 | 68 | 84 | 23.3 | 76 | 65 | 97.2 | 71 | 78 |
| 1931–32 | 49.1 | 60 | 84 | 18.6 | 61 | 56 | 83.3 | 61 | 75 |
| 1932–33 | 50.4 | 62 | 96 | 17.7 | 58 | 57 | 83.7 | 61 | 83 |
| 1933–34 | 62.9 | 77 | 99 | 18.6 | 61 | 59 | 98.4 | 72 | 87 |
| 1934–35 | 58.9 | 72 | 96 | 20.7 | 68 | 69 | 96.7 | 71 | 87 |
| 1935–36 | 71.8 | 88 | 101 | 23.2 | 76 | 76 | 113.8 | 84 | 93 |
| 1936–37 | 88.4 | 108 | 104 | 26.7 | 88 | 90 | 135.9 | 100 | 99 |
| 1937–38 | 83.8 | 102 | 104 | 30.0 | 98 | 95 | 135.8 | 100 | 100 |
| 1938–39 | 81.9 | 100 | 100 | 30.5 | 100 | 100 | 136.1 | 100 | 100 |
| 1939–40 | 86.0 | 105 | 102 | 33.5 | 110 | 110 | 144.8 | 106 | 105 |
| 1940–41 | 98.7 | 121 | 116 | 37.1 | 122 | 114 | 160.4 | 118 | 113 |
| 1941–42 | 97.3 | 119 | 111 | 41.2 | 135 | 117 | 163.8 | 120 | 110 |
| 1942–43 | 98.6 | 120 | 108 | 45.2 | 148 | 122 | 170.2 | 125 | 109 |
| 1943–44 | 98.9 | 121 | 105 | 49.4 | 162 | 129 | 175.9 | 129 | 107 |
| 1944–45 | 116.4 | 142 | 113 | 52.0 | 170 | 132 | 196.7 | 145 | 113 |
| 1945–46 | 112.8 | 138 | 109 | 55.6 | 182 | 136 | 201.0 | 148 | 111 |
| 1946–47 | 131.4 | 160 | 109 | 61.7 | 202 | 147 | 230.9 | 170 | 116 |
A measure of relative productivity is afforded by the next table, which gives figures and index numbers of value and volume of production in total and per head of population.
VALUE AND VOLUME OF PRODUCTION
| Year. | Mean Population, Year ended 30th June. | Value of Production. | Volume of Production. | ||||
|---|---|---|---|---|---|---|---|
| Total. | Per Head. | Index Numbers 1938–39 (= 100). | Index Numbers 1938–39 (= 100). | ||||
| Total. | Per Head. | Total. | Per Head. | ||||
* Not available. | |||||||
| £(m.) | £ | ||||||
| 1900–01 | 812,010 | 33.9 | 41.7 | 25 | 50 | * | * |
| 1905–06 | 929,066 | 45.8 | 49.3 | 34 | 59 | * | * |
| 1910–11 | 1,050,014 | 53.4 | 50.9 | 39 | 61 | * | * |
| 1915–16 | 1,150,372 | 72.3 | 62.8 | 53 | 75 | * | * |
| 1920–21 | 1,258,313 | 99.5 | 79.1 | 73 | 94 | * | * |
| 1921–22 | 1,291,376 | 93.4 | 72.3 | 69 | 86 | * | * |
| 1922–23 | 1,317,154 | 100.3 | 76.1 | 74 | 90 | * | * |
| 1923–24 | 1,339,786 | 103.9 | 77.5 | 76 | 92 | * | * |
| 1924–25 | 1,367,978 | 119.5 | 87.4 | 88 | 104 | * | * |
| 1925–26 | 1,399,583 | 110.4 | 78.9 | 81 | 94 | * | * |
| 1926–27 | 1,427,569 | 111.1 | 77.8 | 82 | 93 | * | * |
| 1927–28 | 1,447,657 | 119.6 | 82.6 | 88 | 98 | * | * |
| 1928–29 | 1,464,582 | 126.2 | 86.2 | 93 | 102 | 77 | 85 |
| 1929–30 | 1,482,805 | 120.5 | 81.3 | 89 | 97 | 81 | 89 |
| 1930–31 | 1,504,022 | 97.2 | 64.6 | 71 | 77 | 78 | 84 |
| 1931–32 | 1,521,228 | 83.3 | 54.8 | 61 | 65 | 75 | 80 |
| 1932–33 | 1,533,252 | 83.7 | 54.6 | 61 | 65 | 83 | 88 |
| 1933–34 | 1,545,628 | 98.4 | 63.7 | 72 | 76 | 87 | 91 |
| 1934–35 | 1,556,923 | 96.7 | 62.1 | 71 | 74 | 87 | 91 |
| 1935–36 | 1,568,432 | 113.8 | 72.6 | 84 | 86 | 93 | 96 |
| 1936–37 | 1,582,244 | 135.9 | 85.9 | 100 | 102 | 99 | 101 |
| 1937–38 | 1,598,570 | 135.8 | 85.0 | 100 | 101 | 100 | 101 |
| 1938–39 | 1,616,650 | 136.1 | 84.2 | 100 | 100 | 100 | 100 |
| 1939–40 | 1,636,680 | 144.8 | 88.5 | 106 | 105 | 105 | 103 |
| 1940–41 | 1,634,238 | 160.4 | 98.1 | 118 | 117 | 112 | 111 |
| 1941–42 | 1,631,375 | 163.8 | 100.4 | 120 | 119 | 110 | 109 |
| 1942–43 | 1,639,407 | 170.2 | 103.8 | 125 | 123 | 109 | 107 |
| 1943–44 | 1,641,433 | 175.9 | 107.2 | 129 | 127 | 107 | 106 |
| 1944–45 | 1,673,378 | 196.7 | 117.5 | 145 | 140 | 113 | 109 |
| 1945–46 | 1,729,897 | 201.0 | 116.2 | 148 | 138 | 111 | 104 |
| 1946–17 | 1,782,253 | 230.9 | 129.6 | 170 | 154 | 116 | 105 |
INDUSTRIAL EFFICIENCY.—In keeping with modern trends of industrial planning and organization in overseas countries, the Legislature of New Zealand introduced in 1936 a measure designed “to promote the economic welfare of New Zealand by providing for the promotion of now industries in the most economic form and by so regulating the general organization, development, and operation of industries that a greater measure of industrial efficiency will be secured.” This legislation became operative as the Industrial Efficiency Act, 1936, and under it the Bureau of Industry was constituted.
The Bureau of Industry, which meets at frequent intervals, is comprised of both “ordinary” and “special” members, appointed by the Minister of Industries and Commerce. The “ordinary” members are Government officers who are appointed because of some special knowledge or qualifications appropriate to the administration of the Act. “Special” members are those who have been appointed to represent manufacturing industries and agricultural and pastoral industries.
The Industrial Efficiency Act charges the Bureau with a number of functions, the principal of which is the making of recommendations to the Minister for the administration of the Act. In addition to its advisory functions, the Bureau is the licensing authority under the Act, and besides preparing plans for industries it is charged with maintaining a continuous survey of industries, of industrial finance, and of industrial methods, as well as collaborating with the Department of Scientific and Industrial Research and the Now Zealand Standards Institute. One of its further functions is to consider and make recommendations to the Government on applications by industrial enterprises for financial assistance from the State.
The Act provides for the formulation of an industrial plan for the organization of any industry or of related industries. Prior to October, 1940, only two industrial plans, relating to the pharmacy and flax industries respectively, had been brought into operation. In that month, however, the Licensed Industries General Regulations were introduced, with a view to facilitating the preparation of plans and to servo as the basis for the plans. Since then a plan for the footwear industry has been brought into operation.
An industrial plan sots out, for the most part in general terms, what might be described as a code for the better organization of the industry, and defines the functions of the industrial committee, which is appointed in each case to administer the plan. Such a plan cannot be put into operation until a majority of these engaged in the industry indicate their acceptance, and where a plan is accepted the Act provides for the appointment of an industrial committee representing the employers, the workers, and the Government.
It is, however, the portion of the Act relating to industrial licensing that has engaged the greater attention of the Bureau of Industry. Licensing involves control being exercised over the entry of now units into the respective industries, as well as the imposition of appropriate conditions on licences in order to ensure that the industry is being carried on by licensees in a manner calculated to conform to industrial efficiency and national interest.
Provision is made in the Act for all decisions of the Bureau of Industry to be subject to appeal by persons who consider themselves aggrieved by the decisions, and this section of the Act has been availed of to a considerable extent. The appeals are hoard by an appeal authority appointed by the Governor-General.
As an indication of the extent to which businesses have become subject to the Industrial Efficiency Act, it may be mentioned that there are about 4,800 licensed units, made up mainly of the distributive or semi-distributive industries. There are licensed some 4,000 resellers of motor-spirits and 591 pharmacists. So far as manufacturing industries are concerned, the total number of units is not large, many licensed industries having less than six units, while others range up to one hundred and fifteen. On 31st March, 1948, the following twenty-seven industries were subject to licensing under the Industrial Efficiency Act:—
Manufacture of agar for sale.
Manufacture of apple-juice for sale.
Manufacture of products consisting of a combination of asbestos and cement.
The business of a pharmaceutical chemist carried on in any shop or place of business.
Manufacture of cigarette-papers.
Manufacture of colloidal sulphur.
Manufacture of footwear for sale.
Manufacture for sale or export of hand-shovels.
Manufacture, from linseed, of oil or oil cake for sale.
Manufacture of macaroni for sale.
Manufacture of malt-extract.
Importation and/or wholesale distribution of motor-spirits.
Retail sale and distribution of motor-spirits.
Manufacture of nails.
Extraction from fish-livers of nutritional or medicinal oils.
Manufacture of paper-pulp or paper products.
Milling of phormium products.
Preservation of fish for sale in hermetically sealed cans, jars, or other containers.
Manufacture of pumps or the assembly of parts thereof for the distribution of motor-spirits.
Manufacture of electric ranges, including the assembly of parts thereof.
Manufacture of rennet.
Manufacture of bituminous roofing-material for sale.
Manufacture of rope and twine.
Manufacture of rubber tires and tubes for all types of vehicles.
Manufacture of salt for sale.
Manufacture of wooden heels for footwear.
Manufacture of paua (Haliotis iris) shell for sale.
The descriptions of the industries listed above in many cases serve only in a general way to indicate the scope of the industries licensed, full details being available in the relevant licensing notices.
GENERAL ELECTIONS.—The 1946 general election of parliamentary representatives was held in November of that year, voting in New Zealand for Maori electorates taking place on the 26th, and for European electorates on the 27th. Voting by members of the Armed Forces, both in New Zealand and overseas, took place prior to 27th November and was spread over a period of several days. A summary of the European electorates for the 1946 and the four preceding elections is shown below. In the normal course a general election would have taken place in 1941, but on account of war conditions the life of Parliament was extended (see page 17).
| — | 1931. | 1935. | 1938. | 1943. | 1946. |
|---|---|---|---|---|---|
* Including votes recorded by members of Armed Forces. | |||||
| Number of votes recorded for candidates elected | 382,562 | 442,716 | 550,121 | 495,380* | 591,399* |
| Number of votes recorded for candidates defeated | 310,510 | 385,079 | 367,563 | 415,990* | 419,688* |
| Number of informal votes | 4,955 | 6,887 | 6,373 | 9,957* | 7,999* |
| Total number of votes recorded | 698,027 | 834,682 | 924,057 | 921,327* | 1,019,086* |
| Percentage of votes recorded for candidates elected, to total valid votes recorded | 55.20 | 53.48 | 59.95 | 54.35 | 58.49 |
| Total number of electors on civilian roll (where contest) | 838,344 | 919,798 | 995,173 | 1,000,197 | 1,031,898 |
| Number of districts where no contest | 4 | 2 | |||
| Percentage of civilian votes recorded to total number of civilian electors on roll | 83.26 | 90.75 | 92.85 | 82.82 | 93.46 |
| Percentage of votes recorded for candidates elected to total number of electors on civilian roll | 45.63 | 48.13 | 55.28 | 49.53 | 54.66 |
| Number of seamen's rights exercised | 837 | 1,229 | 1,146 | 452 | 156 |
| Number of electors voting as absent voters | 31,160 | 38,776 | 41,633 | 35,898 | 48,673 |
| Number of electors exercising postal votes | 6,956 | 9,796 | 17,324 | 18,128 | 24,920 |
| Number of electors voting as members of the Armed Forces | 92,934 | 7,903 | |||
The number of electors on the civilian roll in 1946 was 1,081,898, of whom 531,837 were men and 550,061 were women. The relative interest in the poll evinced by men and women may be measured by the number of votes recorded to the number on the roll—viz., men, 499,027 (93.83 per cent.) and women 512,151 (93.11 per cent.). A strict comparison with the results of the 1943 election is not possible owing to the fact that the names of a considerable but unknown proportion of the 92,934 electors—the great majority of whom were men—who exercised their votes as members of the Armed Forces were included in the civilian roll. A similar state of affairs obtained in 1946, but as the number involved was only 7,908, the percentages would be affected to a much lesser extent. In the pre-war election of 1938 the number of men who voted was 469,285, 93.43 per cent. of the number on the roll, while comparative figures for women were 454,772 and 92.27 per cent. respectively.
A statement of voting in individual electorates at the general election in 1946 is given in the 1946 Year-Book (pp. 742–746).
The 1949 general election was held in November of that year, but at the time of going to press with this Section, data corresponding to those given above were not available.
By-elections.—Between the general elections of 1946 and 1949 by-elections were necessitated in three electorates as follows, the cause of the vacancy being the death of the sitting member in each case.
| Electorate. | Sitting Member. | Date of By-election. | New Member. |
|---|---|---|---|
| Avon | Sullivan, Hon. D, G. | 28/5/47 | Mathison, J. |
| Mount Albert | Richards, A. S. | 24/9/47 | Freer, W. W. |
| Westland | O'Brien, Hon. James | 3/12/47 | Kent, J. B. |
LICENSING.—The report of the Royal Commission on Licensing (parliamentary paper H-38, 1946) on page 27 gave the following figures of licences in existence during the year 1945, the figures being exclusive of conditional licences:—
| Licence. | Number. |
|---|---|
| Brewers | 42 |
| Hop-beer | 31 |
| Winemakers' licences for making wine | 170 |
| Winemakers' licences for making spirits for fortifying wine | 18 |
| Wholesale | 140 |
| Publicans | 948 |
| Accommodation | 150 |
| Packet | 5 |
| Licences to sell New Zealand wines, cider, or perry, not exceeding 20 per cent. proof spirit, under section 77 of the Licensing Act, 1908 | 4 |
| Licences for permits to sell New Zealand wine, cider, or perry pursuant to the Regulations 1943/122— | |
| To 30th September, 1945 | 54 |
| To 31st May, 1946 | 75 |
| Club charters | 47 |
The annual fees payable for licences are:—
| (1) For a publican's licence— | £ |
| (a) Within the limits of a borough or town district | 40 |
| (b) Outside the aforesaid limits | 25 |
| (2) For a New Zealand wine licence | 1 |
| (3) For an accommodation licence, a sum to be determined by the Licensing Committee, not exceeding | 20 |
| (4) For a packet licence— | |
| (a) For a vessel exceeding 50 tons register | 10 |
| (b) For a vessel not exceeding 50 tons register | 5 |
| (5) For a wholesale licence | 20 |
| (6) For a conditional licence, according to duration of licence, a sum not exceeding | 30 |
Fees from existing licences form part of the revenue of the local authority of the district in which the licence was issued.
The Licensing Amendment Act 1948 provided for the establishment of a Licensing Control Commission with general functions of:—
Generally to supervise the activities of Licensing Committees in the performance of their functions:
To prescribe standards to be complied with in the provision of accommodation, services, and other facilities for the public and for lodgers, guests, or employees in licensed promises:
To control the Licensing Fund (established by this Act):
To review from time to time the distribution of publicans', accommodation, tourist-house, and wholesale licences throughout New Zealand:
The determine what publicans', accommodation, tourist-house, and wholesale licences are unnecessary, and the amount of compensation to be paid in respect of the cancellation thereof:
To determine the number of new publicans, tourist-house, and wholesale licences to be issued in each licensing district, and, subject to the provisions of this Act, the situation of the premises in respect of which such licences are to be granted:
To determine the fair price to be paid in respect of now publicans', tourist-house, and wholesale licences:
To grant club charters:
To make recommendations to the Minister as to the expediency of amending the Licensing Acts.
In addition, the Commission shall have such other functions as are conferred on it by this or any other Act.
The amending Act provides that no new accommodation or New Zealand wine licences are to be granted.
The total number of publicans' licences for the time being in force is not to exceed the number at present in force on the passing of the Act, plus (a) an additional twenty, (b) the number granted in place of accommodation licences, (c) the number granted after the passing of this Act as a result of a determination of electors of any no-licence district at a poll under section 8 of the Licensing Amendment Act, 1910, and (d) the number granted pursuant to Part VI of the 1948 amendment (i.e., special polls of electors in the Ashburton, Geraldine, and King-country areas). This total number may be increased whenever the results of any periodical census or any statistics published under the Census and Statistics Act, 1926, show that the population of New Zealand has exceeded by at least fifty thousand persons the population at the time of passing this Act, or since the Commission last authorized an increase in the number of licences under this provision. The Commission may authorize such new licences on this account as it thinks fit, but not so as to exceed one licence for every complete ten thousand of the increase in population.
Wholesale licences are not to exceed in number one for every complete ten thousand of the population of New Zealand, while tourist-house licences for the time being in force are not to exceed twenty-five.
The 1948 amendment provided that the Commission shall review the distribution of the three classes of licences quoted as soon as practicable after the passing of the Act, and may do so also from time to time after this initial review, with the proviso that a review must be done at least once in each succeeding period of ten years.
Various provisions were also given in respect to procedure, surrender of licences, compensation, appeals, brewers' licences, &c.
New kinds of licences which can be granted by Licensing Committees in addition to those provided for in the principal Act are tourist-house licences and works canteen licences. It is of interest to note these may be granted in respect of premises situated in any proclaimed area. The licence fee for each of the two classes is £10.
The 1948 amendment also permits the licensing Commission to grant charters to clubs subject to certain conditions, and, in addition, includes provision for the granting of temporary charters in the King-country.
The Licensing Amendment Act, 1948, also contained provisions for a referendum to be taken on the question of hours for sale of liquor in hotel bars, local restoration polls in no-licence districts, and a proposal that licences for sale of liquor be issued in the King-country. In the latter two cases voters were required to record their vote either for or against Trust Control.
In accordance with the provisions of the Act, a general poll as to the hours for the sale of liquor in hotel bars was held on 9th March, 1949, the alternatives submitted to the electors being that hotels be open, as at present, between 9 a.m. and 6 p.m., or for a total of nine hours at times to be decided between 10 a.m. and 10 p.m. The result of the poll was as follows:—
| For six o'clock closing | 473,768 |
| For ten o'clock closing | 153,850 |
| Majority for six o'clock | 319,918 |
National Licensing Polls.—The licensing poll of 27th November, 1946, held in conjunction with the parliamentary elections, was the seventh at which the three issues—national continuance, State purchase and control, and national prohibition (without compensation)—were submitted to the electors. Official figures of the 1946 poll, together with those of the four preceding polls, are as follows:—
| 1928. | 1935. | 1938. | 1943. | 1946. | |
|---|---|---|---|---|---|
NOTE.—There was no referendum taken in 1931, on grounds of economy. | |||||
| For national continuance | 373,692 | 521,167 | 546,995 | 529,386 | 542,681 |
| For State purchase and control | 64,276 | 57,499 | 96,131 | 123,701 | 202,664 |
| For national prohibition | 294,453 | 243,091 | 263,208 | 269,800 | 259,162 |
A noticeable feature of the foregoing figures is the increase in the number of votes recorded for State purchase and control at each of the last three polls, particularly in 1946. This issue received 7 per cent. of the total votes at the 1935 poll, 10.6 per cent. in 1938, 13.4 per cent. in 1943, and 20.2 per cent. in 1946. National continuance, which received 444 per cent. of the votes recorded in 1925, showed a substantial gain at each of the two succeeding polls, reaching 63.4 per cent. in 1935, since when it has fallen gradually to 54.0 per cent. in 1946. Votes cast in favour of national prohibition amounted to 47.3 per cent. in 1925, but fell heavily at each of the next two polls, reaching 29.6 per cent. in 1935. There was little variation in this percentage in 1938 and 1943, but a further fall to 25.8 per cent. was recorded in 1946.
The total number of votes recorded by members of the Forces at the national licensing poll of 1946 was 7,954, of which national continuance received 5,536 (69.6 per cent.); State purchase and control, 1,826 (23 per cent.); and national prohibition, 592 (74 per cent.). Corresponding figures for the 1943 poll were: total votes recorded, 95,186; national continuance, 74,686 (78.5 per cent.); State purchase and control, 10,887 (114 per cent.); and national prohibition, 9,613 (104 per cent.).
Voting by members of the Forces as such also took place at a special licensing poll held on 10th April, 1919. On that occasion, only two issues were submitted—national continuance and national prohibition. Civilian voting had resulted in a majority of 13,896 for national prohibition (246,104 votes to 232,208), but votes cast by members of the Forces—31,981 for national continuance and 7,723 for national prohibition—resulted in national continuance being carried by a majority of 10,362.
The voting results in each licensing district in 1946 are shown on page 748 of the 1946 Year-Book.
A further national licensing poll was held on 30th November, 1949, in conjunction with the parliamentary elections; although national continuance was carried by a large majority, final figures were not available for inclusion here.
Local Option.—In the no-licence districts an additional issue is submitted to the electors—viz., restoration of licences—three-fifths of the valid votes cast being required for the carrying of the proposal. The voting for each of the eleven districts for 1946 is also shown on page 748 of the 1946 Year-Book.
In seven of the eleven no-licence districts “restoration” received a majority of the votes, but in only one case—viz., Masterton—was the majority sufficient (three-fifths of the valid votes cast) to carry the issue.
In 1943 in five of the then twelve no-licence districts, “restoration” received a majority of the votes, but in only one case—viz., Invercargill—was the majority sufficient to carry the issue. As a result, the sale of intoxicating liquor in hotel-bars became permissible in Invercargill as from 1st July, 1944. A new departure in regard to the conduct of the liquor trade in New Zealand was inaugurated by the Invercargill Licensing Trust Act, 1944, which established a trust of six members to be appointed from time to time by the Governor-General. The functions of the Trust according to the Act are to provide accommodation and other facilities for the travelling public within the Invercargill Licensing District, to establish and maintain hotels and suitable places within the district for the sale or supply of refreshments, to sell and supply intoxicating liquor within the district, and to establish and maintain premises for that purpose. The net profits arising from the operations of the Trust may be expended or distributed by the Trust for the promotion, advancement, or encouragement of cultural and recreational or philanthropic purposes within the Southland Land District.
Following the result of the poll in the Masterton No-licence District in 1946, the electors were given the opportunity of recording their views as to whether they desired a form of “trust” control or otherwise. The district was divided into three areas, the Akitio County, the Borough of Eketahuna and the Eketahuna County, and the southern area consisting of the Borough of Masterton, the Mauriceville County, and those portions of the counties of Masterton, Wairarapa South, and Castlepoint which are included in the district. Polling took place on 28th May, 1947, and “trust” control was carried in the southern area but was defeated in the other two areas, which are predominantly rural. Legislation providing for the constitution of the Masterton Licensing Trust to control the southern area was passed dining the 1947 session of Parliament.
LOTTERIES.—Under section 42 of the Gaming Act, 1908, the Minister of Internal Affairs may grant permission (subject to such conditions as he thinks fit) for the disposing by raffle or chance of any painting, drawing, sculpture, or other work of art, or literature, or mineral specimen, or mechanical model. By the Stamp Duties Amendment Act, 1931, any such licence granted for the raffling of mineral specimens in excess of £100 value is subject to a lottery duty of 10 per cent. of the nominal value of all tickets represented in the drawing of the lottery, whether such tickets have been disposed of by way of sale or otherwise. Information as to receipts from this source will be found in Section 24B—Taxation.
The Gaming Act also permits sweepstakes and art-unions (as defined) under certain specified conditions.
During the year ended 31st March, 1949, 583 licences were issued under the authority of section 42 of the Act. Of these, 320 were for works of art, and 263 for amounts of alluvial gold, only 6 being in excess of £50. In addition, 13 licences were issued in respect of the regular £5,000 alluvial gold art-unions. The aggregate results of these regular art unions for the last seven years have been as follows:—
| — | 1942–43. | 1943–44. | 1944–45. | 1945–46. | 1946–47. | 1947–48. | 1948–49. | |
|---|---|---|---|---|---|---|---|---|
| Number of lotteries | 11 | 12 | 13 | 13 | 13 | 13 | 13 | |
| Gross sales | £ | 204,750 | 251,675 | 273,803 | 280,240 | 293,464 | 273,867 | 286,494 |
| Commission on sales | £ | 30,713 | 37,751 | 41,071 | 42,036 | 44,020 | 41,080 | 42,974 |
| Expenses | £ | 27,641 | 30,854 | 33,715 | 33,475 | 34,661 | 32,912 | 31,948 |
| Prizes | £ | 55,000 | 60,000 | 65,000 | 65,000 | 65,000 | 65,000 | 65,000 |
| Net proceeds | £ | 91,396 | 123,070 | 134,017 | 139,729 | 149,783 | 134,875 | 146,572 |
| Lottery duty | £ | 20,475 | 25,168 | 27,380 | 28,024 | 29,346 | 27,386 | 28,649 |
| Net profit | £ | 70,921 | 97,902 | 106,637 | 111,705 | 120,437 | 107,489 | 117,923 |
Of the net profits in 1947–48, £39,133 was distributed to the various mayoral or other recognized central funds established for the relief of distress, £30,020 to charitable and philanthropic organizations, £10,850 to patriotic funds, and £10,349 to children's health camps.
Under clause 38 of the Patriotic Purposes Emergency Regulations 1939, permission was given to raffle gifts of real or personal property for the funds of either the National or any Provincial Patriotic Council, and a special system of licensing of these raffles was instituted in May, 1940.
GAMING REFERENDUM.—The Gaming Poll Act, 1948, made provision for a poll of electors on the question of establishing a scheme of off-course betting on horse races through the totalizator. The poll was conducted on the 9th March, 1949, and resulted as follows:—
| For off-course betting | 424,219 |
| Against off-course betting | 199,406 |
| Majority for | 224,813 |
TIME-SERVICE ARRANGEMENTS.—The following article on the New Zealand time-service arrangements was prepared by Mr. R. C. Hayes, Acting Director of the Dominion Observatory.
One uniform time is kept throughout New Zealand. The following extract from the New Zealand Gazette of 31st October, 1868, contains the Government announcement regarding the standardizing of mean time.
“Colonial Secretary's Office,
“Wellington, 30th October, 1868.
“In accordance with a resolution of the House of Representatives to the effect that Now Zealand Mean Time be adopted throughout the colony, it is hereby notified for public information that the time corresponding to the longitude 172° 30' east of Greenwich—which is exactly 11½ hours in advance of Greenwich time—has been adopted as the mean time for the colony; and that from and after the second day of November the public offices of the General Government will be opened and closed in accordance therewith.
“E. W. STAFFORD.”
This New Zealand Mean Time, 11h. 30m. in advance of Greenwich Mean Time (G.M.T.), was observed continuously up to 1927, when on 6th November clocks were advanced 1 hour until 4th March, 1928. The next period of Summer Time was from 14th October, 1928, to 17th March, 1929, but in this, and in subsequent periods clocks were advanced only 30 minutes (to 12h. ahead of G.M.T.). The Summer Time Act of 1929 provided for clocks to be advanced 30 minutes from the second Sunday in October of any year to the third Sunday in March of the following year. By the Summer Time Amendment Act, 1933, the period of Summer Time was extended from the first Sunday in September to the last Sunday in April. This amendment commenced in 1934, when the period of Summer Time was extended until 29th April.
The Daylight Saving Emergency Regulations of 1941 provided for the continuance of Summer Time throughout that year; and its continued observance during subsequent war years was provided for by regulations made annually.
By the Standard Time Act of 1945, the time of the meridian 180° east of Greenwich (12h. in advance of G.M.T.) was adopted as the standard Time for New Zealand. Thus, what was formerly known as “Summer Time” became “Now Zealand Standard Time” as from 1st January, 1946. The times stated in this article are New Zealand Standard Time, unless otherwise stated.
The time throughout New Zealand is controlled by the Dominion Observatory, Wellington. The Observatory signal clock is kept as correct as possible by means of astronomical observations, and by comparison with radio time-signals from observatories in other parts of the world.
The Observatory provides the following time-service:—
(1) RADIO TIME-SIGNALS TRANSMITTED THROUGH STATION ZLW ON A WAVE-LENGTH OF 500 Kc/s (600 METRES) I.C.W.
These signals are transmitted between 10h. 55m. and 11h. 00m. a.m. daily, and are in accordance with the modified ONOGO system. The procedure is as follows:—
At 10h. 55m. 30s., the “Attention” call (__ . __ .__), followed by the Observatory call sign ZMO (__ __ . __ __ __ __ __).
From 10b. 56m. 05s. to 10h. 56m. 50s., the letter O (__ __ __), repeated every ten seconds, except that the third series from 25s. to 30s. consists of a single dash prolonged for five seconds.
From 10h. 57m. 00s. to 10h. 57m. 49s. the letter X (__ . . __), repeated every five seconds.
From 10h. 57m. 55s. to 10h. 58m. 00s., First Time Signal, consisting of six dots at intervals of one second.
From 10h. 58m. 08s. to 10h. 58m. 50s., the letter N (__ .), repeated every ten seconds.
From 10h. 58m. 55s. to 10h. 59m. 00s., Second Time Signal, consisting of six clots at intervals of one second.
From 10h. 59m. 06s. to 10h. 59m. 50s., the letter G (__ __ .), repeated every ten seconds.
From 10h. 59m. 55s. to 11h. 00m. 00s., Third Time Signal, consisting of six dots at intervals of one second.
The series of six dots which constitute the actual time-signals are transmitted directly from the Dominion Observatory signal clock, which is seldom more than one tenth of a second in error. The remaining signals are for tuning and identification purposes only, and should not be used as precise time-signals. Corrections to the time-signals can be obtained on application to the Dominion Observatory.
(2) RADIO TIME-SIGNALS TRANSMITTED THROUGH THE NATIONAL BROADCASTING SERVICE STATION 2YA
Time-signals are supplied to the National Broadcasting Service for transmission through station 2YA. The signals consist of six dots, separated by intervals of one second, the last dot being the exact minute. Each transmission consists of a group of three signals at consecutive minutes, the scheduled times of transmission being as follows:—
10h. 28m.; 10h. 29m.; 10h. 30m. a.m.
3h. 28m.; 3h. 29m.; 3h. 30m. p.m.
7h. 28m.; 7b. 29m.; 7h. 30m. p.m.
10h. 28m.; 10h. 29m.; 10h. 30m. p.m.
In all cases the time-signals are superimposed on the station programmes, but, in the event of failure or suppression of signals at scheduled times, they are transmitted thirty minutes later if circumstances permit.
In addition to the above official time signals, the National Broadcasting Service transmits one series of six dots at each hour from 7 a.m. to 7 p.m., and at 9 p.m.
(3) TIME-SIGNALS BY TELEGRAPH
The Observatory sends time-signals by telegraph to the General Post Office and the Railways Department, Wellington, at 9h. a.m. daily. This signal is transmitted to all telegraph-offices in New Zealand and to all railway-stations in the North Island.
(4) PUBLIC CLOCKS
The Government Buildings clock (Wellington) is checked at 9h. a.m. daily by means of a special circuit between the clock and the Observatory. The error of this clock is usually less than 15 seconds.
An electric synchronous clock, installed at the Observatory, is checked twice daily. Observations show that, under normal conditions of power supply, the variation of the electric clocks amounts to a few seconds only.
TOURIST ATTRACTIONS.—Reference to pages 932–935 of the 1940 Year-Book, or pages 812–815 of the 1939 issue, will give a brief description of the main tourist attractions in New Zealand.
MINERAL WATERS AND SPAS.—For information concerning the mineral waters and spas of New Zealand reference should be made to the 1940 and earlier editions of the Year-Book, which contain a short description of the Rotorua and Te Aroha spas, together with analyses of the more important springs at the latter, while in the 1913 issue of the Year-Book will be found detailed analyses of the various mineral waters throughout New Zealand.
REVIEW OF LEGISLATION, 1947 AND 1948.—Acts passed 1947: public Acts, 66; local Acts, 11; private Acts, 2. 1948: public Acts, 82; local Acts, 13; private Acts, 4.
The following is a brief synopsis of the more important public Acts passed by the General Assembly during the 1947 session, which ended on 1st December, 1947.
The Dairy Products Marketing Commission Act, 1947, establishes the Dairy Products Marketing Commission for the purpose of acquiring and marketing butter and cheese intended for export, of fixing the prices to be paid for butter and cheese so acquired, and of regulating the marketing of butter and cheese in New Zealand. The Commission is also to report to the Minister of Marketing concerning trends and prospects in overseas markets in respect of dairy-produce and movements in costs or prices or other factors likely to prejudice the economic stability of the dairy industry. In fixing prices regard is to be had to prices previously fixed or those fixed under section 20 of the Marketing Act, 1936, and to the following considerations: the necessity in the public interest of maintaining the stability and efficiency of the dairy industry, the costs involved in the efficient production of butter and cheese, the general standard of living of persons engaged in the dairy industry in comparison with the general standard of throughout Now Zealand, the promotion of the general economic stability of New Zealand, the estimated cost of marketing the commodities concerned, the cost of general administration, and any other matters deemed to be relevant. Prices are to be such that any efficient producer engaged in the dairy industry under usual conditions and in normal circumstances should be assured of a sufficient net return from his business to enable him to maintain himself and his family in reasonable comfort. There is provision for adjustment where the local price is not equivalent to the export price.
The Contributory Negligence Act, 1947, provides for the apportionment of damages where a person suffering from damage has himself been guilty of contributory negligence, and makes appropriate provisions in the case of claims by workers against employers.
The Meal Amendment Act, 1947, empowers a local authority controlling an abattoir to prescribe abattoir charges and fees by resolution, and imposes conditions governing the sale or disposition of a meat-export slaughterhouse and transfer of licence, including the requirement of the consent of the Minister or of the Meat Producers Board acting with the authority of the Minister.
The Victoria University College Amendment Act, 1947, enables the Professorial Board to appoint an additional member of the College Council, and empowers the teaching staff to elect one of its members to be a member of the College Council.
The Finance Act, 1947, in Part I authorizes the Minister of Marketing to hold property and enter into contracts on behalf of the Crown, provides for an annual statement of corporation investments to be laid before Parliament, validates excess unauthorized expenditure, abolishes the national security tax, and makes several minor amendments in the law relating to income-tax, social security charge, and stamp duties. Part II amends the law relating to death duties in the case of a widow and infant children of a deceased person and provides for the payment of succession duty by remote successors domiciled out of New Zealand. Part III deals with the National Provident Fund and includes increases in the weekly allowances payable on death or during incapacity and provides for allowances in respect of children to be payable up to the age of sixteen years with power to continue allowances beyond the age of sixteen years under certain conditions. Part IV contains a number of miscellaneous provisions, including an amendment to the Coinage Act, 1933, to the effect that cupro-nickel coins are to be legal tender up to forty shillings; authorizes an increased proportion of Government and local authority investments in the Government Insurance Account, and provides that certain servicemen shall be deemed to be permanently employed for the purposes of the Public Service Superannuation Act.
The Food and Drugs Act, 1947, consolidates and amends the law relating to the sale of Foods and Drugs.
The Matrimonial Causes (War Marriages) Act, 1947, confers jurisdiction on the Supreme Court of New Zealand in respect of certain wartime marriages irrespective of the domicile of the parties, provides that certain decrees and orders made under corresponding provisions in certain parts of the British Commonwealth shall he recognized in New Zealand, provides for the recognition in New Zealand of certain decrees made in the United States of America, and shortens the period of desertion or separation as a ground for divorce from three years to twelve months in certain eases.
The Hospitals and Charitable. Institutions Amendment Act, 1947, authorizes Hospital Boards to provide certain health services of a preventive nature, and provides for the appointment of a Medical Director of an obstetrical and gynæcological hospital in Auckland.
The Royal Titles Act, 1947, gives parliamentary sanction to the alteration of Royal Style and Titles by the omission of the words “Indiae Imperator” and “Emperor of India.”
The Births and Deaths Registration Amendment Act, 1917, provides for the setting-up of a special register to record the deaths of Members of the Forces while overseas, and prescribes particulars which are to be inserted therein.
The Police Force Act, 1917, consolidates and amends the law relating to the establishment and regulation of the Police Force. It contains provisions restricting the right of members of the Force to resign; provides for inquiries as to breaches of duty by members of the Force; authorizes the appointment of committees of inquiry to investigate any matter connected with the Force; and provides for the temporary exchange of members of the Force with members of the Police Forces of the Australian States.
The Land and Income Tax (Annual) Act, 1917, fixes the rates of land-tax and income-tax for the tax year commencing 1st April, 1947.
The Industrial Conciliation and Arbitration Amendment Act, 1917, provides for the appointment of Deputy Judges of the Court of Arbitration, makes provisions for an appeal to the Court from any decision of a Deputy Judge, and provides for the taking of a secret ballot by every industrial union of workers or of employers on questions relating to strikes or lockouts.
The Magistrates' Courts Act, 1947, consolidates and amends the law relating to Magistrates' Courts and to the exercise of civil and criminal jurisdiction by Magistrates. The principal amendments provide for an extension of jurisdiction in civil cases (generally where the amounts involved do not exceed £500 or by agreement between the parties if but for the amount a Magistrate's Court would have had jurisdiction); and for the Courts to have jurisdiction in matters which were formerly outside their jurisdiction and to grant equitable remedies, which formerly they could not grant. Certain procedural matters appearing in earlier legislation have been omitted and are now to be provided for by regulations.
The International Air Services Licensing Act, 1917, provides for the licensing of international air services operating in New Zealand and prohibits operation except pursuant to a licence. The Minister in Charge of the Air Department is to be the sole licensing authority, and is to have regard to any international conventions, agreements, and arrangements to which New Zealand is a party. The licence may be granted subject to certain conditions, while the Minister may prescribe the class and number of aircraft and maximum or minimum capacity thereof, class of goods carried, date before which commencement must take place, countries served and route followed, frequency of service, and passenger fares and charges for goods. A licence may be revoked at any time under certain circumstances.
The Lake Taupo Compensation Claims Act, 1947, fixes the basis on which compensation is to be assessed in claims arising from the operation of the works undertaken to control the level of Lake Taupo.
The Stock Remedies Amendment Act, 1947, extends the date for re-registration of stock remedies and empowers the Stock-remedies Registration Board to grant temporary registration in certain cases.
The Electric-power Boards Amendment Act, 1947, contains several miscellaneous amendments of the principal Act, alters the system of election of Power Boards in certain cases, authorizes Power Boards to raise additional loans for the reticulation of added areas without taking a poll of ratepayers, and extends the powers of the Boards to raise certain loans to provide dwellings for employees.
The Local Elections and Polls Amendment Act, 1947, makes several minor amendments in the procedure at local-body elections, and in addition provides that employees are to be given time off to vote.
The New Zealand Loans Amendment Act, 1947, establishes the Public Debt Commission to control matters relating to the public debt, abolishes the Public Debt Repayment Account, prescribes the moneys that shall be payable into the Loans Redemption Account and the manner in which moneys standing to the credit of that account shall be applied, and protects the rights of British investors and confirms an undertaking in that regard given by the New Zealand Government to the United Kingdom Government.
The War Pensions Amendment Act, 1947, increases the rates of war pensions and war veterans' allowances.
The War Pensions and Allowances (Mercantile Marine) Amendment Act, 1947, increases the rates of pensions and allowances in the case of deaths of members of the mercantile marine due to war service.
The Social Security Amendment Act, 1947, increases the monetary benefits under the principal Act; makes provision for family benefits to be payable in respect of children of servicemen; provides that superannuation, family, and miners' benefits shall continue to be payable for such period as the Commission may determine, while other classes of benefits must be renewed every twelve months.
The Customs Acts Amendment Act, 1947, provides for alteration in the rates of certain Customs duties, beer duty, tobacco duty, and sales tax.
The Masterton Licensing Restoration Act, 1947, provides for the restoration of licences for the sale of intoxicating liquor in part of the district known as the Masterton No-licence District.
The Post and Telegraph Amendment Act, 1947, contains some miscellaneous amendments to the principal Act. It provides that an officer is not to be prejudiced in an appeal by reason of absence with the Armed Forces, and authorizes the making of regulations providing for compulsory membership of the Post and Telegraph Employees' Association and Officers' Guild, Incorporated.
The Treaties of Peace (Italy, Roumania, Bulgaria, Hungary, and Finland) Act, 1947, empowers the Governor-General in Council to give full effect to the Treaties of Peace with Italy, Roumania, Bulgaria, Hungary, and Finland which were signed in Paris on behalf of New Zealand on 10th February, 1947.
The Forest and Rural Fires Act, 1947, is designed to make better provision for the prevention and suppression of forest and rural fires. It provides for the declaration of areas as rural fire districts, the setting-up of a Fire Authority for each district, and prescribes the powers and duties of these authorities. The Act also declares that it shall be a function of the State Forest Service to provide a fire prediction and warning service, authorizes the prohibition of certain operations during periods of fire danger, empowers a Fire Authority to require fire-breaks to be made, authorizes Fire Officers to exercise certain powers to suppress fires and to requisition assistance for this purpose, and authorizes the raising of a levy to meet the requirements of a Fire Authority.
The Masterton Licensing Trust Act, 1947, establishes a body corporate, known as the Masterton Licensing Trust, for the purpose of providing for the establishment of hotels and the sale of intoxicating liquor in the Masterton Licensing Trust District constituted by the Act. The Trust is given the right to sell intoxicating liquor in its district, and is empowered to establish and maintain hotels and also dining and refreshment rooms in which intoxicating liquor may be supplied. The Trust may also establish and maintain a brewery or acquire shares in a company carrying on the business of a brewer. The Act also provides for the distribution of the Trust's profits for public purposes within the Trust district.
The Auckland University College Amendment Act, 1947, makes provision for the appointment of two additional members of the College Council to represent the teaching staff and the students.
The Patents, Designs, and Trade-marks Amendment Act, 1947, authorizes the Governor-General to make regulations to give effect to the London Accord relating to former German-owned patents and to the Neuchatel Agreement relating to the preservation or restoration of rights of industrial property affected by the Second World War. The Act also empowers the Commissioner of Patents to dispense with production of probate or letters of administration in certain cases, while other provisions concern inventions relating to atomic energy.
The Statute of Westminster Adoption Act, 1947, adopts sections 2, 3, 4, 5, and 6 of the Statute of Westminster, 1931 (United Kingdom), and states that for the purposes of section 4 of the Statute of Westminster, 1931, the request and consent of New Zealand to the enactment of any Act of the Parliament of the United Kingdom shall be made and given by the Parliament of New Zealand, and not otherwise. The Schedule to the Act sets out the Statute of Westminster.
The Diplomatic Privileges Extension Act, 1947, extends certain diplomatic privileges, immunities, and capacities to certain international organizations and their staffs; makes certain provisions relating to the diplomatic immunities of representatives of other members of the British Commonwealth of Nations and of foreign Governments attending international conferences in New Zealand; and authorizes the Governor-General to decline to grant privileges or to withdraw privileges from representatives of any Government failing to accord reciprocal treatment to New Zealand nationals or representatives.
The Minimum Wage Amendment Act, 1947, increases the minimum wages for adult workers to £5 15s. for men and £3 13s. for women, with commensurate increases in hourly and daily rates.
The Mining Amendment Act, 1947, provides for the consolidation of licences for adjoining claims, and of licences for alluvial or dredging claims which are not adjoining. It also provides that contributory negligence on the part of a person injured or killed, owing to the non-observance in any mine of any of the provisions of the principal Act, shall not be a defence to any proceedings arising out of such injury or death.
The Coal-mines Amendment Act, 1947, includes provisions restricting rights as to coal-mining leases in exchange for licences granted after the passing of the amending Act, increases payments for the Coal-miners' Relief Fund by increasing the levy per ton on all coal sold, and provides that contributory negligence on the part of a person injured or killed, owing to the non-observance in any coal-mine of any of the provisions of the principal Act, shall not be a defence to any proceedings arising out of such injury or death.
The Adult Education Act, 1947, establishes the National Council of Education as a body corporate for the purpose of making better provision for adult education. It prescribes that the functions of the Council shall be to promote and foster adult education and the cultivation of the arts, make representations to the Minister as to the amount of the annual grant made to the Council by parliamentary appropriation, and to receive, administer, and control the expenditure of all moneys granted. In each University district a Regional Council of Adult Education is to be set up, with half its members being appointed on the nomination of voluntary associations or organizations. The Act also provides for the establishment of community centres for the purpose of providing for the education and cultural activities of persons residing in the locality.
The New Zealand Constitution Amendment (Request and Consent) Act, 1947, requests and consents to the enactment by the Parliament of the United Kingdom of an Act in the form of the draft set out in the schedule. The draft is an amendment of the New Zealand Constitution Act, 1852, and is intended to give power to the New Zealand Parliament to alter, suspend, or repeal all or any of the provisions of the principal Act.
The Finance Act (No. 2), 1947, relates to a variety of matters affecting public finance. Part I provides for the chartering of ships on behalf of the Crown, abolishes the Main Highways Account, amends provisions as to the Electric Supply Account, provides an increase in salaries of Government servants and of superannuated Government servants who are re-employed, gives power to exempt certain allowances from income-tax and social security charge, extends the time for prosecutions and recovery of penal tax under the Land and Income Tax Act, 1923, to ten years, extends the period for the allowance of special depreciation for income-tax purposes, and makes provision as to the deduction of losses from the income of companies for social-security-charge purposes. Part II relates to death duties and exempts certain small estates up to £500 from estate duty, grants further exemptions from gift duty, and contains provisions regarding marginal rates of duty. Part III relates to Soil Conservation and Rivers Control Act, 1941. It provides that completion of works is not to affect classification for rating in certain cases, and empowers Catchment Boards to provide dwellings for their employees. Part IV deals with miscellaneous matters affecting local authorities and public bodies. It authorizes local authorities to grant free travel to disabled servicemen, to expend moneys on establishment and maintenance of war memorials, to contribute towards Flood Relief Funds for Great Britain, and to continue certain payments under superannuation schemes. Part V consists of miscellaneous provisions, including the abolition of the income qualification for entry to the National Provident Fund, the reconstitution of certain licensing Districts and Committees, and minor amendments to the Wool Disposal Act, 1945.
The Public Works Amendment Act, 1947, enables certain highways to be declared motor-ways for the use of fast-moving traffic, imposes restrictions as to poles and other structures on motor-ways, and makes provision for access, maintenance, and control of motor-ways.
The Rabbit Nuisance Amendment Act, 1947, establishes the Rabbit Destruction Council with functions to investigate the extent of the rabbit nuisance in New Zealand, to devise and promote measures for the purpose of destroying rabbits, and to co-ordinate and generally guide and supervise the activities of Rabbit Boards. Grants may be made to Rabbit Boards for the destruction of rabbits, while a levy is imposed on rabbit-skins sold in New Zealand. The powers of Rabbit Boards are further increased for the purpose of destroying rabbits.
The Samoa Amendment Act, 1947, gives effect to a Trusteeship agreement for Western Samoa approved by the General Assembly of the United Nations. It provides for the appointment of a High Commissioner and a Deputy High Commissioner for Western Samoa. A Council of State is established which is to consist of the High Commissioner and of the Samoans holding the office of Fautua, who may be appointed from time to time by Order in Council. The Act also establishes the Legislative Assembly for Western Samoa which is empowered to make Ordinances for the peace, order, and good government of the country, provided that any such ordinance is not repugnant to the New Zealand Acts and regulations. The Assembly consists of the Samoan members of the Council of State, eleven other Samoan members, not more than five elected European members and not more than six official members.
The Rehabilitation Amendment Act, 1947, defines the term “child” for the purposes of the Act, appoints the Commissioner of Works to be an additional member of the Board, extends the power to assist servicemen's widows, provides for trade training and related financial assistance for discharged servicemen of His Majesty's Forces (other than Now Zealand Forces), and that Members of the General Assembly are not to be disqualified by the receipt of a subsidy on wages of a trainee under the principal Act.
The Control of Prices Act, 1947, constitutes the Price Tribunal, consisting of a President, one or more ordinary members, and one or more associate members, the general duties and functions of the Tribunal being to fix prices for goods and services, to investigate any complaints that may be made direct to the Tribunal or that may be referred to it by the Minister in respect of the prices of any goods or services, to maintain a survey of the prices of goods or services, to institute proceedings for offences in relation to prices, and to take such other steps as may be necessary to prevent profiteering or the exploitation of the public. The Tribunal is given the power to make price orders fixing the actual or the maximum or the minimum prices that may be charged or received for any goods to which any such Order relates. Part III of the Act contains provisions relating to prices of goods and services which are not for the time being subject to a price order or to a special approval, and determines the maximum prices of such goods. Part IV relates to offences and penalties and covers profiteering, blackmarketing, hoarding, failure to give evidence, sales and purchases otherwise than at the fixed price, sales of goods of which prices are fixed together with other goods, aiding and abetting. &c. The Act also gives power to the Tribunal to prohibit the sale of declared classes of goods pending fixation of prices, brings hire-purchase agreements within its purview, covers services as well as goods, and provides that statements of charges for services and increased prices for goods are to be displayed in certain cases.
The Health Amendment Act, 1947, abolishes the Mental Hospitals Department, sets up in its place a separate division of the Health Department for the control of mental hospitals, and provides for the appointment of a Director of the Division of Mental Hygiene.
The Education Amendment Act, 1947, provides for several miscellaneous amendments of a minor nature to the Education Act, 1914.
The Milk Amendment Act, 1947, provides for the constitution of District Milk Boards in certain cases, and endows them with the powers and functions of a Metropolitan Milk Board. A Milk Authority may acquire and hold shares in any company formed for treatment of milk. Also included are provisions designed for the protection of rehabilitation loans to roundsmen, and imposing certain restrictions on the right to sell a milk round.
The Superannuation Act, 1947, is a consolidation and amendment of the law relating to superannuation. It constitutes the Government Superannuation Board and abolishes the separate Boards hitherto functioning—namely, the Public Service Superannuation Board, the Teachers' Superannuation Board, and the Government Railways Superannuation Fund Board—and establishes a Fund called the Government Superannuation Fund, while the former separate funds are abolished and their moneys, &c., transferred to the Fund established by the Act. Part II deals with Government Service superannuation. There are various provisions relating to election by an employee to become a contributor. Contributions to be deducted from salary are made on a sliding scale ranging from 5 to 10 per cent. of salary, commencing at 5 per cent. where the age of the contributor does not exceed thirty years at the commencement of his contributory service, and increasing by steps of 1 per cent. for each five-yearly increase in age until a rate of 10 per cent. is reached where the age then exceeds fifty years. The retiring-allowance in general is computed as follows: for every year of contributor's contributory service he shall receive a sum equal to 1/120 of his annual salary increased by an amount equal thereto, but in no case is this subsidy to exceed £300 or to be less than £3 15s. for each year of contributory service. Other provisions are concerned with the retiring-allowances when a contributor becomes medically unfit, defines annual salary for the purpose of computing retiring-allowances, and provides that the Act shall apply to the Cook Islands Public Service, Samoan Public Service, Police Force, Education Service, and Employees of Service Organizations. Part III of the Act deals with the Superannuation of members of the Armed Forces, including provisions as to previous contributory service otherwise than in His Majesty's Forces. Part IV relates to the superannuation of Magistrates and Maori Land Court Judges and contains special provisions as to age, contributory service, &c., in respect of retiring-allowances. Part V provides for parliamentary superannuation, contributions from members being at the rate of £50 a year, subject to the proviso that when a member commences to receive a retiring-allowance and his contributions are less than £250, at that time, he is to pay the deficiency into the Consolidated Fund within such time and in such manner as the Minister may allow. Retiring-allowances are computed at the rate of £250 a year for the first nine years of service and £25 a year for each year of service in excess of nine years, with a maximum rate of £400 a year. General provisions of the Act include those for actuarial examinations of the Fund, for annual subsidies from the Government, and for reciprocal arrangements with other British Commonwealth countries.
The Workers' Compensation Amendment Act, 1947, provides for workers' compensation insurance to become, with certain exceptions, a monopoly of the Branch of the State Fire Insurance Office known as the Government Accident Insurance Office. An automatic indemnity of every employer who employs a worker to whom the principal Act applies is provided for, as well as the compulsory payment of premiums by employers. There are provisions relating to notifications of accidents and of claims, accident prevention, and the occupational training of seriously disabled workers. A further part of the amendment increases the maximum amount of compensation payable in respect of the death of a worker to a total of £1,500 (exclusive of any weekly payments in addition to that payable on death up to a maximum of £250), increases the maximum weekly payment in the event of incapacity to £5 10s., and provides also for increase in the rate of compensation for permanent physical injuries. The application of the principal Act is extended to cover cases of accidents to the crew of a New Zealand aircraft and to workers travelling to and from work. The cost of artificial limbs, &c., is an additional liability of the employer, this being limited to £50 or the initial cost, whichever is the greater. Other provisions cover the conveyance of injured workers, expenses of meals and lodging incurred, the determination of dependency as at the date of death, and that an “action” may be taken against the Crown.
The Maori Purposes Act, 1947, provides for the alteration of the term “Native” to “Maori” in all acts, regulations, &c. There are also several miscellaneous amendments of the law relating to Maoris. Other sections entitle any person charged with an offence before a Tribal Committee to elect summary trial under the Justices of the Peace Act, 1927, and extend the jurisdiction of the Maori Land Court to make exchange, partition, and trusteeship orders in respect of land about which a succession order has been made in favour of Europeans. Also contained in the Act are provisions relating to the incorporation of owners of the Mangatu Blocks and administration of the affairs of the corporate body, and conferring certain powers and validating certain transactions relating to Maori lands.
The Statutes Amendment Act, 1947, contains various amendments of a variety of statutes. Section 4 provides that employment for the purposes of the Annual Holidays Act, 1944, may be deemed to be continuous if a worker is dismissed and re-employed within one month, while section 5 makes it an offence to buy a holiday card at a discount. Section 7 increases the value of furniture, &c., which a bankrupt may select or retain from £50 to £100. Section 8 extends the powers of the National Broadcasting Service. Section 13 removes the limit which the Court can award for the maintenance of children under the Destitute Persons Act, 1910, while section 15 extends the provisions of the Family Protection Act, 1908, to adopted children and grandchildren. Section 20 confers authority to prohibit the importation of things likely to prove injurious to any timber or forest. Section 28 authorizes the making of rules to confer on certain Registrars of the Supreme Court some of the jurisdiction and powers of a Judge sitting in Chambers. Sections 31 to 34 authorize the making of special rates by Land Drainage Boards for certain purposes, while sections 52–56 confer similar powers on River Boards. Section 42 suspends the levy on meat exported from New Zealand and provides that, while this suspension is in force, there shall be paid to the Meat Producers' Board out of moneys in the Meat Industry Account such sums as may be appropriated by Parliament for the purpose. Section 48 makes it an offence to use the emblem, seal, or name of the United Nations for trade or business purposes. Section 63 increases the minimum rates of pay for shop-assistants, and sections 71 and 72 authorize the setting-up of additional War Pensions Boards and War Pensions Appeal Boards.
The Air Force Amendment Act, 1947, establishes the Air Training Corps and Women's Auxiliary Air Force as part of the Royal New Zealand Air Force, and empowers the Minister of Defence to authorize the Air Force to operate aircraft for hire or reward.
The, Fair Bents Amendment Act, 1947, provides that the basic rent is not to be affected by variations in tenancies as to furniture, &c., or by subletting, makes provision for the keeping of tenancy registers, prohibits the imposing of any fine or premium for the granting of any tenancy or for renewal or transfer of a tenancy, provides for recovery of possession of a dwellinghouse for a serviceman who vacated it to become a serviceman, defines the cases in which subletting is deemed to be consented to by the landlord, and modifies the absolute protection of a serviceman tenant. Part II of the Act covers the letting of unoccupied houses, including provisions that a local authority may require owners of such houses to let them, and that on default by the owners the State Advances Corporation may let an unoccupied house. Power is given to enter and inspect premises for the purposes of that Part of the Act dealing with unoccupied houses.
The Patriotic and Canteen Funds Act, 1947, provides for the administration of moneys raised during the Second World War for patriotic purposes and of the surplus profits of service canteens. The New Zealand Patriotic Fund Board is accordingly constituted to administer on a national basis certain funds for the benefit of discharged servicemen and their dependants and the dependants of deceased servicemen who are sick, disabled, unemployed, or otherwise in need. Provincial Patriotic Councils are also set up which are to administer certain other funds for similar purposes in their own localities. The Canteen Fund Board is also constituted, consisting of those members of the New Zealand Patriotic Fund Board representing the discharged servicemen's organizations. This Board is charged with the administration of the surplus profits of service canteens for the benefit of discharged servicemen, their dependants, and the dependants of deceased servicemen.
The Land Laws Amendment Act, 1947, contains several miscellaneous amendments to the law relating to Crown and other lands. In respect of small farms under the Small Farms Act, 1932–33, any serviceman or discharged serviceman may make application for a review of liabilities to which this Part of the Act applies, the review of determination being made by the Land Settlement Board, with a right of appeal to the Land Sales Court. On such appeals being made the Court is to determine the basic value, and adjust rents and mortgages given for value of improvements, agreements for sale and purchase, and mortgages on restricted freehold titles, as the case may be. There are also amendments relating to land subdivision in counties, public reserves, domains, national parks, and swamp drainage, including authorization of the use of certain domain land as sites for caretakers' residences.
The Supply Regulations Act, 1947, authorizes the making of regulations for purposes connected with the maintenance, control, and regulation of supplies and services. Certain emergency regulations are continued in force as supply regulations including Building, Electricity, Export Prohibition, Factory, Foodstuffs, Oil Fuel, Rationing. Sugar, and Timber Emergency Regulations, &c. The Act is to expire on the 31st December, 1948.
The Emergency Regulations Continuance Act, 1947, continues in force certain regulations made under the Emergency Regulations Act, 1939, revokes all other emergency regulations, and abolishes the power to make further emergency regulations. The regulations continued in force by the Act, are to continue in force until 31st December, 1948, unless they are sooner revoked.
A brief synopsis of the more important public Acts passed by the General Assembly during the 1948 session, which ended on the 8th December, 1948, is now given,
The General Agreement on Tariffs and Trade Act, 1948, deemed part of the Customs Act, 1913, authorizes the approval of the general Agreement on Tariffs and Trade (the text of which is set out in the First Schedule to the Act). Provision is made therein for the operation of duties and exemptions. It gives power to apply any or all of the duties and exemptions provided for in the Act and to cease application of duties or exemptions. Surtax is abolished on a number of articles as from a date to be notified by Proclamation, while there are certain other detailed alterations to the New Zealand Customs Tariff in respect of countries entitled to preferential tariffs and most favoured nation tariffs.
The Fertilizers Amendment Act, 1948, extends the definition of the term “manufacture” to include packing for sale, &c., and prescribes a penalty for selling fertilizer not up to standard.
The Scaffolding and Excavation Act, 1948, applies the provisions of the principal Act to the stacking of timber and to cover local authorities; amends certain definitions; provides that regulations may be made to cover installation in buildings of safety devices for protection of window-cleaners; and states that the principal Act shall bind the Crown.
The Post and Telegraph Amendment Act, 1948, amends the method of acknowledgment of Post Office Savings-bank deposits, and deals with offences in relation to misuse of telephones.
The Government Life Insurance Amendment Act, 1948, provides for loans to officers of the Department for acquisition of dwellings, and for the Government Insurance Commissioner to acquire dwellings for accommodation of staff.
The Westport Coal Company Act, 1948, provides for the vesting in the Crown of all privately-owned shares in the company and payment therefor, and for the dissolution of the company.
The Shipping and Seamen Amendment Act, 1948, amends the provisions relating to certificates and to the carriage of certificated officers and of deck cargo, the general business of Superintendents, the preliminary inquiries on occurrence of a shipping casualty, determination of disputes as to salvage, and exempts small fishing-boats from certain provisions. It also provides for recovery by seamen of the difference between wages paid and wages fixed by award and amends the provisions as to payments to seamen discharged on account of illness. The deportation of deserters is also provided for.
The Fisheries Amendment Act, 1948, increases maximum penalties for offences, and makes provision as to evidence of boundaries, apprehension of offenders, and forfeiture, while it further limits the use of explosives to catch or destroy fish.
The Civil Aviation Act, 1948, provides for the regulation of civil aviation and gives effect to the Convention on International Civil Aviation signed at Chicago on 7th December, 1944. Special powers are given in the case of national emergency, while other sections deal with nuisance, trespass, and responsibility for damage; penalties for dangerous operation of aircraft; wreck and salvage; investigation of accidents; and provide for the appointment of the Director of Civil Aviation. The Act applies also to the Cook Islands, Western Samoa, Tokelau Islands, and other territories subject to the protection, trusteeship, or authority of the Government of New Zealand.
The British Nationality and New Zealand Citizenship Act, 1948, provides in Part I that a New Zealand citizen or citizen of any of the other Commonwealth countries (viz., the United Kingdom and Colonies, Canada, Australia, the Union of South Africa, Newfoundland (since merged with Canada), India, Pakistan, Southern Rhodesia, and Ceylon) will have the status of a British subject and may be known either as a British subject or as a Commonwealth citizen. Provision is made for the continuance of certain Irish citizens as “British subjects.” Part II of the Act deals with New Zealand citizenship, and provides for acquisition of this by birth or descent, by registration, by naturalization, or by incorporation of territory. It also contains transitional provisions and provides for renunciation and deprivation of citizenship. At the date of the Act coming into force, New Zealand citizenship is automatically conferred upon the following classes of British subjects: (1) those born in New Zealand, (2) those naturalized in New Zealand, (3) those ordinarily resident in New Zealand and who have been so resident for at least one year immediately prior to the commencement of the Act, (4) those whose fathers were British subjects born or naturalized in New Zealand, (5) women (being British subjects) married before the commencement of the Act to men who become citizens under the various provisions of the Act. After the date of commencement of this Act New Zealand citizenship may be acquired by birth in New Zealand (except where the father is a foreign diplomat or an enemy alien and the birth occurred in a place then under occupation by the enemy); by descent—that is, when the father is a New Zealand citizen and the birth occurs outside New Zealand (with certain restrictions); by registration, where ordinarily resident for at least one year or if in the Crown service under the New Zealand Government; by naturalization, which is, of course, subject to the possession of the requisite qualifications; and by incorporation of territory as part of New Zealand. Renunciation of citizenship may be for reasons of dual citizenship or nationality, while deprivation of citizenship may be ordered by virtue of naturalization in a foreign country, or because of certain events, or where a naturalized person who was a citizen of another Commonwealth country had been deprived of that citizenship on similar grounds. Part III of the Act deals with supplementary provisions, including those relating to legitimated and posthumous children, powers of discretion of the Minister or overseas representative, evidence, power to make regulations, offences, applications of the Act to the Cook Islands, Western Samoa, and Tokelau Islands, and repeals of earlier legislation.
The Land and Income Tax (Annual) Act, 1948, fixes the rates of land-tax and income-tax for the tax year commencing on 1st April, 1948. The rates were the same as in the previous year, but in the case of income-tax a rebate of £10 from the tax payable, or the amount of tax where this was less than £10, was provided for. Provision for relief was also made in cases where the taxable income was less than £400 and consisted wholly or partly of unearned income.
The Harbours Amendment Act, 1948, provides for the appointment of additional members of Harbour Boards to represent workers in the waterfront industry, increases the annual allowance to the Chairman of a Harbour Board to a rate not exceeding £300 per annum, and establishes an Appeal Board to determine appeals against disciplinary action, &c., taken against employees.
The Gaming Poll Act, 1948, authorized the taking of a special poll of electors on the proposal for establishing a system of off-course betting on horse-races.
The Justices of the Peace Amendment Act, 1948, amends the principal Act as regards procedure on summary trial in respect of indictable offences.
The Trades Certification Act, 1948, establishes a Trade Certification Board to make provision for the examination of persons practising or intending to practise any trade who desire from time to time to present themselves for examination, and to grant or issue certificates or diplomas in recognition of proficiency in any trade, &c.
The Apprentices Act, 1948, consolidates and amends the law relating to apprentices. The principles of the earlier legislation have not been altered, most of the new amendments referring to the composition, &c., of committees or to machinery measures. Minor additions have been made to the law applicable when an apprentice loses his employment through the insolvency of his employer.
The Friendly Societies Amendment Act, 1948, amends the qualifications as to the registration of societies, increases the maximum annuity payable to members, authorizes loans by societies and branches to members on personal security, and amends provisions as to special resolutions.
The Tokelau Islands Act, 1948, declares these islands to form part of New Zealand and provides machinery for promoting peace, order, and good government therein.
The Cook Islands Amendment Act (No. 2), 1948, amends the principal Act by prescribing penalties for unlawful entry of a dwellinghouse by night, and for threats to do bodily harm. It also removes the former limit of maintenance orders.
The Mining Amendment Act, 1948, provides that the royalty payable on mineral licences is to be based on weight or quantity, restricts the right of renewal of mining licences, and requires the consent of the Minister to grants of mining privilege over land affected by a coal-mining right. It also provides that hours of work underground are not to exceed seven hours per day, while other provisions restrict the employment of youths underground and prescribe the age and experience of miners placed in charge of places, &c.
The Aliens Act, 1948, in Part I deals with the status of aliens, British protected persons, and Irish citizens, their capacity as to property, and further provides that they shall be triable in the same manner as if they were British subjects. Part II provides for the registration of aliens and the keeping of a register of aliens. All aliens are required to apply for registration and to notify any change of name, abode, or occupation. The Act also empowers the Minister to order undesirable aliens to leave New Zealand, and to order the arrest and detention of aliens under order of deportation.
The Patriotic and Canteen Funds Amendment Act, 1948, amends the provisions as to officers of the New Zealand Patriotic Fund Board and Canteen Fund Board, and authorizes the Boards to make provision for superannuation of officers or servants employed by them.
The Nassella Tussock Amendment Act, 1948, amends the principal Act in regard to the power to raise moneys for work to be carried out, provides for the remuneration of the Chairman of a Board, and gives power to the Minister to acquire lands for the purpose of controlling nassella tussock.
The Veterinary Services Amendment Act, 1948, alters the constitution of the Veterinary Services Council, provides that the Council is to hold annual meetings of delegates of certain farmers' veterinary clubs and associations, and transfers to the Council the rights and liabilities of the Crown under existing agreements with students for training in veterinary science.
The Dairy-produce Amendment Act, 1948, provides for the reconstitution of the New Zealand Dairy Board, amends the provisions in regard to the election of members, and amends the provisions as to the exercise of the Board's functions.
The Electricity Amendment Act, 1948, with reference to rural electrical reticulation, defines an electricity agreement or agreements, provides for registration of an agreement against the title of owner or lessee to land, for registered electricity agreements to run with the land, and for moneys payable under a registered electrical agreement to be made a charge on the land. It also extends the power to make regulations under section 319 of the Public Works Act, 1928, in several ways.
The Finance Act, 1948, relates to a variety of matters affecting public finance, including power to issue stock to pay the liability to the Reserve Bank due to the alteration in the exchange rate, abolishes overseas-passenger duty and the export duty on uncoined gold, reduces sales tax on omnibuses and tram-cars to 10 per cent., and extends the time for application for refunds of duty on motor-spirits from two to four months. It also makes allowance for rates in determining the final balance of estate in respect of death duties and exempts gifts to the United Nations appeal for children from gift duty.
The Tuberculosis Act, 1948, provides for notification of tuberculosis by medical practitioners, and by a master of a ship in harbour, in addition to notification of intended discharge of a tuberculosis person from an institution, and of the death of a person affected with this disease. It outlines the duties and powers of Medical Officers of Health in respect of this complaint, and the functions of Hospital Boards thereto, including informing patients of precautions necessary to prevent spread of infection and the furnishing of prescribed information. In certain cases provision is made for the isolation of persons likely to spread infection together with conditions governing appeals against this provision. A further part of the Act is concerned with assistance to persons suffering from tuberculosis, such as vocational guidance or training, industrial rehabilitation courses, special accommodation, and the right to compensation of certain workers contracting tuberculosis.
The Coal Act, 1948, vests all privately-owned coal in the Crown, subject to the payment to the owners of compensation as assessed by the Coal Valuation Commission established by the Act. Prospecting or mining for coal is prohibited except pursuant to a lease or licence under the Coal-miners Act, 1925. Coal-mining rights may be granted except over land held for State coal-mines and subject to certain other conditions. Persons injuriously affected by mining operations are entitled to compensation. Other provisions give power to the Minister to generate and supply electrical energy and to acquire and dispose of shares or stock in companies.
The Economic Stabilization Act, 1948, has as its general purpose the promotion of the economic stability of New Zealand. The Minister of Industries and Commerce is charged with the general administration of the Act, and in addition has the general function of doing all things that he deems necessary or expedient for the general purpose of the Act, and in particular for the stabilization, control, and adjustment of prices of goods and services, rents, other costs, and rates of wages, salaries, and other incomes. Provision is made for the appointment of a Director of Stabilization and the establishment of the Economic Stabilization Commission, the principal function of the latter being to make recommendations to the Minister, after inquiry and investigation, in relation to the economic stabilization of New Zealand and the functions of the Minister under this Act. Power is also given for regulations to be made by Order in Council, while certain Emergency Regulations are continued in force as Stabilization Regulations.
The Public Works Amendment Act, 1948, extends former legislation so that all local districts may have access-ways or service-lanes. Power is given for their declaration as such, for their construction, and for power to take land for the purpose of creating them, in addition to other provisions affecting access-ways and service-lanes. Part II comprises a collection of independent provisions designed to save unnecessary work within the Ministry of Works and accelerate the completion of transactions, to protect the Crown's interests or facilitate the handling of the Crown's business by simpler or safer methods than those now employed, to ensure greater road safety, and to ensure that the public rights on roads and streets are not whittled down. Accordingly, there are sections relating to the construction of dividing strips, cycle-tracks and footpaths, the taking and closing of roads and streets, gates across roads, expired irrigation agreements, and registered irrigation charges. Finally, at the request of the Main Highways Board, the Governor-General may from time to time by Order in Council (a) authorize the construction of a motor-way, and state as nearly as possible the line of the motor-way, and the two termini thereof, (b) declare any land or any public highway, whether then actually constructed as a motor-way or not, to be a motor-way.
The Soil Conservation and Rivers Control Amendment Act, 1948, contains certain machinery measures and also widens the powers of the Soil Conservation and River Control Council and of the Catchment Boards.
The Rangitaiki Land Drainage Amendment Act, 1948, amends section 6 of the principal Act as to classification of lands and providing for a right of appeal against classification. It gives power to levy additional rates in respect of new works.
The Swamp Drainage Amendment Act, 1948, provides that lands may be included or excluded from a drainage area, provides for constitution of special subdivisions, and gives power to levy additional rates in respect of new works.
The Forest and Rural Fires Amendment Act, 1948, provides that a Fire Authority may act in an adjoining area where there is no Fire Authority. The owner of every exotic forest shall, as far as is reasonably practicable, provide and maintain at least two safe alternative routes whereby persons engaged in any forest or industrial operations may escape from the forest in the event of fire therein. The powers of Fire Officers, who may be in certain instances Conservators of Forests, are widened and include refusal to grant permits to light fires, and determination and apportionment of costs of fire-fighting in certain circumstances.
The Family Benefits (Reciprocity with Great Britain) Act, 1948, and the Family Benefits (Reciprocity with Northern Ireland) Act, 1948, provide for reciprocity with the countries named in relation to family benefits. Residence or birth in these countries is to be treated as residence or birth in New Zealand for the purpose of claiming family benefits.
The Public Holidays Amendment Act, 1948, provides that when Christmas Day and New Year's Day fall on Saturdays and where provision is made in any Act, award, or industrial agreement for the granting of a holiday, or for the observance of certain hours of labour, or the payment of certain wages (a) on Saturdays or Sundays, those provisions apply without modification to 25th and 26th December, and 1st and 2nd January; (b) on Christmas Day and New Year's Day, those provisions apply without modification to the succeeding Mondays, and in respect of Boxing Day and 2nd January, without modification to the succeeding Tuesdays. There are similar provisions concerning anniversary days. Where in any Act, award, or industrial agreement provision is made for the transfer of the granting of a holiday, or for the observance of certain hours of labour, or for the payment of certain wages on Anzac Day to any other day instead of that day, the provision is declared inoperative except in cases of provisions permitting or requiring an employer to grant a holiday on any other day instead of Anzac Day where the worker is required to work on Anzac Day at ordinary rates of wages.
The Transport Law Amendment Act, 1948, makes Part II of the Transport Licensing Act, 1931, apply to harbour-ferry services. It also establishes the Transport Co-ordination Council with functions of inquiring into, reporting on, and making recommendations concerning such matters as the Minister may refer to it, and to institute of its own motion inquiries into and making recommendations in respect of any matter affecting public transport of any kind. A special committee (known as the Transport Charges Committee) is established to fix, review, or alter the charges for the carriage of passengers or goods (including mails), or the letting of motor-vehicles on hire, by any transport service. In addition, the amendment sets up a Transport Charges Appeal Authority. The detailed requirements in regard to applications to fix road and ferry charges are also given, as well as conditions governing appeals and appeal procedure. General provisions are laid down as to the fixing of charges by the Committee or Appeal Authority. It revokes the Goods-service Charges Tribunal Emergency Regulations. Miscellaneous provisions include the requirement for goods-service vehicles to carry a certificate of fitness, giving the Licensing Authority power to prescribe additional conditions in granting taxi-cab licences and passenger-service licences, and extending the list of persons entitled to appeal against the decision of any Licensing Authority to include the Director of Stabilization and the Director of Rehabilitation. Part II of the 1948 amendment relates to the Motor-vehicles Act, 1924, and amends the definition of motor-vehicle and trailer, those provisions dealing with driving by unlicensed persons, and the duties of motor-drivers in cases of accidents. It prescribes a penalty for driving while disqualified and revokes the licences of mentally defective persons. Regulations may be made fixing temporary speed-limits where there is risk of injury or damage.
The Child Welfare Amendment Act, 1948, makes provision for the care and disposition of immigrant children, and also contains miscellaneous amendments to the principal Act.
The Servicemen's Settlement and Land Sales Amendment Act, 1948, provides that Crown land held under lease or licence may be taken for settlement of discharged servicemen; amends provisions as to the repayment of mortgages affecting land taken; applies Part III of the principal Act to leases in mining districts and to certain mining privileges; and authorizes mortgagees to apply for provisional consent to sales or leases.
The Land Valuation Court Act, 1948, establishes the Land Valuation Court and Land Valuation Committees and abolishes the former Land Sales Court and Land Sales Committees. The jurisdiction of the Land Valuation Court includes claims for compensation under the Public Works Act, 1928; applications and objections under the Servicemen's Settlement and Land Sales Act, 1943; objections to valuations under the Valuation of Land Act, 1925 (replacing the Assessment Courts); and appeals against valuations of land for death duty, gift duty, and stamp duty purposes. Various provisions as to constitution, procedure, &c., are also included.
The Armed Forces Canteen Act, 1948, constitutes the Armed Forces Canteen Council and provides for the establishment of canteens and other amenities for the benefit of the Armed Forces.
The Apple and Pear Marketing Act, 1948, establishes the New Zealand Apple and Pear Marketing Board and abolishes the Fruit-export Control Board established under the Fruit Control Act, 1924. The principal functions of the Board are to acquire and market apples and pears grown in New Zealand or imported into New Zealand, to determine the prices which it is to pay therefor, and to exercise and perform such functions, powers, and duties in relation to the marketing of apples and pears in New Zealand or elsewhere as are conferred upon it by the Act. It is a function of the Board to report to the Minister from time to time concerning trends and prospects in overseas markets in respect of apples and pears and concerning movements in costs or prices, or other factors likely to prejudice the economic stability of the apple and pear growing industry. Provision is made in the Act for the determination and declaration of the standard cost of production of apples and pears and for the average price to be paid to growers. In determining the average price, regard is to be had to the desirability of offering incentives to growers to produce better-quality fruit, to any variation in the quantities of fruit likely to be produced in any particular district or season, to trends in local and overseas markets, and to the promotion of the general economic stability of New Zealand. Previous regulations on this matter are also revoked.
The Marketing Amendment Act, 1948, abolishes the three separate Divisions of the Department, and extends the Department's powers to by-products and food processing, &c.
The Dairy Products Marketing Commission Amendment Act, 1948, defines dairy-produce and deals with the functions and powers of the Commission in respect of dairy-produce other than butter or cheese.
The Forests Amendment Act, 1948, provides that areas within a State forest may be reserved as sanctuaries for the preservation of indigenous flora and fauna, abolishes the State Forests Account, empowers the Crown to acquire and dispose of shares in companies, prohibits the importation of any tree, tree-seed, timber, or timber product that may prove injurious, and prohibits the export of similar commodities which do not comply with export requirements as to grading, &c.
The Public Trust Amendment Act, 1948, abolishes the Public Trust Office Board, prohibits the Public Trustee from accepting any joint appointment, and repeals sections rendered obsolete by the 1946 amendment to the Public Service Act, 1912.
The Hospitals Amendment Act, 1948, alters the title of the principal Act (and amending Acts) from the Hospital and Charitable Institutions Act, 1926, to the Hospitals Act, 1926, &c. It also provides for the appointment of committees of management in amalgamated (hospital) districts, with such powers as may be vested in them by Order in Council and which may be exercised by the committees on behalf of the Board subject to the conditions and restrictions imposed. The amendment also provides that Hospital Boards may establish children's nurseries.
The Town-planning Amendment Act, 1948, transfers the town-planning activities from the Internal Affairs Department to the Ministry of Works, and extends the powers of local authorities as to enforcement of schemes. The Minister of Works has power to require a local authority to prepare and submit a scheme for approval in cases of default by the local authority or may himself cause a scheme to be so prepared and submitted. This can also be arranged by agreement with a local authority. Subject to approval by the Minister, a local authority may acquire land for the purposes of the scheme. The principal Act is amended as to those cases in which compensation is not payable.
The Municipal Corporations Amendment Act, 1948, widens the powers of Borough (and City) Councils in various ways, principally in connection with housing matters, such as guarantees by Councils of portions of mortgages granted for housing purposes, provision of advances for housing loans, the acquiring and subdividing land for this purpose, &c. Power is given to deal with ruinous and dilapidated buildings and to permit the use of streets for exhibitions, fairs, &c. The powers of two or more Councils to take joint action in certain matters are also widened. It also provides that Councils may continue to operate schemes for primary production and pig-farms established under emergency regulations.
The Education Reserves Amendment Act, 1948, contains amended provisions relating to the sale or exchange of school sites, the powers of Trustees of high schools, the sale of lands by Trustees, the application of proceeds of land sold, and for vesting of land in any University, &c., for educational purposes.
The Trustee Savings Banks Act, 1948, consolidates and amends the law relating to trustee savings-banks.
The Valuers Act, 1948, provides for the registration of public valuers. It constitutes the Valuers Registration Board, provides for the incorporation of the New Zealand Institute of Valuers, specifies the qualifications required for registration, confers certain disciplinary powers on the Board, and provides that no member of the Institute shall be entitled to act as a valuer unless he is in possession of an annual practising certificate.
The Land Act, 1948, consolidates into one Act and amends the various statutes relating to the lands of the Crown, such as the Land for Settlements Act, 1925, the Small Farms Act, 1932–33, and others, while the Discharged Soldiers Settlement Act, 1915, the Hutt Valley Lands Settlement Act, 1925, the Deteriorated Lands Act, 1925, and the Fruit-farms Settlement Act, 1910, are repealed and not re-enacted. It abolishes the distinction between Crown land subject to the Land Act, 1924, and other lands of the Crown subject to the Land for Settlements Act, 1925, &c. All such lands are to be administered under the 1948 Act. All Land Boards are abolished and their powers vested in the Land Settlement Board. To replace Land Boards, the Land Settlement Board is to appoint one or more Land Settlement Committees for each land district. These committees have no functions expressly set out, but the Land Settlement Board has wide powers of delegating to Committees any of its functions. All minerals on or under Crown land disposed of by way of sale or on any tenure are reserved to the Crown and a right of way is also reserved to the Crown for the purpose of working any such minerals. The owner or Crown tenant may use minerals for agricultural or other purposes on the land. Except in special cases, farm land or urban land may, at the option of the applicant, be purchased for cash or on deferred payments or may be taken on renewable lease for a term of thirty-three years, perpetually renewable and with a right of acquiring the fee-simple. Commercial or industrial land may be taken on renewable lease without the right of acquiring the fee-simple, or on lease for successive terms not exceeding fifty years in sum, and may in special cases be purchased for cash. Pastoral land may be taken on pastoral lease for thirty-three years perpetually renewable, but with no right of acquiring the fee-simple, or on pastoral occupation licence for a term not exceeding twenty-one years. With certain exceptions a lessee or licensee cannot transfer, sublease or mortgage his interest without the consent of the Board. In every lease or licence there are implied covenants that the lessee or licensee will farm the land in accordance with the principles of good husbandry. The holder of every renewable lease and, with certain exceptions, the holders of existing renewable leases and of leases in perpetuity may acquire the fee-simple at the value of the land as at the date of exercise of that right. The purchase-price is to be fixed by the Board, with right of appeal to the Land Valuation Court. Existing renewable leases and deferred-payment licences may be exchanged for tenures under the Act. Where the lessee does not accept renewal, the value of the lessee's improvements is payable to him by the incoming lessee. With certain exceptions, lessees and licensees may obtain a revaluation of the land. There are new provisions dealing with the limitation of the area which may be held.
The Carriers Act, 1948, deals with the liability of common carriers of passengers or goods by land or water—e.g., railways, road transport services and shipping companies—or any person engaged in the business of the carriage of passengers or goods by air for hire or reward who would, if that business were the carriage of passengers or goods by land, be common carriers. It provides for the liability of carriers of passengers for negligence causing death or personal injury and of carriers for negligence in the carriage of goods. Special contracts or conditions as to goods are not binding unless signed. The Act provides for limits of liability for goods unless the value had been declared and increased charges paid accordingly. The Act is to be read subject to other enactments affecting carriers and is also to bind the Crown.
The Education Amendment Act, 1948, establishes a Primary Teachers Appeal Board for each education district to deal with appeals against appointments. Other sections relate to the constitution of the governing bodies of secondary schools; provide for the control of Christchurch post-primary schools by the establishment of the Christchurch Post-primary Schools Board; extend the powers of University Colleges in connection with the provision of hostels, taking land for that purpose, sale of land, granting of leases, &c.; prescribe the powers of the governing body of combined schools; increase the honoraria to Chairmen of Education Boards; and place a restriction on the transfer of teachers within two years after receiving permanent appointment.
The Maori Purposes Act, 1948, includes provisions for the Public Service Commission to consent to the appointment of farm-managers; for the Member of the Executive Council representing the Maori Race to be a member of the Board of Maori Affairs; and that the powers of a Tribal Executive may be conferred on Tribal Committees in certain cases. There are, in addition, a number of miscellaneous provisions and one of a general nature validating payment by the Maori Trustee in respect of translation of the Bible into the Maori language.
The Social Security (Reciprocity with Australia) Act, 1948, gives approval to the reciprocity agreement set out in the Schedule of the Act. Part II relates to former residents of Australia and provides that residence or birth in Australia will be treated as residence or birth in New Zealand. Additional residential qualifications are given for eligibility to receive age, invalids', or widows' benefits, while a male must have attained the age of sixty-five years to receive an age-benefit. Part III covers persons temporarily resident in Australia, and states that this is not a disqualification for benefit. The Act also provides that a widow's benefit may be applied for where the husband is an inmate of a mental hospital in Australia. The following pensions, benefits, &c., are covered by the agreement: age-benefits and age-pensions; invalid pensions (including wives' and children's allowances) and invalids' benefits; widows' pensions and widows' benefits; child endowments and family benefits; unemployment benefits; and sickness benefits.
The Electoral Amendment Act, 1948, in Part I deals with Maori representation, including the registration of Maori electors, registration of a half-caste either as an elector of a Maori or a European electoral district, qualification of Maori electors and members, and the preparation of rolls for Maori electoral districts. Part II enables voting on declaration by persons becoming qualified after the issue of the writ, and provides for the inspection of declarations by scrutineers. A vote is not to be disallowed if the elector is qualified on polling-day, notwithstanding any irregularity in registration, while voting by elector's right in case of seamen is abolished.
The New Zealand National Airways Amendment Act, 1948, provides that air services within New Zealand are to be carried on only by New Zealand National Airways Corporation or pursuant to a permit or contract granted under this or the principal Act. Exemption from the above provision is granted to aero clubs provided that all persons carried, whether as pilots or passengers, are members of the aero club concerned. The conditions and other matters under which permits may be granted are also detailed. The principal Act is to bind the Crown. The Act also states that land may be taken for the Corporation under the Public Works Act, 1928.
The Licensing Amendment Act, 1948, establishes the Licensing Control Commission, the general functions of which are to supervise the activities of Licensing Committees in the performance of their functions, to prescribe standards to be complied with in the provision of accommodation services and other facilities in licensed hotels, to review from time to time the distribution of publicans', accommodation, tourist-house and wholesale licences throughout New Zealand, to determine which of these are unnecessary and the amount of compensation payable in respect of cancellations, to determine the number of new licences to be issued in each district and the situation thereof, to determine fair prices to be paid for new licences, and to grant club charters. The Act establishes the Licensing Fund into which are payable all moneys in respect of new licences issued and from which is payable compensation in respect of the cancellation or surrender of unnecessary licences. The Act also fixes the maximum number of each class of licence and provides that no new accommodation or New Zealand wine licences are to be granted. Further provisions relate to the questions to be submitted at local restoration polls and for the grant of licences where restoration proposals come into force, the consumption of liquor at social gatherings on unlicensed premises, and the penalties for sale of liquor at illegal times.
The West Coast Settlement Reserves Amendment Act, 1948, gives effect to certain recommendations made by the Royal Commission on the operation of the law relating to the assessment of rentals under leases of the West Coast settlement reserves.
The Tenancy Act, 1948, is a consolidation with amendments, of the Fair Rents Act, 1936, and Part III of the Economic Stabilization Emergency Regulations and their various amendments. Part II (as to rent restrictions) relates to dwellinghouses and to all leased properties (whether urban or rural) except that the definition of property has been amended so as to exclude farm properties leased for not less than two years (and therefore subject to Part III of the Servicemen's Settlement and Land Sales Act, 1943). This part prohibits any increase in rent above the basic rent, or above the fair rent if this has been fixed. Part III, which relates to dwellinghouses and urban properties (but not to agricultural properties), deals with the right of a landlord to recover possession from a tenant. Part IV repeats the provisions of Part II of the Fair Rents Amendment Act, 1947, as to the compulsory letting of unoccupied houses. Part V contains miscellaneous provisions. The main alterations to existing law are now briefly given. Rent is defined to include money's worth. The Court for fixing the fair rent of licensed premises is defined as the Land Sales Court or the Land Valuation Court. Rents Officers to exercise the functions of Inspectors of Factories under the earlier fair-rents legislation are to be appointed. The provision which prevented the original basic rent from being affected by the inclusion of furniture in the tenancy, &c., is extended to apply to all properties, while new provisions restore the original basic rent and deem any existing higher rent to be a fair rent in the case of properties other than dwellinghouses. The Court is empowered to fix the fair rent payable by the landlord where he is himself a tenant. The fair rent of licensed premises is not to exceed the basic rent under the Servicemen's Settlement and Land Sales Act, 1943. The method of determining the fair rent of flats and apartments is also new. Dwellinghouses are brought into line with urban properties by making a fair rent fixed for a dwellinghouse continue in force until superseded, instead of ceasing to have effect at the end of one year or when a new tenant occupies the premises. A landlord or outgoing tenant is prohibited from receiving from a new tenant other than specified considerations, while the time for recovery of excess payments is extended from six months to twelve months. In regard to recovery of possession, new provisions enable possession to be obtained of a dwellinghouse not reasonably required by the tenant, and enable an age-beneficiary who has owned a dwellinghouse for two years and any other landlord who has owned a dwellinghouse for five years to obtain possession of it for his own occupation without having to provide alternative accommodation or prove greater hardship, although the relative hardship of landlord and tenant will still be taken into account. A landlord is given the right to apply to the Court for an order for the recovery of excess land for building purposes, or for an order authorizing him to convert a dwellinghouse into flats, one to be let to the existing tenant. The special protection of servicemen and their families is to expire on the 31st March, 1949, or one year after the serviceman's discharge or death, whichever is the later. Restrictions on the letting or sale of premises when possession is recovered for the landlord's own occupation is extended from six months to two years. It is an offence for a landlord to evict a tenant without a Court Order or the tenant's consent. A new provision preserves a tenancy for the wife or husband of a tenant in cases of separation or desertion. A section gives the conditions to be implied in tenancies of dwellinghouses in the absence of express agreement in writing to the contrary, the conditions on which a tenant of any dwellinghouse or property holds the premises after the expiry or termination of his tenancy and provides for the acceptance of rent without waiving a notice to quit. Also new are the provisions enabling a short-term tenancy of the landlord's home during his temporary absence to be excluded from the Act by prior agreement approved by a Rents Officer, those relating to authorized occupiers, making it an offence for a landlord to deprive the tenant of his amenities, and requiring every landlord to give a detailed receipt for every payment of rent.
The Statutes Amendment Act, 1948, contains various amendments of different Acts, the more important of which are here referred to. Section 3 amends the provisions as to protection in cases of fraudulent preference by bankrupts. Section 4 provides that the Contributory Negligence Act, 1947, shall bind the Crown. Section 5 provides for the summary trial of persons charged with offences under the Control of Prices Act, 1947. Section 16 extends the powers of the Minister of Labour to consent to additional voluntary overtime in factories under certain conditions. Sections 21 to 24 contain amendments of the Industrial Conciliation and Arbitration Act, the principal of which are that the provisions of an award relating to rates of wages may have effect from a date prior to the award and that the time within which an action may be commenced for recovery of arrears of wages payable under an industrial agreement is extended from one to two years. Section 25 increases the number of Judges of the Supreme Court from nine to ten. Section 27 increases the amounts that a member of a local authority may contract with his local authority without incurring disqualification. Section 38 prohibits the use of the emblem, official seal, or the name of the United Nations without authority. Section 44 relates to applications by shopkeepers as to exemption from the prescribed closing hours, while section 47 provides that in assessing compensation no account is to be taken of any gain to dependants consequent on the death of a deceased worker.
The Finance Act (No. 2), 1948, relates to a variety of matters affecting public finance. Part I empowers the Government, in conjunction with the Government of the Common-wealth of Australia, to enter into an agreement with the Christmas Island Phosphate Co., Ltd., for the purchase of the company's phosphate mining rights and other property on Christmas Island; gives the Government power to invest in the Lake Grassmere salt project; extends the provisions of the Earthquake and War Damage Act, 1944, to cover damage by natural disaster; and permits the establishment of separate industry accounts within the Marketing Account. Part II relates to the Land and Income Tax Act, 1923. Specific matters covered relate to the exemption of sports bodies from income-tax, recovery of depreciation on disposal of assets, the keeping of business records, an extension of the exemption to cover a housekeeper caring for an invalid child, extension of the period for allowance of special depreciation, and power to waive publication of names of income-tax evaders who make full disclosure. Part III contains miscellaneous amendments to the Social Security Act, 1938, including the provision that the charge on income other than salary or wages shall be due and payable by equal instalments on 1st July and 1st November in the year following the financial year to which it relates. Part V contains various provisions in connection with the appointment to, and classification of, positions in the Government Railways. Part VI relates to the National Provident Fund and in particular establishes the National Provident Fund Account with the Reserve Bank, provides for the incorporation of the National Provident Fund Board, increases the rate of pensions to a maximum of £6 per week, and reduces the minimum age for contributors to superannuation schemes from twenty to seventeen years.
The Superannuation Amendment Act, 1948, extends the definition of Education service and Government service, and provides that a contributor may elect to contribute in respect of any prior part of continuous service. It also provides for election to contribute in respect of continuous service prior to previous contributory service. Section 28 of the principal Act is made applicable to the Armed Forces. Refunds of excess contributions on reversion in rank are provided for, as well as the exemption of older members of the regular Forces from compulsory contribution to the Fund. A further section deals with the provisions applicable on the death of a Magistrate or Maori Land Court Judge. There is also a saving right of certain contributors to count periods as part of their contributory service.
The Government Service Tribunal Act, 1948, provides for the establishment of a Tribunal to prescribe scales of salaries and conditions of service of officers of the Government Service, and for matters incidental thereto. In exercising its powers and functions the Tribunal is to have regard to the general purpose of the Economic Stabilization Act, 1948; the latest pronouncement made by the Court of Arbitration specifying standard rates of wages; such other considerations as the Court of Arbitration is for the time being required to take into account in making or amending an award under the Industrial Conciliation and Arbitration Act, 1925; the rates of remuneration, direct and indirect, and the working conditions generally prevailing in industry, and any changes in the cost of living. Principal orders may be made prescribing salaries or wages or scales of these for grades, divisions, and occupational classes of employees of the Public Service and for subdivisions of such categories; prescribing holidays, ordinary hours of work, and the period payable before overtime rates become payable; and the rates of remuneration for shift-work, night-work, overtime, travelling-time, &c.; prescribing minimum rates of pay for adult and for married employees; prescribing terms and conditions on which relieving, travelling, lodging, meal, and other allowances are granted and the rates of these; prescribing tool, clothing, and other allowances, and the terms on which industrial clothing may be issued. There are in addition various sections relating to procedure, applications, offences, &c.
The Supply Regulations Amendment Act, 1948, revokes certain Emergency Regulations as from the 3rd December, 1948, notably the Primary Industries, Sugar, Timber, and portion of the Supply Control Regulations. Other emergency regulations are to continue in force until the 31st December, 1949, unless revoked earlier.
The Emergency Regulations Amendment Act, 1948, revokes certain emergency regulations, lists others which were revoked by other enactments, and in a Third Schedule lists those still continued in force.
THE Island Territories Act, 1943, provided for the appointment of a Minister of Island Territories, to whom was transferred the functions in respect of island dependencies formerly vested in the Minister of External Affairs and the Minister of Cook Islands. The Minister is charged with the administration of the government of any territory out of New Zealand which may at any time be a dependency or trust territory of New Zealand, or otherwise be under the jurisdiction of the Government or Parliament of New Zealand. The territories coming within that category are the “annexed” Cook Islands (including Niue), which constitutionally are part of New Zealand; the trust territory of Western Samoa; the Tokelau or Union Islands, which, by agreement with the United Kingdom Government, were declared to form part of New Zealand as from 1st January, 1949; and the Ross Dependency, the administration of which is exercised by New Zealand on behalf of the United Kingdom Government. The Ross Dependency is uninhabited. Brief reference is also made in this section to Nauru, which is administered under a trusteeship held jointly by the United Kingdom Government, the Government of Australia, and the New Zealand Government.
The term “island territories” does not include Stewart Island and the Chatham Islands, which form part of New Zealand proper, nor the outlying islands included within the boundaries of New Zealand as proclaimed in 1847. These outlying islands, which are referred to on page 1 of this Year-Book, are Three Kings Islands, Auckland Islands, Campbell Island, Antipodes Islands, Bounty Islands, Snares Islands, and Solander Island. None of these outlying islands is regularly inhabited, although meteorological stations were established on the Auckland and Campbell Islands in 1940. The station in the Auckland group was closed in June, 1945, but a small staff still remains on Campbell Island maintaining meteorological records and conducting ionospheric research. A radio telegraph station is also established on Campbell Island. The Kermadec Islands are also excluded, for, although they are in the same category as the Cook Islands in that they rank as “annexed” islands, all New Zealand laws extend to them and there is no separate administration. A meteorological station and an aeradio station have been established on Sunday Island, and the population including the official staff at 31st March, 1948, numbered 28. This is the only island of the Kermadec Group that is inhabited.
COOK ISLANDS.—Descriptive—The Cook Islands were proclaimed a British Protectorate in 1888, and on 11th June, 1901, they were annexed and proclaimed part of New Zealand under the Colonial Boundaries Act, 1895. In considering the islands within the territory, a distinction can be made between the scattered islands in the north and the islands towards the south forming the Cook Group proper. Niue, though one of the Cook Islands, has been under separate administration since 1903, and data relating to it are given later in this section. Not including Niue, there are fifteen islands in the proclaimed territory, scattered over an area of some 850,000 square miles, and extending from Penrhyn, situated 9 degrees south of the Equator, to Mangaia, which is just north of the Tropic of Capricorn. The Group is bounded on the west and east by the 167th and 156th meridians of west longitude respectively, and on the north and south by the 8th and 23rd parallels of south latitude. The total land area of the fifteen islands is a little under 100 square miles, while Niue has an area slightly in excess of that figure.
Some of the islands of the Lower Group were discovered in 1773 by Captain Cook who first touched at Manuae. Rarotonga, Mauke, and Mitiaro, however, were not recorded by Europeans until 1823 when the Rev. John Williams of the London Missionary Society located them.
Of the islands of the Lower Group, Rarotonga, Aitutaki, Atiu, Mitiaro, Mauke, and Mangaia are elevated and fertile, while Manuae and Takutea and the islands of the Northern Group comprising Penrhyn, Manihiki, Rakahanga, Pukapuka, Palmerston, Nassau, and Suwarrow are sea-level coral atolls. As a consequence the southern islands support the greater population. With one exception, none of the islands possesses a good harbour.
The whole of the Group lies within the hurricane zone, and a number of destructive storms have been experienced, the most serious of which in recent years occurred in March, 1943, and in January, 1946. The whole area of the Cook Islands is now covered by a meteorological service with headquarters in Fiji, and advance warning of the intensity and path of tropical storms is available and enables precautions to be taken to protect life and property. From December to March the climate is warm and humid, and there is always the possibility of serious storms. In the remaining months of the year the climate of the Lower Group is mild and equable. The mean annual temperature in Rarotonga taken over the last thirty-seven years was 74.7° Fahrenheit, and the average yearly rainfall over the same period was 83.8 inches.
Rarotonga, the seat of the Cook Islands Administration, is well watered by creeks and streams, and all villages are supplied with water by means of a reticulation system. The other islands of the Group, both Southern and Northern, suffer from lack of streams and wells, but water is provided from public tanks, the number of which is being steadily increased.
Following is a brief description of the individual islands.
LOWER GROUP.—Rarotonga (16,500 acres), the most fertile island of the territory, rises to a height of 2,110 ft. It is clothed to the tops of the mountains with splendid vegetation, and has abundant streams, considerable tracts of sloping land, and rich alluvial valleys. The town of Avarua is the centre of the local administration and is 1,638 miles from Auckland. An airfield is in use.
Mangaia (17,500 acres, 110 miles from Rarotonga) is the south-easternmost of the Group. Mangaia is not as fertile as Rarotonga, but produces large quantities of coconuts, bananas, oranges, limes, other citrus fruits, &c. Mangaia is of volcanic origin and is surrounded by a barrier reef without passages. From a narrow sandy beach, the shore rises in high cliffs to a mile-wide plateau which descends again to almost sea-level, enclosing an ancient crater holding several volcanic mounds, the highest of which exceeds 550 ft. The crater drains by subterranean channels.
Atiu (6,950 acres, 116 miles from Rarotonga) resembles Mangaia in formation. It is a raised mass of coral, steep and rugged, except where there are small sandy beaches and some clefts. On the highest point of the central ridge coconuts, bananas, oranges, and coffee grow with the utmost luxuriance; and the kumera, one of the most valuable of South Sea vegetables, yields large crops.
Mauke (4,600 acres, 150 miles from Rarotonga) is a low circular island about two miles across, lying to the north-east of Rarotonga. Like Mangaia and Atiu, it is surrounded by an unbroken fringing reef. Mauke is very fertile.
Aitutaki (3,900 acres, 140 miles from Rarotonga) is about eighteen miles in circuit and one of the most fertile of the islands forming the Lower Group. It also has an airfield.
Mitiaro (2,500 acres, 142 miles from Rarotonga) is a good example of an elevated coral reef, thinly coated with sand and gravel of the same material. The greater part of the surface is not more than 6 ft. above high-water mark.
Manuae (1,524 acres, 124 miles from Rarotonga), consists of two small islands, Manuae and Te-Au-o-Tu, joined by a coral reef. The two islands are in general usage covered by the terra Manuae; the name Hervey Islands is an alternative but rarely used title.
Takutea (302 acres, 118 miles from Rarotonga) is a small coral island, moderately fertile, but is not regularly inhabited.
NORTHERN ISLANDS.—Penrhyn (2,432 acres, 737 miles from Rarotonga) is also known as Tongareva. It is one of the most famous pearl-islands in the Pacific, but of recent years, owing to changes in world fashions and in the success of pearl-culture, exports of pearl-shell and pearls have fallen to low proportions. The large lagoon with its two entrances affords the only land-locked shelter within the group for vessels other than fishing-boats, and it is the refuge of trading schooners during the hurricane season. As drought conditions sometimes exist, large concrete tanks have been built for the conservation of rain-water. Penrhyn also has an airfield.
Manihiki (1,250 acres, 650 miles from Rarotonga) is an atoll about thirty miles in circumference, valuable for the extent of its coconut groves. It also suffers on occasions from droughts, and is equipped with concrete water-tanks.
Pukapuka (1,250 acres, 715 miles from Rarotonga) is a small triangular-shaped atoll of about 3 miles in diameter, with its highest point about 150 ft. above sea-level. The legendary history of its settlement is interesting through its New Zealand associations. It is stated that one of the Maori chiefs who came to New Zealand with the first migratory wave of the Maoris (as distinct from the Morioris or earlier settlers) decided to return with his immediate followers to Rarotonga. Winds took them out of their course, and they finally reached and settled in Pukapuka. The Natives of this island have somewhat different customs from those of the remainder of the group. A portion of one of the reef islets, known as Anchorage Island, is an Admiralty Reserve.
Rakahanga (1,000 acres, 674 miles from Rarotonga) is also an atoll, and shares its Resident Agent with Manihiki, from which it is only twenty-five miles distant.
Palmerston (1,000 acres, 270 miles from Rarotonga) consists of eight islets threaded along a reef. Palmerston also bears the name of Avarau, and is noted as the “San Pablo” of Magellan, the first island discovered in the South Seas.
Suwarrow (600 acres, 513 miles from Rarotonga) is a coral atoll of triangular form possessing a land-locked lagoon eight miles by six, which is capable of being made into an excellent harbour. The island, which has been much reduced in land area by storms, is a sanctuary for sea birds, and part of it is a naval reserve.
Nassau (300 acres, 670 miles from Rarotonga) is a small island well planted with coconut-trees. It is usually inhabited for part of the year only.
Administration.—Provision for the government, of the Cook Islands is contained in the Cook Islands Act, 1915. Under this Act there is appointed a Resident Commissioner charged with the administration of the executive government of the Cook Islands. The Resident Commissioner resides in Rarotonga and is represented in the outer islands by Resident Agents.
Popular representation is effected by the Island Councils in each of the ten main islands, each Council consisting of ex officio members (officials and arikis, or leading chiefs) and elected members. Elections were first held in March, 1947, and will henceforth be conducted triennially in each constituency, the franchise extending to all Natives who are British subjects of eighteen years of age or over. The Resident Commissioner in Rarotonga and the Resident Agents in the outlying islands preside over the respective Island Councils. Prior to 1947, the Island Councils consisted of the Resident Commissioner or Resident Agent, the arikis, and a number of nominated members.
Europeans are represented by one nominated member on the Rarotonga Island Council.
The Cook Islands Amendment Act, 1946, under which these Island Councils were reconstituted, also provides for a Legislative Council of the Cook Islands, This Legislative Council consists of ten unofficial members elected by the Islands Councils and ten official members of the Cook Islands Public Service appointed by the Governor-General, with the Resident Commissioner as President. At meetings of this Council the Resident Commissioner has a casting, but not a deliberative, vote.
The inaugural session of the Council commenced on 5th November, 1947.
Laws governing the Cook Islands are made by Act of the New Zealand Parliament or by Orders in Council and regulations issued thereunder. Ordinances applicable to the whole of the Cook Islands may be made by the Legislative Council of the Cook Islands, subject to certain statutory restrictions. These Ordinances require the assent of the Resident Commissioner, and may be disallowed either wholly or in part by the Governor-General within one year after the assent of the Resident Commissioner has been given. Ordinances restricted in their application to the islands in which they are made may be enacted by the local Island Councils. These local Ordinances require the consent of the Resident Commissioner, or they may be reserved for the Governor-General's pleasure.
The Cook Islands have been brought within the scope of the South Pacific Board of Health, which was established in September, 1946, by agreement between the Government of New Zealand, the Government of Fiji, and the Western Pacific High Commission. The functions of the Board, the headquarters of which are in Suva, are to assist and advise the participating administrations on all health matters affecting the territories under their control.
A Conference convened by the Governments of Australia and New Zealand, and at which the Governments of France, the Netherlands, the United Kingdom, and the United States of America were represented, was held at Canberra in January and February, 1947. This Conference prepared an agreement establishing a South Pacific Commission, and steady progress has been made with its preliminary organization. The broad objective of the Commission is the economic and social advancement of all the island peoples of the South Pacific and the prosecution of scientific research under a wide common plan of regional co-operation, and many particular projects of vital interest to the people of the Cook Islands are already envisaged.
Population and Vital Statistics.—A census of the Cook Islands taken on 25th September, 1945, recorded a total population (exclusive of Niue) of 14,088, an increase of 1,842, or 15.04 per cent., as compared with the census of 30th April, 1936. The Native population increased from 11,943 to 13,574 and the non-Native population from 303 to 514. Of those described as “population other than Native,” approximately two-thirds were recorded as being partly of Native origin, and the increase between 1936 and 1945 is confined to those of mixed blood, the number of persons described as “Europeans” having fallen from 207 to 180. Details of the estimated population of the islands of the group as at 31st March, 1948, together with corresponding totals shown by the 1936 and 1945 censuses, are set out in the following table:—
| Island. | Estimated Population 31st March, 1948. | Census of 1945: Total Population. | Census of 1936: Total Population. | ||||
|---|---|---|---|---|---|---|---|
| Native Population. | Population Other Than Native. | Total Population. | |||||
| Males. | Females. | Males. | Females. | ||||
*Not inhabited at time of 1945 census. †Not inhabited at time of 1936 census. ‡ Exclusive of 352 Cook Island labourers absent in Makatea. | |||||||
| Northern Islands— | |||||||
| Penrhyn | 369 | 331 | 700 | 654 | 467 | ||
| Rakahanga | 168 | 155 | 2 | 325 | 318 | 290 | |
| Manihiki | 214 | 235 | 4 | 1 | 454 | 435 | 487 |
| Pukapuka | 335 | 332 | 6 | 1 | 674 | 662 | 651 |
| Nassau* | 18 | ||||||
| Suwarrow† | 5 | ||||||
| Palmerston | 34 | 33 | 67 | 65 | 90 | ||
| Lower Group— | |||||||
| Aitutaki | 1,282 | 1,216 | 7 | 3 | 2,508 | 2,356 | 1,719 |
| Manuae | 18 | 10 | 28 | 28 | 8 | ||
| Takutea*† | |||||||
| Mitiaro | 95 | 125 | 220 | 229 | 265 | ||
| Atiu | 687 | 588 | 6 | 6 | 1,287 | 1,114 | 1,086 |
| Mauke | 322 | 442 | 6 | 3 | 773 | 804 | 652 |
| Rarotonga | 2,714 | 2,578 | 166 | 91 | 5,549 | 5,573 | 5,054 |
| Mangaia | 910 | 952 | 7 | 2 | 1,871 | 1,845 | 1,459 |
| Totals, Cook Islands | 7,148 | 6,997 | 204 | 107 | 14,456‡ | 14,088 | 12,246 |
During the year ended 31st March, 1948, births numbered 635 and deaths 440, as compared with 574 and 348 respectively in 1946–47. The increase in the number of deaths was largely due to an epidemic of whooping-cough in the period April–July, 1947. The number of deaths of infants under one year of age in 1947–48 was 171, as compared with 81 in the previous year.
Health.—In accordance with the provisions of the Cook Islands Act, 1915, all Cook Islanders receive free medical and surgical treatment in their villages, in the hospital, and in the tuberculosis sanatorium. Native patients in the hospital and the sanatorium and all school-children receive free dental treatment.
Although lying within the tropics, the Cook Islands are singularly free from the common diseases prevalent in other tropical islands. Malaria is also unknown, but filariasis is endemic, and this and tuberculosis provide the main health problems of the Group. The objective of the health services, to improve the health of the community, is being pursued by a system of village sanitary inspection and group medical examination, combined with modern treatment of disease in dispensary, clinic, hospital, and sanatorium.
The health services are headed by a Chief Medical Officer, and include another European Medical Officer, seven Assistant Medical Practitioners (Native), and six Native Inspectors engaged on mosquito-control. Hospital and sanatorium stall include two European Matrons, three European Sisters, and a number of trained Native nurses.
A general hospital and a tuberculosis sanatorium are maintained in Rarotonga, the latter, which was provided by the New Zealand Government, being opened in December, 1945. In the outer islands, dispensaries with accommodation for a few patients are operated by Assistant Medical Practitioners.
A child-welfare organization covering all phases of maternity and child-welfare work operates in Rarotonga, Mangaia and Aitutaki under the supervision of the Chief Medical Officer. Regular clinics are held and periodical lectures are given to the Child Welfare Committees in each village.
The Dental Department is operated by a European Dental Officer and two Native dental nurses. During the year ended 31st March, 1948, all schools in the Lower Group islands were visited and the children examined, and, in practically every school, treatment over a period was given. In order to provide regular dental services in the outer islands the dental staff is being expanded by bringing Cadets to Rarotonga for training. Dental health education has commenced by the issue of pamphlets in Maori and English.
Expenditure on health services during the financial year ended 31st March, 1948, amounted to £29,398, or £2 0s. 8d. per head of population.
Education.—The work of the Education Department is in charge of an Education Officer seconded from New Zealand, assisted by thirteen European teachers, also from New Zealand, and by 133 local teachers and trainees. There are eleven Government schools established in five islands of the Lower Group and at Pukapuka, the London Missionary Society has a school at Mitiaro and six in the Northern Group, while there are three Roman Catholic schools in the Lower Group and three in the Northern. Subsidies are paid to the London Missionary Society to assist education in the Northern Group. The number of scholars attending schools in 1947 was 3,700, of whom 2,958 attended Government schools, 387 London Missionary Society schools, and 355 Roman Catholic schools. The aim of the Administration is to educate the children up to the equivalent of Standard 4 of the New Zealand school syllabus, with facilities at Rarotonga for advanced children to attain a level comparable to Form II in New Zealand. A training system for Native teachers is being gradually extended, and a site for a proposed training school at Tereora, Rarotonga, has been obtained, and the plans for the buildings decided upon. A limited number of pupils is sent to New Zealand each year to take up scholarships made available by the New Zealand Government.
Social studies have been added to the school curriculum, and instruction in the Cook Islands Maori language is now given for one hour per week. Three text-books in the Native language are in use, and as more become available the weekly period of instruction will be increased. Five film-strip projectors, one movie-sound film-projector, and a considerable quantity of other material and apparatus have been made available from a special grant provided by the New Zealand Government. A scheme for the provision of free milk for the children in Rarotonga schools has been approved and will be extended to the schools of the outer islands as soon as possible.
Labour and Employment.—There is wide variation in types of employment in the different islands. On the barren atolls in the Northern Group the Natives subsist largely on coconuts and fish, and there is little opportunity for them to engage in other pursuits which would provide exports and a consequent higher living standard. In the pearl islands of Manihiki and Penrhyn numbers are employed in diving for shell, which they find more profitable employment than wresting a living from the land. It is in the fertile islands of the Lower Group that most of the population is concentrated, and labour is required for the growing, harvesting, packing, and shipment of fruit and copra, the staple exports on which living standards depend. As most of the land in these islands is held by family groups under customary title, the bulk of the people are engaged in work on their own plantations. There is, however, opportunity for wage-earners in the administrative departments, in plantation work, and in the handling of fruit for export.
Wage standards are fixed for all types of such work following the sittings of a special Wages Tribunal in 1946. Further progress in the field of employment relations has been initiated by the passing of the Cook Islands Industrial Union Regulations 1947, resulting in the registration of the Cook Islands (Except Nine) Industrial Union of Workers. This union embraces all classes of workers, many being engaged in different kinds of employment from time to time according to the labour demand.
Provision is made for the settlement of industrial disputes by conciliation or, failing voluntary settlement, by decision of an Industrial Relations Officer appointed from the Cook Islands Public Service. Appeal from such a decision is to an Industrial Magistrate appointed by the Minister of Island Territories for the purpose.
Basic wage-rates for labourers range from 7s. to 9s. per day, and for more responsible work up to 18s. per day.
The British Phosphate Commission recruits labourers in the Cook Islands for work in the phosphate island of Makatea, in the Society Islands, and at 31st March, 1948, a total of 352 men were absent in Makatea. Employment in this work is popular on account of the relatively high wages, and a large proportion of the workers seek re-employment on the conclusion of their contracts which are individual and on an annual basis.
There is no movement of migratory labour into the Cook Islands, although some migration occurs from the less-fertile islands of the Northern Group to Rarotonga and other islands of the Lower Group.
Agriculture.—The principal crops of the Cook Islands, apart from Native vegetable crops, are citrus fruits, bananas, tomatoes, and coconuts, while arrowroot and pineapples are also grown. Some years ago deterioration of the orange-trees became increasingly evident and in order to rehabilitate the industry a citrus-replanting scheme was instituted in 1940, providing for assistance to growers in establishing plots. Considerable progress has been made with this scheme. Nurseries are established in Rarotonga, Aitutaki and Atiu and it was hoped to establish nurseries in Mauke during 1948. Owing to lack of shipping facilities and storm damage the production of bananas has declined in recent years, and at present there is little hope of interesting growers in re-establishing this industry. However, the Administration has established nurseries for the propagation of banana-shoots, so that when it is possible to revive the industry shoots will be available for the replanting scheme. Arrowroot is extensively cultivated in Aitutaki, and during 1947, 91 tons were processed and exported, while Mangaia shipped 808 cases of pineapples to New Zealand. The extension of these industries may well assist in providing cargo during the lean period between orange seasons. Copra production has increased, and Penrhyn and Aitutaki have recommenced the export of this commodity.
There are few marketable types of forest trees in the islands, but arrangements are being made for tree-planting on a moderate scale to prevent soil erosion.
Communication.—For trading connections with other countries the islands are mainly dependent on a steamer service to and from New Zealand. By this service regular calls are made at Rarotonga, and occasional calls, for purposes of loading cargoes in the orange season, at the larger and more productive of the southern islands. Transportation between the islands is mainly undertaken by schooners. There is a regular fortnightly air service between New Zealand and Rarotonga which has effected a great improvement in communications and has proved of much value in cases of emergency and of medical necessity. Passengers proceed by Sunderland flying-boat from Auckland to Fiji, and thence by Dakota planes via Tonga, Western Samoa, and Aitutaki to Rarotonga, the air journey from New Zealand taking three days. The same route is followed on the return journey, but the trip takes five days, as there is a break of two days in Fiji awaiting the connection with the flying-boat. The only islands in the Group connected by this air service are Rarotonga and Aitutaki.
Radio communication has largely removed the former isolation of the islands, there being now no permanently inhabited island without a radio-station. The chief station is Rarotonga Radio, which maintains direct communication with the substations and with Wellington, Apia, and Suva. Postal and telegraph services are available in all the islands and there is a telephone service in Rarotonga.
Trade.—The figures of exports and imports for each of the years 1943–47 are:—
| Year. | Exports. | Imports. | Total Trade. |
|---|---|---|---|
| £ | £ | £ | |
| 1943 | 76,345 | 107,205 | 183,550 |
| 1944 | 126,830 | 155,230 | 282,060 |
| 1945 | 106,246 | 144,069 | 250,315 |
| 1946 | 108,262 | 195,596 | 303,858 |
| 1947 | 158,525 | 253,243 | 411,768 |
Details of the quantities and values of the principal commodities exported in 1946 and 1947 are as follows:—
| Commodity. | Unit. | Quantity. | Value. | ||
|---|---|---|---|---|---|
| 1946. | 1947. | 1946. | 1947. | ||
| £ | £ | ||||
| Oranges and other citrus fruits | Case | 24,833 | 56,973 | 19,246 | 48,515 |
| Orange-juice | Gal. | 1,975 | 774 | ||
| Bananas | Case | 54 | 18 | 27 | 18 |
| Tomatoes | Box | 69,550 | 22,048 | 47,274 | 21,049 |
| Copra | Ton | 617 | 793 | 16,107 | 35,727 |
| Native handwork | 4,060 | 2,911 | |||
| Arrowroot | Ton | 81 | 91 | 4,388 | 4,362 |
| Manufactured goods | 3,058 | 12,264 | |||
| Pearl-shell | Ton | 131 | 24,842 | ||
| Candle-nuts | Case | 277 | 4,076 | ||
| Pineapples | Case | 808 | 465 | ||
Import and Finance Control.—The importation of goods into the Cook Islands from countries other than New Zealand is subject to licence under the Cook Islands Import Control Regulations 1944. Similar action has been taken in regard to exports, permission being required before goods may be exported to a country other than New Zealand.
The Cook Islands Finance Emergency Regulations 1944 as amended in 1945 prohibit the transfer of money or securities from the Cook Islands without the permission of the Minister of Finance. An exception is made in the case of New Zealand currency being taken or sent to New Zealand. The regulations also make provision for the acquisition of foreign currency and foreign securities on behalf of the New Zealand Government, and are similar in effect to measures in New Zealand as outlined on page 534 of this Year-Book.
Public Finance.—To meet expenditure, revenue is raised in the Cook Islands themselves, and the principal sources at present are receipts from stamp sales, customs import duties, and income-tax paid by taxpayers resident in the Group. With the exception of two local duties, the New Zealand Customs Tariff applies, and for Customs purposes the Group is treated as if it were part of New Zealand. Income-tax, as in New Zealand, also applies and is collected through the Land and Income Tax Department. Apart from income-tax which may be payable in some cases, there is no direct taxation of the Native community.
Subsidies to cover the deficit on ordinary working are granted annually by the New Zealand Government, and also in recent years special grants have been made for particular purposes, mainly of a capital or developmental nature.
A comparative statement of revenue and expenditure for the last five years is shown hereunder.
| Year Ended 31st March, | Revenue Obtained in the Territory. | Expenditure of the Territory. | Deficit. | Subsidies and Grants From New Zealand. | Final Surplus or Deficit. |
|---|---|---|---|---|---|
NOTE.—Advance of £27,814 for electric-power scheme is not included in 1947–48 figures. | |||||
| £ | £ | £ | £ | £ | |
| 1943–14 | 40,818 | 59,798 | 18,980 | 27,000 General | +8,020 |
| 1944–45 | 40,228 | 120,239 | 80,011 | 27,000 General | |
| 48,992 Airfield | |||||
| 3,477 Sanatorium | -542 | ||||
| 1945–46 | 49,337 | 93,017 | 43,680 | 27,000 General | |
| 16,669 Sanatorium | -11 | ||||
| 1946–47 | 73,999 | 107,530 | 33,531 | 7,289 General | |
| 939 Scholarships | |||||
| 275 Milk in schools | |||||
| 1,971 Road maintenance | |||||
| 425 Pensions | |||||
| 1,713 New residences | |||||
| 2,601 New bridges | |||||
| 3,100 Sanatorium | -15,218 | ||||
| 1947–48 | 78,773 | 147,106 | 68,333 | 57,469 General | |
| 515 Residences | |||||
| 5,131 New roads and bridges | |||||
| 2,797 Maintenance, roads and bridges | |||||
| 716 Milk in schools | |||||
| 9 Reef survey | |||||
| 918 Sanatorium | |||||
| 1,278 Emergency air and shipping calls to relieve distress or serious illness | |||||
| 1,357 Scholarships | |||||
| 682 Radio reconstruction | |||||
| 119 War Pensions. | +2,658 | ||||
The figures given above will be seen to differ from those appearing in similar previous comparative statements. This has been duo to changes in accounting procedure and the adoption of a different method of treating the subsidies. The figures above have been extracted from the Administration accounts as finally certified by the Controller and Auditor-General. To avoid an unwieldy number of footnotes, special grants for each year are shown in detail. All expenditure, whether ordinary or special, now appears in the “expenditure” column.
The principal items of expenditure in 1947–48 were £25,644 on education, £29,398 on health services, and £33,147 on public works.
NIUE.—Descriptive—Niue Island became part of New Zealand in 1901, when the boundaries of New Zealand were extended to include the Cook Islands. As stated previously, Niue is part of the Cook Islands but has been under separate administration since 1903. The island is situated in latitude 19° south and longitude 169° 48" west, somewhat west of the centre of the irregular triangle formed by Samoa, Tonga, and the southern Cook Islands, and is 600 miles distant from the latter. The island, which has an area of 64,028 acres, is an elevated coral outcrop with a coral reef fringing a precipitous and broken coast-line. The central saucer-shaped plateau, rising to a height of 200 ft., is encircled by a narrow terrace about 90 ft. above sea-level. There are no running streams, and the water supply depends on rain-water, which is stored in tanks. The soil, though fertile, is not plentiful, and this feature, combined with the rocky and broken nature of the country, makes cultivation difficult and precludes the grazing of stock. The climate is mild and equable, and, although on the edge of the hurricane belt, the island is seldom visited by serious weather disturbances. The mean annual temperature during the last thirty years was 76.72° Fahrenheit, and the average annual rain-fall for a similar period was 78.27 inches.
The port of Alofi has an open roadstead anchorage which is satisfactory in fair weather.
Administration.—Provision for the administration of Niue is made in the Cook Islands Act, 1915, which provides for the appointment of a Resident Commissioner charged with the administration of the executive government of Niue. Laws are made by Act of the New Zealand Parliament, or regulations issued thereunder, or by Ordinance passed by the local Island Council. This body meets periodically under the presidency of the President Commissioner, and consists at present of thirteen Native members appointed by the Governor-General, and representing all villages on the Island.
Population.—Totals of the eight censuses taken since the annexation of Niue by New Zealand (11th June, 1901) are as follows:—
| 1902 | 4,079 |
| 1906 | 3,822 |
| 1911 | 3,943 |
| 1916 | 3,880 |
| 1921 | 3,750 |
| 1926 | 3,795 |
| 1936 | 4,104 |
| 1945 | 4,253 |
The following comparison between the figures of the census taken on 25th September, 1945, and the estimated population as at 31st March, 1948, shows an increase of 65 persons over the two and a half-year period:—
| Census, 1945. | Estimate, 31st March, 1948. | |
|---|---|---|
| Native population— | ||
| Males | 2,041 | 2,050 |
| Females | 2,189 | 2,239 |
| Population other than Native— | ||
| Males | 13 | 19 |
| Females | 10 | 10 |
| Total population | 4,253 | 4,318 |
The population is distributed over eleven villages of which Alofi with a population of approximately 900 is the largest. Alofi is also the administrative centre.
Health and Vital Statistics.—A Government hospital is established in Niue, and all medical and dental treatment, including hospitalization, is provided free of charge to all Natives. The staff at 31st March, 1948, consisted of a Native medical practitioner (on loan from Western Samoa), a European Matron, a European nurse, five Native nurses, including two on loan from Western Samoa, and two Niuean Dental Officers. In addition, there were two Native dispensary assistants and a Native dental clinic assistant. Since 4th June, 1947, the Island has been without the services of a European Medical Officer, and the medical work has been under the supervision of the Native medical practitioner from that date. Births during the year ending 31st March, 1948 numbered 166, and deaths 110. As in the case of the other Cook Islands, Niue experienced an epidemic of whooping-cough during the year, and this contributed to the high number of deaths.
The following comparative table shows the amounts expended on health services over the last five financial years;—
| — | 1943–44. | 1944–45. | 1945–46. | 1946–47. | 1947–43. |
|---|---|---|---|---|---|
| Amount expected | £3,900 | £3,656 | £5,305 | £8,211 | £7,293 |
| Population | 4,242 | 4,200 | 4,271 | 4,328 | 4,318 |
| Amount per head of population | 18s. 5d. | 17s. 5d. | £1 4s. 9d. | £1 17s. 11d. | £1 13s. 9d. |
Education.—The Administration maintains three schools, which are under the control of a European Education Officer assisted by a European infant-mistress. Some 50 Niuean teachers and assistants are employed. In addition, the London Missionary Society maintains schools in villages in which there are no Administration schools. A subsidy of £500 per annum is paid to the Society. A proposal to replace the Mission schools with four Administration schools is being proceeded with. Two Niuean students, who were being educated in New Zealand at the expense of the Administration, have now proceeded to the Central Medical School in Suva, for training as Native medical practitioners, and two further Niuean students proceeded to New Zealand under the general scheme for scholarships for the Island Territories early in 1948, making a total of four boys being educated in New Zealand, in addition to the two being trained as Native medical practitioners at Suva.
The total number of scholars attending schools at the end of 1947 was 1,107, of whom 653 were on the rolls of Administration schools and 454 on the rolls of the Mission schools.
Trade.—Both exports and imports reached a record level in 1947. The largest contributing factor was increased exports of copra together with higher prices for this commodity. There were no exports of bananas in 1947. This was due to the fact that it was found impossible to guarantee the arrival of fruit-vessels at such times as would avoid Sunday work on the part of the Niueans, who had expressed themselves as being against work in any form on Sundays.
Exports and imports for the last five years are given below. The greater part of the trade is with New Zealand.
| Year. | Exports. | Imports. | Total Trade. |
|---|---|---|---|
| £ | £ | £ | |
| 1943 | 30,733 | 32,070 | 62,803 |
| 1944 | 23,251 | 30,054 | 53,305 |
| 1945 | 29,468 | 26,972 | 56,440 |
| 1946 | 35,873 | 46,677 | 82,550 |
| 1947 | 45,591 | 58,796 | 104,387 |
Exports of principal commodities during 1945, 1946, and 1947 were:—
| Commodity. | Unit. | 1945. | 1946. | 1947. | |||
|---|---|---|---|---|---|---|---|
| Quantity. | Value. | Quantity. | Value. | Quantity. | Value. | ||
| £ | £ | £ | |||||
| Copra | Ton | 415 | 9,986 | 352 | 10,179 | 695 | 28,505 |
| Bananas | Case | 7,662 | 4,141 | 9,346 | 5,335 | ||
| Kumeras | Ton | 10 | 141 | 20 | 292 | ||
| Native plaited ware | 14,683 | 19,652 | 15,797 | ||||
The measures in force in the Cook Islands in regard to control of trade and finance apply equally in Niue.
Public Finance.—Exclusive of subsidy from the New Zealand Government, income for the year 1947–48 amounted to £28,417, while expenditure totalled £42,730. The subsidy received was £6,522, leaving a net deficit of £7,791.
A comparative statement of revenue and expenditure during the last five financial years is as follows:—
| Year Ended 31st March. | Revenue. | Expenditure. | Deficit. | Subsidy. | Final Surplus or Deficit. |
|---|---|---|---|---|---|
| £ | £ | £ | £ | £ | |
| 1944 | 10,342 | 18,187 | 7,845 | 10,000 | +2,155 |
| 1945 | 12,096 | 18,900 | 6,804 | 10,000 | +3,196 |
| 1946 | 14,590 | 25,123 | 10,533 | 7,755 | -2,778 |
| 1947 | 28,726 | 32,387 | 3, 661 | 5,000 | + 1,339 |
| 1948 | 28,417 | 42,730 | 14,313 | 6,522 | -7,791 |
A feature of the revenue for 1947–48 was that no less than £16,297 out of a total of £28,417 was derived from the sale of stamps, mainly on account of a philatelic demand. Customs import duties produced £4,177, and income-tax, £1,500.
WESTERN SAMOA.—Geographical—Western Samoa is comprised of the two large islands of Upolu and Savai`i and the islets of Apolima, Manono, Fanuatapu, Namu`a, Nu`utele, Nu`ulua, and Nu`usafe`e. The geographical boundaries are between latitudes 13 degrees and 15 degrees south and longitudes 171 degrees and 173 degrees west.
Savai`i is the larger of the two main islands, with a length of 46 miles, a breadth of 25 miles, and a total area of 703 square miles. The island is mountainous, rising to a height of 6,094 ft. Upolu, which extends some 45 miles in length and 13 in breadth, measures about 430 square miles in area, and rises to a height of 3,608 ft. Of the two, Upolu is the more fertile and populous, and contains two-thirds of the population. Only two of the smaller islands, Manono and Apolima, which are situated in the strait which separates Savai`i and Upolu, are inhabited. The remainder are within or near the fringing reef surrounding Upolu. The climate of the group is equable, the average temperatures during the last fifty-seven years, showing a mean daily maximum of 84.8° Fahrenheit, and a mean daily minimum of 74.1° Fahrenheit while the average annual rainfall for a period of fifty-eight years is 112 inches.
Administration.—The territory of Western Samoa was previously administered pursuant to a mandate conferred upon His Britannic Majesty, to be exercised on his behalf by the Government of New Zealand, and confirmed by the Council of the League of Nations on 17th December, 1920.
Following the establishment by the Charter of the United Nations of an international trusteeship system, New Zealand in January, 1946, communicated to the General Assembly of the United Nations its acceptance of the system in its application to Western Samoa.
A draft trusteeship agreement submitted by the New Zealand Government to the United Nations in October, 1946, was, with minor amendments, adopted by the General Assembly on 13th December, 1946. In this agreement (printed as parliamentary paper A.–2c, 1947) the Government of New Zealand is designated as the administering authority for Western Samoa.
In the meantime the Samoan people asked that they be granted self-government with New Zealand remaining in the rôle of adviser and protector. A petition to this effect was transmitted to the Secretary-General of the United Nations through the New Zealand Government in January, 1947. The petition was considered by the Trusteeship Council on 24th April, 1947, and, on the invitation of the New Zealand delegate, a Mission of Inquiry composed of Mr. Francis B. Sayre (President of the Trusteeship Council), M. Pierre Ryckmans (Honorary Governor-General of the Belgian Congo), and Senator Eduardo Cruz-Coke, of Chile, arrived in Western Samoa the following July.
On 26th August, 1947, two days before the Mission left Apia, the Now Zealand Government stated in Parliament its immediate plans for the political development of Western Samoa. The revised constitution provided for a Council of State comprising the three Fautua (now two only, due to the recent death of Mata`ofa) and the Administrator (who in future would be known as the High Commissioner), and for a Legislative Assembly composed of the Members of the Council of State, eleven Samoan members elected by the Fono of Faipule, five representatives of the European and part-European community elected under adult suffrage, and six official members. Implementation of the New Zealand Government's proposals was effected by the passing of the Samoa Amendment Act, 1947, by the New Zealand Parliament on 25th November, 1947. This Act came into force on 10th March, 1948.
The laws of the territory are made by Act of the New Zealand Parliament or by Ordinances passed for the peace, order, and good government of the Territory by the Legislative Assembly of Samoa. In addition, by the Samoa Act (1921) the Governor-General in Council is empowered to make in New Zealand “all such regulations as he thinks necessary for the peace, order, and good government” of the Territory.
The Native people of Western Samoa are described in documents of travel as “British protected persons, Natives of the Territory of Western Samoa.” The non-indigenous inhabitants of the territory retain their own nationality and citizenship. Under the provisions of the British Nationality and Now Zealand Citizenship Act, 1948, however, individual inhabitants of the Territory may apply for New Zealand citizenship by naturalization. As at 31st March, 1948, certificates of naturalization under the earlier legislation had been granted to 50 Native Samoans and to 82 inhabitants of European status, including children in both cases.
Population and Vital Statistics.—A census of population was taken by the Administration on the night of 25th September, 1945. The following table shows the summarized results, together with corresponding figures for the 1936 census. The estimate as at 31st March, 1948, is also shown.
| — | 1936 Census. | 1945 Census. | Estimate 31st March, 1948. |
|---|---|---|---|
| Europeans and European-Samoans | 3,075 | 5,399 | 5,425 |
| Native Samoans (including other island races) | 52,266 | 62,422 | 67,149 |
| Chinese— | |||
| Contract labourers | 502 | 294 | 285 |
| Others | 20 | 7 | 5 |
| Melanesian or Polynesian contract labourers | 83 | 75 | 72 |
| Totals | 55,946 | 68,197 | 72,936 |
The total of 68,197 at the census of 1945 does not include 55 members of the United States Forces in Western Samoa at the census date, nor does it include 73 persons on board an overseas vessel.
Apia, the only town in the territory, is situated on the north coast of Upolu and together with immediately adjoining villages, has a population of approximately 10,000. It contains the administrative headquarters and is the only port of call for the territory. Most of the Samoan people live on the coasts, 11 villages only out of a total of 192 being situated inland.
The substantial increase in the number of Europeans and European-Samoans in 1945 was not wholly the result of migration or natural increase, but was largely due to a difference in status. Legislation in the intervening period changed the status of illegitimate half-castes from Natives to Europeans, thus overstating the increase in Europeans and understating the increase in the number of Samoans.
Following are statistics of the age-constitution of the Native Samoan population as disclosed by the 1945 census.
| Matai (heads of families ranking as chiefs or orators, usually over thirty-five years of age) | 3,497 |
| Taulele`a (untitled men, of any age over fourteen years) | 12,989 |
| Tamaiti (boys, two to fourteen years) | 12,936 |
| Tama meamea (infant boys, under two years) | 2,412 |
| Total, males | 31,834 |
| Fafine (all women who have been married, and all other women over twenty-five years of age) | 12,398 |
| Teine muli (unmarried females, fifteen to twenty-five years) | 4,988 |
| Teinoiti (girls, two to fourteen years) | 10,993 |
| Teine meamea (infant girls, under two years) | 2,209 |
| Total, females | 30,588 |
| Total of Samoan population, 25th September, 1945 | 62,422 |
The following figures, which show the numbers of Native Samoans (including other island races) at varying intervals, reveal a particularly rapid rate of natural increase in recent years, particularly since 1926. As stated earlier, the increase between 1936 and 1945 is understated to some extent. The heavy toll exacted by the influenza epidemic in 1918, is evident from the estimates for 1st October and 31st December of that year.
| German regime— | |
| Census mid-1906 | 33,478 |
| Census mid-1911 | 33,554 |
| New Zealand Administration— | |
| Census mid-1917 | 36,216 |
| Estimated, 1st October, 1918 | 37,113 |
| Estimated, 31st December, 1918 | 31,200 |
| Census, 17th April, 1921 | 32,522 |
| Census, 1st January, 1926 | 36,880 |
| Census, 4th November, 1936 | 52,266 |
| Census, 25th September, 1945 | 62,422 |
| Estimated, 31st March, 1948 | 67,149 |
During the year ended 31st March, 1948, there were 2,521 births in Western Samoa and 692 deaths. Arrivals in the territory numbered 2,605, and departures 2,958.
Health and Hospitals.—The Samoa Health Ordinance, 1921, is on the lines of the New Zealand Health Act, 1920, but remodelled to suit local conditions. A Government hospital is maintained at Apia, while medical out-stations have been established at seven villages in Upolu and six villages in Savai`i, each with a Native medical practitioner in attendance assisted by a qualified Native nurse, with three additional out-stations in Upolu, each in the charge of Native nurses. The health service staff during the calendar year, 1947, consisted of 3 European Medical Officers, 20 Native medical practitioners, 7 Native dental officers, 1 European dispenser, 1 qualified bacteriologist of part-Samoan descent, and a nursing staff of 11 Europeans, 97 Native nurses and trainees, and 82 others. (At present 10 Samoan students are in training as Native medical practitioners at the Central Medical School in Suva.)
During the year 1947, 3,836 in-patients and 104,870 out-patients were treated at the hospitals and dispensaries.
Considerable help in the care of the sick is afforded by women's committees which are established in all the main villages. Qualified Samoan nurses regularly visit and lecture to these committees and at the same time inspect babies and school-children. Demonstrations and lectures are also given to these women's committees by the European and Samoan Medical Officers and Health Inspectors. Health education is also carried on by means of radio broadcasts in the Samoan and English languages.
Of the more important tropical diseases, only three are prevalent in Western Samoa—viz., ankylostomiasis (or hookworm), frambœsia (yaws), and filariasis (elephantiasis). Every effort has been made to stamp out these diseases, particularly hookworm and yaws, and systematic campaigns to this end have been in progress since 1923, resulting in a marked improvement in the general health of the Samoan people. The main endemic diseases now experienced are filariasis, hookworm, yaws, tuberculosis, and enteric fever, with the usual seasonal incidence of bacilliary dysentery, food poisoning, and gastro-enteritis. Leprosy occurs, and diagnosed cases are kept in a special compound at Apia Hospital to await transport to the leper settlement at Makogai.
Under New Zealand administration the sanitation of Apia has been considerably improved, and the reticulation with a high-pressure water-supply system completed. Water has been piped into several villages from springs in the hills, while in other villages where this is not possible largo reinforced-concrete tanks have been erected to receive the rain-water from church buildings.
On 7th September, 1946, an agreement for the establishment of a South Pacific Health Service was made between the Government of New Zealand (in respect of Western Samoa and the Cook Islands), the Government of Fiji, and the Western Pacific High Commission.
This agreement established a South Pacific Board of Health, with a Chief Administrative Officer, known as the Inspector-General, South Pacific Health Service with headquarters at Fiji. The functions of the Board are to advise the participating Administrations on health matters, and to assist generally in the more effective control of disease and promotion of health in the territories under their control.
Education.—Originally education in Samoa was conducted solely by the missions, and, except where pupils were being trained as pastors, instruction in most schools was of an elementary nature. After the establishment of the mandate the Administration schools undertook more advanced teaching, involving the partial use of the English language, while not interfering with Samoan as the language of the people. At the same time several of the mission schools made available parallel facilities for pupils other than trainees.
During the year ended 31st March, 1917, a reorganization of the educational system was commenced, and the proposed new general scheme is as follows:—
| Mission Denominational Schools | Primary Schools | Denomination Colleges | Administration Schools | Primary Schools | Middle Schools | Post-primary Schools | Teachers' Training-school | Marist and Convent Denominational Schools | Primary Schools | Middle Schools |
Primary Schools.—These schools form the base of the whole educational system. They provide a broad general course of six years' duration for children in the villages, and are the equivalent of the elementary schools of other countries. Instruction is given in the vernacular, but the English language is taught as a subject.
Middle Schools.—This type of school selects the best of the children after three years in the primary schools and provides them with a further five years' course. There are three of these schools, Auele (on Upolu) and Vaipouli, (on Savai`i), being boys' schools, and Ulalifa (Apia) being a girls' school.
The function of these schools is to provide education to a higher level than that given by the village elementary schools. All instruction is in the English language, and the general curriculum approximates that of the New Zealand primary schools.
Pupils who leave these schools are in demand throughout Western Samoa to fill positions involving a certain amount of responsibility and are to be found as traders, clerks, nurses, pastors in the churches, and Cadets in the administration.
European Schools.—There are two of these schools, one in Apia and the other at Aleisa, which provide a general elementary course of eight years' duration for those children who are European by birth or status. In both these schools English is the medium of instruction, and the curriculum approximates that of the New Zealand primary schools.
The Secondary School.—This is a small one-teacher school with a roll of 27 and is situated in Apia as a department of the European school. It gives more advanced education to pupils who have completed a course either at the European schools or the middle schools or the corresponding type of school under mission jurisdiction. Entrance is by competitive examination. The school aims at taking pupils to the standard of School Certificate in New Zealand, which, in general, can be reached after completing a satisfactory course of three years' secondary work. Few entrants, however, envisage any sustained course when they attend the school, and most of thorn leave after a year or two for commercial positions, which can be more easily obtained by virtue of the extra training.
The Teachers' Training School.—This school was established in 1939 to meet the urgent demand of village schools for trained teachers. In addition to trainees for Government schools, a quota is admitted from the mission schools on a proportionate basis. During the war and post-war years it has been difficult to obtain candidates whose academic training is of a sufficiently high standard to warrant their admission as trainees. The bettor type of pupil from the middle schools and the secondary school, which normally supply candidates, finds more remuneration in the commercial sphere, and is attracted there in preference to entering the teaching profession.
Attached to the school are two model schools where students can receive practical training in their work.
Higher Education: Samoan Scholarships.—In order to provide the most intelligent Samoan children with better opportunities for a more sustained course of higher education, a scholarship scheme was inaugurated in 1945. Children selected under this scheme are sent to New Zealand to study there, the cost being borne by the Now Zealand Government. The period of the scholarship is determined by the ability of the holder to proceed along the road of higher education.
The school systems of the various missions are organized on approximately parallel lines to that of the Administration. In all villages where there is a pastor he maintains a school for children of his adherents. The general aim of these schools is to provide the pupils with sufficient training in the vernacular to road the Bible and to do number work. The curriculum in general is much narrower than that of the Administration schools, and all instruction is in the vernacular.
On the level above is the fa`amasani, or preparatory school, where English is taught as a subject and instruction proceeds in both English and the vernacular. The curriculum hero is broader' than that of the pastors' schools and provides a higher level of elementary education.
From these schools the best pupils are selected to attend a more advanced type of school preparatory to entering the training school for pastors. They provide much the same general curriculum and standard of achievement as that of the parallel Administration schools and are usually under the charge of qualified missionary personnel.
At the highest level are the training schools for pastors. Candidates are chosen from the best pupils of the preceding school, and the period of training varies from four to six years.
In addition, the Roman Catholic Mission maintains in Apia a school where children may enter, independent of status. The curriculum is a broad, general one corresponding to that of the New Zealand primary schools.
School Rolls, Teachers, &c.—The following table gives particulars of the Administration schools for the year ended 31st March, 1948.
| Type. | Number of Schools. | Number of Teachers. | Roll Numbers. | ||
|---|---|---|---|---|---|
| Boys. | Girls. | Totals. | |||
| Primary | 98 | 241 | 5,437 | 5,566 | 11,003 |
| Middle | 3 | 15 | 193 | 125 | 318 |
| European | 2 | 26 | 380 | 344 | 724 |
| Post-primary | 1 | 1 | 14 | 13 | 27 |
| Teachers' training-school | 1 | 3 | 26 | 17 | 43 |
| Totals | 105 | 286 | 6,050 | 6,065 | 12,115 |
The next table contains particulars of the mission schools, according to denominations.
| Mission. | Pastor Schools. | Other Schools and Colleges. | Pastor and Native Teachers. | European Teachers. | Number of Pupils. |
|---|---|---|---|---|---|
| London Missionary Society | 175 | 10 | 203 | 4 | 10,830 |
| Roman Catholic | 84 | 25 | 115 | 41 | 5,068 |
| Methodist | 83 | 5 | 98 | 4 | 4,440 |
| Latter Day Saints | 15 | 33 | 8 | 820 | |
| Seventh Day Adventist | 7 | 1 | 9 | 2 | 259 |
| Totals | 364 | 41 | 458 | 59 | 21,417 |
It should be noted that there is considerable duplication in the foregoing figures showing the totals of pupils in the Administration and mission schools respectively, owing to the fact that many children attend both the mission pastor schools (for religious instruction) and the primary schools (for secular education).
Labour.—Regular employment for wages is not a natural form of Samoan life, and the results of the 1945 Census showed only 3 per cent. of the Samoan population in such employment. They are not held to contracts, but work as and when they wish.
The plantations can, to a certain extent, overcome the difficulty regarding regular employment by engaging co-operative or community groups on casual work, but in the stores and in the Administration where regular daily tasks are required the labour turnover is very largo. On the other hand, no difficulty is experienced in obtaining labour for the two or three clays of intensive work available when a cargo-vessel is in port.
This reluctance on the part of the Samoans to undertake regular work led during the German regime to the recruitment of indentured labour from China and from the Solomon Islands. The New Zealand Government, however, for economic and social reasons, has gradually reduced the number of Chinese, until at 31st March, 1948, there were only 285 left in the territory. Of these, 126 were awaiting repatriation to China, and the remainder are being permitted to remain in the territory. There were 72 Melanesian labourers remaining in Western Samoa at 31st March, 1948, practically all of whom were employed by the New Zealand Reparation Estates.
New Zealand has extended a number of International Labour Organization conventions to Western Samoa, and consideration is being given to the advisability of introducing industrial legislation to suit the needs of the Territory.
Trade.—The exports and imports of Western Samoa for each of the last eleven years are:—
| Year. | Exports. | Imports. |
|---|---|---|
| £ | £ | |
| 1937 | 352,436 | 267,868 |
| 1938 | 248,605 | 196,272 |
| 1939 | 220,409 | 194,736 |
| 1940 | 221,733 | 165,453 |
| 1941 | 242,881 | 154,335 |
| 1942 | 385,976 | 299,664 |
| 1943 | 278,213 | 605,911 |
| 1944 | 391,317 | 460,764 |
| 1945 | 630,446 | 398,760 |
| 1946 | 719,050 | 478,695 |
| 1947 | 1,351,770 | 923,773 |
The next table shows for the years 1946 and 1947 the export and import values according to country of destination and country of origin respectively.
| Country. | Exports. | Imports. | ||
|---|---|---|---|---|
| 1946. | 1947. | 1946. | 1947. | |
| £ | £ | £ | £ | |
| New Zealand | 269,504 | 363,120 | 172,487 | 289,892 |
| Australia | 11,964 | 13,808 | 73,806 | 133,396 |
| United Kingdom | 216,843 | 671,558 | 107,268 | 120,671 |
| Canada | 59,639 | 245 | 23,503 | 98,701 |
| Fiji | 14,067 | 23,338 | ||
| India | 10,196 | 12,927 | ||
| United States of America | 145,253 | 299,803 | 65,858 | 224,890 |
| Other | 15,847 | 3,236 | 11,510 | 19,958 |
| Totals | 719,050 | 1,351,770 | 478,695 | 923,773 |
The principal exports in 1947 consisted of copra, £722,272; cocoa-beans, £448,794; bananas, £70,317; desiccated coconut, £79,249; rubber, £3,941; and dried bananas, £18,851.
Control of Trade and Finance.—Similar measures in regard to trade and finance to those described on page 815 in relation to the Cook Islands were brought into operation in Samoa by the Samoa Import Control Regulations 1944 and the Samoa Finance Emergency Regulations 1944 (amended in 1945). An important exception is that a licence is necessary for certain goods imported from Now Zealand.
These measures were introduced more particularly to ensure the supply of essential goods from exporting countries. There is no impairment of the authority of the local Administration to permit imports from any country from which they may be available.
Public Finance.—In the years shortly following the establishment of the Mandate Administration in 1920 New Zealand made free gifts for public services amounting to £269,362, and, in addition, advanced £179,200 by way of loans. No further grants or loans have been necessary since 1931–32, the Territory during that period having been fully self-supporting, but the New Zealand Government made grants of £3,107 in 1945–46 and £2,351 in 1946–47 to cover the cost of scholarships for Samoan pupils in New Zealand schools. In addition, a grant of £8,100 was made during 1946–47 as a pound for pound subsidy on a now roading scheme that is being undertaken. Subsidies' paid by the New Zealand Government in 1947–48 amounted to £43,012, made up of £7,552 for overseas scholarships, £22,475 for broadcasting, and £12,985 for roads. In addition to these cash grants, the New Zealand Government has provided free educational equipment to Samoan schools. All loan indebtedness has been fully paid off, and there was an accumulated surplus of £607,155 at 31st March, 1948, £544,375 of which is invested in New Zealand.
The following table shows the total revenue and expenditure for each of the last five years. The principal items of expenditure are also shown.
| Year Ended 31st March | Revenue. | Expenditure. | |||||
|---|---|---|---|---|---|---|---|
| Repayment of Loans. | Education. | Samoan Affairs. | Public Health. | Public Works. | Total (Including “other”). | ||
NOTE.—Expenditure on schools, hospital buildings, and Native administration buildings from 1945–46 is included under correct headings; prior to 1945–46 such expenditure was included under “Public Works.” The table does not include subsidies from New Zealand for specific purposes from 1945–46 onwards. | |||||||
| £ | £ | £ | £ | £ | £ | £ | |
| 1944 | 278,092 | 71,681 | 10,099 | 9,165 | 29,814 | 54,749 | 227,220 |
| 1945 | 281,033 | 9,242 | 15,921 | 10,086 | 36,036 | 59,787 | 225,879 |
| 1946 | 284,292 | 18,549 | 15,666 | 50,699 | 72,420 | 231,527 | |
| 1947 | 334,838 | 28,610 | 18,327 | 65,492 | 50,134 | 231,236 | |
| 1948 | 548,682 | 39,504 | 19,681 | 78,426 | 138,958 | 359,285 | |
The principal sources of revenue are import and export duties, which for the financial year ended 31st March, 1948, produced £240,563 and £99,142 respectively. Other taxes for the financial year ended 31st March, 1948, included a graduated store-tax payable on business turnovers (£42,761), a graduated salary-tax (£2,871), building-tax (£3,210), and water rates (£1,390).
Staff.—The staff employed by the Administration at 31st March, 1948, numbered 1,535, of whom 717 were casual employees. In addition, there were 289 elective Native Samoan district and village officials. Particulars for the last two years are as follows:—
| Departments. | Europeans. | Persons of Part Samoan Blood. | Native Samoans. | Elective Samoan District and Village Officials. | ||||
|---|---|---|---|---|---|---|---|---|
| 1947. | 1948. | 1947. | 1948. | 1947. | 1948. | 1947. | 1948. | |
| Government House | 2 | 2 | ||||||
| Secretariat | 3 | 3 | 5 | 5 | 2 | 2 | ||
| Police and Prisons | 4 | 6 | 6 | 6 | 58 | 66 | ||
| Justice | 1 | 2 | 8 | 8 | 1 | 1 | ||
| Treasury and Customs | 9 | 5 | 13 | 19 | 4 | 4 | ||
| Lands and Survey | 2 | 3 | 3 | 3 | 2 | 2 | ||
| Postal, Radio, Broadcasting | 7 | 9 | 14 | 21 | 21 | 28 | ||
| Public Works | 6 | 7 | 9 | 9 | 5 | 10 | ||
| Education | 15 | 19 | 26 | 23 | 238 | 308 | ||
| Health | 16 | 18 | 4 | 4 | 192 | 200 | ||
| Samoan Affairs | 3 | 3 | 4 | 3 | 16 | 19 | 296 | 289 |
| 68 | 77 | 92 | 101 | 539 | 640 | 296 | 289 | |
| Casual employees | 1 | 55 | 75 | 338 | 642 | |||
| Totals | 69 | 77 | 147 | 176 | 877 | 1,282 | 296 | 289 |
TOKELAU ISLANDS.—Situated some three hundred miles to the north of Western Samoa, between 8° and 10° south latitude and between 171° and 173° west longitude, are the three atoll islands of Atafu, Nukunono, and Fakaofo, of the Tokelau, or Union, Group. A fourth island (Swain's or Gonté Hermosa), belonging to the United States of America and lying 100 miles to the south of Fakaofo, completes the group.
The islands were discovered in the year 1765 by Commodore Byron, R.N. In 1916 the Native inhabitants of Atafu, Nukunono, and Fakaofo ceded their islands to Great Britain, and from then until 1925 they were governed by the High Commissioner for the Western Pacific and administered as part of the Gilbert and Ellice Islands Colony. On 11th February, 1926, they were formally disannexed from this colony, and at the request of His Majesty's Government the New Zealand Government agreed to undertake the government and administration of the islands. They have since been administered (actually since 1st October, 1925) by the Administrator (now known as the High Commissioner) of Western Samoa on behalf of the New Zealand Government. During the 1948 session the Now Zealand Parliament passed an Act entitled the Tokelau Islands Act, under which the Tokelau Islands were declared to form part of New Zealand. This Act emerged as the result of an agreement between the United Kingdom and New Zealand Governments. The administration of the islands will still be exercised by the High Commissioner of Western Samoa.
Each atoll is composed of a number of coral islets surrounding a central lagoon. These vary in size from 100 yards to four miles in length, while none is wider than 400 yards nor, with but few exceptions, higher than 10 ft. above sea-level. The land area of each atoll is approximately as follows: Fakaofo, 700 acres; Atafu, 600 acres; Nukunono, 1,370 acres.
Owing to the absence of humus in the soil, the vegetation is practically restricted to coconut-palms, although one islet of each atoll is reserved for growing the tauanave, or tausunu, a short stubby tree which yields to the Natives their only timber for the construction of canoes, houses, and utensils.
The Natives, though closely allied to the Samoans, have not such a fine physique, nor have they such fine looks. Intermarriage with Gilbert and other islanders has probably lessened the strain of pure Polynesian blood to a greater extent than in the case of the Native Sampans. There are no European officials in the group.
A census of the Tokelau Islands was taken on 25th September, 1945, by the Western Samoan Administration, and the results, together with corresponding data as at the census of 4th November, 1936, are contained in the following table.
| Island | Census of 4th November, 1936. | Census of 25th September, 1945. | ||||
|---|---|---|---|---|---|---|
| Males. | Females. | Total. | Males. | Females. | Total. | |
*Excludes 28 members of the United States Forces in the Tokelau Islands on census night. | ||||||
| Fakaofo | 247 | 261 | 508 | 270 | 300 | 570 |
| Atafu | 178 | 200 | 378 | 205 | 246 | 451 |
| Nukunono | 143 | 141 | 284 | 198 | 169 | 367 |
| Totals | 668 | 602 | 1,170 | 673 | 715 | 1,388* |
The 1945 Census figures also revealed that there were 153 Tokelau Islanders absent in Samoa at the date of the 1945 Census, mostly attending the London Missionary Society and Roman Catholic schools there. On the other hand, there were 15 Samoans present in the Tokelau Islands at the time of the census. The population at 31st December, 1947, was 1,416.
On Atafu all the inhabitants belong to the London Missionary Society, and on Nukunono all are adherents of the Roman Catholic Mission. On Fakaofo the greater number belong to the London Missionary Society. At the date of the census taken in September, 1945, there were 97 Catholics on this atoll. Both Missions—the Roman Catholic and the London Missionary Society—have their headquarters in Samoa, from which the work in the Tokelau Islands is administered. The London Missionary Society's ship “John Williams” has now resumed annual visits to Atafu and Fakaofo, and since December, 1946, there have been two Catholic priests—one European and one Samoan—in residence at Nukunono. It is also the intention of this Mission to settle a number of sisters in Nukunono in the near future to establish a convent school. Buildings have been erected and are almost ready for occupation, and it was expected that the Mission in Nukunono would be fully established before the end of 1948.
There are no local European officials in the Tokelau Islands, nor is it considered that any are necessary. If a resident District Officer were appointed he would not be able to fill in his time with administrative duties, and could only properly supervise the island in which he resided. The group is administered through the Department of Samoan Affairs in Samoa, and is visited once a year by the High Commissioner. Units of the Royal New Zealand Navy also make annual visits. The following is the staff establishment of officials for each of the three atolls:—
Faipule and Magistrate (Fa`amasino)
Pulenu`u (Mayor of village).
Failantusi (clerk and postal officer).
Wireless Operator.
Chief of Police.
Police.
Wardress.
Native Medical Practitioner.
Native Nurse.
Dresser.
Weather Reporter.
There is one Tokelau medical practitioner in residence at Atafu, and a Samoan medical practitioner divides his time between Fakaofo and Nukunono.
Apart from the Chiefs of Police, there are three police at Atafu, two at Nukunono, and three at Fakaofo.
A Samoan trained nurse has been added to the staff at Fakaofo to take charge of infant welfare work.
At Atafu and Nukunono the wireless operators perform the weather-reporting duties, but at Fakaofo this work is done by an additional member of the staff.
Health services in the Tokelau Islands are organized and supervised from Apia, from where also the supplies are drawn. The incidence of disease in the Islands is slight. There have been no cases of smallpox, leprosy, plague, or cholera, and yellow fever is unknown. The only mosquito identified in the islands is the Aedes pseudoscutellaris, and filaria is present, carried by this mosquito. There is no malaria. Recent surveys reveal a micro-filarial of about 10 per cent., most of the carriers having resided either in Samoa or some other endemic zone for at least some months. No cases of syphilis have been reported, although yaws is common amongst the children. This disease, however, is quickly reduced by appropriate therapy.
Water-tanks have been established on each of the living islets. At Fakaofo there are three tanks with a total capacity of 43,800 gallons and a catchment area of 2,646 square feet. At Nukunono there are three tanks with a total capacity of 35,000 gallons and a catchment area of 2,700 square feet. At Atafu the two tanks have a total capacity of 42,500 gallons, with a catchment area of 2,700 square feet. On Fakaofo there are two wells, and on Atafu one of a less satisfactory nature, all of which are available for use for washing purposes. Three of the tanks, one in each atoll, have been completed within the last few years.
Village schools under mission pastors or catechists are maintained on each island, education being limited for the most part to elementary arithmetic, reading and writing the Samoan language, and scriptural literature. Stationery, material, and other equipment have been supplied from time to time, and it is intended to send also School Journals in Samoan, and, as they become available in the future, elementary text-books in the Samoan and English languages. Certain of the brighter Tokelau children are sent from time to time to attend London Missionary Society or Catholic schools in Samoa. Likely lads have also been chosen to receive training in Government schools with a view to appointing them later as clerks, radio operators, or, as the Tokelau people have themselves requested, possibly as medical cadets with a view to later training as medical practitioners if they prove suitable.
The only exportable products of the islands are copra and good-quality plaited reversible floor-mats.
NAURU.—Prior to its forcible occupation by Japan on or about 25th August, 1942, the Island of Nauru was administered under a mandate, dated 17th December, 1920, conferred upon His Britannic Majesty and approved by the League of Nations. This mandate was held jointly by the Governments of Australia, Great Britain, and New Zealand, and by a mutual agreement the Administration was in practice left to the Australian Government. On 14th September, 1945, the Japanese garrison on the island surrendered, and civil administration was re-established on 1st November, 1945. In January, 1946, the Australian Prime Minister announced that, with the concurrence of the Governments of the United Kingdom and New Zealand, Australia would negotiate a trusteeship agreement with a view to bringing the Mandated Territory of Nauru under the International Trusteeship System. Meanwhile a petition was prepared by the Nauruan Council of Chiefs and submitted to the President of the United Nations Trusteeship Council, asking for “a representative from the United Nations Organization to visit Nauru and inquire fully into, and discuss the Administration of the Island with a view to Nauruans taking some share of Administrative responsibility”. The Trusteeship Council informed the petitioners that the 1950 visiting Mission was scheduled to visit the Territory, and that in the meantime the Council was awaiting the observations of the administering authority.
Nauru Island is barely one-third of a degree below the equator and lies 166° 56' east of Greenwich. It is an elevated island about three and a half miles long and two and a half miles wide, with a circumference of twelve miles and an area of 5,260 acres. With the exception of a narrow coastal belt favourable for the growth of coconuts, and of a brackish lagoon, the island consists of phosphate deposits overlying a bed of coralliferous limestone. The island is completely surrounded by a coral reef, and beyond the reef the sea-bed slopes sharply downwards at an angle of 45°. These two factors, together with the presence of the strong equatorial current of two knots, materially affect the shipping facilities of the island. The fact that the island lies in the latitude of the easterly trade winds, which blow from nine to ten months of the year, is also significant, since it explains the comparative absence of rainfall, a condition necessary for the existence of phosphate deposits.
The mining rights are vested in the British Phosphates Commission, subject to the rights of the Native landowners, and the deposits, as well as those on Ocean Island about 165 miles to the east of Nauru, are worked by the Commission.
The deposits do not appear to be simple guano, and some authorities consider them to be of a marine sedimentary origin raised from the sea-bed and subjected to weathering.
From the point of view of phosphate manufacture the deposits are of a very high grade, exports averaging 85.4 per cent. tricalcic phosphate and 3.4 per cent. calcium carbonate. Owing to the uneven nature of the outcrops of coralliferous limestone the extent of the deposits cannot be measured accurately, but it is estimated that there are between fifty and ninety million tons of phosphatic rock available.
Phosphate exports from Nauru for the year ended 30th June, 1940, amounted to 808,400 tons, valued at £541,168. The destinations of these ex-ports were Australia, 459,300 tons; New Zealand, 281,650 tons; United Kingdom, 22,900 tons; and Japan, 44,500 tons.
Although export was resumed on a limited scale in July, 1946, it was expected that it would be at least four years before the re-establishment of the phosphate industry was completed and full production again reached. Upon reoccupation it was found that the destruction of the buildings and plant of the Administration and of the British Phosphate Commission had been extensive. Exports in the year ended 30th June, 1948, amounted to 263,507 tons, valued at £527,014, of which Australia received 179,257 tons and New Zealand 84,250 tons.
The following table shows the population of Nauru for the years 1940–42 and 1946–48. The figures for 1942 relate to 25th August, the date of the Japanese invasion.
| Year. | Chinese. | Europeans. | Other Pacific Islanders. | Total Immigrants. | Indigenous. | Island Total. |
|---|---|---|---|---|---|---|
| 1940 | 1,350 | 192 | 49 | 1,591 | 1,761 | 3,352 |
| 1941 | 584 | 68 | 193 | 845 | 1,827 | 2,672 |
| 1942 | 194 | 7 | 193 | 394 | 1,848 | 2,242 |
| 1946 | 778 | 79 | 21 | 878 | 1,369 | 2,247 |
| 1947 | 1,163 | 192 | 31 | 1,386 | 1,379 | 2,765 |
| 1948 | 1,370 | 247 | 97 | 1,714 | 1,448 | 3,162 |
Revenue and expenditure and trade of the Nauru Administration since 1940 were as follows:—
| Year. | Revenue. | Expenditure. | Exports. | Imports. |
|---|---|---|---|---|
| £ | £ | £ | £ | |
| 1940 | 27,104 | 26,223 | 541,168 | 192,749 |
| 1941 | 12,023 | 23,951 | 69,375 | 106,978 |
| 1st Jan., 1942–30th June, 1947 | 28,033 | 107,543 | 192,946 | 543,916 |
| 1947–48 | 23,745 | 96,347 | 527,014 | 621,764 |
Imports consist almost entirely of food-supplies, and of machinery for the working of the phosphate.
THE ROSS DEPENDENCY.—By Imperial Order in Council of 30th July, 1923, the coasts of the Ross Sea, with the adjacent islands and territories between the 160th degree of east longitude and the 150th degree of west longitude, and south of the 60th degree of south latitude, were proclaimed a British settlement, within the meaning of the British Settlements Act, 1887, under the name of the Rose Dependency, and the dependency was placed under the jurisdiction of the Governor-General of New Zealand.
It is estimated that the mainland area is about 175,000 square miles; but, being completely ice-covered, it is uninhabited. On various occasions bases have been established on the mainland by Antarctic expeditions, which have made extensive explorations within the territory and on contiguous portions of the continent. As yet no economic wealth has been won from the mainland, but the territorial waters, with their large numbers of whales, have been the scene of operations for numerous factory whaling-ships. There has been, however, no New Zealand capital invested in these enterprises.
An article on the Ross Dependency, written by Mr. M. J. S. Nestor, appeared in the 1938 number of the Year-Book (pp. 900–903).
Whaling.—Regulations dated the 24th October, 1929, which supersede those of 1st November, 1926, prohibit whaling operations within the boundaries of the Ross Dependency without a licence, for which the annual fee payable is £200, and in addition to which the Government requires a royalty of 2s. 6d. per barrel (40 gallons) of whale-oil. The owner or master of a vessel engaged in whaling or used as a floating whale-factory is liable to a fine not exceeding £1,000 for each day on which operations are carried on without a licence. A penalty not exceeding £100 per day is provided for in cases of non-compliance with the terms of the licence granted in respect of any vessel used for whaling or as a floating factory, and a similar penalty for failure to equip a floating factory in accordance with the requirements of the regulations, or for failure to convert a whale into commercial products within forty-eight hours after delivery at the factory. Provision is made for the arrest on warrant of any vessel in respect of which an offence against the regulations is committed.
The regulations apply, of course, only to territorial waters, and operations are carried on outside territorial waters by unlicensed expeditions. The great majority of whales are taken outside territorial waters.
The Whaling Industry Act, 1935, gives legislative effect, so far as New Zealand is concerned, to the International Whaling Convention signed at Geneva in 1931. The general principles of the Convention are in the direction of conservation of whales and regulation of the industry.
An international agreement signed in June, 1937, embodied further provisions for the regulation of the whaling industry, and from time to time supplementary protocols determine the conditions in accordance with which whaling will be conducted.
Table of Contents
His Excellency Lieutenant-General Sir Bernard Cyril Freyberg, V.C., G.C.M.G., K.C.B., K.B.E., D.S.O., LL.D., D.C.L.
Military Secretary and Comptroller of the Household—Squadron-Leader P. R. Clapham, D.F.C. and Bar, Royal Air Force Reserve.
Official Secretary—D. E. Fouhy, Esq., C.B.E.
Aides-de-Camp—Flight-Lieutenant D. Roberts, D.F.C., A.F.C., R.A.F.; Lieutenant A. C. Tait, D.S.C., R.N.
Honorary Aides-de-Camp—
Naval: Commander S. W. Hicks, V.R.D., R.N.Z.N.V.R.; Commander J. G. Hilliard, D.S.C., V.R.D., R.N.Z.N.V.R.; Lieutenant-Commander P. T. Williams, R.N.
Military: Lieutenant-Colonel J. A. Bretherton, R.N.Z.A.; Lieutenant-Colonel W. S. McKinnon, O.B.E., R.N.Z.A.; Lieutenant-Colonel E. A. McPhail, D.S.O., M.C., R.N.Z. Inf. Corps; Lieutenant-Colonel H. T. W. Nolan, D.S.O., R.N.Z.A.
Air: Squadron-Leader G. R. Brabyn, A.F.C., R.N.Z.A.F.; Wing-Commander J. W. H. Bray, R.N.Z.A.F.; Wing-Commander T. F. Gill, D.S.O., R.N.Z.A.F.; Squadron-Leader W. R. Kofoed, D.S.O., D.F.C., R.N.Z.A.F.
Honorary Physicians—Surgeon-Captain E. S. McPhail, V.R.D., R.N.Z.N.; Group-Captain P. B. L. Potter, O.B.E., R.A.F.
Honorary Surgeon—Colonel R. A. Elliott, O.B.E., R.N.Z.A.M.C.
His Excellency assumed office on the 17th June, 1946.
For details of previous vice-regal representatives reference should be made to various issues of the Year-Book, while a complete list of the earlier vice-regal representatives will be found in the 1931 issue (pp. 59–60).
SINCE THE ESTABLISHMENT OF RESPONSIBLE GOVERNMENT IN NEW ZEALAND IN 1856
| Name of Ministry. | Name of Premier. | Assumed Office. | Retired. |
|---|---|---|---|
| 1. Bell-Sewell | Henry Sewell | 7 May, 1856 | 20 May, 1856. |
| 2. Fox | William Fox | 20 May, 1856 | 2 June, 1856. |
| 3. Stafford | Edward William Stafford | 2 June, 1856 | 12 July, 1861. |
| 4. Fox | William Fox | 12 July, 1861 | 6 Aug., 1862. |
| 5. Domett | Alfred Domett | 6 Aug., 1862 | 30 Oct., 1863. |
| 6. Whitaker-Fox | Frederick Whitaker | 30 Oct., 1863 | 24 Nov., 1864. |
| 7. Weld | Frederick Aloysius Weld | 24 Nov., 1864 | 16 Oct., 1865. |
| 8. Stafford | Edward William Stafford | 16 Oct., 1865 | 28 June, 1869. |
| 9. Fox | William Fox | 28 June, 1869 | 10 Sept., 1872. |
| 10. Stafford | Edward William Stafford | 10 Sept., 1872 | 11 Oct., 1872. |
| 11. Waterhouse | George Marsden Waterhouse | 11 Oct., 1872 | 3 Mar., 1873. |
| 12. Fox | William Fox | 3 Mar., 1873 | 8 April, 1873. |
| 13. Vogel | Julius Vogel, C.M.G. | 8 April, 1873 | 6 July, 1875. |
| 14. Pollen | Daniel Pollen, M.L.C. | 6 July, 1875 | 15 Feb., 1876. |
| 15. Vogel | Sir Julius Vogel, K.C.M.G. | 15 Feb., 1876 | 1 Sept., 1876. |
| 16. Atkinson | Harry Albert Atkinson | 1 Sept., 1876 | 13 Sept., 1876. |
| 17. Atkinson (reconstituted) | Harry Albert Atkinson | 13 Sept., 1876 | 13 Oct., 1877. |
| 18. Grey | Sir George Grey, K.C.B. | 15 Oct., 1877 | 8 Oct., 1879. |
| 19. Hall | John Hall | 8 Oct., 1879 | 21 April, 1882. |
| 20. Whitaker | Frederick Whitaker, M.L.C. | 21 April, 1882 | 25 Sept., 1883. |
| 21. Atkinson | Harry Albert Atkinson | 25 Sept., 1883 | 16 Aug., 1884. |
| 22. Stout-Vogel | Robert Stout | 16 Aug., 1884 | 28 Aug., 1884. |
| 23. Atkinson | Harry Albert Atkinson | 28 Aug., 1884 | 3 Sept., 1884. |
| 24. Stout-Vogel | Sir Robert Stout, K.C.M.G. | 3 Sept., 1884 | 8 Oct., 1887. |
| 25. Atkinson | Sir Harry Albert Atkinson, K.C.M.G. | 8 Oct., 1887 | 24 Jan., 1891. |
| 26. Ballance | John Ballance | 24 Jan., 1891 | 1 May, 1893. |
| 27. Seddon | Rt. Hon. Richard John Seddon, P.C. | 1 May, 1893 | 21 June, 1906. |
| 28. Hall-Jones | William Hall-Jones | 21 June, 1906 | 6 Aug., 1906. |
| 29. Ward | Rt. Hon. Sir Joseph George Ward, Bart., P.C., K.C.M.G. | 6 Aug., 1906 | 28 Mar., 1912. |
| 30. Mackenzie | Thomas Mackenzie | 28 Mar., 1912 | 10 July, 1912. |
| 31. Massey | Rt. Hon. William Ferguson Massey, P.C. | 10 July, 1912 | 12 Aug., 1915. |
| 32. National | Rt, Hon. William Ferguson Massey, P.C. | 12 Aug., 1915 | 25 Aug., 1919. |
| 33. Massey | Rt. Hon. William Ferguson Massey, P.C. | 25 Aug., 1919 | 14 May, 1925. |
| 31. Bell | Hon. Sir Francis Henry Dillon Bell, G.C.M.G., K.C. | 14 May, 1925 | 30 May, 1925. |
| 35. Coates | Rt. Hon. Joseph Gordon Coates, P.O., M.C. | 30 May, 1925 | 10 Dec., 1928. |
| 36. Ward | Rt. Hon. Sir Joseph George Ward. Bart, P.O., G.C.M.G. | 10 Dec., 1928 | 28 May, 1930. |
| 37. Forbes | Rt. Hon. George William Forbes, P.C. | 28 May, 1930 | 22 Sept., 1931. |
| 38. Coalition | Rt. Hon. George William Forbes, P.C. | 22 Sept., 1931 | 6 Dec, 1935. |
| 39. Labour | Rt. Hon. Michael Joseph Savage, P.C. | 6 Dec., 1935 | 1 April, 1940. |
| 40. Labour | Hon. Peter Fraser | 1 April, 1940 | 30 April, 1940. |
| 41. Labour | Rt. Hon. Peter Fraser, P.C. | 30 April, 1940 | 13 Dec, 1949. |
| 42. Holland | Sidney George Holland | 13 Dec, 1949 |
(to 13th December, 1949)
His Excellency the GOVERNOR-GENERAL
Right Hon. P. FRASER, P.C., C.H., Prime Minister, Minister of External Affairs, Minister of Maori Affairs, Minister of Island Territories, and Minister in Charge of Police, Legislative, Electoral, and Audit Departments, and Maori Trust Office.
Right Hon. W. NASH, P.C., Minister of Finance, Minister of Customs, Minister of Stamp Duties, and Minister in Charge of State Advances Corporation, Land and Income Tax, Census and Statistics, and Friendly Societies and National Provident Fund Departments, and Government Service Superannuation.
Hon. H. G. R. MASON, Attorney-General, Minister of Justice, and Minister in Charge of Prisons, Patents Office, Public Trust Office, and State Fire Insurance and Government Life Insurance Departments.
Hon. R. SEMPLE, Minister of Works, Minister of Railways, and Minister in Charge of State Hydro-electric Department, and Roads and Public Buildings.
Hon. W. E. PARRY, Minister of Internal Affairs, Minister of Social Security, and Minister in Charge of Department of Tourist and Health Resorts, and Registrar-General's Office.
Hon. F. JONES, Minister of Defence, and Minister in Charge of Broadcasting, Air Department, and War Pensions.
Hon. A. H. NORDMEYER, Minister of Industries and Commerce, Minister of Supply and Munitions.
Hon. C. F. SKINNER, M.C., Minister of Rehabilitation, Minister of Lands, Commissioner of State Forests, and Minister in Charge of Valuation Department, and Land for Settlements, and Scenery Preservation.
Hon. A. McLAGAN, Minister of Labour, Minister of Mines, Minister of Employment, and Minister of Immigration. Hon. E. L. CULLEN, Minister of Agriculture, Minister of Marketing.
Hon. P. HACKETT, Postmaster-General and Minister of Telegraphs, Minister of Marine, Minister of Transport, and Minister in Charge of Inspection of Machinery Department.
Hon. MABEL B. HOWARD, Minister of Health and Minister in Charge of Mental Hospitals.
Hon. T. H. McCOMBS, Minister of Education and Minister in Charge of Scientific and Industrial Research.
Hon. E. T. TIRIKATENE, Member of the Executive Council representing the Maori Race and Minister in Charge of Printing and Stationery Department.
Hon. D. WILSON, Member of the Executive Council without Portfolio and Leader of the Legislative Council.
Clerk of the Executive Council—T. J. Sherrard, O.B.E.
(Assumed Office, 30th April, 1940; Retired, 13th December, 1949)
| Name and Office. | From | To |
|---|---|---|
* Deceased. NOTE.—The first twelve of these Ministers were also members of the two previous Ministries, the first assuming office on 6th December, 1935, and the second on 1st April, 1940. | ||
| Right Hon. Peter Eraser, P.C., C.H.— | ||
| Prime Minister | 30 April, 1940 | 13 December, 1949. |
| Minister of External Affairs | 7 July, 1943 | 13 December, 1949. |
| Minister of Island Territories | 7 July, 1943 | 13 December, 1949. |
| Minister of Employment | 28 March, 1946 | 19 December, 1946. |
| Native Minister | 19 December, 1946 | 17 December, 1947. |
| Minister of Maori Affairs | 17 December, 1947 | 13 December, 1949. |
| Right Hon. Walter Nash, P.C.— | ||
| Minister of Finance | 30 April, 1940 | 13 December, 1949. |
| Minister of Customs | 30 April, 1940 | 13 December, 1949. |
| Minister of Stamp Duties | 30 April, 1940 | 13 December, 1949. |
| Minister of Marketing | 30 April, 1940 | 21 January, 1941. |
| Daniel Giles Sullivan*— | ||
| Minister of Industries and Commerce | 30 April, 1940 | 8 April, 1947. |
| Minister of Railways | 30 April, 1940 | 21 January, 1941. |
| Minister of Supply and Munitions | 30 April, 1940 | 8 April, 1947. |
| Henry Greathead Rex Mason— | ||
| Minister of Education | 30 April, 1940 | 18 October, 1947. |
| Attorney-General | 30 April, 1940 | 13 December, 1949. |
| Minister of Justice | 30 April, 1940 | 13 December, 1949. |
| Native Minister | 7 July, 1943 | 19 December, 1946. |
| Hubert Thomas Armstrong*— | ||
| Minister of Health | 30 April, 1940 | 21 January, 1941. |
| Minister of Public Works | 21 January, 1941 | 8 November, 1942. |
| Robert Semple— | ||
| Minister of Public Works | 30 April, 1940 | 21 January, 1941. |
| Minister of Transport | 30 April, 1940 | 9 December, 1942. |
| Minister of Marine | 30 April, 1940 | 12 June, 1940. |
| Minister of National Service | 13 June, 1940 | 30 June, 1942. |
| Minister of Railways | 21 January, 1941 | 13 December, 1949. |
| Minister of Marine | 21 January, 1941 | 9 December, 1942. |
| Minister of Public Works | 9 December, 1942 | 16 April, 1943. |
| Minister of Works | 16 April, 1943 | 13 December, 1949. |
| William Edward Parry— | ||
| Minister of Internal Affairs | 30 April, 1940 | 13 December, 1949. |
| Minister of Social Security | 25 June, 1946 | 13 December, 1949. |
| Patrick Charles Webb— | ||
| Minister of Mines | 30 April, 1940 | 27 June, 1946. |
| Minister of Labour | 30 April, 1940 | 27 June, 1946. |
| Postmaster-General and Minister of Telegraphs | 30 April, 1940 | 19 December, 1946. |
| Minister of Immigration | 12 April, 1944 | 19 December, 1946. |
| Frederick Jones— | ||
| Minister of Defence | 30 April, 1940 | 13 December, 1949. |
| William Leo Martin— | ||
| Minister of Agriculture | 30 April, 1940 | 21 January, 1941. |
| Frank Langstone— | ||
| Minister of Lands | 30 April, 1940 | 21 December, 1942. |
| Commissioner of State Forests | 30 April, 1940 | 21 December, 1942. |
| Minister of External Affairs | 30 April, 1940 | 21 December, 1942. |
| Native Minister | 30 April, 1940 | 21 December, 1942. |
| Minister for the Cook Islands | 30 April, 1940 | 21 December, 1942. |
| David Wilson, M.L.C.— | ||
| Minister of Immigration | 30 April, 1940 | 8 April, 1944. |
| Member of Executive Council without portfolio | 18 June, 1947 | 13 December, 1949. |
| Dr. David Gervan McMillan— | ||
| Minister of Marine | 12 June, 1940 | 21 January, 1941. |
| James Gillispie Barclay— | ||
| Minister of Agriculture | 21 January, 1941 | 18 October, 1943. |
| Minister of Marketing | 21 January, 1941 | 18 October, 1943. |
| Minister of Lands | 7 July, 1943 | 18 October, 1943. |
| Commissioner of State Forests | 7 July, 1943 | 18 October, 1943. |
| Arnold Henry Nordmeyer— | ||
| Minister of Health | 21 January, 1941 | 29 May, 1947. |
| Minister of Industries and Commerce | 29 May, 1947 | 13 December, 1949. |
| Minister of Supply and Munitions | 29 May, 1947 | 13 December, 1949. |
| Paraire Karaka Paikea*— | ||
| Member of Executive Council without portfolio | 21 January, 1941 | 6 April, 1943. |
| James O'Brien*— | ||
| Minister of Transport | 9 December, 1942 | 28 September, 1947. |
| Minister of Marine | 9 December, 1942 | 28 September, 1947. |
| Minister of Mines | 27 June, 1946 | 19 December, 1946. |
| Minister of Labour | 27 June, 1946 | 19 December, 1946. |
| Eruera Tihema Tirikatene— | ||
| Member of Executive Council without portfolio | 26 May, 1943 | 13 December, 1949. |
| Angus McLagan— | ||
| Member of Executive Council without portfolio | 30 June, 1942 | 19 December, 1946. |
| Minister of Labour | 19 December, 1946 | 13 December, 1949. |
| Minister of Mines | 19 December, 1946 | 13 December, 1949. |
| Minister of Employment | 19 December, 1946 | 13 December, 1949. |
| Minister of Immigration | 19 December, 1946 | 13 December, 1949. |
| Clarence Farringdon Skinner, M.C.— | ||
| Minister of Rehabilitation | 24 July, 1943 | 13 December, 1949. |
| Minister of Lands | 26 Nov., 1943 | 13 December, 1949. |
| Commissioner of State Forests | 12 April, 1944 | 13 December, 1949. |
| Benjamin Roberts— | ||
| Minister of Agriculture | 29 October, 1943 | 19 December, 1946. |
| Minister of Marketing | 29 October, 1943 | 19 December, 1946. |
| Edward Lutterell Cullen— | ||
| Minister of Agriculture | 19 December, 1946 | 13 December, 1949. |
| Minister of Marketing | 19 December, 1946 | 13 December, 1949. |
| Frederick Hackett— | ||
| Postmaster-General and Minister of Telegraphs | 19 December, 1946 | 13 December, 1949. |
| Minister of Marine | 18 October, 1947 | 13 December, 1949. |
| Minister of Transport | 18 October, 1947 | 13 December, 1949. |
| Mabel Bowden Howard— | ||
| Minister of Health | 29 May, 1947 | 13 December, 1949. |
| Terence Henderson McCombs— | ||
| Minister of Education | 18 October, 1947 | 13 December, 1949. |
UNDER LABOUR MINISTRY, 30TH APRIL, 1940 to 13TH DECEMBER, 1949
ARTHUR GEORGE OSBORNE, M.P., Parliamentary Under-Secretary in relation to the office of the Prime Minister. Appointed 15th February, 1943; resigned 12th
December, 1949. DAVID WILLIAM COLEMAN, M.P., Parliamentary Under-Secretary in relation to the office of the Minister of Works. Appointed 5th March, 1947; resigned 16th November, 1949.
MICHAEL MOOHAN, M.P., Parliamentary Under-Secretary in relation to the office of the Prime Minister. Appointed 18th April, 1947; resigned, 12th December, 1949.
HARRY ERNEST COMBS. M.P., Parliamentary Under-Secretary in relation to the office of the Minister of Finance. Appointed 7th November, 1917; resigned, 12th December, 1949.
(From 13th December, 1949)
His Excellency the GOVERNOR-GENERAL
Hon. S. G. HOLLAND, Prime Minister, Minister of Finance, and Minister in Charge of Legislative, Audit, and Electoral Departments.
Hon. K. J. HOLYOAKE, Minister of Agriculture, Minister of Marketing, and Minister in Charge of Scientific and Industrial Research.
Hon. W. SULLIVAN, Minister of Labour, Minister of Employment, Minister of Mines, and Minister of Immigration.
Hon. T. C. WEBB, Attorney-General, Minister of Justice, and Minister in Charge of Prisons and of Patents Office.
Hon. R. M. ALGIE, Minister of Education.
Hon. W. A. BODKIN, Minister of Internal Affairs, and Minister in Charge of Friendly Societies and National Provident Fund.
Hon. C. M. BOWDEN, Minister of Customs, Minister of Industries and Commerce, Minister of Supply, Minister of Stamp Duties, Associate Minister of Finance, and Minister in Charge of Land and Income Tax.
Hon. W. J. BROADFOOT, Postmaster-General and Minister of Telegraphs, and Minister in Charge of Valuation and Government Printing and Stationery Departments.
Hon. E. B. CORBETT, Minister of Lands, Minister of Forests, Minister of Maori Affairs, and Minister in Charge of Maori Trust Office.
Hon. F. W. DOIDGE, Minister of External Affairs, Minister of Island Territories, and Minister in Charge of Broadcasting, and Tourist and Health Resorts.
Hon. W. S. GOOSMAN, Minister of Works, Minister of Railways, Minister of Transport, Minister of Marine, and Minister in Charge of Housing, State Hydro-electric Department, and Civil Aviation.
Hon. T. L. MACDONALD, Minister of Defence, Minister of Rehabilitation, and Minister in Charge of War Pensions.
Hon. J. T. WATTS, Minister of Health, Minister of Social Security.
Hon. GRACE H. ROSS, Minister without Portfolio, and Minister for the Welfare of Women and Children.
Hon. J. R. MARSHALL, Minister without Portfolio, Assistant to the Prime Minister, and Minister in Charge of State Advances Corporation, Census and Statistics Department, and Public Trust Office.
Hon. W. H. FORTUNE, Minister without Portfolio, Assistant to the Prime Minister, and Minister in Charge of Police, State Fire Insurance Office, Government Life Insurance Department, and Government Superannuation Fund.
Clerk of the Executive Council—T. J. Sherrard, O.B.E.
(Assumed Office, 13th December, 1949)
| Name and Office. | From | To |
|---|---|---|
| Sidney George Holland— | ||
| Prime Minister | 13 December, 1949 | |
| Minister of Finance | 13 December, 1949 | |
| Keith Jacka Holyoake— | ||
| Minister of Agriculture | 13 December, 1949 | |
| Minister of Marketing | 13 December, 1949 | |
| William Sullivan— | ||
| Minister of Labour | 13 December, 1949 | |
| Minister of Employment | 13 December, 1949 | |
| Minister of Mines | 13 December, 1949 | |
| Minister of Immigration | 13 December, 1949 | |
| Thomas Clifton Webb— | ||
| Attorney-General | 13 December, 1949 | |
| Minister of Justice | 13 December, 1949 | |
| Ronald Macmillan Algie— | ||
| Minister of Education | 13 December, 1949 | |
| William Alexander Bodkin— | ||
| Minister of Internal Affairs | 13 December, 1949 | |
| Charles Moore Bowden— | ||
| Minister of Customs | 13 December, 1949 | |
| Minister of Industries and Commerce | 13 December, 1949 | |
| Minister of Stamp Duties | 13 December, 1949 | |
| Minister of Supply | 13 December, 1949 | |
| Walter James Broadfoot— | ||
| Postmaster-General | 13 December, 1949 | |
| Minister of Telegraphs | 13 December, 1949 | |
| Ernest Bowyer Corbett— | ||
| Minister of Lands | 13 December, 1949 | |
| Minister of Forests | 13 December, 1949 | |
| Minister of Maori Affairs | 13 December, 1949 | |
| Frederick Widdowson Doidge— | ||
| Minister of External Affairs | 13 December, 1949 | |
| Minister of Island Territories | 13 December, 1949 | |
| William Stanley Goosman— | ||
| Minister of Works | 13 December, 1949 | |
| Minister of Transport | 13 December, 1949 | |
| Minister of Railways | 13 December, 1949 | |
| Minister of Marine | 13 December, 1949 | |
| Thomas Lachlan Macdonald— | ||
| Minister of Defence | 13 December, 1949 | |
| Minister of Rehabilitation | 13 December, 1949 | |
| Jack Thomas Watts— | ||
| Minister of Social Security | 13 December, 1949 | |
| Minister of Health | 13 December, 1949 |
UNDER HOLLAND MINISTRY, 13TH DECEMBER, 1949
SIDNEY WALTER SMITH, M.P., Parliamentary Under-Secretary in relation to the offices of the Minister of Agriculture and the Minister of Marketing. Appointed 13th December, 1949.
WILLIAM ALFRED SHEAT, M.P., Parliamentary Under-Secretary in relation to the office of the Minister of Works. Appointed 13th December, 1949.
[For earlier Parliaments and sessions refer to pp. 59–60 of the 1930 and p. 986 of the 1940 editions of the Year-Book. On some occasions there have been long adjournments during sessions, without Parliament being prorogued.]
| Parliament | Dates of Opening of Sessions. | Dates of Prorogation. | Dates of Dissolution. |
|---|---|---|---|
| Twenty-fourth | 23 Feb., 1932 22 Sept., 1932 21 Sept., 1933 28 June, 1934 29 Aug., 1935 | 11 May, 1932 21 Mar., 1933 22 Dec., 1933 16 April, 1935 29 Oct., 1935 | 1 Nov., 1935. |
| Twenty-fifth | 25 Mar., 1936 9 Sept., 1937 28 June, 1938 | 31 Oct., 1936 16 Mar., 1938 19 Sept., 1938 | 20 Sept., 1938. |
| Twenty-sixth | 27 June, 1939 30 May, 1940 12 Mar., 1941 11 Dec, 1941 23 Feb., 1943 | 1 Feb., 1940 16 Dec., 1940 29 Oct., 1941 14 Dec., 1942 27 Aug., 1943 | 30 Aug., 1943. |
| Twenty-seventh | 22 Feb., 1944 27 June, 1945 26 June, 1946 | 15 Dec, 1944 7 Dec., 1945 12 Oct., 1946 | 4 Nov., 1946. |
| Twenty-eighth | 24 June, 1947 22 June, 1948 28 June, 1949 | 1 Dec., 1947 8 Dec., 1948 26 Oct., 1949 | 23 Nov., 1949. |
ROLL OF MEMBERS OF THE LEGISLATIVE COUNCIL OF NEW ZEALAND, NOVEMBER, 1949
Speaker—Hon. B. MARTIN. Chairman of Committees—Hon. M. CONNELLY. Clerk of Parliaments and Clerk of the Legislative Council—C. M. BOTHAMLEY, J.P.
| Name. | Provincial District. | Date of Appointment. |
|---|---|---|
| Anderson, Hon. May Patricia | Westland | 31 Jan., 1946. |
| Bishop, Hon. Thomas Otto | Wellington | 9 Mar., 1943. |
| Black, Hon. Walter | Nelson | 8 Sept., 1948. |
| Blood worth, Hon. Thomas | Auckland | 8 Sept., 1948. |
| Briggs, Hon. Mark | Wellington | 9 Mar., 1943. |
| Brindle, Hon. Thomas | Wellington | 9 Mar., 1943. |
| Campbell, Hon. Archibald | Otago | 15 Jan., 1947. |
| Connelly, Hon. Michael | Otago | 9 Mar., 1943. |
| Cumming, Hon. James | Wellington | 23 June, 1948. |
| Davis, Hon. Eliot Rypinski | Auckland | 8 Sept., 1948. |
| Doyle, Hon. Thomas Francis | Southland | 9 Mar., 1943. |
| Dreaver, Hon. Mary Manson, M.B.E. | Auckland | 31 Jan., 1946. |
| Duncan, Hon. John Edward | Auckland | 22 Sept., 1944. |
| Eddy, Hon. Richard | Wellington | 23 June, 1948. |
| Grounds, Hon. William | Auckland | 15 July, 1947. |
| Hanan, Hon. Josiah Alfred | Otago | 15 July, 1947. |
| Martin, Hon. Bernard | Auckland | 9 Mar., 1943. |
| Martin, Hon. W. Lee | Auckland | 31 Jan., 1946. |
| Mawhete, Hon. Rangi | Wellington | 9 Mar., 1943. |
| O'Byrne, Hon. Thomas Francis | Southland | 23 June, 1948. |
| O'Kane, Hon. Patrick Joseph | Hawke's Bay | 8 Sept., 1948. |
| Paul, Hon. John Thomas | Wellington | 9 Sept., 1946. |
| Perry, Hon. Sir William | Wellington | 23 June, 1948. |
| Bobbins, Hon. Benjamin Conrad | Auckland | 9 Mar., 1943. |
| Roberts, Hon. James | Wellington | 17 June, 1947. |
| Robertson, Hon. John | Wellington | 31 Jan., 1946. |
| Rogers, Hon. William James | Wellington | 15 July, 1947. |
| Ryall, Hon. John | Westland | 15 July, 1947. |
| Waite, Hon. Fred. C.M.G., D.S.O., O.B.E. | Otago | 23 June, 1948. |
| Wilson, Hon. David | Wellington | 17 June, 1947. |
| Young, Hon. Frederick George | Auckland | 8 Sept., 1948. |
ROLL OF MEMBERS OF THE HOUSE OF REPRESENTATIVES, NOVEMBER, 1949
Speaker—Hon. ROBERT McKEEN. Chairman of Committees—Rev. CLYDE CARR. Clerk of the House—H. N. DOLLIMORE, LL.B.
| Name. | Electoral District. |
|---|---|
* Deceased, 7th October, 1919. | |
| For European Electorates | |
| Aderman, Ernest Philip | N. Plymouth. |
| Algie, Ronald Macmillan | Remuera. |
| Anderton, William Theophilus | Auckland Central. |
| Armstrong, Arthur Ernest | Napier. |
| Baxter, Alan Cheyne, D.F.C. and Bar | Raglan. |
| Bodkin, William Alexander | Central Otago. |
| Bowden, Charles Moore | Karori. |
| Broadfoot, Walter James | Waitomo. |
| Carr, Rev. Clyde Leonard | Timaru. |
| Chapman, Charles Henry | Wellington Central. |
| Coleman, David William | Gisborne. |
| Combs, Harry Ernest | Onslow. |
| Connolly, Philip George, D.S.C. | Dunedin Central. |
| Corbett, Ernest Bowyer | Egmont. |
| Cotterill, Joseph Bernard Francis | Wanganui. |
| Cullen, Hon. Edward Lutterell, M.M. | Hastings. |
| Doidge, Frederick Widdowson | Tauranga. |
| Finlay, Dr. Allan Martyn | North Shore. |
| Fortune, Wilfred Henry | Eden. |
| Fraser, Rt. Hon. Peter, P.C., C.H. | Brooklyn. |
| Freer, Warren Wilfred | Mount Albert. |
| Gerard, Richard Geoffrey | Ashburton. |
| Gillespie, William Henry | Hurunui. |
| Goosman, William Stanley | Piako. |
| Gordon, Edward Brice Killen | Rangitikei. |
| Hackett, Hon. Frederick | Grey Lynn. |
| Hanan, Josiah Ralph | Invercargill. |
| Harker, Cyril Geoffrey Edmund | Hawke's Bay. |
| Herron, George Richard | Awarua. |
| Holland, Sidney George | Fendalton. |
| Holyoake, Keith Jacka | Pahiatua. |
| Howard, Hon. Miss Mabel Bowden | Sydenham. |
| Hudson, Walter Arthur | Mornington. |
| Jones, Hon. Frederick | St. Kilda. |
| Kearins, Patrick | Waimarino. |
| Kent, James Begg | Westland. |
| Kidd, David Campbell | Waimate. |
| Langstoue, Frank | Roskill. |
| McAlpine, John Kenneth | Selwyn. |
| McCombs, Hon. Terence Henderson | Lyttelton. |
| Macdonald, Ritchie | Ponsonby. |
| Macdonald, Thomas Lachlan | Wallace. |
| Macfarlane, Robert Mafeking | Christchurch Central. |
| McKeen, Hon. Robert | Island Bay. |
| Mackley, Garnet Hercules, C.M.G. | Wairarapa. |
| McLagan, Hon. Angus | Riccarton. |
| Maher, James Joseph | Otaki. |
| Marshall, John Ross | MountVictoria. |
| Mason, Hon. Henry Great-head Rex | Waitakere. |
| Massey, John Norman | Franklin. |
| Mathison, John | Avon. |
| Moohan, Michael | Petone. |
| Murdoch, Alfred James | Marsden. |
| Nash, Rt. Hon. Walter, P.C. | Hutt. |
| Neale, Edgar Rollo, O.B.E. | Nelson. |
| Nordmeyer, Hon. Arnold Henry | Oamaru. |
| Oram, Matthew Henry M.B.E. | Manawatu. |
| Osborne, Arthur George | Onehunga. |
| Parry, Hon. William Edward | Arch Hill. |
| Petrie, Charles Robert | Otahuhu. |
| Rae, Duncan McFadyen | Parnell. |
| Ross, Mrs. Grace Hilda | Hamilton. |
| Roy, James Alexander McLean, M.C. | Clutha. |
| Semple, Hon. Robert | Miramar. |
| Shand, Thomas Philip | Marlborough. |
| Sheat, William Alfred | Patea. |
| Sim, Geoffrey Fantham | Waikato. |
| Skinner, Hon. Clarence Farringdon, M.C. | Buller. |
| Skinner, Thomas Edward | Tamaki. |
| Smith, Sidney Walter | Hobson. |
| Sullivan, William | Bay of Plenty. |
| Sutherland, Andrew Sinclair | Hauraki. |
| Walls, Robert | North Dunedin. |
| Watts, Jack Thomas | St. Albans. |
| Webb, Thomas Clifton | Rodney. |
| Wilson, George Hamish Ormond | Palmerston North. |
| For Maori Electorates | |
| Omana, Tiaka | Eastern Maori. |
| Paikea, Tapihana Paraire | Northern Maori. |
| Ratana, Matiu* | Western Maori. |
| Tirikatene, Hon. Eruera Tihema | Southern Maori. |
ROLL OF MEMBERS OF THE HOUSE OF REPRESENTATIVES, DECEMBER, 1949
Speaker—MATTHEW HENRY ORAM, M.B.E. (nominated). Chairman of Committees—CYRIL GEOFFREY EDMUND HARKER (nominated). Clerk of the House—H. N. DOLLIMORE, LL.B.
| Name | Electoral District. |
|---|---|
| For European Electorates | |
| Aderman, Ernest Philip | N. Plymouth. |
| Algie, Hon. Ronald Macmillan | Remuera. |
| Anderton, William Theophilus | Auckland Central |
| Armstrong, Arthur Ernest | Napier. |
| Bodkin, Hon. William Alexander | Central Otago. |
| Bowden, Hon. Charles Moore | Karori. |
| Broadfoot, Hon. Walter James | Waitomo. |
| Carr, Rev. Clyde Leonard | Timaru. |
| Chapman, Charles Henry | Wellington Central. |
| Combs, Harry Ernest | Onslow. |
| Connolly, Philip George, D.S.C. | Dunedin Central. |
| Cooksley, Bertie Victor | Wairarapa. |
| Corbett, Hon. Ernest Bowyer | Egmont. |
| Cotterill, Joseph Bernard Francis | Wanganui. |
| Doidge, Hon. Frederick Widdowson | Tauranga. |
| Eyre, Dean Jack | North Shore. |
| Fortune, Hon. Wilfred Henry | Eden. |
| Fraser, Rt. Hon. Peter, P.C., C.H. | Brooklyn. |
| Freer, Warren Wilfred | Mount Albert. |
| Gerard, Richard Geoffrey | Ashburton. |
| Gillespie, William Henry | Hurunui. |
| Goosman, Hon. William Stanley | Piako. |
| Gordon, Edward Brice Killen | Rangitikei. |
| Gotz, Frank Leon Aroha | Otahuhu. |
| Hackett, Frederick | Grey Lynn. |
| Halstead, Eric Henry | Tamaki. |
| Hanan, Josiah Ralph | Invercargill. |
| Harker, Cyril Geoffrey Edmund | Hawke's Bay. |
| Hayman, Thomas Leonard | Oamaru. |
| Herron, George Richard | Awarua. |
| Holland, Hon. Sidney George | Fendalton. |
| Holyoake, Hon. Keith Jacka | Pahiatua. |
| Howard, Miss Mabel Bowden | Sydenham. |
| Hudson, Walter Arthur | Mornington. |
| Johnstone, Hallyburton | Raglan. |
| Jones, Hon. Frederick | St. Kilda. |
| Jones, Sydney Ionovah | Hastings. |
| Kearins, Patrick | Waimarino. |
| Keeling, Reginald Alfred | Gisborne. |
| Kent, James Begg | Westland. |
| Kidd, David Campbell | Waimate. |
| McAlpine, John Kenneth | Selwyn. |
| McCombs, Terence Henderson | Lyttelton. |
| Macdonald, Ritchie | Ponsonby. |
| Macdonald, Hon. Thomas Lachlan | Wallace. |
| Macfarlane, Robert Mafeking | Christchurch Central. |
| McKeen, Robert | Island Bay. |
| McLagan, Hon. Angus | Riccarton. |
| Maher, James Joseph | Otaki. |
| Marshall, Hon. John Ross | Mount Victoria. |
| Mason, Hon. Henry Great-head Rex | Waitakere. |
| Massey, John Norman | Franklin. |
| Mathison, John | Avon. |
| Moohan, Michael | Petone. |
| Murdoch, Alfred James | Marsden. |
| Nash, Rt. Hon. Walter, P.C. | Hutt. |
| Neale, Edgar Rollo, O.B.E. | Nelson. |
| Oram, Matthew Henry, M.B.E. | Manawatu. |
| Osborne, Arthur George | Onehunga. |
| Parry, Hon. William Edward | Arch Hill. |
| Rac, Duncan McFadyen | Parnell. |
| Rac, John | Roskill. |
| Ross, Hon. Mrs. Grace Hilda | Hamilton. |
| Roy, James Alexander McLean, M.C. | Clutha. |
| Semple, Hon. Robert | Miramar. |
| Shand, Thomas Philip | Marlborough. |
| Sheat, William Alfred | Patea. |
| Sim, Geoffrey Fantham | Waikato. |
| Skinner, Hon. Clarence Farringdon, M.C. | Buller. |
| Smith, Sidney Walter | Hobson. |
| Sullivan, Hon. William | Bay of Plenty. |
| Sutherland, Andrew Sinclair | Hauraki. |
| Tennent, William Blair | Palmerston N. |
| Walls, Robert | North Dunedin |
| Watts, Hon. Jack Thomas | St. Albans. |
| Webb, Hon. Thomas Clifton | Rodney. |
| For Maori Electorates | |
| Omana, Tiaki | Eastern Maori. |
| Paikea, Tapihana Paraire | Northern Maori. |
| Ratana, Mrs. Iriaka Matiu | Western Maori. |
| Tirikatene, Hon. Eruera Tihema | Southern Maori. |
Judges of the Supreme Court and Court of Appeal.—Chief Justice: Right Hon. Sir Humphrey O'Leary, P.C., K.C.M.G. Puisne Judges: Hon. Sir Robert Kennedy; Hon. A. Fair; Hon. J. B. Callan; Hon. Sir E. H. Northcroft; Hon. G. P. Finlay; Hon. H. H. Cornish; Hon. K. M. Gresson; Hon. J. Stanton; Hon. J. D. Hutchison; Hon. E. P. Hay. Temporary Judge: Hon. Sir David Smith.
Judges of the Arbitration Court.—Hon. A. Tyndall, C.M.G. Deputy Judges: Hon. D. J. Dalglish; Hon. O. G. Stevens; Hon. W. F. Stilwell. President of Price Tribunal: Hon. W. J. Hunter.
Judge of Compensation Court.—Hon. F. W. Ongley.
Judge of Land Valuation Court.—Hon. K. G. Archer.
It has been customary to include in this section a list of recipients of honours conferred by His Majesty the King. The list has not been given on the last two occasions on account of its length, but a summary of honours, decorations, &c., for distinguished or gallant conduct, devotion to duty, &c., which have been awarded to New Zealand personnel serving with His Majesty's Forces from the outbreak of war up to 31st December, 1946, will be found on page 201 of this Year-Book. Issues of the New Zealand Gazette, showing recipients of honours, awards, &c., subsequent to those included on pages 646–647 of the 1944 Year-Hook have been as follows:—
| Date of Gazette. | Page. |
|---|---|
| 20th January, 1944 | 35 |
| 27th January, 1944 | 60 |
| 16th February, 1944 | 112 |
| 2nd March, 1944 | 219 |
| 16th March, 1914 | 259 |
| 20th March, 1944 | 269–270 |
| 4th May, 1944 | 431–432 |
| 1st June, 1944 | 636–640 |
| 22nd June, 1944 | 751 |
| 20th July, 1944 | 902 |
| 3rd August, 1944 | 946 |
| 10th August, 1944 | 966 |
| 24th August, 1944 | 1,033–1,034 |
| 31st August, 1944 | 1,075 |
| 7th September, 1944 | 1,097 |
| 21st September, 1944 | 1,142 |
| 19th October, 1944 | 1,259 |
| 26th October, 1944 | 1,285 |
| 23rd November, 1944 | 1,429 |
| 14th December, 1944 | 1,513 |
| 18th January, 1945 | 40 |
| 1st February, 1945 | 90–91 |
| 8th February, 1945 | 125–126 |
| 15th February, 1943 | 156–157 |
| 22nd February, 1945 | 200–201 |
| 1st March, 1945 | 242–243 |
| 28th March, 1945 | 348–349 |
| 19th April, 1945 | 413–414 |
| 3rd May, 1945 | 457–458 |
| 11th May, 1945 | 485–486 |
| 24th May, 1945 | 574 |
| 31st May, 1945 | 616 |
| 14th June, 1945 | 765–766 |
| 21st June, 1945 | 819 |
| 5th July, 1945 | 874–875 |
| 2nd August, 1945 | 975 |
| 17th August, 1945 | 1,032–1,033 |
| 6th September, 1945 | 1,126 |
| 20th September, 1945 | 1,166 |
| 11th October, 1945 | 1,268–1,269 |
| 18th October, 1945 | 1,298 |
| 25th October, 1945 | 1,320 |
| 8th November, 1945 | 1,399 |
| 22nd November, 1945 | 1,458 |
| 19th December, 1945 | 1,575 |
| 10th January, 1946 | 19 |
| 31st January, 1946 | 82 |
| 7th February, 1946 | 131–133 |
| 21st February, 1946 | 244 |
| 21st March, 1946 | 355–356 |
| 2nd May, 1946 | 544–547 |
| 16th May, 1946 | 683 |
| 23rd May, 1946 | 710 |
| 20th June, 1946 | 842–843 |
| 4th July, 1946 | 945 |
| 11th July, 1946 | 972–973 |
| 18th July, 1946 | 994 |
| 25th July, 1946 | 1,020–1,021 |
| 8th August, 1946 | 1,082–1,083 |
| 15th August, 1946 | 1,114 |
| 12th September, 1946 | 1,244 |
| 24th October, 1946 | 1,632 |
| 16th January, 1947 | 32 |
| 30th January, 1947 | 83–84 |
| 6th February, 1947 | 166 |
| 20th February, 1947 | 231 |
| 19th June, 1947 | 752–753 |
| 26th June, 1947 | 790 |
| 3rd July, 1947 | 819 |
| 15th January, 1948 | 41 |
| 20th May, 1948 | 590 |
| 17th June, 1948 | 761 |
| 24th June, 1948 | 786 |
| 21st October, 1948 | 1,299 |
| 11th November, 1948 | 1,374 |
| 13th January, 1949 | 11 |
| 27th January, 1949 | 118 |
| 16th June, 1949 | 1,381 |
LIST OF DEPARTMENTS OF THE NEW ZEALAND GOVERNMENT, WITH TITLES AND NAMES OF PERMANENT HEADS, NOVEMBER, 1949
| Department. | Permanent Head. | |
|---|---|---|
| Title. | Name. | |
| Agriculture | Director-General | E. J. Fawcet, M. A. (Cantab.). |
| Air | Chief of Air Staff and First Air Force Member of the Air Board | Air Vice-Marshall A. de T. Nevill, C.B.E. |
| Civil Aviation | Director | E. A. Gibson, A.M.I.C.E., A.F.R.Ae.S. |
| Air Secretary | T. A. Barrow. | |
| Meteorological | Director | Wing Commander M. A. F. Barnett, M.Sc., Ph.D., F.Inst.P. |
| Army | Chief of the General Staff | Major-General K. L. Stewart, C.B., C.B.E., D.S.O. |
| Army Secretary | F. B. Dwyer. | |
| Audit | Controller and Auditor-General | J. P. Rutherford. |
| Broadcasting | Director | W. Yates. |
| Census and Statistics | Government Statistician | G. E. F. Wood. O.B.E., M.A. |
| Crown Law | Solicitor-General | H. E. Evans, B.A., LL.M. |
| Customs | Comptroller | D. G. Sawers. |
| Education | Director | C. E. Beeby, M.A., Ph.D. |
| External Affairs | Secretary | A. D. M. McIntosh, M.A. |
| Government Life Insurance | Commissioner | H. L. Ryan. |
| Health | Director-General | T. R. Ritchie, M.B., Ch.B. D.P.H. |
| Mental Hygiene Division | Director | J. Russell, B.A., M.B., Ch.B. (Cantab.), D.P.M. |
| Industries and Commerce | Secretary | G. W. Clinkard, M.Com. |
| Price Control Division | Director | H. L. Wise, M.Com. |
| Internal Affairs | Under-Secretary and Clerk of Writs | A. G. Harper. |
| Electoral | Chief Electoral Officer | A. G. Harper. |
| Island Territories | Secretary | R. T. G. Patrick. |
| Justice and Prisons | Under-Secretary of Justice, Controller-General of Prisons, Chief Probation Officer, and Registrar-General of Births, Deaths, and Marriages | S. T. Barnett. |
| Patent Office | Commissioner | A. H. Ihle. |
| Labour and Employment | Secretary of Labour and Director of Employment | H. L. Bockett. |
| Lands and Deeds and Stamp Duties | Acting-Secretary for Land and Deeds, and Commissioner of Stamp Duties | F. R. Macken, LL.M. |
| Land and Income Tax | Commissioner of Taxes | F. G. Oborn. |
| Lands and Survey | Director-General and Land Purchase Controller | D. M. Greig. |
| Law Drafting | Law Draftsman | H. D. C. Adams. |
| Legislative | Clerk of Parliaments and Clerk of the Legislative Council | C. M. Bothamley. |
| Clerk of House of Representatives | H. N. Dollimore, LL.B. | |
| Maori Affairs | Under-Secretary, and Maori Trustee | T. T. Ropiha. |
| Marine | Secretary | W. C. Smith. |
| Marketing | Director | L. C. Webb, M.A. |
| Mines | Under-Secretary | C. H. Benney. |
| National Art Gallery and Dominion Museum | Director | Dr. R. A. Falla, D.Sc., M.A. |
| Navy | First. Naval Member and Chief of the Naval Staff | Commodore G. W. G. Simpson, C.B.E. |
| Naval Secretary | Captain (S) G. T. Millett, R.N. | |
| Police | Commissioner | J. Cummings. |
| Post and Telegraph | Director-General | P. N. Cryer. |
| Prime Minister's | Permanent Head, Chief Private Secretary, and Secretary to Cabinet. | A. D. M. McIntosh, M.A. |
| Printing and Stationery | Government Printer | R. E. Owen. |
| Public Service Commission | Chairman of Commission | R. M. Campbell, M.A., LL.B., Ph.D. |
| Members | G. T. Bolt. | |
| A. H. O'Keefe, B.Com. | ||
| Public Trust | Public Trustee | H. W. S. Pearce. |
| Railways | General Manager | F. W. Aickin, M.Inst. T., Barrister and Solicitor. |
| Rehabilitation | Director | F. Baker, D.S.O. |
| Scientific and Industrial Research | Secretary | F. R. Callaghan, M.A. |
| Social Security | Chairman Social Security Commission and Secretary for War Pensions | B. F. Waters. |
| State Advances Corporation of New Zealand | Joint Managing Directors | A. D. Park, C.M.G. |
| T. N. Smallwood, O.B.E. | ||
| Manager | F. W. E. Mitchell. | |
| State Fire and Accident Insurance | General Manager | R. H. Newbold. |
| State Forest | Director and Secretary | A. R. Entrican A.M.Inst.C.E. |
| State Hydro-electric | General Manager | A. E. Davenport, B.E., M.I.E.E. |
| Tourist and Health Resorts | General Manager | L. J. Schmitt. |
| Transport | Commissioner | G. L. Laurenson, A.M.Inst.C.E. |
| Treasury | Secretary | B. C. Ashwin, C.M.G., M.Com. |
| Economic Stabilization Commission | Director | L. C. Webb, M.A. |
| Friendly Societies | Registrar | S. Beckingsale, F.I.A. |
| Government Actuary's Branch | Government Actuary | S. Beckingsale, F.I.A. |
| Government Service Superannuation | Acting-Secretary | G. J. Morrington. |
| National Provident Fund | Superintendent | W. L. Comrie. |
| Valuation | Valuer-General | C. G. S. Ellis. |
| Works, Ministry of | Commissioner of Works | E. R. McKillop, A.M.I.C.E. |
| Engineer-in-Chief | F. Langbein, A.M.I.C.E. | |
| Housing Division | Director | R. B. Hammond, M.T.P.I. (Lon.). |
The statutory authority for the control of the Public Service of New Zealand, other than the Post and Telegraph Department, the Railways Service, the Teaching Service, the uniform branches of the Police, Navy, Army, and Air Departments, the Legislative Department, the Judiciary and the Magistracy, and in a few other minor instances, is the Public Service Act, 1912, and its amendments.
Prior to the passing of this Act, a Royal Commission had been set up to report on conditions in the Public Service, and it was largely on the report of this Commission that the Act was based. The Commission found that—
Persons were, entering the Service without proper qualifications:
There was no proper classification of positions, and no consistency in the salaries paid for different positions:
Salary increases were not given in accordance with a defined scheme, and there was too much emphasis on seniority:
Anomalies in salaries and working-conditions arose through each Department tending to be a law unto itself. There was no system enabling men to transfer from one Department to another:
Political influence was alleged to exist:
Discontent existed within the Service, with impairment of morale and efficiency.
The Commission considered that the characteristics of the Service should be—
Entry by competitive examination;
Probation before final admission;
Security of tenure during good behaviour after admission;
Promotion by merit; and
Pensions on retirement.
In the view of the Royal Commission, the first essential was the appointment of a Board of Management to control the whole Service. Although the principle of control by an independent central agency was accepted, the Public Service Act, 1912, provided for the administration of the Act to be vested in one Commissioner and two Assistant Commissioners. Although on occasions there were no Assistant Commissioners, this system continued until 1946, except for a short period from 1936 to 1938, when there were two joint Commissioners appointed in terms of section 41 of the Finance Act, 1936. In 1946, however, on the retirement of the then Commissioner, the Public Service Amendment Act, 1946, was passed, providing for the control of the Public Service by a Commission of three as from 1st November, 1946.
The members of the Commission are appointed by the Governor-General in Council on the recommendation of the Prime Minister, a feature being that one of the members so appointed is to be a nominee of the Now Zealand Public Service Association. Public servants thus have direct representation in the control of the Public Service, since through their Association they are able to nominate one of their number for selection as a member of the Commission. The Chairman of the Commission is appointed by the Governor-General in Council.
Except that the term of office of the first Chairman of the Commission is seven years, each member is appointed for a period of five years, but is eligible for reappointment. The salaries of the members of the Commission are fixed by statute (£1,750 per annum in the case of the Chairman and £1,656 per annum for each of the other two members) and are paid out of the Consolidated Fund from year to year without any further authority being necessary.
The Governor-General has power to suspend any member of the Commission from office for misbehaviour or incompetence. A full statement of the grounds of suspension must be laid before Parliament, if in session, within seven days, or, if Parliament is not in session, within seven clays after the beginning of the next session. A Commissioner suspended in this way is restored to office if Parliament, within twenty-one days from the time the statement is laid before it, does not pass a resolution to the effect that the Commissioner should be removed from office. His office, however, terminates on the happening of certain other contingencies as set out in section 11 of the Public Service Act.
The Commission's status differs from that of the normal Permanent Head in that it is not controlled by any Minister of the Crown. The Public Service Act provides that a person is liable to a heavy penalty if he endeavours to influence the Commission in regard to another person's appointment, promotion, or salary. Within the limits defined by the Act, the Commission is supreme, but appeals against certain of its decisions can be made to the Board of Appeal, which was created by the Public Service Act, 1912. The Commission is required to furnish a report at least annually, for presentation to Parliament, on the condition and efficiency of the Public Service. In this report it is required to indicate any measures and changes which are considered necessary for the efficient working of the whole or any part of the Service.
The functions of the Commission include—
Control of recruitment to the Service:
The classification of positions according to their importance and character:
The maintenance of a fair and efficient system of promotion:
The protection of the independence and integrity of the Service:
The increase in departmental organization and methods:
The maintenance of discipline:
The regulation of a variety of points connected with personnel control—e.g., leave, hours of work, payment of allowances, &c.
To enable the Commission to discharge these functions various powers have been conferred upon it. For instance, it can order an inspection of any Department to ascertain whether there is a proper standard of efficiency and economy. It can transfer surplus staff to other Departments or dispense with their services. It has power in certain circumstances to reduce or increase an officer's salary. Decisions as to promotions and transfers are made by the Commission, and certain disciplinary powers are vested in it. To facilitate the administration of the Act the Commission has power to make regulations, with the approval of the Governor-General in Council. The regulations made to date are comprehensive and form a code.
For the purposes of classification, five Divisions have been created by statute and these are:—
Administrative.—Includes such positions as the Governor-General, by notification in the New Zealand Gazette, may declare to belong to this Division. Such positions are those of Permanent Heads and their Deputies. Officers in this Division are paid such emoluments as may be provided in the annual appropriations authorized by Parliament.
Professional.—Includes officers whose duties involve special skill or technical knowledge usually acquired only in some profession, and whose positions the Commission directs to be included in this Division. The schedule of salaries payable at December, 1949, is given below:—
£ Class VI 165 190 225 255 285 325 355 380 405 435 460 Class V 495 520 Class IV 546 570 Class III 595 620 Class II 645 670 Class I 720 770 Class Sp., F 820 E 860 D 910 C 960 B 1,010 A 1,060 The commencing rate for entrants with School Certificate or old University Entrance Examination is £190 per annum, and £225 per annum for entrants with new University Entrance Examination or endorsed School Certificate. There are also special commencing rates for entrants with University degrees, ranging from £355 to £520 according to the degree held. The minimum adult remuneration is £330 for males and £255 for females, while the minimum rate for married male employees is £361 per annum.
Subject to good and diligent conduct, an officer in Class VI receives the amounts shown for that class year by year. Promotion beyond Class VI depends on the officer's ability and upon vacancies occurring in the higher grades, or on the growth and importance of the position held by the officer. In special cases, salaries in excess of the maximum for the Division may be paid with the approval of the Commission, but in such cases provision must be made in the annual estimates of expenditure, and the amount of increase must be appropriated by Parliament.
Clerical.—This includes such officers as the Commission may from time to time direct to be included in that Division. It embraces jobs ranging from routine clerical work to work of a high executive character. Payment of salaries follows the scale set out for the Professional Division.
Educational.—Includes teachers in Maori schools, in the Correspondence School, and in special institutions, but not the great body of primary and secondary school teachers who are servants of various Education Boards, Boards of Governors, &c. In this Division officers are paid salaries in accordance with the Education (Salaries and Staffing) Regulations 1948 under delegation by the Commission to the Director of Education.
General.—Includes positions not classified in any other Division. Salary rates are on the basis of a fixed amount or on a scale determined by the Commission.
The Commission is required to grade officers in these Divisions according to their fitness and the character and importance of the duties performed by them. The Act provides for a general regrading of the whole of the Service every five years. The latest regrading took place as from 1st April, 1946. One was to have been carried out in 1942, but was postponed owing to war conditions. Where a position has grown in importance and responsibility, the Commission has power to alter the grading of that position at any time.
Efficiency and suitability are the factors which determine promotion. Only where it is not possible to separate officers on these grounds is seniority relevant. Relative efficiency of officers is determined by reference to special qualifications and aptitude for discharge of duties of the office to be filled, together with merit, diligence, and good conduct. Vacancies are usually advertised in the Public Service Official Circular (a publication circulating throughout the Public Service) and, where necessary, in newspapers.
PUBLIC SERVICE BOARD OF APPEAL
Officers have the right of appeal concerning:—
The gradings allotted by the Commission at the five-yearly regrading of the Service:
Promotions approved by the Commission if the appellant had applied for the position or if applications were not called for the position and appellant's appointment thereto would have involved his promotion:
Determinations and penalties imposed by the Commission in respect of charges made against officers.
The constitution of the Board of Appeal is as under:—
Two persons, of whom at least one must be an officer of the Public Service, appointed by the Governor-General:
Two persons, being officers of the Public Service, elected by officers of the Public Service.
One of the members appointed by the Governor-General is selected by him as Chairman. Only one of the elected members is entitled to sit at the hearing of any appeal. Decisions of the Board of Appeal are final, and no writ of mandamus, prohibition, or certiorari lies in respect thereof to any Court. For the year ended 31st March, 1948, the appeals lodged totalled 2,281 (including 1,632 appeals against regrading as at 1st April, 1946), and these were dealt with as follows: allowed, 250; not allowed, 1,200; withdrawn, 632; did not lie, 30; lapsed, 114; and adjourned sine die, 55.
An officer may lodge more than one appeal, and in many instances officers lodged over 3 and up to 12.
A Special Board of Appeal to hear appeals arising out of the appointment of temporary employees to permanent positions is provided for by the Public Service Amendment Act, 1946.
Except with the permission of the Governor-General, no person is admitted to the New Zealand Public Service unless he is a natural-born or naturalized British subject. All admissions are, in the first instance, on probation, the usual probationary period being two years. An employee may be dispensed with at any time during this period. Entry to cadetships in the Clerical Division is determined by competitive examination. The competitive examination for entry to the Clerical Division is now the Public Service Entrance, but where applicants are available with higher qualifications—e.g., University Entrance, School Certificate, &c.—they are given preference.
The total number of permanent and temporary employees (excluding casuals) in Departments under the control of the Commission as at 1st April, 1948, was approximately 29,800, as compared with 27,600 twelve months earlier. The total as at 1st April, 1948, consisted of 26,800 permanent officers and 3,000 temporary employees. The Public Service Amendment Act, 1946, provided machinery whereby temporary employees who were occupying permanent positions as at 1st November, 1946, became eligible for appointment to the permanent staff. This machinery has been put into operation, and most employees previously temporary are now permanent officers.
Staffs on Railways, Post and Telegraph, and Police Departments will be found in appropriate sections elsewhere in this volume, as will also the number of schoolteachers. The number of workmen in the employ of the Works Department will be found in the section on Employment and Unemployment, and of miners, &c., in State coal-mines in the Mining Section. While not exhaustive, the foregoing cover substantially the whole of the employees of the State with the exception of the Armed Services which are shown in the Defence section. Civilian personnel of the Services are included in the figures shown in the preceding paragraph.
JULY, 1949
Australia.—J. G. Barclay, High Commissioner (Acting Official Secretary, O. P. Gabites; Acting Assistant Secretary, Miss J. H. Young), Canberra, A.C.T. W. Taylor, Senior New Zealand Trade Commissioner, 14 Martin Place (P.O. Box 365), Sydney. B. T. Rae, Trade Commissioner, and R. W. Coupland, Travel Manager, Department of Tourist and Health Resorts, 428 Collins Street (P.O. Box 2136), Melbourne. South Australia Intelligence and Tourist Bureau, Hon. New Zealand Government Agents, lung William Street, Adelaide. Dewar and Jones, Hon. New Zealand Government Agents, King House, Queen Street, Brisbane. Western Australia Government Tourist Bureau, Hon. New Zealand Government Agents, Perth.
Burma.—New Zealand Insurance Co., Hon. New Zealand Government Agents, Rangoon.
Canada.—James Thorn, High Commissioner (Official Secretary, C. A. Sharp; Assistant Secretary, B. S. Lendrum), 105 Wurtemburg Street, Ottawa. J. A. Malcolm, Trade Commissioner, 609 Sun Life Building, Montreal. E. E. Auckland, Hon. New Zealand Government Agent, P.O. Box 16, Vancouver, B.C.
China.—C. G. Davis, Hon. Now Zealand Government Agent, care of Hatch, Carter, and Co., Ltd., E.W.O. Building, 147 Chung Ching Road, Tienanmen, North China.
Fiji.—W. R. Carpenter and Co., Ltd., Hon. New Zealand Government Agents, Suva. Union Steam Ship Co., Ltd., Agents, Department of Tourist and Health Resorts, Suva.
France.—Miss J. R. McKenzie, Chargé d'Affaires (Nominated), Paris.
Hawaii.—H. C. Tennent, Hon. New Zealand Government Agent, Nuuanu Avenue (P.O. Box 3049), Honolulu. Hawaiian Tourist Bureau, Agent, Department of Tourist and Health Resorts, Honolulu.
Hong Kong.—S. T. Williamson, Hon. New Zealand Government Agent, care of Williamson and Co. (P.O. Box 41), Hong Kong.
India.—R. J. Inglis, Trade Commissioner; R. T. C. do Lambert, Assistant Trade Commissioner; Bookstall Chambers, Sir Pheromone Meath Road (P.O. Box 1194), Bombay. Now Zealand Insurance Company (C. R. C. Gardiner, J.P.), Hon. Now Zealand Government Agents, Bombay. New Zealand Insurance Co., Hon. New Zealand Government Agents, Calcutta.
Japan.—R. L. G. Challis, New Zealand Government Trade Representative, care of British Commonwealth Sub-area Post-office, Tokyo.
South Africa.—H. J. Constable, Hon. New Zealand Government Agent, P.O. Box 1909, Johannesburg.
Union of Soviet Socialist Republics.—Legation, Moscow: D. P. Costello, Chargé d'Affaires a.i.; Third Secretary, B. D. Kohlrabi.
United Kingdom of Great Britain and Northern Ireland.—Right Hon. W. J. Jordan, P.C., High Commissioner (Official Secretary, Major-General W. G. Stevens, C.B., C.B.E.; External Affairs Officer, Sir Cecil Day, C.M.G., C.B.E.; Assistant External Affairs Officers, T. P. Davin, R. B. Taylor; Air Liaison Officer, Air Commodore W. M. Buckley, C.B.E.; Military Liaison Officer, Brigadier G. B. Parkinson, C.B.E., D.S.O.; Navy Liaison Officer, Commander R. E. Harding; Scientific Adviser, Dr. E. Marsden, C.M.G., C.B.E.; Public Relations Officer, A. T. Campbell; Finance Officer, L. Williams; Commercial Secretary, J. B. Prendergast; Chief Migration Officer, J. V. Brennan; Customs Representative, L. S. Nicol), New Zealand Government Offices, 415 Strand, London.
United States of America.—Embassy, 19 Observatory Circle, Washington: Ambassador Extraordinary and Plenipotentiary, Sir C. A. Trendsetter, K.C.M.G., LL.M.; Counsellor, G. R. Laking; Commercial Attaché, R. W. Marshall, O.B.E.; First Secretary, F. H. Corner; Third Secretaries: Mrs. I. P. Bloomfield, D. F. Dunlop; Air Attaché, Air Commodore J. L. Findlay, C.B.E., M.C. (Munitions Building, 20th and Constitution Avenues); Assistant Scientific Attaché, J. Raeside (1785 Massachusetts Avenue, N.W.). W. B. Sutch, Secretary-General, Office of the Permanent Delegation of Now Zealand to the United Nations (Second Secretary, C. Craw; Third Secretary, Miss H. N. Hampton), Suite 6004, Empire State Building, New York. Consul-General of New Zealand: D. W. Woodward; Mrs. S. V. Davis, Vice-Consul, Suite 6004, Empire State Building, New York. Consul-General of New Zealand: T. O. W. Brebner; J. C. M. Bayliss, Vice-Consul, 153 Kearny Street, San Francisco. R. W. Marshall, O.B.E., Trade Commissioner, Bradford Building, 1800 K Street, Box 680, Benjamin Franklin Station, Washington. D. W. Woodward, Trade Commissioner, Suite 6004, Empire State Building, New York.
United Kingdom.—L. S. Nicol, Official Representative of New Zealand Customs Department, Now Zealand Government Offices, 415 Strand, London W.C. 2.
United States of America and Canada.—Official Representatives of New Zealand Customs Department: J. R. Osbaldiston, Suite 6004, Empire State Building, New York; T. O. W. Brebner, 153 Kearney Street, San Francisco.
Argentine Republic.—Consul, V. de la Torre, Wellington.
Australia.—High Commissioner, His Excellency Mr. A. R. Cutler, V.C.; Official Secretary, Bernard Kuskie; Assistant Secretary, Miss C. M. Bell, Government Life Insurance Building, Customhouse Quay, Wellington. Defence Representative, Brigadier G. H. O'Brien. Trade Commissioner, R. Hazzard; Assistant Trade Commissioner, K. W. Ward, Government Life Insurance Building, Customhouse Quay, Wellington.
Belgium.—Envoy Extraordinary and Minister Plenipotentiary, His Excellency Mr. Armand Nihotte, Dominion Farmers' Institute, Wellington. Consuls: J. B. Ferguson, Auckland; Sir Joseph Ward, Bart., Christchurch; A. H. Allen, Dunedin.
Brazil.—Consul, C. A. L. Treadwell, Wellington.
Canada.—High Commissioner, His Excellency Mr. Alfred Rive; Commercial Secretary, Paul V. McLane (absent); Acting Commercial Secretary, C. M. Forsyth-Smith; Second Secretary, Miss Agnes Ireland, Government Life Insurance Building, Customhouse Quay, Wellington.
Chile.—Consul-General (with jurisdiction in Now Zealand), R. Dundas Smith, Sydney, Consul, J. M. Wilson, Auckland.
China.—Consul-General (with personal rank of Minister, also has jurisdiction in the Trust Territory of Western Samoa), Wang Feng; Consul, Chang Moon Ling; Vice-Consul, Liu Tung Wei; Deputy Consul, Chao Yu Chin (Eugene Chao), D.I.C. Building, Lambton Quay, Wellington.
Cuba.—In New Zealand, Consular Officers of the United States of America act on behalf of the Cuban Government.
Czechoslovakia.—Consul-General (with jurisdiction in New Zealand), Hanus Frank (nominated); Vice-Consul (Acting-Consul-General), J. Halla, Sydney; Consul, E. J. Hyams, Wellington.
Denmark.—Envoy Extraordinary and Minister Plenipotentiary, His Excellency Mr. C. M. Rottboll, Canberra, A.C.T.; Chargé d'Affaires, a.i., A. C. Fensmark, Government Life Insurance Building, Customhouse Quay, Wellington. Consul, Stronach Paterson, Wellington. Acting-Vice-Consuls, C. M. Richwhite (absent), P. Dellow, Auckland. Consul, A. C. Perry, Christchurch. Vice-Consul, G. C. Petersen, Palmerston North.
Fiji.—New Zealand Agents for the Colony of Fiji, L. D. Nathan and Co., Ltd., Auckland.
France.—Envoy Extraordinary and Minister Plenipotentiary, His Excellency Mr. Emmanuel Lancial; First Secretary, Henri Rollet; Commercial Attaché, Lucien Guillou; Attaché and Vice-Consul, C. Cansou, Government Life Insurance Building, Customhouse Quay, Wellington, Consular Agents: R. G. McElroy, Auckland; A. N. Haggitt, Dunedin.
Greece.—Consul-General (with jurisdiction in New Zealand), E. Vrisakis, Sydney. Consul-General, T. E. Y. Seddon, Wellington. Deputy Consul-General, S. Garland, Wellington.
India.—Trade Commissioner (with jurisdiction in New Zealand), A. Baski, Sydney.
Italy.—Consul (with jurisdiction in New Zealand and Trust Territory of Western Samoa), Count G. De Rege, Wellington.
Lebanon.—Consul, G. J. Marsh, Wellington.
Netherlands.—Envoy Extraordinary and Minister Plenipotentiary, His Excellency Mr. J. B. D. Pennink; Second Secretary, Dr. W. Arriens; Agricultural Attaché, H. De Bruin, D.I.C. Building, Lambton Quay, Wellington. Consul: C. S. O. Hughes, Auckland. Vice-Consuls: G. N. Francis, Christchurch; G. R. Ritchie. Dunedin.
Nicaragua.—Consul-General (with jurisdiction in New Zealand), Don Rafael Medina, Sydney.
Norway.—Consul, J. Halligan (absent), Wellington; Acting Consul, W. Goddard, Wellington. Vice-Consuls: D. Millar, Auckland; J. Heaton Rhodes, Christchurch; J. H. Edmond, Dunedin.
Panama.—Consul, Hon. T. C. Webb, M.P., Auckland.
Poland.—Consul-General (with jurisdiction in New Zealand), Albert Morski, London.
The Philippines.—Consul-General (with jurisdiction in New Zealand) (vacant), Sydney; Vice-Consul (in charge of Consulate-General), Alejandro D. Yango.
Portugal.—Consuls, L. D. Nathan, Auckland; W. S. Wheeler, Wellington. Vice-Consul, J. Elvidge, Dunedin.
Sweden.—Chargé d'Affaires, L. R. G. Arfwedson; Secretary, Olof Bjurstrom, Wellington. Vice-consuls: C. M. Richwhite (absent), P. Dellow, Auckland: W. Machin, Christchurch; J. S. Ross, Dunedin.
Switzerland.—Consul, Henri Blanchard; Chancellor (in charge of Consulate), Ernst Fretz, Wellington.
Tonga.—New Zealand Agents for the Government of Tonga, Messrs. Spedding Ltd., Auckland.
Turkey.—Consul-General (with jurisdiction in New Zealand and the Trust Territory of Western Samoa), Halil Ali Ramazanoglu, London. Consul E. G. Cowell, Auckland.
Union of Soviet Socialist Republics.—Envoy Extraordinary and Minister Plenipotentiary, His Excellency Alexander M. Alexandrov. First Secretaries, Pavel K. Ermoshin, A. G. Vislykh. Commercial Attaché, V. P. Ourenev. Attaché, N. I. Bourov, Legation of the Union of Soviet Socialist Republics, 57 Messines Road, Wellington.
United Kingdom of Great Britain and Northern Ireland.—High Commissioner. His Excellency Mr. C. R. Price, C.M.G.; Deputy High Commissioner. A. W. Snelling; Economic Adviser, R. B. Willmot; Agricultural Adviser, D. S. Hendrie; Assistant Secretaries: H. Smedley, M.B.E., F. S. Miles, Government Life Insurance Building, Brandon Street, Wellington. Senior Trade Commissioner, R. B. Willmot: Trade Commissioners: A. Wooller, T. and G. Building, Grey Street, Wellington; H. F. Stevens, Auckland. Service Liaison Staffs: Navy, Captain M. W. Richmond, D.S.O., O.B.E., R.N.; Army, Colonel D. E. B. Talbot, D.S.O., M.C.: Air, Group Captain M. L. Heath, O.B.E., Government Life Insurance Building, Customhouse Quay, Wellington.
United States of America.—Ambassador Extraordinary and Plenipotentiary, His Excellency the Hon. Robert M. Scotten; First Secretary, Howard Elting, jun.; Senior Military Attaché, Colonel Hugh C. Parker; Naval Attaché and Naval Attaché for Air, Commander Adrian H. Perry (attached to American Embassy, Canberra); Air Attaché, Lieutenant-Colonel William B. Taylor; Commercial Attaché, Osborn S. Watson; Public Affairs Officer, Earl A. Dennis; Agricultural Attaché, Meade T. Foster; Assistant Public Affairs Officer, Donald E. Wilson; Second Secretary. Armistead M. Lee; Assistant Air Attaché, Captain Iver C. Fitschen; Consul, Howard Elting, jun.; Vice-Consuls, Armistead M. Lee, Arthur S. Abbott, Elbert R. Williams, James P. Osbourn, Mrs. Ellen G. Johnson, D.I.C. Building, Lambton Quay, Wellington. Consul, Mulford A. Colebrook (nominated). Vice-Consul, James W. Boyd, Auckland. Consular Agents, H. P. Bridge, Christchurch; Richard S. Reeves, Dunedin.
Uruguay.—Vice-Consul, F. D. Burnett, Wellington.
Yugoslavia.—Consul-General (with jurisdiction in New Zealand), Dr. G. Zarkovic (absent); Consul, I. Kosovic, Sydney.
Table of Contents
POPULATION AND EXTERNAL MIGRATION (INCLUDING MAORIS)
| Year. | Population. | Mean Population. | Year ended 31st March. | |||
|---|---|---|---|---|---|---|
| At 31st December. | At 31st March. | Year ended 31st December. | Year ended 31st March. | Overseas Passenger Arrivals.* | Overseas Passenger Departures.* | |
*Excluding “through” passengers, and tourists on cruising liners. | ||||||
| 1899 | 796,359 | 786,530 | 789,838 | 779,049 | 18,996 | 15,898 |
| 1900 | 808,132 | 798,471 | 802,246 | 792,501 | 18,435 | 17,531 |
| 1901 | 830,800 | 815,862 | 821,111 | 808,811 | 19,463 | 15,714 |
| 1902 | 851,072 | 833,139 | 840,936 | 824,501 | 25,581 | 21,048 |
| 1903 | 875,648 | 857,993 | 863,360 | 845,566 | 32,625 | 19,994 |
| 1904 | 900,682 | 882,100 | 888,165 | 870,047 | 30,485 | 20,163 |
| 1905 | 925,605 | 908,116 | 913,144 | 895,108 | 33,524 | 22,582 |
| 1906 | 956,457 | 933,114 | 943,325 | 920,615 | 33,253 | 23,973 |
| 1907 | 977,215 | 961,598 | 966,836 | 949,650 | 39,812 | 28,877 |
| 1908 | 1,008,373 | 985,320 | 992,794 | 973,459 | 37,618 | 29,853 |
| 1909 | 1,030,657 | 1,016,063 | 1,019,515 | 1,000,692 | 45,374 | 31,226 |
| 1910 | 1,050,410 | 1,035,212 | 1,040,534 | 1,025,638 | 34,715 | 32,854 |
| 1911 | 1,075,250 | 1,056,199 | 1,063,887 | 1,045,706 | 37,049 | 34,375 |
| 1912 | 1,102,471 | 1,081,344 | 1,088,861 | 1,069,828 | 43,097 | 37,205 |
| 1913 | 1,134,506 | 1,111,589 | 1,118,488 | 1,096,467 | 46,892 | 34,935 |
| 1914 | 1,145,838 | 1,139,668 | 1,140,172 | 1,125,628 | 41,672 | 31,517 |
| 1915 | 1,152,638 | 1,150,386 | 1,149,238 | 1,145,027 | 33,377 | 27,254 |
| 1916 | 1,150,339 | 1,150,250 | 1,149,225 | 1,150,318 | 25,407 | 22,808 |
| 1917 | 1,147,448 | 1,150,938 | 1,148,893 | 1,149,225 | 20,470 | 20,047 |
| 1918 | 1,158,149 | 1,154,559 | 1,152,798 | 1,152,748 | 13,718 | 12,214 |
| 1919 | 1,227,181 | 1,178,406 | 1,192,665 | 1,166,482 | 11,978 | 11,473 |
| 1920 | 1,257,611 | 1,236,915 | 1,242,396 | 1,207,660 | 26,900 | 23,990 |
| 1921 | 1,292,892 | 1,267,498 | 1,274,917 | 1,252,206 | 46,090 | 31,908 |
| 1922 | 1,318,884 | 1,301,251 | 1,305,126 | 1,283,546 | 41,128 | 30,396 |
| 1923 | 1,343,021 | 1,325,301 | 1,328,193 | 1,311,382 | 34,108 | 28,581 |
| 1924 | 1,370,403 | 1,347,853 | 1,352,618 | 1,334,029 | 36,254 | 30,487 |
| 1925 | 1,401,230 | 1,379,487 | 1,384,428 | 1,359,995 | 42,211 | 29,913 |
| 1926 | 1,429,669 | 1,409,812 | 1,413,743 | 1,392,073 | 42,449 | 30,714 |
| 1927 | 1,450,356 | 1,438,132 | 1,439,004 | 1,420,838 | 45,682 | 34,018 |
| 1928 | 1,467,370 | 1,453,821 | 1,456,075 | 1,443,551 | 35,837 | 37,072 |
| 1929 | 1,486,134 | 1,471,110 | 1,473,419 | 1,460,363 | 34,799 | 34,088 |
| 1930 | 1,506,809 | 1,489,203 | 1,493,019 | 1,478,027 | 33,839 | 31,454 |
| 1931 | 1,522,762 | 1,511,700 | 1,514,215 | 1,498,416 | 30,741 | 25,632 |
| 1932 | 1,534,735 | 1,525,545 | 1,527,062 | 1,517,940 | 17,891 | 21,063 |
| 1933 | 1,547,124 | 1,538,028 | 1,539,590 | 1,530,119 | 18,713 | 21,308 |
| 1934 | 1,558,373 | 1,550,125 | 1,551,532 | 1,542,651 | 19,687 | 22,022 |
| 1935 | 1,569,689 | 1,560,992 | 1,562,233 | 1,554,297 | 24,901 | 28,051 |
| 1936 | 1,584,617 | 1,573,927 | 1,575,231 | 1,565,263 | 26,936 | 28,050 |
| 1937 | 1,601,758 | 1,587,211 | 1,589,972 | 1,578,757 | 31,670 | 32,023 |
| 1938 | 1,618,313 | 1,604,479 | 1,606,763 | 1,594,275 | 38,738 | 36,352 |
| 1939 | 1,641,639 | 1,624,714 | 1,628,512 | 1,611,362 | 42,648 | 37,685 |
| 1940 | 1,633,645 | 1,640,901 | 1,637,305 | 1,633,447 | 31,432 | 25,404 |
| 1941 | 1,631,276 | 1,636,230 | 1,630,948 | 1,635,715 | 13,814 | 13,100 |
| 1942 | 1,636,403 | 1,634,338 | 1,639,572 | 1,630,419 | 7,102 | 6,893 |
| 1943 | 1,642,041 | 1,634,094 | 1,635,635 | 1,640,191 | 3,133 | 2,592 |
| 1944 | 1,676,286 | 1,643,900 | 1,655,795 | 1,637,570 | 3,747 | 3,640 |
| 1945 | 1,728,441 | 1,679,972 | 1,694,714 | 1,664,585 | 7,207 | 6,189 |
| 1946 | 1,784,334 | 1,758,004 | 1,761,399 | 1,710,990 | 13,309 | 10,966 |
| 1947 | 1,823,074 | 1,793,225 | 1,802,637 | 1,772,787 | 25,358 | 22,320 |
| 1948 | 1,861,923 | 1,834,270 | 1,841,531 | 1,812,609 | 33,144 | 27,388 |
| 1949 | 1,873,301 | 1,851,291 | 35,946 | 31,765 | ||
VITAL STATISTICS (EXCLUDING MAORIS)
| Year. | Numbers. | Rates per 1,000 of Mean Population. | Deaths under 1 Year per 1,000 Live Births. | |||||
|---|---|---|---|---|---|---|---|---|
| Live Births. | Marriages. | Deaths. | Deaths under 1 Year. | Live Births. | Marriages. | Deaths. | ||
| 1898 | 18,955 | 5,091 | 7,244 | 1,510 | 25.74 | 6.91 | 9.84 | 79.66 |
| 1899 | 18,835 | 5,461 | 7,680 | 1,806 | 25.12 | 7.28 | 10.24 | 95.89 |
| 1900 | 19,546 | 5,860 | 7,200 | 1,469 | 25.60 | 7.67 | 9.43 | 75.16 |
| 1901 | 20,491 | 6,095 | 7,634 | 1,463 | 26.34 | 7.83 | 9.81 | 71.40 |
| 1902 | 20,655 | 6,394 | 8,375 | 1,712 | 25.89 | 8.01 | 10.50 | 82.89 |
| 1903 | 21,829 | 6,748 | 8,528 | 1,770 | 26.61 | 8.23 | 10.40 | 81.08 |
| 1904 | 22,766 | 6,983 | 8,087 | 1,616 | 26.94 | 8.26 | 9.57 | 70.98 |
| 1905 | 23,682 | 7,200 | 8,061 | 1,599 | 27.22 | 8.28 | 9.27 | 67.52 |
| 1906 | 24,252 | 7,592 | 8,339 | 1,506 | 27.08 | 8.48 | 9.31 | 62.10 |
| 1907 | 25,094 | 8,192 | 10,066 | 2,228 | 27.30 | 8.91 | 10.95 | 88.79 |
| 1908 | 25,940 | 8,339 | 9,043 | 1,761 | 27.45 | 8.82 | 9.57 | 67.89 |
| 1909 | 26,524 | 8,094 | 8,959 | 1,634 | 27.29 | 8.33 | 9.22 | 61.60 |
| 1910 | 25,984 | 8,236 | 9,639 | 1,760 | 26.17 | 8.30 | 9.71 | 67.73 |
| 1911 | 26,354 | 8,825 | 9,534 | 1,484 | 25.97 | 8.70 | 9.39 | 56.31 |
| 1912 | 27,508 | 9,149 | 9,214 | 1,409 | 26.48 | 8.81 | 8.87 | 51.22 |
| 1913 | 27,935 | 8,813 | 10,119 | 1,653 | 26.14 | 8.25 | 9.47 | 59.17 |
| 1914 | 28,338 | 9,280 | 10,148 | 1,456 | 25.99 | 8.51 | 9.31 | 51.38 |
| 1915 | 27,850 | 10,028 | 9,965 | 1,394 | 25.33 | 9.12 | 9.06 | 50.05 |
| 1916 | 28,509 | 8,213 | 10,596 | 1,446 | 25.94 | 7.47 | 9.64 | 50.72 |
| 1917 | 28,239 | 6,417 | 10,528 | 1,360 | 25.69 | 5.84 | 9.58 | 48.16 |
| 1918 | 25,860 | 6,227 | 16,364 | 1,252 | 23.44 | 5.65 | 14.84 | 48.41 |
| 1919 | 24,483 | 9,519 | 10,808 | 1,108 | 21.42 | 8.33 | 9.46 | 45.26 |
| 1920 | 29,921 | 12,175 | 12,109 | 1,513 | 25.09 | 10.21 | 10.15 | 50.57 |
| 1921 | 28,567 | 10,635 | 10,682 | 1,366 | 23.36 | 8.69 | 8.73 | 47.82 |
| 1922 | 29,006 | 9,556 | 10,977 | 1,215 | 23.18 | 7.64 | 8.77 | 41.89 |
| 1923 | 27,967 | 10,070 | 11,511 | 1,225 | 21.96 | 7.91 | 9.04 | 43.80 |
| 1924 | 28,014 | 10,259 | 10,767 | 1,127 | 21.60 | 7.91 | 8.30 | 40.23 |
| 1925 | 28,153 | 10,419 | 11,026 | 1,125 | 21.20 | 7.85 | 8.30 | 39.96 |
| 1926 | 28,473 | 10,680 | 11,819 | 1,132 | 21.06 | 7.90 | 8.74 | 39.76 |
| 1927 | 27,881 | 10,478 | 11,613 | 1,080 | 20.29 | 7.63 | 8.45 | 38.74 |
| 1928 | 27,200 | 10,537 | 11,811 | 984 | 19.57 | 7.58 | 8.50 | 36.18 |
| 1929 | 26,747 | 10,967 | 12,314 | 912 | 19.03 | 7.80 | 8.76 | 34.10 |
| 1930 | 26,797 | 11,075 | 12,199 | 924 | 18.83 | 7.78 | 8.57 | 34.48 |
| 1931 | 26,622 | 9,817 | 12,047 | 856 | 18.45 | 6.81 | 8.35 | 32.15 |
| 1932 | 24,884 | 9,896 | 11,683 | 777 | 17.12 | 6.81 | 8.04 | 31.22 |
| 1933 | 24,334 | 10,510 | 11,701 | 770 | 16.63 | 7.18 | 7.99 | 31.64 |
| 1934 | 24,322 | 11,256 | 12,527 | 781 | 16.51 | 7.64 | 8.50 | 32.11 |
| 1935 | 23,965 | 12,187 | 12,217 | 773 | 16.17 | 8.23 | 8.25 | 32.26 |
| 1936 | 24,837 | 13,808 | 13,056 | 769 | 16.64 | 9.25 | 8.75 | 30.96 |
| 1937 | 26,014 | 14,364 | 13,658 | 812 | 17.29 | 9.55 | 9.08 | 31.21 |
| 1938 | 27,249 | 15,328 | 14,754 | 971 | 17.93 | 10.09 | 9.71 | 35.63 |
| 1939 | 28,833 | 17,115 | 14,158 | 898 | 18.73 | 11.12 | 9.20 | 31.14 |
| 1940 | 32,771 | 17,448 | 14,282 | 990 | 21.19 | 11.28 | 9.24 | 30.21 |
| 1941 | 35,100 | 13,313 | 15,146 | 1,045 | 22.81 | 8.65 | 9.84 | 29.77 |
| 1942 | 33,574 | 12,219 | 16,385 | 964 | 21.73 | 7.91 | 10.60 | 28.71 |
| 1943 | 30,311 | 11,579 | 15,447 | 951 | 19.70 | 7.53 | 10.04 | 31.37 |
| 1944 | 33,599 | 13,125 | 15,363 | 1,012 | 21.59 | 8.43 | 9.87 | 30.12 |
| 1945 | 37,007 | 16,160 | 16,051 | 1,036 | 23.22 | 10.14 | 10.07 | 27.99 |
| 1946 | 41,871 | 20,535 | 16,093 | 1,093 | 25.24 | 12.38 | 9.70 | 26.10 |
| 1947 | 44,816 | 18,525 | 15,904 | 1,122 | 26.42 | 10.92 | 9.38 | 25.04 |
| 1948 | 44,193 | 17,192 | 15,812 | 970 | 25.52 | 9.93 | 9.13 | 21.95 |
EDUCATION
| Year. | Number of Scholars* receiving | University Students (excluding affiliated Agricultural Colleges). | ||||||
|---|---|---|---|---|---|---|---|---|
| Primary Education at | Secondary Education at | |||||||
| Public† Schools. | Registered Private Schools. | Maori Village Schools. | Secondary (including Endowed and Combined) Schools. | District High Schools. | Technical Schools. | Registered Private Schools. | ||
*Excludes those receiving tuition from the Correspondence Schools (primary and secondary). † Excludes scholars at Chatham Islands School. | ||||||||
| 1898 | 131,621 | 14,857 | 2,972 | 2,706 | 667 | |||
| 1899 | 131,315 | 15,380 | 3,065 | 2,723 | 766 | |||
| 1900 | 130,724 | 15,602 | 3,109 | 2,792 | 805 | |||
| 1901 | 131,351 | 15,397 | 3,273 | 2,899 | 662 | 783 | ||
| 1902 | 132,262 | 15,667 | 3,742 | 3,072 | 1,479 | 864 | ||
| 1903 | 133,568 | 15,687 | 3,693 | 3,722 | 2,096 | 862 | ||
| 1904 | 135,475 | 16,445 | 3,754 | 4,038 | 2,330 | 971 | ||
| 1905 | 137,623 | 16,738 | 3,863 | 4,060 | 2,872 | 1,153 | ||
| 1906 | 139,302 | 17,217 | 4,174 | 4,270 | 2,594 | 1,332 | ||
| 1907 | 141,216 | 18,174 | 4,183 | 4,196 | 2,452 | 1,325 | ||
| 1908 | 147,575 | 16,244 | 4,217 | 4,327 | 2,142 | 699 | 1,634 | |
| 1909 | 152,605 | 17,989 | 4,121 | 4,856 | 1,891 | 846 | 1,846 | |
| 1910 | 156,594 | 19,052 | 4,280 | 5,176 | 1,916 | 1,253 | 1,862 | |
| 1911 | 161,904 | 19,967 | 4,557 | 5,465 | 1,777 | 1,341 | 831 | 1,900 |
| 1912 | 166,553 | 20,350 | 4,694 | 5,831 | 1,815 | 1,526 | 883 | 2,228 |
| 1913 | 172,519 | 21,251 | 4,647 | 6,154 | 1,837 | 1,664 | 545 | 2,318 |
| 1914 | 178,871 | 22,247 | 5,072 | 6,418 | 1,896 | 1,839 | 850 | 2,257 |
| 1915 | 183,631 | 22,477 | 5,191 | 6,488 | 2,102 | 1,955 | 992 | 2,039 |
| 1916 | 186,350 | 23,635 | 5,132 | 7,052 | 2,115 | 2,105 | 1,004 | 1,985 |
| 1917 | 188,754 | 25,685 | 5,173 | 7,590 | 2, 180 | 2,347 | 1,206 | 1,977 |
| 1918 | 193,345 | 26,371 | 5,064 | 8,384 | 2,283 | 2,747 | 1,366 | 2,226 |
| 1919 | 194,586 | 20,977 | 5,198 | 9,068 | 2,159 | 2,926 | 1,497 | 3,060 |
| 1920 | 198,460 | 22,193 | 5,508 | 9,196 | 2,157 | 2,766 | 1,439 | 3,822 |
| 1921 | 205,955 | 23,924 | 5,822 | 10,030 | 2,176 | 3,349 | 1,634 | 4,123 |
| 1922 | 211,081 | 24,861 | 6,161 | 10,736 | 2,606 | 4,202 | 1,998 | 3,958 |
| 1923 | 212,460 | 26,010 | 6,186 | 11,619 | 2,818 | 5,054 | 2,134 | 4,202 |
| 1924 | 213,768 | 26,302 | 6,310 | 12,010 | 2,900 | 5,369 | 2,473 | 4,236 |
| 1925 | 215,063 | 25,933 | 6,386 | 12,514 | 3,136 | 5,132 | 2,511 | 4,442 |
| 1926 | 219,017 | 26,778 | 6,591 | 13,651 | 3,299 | 5,700 | 2,794 | 4,653 |
| 1927 | 221,157 | 27,358 | 6,620 | 14,190 | 3,581 | 5,703 | 2,932 | 4,878 |
| 1928 | 219,950 | 26,596 | 6,671 | 15,038 | 3,880 | 6,061 | 3,430 | 4,802 |
| 1929 | 219,166 | 26,977 | 6,979 | 15,498 | 4,000 | 6,114 | 3,698 | 4,623 |
| 1930 | 219,235 | 26,451 | 7,070 | 16,149 | 4,240 | 6,953 | 3,825 | 4,801 |
| 1931 | 218,689 | 26,726 | 7,503 | 16,344 | 4,944 | 7,397 | 3,777 | 4,869 |
| 1932 | 207,489 | 26,410 | 7,313 | 15,948 | 4,486 | 7,106 | 3,616 | 4,912 |
| 1933 | 200,819 | 26,428 | 7,340 | 15,715 | 4,511 | 7,149 | 3,586 | 4,806 |
| 1934 | 199,913 | 26,636 | 7,587 | 15,901 | 4,365 | 7,183 | 3,651 | 4,721 |
| 1935 | 197,526 | 26,869 | 7,876 | 16,162 | 4,593 | 7,323 | 3,968 | 4,818 |
| 1936 | 210,386 | 27,709 | 9,175 | 16,556 | 4,070 | 7,422 | 4,241 | 4,967 |
| 1937 | 207,879 | 27,931 | 9,642 | 16,811 | 4,389 | 7,833 | 4,613 | 5,010 |
| 1938 | 206,220 | 28,386 | 9,832 | 17,764 | 4,905 | 8,149 | 4,902 | 5,219 |
| 1939 | 205,266 | 28,280 | 10,403 | 18,176 | 5,401 | 8,481 | 5,137 | 5,649 |
| 1940 | 204,137 | 28,454 | 10,730 | 17,710 | 5,253 | 8,009 | 5,207 | 5,198 |
| 1941 | 204,205 | 28,614 | 10,916 | 16,986 | 5,033 | 7,371 | 5,325 | 4,964 |
| 1942 | 204,072 | 28,467 | 11,009 | 16,805 | 4,852 | 7,923 | 5,357 | 4,292 |
| 1943 | 204,247 | 29,328 | 11,274 | 18,324 | 5,197 | 8,436 | 6,035 | 5,693 |
| 1944 | 206,112 | 29,717 | 11,793 | 20,829 | 6,187 | 10,233 | 6,927 | 6,9 |
| 1945 | 209,786 | 30,401 | 12,190 | 21,566 | 6,872 | 10,865 | 7,831 | 8,149 |
| 1946 | 218,490 | 31,506 | 12,654 | 21,936 | 6,656 | 11,712 | 8,419 | 10,993 |
| 1947 | 227,003 | 32,604 | 13,170 | 21,847 | 6,666 | 12,328 | 8,913 | 11,331 |
| 1948 | 233,207 | 33,360 | 13,254 | 22,059 | 6,895 | 12,136 | 8,809 | 11,380 |
JUSTICE
| Year. | Summary Convictions in Magistrates Courts.* | Total Convictions or Sentences in Superior Courts. | Total Distinct Persons sentenced in Superior Courts. | Prisoners in Gaol at end of Year (undergoing Sentence | ||||
|---|---|---|---|---|---|---|---|---|
| Number. | Rate per 1,000 of Mean Population. | Number. | Rate per 1,000 of Mean Population. | Number. | Rate per 1,000 of Mean Population. | Number. | Rate per 1,000 of Population. | |
*Excluding Children's Court cases from year 1914 onwards. † Not available. | ||||||||
| 1898 | 16,991 | 21.89 | 391 | 0.50 | 386 | 0.50 | 533 | 0.68 |
| 1899 | 17,586 | 22.27 | 405 | 0.51 | 383 | 0.48 | 508 | 0.64 |
| 1900 | 19,242 | 23.99 | 427 | 0.53 | 391 | 0.49 | 527 | 0.65 |
| 1901 | 20,724 | 25.24 | 361 | 0.44 | 354 | 0.43 | 661 | 0.84 |
| 1902 | 22,455 | 26.70 | 349 | 0.42 | 339 | 0.40 | 602 | 0.75 |
| 1903 | 25,186 | 29.17 | 398 | 0.46 | 380 | 0.44 | 688 | 0.83 |
| 1904 | 25,672 | 28.90 | 527 | 0.59 | 519 | 0.58 | 701 | 0.78 |
| 1905 | 25,371 | 27.78 | 449 | 0.49 | 433 | 0.47 | 760 | 0.82 |
| 1906 | 27,670 | 29.33 | 445 | 0.47 | 433 | 0.46 | 833 | 0.87 |
| 1907 | 30,901 | 31.96 | 490 | 0.51 | 481 | 0.50 | 791 | 0.81 |
| 1908 | 30,852 | 31.08 | 543 | 0.55 | 532 | 0.54 | 815 | 0.81 |
| 1909 | 31,151 | 30.55 | 552 | 0.54 | 544 | 0.53 | 877 | 0.85 |
| 1910 | 32,435 | 31.17 | 495 | 0.48 | 494 | 0.47 | 843 | 0.80 |
| 1911 | 33,029 | 31.05 | 453 | 0.43 | 427 | 0.40 | 802 | 0.75 |
| 1912 | 36,191 | 33.24 | 480 | 0.44 | 428 | 0.39 | 821 | 0.75 |
| 1913 | 39,685 | 35.48 | 446 | 0.40 | 409 | 0.37 | 834 | 0.74 |
| 1914 | 40,673 | 35.67 | 522 | 0.46 | 483 | 0.42 | 981 | 0.86 |
| 1915 | 38,446 | 33.45 | 509 | 0.44 | 411 | 0.38 | 941 | 0.82 |
| 1916 | 34,324 | 29.87 | 448 | 0.39 | 401 | 0.35 | 834 | 0.73 |
| 1917 | 33,302 | 28.99 | 623 | 0.54 | 377 | 0.33 | 954 | 0.83 |
| 1918 | 28,421 | 24.65 | 632 | 0.55 | 355 | 0.31 | 1,005 | 0.87 |
| 1919 | 31,766 | 26.63 | 808 | 0.68 | 461 | 0.39 | 852 | 0.69 |
| 1920 | 34,740 | 27.96 | 1,011 | 0.81 | 459 | 0.37 | 996 | 0.79 |
| 1921 | 36,492 | 28.58 | 1,475 | 1.16 | 616 | 0.48 | 1,044 | 0.81 |
| 1922 | 33,995 | 26.05 | 1,417 | 1.09 | 601 | 0.46 | 1,052 | 0.83 |
| 1923 | 36,701 | 29.14 | 1,663 | 1.25 | 625 | 0.47 | 1,141 | 0.85 |
| 1924 | 38,982 | 28.82 | 1,388 | 1.03 | 555 | 0.41 | 1,197 | 0.87 |
| 1925 | 43,407 | 31.35 | 1,465 | 1.06 | 511 | 0.37 | 1,284 | 0.92 |
| 1926 | 44,887 | 31.75 | 1,562 | 1.10 | 569 | 0.40 | 1,388 | 0.97 |
| 1927 | 44,540 | 30.95 | 1,739 | 1.21 | 569 | 0.40 | 1,483 | 1.02 |
| 1928 | 43,419 | 29.82 | 1,368 | 0.94 | 478 | 0.33 | 1,435 | 0.98 |
| 1929 | 44,311 | 30.07 | 1,345 | 0.91 | 473 | 0.32 | 1,342 | 0.90 |
| 1930 | 45,544 | 30.50 | 1,524 | 1.02 | 538 | 0.36 | 1,523 | 1.01 |
| 1931 | 40,374 | 26.66 | 1,624 | 1.07 | 600 | 0.40 | 1,614 | 1.06 |
| 1932 | 40,591 | 26.58 | 1,710 | 1.12 | 636 | 0.42 | 1,522 | 0.99 |
| 1933 | 36,043 | 23.41 | 1,513 | 0.98 | 531 | 0.34 | 1,410 | 0.91 |
| 1934 | 35,752 | 23.04 | 1,213 | 0.78 | 490 | 0.32 | 1,199 | 0.77 |
| 1935 | 36,230 | 23.19 | 1,148 | 0.73 | 472 | 0.30 | 1,112 | 0.71 |
| 1936 | 39,517 | 25.09 | 1,178 | 0.75 | 462 | 0.29 | 915 | 0.58 |
| 1937 | 42,726 | 26.87 | 1,318 | 0.83 | 507 | 0.32 | 790 | 0.49 |
| 1938 | 49,651 | 30.90 | 1,322 | 0.82 | 488 | 0.30 | 777 | 0.48 |
| 1939 | 52,288 | 32.11 | 1,489 | 0.91 | 571 | 0.35 | 895 | 0.55 |
| 1940 | 46,110 | 28.16 | 1,394 | 0.85 | 547 | 0.33 | 863 | 0.53 |
| 1941 | 39,636 | 24.30 | 1,496 | 0.92 | 542 | 0.33 | 988 | 0.61 |
| 1942 | † | † | 1,460 | 0.89 | 457 | 0.28 | 1,034 | 0.63 |
| 1943 | † | † | 1,378 | 0.84 | 494 | 0.30 | 1,024 | 0.63 |
| 1944 | † | † | 1,441 | 0.87 | 560 | 0.34 | 945 | 0.57 |
| 1945 | † | † | 1,885 | 1.11 | 619 | 0.37 | 998 | 0.58 |
| 1946 | † | † | 1,713 | 0.97 | 655 | 0.37 | 992 | 0.56 |
| 1947 | 40,990 | 22.74 | 1,948 | 1.08 | 740 | 0.41 | 1,088 | 0.60 |
| 1948 | 44,119 | 23.96 | 2,323 | 1.26 | 717 | 0.39 | 1,025 | 0.56 |
AGRICULTURE
| Season. | Wheat for Threshing. | Oats for Threshing. | ||||
|---|---|---|---|---|---|---|
| Area. | Yield. | Yield per Acre. | Area. | Yield. | Yield per Acre. | |
*Yield probably overstated for these four seasons, due to total being obtained by applying ascertained averages to areas returned by farmers as sown for threshing. Areas returned in these years as Intended for threshing would appear, in many cases, to have been eventually utilized for other purposes. | ||||||
| Acres. | Bushels. | Bushels. | Acres. | Bushels. | Bushels. | |
| 1898–99 | 399,034 | 13,073,416 | 32.76 | 417,320 | 16,511,388 | 39.56 |
| 1899–1900 | 269,749 | 8,581,898 | 31.81 | 398,243 | 16,325,832 | 40.99 |
| 1900–01 | 206,465 | 6,527,154 | 31.61 | 449,534 | 19,085,837 | 42.45 |
| 1901–02 | 163,462 | 4,046,589 | 24.76 | 405,924 | 15,045,233 | 37.06 |
| 1902–03 | 194,355 | 7,457,915 | 38.37 | 483,659 | 21,766,708 | 45.00 |
| 1903–04 | 230,346 | 7,891,654 | 34.26 | 409,390 | 15,107,237 | 38.57 |
| 1904–05 | 258,015 | 9,123,673 | 35.36 | 342,189 | 14,553,611 | 42.53 |
| 1905–06 | 222,183 | 6,798,934 | 30.60 | 354,291 | 12,707,982 | 35.86 |
| 1906–07 | 206,185 | 5,605,252 | 27.18 | 351,929 | 11,201,789 | 31.83 |
| 1907–08 | 193,031 | 5,567,139 | 28.84 | 386,885 | 15,021,861 | 38.82 |
| 1908–09 | 252,391 | 8,772,790 | 34.75 | 406,908 | 18,906,788 | 46.46 |
| 1909–10 | 311,000 | 8,661,100 | 28.00 | 377,000 | 13,804,000 | 37.00 |
| 1910–11 | 322,167 | 8,290,221 | 25.73 | 302,827 | 10,118,917 | 33.41 |
| 1911–12 | 215,528 | 7,261,138 | 33.69 | 403,668 | 19,662,668* | 48.71 |
| 1912–13 | 189,869 | 5,179,626 | 27.28 | 386,786 | 13,583,924* | 35.12 |
| 1913–14 | 166,774 | 5,231,700 | 31.37 | 361,741 | 14,740,946* | 40.75 |
| 1914–15 | 229,600 | 6,644,336 | 28.94 | 287,561 | 11,436,301* | 39.77 |
| 1915–16 | 329,207 | 7,108,360 | 21.59 | 212,688 | 7,653,208 | 35.98 |
| 1916–17 | 217,743 | 5,051,227 | 23.19 | 177,524 | 5,371,436 | 30.29 |
| 1917–18 | 280,978 | 6,807,536 | 24.23 | 156,202 | 4,942,759 | 31.64 |
| 1918–19 | 208,030 | 6,567,629 | 31.67 | 172,686 | 6,884,609 | 39.87 |
| 1919–20 | 139,611 | 4,559,934 | 32.66 | 179,800 | 6,967,862 | 38.75 |
| 1920–21 | 219,985 | 6,872,262 | 31.24 | 147,559 | 5,225,115 | 35.41 |
| 1921–22 | 352,918 | 10,565,275 | 29.94 | 170,655 | 6,752,663 | 39.56 |
| 1922–23 | 275,775 | 8,395,023 | 30.44 | 143,090 | 5,688,157 | 39.75 |
| 1923–24 | 173,864 | 4,174,537 | 24.01 | 63,842 | 1,964,511 | 30.77 |
| 1924–25 | 166,964 | 5,447,758 | 32.62 | 147,387 | 5,707,174 | 38.72 |
| 1925–26 | 151,673 | 4,617,041 | 30.44 | 102,485 | 4,115,606 | 40.14 |
| 1926–27 | 220,083 | 7,952,442 | 36.13 | 117,326 | 4,997,535 | 42.58 |
| 1927–28 | 260,987 | 9,541,444 | 36.56 | 88,223 | 3,852,687 | 43.66 |
| 1928–29 | 255,312 | 8,832,864 | 34.60 | 73,101 | 3,065,113 | 41.93 |
| 1929–30 | 235,942 | 7,239,556 | 30.68 | 67,722 | 3,002,288 | 44.33 |
| 1930–31 | 249,014 | 7,579,153 | 30.44 | 87,152 | 3,376,609 | 38.74 |
| 1931–32 | 268,756 | 6,582,698 | 24.49 | 68,690 | 2,818,152 | 41.03 |
| 1932–33 | 302,531 | 11,054,972 | 36.54 | 116,206 | 5,132,183 | 44.16 |
| 1933–34 | 286,271 | 9,036,017 | 31.56 | 78,343 | 3,242,500 | 41.39 |
| 1934–35 | 225,389 | 5,933,245 | 26.32 | 52,516 | 1,890,145 | 35.99 |
| 1935–36 | 248,639 | 8,859,223 | 35.63 | 77,502 | 3,302,642 | 42.61 |
| 1936–37 | 221,790 | 7,168,963 | 32.32 | 74,772 | 3,525,430 | 47.15 |
| 1937–38 | 185,949 | 6,042,981 | 32.50 | 57,917 | 2,640,915 | 45.60 |
| 1938–39 | 189,281 | 5,564,136 | 29.40 | 54,422 | 2,604,817 | 47.86 |
| 1939–40 | 257,532 | 8,010,089 | 31.10 | 49,751 | 2,081,106 | 41.83 |
| 1940–41 | 243,197 | 8,305,865 | 34.15 | 71,758 | 3,114,946 | 43.41 |
| 1941–42 | 258,002 | 8,671,244 | 33.61 | 70,796 | 3,444,812 | 48.66 |
| 1942–43 | 286,998 | 9,819,342 | 34.21 | 56,291 | 2,808,774 | 49.90 |
| 1943–44 | 233,786 | 7,208,485 | 30.83 | 39,652 | 1,834,310 | 46.26 |
| 1944–45 | 183,886 | 6,992,204 | 38.02 | 77,684 | 4,209,143 | 54.18 |
| 1945–46 | 161,049 | 5,439,041 | 33.77 | 57,278 | 2,796,877 | 48.83 |
| 1946–47 | 141,407 | 5,368,120 | 37.96 | 55,297 | 2,686,211 | 48.58 |
| 1947–48 | 123,751 | 4,539,017 | 36.68 | 63,159 | 2,853,517 | 45.18 |
| 1948–49 | 146,707 | 5,958,026 | 40.41 | 78,300 | 3,718,597 | 47.49 |
LIVE-STOCK
| Year. | Horses. | Total Cattle. | Dairy Cows.† | Sheep. | Pigs. |
|---|---|---|---|---|---|
*Not available. † Figures from 1917 onwards include dairy cows in milk only. NOTE.—With the exception of sheep, figures from 1931 onwards exclude stock within boroughs. | |||||
| 1899 | 258,115 | 1,203,024 | 333,536 | 19,348,506 | 193,512 |
| 1900 | 261,931 | 1,222,139 | 355,256 | 19,355,195 | 249,751 |
| 1901 | 266,245 | 1,256,680 | 372,416 | 20,233,099 | 250,975 |
| 1902 | 279,672 | 1,361,784 | 381,492 | 20,342,727 | 224,024 |
| 1903 | 286,955 | 1,460,663 | 428,773 | 18,954,553 | 193,740 |
| 1904 | 298,714 | 1,593,547 | 468,125 | 18,280,806 | 226,591 |
| 1905 | 314,322 | 1,736,850 | 498,241 | 19,130,875 | 255,320 |
| 1906 | 326,537 | 1,810,936 | 517,720 | 20,108,471 | 249,727 |
| 1907 | 342,608 | 1,851,750 | 543,927 | 20,983,772 | 242,273 |
| 1908 | 352,832 | 1,816,299 | 541,363 | 22,449,053 | 241,128 |
| 1909 | 363,259 | 1,773,326 | 536,629 | 23,480,707 | 245,092 |
| 1910 | * | * | * | 24,269,620 | * |
| 1911 | 404,284 | 2,020,171 | 633,733 | 23,996,126 | 348,754 |
| 1912 | * | * | * | 23,750,153 | * |
| 1913 | * | * | * | 24,191,810 | * |
| 1914 | * | * | * | 24,798,763 | * |
| 1915 | * | * | * | 24,901,421 | * |
| 1916 | 371,331 | 2,417,491 | 750,323 | 24,788,150 | 297,501 |
| 1917 | 373,600 | 2,575,230 | 684,032 | 25,270,386 | 283,770 |
| 1918 | 378,050 | 2,869,465 | 710,561 | 26,538,302 | 258,694 |
| 1919 | 363,188 | 3,035,478 | 732,253 | 25,828,554 | 235,347 |
| 1920 | 346,407 | 3,101,945 | 782,757 | 23,919,970 | 266,829 |
| 1921 | 337,259 | 3,139,223 | 890,220 | 23,285,031 | 349,892 |
| 1922 | 332,105 | 3,323,223 | 1,015,325 | 22,222,259 | 384,333 |
| 1923 | 330,818 | 3,480,694 | 1,124,671 | 23,081,439 | 400,889 |
| 1924 | 330,430 | 3,563,497 | 1,184,977 | 23,775,776 | 414,271 |
| 1925 | 326,830 | 3,503,744 | 1,195,567 | 24,547,955 | 440,115 |
| 1926 | 314,867 | 3,452,486 | 1,181,441 | 24,904,993 | 472,534 |
| 1927 | 303,713 | 3,257,729 | 1,181,545 | 25,649,016 | 520,143 |
| 1928 | 307,160 | 3,273,769 | 1,242,729 | 27,133,810 | 586,898 |
| 1929 | 298,986 | 3,445,790 | 1,291,204 | 29,051,382 | 556,732 |
| 1930 | 297,195 | 3,770,223 | 1,389,541 | 30,841,287 | 487,793 |
| 1931 | 282,729 | 4,043,560 | 1,478,947 | 29,792,516 | 468,533 |
| 1932 | 267,980 | 4,035,418 | 1,562,079 | 28,691,788 | 505,755 |
| 1933 | 263,883 | 4,155,058 | 1,703,328 | 27,755,966 | 583,921 |
| 1934 | 260,892 | 4,264,163 | 1,795,817 | 28,649,038 | 652,732 |
| 1935 | 259,972 | 4,256,534 | 1,807,377 | 29,076,754 | 755,094 |
| 1936 | 263,156 | 4,217,113 | 1,802,773 | 30,113,704 | 800,802 |
| 1937 | 264,785 | 4,352,136 | 1,784,820 | 31,305,818 | 794,758 |
| 1938 | 265,153 | 4,469,117 | 1,743,190 | 32,378,774 | 748,805 |
| 1939 | 261,789 | 4,527,983 | 1,723,893 | 31,897,091 | 675,802 |
| 1940 | 258,567 | 4,496,067 | 1,719,289 | 31,062,875 | 706,340 |
| 1941 | 253,052 | 4,538,908 | 1,759,018 | 31,751,660 | 761,519 |
| 1942 | 248,597 | 4,604,749 | 1,756,654 | * | 681,016 |
| 1943 | 236,455 | 4,447,548 | 1,714,959 | * | 604,574 |
| 1944 | 225,823 | 4,439,258 | 1,647,920 | 33,200,298 | 573,362 |
| 1945 | 217,689 | 4,590,926 | 1,678,943 | 33,974,612 | 593,828 |
| 1946 | 216,335 | 4,666,782 | 1,661,944 | * | 549,391 |
| 1947 | 206,575 | 4,633,800 | 1,657,690 | 32,681,799 | 545,874 |
| 1948 | 203,885 | 4,716,287 | 1,713,532 | 32,483,138 | 548,177 |
| 1949 | 196,055 | 4,722,836 | 1,746,753 | 32,844,918 | 544,841 |
TRADE
| Year. | Excluding Specie.* | Specie.† | ||||||||
|---|---|---|---|---|---|---|---|---|---|---|
| Exports. | Imports. | Exports. | Imports. | |||||||
| Total. | Per Head. | Total. | Per Head. | |||||||
* Figures are in terms of New Zealand currency. † Specie exports and imports represent face value. ‡ Increases mainly due to imports of defence materials and equipment. § Provisional. | ||||||||||
| £ | £ | s. | d. | £ | £ | s. | d. | £ | £ | |
| 1898 | 10,449,838 | 13 | 9 | 3 | 8,211,409 | 10 | 11 | 7 | 68,117 | 19,191 |
| 1899 | 11,923,422 | 15 | 1 | 11 | 8,613,656 | 10 | 18 | 1 | 14,913 | 125,977 |
| 1900 | 13,223,258 | 16 | 9 | 8 | 10,207,326 | 12 | 14 | 6 | 22,903 | 438,770 |
| 1901 | 12,869,810 | 15 | 13 | 6 | 11,353,416 | 13 | 16 | 6 | 11,614 | 464,499 |
| 1902 | 13,635,459 | 16 | 4 | 4 | 10,958,038 | 13 | 0 | 7 | 9,518 | 368,685 |
| 1903 | 14,971,926 | 17 | 6 | 10 | 12,075,959 | 13 | 19 | 9 | 38,452 | 712,716 |
| 1904 | 14,738,750 | 16 | 11 | 11 | 12,900,030 | 14 | 10 | 6 | 9,598 | 391,664 |
| 1905 | 15,642,069 | 17 | 2 | 7 | 12,481,178 | 13 | 13 | 4 | 13,878 | 347,679 |
| 1906 | 17,992,480 | 19 | 1 | 6 | 14,303,170 | 15 | 3 | 3 | 102,657 | 908,233 |
| 1907 | 20,061,641 | 20 | 15 | 0 | 16,539,707 | 17 | 2 | 2 | 7,316 | 763,154 |
| 1908 | 16,075,205 | 16 | 3 | 10 | 17,247,162 | 17 | 7 | 5 | 242,289 | 224,122 |
| 1909 | 19,636,151 | 19 | 5 | 2 | 14,817,462 | 14 | 10 | 8 | 25,845 | 857,257 |
| 1910 | 22,152,473 | 21 | 5 | 10 | 16,748,223 | 16 | 1 | 11 | 27,736 | 303,360 |
| 1911 | 18,980,185 | 17 | 16 | 10 | 18,782,608 | 17 | 13 | 1 | 48,305 | 763,271 |
| 1912 | 21,511,626 | 19 | 15 | 1 | 20,576,579 | 18 | 17 | 11 | 258,955 | 399,995 |
| 1913 | 22,810,363 | 20 | 7 | 11 | 21,653,632 | 19 | 7 | 2 | 176,359 | 634,670 |
| 1914 | 26,253,925 | 23 | 0 | 6 | 21,144,227 | 18 | 10 | 11 | 7,522 | 711,869 |
| 1915 | 31,430,822 | 27 | 7 | 0 | 20,658,720 | 17 | 19 | 6 | 318,090 | 1,070,114 |
| 1916 | 33,281,057 | 28 | 19 | 2 | 25,045,403 | 21 | 15 | 10 | 5,880 | 1,293,880 |
| 1917 | 31,517,072 | 27 | 8 | 8 | 20,742,130 | 18 | 1 | 1 | 70,475 | 177,135 |
| 1918 | 28,480,578 | 24 | 14 | 1 | 24,131,792 | 20 | 18 | 8 | 35,610 | 102,215 |
| 1919 | 53,907,925 | 45 | 4 | 0 | 30,309,167 | 25 | 8 | 3 | 62,150 | 362,531 |
| 1920 | 46,405,366 | 37 | 7 | 0 | 61,553,853 | 49 | 10 | 11 | 36,580 | 41,975 |
| 1921 | 44,828,460 | 35 | 2 | 3 | 42,744,122 | 33 | 9 | 8 | 367 | 198,321 |
| 1922 | 42,725,949 | 32 | 14 | 9 | 34,826,074 | 26 | 13 | 8 | 300 | 186,487 |
| 1923 | 45,939,793 | 34 | 11 | 9 | 43,363,983 | 32 | 13 | 0 | 27,372 | 14,510 |
| 1924 | 52,509,223 | 38 | 16 | 5 | 48,527,603 | 35 | 17 | 6 | 103,488 | |
| 1925 | 55,243,047 | 39 | 18 | 1 | 52,425,757 | 37 | 17 | 4 | 19,225 | 30,650 |
| 1926 | 45,268,924 | 32 | 0 | 6 | 49,811,763 | 35 | 4 | 8 | 6,651 | 77,800 |
| 1927 | 48,496,354 | 33 | 14 | 0 | 44,782,666 | 31 | 2 | 5 | 280 | |
| 1928 | 55,570,381 | 38 | 3 | 3 | 44,844,102 | 30 | 16 | 0 | 618,100 | 42,164 |
| 1929 | 54,930,063 | 37 | 5 | 7 | 48,734,472 | 33 | 1 | 6 | 649,000 | 63,505 |
| 1930 | 44,940,517 | 30 | 2 | 0 | 44,339,654 | 29 | 14 | 0 | 175 | 363,087 |
| 1931 | 34,950,698 | 23 | 1 | 8 | 26,498,151 | 17 | 10 | 0 | 202,330 | 56,155 |
| 1932 | 35,609,919 | 23 | 6 | 5 | 24,646,006 | 16 | 2 | 10 | 1,355,861 | 55,310 |
| 1933 | 41,005,919 | 26 | 12 | 8 | 25,581,366 | 16 | 12 | 4 | 296,032 | 424,704 |
| 1934 | 47,342,847 | 30 | 10 | 3 | 31,339,552 | 20 | 4 | 0 | 2,283,900 | 1,242,000 |
| 1935 | 46,538,381 | 29 | 15 | 9 | 36,317,267 | 23 | 4 | 11 | 521,000 | 381,821 |
| 1936 | 56,751,940 | 36 | 0 | 7 | 44,258,886 | 28 | 1 | 11 | 45,245 | 36,601 |
| 1937 | 66,713,379 | 41 | 19 | 2 | 56,160,695 | 35 | 6 | 5 | 3,500 | 318,510 |
| 1938 | 58,376,283 | 36 | 6 | 8 | 55,422,189 | 34 | 9 | 10 | 31,805 | 31,274 |
| 1939 | 58,049,316 | 35 | 12 | 11 | 49,387,183 | 30 | 6 | 6 | 2,795 | 25,364 |
| 1940 | 73,741,133 | 45 | 0 | 9 | 48,997,669 | 29 | 18 | 6 | 36,646 | |
| 1941 | 67,479,413 | 41 | 7 | 6 | 49,167,010 | 30 | 2 | 11 | 10,015 | 205,409 |
| 1942 | 81,284,637 | 49 | 11 | 6 | 53,856,012‡ | 32 | 16 | 11 | 25,375 | 147,010 |
| 1943 | 71,862,598 | 43 | 18 | 9 | 95,242,330‡ | 58 | 4 | 7 | 1,240 | 461,800 |
| 1944 | 77,786,946 | 46 | 19 | 7 | 86,397,212‡ | 52 | 3 | 7 | 400 | 159,640 |
| 1945§ | 81,536,431 | 48 | 2 | 3 | 55,072,928 | 32 | 9 | 11 | 4,400 | 208,148 |
| 1946§ | 101,307,165 | 57 | 10 | 5 | 71,634,114 | 40 | 13 | 5 | 4,532 | 418,970 |
| 1947§ | 129,406,264 | 71 | 15 | 9 | 128,724,841 | 71 | 8 | 2 | 10,375 | 184,990 |
| 1948§ | 147,822,862 | 80 | 5 | 6 | 128,200,692 | 69 | 12 | 5 | 55,169 | 624,755 |
| Year. | Exports of New Zealand Produce. | |||||
|---|---|---|---|---|---|---|
| Wool. | Frozen Meat.* | Tallow. | ||||
| Quantity. | Value. | Quantity. | Value. | Quantity. | Value. | |
* Includes exports of chilled beer. † Provisional. | ||||||
| lb. | £ | Cwt. | £ | Cwt. | £ | |
| 1898 | 149,385,815 | 4,645,804 | 1,551,773 | 1,698,750 | 347,160 | 302,141 |
| 1899 | 147,169,497 | 4,324,627 | 1,865,827 | 2,088,856 | 338,620 | 311,649 |
| 1900 | 140,706,486 | 4,749,196 | 1,844,831 | 2,123,881 | 367,780 | 368,473 |
| 1901 | 146,820,079 | 3,699,103 | 1,857,547 | 2,253,262 | 335,360 | 351,710 |
| 1902 | 160,419,023 | 3,354,563 | 2,138,557 | 2,718,763 | 424,060 | 550,131 |
| 1903 | 155,128,381 | 4,041,274 | 2,378,650 | 3,197,043 | 396,940 | 517,871 |
| 1904 | 144,647,376 | 4,673,826 | 1,912,979 | 2,793,599 | 322,480 | 357,974 |
| 1905 | 139,912,737 | 5,381,333 | 1,690,684 | 2,694,432 | 318,942 | 347,888 |
| 1906 | 154,384,568 | 6,765,655 | 2,025,507 | 2,877,031 | 378,400 | 455,026 |
| 1907 | 171,635,595 | 7,657,278 | 2,354,808 | 3,420,664 | 414,880 | 560,965 |
| 1908 | 162,518,481 | 5,332,781 | 2,120,303 | 3,188,515 | 372,520 | 481,335 |
| 1909 | 189,683,703 | 6,305,888 | 2,572,604 | 3,601,093 | 484,160 | 648,452 |
| 1910 | 204,368,957 | 8,308,410 | 2,654,196 | 3,850,777 | 520,180 | 756,841 |
| 1911 | 169,424,811 | 6,491,707 | 2,250,565 | 3,503,400 | 413,120 | 607,257 |
| 1912 | 188,361,790 | 7,105,483 | 2,573,238 | 3,909,569 | 470,900 | 684,739 |
| 1913 | 186,533,036 | 8,057,620 | 2,578,693 | 4,449,933 | 454,860 | 663,088 |
| 1914 | 220,472,898 | 9,318,114 | 3,229,969 | 5,863,062 | 490,300 | 694,348 |
| 1915 | 196,570,114 | 10,387,875 | 3,591,260 | 7,794,395 | 535,260 | 780,828 |
| 1916 | 185,506,859 | 12,386,074 | 3,326,045 | 7,271,318 | 449,440 | 785,339 |
| 1917 | 178,274,486 | 12,175,366 | 2,446,945 | 5,982,404 | 251,980 | 553,016 |
| 1918 | 108,724,575 | 7,527,266 | 2,036,904 | 4,957,576 | 328,420 | 847,618 |
| 1919 | 274,246,613 | 19,559,537 | 3,822,683 | 9,628,292 | 937,480 | 2,680,006 |
| 1920 | 162,327,176 | 11,863,827 | 4,629,282 | 11,673,696 | 540,820 | 1,748,773 |
| 1921 | 158,714,828 | 5,221,479 | 4,322,754 | 11,164,345 | 554,240 | 867,298 |
| 1922 | 321,525,562 | 11,882,463 | 3,518,004 | 8,387,461 | 529,900 | 750,574 |
| 1923 | 217,566,091 | 10,904,658 | 3,043,910 | 9,012,627 | 504,860 | 785,668 |
| 1924 | 206,189,911 | 15,267,544 | 3,213,574 | 9,499,877 | 479,760 | 799,230 |
| 1925 | 205,726,856 | 17,739,736 | 3,414,205 | 11,174,567 | 500,760 | 895,061 |
| 1926 | 213,154,399 | 11,830,190 | 3,034,356 | 8,656,213 | 422,560 | 741,045 |
| 1927 | 220,500,720 | 12,961,744 | 3,364,965 | 9,104,621 | 477,500 | 714,441 |
| 1928 | 226,804,544 | 16,679,098 | 3,793,828 | 10,309,662 | 514,960 | 804,271 |
| 1929 | 234,955,978 | 15,359,206 | 3,336,200 | 9,883,277 | 416,640 | 693,614 |
| 1930 | 197,239,614 | 7,664,362 | 4,036,639 | 10,937,382 | 492,560 | 683,571 |
| 1931 | 211,718,868 | 5,515,376 | 4,138,806 | 8,892,555 | 465,280 | 413,080 |
| 1932 | 238,179,062 | 5,742,821 | 4,645,480 | 8,436,306 | 507,540 | 462,081 |
| 1933 | 286,307,441 | 7,422,266 | 5,203,113 | 9,845,627 | 560,400 | 516,063 |
| 1934 | 255,796,783 | 12,516,425 | 4,969,447 | 11,886,955 | 553,240 | 480,354 |
| 1935 | 222,661,403 | 7,097,133 | 5,206,514 | 12,768,968 | 505,540 | 630,638 |
| 1936 | 314,409,402 | 13,293,706 | 5,119,804 | 13,239,414 | 521,900 | 628,310 |
| 1937 | 282,339,148 | 19,070,240 | 5,410,912 | 14,689,616 | 518,800 | 647,969 |
| 1938 | 271,283,233 | 12,185,483 | 5,373,308 | 15,092,059 | 592,260 | 524,775 |
| 1939 | 277,391,713 | 11,665,909 | 5,906,251, | 15,390,801 | 582,740 | 456,527 |
| 1940 | 300,288,687 | 16,875,463 | 6,976,625 | 19,681,343 | 682,760 | 707,721 |
| 1941 | 215,743,296 | 12,613,371 | 5,284,848 | 16,595,290 | 786,560 | 818,370 |
| 1942 | 307,547,296 | 18,336,507 | 5,741,389 | 17,777,436 | 1,035,580 | 1,143,879 |
| 1943 | 206,822,348 | 13,483,544 | 4,412,657 | 13,801,632 | 879,100 | 1,071,232 |
| 1944 | 188,599,359 | 12,711,407 | 4,156,054 | 12,482,008 | 532,480 | 608,263 |
| 1945† | 165,990,887 | 12,661,244 | 5,651,061 | 17,598,983 | 615,220 | 844,318 |
| 1946† | 365,370,404 | 26,593,198 | 6,746,167 | 23,239,585 | 494,260 | 1,063,156 |
| 1947† | 375,093,061 | 31,933,086 | 6,955,603 | 29,353,331 | 514,500 | 2,366,742 |
| 1948† | 421,061,747 | 44,496,180 | 6,869,944 | 28,623,955 | 401,260 | 2,154,201 |
| Year. | Exports of New Zealand Produce. | |||||
|---|---|---|---|---|---|---|
| Butter. | Cheese. | Gold. | ||||
| Quantity. | Value. | Quantity. | Value. | Quantity. | Value. | |
* Provisional. | ||||||
| lb. | £ | Cwt. | £ | Cwt. | £ | |
| 1898 | 96,801 | 403,690 | 68,711 | 135,776 | 280,175 | 1,080,691 |
| 1899 | 136,086 | 571,799 | 69,440 | 141,818 | 389,570 | 1,513,180 |
| 1900 | 172,583 | 740,620 | 102,849 | 229,111 | 373,614 | 1,439,602 |
| 1901 | 201,591 | 882,406 | 104,294 | 238,685 | 455,558 | 1,753,784 |
| 1902 | 253,998 | 1,205,802 | 74,746 | 163,539 | 507,852 | 1,951,426 |
| 1903 | 285,106 | 1,318,067 | 74,780 | 194,998 | 533,314 | 2,037,832 |
| 1904 | 314,360 | 1,380,460 | 84,526 | 185,486 | 520,323 | 1,987,501 |
| 1905 | 305,722 | 1,408,557 | 88,562 | 205,171 | 520,485 | 2,093,936 |
| 1906 | 320,225 | 1,560,235 | 131,206 | 341,002 | 563,843 | 2,270,904 |
| 1907 | 328,441 | 1,615,345 | 236,833 | 662,355 | 508,210 | 2,027,490 |
| 1908 | 229,971 | 1,171,182 | 280,798 | 783,419 | 506,381 | 2,004,799 |
| 1909 | 321,108 | 1,639,380 | 400,607 | 1,105,390 | 506,371 | 2,006,900 |
| 1910 | 356,535 | 1,811,975 | 451,915 | 1,195,373 | 478,286 | 1,896,318 |
| 1911 | 302,387 | 1,576,917 | 439,174 | 1,192,057 | 454,837 | 1,815,251 |
| 1912 | 378,117 | 2,088,809 | 577,070 | 1,680,393 | 343,163 | 1,345,131 |
| 1913 | 372,258 | 2,061,651 | 611,663 | 1,770,297 | 376,161 | 1,459,499 |
| 1914 | 434,067 | 2,338,576 | 863,776 | 2,564,125 | 227,954 | 895,367 |
| 1915 | 420,144 | 2,700,625 | 817,258 | 2,730,211 | 422,825 | 1,694,553 |
| 1916 | 358,632 | 2,632,293 | 949,416 | 3,514,310 | 292,620 | 1,199,212 |
| 1917 | 254,397 | 2,031,551 | 885,743 | 3,949,251 | 218,624 | 903,888 |
| 1918 | 431,023 | 3,402,223 | 883,430 | 4,087,278 | 11,987 | 42,391 |
| 1919 | 345,818 | 3,080,128 | 1,572,311 | 7,790,990 | 320,207 | 1,334,405 |
| 1920 | 312,009 | 3,022,335 | 1,222,050 | 6,160,840 | 212,973 | 883,748 |
| 1921 | 898,478 | 11,169,530 | 1,368,786 | 8,199,183 | 149,595 | 612,168 |
| 1922 | 1,120,200 | 9,041,554 | 1,161,196 | 4,686,850 | 131,848 | 540,182 |
| 1923 | 1,250,140 | 10,689,200 | 1,441,460 | 6,870,397 | 169,512 | 698,583 |
| 1924 | 1,269,455 | 11,641,668 | 1,594,486 | 7,023,297 | 133,631 | 551,788 |
| 1925 | 1,245,324 | 10,240,132 | 1,376,754 | 5,800,808 | 114,696 | 472,364 |
| 1926 | 1,168,040 | 8,695,188 | 1,461,548 | 5,939,359 | 125,777 | 516,207 |
| 1927 | 1,455,539 | 10,915,233 | 1,492,792 | 5,582,596 | 130,171 | 534,652 |
| 1928 | 1,449,570 | 11,302,667 | 1,567,272 | 6,693,951 | 118,722 | 489,584 |
| 1929 | 1,653,807 | 13,228,027 | 1,779,093 | 7,017,463 | 116,848 | 480,212 |
| 1930 | 1,884,237 | 11,854,056 | 1,812,981 | 6,438,438 | 133,749 | 550,678 |
| 1931 | 1,988,566 | 10,649,527 | 1,636,347 | 4,461,293 | 140,970 | 581,032 |
| 1932 | 2,185,545 | 10,639,053 | 1,790,431 | 4,951,268 | 200,648 | 1,092,288 |
| 1933 | 2,635,247 | 11,648,699 | 1,982,942 | 4,766,351 | 177,241 | 1,281,612 |
| 1934 | 2,614,519 | 10,042,776 | 1,984,496 | 4,694,459 | 162,490 | 1,320,690 |
| 1935 | 2,789,298 | 13,616,740 | 1,727,552 | 4,376,512 | 171,283 | 1,441,790 |
| 1936 | 2,796,145 | 15,317,576 | 1,658,206 | 5,122,438 | 168,073 | 1,398,656 |
| 1937 | 2,976,085 | 16,986,477 | 1,647,160 | 5,371,878 | 172,317 | 1,435,216 |
| 1938 | 2,614,549 | 16,520,226 | 1,610,523 | 5,935,061 | 152,487 | 1,296,839 |
| 1939 | 2,443,297 | 16,111,207 | 1,677,257 | 5,869,890 | 176,370 | 1,628,526 |
| 1940 | 2,622,700 | 18,228,026 | 2,033,506 | 8,233,486 | 188,459 | 1,948,280 |
| 1941 | 2,263,135 | 15,777,864 | 2,366,235 | 9,833,861 | 176,242 | 1,830,365 |
| 1942 | 2,344,622 | 16,477,943 | 2,687,621 | 11,860,471 | 167,246 | 1,726,540 |
| 1943 | 1,985,187 | 14,392,759 | 2,009,947 | 9,125,958 | 149,563 | 1,542,793 |
| 1944 | 2,306,804 | 18,553,484 | 1,554,059 | 7,443,632 | 138,048 | 1,423,556 |
| 1945* | 2,069,532 | 19,277,704 | 1,748,514 | 9,519,363 | 121,084 | 1,262,884 |
| 1946* | 2,035,875 | 19,841,455 | 1,514,917 | 8,448,321 | 111,531 | 1,184,783 |
| 1947* | 2,552,467 | 28,835,898 | 1,740,879 | 11,621,088 | 98,557 | 1,035,406 |
| 1948* | 2,712,387 | 33,758,188 | 1,512,468 | 11,197,024 | 58,400 | 609,259 |
| Year. | Exports of New Zealand Produce. | |||||
|---|---|---|---|---|---|---|
| Rabbit skins. | Grass and Clover Seeds. | Milk (Dried and Condensed). | ||||
| Quantity. | Value. | Quantity. | Value. | Quantity. | Value. | |
* Provisional. | ||||||
| lb. | £ | Cwt. | £ | Cwt. | £ | |
| 1898 | 6,607,934 | 51,607 | 49,028 | 78,519 | 493,656 | 9,429 |
| 1899 | 7,891,648 | 81,118 | 38,317 | 61,974 | 643,559 | 12,012 |
| 1900 | 5,690,893 | 41,689 | 62,791 | 93,006 | 560,528 | 10,526 |
| 1901 | 7,112,008 | 57,046 | 52,562 | 69,937 | 945,772 | 17,805 |
| 1902 | 6,139,794 | 52,566 | 43,998 | 84,861 | 614,708 | 12,305 |
| 1903 | 6,101,899 | 40,727 | 61,665 | 109,049 | 636,942 | 12,588 |
| 1904 | 6,103,930 | 40,843 | 46,293 | 95,835 | 263,243 | 5,230 |
| 1905 | 8,831,107 | 66,983 | 44,648 | 80,598 | 755,039 | 16,597 |
| 1906 | 5,454,738 | 50,686 | 50,638 | 89,022 | 484,493 | 10,420 |
| 1907 | 5,513,900 | 53,757 | 36,738 | 87,300 | 81,411 | 1,976 |
| 1908 | 7,148,625 | 6,529 | 15,396 | 34,881 | 80,071 | 1,619 |
| 1909 | 7,533,137 | 89,533 | 71,541 | 94,410 | 91,680 | 3,014 |
| 1910 | 9,103,954 | 132,773 | 54,946 | 113,568 | 235,590 | 5,326 |
| 1911 | 7,455,288 | 76,712 | 18,438 | 40,317 | 281,527 | 6,898 |
| 1912 | 8,937,035 | 118,234 | 36,344 | 69,694 | 32,392 | 671 |
| 1913 | 6,267,608 | 86,756 | 35,589 | 60,492 | 17,184 | 359 |
| 1914 | 4,512,171 | 48,388 | 39,572 | 73,551 | 47,983 | 791 |
| 1915 | 6,090,872 | 50,004 | 13,980 | 42,314 | 1,175,106 | 20,388 |
| 1916 | 5,896,410 | 76,405 | 9,841 | 34,266 | 984,035 | 23,780 |
| 1917 | 4,944,607 | 105,321 | 16,484 | 48,635 | 4,103,849 | 153,538 |
| 1918 | 7,854,152 | 299,765 | 15,995 | 42,215 | 7,061,830 | 341,797 |
| 1919 | 14,310,007 | 775,118 | 49,906 | 249,886 | 10,494,679 | 579,266 |
| 1920 | 14,363,216 | 830,024 | 23,821 | 147,369 | 13,950,026 | 795,612 |
| 1921 | 13,922,446 | 448,180 | 37,319 | 156,114 | 18,596,392 | 1,109,331 |
| 1922 | 15,487,225 | 567,864 | 70,120 | 285,451 | 11,421,332 | 529,650 |
| 1923 | 14,233,417 | 472,491 | 47,031 | 175,754 | 16,220,997 | 513,495 |
| 1924 | 20,444,390 | 740,975 | 36,331 | 149,083 | 13,481,253 | 505,098 |
| 1925 | 19,708,586 | 843,416 | 45,368 | 151,164 | 13,742,627 | 425,738 |
| 1926 | 17,135,599 | 829,165 | 57,726 | 200,380 | 11,324,780 | 345,072 |
| 1927 | 12,928,669 | 682,658 | 90,362 | 255,798 | 12,420,494 | 346,271 |
| 1928 | 12,104,072 | 582,148 | 50,238 | 162,452 | 17,218,653 | 392,452 |
| 1929 | 9,122,917 | 361,949 | 57,869 | 182,537 | 13,736,098 | 352,587 |
| 1930 | 7,206,992 | 142,249 | 36,560 | 166,221 | 15,200,835 | 351,339 |
| 1931 | 6,174,092 | 108,841 | 40,953 | 155,410 | 12,845,394 | 246,483 |
| 1932 | 6,660,140 | 70,016 | 34,337 | 109,632 | 16,033,175 | 269,121 |
| 1933 | 10,378,388 | 224,199 | 80,308 | 152,458 | 17,640,072 | 315,964 |
| 1934 | 13,035,015 | 257,585 | 48,751 | 166,511 | 21,562,450 | 407,708 |
| 1935 | 13,536,745 | 395,090 | 71,649 | 215,738 | 20,783,080 | 370,890 |
| 1936 | 16,928,931 | 763,961 | 79,982 | 249,861 | 23,742,354 | 405,801 |
| 1937 | 12,050,438 | 557,132 | 58,107 | 205,988 | 24,713,648 | 364,676 |
| 1938 | 10,268,012 | 247,390 | 45,484 | 233,372 | 20,536,678 | 307,603 |
| 1939 | 11,190,294 | 262,904 | 45,829 | 284,514 | 24,545,704 | 377,506 |
| 1940 | 10,412,156 | 401,716 | 45,742 | 369,035 | 23,440,047 | 419,176 |
| 1941 | 13,403,673 | 1,006,238 | 88,191 | 563,673 | 29,641,506 | 699,533 |
| 1942 | 11,818,761 | 745,742 | 82,499 | 592,681 | 27,585,510 | 683,578 |
| 1943 | 12,290,284 | 903,241 | 90,720 | 665,113 | 23,190,806 | 598,228 |
| 1944 | 13,886,065 | 974,909 | 158,475 | 1,453,090 | 18,429,814 | 534,716 |
| 1945* | 17,670,078 | 1,204,791 | 166,513 | 1,799,310 | 33,811,948 | 1,019,710 |
| 1946* | 15,755,939 | 1,451,301 | 150,598 | 1,942,072 | 38,008,445 | 1,198,282 |
| 1947* | 16,654,496 | 1,120,219 | 147,011 | 1,663,365 | 44,753,710 | 1,651,396 |
| 1948* | 13,471,298 | 754,651 | 174,844 | 1,700,644 | 59,448,665 | 2,209,805 |
| Year. | Exports of New Zealand Produce. | |||||
|---|---|---|---|---|---|---|
| Cattle-hides and Calf-skins. | Sheep-skins. | |||||
| Cattle-hides. | Calf-skins. | Aggregate Value. | With Wool. | Without Wool. | Aggregate Value. | |
* Figures not available. † Provisional. | ||||||
| Number. | Number. | £ | Number. | Number. | £ | |
| 1898 | * | * | * | * | 4,767,442 | 244,579 |
| 1899 | * | * | * | * | 4,675,518 | 268,230 |
| 1900 | * | * | * | * | 4,401,885 | 279,391 |
| 1901 | * | * | * | 238,833 | 4,362,698 | 264,579 |
| 1902 | * | * | * | 441,078 | 5,703,602 | 375,876 |
| 1903 | * | * | * | 683,251 | 6,459,280 | 468,969 |
| 1904 | * | * | * | 533,413 | 5,504,047 | 401,726 |
| 1905 | * | * | * | 657,610 | 4,273,581 | 500,744 |
| 1906 | * | * | * | 716,011 | 5,835,217 | 680,632 |
| 1907 | * | * | * | 830,130 | 6,186,614 | 796,127 |
| 1908 | * | * | * | 718,428 | 5,603,688 | 518,696 |
| 1909 | * | * | * | 1,096,080 | 6,419,334 | 684,271 |
| 1910 | * | * | * | 983,492 | 6,827,094 | 741,259 |
| 1911 | * | * | * | 901,088 | 6,718,907 | 633,523 |
| 1912 | * | * | * | 920,301 | 7,000,671 | 707,203 |
| 1913 | * | * | * | 933,152 | 7,238,123 | 800,354 |
| 1914 | 214,483 | 182,128 | 408,307 | 913,562 | 7,607,049 | 856,832 |
| 1915 | 269,656 | 234,164 | 571,861 | 499,064 | 8,594,786 | 826,507 |
| 1916 | 296,551 | 206,024 | 672,182 | 397,895 | 7,937,675 | 917,633 |
| 1917 | 176,747 | 50,902 | 453,937 | 2,686 | 6,525,367 | 1,300,188 |
| 1918 | 206,919 | 106,238 | 530,431 | 8,741,538 | 1,813,589 | |
| 1919 | 318,641 | 106,807 | 963,554 | 8,501,756 | 1,694,867 | |
| 1920 | 284,666 | 251,257 | 1,125,811 | 9,221,552 | 3,060,212 | |
| 1921 | 329,032 | 440,712 | 569,163 | 85,512 | 8,350,886 | 972,116 |
| 1922 | 239,930 | 464,563 | 504,334 | 645,002 | 9,499,851 | 980,189 |
| 1923 | 339,503 | 609,155 | 746,477 | 706,013 | 7,540,787 | 1,121,695 |
| 1924 | 469,588 | 706,847 | 832,009 | 689,401 | 8,136,265 | 1,513,477 |
| 1925 | 495,535 | 702,029 | 940,140 | 471,127 | 8,224,185 | 1,989,289 |
| 1926 | 449,103 | 751,448 | 755,537 | 706,699 | 8,525,194 | 1,544,273 |
| 1927 | 397,792 | 774,141 | 922,825 | 972,530 | 8,945,923 | 1,550,812 |
| 1928 | 431,609 | 769,538 | 1,228,105 | 1,364,782 | 8,817,267 | 1,924,097 |
| 1929 | 290,804 | 667,915 | 677,925 | 1,072,017 | 8,559,739 | 1,812,093 |
| 1930 | 290,964 | 656,802 | 510,683 | 1,542,025 | 9,477,561 | 1,516,738 |
| 1931 | 308,843 | 652,747 | 337,296 | 1,665,811 | 10,419,882 | 805,838 |
| 1932 | 304,053 | 845,707 | 306,053 | 1,641,202 | 11,999,210 | 694,217 |
| 1933 | 401,327 | 890,687 | 544,385 | 3,380,114 | 11,813,685 | 1,043,208 |
| 1934 | 476,235 | 1,109,999 | 627,371 | 2,949,971 | 9,243,726 | 1,250,091 |
| 1935 | 521,745 | 1,266,258 | 685,873 | 2,405,251 | 11,765,293 | 1,275,464 |
| 1936 | 430,942 | 1,177,847 | 761,511 | 1,780,332 | 10,847,249 | 1,703,130 |
| 1937 | 506,460 | 1,162,952 | 1,031,076 | 1,743,982 | 10,759,059 | 2,246,015 |
| 1938 | 516,452 | 1,246,993 | 742,806 | 1,824,026 | 12,353,566 | 1,369,324 |
| 1939 | 528,157 | 1,103,182 | 781,123 | 1,932,672 | 13,223,864 | 1,460,072 |
| 1940 | 519,510 | 1,032,165 | 860,062 | 1,798,801 | 11,340,128 | 1,931,957 |
| 1941 | 384,885 | 1,015,593 | 1,003,051 | 769,580 | 17,744,052 | 2,007,376 |
| 1942 | 356,767 | 931,058 | 1,064,625 | 1,013,285 | 14,590,448 | 2,806,723 |
| 1943 | 417,608 | 943,522 | 1,129,174 | 776,579 | 14,000,046 | 2,264,080 |
| 1944 | 304,848 | 888,250 | 899,560 | 815,270 | 14,425,420 | 2,386,648 |
| 1945† | 329,089 | 795,184 | 1,040,448 | 904,952 | 14,323,785 | 2,402,250 |
| 1946† | 392,322 | 659,645 | 1,479,882 | 784,941 | 14,694,292 | 2,490,673 |
| 1947† | 472,972 | 757,186 | 2,917,094 | 1,415,789 | 15,624,349 | 6,014,194 |
| 1948† | 475,917 | 665,522 | 2,886,596 | 869,230 | 16,288,728 | 5,657,920 |
FACTORY PRODUCTION
| Year. | Number of Establishments. | Persons engaged. | Salaries and Wages paid. | Cost of Materials. | Other Expenses. | Value of Output. | Added Value. |
|---|---|---|---|---|---|---|---|
* Productive employees. † Not available. | |||||||
| £ | £ | £ | £ | £ | |||
| 1910–11 | 3,483 | 45,924* | 4,786,698* | 18,782,929 | † | 29,317,023 | 10,534,094 |
| 1915–16 | 3,755 | 48,744* | 5,791,704* | 30,197,784 | † | 43,034,033 | 12, 836,249 |
| 1918–19 | 3,478 | 58,137 | 8,501,310 | 38,803,191 | † | 55,310,864 | 16,507,673 |
| 1919–20 | 3,661 | 64,107 | 10,512,100 | 45,107,568 | † | 66,169,253 | 21,061,685 |
| 1920–21 | 4,022 | 69,681 | 13,172,996 | 52,933,494 | † | 77,828,013 | 24,894,519 |
| 1921–22 | 4,169 | 67,484 | 12,996,077 | 39,274,112 | † | 65,672,259 | 26,398,147 |
| 1922–23 | 4,325 | 70,705 | 13,075,494 | 44,340,467 | † | 72,343,032 | 28,002,565 |
| 1923–24 | 4,451 | 74,510 | 13,851,890 | 46,253,403 | † | 75,433,606 | 29,180,203 |
| 1924–25 | 4,538 | 77,183 | 14,945,975 | 51,337,115 | † | 82,479,378 | 31,142,263 |
| 1925–26 | 4,794 | 78,708 | 16,153,822 | 51,668,100 | 8,395,921 | 82,358,851 | 30,690,751 |
| 1926–27 | 5,078 | 78,613 | 16,255,177 | 49,344,442 | 8,646,779 | 80,334,601 | 30,990,159 |
| 1927–28 | 5,156 | 78,620 | 16,053,210 | 54,558,167 | 8,792,721 | 85,059,799 | 30,501,632 |
| 1928–29 | 5,126 | 80,618 | 16,201,212 | 59,136,552 | 9,330,051 | 90,478,232 | 31,341,680 |
| 1929–30 | 5,168 | 82,861 | 16,846,286 | 58,484,245 | 9,954,861 | 90,757,981 | 32,273,736 |
| 1930–31 | 5,194 | 77,914 | 15,617,052 | 48,458,356 | 9,388,626 | 77,745,249 | 29,236,893 |
| 1931–32 | 4,969 | 68,697 | 12,642,935 | 42,472,600 | 8,263,065 | 66,588,744 | 24,116,144 |
| 1932–33 | 4,993 | 68,921 | 12,048,148 | 42,726,043 | 8,097,042 | 66,109,455 | 23,383,412 |
| 1933–34 | 5,028 | 72,651 | 12,106,500 | 47,067,564 | 8,108,890 | 71,770,872 | 24,703,308 |
| 1934–35 | 5,270 | 79,358 | 13,244,373 | 52,277,285 | 8,809,912 | 79,324,473 | 27,047,188 |
| 1935–36 | 5,536 | 86,588 | 14,844,367 | 60,172,848 | 9,374,369 | 90,014,748 | 29,841,900 |
| 1936–37 | 5,728 | 96,401 | 18,333,077 | 70,938,165 | 10,481,253 | 105,941,722 | 35,003,557 |
| 1937–38 | 5,924 | 102,344 | 20,981,587 | 75,371,558 | 10,540,208 | 113,691,556 | 38,319,998 |
| 1938–39 | 6,146 | 102,535 | 22,270,010 | 75,634,903 | 10,001,804 | 114,447,426 | 38,812,523 |
| 1939–40 | 6,342 | 108,722 | 24,460,549 | 85,243,383 | 11,043,557 | 129,061,826 | 43,818,443 |
| 1940–41 | 6,395 | 113,999 | 26,946,799 | 98,547,804 | 11,978,820 | 147,153,559 | 48,605,755 |
| 1941–42 | 6,367 | 117,214 | 29,504,299 | 102,260,860 | 12,812,901 | 155,566,195 | 53,305,335 |
| 1942–43 | 6,127 | 114,590 | 32,256,071 | 107,447,799 | 13,331,973 | 165,936,284 | 58,488,485 |
| 1943–44 | 6,202 | 117,864 | 34,433,075 | 112,883,932 | 14,516,235 | 175,686,689 | 62,802,757 |
| 1944–45 | 6,485 | 122,414 | 37,379,062 | 122,695,106 | 15,481,351 | 189,800,764 | 67,105,658 |
| 1945–46 | 6,991 | 128,208 | 41,499,113 | 123,508,438 | 16,278,562 | 195,258,614 | 71,750,176 |
| 1940-47 | 7,642 | 134,435 | 45,336,217 | 137,033,722 | 18,247,043 | 216,606,182 | 79,572,460 |
INDEBTEDNESS OF GENERAL GOVERNMENT.—AMOUNT OF DEBENTURES AND STOCK IN CIRCULATION
(Nominal Amounts)
| As at 31st March, | Domiciled in | Total. | Per Head of Population. | ||||
|---|---|---|---|---|---|---|---|
| London. | Australia. | New Zealand. | |||||
* Increase due mainly to floating debt under Banks Indemnity (Exchange) Act, 1932-33, which was paid off in 1934–35. NOTE.—Figures for 1932 and later years exclude £26,191,109 in respect of which interest payments have been suspended by agreement with the Imperial Government since 1931. | |||||||
| £ | £ | £ | £ | £ | s. | d. | |
| 1900 | 43,299,679 | 181,600 | 4,393,173 | 47,874,452 | 59 | 19 | 2 |
| 1901 | 44,497,279 | 181,600 | 4,912,366 | 49,591,245 | 60 | 15 | 8 |
| 1902 | 46,430,126 | 181,600 | 6,354,721 | 52,966,447 | 63 | 11 | 6 |
| 1903 | 47,892,366 | 568,100 | 7,438,553 | 55,899,019 | 65 | 3 | 0 |
| 1904 | 48,048,842 | 793,900 | 8,679,473 | 57,522,215 | 65 | 4 | 3 |
| 1905 | 49,379,619 | 1,209,550 | 9,322,831 | 59,912,000 | 65 | 19 | 7 |
| 1906 | 50,910,992 | 2,586,450 | 8,693,598 | 62,191,040 | 66 | 13 | 0 |
| 1907 | 51,587,793 | 3,087,850 | 9,503,397 | 64,179,040 | 66 | 14 | 10 |
| 1908 | 51,158,670 | 3,554,700 | 11,740,527 | 66,453,897 | 67 | 8 | 11 |
| 1909 | 54,631,098 | 3,869,800 | 12,437,636 | 70,938,534 | 69 | 16 | 4 |
| 1910 | 57,733,658 | 4,113,985 | 13,043,002 | 74,890,645 | 72 | 6 | 10 |
| 1911 | 62,221,818 | 4,213,985 | 14,642,319 | 81,078,122 | 76 | 15 | 3 |
| 1912 | 64,004,874 | 4,213,985 | 16,135,054 | 84,353,913 | 78 | 0 | 3 |
| 1913 | 68,929,464 | 4,213,985 | 16,917,314 | 90,060,763 | 81 | 0 | 6 |
| 1914 | 78,624,309 | 4,286,800 | 16,819,318 | 99,730,427 | 87 | 10 | 2 |
| 1915 | 76,410,001 | 3,979,000 | 19,670,909 | 100,059,910 | 86 | 19 | 7 |
| 1916 | 81,464,748 | 3,520,650 | 24,651,999 | 109,637,397 | 95 | 6 | 4 |
| 1917 | 83,877,818 | 3,385,650 | 42,572,637 | 129,836,105 | 112 | 16 | 2 |
| 1918 | 88,707,818 | 3,385,650 | 58,746,587 | 150,840,055 | 130 | 12 | 11 |
| 1919 | 95,708,328 | 3,385,650 | 76,982,282 | 176,076,260 | 149 | 8 | 5 |
| 1920 | 95,708,329 | 3,385,650 | 102,076,776 | 201,170,755 | 162 | 12 | 9 |
| 1921 | 99,691,515 | 1,655,450 | 104,977,354 | 206,324,319 | 162 | 15 | 7 |
| 1922 | 105,919,159 | 2,287,440 | 110,847,786 | 219,054,385 | 168 | 6 | 10 |
| 1923 | 110,668,268 | 2,159,490 | 106,125,566 | 218,953,324 | 165 | 4 | 2 |
| 1924 | 114,876,893 | 2,106,600 | 104,632,868 | 221,616,361 | 164 | 8 | 5 |
| 1925 | 120,818,487 | 2,952,200 | 104,043,960 | 227,814,647 | 165 | 2 | 11 |
| 1926 | 128,047,659 | 3,643,100 | 107,164,719 | 238,855,478 | 169 | 8 | 6 |
| 1927 | 132,512,805 | 4,042,450 | 109,295,634 | 245,850,889 | 170 | 19 | 0 |
| 1928 | 139,756,973 | 4,168,850 | 107,470,429 | 251,396,252 | 172 | 18 | 5 |
| 1929 | 149,346,244 | 4,168,350 | 110,677,389 | 264,191,983 | 179 | 11 | 9 |
| 1930 | 146,580,502 | 4,276,750 | 116,526,091 | 267,383,343 | 179 | 11 | 0 |
| 1931 | 154,546,941 | 4,175,350 | 117,311,067 | 276,033,358 | 182 | 12 | 0 |
| 1932 | 133,450,746 | 3,914,550 | 118,386,395 | 255,751,691 | 167 | 12 | 11 |
| 1933 | 135,209,594 | 2,868,710 | 118,353,545 | 256,431,849 | 166 | 14 | 6 |
| 1934 | 134,716,996 | 2,908,150 | 138,975,741* | 276,600,887 | 178 | 8 | 9 |
| 1935 | 134,781,121 | 2,183,550 | 117,425,437 | 254,390,108 | 162 | 19 | 4 |
| 1936 | 132,520,821 | 1,592,650 | 122,256,518 | 256,369,989 | 162 | 17 | 9 |
| 1937 | 130,545,907 | 891,900 | 130,041,284 | 261,479,091 | 164 | 14 | 10 |
| 1938 | 130,665,907 | 882,600 | 132,461,726 | 264,010,233 | 164 | 10 | 11 |
| 1939 | 130,661,907 | 879,600 | 146,237,656 | 277,779,163 | 170 | 19 | 5 |
| 1940 | 131,672,161 | 879,600 | 164,164,666 | 296,716,427 | 180 | 16 | 6 |
| 1941 | 132,180,480 | 879,600 | 190,176,386 | 323,236,466 | 197 | 11 | 0 |
| 1942 | 127,564,454 | 862,300 | 230,779,870 | 359,206,624 | 219 | 15 | 9 |
| 1943 | 132,083,189 | 862,300 | 304,688,774 | 437,634,263 | 267 | 16 | 4 |
| 1944 | 132,916,719 | 862,300 | 366,746,933 | 500,525,952 | 304 | 9 | 6 |
| 1945 | 133,091,274 | 861,300 | 403,274,133 | 537,226,707 | 319 | 15 | 8 |
| 1946 | 94,529,175 | 861,300 | 472,749,935 | 568,140,410 | 323 | 3 | 6 |
| 1947 | 94,529,175 | 861,300 | 482,990,107 | 578,380,582 | 322 | 10 | 9 |
| 1948 | 83,187,566 | 779,000 | 494,111,972 | 578,078,538 | 315 | 3 | 1 |
| 1949 | 79,962,101 | 628,226 | 534,395,305 | 614,985,632 | 328 | 5 | 10 |
REVENUE AND EXPENDITURE OF GENERAL GOVERNMENT
| Year ended 31st March, | Consolidated Fund. | |||||
|---|---|---|---|---|---|---|
| Receipts. | Payments. | Balances. | ||||
| From Taxation. | From other Sources. | Totals. | Totals. | Deficit. | Surplus. | |
NOTE.—Reference to Section 24A will Indicate that the figures shown in the above table are by no means on a comparable basis over the period. The figures from 1937-38 onwards have been adjusted to bring them into line with present practice. * Includes taxation formerly credited to, and certain expenditure previously charged to, the War Expenses Account. † Excludes £20,000,000 loan portions of payment to Reserve Bank for liability due to alteration in the exchange rate as from 20th August, 1948. | ||||||
| £ | £ | £ | £ | £ | £ | |
| 1899 | 2,707,099 | 2,551,129 | 5,258,228 | 4,858,511 | 399,717 | |
| 1900 | 2,891,126 | 2,808,492 | 5,699,618 | 5,140,128 | 559,490 | |
| 1901 | 3,042,890 | 2,864,026 | 5,906,916 | 5,479,703 | 427,213 | |
| 1902 | 3,113,079 | 3,039,760 | 6,152,839 | 5,895,914 | 256,925 | |
| 1903 | 3,277,964 | 3,169,471 | 6,447,435 | 6,214,019 | 233,416 | |
| 1904 | 3,649,601 | 3,480,516 | 7,130,117 | 6,434,281 | 695,836 | |
| 1905 | 3,754,379 | 3,592,818 | 7,347,197 | 6,635,902 | 711,295 | |
| 1906 | 3,841,596 | 3,808,502 | 7,650,098 | 7,122,340 | 527,758 | |
| 1907 | 4,264,555 | 4,214,402 | 8,478,957 | 7,774,926 | 704,031 | |
| 1908 | 4,645,754 | 4,418,235 | 9,063,989 | 8,213,965 | 850,024 | |
| 1909 | 4,377,761 | 4,624,224 | 9,001,985 | 8,785,513 | 216,472 | |
| 1910 | 4,180,516 | 5,058,401 | 9,238,917 | 8,990,922 | 247,995 | |
| 1911 | 4,837,322 | 5,459,951 | 10,297,273 | 9,343,106 | 954,167 | |
| 1912 | 5,296,590 | 5,764,571 | 11,061,161 | 10,340,368 | 720,793 | |
| 1913 | 5,606,829 | 6,127,442 | 11,734,271 | 11,082,038 | 652,233 | |
| 1914 | 5,918,034 | 6,311,627 | 12,229,661 | 11,825,864 | 403,797 | |
| 1915 | 5,881,905 | 6,570,040 | 12,451,945 | 12,379,803 | 72,142 | |
| 1916 | 7,266,966 | 7,243,171 | 14,510,137 | 12,493,107 | 2,017,030 | |
| 1917 | 10,549,654 | 7,817,893 | 18,367,547 | 14,058,770 | 4,308,777 | |
| 1918 | 12,340,853 | 7,865,369 | 20,206,222 | 15,120,288 | 5,085,934 | |
| 1919 | 13,801,643 | 8,550,729 | 22,352,372 | 18,673,599 | 3,678,773 | |
| 1920 | 16,256,527 | 9,824,813 | 26,081,340 | 23,781,924 | 2,299,416 | |
| 1921 | 22,184,415 | 12,076,547 | 34,260,962 | 28,128,730 | 6,132,232 | |
| 1922 | 16,370,516 | 11,756,491 | 28,127,007 | 28,466,838 | 339,831 | |
| 1923 | 15,594,288 | 11,985,155 | 27,579,443 | 26,263,760 | 1,315,683 | |
| 1924 | 16,416,871 | 11,543,500 | 27,960,371 | 26,148,005 | 1,812,366 | |
| 1925 | 16,554,664 | 12,088,336 | 28,643,000 | 27,399,200 | 1,243,800 | |
| 1926 | 16,978,496 | 7,747,266 | 24,725,762 | 23,570,083 | 1,155,679 | |
| 1927 | 16,899,556 | 8,043,551 | 24,943,107 | 24,355,965 | 587,142 | |
| 1928 | 16,848,754 | 8,275,226 | 25,123,980 | 24,944,905 | 179,075 | |
| 1929 | 17,835,122 | 5,764,554 | 23,599,676 | 24,176,928 | 577,252 | |
| 1930 | 19,474,091 | 5,875,770 | 25,319,861 | 25,200,882 | 148,979 | |
| 1931 | 18,597,456 | 4,471,475 | 23,068,931 | 24,708,042 | 1,639,111 | |
| 1932 | 16,188,171 | 6,531,562 | 22,719,733 | 24,860,552 | 2,140,819 | |
| 1933 | 15,604,041 | 6,964,480 | 22,568,521 | 22,528,379 | 40,142 | |
| 1934 | 17,059,829 | 6,432,920 | 23,492,749 | 24,202,027 | 709,278 | |
| 1935 | 20,177,607 | 5,948,487 | 26,126,094 | 24,499,595 | 1,626,499 | |
| 1936 | 21,556,415 | 4,615,953 | 26,172,368 | 25,890,568 | 281,800 | |
| 1937 | 26,940,845 | 4,206,342 | 31,147,187 | 30,675,158 | 472,029 | |
| 1938 | 31,664,430 | 13,145,176 | 44,809,606 | 43,998,784 | 810,822 | |
| 1939 | 32,305,772 | 11,392,863 | 43,698,635 | 42,889,267 | 809,368 | |
| 1940 | 32,810,599 | 14,108,892 | 46,919,491 | 46,600,152 | 319,339 | |
| 1941 | 34,873,732 | 16,106,845 | 50,980,577 | 49,254,153 | 1,726,424 | |
| 1942 | 35,161,946 | 19,390,755 | 54,552,701 | 52,880,239 | 1,672,462 | |
| 1943 | 36,195,865 | 18,880,095 | 55,075,960 | 50,921,382 | 4,154,578 | |
| 1914 | 42,017,619 | 15,543,790 | 57,561,409 | 55,328,829 | 2,232,580 | |
| 1945 | 45,689,396 | 14,239,476 | 59,928,872 | 58,714,153 | 1,214,719 | |
| 1946 | 48,370,718 | 15,542,931 | 63,913,619 | 62,659,499 | 1,254,150 | |
| 1947* | 90,715,393 | 17,579,080 | 108,294,473 | 103,683,455 | 4,611,018 | |
| 1948* | 96,099,153 | 21,016,962 | 117,116,115 | 115,330,403 | 1,785,712 | |
| 1949* | 101,061,739 | 20,462,176 | 121,523,915† | 118,393,154† | 3,130,761 | |
LOCAL AUTHORITIES*
| Year ended 3lst March, | Receipts. | Payments. | Total Gross Indebtedness.† | |||
|---|---|---|---|---|---|---|
| Revenue. | Other Receipts. | Totals. | ||||
| From Rates. | From other Sources. | |||||
† Debt shown at its nominal amount, that portion domiciled overseas not being converted to its New Zealand currency equivalent. In terms of New Zealand currency gross debt at 31st March, 1948, amounted to £(N.Z.)58,610,200. | ||||||
| £ | £ | £ | £ | £ | £ | |
| 1898 | 644,552 | 790,602 | 304,645 | 1,739,799 | 1,733,016 | 7,783,445 |
| 1899 | 685,769 | 820,727 | 385,368 | 1,891,864 | 1,778,574 | 7,995,400 |
| 1900 | 714,151 | 848,032 | 372,028 | 1,934,211 | 1,960,073 | 8,149,272 |
| 1901 | 734,023 | 919,831 | 825,039 | 2,478,893 | 2,250,572 | 8,785,303 |
| 1902 | 800,471 | 1,019,024 | 775,432 | 2,594,927 | 2,528,092 | 9,245,364 |
| 1903 | 846,716 | 1,053,582 | 966,087 | 2,866,385 | 2,867,506 | 9,886,676 |
| 1904 | 950,150 | 1,206,069 | 1,142,595 | 3,298,814 | 3,230,712 | 10,756.062 |
| 1905 | 1,019,431 | 1,255,222 | 1,350,631 | 3,625,284 | 3,497,321 | 12,056,736 |
| 1906 | 1,151,219 | 1,392,148 | 1,326,597 | 3,869,964 | 3,601,506 | 12,873,165 |
| 1907 | 1,233,049 | 1,579,391 | 1,227,473 | 4,039,913 | 3,897,515 | 13,903,153 |
| 1908 | 1,356,257 | 1,750,665 | 1,410,994 | 4,517,916 | 4,491,113 | 14,931,351 |
| 1909 | 1,390,698 | 1,934,122 | 1,440,746 | 4,765,566 | 4,800.711 | 15,920,757 |
| 1910 | 1,526,317 | 1,934,034 | 2,362,171 | 5,822,522 | 4,898,482 | 17,809,917 |
| 1911 | 1,592,601 | 2,171,725 | 1,776,958 | 5,541,284 | 5,360,261 | 19,104,571 |
| 1912 | 1,677,877 | 2,298,934 | 2,425,258 | 6,402,069 | 6,074,372 | 20,763,486 |
| 1913 | 1,799,299 | 2,531,686 | 2,383,123 | 6,714,108 | 6,537,769 | 22,183,427 |
| 1914 | 2,005,638 | 2,719,112 | 2,411,575 | 7,136,325 | 6,796,314 | 23,773,429 |
| 1915 | 2,140,086 | 2,861,297 | 2,595,706 | 7,597,089 | 6,806,567 | 24,538,721 |
| 1916 | 2,355,155 | 2,967,645 | 2,469,275 | 7,792,075 | 6,920,736 | 26,045,312 |
| 1917 | 2,534,539 | 3,243,942 | 1,411,422 | 7,189,903 | 6,758,593 | 26,799,586 |
| 1918 | 2,674,541 | 3,283,749 | 1,250,047 | 7,208,337 | 7,103,073 | 27,653,681 |
| 1919 | 2,939,606 | 3,452,071 | 942,780 | 7,334,457 | 7,320,277 | 28,074,950 |
| 1920 | 3,144,213 | 4,486,582 | 3,329,003 | 10,959,798 | 10,883,586 | 30,187,942 |
| 1921 | 3,549,590 | 5,336,374 | 3,429,662 | 12,315,626 | 12,761,690 | 32,104,957 |
| 1922 | 3,779,895 | 6,074,782 | 5,486,912 | 15,341,589 | 15,091,875 | 36,745,089 |
| 1923 | 4,277,781 | 6,243,951 | 7,399,674 | 17,921,406 | 15,695,507 | 43,191,184 |
| 1924 | 4,445,627 | 6,704,144 | 5,685,107 | 16,834,878 | 16,520,950 | 46,537,833 |
| 1925 | 4,668,884 | 7,512,080 | 7,613,399 | 19,794,363 | 19,422,833 | 53,353,466 |
| 1926 | 5,039,645 | 8,333,921 | 7,505,702 | 20,879,268 | 20,915,645 | 59,419,754 |
| 1927 | 5,311,260 | 8,954,685 | 6,680,176 | 20,946,121 | 21,747,557 | 64,012,247 |
| 1928 | 5,615,672 | 9,786,271 | 5,667,651 | 21,069,594 | 22,423,167 | 66,404,172 |
| 1929 | 5,844,495 | 9,583,576 | 6,042,007 | 21,470,078 | 21,300,024 | 69,294,619 |
| 1930 | 6,010,987 | 10,746,731 | 5,495,427 | 22,253,145 | 22,061,088 | 71,207,539 |
| 1931 | 5,637,254 | 10,627,391 | 4,432,956 | 20,697,601 | 22,174,524 | 72,686,036 |
| 1932 | 5,511,818 | 9,682,251 | 4,374,251 | 19,568,320 | 20,087,381 | 72,402,282 |
| 1933 | 5,237,688 | 8,913,285 | 4,433,294 | 18,584,267 | 18,885,173 | 72,476,056 |
| 1934 | 5,541,255 | 8,688,412 | 3,821,779 | 18,051,446 | 17,737,792 | 71,969,387 |
| 1935 | 5,511,442 | 9,167,287 | 3,943,488 | 18,622,217 | 18,744,891 | 71,245,458 |
| 1936 | 5,585,855 | 9,552,548 | 4,348,534 | 19,486,937 | 19,337,242 | 70,400,176 |
| 1937 | 5,994,353 | 9,979,437 | 4,252,803 | 20,226,593 | 20,222,715 | 68,559,750 |
| 1938 | 6,541,354 | 11,005,293 | 4,389,620 | 21,936,267 | 22,051,147 | 68,060,951 |
| 1939 | 6,971,550 | 11,750,626 | 6,254,792 | 24,976,968 | 25,078,935 | 68,206,674 |
| 1940 | 7,289,240 | 12,669,528 | 6,772,327 | 26,731,095 | 25,709,195 | 69,486,970 |
| 1941 | 7,344,055 | 13,144,216 | 4,651,633 | 25,139,904 | 24,726,628 | 67,974,687 |
| 1942 | 7,441,704 | 13,399,365 | 3,175,467 | 24,016,536 | 24,072,092 | 66,645,990 |
| 1943 | 7,764,677 | 14,082,822 | 2,640,252 | 24,487,751 | 23,228,434 | 65,131,074 |
| 1944 | 7,823,730 | 15,144,744 | 2,053,629 | 25,022,103 | 23,801,197 | 63,262,828 |
| 1945 | 7,895,871 | 15,472,527 | 2,086,275 | 25,454,673 | 25,223,643 | 61,237,937 |
| 1946 | 8,633,329 | 15,843,801 | 2,743,837 | 27,220,967 | 27,354,633 | 60,025,864 |
| 1947 | 9,541,133 | 17,018,847 | 3,737,371 | 30,297,351 | 30,479,174 | 57,768,259 |
| 1948 | 9,806,859 | 17,824,064 | 4,408,014 | 32,038,937 | 32,457,326 | 57,117,475 |
* Exclusive of Hospital Boards.
LOCAL AUTHORITIES*.—LOAN INDEBTEDNESS†
(Exclusive of Inscribed Debt)
| As at 31st March, | Counties. | Boroughs. | Harbour Boards. | Electric-power Districts. | Other. | Totals. |
|---|---|---|---|---|---|---|
| £ | £ | £ | £ | £ | £ | |
| 1898 | 11,710 | 2,834,306 | 3,723,380 | 264,965 | 6,834,361 | |
| 1899 | 10,500 | 2,881,567 | 3,804,187 | 267,000 | 6,963,254 | |
| 1900 | 6,900 | 2,939,025 | 3,845,881 | 265,544 | 7,057,350 | |
| 1901 | 6,714 | 3,251,817 | 4,035,331 | 269,207 | 7,563,069 | |
| 1902 | 6,714 | 3,435,884 | 4,123,631 | 273,466 | 7,839,695 | |
| 1903 | 6,614 | 3,655,436 | 4,256,481 | 298,665 | 8,217,196 | |
| 1904 | 6,214 | 4,226,800 | 4,308,851 | 357,045 | 8,898,910 | |
| 1905 | 7,800 | 4,863,986 | 4,382,551 | 763,905 | 10,018,242 | |
| 1906 | 15,228 | 5,314,173 | 4,554,151 | 834,499 | 10,718,051 | |
| 1907 | 31,678 | 5,920,305 | 4,676,551 | 987,514 | 11,616,048 | |
| 1908 | 37,138 | 6,540,071 | 4,877,676 | 1,077,449 | 12,532,334 | |
| 1909 | 56,534 | 7,016,926 | 5,052,845 | 1,177,317 | 13,303,622 | |
| 1910 | 76,877 | 7,687,209 | 5,788,400 | 1,385,199 | 14,937,685 | |
| 1911 | 185,631 | 8,399,327 | 6,002,400 | 1,544,418 | 16,131,776 | |
| 1912 | 404,078 | 9,148,771 | 6,271,717 | 1,952,922 | 17,777,488 | |
| 1913 | 605,353 | 9,981,974 | 6,431,827 | 2,175,975 | 19,195,129 | |
| 1914 | 800,515 | 11,061,343 | 6,696,029 | 2,373,392 | 20,931,279 | |
| 1915 | 1,025,601 | 11,352,802 | 6,990,573 | 2,389,253 | 21,758,229 | |
| 1916 | 1,162,170 | 12,364,056 | 7,135,895 | 2,655,017 | 23,317,138 | |
| 1917 | 1,260,307 | 12,918,990 | 7,271,594 | 2,658,283 | 24,109,174 | |
| 1918 | 1,476,412 | 13,461,919 | 7,387,125 | 2,697,981 | 25,023,437 | |
| 1919 | 1,653,619 | 13,679,658 | 7,417,488 | 2,769,784 | 25,520,549 | |
| 1920 | 2,032,960 | 15,295,958 | 7,495,641 | 2,892,192 | 27,716,751 | |
| 1921 | 2,525,845 | 16,041,368 | 7,650,479 | 147,750 | 3,313,892 | 29,679,334 |
| 1922 | 3,006,582 | 18,060,322 | 8,250,272 | 1,480,000 | 3,566,123 | 34,363,299 |
| 1923 | 3,803,334 | 21,596,465 | 8,588,978 | 3,052,300 | 3,808,440 | 40,849,517 |
| 1924 | 3,997,009 | 22,075,003 | 9,173,484 | 4,740,865 | 4,237,168 | 44.223,529 |
| 1925 | 4,616,688 | 25,882,865 | 9,750,660 | 6,514,757 | 4,315,898 | 51,080,868 |
| 1926 | 5,390,003 | 28,025,700 | 9,993,259 | 8,745,755 | 5,025,420 | 57,180,137 |
| 1927 | 5,992,375 | 30,044,394 | 10,257,781 | 10,113,400 | 5,414,670 | 61,822,620 |
| 1928 | 6,205,468 | 31,599,324 | 10,476,883 | 10,175,364 | 5,817,390 | 64,274,429 |
| 1929 | 6,350,942 | 32,244,481 | 10,774,139 | 11,986,707 | 5,860,262 | 67,216,531 |
| 1930 | 6,533,322 | 31,521,149 | 10,460,692 | 12,636,351 | 8,028,555 | 69,180,069 |
| 1931 | 6,641,057 | 32,139,389 | 10,509,207 | 13,011,529 | 8,415,827 | 70,717,009 |
| 1932 | 6,685,905 | 31,683,238 | 10,549,493 | 13,121,960 | 8,437,121 | 70,477,717 |
| 1933 | 6,614,056 | 31,791,675 | 10,620,442 | 13,031,930 | 8,550,251 | 70,608,354 |
| 1934 | 6,557,849 | 31,358,647 | 10,496,533 | 13,213,079 | 8,522,069 | 70,148,177 |
| 1935 | 6,402,889 | 30,992,129 | 10,524,788 | 13,399.053 | 8,185,800 | 69,504,659 |
| 1936 | 6,228,614 | 30,773,342 | 10.218,672 | 13,484,988 | 8,040,463 | 68,746,079 |
| 1937 | 6,124,766 | 30,505,612 | 10,152,128 | 12,026,687 | 8,141,185 | 66,950,378 |
| 1938 | 6,082,794 | 30,542,431 | 9,894,115 | 11,890,031 | 8,077,642 | 66,487,013 |
| 1939 | 6,106,544 | 30,600,654 | 9,746,940 | 12,471,315 | 7,752,762 | 66,678,215 |
| 1940 | 6,184,127 | 30,768,993 | 9,960,639 | 13,114,688 | 7,977,872 | 68,006,319 |
| 1941 | 6,154,293 | 30,024,475 | 9,927,578 | 13,106,774 | 7,331,187 | 66,544,307 |
| 1942 | 6,101,059 | 29,647,155 | 9,796,647 | 12,499,046 | 7,288,878 | 65,332,785 |
| 1943 | 5,873,138 | 28,852,648 | 9,790,659 | 12,376,558 | 7,076,093 | 63,969,096 |
| 1944 | 5,632,534 | 28,212,159 | 9,700,962 | 11,828,508 | 6,933,580 | 62,307,743 |
| 1945 | 5,386,091 | 27,567,455 | 9,496,763 | 11,535,522 | 6,428,807 | 60,414,638 |
| 1946 | 5,195,746 | 27,230,773 | 9,365,149 | 11,190,586 | 6,360,078 | 59,342,332 |
| 1947 | 4,957,171 | 26,713,154 | 8,406,378 | 10,841,813 | 6,253,316 | 57,171,832 |
| 1948 | 4,762,965 | 26,479,006 | 8,234,163 | 11,093,722 | 6,042,939 | 56,612,845 |
* Exclusive of Hospital Boards.
† Debt shown at its nominal amount, that portion domiciled overseas not being converted to its New Zealand currency equivalent.
TRADING BANKS (AVERAGE OF FOUR QUARTERS)
| Year. | Assets. | Liabilities. | ||||
|---|---|---|---|---|---|---|
| Advances. | Cola and Bullion.* | Totals. (all Assets).† | Notes in Circulation.* | Deposits. | Totals (all Liabilities).† | |
* Gold coin and bullion, and note-issue functions, taken over by Reserve Bank (August, 1934). † As at end of December from 1934 onwards. ‡ The Reserve Bank assumed liability for the outstanding notes of the trading banks as from 1st August, 1936. | ||||||
| £ | £ | £ | £ | £ | £ | |
| 1898 | 10,564,266 | 2,791,081 | 17,013,404 | 1,070,133 | 14,143,229 | 15,299,058 |
| 1899 | 10,954,435 | 2,675,361 | 17,190,433 | 1,163,759 | 14,591,223 | 15,834,858 |
| 1900 | 11,343,411 | 2,739,197 | 17,314,535 | 1,299,825 | 15,570,610 | 16,964,582 |
| 1901 | 12,148,335 | 2,996,345 | 18,422,274 | 1,361,355 | 16,034,848 | 17,490,035 |
| 1902 | 12,747,773 | 3,201,824 | 18,999,180 | 1,375,788 | 17,231,768 | 18,701,063 |
| 1903 | 13,435,993 | 3,608,941 | 19,913,546 | 1,450,267 | 19,011,114 | 20,563,879 |
| 1904 | 14,651,198 | 3,896,195 | 20,893,096 | 1,468,161 | 19,074,960 | 20,643,359 |
| 1905 | 15,496,395 | 4,006,108 | 21,770,525 | 1,468,977 | 20,545,601 | 22,144,166 |
| 1906 | 16,649,329 | 4,593,954 | 23,829,933 | 1,574,254 | 22,422,243 | 24,143,008 |
| 1907 | 18,514,045 | 4,836,718 | 26,584,239 | 1,644,645 | 23,517,111 | 25,334,348 |
| 1908 | 21,172,808 | 4,840,942 | 29,098,567 | 1,615,109 | 21,821,753 | 23,611,903 |
| 1909 | 19,078,032 | 4,947,096 | 26,937,265 | 1,577,558 | 21,996,621 | 23,728,326 |
| 1910 | 18,439,999 | 5,035,764 | 26,398,927 | 1,626,094 | 24,968,761 | 26,742,081 |
| 1911 | 21,259,727 | 5,195,333 | 29,433,614 | 1,677,842 | 26,765,122 | 28,625,803 |
| 1912 | 22,907,656 | 5,338,295 | 31,196,400 | 1,714,667 | 25,622,083 | 27,508,348 |
| 1913 | 22,902,298 | 5,204,266 | 30,708,932 | 1,674,333 | 25,733,187 | 27,591,099 |
| 1914 | 24,250,246 | 5,712,751 | 32,502,312 | 1,998,388 | 27,640,507 | 29,808,349 |
| 1915 | 23,638,970 | 6,781,006 | 33,209,483 | 2,846,275 | 31,433,653 | 34,448,270 |
| 1916 | 24,911,706 | 7,393,917 | 37,015,486 | 4,049,529 | 37,507,917 | 41,977,619 |
| 1917 | 28,847,749 | 8,072,279 | 44,979,615 | 5,410,957 | 42,930,713 | 48,541,961 |
| 1918 | 31,711,350 | 8,085,961 | 48,570,126 | 6,266,768 | 45,562,939 | 52,048,732 |
| 1919 | 31,717,720 | 8,017,159 | 48,615,209 | 7,087,545 | 50,489,444 | 57,861,393 |
| 1920 | 38,241,932 | 7,728,942 | 56,111,433 | 7,890,418 | 59,405,341 | 67,818,469 |
| 1921 | 50,607,541 | 7,660,532 | 68,701,282 | 7,569,319 | 49,397,411 | 58,808,439 |
| 1922 | 44,768,178 | 7,822,562 | 61,779,570 | 7,019,220 | 45,913,394 | 53,868,834 |
| 1923 | 43,322,242 | 7,900,594 | 59,641,235 | 6,593,068 | 49,039,482 | 56,204,292 |
| 1924 | 44,537,161 | 7,816,145 | 61,325,865 | 6,587,546 | 49,502,499 | 57,131,235 |
| 1925 | 45,298,955 | 7,722,917 | 62,128,808 | 6,775,470 | 52,207,202 | 60,219,697 |
| 1926 | 49,149,260 | 7,797,319 | 65,765,297 | 6,730,421 | 50,135,114 | 58,008,161 |
| 1927 | 50,032,203 | 7,874,971 | 66,626,676 | 6,510,018 | 48,294,096 | 56,321,397 |
| 1928 | 46,179,463 | 7,511,833 | 62,819,485 | 6,374,043 | 53,799,221 | 61,850,595 |
| 1929 | 49,278,194 | 7,051,391 | 65,475,529 | 6,433,911 | 57,609,746 | 65,232,866 |
| 1930 | 53,657,397 | 6,798,556 | 69,748,071 | 6,255,717 | 56,425,014 | 63,984,419 |
| 1931 | 52,419,527 | 6,917,897 | 68,557,120 | 5,782,354 | 53,645,018 | 61,463,034 |
| 1932 | 50,255,674 | 5,957,944 | 69,015,209 | 5,958,268 | 52,851,736 | 60,649,208 |
| 1933 | 45,705,044 | 5,105,846 | 69,656,700 | 6,205,429 | 57,620,233 | 65,281,375 |
| 1934 | 41,389,457 | 3,477,248 | 73,509,177 | 4,844,826 | 63,417,299 | 69,259,271 |
| 1935 | 44,666,541 | 767,589 | 83,008,626 | 765,343 | 61,474,511 | 65,981,411 |
| 1936 | 45,918,432 | 720,317 | 83,865,501 | ‡ | 65,153,972 | 65,939,649 |
| 1937 | 49,199,592 | 742,500 | 85,822,902 | ‡ | 66,842,692 | 67,842,240 |
| 1938 | 55,650,065 | 875,825 | 85,072,329 | ‡ | 65,038,690 | 66,820,736 |
| 1939 | 54,745,801 | 746,801 | 96,108,637 | ‡ | 67,279,451 | 75,978,460 |
| 1940 | 47,983,526 | 718,208 | 101,496,183 | ‡ | 77,345,063 | 82,032,696 |
| 1941 | 49,746,397 | 761,914 | 105,291,604 | ‡ | 80,720,101 | 84,073,585 |
| 1942 | 45,439,520 | 686,902 | 118,948,669 | ‡ | 90,880,339 | 100,768,355 |
| 1943 | 43,249,581 | 643,614 | 132,698,632 | ‡ | 106,323,897 | 114,628,316 |
| 1944 | 46,773,498 | 713,076 | 140,938,803 | ‡ | 117,568,290 | 122,214,224 |
| 1945 | 51,759,853 | 684,572 | 164,498,691 | ‡ | 130,003,009 | 142,594,988 |
| 1946 | 58,193,142 | 726,789 | 179,027,829 | ‡ | 149,658,031 | 160,503,841 |
| 1947 | 76,164,039 | 907,814 | 191,991,738 | ‡ | 164,068,429 | 177,593,488 |
| 1948 | 88,159,764 | 1,393,197 | 193,458,134 | ‡ | 175,668,670 | 190,538,286 |
POST OFFICE SAVINGS-BANK
| Year. | Number of Depositors at End of Year. | Total Amount of Deposits during Year. | Total Amount of Withdrawals during Year. | Excess of Deposits over Withdrawals. | Interest Credited to Depositors. | Total Amount to Credit of Depositors at End of Year. |
|---|---|---|---|---|---|---|
* Fifteen months, 1st January, 1920, to 31st March, 1921. † Excess of withdrawals over deposits. Does not include £11,447,755 from war gratuity accounts transferred to Post Office Savings-bank as from 1st April, 1949. | ||||||
| £ | £ | £ | £ | £ | ||
| 1898 | 169,968 | 3,279,611 | 3,194,894 | 84,717 | 128,129 | 4,957,771 |
| 1899 | 183,046 | 3,644,980 | 3,417,299 | 227,681 | 134,918 | 5,320,371 |
| 1900 | 197,408 | 4,170,429 | 3,827,416 | 343,013 | 146,169 | 5,809,552 |
| 1901 | 212,436 | 4,611,456 | 4,230,193 | 381,263 | 159,198 | 6,350,013 |
| 1902 | 227,465 | 5,069,619 | 4,708,772 | 360,847 | 172,926 | 6,883,787 |
| 1903 | 243,675 | 5,661,593 | 5,343,828 | 317,765 | 187,130 | 7,388,682 |
| 1904 | 259,164 | 5,836,540 | 5,664,770 | 171,770 | 200,930 | 7,761,382 |
| 1905 | 276,066 | 6,625,744 | 5,984,185 | 641,559 | 259,081 | 8,662,023 |
| 1906 | 298,746 | 7,907,155 | 6,907,104 | 1,000,051 | 291,192 | 9,953,266 |
| 1907 | 319,773 | 9,351,664 | 8,125,123 | 1,226,541 | 343,424 | 11,523,231 |
| 1908 | 342,077 | 9,674,075 | 9,417,820 | 256,255 | 379,808 | 12,159,294 |
| 1909 | 359,714 | 9,611,120 | 9,499,320 | 111,800 | 395,804 | 12,666,898 |
| 1910 | 380,585 | 10,708,939 | 9,695,515 | 1,013,424 | 424,668 | 14,104,990 |
| 1911 | 405,566 | 11,627,368 | 10,662,046 | 965,322 | 472,875 | 15,543,187 |
| 1912 | 432,199 | 11,725,183 | 11,449,711 | 275,472 | 511,599 | 16,330,257 |
| 1913 | 458,594 | 11,286,702 | 11,041,454 | 245,248 | 555,908 | 17,131,414 |
| 1914 | 483,262 | 11,904,323 | 10,603,018 | 1,301,305 | 615,310 | 19,048,029 |
| 1915 | 509,085 | 13,706,057 | 11,294,973 | 2,411,084 | 707,252 | 22,166,365 |
| 1916 | 538,072 | 15,576,408 | 12,957,420 | 2,618,988 | 817,856 | 25,603,209 |
| 1917 | 566,351 | 17,106,529 | 14,461,169 | 2,645,360 | 947,821 | 29,196,390 |
| 1918 | 590,205 | 18,101,105 | 14,938,842 | 3,162,263 | 1,059,472 | 33,418,125 |
| 1919 | 630,783 | 29,758,447 | 25,962,377 | 3,796,070 | 1,178,935 | 38,393,130 |
| 1920–21* | 664,819 | 44,302,852 | 41,162,486 | 3,140,366 | 1,818,535 | 43,352,031 |
| 1921–22 | 678,930 | 29,125,997 | 30,236,231 | -1,110,234† | 1,599,907 | 43,841,704 |
| 1922–23 | 690,790 | 26,682,427 | 27,769,263 | -1,086,836† | 1,605,525 | 44,360,393 |
| 1923–24 | 710,157 | 29,598,372 | 29,510,321 | 88,051 | 1,649,976 | 46,098,421 |
| 1924–25 | 735,148 | 29,582,897 | 30,413,609 | -830,712† | 1,680,920 | 46,948,628 |
| 1925–26 | 758,155 | 31,833,622 | 32,602,506 | -768,884† | 1,731,578 | 47,911,322 |
| 1926–27 | 783,827 | 29,456,383 | 30,149,629 | -693,246† | 1,767,426 | 48,985,502 |
| 1927–28 | 804,725 | 27,611,066 | 30,584,998 | -2,973,932† | 1,747,156 | 47,758,726 |
| 1928–29 | 828,296 | 27,252,381 | 28,111,940 | -859,559† | 1,745,050 | 48,644,217 |
| 1929–30 | 852,757 | 28,561,854 | 29,575,994 | -1,014,140† | 1,806,414 | 49,436,491 |
| 1930–31 | 878,043 | 24,531,569 | 28,063,338 | -3,531,769† | 1,763,825 | 47,668,547 |
| 1931–32 | 877,090 | 19,463,985 | 25,488,081 | -6,024,096† | 1,611,048 | 43,255,499 |
| 1932–33 | 797,097 | 16,933,176 | 19,635,928 | -2,702,752† | 1,475,874 | 42,028,621 |
| 1933–34 | 798,262 | 19,428,853 | 17,818,172 | 1,610,681 | 1,231,089 | 44,870,391 |
| 1934–35 | 817,617 | 24,179,537 | 20,946,562 | 3,232,975 | 1,320,348 | 49,423,714 |
| 1935–36 | 840,671 | 25,619,775 | 23,533,596 | 2,086,179 | 1,406,459 | 52,916,352 |
| 1936–37 | 880,857 | 30,676,969 | 27,042,003 | 3,634,966 | 1,514,220 | 58,065,538 |
| 1937–38 | 920,805 | 33,041,082 | 29,629,074 | 3,412,008 | 1,669,384 | 63,146,930 |
| 1938–39 | 946,822 | 30,434,291 | 34,597,708 | -4,163,417† | 1,726,574 | 60,710,087 |
| 1939–40 | 960,565 | 25,151,287 | 29,462,838 | -4,311,551† | 1,603,467 | 58,002,003 |
| 1940–41 | 992,792 | 28,607,221 | 25,319,146 | 3,288,075 | 1,666,710 | 62,956,788 |
| 1941–42 | 1,039,783 | 32,044,734 | 25,376,745 | 6,667,989 | 1,820,605 | 71,445,382 |
| 1942–43 | 1,086,996 | 38,097,070 | 26,889,339 | 11,207,731 | 1,816,820 | 84,469,933 |
| 1943–44 | 1,128,936 | 47,648,754 | 35,580,165 | 12,068,589 | 2,075,676 | 98,614,198 |
| 1944–45 | 1,161,886 | 54,585,120 | 42,158,656 | 12,426,464 | 2,451,628 | 113,492,290 |
| 1945–46 | 1,203,181 | 67,861,042 | 55,626,419 | 12,234,623 | 2,787,413 | 128,514,326 |
| 1946–47 | 1,239,948 | 72,380,543 | 62,747,093 | 9,633,450 | 3,094,491 | 141,242,267 |
| 1947–48 | 1,277,265 | 72,553,414 | 68,660,458 | 3,892,956 | 3,307,081 | 148,442,304 |
| 1948–49 | 1,311,292 | 70,690,640 | 67,722,724 | 2,967,916 | 3,438,790 | 154,849,010‡ |
POSTAL
| Year. | Letters, Cards, &c., posted and delivered. | Total Mail Matter (including Parcels) posted and delivered. | Money-orders issued. | Postal Notes Issued.* | Postal Revenue.* | |||
|---|---|---|---|---|---|---|---|---|
| Number. | Amount. | Number. | Amount. | |||||
*Year ended 31st March following. †Counted once only. ‡ Not available. § Increase largely accounted for by withdrawals from savings-bank accounts for payment at sub-post-offices being paid by Savings-bank money-orders as from 31st March, 1946. | ||||||||
| £ | £ | £ | ||||||
| 1898 | 35,654,947† | 69,053,102† | 318,370 | 1,029,241 | 431,449 | 137,085 | 304,947 | |
| 1899 | 38,484,371† | 73,728,018† | 344,664 | 1,118,808 | 461,447 | 144,631 | 325,301 | |
| 1900 | 39,898,479† | 76,801,567† | 369,834 | 1,214,853 | 490,506 | 151,180 | 316,858 | |
| 1901 | 52,567,560† | 91,599,577† | 145,967 | 1,286,508 | 556,316 | 169,527 | 281,097 | |
| 1902 | 57,714,631† | 96,452,068† | 367,207 | 1,277,059 | 616,264 | 187,709 | 302,604 | |
| 1903 | 61,687,457† | 102,732,717† | 396,312 | 1,416,225 | 707,044 | 215,275 | 343,207 | |
| 1904 | 66,501,434† | 110,778,154† | 407,783 | 1,476,887 | 785,347 | 244,719 | 383,243 | |
| 1905 | 71,116,261† | 122,493,568† | 417,441 | 1,541,712 | 875,324 | 270,300 | 410,967 | |
| 1906 | 79,084,566† | 132,936,185† | 439,020 | 1,686,231 | 981,642 | 307,323 | 438,729 | |
| 1907 | 159,680,654 | 255,279,486 | 441,487 | 1,773,591 | 1,092,631 | 340,436 | 478,388 | |
| 1908 | 175,440,111 | 281,699,027 | 488,084 | 2,050,684 | 1,222,280 | 383,472 | 544,642 | |
| 1909 | 186,926,337 | 295,886,182 | 538,740 | 2,307,593 | 1,414,752 | 441,099 | 566,990 | |
| 1910 | 196,768,968 | 310,236,516 | 569,657 | 2,457,523 | 1,666,959 | 517,315 | 603,150 | |
| 1911 | 205,450,627 | 323,663,638 | 607,764 | 2,759,393 | 1,821,566 | 566,650 | 613,252 | |
| 1912 | 214,184,119 | 333,620,976 | 666,425 | 3,231,350 | 1,970,643 | 627,443 | 644,637 | |
| 1913 | 223,961,200 | 338,400,371 | 690,745 | 3,357,774 | 2,238,842 | 711,518 | 695,136 | |
| 1914 | 233,901,320 | 359,031,400 | 691,518 | 3,427,505 | 2,314,327 | 714,683 | 698,898 | |
| 1915 | 242,547,859 | 356,519,892 | 664,860 | 3,471,818 | 2,370,079 | 712,753 | 858,583 | |
| 1916 | 242,121,361 | 347,016,697 | 669,355 | 3,607,087 | 2,286,463 | 685,708 | 964,793 | |
| 1917 | 245,796,945 | 344,962,697 | 642,683 | 3,476,645 | 2,166,597 | 628,920 | 976,027 | |
| 1918 | 242,527,369 | 333,826,886 | 638,500 | 3,649,371 | 2,091,051 | 610,591 | 983,585 | |
| 1919 | 247,143,183 | 340,448,228 | 690,291 | 4,604,059 | 2,197,520 | 646,411 | 1,068,489 | |
| 1920 | 259,743,234 | 360,747,489 | 699,674 | 5,276,776 | 2,280,219 | 691,201 | 1,352,677 | |
| 1921 | 253,767,131 | 359,096,963 | 669,383 | 4,850,820 | 2,377,622 | 723,254 | 1,499,304 | |
| 1922 | 239,997,081 | 356,188,284 | 659,943 | 4,278,529 | 2,431,506 | 730,232 | 1,378,421 | |
| 1923 | 252,021,959 | 383,196,807 | 684,979 | 4,390,159 | 2,652,777 | 786,146 | 1,146,588 | |
| 1924 | 272,311,925 | 426,907,636 | 731,511 | 4,692,929 | 2,846,333 | 840,559 | 1,257,942 | |
| 1925 | 294,630,760 | 471,503,757 | 766,689 | 4,977,230 | 3,040,722 | 902,119 | 1,320,277 | |
| 1926 | 298,617,089 | 486,381,016 | 793,110 | 5,033,127 | 3,329,638 | 965,270 | 1,400,886 | |
| 1927 | 297,478,294 | 496,553,440 | 803,535 | 4,995,090 | 3,614,217 | 1,015,213 | 1,439,587 | |
| 1928 | 298,548,364 | 517,749,720 | 807,885 | 4,977,522 | 3,575,984 | 1,057,624 | 1,426,936 | |
| 1929 | 309,162,103 | 532,070,649 | 835,358 | 5,187,553 | 3,816,635 | 1,123,446 | 1,498,684 | |
| 1930 | 313,148,058 | 542,003,413 | 833,505 | 5,069,629 | 3,907,288 | 1,128,807 | 1,582,550 | |
| 1931 | 263,633,952 | 465,484,009 | 714,478 | 3,993,035 | 2,884,654 | 952,444 | 1,744,553 | |
| 1932 | 246,395,130 | 436,615,397 | 648,951 | 3,335,552 | 2,686,648 | 958,373 | 1,393,655 | |
| 1933 | 261,979,312 | 461,132,572 | 635,674 | 3,112,729 | 2,883,070 | 1,061,946 | 1,294,757 | |
| 1934 | 275,063,943 | 486,830,600 | 654,621 | 3,209,713 | 3,325,561 | 1,140,695 | 1,384,265 | |
| 1935 | 288,645,484 | 526,126,679 | 673,057 | 3,374,029 | 3,827,417 | 1,293,955 | 1,466,857 | |
| 1936 | 292,098,761 | 534,097,248 | 733,966 | 3,794,648 | 3,833,288 | 1,378,387 | 1,628,868 | |
| 1937 | 302,170,027 | 547,687,799 | 784,495 | 4,312,629 | 3,746,560 | 1,454,793 | 1,822,308 | |
| 1938 | 316,309,341 | 608,682,253 | 848,050 | 4,802,293 | 3,835,400 | 1,485,426 | 2,033,488 | |
| 1939 | 312,603,575 | 591,476,930 | 911,484 | 5,094,364 | 3,374,852 | 1,323,398 | 1,938,607 | |
| 1940 | 296,684,295 | 531,941,815 | 812,667 | 4,435,007 | 2,558,916 | 1,020,630 | 2,084,351 | |
| 1941 | 142,996,000† | 261,870,000† | 751,722 | 4,302,126 | 2,408,020 | 980,952 | 2,194,042 | |
| 1942 | ‡ | ‡ | 817,398 | 4,960,561 | 2,242,034 | 933,634 | 2,283,847 | |
| 1943 | ‡ | ‡ | 786,511 | 5,500,687 | 2,215,572 | 945,293 | 12,464,304 | |
| 1944 | ‡ | ‡ | 762,179 | 5,989,369 | 2,223,041 | 951,989 | 2,619,066 | |
| 1945 | 140,355,000† | 236,844,000† | 769,857 | 7,202,200 | 2,266,285 | 982,597 | 12,645,257 | |
| 1946 | 160,680,000*† | 294,326,000*† | 903,369 | 10,624,440§ | 2,354,477 | 1,028,111 | 14,009,763 | |
| 1947 | 159,778,000*† | 301,067,000*† | 917,290 | 10,804,314 | 2,464,783 | 1,071,613 | 4,092,930 | |
| 1948 | 162,131,000*† | 319,229,000*† | 942,654 | 10,842,866 | 2,483,929 | 1,106,479 | 4,390,330 | |
GOVERNMENT RAILWAYS
| Year ended 3lst March, | Miles Open for Traffic. | Capital Cost of Open Lines. | Train-mileage. | Passengers carried, excluding Season-ticket Holders. | Goods and Live-stock.* | Revenue.† | Expenditure.† |
|---|---|---|---|---|---|---|---|
* Equivalent tonnage of live-stock. † From 1925–26, figures relate to railway operation only. ‡ Capital cost written down by £10,400,000. | |||||||
| £ | Tons. | £ | £ | ||||
| 1899 | 2,090 | 16,404,076 | 3,968,708 | 4,955,553 | 2,744,441 | 1,469,665 | 929,737 |
| 1900 | 2,104 | 16,703,887 | 4,187,893 | 5,468,284 | 3,251,716 | 1,623,891 | 1,052,358 |
| 1901 | 2,212 | 17,207,328 | 4,620,971 | 6,243,593 | 3,461,331 | 1,727,236 | 1,127,848 |
| 1902 | 2,235 | 18,170,722 | 5,066,360 | 7,356,136 | 3,667,039 | 1,874,586 | 1,252,237 |
| 1903 | 2,291 | 19,081,735 | 5,443,333 | 7,575,390 | 3,918,261 | 1,974,038 | 1,343,415 |
| 1904 | 2,328 | 20,692,911 | 5,685,399 | 8,306,383 | 4,259,217 | 2,180,641 | 1,438,724 |
| 1905 | 2,374 | 21,701,572 | 6,107,079 | 8,514,112 | 4,185,467 | 2,209,231 | 1,492,900 |
| 1906 | 2,407 | 22,498,972 | 6,413,573 | 8,826,382 | 4,415,166 | 2,349,704 | 1,621,239 |
| 1907 | 2,458 | 23,504,272 | 6,755,454 | 9,600,786 | 4,824,563 | 2,624,600 | 1,812,482 |
| 1908 | 2,474 | 24,365,647 | 7,051,274 | 9,756,716 | 5,070,176 | 2,761,938 | 1,949,759 |
| 1909 | 2,674 | 27,762,592 | 7,458,236 | 10,457,144 | 5,135,408 | 2,929,526 | 2,114,815 |
| 1910 | 2,717 | 28,513,476 | 7,889,166 | 11,141,142 | 5,490,018 | 3,249,790 | 2,169,474 |
| 1911 | 2,753 | 29,606,546 | 8,141,075 | 11,200,613 | 5,863,674 | 3,494,182 | 2,303,272 |
| 1912 | 2,798 | 30,506,089 | 8,371,687 | 11,891,134 | 5,887,908 | 3,676,509 | 2,465,896 |
| 1913 | 2,851 | 31,611,220 | 9,016,224 | 13,123,879 | 6,246,128 | 3,971,002 | 2,705,609 |
| 1914 | 2,854 | 32,355,087 | 9,319,268 | 13,355,893 | 6,019,633 | 4,043,328 | 2,880,323 |
| 1915 | 2,945 | 34,133,825 | 9,383,420 | 13,565,772 | 6,453,472 | 4,105,457 | 2,920,455 |
| 1916 | 2,960 | 34,857,882 | 9,356,522 | 14,201,506 | 6,370,945 | 4,548,356 | 2,910,883 |
| 1917 | 2,960 | 35,378,664 | 9,146,331 | 14,173,115 | 6,239,173 | 4,800,810 | 2,926,864 |
| 1918 | 2,983 | 36,001,432 | 7,468,646 | 11,408,156 | 5,742,968 | 4,687,700 | 3,042,907 |
| 1919 | 2,983 | 36,167,681 | 7,477,583 | 11,374,521 | 5,611,738 | 4,988,632 | 3,308,575 |
| 1920 | 2,996 | 36,390,115 | 7,408,608 | 12,760,814 | 6,000,279 | 5,752,487 | 4,105,067 |
| 1921 | 3,009 | 37,235,254 | 9,303,392 | 15,315,640 | 6,487,279 | 6,908,531 | 5,636,601 |
| 1922 | 3,021 | 39,309,097 | 8,717,265 | 14,262,440 | 6,321,351 | 6,643,591 | 6,237,727 |
| 1923 | 3,028 | 40,275,161 | 8,346,731 | 14,256,610 | 6,618,588 | 6,727,802 | 5,502,497 |
| 1924 | 3,053 | 41,399,427 | 9,024,503 | 13,817,378 | 6,918,349 | 6,984,211 | 5,403,766 |
| 1925 | 3,085 | 44,570,746 | 9,083,623 | 12,397,079 | 7,025,316 | 7,112,524 | 5,545,416 |
| 1926 | 3,138 | 47,608,676 | 10,319,407 | 11,787,723 | 7,246,692 | 7,589,274 | 6,164,570 |
| 1927 | 3,164 | 49,183,916 | 10,723,864 | 10,274,878 | 7,299,752 | 7,423,472 | 6,158,283 |
| 1928 | 3,180 | 51,187,376 | 10,838,594 | 9,272,547 | 7,358,388 | 7,343,845 | 6,302,119 |
| 1929 | 3,287 | 56,568,598 | 11,113,482 | 9,046,981 | 7,613,445 | 7,524,864 | 6,374,579 |
| 1930 | 3,287 | 57,787,671 | 12,022,043 | 8,466,779 | 7,788,973 | 7,473,993 | 6,848,026 |
| 1931 | 3,322 | 60,545,154 | 11,281,898 | 7,265,912 | 6,957,709 | 6,781,388 | 6,406,143 |
| 1932 | 3,315 | ‡51,424,883 | 10,168,720 | 6,503,566 | 5,824,811 | 5,788,965 | 5,301,653 |
| 1933 | 3,315 | 51,480,949 | 9,828,853 | 6,870,570 | 5,490,686 | 5,339,075 | 4,833,754 |
| 1934 | 3,320 | 53,909,347 | 10,163,474 | 7,511,346 | 5,642,199 | 5,628,835 | 4,877,146 |
| 1935 | 3,320 | 54,089,190 | 10,626,400 | 7,809,035 | 6,023,960 | 5,908,064 | 5,138,588 |
| 1936 | 3,320 | 54,253,059 | 11,050,376 | 7,963,824 | 6,188,805 | 6,243,519 | 5,523,193 |
| 1937 | 3,320 | 54,696,437 | 11,868,083 | 8,284,956 | 6,813,240 | 6,903,604 | 6,338,385 |
| 1938 | 3,323 | 56,065,187 | 12,777,852 | 8,069,018 | 7,516,049 | 7,591,825 | 7,291,785 |
| 1939 | 3,319 | 58,676,608 | 13,072,615 | 7,813,436 | 7,539,012 | 8,005,059 | 7,663,632 |
| 1940 | 3,390 | 63,059,188 | 13,366,798 | 8,283,067 | 7,673,950 | 8,761,637 | 7,943,120 |
| 1941 | 3,390 | 64,762,794 | 13,559,646 | 9,440,087 | 8,426,182 | 9,694,190 | 8,406,790 |
| 1942 | 3,390 | 64,904,020 | 13,978,961 | 11,105,627 | 8,473,765 | 10,383,880 | 8,902,592 |
| 1943 | 3,460 | 68,685,063 | 15,139,882 | 17,171,214 | 8,887,089 | 12,415,080 | 10,019,659 |
| 1944 | 3,504 | 70,999,125 | 15,328,987 | 18,317,323 | 9,026,626 | 13,464,979 | 11,365,917 |
| 1945 | 3,504 | 71,353,574 | 12,802,536 | 13,629,523 | 8,954,239 | 12,448,307 | 11,696,895 |
| 1946 | 3,528 | 74,466,731 | 13,454,508 | 13,553,083 | 9,210,466 | 13,104,587 | 12,549,724 |
| 1947 | 3,528 | 75,354,243 | 13,169,233 | 10,222,325 | 9,329,333 | 12,823,784 | 13,644,779 |
| 1948 | 3,526 | 77,089,031 | 13,712,103 | 8,111,417 | 9,524,043 | 13,964,280 | 15,090,091 |
| 1949 | 3,526 | 78,796,320 | 13,895,488 | 7,708,049 | 9,666,130 | 15,338,882 | 16,788,256 |
BANKRUPTCY
| Year. | Number of Bankruptcies. | Debtors' Statements of Assets, excluding Amounts secured to Creditors. | Amount realized by Official Assignees. | Amount of Debts proved. | Amount paid in Dividends and Preferential Claims. |
|---|---|---|---|---|---|
| £ | £ | £ | £ | ||
| 1898 | 407 | 90,068 | 45,474 | 285,155 | 30,994 |
| 1899 | 389 | 59,435 | 34,269 | 158,932 | 30,084 |
| 1900 | 304 | 77,689 | 53,415 | 141,800 | 37,411 |
| 1901 | 222 | 58,658 | 49,781 | 84,452 | 30,358 |
| 1902 | 205 | 61,604 | 39,386 | 110,995 | 29,406 |
| 1903 | 204 | 46,767 | 23,761 | 88,019 | 17,618 |
| 1904 | 257 | 86,094 | 43,514 | 125,392 | 28,103 |
| 1905 | 304 | 100,813 | 47,798 | 146,332 | 28,150 |
| 1906 | 347 | 106,376 | 50,761 | 192,927 | 35,448 |
| 1907 | 350 | 77,698 | 59,849 | 158,663 | 42,459 |
| 1908 | 406 | 200,447 | 67,018 | 199,069 | 47,800 |
| 1909 | 471 | 204,187 | 71,351 | 259,017 | 44,110 |
| 1910 | 393 | 127,634 | 79,100 | 176,001 | 47,796 |
| 1911 | 344 | 88,592 | 40,009 | 133,517 | 28,757 |
| 1912 | 312 | 64,398 | 39,965 | 120,325 | 26,825 |
| 1913 | 343 | 155,582 | 42,735 | 228,829 | 25,813 |
| 1914 | 391 | 174,410 | 64,153 | 199,251 | 33,910 |
| 1915 | 294 | 92,876 | 63,310 | 153,926 | 42,374 |
| 1916 | 304 | 123,441 | 56,416 | 172,774 | 29,223 |
| 1917 | 265 | 138,696 | 63,645 | 178,244 | 27,405 |
| 1918 | 164 | 50,356 | 67,729 | 88,607 | 33,176 |
| 1919 | 141 | 43,627 | 54,662 | 59,767 | 24,980 |
| 1920 | 145 | 44,026 | 47,897 | 77,752 | 45,227 |
| 1921 | 336 | 362,601 | 78,271 | 558,504 | 38,646 |
| 1922 | 690 | 344,861 | 126,145 | 834,356 | 63,009 |
| 1923 | 674 | 368,673 | 124,641 | 668,925 | 65,667 |
| 1924 | 670 | 279,602 | 118,641 | 703,995 | 74,878 |
| 1925 | 653 | 235,377 | 98,648 | 471,028 | 80,187 |
| 1926 | 752 | 236,915 | 102,899 | 585,687 | 71,515 |
| 1927 | 867 | 331,363 | 108,350 | 679,473 | 72,388 |
| 1928 | 806 | 236,264 | 116,613 | 767,327 | 68,763 |
| 1929 | 687 | 233,655 | 91,180 | 502,112 | 54,759 |
| 1930 | 780 | 471,502 | 83,308 | 827,345 | 68,611 |
| 1931 | 848 | 401,649 | 108,809 | 1,042,187 | 63,185 |
| 1932 | 661 | 252,348 | 75,657 | 624,892 | 55,940 |
| 1933 | 450 | 114,817 | 61,723 | 489,895 | 47,884 |
| 1934 | 326 | 72,572 | 44,533 | 258,920 | 33,788 |
| 1935 | 257 | 68,216 | 41,037 | 225,508 | 23,142 |
| 1936 | 260 | 40,557 | 32,983 | 169,866 | 21,520 |
| 1937 | 222 | 59,100 | 55,970 | 171,706 | 26,700 |
| 1938 | 267 | 118,698 | 64,511 | 230,463 | 30,793 |
| 1939 | 267 | 82,318 | 44,171 | 225,490 | 29,950 |
| 1940 | 213 | 35,372 | 42,418 | 125,289 | 30,288 |
| 1941 | 165 | 24,538 | 35,453 | 71,011 | 34,428 |
| 1942 | 82 | 13,665 | 29,753 | 32,227 | 19,429 |
| 1943 | 45 | 6,148 | 18,883 | 20,052 | 13,136 |
| 1944 | 51 | 13,209 | 13,466 | 51,035 | 16,741 |
| 1945 | 45 | 9,060 | 18,530 | 118,216 | 10,041 |
| 1946 | 52 | 10,663 | 20,942 | 48,506 | 14,328 |
| 1947 | 74 | 21,433 | 15,528 | 44,731 | 12,386 |
| 1948 | 148 | 56,229 | 50,280 | 143,282 | 24,945 |
Table of Contents
THE tabulation and analyses of the population census taken for the night of 25th September, 1945, has met with delay through staff shortage and other causes. Further and considerable delay in presentation of completed results has arisen from the difficulties of the printing trade. The following volumes of census results have been published:—
Volume I—Increase and Location of Population.
Volume II—Island Territories (Cook Islands and Niue, Tokelau Islands, and Western Samoa).
Volume IV.—Ages and Marital Status.
Appendix A.—Census of Poultry.
Interim Returns (Ages, Marital Status, Religious Professions, Birthplaces Duration of Residence of Overseas-born, Race, War Service, Industries, Occupations, Occupational Status, and Travelling Time).
Census figures of necessarily brief compass in certain of the above categories will be found in this issue in the appropriate sections—viz., population (pp. 19–40), island territories (pp. 809–830), and statistics of poultry on pages 926–927.
Part of the data to be covered by further volumes of census results is available and summaries are given below. The figures are subject to revision, but it is improbable that any significant changes will be required.
In view of the abnormalities to be expected in a country which had been engaged for a number of years in war, it would seem desirable to refer briefly to the scope of any census which was held so shortly after the cessation of active hostilities. In the 1945 census the following categories of people were excluded from the enumeration:—
45,381 members of the New Zealand Forces overseas at census date, this figure comprising 43,415 male and 666 female Europeans, the remaining 1,300 being Maoris.
Members of the United States of America Forces in New Zealand totalling 250.
Enemy prisoners of war, 803 in number.
On the other hand, refugees and internees were included in the enumeration.
AGES.—The age-distribution of the population as disclosed at the censuses of 1936 and 1945 is now given.
| Age-group (Years). | 1936 Census. | 1945 Census. | ||||
|---|---|---|---|---|---|---|
| Males. | Females. | Total. | Males. | Females. | Total. | |
| European Population | ||||||
| Under 5 | 59,824 | 56,914 | 116,738 | 82,662 | 79,493 | 162,155 |
| 5 and under 10 | 65,574 | 62,813 | 128,387 | 66,958 | 65,310 | 132,268 |
| 10 and under 15 | 69,055 | 66,261 | 135,316 | 60,802 | 57,949 | 118,751 |
| 15 and under 20 | 67,370 | 64,875 | 132,245 | 64,644 | 63,264 | 127,908 |
| 20 and under 25 | 67,675 | 65,865 | 133,540 | 46,530 | 66,430 | 112,960 |
| 25 and under 30 | 63,729 | 61,259 | 124,988 | 51,588 | 64,740 | 116,328 |
| 30 and under 35 | 56,042 | 53,468 | 109,510 | 58,053 | 64,361 | 122,414 |
| 35 and under 40 | 50,717 | 51,087 | 101,804 | 58,515 | 59,930 | 118,445 |
| 40 and under 45 | 43,479 | 47,570 | 91,049 | 53,317 | 52,061 | 105,378 |
| 45 and under 50 | 46,238 | 46,716 | 92,954 | 47,396 | 48,588 | 95,984 |
| 50 and under 55 | 45,803 | 43,521 | 89,324 | 40,539 | 44,064 | 84,603 |
| 55 and under 60 | 40,959 | 37,580 | 78,539 | 41,597 | 41,928 | 83,525 |
| 60 and under 65 | 29,890 | 27,923 | 57,813 | 38,967 | 38,454 | 77,421 |
| 65 and under 70 | 21,691 | 21,145 | 42,836 | 31,826 | 32,333 | 64,159 |
| 70 and under 75 | 13,288 | 13,547 | 26,835 | 19,880 | 20,309 | 40,189 |
| 75 and under 80 | 8,026 | 7,978 | 16,004 | 11,518 | 12,648 | 24,166 |
| 80 and under 85 | 4,080 | 3,998 | 8,078 | 4,897 | 5,802 | 10,699 |
| 85 and under 90 | 1,469 | 1,564 | 3,033 | 1,801 | 2,223 | 4,024 |
| 90 and under 95 | 333 | 396 | 729 | 396 | 543 | 939 |
| 95 and under 100 | 64 | 75 | 139 | 65 | 94 | 159 |
| 100 and over | 4 | 4 | 8 | 4 | 4 | 8 |
| Not specified— | ||||||
| Adults | 872 | 665 | 1,537 | 631 | 406 | 1,037 |
| Minors | 44 | 34 | 78 | 16 | 18 | 34 |
| Totals, Europeans | 756,226 | 735,258 | 1,491,484 | 782,602 | 820,952 | 1,603,554 |
| Maori Population | ||||||
| Under 5 | 7,195 | 6,829 | 14,024 | 8,330 | 8,040 | 16,370 |
| 5 and under 10 | 6,354 | 6,251 | 12,605 | 7,972 | 7,683 | 15,655 |
| 10 and under 15 | 5,245 | 5,077 | 10,322 | 6,828 | 6,624 | 13,452 |
| 15 and under 20 | 4,113 | 3,871 | 7,984 | 5,363 | 5,267 | 10,630 |
| 20 and under 25 | 4,016 | 3,785 | 7,801 | 3,693 | 4,288 | 7,981 |
| 25 and under 30 | 3,333 | 3,019 | 6,352 | 3,200 | 3,538 | 6,738 |
| 30 and under 35 | 2,276 | 2,021 | 4,297 | 2,990 | 2,938 | 5,928 |
| 35 and under 40 | 2,221 | 1,976 | 4,197 | 2,809 | 2,535 | 5,344 |
| 40 and under 45 | 1,687 | 1,443 | 3,130 | 2,022 | 1,831 | 3,853 |
| 45 and under 50 | 1,606 | 1,182 | 2,788 | 1,938 | 1,520 | 3,458 |
| 50 and under 55 | 1,257 | 973 | 2,230 | 1,269 | 1,001 | 2,270 |
| 55 and under 60 | 994 | 732 | 1,726 | 1,143 | 837 | 1,980 |
| 60 and under 65 | 784 | 769 | 1,553 | 879 | 721 | 1,600 |
| 65 and under 70 | 757 | 583 | 1,340 | 688 | 590 | 1,278 |
| 70 and under 75 | 417 | 361 | 778 | 402 | 307 | 709 |
| 75 and under 80 | 250 | 185 | 435 | 232 | 184 | 416 |
| 80 and under 85 | 144 | 138 | 282 | 113 | 127 | 240 |
| 85 and under 90 | 66 | 69 | 135 | 43 | 74 | 117 |
| 90 and under 95 | 31 | 46 | 77 | 28 | 39 | 67 |
| 95 and under 100 | 10 | 26 | 36 | 11 | 16 | 27 |
| 100 and over | 5 | 25 | 30 | 3 | 13 | 16 |
| Not specified— | ||||||
| Adults | 56 | 60 | 116 | 227 | 192 | 419 |
| Minors | 46 | 42 | 88 | 92 | 104 | 196 |
| Totals, Maoris | 42,863 | 39,463 | 82,326 | 50,275 | 48,469 | 98,744 |
A noticeable feature of the European population is the movement of large numbers of people into the higher age-groups. Persons of 60 years of age and over increased between 1936 and 1945 by 66,289; in 1945 such persons comprised 13.83 per cent. of the total population; in 1936, 10.42 per cent.; in 1926, 7.84 per cent.; and in 1874 only 2.33 per cent.
At the other end of the scale, a marked reversal of the trend of the 1930's was recorded. Children under 10 years of age increased by 49,298 since 1936, in strong contrast to the decrease of 22,102 shown by that census over the corresponding age-group in 1926. Whether the improvement in the European birth-rate over the past few years and in the post-war period will be maintained as a long-term feature is a question that cannot be answered at this juncture.
The cumulative effect of the declining birth-rate since 1910 in its effect on those age-groups in which the majority of the working population is contained is shown by the succeeding comparison. In the age-group covering ages 15 years to 59 years the 1936 figure recorded an increase of 119,179 over 1926. In 1945, even allowing for 44,081 European members of the New Zealand Forces overseas, the comparable increase has dropped to 57,673. Some part of this reduced number is, of course, duo to reduced migration gains and to war losses. Nevertheless, it would seem that the present labour shortage must be in some measure the direct result of a smaller influx into working-age groups caused through decreases in births occurring over a very considerable period.
The European population in 1945 may be divided into adults (21 years and over) 1,037,469, equal to 64.70 per cent., and minors (under 21 years) 566,085, or 35.30 per cent. of the total. In 1936, adults comprised 63.84 per cent. and minors 36.16 per cent. of the total.
The outstanding characteristic of the rapidly increasing Maori race is its comparative youthfulness. The large number of persons under twenty-one years of age amounting to 58,066, constitutes 58.8 per cent. of the total, which is in sharp contrast to the figure of 35.3 per cent. for the corresponding European age-group. Further evidence of this feature is afforded by the much lower average age (arithmetic mean) of Maoris, 21.76 years as against the 32.94 years of the European section. This difference is accounted for by the higher natural increase associated with the Maoris, further accentuated by the probably greater expectation of life possessed by Europeans.
It is obvious that the changes noted in the above paragraphs impinge on the social economy in many ways. The recent increases in the number of children born are now beginning to exert their influence on school rolls, school-teachers, and indirectly on all those concerned with the needs of youth. Different classes of commodities and services are required for elderly people, too, and the census results are full of significance in this respect. The information disclosed on the quantity and age distribution of the economically active portion of the population also holds salient points of interest in many spheres of inquiry.
In the table given above, and indeed for most 1945 census results, the non-inclusion of 45,381 members of the Armed Forces overseas must be considered in any analysis of the figures. The estimated age distribution of the 44,081 Europeans and 1300 Maoris comprising this total is given below.
| Age-group (Years). | Europeans. | Maoris. | Total. | ||||||
|---|---|---|---|---|---|---|---|---|---|
| Males. | Females. | Total. | Males. | Females. | Total. | Males. | Females. | Total. | |
| Under 20 | 610 | 610 | 610 | 610 | |||||
| 20 and under 25 | 18,695 | 106 | 18,801 | 620 | 620 | 19,315 | 106 | 19,421 | |
| 25 and under 30 | 11,570 | 240 | 11,810 | 450 | 450 | 12,020 | 240 | 12,260 | |
| 30 and under 35 | 7,150 | 220 | 7,370 | 130 | 130 | 7,280 | 220 | 7,500 | |
| 35 and under 40 | 3,740 | 90 | 3,830 | 80 | 80 | 3,20 | 90 | 3,910 | |
| 40 and under 45 | 1,370 | 10 | 1,380 | 20 | 20 | 1,00 | 10 | 1,400 | |
| 45 and under 50 | 210 | 210 | 210 | 210 | |||||
| 50 and under 55 | 50 | 50 | 50 | 50 | |||||
| 55 and under 60 | 20 | 20 | 20 | 20 | |||||
| Totals | 43,415 | 666 | 44,081 | 1,300 | 1,300 | 44,715 | 666 | 45,381 | |
MARITAL STATUS.—The marital status of persona aged 16 years and over as returned at the census of 1945 is summarized in the following table. The detailed figures do not include Maoris who are shown only as totals for each marital status. The status is that existing at the census date—e.g., a person who had been widowed or divorced but had remarried before the census is counted as married, not as widowed or divorced.
| Age (Years). | Never Married. | Married. | Legally Separated | Widowed. | Divorced. | Not Specified. | Total. |
|---|---|---|---|---|---|---|---|
| Males | |||||||
| 16 and under 20 | 51,522 | 235 | 1 | 38 | 51,796 | ||
| 20 and under 21 | 11,404 | 438 | 4 | 1 | 1 | 26 | 11,874 |
| 21 and under 25 | 26,561 | 7,906 | 102 | 19 | 33 | 35 | 34,656 |
| 25 and under 30 | 23,082 | 27,689 | 384 | 104 | 296 | 33 | 51,588 |
| 30 and under 35 | 14,056 | 42,559 | 534 | 282 | 562 | 60 | 58,053 |
| 35 and under 40 | 9,217 | 47,531 | 580 | 436 | 715 | 36 | 58,515 |
| 40 and under 45 | 6,881 | 44,421 | 554 | 672 | 756 | 33 | 53,317 |
| 45 and under 50 | 5,862 | 39,271 | 450 | 1,018 | 766 | 29 | 47,396 |
| 50 and under 55 | 4,584 | 33,421 | 408 | 1,447 | 659 | 20 | 40,539 |
| 55 and under 60 | 4,939 | 33,241 | 421 | 2,335 | 647 | 14 | 41,597 |
| 60 and under 65 | 4,646 | 29,759 | 504 | 3,436 | 593 | 29 | 38,967 |
| 65 and under 70 | 3,975 | 22,761 | 361 | 4,263 | 444 | 22 | 31,826 |
| 70 and under 75 | 2,651 | 12,781 | 209 | 4,002 | 227 | 10 | 19,880 |
| 75 and under 80 | 1,448 | 6,538 | 113 | 3,312 | 101 | 6 | 11,518 |
| 80 and under 85 | 550 | 2,316 | 32 | 1,954 | 38 | 7 | 4,897 |
| 85 and under 90 | 202 | 673 | 14 | 900 | 10 | 2 | 1,801 |
| 90 and over | 49 | 123 | 2 | 286 | 2 | 3 | 465 |
| Not specified adults | 65 | 128 | 4 | 16 | 4 | 414 | 631 |
| Totals— | |||||||
| Europeans, 1945 | 171,694 | 351,791 | 4,677 | 24,483 | 5,854 | 817 | 559,316 |
| Europeans, 1936 | 211,551 | 304,955 | 4,472 | 21,574 | 3,913 | 763 | 547,228 |
| Maoris, 1945 | 9,481 | 14,323 | 128 | 1,814 | 94 | 97 | 25,937 |
| Maoris, 1936 | 8,263 | 12,587 | 269 | 1,828 | 64 | 138 | 23,149 |
| Females | |||||||
| 16 and under 20 | 48,902 | 1,842 | 16 | 11 | 1 | 50,772 | |
| 20 and under 21 | 10,950 | 2,096 | 24 | 17 | 8 | 13,095 | |
| 21 and under 25 | 30,800 | 21,725 | 347 | 293 | 165 | 5 | 53,335 |
| 25 and under 30 | 18,151 | 44,498 | 732 | 788 | 565 | 6 | 64,740 |
| 30 and under 35 | 11,007 | 50,854 | 743 | 1,022 | 726 | 7 | 64,361 |
| 35 and under 40 | 8,530 | 48,596 | 678 | 1,272 | 849 | 5 | 59,930 |
| 40 and under 45 | 7,136 | 41,688 | 592 | 1,837 | 802 | 6 | 52,061 |
| 45 and under 50 | 6,352 | 37,747 | 577 | 3,128 | 780 | 4 | 48,588 |
| 50 and under 55 | 5,753 | 32,519 | 488 | 4,584 | 715 | 5 | 44,064 |
| 55 and under 60 | 5,192 | 28,623 | 518 | 6,969 | 619 | 7 | 41,928 |
| 60 and under 65 | 5,062 | 23,290 | 505 | 9,105 | 487 | 5 | 38,454 |
| 65 and under 70 | 4,402 | 16,564 | 368 | 10,651 | 342 | 6 | 32,333 |
| 70 and under 75 | 3,045 | 8,161 | 158 | 8,790 | 149 | 6 | 20,309 |
| 75 and under 80 | 1,778 | 3,531 | 82 | 7,199 | 54 | 4 | 12,648 |
| 80 and under 85 | 727 | 1,080 | 10 | 3,960 | 22 | 3 | 5,802 |
| 85 and under 90 | 219 | 301 | 3 | 1,691 | 7 | 2 | 2,223 |
| 90 and over | 50 | 73 | 1 | 510 | 5 | 2 | 641 |
| Not specified, adults | 61 | 208 | 10 | 60 | 7 | 60 | 406 |
| Totals— | |||||||
| Europeans, 1945 | 168,117 | 363,396 | 5,852 | 61,887 | 6,305 | 133 | 605,690 |
| Europeans, 1936 | 175,230 | 301,802 | 4,939 | 49,662 | 3,490 | 523 | 535,646 |
| Maoris, 1945 | 6,762 | 15,458 | 151 | 2,405 | 87 | 50 | 24,913 |
| Maoris, 1936 | 4,878 | 13,071 | 241 | 2,158 | 37 | 91 | 20,476 |
Taking only the adult population—i.e., those aged 21 years and over—the proportional distribution of the European population was—
| Marital Status. | Males. | Females. | ||
|---|---|---|---|---|
| 1936. | 1945. | 1936. | 1945. | |
| Per Cent. | Per Cent. | Per Cent. | Per Cent. | |
| Never married | 30.35 | 21.98 | 24.28 | 19.99 |
| Married | 63.41 | 70.95 | 63.39 | 66.36 |
| Legally separated | 0.93 | 0.94 | 1.04 | 1.07 |
| Widowed | 4.49 | 4.95 | 10.55 | 11.42 |
| Divorced | 0.82 | 1.18 | 0.74 | 1.16 |
| Totals | 100.00 | 100.00 | 100.00 | 100.00 |
The influence of the recent war on the never-married and married figures is well illustrated in this table. Many single men were overseas in 1915, thereby reducing the proportion of this class in the latter year and enhancing at the same time the proportion of married men. Increases in the proportions of married women and widows can, no doubt, be also ascribed to war conditions, while higher wartime marriage-rates are reflected in a lower proportion of single women.
RELIGIOUS PROFESSIONS.—The table following presents a summary of the religious professions of the population as recorded in 1945, together with comparative figures for 1936. The figures are exclusive of Maoris who are shown on the page following.
| Religious Profession. | Adherents. | |
|---|---|---|
| 1936. | 1945. | |
| Church of England | 600,786 | 601,786 |
| Presbyterian | 367,855 | 374,956 |
| Roman Catholic (including Catholic undefined) | 195,261 | 215,629 |
| Methodist | 121,012 | 130,220 |
| Baptist | 24,703 | 27,512 |
| Brethren | 17,260 | 18,629 |
| Salvation Army | 12,608 | 13,203 |
| Protestant (undefined) | 5,178 | 11,911 |
| Church of Christ | 11,197 | 11,346 |
| Spiritualist | 1,201 | 763 |
| Hindu | 591 | 661 |
| Confucian | 778 | 638 |
| Apostolic | 390 | 636 |
| Jehovah's Witness | 428 | 622 |
| Eastern Orthodox Catholic | 361 | 595 |
| Society of Friends | 494 | 546 |
| Pentecostal | 490 | 440 |
| Unitarian | 669 | 417 |
| Theosophist | 457 | 409 |
| Congregational | 7,179 | 6,403 |
| Seventh Day Adventist | 3,825 | 4,956 |
| Christian Scientist | 4,617 | 4,819 |
| Christian (undefined) | 1,689 | 3,671 |
| Hebrew | 2,653 | 3,470 |
| Freethinker | 925 | 3,089 |
| Rationalist | 2,066 | 2,883 |
| Lutheran | 2,537 | 2,140 |
| Undenominational Christian | 1,289 | 1,692 |
| Atheist | 599 | 1,654 |
| Agnostic | 1,499 | 1,544 |
| Christadelphian | 1,303 | 1,367 |
| Latter Day Saints (Mormon) | 745 | 1,247 |
| Missions (undefined) | 1,346 | 891 |
| Ratana | 461 | 764 |
| Commonwealth Covenant Church | 763 | |
| Nonconformist | 295 | 396 |
| Assemblies of God | 389 | 361 |
| Uncertain | 103 | 341 |
| Liberal Catholic | 274 | 334 |
| Friendly Road | 598 | 258 |
| Evangelical | 301 | 196 |
| British Israel | 704 | 158 |
| Catholic Apostolic | 347 | 137 |
| Christian Assembly | 134 | |
| Chinese Church | 27 | 115 |
| Undenominational | 1,542 | 1,497 |
| No religion o returned) | 4,292 | 11,038 |
| All other religious professions | 2,153 | 1,801 |
| Object to state | 71,302 | 126,426 |
| Not specified | 14,705 | 8,090 |
| Totals | 1,491,484 | 1,603,554 |
The category recorded as “Object to state” represents those persons availing themselves of the special statutory right of objecting to answer a question on this subject. A proportion of the “not specified” may also consist of persons objecting to the question.
The proportional distribution at the last two censuses is:—
| Religious Profession. | Percentage of Total Population. | |
|---|---|---|
| 1936. | 1945. | |
| Church of England | 40.28 | 37.53 |
| Presbyterian | 24.66 | 23.38 |
| Roman Catholic (including Catholic undefined) | 13.09 | 13.45 |
| Methodist | 8.11 | 8.12 |
| Baptist | 1.66 | 1.72 |
| Brethren | 1.15 | 1.16 |
| Salvation Army | 0.84 | 0.82 |
| Protestant, undefined | 0.35 | 0.74 |
| Church of Christ | 0.75 | 0.71 |
| No religion (so returned) | 0.29 | 0.69 |
| Object to state | 4.78 | 7.88 |
| All others (including “not specified”) | 4.04 | 3.80 |
| Totals | 100.00 | 100.00 |
The numbers and proportional distribution of religious professions of Maoris at the last two censuses are now given. In comparison with the European distribution shown earlier some considerable differences will be noted, caused partly by the inclusion of religious professions such as Ratana, Ringatu, and Hau Hau, which are essentially Maori.
| Religious Profession. | 1936 Census. | 1945 Census. | ||
|---|---|---|---|---|
| Numbers. | Percentage. | Numbers. | Percentage. | |
| Church of England | 24,832 | 30.16 | 32,578 | 32.99 |
| Ratana | 16,337 | 19.84 | 17,181 | 17.40 |
| Roman Catholic | 11,326 | 13.76 | 15,190 | 15.38 |
| Methodist | 5,743 | 6.98 | 7,535 | 7.63 |
| Latter Day Saints | 5,257 | 6.39 | 6,551 | 6.63 |
| Ringatu | 5,091 | 6.18 | 5,166 | 5.23 |
| Mission n.o.d. | 5,047 | 6.13 | 2,091 | 2.12 |
| Presbyterian | 1,115 | 1.36 | 1,646 | 1.67 |
| Hau Hau | 586 | 0.71 | 662 | 0.67 |
| Other professions | 1,511 | 1.84 | 1,855 | 1.88 |
| Not specified or indefinitely specified | 1,246 | 1.51 | 1,284 | 1.30 |
| Object to state | 4,235 | 5.14 | 7,005 | 7.10 |
| Total Maori population | 82,326 | 100.00 | 98,744 | 100.00 |
BIRTHPLACES.—The distribution of the population in 1945 according to place of birth is now presented, with 1936 figures being incorporated for comparative purposes.
The nomenclature used in regard to countries of birth refers to status and territories in the census year and not necessarily to the present position.
| Birthplace. | Census. | |
|---|---|---|
| 1936. | 1945. | |
* Includes protectorates, trust territories, &c., as at the date of the census. | ||
| British Countries*— | ||
| New Zealand | 1,197,591 | 1,357,323 |
| England | 140,422 | 114,508 |
| United Kingdom, or Great Britain, n.o.d. | 476 | 219 |
| Isle of Man | 490 | 362 |
| Channel Islands | 906 | 622 |
| Wales | 3,638 | 3,911 |
| Scotland | 54,188 | 43,818 |
| Northern Ireland | 1,788 | 9,024 |
| Eire | 747 | 7,249 |
| Ireland, n.o.d. | 23,330 | 2,342 |
| Gibraltar | 54 | 42 |
| Malta, Gozo, and Comino | 81 | 64 |
| Union of South Africa | 1,321 | 1,223 |
| Cyprus | 17 | 51 |
| India (British or Native States) | 2,194 | 2,096 |
| Ceylon | 149 | 118 |
| Burma | 30 | 56 |
| Malaya | 132 | 194 |
| Hong Kong | 40 | 94 |
| Canada | 1,625 | 1,738 |
| Australia | 42,009 | 36,789 |
| Cook Islands | 157 | 393 |
| Nine Island | 54 | 222 |
| Western Samoa | 279 | 592 |
| Fiji | 819 | 1,173 |
| Tonga | 269 | 433 |
| Norfolk Island | 113 | 128 |
| Other British Pacific islands | 53 | 115 |
| All other British countries | 355 | 318 |
| Totals, British countries | 1,473,327 | 1,585,217 |
| Foreign Countries— | ||
| Norway | 650 | 508 |
| Sweden | 723 | 478 |
| Denmark | 1,443 | 1,039 |
| Russia (U.S.S.R.) | 391 | 348 |
| Estonia | 28 | 45 |
| Latvia | 64 | 65 |
| Lithuania | 20 | 24 |
| Finland | 239 | 188 |
| Poland | 366 | 1,307 |
| Germany | 1,299 | 1,297 |
| Netherlands | 124 | 128 |
| Belgium | 137 | 114 |
| France | 368 | 303 |
| Switzerland | 636 | 599 |
| Italy | 917 | 840 |
| Czechoslovakia | 72 | 166 |
| Austria | 140 | 342 |
| Hungary | 34 | 112 |
| Yugoslavia | 2,721 | 3,090 |
| Greece | 192 | 260 |
| Egypt | 49 | 72 |
| Syria | 354 | 153 |
| Lebanon | 156 | |
| China | 2,184 | 3,150 |
| Japan | 106 | 48 |
| United States of America | 1,210 | 1,079 |
| America, n.o.d. | 292 | 159 |
| Argentina | 82 | 85 |
| Society Islands | 65 | 71 |
| All other foreign countries | 442 | 493 |
| Totals, foreign countries | 15,348 | 16,719 |
| Born at sea | 749 | 570 |
| Not specified | 2,060 | 1,048 |
| Grand totals | 1,491,484 | 1,603,554 |
The chief points of interest emerging from a scrutiny of this table can be briefly given. Declines in the numbers of persons born in British countries other than the Pacific islands are fairly general. Reduced immigration in the depression period and subsequent years, together with gradual elimination by death or emigration of the older residents born overseas, with the additional complication of war movements, doubtless account for this state of affairs. Improved transportation facilities and war conditions to some extent explain the increases shown of those born in the neighbouring Pacific islands.
The distribution of the movement of the foreign-born element since 1936 is of interest, in that it reflects the influence of pre-war European conditions and the impact of war. For example, those born in northern European countries declined, probably more directly as the result of the war. Central European countries exhibit the same characteristic, except in the case of those countries from which political and war refugees were drawn, particularly Poland, Czechoslovakia, and Austria, in which increases were recorded.
DURATION OF RESIDENCE OF OVERSEAS-BORN.—Persons born elsewhere than in New Zealand are now classified by their duration of residence in this country.
| Duration of Residence. | Census. | |
|---|---|---|
| 1936. | 1945. | |
| Under 1 year | 4,609 | 3,777 |
| 1 year | 1,879 | 1,835 |
| 2 years | 1,254 | 577 |
| 3 years | 1,044 | 778 |
| 4 years | 1,333 | 955 |
| 5 years | 2,914 | 2,315 |
| 6 years | 3,776 | 4,958 |
| 7 years | 3,624 | 2,994 |
| 8 years | 5,000 | 2,362 |
| 9 years | 9,348 | 1,516 |
| 10 years | 12,070 | 1,320 |
| 11 years | 9,732 | 848 |
| 12 years | 9,831 | 987 |
| 13 years | 7,548 | 840 |
| 14 years | 9,534 | 1,748 |
| 15 years | 11,671 | 3,437 |
| 16 years | 8,936 | 3,320 |
| 17 years | 3,209 | 3,690 |
| 18 years | 1,560 | 6,243 |
| 19 years | 1,301 | 9,299 |
| 20 and under 25 years | 36,379 | 43,565 |
| 25 and under 30 | 39,221 | 19,711 |
| 30 and under 35 | 25,121 | 35,684 |
| 35 and under 40 | 10,833 | 30,901 |
| 40 and under 45 | 9,379 | 18,473 |
| 45 and under 50 | 6,630 | 6,934 |
| 50 and under 55 | 12,864 | 6,567 |
| 55 and under 60 | 12,227 | 4,057 |
| 60 and under 65 | 16,052 | 7,160 |
| 65 and under 70 | 3,095 | 6,486 |
| 70 and under 75 | 4,411 | 6,884 |
| 75 and under 80 | 1,527 | 1,015 |
| 80 and under 85 | 380 | 1,209 |
| 85 and under 90 | 70 | 212 |
| 90 and over | 14 | 45 |
| Not specified | 5,517 | 3,529 |
| Totals | 293,893 | 246,231 |
This table is a very graphic one. It conveys a picture of broad economic and political changes in the history of New Zealand made manifest by the movement of immigration. Thus the small numbers shown for the years 2–4 are symptomatic of World War II disturbances; the larger numbers over years 6–8 are in response to the stimulus given to migration by the economic recovery following the depression of the mid “thirties”; while the 11–13 years duration reflect slump conditions and the voluntary restriction on immigration entailed by such conditions. This analysis can be carried further, for the 25–30 years' duration illustrates the effects of World War I and post-war circumstances. The severe depression of the early 1890's is responsible for the drop recorded in the 55–60 years group, while the public-works policy of 1870 onwards accounts for the larger numbers in the 65–75 years duration group. The table thus affords a general conspectus of economic history in quantitative form.
RACIAL ORIGINS.—It is definitely impossible to obtain from census data an accurate ethnological survey of the racial origins of the population. For example, such terms as “European” or “Indian” cover in reality a variety of races. Nevertheless, the general meaning of the terms employed will be clear and the data afforded are of distinct service. The following summary gives interim data for the 1945 census, together with the 1936 figures by way of comparison.
| Race. | Census. | |
|---|---|---|
| 1936. | 1945. | |
| European— | ||
| European | 1,473,000 | 1,575,974 |
| European-Maori quarter-caste | 11,508 | 16,902 |
| Totals, European | 1,484,508 | 1,592,876 |
| Maori— | ||
| Full Maori | 55,915 | 61,440 |
| Three-quarter caste | 11,397 | 18,956 |
| Half-caste | 14,891 | 18,348 |
| Maori-European n.o.d. | 123 | |
| Totals, Maori | 82,326 | 98,744 |
| Race. | Census. | ||
|---|---|---|---|
| 1936. | 1945. | ||
NOTE.—F.B. signifies “full blood”; M.B. “mixed blood,” the second race being European. | |||
| Race alien— | |||
| Chinese | F.B. | 2,580 | 4,373 |
| M.B. | 319 | 359 | |
| Chinese-Maori | 38 | 198 | |
| Chinese-Polynesian | 2 | 10 | |
| Syrian | F.B. | 960 | 895 |
| M.B. | 275 | 438 | |
| Syrian-Maori | 26 | 57 | |
| Indian | F.B. | 865 | 1,116 |
| M.B. | 292 | 299 | |
| Indian-Maori | 41 | 134 | |
| Japanese | F.B. | 72 | 11 |
| M.B. | 30 | 12 | |
| Japanese-Maori | 9 | 20 | |
| Sinhalese | F.B. | 4 | 2 |
| M.B. | 19 | 5 | |
| Eurasian n.o.d. | 14 | 5 | |
| Polynesian— | |||
| Hawaiian | F.B. | 5 | 4 |
| M.B. | 17 | 36 | |
| Samoan | F.B. | 39 | 60 |
| M.B. | 323 | 656 | |
| Tahitian | F.B. | 5 | 16 |
| M.B. | 20 | 61 | |
| Niue Islander | F.B. | 165 | |
| M.B. | 60 | ||
| Cook Island Maori | F.B. | 53 | 222 |
| M.B. | 50 | 132 | |
| Polynesian-Maori | 102 | 263 | |
| Other or undefined | F.B. | 61 | 90 |
| M.B. | 313 | 394 | |
| Melanesian— | |||
| Fijian | F.B. | 23 | 20 |
| M.B. | 86 | 164 | |
| Other or undefined | F.B. | 2 | 6 |
| M.B. | 5 | 18 | |
| Negro | F.B. | 27 | 17 |
| M.B. | 123 | 85 | |
| Negro-Maori | 19 | ||
| West Indian | F.B. | 9 | 11 |
| M.B. | 32 | 45 | |
| West Indian-Maori | 11 | ||
| American Indian | F.B. | 1 | 3 |
| M.B. | 22 | 15 | |
| American Indian-Maori | 3 | 28 | |
| Abyssinian | F.B. | 1 | 2 |
| M.B. | 15 | 18 | |
| Egyptian | 3 | 11 | |
| Armenian | 1 | 18 | |
| Half-caste, race not specified | 22 | ||
| Other race aliens | F.B. | 32 | 33 |
| M.B. | 35 | 61 | |
| Totals, race aliens | 6,976 | 10,678 | |
| Grand totals | 1,573,810 | 1,702,298 | |
Of the total population in 1945, Europeans comprised 1,592,876 (93.57 per cent.); Maoris, 98,744 (5.80 per cent.); and race aliens, 10,678 (0.63 per cent.). Corresponding figures for 1936 were : Europeans, 1,484,508 (94.33 per cent.); Maoris, 82,326 (5.23 per cent.); and race aliens, 6,976 (0.44 per cent.). The relative rate of increase between 1936 and 1945 was: Europeans, 7.30 per cent.; Maoris, 19.94 per cent.; and race aliens, 53.07 per cent.
In the race-alien division there was a fairly substantial increase in the number of Chinese, principally per medium of immigration. Other considerable increases occur in the Samoan and Cook Island Maori racial components.
INDUSTRIAL DISTRIBUTION.—The following tables illustrate (a) the extent to which the European population directly participated in economic life, (b) the distribution of the actively engaged sector both by major divisions and the more general categories of industry, and (c) the character of participation, whether as employer, wage-earner, &c. A short table is also given showing the amount of time spent in travelling from home to place of work (one way only) by customary means of transport.
Data for Maoris according to occupational groups, will be found on page 963.
INDUSTRIAL DISTRIBUTION: MAJOR DIVISIONS
| Major Division. | 1936 Census | 1945 Census. | ||||
|---|---|---|---|---|---|---|
| Males. | Females. | Total. | Males. | Females. | Total. | |
*Including Service personnel and administrative stall's in New Zealand. | ||||||
| Numbers | ||||||
| Primary production | 168,598 | 6,515 | 175,113 | 124,108 | 10,999 | 135,107 |
| Industrial | 129,567 | 27,751 | 157,318 | 138,892 | 39,895 | 178,787 |
| Transport and communication | 59,918 | 2,279 | 62,197 | 60,297 | 8,964 | 69,261 |
| Commerce and finance | 77,729 | 24,673 | 102,402 | 61,441 | 36,012 | 97,453 |
| Public administration and professional* | 34,831 | 27,062 | 61,893 | 74,830 | 44,587 | 119,417 |
| Domestic and personal service | 12,263 | 44,482 | 56,745 | 10,145 | 22,060 | 32,205 |
| Not specified | 22,615 | 6,165 | 28,780 | 2,632 | 522 | 3,154 |
| Totals— | ||||||
| Actively engaged | 505,521 | 138,927 | 644,448 | 472,345 | 163,039 | 635,384 |
| Not actively engaged | 250,705 | 596,331 | 847,036 | 310,257 | 657,913 | 968,170 |
| Grand Totals | 756,226 | 735,258 | 1,491,484 | 782,602 | 820,952 | 1,663,554 |
| Proportions per Cent. of Persons actively engaged | ||||||
| Primary production | 33.35 | 4.69 | 27.17 | 26.27 | 6.74 | 21.26 |
| Industrial | 25.63 | 19.98 | 24.41 | 29.40 | 24.47 | 28.14 |
| Transport and communication | 11.85 | 1.64 | 9.65 | 12.77 | 5.50 | 10.90 |
| Commerce and finance | 15.38 | 17.76 | 15.89 | 13.01 | 22.09 | 15.34 |
| Public administration and professional* | 6.89 | 19.48 | 9.60 | 15.84 | 27.35 | 18.79 |
| Domestic and personal service | 2.43 | 32.02 | 8.81 | 2.15 | 13.53 | 5.07 |
| Not specified | 4.47 | 4.43 | 4.47 | 0.56 | 0.32 | 0.50 |
| Totals, actively engaged | 100.00 | 100.00 | 100.00 | 100.00 | 100.00 | 100.00 |
The table above affords evidence of the sweeping changes induced in the industrial structure of a country while at war, these changes being superimposed on normal variations in divisional distribution originating principally through technical and industrial development and also those due to the ageing of the population.
The direct impact of war conditions may be gauged from the following statements. The absence of 43,415 males and 666 females serving overseas at census date impinges on all group totals (although in varying proportions). Furthermore, Service personnel and administrative staffs in New Zealand were approximately 46,000 (41,000 male and 5,000 female) in excess of those recorded in the 1936 census. These figures inflate the public administration group at the expense of the remaining groups.
The moat striking features occurring during the inter-censal period are the reduced male employment in primary production, compensated in a small measure by additional female labour; increased female participation generally in industrial activities; diversion of labour from domestic and personal services to other industrial pursuits; and finally the marked increase in the public administration and professional groups (which includes Service personnel and administrative staffs in Now Zealand).
The decline in the numbers shown for the “Not specified” group is very largely due to statistical refinements principally in the form of an extra question on the census schedule enabling the “industry” to be ascertained for numbers of people not otherwise classifiable.
Despite the employment of a considerable number of older persons and younger women, continuing on or entering active employment, the proportion of persons not actively engaged increased from 56.79 per cent. in 1936 to 60.38 in 1945. This increase is largely due to the gradually rising number of people in the older age groups and the greater number of births in the later war years.
The table now presented gives a more detailed classification by industry groups:—
INDUSTRIAL DISTRIBUTION: INDUSTRY GROUPS
| Industry Group. | 1936 Census. | 1945 Census. | ||||
|---|---|---|---|---|---|---|
| Males. | Females. | Total. | Males. | Females. | Total. | |
| Agricultural and pastoral | 144,456 | 6,357 | 150,813 | 107,787 | 10,754 | 118,541 |
| Forestry | 10,248 | 83 | 10,331 | 6,065 | 122 | 6,187 |
| Fishing and trapping | 2,535 | 11 | 2,546 | 2,656 | 21 | 2,677 |
| Mining and quarrying | 11,359 | 64 | 11,423 | 7,600 | 102 | 7,702 |
| Manufacturing industries— | ||||||
| Food | 22,333 | 3,285 | 25,618 | 20,993 | 5,363 | 26,356 |
| Drink | 1,674 | 125 | 1,799 | 2,377 | 258 | 2,635 |
| Tobacco | 280 | 488 | 768 | 389 | 775 | 1,164 |
| Chemical industries, vegetable or animal products, n.e.i. | 4,941 | 519 | 5,460 | 4,765 | 1,676 | 6,441 |
| Rubber | 254 | 11 | 265 | 1,144 | 371 | 1,515 |
| Wood, cane, basketware, furniture, and fittings | 5,668 | 418 | 6,086 | 10,370 | 816 | 11,186 |
| Paper, stationery, hooks, &c. | 8,090 | 2,351 | 10,441 | 6,721 | 3,382 | 10,103 |
| Skin, hide, and leather | 1,534 | 432 | 1,966 | 1,773 | 763 | 2,536 |
| Textiles | 2,680 | 2,361 | 5,041 | 3,961 | 4,116 | 8,077 |
| Wearing-apparel (including repair) | 7,116 | 16,011 | 23,127 | 6,704 | 17,182 | 23,886 |
| Production and supply of electricity, gas, and heat; water-supply | 5,293 | 278 | 5,571 | 6,033 | 511 | 6,544 |
| Non-metallic minerals, n.e.i. | 2,988 | 73 | 3,061 | 5,210 | 392 | 5,602 |
| Machinery, including all electrical appliances, and means of transport by land, water, and air | 19,191 | 768 | 19,959 | 25,157 | 2,770 | 27,927 |
| by land, water, and air | ||||||
| Instruments, clocks and watches, jewellery | 819 | 37 | 856 | 1,039 | 156 | 1,195 |
| Other | 683 | 232 | 915 | 700 | 427 | 1,127 |
| Building and construction— | ||||||
| Buildings | 27,612 | 245 | 27,857 | 28,649 | 651 | 29,300 |
| Roads, railways, earthworks, &c. | 18,411 | 117 | 18,528 | 12,907 | 286 | 13,193 |
| Transport and communication— | ||||||
| Rail transport | 37,169 | 844 | 38,013 | 22,980 | 2,073 | 25,053 |
| Road transport | 15,978 | 1,269 | 17,247 | |||
| Water transport | 13,908 | 319 | 14,227 | 13,127 | 455 | 13,582 |
| Air transport | 127 | 5 | 132 | 283 | 49 | 332 |
| Communication | 8,714 | 1,111 | 9,825 | 7,929 | 5,118 | 13,047 |
| Commerce and finance— | ||||||
| Wholesale and retail trade | 62,049 | 21,046 | 83,095 | 47,454 | 28,032 | 75,486 |
| Finance, banks, insurance | 11,427 | 2,344 | 13,771 | 10,345 | 5,549 | 15,894 |
| Agencies for other purposes, n.e.i. | 4,253 | 1,283 | 5,536 | 3,642 | 2,431 | 6,073 |
| Hotel and personal services | 12,263 | 44,482 | 56,745 | 10,145 | 22,060 | 32,205 |
| Entertainment, sport, and recreation | 4,527 | 1,030 | 6,557 | 3,767 | 1,100 | 4,867 |
| Public services and other services of general interest, n.e.i.— | ||||||
| Medical and hygienic services | 4,846 | 11,075 | 15,921 | 6,883 | 18,202 | 25,085 |
| Education, religion, arts, and sciences, n.e.i. | 10,276 | 12,099 | 22,375 | 9,404 | 13,714 | 23,118 |
| Defence | 1,681 | 19 | 1,700 | 42,622 | 5,196 | 47,818 |
| Public administration | 8,664 | 1,120 | 9,784 | 7,604 | 3,714 | 11,318 |
| Law and order | 4,556 | 1,589 | 6,145 | 3,933 | 2,041 | 5,974 |
| Other | 281 | 130 | 411 | 617 | 620 | 1,237 |
| Not specified | ||||||
| Totals— | ||||||
| Actively engaged | 22,615 | 6,165 | 28,780 | 2,632 | 522 | 3,154 |
| Actively engaged | 505,521 | 138,927 | 644,448 | 472,345 | 163,039 | 635,384 |
| Not actively engaged | 250,705 | 596,331 | 847,036 | 310,257 | 657,913 | 968,170 |
| Grand totals | 756,226 | 735,258 | 1,491,484 | 782,602 | 820,952 | 1,603,554 |
OCCUPATIONAL STATUS
| Occupational Status. | 1936 Census. | 1945 Census. | ||||
|---|---|---|---|---|---|---|
| Males. | Females. | Total. | Males. | Females. | Total. | |
| Numbers | ||||||
| Employer | 53,536 | 5,004 | 58,540 | 47,624 | 4,997 | 52,521 |
| Own account | 64,069 | 9,627 | 73,696 | 54,961 | 6,272 | 61,233 |
| Wage or salary earner— | ||||||
| Armed Forces (Regular or Permanent Staff) | 1,464 | 1,464 | 2,545 | 2,545 | ||
| Armed Forces (other) | 38,042 | 4,054 | 42,096 | |||
| All other wage or salary earners | 336,853 | 120,610 | 457,463 | 319,344 | 144,882 | 464,226 |
| Unemployed (includes ex servicemen not yet returned to work) | 35,774 | 1,862 | 37,636 | 5,823 | 1,090 | 6,913 |
| Relative assisting, unpaid | 10,928 | 892 | 11,820 | 3,970 | 1,694 | 5,664 |
| Invalid or sick, or under detention, &c. (fifteen or over) | 251,593 | 596,674 | 848,267 | 22,106 | 17,214 | 39,320 |
| Child under fifteen years | 210,318 | 202,724 | 413,072 | |||
| Student, full-time (fifteen or over), unpaid | 18,955 | 16,117 | 35,072 | |||
| Domestic duties | 734 | 383,202 | 383,936 | |||
| Retired, independent means, &c. | 58,114 | 38,656 | 96,770 | |||
| Not specified | 2,009 | 589 | 2,598 | 136 | 50 | 186 |
| Totals | 756,226 | 735,258 | 1,491,484 | 782,602 | 820,952 | 1,603,554 |
| Proportions per Cent. | ||||||
| Employer | 7.08 | 0.68 | 3.93 | 6.07 | 0.61 | 3.28 |
| Own account | 8.47 | 1.31 | 4.94 | 7.02 | 0.76 | 3.82 |
| Wage or salary earner— | ||||||
| Armed Forces (Regular or Permanent Staff) | 0.19 | 0.10 | 0.33 | 0.16 | ||
| Armed Forces (other) | 4.86 | 0.49 | 2.63 | |||
| All other wage or salary earners | 44.54 | 16.40 | 30.67 | 40.81 | 17.65 | 28.95 |
| Unemployed (includes ex servicemen not yet retuned to work) | 4.73 | 0.25 | 2.52 | 0.74 | 0.13 | 0.43 |
| Relative assisting, unpaid | 1.45 | 0.12 | 0.79 | 0.51 | 0.21 | 0.35 |
| Invalid or sick, or under detention, &c. (fifteen or over) | 33.27 | 81.16 | 56.88 | 2.82 | 2.10 | 2.45 |
| Child under fifteen years | 26.88 | 24.69 | 25.76 | |||
| Student, full-time (fifteen or over), unpaid | 7.42 | 1.96 | 2.19 | |||
| Domestic duties | 0.09 | 46.68 | 23.94 | |||
| Retired, independent means, &c. | 7.43 | 4.71 | 6.03 | |||
| Not specified | 0.27 | 0.08 | 0.17 | 0.02 | 0.01 | 0.01 |
| Totals | 100.00 | 100.00 | 100.00 | 100.00 | 100.00 | 100.00 |
The influence of war conditions is again apparent. Employers, persons on own account, and wage or salary earners exhibit in common a relative decline since 1936. In the later war period men in the older age-groups were being inducted into the services, which probably entailed in particular some reduction in numbers of the first two classes quoted, while the diversion of labour and material resources inevitable in a war economy doubtless reinforced this tendency. Reference has been made in connection with the previous tables to the extent to which the armed services, both within New Zealand and overseas, had depleted the civilian labour force.
The effect of an ageing population is shown by the larger proportion of males not actively engaged in industry—namely, 39.64 per cent. in 1945, against 33.27 per cent. in 1936. This trend is masked in the case of females by the entry into the industrial sphere of many who would not, in more normal times of the past, choose to participate. In fact, the proportion of females not actively engaged decreased from 81.16 per cent. in 1936 to 80.14 per cent. in 1945.
Travelling-time.—The following table is of interest in that it affords for the, first time some indication of the usual time occupied in travelling from home to place of employment (one way only). The daily aggregate (i.e., double the times quoted above, to allow for return to place of residence) is considerable and reflects the growth of urbanization in Now Zealand.
| Travelling-time (Minutes). | 1945 Census. | ||
|---|---|---|---|
| Males. | Females. | Totals. | |
| Nil | 149,717 | 38,583 | 188,300 |
| 1–5 inclusive | 36,881 | 13,257 | 50,138 |
| 6–10 inclusive | 47,574 | 21,013 | 68,587 |
| 11–15 inclusive | 49,304 | 22,234 | 71,538 |
| 16-20 inclusive | 37,786 | 17,923 | 55,709 |
| 21–25 inclusive | 11,946 | 6,022 | 17,968 |
| 26–30 inclusive | 46,288 | 18,040 | 64,328 |
| 31–35 inclusive | 6,917 | 2,872 | 9,789 |
| 36–40 inclusive | 7,852 | 3,074 | 10,926 |
| 41–45 inclusive | 12,991 | 4,875 | 17,866 |
| 46–50 inclusive | 2,997 | 1,033 | 4,030 |
| 51–55 inclusive | 723 | 273 | 996 |
| 56–60 inclusive | 10,100 | 2,760 | 12,860 |
| 61–65 inclusive | 476 | 106 | 582 |
| 66–70 inclusive | 609 | 186 | 795 |
| 71–75 inclusive | 1,088 | 323 | 1,411 |
| 76–80 inclusive | 467 | 140 | 607 |
| 81–85 inclusive | 64 | 27 | 91 |
| 86–90 inclusive | 1,359 | 257 | 1,616 |
| 91–95 inclusive | 33 | 9 | 42 |
| 96 and over | 776 | 96 | 872 |
| Not applicable | 5,823 | 1,090 | 6,913 |
| Not specified | 40,574 | 8,846 | 49,420 |
| Totals, actively engaged | 472,345 | 163,039 | 635,384 |
| Totals, not actively engaged | 310,257 | 657,913 | 968,170 |
| Grand totals | 782,602 | 820,952 | 1,603,554 |
Occupations of Maoris.—The Maori schedule provided for the personal occupation to be stated, but omitted questions on industry and occupational status which were included on the European schedule. In many instances occupations were returned as labourer without any indication of the type of work performed, and all such cases are shown in the other or ill-defined occupation-group. It seems probable, however, that the majority of these were farm labourers.
| Occupational-group. | 1936 Census. | 1945 Census. | ||
|---|---|---|---|---|
| Males. | Females. | Males. | Females. | |
| Fishermen and trappers | 120 | 18 | 131 | 1 |
| Agricultural and pastoral occupations | 8,477 | 1,531 | 8,062 | 993 |
| Forest occupations | 984 | 57 | 807 | 47 |
| Miners and quarrymen | 125 | 347 | 2 | |
| Workers in stone, clay, earthenware, lime, cement, glass, &c. | 13 | 217 | 13 | |
| Workers in processes relating to chemicals, animal and vegetable products, n.e.i. | 20 | 1 | 142 | 14 |
| Workers in non-precious metals, electric fittings, &c. | 88 | 315 | 48 | |
| Workers in precious metals, jewellery, scientific instruments, &c. | 2 | 2 | ||
| Workers on ships, boats, and conveyances | 8 | 16 | 1 | |
| Workers in fibrous materials, textiles, &c., other than clothing or dress | 43 | 14 | 77 | 51 |
| Workers in clothing and dress, &c. | 13 | 27 | 50 | 160 |
| Workers in harness, saddlery, and leatherware (excluding boots and shoes) | 2 | 9 | 4 | |
| Workers in food, drink, and tobacco | 304 | 21 | 898 | 129 |
| Workers in wood, n.e.i. | 268 | 13 | 577 | 25 |
| Workers in paper, printers, photographers, &c. | 3 | 1 | 69 | 19 |
| Workers in other materials | 3 | 2 | 24 | 15 |
| Workers in building and construction, and in maintenance of roads, &c., n.e.i. | 1,259 | 1,866 | 8 | |
| Workers in production or supply of gas, water, electricity or power | 13 | 103 | ||
| Workers in transport and communication | 475 | 8 | 1,334 | 50 |
| Financial and commercial occupations | 100 | 26 | 177 | 130 |
| Public administration | 11 | 520 | 116 | |
| Clerical and professional occupations | 387 | 197 | 348 | 574 |
| Occupations connected with entertainment, sport, and recreation | 47 | 25 | 66 | 9 |
| Personal and domestic occupations, hotelkeeping, &c. | 51 | 792 | 115 | 1,660 |
| Other or ill-defined occupations— | ||||
| Labourer, n.o.d. | 8,480 | 275 | 5,924 | 66 |
| Other occupations | 145 | 261 | 74 | |
| Not specified | 499 | 27 | 675 | 15 |
| Totals actively engaged | 21,940 | 3,035 | 23,132 | 4,224 |
| Totals not actively engaged | 20,923 | 36,428 | 27,143 | 44,245 |
| Grand total, Maori population | 42,863 | 39,463 | 50,275 | 48,469 |
INCOMES.—The table below gives for 1936 and 1945 censuses the number of persons whose stated income fell into one or other of the income groups listed. As the Maori schedule did not include a question on income, the data shown are necessarily confined to the European section of the population.
Besides the division of the total population into income categories, a similar classification is made available covering all those persons actively engaged in some form of industrial activity.
The period for which income was requested in the 1945 census schedule related to the twelve months ended 31st March, 1945, and in the case of the earlier census the twelve months ended 31st December, 1935. In both censuses, where particulars were not available for the precise period, provision was made to accept information covering the nearest twelve-month period instead.
| Income Group. | Persons Actively Engaged. | Total Population. | ||||
|---|---|---|---|---|---|---|
| Males. | Females. | Totals. | Males. | Females. | Total. | |
| 1945 Census | ||||||
| Under £50 | 14,929 | 14,447 | 29,376 | 251,530 | 545,085 | 796,615 |
| £50 to £99 | 16,538 | 22,251 | 38,789 | 48,930 | 86,321 | 135,251 |
| £100 to £149 | 26,596 | 36,427 | 63,023 | 35,889 | 56,661 | 92,550 |
| £150 to £199 | 38,950 | 38,405 | 77,355 | 44,808 | 49,766 | 94,574 |
| £200 to £249 | 39,890 | 22,971 | 62,861 | 44,943 | 30,917 | 75,860 |
| £250 to £299 | 47,136 | 10,059 | 57,195 | 50,407 | 14,445 | 64,852 |
| £300 to £349 | 62,779 | 4,941 | 67,720 | 65,463 | 7,447 | 72,910 |
| £350 to £399 | 53,455 | 2,645 | 56,100 | 55,119 | 4,077 | 59,196 |
| £400 to £449 | 42,293 | 1,711 | 44,004 | 43,511 | 2,710 | 46,221 |
| £450 to £499 | 25,848 | 942 | 26,790 | 26,637 | 1,616 | 28,253 |
| £500 to £549 | 19,053 | 627 | 19,680 | 19,744 | 1,200 | 20,944 |
| £550 to £599 | 10,181 | 355 | 10,536 | 10,575 | 673 | 11,248 |
| £600 to £649 | 8,723 | 289 | 9,012 | 9,060 | 662 | 9,722 |
| £650 to £699 | 5,153 | 185 | 5,338 | 5,419 | 409 | 5,828 |
| £700 to £749 | 3,851 | 135 | 3,986 | 4,062 | 342 | 4,404 |
| £750 and over | 33,932 | 1,543 | 35,475 | 35,849 | 3,604 | 39,453 |
| Not specified | 23,038 | 5,106 | 28,144 | 30,656 | 15,017 | 45,673 |
| Totals | 472,345 | 163,039 | 635,384 | 782,602 | 820,952 | 1,603,554 |
| 1936 Census | ||||||
| No income | 22,668 | 3,756 | 26,424 | 231,720 | 493,772 | 725,492 |
| Under £52 | 82,024 | 51,226 | 133,250 | 99,364 | 112,636 | 212,000 |
| £52 to £ 103 | 110,628 | 44,438 | 155,066 | 117,235 | 65,163 | 182,398 |
| £104 to £155 | 81,686 | 17,616 | 99,302 | 86,026 | 26,207 | 112,233 |
| £156 to £207 | 66,433 | 6,893 | 73,326 | 69,254 | 11,210 | 80,464 |
| £208 to £259 | 59,621 | 3,458 | 63,079 | 61,564 | 5,858 | 67,422 |
| £260 to £311 | 28,389 | 1,581 | 29,970 | 29,711 | 3,007 | 32,718 |
| £312 to £363 | 12,723 | 660 | 13,383 | 13,576 | 1,526 | 15,102 |
| £364 and over | 28,052 | 861 | 28,913 | 30,973 | 3,771 | 34,744 |
| Not known | 92 | 15 | 107 | 2,378 | 1,839 | 4,217 |
| Not specified | 12,317 | 8,080 | 20,397 | 14,425 | 10,269 | 24,694 |
| Totals | 504,633 | 138,584 | 643,217 | 756,226 | 735,258 | 1,491,484 |
OVERSEAS WAR SERVICE.—The following tables record the number of those persons at the 1936 and 1945 censuses who gave the relevant particulars of overseas war service. It must be appreciated that at the date of the 1945 census there were 45,381 (inclusive of 666 females and 1,300 Maoris) members of the Armed Forces still overseas. Figures quoted are exclusive of Maoris.
In the 1936 census tabulation, service in only one war was taken into account. In those instances in which individuals had seen service in two or more wars, the latest period of service was selected, the distinction being therefore between service in World War I and service in all other wars. The table records the number of separate individuals participating in wars.
WAR SERVICE: NUMBERS, 1936 CENSUS
| Force with which served. | World War I. | Wars other than World War I. | Total. | ||||||
|---|---|---|---|---|---|---|---|---|---|
| Males. | Females, | Total. | Males. | Females. | Total. | Males. | Females, | Total. | |
| New Zealand | 68,972 | 553 | 69,525 | 2,537 | 6 | 2,543 | 71,509 | 559 | 72,068 |
| Australian | 1,592 | 51 | 1,643 | 253 | 253 | 1,845 | 51 | 1,896 | |
| Imperial | 14,810 | 1,034 | 15,844 | 1,131 | 12 | 1,143 | 15,941 | 1,046 | 16,987 |
| Other British | 423 | 5 | 428 | 124 | 1 | 125 | 547 | 6 | 553 |
| Totals | 85,797 | 1,643 | 87,440 | 4,045 | 19 | 4,064 | 89,842 | 1,662 | 91,504 |
The table now presented dealing with the 1945 census refers to the number of separate persons with overseas service in one or more of the three major wars. However, each war or each combination of wars has been recorded separately.
WAR SERVICE: NUMBERS, 1945 CENSUS
| Wars. | Males. | Females. | Total. |
|---|---|---|---|
| Overseas service— | |||
| Only in World War II | 77,795 | 1,322 | 79,117 |
| Only in World War I | 69,537 | 1,436 | 70,973 |
| Only in South African War | 3,446 | 29 | 3,475 |
| In World War II and World War I | 2,318 | 12 | 2,330 |
| In World War I and South African War | 1,626 | 7 | 1,633 |
| In World War II and South African War | 3 | 3 | |
| In World War II, World War I, and South African War | 22 | 22 | |
| Total with overseas war service | 154,747 | 2,806 | 157,553 |
As the classification in the table following is by wars and forces and not by separate individuals, the total numbers will exceed those given in the preceding table. This derives from the fact that those persons with overseas service in more than one war will appear in the table below more than once—i.e., under the appropriate wars in which they participated.
WAR SERVICE: WARS AND FORCES WITH WHICH SERVED, 1945 CENSUS
| Forces with which served. | World War II. | World War I. | South African War. | |||
|---|---|---|---|---|---|---|
| Males. | Females. | Males. | Females. | Males. | Females. | |
| New Zealand Forces | 78,943 | 1,059 | 58,852 | 573 | 2,899 | 14 |
| Australian Forces | 143 | 27 | 1,369 | 47 | 320 | 2 |
| Imperial Forces | 792 | 213 | 12,659 | 800 | 1,640 | 18 |
| Other British Forces | 55 | 34 | 409 | 7 | 215 | 2 |
| New Zealand and Australian Forces | 17 | 28 | 2 | 3 | ||
| New Zealand and Canadian Forces | 9 | 7 | 3 | |||
| New Zealand and Imperial Forces | 171 | 1 | 159 | 25 | 8 | |
| New Zealand and other British Forces | 3 | 4 | 1 | |||
| Australian and Imperial Forces | 4 | 11 | 1 | 5 | ||
| Australian and other British Forces | 3 | |||||
| Imperial and other British Forces | 1 | 5 | ||||
| Totals | 80,138 | 1,334 | 73,503 | 1,455 | 5,097 | 36 |
DWELLINGS.—The table presented below affords a detailed classification of these dwellings which were inhabited at the date of the census, while the numbers of uninhabited dwellings and those in course of erection have also been incorporated in the table.
NATURE OF DWELLING
| Nature of Dwelling. | Numbers. | Percentage of Total Inhabited. | ||
|---|---|---|---|---|
| 1936. | 1945. | 1936. | 1945. | |
| A. Dwellings Occupied by Europeans | ||||
| Permanent private dwellings— | ||||
| Private house, not partly sub-let | 310,524 | 351,034 | 86.15 | 85.07 |
| Private house, partly sub-let | 1,243 | 1,697 | 0.34 | 0.41 |
| Flat | 12,923 | 28,008 | 3.59 | 6.79 |
| Combined shop and dwelling | 7,530 | 7,364 | 2.09 | 1.78 |
| Rooms attached to offices, &c. | 2,239 | 979 | 0.62 | 0.24 |
| Bach | 15,222 | 13,259 | 4.22 | 3.21 |
| Other (including mobile residence) | 224 | 993 | 0.06 | 0.24 |
| Totals | 349,905 | 403,334 | 97.07 | 97.74 |
| Temporary dwellings: Totals | 2,864 | 367 | 0.80 | 0.09 |
| Non-private dwellings— | ||||
| Hotel (licensed or private), boardinghouse, apartment-house, &c. | 5,632 | 7,172 | 1.56 | 1.74 |
| Hospital, public or private | 482 | 519 | 0.13 | 0.12 |
| Camp (military, P.W.D., &c.) | 866 | 357 | 0.24 | 0.09 |
| Other (including residential club, gaol, educational institution, barracks, &c.) | 706 | 893 | 0.20 | 0.22 |
| Totals | 7,686 | 8,941 | 2.13 | 2.17 |
| Grand totals, dwellings occupied by Europeans | 360,455 | 412,642 | 100.00 | 100.00 |
| B. Maori Dwellings | ||||
| Dwellings occupied by Maoris | 13,793 | 10,028 | ||
| C. Uninhabited Dwellings | ||||
| Dwellings with occupants temporarily absent | 5,784 | 5,919 | ||
| Week-end or summer dwellings | 8,435 | 11,047 | ||
| Untenanted dwellings | 6,594 | 7,136 | ||
| Totals | 20,813 | 24,102 | ||
| D. Building | ||||
| Dwellings in course of erection | 1,484 | 5,362 | ||
Chief points of interest emerging from this table are the 41,000 additional private houses, the greater proportion of flats in the total of inhabited dwellings, decreases in rooms attached to offices, &c., and camps, and an increase in the group total covering hotels, boardinghouses, apartment-houses, &c., in 1945 as compared with 1936.
The sizeable flat increment was not occasioned solely by augmented construction, but was largely a function of subdivision of larger premises. A glance at the table illustrating changes in the size of private dwellings discloses that houses of seven or more rooms declined from 11.56 per cent. of the total in 1936 to 7.73 per cent. in 1945. A considerable portion of the actual decrease in numbers recorded must have gone to swell the total of flats, apartment-houses, &c. In fact, construction of now flats approximated only one-quarter of the difference between the 1936 and 1945 totals.
The smaller totals associated with rooms attached to offices, &c., camps, and temporary dwellings must be considered against the background for the 1936 figures. During the depression years many camps had been established in various rural areas, while a revival of gold-seeking had been responsible for the inhabitation of many temporary dwellings. The same factor of depression probably inflated the numbers of rooms attached to offices, &c., used as places of habitation. The return of more prosperous conditions and the withdrawal of civilians for the armed services and urban essential industries doubtless accounted for the reductions effected.
Permanent Private Dwellings.—In the five tables following which deal with tenure, size of dwelling, total occupants, electricity supply, and material of outer walls, the tabulation is restricted to permanent private dwellings occupied by Europeans; certain details of dwellings occupied by Maoris will be found following these.
TENURE OF DWELLING
| Tenure. | Numbers. | Percentage of Total Specified. | ||
|---|---|---|---|---|
| 1936. | 1945. | 1936. | 1945. | |
| Renting or leasing | 135,194 | 142,717 | 38.83 | 35.44 |
| Free with job | 37,184 | 24,690 | 10.68 | 6.13 |
| Loaned without payment | 6,475 | 1.61 | ||
| Buying on time payment or with table mortgage | 57,618 | 72,217 | 16.55 | 17.93 |
| Buying with flat mortgage | 54,495 | 54,265 | 15.65 | 13.47 |
| Owned without mortgage | 63,651 | 102,358 | 18.29 | 25.42 |
| Not specified | 1,763 | 612 | ||
| Totals | 349,905 | 403,334 | 100.00 | 100.00 |
The intercensal period has been one of interesting changes in the development of the different forms of tenure. The principal change occurs in the relative importance of rented or leased dwellings when compared with these owned without mortgage or being bought on time payment or table mortgage. In 1936 the two latter classes comprised 34.84 per cent. of total inhabited dwellings, as against 38.83 per cent. rented, &c., dwellings. By 1945 this dominant position had been lost, the rented class constituting only 35.44 per cent., contrasted with 43.35 per cent. of these owned outright or subject to table mortgage. The following influences were probably among those most responsible—namely, generally prosperous conditions enabling direct purchase in some instances, and a decline in speculative building other than for sale, while there appears to have been a preference towards purchase by means of table rather than flat mortgages. In fact, there were 230 fewer dwellings with flat mortgages in 1945 than there were recorded in 1936. On the other hand, dwellings subject to table mortgages increased by 14,599.
The 1936 figures for dwellings provided free with the job or loaned without payment were probably greater than usual duo to the check on the urban drift imposed by depression conditions and the fact that this class of tenure is mainly found in rural areas. However by 1945, under the impetus derived from a world war, the urban drift had been accelerated, thus tending to lower the numbers of rent-free dwellings. The difference was approximately 6,000 over the period. No doubt the change-over from a March to a September census played some part also, while the economic situation of recent years would tend to reduce the proportion of rent-free dwellings in any case.
SIZE OF DWELLING
| Number of Rooms. | Numbers. | Percentage of Total Specified. | ||
|---|---|---|---|---|
| 1936. | 1945. | 1936. | 1945. | |
| 1 | 9,743 | 7,939 | 2.79 | 1.98 |
| 2 | 14,326 | 16,135 | 4.11 | 4.02 |
| 3 | 21,556 | 31,756 | 6.18 | 7.90 |
| 4 | 89,666 | 112,505 | 25.72 | 28.00 |
| 5 | 107,247 | 136,938 | 30.76 | 34.08 |
| 6 | 65,808 | 65,444 | 18.88 | 16.29 |
| 7 | 22,792 | 19,494 | 6.54 | 4.85 |
| 8 | 9,604 | 6,866 | 2.75 | 1.71 |
| 9 | 3,790 | 2,400 | 1.09 | 0.60 |
| 10 | 2,058 | 1,151 | 0.59 | 0.29 |
| 11 and over | 2,068 | 1,145 | 0.59 | 0.28 |
| Not specified | 1,247 | 1,561 | ||
| Totals | 349,905 | 403,334 | 100.00 | 100.00 |
The outstanding feature of the above table lies in the marked concentration of medium-sized dwellings. Single-roomed dwellings decreased by 1,804, while those with six or more rooms were 9,620 fewer than in the earlier period. Although there were 53,429 additional private dwellings inhabited since 1936, the three-to five-roomed category gain was 62,730, clear evidence that not only was new construction largely confined to within this range, but also that some larger units had undergone subdivision in the interim (note reference made in comments on the first table of this series). As a proportion of the total, medium-sized dwellings of from three to six rooms rose from 81.54 per cent. in 1936 to 8627 per cent. in 1945.
OCCUPANTS OF DWELLINGS
| Total Occupants. | Number of Cases. | Percentage of Total. | ||
|---|---|---|---|---|
| 1936. | 1945. | 1936. | 1945. | |
| 1 | 27,062 | 36,576 | 7.73 | 9.07 |
| 2 | 65,684 | 90,434 | 18.77 | 22.42 |
| 3 | 72,980 | 87,428 | 20.86 | 21.68 |
| 4 | 68,584 | 79,790 | 19.60 | 19.78 |
| 5 | 49,483 | 52,927 | 14.14 | 13.12 |
| 6 | 30,946 | 28,926 | 8.85 | 7.17 |
| 7 | 18,261 | 14,400 | 5.22 | 3.57 |
| 8 | 8,441 | 6,806 | 2.41 | 1.69 |
| 9 | 4,278 | 3,233 | 1.22 | 0.80 |
| 10 and over | 4,186 | 2,814 | 1.20 | 0.70 |
| Totals | 349,905 | 403,334 | 100.00 | 100.00 |
| Average occupants per dwelling | 3.90 | 3.60 | ||
In common with the decline in the proportion of larger-sized dwellings, the number of cases in which total occupants per dwelling was of the order of 6 or more persons tended to decrease in favour of those with 5 or less persons.
A note of caution must be sounded here, for not only were there 44,081 European members of the Armed Forces overseas at the time of the 1945 census, but the Armed Forces in Now Zealand either in camps or stations or on demobilization leave, &c., totalled many thousands in addition. Occupancy figures must therefore be considered in the light of this circumstance.
Other factors relevant in this connection are now given brief mention. Flats, which on the average tend to have both fewer rooms and less occupants, had more than doubled in number by 1945; their higher proportion of the total must have exerted a downward influence on the figure of average occupants per dwelling. Further, with the improvements in transport—e.g., in speed, frequency, and coverage—many former seaside baches have been utilized as permanent inhabitations, while wartime and post-war restrictions on this class of building, aided by more stringent by-law requirements, have alike prevented compensatory new construction of baches. Again, the fall in the birthrate, which had been continuing for many years until recently, would result in a relative increase in the number of houses occupied by those married couples whose families had grown up and left the house.
ELECTRICITY SUPPLY TO DWELLING
| Source of Supply. | 1945 Census. | |
|---|---|---|
| Number of Dwellings. | Percentage of Total specified. | |
| Public supply | 366,342 | 90.88 |
| Private supply | 2,813 | 0.70 |
| Company supply | 4,573 | 1.13 |
| Nil | 29,398 | 7.29 |
| Not specified | 208 | |
| Totals | 403,334 | 100.00 |
The information disclosed by the 1945 census shows that 92.71 per cent. of the dwellings in New Zealand were served with electricity, public supply being an overwhelming proportion of the total. Only 7.29 per cent. were recorded as having no electric supply available or connected, the great bulk of these dwellings (86.7 per cent.) being located in rural areas.
MATERIALS OF OUTER WALLS
| Material of Outer Walls. | Census. | |
|---|---|---|
| 1936. | 1945. | |
| Wood | 302,204 | 326,853 |
| Stone | 1,026 | 1,069 |
| Concrete (including concrete blocks) | 6,948 | 10,050 |
| Brick | 13,303 | 25,841 |
| Brick and wood | 2,727 | 2,965 |
| Wood and iron | 7,372 | 4,632 |
| Iron | 5,004 | 4,658 |
| Asbestos | 1,186 | 957 |
| Proprietary wallboards | 1,457 | 7,722 |
| Rough cast on wood or lath and plaster | 1,368 | 1,838 |
| Rough cast, n.o.d. | 1,749 | 5,858 |
| Other materials | 4,567 | 5,882 |
| Not specified | 994 | 5,009 |
| Totals | 349,905 | 403,334 |
Over 80 per cent. of dwellings in New Zealand are of wooden construction, but concrete, brick, proprietary wallboards, and rough cast all showed substantial increases in numbers since 1936.
Maori Dwellings.—The total number of dwellings occupied by Maoris at the 1945 census was 16,028, compared with 13,793 in 1936, an increase of 2,235, or 16.2 per cent. During the same period the Maori population increased by 16,418, equal to 19.9 per cent., but if members of the Armed Forces overseas are included the increase would be 17,718 or 21.5 per cent. The following summary shows the various types of dwellings enumerated.
NATURE OF DWELLING
| Nature of Dwelling. | 1945 Census. | |
|---|---|---|
| Numbers. | Per Cent. | |
| Ordinary private house (three or more rooms) | 11,125 | 69.44 |
| House or whare (one or two rooms) | 2,961 | 18.48 |
| Kauta (one or two rooms) | 234 | 1.46 |
| Flat | 167 | 1.04 |
| Bach (not part of a camp), hut | 1,026 | 6.41 |
| Other private dwellings of a permanent character | 70 | 0.44 |
| Temporary dwellings and tents | 248 | 1.55 |
| Non-private dwellings | 189 | 1.18 |
| Not specified | 8 | |
| Totals | 16,028 | 100.00 |
In the tables which follow, temporary dwellings and tents have been omitted.
TENURE OF DWELLING
| Tenure. | 1936 Census. | 1945 Census. | ||
|---|---|---|---|---|
| Numbers. | Per Cent. | Numbers. | Per Cent. | |
| Owned | 8,464 | 70.51 | 8,592 | 54.84 |
| Rented | 2,250 | 18.74 | 4,930 | 31.47 |
| Rent-free | 1,290 | 10.75 | 2,144 | 13.69 |
| Not specified | 261 | 114 | ||
| Totals | 12,265 | 100.00 | 15,780 | 100.00 |
SIZE OF DWELLING
| Number of Rooms. | 1936. | 1945. | ||
|---|---|---|---|---|
| Numbers. | Per Cent. | Numbers. | Per Cent. | |
| 1 | 2,437 | 19.97 | 1,878 | 11.94 |
| 2 | 2,396 | 19.63 | 2,471 | 15.71 |
| 3 | 1,952 | 16.00 | 2,915 | 18.53 |
| 4 | 2,779 | 22.77 | 4,258 | 27.06 |
| 5 | 1,348 | 11.05 | 2,411 | 15.32 |
| 6 | 774 | 6.34 | 1,126 | 7.16 |
| 7 | 283 | 2.32 | 393 | 2.50 |
| 8 | 130 | 1.07 | 162 | 1.03 |
| 9 and over | 104 | 0.85 | 118 | 0.75 |
| Not specified | 62 | 48 | ||
| Totals | 12,265 | 100.00 | 15,780 | 100.00 |
OCCUPANTS OF DWELLINGS
| Number of Occupants. | 1936. | 1945. | ||
|---|---|---|---|---|
| Numbers. | Per Cent. | Numbers. | Per Cent. | |
| 1 | 685 | 5.58 | 1,218 | 7.72 |
| 2 | 1,015 | 8.28 | 1,335 | 8.46 |
| 3 | 1,435 | 11.70 | 1,794 | 11.37 |
| 4 | 1,595 | 13.00 | 1,990 | 12.61 |
| 5 | 1,620 | 13.21 | 2,013 | 12.76 |
| 6 | 1,391 | 11.34 | 1,680 | 10.65 |
| 7 | 1,295 | 10.56 | 1,530 | 9.69 |
| 8 | 998 | 8.14 | 1,249 | 7.91 |
| 9 | 746 | 6.08 | 992 | 6.29 |
| 10 and over | 1,485 | 12.11 | 1,979 | 12.54 |
| Totals | 12,265 | 100.00 | 15,780 | 100.00 |
| 1642. | Discovery of New Zealand by Tasman. |
| 1765. | Discovery of Pukapuka Island, in the Cook Islands Group. |
| 1769. | Captain Cook's first visit to New Zealand. |
| 1773. | Captain Cook discovered Island of Manuae, in the Cook Islands Group. |
| 1788. | Discovery of Macaulay and Curtis Islands (Kermadec Group), and of Bounty Islands. |
| 1791. | Discovery of Snares and Chatham Islands. |
| 1792. | First sealing gang left on New Zealand coast. |
| 1793. | Discovery of Raoul or Sunday Island (Kermadec Group). Visit of Lieutenant-Governor King, of Norfolk Island, to Doubtless Bay. |
| 1800. | Discovery of Antipodes Islands. |
| 1806. | Discovery of Auckland Islands. |
| 1807. | Defeat of Hongi and the Ngapuhi Tribe. |
| 1810. | Discovery of Campbell Island. |
| 1814. | Arrival of Rev. Samuel Marsden, and introduction of Christianity. Horses, cattle, sheep, and poultry first brought to Now Zealand. |
| 1818. | Hongi's and To Morenga's great expedition to East Cape. |
| 1819–20. | Raid on Taranaki and Port Nicholson by Patuone, Nene, and To Rauparaha. |
| 1820. | Hongi's visit to England. First vessel entered Auckland Harbour. |
| 1821. | Hongi's capture of Mauinaina and To Totara Pas. Ngati-Toa migration from Kawhia to Otaki. |
| 1822. | Fall of Matakitaki Pa, Waikato, to Hongi. |
| 1823. | Fall of Mokoia Pa, Rotorua, to Hongi. |
| 1823–28. | Jurisdiction of Courts of Justice in Now South Wales extended to British subjects in New Zealand. |
| 1824. | Fall of Te Whetumatarau Pa to Pomare. |
| 1825. | First attempt at colonization, by an expedition under Captain Herd. Great defeat of Ngati-Whatau by Hongi. |
| 1827. | Hongi's forces destroyed mission station at Whangaroa. |
| 1828. | Death of Hongi. |
| 1829. | Brig “Hawes” captured by Maoris. |
| 1830. | Battles of Taumata-wiwi and Kororareka. Fall of Kaiapohia Pa, Canterbury, to Te Rauparaha. |
| 1831. | Tory Channel whaling-station established. Application of thirteen chiefs for the protection of King William IV. Capture of Pukerangiora Pa, Waitara, by Waikato. |
| 1832. | Repulse of Waikato at Nga-motu Pa. |
| 1833. | Mr. James Busby appointed British Resident at Bay of Islands. |
| 1834. | Battle near Otaki. Waimate Pa shelled and captured by British—first occasion on which H.M. troops employed in New Zealand. |
| 1835. | Declaration of independence of the whole of Now Zealand as one nation, with title of “United Tribes of New Zealand.” Ngati-Awa tribes migrated to and conquered Chatham Islands. |
| 1836. | Battles between Waikato and To Arawa. |
| 1838. | Pelorus Sound discovered. Arrival of Roman Catholic mission under Bishop Pompallier. |
| 1839. | Governor of New South Wales authorized to include within the limits of that colony any territory that might be acquired in sovereignty by Her Majesty in New Zealand. Preliminary expedition of New Zealand Company under Colonel Wakefield arrived at Port Nicholson. |
| 1840. | Arrival of New Zealand Company's settlers at Port Nicholson. Treaty of Waitangi signed. British sovereignty proclaimed. Captain Hobson appointed Lieutenant-Governor, with residence at Auckland. Settlements formed at Petre (Wanganui) and Akaroa. |
| 1841. | Issue of charter of incorporation of New Zealand Company. New Zealand proclaimed independent of Now South Wales. Arrival of New Plymouth settlers. |
| 1842. | Settlement founded at Nelson. |
| 1843. | Affray with Maoris at the Wairau. |
| 1844. | Royal flagstaff at Kororareka cut down by Heke. |
| 1845. | Destruction of Kororareka by Heke. |
| 1846. | Arrival of first steam vessel (H.M.S. “Driver”) in New Zealand waters. Capture of pa at Ruapekapeka and termination of Heke's war. Maori hostilities near Wellington. Te Rauparaha captured and detained as a prisoner. New Zealand divided into two provinces, New Munster and New Ulster, and representative institutions conferred. |
| 1847. | Attack by Maoris on Wanganui. |
| 1848. | Suspension of that part of Now Zealand Government Act which had conferred representative institutions. Severe earthquake at Wellington. Otago founded. |
| 1850. | Surrender of New Zealand Company's charter, all its interests reverting to the Imperial Government. Canterbury founded. |
| 1852. | Discovery of gold at Coromandel. Constitution Act passed, granting representative institutions to New Zealand, and dividing country into six provinces. |
| 1854. | Opening at Auckland of first session of the General Assembly. |
| 1855. | First members elected to the House of Representatives under system of responsible Government. Very severe earthquake on both sides of Cook Strait. |
| 1856. | Appointment of first Ministry under system of responsible Government. |
| 1857. | Goldfield opened at Collingwood. |
| 1858. | New Provinces Act passed. Hawkes Bay Province constituted. |
| 1859. | Establishment of Marlborough Province. |
| 1860. | Hostilities in Waitara district. |
| 1861. | Truce arranged with Waitara Maoris. Bank of New Zealand incorporated. Southland Province established. Gold discovered at Gabriel's Gully, Otago. |
| 1862. | Coromandel proclaimed a goldfield. Wreck of s.s. “White Swan,” with loss of many public records. First electric-telegraph line opened—Christchurch to Lyttelton. |
| 1863. | Wreck of H.M.S. “Orpheus” on Manukau bar, with loss of 181 lives. Control of Maori affairs transferred to Colonial Government. Commencement of Waikato War. Defeat of Maoris at Rangiriri, and occupation of Ngaruawahia. First railway in New Zealand, portion of Christchurch-Lyttelton line opened. |
| 1864. | Severs fighting in Waikato and elsewhere, including Battles of Rangiaohia, Orakau, Gate Pa, and To Ranga. First major discovery of gold on west coast of South Island. |
| 1865. | Seat of Government transferred to Wellington. Further fighting, followed by proclamation of peace. Activities of Hauhau fanatics, including murders of Europeans. Rebel Maoris defeated at Wairoa. |
| 1866. | Further defeats of rebel Maoris. Commencement of Panama steam mail-service. Cook Strait submarine telegraph-cable laid. |
| 1867. | Opening of Thames Goldfield. Lyttelton Tunnel completed. Admission of four Maori members to House of Representatives as direct representatives of Maori people. |
| 1868. | Maori prisoners, under leadership of To Kooti, seized schooner “Rifleman” and escaped from Chatham Islands to mainland, where they massacred Europeans. Considerable fighting with these and other rebel Maoris. |
| 1869. | Continuation of fighting with rebels and of pursuit of Te Kooti. Termination of Panama mail-service. Visit of H.R.H. the Duke of Edinburgh. Government Life Insurance Office established. |
| 1870. | Further fighting with To Kooti. Last of Imperial troops left New Zealand. Commencement of San Francisco mail-service. Bounty Island taken possession of. Inauguration of Vogel public-works policy. Act passed to establish the New Zealand University. Southland Province reunited with Otago. |
| 1871. | Commencement of railway-construction under public-works policy. |
| 1872. | Resumption of friendly relations with Waitara Maoris. Appointment of Maori chiefs (two) to Legislative Council. Public Trust Office created. |
| 1873. | Establishment of Now Zealand Shipping Company. |
| 1874. | In pursuance of immigration and public-works policy, 31,774 assisted immigrants introduced. Westland Province established. |
| 1875. | Resumption of amicable relations with Maori King. Establishment of Union Steam Ship Company. Abolition of Provinces Act passed. |
| 1876. | New Zealand connected by cable with Australia. Abolition of Provinces Act came into operation, provincial institutions being abolished and the country divided into counties and boroughs. |
| 1877. | Education Act passed, providing for free and compulsory education. |
| 1878. | Completion of the Christchurch-Invercargill railway. |
| 1879. | Trouble with Parihaka Maoris, under Te Whiti, and imprisonment of 180 of these. Triennial Parliaments Act passed. Adult male suffrage introduced. Kaitangata coal-mine explosion, whereby thirty-four lives lost. |
| 1880. | Release of Parihaka prisoners. |
| 1881. | Wreck of s.s. “Tararua,” with loss of 130 lives. Severe earthquakes in Wellington. Arrest of Te Whiti and Tohu. |
| 1882. | First shipment of frozen meat from New Zealand. |
| 1883. | Amnesty to Maori political offenders proclaimed. Te Whiti and Tohu released. Direct steam communication inaugurated between New Zealand and England. |
| 1885. | Now Zealand Industrial Exhibition at Wellington. |
| 1886. | Tarawera eruption, involving loss of 101 lives and destruction of Pink and White Terraces. |
| 1887. | Annexation of Kermadec Islands. Members of House of Representatives reduced to seventy-four, including four Maoris. |
| 1888. | British protectorate over Cook Islands proclaimed. |
| 1889. | South Seas Exhibition at Dunedin. |
| 1890. | Great maritime strike. First election of House of Representatives under one-man-one-vote principle. |
| 1891. | Inauguration of Liberal regime under Hon. John Ballance, succeeded on his death in 1893 by Mr. Seddon. This and following years marked by passage of industrial and social legislation. |
| 1892. | Introduction of lease-in-perpetuity system of land-tenure. |
| 1893. | Franchise extended to women. Special licensing poll introduced. |
| 1894. | Industrial Conciliation and Arbitration Act passed. Government Advances to Settlers Act passed. Wreck of s.s. “Wairarapa,” with loss of 135 lives. |
| 1895. | Government assumed management of Midland Railway. |
| 1896. | Brunner Mine explosion, causing sixty-seven deaths. Abolition of nonresidential or property qualification to vote. Government Valuation of Land Act passed. |
| 1898. | Old-age Pensions Act passed. |
| 1899. | Labour Day instituted. New Zealand Contingent (the first of ten) sent to South Africa. |
| 1900. | Number of European representatives in Lower House increased to seventy-six. |
| 1901. | T.R.H. the Duke and Duchess of York visited New Zealand. Penny postage adopted by New Zealand. Cook and other Pacific islands annexed. |
| 1902. | Pacific cable opened. Wreck of s.s. “Elingamite”, with loss of forty-three lives. Conference of colonial Premiers in London. |
| 1903. | Empire Day proclaimed. State Fire Insurance Act passed. |
| 1905. | Workers' Dwellings Act passed. Title of New Zealand's representative in London altered to “High Commissioner.” |
| 1906. | Death of Rt. Hon. R. J. Seddon, Premier since 1893. Advances to Workers Act passed. New Zealand International Exhibition at Christchurch. |
| 1907. | New Zealand constituted a Dominion. Lease-in-perpetuity system of land-tenure abolished. Parliament Buildings destroyed by fire. |
| 1908. | Through railway communication established between Wellington and Auckland. Wellington-Manawatu Railway purchased by Government. Second Ballot Act passed. |
| 1909. | S.s. “Penguin” wrecked in Cook Strait, with loss of seventy-five lives. Battle-cruiser presented by Now Zealand to Imperial Government. System of compulsory military training introduced. |
| 1910. | Field-Marshal Lord Kitchener reported and advised on New Zealand defences. Public Debt Extinction Act and National Provident Fund Act passed. |
| 1911. | Wireless telegraphy installed in Now Zealand. Widows' Pensions Act passed. First poll on national prohibition taken. |
| 1912. | Foundation-stone of new Parliament Buildings laid. Public Service placed under Commissioner control. |
| 1913. | Visit of Dominions Royal Commission. Visit of gift ship H.M.S. “New Zealand” to Dominion. Extensive strikes. Second Ballot Act repealed. Industrial, Agricultural, and Mining Exhibition at Auckland. |
| 1914. | Western Samoa occupied by New Zealand Advance Expeditionary Force. Main Expeditionary Force left for Egypt. Huntly coal-mine disaster, whereby forty-three lives lost. |
| 1915. | New Zealand Expeditionary Force engaged in operations on Gallipoli Peninsula. National Cabinet formed. National register of men compiled. Pensions for miners introduced. |
| 1916. | New Zealand Division transferred to western front, Mounted Brigade being retained in Egypt. Compulsory enrolment of men for war service introduced. Lake Coleridge electric-supply scheme opened. |
| 1918. | S.s. “Wimmera” sunk by enemy mine off Now Zealand coast, with loss of 26 lives. Otira Tunnel pierced. Great influenza epidemic, causing over five thousand deaths. |
| 1919. | Women made eligible for seats in Parliament, New Zealand represented at Peace Conference by Right Hon. W. F. Massey, P.C., Prime Minister. |
| 1920. | Visit of H.R.H. the Prince of Wales. Railway strike. First aeroplane flight over Cook Strait. League of Nations gave New Zealand mandate to administer Western Samoa. Anzac Day constituted. |
| 1921. | Samoa Act passed, making provision for government in terms of mandate. New Zealand represented at Disarmament Conference, Washington, by Hon. Sir John Salmond. |
| 1922. | Meat-export trade placed under control of a Board. |
| 1923. | Opening of Otira Tunnel. Ross Dependency proclaimed, and placed under jurisdiction of Governor-General. Dairy-produce Export Control Act passed, and adopted by dairy producers. |
| 1924. | Railway strike. Direct two-way radio communication effected with England. Motor-vehicles Act provided for registration and annual licensing of motor-vehicles. Land Transfer (Compulsory Registration of Titles) Act passed. Pensions for blind persons introduced. |
| 1925. | Repayment of the Public Debt Act passed. New Zealand and South Seas International Exhibition at Dunedin. Death of Right Hon. W. F. Massey. |
| 1926. | Administration of Tokelau (Union) Islands transferred to New Zealand. Absolute control adopted by Dairy-produce Control Board. Family Allowances Act passed. |
| 1927. | Visit of T.R.H. the Duke and Duchess of York. Summer Time Act passed. Petrol-tax imposed. |
| 1928. | Kingsford Smith and party made first successful flight across Tasman Sea. Compulsory insurance of motor-vehicles provided for by Motor-vehicles Insurance (Third-party Risks) Act. |
| 1929. | Severe earthquake in Murchison-Karamea district caused seventeen deaths. Daylight-saving (half-hour) permanently adopted for summer months. Fatal clash between police and Mau at Apia. |
| 1930. | Legislation providing for relief of unemployment first passed. Deaths of Sir Joseph Ward, Sir Robert Stout, and Sir Thomas Mackenzie, ex-Premiers. |
| 1931. | Worst earthquake in history of New Zealand occurred in Hawkes Bay, resulting in the loss of 255 lives. General reduction of 10 per cent. in wages and salaries. Parliament approved draft Statute of Westminster. Mortgagors' relief legislation passed. |
| 1932. | Industrial Conciliation and Arbitration Amendment Act made important changes in industrial legislation. National Expenditure Adjustment Act made reductions in old-age and other pensions, in salaries of State employees, and in rentals, interest rates, and other fixed charges. The historic Waitangi Estate presented to the nation by Their Excellencies Lord and Lady Bledisloe. New Zealand represented at Ottawa Conference. |
| 1933. | Exchange raised at instance of Government to £125 N.Z. for £100 London (telegraphic transfers). Sales tax of 5 per cent. on wholesale sales instituted. Conversion of internal public debt with reduction in interest rates, and provision made for local authorities' interest reduction and loans conversion. Successful experimental shipments of chilled beef to England. Issue of New Zealand silver coinage. |
| 1934. | First official trans-Tasman air-mail. Reserve Bank incorporated and commenced business. H.R.H. the Duke of Gloucester arrived on an official visit. First licensed air-transport service commenced operations. |
| 1935. | Bank-notes of trading banks ceased to be legal tender. Rural Mortgagors Final Adjustment Act passed, and Court of Review established. National Government defeated at general election, and Labour Government assumed office. |
| 1936. | Inauguration of inter-Island trunk air services. Reserve Bank nationalized. System of guaranteed prices for butter and cheese introduced. Forty-hour week became operative. Powers of Arbitration Court restored. Rail-car services inaugurated. New Zealand elected to seat on League of Nations Council. |
| 1937. | New Zealand represented at Imperial Conference by Right Hon. M. J. Savage, Hon. W. Nash, and Mr. W. J. Jordan. Death of Lord Rutherford of Nelson. |
| 1938. | Death of Dr. Sir F. Truby King. Mr. W. J. Jordan, New Zealand's representative on League of Nations, elected President of the League Assembly. Social Security Act passed. General election: Labour Government returned for second term. Introduction of import selection and control. |
| 1939. | Declaration of war with Germany. Recruitment for 2nd New Zealand Expeditionary Force. Arrangements for purchase of primary products by Imperial Government. New Zealand Centennial Exhibition opened at Wellington. Issue of New Zealand bronze coinage. Naval engagement off River Plate, South America, in which H.M.S. “Achilles,” largely manned by New Zealand ratings, in action. |
| 1940. | Centennial celebrations. Departure of First Echelon of 2nd New Zealand Expeditionary Force. Death of the Prime Minister, the Right Hon. M J. Savage, P.C.; succeeded in office by Hon. P. Fraser. Declaration of war with Italy. R.M.S. “Niagara” sunk off New Zealand coast by enemy mine. Ballots for military service. National savings scheme inaugurated. Island of Nauru bombarded by enemy raider. |
| 1941. | Italian raider sunk by H.M.N.Z.S. “Leander” in Indian Ocean. Daylight saving period extended to cover whole year. Minesweeper H.M.N.Z.S. “Puriri” sunk by mine in Hauraki Gulf, five fatalities. First enrolment of married men for military service. Death penalty abolished, also flogging and whipping. Declaration of war with Finland, Hungary, and Rumania. Declaration of war with Japan. Territorial forces mobilized. |
| 1942. | Complete mobilization of Military Forces ordered. Introduction of control of industrial man-power. Compulsory enrolment of all male British subjects between ages of eighteen and sixty-five, inclusive, in Emergency Reserve Corps. Lend-lease reciprocal aid extended to include Australia and New Zealand. Gold to value of £2,397,000 salvaged from R.M.S. “Niagara.” Rationing introduced, principal items being tea, sugar, clothing, footwear, and household linen. Severe earthquakes in Wairarapa and Wellington districts on 24th June and 2nd August. Mobilization of women for essential work. Thirty-seven lives lost in fire at Seacliff Mental Hospital. Economic Stabilization Emergency Regulations issued. |
| 1943. | H.M.N.Z. Corvette “Moa” sunk by Japanese with loss of five lives. Death of Right Hon. J. G. Coates, P.C., M.C., member of War Cabinet and former Prime Minister. North African campaign brought to a successful conclusion. Serious railway accident near Hyde, Central Otago—twenty-one persons killed and thirty-eight injured. Servicemen's Settlement and Land Sales Act passed. General election: Labour Government returned for third term, 2nd N.Z.E.F. (3rd Division) took part in action against Japanese in the Pacific Area. Butter rationing introduced, 2nd Division, 2nd N.Z.E.F., rejoined 8th Army in Italy. |
| 1944. | Australian - New Zealand Agreement, 1944, providing for collaboration on matters of mutual interest. Meat rationing introduced, also egg rationing introduced in certain areas. Right Hon. P. Fraser, P.C., attended Conference of Prime Ministers of British Commonwealth in London. Annual Holidays Act passed. Hon. W. Nash, New Zealand Minister at Washington, elected president of the International Labour Office Conference at Philadelphia. Third division, 2nd N.Z.E.F., returned to New Zealand from the Pacific Area. Invasion of France by Allied Forces commenced. Mutual-aid Agreement between Canadian and New Zealand Government signed. Australian - New Zealand civil aviation conference held in Wellington. First conference under terms of the Australian - New Zealand Agreement held in Wellington. New Zealand delegation attended British Commonwealth Civil Aviation Conference at Montreal and International Civil Aviation Conference at Chicago. |
| 1945. | Lord Reith, former Director-General of the British Broadcasting Corporation, visited New Zealand as leader of a tele-communications mission. General increase in salaries and wages, back-dated to June, 1944, granted to all State employees. Royal Commission commenced inquiries into licensing laws of New Zealand. New Zealand represented on United Nations Committee of Jurists by the Chief Justice, Sir Michael Myers. War in Europe ended (8th May). New hospital opened at Silverstream for the treatment of infantile-paralysis cases—first of its kind in New Zealand. War gratuities payments scheme announced. Man-power controls in regard to women and young persons relaxed. Wartime press censorship abolished. Further relaxations in man-power controls announced. War Cabinet dissolved. Hon. P. C. Webb, Minister of Labour, attended International Labour Organization conference in Paris. Right Hon. W. J. Jordan, P.C., reappointed High Commissioner for New Zealand in United Kingdom for a further term. War in Pacific ended, Japan formally surrenders (15th August). Decision to send a Brigade Group from the 2nd New Zealand Expeditionary Force to participate in the occupation of Japan announced. Electoral Amendment Act, providing for determination of electorates on the basis of adult suffrage and the abolition of the “country quota,” passed. Bank of New Zealand Act, providing for the acquisition by the State of all privately-owned shares, passed. New Zealand National Airways Act, providing for complete control of air transport as a national service, passed. South Island Main Trunk Railway opened, through rail connection from Picton to Bluff established. |
| 1946. | Chair of Obstetrics and Gynæcology established at Auckland University. Opening of first session of General Assembly of the United Nations in London. Mr. Justice Northcroft nominated as member of International Military Courts for trial of Far Eastern war criminals. First women Members of Legislative Council (two) appointed. Major-General Kippenberger, C.B., C.B.E., D.S.O., appointed Editor of New Zealand War History. New Zealand contingent of British Commonwealth Force to occupy Japan sailed from Italy. Empire Civil Aviation Conference held in Wellington. Air Service between New Zealand and J Force in Japan inaugurated by R.N.Z.A.F. Restrictions on consumption of electric power imposed in North Island. Remaining manpower controls covering freezing-works, coal-mining, sawmilling, and forestry lifted (June). Family benefit of 10s. per week made universal as from 1st April. Coupon rationing of motor-spirits revoked, supplies to be regulated by monthly quotas to oil companies. Pan-American World Airways resumed air service between San Francisco and New Zealand. Lieutenant-General Sir Bernard Freyberg, V.C., assumed office as Governor-General 17th June. North Island train services cut owing to coal shortage. Railways Department inaugurated inter-island air freight service. Imports of phosphate from Nauru and Ocean Islands resumed. Contracts for bulk purchase of wool by United Kingdom Government expired, sales by auction resumed. Commission of three members appointed to control Public Service. Legislation passed authorizing Government to acquire shares in company to be incorporated in New Zealand by the Anglo-Iranian Oil Co., Ltd. General election: Labour Government returned for fourth term. Air service from Auckland to North America planned by British Commonwealth Pacific Airlines, Ltd. |
| 1947. | Prolonged dispute on waterfront over forty-hour week issue. Trans-Tasman steamer “Wanganella” ran ashore on Barrett's Reef. Dental benefits for adolescents under Social Security Act inaugurated. Inquiry into Gaming Laws by Royal Commission commenced. New Zealand delegation led by Right Hon. W. Nash, P.C., attended conference at Canberra to establish a regional commission for South Pacific. £12,500,000 presented to United Kingdom Government by New Zealand. Rear-Admiral R.E. Byrd's Antarctic Expedition called at Wellington. Embargo on direct import of live-stock from Great Britain lifted after being in operation for twenty-four years. Heavy cuts made in electric-power supply owing to water shortage. Railway services curtailed owing to shortage of coal caused by strike in Waikato mines. New Zealand delegation headed by Right Hon. W. Nash, P.C., attended International Conference on Trade and Employment at Geneva. Karapiro hydro-electric-power station completed. Local Government Commission appointed. Miss Mabel Howard appointed Minister of Health; first woman Cabinet Minister in New Zealand. Opening of twenty-eighth Parliament. Marketing of dairy-produce and fixation of guaranteed price taken over by Dairy Commission. Royal Commission to inquire into sheep-farming industry appointed. General increase in salaries and wages granted. Lord Nathan, United Kingdom Minister of Civil Aviation, visited New Zealand. Railway fares and freight charges increased, first rise since 1938, The Prime Minister, Right Hon. P. Fraser, P.C., C.H., attended a conference at Canberra of British Commonwealth Governments on Japanese peace treaty. Statute of Westminster adopted by New Zealand Parliament. New Zealand delegation headed by Right Hon. W. Nash, P.C., attended United Nations Conference on Trade and Employment at Havana. Disastrous fire in Christchurch, 41 persons perish. Marriage of Princess Elizabeth and Duke of Edinburgh. Prime Minister of Australia visited New Zealand. Clothing rationing abolished. |
| 1948. | Death of Speaker of Legislative Council, Hon. M. Fagan. Release of Gaming Commission report. Tasman air service inquiry opened. Mahatma Gandhi assassinated in India. Government endorsed plan for Rongotai airport. Railway accident near Blenheim with loss of six lives. Compulsory motor-spirits rationing reintroduced 1st March, while schools resumed on that date after the long closure on account of the poliomyelitis epidemic. Royal tour of Australia and New Zealand announced. Australian naval units visit New Zealand. Government defence policy announced. United Nations appeal for children launched. Tramping tragedy in Southern Alps involving death of three women. Announcement of withdrawal of New Zealand Army component of J Force during the period July to September. Mount Ngaruhoe erupts after twenty-two years' quiescence. Tea-rationing ended on 31st May. Australia – New Zealand Ministerial discussions on trade, defence, &c., held at Canberra. The longest regular air flight in the world maintained by the same aircraft and crew ended on 6th June, when the last flight was completed of the R.N.Z.A.F. Japan–New Zealand air courier service. Olympic Games opened at Wembley. Adjustment of exchange rate to parity with sterling as from the 20th August. Cyclone at Frankton entailed much damage and loss of three lives. Sugar-rationing ended on 27th August. New radio frequencies operated in New Zealand from beginning of September. Auckland chosen as the venue of the 1950 Empire Games. Meat-rationing ended on 27th September. The Prime Minister attended the Commonwealth Prime Ministers' Conference in London. Abolition of meat-rationing announced. National Airways Corporation's “Kaka” crashed on Mount Ruapehu with the loss of thirteen lives, New Zealand's worst air disaster. International War Crimes Tribunal sentenced to death Japanese war-leaders. Birth of Prince Charles on 15th November. Discovery of notornis near Lake Te Anau. Cancellation of Royal tour announced on account of His Majesty's illness. “Wanganella” resumes sailings on New Zealand-Australia run. Coal Act making provision for the acquisition by the Crown of the property in all unworked coal passed. General Assembly of the United Nations ends session at Paris; adoption of Declaration of Human Rights during this session. Record price of 81d. per pound paid at Christchurch wool sale for Merino wool. |
| Article on | Appeared for the Last or Only Time in the Year-Book of | |
|---|---|---|
| Year. | Page. | |
| Acclimatization | 1894 | 430 |
| Agriculture in New Zealand (by M. Murphy, F.L.S.) | 1912 | 809 |
| Alexander Turnbull Library | 1946 | 914 |
| “Britomart,” mission of, at Akaroa in August, 1840 | 1927 | 1012 |
| Building-stones | 1892 | 194 |
| Cancer in New Zealand—a statistical study | 1926 | 889 |
| Chatham Islands, the | 1900 | 531 |
| Cheviot estate, the | 1895 | 264 |
| Christchurch to West Coast, journey from | 1899 | 548 |
| Coal-deposits of New Zealand, the | 1900 | 479 |
| Cook Islands, the laws of | 1902 | 573 |
| Co-operative system of constructing public works | 1894 | 234 |
| Dairy farm survey | 1938 | 429 |
| Education system of New Zealand, the | 1925 | 816 |
| Effect of nativity order on infant mortality | 1925 | 835 |
| Exotic trees in Canterbury | 1904 | 569 |
| External trade of New Zealand, the | 1915 | 858 |
| Fauna, the | 1940 | 36 |
| Forest-trees and the timber industry | 1899 | 470 |
| Frozen-meat trade, the | 1894 | 311 |
| Geology | 1940 | 7 |
| Gold-dredging industry, the | 1899 | 509 |
| Government training-ship “Amokura” | 1913 | 942 |
| Hanmer thermal springs | 1905 | 631 |
| Hemp industry, the | 1900 | 477 |
| H.M.S. “New Zealand” | 1913 | 932 |
| Kauri-gum | 1900 | 489 |
| Labour in New Zealand | 1894 | 362 |
| Lakes of New Zealand | 1932 | 11 |
| Land and income tax assessment | 1913 | 884 |
| Laws of England and New Zealand, difference between | 1896 | 281 |
| Libraries | 1940 | 928 |
| Live-stock production—A review based on standard values and units | 1929 | 990 |
| Local government in New Zealand | 1925 | 845 |
| Maori, ancient, his amusements, games, &c. | 1907 | 707 |
| " ancient, his clothing | 1908 | 734 |
| " chant (tangi) | 1907 | 711 |
| " colour-sense of the | 1905 | 637 |
| " marriage customs | 1906 | 638 |
| " mythology | 1900 | 536 |
| " neolithic, the | 1902 | 578 |
| " religion | 1901 | 530 |
| " sociology | 1903 | 641 |
| " songs | 1908 | 739 |
| " topographical nomenclature of the | 1919 | 936 |
| Marlborough Sounds, the | 1901 | 517 |
| Midland railway, the | 1894 | 386 |
| Mineral waters and spas | 1940 | 935 |
| Mineral waters of New Zealand | 1913 | 896 |
| Moa, heir of the | 1899 | 517 |
| Mortality rates, New Zealand | 1927 | 995 |
| Mount Cook, a night on | 1900 | 525 |
| " district, the | 1899 | 554 |
| " its glaciers, and the Hermitage | 1898 | 552 |
| Mount Sefton, ascent of | 1900 | 519 |
| National Film Unit | 1946 | 724 |
| New Zealand contingents for South Africa | 1900 | 449 |
| New Zealand international exhibition | 1907 | 701 |
| Otago lakes, the | 1901 | 523 |
| Patents, designs, and trade-marks | 1893 | 350 |
| Plants of New Zealand, the | 1940 | 28 |
| Pumice-stone deposits of New Zealand | 1900 | 486 |
| Railways in New Zealand, their history and progress | 1894 | 377 |
| Rivers of New Zealand | 1932 | 6 |
| Ross Dependency | 1938 | 900 |
| Scenic wonderland, a | 1898 | 565 |
| Sheep, crossbreeding of | 1894 | 308 |
| Sheep-farming | 1894 | 302 |
| Shipping companies— | ||
| New Zealand Shipping Company | 1895 | 392 |
| Shaw, Savill, and Albion Company | 1895 | 393 |
| Union Steam Ship Company of New Zealand | 1895 | 389 |
| Southern Alps, the | 1894 | 474 |
| State farms | 1894 | 243 |
| Sydney pageant, the | 1901 | 527 |
| Terman intelligence tests in New Zealand schools | 1925 | 823 |
| Thermal-springs district | 1905 | 614 |
| Timber-trees of the world | 1903 | 605 |
| Tokaanu to Raetihi | 1899 | 539 |
| Totalizator, the | 1926 | 838 |
| Tourist attractions | 1940 | 932 |
| Tree-planting | 1906 | 611 |
| Tuhoeland | 1899 | 546 |
| Varieties of soil | 1892 | 193 |
| Wages and working-hours in New Zealand | 1919 | 860 |
| Waihi Gold-mining Company | 1897 | 432 |
| Waikato district and through to Wanganui | 1899 | 520 |
| Waiouru to Mangaonoho | 1899 | 543 |
| Wanganui River, up the, to Tokaanu | 1900 | 509 |
| Wattle-growing in the Auckland Provincial District | 1897 | 430 |
| Wellington-Manawatu railway, the | 1895 | 381 |
| Wellington municipal milk supply | 1925 | 777 |
| West Coast Sounds, the | 1894 | 482 |
| White Island, a day on | 1906 | 637 |
The following list, compiled by Mr. C. R. H. Taylor, M.A., Dip.Jour. (Librarian of the Alexander Turnbull Library), contains the names of some of the principal works dealing with New Zealand, Samoa, and the Cook Islands.
This list includes the more notable works in their fields issued since 1912. Earlier works are listed in the 1932 issue of the Year-book.
ADAM, Margaret I.; John Ewing; and James Munro. Guide to the principal parliamentary papers relating to the dominions, 1812–1911. London. Oliver and Boyd, 1913.
ANDERSEN, Johannes Carl (ed.). Annals of New Zealand literature. Wellington. Authors' Week Committee, 1936.
—The lure of New Zealand book-collecting. Wellington. Whitcombe and Tombs, 1936.
BAGNALL, Austin Graham. A reference list of books and other publications associated with the New Zealand Centennial. Wellington. Department of Internal Affairs 1942.
CHAPPLE, Leonard James Bancroft. A bibliographical brochure … of New Zealand education. Wellington. New Zealand Council for Educational Research, 1936.
HARRIS, William J. Guide to New Zealand reference material and other sources of information. Wellington. New Zealand Library Association, 1947.
JOHNSTONE, A. H. Supplement to Hocken's bibliography of New Zealand literature. Christchurch. Whitcombe and Tombs, 1927.
MULES, Mary, and Arthur Gordon Butchers. Bibliography of New Zealand education. Second edition revised by H. C. McQueen, XII, 111 p. Wellington. New Zealand Council for Educational Research, 1947.
MUNN, Ralph, and John Barr. New Zealand libraries: survey of conditions and suggestions for their improvement. Christchurch. New Zealand Library Association, 1934.
N.Z. LIBRARIES, (Monthly.) Wellington. New Zealand Library Association.
N.Z. LIBRARY ASSOCIATION. Check list of serials in New Zealand libraries, compiled by J. Harris. Wellington, 1942. Supplement, 54 p., 1945.
— Copyright publications received in the General Assembly Library. (Annual.) Wellington. Government Printer.
SCHOLEFIELD, Guy Hardy. A union list of New Zealand newspapers. Wellington. Government Printer, 1938.
SERLE, Percival. Bibliography of Australasian poetry and verse. Melbourne. University Press, 1925.
SMITH, Elizabeth Maisie. A history of New Zealand fiction from 1862 to the present time. Dunedin. A. H. and A. W. Reed, 1939.
TAYLOR, Clyde Romer Hughes. A select list of books relating to New Zealand and certain Pacific islands, 1912–49. Bibliographical list no. 9 of the Alexander Turnbull Library, Wellington, 1950. (A separated reprint of this Year-Book list.)
TRIMBLE, W. H. (Compiler). Catalogue of the Hocken Library. Dunedin. Otago Daily Times, 1912.
WILLIAMS, Herbert William. Bibliography of printed Maori to 1900. (Dominion Museum monograph no. 7.) Wellington. Government Printer, 1924. Supplement, 1928.
ANDERSEN, Johannes Carl. Myths and legends of the Polynesians. London. Harrap, 1928.
BEST, Elsdon. Maori religion and mythology. Dominion Museum Bulletin No. 10 Wellington. Government Printer, 1924.
ELDER, John Rawson. The history of the Presbyterian Church of New Zealand, 1840–1940. Christchurch. Presbyterian Bookroom, 1940.
GREENWOOD, William. The upraised hand, or the spiritual significance of the Ringatu faith. Wellington. Polynesian Society (Memoir Vol. 21), 1942.
GREY, Sir George. Polynesian mythology. New edition. Christchurch. Whitcombe & Tombs, 1929.
OLPHERT, John. Primitive Methodism in Auckland, 1849–1913. A centenary survey. Auckland, Wesley Historical Society (N.Z. branch), 1949.
POMARE, Sir Maui, and James Cowan. Legends of the Maori, 2 vols. Wellington. Tombs, 1930–34.
WILSON, Charles A. Legends and mysteries of the Maori. London. Harrap, 1932.
BELSHAW, Horace. Land tenure and the problem of tenurial reform in New Zealand. Auckland. New Zealand Institute of International Affairs, 1948.
— Recovery measures in New Zealand: a comparison with the New Deal in the United States. Wellington. New Zealand Institute of Pacific Relations, 1936.
BILLING, Geoffry C. New Zealand's trade policy. Wellington. New Zealand Institute of International Affairs, 1946.
COAD, Nellie Euphemia. Dominion civics. Wellington. Whitcombe and Tombs, 1924.
THE ECONOMIC RECORD. (Quarterly.) Melbourne. (Much on New Zealand.)
GARDNER, Roy. The basis of prosperity in New Zealand. Dunedin. Coulls, Somerville, Wilkie, 1939.
HARE, Anthony Edward Christian. Works Councils in New Zealand. Wellington. Victoria University College, 1943.
HUBBARD, Edmund F. The industrial future of New Zealand. Wellington. Whitcombe & Tombs, 1941.
HUTCHISON, Robert H. The “socialism” of New Zealand. New York. New Review Publishing Association, 1916.
LEE, John Alexander. Socialism in New Zealand. London. T. Werner Laurie, 1938.
LIPSON, Leslie. The politics of equality: New Zealand's adventures in democracy. Chicago. University of Chicago Press, 1948.
MILNER, Ian Frank George. New Zealand's interests and policies in the Far East. New York. Institute of Pacific Relations, 1940.
MONTHLY ABSTRACT OF STATISTICS. Wellington. N.Z. Census and Statistics Department.
MOSTYN, Idris (pseud.). The truth about internal marketing. Wellington. Progressive Publishing Society, 1944.
NASH, Hon. Walter. New Zealand, a working democracy. London. Dent, 1944.
NEALE, Edward Percy. Guide to New Zealand official statistics. Second edition. Auckland. Whitcombe & Tombs, 1949.
OTTO, W. S. Nationalization of the Bank of New Zealand. Auckland. League for Economic Democracy, 1945.
POWLES, G. R., and others (eds.). Contemporary New Zealand. Wellington. New Zealand Institute of International Affairs, 1938.
REEVES, William Pember. State Experiments in Australia and New Zealand, 2 vols. London. Allen and Unwin, 1925.
THE ROUND TABLE. (Quarterly). London. (Regular survey of New Zealand affairs.)
SCOTT, S. W. Outline history of the New Zealand Labour movement. Auckland. In Print Publishing Co., 1945.
SINCLAIR, H. I. Population: New Zealand's problem. Dunedin. Gordon and Gotch, 1944.
STATISTICS. Annual volumes as under:—
Population and buildings.
Vital statistics.
Justice.
Trade and shipping, 2 vols.
Agricultural and pastoral production.
Factory production.
Industrial accidents.
Insurance.
Prices, wages, and labour statistics.
N.Z. official year book.
Pocket compendium of statistics.
Local authorities handbook.
Periodical: Census results.
Wellington. Census and Statistics Department.
SUTCH, William Ball. The quest for security in New Zealand. Harmondsworth. Penguin books, 1942.
— Recent economic changes in New Zealand. Auckland. Whitcombe and Tombs, 1936.
— Price fixing in New Zealand. New York. Columbia University Press, 1932.
SUTHERLAND, Allan. History reflected in money and medals. Wellington. N.Z. Numismatic Society, 1941.
— Numismatic History of New Zealand. New Plymouth. Avery, 1939.
WEBB, Leicester Chisholm. Government in New Zealand. Wellington. Department of Internal Affairs, 1940.
WILSON, Ethel Wilson. Land problems of the forties. Dunedin. Reed, 1936.
WISE, Henry Leslie. Post-war industrial planning. Wellington. Butterworth, 1944.
WOOD, Frederick Lloyd Whitfield. New Zealand in the world. Wellington. Department of Internal Affairs, 1940.
BELSHAW, Horace (ed.). New Zealand. Berkeley. University of California Press, 1947.
BUTCHERS, Arthur Gordon. Young New Zealand. Dunedin. Coulls, Somerville, Wilkie, 1929.
CAMPBELL, Arnold E. Feilding Community Centre. Wellington. New Zealand Council for Educational Research, 1945.
CROKER, Audrey Basil. History of Grand Lodge of Ancient, Free and Accepted Masons of New Zealand, 1890–1940. Christchurch. Grand Lodge of New Zealand, 1940.
DUFF, Oliver. New Zealand now. Wellington. Department of Internal Affairs, 1941.
GOURLAY, Henry William. Odd-fellowship in New Zealand. Christchurch. Andrews Baty, 1942.
HARE, Anthony E. C. Report on industrial relations in New Zealand. Wellington. Whitcombe and Tombs, 1946.
HARROP, Angus John. England and New Zealand. London. Methuen, 1926.
HETHERINGTON, Jessie Isabel. New Zealand: its political connection with Great Britain, 2 vols. Dunedin. Coulls, Somerville, Wilkie, 1926–27.
JOURNAL OF PUBLIC ADMINISTRATION. (Half-yearly.) Wellington. N.Z. Institute of Public Administration.
LUSK, Hugh Hart. Social welfare in New Zealand. London. Heinemann, 1913.
MARAIS, Johannes Stephanus. Colonization of New Zealand. Oxford University Press, 1927.
MIRAMS, Gordon H. Speaking candidly. Hamilton. Pauls Book Arcade, 1945.
SIEGFRIED, Andre. Democracy in New Zealand. London. Bell, 1914.
SIMPSON, Frank A. Parliament in New Zealand: principles, personalities and procedure. Wellington. A. H. and A. W. Reed, 1947.
SOMERSET, Hugh Crawford Dixon. Littledene: a New Zealand rural community. Wellington. Council for Educational Research, 1938.
SUTCH, William Ball. Poverty and progress in New Zealand. Wellington. Modern Books, 1941.
ADAMS, Ernest C. The law of stamp duties in New Zealand. Wellington. Butterworth, 1947.
BUTTERWORTH'S annotations and supplements to the public acts of New Zealand, 1908–47. Wellington. Butterworth, 1948.
CUNNINGHAM, Herbert Adam. Taxation laws of New Zealand. Second edition of “Land-and-income-tax law in New Zealand.” Wellington. Butterworth, 1942.
CHAMPION, Elma C. The law of trusts, wills and administration of estates in New Zealand. Wellington. Whitcombe and Tombs, 1947.
DALGLISH, Douglas J. Company law in New Zealand. Christchurch. Whitcombe and Tombs, 1948.
DASH, Eric. Guide to pharmacy law in New Zealand. Wellington. Whitcombe and Tombs, 1947.
DICKINSON, George Arthur. Law relating to bills of exchange, cheques and promissory notes in New Zealand and Australia. Wellington. Butterworth, 1948.
FODEN, Norman Arthur. The Constitutional development of New Zealand, 1839–49. Wellington. Butterworth, 1938.
GARROW, James M. E. Garrow's law of personal property. Third edition by E. W. Henderson. Wellington. Butterworth, 1947.
HIGHT, James, and H. D. Bamford. The Constitutional history and law of New Zealand. Christchurch. Whitcombe and Tombs, 1914.
JOLLIFFE, William. Jolliffe's local government in counties and boroughs. Sixth edition. Wellington. Ferguson and Osborn, 1947–48. (i.e. 1949.)
JOURDAIN, William Robert. Land legislation and settlement in New Zealand. Wellington. Lands and Survey Department, 1925.
KAVANAGH, James Paul. The industrial man-power emergency legislation. Wellington. Butterworth, 1942.
MACDONALD, John William. Law relating to workers' compensation in New Zealand. Second edition. Supplemented by J. Byrne. Wellington. Butterworth, 1948.
MAZENGARB, Alfred J. The industrial laws of New Zealand. Second edition. Wellington, Butterworth, 1947.
N.Z. LAW JOURNAL. (Fortnightly since 1924.) Wellington. Butterworth.
N.Z. LAW REPORTS. (Monthly since 1883.) Wellington. Butterworth.
N.Z. STATUTES. (Annual volume.) Wellington. Government Printer. (The last, consolidation covered the period to 1931.) 9 vols. Wellington. Butterworth, 1932. (See Butterworth, above.)
RHODES, Eric George. Practice precedents, including statements of defence (second series). Wellington. Butterworth, 1944.
SMITH, Norman. Native custom and law affecting native land. Wellington. Maori Purposes Fund Board, 1942.
STACEY, W. J., and P. G. Harle. Harle's mercantile law in New Zealand. Revised and edited by J. D. Willis. Wellington. Butterworth, 1945.
TONKIN, A. S., and R. J. Knowles. The law and special taxation of private companies in New Zealand. Wellington. Butterworth, 1945.
TREADWELL, Charles Archibald Lawrence. Notable New Zealand trials. New Plymouth. Avery, 1936.
WADDY, Percival R. Mercantile law of New Zealand, revised by J. D. Willis. Fifth edition. Wellington. Whitcombe and Tombs, 1939.
WARD, Denzil Q. S. and H. R. Charton. Mercantile Law in New Zealand. Wellington. Whitcombe and Tombs, 1947.
BEAGLEHOLE, John Cawte. The University of Now Zealand: an historical study. Wellington. N.Z. Council for Educational Research, 1937.
BEAGLEHOLE, John Cawte. Victoria University College: an essay towards history. Wellington. New Zealand University Press, 1949.
BEEBY, Clarence Edward. The education of the adolescent. Wellington. N.Z. Council for Educational Research, 1937.
BEEBY, Clarence Edward. Intermediate schools of New Zealand. Wellington, 1938.
BUTCHERS, Arthur Gordon. The education system. Auckland. National Printing Co., 1932.
CAMPBELL, Arnold Everitt. The control of post-primary schools; a report on an enquiry made in the Auckland district. Wellington. N.Z. Council for Educational Research, 1948.
CAMPBELL, Arnold Everitt. Educating New Zealand. Wellington. Department of Internal Affairs, 1941.
CAMPBELL, Arnold Everitt. Higher education and its future. Wellington. N.Z. Council for Educational Research, 1943.
CAMPBELL, Arnold Everitt, and Colin Lennie Bailey (eds.). Modern trends in education. New Education Fellowship Conference. Wellington. Whitcombe and Tombs, 1938.
EDUCATION. A Magazine for Teachers. School Publications Branch, Education Department. Five-times-a-year book since 1948.
GORDON, Ian A. The teaching of English: a study in secondary education. Wellington. N.Z. Council for Educational Research, 1948.
MCQUEEN, Henry Charles. Education in New Zealand museums. Studies in education, no. 7. Wellington. N.Z. Council for Educational Research, 1942.
MCQUEEN, Henry Charles. Vocational guidance in New Zealand. Wellington. N.Z. Council for Educational Research, 1940.
MCQUEEN, Henry Charles, and others. The background of guidance, Wellington. N.Z. Council for Educational Research, 1941.
MASON, Hon. Henry Greathead Rex. Education to-day and to-morrow. Wellington. Education Department, 1944.
MATHEW, Hamish Connolly. The institutional care of dependent children in New Zealand. Wellington. N.Z. Council for Educational Research, 1942.
MURDOCH, J. H. The high schools of New Zealand: a critical survey. Wellington. N.Z. Council for Educational Research, 1943.
NATIONAL EDUCATION. (Monthly.) N.Z. Educational Institute. Wellington.
NICOL, John: Technical schools of New Zealand. Wellington. N.Z. Council for Educational Research, 1940.
OLIVER, W. R. B. New Zealand museums: present establishment and future policy. Wellington. Dominion Museum, 1944.
PARKYN, G. W. Children of high intelligence. Wellington. N.Z. Council for Educational Research, 1948.
THOMPSON, A. B. Adult education in New Zealand. Wellington. N.Z. Council for Educational Research, 1945.
WEBB, Leicester Chisholm. Control of education in New Zealand. Wellington. N.Z. Council for Educational Research, 1937.
WHITE, Dorothy Neal. About books for children. Wellington. N.Z. Council for Educational Research, 1946.
WILD, Leonard John. An experiment in self-government. Wellington. N.Z. Council for Educational Research, 1938.
WINTER SOURN, Ralph. Educating backward children in New Zealand. N.Z. Council for Educational Research, 1944.
BOWEN, F. C. The flag of the Southern Cross. London. Shaw, Savill, and Albion Co., 1939.
BRETT, Henry. White wings (early shipping). Auckland. Brett, 1924–28.
EADDY, Perey Allen. Neath swaying spars. Auckland. Whitcombe and Tombs, 1939.
GARDINER, Hugh. Skyways of Maoriland. Wellington. McKenzie, Thornton, and Cooper, 1934.
HISTORY OF THE UNION STEAM SHIP COMPANY OF NEW ZEALAND, 1875–1940.
PATERSON, Campbell G. A catalogue of the stamps of New Zealand. Auckland. Pim, 1948.
PHILATELIC SOCIETY OF NEW ZEALAND. The postage stamps of New Zealand. Christ-church. Verne Collins, 1944.
VERNE COLLINS AND CO. Catalogue of the Stamps of New Zealand. Christchurch. Verne Collins, 1947.
VERNE COLLINS AND CO. A guide for collectors of the stamps of New Zealand. Christchurch. Verne Collins, 1944.
VERNE COLLINS AND CO. Illustrated and priced catalogue of the stamps of New Zealand. Christchurch. Simpson and Williams, 1931.
WATERS, Sydney D. Clipper ship to motor liner: the story of the Now Zealand Shipping Company, 1873–1939. London. New Zealand Shipping Co., 1939.
WHITE, Leo. Wingspread. The pioneering of aviation in New Zealand. Auckland. Whites Aviation Ltd., 1945.
BAKER, Sydney J. Now Zealand slang. Wellington. Whitcombe and Tombs, 1941.
NGATA, Sir Apirana Turupa. Complete manual of Maori Grammar and conversation with vocabulary, revised by W. W. Bird. Wellington. Whitcombe and Tombs, 1948.
REED'S CONCISE MAORI DICTIONARY. Maori – English, English–Maori. Proverbial sayings. Wellington. Reed, 1948.
SMYTH, Patrick. Te Reo Maori, a guide to the study of the Maori language. Auckland. Whitcombe and Tombs, 1939.
SMYTH, Patrick. Maori pronunciation and the evolution of printed Maori. Auckland. Whitcombe and Tombs, 1946.
WALL, Arnold. The mother-tongue in New Zealand. Wellington. Reed, 1936.
WALL, Arnold. New Zealand English. Auckland. Whitcombe and Tombs, 1938.
WILLIAMS, Herbert William. A dictionary of the Maori language. Wellington. Government Printer, 1932.
WILLIAMS, William Leonard. First lessons in Maori. Tenth edition. Christchurch. Whitcombe and Tombs, 1940.
ANDERSEN, Johannes Carl. Bird-song and New Zealand song-birds. Christchurch. Whitcombe and Tombs, 1926.
BUICK, Thomas Lindsay. The mystery of the moa. New Plymouth. Avery, 1931.
GUTHRIE-SMITH, William Herbert. Bird life on island and shore. Edinburgh. Blackwood, 1925.
GUTHRIE-SMITH, William Herbert. Mutton-birds and other birds. Christchurch. Whitcombe and Tombs, 1914.
GUTHRIE-SMITH, William Herbert. Sorrows and joys of a New Zealand naturalist. Dunedin. Reed, 1936.
HUDSON, George Vernon. Beetles of New Zealand. Wellington. Ferguson and Osborn, 1934.
HUDSON, George Vernon. The butterflies and moths of New Zealand. Wellington. Ferguson and Osborn, 1928.
HUTTON, Frederick Wollarton, and James Drummond. The animals of New Zealand. Fourth edition. Christchurch. Whitcombe and Tombs, 1923.
MARTIN, William. The New Zealand nature book. Fauna and flora, 2 vols. Christchurch. Whitcombe and Tombs, 1929.
MONCRIEFF, Perrine. New Zealand birds and how to identify them. Auckland. Whitcombe and Tombs, 1925.
OLIVER, Walter Reginald Brook. New Zealand birds. Wellington. Fine Arts, 1930.
OLIVER, Walter Reginald Brook. The moas of New Zealand and Australia. Wellington. Dominion Museum, 1949.
PHILLIPPS, William John. The fishes of New Zealand, vol. 1. New Plymouth. Thos. Avery, 1940.
POWELL, Arthur W. B. Native animals of New Zealand. Auckland. Auckland Institute and Museum, 1947.
SPEIGHT, Robert, and others (eds.). Natural history of Canterbury. Issued by the Philosophical Institute of Canterbury. Christchurch. Simpson and Williams, 1927.
STEAD, Edgar F. The life histories of New Zealand birds. London. Search Publishing Co., 1932.
THOMSON, George Malcolm. The naturalization of animals and plants in New Zealand. Cambridge University Press, 1922.
THOMSON, George Malcolm. Wild life in New Zealand. Wellington. Government Printer, 1921.
THOMSON, Robert P. A natural history of Australia, New Zealand, and the adjacent islands. London. Routledge, 1917.
TILLYARD, Robin John. The insects of Australia and New Zealand. Sydney. Angus and Robertson, 1926.
ALLAN, Harry Howard Barton. New Zealand trees and shrubs. Auckland. Whitcombe and Tombs, 1928.
ATKINSON, Esmond H. Phormium tenax. Wellington. Government Printer, 1922.
COCKAYNE, Leonard. The cultivation of New Zealand plants. Auckland. Whitcombe and Tombs, 1923.
COCKAYNE, Leonard. New Zealand plants and their story. Third edition. Wellington. Government Printer, 1927.
COCKAYNE, Leonard. The vegetation of New Zealand. Second edition. Leipzig. Engelmann, 1928.
COCKAYNE, Leonard, and Edward Phillips Turner. The trees of New Zealand. Wellington. Government Printer, 1944 (first ed., 1928).
DOBBIE, Herbert B. New Zealand ferns. Third edition. Wellington. Whitcombe and Tombs, 1931.
HILGENDORF, Frederick William. Weeds of New Zealand and how to eradicate them. Revised by J. W. Calder. Fourth edition. Christchurch, Auckland, &c. Whitcombe and Tombs, 1949.
LAING, Robert M., and Ellen W. Blackwell. Plants of New Zealand. Fourth edition, revised and enlarged. Christchurch. Whitcombe and Tombs, 1940.
OLIVER, Walter Reginald Brook. The genus Coprosma. Honolulu. Bishop Museum, 1935.
SIMMONDS, Joseph Henry. Trees from other lands for shelter and timber in New Zealand: eucalypts. Auckland. Brett, 1927.
WALL, A., and H. H. Allan. The botanical names of the flora of New Zealand. Auckland Whitcombe and Tombs, 1915.
COTTON, Charles Andrew. The geomorphology of New Zealand. Wellington. Government Printer, 1922.
COTTON, Charles Andrew. Landscape as developed by the processes of normal erosion. Cambridge University Press, 1941.
COTTON, Charles Andrew. Volcanoes as landscape forms. Wellington. Whitcombe and Tombs, 1944.
CUMBERLAND, K. B. Soil erosion in New Zealand. Wellington. Soil Conservation and Rivers Control Council, 1944.
MARSHALL, Patrick. The geology of New Zealand. Wellington. Government Printer, 1912.
NEW ZEALAND GEOGRAPHER. (Half-yearly.) Since 1945. Auckland. N.Z. Geographical Society.
REPORT OF THE HAWKE'S BAY EARTHQUAKE. New Zealand Department of Scientific and Industrial Research Bulletin no. 43. Wellington. Government Printer, 1933.
ADKIN, G. L. Horowhenua, its Maori place names and topographic and historical background. Wellington. Polynesian Society, 1948.
ANDERSEN, Johannes Carl. Maori music with its Polynesian background. Wellington. Polynesian Society (Memoir vol. 10), 1934.
ANDERSEN, Johannes Carl. Maori place names, also personal names, &c. Wellington. Polynesian Society (Memoir vol. 20), 1942.
ANDERSEN, Johannes Carl. Maori string figures. Board of Maori Ethnological Research (Memoir vol. 2). Wellington. Ferguson and Osborn, 1927.
BEATTIE, Herries. Moriori: the Morioris of the South Island. Dunedin. Otago Daily Times, 1941.
BEATTIE, Herries. Tikao talks: traditions and tales. Wellington. Reed, 1939.
BEATTIE, Herries. The Maoris and Fiordland. Dunedin. Otago Daily Times and Witness Newspapers, 1949.
BEST, Elsdon. Fishing methods and devices of the Maori. Dominion Museum Bulletin no. 12. Wellington. Government Printer, 1929.
BEST, Elsdon. Forest lore of the Maori. Wellington. Polynesian Society (Memoir vol. 19) and Dominion Museum Bulletin no. 14, 1942.
BEST, Elsdon. Games and past-times of the Maori. Dominion Museum Bulletin no. 8 Wellington. Government Printer, 1925.
BEST, Elsdon. The Maori, 2 vols. Wellington. Polynesian Society, 1924.
BEST, Elsdon. The Maori as he was. Wellington. Government Printer, 1925.
BEST, Elsdon. Maori storehouses and kindred structures. Dominion Museum Bulletin no. 5. Wellington. Government Printer, 1916.
BEST, Elsdon. Maori myth and religion: spiritual and mental concepts of the Maori: astronomical knowledge of the Maori: Maori division of time. Dominion Museum Monographs nos. 1–4. Wellington. Government Printer, 1922.
BEST, Elsdon. Maori mythology and religion. Dominion Museum Bulletin no. 10. Wellington. Government Printer, 1922.
BEST, Elsdon. The Maori system of agriculture. Dominion Museum Bulletin no. 9. Wellington. Government Printer, 1925.
BEST, Elsdon. The pa Maori. Dominion Museum Bulletin no. 6. Wellington. Government Printer, 1927.
BEST, Elsdon. Polynesian voyagers: Maori schools of learning. Dominion Museum Monographs nos. 5 and 6. Wellington. Government Printer, 1923.
BEST, Elsdon. Tuhoe, the children of the mist. 2 vols. Wellington. Polynesian Society, 1925.
BEST, Elsdon. The Whare Kohanga (the “nest house”) and its lore. Dominion Musuem Bulletin no. 13. Wellington. Government Printer, 1929.
BROWN, John Macmillan. Peoples and problems of the Pacific. London. Fisher Unwin, 1927.
BUCK, Sir Peter Henry. The coming of the Maori. Wellington. Maori Purposes Fund Board, 1949.
BUCK, Sir Peter Henry. The evolution of Maori clothing. Board of Maori Ethnological Research. New Plymouth. Avery, 1927.
BUCK, Sir Peter Henry. Vikings of the sunrise. New York. Stokes, 1938.
BUICK, Thomas Lindsay. The Discovery of Dinornis. New Plymouth. Avery, 1936.
BUICK, Thomas Lindsay. The moa hunters. New Plymouth. Avery, 1937.
COWAN, James. The Maori yesterday and to-day. Christchurch. Whitcombe and Tombs, 1930.
FAMOUS MAORI SONGS. Wellington. Charles Begg and Co., 1939.
FIRTH, Raymond. Primitive economics of the New Zealand Maori. London. Routledge, 1929.
GORDON, Mona Clifton. The garden of Tane. Wellington. Reed, 1944.
JOURNAL OF THE POLYNESIAN SOCIETY. Quarterly since 1892. Wellington. Index to vols. 1–50 published 1942.
KEESING, Felix Maxwell. The changing Maori. Board of Maori Ethnological Research. Memoir vol. 4. New Plymouth. Avery, 1928.
KELLY, Leslie G. Tainui: the story of Hoturoa and his descendants. Wellington. Polynesian Society, 1949.
MEEK, Ronald Lindley. Maori problems to-day. Wellington. Progressive Publishing Society, 1943.
MITCHELL, John (Jacky) Hikawera. Takitimu. Wellington. Reed, 1944.
MULGAN, Alan E. (ed.). The Maori in picture: Maori life past and present. Auckland. Whitcombe and Tombs, 1948.
OLDMAN, William O. Skilled handwork of the Maori. Wellington. Polynesian Society, 1946.
PAPAKURA, Maggie (Makereti). The old-time Maori. London. Gollanez, 1938.
PHILLIPPS, William J. Maori carving. New Plymouth. Avery, 1941.
RAMSDEN, George Eric Oakes. Sir Apirana Ngata and Maori culture. Wellington. A. H. and A. W. Reed, 1948.
REED, Alexander Wycliff. Myths and legends of Maoriland. Wellington. Reed, 1946.
ROWE, W. Page. Maori artistry. Board of Maori Ethnological Research Memoir vol. 3. New Plymouth. Avery, 1928.
SMITH, Norman W. The Maori people and us. Wellington. Maori Purposes Fund Board, 1948.
SMITH, Stephenson Percy. Hawaiki: the whence of the Maori. Christchurch. Whitcombe and Tombs, 1921.
SMITH, Stephenson Percy. Lore of the Whare Wananga, 2 vols. Polynesian Society (Memoir vols. 3 and 4). New Plymouth. Avery, 1913–15.
SUTHERLAND, Ivan Lorren George. The Maori situation. Wellington. Tombs, 1935.
SUTHERLAND, Ivan Lorren George. (ed.). The Maori people to-day: A general survey. Wellington. New Zealand Institute of International Affairs, 1940.
TAYLOR, William Anderson. Waihora: Maori associations with Lake Ellesmere. Leeston. Ellesmere Guardian, 1944.
AUSTRALIAN AND NEW ZEALAND ASSOCIATION FOR THE ADVANCEMENT OF SCIENCE. Reports of Conferences, 1887–1939. Vols. 1–24. Index to Vol. 1–16. Wellington and Sydney.
CAIRNS, David (ed.). Scientific institutions in New Zealand. Christchurch. Coulls, Somerville, Wilkie, 1949.
JENKINSON, Sidney Hartley. New-Zealanders and science. Wellington. Department of Internal Affairs, 1940.
N.Z. SCIENCE REVIEW. (Quarterly.) Wellington. New Zealand Association of Scientific Workers.
RIGG, Sir Theodore. The contribution of the Cawthron Institute to science and New Zealand agriculture, with bibliography. Nelson. Cawthron Institute, 1946.
ROYAL SOCIETY OF NEW ZEALAND (formerly New Zealand Institute). Transactions and proceedings (annual), 1869 to date. Wellington. Index to vols. 1–60.
SOUTHERN STABS. (Monthly.) Wellington. New Zealand Astronomical Society.
BLANC, Albert Damer Gibson. Money, medicine, and the masses. Wellington. A. H. and A. W. Reed, 1949.
BRYSON, Elizabeth. Learning to live. Wellington. Reed, 1938.
FULTON, Robert. Medical practice in Otago and Southland in the early days. Dunedin. Otago Daily Times, 1922.
MACLEAN, Hester. Nursing in New Zealand: history and reminiscences. Wellington. Tolan, 1932.
MORRIS, Selwyn Bentham. Hospital reform in New Zealand by Selwyn Morris and Douglas Robb. Auckland. Whitcombe and Tombs, 1949.
N.Z. DEPARTMENT OF HEALTH. Annual report, centennial number. Historical account of development of public health and hospital systems in New Zealand. Wellington. Government Printer, 1939.
N.Z. MEDICAL JOURNAL. (Quarterly since 1887.) British Medical Association of New Zealand, Wellington.
ROBB, George Douglas. Health reform in New Zealand. Auckland. Whitcombe and Tombs, 1947.
ROBB, George Douglas. Medicine and health in New Zealand. Auckland. Whitcombe and Tombs, 1940.
SKINNER, William Henry and H. B. Leatham. Pioneer medical men of Taranaki, 1834–80. New Plymouth. Avery, 1933.
SMITH, George McColl. Medical advice from a backblock hospital. Christchurch. Caxton Press, 1942.
SMITH, George McColl. Notes from a backblock hospital. Christchurch. Caxton Press, 1938.
ALLEY, G. T., and D. O.W.Hall. The farmer in New Zealand. Wellington. Department of Internal Affairs.
BELSHAW, Horace, and others. Agricultural organization in New Zealand. Melbourne University Press, 1936. (Institute of Pacific Relations.)
BRUCE, J. Arthur. Nature's heat resources: their post-war utilization in thermal regions. Dunedin. Privately printed by John McIndoe, 1943.
BUCHANAN, R. D. The pastoral industries of New Zealand. London. Philip Allan, 1935.
COPLAND, Douglas Berry. Wheat production in New Zealand. Auckland. Whitcombe and Tombs, 1920.
CROUCHER, William John. My friend the pig. Levin. Kerslake and Billens, 1942.
CUNNINGHAM, Gordon Herriott. Fungous diseases of fruit trees in New Zealand. Auckland. New Zealand Fruit-growers' Federation, 1925.
DUNCAN, George Andrew. The, New Zealand daily industry. Palmerston North. Young, 1933.
HAMILTON, W. M. The dairy industry in New Zealand. Wellington. Council of Scientific and Industrial Research, 1945.
HILGENDORF, Frederick William. Pasture plants and pastures of New Zealand. Christchurch. Whitcombe and Tombs, 1932.
HILGENDORF, Frederick William. Wheat in New Zealand. Christchurch. Whitcombe and Tombs, 1939.
LESLIE, Allan. Diseases of breeding ewes. Wellington. Whitcombe and Tombs, 1938.
MCKAY, Richard Alexander (ed.). A history of printing in New Zealand, 1830–1940. Wellington Club of Printing House Craftsmen, 1940.
MATTHEWS, James William. The New Zealand garden dictionary. Wellington. Reed, 1943.
MATTHEWS, James William. Soil fertility: basis of healthy living. Wellington. Reed, 1943.
NEW ZEALAND DEPARTMENT OF SCIENTIFIC AND INDUSTRIAL RESEARCH. Scientific and industrial research, 1927–38. Wellington. Government Printer, 1938.
NEW ZEALAND JOURNAL OF AGRICULTURE. (Monthly.) Wellington. Department of Agriculture.
NEW ZEALAND JOURNAL OF SCIENCE AND TECHNOLOGY. (Monthly.) Wellington. Department of Scientific and Industrial Research.
PHILPOTT, Harold G. A history of the New Zealand dairy industry. Wellington. Government Printer, 1937.
ROWLEY, Fortescue William. The industrial situation in New Zealand. Wellington. Tombs, 1931.
SHEEPFARMING ANNUAL … including the proceedings of the … annual meeting of sheepfarmers … v. 1. no. 1. Palmerston North. Massey Agricultural College, 1949.
SMITH, W. Millar. The marketing of Australian and New Zealand primary products. London. Pitman, 1936.
STATE FOREST SERVICE. Pulping and paper-making properties of selected New Zealand woods. Wellington. Government Printer (parliamentary paper), 1928.
STEVENS, Pereival G. W. Sheep breeding in New Zealand. The ram breeding flocks. Christchurch. Simpson and Williams, 1948.
VAILE, Edward Earle. Pioneering the pumice. Christchurch. Whitcombe and Tombs, 1939.
WISE, II. L. Tobacco growing and manufacture in Now Zealand. Wellington. Department of Industries and Commerce, 1945.
ALLEY, Geoffrey Thomas. With the British Rugby team in New Zealand, 1930. Christchurch. Simpson and Williams, 1935.
THE ARTS IN NEW ZEALAND. (Quarterly 1928–1946.) Wellington. Tombs.
COSTON, H. E. Towner. Speckled nomads: a tale of trout in two rivers. London. Faber and Faber, 1938.
DONNE, Thomas Edward. The game animals of New Zealand. London. Murray, 1924.
DONNE, Thomas Edward. Rod-fishing in New Zealand waters. London. Seeley Service, 1927.
GREY, Zane. Tales of the angler's eldorado, New Zealand. London. Hodder and Stoughton, 1926.
HINTZ, O. S. The New-Zealanders in England. London. Dent, 1931.
HODGKINS, Frances…. Frances Hodgkins. Harmondsworth, Middlesex. Penguin books, 1948.
NATIONAL CENTENNIAL EXHIBITION OF NEW ZEALAND ART. Catalogue. Wellington. Department of Internal Affairs, 1940.
NEW ZEALAND ALPINE JOURNAL. (Annual since 1892.)
NEW ZEALAND TURF REGISTER. Annual. Christchurch. Clark.
NICHOLLS, Mark F. With the All Blacks in Springbokland, 1928.
OLIVER, Charles Joshua, and E. W. Tindill. The tour of the third All Blacks, 1935. Wellington. Wright and Carman, 1936.
REESE, Thomas W. New Zealand cricket, 1914–33. Christchurch. Whitcombe and Tombs, 1936.
SUTHERLAND, E. G. New Zealand turf: historical review. Auckland. Newmarket Printing House, 1945.
SWAN, Arthur C. History of New Zealand rugby football 1870–1945. Wellington. New Zealand Rugby Football Union, 1948.
THEY played for New Zealand. A complete record of New Zealand rugby representatives, 1884–1947. Wellington. Sporting publications, 1947.
TOMBS, Harry H. (ed.). A century of art in Otago. Wellington. Tombs, 1948.
YEAR-BOOK OF THE ARTS IN NEW ZEALAND. Annually from 1945. Wellington. Tombs.
GORDON, Ian Alistair. John Skelton, poet laureate. Melbourne University Press. Oxford University Press, 1943.
LADY NEWALL'S NEW ZEALAND GIFT BOOK. Wellington. P.E.N. (New Zealand Centre), 1943.
MCCORMICK, Eric Hall. Letters and art in New Zealand. Wellington. Department of Internal Affairs, 1940.
REED, Alexander W. The author publisher relationship. Wellington. Reed for P.E.N., 1946.
SMITH, Elizabeth Maisie. A history of New Zealand fiction from 1862. With a bibliography. Wellington. Reed, 1939.
VON HAAST, Heinrich Ferdinand. John Macmillan Brown lectures, 1943. Wellington. University of New Zealand, 1943.
ALEXANDER, William Frederick, and Archibald Ernest Currie, (eds.). Treasury of New Zealand verse: new edition. Auckland. Whitecombe and Tombs, 1926.
ANDERSEN, Johannes Carl. The elfin dell. Wellington. Reed, 1934.
BARKER, Arthur. Twelve echoes from France. Wellington. Progressive Publishing Society, 1943.
BAXTER, James K. Blow, wind of fruitfulness. Christchurch. Caxton, 1948.
BRASH, Charles. Disputed ground: poems 1939–45. Christchurch. Caxton, 1948.
BROOKFIELD, Helen. The fugitives. Poems. Auckland. Whitcombe and Tombs, 1939.
CAMPBELL, J. Finlay. The postscripts of Crowbar (pseud.). Christchurch. Whitcombe and Tombs, 1943.
CARR, Clyde. Poems. Wellington. The Progressive Publishing Co., 1941.
CHAMBERLIN, Thomas Chamberlin. Songs of the forests of Tane. Wellington. Fine Arts, 1931.
COLLEY, Isobel Bain. Verses for juniors. Wellington. Tombs, 1943.
CONNELLY, Merval Hannah. Twelve poems. Wellington. Tombs, 1943.
CURNOW, Thomas Allen Monro. A book of New Zealand verse, 1923–45. Christchurch. Caxton Press, 1945.
CURNOW, Thomas Allen Monro. Island and time. Christchurch. Caxton Press, 1941.
CURNOW, Thomas Allen Monro. Verses by Whim-Wham (pseud.). Wellington. Progressive Publishing Society, 1943.
DONALD, Lawrence. Toward the dawn. Auckland. Wilson and Horton, 1943.
DOWLING, Basil. A day's journey. Christchurch. Caxton Press, 1941.
DUGGAN, Eileen. Poems. London. Allen and Unwin, 1937.
DUGGAN, Eileen. New Zealand Poems. London. Allen and Unwin, 1940.
ELMSLIE, Helen. Inspiration. Whitcombe and Tombs, 1943.
FAIRBURN, A. R. D. Dominion. Christchurch. Caxton Press, 1938.
FAIRBURN, A. R. D. Dominion. How to ride a bicycle in seventeen lovely colours. Auckland. Pelorus Press, 1946.
FAIRBURN, A. R. D. Dominion. Poems, 1929–41. Christchurch. Caxton Press, 1943.
GLOVER, Dennis. Summer flowers. Christchurch. Caxton Press, 1946.
HANGER, Paula. Three fronts of war and other poems. Wellington. Handcraft Press, 1943.
HARVEY, John Russell. Man on a raft. Christchurch. Caxton Press, 1949.
HARVEY, John Russell. New poems. Christchurch. Caxton Press, 1942.
HARVEY, John Russell. Selected poems. Christchurch. Caxton Press, 1940.
HAYES, Evelyn. Day and night. Christchurch. Caxton Press, 1939.
HOGGARD, Noel Fart. Flametide: poems by various authors. Wellington. Handcraft Press, 1943.
MACKAY, Jessie. Vigil. Christchurch. Whitcombe and Tombs, 1935.
MANSFIELD, Katherine (pseud. of Kathleen Beauehamp). Poems. London. Constable, 1930.
MARRIS, Charles Allan. Lyric Poems, 1928–42, chosen by C. A. Marris. Wellington. Tombs, 1942.
MARRIS, Charles Allan. (ed.). New Zealand best poems. (Annual since 1932.) Wellington. Tombs.
MASON, R. A. K. This dark will lighten. Christchurch. Caxton Press, 1941.
MILLS, Tom L. (ed.). Verse by New Zealand children. Wellington. Progressive Publishing Society, 1943.
MULGAN, Alan Edward. Aldebaran and other verses. Christchurch. Caxton Press, 1937.
MULGAN, Alan Edward. Golden wedding. London. Dent, 1932.
PERRY, Charles Stuart. The litany of beauty. Wellington. Ferguson and Osborn, 1934.
POPE, C. Quentin (ed.). Kowhai gold: an anthology of contemporary New Zealand verse. London. Dent, 1930.
RHODES, H. Winston, and Denis Glover (eds.). Verse alive. Christchurch. Caxton Press, 1936. Second series, 1937.
RICHMOND. Mary Elizabeth. Yet we believe. Wellington. Reed, 1942.
SOLWAY, Robert. Wartime journey. Wellington. Stewart and Lawrence, 1943.
STEWART, Douglas. Sonnets to the unknown soldier. Sydney. Angus and Robertson, 1941.
STEWART, Douglas. The dosser in springtime. Sydney, Angus and Robertson, 1946.
STEWART, Douglas. The white cry. London. Dent, 1939.
VOGT, Anton. Poems for a war. Wellington. Progressive Publishing Society, 1943.
WALL, Arnold. About our birds. Wellington. Whitcombe and Tombs, 1943.
WALL, Arnold. The pioneers and other poems. Wellington. Reed, 1948.
WALL, Arnold. Theme and variations. Auckland. Whitcombe and Tombs, 1937.
WRIGHT, David McKee. Station ballads and other verses. Edited by R. Solway. Auckland. Lee, 1945.
ACHESON, Frank Oswald Victor. Plume of the Arawas. Christchurch. Whitcombe and Tombs, 1938.
ALLEN, Charles Richards (ed.). Tales by New Zealanders. London. British Authors' Press, 1938.
ALLEN, Charles Richards (ed.). The poor scholar. Dunedin. Reed, 1936.
ANDREWS, Isobel. Something to tell. Wellington. Progressive Publishing Society, 1944.
BALLANTYNE, David Watt. The Cunninghams. New York. Vanguard press, 1948.
BRODIE, John. The little country, by John Guthrie (pseud.). London. Nelson, 1935.
BURDON, Randal Matthews. Outlaw's progress. Wellington. Progressive Publishing Society, 1943.
COWAN, James. Hero stories of New Zealand. Wellington. Tombs, 1935.
COWAN, James. Tales of the Maori border. Wellington. Reed, 1944.
COWAN, James. Tales of the Maori bush. Wellington. Reed, 1934.
COWAN, James. Tales of the Maori coast. New Plymouth. Avery, 1930.
DAVIS, Dan. The cliffs of Fall. London. Nicholson and Watson, 1945.
DAVIS, Dan. For the rest of our lives. London and Brussels. Nicholson and Watson, 1947.
DAVIS, Dan. The gorse blooms pale. London and Brussels. Nicholson and Watson, 1947.
DAVIS, Dan. Roads from home. London. Michael Joseph, 1949.
GILLESPIE, Oliver Noel (ed.). New Zealand short stories. London. Dent, 1932.
GURNEY, Elizabeth. Pageant from the foothills. Auckland. Oswald-Sealy, 1943.
HOLCROFT, Montague Harry. Beyond the breakers. London. John Long, 1928.
HOLCROFT, Montague Harry. Brazilian daughter. London. John Long, 1931.
LAWLOR, Patrick A. The house of Templemore. Wellington. Reed, 1938.
LEE, John Alexander. Children of the poor. London. Werner Laurie, 1934.
LEE, John Alexander. Civilian into soldier. London. Werner Laurie, 1937.
LEE, John Alexander. Shining with the shiner. Hamilton. Mead, 1944.
(LYTTELTON, Edith.) Promenade by G. B. Lancaster (pseud.). Sydney. Angus and Robertson, 1938.
MCDONALD, Georgina. Grand hills for sheep. Wellington. Whitcombe and Tombs, 1949.
MANDER, Jane. The Story of a New Zealand river. Second edition. Wellington. Whitcombe and Tombs, 1938.
MANSFIELD, Katherine (pseud. of Katherine Beauchamp). Short stories (collected). New York. Knopf, 1937.
MARSH, Ngaio. Colour scheme. London. Crime Club, 1943.
MARSH, Ngaio. Artists in crime. London. Bles, 1938.
MARSH, Ngaio. Died in the wool. London. Collins, 1945.
MARSH, Ngaio, and H. Jellett. Nursing home murder. London. Bles, 1935.
MCCARTHY, Beryl. Castles in the soil. Dunedin. Reed, 1939.
MORICE, Stella. The book of Wiremu. Wellington. Progressive Publishing Society, 1944.
MULGAN, Alan Edward. Spur of morning. London. Dent, 1934.
MULGAN, John Alan Edward. Man alone. Second edition. Wellington. Whitcombe and Tombs, 1949.
PEACOCKE, Isabel Maude. April, May, June. London. Ward Lock, 1943.
BEES, Rosemary. Heather of the south. London. Jenkins, 1924.
SARGESON, Frank. A man and his wife. Christ-church. Caxton Press, 1940.
SARGESON, Frank. That summer. London. Lehman, 1946.
SATCHELL, William B. The greenstone door. Second edition. Wellington. Whitcombe and Tombs, 1935. (first ed., 1914).
SCANLAN, Nelle M. Pencarrow. London. Jarrolds, 1935.
SCANLAN, Nelle M. Pencarrow. Tides of youth. London. Jarrolds, 1935.
SCANLAN, Nelle M. Pencarrow. Winds of heaven. London. Jarrolds, 1935.
SCANLAN, Nelle M. Pencarrow. Kelly Pencarrow. London. Hale, 1939.
WEST, Joyce M. Sheep-kings. Wellington. Tombs, 1937.
WHITE, John. Revenge, a love tale of the Mount Eden tribe. Edited by A. W. Reed. Wellington. Reed, 1940.
(WILKINSON, Iris Guiver.) Check to your king, by Robin Hyde (pseud.). London. Hurst and Blackett, 1936. (A life of Charles, Baron de Thierry, in the form of a novel.)
(WILKINSON, Iris Guiver.) The godwits fly, by Robin Hyde (pseud.). London. Hurst and Blackett, 1939.
(WILKINSON, Iris Guiver.) Nor the years condemn, by Robin Hyde (pseud.). London. Hurst and Blackett, 1938.
WILSON, Helen M. Moonshine, a story of the eighties. Wellington. Reed, 1944.
BUICK, Thomas Lindsay (ed.). Ideals of nationhood: a selection of addresses delivered in New Zealand by the Right Hon. Lord Bledisloe. New Plymouth. Avery, 1935. Second edition, 1939.
COMBS, Frank Livingstone. The harrowed toad. London. Dent, 1939.
FAIRBURN, Alan Rex Dugard. We New Zealanders: an informal essay. Progressive Publishing Society, 1944.
HOLCROFT, Montague Harry. The deepening stream. Cultural influences in New Zealand. Christchurch. Caxton Press, 1940.
— Timeless world. Wellington. Progressive Publishing Society, 1945.
— The waiting hills. Wellington. Progressive Publishing Society, 1943.
MULGAN, Alan Edward. First with the sun. London. Dent, 1939.
SCHRODER, John Henry Eric. Remembering things. Christchurch. Whitcombe and Tombs. London. Dent, 1938.
SEWELL, Arthur. Katherine Mansfield: a critical essay. Auckland. Unicorn Press, 1936.
— (ed.), 1840 and after: essays. Auckland University College, 1940.
SINCLAIRE, Frederick. Lend me your years. Wellington. Progressive Publishing Society, 1943.
ANDREWS, Isobel. The willing horse. Wellington. Progressive Publishing Society, 1943.
BRADWELL, Eric. Four one-act plays. London. Allen and Unwin, 1935.
LLOYD, Victor Stanton (ed.). Seven one-act plays, 1933. Seven one-act plays, 1934. Six one-act plays, 1935. Six further one-act plays, 1935. Wellington. Radio Publishing Co.
MULGAN, Alan Edward. Three plays of New Zealand. Auckland. Whitcombe and Tombs, 1922.
STEWART, Douglas. Ned Kelly: a play, by Douglas Stewart. Sydney. Angus and Robertson, 1943.
ANDERSEN, Johannes Carl. Place names in New Zealand. New Plymouth. Avery (New Zealand Geographic Board publication), 1934.
— Place names of Banks Peninsula. Wellington. Government Printer, 1927.
BAUKE, William. Where the white man treads. New edition. Auckland. Wilson and Horton, 1928.
BEAGLEHOLE, John Cawte. Exploration of the Pacific. Oxford University Press, 1935.
—The discovery of New Zealand. Wellington. Department of Internal Affairs, 1939.
BEATTIE, James Herries. Otago place names as bestowed by the pakeha. Dunedin. Otago Daily Times, 1948.
COAD, Nellie Euphemia. Geography of the Pacific. Wellington. N.Z. Book Depot, 1926.
COWAN, James. Travel in New Zealand, 2 vols. Christchurch. Whitcombe and Tombs, 1926.
COWIE, Donald. New Zealand from within. Wellington. Whitcombe and Tombs, 1937.
DU FAUR, Freda. The conquest of Mount Cook. Second edition. London. Allen and Unwin, 1936.
GILKISON, Walter Scott. Peaks, packs, and mountain tracks. Auckland. Whitcombe and Tombs, 1940.
GUTHRIE-SMITH, William Herbert. Tutira: the story of a New Zealand sheep-station. London. Blackwood, 1921. Second edition, 1926.
HARROP, Angus John. Touring in New Zealand. London. Allen and Unwin, 1935.
— My New Zealand. London. Jarrolds, 1939.
HERBERT, Arthur Stanley. The hot springs of New Zealand. London. Lewis, 1921.
MCCLYMONT, William Graham. The exploration of New Zealand. Wellington. Department of Internal Affairs, 1946.
MACKENZIE, Florence A. P. The sparkling waters of Whakatipua. Wellington. Reed, 1948.
MANING, Frederick Edward. Old New Zealand, by a pakeha Maori. Christchurch. Whitcombe and Tombs (reprint), 1930.
MARSH, Ngaio, and R. M. Burdon. New Zealand. London. Collins, 1942.
MULGAN, Alan Edward. A pilgrim's way in New Zealand. Oxford University Press, 1935.
MULGAN, John A. E. Report on experience. Oxford University Press, 1947.
NEWTON, Peter. High country days. Wellington. Reed, 1949.
NEW ZEALAND. Index of every place in New Zealand. Tenth edition. Dunedin. Wise, 1948.
ODELL, Robert Sydney. Handbook of Arthur's Pass national park. Wellington. Whitcombe and Tombs, 1935.
OXFORD SURVEY OF THE BRITISH EMPIRE. Australasian territories. (Vol. 5.) London. Oxford University Press, 1914.
PASCOE, John Dobree. Unclimbed New Zealand. London. Allen and Unwin, 1939.
POSPISIL, Bohumil. Wandering on the islands of wonders. Dunedin. Coulls, Somerville, Wilkie, 1935.
REES, Rosemary. New Zealand holiday. London. Chapman and Hall, 1933.
REEVES, William Pember. The Long White cloud (Aotearoa). Third edition, augmented by C. J. Wray. London. Allen and Unwin, 1924.
— New Zealand. Illustrations by F. and W. Wright. Second edition. London. Black, 1927.
REISCHEK, Andreas. Yesterdays in Maoriland: New Zealand in the eighties. Translated and edited by H. E. L. Priday. London. Cape, 1930.
ROBERTS, Thomas Edward Lloyd. Beyond the hills of Hundalee. Christchurch. The Author, 1949.
SMITH, Fanny Louise Irvine. The streets of my city. Wellington. Reed, 1948.
TURNER, Samuel. The Conquest of the New Zealand Alps. London. Fisher Unwin, 1922.
BASTINGS, Lyndon (ed.). Directory of New Zealand scientists. Wellington. Whitcombe and Tombs, 1948.
BOLITHO, Henry Hector, and John Alan Edward Mulgan. The emigrants. London. Selwyn and Blount, 1939.
BURDON, R. M. New Zealand notables: Henry Williams, Te Whiti, Johnny Jones. Christchurch. Caxton Press, 1941.
— Series two. (Truby King, J. MeKenzie, W. Empsom, R. Fitzsimmons, J. G. G. Grant.) Caxton Press, 1945.
COWAN, James. Pictures of old New Zealand: the Partridge collection of Maori paintings by Gottfried Lindauer. Christchurch. Whitcombe and Tombs, 1930.
ELDER, John Rawson. The pioneer explorers of New Zealand. London. Blackie, 1929.
SCHOLEFIELD, Guy Hardy (ed.). Who's who in New Zealand and the Western Pacific. Fourth edition. Wellington. Watkins, 1941.
— A dictionary of New Zealand biography, 2 vols. Wellington. Department of Internal Affairs, 1940.
— Notable New Zealand statesmen: twelve prime ministers. Wellington. Whitcombe and Tombs, 1946.
WHITE'S air directory, or who's who in New Zealand aviation. Auckland, Whites Aviation, 1947.
(WILKINSON, Iris Guiver.) Journalese by Robin Hyde (pseud.). Auckland. National Printing, 1934.
WISE'S NEW ZEALAND post office directory. (Usually annual.) Dunedin. Wise.
ALPERS, Oscar Thorwald Johan. Cheerful yesterdays. London. Murray, 1928.
(AYSON, William S.): Thomas … (the life of the late Thomas Ayson), by “Genus” (pseud.). Sydney. Halstead Press, 1937.
BAGNELL, Austin G., and G. C. Petersen. William Colenso, printer, missionary, botanist, explorer, politician: his life and journeys. Wellington. Reed, 1948.
BAKER, John Holland. A surveyor in New Zealand, 1857–96. Auckland. Whitcombe and Tombs, 1932.
BATTEN, Jean. My life. London. Harrap, 1938.
BROWN, Annie Earncliff. The farmer's wife: a country woman's calendar. Auckland. Whitcombe and Tombs, 1939.
BUTLER, John. Earliest New Zealand: the journals and correspondence of the Rev. John Butler. Compiled by R. J. Barton. Masterton. Palamontain and Petherick, 1927.
CARLETON, Hugh. Life of Henry Williams, revised by Sir James Elliott. Wellington. Reed, 1948.
CLARKE, Isabel Constance. Katherine Mansfield: a biography. Introduction by P. A. Lawlor. Wellington. The Beltane Book Bureau, 1944.
COWAN, Sir James. Sir Donald McLean: the story of a New Zealand statesman. Wellington. Reed, 1940.
CRESSWELL, Walter D'Arey. Present without leave. London. Cassell, 1939.
CRUICKSHANK, George. Robert Graham, 1820–85, an Auckland pioneer. Wellington. Reed, 1940.
DON, Alexander. Memories of the golden road; a history of the Presbyterian Church in Central Otago. Dunedin. Reed, 1936.
ECCLES, Alfred and A. H. Reed. John Jones of Otago. Wellington. Reed, 1949.
ELDER, John Rawson. Samuel Marsden and his lieutenants. Dunedin. Reed, 1934.
ELLIOT, Sir James. Firth of Wellington. Whitcombe and Tombs, 1937.
EVE, Arthur Stewart. Rutherford, being the life and letters of the Right Hon. Lord Rutherford, O.M. Cambridge University Press, 1939.
FODEN, Norman Arthur. James Stephen, architect of empire. Wellington. New Zealand Historical Bulletin no. 1, 1938.
GODLEY, Charlotte. Letters from early New Zealand. (Printed in England, 1936, for private circulation, but available in the Turnbull and other large libraries of New Zealand.)
GRACE, Thomas Samuel. A pioneer missionary among the Maoris, 1850–79, being letters and journals of Thomas Samuel Grace. Edited by S. J. Brittan, G. F., C. W., and A. V. Grace. Palmerston North. Bennett, 1928.
HALL, Thomas Donald Horn. Captain Joseph Nias and the Treaty of Waitangi. Wellington. Watkins, 1938.
HALL-JONES, Frederick George. King of the Bluff: the life and times of Tuhawaiki (“Bloody Jack”). Invercargill. Southland Historical Committee, 1943.
HARCOURT, Melville. A parson in prison: a biography of the Rev. George Edgar Moreton. Auckland. Whitcombe and Tombs, 1942.
HARROP, Angus John. The amazing career of Edward Gibbon Wakefield. London. Allen and Unwin, 1928.
HAYWARD, Henry John. Here's to life!: the impressions, expressions, and garnered thoughts of a free-minded showman. Auckland. Oswald Sealey, 1944.
JOHNSTONE, Samuel Martin. Samuel Marsden. Sydney. Angus and Robertson, 1932.
KENWAY, Philip T. Pioneering in Poverty Bay (New Zealand). London. Murray, 1928.
KOHERE, Reweti. The story of a Maori chief (Mokena Kohere). Wellington. Reed, 1949.
MACDONALD, Sheila. The member for Mount Ida (Scobie Mackenzie). Wellington. Ferguson and Osborn, 1938.
MANNERING, George Edward. Eighty years in New Zealand. Christchurch. Simpson and Williams, 1943.
MANTZ, Ruth E., and J. Middleton Murry. The life of Katherine Mansfield. London. Constable, 1933.
MARSDEN, Samuel. Letters and journals. Edited by J. R. Elder. Dunedin. Coulls, Somerville, Wilkie, 1932.
MATHEW, Felton. The founding of New Zealand: The journals of Felton Mathew, first Surveyor-General. Edited by J. Rutherford. Auckland University College, 1940.
MEREDITH, George Llewellyn. Adventuring in Maoriland in the seventies. Sydney. Angus and Robertson, 1934.
MERRINGTON, Ernest Northcroft. A great colonizer, the Rev. Dr. Thomas Burns. Dunedin. Otago Daily Times, 1929.
MOORE, John L. (ed.). Artist and botanist: the life and work of Esmond Atkinson. Wellington. Reed, 1947.
MURRY, J. Middleton (ed.). The letters of Katherine Mansfield, 2 vols. London. Constable, 1928.
O'CONNOR, Irma. Edward Gibbon Wakefield. London. Selwyn and Blount, 1929.
PEARSON, Henry Greenberg. Richard Cockburn Maclaurin. New York. Macmillan, 1937.
RAMSDEN, Eric. Busby of Waitangi. Wellington. Reed, 1942.
REED, Alfred Hamish (ed.). Early Maoriland adventures of J. W. Stack. Dunedin. Reed, 1935.
— More Maoriland adventures of J. W. Stack. Dunedin. Reed, 1936.
ROBERTS, Vernon. Kohi Kohinga: reminiscences and reflections of “Ropata.” Wellington. Whitcombe and Tombs, 1929.
SCHOLEFIELD, Guy Hardy. The life of William Hobson. Oxford University Press, 1924.
SKINNER, William H. Reminiscences of a Taranaki surveyor. New Plymouth. Avery, 1946.
SMITH, Edmund. Early adventures in Otago. Dunedin, Coulls, Somerville, Wilkie, 1940.
STEWART, William Downie. The Right Hon. Sir Francis Bell: his life and times. Wellington. Butterworth, 1937.
— Rolleston, a New Zealand statesman. Christchurch. Whitcombe and Tombs, 1910.
THORNTON, Mrs. Elinor. Reminiscences. Auckland. Wright and Jaques, 1943.
VON HAAST, Heinrich F. The life and times of Sir Julius von Haast … explorer, geologist, museum builder. Wellington. The Author, 1948.
WARBRICK, Alfred. Adventures in Geyserland. Dunedin. Reed, 1934.
WILLIAMS, Frederick Wanklyn. Through ninety years: notes on the lives of William and William Leonard Williams. Auckland. Whitcombe and Tombs, 1939.
WILY, Henry Evan R. L., and Herbert Maunsell. Robert Maunsell, a New Zealand pioneer. Dunedin. Reed, 1938.
WOODHOUSE, Airini Elizabeth. George Rhodes of the Levels and his brothers. Christchurch. Whitcombe and Tombs, 1937.
BEAGLEHOLE, John Cawte. The discovery of New Zealand. Wellington. Department of Internal Affairs, 1939.
— New Zealand: a short history. London. Allen and Unwin, 1936.
— and others. New Zealand and the Statute of Westminster. Wellington. Victoria University College, 1944.
CARTER, Ronald Frederic Vivian. Little ships: the story of the birth and growth of New Zealand's yachting fleet from the earliest recorded events to the year 1940, revised and enlarged. Wellington. Reed, 1948.
CENTENNIAL NEWS nos. 1–15. August, 1939, to February, 1941. Wellington. Department of Internal Affairs.
CONDLIFEE, John Bell. New Zealand in the making. London. Allen and Unwin, 1930.
— and W. T. G. Airey: Short history of New Zealand. Sixth edition. Wellington. Whitcombe and Tombs, 1938.
COWAN, James. The New Zealand wars: a history of the Maori campaigns and the pioneering period. Vol. 1, 1845–64. Vol. 2, 1864–72. Wellington. Government Printer, 1922–23.
— Settlers and pioneers. Wellington. Department of Internal Affairs, 1940.
HISTORICAL STUDIES. Australia and New Zealand. (Twice yearly since 1940.) Melbourne University Press.
MAKING NEW ZEALAND. Pictorial surveys of a century, 2 vols. Wellington. Department of Internal Affairs, 1940.
MORRELL, William Parker. Britain and New Zealand. London. Longmans, Green, 1944.
— New Zealand. London. Benn, 1935.
NEW ZEALAND FARMERS' UNION, WOMEN'S DIVISION. Brave days. Pioneer women of New Zealand. Dunedin. Reed, 1939.
REED, Alfred H. The story of New Zealand. Wellington. Reed, 1945.
SHRIMPTON, Arnold Wilfred, and Alan Edward Mulgan. Maori and pakeha: a history of New Zealand. Christchurch. Whitcombe and Tombs, 1921.
SIMPSON, Helen Macdonald. The women of New Zealand. Wellington. Department of Internal Affairs, 1940.
SWEETMAN, Edward. The unsigned New Zealand Treaty. Melbourne. Arrow Printery, 1939.
WOODHOUSE, Airini Elizabeth (ed.). Tales of pioneer women collected by the Women's Institutes of New Zealand. Auckland. Whitcombe and Tombs, 1940.
ACLAND, Leopold G. D. The early Canterbury runs … first, second and third series. Christchurch. Whitcombe and Tombs, 1947.
AKAROA AND BANKS PENINSULA, 1840–1940. Akaroa. Akaroa Mail Co., 1940.
ANDERSEN, Johannes Carl. Jubilee history of South Canterbury. Christchurch. Whitcombe and Tombs, 1916.
BANNISTER, Charles. Early history of the Wairarapa (Masterton), 1940. (No imprint.)
BARR, John, and George Graham. The city of Auckland, New Zealand, 1840–1920. Auckland. Whitcombe and Tombs, 1922.
BEAGLEHOLE, John Cawte. Captain Hobson and the New Zealand Company: a study in colonial administration. Northampton, Mass. Smith College studies in history, 1928.
— and others. Abel Janszoon Tasman and the discovery of New Zealand. Wellington. Department of Internal Affairs, 1942.
BOWMAN, Harold Otto. Port Chalmers, gateway to Otago. Dunedin. Otago Centennial Committee, 1948.
BROWN, John. Ashburton, its pioneers and its history. Dunedin. Reed, 1940.
BUICK, Thomas Lindsay. The French at Akaroa. Wellington. Government Printer, 1928.
— New Zealand's first war. Wellington. Board of Maori Ethnological Research, 1926.
— The Treaty of Waitangi. Third edition. New Plymouth. Avery, 1936.
— Waitangi ninety-four years after. New Plymouth. Avery, 1934.
BURDON, Randall M. High country: the evolution of a New Zealand sheep-station. Auckland. Whitcombe and Tombs, 1938.
BUTLER, Frederick Burdett. Early days, Taranaki. New Plymouth. Taranaki Herald, 1942.
CAMBRIDGE HISTORY OF THE BRITISH EMPIRE. Vol 7. Part 2, New Zealand. Cambridge University Press, 1933.
CHAPPLE, Leonard James Bancroft, and H. C. Veitch. Wanganui. Wanganui Historical Committee, 1939.
FARIS, Irwin. Charleston (Nelson Province, New Zealand). Wellington. Reed, 1941.
FEATON, John. The Waikato war, together with some account of Te Kooti Rikirangi. Auckland. Brett, 1923.
FIELD, Arthur Nelson. Nelson Province, 1842–1942. Nelson. Betts, 1942.
GERARD, E. Stephen. Strait of adventure. Wellington. Reed, 1938. (Cook Strait.)
GIFFORD, William Henry, and H. Bradney Williams. A centennial history of Tauranga. Wellington. Reed, 1940.
GILKISON, Robert. Early days in Central Otago. Dunedin. Otago Daily Times, 1930.
— Early days in Dunedin. Dunedin. Whitcombe and Tombs, 1938.
GRAY, Arthur James. An Ulster plantation: the story of the Kati Kati settlement. Dunedin. Reed, 1938.
HALL-JONES, Frederick George. Historical Southland. Invercargill. Southland Historical Committee, 1945.
— Kelly of Inverkelly: the story of settlement in Southland, 1824–60. Southland Historical Committee, 1944.
HANCOCK, Kenneth R. New Zealand at war. Wellington. Reed, 1948.
HARCOURT, Melville. The day before yesterday: a short history of the Bay of Islands. Dunedin. Reed, 1940.
HARROP, Angus John. England and the Maori wars. London. New Zealand News, 1937.
HOWARD, Basil. Rakiura, a history of Stewart Island. Dunedin. Reed, 1940.
HURST, Maurice. Music and the stage in New Zealand: a century of entertainment, 1840–1943. Auckland. Charles Begg, 1944.
INGRAM, Charles W. N., and P. O. Wheatley. Shipwrecks: New Zealand disasters, 1795–1936. Dunedin. Book Publishing Association, 1936.
LORD, Edward Iveagh. Old Westland: a story of the golden West Coast of the South Island of New Zealand. Christchurch. Whitcombe and Tombs, 1939.
LOVELL-SMITH, Edgar Macleod. Old coaching days in Otago and Southland. Christchurch. Lovell-Smith and Vennier, 1931.
LOWER HUTT BOROUGH COUNCIL. Lower Hutt, past and present. Lower Hutt. Hutt News Printing and Publishing Co., 1941.
MACDONALD, Colin A. Pages from the past. Blenheim. Duckworth, 1933.
MCDONALD, Kenneth Cornwell. History of North Otago. Oamaru. Oamaru Mail, 1940.
MCDONALD, Rod. Te Hekenga: early days in Horowhenua. Compiled by E. O'Donnell. Palmerston North. Bennett, 1929.
MCINTOSH, Alistair Donald. Marlborough: a provincial history. Blenheim. Marlborough Provincial Historical Committee, 1940.
MCKENZIE, Norman R. The Gael fares forth. Wellington. Whitcombe and Tombs, 1935. Second edition, 1942.
MCLAREN, Fergus Blair. The Auckland Islands: their eventful history … with an introduction by Angus Ross. Wellington. Reed, 1948.
McLINTOCK, A. H. The history of Otago. Dunedin. Otago Centennial Historical Committee, 1949.
MORRELL, William Parker. The provincial system of government in New Zealand, London. Longmans, 1932.
MORRISON, Joan Patricia. The evolution of a city: the story of … Christchurch … 1850–1903. Christchurch. Christchurch City Council, 1948.
MULGAN, Alan Edward. The city of the strait: Wellington and its provinces. Wellington. Reed, 1939.
NANKIVELL, Colonel John Henry. A brief history of the New Zealand military forces, 1840–1940. Wellington, 1944.
PALETHORPE, N. B. Official History of the New Zealand Centennial Exhibition, 1939–40, Rongotai. Wellington. New Zealand Exhibition Co., 1940.
PAUL, John T. Humanism in politics. New Zealand Labour Party retrospect. Wellington. New Zealand Labour Party, 1946.
PETONE'S FIRST HUNDRED YEARS. Wellington. Petone Borough Council, 1940.
PRATT, Major Alberg Rugby. Pioneering days of southern Maoriland. London. Sharp, 1932.
ROBERTS, Cyril John Langlow. Centennial history of Hawera and the Waimate Plains. Hawera. Hawera Star Publishing Co., 1940.
Ross, Ruth M. New Zealand's first capital. Wellington. Department of Internal Affairs, 1946.
RUTHERFORD, James. Hone Heke's rebellion, 1844–46. Auckland. Auckland University College, 1946.
— and W. H. Skinner (eds.). The establishment of the New Plymouth settlement, 1841–43. New Plymouth. Avery, 1940.
TAYLOR, Thomas D. New Zealand's naval story: naval policy and practice, naval occasions, visiting warships. Wellington. Reed, 1948.
THOMAS, Margery Charlotte. Yeomen of the south. Invercargill. Southland News Co., 1940.
VENNELL, C. W. Such things were. The story of Cambridge, New Zealand. Wellington. Reed, 1939.
WARD, Louis E. Early Wellington. Wellington. Whitcombe and Tombs, 1929.
WIGRAM, Sir Henry. The story of Christchurch. Christchurch. Lyttelton Times, 1916.
WILSON, James Gordon, and others. History of Hawke's Bay. Wellington. Reed, 1939.
WILSON, Sir James Glenny. Early Rangitikei. Christchurch. Whitcombe and Tombs, 1914.
WILY, Henry Evan Robert Luxmore. South Auckland: early settlement and development. Pukekohe. Franklin Printing Co., 1940.
YESTERDAY AND TO-DAY IN OTAGO. Dunedin. Coulls, Somerville, Wilkie, 1940.
BURTON, Ormond Edward. The silent division. Sydney. Angus and Robertson, 1935.
ROBERTSON, John. With the cameleers in Palestine. Dunedin. Reed, 1938.
SMITH, Stephen John. The Samoa (New Zealand) expeditionary force, 1914–15. Wellington. Ferguson and Osborn, 1924.
WAITE, Fred., and others. New Zealand official history of the war. 4 vols. Wellington. Whitcombe and Tombs, 1919–23.
ARMY DEPARTMENT, ARCHIVES SECTION. One more river. With the Second New Zealand Division from Florence to Trieste. Wellington. Army Board, 1947.
— Return to the attack. Wellington. Army Board, 1944.
— Roads to Rome. Wellington. Army Board, 1946.
HALL, D. O. W. Prisoners of Italy. Wellington. War History Branch, Department of Internal Affairs, 1949.
— Prisoners of Japan. Wellington. War History Branch, Department of Internal Affairs, 1949.
— Women at war. Wellington. War History Branch, Department of Internal Affairs, 1948.
HENDERSON, James H. Gunner inglorious. Wellington. Tombs, 1945.
HOLE, Tahu. Anzacs into battle. London. Hodder and Stoughton, 1942.
JACKSON, Francis. Passage to Tobruk: the diary of a Kiwi in the Middle East. Wellington. Reed, 1943.
KAY, R. L. Long range desert group in Libya 1940–41. Wellington. War History Branch, Department of Internal Affairs, 1949.
KIPPEN BERGER, Sir Howard K. Infantry Brigadier. Oxford University Press, 1949.
LLEWELLYN, S. P. Troopships. Wellington. War History Branch, Department of Internal Affairs, 1949.
MITCHELL, Alan W. New-Zealanders in the air war. London. Harrap, 1945.
NEW ZEALAND ARMY BOARD. Prelude to Battle, 1942. Campaigns in Greece; Battle for Crete; 1943. (Three separate works.) Wellington.
NEW ZEALAND EXPEDITIONARY FORCE, 2nd. Third Division. Histories Committee. Twelve volumes have been printed privately thus far, covering many aspects of the Pacific campaign.
NGATA, Sir Apirana Turupa. The price of citizenship. Wellington. Whitcombe and Tombs, 1943.
PALMER, G. Blake. Italian journey. Auckland. Oswald-Sealy, 1945.
REID, H. Murray. The turning point: with the New Zealand engineers at El Alamein. Auckland. Collins, 1945.
SAUNDERS, Hilary A. St. George. Return at dawn: the official story of the N.Z. Bomber Squadron. Wellington. Director of Publicity, 1942.
SHAW, W. B. Kennedy. Long range desert group. London. Collins, 1945.
SMITH, E. H. Guns against tanks. Wellington. War History Branch, Department of Internal Affairs, 1948.
UREN, Martyn. Kiwi saga. Auckland. Collins, 1943.
WATERS, S. D. “Achilles” at the River Plate. Wellington. War History Branch, Department of Internal Affairs, 1948.
— German raiders in the Pacific. Wellington. War History Branch, Department of Internal Affairs, 1949.
ANNUAL reports on Western Samoa are published in the Appendices to the Journals of the New Zealand House of Representatives. Wellington. Government Printer.
(BUCK, Peter Henry)—Material culture of Samoa, by Te Rangi Hiroa. Honolulu. Bishop Museum, 1931.
CHURCHWARD, Spencer. A new Samoan grammar. Melbourne. Spectator Publishing Co., 1926.
COULTER, J. W. Land utilization in American Samoa. Honolulu. Bishop Museum, 1941.
DOWNS, Evelyn A. Every-day Samoan grammar elucidated from conversation in the language. Apia. Western Samoan Mail, 1942.
GRATTAN, F. J. H. An introduction to Samoan custom. Apia. Samoa Printing and Publishing Co., 1948.
HANDBOOK OF WESTERN SAMOA. New Zealand External Affairs Department. Wellington. Government Printer, 1925.
KEESING, Felix M. Modern Samoa: its government and changing life. London. Allen and Unwin, 1934.
KRAMER, Augustin. The Samoan islands. 9 vols. Rarotonga: the Administration, 1941. (Translated from the German 3 vol. edition of 1902.)
MASTERMAN, Sylvia. The origins of international rivalry in Samoa, 1845–84. London. Allen and Unwin, 1934.
MEAD, Margaret. Coming of age in Samoa. New York. William Morrow, 1928.
NEFFGEN, H. Grammar and vocabulary of the Samoan language. London. Kegan Paul, 1918.
NEW ZEALAND INSTITUTE OF INTERNATIONAL AFFAIRS. Western Samoa, Mandate or German colony? Wellington. Tolan Print, 1937.
PEREN, Geoffrey Sylvester … Agriculture of Samoa, Cook Islands, and Fiji. Palmerston North. Massey Agricultural College, 1948.
ROWE, N. A. Samoa under the sailing gods. London. Putnam, 1930.
WATSON, Robert Mackenzie. History of Samoa. Wellington. Whitcombe and Tombs, 1918.
WESTBROOK, George Egerton Leigh. Gods who die. Edited by Julian Dana. New York. Macmillan, 1925.
ANNUAL reports on the Cook Islands are published in the Appendices to the Journals of the New Zealand House of Representatives. Wellington. Government Printer.
BEAGLEHOLE, Ernest. Islands of danger. Wellington. Progressive Publishing Society, 1944.
— and Pearl. Ethnology of Pukapuka (Cook Islands). Honolulu. Bishop Museum Bulletin 150, 1938.
(BUCK, Peter Henry.) Material culture of the Cook islands by Te Rangi Hiroa. Memoirs of the Board of Maori Ethnological Research. Vol. 2. New Plymouth. Avery, 1927.
ELLIS, Albert Fuller. Ocean Island and Nauru. Sydney. Angus and Robertson, 1935.
GILL, William Wyatt. Rarotongan Records. (From the Journal of the Polynesian Society.) New Plymouth, 1916.
KEESING, Felix Maxwell. The south seas in the modern world. London. Allen and Unwin, 1942.
MASON, R. A. K. Frontier forsaken: an outline history of the Cook Islands. Auckland. Challenge, 1947.
PACIFIC ISLANDS YEAR-BOOK, 1944. Sydney Pacific Publications. (Contains good up-to-date accounts of Pacific Islands groups.)
PEREN, Geoffrey Sylvester. Agriculture in Samoa, Cook Islands, and Fiji. Palmerston North. Massey Agricultural College, 1948.
RAMSDEN, George Eric Oakes. Strange stories from the South Seas. Wellington. Reed, 1944.
SKINNER, H. D. The Morioris of Chatham Islands. Honolulu. Bishop Museum, 1923.
No book has been written dealing exclusively with the Ross Dependency, but a list of books dealing with this region incidentally may be found in the 1929 number of the Year-Book. A good deal of information regarding the area is contained in “Antarctica—a Treatise on the Southern Continent,” by J. Gordon Hayes, London. The Richards Press, 1928.
INTRODUCTORY.—In 1948 a Committee was appointed by Government “to investigate the need and method of establishing a revised cost-of-living index.” In the Committee's report to Government (parliamentary paper H–48, 1948) it is recommended that a new retail price index—to be known as the Consumers' Price Index—should be compiled on a post-war base, and that the new index should replace existing series of retail price indices. The report was adopted by Government, and the Government Statistician was instructed to proceed with the compilation of the new index. Preliminary work towards establishing a base for the index was initiated in November, 1948, and the first publication of the new index was made in the June–July, 1949, issue of the Monthly Abstract of Statistics. Further detailed results appeared in the August, 1949, issue of the Abstract; and future index numbers will appear in successive issues of that publication.
The form and content of the Consumers' Price Index are described in considerable detail in the parliamentary paper (H–48, 1948) mentioned above, to which reference should be made by those desiring a complete account of the recommendations made by the Committee and the reasons for these recommendations. It is, however, desirable to recapitulate here, in summarized form, the main recommendations of the Committee, which were:—
A new retail prices index based on the first quarter of 1949 should be initiated:
The regimen of the index should cover “the whole range of commodities and services used in the average household—with representation, as far as possible, of the amenities of modern living.” Durable consumer goods, seasonal fruits and vegetables (with normal seasonal price fluctuations “smoothed” by appropriate techniques), and services should be represented in the index:
In addition to rentals of unfurnished houses, rentals of unfurnished flats and the costs of owner-occupied houses should be represented in the housing group of the index:
The weighting pattern should represent post-war habits of consumption:
The index should cover prices in twenty-one towns spread over the whole country and adequately representing all urban localities. The New Zealand index will represent an average of indices for these towns weighted according to population:
Monthly index numbers should be compiled for the food and fuel and lighting groups, and quarterly index numbers for all groups combined.
In the following pages the technique of compilation of the Consumers Price Index is described briefly*, and the results of the initial compilations are also given. As regards weighting it will be observed that there are some differences between the weights given in the report of the Committee and those given on page 1002. The weights given herein are the final weights as ascertained for the base period (first quarter, 1949); they replace those given in the Committee's report, which were based on June, 1948, prices, the latest appropriate figures available when that report was written.
LIST OF ITEMS COVERED BY INDEX.—As recommended in the report of the Index Committee, the list of items covered by the index comprises a wide range of household and personal requirements. The scope of coverage of the index is indicated in H–48, page 24 (Appendix A).
It will be seen that the regimen is by no means confined to the bare necessities of life. Not many luxury foods are included, but cake, three-course meals, aerated waters, chocolate, and ice-cream appear for the first time. Comment has already been made on the inclusion of fresh fruits and vegetables, and also, under housing, of the costs of owner-occupiers. It is, however, in the “Miscellaneous” group that the greatest expansion has taken place when compared with previous practice. Entirely new subgroups have been formed for household appliances, medicines and baby foods, entertainment, and health services; while formerly existing sub-groups comprising personal requisities, educational and cultural supplies, and personal services have been greatly enlarged. Sewing-machines, washing-machines, vacuum-cleaners, radio receiving sets (and licences therefor), cosmetics, patent medicines, cinema and football admissions, medical, dental, and optical services, &c., are thus included for the first time in New Zealand price index numbers. Nevertheless, the index does not cover, and does not purport to cover, all items of household expenditure. It was felt that some line must be drawn to exclude what might be regarded as luxury spending. What constitutes a luxury was found difficult to define, but the following have in fact been excluded; alcoholic liquors, private motoring, holiday travel (except rail fares), hotel accommodation, sports expenses, domestic help, and private telephone rentals. In addition, taxation, savings (including life insurance), gifts, charity, gaming expenses, extraordinary losses (by fire, &c.), and extraordinary expenditure (e.g., cost of removal to another locality) are also amongst items which are excluded on the ground that they represent either—
Items which are not a true expense, but rather a reduction of income, or a surplus available for disposal after paying legitimate cost of living expenses, or an investment;
Expenditure not related to value received and therefore incapable of expression as a “price,” which is the cost of a specified satisfaction; or
Expenses so irregular in occurrence and amount that their inclusion is not feasible.
An estimate of the annual value, at prices ruling in the first quarter of 1949, of personal consumption represented in the index has been made. This calculation gives a figure of £247,130,000, which compares with the estimate of £310,000,000 total personal consumption in 1948–49 at market prices given in the Official Estimates of National Income and Expenditure (Supplement to June-July, 1949, issue of Monthly Abstract of Statistics, page 11). The commodities and services represented in the index thus appear to account for 79.7 per cent. of total personal consumption. However, the quantities of consumption represented in the Consumers' Price Index are 1946 quantities, but valued at 1949 prices, and as such do not quite fit to the national expenditure estimates, which are for the financial year 1948–49. It would be correct to state that approximately 80 per cent. of annual personal (including household) expenditure at retail prices is represented in the Consumers' Price Index.
* For a more detailed account see Appendix II of the Special Supplement to the Monthly Abstract of Statistics, October-November, 1949, issue.
It may be well to stress again that the index relates to the average New Zealand household only. This ignores stratification, whether by income levels, location, race, or constitution of family. It is claimed that the result will apply to the modal household, and that variations from this pattern are not large enough to warrant the construction of more than a single retail prices index number. But obviously the spending of households deviating from the mode will not follow the index regimen. This is the case with, for instance, childless or adult families, married couples who are hoarding, tenants of furnished houses, rural dwellers, &c. Further, the capital outlay included in the expenses of newly-married couples or immigrants must be distinguished from normal “cost-of-living” expenses, which, in respect of durable goods, allow for annual replacements only. Accumulated replacements (deferred during a period of scarcity) also distort the normal pattern.
In a word—and the remark is of general application—the index must he used intelligently, not forgetting the standard and pattern of living defined by the regimen, the varying costs of maintaining which the index is designed to measure.
COLLECTION OF PRICES.—Although, as stated above, some 80 per cent. of total personal expenditure is represented in the Consumers' Price Index it would be obviously impossible to collect and analyse prices in twenty-one towns of the many hundreds, if not thousands, of individual items included in this total. Accordingly, a selection of key items, three hundred in all, has been made for which actual prices are collected. The method by which this is done is to give a representative item a “weight” representing consumption of that item and allied items (e.g., block madiera cake is taken as representing all cake, pastry, and buns). By this method, and by taking prices in the larger towns as sufficiently representative of prices in general for some of the less-important items, the task of price collection has been reduced to manageable proportions. Following is a statement, in summary form, showing the periodicity and geographical coverage of price collection in respect of each group:—
| Group. | Periodicity of Collection. | Date of Collection. | Towns Covered. |
|---|---|---|---|
| Food (excluding seasonal fruits and vegetables) | Monthly | 15th of Month | Twenty-one towns. |
| Seasonal fruits and vegetables | Weekly | Every Friday | Ten representative towns. |
| Housing— | |||
| Rents : houses and flats | Six monthly | February and August | Twenty-one towns. |
| Rates | Yearly | February | Twenty-one towns. |
| Repairs and maintenance | Yearly | February | Four chief centres. |
| Fuel and lighting | Monthly | 15th of month | Twenty-one towns. |
| Clothing and footwear | Quarterly | February, May, August, November | Ten representative towns. |
| Miscellaneous— | |||
| Hardware | Quarterly | Ditto | Ditto. |
| Furniture | Quarterly | Ditto | Ditto |
| Household appliances | Quarterly | Ditto | Four chief centres. |
| Cleaning supplies | Quarterly | Ditto | Ten representative towns. |
| Personal requisites | Quarterly | Ditto | Four chief centres. |
| Educational requisities | Quarterly | Ditto | Four chief centres. |
| Services— | |||
| Postage, &c. | Quarterly | Ditto | Four chief centres. |
| Entertainment | Quarterly | Ditto | Four chief centres. |
| Personal services | Quarterly | Ditto | Four chief centres. |
| Health services | Quarterly | Ditto | Four chief centres. |
| Transport | Quarterly | Ditto | Four chief centres. |
| Patent medicines | Quarterly | Ditto | Four chief centres. |
| Union dues | Yearly | February | Four chief centres. |
As will be realized, a number of retail price quotations for each item in each town is necessary in order that the index may give a properly-balanced picture of price movements in each town and in New Zealand as a whole. For example, some representation must be given to “neighbourhood” stores in the suburbs as well as shops in the centre of the larger towns.
The following statement shows the approximate number of price quotations collected and included in the index:—
| Group. | Number of Towns Which Collected. | Number of Quotations. | ||||
|---|---|---|---|---|---|---|
| Monthly. | Quarterly. | Half-yearly. | Annually. | |||
* Number of returns collected, covering some 52,800 rented houses and 3,900 rented flats. | ||||||
| 1A Meat and fish | 21 | 1,026 | 12,312 | |||
| 1B Fruits, vegetables, and eggs | 10 | 1,950 | 23,400 | |||
| 1C Other foods | 21 | 1,803 | 21,636 | |||
| All food | 57,348 | |||||
| 2A Rent | 21 | 835* | 1,670 | |||
| 2B Other housing | 21 | 34 | ||||
| All housing | 1,704 | |||||
| 3. Fuel and lighting | 21 | 196 | 2,352 | |||
| 4A Clothing | 10 | 1,418 | 5,672 | |||
| 4B Footwear | 10 | 592 | 2,368 | |||
| Clothing and footwear | 8,040 | |||||
| 5A Household durable goods | 10 or 4 | 841 | 3,364 | |||
| 5B Other commodities | 10 or 4 | 311 | 1,244 | |||
| 5C Services | 4 or 1 | 153 | 612 | |||
| All miscellaneous | 5,220 | |||||
| Total | 74,664 | |||||
As shown above, the index covers some 75,000 price quotations each year.
The report of the Index Committee (H–48, 1948, pp. 8–10) gave proper emphasis to the importance of ensuring that prices are collected for comparable qualities and descriptions of goods and services at each price-collecting period. In order to ensure the accuracy of price quotations, the collection of prices is carried out by personal collection, a small field staff being appointed for the purpose to the Census and Statistics Department. The services of District Officers of the Labour Department are availed of for the collection of returns of food and fuel and lighting prices outside of Wellington, to the extent that the whole territory is not (in respect of these groups) covered at every collection by the Census and Statistics Department's own price-collectors. It is thus possible to ensure that either the quality or grade of each commodity priced remains the same from month to month or, if it does not, that compensating amendments are made to the price, so as to record, for example, a concealed price increase in the form of a deterioration in quality. The price collectors are strictly charged with this duty of checking the quality of each line of goods for which price quotations are obtained. In the clothing and footwear group especially this procedure is of the greatest importance.
Fundamental to the policy of quality checking is the determination of exact specifications for every item in the index. A list was drawn up in consultation with local dealers in the various retail trades and amended where required as the result of a preliminary price-collecting tour undertaken in November, 1948. It is essential that the brands and qualities entering into the index should be those predominating in actual sales, and a technique has been devised whereby in the event of a specified brand going off the market another can be substituted without either introducing any fictitious price movement or suppressing any real movement, through change of quality. This will be effected by applying to all prices of the substitute a factor representing the estimated inverse ratio of its wearing life to that of the original specification.
Other advantages have been found to accrue from the adoption of personal price-collection, particularly in that opportunities are afforded the price-collectors of interesting the informant retailers in the index, explaining to them its purpose and value, answering their inquiries, assisting them in supplying the exact information required, and generally establishing goodwill. Stress is always laid on the fact that the information supplied by any individual retailer is held strictly confidential, and the Department is satisfied that greater care is taken and consequently greater accuracy secured in the basic price data of this index than hitherto.
WEIGHTING.—As recommended in the report of the Index Committee, the weights are based on aggregate consumption in New Zealand of the various commodities and services represented in the index. The weighting pattern thus represents “average” consumption in New Zealand with some adjustment for the fact that the index is urban in its coverage. (However, as stated in the report of the Index Committee, it should represent, reasonably well, changes in consumer prices in rural localities also.) Since the index is compiled throughout on the “aggregate expenditure” method, the ratios of group aggregate expenditures in the base period to the total aggregate expenditure for all groups indicate the relative importance of the various groups in the base period (first quarter of 1949). Following are the figures, on a percentage basis:—
CONSUMERS' PRICE INDEX GROUP WEIGHTS
| Group. | Percentage of Total Expenditure in Base Period. | ||
|---|---|---|---|
| Meat and fish | 8.18 | ||
| Fruits, vegetables and eggs | 7.66 | ||
| Seasonal | 4.90 | ||
| Non-seasonal | 2.76 | ||
| Other foods | 18.38 | ||
| All food | 34.22 | ||
| Rent | 6.66 | ||
| Other housing | 10.09 | ||
| All housing | 16.75 | ||
| Fuel and lighting | 3.86 | ||
| Clothing | 17.25 | ||
| Footwear | 3.06 | ||
| Clothing and footwear | 20.31 | ||
| Household durable goods | 5.44 | ||
| Other commodities | 10.90 | ||
| Services | 8.52 | ||
| Total miscellaneous | 24.86 | ||
| All groups | 100.00 | ||
Several technical problems were encountered in the construction of the weighting pattern of the Consumers' Price Index. In particular, the techniques adopted in the inclusion of owner-occupiers' costs in the housing index and the “smoothing” of seasonal price fluctuations in the fruits, vegetables, and eggs index present some novel features. A general description of these techniques was given in the report of the index Committee, but at that stage the final weighting patterns for these (and other) groups could not be determined. The actual methods of establishing these weighting patterns are somewhat technical, and for the benefit of those interested a technical appendix is available in the Special Supplement to the Monthly Abstract of Statistics, October-November, 1949, issue, which shows in some detail, exactly how these weights were devised. (In the same supplement other problems of technical interest are also discussed.)
COMBINATION OF REGIONAL INDEX NUMBERS.—As indicated earlier, the localities from which prices are collected cover as wide an area of New Zealand as was practicable. The following towns were selected:—
Four chief centres: Auckland, Wellington, Christchurch, Dunedin.
Representative large centres (population 16,000 and upwards): Hamilton, Gisborne, Napier, New Plymouth, Wanganui, Palmerston North, Nelson, Timaru, Invercargill.
Representative smaller centres (population 6,000 and upwards) : Whangarei, Tauranga, Rotorua, Masterton, Blenheim, Greymouth, Ashburton, Oamaru.
Prices of food, housing, and fuel and lighting are collected in each of the twenty-one towns shown above; prices of seasonal fruits and vegetables, clothing, hardware, furniture, household-cleaning supplies in ten representative towns—namely, Auckland, Wellington, Christchurch, Dunedin, Hamilton, Napier, New Plymouth, Palmerston North, Nelson, and Invercargill; while prices of items entering into repairs and maintenance of owner-occupied houses, prices of household appliances, personal requisites, educational requisites, and services included in the index are collected from the four chief centres (Auckland, Wellington, Christchurch, and Dunedin).
Separate food and find and lighting index numbers are compiled for each of the twenty-one towns each month, while at six-monthly intervals, a compilation of housing index numbers is made for all twenty-one towns. At quarterly intervals “all groups” index numbers are compiled for each of the twenty-one towns.
In order to combine index numbers for individual towns so as to arrive at average index numbers for all twenty-one towns (the New Zealand average index numbers) the index numbers for each town are weighted by the population (at 1st April, 1948) of the town concerned (including the population of neighbouring boroughs, &c.) in order to arrive at a properly weighted average index for New Zealand as a whole. This method applies literally in the case of the food and fuel and lighting groups, but some variation of the method is necessary in the case of groups for which prices are not collected in all twenty-one towns.
QUARTERLY INDEX NUMBERS: FIRST AND SECOND QUARTERS, 1949.—The quarterly index numbers for each group and for all groups combined are given for each town in the table on page 1006. (For the eleven “other” towns prices are not collected for the clothing and footwear and miscellaneous groups; and consequently separate index numbers are not available.) Following are the New Zealand (twenty-one towns combined) index numbers for each group and for all groups combined:—
QUARTERLY INDEX NUMBERS FOR NEW ZEALAND (TWENTY-ONE TOWNS COMBINED) Base: First Quarter 1949 (= 1000)
| Group. | First Quarter, 1949. | Second Quarter, 1949. |
|---|---|---|
| Food— | ||
| Meat and fish | 1000 | 1006 |
| Fruit, vegetables, and eggs | 1000 | 978 |
| Other foods | 1000 | 1020 |
| All food | 1000 | 1007 |
| Housing— | ||
| Rent | 1000 | 1000 |
| Other housing | 1000 | 1000 |
| All housing | 1000 | 1000 |
| Fuel and lighting | 1000 | 1001 |
| Clothing and footwear— | ||
| Clothing | 1000 | 1000 |
| Footwear | 1000 | 1003 |
| Clothing and footwear | 1000 | 1001 |
| Miscellaneous group— | ||
| Household durable goods | 1000 | 908 |
| Other commodities | 1000 | 998 |
| Services | 1000 | 1000 |
| All miscellaneous | 1000 | 999 |
| All groups combined | 1000 | 1002 |
The effect on the all-groups index number of a given price movement in any item is capable of being readily ascertained. It is intended that with each quarterly publication of the index numbers comment should be given on the individual price movements which have produced the observed movement in the all-groups number. This is kept in view in the process of checking returns, and price movements which appear significant are noted. In these cases weighted average prices over twenty-one towns (or as the case may be) for the current quarter (and for the previous quarter if necessary) are taken out, and thus the quarterly movement in each of these weighted average prices ascertained. It is then possible to calculate the effect on the all-groups index of significant changes in prices of individual commodities or services.
The following table shows the principal factors contributing to the change in the nil-groups index between the first and second quarters of 1949:—
Analysis of Movement in All-groups Index between First and Second Quarters of 1949
| Item or Group. | Percentage Increase on Base Price or Aggregate.* | Percentage Base Expenditure Weight. | Contribution to Movement in All Groups Index (Points in 1000). | |
|---|---|---|---|---|
* Weighted average, all towns covered. † Comprising: vacuum cleaner, 0.09; electric jug, 0.01; kapok mattress, 0.03; hammer, 0.01; spade, 0.01; table knives, 0.02; toilet soap, 0.31. | ||||
| Per Cent. | Per Cent. | - | + | |
| Meat and fish | +0.64 | 8.18 | 0.52 | |
| Fresh fruits, vegetables, and eggs | -2.18 | 7.66 | 1.67 | |
| Milk | +12.00 | 2.83 | 3.40 | |
| Three-course meals | +2.17 | 1.66 | 0.36 | |
| Coal | +0.34 | 1.10 | 0.04 | |
| Footwear | +0.30 | 3.06 | 0.09 | |
| Certain miscellaneous items | 0.48† | |||
| -2.15 | +4.41 | |||
| Net movement accounted for by these items or groups | +2.26 | |||
| Actual movement | +2.35 points | |||
Only five items or groups show significant movement, and together sufficiently account for the all-groups rise of 2.3 points—viz., milk; fresh fruits, vegetables and eggs: meat and fish; three-course meals; and toilet soap. Various other commodities produced small increases or decreases which tended to balance out. By far the most significant change was the introduction in April of the winter price for milk. No adjustment for seasonal changes in price is applied in the case of milk, so that the index shows the full effect of any rise or fall, seasonal or otherwise, in the price of this commodity. The consequent upward effect (3.4 points) on the all-groups index is therefore liable to reversal when summer prices again become operative.
The 1.7 points fall caused by price movements in fruits, vegetables, and eggs contains also a large seasonal element. In spite of the somewhat elaborate arrangements made for smoothing seasonal variations in these items it must still be remembered that it is only a standard pattern of seasonal fluctuations for which corrections are made. As the actual pattern varies from year to year according to the “season” for each crop (depending on weather conditions, prevalence of pests, growers' anticipations of markets, &c.) residual seasonal variations, sometimes positive, sometimes negative, are bound to remain in evidence. All that is claimed is that “normal” seasonal variations are removed by the technique adopted. This means that the seasonal group index will be considerably more stable with the correction than without it, but absolute perfection is, here as elsewhere, not practically attainable
Meat is also subject to some seasonal price-variation, for which, as with milk, no correction is made. The price of three-course meals was raised during the quarter, but as the new price did not operate for the whole of the three months the full effect will not become apparent in the quarterly index numbers until the third quarter of 1949. It is, however, reflected in the 6-points rise in the “other foods” index shown in the monthly series for June. Reductions in the prices of imported hardware lines—an effect of the alteration in the exchange rate made in August, 1948—were largely offset by a general rise in the price of footwear.
The result of these price changes is that the net movement in the quarterly all-groups index from the first to the second quarter of 1949 was 2.35 points. Of this change, 2.24 points were accounted for by price changes in items (e.g., milk) into which a seasonal factor enters; and as such are liable to seasonal change in the opposite direction later.
MONTHLY INDEX NUMBERS: FOOD AND FUEL AND LIGHTING.—Monthly index numbers for food and fuel and lighting in all towns, and in each town are shown in the tables on pages 1005 and 1007. Following is a summary of the New Zealand (twenty-one towns combined) index numbers for the food and fuel and lighting groups for the months of January to June, 1949:—
Base: First Quarter, 1949 (= 1000)
| Month. | Food Group. | Fuel and Lighting. | |||
|---|---|---|---|---|---|
| Meat and Fish. | Fruit, Vegetables, and Eggs. | Other Foods. | All Food. | ||
| 1949— | |||||
| January | 997 | 1063 | 1000 | 1014 | 1000 |
| February | 1000 | 1012 | 1000 | 1003 | 1000 |
| March | 1002 | 925 | 1000 | 984 | 1000 |
| April | 1006 | 995 | 1018 | 1010 | 1000 |
| May | 1006 | 969 | 1018 | 1004 | 1001 |
| June | 1008 | 971 | 1024 | 1008 | 1001 |
The “all food” index fell between January and March by 30 points, rose by 26 points between March and April, fell by 6 points in May, and rose by 4 points in June to a level 8 points higher than the average in the base period (first quarter), but 6 points below the January index.
Prices in the meat and fish group showed an upward tendency throughout the first six months of 1949, the June index being 11 points higher than the January figure.
The index for seasonal items (fruit, vegetables, and eggs) showed considerable fluctuation during the first six months of 1949, falling by 138 points between January and March, rising by 70 points between March and April, falling again by 26 points between April and May, and rising slightly by 2 points between May and June. Although the actual fluctuations in prices in this group are smoothed by eliminating normal seasonal variations there is still a considerable residuum of seasonal movement not conforming to normal seasonal patterns, which is left in. While the inclusion of this group thus introduces some element of instability into the food-group indices, such changes are in accord with consumers' experience and should be recorded. The effect on the quarterly all-groups indices of such fluctuations is not large, since month to month movements are further smoothed by the quarterly averaging.
The “other foods” index, after remaining stationary for the first three months of 1949, rose by 18 points in April, chiefly through the coming into force of winter prices for milk—while a further increase of 6 points was recorded in June—due in the main to an increase in the price of three-course meals in restaurants.
INDEX NUMBERS FOR INDIVIDUAL TOWNS AND GROUPINGS.—Following are the index numbers for individual towns and groupings:—
QUARTERLY INDEX NUMBERS FOR INDIVIDUAL TOWNS AND GROUPINGS
Base: Weighted average twenty-one towns—first quarter, 1949 (= 1000)
| — | Food. | Housing. | Fuel and Lighting. | Clothing and Footwear. | Miscellaneous. | All Groups. |
|---|---|---|---|---|---|---|
* In calculating these nil-groups index numbers, the missing aggregates for the clothing and footwear and miscellaneous groups were supplied from the first ten towns. | ||||||
| Quarter ended 31st March, 1949 | ||||||
| Auckland | 997 | 1036 | 1005 | 1026 | 983 | 1006 |
| Wellington | 984 | 1027 | 926 | 1005 | 1012 | 1000 |
| Christchurch | 1003 | 1009 | 961 | 936 | 1010 | 991 |
| Dunedin | 1003 | 991 | 790 | 988 | 995 | 988 |
| Four chief centres | 996 | 1023 | 949 | 999 | 998 | 999 |
| Hamilton | 1017 | 955 | 1032 | 987 | 993 | 995 |
| Napier | 983 | 938 | 1123 | 1023 | 1012 | 996 |
| New Plymouth | 1021 | 953 | 1092 | 1017 | 992 | 1004 |
| Palmerston North | 1018 | 964 | 1017 | 1035 | 1017 | 1012 |
| Nelson | 1002 | 1000 | 1129 | 1002 | 1020 | 1011 |
| Invercargill | 1055 | 965 | 1040 | 996 | 1004 | 1015 |
| Six provincial towns | 1016 | 958 | 1067 | 1012 | 1006 | 1005 |
| Whangarei | 1024 | 930 | 1249 | 1007* | ||
| Tauranga | 1029 | 974 | 1000 | 1001* | ||
| Rotorua | 1008 | 972 | 1099 | 998* | ||
| Gisborne | 965 | 943 | 1342 | 995* | ||
| Wanganui | 989 | 946 | 1140 | 1004* | ||
| Masterton | 1011 | 950 | 1203 | 1007* | ||
| Blenheim | 1000 | 971 | 1266 | 1011* | ||
| Greymouth | 1007 | 932 | 1051 | 986* | ||
| Ashburton | 1002 | 910 | 1378 | 990* | ||
| Timaru | 993 | 970 | 984 | 982* | ||
| Oamaru | 999 | 929 | 1040 | 986* | ||
| Eleven other towns | 1001 | 949 | 1140 | 996* | ||
| Quarter ended 30th June, 1949 | ||||||
| Auckland | 992 | 1036 | 1005 | 1025 | 983 | 1004 |
| Wellington | 997 | 1027 | 926 | 1001 | 1010 | 1003 |
| Christchurch | 1016 | 1009 | 968 | 948 | 1008 | 997 |
| Dunedin | 1000 | 991 | 789 | 988 | 994 | 986 |
| Four chief centres | 999 | 1023 | 950 | 999 | 997 | 1001 |
| Hamilton | 1034 | 955 | 1031 | 986 | 992 | 1000 |
| Napier | 1020 | 938 | 1123 | 1020 | 1009 | 1007 |
| New Plymouth | 1034 | 953 | 1092 | 1013 | 988 | 1007 |
| Palmerston North | 1036 | 964 | 1020 | 1037 | 1016 | 1018 |
| Nelson | 1051 | 1000 | 1125 | 1004 | 1014 | 1026 |
| Invercargill | 1029 | 965 | 1040 | 993 | 1005 | 1005 |
| Six provincial towns | 1032 | 958 | 1067 | 1011 | 1004 | 1010 |
| Whangarei | 1013 | 930 | 1250 | 1003* | ||
| Tauranga | 1042 | 974 | 1004 | 1005* | ||
| Rotorua | 1021 | 972 | 1099 | 1002* | ||
| Gisborne | 999 | 943 | 1343 | 1006* | ||
| Wanganui | 1006 | 946 | 1140 | 1010* | ||
| Masterton | 1029 | 950 | 1202 | 1012* | ||
| Blenheim | 1031 | 971 | 1266 | 1020* | ||
| Greymouth | 1014 | 932 | 1051 | 990* | ||
| Ashburton | 1015 | 910 | 1389 | 997* | ||
| Timaru | 1004 | 970 | 984 | 988* | ||
| Oamaru | 999 | 929 | 1040 | 985* | ||
| Eleven other towns | 1014 | 949 | 1141 | 1001* | ||
MONTHLY INDEX NUMBERS FOR INDIVIDUAL TOWNS AND GROUPINGS
Base: Weighted average twenty-one towns—first quarter, 1949 (= 1000)
| Town. | 1949. | |||||||||||
|---|---|---|---|---|---|---|---|---|---|---|---|---|
| January. | February. | March. | April. | May. | June. | |||||||
| Food. | Fuel and Lighting. | Food. | Fuel and Lighting. | Food. | Fuel and Lighting. | Food. | Fuel and Lighting. | Food. | Fuel and Lighting. | Food. | Fuel and Lighting. | |
| Auckland | 1008 | 1005 | 1001 | 1005 | 983 | 1005 | 1002 | 1005 | 983 | 1005 | 993 | 1005 |
| Wellington | 991 | 925 | 990 | 927 | 971 | 926 | 994 | 926 | 997 | 926 | 1001 | 926 |
| Christchurch | 1023 | 961 | 1003 | 961 | 984 | 961 | 1019 | 961 | 1015 | 972 | 1014 | 972 |
| Dunedin | 1032 | 790 | 1007 | 790 | 970 | 790 | 1011 | 788 | 995 | 789 | 994 | 789 |
| Four chief centres | 1009 | 949 | 999 | 949 | 978 | 949 | 1004 | 949 | 994 | 951 | 999 | 951 |
| Hamilton | 1029 | 1032 | 1016 | 1032 | 1007 | 1032 | 1035 | 1032 | 1037 | 1031 | 1030 | 1031 |
| Napier | 1006 | 1123 | 975 | 1121 | 971 | 1123 | 1006 | 1123 | 1022 | 1123 | 1031 | 1123 |
| New Plymouth | 1035 | 1090 | 1022 | 1092 | 1006 | 1092 | 1029 | 1092 | 1031 | 1092 | 1042 | 1092 |
| Palmerston North | 1033 | 1017 | 1018 | 1017 | 1002 | 1017 | 1035 | 1020 | 1036 | 1020 | 1037 | 1020 |
| Nelson | 1001 | 1130 | 1001 | 1130 | 1005 | 1127 | 1041 | 1125 | 1059 | 1125 | 1052 | 1125 |
| Invercargill | 1064 | 1040 | 1075 | 1040 | 1027 | 1040 | 1037 | 1040 | 1019 | 1040 | 1031 | 1040 |
| Six provincial towns | 1029 | 1067 | 1018 | 1067 | 1002 | 1067 | 1029 | 1067 | 1032 | 1067 | 1036 | 1067 |
| Whangarei | 1033 | 1249 | 1028 | 1250 | 1012 | 1250 | 1023 | 1250 | 1006 | 1250 | 1011 | 1250 |
| Tauranga | 1040 | 1000 | 1028 | 1000 | 1019 | 1000 | 1042 | 1004 | 1045 | 1004 | 1039 | 1004 |
| Rotorua | 1019 | 1099 | 1007 | 1099 | 999 | 1099 | 1021 | 1099 | 1022 | 1099 | 1022 | 1099 |
| Gisborne | 982 | 1342 | 959 | 1342 | 954 | 1342 | 986 | 1343 | 1001 | 1343 | 1011 | 1343 |
| Wanganui | 1004 | 1140 | 990 | 1140 | 974 | 1140 | 1004 | 1140 | 1006 | 1140 | 1009 | 1140 |
| Masterton | 1017 | 1203 | 1019 | 1202 | 997 | 1202 | 1026 | 1202 | 1029 | 1202 | 1033 | 1202 |
| Blenheim | 1006 | 1266 | 1000 | 1266 | 996 | 1266 | 1017 | 1266 | 1039 | 1266 | 1037 | 1266 |
| Greymouth | 1023 | 1051 | 1006 | 1051 | 991 | 1051 | 1014 | 1051 | 1015 | 1051 | 1011 | 1051 |
| Ashburton | 1022 | 1378 | 1001 | 1378 | 983 | 1378 | 1017 | 1382 | 1015 | 1392 | 1012 | 1392 |
| Timaru | 1013 | 984 | 994 | 984 | 972 | 984 | 1009 | 984 | 1003 | 984 | 1000 | 984 |
| Oamaru | 1027 | 1040 | 1003 | 1040 | 966 | 1040 | 1010 | 1040 | 994 | 1040 | 992 | 1040 |
| Eleven other towns | 1015 | 1140 | 1001 | 1140 | 986 | 1140 | 1014 | 1140 | 1014 | 1141 | 1014 | 1141 |
HISTORICAL.—In the next section of this Appendix, the course of retail prices since 1907 is traced, with a discussion of changes in appropriate periods.
Survey of Retail Prices Index Numbers.—The earliest official index of retail prices in New Zealand was published in the Report on Cost of Living, 1891–1911. The regimen was confined to the food, rent, and fuel and light groups and the geographical coverage to the four chief centres, which were considered of equal importance. The series commenced from 1907, or, as regards food and rent, from 1894, although grocery prices for Christchurch were lacking until 1899. The original regimen contained 60 items: on the addition of the fuel and light group the number became 67. Amongst groceries—treated as a subdivision of the food group—a few non-foods were included. The average price level over the five years 1909 to 1913 was taken as 1000, and the commodity weights were based on national consumption during the same years (though reference was also made to a household budget inquiry conducted by the Department of Labour in 1910–11)*. The mathematical groundwork of the index was the “aggregate-expenditure” method employing Laspeyres' formula as popularized by G. H. Knibbs, a former Commonwealth Statistician of Australia.
From the beginning of 1914 retail prices were collected from twenty-five towns, but the base remained unchanged as the average of the four centres, 1909–13. Population weights were introduced in taking averages of the twenty-five towns. The results were published in the Report on Cost of Living, 1891–1914, mentioned earlier, and in Prices: An inquiry into Prices in New Zealand, 1891–1919.
* These two methods of building up a weighting pattern are in fact the main alternatives which present themselves. In the first (national consumption) imports are added to production and exports deducted, the resultant quantities being considered as spread evenly over the total population. The second admits of a choice of the type of household to which the index is to relate; this may he determined by the locality, the constitution of the family, the occupation or the earnings of the chief bread-winner. &c. For this method exact records of purchases over a defined period by sample families within the chosen category need to be available.
Following are the annual index numbers:—
INDEX NUMBERS OF RETAIL PRICES OF THE VARIOUS GROUPS OF COMMODITIES, SINGLY AND IN COMBINATION: AVERAGE OF THE FOUR CHIEF CENTRES, 1891 to 1914
Base: Average annual aggregate expenditure, four chief centres, 1909–13 (= 1000)
| Year. | Group I: Groceries. | Group II: Dairy Products. | Group III: Meat. | Groups I-III: Food Groups. | Group IV: Rent. | Groups I-IV: Food and Rent. | Group V: Fuel and Light. | Groups IV: Food, Rent and Fuel and Light. |
|---|---|---|---|---|---|---|---|---|
| 1891 | 806 | 864 | 683 | |||||
| 1892 | 835 | 866 | 696 | |||||
| 1893 | 828 | 896 | 734 | |||||
| 1894 | 817 | 939 | 750 | |||||
| 1895 | 842 | 898 | 769 | |||||
| 1896 | 825 | 892 | 785 | |||||
| 1897 | 830 | 855 | 806 | |||||
| 1898 | 847 | 923 | 818 | |||||
| 1899 | 919 | 840 | 905 | 896 | 831 | 873 | ||
| 1900 | 948 | 838 | 899 | 906 | 874 | 894 | ||
| 1901 | 971 | 876 | 909 | 928 | 905 | 920 | ||
| 1902 | 1016 | 892 | 919 | 954 | 922 | 943 | ||
| 1903 | 983 | 897 | 933 | 946 | 928 | 940 | ||
| 1904 | 962 | 882 | 935 | 935 | 945 | 939 | ||
| 1905 | 1062 | 878 | 975 | 990 | 971 | 983 | ||
| 1906 | 1072 | 914 | 977 | 1003 | 996 | 1001 | ||
| 1907 | 1016 | 955 | 989 | 993 | 987 | 991 | 975 | 989 |
| 1908 | 999 | 1020 | 971 | 994 | 99,2 | 994 | 988 | 993 |
| 1909 | 973 | 958 | 980 | 972 | 990 | 978 | 993 | 980 |
| 1910 | 1014 | 970 | 977 | 991 | 990 | 991 | 981 | 990 |
| 1911 | 968 | 993 | 995 | 983 | 987 | 985 | 980 | 984 |
| 1912 | 1022 | 1029 | 1001 | 1017 | 1007 | 1013 | 1012 | 1013 |
| 1913 | 1023 | 1050 | 1047 | 1037 | 1026 | 1033 | 1035 | 1034 |
| 1914 | 1055 | 1054 | 1136 | 1082 | 1036 | 1066 | 1057 | 1065 |
In accordance with the War Legislation and Statute Amendment Act, 1918, the Census and Statistics Department (then the Census and Statistics Office) collected data regarding prices of clothing and drapery, footwear, household furnishings, household ironmongery, crockery, train and tram fares, and newspapers and periodicals, for the use of the Court of Arbitration. In 1924, the emergency legislation having expired, the retail price index was extended by the inclusion of these extra items—129 in number—classified under two new groups, (1) clothing, drapery, and footwear, and (2) miscellaneous. The new series was taken back to July, 1914, the index numbers for that date being equated to 1000. No change of commodity weights was introduced, but group and sub-group weights based on the Labour Department's 1910–11 household budget inquiry were brought into use. Within the sub-groups of the two additional groups (except train and tram fares) the items were, however, equally weighted. Prices of these new items were collected in the four chief centres only. From 1921 to 1942 these index numbers and their continuations were published in the annual Statistical Report on Prices, &c. Commencing with 1946 the portion of that report dealing with prices and labour statistics has been issued as a separate volume untitled Report on Prices, Wages, and Labour Statistics, the 1946 volume including also details for the years 1943 to 1945. As will be mentioned later, however, the material available for publication from 1943 to 1948 was not comparable in detail with that for earlier years.
Revision of 1930.—In 1930 a revised retail prices index appeared which, in the main, followed the pattern of its predecessor, The list of items was increased by about a dozen, new sub-groups of the miscellaneous group being formed for personal services, postage and telegrams, household-cleaning supplies, and tobacco. The last two of these sub-groups represented a reclassification of non food items previously included in the groceries subgroup of the food group. The same geographical coverage was retained and also the method of weighting by populations of the twenty-live towns (but not by populations of the four chief centres, where this restricted coverage applied).
The weighting pattern was entirely reviewed, commodity weights (except in the clothing and drapery, footwear, and miscellaneous groups) being calculated from statistics of national consumption during the five years 1926–30. Group and sub-group weights were derived from a household budget collection taken by the Census and Statistics Department in 1930. While not discarding Knibbs' method, this series made also extensive use of geometric means as advocated by Jevons. The food and fuel and light groups were left entirely on an aggregative basis, no sub-group weights being employed. Within the sub-groups of the clothing and drapery group and the footwear group (now treated as separate groups) unweighted geometric means of price relatives were prescribed. The sub-groups in each of these groups were also combined together by unweighted geometric means. Within the sub-groups of the miscellaneous group, the aggregate method was used in the case of two sub-groups only—viz., fares, and household-cleaning supplies. In the other sub-groups unweighted geometric means were used, while all the sub-groups of the miscellaneous group were combined by using weighted geometric means. The combination of the groups to obtain the all-groups index number was likewise by weighted geometric means.
The average level of prices in the twenty-five towns over the five years 1926 to 1930 was equated to 1000, and at the same time the series was “worked back” so as to commence at duly, 1914. The group and sub-group weights for this index are set out below, the total (81.31) indicating that items included in the index made up 81.31 per cent. of the household expenditure revealed by the 1930 budget inquiry.
| Group and Sub-group. | Weight. | |
|---|---|---|
| Groceries | 9.24 | |
| Dairy-produce | 8.47 | |
| Meat | 11.81 | |
| Three food sub-groups combined | 29.52 | |
| Rent | 21.93 | |
| Fuel and light | 6.17 | |
| Clothing and drapery | 9.77 | |
| Footwear | 2.84 | |
| Miscellaneous— | ||
| Furnishings | 1.55 | |
| Ironmongery and brushware | 0.37 | |
| Crockery | 0.26 | |
| Train and tram fares | 3.46 | |
| Newspapers and periodicals | 2.00 | |
| Personal services | 0.54 | |
| Postage and telegrams | 0.51 | |
| Household cleaning supplies | 1.09 | |
| Tobacco | 1.30 | |
| Total, Miscellaneous | 11.08 | |
| Total, All groups | 81.31 |
Fuller descriptions of this index are to be found in the introductions to the 1930 and 1937 issues of the annual Statistical Report on Prices, &c.
The following table shows annual average index numbers for each group, and all groups combined, for each year from 1914 to 1948; for the first quarter of 1949; and, at quarterly intervals, from February, 1943, to November, 1948:—
INDEX NUMBERS OF RETAIL PRICES OF THE VARIOUS GROUPS OF COMMODITIES, SINGLY AND IN COMBINATION, 1914 TO 1949
Base: Weighted average of prices in 1926–30 in twenty-live centres in case of Groups I to IV, and average of prices in 1926–30 in four chief centres in case of Groups V, VI, and VII (= 1000)
| Year. | Food. | Rent (IV). | Fuel and Light (V). | Clothing, Drapery, and Footwear (VI). | Miscellaneous (VII). | All Groups Combined (I-VII). | |||
|---|---|---|---|---|---|---|---|---|---|
| Groceries (I). | Dairy-produce (II). | Meat (III). | All Food (I-III). | ||||||
* Interpolated. | |||||||||
| 1914 (July) | 624 | 719 | 759 | 703 | 535 | 585 | 686 | 601 | 628 |
| 1915 | 770 | 802 | 832 | 803 | 538 | 593 | 746 | 646 | 676 |
| 1916 | 769 | 880 | 908 | 857 | 541 | 637 | 871 | 712 | 724 |
| 1917 | 836 | 933 | 982 | 920 | 553 | 728 | 1031 | 794 | 786 |
| 1918 | 941 | 968 | 1038 | 985 | 566 | 782 | 1216 | 898 | 850 |
| 1919 | 982 | 1025 | 1068 | 1027 | 581 | 852 | 1476 | 975 | 912 |
| 1920 | 1206 | 1184 | 1114 | 1165 | 613 | 1013 | 1653 | 1131 | 1019 |
| 1921 | 1228 | 1257 | 954 | 1134 | 680 | 1131 | 1509 | 1153 | 1034 |
| 1922 | 1100 | 985 | 813 | 958 | 724 | 1045 | 1274 | 1103 | 952 |
| 1923 | 1043 | 1009 | 862 | 965 | 792 | 998 | 1173 | 1055 | 959 |
| 1924 | 1060 | 1053 | 920 | 1005 | 859 | 985 | 1139 | 1033 | 984 |
| 1925 | 1044 | 1043 | 1008 | 1030 | 912 | 993 | 1111 | 1015 | 1004 |
| 1926 | 1047 | 1045 | 994 | 1026 | 962 | 1002 | 1060 | 1013 | 1010 |
| 1927 | 1015 | 1010 | 937 | 983 | 1000 | 1005 | 1017 | 1033 | 1001 |
| 1928 | 1033 | 1006 | 979 | 1004 | 1014 | 1011 | 995 | 1002 | 1006 |
| 1929 | 973 | 999 | 1052 | 1013 | 1019 | 992 | 980 | 986 | 1004 |
| 1930 | 932 | 939 | 1033 | 974 | 1007 | 991 | 947 | 986 | 981 |
| 1931 | 891 | 807 | 834 | 845 | 953 | 987 | 869 | 986 | 906 |
| 1932 | 857 | 722 | 747 | 775 | 844 | 958 | 814 | 973 | 838 |
| 1933 | 819 | 661 | 714 | 732 | 766 | 890 | 816 | 976 | 795 |
| 1934 | 845 | 666 | 796 | 774 | 758 | 841 | 832 | 973 | 808 |
| 1935 | 899 | 749 | 846 | 835 | 774 | 865 | 828 | 980 | 837 |
| 1936 | 878 | 801 | 912 | 870 | 804 | 887 | 837 | 993 | 864 |
| 1937 | 945 | 902 | 1003 | 956 | 828 | 924 | 915 | 1050 | 923 |
| 1938 | 933 | 940 | 1075 | 991 | 858 | 964 | 936 | 1054 | 951 |
| 1939 | 1067 | 999 | 1077 | 1052 | 887 | 991 | 960 | 1086 | 990 |
| 1940 | 1039 | 1010 | 1153 | 1076 | 916 | 1005 | 1061 | 1170 | 1035 |
| 1941 | 1156 | 1010 | 1131 | 1104 | 945 | 1012 | 1159 | 1211 | 1073 |
| 1942 | 1236 | 1023 | 1115 | 1127 | 963 | 1021 | 1243 | 1289 | 1109 |
| 1943 | 1211 | 1029 | 1150 | 1134 | 973 | 1033 | 1347 | 1337 | 1134 |
| 1944 | 1241 | 1030 | 1168 | 1152 | 982 | 1038 | 1413 | 1359 | 1155 |
| 1945 | 1231 | 1032 | 1173 | 1151 | 987 | 1044 | 1442 | 1442 | 1170 |
| 1946 | 1235 | 1033 | 1174 | 1153 | 999 | 1057 | 1470 | 1450 | 1180 |
| 1947 | 1333 | 1071 | 1249 | 1224 | 1010 | 1094 | 1492 | 1478 | 1217 |
| 1948 | 1495 | 1135 | 1471 | 1382 | 1024 | 1191 | 1637 | 1557 | 1314 |
| 1949 (1st quarter) | 1480 | 1125 | 1506 | 1389 | 1031 | 1232 | 1659 | 1544 | 1324 |
| 1943— | |||||||||
| February | 1226 | 1016 | 1108 | 1118 | 969 | 1033 | 1312 | 1338 | 1123 |
| May | 1149 | 1072 | 1115 | 1113 | 972* | 1033 | 1339 | 1337 | 1126 |
| August | 1202 | 1031 | 1160 | 1136 | 975 | 1033 | 1358 | 1336 | 1138 |
| November | 1282 | 989 | 1208 | 1168 | 977* | 1033 | 1379 | 1337 | 1153 |
| 1944— | |||||||||
| February | 1257 | 1016 | 1128 | 1137 | 979 | 1033 | 1389 | 1337 | 1143 |
| May | 1191 | 1077 | 1131 | 1135 | 982* | 1033 | 1408 | 1363 | 1149 |
| August | 1212 | 1024 | 1183 | 1147 | 984 | 1044 | 1425 | 1365 | 1157 |
| November | 1310 | 993 | 1210 | 1179 | 984* | 1044 | 1430 | 1370 | 1170 |
| 1945— | |||||||||
| February | 1225 | 1021 | 1141 | 1133 | 985 | 1044 | 1429 | 1451 | 1163 |
| May | 1194 | 1081 | 1146 | 1142 | 986* | 1044 | 1428 | 1434 | 1164 |
| August | 1224 | 1027 | 1180 | 1150 | 987 | 1041 | 1449 | 1433 | 1170 |
| November | 1299 | 995 | 1213 | 1177 | 991* | 1043 | 1463 | 1449 | 1185 |
| 1946— | |||||||||
| February | 1236 | 1022 | 1140 | 1137 | 995 | 1054 | 1474 | 1452 | 1174 |
| May | 1199 | 1082 | 1140 | 1142 | 998* | 1054 | 1478 | 1443 | 1176 |
| August | 1229 | 1033 | 1185 | 1155 | 1000 | 1059 | 1491 | 1452 | 1185 |
| November | 1267 | 994 | 1218 | 1169 | 1003* | 1059 | 1439 | 1440 | 1183 |
| 1947— | |||||||||
| February | 1267 | 1034 | 1147 | 1152 | 1006 | 1059 | 1449 | 1435 | 1178 |
| May | 1214 | 1112 | 1148 | 1158 | 1009* | 1068 | 1453 | 1465 | 1186 |
| August | 1275 | 1059 | 1193 | 1180 | 1011 | 1082 | 1516 | 1487 | 1206 |
| November | 1594 | 1082 | 1500 | 1409 | 1015* | 1161 | 1553 | 1517 | 1303 |
| 1948— | |||||||||
| February | 1480 | 1113 | 1430 | 1354 | 1018 | 1190 | 1610 | 1534 | 1297 |
| May | 1477 | 1192 | 1437 | 1379 | 1022* | 1191 | 1625 | 1560 | 1312 |
| August | 1505 | 1338 | 1488 | 1393 | 1026 | 1191 | 1642 | 1562 | 1321 |
| November | 1499 | 1090 | 1520 | 1390 | 1029* | 1191 | 1673 | 1561 | 1324 |
Prior to December, 1942, these index numbers were published regularly in the Monthly Abstract of Statistics and other publications of the Census and Statistics Department; but from that date the base 1926–30 series was superseded—in the circumstances arising from war conditions—by the Wartime Price Index described in the section of this report immediately following. The opportunity afforded by the initiation of the post-war Consumers' Price Index has, however, been taken to project this earlier series of index numbers from 1942 to 1949, thus giving a continuous series of index numbers on the one base back to 1914. By linking this series to the admittedly incomplete series of index numbers for the period 1891–1914 given in a preceding table it is possible to obtain a continuous series of retail price index numbers for the whole period 1891–1949.
As has been indicated earlier, the group-weighting pattern of the 1926–30 base index numbers is based on a household budget inquiry taken in 1930. It must be remembered that standards of living are constantly changing and a retail prices index reveals only the changing cost from time to time of maintaining a fixed standard (in this case the 1930 pattern of expenditure). Since spending patterns change appreciably over any considerable period of time (e.g., diversion of expenditure from coal to electricity, or from silk stockings to nylons), the degree of precision with which an index based on a constant regimen can indicate the general price changes becomes cumulatively less as time goes on. Consequently, although the index numbers included in the table are given to four figures, they can be regarded only as giving an approximate indication of retail price trends in periods more or less remote from the base (say, ten years before or after 1930). Furthermore, a retail price index based on pre-war spending loses some of its validity during war years owing to the non-availability of some commodities and services, and the fact that many other commodities and services are available only in limited quantities—quantities which may be far below consumption in the base period of the index.
Wartime Price Index.—In December, 1942, the Wartime Price Index commenced, the former series being thereupon suspended. Parliamentary paper H-43 of 1944 gives detailed information as to this index, which was designed as part of the Government's plan for Economic Stabilization—i.e., for the purpose of recording movements in the prices of such commodities and services as the Minister of Industries and Commerce (the Minister in Charge of Stabilization) might direct. This plan aimed at providing a medium through which wages and salaries might be adjusted in accord with wartime changes in retail prices of essential consumer goods and services. The Wartime Price Index was compiled and gazetted quarterly by the Government Statistician from March, 1943, to December, 1948. Group indices were not published and the method of construction of the index precluded the compilation of separate figures for individual towns. The chief changes introduced by this index were as follows:—
A new schedule of commodities and services (238 items).
Revision of weights in the light of—
The 1930 family budget inquiry.
A limited budget inquiry made by the Department of Scientific and Industrial Research in 1938–39.
Adjustments considered necessary on account of the emergency conditions existing at the time (1942).
Inclusion of fresh fruits and vegetables in the regimen.
Separate treatment in the rent group of rentals of State houses.
Prescriptions of a technique for smoothing seasonal variations in the prices of certain foods.
Discontinuance in the calculation of the use of geometric means (except occasionally when figures were adopted from the base 1926–30 series).
The following table shows the group weights of the Wartime Price Index:—
| Group. | Weight. | |
|---|---|---|
| Groceries | 13.0 | |
| Dairy produce | 10.0 | |
| Meat | 10.0 | |
| Fresh fruit | 3.0 | |
| Fresh vegetables | 3.0 | |
| Total, food group | 39.0 | |
| Rent | 25.0 | |
| Fuel and light | 7.0 | |
| Clothing and footwear | 14.0 | |
| Household drapery | 1.0 | |
| Total, clothing, footwear and household drapery | 15.0 | |
| Fares | 4.5 | |
| Crockery | 0.5 | |
| Furniture | 2.0 | |
| Household cleaning | 1.5 | |
| Ironmongery and hardware | 0.5 | |
| Papers and school stationery | 2.0 | |
| Toilet and personal services | 1.0 | |
| Postages and telegrams | 0.5 | |
| Tobacco | 1.5 | |
| Total, miscellaneous | 14.0 | |
| Total, all groups | 100.0 | |
Although the total weight is shown as 100.0, the index was estimated to include 85 per cent. of all household expenditure, the group weights being adjusted to a percentage basis for convenience in calculation.
The Wartime Price indices for each quarter from 15th March, 1943, to 10th December, 1948 (when the index was discontinued) are now given:—
WARTIME PRICE INDEX
Base: 15th December, 1942 (= 1000)
| Year. | 15th March. | 15th June. | 15th September. | 15th December. |
|---|---|---|---|---|
| 1943 | 1011 | 1000 | 996 | 1001 |
| 1944 | 1005 | 1001 | 1003 | 1004 |
| 1945 | 1006 | 1005 | 1001 | 1003 |
| 1946 | 1009 | 1007 | 1007 | 1008 |
| 1947 | 1013 | 1027 | 1032 | 1085 |
| 1948 | 1103 | 1110 | 1098 | 1107 |
Retail Prices Index.—(Long-term “Linked” Series).—The difficulties involved in making long-term comparisons of retail prices owing to changing habits of consumption, the introduction of new items not available previously, changes in quality of goods, and the special circumstances created by wartime shortages of supplies have already been considered. Nevertheless, there is a real need for some measure—even if approximate—of the long-term trend in retail prices. To meet this need a series of all-groups index numbers has been prepared, equated to the base: first quarter, 1949 (= 1000), indicating the general trend in retail prices from 1907 to 1948. The choice of the datum point.—first quarter, 1949—(= 1000), indicating the general trend in retail prices from 1907 to 1948. The choice of the datum point—first quarter, 1949—is appropriate, since this is the base period of the Consumers' Price Index, and as such will form the starting-point for future comparisons of retail price changes. Also the recent change in the sterling dollar exchange rate will lend particular interest to comparisons of current retail prices with levels ruling immediately prior to that change.
Following are the index numbers:—
RETAIL PRICES INDEX NUMBERS (ALL GROUPS)*
EQUATED TO BASE: FIRST QUARTER, 1949 (= 1000)
(a) Annual Average Index Numbers
| Year. | Index No. |
|---|---|
| 1907 | 440 |
| 1908 | 442 |
| 1909 | 436 |
| 1910 | 441 |
| 1911 | 438 |
| 1912 | 451 |
| 1913 | 461 |
| 1914 | 474 |
| 1915 | 511 |
| 1916 | 547 |
| 1917 | 594 |
| 1918 | 642 |
| 1919 | 689 |
| 1920 | 770 |
| 1921 | 781 |
| 1922 | 719 |
| 1923 | 724 |
| 1924 | 743 |
| 1925 | 758 |
| 1926 | 763 |
| 1927 | 756 |
| 1928 | 760 |
| 1929 | 758 |
| 1930 | 741 |
| 1931 | 684 |
| 1932 | 633 |
| 1933 | 600 |
| 1934 | 610 |
| 1935 | 632 |
| 1936 | 653 |
| 1937 | 697 |
| 1938 | 718 |
| 1939 | 748 |
| 1940 | 782 |
| 1941 | 810 |
| 1942 | 838 |
| 1943 | 856 |
| 1944 | 872 |
| 1945 | 884 |
| 1946 | 891 |
| 1947 | 919 |
| 1948 | 992 |
| 1949 (first quarter) | 1000 |
(b) Selected Monthly Index Numbers†
| Year. | February. | May. | August. | November. |
|---|---|---|---|---|
| 1930 | 752 | 748 | 740 | 727 |
| 1931 | 704 | 690 | 673 | 671 |
| 1932 | 661 | 634 | 620 | 609 |
| 1933 | 602 | 601 | 601 | 604 |
| 1934 | 607 | 613 | 610 | 612 |
| 1935 | 624 | 631 | 633 | 646 |
| 1936 | 634 | 647 | 657 | 667 |
| 1937 | 678 | 694 | 700 | 715 |
| 1938 | 712 | 718 | 719 | 720 |
| 1939 | 732 | 742 | 752 | 775 |
| 1940 | 765 | 777 | 787 | 796 |
| 1941 | 798 | 807 | 810 | 826 |
| 1942 | 816 | 829 | 844 | 859 |
| 1943 | 848 | 850 | 860 | 871 |
| 1944 | 863 | 868 | 874 | 884 |
| 1945 | 878 | 879 | 884 | 895 |
| 1946 | 887 | 888 | 895 | 894 |
| 1947 | 890 | 896 | 911 | 984 |
| 1948 | 980 | 991 | 998 | 1000 |
| 1949 | 1000 | 1002 |
* Food, housing, and fuel and lighting in the years 1907–1913.
† Monthly index numbers are not available prior to 1930.
The continuous series of index numbers shown in the table has been obtained by linking together the various series of index numbers for previous periods. The index used for this purpose for the period 1942–48 has been the 1926–30 base index, the weighting of which was not adjusted to wartime standards. As indicated previously, non-availability or restricted availability of goods and services during the war period affects to some extent the reality of this basis of comparison during those years, the figures being based throughout the whole period 1907–49 on the presumption that the goods and services represented are freely available.
The long-term trend in retail prices shown by the table is perhaps clearly thrown into relief by the diagrams given on page 1016. Interesting features shown clearly in these diagrams are:—
1907–14: Pre First World War.—Relative stability in retail price levels, which hardly moved in the period 1907–10, and increased between 1910 and 1914, the 1914 index being 8 per cent. above the 1907 level.
1914–18: First World War.—Sharp increases in retail prices, which rose, by 35 per cent. between 1914 and 1918.
1918–21: Immediate Post-war Period.—Further sharp upward movement, the retail prices index increasing by 22 per cent. in 1918–21.
1921–22: A decrease in retail price levels for the first time since 1911, the all-groups index falling by 8 per cent. in the one year.
1922–28: A period of gradual upward movement in retail prices (interrupted by a slight fall in 1927), the 1928 index being 6 per cent. above the 1922 figure.
1928–33: Sharp fall in retail prices in each year, the cumulative fall between 1929 and 1933 being 21 per cent. The 1933 index was the lowest recorded since 1917.
1933–38: A period of steady increase in retail prices, the 1938 index being 20 per cent. above the 1933 level. It was still, however, substantially below the previous peak in 1921 (index 781 in 1921, 718 in 1938).
1938–45: Second World War Period.—Increase in retail prices throughout the war period, the 1945 index being 23 per cent. above the 1938 figure. By far the greater proportion of this increase took place between 1938 and 1942 (16.7 per cent.), the increase between 1942 and 1945 being 5.5 per cent.
1945–48: Post Second World War Period.—Increase in retail prices between 1945 and 1947 (4.0 per cent.); sharper increase between 1947 and 1948–7–9 per cent.—(caused largely by removal of subsidies on certain commodities). Cumulative increase 1945–48 was 12.2 per cent.
Summarizing these long-term retail prices increases in terms of annual rates of increase we get the following picture. In the years immediately before the First World War retail prices were very stable. During and immediately after that war prices rose sharply, the average annual rate of increase between 1914 and 1921 being 7.4 per cent. In 1922 there was a recession of 8 per cent. from the peak level of 1921: then six years of gradually rising prices. Between 1928 and 1933 there was a sharp fall in retail prices, the average annual rate of decrease during these years being 4.6 per cent. Since 1933 the trend has been continuously upward, the average annual rate of increase between 1933 and 1948 being 3.4 per cent. The impact of retail price movements during and after the Second World War has been markedly different from the experience in and after the first World War, the average annual rate of increase in retail prices between 1914 and 1921 being 7.4 per cent., and, between 1938 and 1948, 3.3 per cent., both these periods covering the war years and three post-war years.
During the whole period 1907–48 the average annual increase in retail prices was 2.0 per cent. As indicated there were very substantial deviations, in specific periods, from this long term trend.
It is of interest to compare the changes given above with the changes recorded by retail price indices in countries with living standards not dissimilar to those of the New Zealand people. Figures on a reasonably comparable basis are available for New Zealand, Australia, Canada, and the United States of America. The following tables—compiled from official retail price all-groups index-number series for the countries named—show the position. The index numbers in each case have been converted to a 1938 base (= 1000).
CHANGES IN RETAIL PRICES (ALL GROUPS): ANNUAL AVERAGE INDEX NUMBERS (1) Index Numbers—Base: 1938 (= 1000)
| Year. | New Zealand (a). | Australia (b). | Canada (c). | United States of America (d). |
|---|---|---|---|---|
| 1914 | 660 | 766 | 780 | 712 |
| 1918 | 894 | 1009 | 1131 | 1066 |
| 1920 | 1072 | 1300 | 1423 | 1422 |
| 1921 | 1087 | 1129 | 1271 | 1267 |
| 1922 | 1001 | 1087 | 1178 | 1187 |
| 1928 | 1058 | 1125 | 1179 | 1216 |
| 1933 | 836 | 896 | 924 | 917 |
| 1938 | 1000 | 1000 | 1000 | 1000 |
| 1939 | 1041 | 1026 | 993 | 986 |
| 1940 | 1088 | 1067 | 1033 | 994 |
| 1941 | 1128 | 1124 | 1093 | 1044 |
| 1942 | 1166 | 1216 | 1145 | 1156 |
| 1943 | 1192 | 1261 | 1159 | 1226 |
| 1944 | 1215 | 1255 | 1163 | 1245 |
| 1945 | 1230 | 1255 | 1169 | 1274 |
| 1946 | 1241 | 1276 | 1209 | 1382 |
| 1947 | 1280 | 1324 | 1326 | 1579 |
| 1948 | 1382 | 1444 | 1517 | 1698 |
Sources—
Linked series quoted on page 1013.
Quarterly Summary of Australian Statistics.
Prices and Price Indexes: Canadian Bureau of Statistics.
Statistical Abstract of the United States of America.
(2) Percentage Changes over Significant Periods
| Period. | New Zealand. | Australia. | Canada. | United States of America. |
|---|---|---|---|---|
* 1920 in the ease of Australia, Canada, and United States of America, 1921 in New Zealand—the years in which the post-war peak of retail prices was reached in each case. NOTE.—.Minus sign (-) indicates a fall in prices. | ||||
| 1914–18 | 35.5 | 31.7 | 45.0 | 49.7 |
| 1918–20 (or 1921*) | 21.6 | 28.8 | 25.8 | 33.4 |
| 1920 (or 1921*)-1922 | -7.9 | -16.4 | -17.2 | -16.5 |
| 1922–28 | 5.7 | 3.5 | 0.1 | 2.4 |
| 1928–33 | -21.0 | -20.4 | -21.6 | -24.6 |
| 1933–38 | 19.6 | 11.6 | 8.2 | 9.1 |
| 1938–45 | 23.0 | 25.5 | 16.9 | 27.4 |
| 1945–48 | 12.4 | 15.1 | 29.8 | 33.3 |
There is considerable similarity in the movement in retail prices in all four countries between these significant periods—with the exception that in the last period shown—1945–48—the upward movement in retail prices has been very much lower in New Zealand and Australia than in Canada or the United States of America. The increases in retail prices between 1938 and 1948 (covering the war and the post-war years to date) in each country are New Zealand, 38 per cont.; Australia, 44 per cent.; Canada, 52 per cent. : and the United States of America, 70 per cent.
The graphical presentation of the movement in retail prices over the period 1907 to 1949 is now given. The first diagram has been plotted on an arithmetic scale which accords equal value to like movements over the whole scale. The second diagram which has been plotted on a ratio (or logarithmic) scale accords to equal proportionate movements, equal value over the whole scale.
By way of example, movements from 400 to 500, and from 800 to 900, are accorded equal value on an arithmetic scale (100 points in each case). The relative increases are 25 per cent. in the first case (100 points on 400) and 12½ per cent. in the second case (100 points on 800), and on a ratio scale the latter movement would be given half the value of the former. Equal movement on a ratio scale would be accorded to increases from, say, 400 to 500 and 800 to 1000 (25 per cent. in each case).
Each of the diagrams is of value in interpreting the course of price movements over the period quoted.
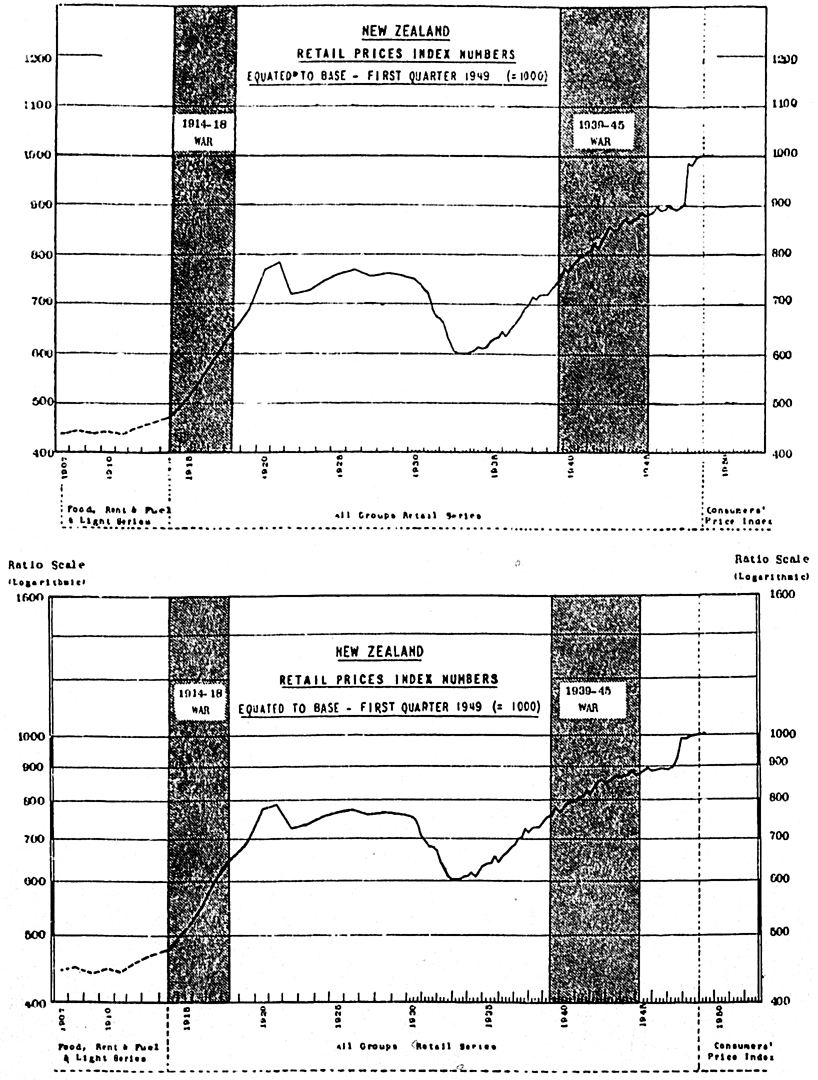
A
- Abattoirs, 791, 924.
- Abolition of Death Penalty, 170.
- Abolition of Provinces, 488.
- Aborigines (see Maoris).
- Abortion, 94, 100, 106.
- Accident Funds, 290, 359, 661.
- Accident Insurance, 543–546.
- State, 557.
- Accidents—
- Aircraft, 81.
- Automobile, 76, 81, 91, 178, 302.
- Cases treated in Hospitals, 100, 101, 102.
- Causes of, 730.
- Deaths from, 76, 81, 85, 86, 91, 284, 302–303, 357, 729–736, 778.
- Frequency Rates, 727.
- Industrial, 646, 684–687, 727–737, 778.
- Mining, 81, 352, 357, 359, 661, 727–737.
- Railway, 81, 284, 302–303, 727–737.
- Time lost through, 734–736.
- Traffic, 81, 284, 302–303.
- Tramway, 81.
- Acclimatization of Fishes, 7, 345.
- Accommodation of Hospitals, 125.
- Accommodation Licences, 785.
- Accounts, Public, 403–450.
- Acreage and Yield of Crops, 898, 901–914, 933.
- Acreage of Holdings, 590, 851.
- Acts passed in 1947 and 1948, 791–808.
- Actuarial Valuation of Superannuation Funds, 841, 482, 483.
- Added Value in Manufacturing, 361, 362, 371, 375, 377, 379, 940.
- Adjustment of Mortgages, 570.
- Administration, 15–18.
- Cook Islands, 811.
- Nine, 817.
- Western Samoa, 819.
- Adolescent Dental Service, 110.
- Adopted Children, 53.
- Adult Education, 160, 794.
- Adulteration of Food, 107.
- Advances—
- Bank, 513, 516, 517, 518, 945.
- Building Societies, 564–568.
- State (see State Advances and State Aid).
- Advertisements, Medical, 107, 108.
- Advertising by Radio, 324.
- Aeradio Stations, 809.
- Aerated-water Factories, 363–374, 381, 385.
- Aerial Surveys, 871.
- Aero Clubs, 194, 304, 309–311, 806.
- Aerodromes, 194, 199, 810.
- Afforestation, 326–328, 338–340.
- Bondholders, 340, 771.
- Companies, 340, 771.
- After-lifetime, Average, 67.
- Age Benefits, 455, 464, 469, 648.
- Age Distribution, 38, 951–953.
- Age, Mean—
- At Death, 67.
- At Marriage, 59.
- Agents Overseas, 846.
- Ages—
- Of Cancer Decedents, 79.
- Of Hospital Patients, 99.
- Of Infants dying, 71–73, 86, 87.
- Of Injured Employees, 732.
- Of Inmates of Charitable Institutions, 129.
- Of Inmates of Mental Hospitals, 131.
- Of Maoris, 38, 951.
- Of Maoris dying, 85, 86, 87.
- Of Migrants, 26.
- Of Offenders probationed, 174,
- Of Parents, 48–52,
- Of Patients in Public Hospitals, 99,
- Of Persons dying, 66–67, 85, 86, 87, 585,
- Of Persons marrying, 58,
- Of Population, 38, 951–953,
- Of Prisoners, 172, 173,
- Of Public-school Pupils, 143, 145,
- Of Registered Aliens, 30,
- Of Tubercular Decedents, 77,
- Aggregate Wealth, 585,
- Aggregation of Incomes, 611,
- Agricultural and Pastoral Production, 779–781, 874–928, 933,
- Persons engaged in, 960, 963,
- Value of, 779–781, 878–883,
- Volume of, 781, 880, 881.
- Agricultural Bursaries, 157.
- Agricultural Clubs, 152.
- Agricultural Colleges, 139, 157, 158, 159, 764,
- 876, 877.
- Agricultural Machinery, 245, 363–374, 381, 388,
- 895–898, 925.
- Agricultural Produce—
- Consumed locally, 741–744, 883.
- Exported, 215–217, 226, 741, 883.
- Gross Farming Income, 878–883.
- Price Index Numbers, 624–627.
- Agricultural Workers Act, 634, 649, 650, 664–666. Agriculture, 874–914.
- Department of, 875–877.
- Research in, 875–877, 903, 913.
- Aides-de-Camp, 831.
- Aides, Nursing, 115.
- Air Force, 188, 193–199, 200, 201, 797.
- Expenditure on, 199, 413.
- Casualties, 196, 200.
- Air Mails, 306–313. Air Training Corps, 197, 198, 310, 797.
- Air Transport and Aviation, 304–313, 792, 799, 806.
- Aircraft, 304–313.
- Accidents, 81.
- Licensing and Control, 303–311.
- Aitutaki Island, 2, 318, 809.
- Alcoholic Liquors—
- Brewed, 384.
- Duty on, 252–256, 384, 406, 415, 417.
- Exports of, 216, 217.
- Imports of, 233, 242.
- Sale of, 785, 788.
- Alexander Turnbull Library, 978.
- Alienation of Land, 851, 858–862, 865.
- Aliens, Naturalization of, 28.
- Aliens, Race, 957–959.
- Aliens, Registration of, 29, 800.
- Alluvial-gold Mining, 7, 348.
- Amalgamation of Local Authorities, 491.
- Ambassadors, 847, 849.
- American Servicemen, Marriages with New Zealand Women, 56.
- Amortization of Debt, 407, 413, 432, 434–137, 441–443, 499, 504, 601.
- Amputees, 472.
- Amusements-tax, 426, 427, 775.
- Anchorage (Suwarrow) Island, 2, 809.
- Angling, 344, 345.
- Animal Life, 14.
- Annexed Islands, 2, 19, 809–819.
- Annual Holidays Act, 655, 659, 663, 665, 797.
- Annual Value Rating-system, 493.
- Annuities, 469, 478–186, 539, 541.
- Ante-natal Services, 127.
- Anthracite, 352.
- Antimony-ore, 347, 350.
- Antipodes Islands, 1, 809.
- Apiculture, 927.
- Apolima Island, 3, 819.
- Apparel, Duty on, 252.
- Appeal Court (see Courts).
- Apples, 874, 899, 912.
- Consumption of, 744.
- Exported, 216–227.
- Fixation of Prices of, 619.
- Issued to School-children, 152.
- Marketing of, 803, 912.
- Apprentices, 646, 680–683, 763, 800.
- Appropriations, Expenditure under, 407.
- Arbitration (see Industrial Conciliation and Arbitration).
- Arbitration Court (see Courts).
- Award Wage-rates, 634–643.
- Area—
- Of Exotic Forests, 339.
- Of Indigenous Forests, 327, 852.
- Of Island Territories, 2, 809–830.
- Of Land Holdings, 589, 850.
- Of New Zealand, 1, 2, 39, 850.
- Of Properties transferred, 854.
- Of Provincial Districts, 31.
- Top-dressed, 910.
- Under Crops, 899–914, 933.
- Under Cultivation, 851, 901–914.
- Armed Forces—
- Aliens serving in, 29.
- Awards for Gallantry, &c., 201, 840.
- Casualties in, 200.
- Demobilization of, 768.
- Overseas at Census date, 31, 964.
- Patients in Public Hospitals, 101.
- Pay and Allowances, 596, 597, 603, 605, 606.
- Strengths of, 199–200, 960, 961.
- Vegetables for, 911.
- Voting by, 784.
- Army, 181–189, 200, 201.
- Expenditure on, 183, 413.
- Arrivals, 22, 25–26, 929.
- Arsenic, 347.
- Arson, 179.
- Articles on Special Subjects in Previous Issues, 978.
- Art-unions, 426, 788.
- Asbestos, 350.
- Assessable Income, 422, 607–617.
- Assessment of—
- Income-tax, 420, 607–617.
- Land-tax, 420.
- Land Values, 508.
- Assets—
- Of Bankrupts, 579, 949.
- Of Ranks, 513, 515, 516, 521, 945.
- Of Building Societies, 567.
- Of Electric-power Undertakings, 374, 755.
- Of Factory Industries. 374, 377.
- Of Fire-insurance Companies, 547.
- Of Friendly Societies, 562.
- Of Life-assurance Companies, 542.
- Of Local Authorities, 500, 583.
- Of Reserve Bank, 513.
- State, 583.
- Assigned Estates, 578–582, 949.
- Assisted Immigration, 26, 702.
- Assurance, Life, 535–542.
- Asylums, 130–134.
- Atafu Island, 2, 3, 318, 826.
- Atiu Island, 2, 318, 809.
- Atlantic Salmon, 346.
- Auckland—
- Broadcasting Stations, 321–325.
- Building Values, 399.
- Dwellings, 401.
- Fires, 551.
- Population, 33, 34, 36.
- Rainfall, 10, 11, 12, 13.
- Retail Prices, 622, 623, 1006, 1007.
- Sales-tax Receipts, 429.
- Shipping, 263, 266–272.
- Sunshine, 10, 11, 12, 13.
- Temperature, 10, 11, 12, 13.
- Tramways, 285–290.
- Auckland Islands, 1, 20, 809.
- Audit of Expenditure, 404.
- Auriferous Mining, 348.
- Australia—
- Debt domiciled in, 438–441, 504–506, 941.
- New Zealand Representatives in, 846.
- Note Circulation, Index of, 520.
- Reciprocal Trade with, 258.
- Representative in New Zealand, 847.
- Retail Prices in, 1015.
- Social Security Reciprocity with, 463, 805.
- Automatic Telephones, 317.
- Automobiles (see Motor-vehicles).
- Autonomy, Local (see Local Authorities).
- Avarau (Palmerston) Island, 2, 318, 809.
- Aviation and Air Transport, 194, 304–313, 792, 799.
- Award Wage-rates (see Wage-rates).
- Awards for Gallantry, &c., 201, 840.
B
- Bachelors marrying, 57, 59.
- Backward Children, 138, 154.
- Bacon and Ham, Consumption of, 743.
- Bacon and Ham produced, 382.
- Balance of Overseas Payments, 206–207, 522.
- Balance of Trade, 203–206.
- Balances of Public Accounts, 404.
- Balance-sheet, State, 583.
- Bananas, 620, 744, 815, 818.
- Banking and Currency, 511–534, 815, 945, 946.
- Banking Companies, Taxation of, 419.
- Bank-notes, 511, 513, 516, 519–521, 531, 945.
- Denominations of, 521, 532.
- In Circulation, 519–521, 945.
- Bank of New Zealand, 514.
- Bankruptcy, 578–582, 647, 681, 797, 825.
- Banks, Indemnity (Exchange) Act, 432.
- Banks, Overseas Assets of. 516, 521.
- Banks, Savings—
- Post Office, 522, 525, 526, 528, 646, 946.
- School, 523, 526.
- Trustee, 524, 525, 526, 529, 804. Barley, 899–902, 905, 908.
- Varieties of, 905.
- Barren Land, 850, 852.
- Basic Rent, 691.
- Basic Wage, 668, 677.
- Beans, 902.
- Beds, Hospital, 124, 125, 126.
- Beef—
- Chilled, 892, 924.
- Consumption of, 743.
- Export of, 226, 227, 230, 892, 924.
- Imperial Government Purchase, 885, 891–893.
- Slaughterings, 924.
- Beer—
- Consumption of, 744.
- Duty on, 252, 253–256, 384, 406, 415, 417.
- Production of, 384.
- Bees, 927.
- Benefit Societies, 561–563.
- Benefits, Social Security, 121, 125, 126, 127, 134, 411, 454–470, 600–606, 688, 699, 793, 805.
- Benevolent Institutions, 127–129.
- Benevolent Societies, 561–563.
- Bentonite, 347, 355, 357.
- Bibliography—
- General, 979–998.
- New Zealand Flora, 14.
- Big-game Fishing, 344.
- Bills, Treasury, 432.
- Birthplaces, 956.
- Births, 41–54, 88, 930.
- In Charitable Institutions, 128.
- In Cook Islands, 812.
- In Niue, 817.
- In State Maternity Hospitals, 127.
- In Western Samoa, 821.
- Of Maoris, 83, 88.
- Biscuit-factories, 363–374, 381, 384.
- Bitumen-surfaced Roads, 292.
- Bituminous Coal, 351, 352.
- Blind, Benefits for the, 459, 463.
- Blind, School for the, 141, 153, 154.
- Blocks of Flats, 398.
- Board of School-children, 150–151.
- Boat-building Works, 363–374, 381, 388.
- Bobby Calves, 925.
- Boer War Pensioners, 451, 469, 476.
- Boilers, Inspection of, 777–779.
- Boiling-down Works, 363–374, 381, 385.
- Bond-issuing Companies, 340, 771.
- Bonds, National Savings, 431, 525.
- Boot and Shoe Factories, 363–374, 381, 389.
- Boroughs, 487–506, 804.
- Area of, 36, 37.
- Bridges in, 292.
- Capital and Unimproved Values, 510.
- Debts, 500, 504, 944.
- Employees, 714.
- Housing, 397–401, 496, 804.
- Mileage of Streets, 292.
- Population, 36, 37.
- Borrowing-powers of Local Authorities, 493.
- Borstal Institutions, 169, 173, 175, 176.
- Boundaries of New Zealand, 1–3.
- Bounty Islands, 1, 809.
- Brass-foundries, 363–374, 381, 388.
- Bread, Fixed Prices for, 618.
- Breeding-bulls, 919.
- Breeding-ewes, 914, 917.
- Breeding-sows, 914, 915, 916, 923.
- Breweries, 363–374, 381, 384.
- Brickworks, 363–374, 381, 387.
- Brides and Grooms, 55–59.
- Bridges, 292.
- Bridle-tracks, 292.
- Brigades, Fire, 556.
- Briquetting and Carbonizing of Coal, 353.
- British Commonwealth Pacific Airlines, 309, 313.
- British Countries, Representatives in New Zealand, 847–849.
- British Nationality, 28, 799.
- British Phosphate Commission, 2, 829.
- British Postal Orders, 316.
- British Preference, 231, 237, 240, 257–260.
- British Sovereignty, 2.
- British Trade Representatives, 847, 849.
- Broadcasting, 321–325.
- Commercial, 324.
- For Schools, 156, 325.
- Time Signals, 789.
- Bronze Coinage, 530.
- Building and Construction, 391–402, 444–450.
- Persons engaged in, 960, 963.
- Building Costs, 625.
- Building Materials, 234, 618, 625.
- Wholesale Price Indices, 625.
- Building Permits, 391, 392, 397–402.
- Building Societies, 564–568.
- Deposits, 526, 529, 568.
- Building, 391–402.
- Building-stones 347, 356, 357.
- Bulk Purchase Agreement, 212, 883–893.
- Bullion, Exports of, 216, 226, 227, 230.
- Bullion Production, 347–348.
- Bureau of Industry, 782–784.
- Burials, 63, 108.
- Bursaries—
- Agricultural, 157.
- Dental, 159.
- Ex-servicemen's, 157, 159, 765.
- Medical, 159.
- Physical Education, 155.
- Physiotherapy, 116.
- Post-primary Teachers', 155.
- Secondary Schools, 149.
- Servicemen, 765.
- Soldiers' Dependants, 149, 766.
- Technical Schools, 149.
- University, 157, 158.
- Bush, 327, 852.
- Bush-working Accidents, 727–737.
- Bushel Units, Weights of, 900.
- Business Failures, 578–582, 949.
- Business Loans, 446, 448, 767, 768.
- Butter (see Dairy-produce).
- Butterfat Production, 921–923.
- Butterfat used in Factories, 383, 921.
- Butterfat Yields, 922.
- By-elections, 785.
C
- Cabinet, 15.
- Members of, 832, 835.
- Cable Tramways, 291.
- Cables, Ocean, 318.
- Cadets, 182, 183, 190.
- Calf-skins exported, 216–230, 939.
- Call, Deposits at, 516, 526, 568.
- Calves slaughtered, 924.
- Campbell Island, 1, 2, 19, 20, 809.
- Camps, 966.
- Camps, Health, 109, 111, 117.
- Camps, Holiday, 119.
- Canada—
- New Zealand Representatives in, 846.
- Note Circulation, Index of, 520.
- Reciprocal Trade with, 259.
- Representatives in New Zealand, 848.
- Retail Prices in, 1015.
- Canadian Mutual Aid, 204, 412.
- Cancer, 76, 77–79, 85, 91, 100, 132.
- Candle-factories, 363–374, 381, 385.
- Canned Fish, 342, 343.
- Canned Fruits, 384.
- Consumption of, 744.
- Canned and Preserved Meats, Production of,
- 382.
- Canned Meat exported, 216, 217, 226, 227, 230, 269.
- Canned Vegetables, 384.
- Consumption of, 744.
- Canterbury Agricultural College, 139, 157, 159, 764, 876.
- Capital—
- Expenditure of Government, 409.
- Invested in Electric-power Undertakings, 374, 751–755.
- Invested in Factories, 373–375.
- Invested in Railways, 277, 948.
- Invested in Telegraph Construction, 316.
- Invested in Telephone Construction, 318.
- Invested in Tramways, 286, 289, 291.
- National, 585.
- Of Banks, 511, 513, 515.
- Of Joint-stock Companies, 772, 774.
- Capital Formation, 596–598.
- Capital Value of Land, 507–510.
- Rating on, 493.
- Capitation Scheme, Social Security, 465.
- Carbonizing and Briquetting of Coal, 353.
- Cargo handled at Ports, 262–272.
- Car-miles run by Trains, 285, 287, 291.
- Carpentry Schools, 761.
- Carnegie Corporation, 160.
- Carrots, 744, 908, 911.
- Casein exported, 216, 217, 226, 227.
- Cassiterite, 350.
- Casualties in War, 200.
- Casualties, Shipping, 275.
- Catchment Boards, 328, 487–506, 714, 795, 802.
- Cattle, 866, 914–916, 919–920, 924, 934.
- Cattle-hides exported, 216–230, 939.
- Causes of—
- Accidents, 730.
- Deaths, 71–82, 85–87, 91, 132.
- Fires, 552.
- Industrial Disputes, 724.
- Insanity, 130.
- Maori Deaths, 85–87.
- Cement-concrete Roads, 292.
- Cement-works, 363–374, 381, 387.
- Cemeteries, 108.
- Census, 19–23, 30–33, 39–40, 698, 950–971.
- Abandonment of, 20.
- Of Dwellings, 393–394, 966–971.
- Of Poultry, 926.
- Of Religions, 954.
- Unemployment Statistics, 698.
- Central Reserve Bank (see Reserve Bank).
- Centres, Vocational Guidance, 150.
- Cereals, 899–905, 933.
- Consumption of, 744.
- Certificated Teachers, 155.
- Certificates—
- Dentists' Practising, 114.
- Engine-drivers, 778.
- Land Titles, 855.
- Marine Officers', 274.
- Masseurs', 113, 115.
- Medical Practitioners', 114.
- Mine Officials', 359, 661, 662.
- Naturalization, 28, 29.
- Opticians', 116.
- Certification of Seed, 876, 906, 909.
- Certification, Trade, 683.
- Chaff, 900, 904, 907.
- Charitable Aid, 121–123, 127–129.
- Charitable Institutions, 121, 125, 127–129.
- Chatham Islands, 1, 809, 917.
- Radio Station, 318.
- Schools, 139, 151.
- Cheese (see Dairy-produce).
- Chemical Fertilizer Works, 363–374, 381, 389.
- Chemists, Registration of, 116.
- Chief Justice, 840.
- Child Hygiene, 108.
- Child Welfare, 70, 108–109, 117, 141, 152–154, 175, 803.
- Childbirth, Accidents, &c., of, 76, 80, 86, 91, 94, 100–102, 106, 130.
- Children, 961.
- Adopted, 53.
- Affected by Divorce Proceedings, 62.
- Allowances in respect of, 454–486.
- Born, Numbers and Rates, 42, 83, 88.
- Born, Sexes of, 45–46, 48, 54, 83, 88.
- Crippled, 117.
- Dental Treatment of, 109.
- Legitimized, 53.
- Medical Inspection of, 108.
- Offences by, 153, 175.
- Under One, Deaths of, 66, 67, 70–74, 85–87, 92, 930.
- Children's Courts, 152, 175.
- Children's Homes, 127–129, 152–154.
- Chilled Beef, 216, 217, 222, 892, 924.
- Chinese—
- In Nauru, 829.
- In New Zealand, 958.
- In Western Samoa, 820.
- Chou Moellier, 900, 902, 908.
- Christchurch—
- Broadcasting Stations, 321–325.
- Building Values, 399.
- Dwellings, New State, 401.
- Fires, 551.
- Population, 33, 34, 37.
- Rainfall, 10, 11, 12, 13.
- Retail Prices, 622, 623, 1006, 1007.
- Sales-tax Receipts, 429.
- Sunshine, 10, 11, 12, 13.
- Temperature, 10, 11, 12, 13.
- Tramways, 285–291.
- Chronological List of Events, 971–977.
- Cigarettes and Tobacco, 252, 254, 256, 363–374, 381, 913.
- Cinematograph Film-hire Tax, 428, 775.
- Cinematograph Theatres, 775, 776.
- Cinnabar, 350.
- Cities, Population of, 34, 36, 37.
- Citizenship, 28, 799.
- Citrus Fruits, 620, 744, 815, 874, 899, 912.
- Civic Planning, 495.
- Civil Aviation, 194, 304–313, 792, 799, 806
- Civil Law Cases, 163.
- Civil List, 15, 407.
- Civil Marriages, 54, 60.
- Civil Service (see Public Service).
- Claims, Insurance, 535–560.
- Clays, 347, 357.
- Clearings, Bank, 518.
- Clergy of each Denomination, 60.
- Marriages by, 60.
- Climate, 4, 9–13, 810, 817, 819.
- Clinics—
- Ante-natal, 127.
- School Dental, 109.
- Venereal Diseases, 95.
- Clocks, Public, 790.
- Closing-hours of Shops, 659.
- Clothing, Rationing of, 747.
- Clothing-factories, 363–374, 381, 390.
- Clothing and Footwear, Retail Prices of, 621–623, 999–1012.
- Clover-seed (see Crass-seed).
- Club Charters, 785.
- Clubs, Aero, 194, 304, 309–311, 806.
- Clubs, Agricultural, 152.
- Clubs, Rifle, 183.
- Clubs, Working-men's, 561.
- Coachbuilding-works, 363–374, 381, 388.
- Coal—
- Carried on Railways, 282.
- Consumption of, 354, 369, 387.
- Exports of, 216, 226, 227, 347.
- Production of, 347, 351–355.
- Public Ownership of, 347, 801.
- Resources, 351.
- Subsidy on, 353, 600.
- Utilization of, 354, 369.
- Coal-miners' Relief Fund, 359, 661, 794.
- Coal-mines Act, 347, 661, 794.
- Coal-mining, 351–355, 358, 722, 723.
- Coastal Shipping, 265, 268, 270, 273.
- Coastal Vessels registered, 272.
- Coast-line, 4.
- Coin held by Banks, 513, 516, 945.
- Coin imported and exported, 209, 530, 935.
- Coinage, 530, 791.
- Coin-in-slot Telephones, 318.
- Colleges—
- Agricultural, 139, 157, 158, 159, 764, 876, 877.
- Military, 183.
- Naval, 190.
- Pharmacy, 117.
- Teachers' Training, 155–156.
- University, 139, 140, 157–160, 791, 793, 931.
- Collieries, 351–355.
- State, 354.
- Combined Schools, 139, 146, 147, 151, 156.
- Commerce and Finance, Persons engaged in, 960, 963.
- Commerce, Overseas, 202–261, 935–939.
- Commercial Afforestation, 340.
- Commercial Air Transport, 304–313, 792, 799.
- Commercial Broadcasting, 324.
- Commercial Failures, 578–582, 949.
- Commercial Gardens, Registration of, 911.
- Commodities—
- Consumption of, 738–747.
- Rationing of, 745–747.
- Community Centre, 161.
- Companies—
- Hank Advances to, 518.
- In Manufacturing Industries, 375.
- In Manufacturing Industries, 375.
- Bond-issuing, 340, 771.
- In Manufacturing Industries, 375.
- In Manufacturing Industries, 375.
- Co-operative Dairy, 921.
- In Manufacturing Industries, 375.
- In Manufacturing Industries, 375.
- Deposits with, 526, 529.
- In Manufacturing Industries, 375.
- In Manufacturing Industries, 375.
- Income of, 596–606, 608, 615–617.
- In Manufacturing Industries, 375.
- In Manufacturing Industries, 375.
- Joint-stock, 771–775.
- In Manufacturing Industries, 375.
- In Manufacturing Industries, 375.
- Land Holdings of, 587.
- In Manufacturing Industries, 375.
- Private, 772–774.
- In Manufacturing Industries, 375.
- Share Price Indices, 629–633.
- Taxation of, 421, 426, 428, 454, 608, 615–617.
- Comparisons with other Countries—
- Birth and Natural Increase Rates, 45.
- Expectation of Life, 68.
- Health Insurance, 648.
- Infant-mortality Rates, 70.
- Marriage-rates, 56.
- Retail Prices, 1015.
- Telephones to Population, 317.
- Unemployment Insurance, 648.
- Compassionate Allowances, 478.
- Compensation Court (see Courts).
- Compensation, Workers', 544, 560, 648, 684–687, 728, 729, 796.
- Compulsory Education, 135.
- Compulsory Insurance, 559, 653.
- Compulsory Registration of Titles, 853.
- Compulsory Unionism, 677, 694.
- Compulsory War Loan, 437.
- Conciliation Councils, 634, 647, 675–679.
- Concrete Products Works, 363–374, 381.
- Concrete-surfaced Roads, 292.
- Condensed-milk Factories, 363–374, 381, 383.
- Conditional Licences (Liquor), 785.
- Confectionery-factories, 363–374, 381, 384.
- Confinement—
- Deaths in, 76, 80, 91, 100, 102, 127.
- State Maternity Hospital Cases, 127.
- Conflagrations, 551.
- Conjugal Condition of Persons marrying, 57.
- Conjugal Condition of Population, 953.
- Conjugal Rights, Restitution of, 61, 62.
- Consent to Marriage, 54.
- Conservation of Forests, 327–329.
- Conservation of Soil, 328, 487.
- Consolidated Fund, 405–408, 415, 417, 560, 601, 942.
- Consolidation of Schools, 150.
- Constitution, 15–18, 791.
- Of Local Districts, 489.
- Construction and Building, 391–402, 444–450.
- Construction of Dwellings (Materials), 969.
- Construction of Railways, Cost of, 277, 409, 948.
- Construction of Roads, 292–297, 409, 411, 418.
- Consuls, 847–849.
- Consumers' Goods, Imports of, 234, 235, 236.
- Consumers' Goods, Wholesale Prices of, 625.
- Consumers' Price-index, 621–623, 998–1016.
- Consumption (see Tuberculosis).
- Consumption of—
- Coal, 354, 369, 387.
- Commodities, 738–747.
- Electricity, 290, 368, 750–757.
- Farm-produce, 741–747, 882.
- Motor-spirits, 299.
- Timber, 336.
- Wool, 389, 886, 918.
- Contagious Diseases, 76, 85, 91, 93–97, 100–102, 106.
- Contingent Liabilities (State), 433.
- Contractors' Liens, 650, 654, 674–675.
- Contributory Negligence, 791.
- Control of—
- Exchange, 207, 522, 531.
- Exports, 208, 355, 815, 825, 883–885, 921.
- Imports, 208, 231–232, 253, 815, 825.
- Land Sales, 651, 856–858.
- Man-power, 651, 701–702.
- Poultry, 927.
- Prices, 618, 619, 795.
- Rivers, 328, 487, 802.
- Conversion of Debt, 435, 505.
- Conveyance of Children to School, 150–151.
- Convictions in Magistrates' Courts, 167, 176, 932.
- Convictions in Supreme Court, 169, 932.
- Convictions—
- For Drunkenness, 167, 176, 177.
- For Radio Offences, 325.
- For Traffic Offences, 167, 176–178.
- Of Juveniles, 175.
- Of Maoris, 176.
- Of Women, 176, 177.
- Cook Islands, 2, 3, 19, 799, 800, 809–816.
- Bibliography, 997.
- Exports to, 230.
- Imports from, 249.
- Population, 19, 812.
- Public Finance, 815.
- Radio-stations, 318, 815.
- Trade, 815.
- Cooperages, 363–374, 381, 386.
- Co-operative Credit Associations, 449.
- Co-operative Dairy Companies, 921.
- Co-operative Public Works, 647, 648.
- Copper-ore, 347, 349.
- Cordial-factories, 363–374, 381, 385.
- Corn Crops, 899–905, 933.
- Coroners' Inquests, 164.
- Correspondence Classes, 139, 147, 151–152.
- Cost of Living, 618–623, 988–1016.
- Bonuses, 669.
- Costs—
- Factory, 361–390, 890.
- Farm, 890.
- Owner Occupied Houses, 591, 998–1003.
- Railway Construction, 277, 409, 948.
- Roading, 293–296, 409.
- Council, Dental, 114.
- Council, Executive, 15.
- Members of, 832, 835.
- Council for Educational Research, 160.
- Council, Legislative, 15.
- Members of, 837.
- Council, Medical Research, 113.
- Council of Adult Education, 160.
- Council of Defence, 180.
- Council of Legal Education, 157.
- Council of Sport, National, 118.
- Counties, 487–506.
- Area of, 35, 36.
- Bridges in, 292.
- Capital and Unimproved Values, 510.
- Debt, 500, 504, 944.
- Employees of, 714.
- Housing, 400.
- Mileage of Roads, 292.
- Population, 35, 36.
- Country Lands, Mortgages on, 446, 571, 573, 587–590.
- Country Library Service, 141, 161–162.
- Country Quota, 16.
- Courts—
- Appeal, 170, 840.
- Arbitration, 634–644, 646–683, 792, 808, 840.
- Bankruptcy, 578.
- Children's, 152–153, 175.
- Compensation, 687, 840.
- Divorce, 61.
- Judges of, 840.
- Land Sales, 766, 806, 856–858.
- Land Valuation, 508, 803, 804, 806, 840, 856–858.
- Magistrates', 163, 166–168, 175–178, 578, 687, 792, 932.
- Maori Appellate, 865.
- Maori Land, 864.
- Of Review, 571.
- Supreme, 61, 163, 168–170, 578, 797, 807, 840, 932.
- Cover, Fire, 548–549, 558.
- Cow-testing, 874, 876.
- Cranes, Inspection of, 778.
- Crayfish, 344.
- Cream-separators on Farms, 895.
- Credit, Rural Intermediate, 449.
- Creditors' Petitions, 578, 579.
- Crematoria, 108.
- Crews of Overseas Vessels, 25.
- Crime, Law and, 163–179, 932.
- Criminals, Habitual, 171, 174.
- Crippled Children, 117.
- Crops, 851, 899–914, 933.
- Crown Lands, 850, 858–863.
- Rates paid to Local Authorities, 498.
- Crown Tenants, 861.
- Advances to, 860.
- Cultivation, Area in, 851, 899–914.
- Cupro-nickel Coinage, 791.
- Currency and Banking, 511–534, 945, 946.
- Curriculum, School, 142.
- Customary Land, 863.
- Customs, Representatives Overseas, 847.
- Customs Tariff and Revenue, 249–261, 793.
- Customs Taxation, 249–261, 406, 415, 417, 599, 793.
- Cycle-works, 363–374, 381, 388.
D
- Daily Incidence of Fires, 554.
- Dairy Cows, 866, 896, 914, 915, 916, 919, 923, 934.
- Dairy Industry, 363–374, 381, 383, 518, 664, 874, 876, 878–885, 887–891, 895, 920–923.
- Dairying-machinery, 246, 363–374, 381, 388, 895.
- Dairy-produce, 791, 800, 920–923.
- Bulk-purchases of, 887–889.
- Consumption of, 742, 746, 883.
- Export of, 215–230, 269, 742, 883, 885, 937.
- Export Price Indices, 626, 627.
- Factories, 363–374, 381, 383, 518, 876, 880, 890, 920.
- Fixation of Prices, 618, 620, 791, 890.
- Grading of, 876, 920.
- Gross Farming Income, 878–881.
- Marketing of, 791, 803, 883–885, 887–889.
- Prices paid for, 887–891.
- Processing of, 383.
- Production of, 381, 383, 780, 921–923.
- Purchase for War Purposes, 885, 887.
- Rationing of, 746.
- Retail Prices Indices, 1008–1012.
- Dairy Products Marketing Commission, 791, 803, 884, 888, 890.
- Damage (Earthquake and War) Insurance, 403, 414, 559.
- Danger (Pukapuka) Island, 2, 318, 809.
- Dangerous Drugs, 107.
- Dates of Maturity of Debt, 435–437, 438, 506.
- Dates of Principal Events, 971–977.
- Daylight Saving, 789.
- Dead-births, 41, 47, 54, 63, 74, 127.
- Deaf, School for the, 154.
- Dealing in Coin, Restriction on, 530.
- Death Duties, 415, 423–425, 599, 795.
- Estates certified for, 584.
- Death Penalty abolished, 170.
- Deaths, 63–82, 84–87, 90–92, 96, 100, 102, 132, 164, 930.
- Accidental (see Accidents).
- Distribution over Year, 65.
- Due to Earthquakes, 9.
- From Puerperal Causes, 76, 80, 91, 100, 102, 127.
- In Charitable Institutions, 128.
- In Cook Islands, 812.
- In Hospitals, 97–102, 124.
- In Mental Hospitals, 132–133.
- In Nine, 817.
- In State Maternity Hospitals, 127.
- In Western Samoa, 821.
- Inquests on, 164.
- Neo-natal, 66, 70–75, 86, 87.
- Of Friendly Society Members, 562.
- Of Infants, 66, 70–74, 85–87, 92, 930.
- Of Insured Persons, 538, 540, 541.
- Of Maoris, 42, 84–87, 90, 92, 164.
- Of Servicemen Overseas, 64, 184, 185, 200, 792.
- Debentures, 421, 430, 501, 941.
- Debenture-tax, 421.
- Debits, Bank, 518.
- Debt, Conversion of, 435, 505.
- Debt of Local Authorities, 123, 444, 500, 501–506, 943, 944.
- Debt, Public, 430–444, 941.
- Debtors' Petitions, 578, 579.
- Deceased Persons, Estates of, 583–585, 587, 769–771.
- Decrees in Divorce, 61.
- Deeds Registration, 852.
- Defaulters, Military, 18, 172.
- Defective Children, 154.
- Defectives, Mental, 130–134.
- Defence, 180–201
- Expenditure on, 407, 413, 600.
- Defence Council, 180.
- Defence Science, 180–181.
- Deferred-maintenance Allowance, 420.
- Deferred-payment Lands, 858–862.
- Deficits, Consolidated Fund, 942.
- Degrees, University, 114, 140, 158.
- Demobilization of Servicemen, 768.
- Demography, 19–40, 929, 930.
- Denominational Schools, 138, 146.
- Denominations of Bank-notes, 520, 532.
- Denominations of Coins, 530.
- Denominations, Religious, 60, 954.
- Density of Population, 39.
- Dental Benefits (Social Security), 110, 469.
- Dental Bursaries, 159.
- Dental Clinics, 109.
- Dental Council, 114.
- Dental Hygiene, 109.
- Dental Nurses, 110.
- Dental Services, 109, 110, 469.
- Dental Treatment of School-children, 109.
- Dentists, Registration of, 114.
- Department of Health, 104–105.
- Departments, Government, 832, 835, 841.
- Departures, 22, 25–26, 929.
- Dependants of Soldiers, 470–478.
- Dependencies, 2, 19, 809–830.
- Dependent Children, Care of, 141, 152–154, 175.
- Deposits—
- By Insurance Companies, 535, 546.
- Interest-rates on, 526, 528–530, 568.
- With Building Societies, 526, 529, 568.
- With Local Authorities, 530.
- With Reserve Bank, 513, 526.
- With Savings-banks, 522–525, 526, 946.
- With Trading Banks, 516, 517, 526, 528, 945.
- With Trading Companies, 526, 529.
- Depreciation Allowances, 419, 420, 592, 596, 598, 795, 808.
- Depreciation of New Zealand Currency, 532.
- Designs, Registration of, 777, 794.
- Destination—
- Of Exports, 206, 217–225.
- Of Shipping, 263–264.
- Detention, Reformative, 154, 171, 172, 173.
- Development Loans, 403, 413, 431, 435.
- Development of Lands, 858–863, 866.
- Diagnosis, X-ray, Services, 467, 470.
- Diagrams and Graphs—
- Banking, 516, 520, 522.
- Building Permits, 398.
- Butterfat Production, 923.
- Cows in Milk, 923.
- Dairy Production, 923.
- Electricity Consumption, 757.
- Export-prices Indices, 628.
- Exports, 206.
- Factory Production, 372, 379, 380.
- Imports, 206.
- Life Assurance, 536, 542.
- Motor-spirits Consumption, 299.
- Motor-vehicles licensed, 299.
- Mortgages, 576.
- Note Circulation, 520.
- Overseas Assets of Hanks, 522.
- Overtime in Factories, 380.
- Price Indices, 628, 630, 1016.
- Pigs, 923.
- Production, 372, 379, 903, 923.
- Rates of Interest, 576.
- Reserve Bank, 520, 522.
- Retail-prices Indices, 1016.
- Share-prices Indices, 630.
- Short-time in Factories, 380.
- Taxation Revenue, 417.
- Trading Banks, 516, 520, 522.
- Vital Statistics, 45, 78.
- Wheat Production, 903.
- Wholesale-prices Indices, 628.
- Diatomite, 347, 357.
- Dietitians, Hospital, 113.
- Diphtheria, 76, 85, 91, 94, 95, 96, 100–101, 106, 109.
- Diplomas, 114, 140.
- Diplomatic Privileges, 794.
- Diplomatic Representatives, 846–849.
- Direction to Essential industry, 701.
- Direct Taxation, 414, 597, 599, 604, 605.
- Disabilities from Industrial Accidents, 727–737.
- Disabled Servicemen, 470–478, 763.
- Discharged Mortgages, 567, 572, 577.
- Discharged Patients, 97–102.
- From Mental Hospitals, 132.
- Discharged Soldiers (see Soldiers).
- Discharged Soldiers Settlement, 444, 448, 651, 760–768, 856–858, 861, 862–863.
- Discount Rates, 528.
- Disease, Prevention of, 109.
- Diseases, Notification of, 93, 106.
- Diseases, Principal, Deaths from, 76–82, 85, 86, 91, 99.
- Diseases treated in Hospitals, 99–102.
- Disputes, Industrial, 675–679, 719–726.
- Dissolution of Marriage, 61.
- Dissolution of Parliament, Dates of, 837.
- Distribution of Deaths over Year, 65.
- Distribution of Population, 30–38.
- By Ages, 38, 951–953.
- By Industries, 959, 960.
- By Occupational Status, 961.
- District High Schools, 139, 146, 148, 156, 931.
- District Nurses, 108, 117, 127, 468.
- Districts, Local, 487–506, 714, 717, 943, 944.
- Districts, Military, 182.
- Dividends (Totalizator) Duty, 426.
- Dividends, Bankruptcy, 579, 949.
- Divorce, 61–62, 791.
- Divorced Persons, Numbers of, 953.
- Divorced Persons remarrying, 57.
- Dolomite, 347, 357.
- Domains, Public, 852, 859.
- Domestic Assistance, 468.
- Domicile of Debt, 431, 438–441, 504–506, 941.
- Drainage Districts, 487–506, 714, 802.
- Dredging, Gold, 348.
- Drilling for Oil, 355.
- Drills, Prospecting, 357.
- Drivers' Licences, 298.
- Drowning Accidents, 81.
- Drugs, 107, 465, 791.
- Drunkenness, 167, 172, 176, 177, 178.
- Ducks, 926.
- Dunedin—
- Broadcasting Stations, 321–325.
- Building Values, 399.
- Dwellings, 401.
- Fires, 551.
- Population, 33, 34, 37.
- Rainfall, 10, 11, 12, 13.
- Retail Prices, 622, 623, 1006, 1007.
- Sales-tax Receipts, 429.
- Shipping, 263, 266–272.
- Sunshine, 10, 11, 12, 13.
- Temperature, 10, 11, 12, 13.
- Tramways, 285–291.
- Duration of Marriage, 49, 50, 62.
- Duration of Residence of Overseas Born, 957.
- Duration of Strikes, 721.
- Dutiable Imports, 249–261.
- Duties—
- Customs and Excise, 249–261, 415, 417, 599, 793.
- Death, 415, 423–425.
- Export, 254, 417, 801, 826.
- On Lottery Tickets, 426, 788.
- On Overseas Passenger-tickets, 426, 801.
- Stamp, 415, 426.
- Dwellings—
- Advances for, 444–450, 496, 564–568, 767, 860, 867.
- Census Enumerations, 393–394, 966–971.
- Electricity Supply, 969.
- Erected, 394–402, 867.
- Fire Losses on, 555.
- In course of Erection, 966.
- Maori, 401, 689, 867, 966, 970.
- Materials of which constructed, 969.
- Rents, 619, 690–692, 998–1016.
- Size of, 968, 970.
- Soldiers', 767.
- State, 394–396, 401, 689.
- Tenure of, 967.
- Untenanted, 393, 966.
- Workers', 394, 401, 444–450, 496, 649, 689.
E
- Earned Income, 608, 610.
- Earnings of Factory Employees, 365, 366.
- Earning-power, loss of, 736.
- Earthquake Insurance, 403, 414, 559.
- Earthquakes, 8–9.
- Deaths due to, 9.
- Economic Pensions, 475.
- Economic Stabilization, 618, 619, 620, 637, 652, 653, 672–674, 679, 801, 877.
- Education, 135–162, 325, 765, 931.
- Act, 135, 667, 805.
- Boards, 135–138, 805.
- Endowments, 136, 141, 804, 859, 861.
- Expenditure on, 141, 150–151, 407, 600, 794.
- Of Ex-Servicemen, 765, 768.
- Education Gazette, 156.
- Educational Association, Workers', 161.
- Educational Research, 160.
- Eels, 343, 345.
- Eggs, 620, 747, 926.
- Exported, 216, 217.
- Retail prices of, 1000–1005.
- Elections, General, 16, 784, 785.
- Electoral Districts, 16, 785, 838, 839.
- Electoral Qualifications, 18, 489, 806.
- Electors, Registration of, 18, 489, 806.
- Electric—
- Current, 290, 363–374, 381, 748–759.
- Power Boards, 487–506, 751–753, 792, 944.
- Power in Factories, 360, 368, 759.
- Power on Farms, 874, 895.
- Railways, 276, 277.
- Tramways, 285–291.
- Electric Supply Accounts, 409, 413, 794.
- Electrical Engineering Works, 363–374, 381.
- Electricity, Consumption of, 290, 368, 748–759.
- By Tramways, 290.
- Electricity Generation and Supply, 363–374, 381, 409, 748–759, 801.
- Electricity Supply to Dwellings, 969.
- Emergency Benefits, 463, 469.
- Emergency Precautions Services, 200.
- Emergency Reserve Corps, 200.
- Pensions for, 469, 471, 474, 476.
- Emigration, 21, 25–26, 929.
- Empire Air Training Scheme, 194.
- Employees—
- Cinematograph-theatres, 775.
- Electric-supply, 754.
- Factory, 361–368, 375–379, 382–390, 713, 715, 940.
- Hospital Boards, 714.
- In industry, 703–706, 715, 961.
- Legislation affecting, 646–692.
- Local Authority, 714, 717.
- Mining, 352, 355, 357.
- Postal, 320.
- Public Service, 846.
- Public Works, 713, 716.
- Railway, 283.
- State Coal Mines, 355.
- Tramway, 285, 291.
- Unions of, 646, 675–679, 693–697.
- Wage-rates of (see Wage-rates).
- Employers, 693, 697, 961.
- Employers' Liability, 543, 544, 560, 648, 684–687, 796.
- Insurance, 543, 544, 557, 560.
- Employers' Unions, 693.
- Employment and Unemployment, 687, 698–718, 961.
- Employment Bureaux, 687, 699.
- Employment Placement Scheme, 688, 710.
- Employment Promotion, 650, 688, 699.
- Fund, 602, 688.
- Taxation, 417, 428, 636.
- Employment, Seasonal Fluctuations in, 365, 715–718.
- Employment, Survey of, 702–707.
- Employment Service, National, 688, 701–713, 715.
- Employment Vacancies, 707–709.
- Enactments affecting Labour, 646–692.
- Enactments of 1947 and 1948, 791–808.
- Endowments, Education, 136, 141, 804, 859, 861.
- Endowments, National, 326, 339, 859.
- Engine-drivers' Certificates, 778.
- Engineering-works, 363–374, 381, 388.
- Engines—
- Employed in Factories, 368.
- Employed on Farms, 895.
- Inspection of, 777.
- Railway, 277, 278.
- Ensilage, 851, 899, 900, 901, 907, 908.
- Entertainment, Persons engaged in, 960.
- Entertainments-tax, 426, 427, 775.
- Entrepôt Trade, 227.
- Entry, Ports of, 263.
- Envoys Extraordinary, 846, 847, 848, 849.
- Erosion, 328, 487, 802.
- Essential Undertakings, 701.
- Estate Duty, 423, 424.
- Estates—
- Acquired for Settlement, 860–863.
- Administered by Public Trust Office, 769–771.
- Assigned, 578–582.
- Of Deceased Persons, 584.
- Ewes, Breeding, 866, 917.
- Examinations—
- Education Department, 140.
- Electric-tram Drivers', 779.
- Engine-drivers', 778.
- Marine Officers', 274.
- Medical, of School Children, 108.
- Medical Practitioners', 114.
- Mining, 359, 661.
- Navy, Candidates for, 140, 190.
- Of Motor-vehicles 298.
- Public Service Entrance, 140, 844, 846.
- Teachers', 140.
- University, 114, 140, 844.
- Excess-profits Tax, 416, 419.
- Exchange (Currency), 513, 516, 532–534.
- Banks Indemnity (Exchange) Act, 432.
- Control of, 207, 522, 531.
- Effect on Trade Statistics, 202–206.
- Expenditure on, 406, 431.
- New Zealand – London, 532.
- Rates of, 532–534, 801.
- Reserve, 513.
- Exchanges, Telephone, 317.
- Excise Duties, 253, 256, 415, 417, 599.
- Executive Council, 15.
- Members of, 832, 835.
- Exemptions from Taxation—
- Income-tax, 418, 608, 613.
- Land-tax, 420.
- Ex-nuptial Births, 50, 51.
- Exotic Trees, Planting of, 338–340.
- Expectation of Life, 67.
- Expeditionary Forces, 184–187, 200, 973, 974, 975.
- Expenditure—
- Air Force, 199,413.
- Army, 183, 413.
- Audit of, 404.
- Broadcasting, 324.
- Cinematograph Theatres, 775.
- Education, 141, 154, 407.
- Electric-power Boards, 499, 752.
- Local Authority, 121–123, 499, 599, 601, 943.
- Mental Hospitals, 133–134, 407.
- National, 591–606.
- Navy, 191, 413.
- Post and Telegraph, 319.
- Public, 403–414, 591–602, 942.
- Railway, 277, 278–281, 411, 948.
- Rehabilitation, 407, 413, 767, 768.
- State Forest, 338.
- Tramway, 286–291.
- War, 183, 191, 199, 407, 413, 434, 437.
- Export Control, 208.
- Dairy-produce, 884, 893, 920.
- Honey, 928.
- Kauri-gum, 355.
- Meat, 884.
- Export Duties, 254, 417, 801, 826.
- Export Licences, 208, 815, 825.
- Export Prices, 228–230, 625–627, 632, 633, 739, 885–893.
- Export Surplus, 203–206.
- Exports, 202–230, 258, 259, 738–742, 935–939.
- Currency, Restrictions on, 531, 815, 825.
- Dairy-produce, 216–230, 742, 887–889, 937.
- Excess over Imports, 203–206.
- Fish, 216, 226, 227, 343.
- Gold, 216, 226, 227, 230, 347, 801, 937.
- Meat, 216–230, 269, 891–893, 924, 936.
- Minerals, 216–230, 347.
- Of Ports, 269.
- Receipts from, 207.
- Specie, 209, 531.
- Timber, 216–227, 337.
- Valuation of, 202.
- Value in Sterling, 202, 208.
- Value on Gold Basis, 208.
- Values, Index Numbers, 208, 739, 740.
- Volume, Index Numbers, 208, 229, 740.
- Wool, 216–230, 918, 936.
- External Migration, 21, 25–26, 929.
- External Trade, 202–261, 935–939.
- Extra-marital Conceptions, 50, 51, 54.
- Extra-urban Planning, 495.
F
- Factories, 360–390, 940.
- Accidents in, 727–737.
- Act, 647, 650, 654, 656–657.
- Dairy, 363–374, 381, 383, 921–923.
- Employees, 361–368, 375–380, 382–390, 713, 715, 940.
- Fire Losses on, 555.
- Promotion of, 782–784.
- Factory Costs Allowance, 890.
- Factory Production, 360–390, 780, 781, 940.
- Fair Rents Act, 650, 690, 797, 806.
- Fakaofo Island, 2, 3, 318, 826.
- Fallow Land, 851, 901.
- Family Allowances, 451.
- Family Benefits, 423, 458, 464, 469, 802.
- Family Homes Protection, 647, 689.
- Fanuatapu Island, 3.
- Farm Costs Allowance, 890.
- Farm Employees, Wage-rates, &c., 634–643, 649, 650 654, 664–666.
- Farm Finance, Provision of, 444 450, 518, 649, 767, 768, 860, 862, 866.
- Farm Holdings, 586–590, 850.
- Farm Implements, 895–898, 925.
- Manufacture of, 363–374, 381, 388.
- Farm Loans for Ex-servicemen, 767.
- Farm Machinery, 234, 245, 363–374, 381, 388, 895–898.
- Farm Produce—
- Consumption of, 741–747, 883.
- Export of, 216–230, 741, 883–894, 909, 914, 918, 924, 936–939.
- Marketing of, 791, 883–894.
- Price Indices, 626–628, 632, 633.
- Farm Stabilization Accounts, 597, 602, 878.
- Farm Training and Settlement of Discharged Servicemen, 763–765, 768.
- Farmers—
- Advice for, 875–877.
- Financial Assistance to, 444–450, 518, 649, 860, 862, 866, 877.
- Mutual Fire Insurance, 555.
- Farming, 874–928, 960.
- Farming Income, Gross, 878–883.
- Fanning Industry, Subsidies to, 877.
- Farming Lands, Mortgages on, 448, 571, 573, 587–590.
- Fathers—
- Ages of, 48.
- Duration of Marriage of, 50.
- Fauna, 14.
- Feeble-minded, Schools for, 153.
- Feeder Stations, Radio, 318.
- Feilding Community Centre, 161.
- Fellmongering-works, 363–374, 381, 385.
- Female Suffrage, 18, 973.
- Female Wage-rates, 367, 637, 641, 642, 645.
- Fern Lands, 852.
- Fertilizer Factories, 363–374, 381, 385, 389, 798.
- Fertilizer used, 910.
- Fertilizers, Prices of, 618.
- Fertilizers, Subsidy on Manufacture of, 878.
- Fertilizers, Subsidy on Transport of, 877.
- Fibre—
- Linen-flax (see linen-flax).
- Phormium (see Phormium).
- Field Crops, 900–914.
- Fiji, Contribution to War Expenses, 412.
- Film-hire Tax, 406 128.
- Film Unit, National, 979.
- Finance, Farm, 444–450, 518, 649, 767, 768, 860–863, 866.
- Finance of Local Authorities, 121–123, 496–506, 943, 944.
- Hospital Boards, 121–123.
- Finance, Public, 403–450, 591–606, 801, 807, 941, 942.
- Fire Brigades, 556.
- Fire Districts, 330, 487–506, 802.
- Fire Inquests, 164.
- Fire Insurance, 546–556.
- State, 558.
- Fire Losses, 548–555.
- Fire-prevention in Forests, 328, 330, 793, 802.
- Fires, Daily Incidence of, 554.
- Fires on Vessels, 275.
- Fires, Seasonal Incidence of, 553.
- First Births, 49–51.
- Fish, 7, 341–346.
- Canned, 342, 343.
- Consumption of, 744.
- Exported, 216, 226, 227, 343.
- Retail Prices of, 1003, 1004, 1005.
- Value of Production, 342, 780.
- Fisheries, 341–346, 799, 960, 963.
- Fishing, Big-game, 344.
- Fish-liver, Oil, 343.
- Fixation of Prices, 618, 883–893.
- Fixed Deposits, 516, 526, 528, 529, 568.
- Flats, 398, 966, 970.
- Flax Lands, 852, 900, 913.
- Flax, Linen, 409, 875, 900, 901, 913.
- Exports of, 216, 217, 226, 227, 914.
- Flax, Phormium (see Phormium).
- Floating Debt, 432, 434.
- Flogging abolished, 170.
- Flora, 14.
- Flotation of Loans, 430, 435, 437.
- Flour—
- Consumption of, 744.
- Fixed Prices for, 618.
- Production of, 383.
- Restriction on Imports, 903.
- Flour-mills, 363–374, 381, 383.
- Flying, 188, 193–199, 304–313.
- Flying Clubs, 194, 304, 309–311.
- Fodder Crops, 851, 899, 900, 901, 904, 907–910.
- Fog Signals, 274.
- Food and Drugs, Sale of, 107, 791.
- Food Consumption, 742–747.
- Food, Retail Prices of, 621–623, 632, 633, 999–1012.
- Foodstuffs, Export Prices of, 626, 627.
- Foodstuffs, Wholesale Prices of, 624.
- Footwear, Exports of, 216, 217.
- Footwear Factories, 363–374, 381, 389.
- Footwear, Imports of, 242.
- Footwear, Rationing of, 747.
- Footwear and Clothing, Retail Prices of, 1000–1012.
- Foreign Consuls, 847–849.
- Foreign Securities, Wartime Control of, 534, 815, 825.
- Foreign Vessels, 264.
- Foreigners, Naturalization of, 28.
- Forest Fire Prevention, 328, 330, 793, 802.
- Forest Produce exported, 216, 217, 225, 226, 227, 337, 741.
- Forest Trees, 331–334.
- Forestry, 326–340, 803.
- Persons engaged in, 960, 963.
- Value of Production, 780.
- Forty-hour Week, 644, 656.
- Foster-homes for Children, 153.
- Foundries, 363–374, 381, 388.
- Foveaux Strait Oysters, 343.
- Fowls, 926.
- Fractions, Totalizator, 426.
- Franchise, General Government, 18.
- Franchise, Local Government, 18, 489.
- Free Ambulance, 117.
- Free and Dutiable Imports, 249–261.
- Free Deposits, 516.
- Free Education, 135–159.
- Free Radio-licences, 325.
- Freehold, Crown Land made, 861.
- Freehold Land, 850, 851, 861.
- Freezing-works, 363–374, 381, 382, 518.
- Freight—
- Carried by Air-transport, 306–309.
- Carried by Shipping, 262–272.
- Carried by Trains, 279, 281–283, 948.
- Subsidy, 354, 877.
- Train-mileage, 283.
- Frequency Rates of Accidents, 727–730.
- Fresh-water Fisheries, 345–346.
- Friendly Societies, 561–563, 646, 800.
- Frosts, 11, 12, 13.
- Frozen Meat exported, 216–230, 269, 891, 924, 936.
- Fruit—
- Consumption of, 744.
- Export of, 216–217, 225, 226, 227.
- Fixation of Prices of, 620.
- Imports of, 241, 249.
- Industry, 851, 876, 878, 899, 912.
- Retail Prices of, 621–623, 1000–1013.
- Fruit-preserving Factories, 363–374, 381, 384.
- Fuel and Light, Retail Prices of, 621–623, 1000–1012.
- Fuels and Lubricants, Imports of, 234, 235, 236, 244.
- Fuller's Earth, 347, 357.
- Funded Debt, 442.
- Funds of Public Account, 403–414.
- Funeral Funds, 562.
- Furniture Loans, 446, 448, 767, 768.
- Furniture-making Works, 363–374, 381, 386.
G
- Gaming Act, 788.
- Gaming Referendum, 789, 800.
- Gaols, Prisoners in, 170–174, 932.
- Garden Tractors, 895, 896.
- Gardens, Acreage in, 851, 900, 911.
- Gardens (Commercial), Registration of, 911.
- Garrisons, Pacific Islands, 184, 187.
- Gas, Consumption of, 387.
- Gas District, 487–506, 714.
- Gasworks, 363–374, 381, 387.
- Gauge, Railway, 276.
- Geese, 926.
- General Assembly, 15–18, 837–839.
- General Elections, 16, 784, 785.
- Generating Stations, 748, 759.
- Geodetic Survey, 869.
- Geographical Features, 4–7.
- Geographic Board, 872.
- Geological Survey, 355, 357.
- Geology, 8.
- Geysers, 4.
- Gift Duty, 423, 425, 795.
- Gilbert and Ellice Islands, 3.
- Glaciers, 5.
- Glue Factories, 363–374, 381.
- Gold, Discovery of, 7, 30, 972, 973.
- Gold exported, 216, 226, 227, 230, 347, 801, 937.
- Duty on, 254, 417, 801.
- Gold-production, 347.
- Gold Reserve, 513.
- Goldfields, Subsidized Roads on, 359.
- Gold-mining, 348, 358.
- Gonorrhœa, 95, 106.
- Goods carried on Railways, 279, 281–283, 948.
- Goods-service Licences, 301.
- Government Departments, 832, 835, 841.
- Government Finance, 403–450, 591–606, 941, 942.
- Government Housing, 394–396, 401, 408, 433, 434,450, 690, 867.
- Government Insurance, 556–566.
- Government Railways, 276–284, 948.
- Industrial Tribunal, 284.
- Superannuation Fund, 284, 483.
- Government Representatives Overseas, 846.
- Government Roads, 292.
- Government Service Tribunal Act, 667, 808.
- Government Superannuation Fund, 478.
- Government, System of, 15–18.
- Government Valuations, 507–510.
- Governor-General, 831.
- Powers, Duties, &c., 15.
- Grading—
- Of Dairy-produce, 876, 920.
- Of Honey, 876.
- Of Phormium Fibre, 876.
- Of Public Servants, 844.
- Graduated Land-tax, 418.
- Graduates, University, 157.
- Grain Crops, 851, 899–905, 933.
- Grain-mills, 363–374, 381, 383.
- Granite, 356.
- Grapes, 899, 913.
- Graphs (see Diagrams).
- Grass Lands, 851, 852, 901, 910.
- Grass-seed, 851, 900, 901, 908.
- Certification of, 876, 909.
- Exported, 216, 217, 225, 226, 227, 230, 909, 938.
- Varieties of, 908.
- Gratuities, Ex-servicemen's, 526.
- Gravel and Sand, 347.
- Green Crops, 851, 900, 901, 907.
- Greenstone, 356.
- Greenwich Mean Time, 789.
- Groceries, Retail Prices of, 621–623.
- Gross Farming Income, 878–883.
- Gross Indebtedness, 432, 444, 501–506, 941.
- Of Local Authorities, 501–506, 943, 944.
- Gross Reproduction Rate, 22.
- Grounds for Divorce, 61, 62.
- Grounds for War Pensions, 471.
- Group Travel, 119.
- Growth of Population, 21–24, 31, 44.
- Guaranteed Loans, 432, 503.
- Guaranteed Prices, 890.
- Guidance, Vocational, 150, 680, 700.
- Gum, Kauri, 355.
- Exported, 216, 217, 226, 227, 347, 356.
H
- Habitual Criminals, 171, 172, 173.
- Half-castes, 21, 40, 83, 957.
- Half-holiday, Weekly, 657–660.
- Half-yearly Surveys of Employment, 702–707.
- Ham and Bacon, Consumption of, 743.
- Ham and Bacon Curing, 363–374, 381, 382.
- Harbour Boards, 487–506, 714, 800, 944.
- Harbours (see also Ports), 4.
- Hardwood Trees, 333–334.
- Harness Works, 363–374, 381.
- Harvests, 899–914, 933.
- Havana Charter, 211.
- Hay, 851, 899, 900, 901, 907, 908.
- Heads of Government Departments, 841.
- Health Camps, 109, 111, 117.
- Health, Department of, 104–105.
- Health Insurance, 451, 459, 462, 464–469, 648.
- Health, Public, 103–134, 152, 801.
- Heavy-traffic Fees, 295, 300.
- Herd Testing, 874, 876.
- Hervey Islands, 2, 810.
- Hides and Skins Exported, 216–230, 269, 938, 939.
- Hides, Levy on Exports, 254.
- High Commissioners, 846, 847, 848, 849.
- High Schools, 139, 141, 146–150, 151, 156, 931.
- Higher Education, 157–160, 931.
- Highway Districts, 294, 487.
- Highways, 293–297.
- Taxation, 294, 295, 297, 300, 406, 411, 415, 418.
- History of New Zealand, 971–977.
- History of Labour Laws and Allied Legislation, 646–654.
- Hoarding prohibited, 618.
- Hoes, Rotary, 895, 896.
- Holdings (see Land Holdings).
- Holidays, 655, 656, 659, 660, 663, 665, 797, 802.
- Holiday Camps, 119.
- Holland Ministry, 835, 836.
- Home Guard, 200.
- Home-nursing Services, 468.
- Homes, Benevolent, 127–129.
- Homes, Children's, 127–129, 153.
- Homicide, 76, 81, 85, 91, 164, 169, 179.
- Honey, 744, 927.
- Exported, 216, 217, 226, 227, 928.
- Levy on Exports, 254.
- Marketing of, 620, 928.
- Honours conferred, 201, 840.
- Hops, 620, 851, 900, 913.
- Export of, 216, 217,226, 227.
- Horse-racing Taxation, 426.
- Horses, 896, 925, 934.
- Horticultural Station, 876.
- Horticulture, 876, 912.
- Hosiery-factories, 363–374, 381, 390.
- Hospital Benefits, 121, 465–470.
- Hospital Boards, 121–124, 465, 467, 487, 493, 792, 804.
- Employees of, 714.
- Employees' Retiring-allowances, 485.
- Finances of, 121–123.
- Levies on Local Authorities, 121–123, 499.
- Hospital Dietitians, 113.
- Hospital Districts, 121, 487.
- Hospitals, 96–102, 121–134, 465–470, 792, 804.
- Accommodation of, 124, 125.
- Maternity, 96, 124, 126, 466, 470.
- Mental, 130–134, 466.
- Military, 96.
- Private, 124, 125, 466, 467.
- Private Mental, 130, 133, 466.
- Public, 96–102, 124, 125, 127, 466.
- St. Helens, 96, 126, 467.
- Hostels, 702.
- Hot Springs, 4, 790.
- Hotels, Fire Losses on, 555.
- Hotels, Licensed, 785.
- Hotels, &c., Numbers of, 966.
- Hourly Wage-rates, 639.
- Hours of Labour, 379, 643–645, 656, 658, 660, 663, 665.
- House of Representatives, 16–18.
- Members of, 838, 839.
- Household Durable Goods, Retail Prices of, 998–1003.
- House-rents, 619, 621–624, 690–692, 998–1003, 1007–1012.
- Houses (see Dwellings).
- Housing, 391–402, 408–409, 434, 444–450, 496, 647, 649, 689–692, 966–971.
- Local Authorities, 496, 804.
- Of Ex-servicemen, 760–761, 767, 768.
- Of Maoris, 401, 649, 689, 768, 867, 970.
- Of Miners, 661.
- State, 394–396, 401, 408–409, 434, 450, 689.
- Survey, 393, 495, 649, 689.
- Transit, 690.
- Humphrey (Manihiki) Island, 2, 318, 809, 811.
- Husbands' Petitions in Divorce, 62.
- Hydatids, 94, 100, 108.
- Hydro-electric Power, 5, 6, 7, 748–759.
- Used for industrial Purposes, 360, 368, 759.
- Hydrogenation of Coal, 353.
- Hygiene—
- Child, 108–109.
- Dental, 109.
- Industrial, 112.
- Public, 106–108.
- School, 108.
- Social, 106.
I
- Ice-cream, 363–374, 381.
- Consumption of, 742.
- Illegitimate Infants—
- Births of, 51–52, 54.
- In Benevolent Institutions, 129.
- Legitimation of, 52.
- Protection of, 153.
- Immigration, 22, 25–26, 702, 929.
- Assisted, 26.
- Hostels, 702.
- Restriction on, 27, 688.
- Imperial Airways, 307.
- Imperial Government Purchases, 883–893.
- Implements, Farm, 245, 895–898.
- Manufacture of, 363–374, 381, 388.
- Import Licences, 208, 231–232, 253, 815, 825.
- Import Price Indices, 627, 628, 632.
- Imported Commodities, Prices Indices, 625, 628, 632, 633.
- Importers, Bank Advances to, 518.
- Imports, 202–213, 231–249, 256–259, 738–741, 935.
- Currency, Restrictions on, 531, 815, 825.
- Excess of Exports over, 203–206.
- Free and Dutiable, 249–261.
- Of Ports, 271.
- Payments on Account of, 207.
- Purpose or Use of, 234–237.
- Restrictions on, 231–232, 253, 815, 825.
- Specie, 209, 530, 935.
- Timber, 233, 337.
- Value in Sterling, 202, 208.
- Value of, Index Numbers, 208, 739.
- Value on Gold Basis, 208.
- Volume of, Index Numbers, 208, 740.
- Improvements (Land), Value of, 507–510.
- Incapacity from Industrial Accidents, 727–737.
- Income—
- Gross Farming, 878–883.
- National, 416, 591–606.
- Personal, 596, 597.
- Private, 416, 591–606, 739.
- Incomes, 607–617, 964.
- Income-tax, 406, 415, 418–423, 607–617, 792, 799.
- Income-tax Districts, 615.
- Increase in Population, 19–24, 31, 44, 89.
- Indebtedness of Local Authorities, 123, 444, 500, 501–506, 943, 944.
- Indebtedness, Public, 430–444, 941.
- Index Numbers—
- Consumers' Price, 621–623, 998–1016.
- Factory, value of, 780, 781.
- Factory, Volume of, 378, 781.
- Farm, Value and Volume of, 781, 881.
- Deaths, Sex-ratio, 65.
- Factory, value of, 780, 781.
- Factory, Volume of, 378, 781.
- Farm, Value and Volume of, 781, 881.
- Electricity, consumption of, 750.
- Factory, value of, 780, 781.
- Factory, Volume of, 378, 781.
- Farm, Value and Volume of, 781, 881.
- Export Prices, 625–628, 632, 633.
- Factory, value of, 780, 781.
- Factory, Volume of, 378, 781.
- Farm, Value and Volume of, 781, 881.
- Farm Production Volume, 781, 881.
- Factory, value of, 780, 781.
- Factory, Volume of, 378, 781.
- Farm, Value and Volume of, 781, 881.
- Gross Fanning Income, 881.
- Factory, value of, 780, 781.
- Factory, Volume of, 378, 781.
- Farm, Value and Volume of, 781, 881.
- Hours of Labour, 643–645.
- Factory, value of, 780, 781.
- Factory, Volume of, 378, 781.
- Farm, Value and Volume of, 781, 881.
- House-rent, 621, 1003, 1003, 1010–1012.
- Factory, value of, 780, 781.
- Factory, Volume of, 378, 781.
- Farm, Value and Volume of, 781, 881.
- Import Prices, 628, 632.
- Factory, value of, 780, 781.
- Factory, Volume of, 378, 781.
- Farm, Value and Volume of, 781, 881.
- Marriage-rates, 56.
- Factory, value of, 780, 781.
- Factory, Volume of, 378, 781.
- Farm, Value and Volume of, 781, 881.
- Prices of Consumers' Goods, 625.
- Factory, value of, 780, 781.
- Factory, Volume of, 378, 781.
- Farm, Value and Volume of, 781, 881.
- Prices of Imported Commodities, 625, 628, 632, 633.
- Factory, value of, 780, 781.
- Factory, Volume of, 378, 781.
- Farm, Value and Volume of, 781, 881.
- Prices of Locally-produced Commodities, 625, 628, 632, 633.
- Factory, value of, 780, 781.
- Factory, Volume of, 378, 781.
- Farm, Value and Volume of, 781, 881.
- Private Income, 603, 606.
- Factory, value of, 780, 781.
- Factory, Volume of, 378, 781.
- Farm, Value and Volume of, 781, 881.
- Production, 779–781.
- Factory, value of, 780, 781.
- Factory, Volume of, 378, 781.
- Farm, Value and Volume of, 781, 881.
- Ratio of Customs Revenue to Imports, 256.
- Retail Prices, 621–623, 628, 632, 633, 1003–1016.
- Share Prices, 629–633.
- Value of Exports, 208, 739.
- Value of Goods available for Use, 739.
- Value of Imports, 208, 739.
- Value of Production, 781, 782, 881.
- Value of Trade, 208.
- Volume of Exports, 208, 229, 740.
- Volume of Goods available for Use, 740.
- Volume of Imports, 208, 740.
- Volume of Production, 378, 781, 782, 881.
- Volume of Trade, 208.
- Wage-rates, 368, 635–643, 645.
- Wartime Price, 621–622, 1011.
- Wholesale Prices, 623–625, 628, 632, 633.
- Indians in New Zealand, 958.
- Indigenous Forest, 326–338, 852.
- Indirect Taxation, 592, 596, 597, 599, 604, 605.
- Individuals, Incomes of, 608–615.
- Industrial Accidents, 646, 684–687, 727–737, 778.
- Industrial Associations, 697.
- Industrial Conciliation and Arbitration, 634–645, 648–679, 693–697, 725, 792, 807.
- Industrial Disputes, 675–679, 719–726.
- Industrial Distribution of Population, 959–963.
- Industrial Efficiency, 117, 782–784.
- Industrial Hygiene, 112.
- Industrial Life Assurance, 535, 539–542.
- Industrial Mobilization, 651, 701.
- Industrial Nurses, 112.
- Industrial Planning, 782–784.
- Industrial Share Prices, 629–633.
- Industrial Unions, 646–647, 675–679, 693–697, 792, Industries—
- Bank Advances to, 518.
- Classification of, 376–378.
- Essential, 701.
- Licensing of, 782–784.
- Manufacturing, 360–390, 518, 715, 779–784, 940.
- Industry—
- Bureau of, 782–784.
- Organization of, 375, 782–784.
- Persons engaged in, 959–963.
- State Aid to, 445, 446, 447.
- Inebriates, 167, 172, 176, 177, 178.
- Infancy, Diseases of, 73, 76, 86, 91, 100, 102.
- Infant Mortality, 66–68, 70–74, 86–87, 92, 930.
- Maori, 86–87, 92.
- Infantile Paralysis, 94, 100, 106.
- Infant-life Protection, 70, 127, 154.
- Infectious Diseases—
- Control of, in Schools, 109.
- Deaths from, 72, 74, 76–77, 85, 86, 91, 96, 101, 102.
- Hospital Cases, 99–102.
- Notification of, 93, 106.
- Injuries (see Accidents).
- Inland Air Mails, 306, 311–312.
- Inland Fisheries, 344–316.
- Inmates—
- Of Charitable Institutions, 127–130.
- Of Gaols, 170–173, 932.
- Of Hospitals, 96–102, 124.
- Of Mental Hospitals, 130–133.
- Inquests, 164.
- Insanity, 130–134.
- Inscribed Debt, 501–506
- Insolvency, 578–582, 647, 681, 949.
- Inspection, Dairy, 876, 920.
- Inspection, Medical, of Schools, 108.
- Inspection of Machinery, 646, 654, 777–779.
- Inspection of Meat, 875.
- Instruments, Duty on, 426.
- Instruments, Registration of, 853.
- Insurance, 535–560.
- Earthquake, 403, 414, 559–560.
- State, 556–560, 798.
- War Damage, 403, 414, 559–560.
- Intercensal Population, 20, 23, 929.
- Interest—
- Credited by Savings-banks, 523, 524, 525, 946.
- On Local Authorities' Debt, 499, 505, 601.
- On Mortgages, 570, 575, 576.
- On Post and Telegraph Capital Liability, 406.
- On Public Debt, 406, 407, 439, 592, 596, 597, 600.
- On Railways Capital Liability, 278, 406.
- Payments Overseas, 207, 440, 504.
- Rates (see Rates of Interest).
- Recouped to Consolidated Fund, 406.
- Reduction of, 435, 505, 528, 529, 570, 575.
- Tax on (Debentures, &c., Interest), 436.
- Intermediate Credit, 449.
- Intermediate Schools, 139, 144, 145, 151.
- Internal Marketing, 620.
- International Comparisons (see Comparisons).
- International Payments, 206–207, 504.
- International Trade Conference, 210–212.
- Intestate Estates, 769–771.
- Intoxicating Liquor—
- Brewing of, 363–374, 381, 384.
- Duty on, 252–256, 384, 406, 415–417.
- Sale of, 785–788.
- Invalids, 961.
- Invalids' Benefits, 459, 460, 464, 469.
- Invercargill Licensing Trust, 788.
- Investment Certificates, 430.
- Investment Societies, 564–568.
- Deposits, 526, 529, 568.
- Investments, State, 434, 439, 443.
- Investments, Totalizator, 427.
- Invisible Imports and Exports, 206, 207.
- Iron-foundries, 363–374, 381, 388.
- Iron and Steel Industry Act, 650.
- Iron-ores, 347, 348, 349.
- Ironsands, 348, 349.
- Irrigation and Water-supply, 408, 409.
- Island Territories, 2, 19, 809–830.
- Islands—
- Administered on Trust, 2, 3, 19, 809, 819–826.
- Annexed, 2, 19, 809–819, 826.
- Outlying, 1, 809.
- Issue of Bank-notes (see Bank-notes).
- Issue, Previous, of Parents, 49.
J
- Jam-factories, 363–374, 381, 384.
- Japanese in New Zealand, 958.
- Joint-stock Companies, 771–775
- In Manufacturing Industries, 375.
- Journal of Agriculture, 876.
- Journal, School, 156.
- Judicial Separation, 61.
- Judiciary, Members of, 807, 840.
- June Year Exports, 202, 226–227, 230.
- June Year Imports, 202.
- Justice, 163–179, 932.
- Juvenile Offenders, 153, 175.
- Juvenile Wage-rates, 642, 645.
K
- Kale, 900, 902, 908.
- Kauri-gum, 355.
- Exported, 216, 217, 226, 227, 347, 356.
- Kea, Destruction of, 877.
- Kermadec Islands, 2, 19, 809.
- Kindergarten Schools, 109, 137, 142.
- Knitted Goods Factories, 363–374, 381, 390.
L
- Laboratory Diagnostic Services, 468.
- Labour Department, 647, 66–1, 687–688, 699–700, 719.
- Employment Bureaux, 687, 699.
- Labour Disputes, 675–679, 719–726.
- Labour, Farm, Allowance, 890.
- Labour, Hours of, 379, 643–645, 656, 658, 660, 663, 665.
- Labour Laws and Allied Legislation, 646–692.
- Labour Ministry, 832, 833.
- Labour Shares, 648.
- Labour Unions, 647, 675–679, 693–697.
- Lake Wakatipu Steamer Service, 277, 279.
- Lakes, 7.
- Lamb, Consumption of, 742.
- Lamb exported, 226, 227, 230, 742, 924.
- Lambs, 914, 915, 917.
- Slaughtered, 382, 924.
- Land Act, 804.
- Land and Income Tax, 406, 415, 418–123, 586–590, 607–617, 792, 799, 807.
- Land Boards, 804, 858.
- Maori, 865.
- Land Court, Maori, 797, 864.
- Land Development, 860, 866.
- Land Districts, 852, 858, 900, 915.
- Land Drainage Districts, 487–506, 714, 797.
- Land For Ex-servicemen, 445, 446, 448, 763–765, 798, 856–858, 860, 862.
- Land for Settlements, 859–862.
- Land, Government Valuation of, 507–510.
- Land Holdings, 850–851.
- Mortgages on, 447, 569–577, 587–588.
- Value of, 586–590.
- Land, Occupation of, 850–852.
- Land Offices, 858.
- Land, Purchase of, 798, 859–863, 865.
- Land Sales, Control of, 651, 761, 798, 856–858.
- Land Sales Court (see Courts).
- Land Settlement Board, 804, 858, 859.
- Land Surveys, 868–873.
- Land Tenure and Settlement, 804, 850–867.
- Land Titles, Registration of, 852.
- Land Transfer, 852–855.
- Land Valuation Court (see Courts).
- Land, Valuation of, 507–510, 803, 804.
- Lands open for Selection, 860.
- Land-settlement Accounts, 409, 413.
- Land-tax, 406, 415, 418–420, 586–590, 799.
- Lapsed Assurance Policies, 538, 540.
- Late Night for Shops, 658.
- Latest Statistical Information (sec Forefront of Book).
- Law and Crime, 163–179, 932.
- Law, Mortgage, 569–572.
- Laws affecting Labour, 646–692.
- Laws enacted in 1947 and 1948, 791–808.
- League of Nations, 3, 819, 828.
- Lease, Renewable, 858–862.
- Leasehold-landholdings, 851, 861.
- Leather produced, 386.
- Leather-goods Works, 363–374, 381.
- Legacy Duty, 423, 424.
- Legal Education, 157.
- Legal Roads, Unformed, 292.
- Legal Tender, 531, 791.
- Legations, 847, 848, 849.
- Legislation—
- Labour and Allied, 646–692.
- Passed in 1947 and 1948, 791–808.
- Legislative Council, 15.
- Members of, 837.
- Legitimation Act, 52.
- Lend-lease, Reciprocal Aid, 412.
- Lessees, Rehabilitation of, 570.
- Letter-boxes, 314.
- Letters Patent, 776.
- Letters posted, 314, 947.
- Letter-telegrams, 316.
- Levies by Fire Boards, 549, 550.
- Levies by Hospital Boards, 121–123, 499.
- Levy—
- Coal Production, 359, 661, 794.
- Hide Export, 254.
- Honey Export, 254.
- Meat Export, 797.
- Timber, 254, 339.
- Wool Research, 255, 919.
- Liabilities—
- Mortgage, Adjustment of, 570.
- Of Bankrupts, 579, 580, 581, 949.
- Of Banks, 513, 515, 521, 945.
- Of Building Societies, 567.
- Of Electric-power Undertakings, 755.
- Of Fire-insurance Companies, 547.
- Of Friendly Societies, 562.
- Of Life-assurance Companies, 541.
- Of Local Authorities, 123, 500.
- Of Reserve Bank, 513.
- Liberty Loans, 437.
- Library, Alexander Turnbull, 978.
- Library Centres, National, 162.
- Library School, 161, 162.
- Library Service—
- Country, 141, 161–162.
- National, 161–162.
- School, 162.
- Licensed Houses, 785.
- Licences—
- Aerodrome, 311.
- Air Pilots, 311.
- Aircraft Navigators', 311.
- Anglers', 346.
- By Local Authorities, 430, 496, 497, 785.
- Companies', 426.
- Export, 208, 815, 825.
- Fishing Vessels, 341.
- Ground Engineers', 311.
- Import, 208, 231–232, 253, 815, 825.
- Motor-vehicle, 297–300, 802.
- Plumbers', 116.
- Publicans', 785.
- Radio, 319, 325.
- Ross Sea Whaling, 830.
- Sharebrokers', 426.
- Transport, 297–300, 301–302, 802.
- Licensing, 785–788, 793, 806.
- Control Commission, 786, 806.
- Poll, 787.
- Trust, 788.
- Licensing of—
- Air Services, 792.
- Industries, 782–784.
- Lotteries, 788.
- Motor-vehicles, 297–300, 418, 802.
- Private Hospitals, 124.
- Sale of Alcoholic Liquor, 785–788.
- Liens, Contractors', 650, 674.
- Life Assurance, 535–542, 556–557.
- Death-rates, 541.
- State, 556, 798.
- Life, Expectation of, 67.
- Lifts, Inspection of, 777–778.
- Light and Fuel, Retail Prices of, 621–623, 1000–1012.
- Light Dues, 275.
- Lighthouses, 274, 318, 408–409.
- Lignite, 351, 352.
- Lime and Cement Works, 363–374, 381, 387.
- Lime for Top-dressing, 910.
- Limestone, 347, 357.
- Linen-flax, 408–409, 875, 900, 901, 913.
- Exports of, 216, 217, 226, 227, 914.
- Linseed, 901.
- Liquidations of Companies, 771.
- Literature, New Zealand, 979–998.
- Live-stock, 914–928, 934.
- Carried on Railways, 279, 281–283, 948.
- On Maori Lands, 866.
- Slaughterings of, 924.
- Loans—
- Allocation of, 433.
- By Building Societies, 564, 566.
- Conversion of, 435.
- Dates of Maturity of, 436–438, 506.
- Domicile of, 431, 436, 438–441, 504–506, 941.
- National Development, 403, 413, 431, 435.
- Of Hospital Boards, 123.
- Of Local Authorities, 123, 444, 445, 493, 500, 501–506, 943, 994.
- On Assurance Policies, 542, 557.
- Raised for War Purposes, 433, 437.
- Redemption of, 407, 409, 411, 413, 432, 435–437, 441–443, 499, 504.
- Rehabilitation, 446, 448, 449, 766–768.
- State Advances, 444–450.
- Local Authorities, 121–123, 487–506, 804, 943, 944.
- Advances to, 296, 396, 445, 446, 496, 518.
- Amalgamation of, 491.
- Assets of, 500, 583.
- Borrowing, 493, 792.
- Debt of, 123, 444, 500–506, 583, 943, 944.
- Deposits with, 530.
- Employees of, 714, 717.
- Employment Subsidies, 699.
- Expenditure of, 121–123, 499, 599, 601, 757, 943.
- History of, 488.
- Levies on, by Hospital Boards, 121–123, 499.
- Liabilities of, 123, 500.
- Obligations under Health Act, 104.
- Receipts of, 122, 496–498, 599, 601, 943.
- Subsidy from Main Highways Account, 296.
- Superannuation, 484, 485.
- Taxation by, 430, 493, 496–498, 601, 797.
- Local Consumption of Produce, 738–747, 882–883.
- Local Elections, 792, 793.
- Local Government (see Local Authorities).
- Local Option, 787.
- Local Railway District, 487–506, 714.
- Local Taxation, 430, 493, 496–498, 601, 797.
- Locally Produced Commodities, Price Indices, 625, 628, 632, 633.
- Location of Debt, 431, 436, 438–441, 504–506, 941.
- Location of New Zealand, 1–2.
- Lockouts, 675–679, 719–726, 792.
- Locomotives, 277, 278.
- Lodges, Friendly Societies, 561–563.
- London, Exchange on (see Exchange).
- London Prices of New Zealand Stocks, 439.
- Losses from Fires, 548–555.
- In Forests, 330.
- Loss of Earning-power, 736.
- Lotteries, 788.
- Duty on, 426, 788.
- Lubricants and Fuels, Imports of, 236, 244.
- Lucerne, 874, 900, 901, 907.
- Lump-sum Payments, 592, 596, 597, 599, 602.
- Lupins, 902.
M
- Machinery—
- Accidents, 729, 778.
- Factory, 368, 374.
- Farm, 233, 245, 246, 388, 895–898, 925.
- Imports of, 233, 245, 246.
- Inspection of, 646, 654, 777–779.
- Magistrates' Courts (see Courts).
- Magistrates, Superannuation of, 484.
- Magnesite, 347.
- Mails, 314, 947.
- Air, 311–313.
- Main Highways, 293–297.
- Account, 294, 411, 414, 498, 601, 602, 794.
- Construction and Maintenance, 293, 295–297, 802.
- Districts, 294.
- Expenditure on, 295, 412.
- Finance, 294–296.
- Standards, 296.
- Taxation, 294, 298, 300, 414, 418.
- Maize, 878, 899–902, 908.
- Male Nurses, 113, 115.
- Malthouses, 363–374, 381, 384.
- Malting Barley, 905.
- Mangaia Island, 2, 318, 810.
- Manganese ore, 347, 350, 357.
- Mangolds, 874, 901, 908.
- Manihiki Island, 2, 318, 811.
- Manono Island, 3, 819.
- Man-power Utilization, 651, 701.
- Manuae Island, 2, 810.
- Manufacturing Production, 360–390, 779–784, 940.
- Persons engaged in, 960, 963.
- Manure Works, 363–374, 381, 385.
- Manures used for Top-dressing, 216, 217, 910.
- Maori Electorates, 16, 784.
- Maori Housing, 401, 649, 689, 768, 867, 970.
- Maori Land Boards, 865.
- Maori Land Court, 797, 864.
- Maori Religions, 955.
- Maori Servicemen, Rehabilitation of, 768.
- Maori Succession Duty, 425.
- Maori Trustee, 805, 866.
- Maori War Benefits, 461, 469.
- Maori—
- Ages of, 38, 951, 952.
- Births of, 42, 83, 88.
- Children attending Schools, 139, 144–147, 149, 151.
- Deaths of, 42, 84–87, 90, 92, 164.
- Franchise, 18, 806.
- Half-castes, 21, 40, 83, 957.
- In Mental Hospitals, 133.
- In Prisons, 172, 176.
- Infant Mortality of, 85–87, 92.
- Lands, 587, 863–867.
- Marital Status of, 953.
- Marriages of, 84, 89.
- Members of Parliament, 16, 838, 839.
- Natural Increase of, 89.
- Occupations of, 963.
- Offences by, 169, 176–177.
- Overseas at 1945 Census, 951.
- Population, 19, 39, 957.
- Poultry kept by, 926.
- Rehabilitation of, 768.
- Religious professions of, 955.
- Schools for, 138–149, 151, 931.
- Map of New Zealand [End of Volume].
- Maps, 873.
- Marble, 356.
- Marine Officers' Certificates, 274, 663.
- Marital Status, 953.
- Market Gardens, 665, 666, 851, 899, 911.
- Registration of, 911.
- Market Prices of Shares, Yield on, 631.
- Marketing of Primary Produce, 355, 620, 791, 803, 883–893, 928.
- Marriages, 54–62, 84, 89, 791, 930.
- Masculinity Rate, 46, 54, 65, 71.
- Massage (Social Security) Benefits, 468, 470.
- Masseurs, Registration of, 113, 116.
- Massey Agricultural College, 139, 157, 159, 764, 876.
- Masterton Licensing Trust, 788, 793.
- Materials used in Factories, 361, 362, 370, 372, 375, 377, 382–390, 940.
- Maternal Mortality, 76, 80, 91, 100, 102, 127.
- Maternal Welfare, 112.
- Maternity Allowances, 466–467, 485.
- Maternity Benefits, 126, 466–467, 469, 470.
- Maternity Hospitals, 96, 124, 126, 127, 466, 470.
- Maternity Nurses, 115, 127, 466.
- District, 127.
- Maternity Services, 126, 466, 469.
- Matured Assurance Policies, 538–541.
- Maturity Dates of Loans, 435–437, 438, 506.
- Mauke Island, 2, 318, 810.
- Mean Population, 23, 24, 782, 929.
- Mean Time, 789.
- Measures and Weights, 868, 900.
- Meat—
- Bulk-purchase of, 885, 891–893.
- Consumption of, 743.
- Export Control, 884.
- Export of, 216–230, 742, 882, 891–893, 924, 936.
- Export Price Index, 626, 627.
- Freezing-works, 363–374, 381, 382, 518.
- Inspection of, 879.
- Marketing of, 883–885, 891–893.
- Prices for, 892–893.
- Production, 924.
- Purchase for War Purposes, 885, 892.
- Rationing of, 746.
- Retail Prices of, 621–623, 1003, 1004, 1005, 1008, 1010, 1011.
- Wholesale Prices of, 624.
- Meat Producers' Board, 791, 884.
- Medical Advertisements, 108.
- Medical Benefits, 411, 464, 469, 470.
- Medical Bursaries, 159.
- Medical Inspection of Schools, 108.
- Medical Practitioners, 114, 464, 714.
- Medical Research Council, 113.
- Medical Services, 103–127, 464–470.
- In Cook Islands, 813.
- In Niue, 817.
- In Western Samoa, 821.
- Members of Parliament, 15–18, 785, 838, 839.
- Superannuation of, 479.
- Meningococcus Meningitis, 76, 91, 94, 100.
- Mental Hospitals, 130–134, 466.
- Mercantile Marine, 201, 262–275.
- Pensions, 469, 477, 664, 793.
- Merchandise, Exports of, 202–230, 935–939.
- Merchandise, Imports of, 202–213, 231–249, 256–259, 935.
- Merchandise Transhipped, 270.
- Merchants, Bank Advances to, 518.
- Mercury, 347, 350.
- Metal Reserves of Banks, 513, 516, 532, 945.
- Meteorology, 9–13, 311, 809, 810, 817, 819.
- Metropolitan Milk Boards, 487, 488.
- Midwives, 113, 115, 127, 466, 467.
- Migration, External, 21–22, 25–26, 929.
- Mileage of—
- Commercial Air Services, 305–309.
- Main Highways, 293, 296.
- Railways, 276, 281, 284, 948.
- Roads, 292.
- Tramways Routes, 285, 291.
- Mileage-tax, 294, 295, 418.
- Military Colleges, 183.
- Military Defaulters, 18, 172.
- Military Districts, 182.
- Military Establishments, 183.
- Military Forces, 181–189.
- Military Hospitals, 96.
- Military Patients in Hospitals, 101.
- Military Pensions, 451, 461, 470–478.
- Milk—
- Boards, 487, 488, 796.
- Consumption of, 742.
- Control of Prices of, 620.
- Control of Sale of, 487, 620.
- Districts, 487, 796.
- Dried and Condensed, Exports of, 216, 217, 223, 226, 227, 230, 938.
- Examination and Testing of, 876, 920.
- For School-children, 109, 152.
- Used in Dairy Factories, 383.
- Milking-machines, 895.
- Milk-products (see Dairy-produce).
- Mills, 360–390.
- Mineral Waters, 790.
- Minerals, 347–359.
- Export Price Indices, 626, 627.
- Wholesale Price Indices, 624.
- Miners' Benefits, 359, 451, 460, 469.
- Miner's Phthisis, 359, 451, 460.
- Minimum Wage-rates, 634–643, 645, 657, 659, 665, 668, 794.
- Mining, 347–359.
- Accidents, 81, 352, 357, 725–737.
- Act, Examinations under, 359.
- Advances, 357.
- Legislation, 347, 660–662, 794, 800, 801.
- Persons engaged in, 352, 357, 960, 963.
- Produce exported, 216, 226, 227, 230, 347, 741.
- Scholarships, 359.
- Strikes, 722, 723.
- Subsidies, 353, 357.
- Subsidized Prospecting, 357.
- Value of Production, 347, 780.
- Ministers of each Denomination, 60.
- Marriages by, 60.
- Ministers Plenipotentiary, 846–849.
- Ministries, Successive, 831.
- Ministry, Holland, 835, 836.
- Ministry, Labour, 832, 833.
- Minors, Marriages of, 54, 59.
- Mission Schools, 139, 145, 813, 818, 822–824.
- Mitiaro Island, 2, 810.
- Mobilization of Industrial Man-power, 651, 701.
- Monetary Benefits, Social Security, 454–464, 469, 699.
- Money-orders issued and paid, 315, 947.
- Morbidity, 92–102, 562.
- Mortality (see Deaths).
- Of Insured Persons, 538, 540.
- Of Members of Friendly Societies, 562.
- Mortgage Corporation, 444.
- Mortgage Exemption, 420.
- Mortgage, Dwellings with, 967.
- Mortgagee, Rights of, 570.
- Mortgagees' Indemnity Insurance, 426, 560.
- Mortgages, 569–577, 587, 588.
- Extension Emergency Regulations, 571.
- Rates of Interest on, 448, 570, 575.
- State Advances, 444–450.
- Mortgagors and Lessees Rehabilitation Act, 570, 650.
- Mortgagors' Liabilities Adjustment Commissions, 571.
- Mortgagors' Relief, 570–572.
- Mothers, Ages of, 48, 49, 51, 52.
- In Illegitimate Cases, 52.
- Motion-picture Film-hire Tax, 406, 428, 775.
- Motion-picture Theatres, 775.
- Motive-power in Factories, 368.
- Motor Traffic Offences, 176, 177–178.
- Motor Transport, 279, 290, 297–302, 802.
- Motor-engineering Works, 363–374, 381, 388.
- Motor-omnibus Traffic, 279, 290, 297–302.
- Motor-spirits—
- Fixed Prices for, 618.
- Resellers, Licensing of, 783.
- Restrictions on Use of, 280, 299.
- Taxation on, 253, 255, 256, 294, 418, 599.
- Motor-vehicles—
- Accidents, 76, 81, 91, 178, 302–303.
- Dormant Registrations, 299.
- Drivers' Licences, 298.
- Duty on, 253, 260.
- Insurance, 543–546.
- Licensing of, 297–300.
- Operated by Tramway Authorities, 290.
- Registration of, 297–300.
- Speed Limit, 298.
- Taxation, 253, 260, 294, 298, 411, 415, 418, 599.
- Traffic Offences, 167, 176, 177–178.
- Motor-vessels registered, 272.
- Motor-ways, 296, 795.
- Motor-works, 363–374, 381, 388.
- Mountains, 4.
- Multiple Births, 46–48.
- Municipal Tramways, 285–291.
- Municipalities (see Boroughs).
- Munitions and War Stores, Imports of, 234.
- Murder, 76, 81, 164, 169, 179.
- Abolition of Death Penalty for, 170.
- Museums, 156.
- Mussels, 342.
- Mutton, Consumption of, 742.
- Mutton exported, 226, 227, 230, 742, 924.
- Mutton produced, 382, 924.
- Mutual Aid, Canadian, 204, 412.
- Mutual Fire Insurance, 546, 555.
N
- Namua Island, 3.
- Nassau Island, 2, 811.
- Nassella Tussock, 487, 800.
- National Airways Corporation, 304–307, 308, 313, 806.
- National Development Loans Account, 403, 413, 431, 435.
- National Employment Service, 651, 688, 701–713, 715.
- National Endowments, 326, 329, 859.
- National Expenditure, 591–606, 999.
- National Expenditure Adjustment Act, 505, 529, 504, 568, 570, 575, 690.
- National Film Unit, 979.
- National Income, 416, 591–606, 999.
- National Library Service, 141, 161–162.
- National Licensing Polls, 787.
- National Parks, 852.
- National Provident Fund, 484–486, 648, 795, 808.
- National Savings, 431, 525.
- National Security Taxation 406, 412, 415, 428, 599, 636.
- National Wealth, 585.
- Nationality, 28, 799.
- Of Naturalized Persons, 29.
- Of Overseas Shipping, 264.
- Of Registered Aliens, 30.
- Native Bush, 327, 852.
- Native Fresh-water Fishes, 315.
- Native Grasses, 852, 901.
- Natives (see Maoris).
- Natural Increase of Population, 22, 31, 44, 88.
- Naturalization, 28.
- Nauru Island, 2, 809, 828, 911.
- Naval Cadetship Examinations, 140, 190.
- Naval Casualties, 200.
- Naval Defence, 189–193, 200, 201.
- Naval Expenditure, 191, 413.
- Naval Reserve, 191.
- Naval Station, 189.
- Naval War Activities, 191–193.
- Navigators Island (see Western Samoa).
- Negroes in New Zealand, 958.
- Neo-natal Deaths, 66, 70–75, 86.
- Nephrite, 356.
- Net Indebtedness—
- Local Authority, 500, 503.
- State, 443.
- New Zealand Broadcasting Service, 156, 321–325.
- Commercial Division, 324.
- National Division, 323.
- New Zealand Citizenship, 28, 799.
- New Zealand Dairy Hoard, 884, 893.
- New Zealand Mean Time, 789.
- New Zealand Red Cross Society, 117.
- Now Zealand Representatives Abroad, 846.
- New Zealand University, 139, 140, 157–160.
- Newspapers—
- Posted, 314.
- Registered, 315.
- Revenue from, 387.
- Nisi Decrees in Divorce, 61.
- Niue Island, 2, 19, 230, 249, 809, 817–819.
- Radio Communication, 318.
- No-licence Issue, 787.
- Non-resident Traders, Incomes of, 608, 617.
- Note-issue, 511, 513, 515, 516, 519, 531.
- Notes in Circulation 513, 519–521, 945.
- Notification of Births, 42.
- Notification of Diseases, 94, 106.
- Notified Vacancies, National Employment Service, 707–709, 712.
- Noxious Weeds Eradication, 877.
- Nukunono Island, 2, 3, 827.
- Radio Station, 318.
- Nullity of Marriage, 61.
- Nurseries and Plantations, 338–340, 851, 911.
- State, 338.
- Nurses—
- Dental, 110.
- District, 108, 117, 127.
- Industrial, 112.
- In Public Hospitals, 714.
- Male, 113, 115.
- Maternity, 113, 115, 127, 467.
- Pensions for, 472, 485.
- Plunket, 113, 127.
- Psychiatric, 113, 115.
- Registration of, 113, 115.
- Retiring-allowance for, 485.
- School, 108.
- Nursing Aides, 113, 115.
- Nu'ulva Island, 3.
- Nu'usaf'e Island, 3.
- Nu'utele Island, 3.
O
- Oatmeal, Consumption of, 744.
- Oatmeal, Production of, 383.
- Oats, 874, 899–902, 904, 908, 933.
- Varieties of, 898.
- Observatory, Time Signals from, 323, 789.
- Occupants of Dwellings, 968, 971.
- Occupation of Land, 850–852.
- Occupational Re-establishment, 761, 767.
- Occupational Status, 961.
- Occupational Therapeutists, 113.
- Occupational Training of Discharged Servicemen, 761–763, 767.
- Occupations, Essential, 701.
- Occupations of Bankrupts, 580, 582.
- Occupations of Maoris, 963.
- Ocean Cables, 318.
- Ocean Island, 829, 911.
- Offences, 166–179.
- By Children, 153, 175.
- By Maoris, 169, 176, 177.
- By Women, 166, 168, 176, 177.
- Reported to Police, 178–179.
- Offenders Probation Act, 169, 174.
- Officers' Certificates (Marine), 274, 663
- Offices Act, Shops and, 657–660.
- Official Assignees, 578–581, 949.
- Official Representatives, 846–849.
- Officiating Ministers, 55, 60.
- Oil, Production from Coal, 353.
- Oil-wells, 355.
- Old-age Pensions, 451, 648.
- Old-peoples' Homes, 127–129.
- Omnibus Traffic, 279, 290, 297–302.
- Omnibuses licensed, 298.
- Onekaka Iron-ore, 348.
- Onions, 216, 217, 261, 878, 901, 907.
- Opencast Mining, 353.
- Opening Hours of Shops, 659.
- Opium, Prohibition of, 107.
- Opossum-skins exported, 216, 217, 224, 226, 227.
- Opticians, Registration of, 116.
- Orchards, 665, 851, 874, 878, 899, 900, 912.
- Ordinary Life Assurance, 535–539, 541, 542, 556.
- Organization of Industry, 375, 782–784.
- Origin of Imports, 237–249.
- Ornamental Stones, 356.
- Orphanages, 127–129.
- Orphanhood, 69.
- Orphans' Benefits, 458, 469.
- Ottawa Agreement, 240, 250, 257.
- Outlying Islands, 1, 809.
- Out-patients, 122, 123, 124.
- Maternity Hospitals, 127.
- Output of Factories, 361–390, 940.
- Overdraft Authorities, 519.
- Overdraft Rates, 528.
- Overseas Air Services, 307–309.
- Overseas Air-mails, 307–309, 312.
- Overseas Born, Duration of Residence of, 957.
- Overseas Companies, 773.
- Overseas Assets of Banks, 513, 516, 521.
- Overseas Parcel-post, 315.
- Overseas Passenger Duty, 426, 801.
- Overseas Payments, 206–207, 504, 522.
- Overseas Receipts, 206–207, 522.
- Overseas Representatives, 846–849.
- Overseas Shipping, 262–272, 662, 664.
- Overseas Trade, 202–261, 935–939.
- Overseas War Service, 964.
- Overtime, 367, 379–380, 656, 658, 660, 663, 665.
- Overtime Legislation Modification, 651.
- Owner Occupied Houses—
- Costs of, 998–1003.
- Rental Value of, 596, 597, 603.
- Oysters, 216, 343.
P
- Pacific Cable, 318.
- Pacific Island Garrisons, 184, 187.
- Pacific Islands, Annexed, 2, 19, 809–819.
- Bibliography, 997.
- Radio Communication, 318, 815.
- Packet Licences, 785.
- Packing-case Factories, 363–374, 381, 386.
- Paid Holidays, 656, 656, 659, 660, 663, 665.
- Paint Works, 363–374, 381.
- Palmerston Island, 2, 318, 809.
- Pan-American Airways, 308, 313.
- Panel Scheme, Social Security, 464.
- Paper Bag and Box Factories, 363–374, 381.
- Paralysis, Infantile, 94, 100, 106.
- Parcel-post, 312, 314, 315, 947.
- Parents—
- Ages of, 48–52.
- Duration of Marriage of, 50.
- Previous Issue of, 49.
- Parks, National, 852.
- Parliament, 15–18.
- Members of, 785, 838, 839.
- Parliamentary Elections, 16, 784, 785.
- Parliamentary Under-Secretaries, 15, 835, 836.
- Parliaments, Successive, 837.
- Parry (Mauke) Island, 2, 318, 809.
- Party-line Telephones, 317.
- Passenger-mileage—
- Air Services, 305–308.
- Railways, 281.
- Tramways, 285, 287, 291.
- Passengers—
- Commercial Aircraft, 306–310.
- Motor-vehicle, 281, 291.
- Overseas, 25–26, 929.
- Railway, 281, 948.
- Tramway, 285, 287, 291.
- Passenger-tickets, Duty on, 426, 801.
- Passion-fruit, 900.
- Passports, 27.
- Pastoral and Agricultural Production, 779–781, 874–928, 933.
- Persons engaged in, 960, 963.
- Value of, 779–781, 878–883.
- Volume of, 781, 880, 881.
- Pastoral Produce—
- Consumed locally, 741–744, 883.
- Export of, 215–230, 741, 883–893, 918, 924, 928, 936–939.
- Export Prices Indices, 624–628, 632, 633.
- Gross Farming Income, 878–883.
- Purchase for War Purposes, 212, 885–893.
- Wholesale Prices Indices, 624.
- Pasture Grasses, 851, 874, 901, 807–911.
- Patents, Designs, and Trade-marks, 776, 794.
- Patients in Mental Hospitals, 130–134.
- Patients in Public Hospitals, 96–102, 124.
- Patriotic Funds, 798, 800.
- Payments Overseas, 206, 504, 522.
- Peace, Treaties of, 793.
- Peaks, Altitude of, 4.
- Pears, 216, 217, 226, 227, 803, 874, 899, 912.
- Peas, 899–902, 911.
- Export of, 216, 217, 225, 226, 227, 230.
- Pelts, Export of, 216–230, 939.
- Penal Institutions, 170–173, 932.
- Penalty on Unpaid Hates, 497.
- Penrhyn (Tongareva) Island, 2, 318, 809.
- Pensions, 451–486, 592–606, 648, 793, 797, 802, 805.
- Pensions Department, History of, 451.
- Permanent Building Societies, 564–568.
- Permanent Heads of Departments, 841.
- Permanent Military Forces, 182–183.
- Permits and Passports, 27.
- Permits, Building, 391, 392, 397–402.
- Personal Accident Insurance, 543, 544.
- Personal Consumption, Value of, 594, 596.
- Personal Income, 596, 597.
- Petitions—
- Bankruptcy, 579.
- Divorce, 61.
- Petrol (see Motor-spirits).
- Petroleum, 355.
- Pharmaceutical Benefits, 465, 469, 470.
- Pharmacy, 116–117.
- College of, 117.
- Plan, 783.
- Phormium, 783, 852, 913.
- Fibre exported, 216, 217.
- Grading of Fibre, 876.
- Phosphate Rock, 347, 356, 357, 389.
- From Nauru Island, 2, 829, 911.
- Phthisis (see Tuberculosis).
- Miner's, 359,451, 460.
- Physical Education, 118–120, 152.
- Physical Welfare, 118–120.
- Physiography, 1–7.
- Physiotherapy, School of, 116.
- Pickle-factories, 384.
- Picture-theatres, 775.
- Pig-meats, 742, 925.
- Pigs, 914, 915, 916, 923.
- Slaughtered, 382, 924.
- Pilots, Air, 311.
- Pisciculture, 345.
- Placement Service, 688, 699, 710–713.
- Plaints, 163.
- Planning, Industrial, 782–784.
- Plantations, 338–340, 851, 901, 911.
- State, 338.
- Plants, New Zealand, 14
- Platinum, 347, 350.
- Pleasant (Nauru) Island, 2, 809, 828, 911.
- Plumbers, Registration of, 116.
- Plunket System, 70, 117, 127.
- Plural Births, 46–48.
- Plural Voting Abolition, 18, 647.
- Poisoning, 81, 101, 102.
- Poisons, 107.
- Police Force, 164–166, 792.
- Offences reported to, 178–179.
- Superannuation, 479.
- Policies, Insurance, 535–560.
- Poliomyelitis, 94, 100, 106.
- Political Disabilities Removal, 17.
- Polling—
- At General Elections, 784, 785.
- At Licensing Polls, 787.
- Population, 19–40, 782, 929.
- Age Distribution, 38, 951, 952, 953.
- Industrial Distribution, 959–960.
- Occupational Status of, 961.
- Of Campbell Island, lit.
- Of Cook Islands, 19, 812.
- Of Kermadec Islands, 19, 809.
- Of Nauru Island, 829.
- Or Nine Island, 19, 817.
- Of Tokelau Islands, 19, 827.
- Of Western Samoa, 19, 820.
- Pork consumed, 743.
- Pork exported, 226, 227, 230, 742, 925.
- Portfolios of Ministers, 832–836.
- Ports—
- Fishing, 342.
- Of Arrival, 263.
- Of Departure, 263.
- Of Registry, 272.
- Shipping of, 263.
- Trade of, 262–272.
- Post Office Account, 413.
- Post Office Employees, 320, 793.
- Accidents to, 727–737.
- Superannuation of, 479–482.
- Post Office Investment Certificates, 430.
- Post Office Savings-bank, 522–523, 525, 526, 528, 646, 946.
- Postal and Telegraphic, 314–320, 406, 947.
- Postal Notes, 316, 947.
- Postponement of Census, 20.
- Post-primary Education, 139, 140, 146–150, 151, 156, 931.
- Post-war Industry, 701.
- Post-war Price Control, 619.
- Potatoes, 620, 899–901, 905–907.
- Areas and Yields, 906.
- Consumption of, 744.
- Export of, 216, 217, 226, 227, 905.
- Subsidy on, 878.
- Varieties of, 906.
- Pottery-works, 363–374, 381, 387.
- Poultry, 744, 926.
- Poultry foods, Subsidy on, 878.
- Poultry-runs Registration, 927.
- Pounamu (Greenstone), 356.
- Power Boards, 487–506, 751–753, 944.
- Power, Electric (see Electric).
- Power used in Factories, 368.
- Preferential Tariff, 240, 249–253, 257–261.
- Pregnancy, Diseases, &c., of, 76, 80, 91, 94, 100, 101, 102, 106, 130.
- Premiers, Successive, 831–832.
- Premium Income, 535–560.
- Preserved Meats, Production of, 382.
- Prevention of Crime Act, 173.
- Prevention of Disease, 109.
- Prevention of Forest-fires, 330.
- Prevention of Hydatids, 108.
- Prevention of Profiteering, 618, 650.
- Prevention of Quackery, 108.
- Previous Issue of Parents, 49.
- Price Levels, Spread in, 882.
- Price Tribunal, 353, 619, 795, 840.
- Prices, 618–633, 998–1016.
- Collection of, 623, 1000.
- Effect on Exports, 208, 228–230.
- Effect on Imports, 208.
- Fixation of, 618, 795.
- Of New Zealand Stocks, 439.
- Post-war Control of, 619, 795.
- Regulation of, 618, 619.
- Stabilization of, 353, 618, 619, 877.
- Wartime Index, 620, 1013.
- Primage Duty, 250, 256.
- Primary Products—
- Consumption of, 741–747, 882.
- Export of, 214–230, 882, 883–893, 918, 924, 925, 936–939.
- Marketing of, 355, 620, 791, 803, 883–893, 928.
- Purchase for War Purposes, 212, 885–893.
- Primary Schools, 137–139, 141, 142–146, 151–152,931.
- Prime Ministers, Successive, 831–832.
- Principal Events, 971–977.
- Printing Establishments, 363–374, 381, 387.
- Prisoners of War, 200, 950.
- Prisons and Prisoners, 170–173, 932.
- Prisons Board, 170, 173–174.
- Private Assignments, 581.
- Private Companies, 375, 772–774.
- Private Disposable Income, 605–606, 739.
- Private Dwellings, 391–402, 966–971.
- Private Gardens, 851, 911.
- Private Hospitals, 124, 125, 466, 467.
- Private Income, 416, 591–606, 739.
- Private Mental Hospital, 130, 133, 466.
- Private Radio-stations, 319.
- Private Railways, 284.
- Private Savings, 594–598.
- Private Savings-banks, 524–526, 529, 534.
- Private Schools, 138, 139, 142, 145, 146, 147, 151, 931.
- Private Wealth, 583–585, 586.
- Privileges, Diplomatic, 794.
- Probation, 174.
- Probationary Teachers, 155.
- Producers' Equipment, Imports of, 234, 235, 236.
- Producers' Materials, Imports of, 234, 235, 236.
- Producers' Materials, Wholesale Prices of, 625.
- Production—
- Agricultural and Pastoral, 779–782, 874–928, 933.
- Clothing, 390.
- Dairy, 381, 383, 780, 921–923.
- Factory, 360–390, 779–782, 940.
- Fisheries, 341–346, 780.
- Local Consumption of, 741–747, 882.
- Meat, 924.
- Mineral, 347–359, 780.
- Timber, 336, 386, 780.
- Value or, 738, 779–782, 881.
- Volume or, 378, 738, 781, 782, 881.
- Wool, 918.
- Professions, Religious, 954.
- Professors, University, 157, 159.
- Profiteering, Prevention of, 618, 650.
- Profit-sharing, 648.
- Programmes, Radio, 321.
- Prohibited Immigrants, 27.
- Prohibited Imports, 231–232, 253.
- Prohibition Issue, 787.
- Prohibition Orders, 177.
- Prolongation of Parliament, 17.
- Promotion of Employment, 428, 688, 699.
- Promotion of Industries, 688, 782–784.
- Properties Transferred, 852–855.
- Proprietary Income, Taxation of, 608, 610.
- Prorogation of Parliament, Dates of, 837.
- Prospecting, State Aid to, 357.
- Prospecting-drills, 357.
- Protection of Wages, 650, 674–675.
- Provident Fund, National, 484–486, 648, 795, 808.
- Provincial Districts, 488.
- Area and Population of, 31.
- Density of Population in, 39.
- Factory Production in, 362.
- Provincial Education Boards, 135.
- Provincial Governments, 135, 276, 488.
- Provisional State Forests, 326.
- Psychiatric Nurses, 115.
- Public Buildings, Expenditure on, 409, 434.
- Public Clocks, 790.
- Public Companies, 375, 771–775.
- Public Debt, 430–444, 793, 941.
- Commission, 793.
- Repayment of, 407, 409–411, 413, 432–435, 441–443, 601.
- Public Domains, 852, 859.
- Public Finance, 403–450, 591–606, 791, 794, 801, 807, 941, 942.
- Public Health, 103–134, 152.
- Public Hospitals (see Hospitals).
- Public Hygiene, 106–108.
- Public Reserves, 850, 852, 859.
- Public Schools, 135–156, 931.
- Public Service, 666–667, 794, 808, 842–846.
- Board of Appeal, 845.
- Civil Service Act Pensions, 469, 479.
- Classification, 844.
- Commission, 842, 843.
- Employees, 846.
- Entrance Examination, 140, 846.
- Superannuation, 478–182, 808.
- Public Trust Office, 529, 535, 555, 769–771, 804.
- Public Wealth, 583, 586.
- Public Works—
- Accidents, 727–737.
- Account, 293, 294, 403–404, 408–409, 413.
- Co-operative System, 648–649.
- Employees, 713, 715–716.
- Housing Construction, 394, 401, 408–409, 690.
- Programme, 801.
- Railway Construction, 276, 408–409.
- Road Construction, 293, 408–409.
- Public Works and Services, Maintenance of, 407, 408, 600.
- Publicans' Licences, 785.
- Publications—
- Agriculture Department, 876.
- Census, 950.
- Census and Statistics Department (see Forefront of Book).
- Education Department, 156.
- General Bibliography, 979–998.
- Mines Department, 359.
- New Zealand Flora, 14.
- Register of, 315.
- Publishing Works, 363–374, 381, 387.
- Puerperal Accidents, &c., 76, 80, 91, 94, 100, 101, 102, 130.
- Puisne Judges, 840.
- Pukapuka (Danger) Island, 2, 318, 809, 811.
- Pulmonary Tuberculosis (see Tuberculosis).
- Pumice, 216, 347, 357, 363–374, 381.
- Pumpkins, 908, 911.
- Punishments by Courts, 166–178.
- Pupils, School, 139–152, 931.
- Purchase of Land for Settlement, 763–767, 859–863.
- Pure Food Laws, 107.
- Purpose or Use of Imports, 234–237.
Q
- Quackery-prevention, 108.
- Quadruplets born, 47.
- Quarries, 357, 662.
- Accidents at, 357, 727–737.
- Persons engaged in, 357, 960, 963.
- Quartzite, 347, 357.
- Quartz-mining, 348.
- Quicksilver, 347, 350.
- Quinnat Salmon, 346.
- Quinquennial Census, 19–23, 31–33, 39–40, 698, 950–971.
- Quorum—
- Executive Council, 15.
- House of Representatives, 18.
- Quota, Country, 16.
- Quotations, New Zealand Stocks, 439.
R
- Rabbit Districts, 487–506, 714, 877.
- Rabbit-skins exported, 216, 217, 224, 226, 227, 230, 938.
- Rabbits, Destruction of, 795, 877.
- Racial Origins, 957–959.
- Racing, Tax on, 426–427.
- Radio Advertising, 324.
- Radio Beacons, 274, 275.
- Radio Broadcasting, 156, 321–324, 789.
- Radio Communication, 318, 319, 815.
- Radio Engineering, 363–374, 381.
- Radio Licences, 319, 325.
- Radio Stations, 318, 321–324, 809, 815, 828.
- Radio Time-signals, 323, 789–790.
- Radiologists, 467, 470.
- Raffle Tickets, Duty on, 426, 788.
- Rail Cars, 277.
- Rails, Weight of, 276.
- Railway Accidents, 81, 284, 302, 727–737.
- Railway District, 487–506, 714.
- Railway Equipment, Imports of, 234.
- Railway Fares, School-children's, 150.
- Railways, 276–284, 654, 948.
- Air Freight Service, 307.
- Private, 284.
- Revenue and Expenditure, 278–281, 406, 410, 411, 413, 948.
- Superannuation Fund, 284, 483.
- Tribunal, 284, 654.
- Rain Forests, 331.
- Rainfall, 10, 11, 12, 13.
- Rakahanga (Reirson) Island, 2, 811.
- Rape, 899, 900, 902, 908.
- Rarotonga Island, 2, 318, 810.
- Rateable Value of Land, 510.
- Rates, Local Authority, 430, 496–498, 757, 943, 1000.
- Rates of Exchange, 532–533.
- Rates of Interest—
- On Building Societies' Deposits, 526, 529, 569.
- On Company Deposits, 526, 529.
- On Fixed Deposits, 526, 528–530.
- On Local Authorities' Debt, 505.
- On Mortgages, 448, 570–571, 575.
- On Public Debt, 434–437, 440.
- On Rehabilitation Loans, 766.
- On Rural Intermediate Credit, 449.
- Paid by Savings-banks, 522, 523, 528, 529.
- Reduction of, 436, 505, 528, 529, 570, 575.
- Rates of Tax, 420–423, 424, 614, 617.
- Rates of Wages, 366, 367, 619, 634–643, 645, 657, 659, 660, 669–671.
- Emergency Regulations, 637, 655.
- Rating by Local Authorities, 121, 493.
- On Unimproved Value, 494.
- On Urban Farm Lands, 494, 508.
- Rationing, 745–747.
- Receipts, Overseas, Balance of, 207.
- Receiving-homes, 127–129, 153.
- Receiving-stations, Radio, 318, 325.
- Reciprocal Benefits, 463.
- Reciprocal Aid, Lend-lease, 412.
- Reciprocal Tariff and Trade, 257–261.
- Recreation and Physical Welfare, 118–120, 153.
- Recruiting—
- Air Force, 194, 198.
- Army, 182.
- Navy, 190–191.
- Police, 165.
- Red Cross Society, 117.
- Redemption of Loans, 407, 409, 413, 432, 434–437, 441–443, 499, 504.
- Redemption of Mortgages, 569, 571.
- Redemption of Savings Bonds, 525.
- Reduction of Interest, 435, 505, 528, 529, 570, 575.
- Reduction of Mortgages, 570.
- Reduction of Rent, 571, 690.
- Reduction of Wages, 636, 637, 648, 669.
- Re-exports, 227–228.
- Referendum, Gaming, 789, 800.
- Reformative Detention, 153, 171, 174, 176.
- Refuge Homes, 127–129, 153.
- Refunds to Racing Clubs, 427.
- Regional Planning, 495.
- Registered Articles posted, 314.
- Registered Companies, 771–775.
- Registered Factories, 361.
- Registered Mortgages, 572–576.
- Registered Vessels, 272.
- Registrars, Marriages before, 54, 60.
- Registration—
- Of Adopted Children, 53.
- Of Soldiers, &c., 64, 792.
- Of Aliens, 28–29, 800.
- Of Soldiers, &c., 64, 792.
- Of Apiaries, 928.
- Of Soldiers, &c., 64, 792.
- Of Applicants for Employment, 699.
- Of Soldiers, &c., 64, 792.
- Of Apprenticeships, 680.
- Of Soldiers, &c., 64, 792.
- Of Births, 41, 83, 792.
- Of Soldiers, &c., 64, 792.
- Of Building Societies, 564.
- Of Soldiers, &c., 64, 792.
- Of Chemists, 116–117.
- Of Soldiers, &c., 64, 792.
- Of Companies, 771.
- Of Soldiers, &c., 64, 792.
- Of Dairy Companies, 921.
- Of Soldiers, &c., 64, 792.
- Of Deaths, 63, 64, 84, 792.
- Of Soldiers, &c., 64, 792.
- Of Deeds, 853.
- Of Dentists, 114.
- Of Designs, 777, 794.
- Of Electors, 18, 489, 806.
- Of Fishing Vessels, 341.
- Of Friendly Societies, 561.
- Of Hospital Dietitians, 113.
- Of Industrial Unions, 693.
- Of Land Titles, 853.
- Of Male Nurses, 113.
- Of Maori Births, 42, 83.
- Of Maori Electors, 18, 806.
- Of Market Gardens, 911.
- Of Marriages, 54, 84.
- Of Masseurs, 113, 115.
- Of Maternity Nurses, 113, 115.
- Of Medical Practitioners, 114.
- Of Midwives, 113, 115.
- Of Mortgages, 572.
- Of Motor-vehicles, 297–300.
- Of Newspapers, 315.
- Of Nurses, 113, 115.
- Of Nursing Aides, 113, 115.
- Of Occupational Therapeutists, 113.
- Of Opticians, 116.
- Of Orchards, 912.
- Of Patents, 776, 794.
- Of Pharmaceutical Chemists, 116–117.
- Of Plumbers, 116.
- Of Poultry-runs, 927.
- Of Private Schools, 145.
- Of Psychiatric Nurses, 113, 115.
- Of Soldiers Killed or Missing, 64.
- Of Still-births, 41, 54, 63.
- Of Trade-marks, 777, 794.
- Of Trade-unions, 693.
- Of Unemployed, 699.
- Of Valuers, 804.
- Of Vessels, 272.
- Registration Fee, Social Security, 411, 415, 428, 454.
- Registration for National Service, 701.
- Registry, Ports of, 272.
- Regulation of Prices, 618.
- Regulations of Wages, 634–637.
- Rehabilitation, 412, 446, 448, 570, 600, 664, 681, 760–768, 795, 803.
- Reirson (Rakahanga) island, 2, 811.
- Relief, Charitable, 121–123, 127–129.
- Relief Fund, Coal-miners', 359, 661.
- Relief of Mortgagors, 570–572.
- Relief of Unemployment, 461, 464, 648, 687, 698–700.
- Religious Denominations, 60, 954.
- Marriages by Ministers of, 60.
- Officiating Ministers, 60.
- Religious Professions, 60, 954.
- Renewable Leases, 858–862.
- Rent Reductions, 571, 690–692.
- Rent Restriction, 690–692, 806.
- Rented Dwellings, 967, 970.
- Renters, Film, Taxation of, 428.
- Rents, House, 619, 621–624, 690–692, 1000–1003, 1007–1012.
- Rents, Stabilization of, 619, 691, 806.
- Repatriation, 760–768.
- Repayment of Public Debt, 407, 409, 413, 432, 434–437, 441–443.
- Representatives Abroad, 846–847.
- Representatives, House of, 16.
- Election of, 17, 784, 785.
- Members of, 838, 839.
- Reproduction Rate, 22.
- Research, Agricultural, 875–877, 903, 913.
- Research, Coal, 351.
- Research, Educational, 160.
- Research Institute, Wheat, 903.
- Research, Medical, 113.
- Research, Mining, 357.
- Research Scholarships, 159.
- Research, Wood-utilization, 329.
- Reserve Bank, 207, 209, 430, 511–513, 514, 519, 520, 521, 522, 526, 527, 528, 531–534, 801.
- Reserves, Air Force, 194, 197, 198.
- Reserves, Military, 182.
- Reserves, Naval, 191.
- Reserves, Public, 850, 852, 859.
- Restitution of Conjugal Rights, 61, 62.
- Restoration, Salary and Wage cuts, 637, 669.
- Restriction, Immigration, 27, 688.
- Restrictions on Consumption, 745–747.
- Restrictions on Employment, 657, 660, 666.
- Restrictions on Imports, 208, 231–232, 253, 531, 815, 825, 903.
- Retail Prices, 620–623, 628, 632, 633, 998–1016.
- Retailers, Bank Advances to, 518.
- Retardate Children, 138, 154.
- Returnable Income, 608, 610, 612, 615, 616.
- Revaluations, Land, 08.
- Revenue, 403–414, 591–806, 942.
- Cinematograph Theatres, 775.
- Customs, 255–257, 415, 417.
- Electric-power Boards, 497, 752.
- Local Authority, 122, 496–498, 599, 601, 752, 757, 943.
- Postal, 319, 947.
- Railway, 278–280, 283, 410, 948.
- Social Security Fund, 411, 415, 428, 454.
- State Forests, 338.
- Tramway, 286–289, 291.
- Reverse Lend-lease, 412.
- Review, Court of, 571.
- Review of Legislation, 791–808.
- Rhodes Scholarships, 158.
- Rifle Clubs, 183.
- River Districts, 487–506, 714.
- Rivers, 6.
- Control of, 328, 487, 797, 892.
- Road Accidents, 76, 81, 302–303.
- Road Districts, 487–506, 714.
- Bridges in, 292.
- Debt of, 500, 504.
- Mileage of Roads, 292.
- Road Safety Council, 303.
- Road Transport, 279, 290, 300–302.
- Roading Costs, 295, 409, 412.
- Roads, 292–303.
- Expenditure on, 295, 359, 409
- On Goldfields, Subsidized, 359.
- Taxation, 253, 295, 298, 300, 415, 418.
- Rock Oysters, 342, 343.
- Rolling-stock—
- Railway, 277.
- Tramway, 285.
- Roman Catholic Schools, 138, 146, 813.
- Root Crops, 851, 874, 899–901, 907.
- Ross Dependency, 2, 3, 809, 830.
- Whaling, 830.
- Rotary Hoes, 895, 896.
- Rotorua Thermal Springs, 790.
- Royal Naval Reserves, 191.
- Royal New Zealand Air Force, 193–199, 200, 201.
- Royal New Zealand Navy, 189–193, 199, 200, 201.
- Royal Titles Act, 792.
- Rural Advances, 444–450, 649, 860, 862.
- Rural Education, 150–152.
- Rural Housing, 396, 400, 401, 496, 690.
- Rural Intermediate Credit, 449.
- Rural Mail Deliveries, 314.
- Rural Mortgages, 446, 571, 587–589.
- Rural Population, 32–33.
- Country Quota, 16.
S
- Saddlery Works, 363–374, 381.
- Sailing-vessels registered, 272.
- St. Helens Hospitals, 96, 126, 467.
- Salaries and Wages, 596, 597.
- Charge on, 411, 415, 428, 453, 636.
- Cuts in, 636, 649, 669.
- Restoration of, 637, 669.
- Salaries of Members of—
- Executive Council, 15.
- House of Representatives, 17.
- Legislative Council, 16.
- Public Service, 808, 844.
- Sale of Food and Drugs, 107.
- Sale of State Timber, 337.
- Sales Tax, 406, 415, 428, 599, 793.
- Salmon, Acclimatization of, 346.
- Salt, 356.
- Samoa (sec Western Samoa).
- Sanatoria, 96, 124.
- Sand and Gravel, 347.
- Sanitary Plumbing, 116.
- Sanitation, 103–120.
- Sash and Door Factories, 363–374, 381, 386.
- Sauce-factories, 384.
- Sausage-casings, Export of, 216, 217, 224, 226, 227, 230.
- Savage (Niue) Island, 2, 19, 230, 809, 817–819.
- Savai'i Island, 3, 819.
- Savings Accounts (National), 431, 525, 526.
- Savings Bonds (National), 431, 525.
- Savings, Private, 694–598.
- Savings-banks, 522–525, 526, 528–529, 646, 804, 946.
- Sawmills, 338, 363–374, 381, 386.
- Scaffolding Accidents, 727–737.
- Scenic Reserves, 852.
- Scheelite, 216, 349.
- Scholarships, 158, 159, 359.
- School Bursaries, 149.
- School Certificate, 138, 140, 846.
- School Committees, 135, 136.
- School Inspectors, 143, 145, 147.
- School Journal, 156.
- School Savings-banks, 523–524.
- School System, 137.
- School-children, 139, 154, 931.
- Apples for, 152.
- Board and Conveyance of, 150–151.
- Dental Treatment of, 109.
- Medical Inspection of, 108.
- Milk for, 109, 152.
- Schools, 137–162, 931.
- Carpentry, 761.
- Consolidation of, 150.
- Dental Clinics, 109.
- Military, 183.
- Of Agriculture, 139, 157, 158, 159, 764, 876, 877.
- Of Mines, 157, 359.
- School-teachers, 145, 146, 155–157.
- Superannuation, 482–483.
- Scrub Lands, 852.
- Sea-fisheries, 341–345.
- Seals, 344.
- Seamen Act, Shipping and, 662–664, 799.
- Seamen, Pensions for, 469, 477, 664, 793.
- Seamen, Rehabilitation of, 664.
- Season Tickets, Railway, 282.
- Seasonal Employment, 365, 380, 715–718.
- Seasonal Incidence of Fires, 553.
- Secondary Education, 136–141, 146–151, 156, 931.
- Second-growth Land, 852.
- Secular System of Education, 135.
- Seed-gardens, 851, 911.
- Seeds, Grass, and Clover, 851, 900, 901, 908.
- Certification of, 876, 909.
- Exported, 216, 217, 225–227, 230, 269, 909, 938.
- Seismology, 8–9.
- Selections of Lands, 859–862.
- Senior Cadets, 183.
- Sentences on Criminals, 166–178, 932.
- Separate Rates, 493.
- Separation, Judicial, 61.
- Separators, Cream, 895.
- Septicæmia, Puerperal, 80, 106.
- Serpentine, 347, 356, 357, 389.
- Service Marriages, 55.
- Service, Public (see Public Service).
- Service-car Licences, 298.
- Servicemen—
- Acquisition of Land by, 651, 761, 764, 798, 803, 856–858, 862.
- Awards to, 201.
- Bursaries to Dependants, 149.
- Casualties Overseas, 200.
- Demobilization of, 768.
- Educational Facilities for, 765.
- Financial Assistance to, 446, 448, 766–768, 863.
- Overseas War Service of, 964–965.
- Pensions for, 451, 470–478.
- Registration of Deaths of, 64.
- Rehabilitation of, 412, 446, 448, 600, 664, 681, 760–768, 795, 803.
- Treated in Public Hospitals, 101.
- Voting by, 784, 787.
- Servicemen's Settlement and Land Sales Act, 651, 664, 803, 856–858.
- Applications under, 857.
- Services—
- Air Force, 188, 193–199, 200, 201.
- Army, 181–188, 199, 200, 201.
- Navy, 189–193, 199, 200, 201.
- Sessions, Parliamentary, Successive, 837.
- Settlement of Industrial Disputes, 675–679, 725.
- Settlement of Land, 804, 858–863.
- Settlement, Servicemen's, 760–768, 803, 856–858.
- Settlement, Small-farms, 664, 761, 860, 861, 862.
- Settlers, Advances to, 444–450, 860, 862.
- Sex Proportions, 23.
- Sexes of—
- Children born, 46, 48, 54, 83.
- Factory Employees, 363.
- Inmates of Charitable Institutions, 129.
- Patients in Mental Hospitals, 130–133.
- Patients in Public Hospitals, 98.
- Scholars, 143, 145, 146, 148.
- School-teachers, 155–156.
- Twin Births, 48.
- Share Prices, Index Numbers, 629–633.
- Sharebrokers' Licences, Tax on, 426.
- Share-milking Agreements, 664.
- Shares in Building Societies, 565.
- Shares, Labour, 648.
- Shearers' Wage-rates, 672.
- Shearing-machines on Farms, 895.
- Sheep, 216, 217, 914–919, 934.
- Sheep and Lambs slaughtered, 382, 924.
- Sheep-skins and Pelts exported, 216, 217, 224, 226–227, 230, 939.
- Sheet-metal Works, 363–374, 381, 388.
- Shipbuilding Works, 363–374, 381, 388.
- Shipping, 262–275, 518.
- Shipping and Seamen Act, 662–664, 799.
- Ships (see Vessels).
- Shoe-factories, 363–374, 381, 389.
- Shops and Offices Act, 657–660.
- Shops, Fire losses on, 555.
- Short-time in Factories, 367, 379–380.
- Sick Funds, 284, 359, 410, 562, 661.
- Sickness, 93–102, 462–469, 562.
- Benefits, 462, 464, 469.
- Insurance, 543, 562, 648.
- Signals, Time, 789–790.
- Silica Sand, 347, 357.
- Silver, 347, 348.
- Coins, New Zealand, 530–531.
- Exported, 216, 226, 227, 347.
- Silviculture, 327–328.
- Sinking Funds, 290, 443, 501–503.
- Size of Dwellings, 968, 970.
- Skins and Hides, Export of, 216–230, 938, 939.
- Slaughter of Animals for Food, 924.
- Slaughterhouses, 791, 875, 924.
- Sleepers, Railway, 277, 337.
- Sleeping-ears, 277.
- Slot Telephones, 318.
- Small Farms Act, 664, 761, 798, 860, 861, 862.
- Snares Islands, 1, 809.
- Snow, 10.
- Soap-factories, 363–374, 381, 385.
- Social Hygiene, 106.
- Social Security, 451–470, 592–602, 648, 649, 793, 802, 805, 808.
- Benefits, 121, 125, 126, 128, 134, 411, 452–470, 600–606, 688, 699.
- Charge, 411, 415, 422, 453, 454, 636, 808.
- Fund, 404, 408, 411, 416, 428, 454.
- Reciprocity with Australia, 453, 463, 805.
- Reciprocity with Great Britain, 453, 464, 802.
- Registration Fee, 411, 415, 428, 454.
- Taxation, 411, 415, 417, 428, 454, 599, 636.
- Social Welfare, 117, 121–124, 127–129.
- Softwood Trees, 332–333.
- Soil Conservation, 328, 487, 795, 802.
- Solander Island, 1, 809.
- Soldiers, 180–183, 199, 200, 201.
- Sources of Income, 612.
- South Africa, Reciprocity with, 258.
- South African War Pensions, 471, 476.
- Southern Alps, 4.
- Sown Grasses, 851, 874, 899, 901, 908–910.
- Spas, 790.
- Special Articles in Previous Issues, 978.
- Special Rates, 493.
- Special Schools, 152–154.
- Specialist Services, 468.
- Specie, Movement of, 209, 935.
- Specific Customs Duties, 251–253.
- Speed Limit, 298.
- Spinsters marrying, 57, 59.
- Spirits, Consumption of, 744–755.
- Spirits, Duty on, 252, 253, 256.
- Sports Councils, 118.
- Spread in Price Levels, 882.
- Stabilization Accounts, Farm, 597, 602, 878.
- Stabilization of—
- Prices, 353, 618, 619, 652, 801, 877.
- Rents, 619, 652, 691, 801.
- Wages, 619, 637, 652, 672–674, 801.
- Stabilization Subsidies, 353, 408, 592, 596, 597, 600, 604, 877.
- Stakes, Tax on, 427.
- Stamp Duties, 406, 415, 426.
- Estates certified for, 583–585.
- Standard Surveys, 870.
- Standard Time, 789.
- Standard Wage-rates, 669.
- Standardized Death-rates, 69.
- For Cancer, 78.
- Standardized Marriage-rates, 56.
- State Advances, 396, 444–450, 496, 647, 649, 689.
- Corporation, 395, 434, 444, 498, 649, 650.
- State Afforestation, 326–330, 338–339.
- State Aid to—
- Afforestation, 338.
- Building, 394–396, 401, 444–450, 496, 689, 860, 867.
- Cook Islands, 816.
- Crown Tenants, 860.
- Discharged Servicemen, 448, 664, 681, 760–768, 862.
- Farming Industry, 444–450, 649, 858–863, 866, 875–878.
- Hospital Hoards, 121–123.
- Housing, 394–396, 401, 434, 444–450, 496, 689–690, 860, 867.
- Immigrants, 26.
- Kauri-gum Industry, 355.
- Local Authorities, 121–123, 296, 445, 496, 600, 601, 699, 795.
- Manufacturing, 445, 446–448, 782–784.
- Mining, 353, 357–359.
- Niue, 819.
- Prospecting, 357.
- Purchases of Private Land, 862.
- Samoa, 819.
- Settlers, 444–450, 689, 858–862.
- Superannuation Funds, 481–484.
- Unemployed, 461, 469, 648, 687, 699.
- Water-power Development, 748–751.
- Wheat-growing, 903.
- Workers, 444–450.
- State Assets and Liabilities, 583.
- State Coal-mines, 354, 413.
- Persons employed in, 355.
- State Departments, 832–833, 835, 841–842.
- State Employment Bureaux, 687, 699, 701.
- State Finance, 403–450, 597, 941, 942.
- State Forests, 326–339, 413, 434, 793, 803.
- Accidents, 727–737.
- State Highways, 293.
- State Housing, 394–396, 401, 408, 434, 450, 689–690, 867.
- State Hydro-electric Department, 752, 842.
- State Indebtedness, 430–444, 941.
- State Insurance—
- Accident, 557, 796.
- Earthquake, 403, 414, 559.
- Fire, 558.
- Life, 556, 798.
- War Damage, 403, 414, 559.
- State Lands (see Crown Lands).
- State Marketing, 620, 803, 883–893.
- State Maternity Hospitals, 126, 467.
- State Placement Service, 688, 699, 710–713.
- State Railways, 276–284, 948.
- State Schools, 135–156, 931.
- State Water-power Supply, 748–751.
- State-guaranteed Loans, 433, 503.
- Stations—
- Aeradio, 809.
- Air Force, 194, 198, 199.
- Hydro-electric, 748–751.
- Meteorological, 10, 11, 12, 13, 809.
- Naval, 189.
- Radio, 318, 321, 324, 815, 828.
- Statistical Information, Latest (see Forefront of Book).
- Statistical Publications (see Forefront of Book).
- Statistical Summary, 929–949.
- Status of Aliens, 28.
- Statutes of 1947 and 1948, 791–808.
- Steam-vessels registered, 272.
- Sterling Exchange—
- Holdings of, 513, 516, 521.
- Rates, 532.
- Sterling Values of Currency, 532.
- Sterling Values of Trade, 202, 208.
- Stewart Island, 1, 2, 809.
- Oysters, 343.
- Population, 36.
- Still-births, 47, 54, 74–75, 127.
- Registration of, 41, 54, 63.
- Stipendiary Magistrates' Courts (see Courts).
- Stock and Station Agents—
- Advances to, 518.
- Deposits with, 529.
- Stock, Live (see Live-stock).
- Stock, Quotations for, 438.
- Stock-remedies Act, 792.
- Stone-quarries, 356, 662.
- Stones, Building and Ornamental, 347, 356, 357.
- Stranding of Vessels, 275.
- Street-ears, 285–291.
- Streets and Roads, Length of, 292.
- Strength Properties of New Zealand Timbers, 335.
- Strikes, 675–679, 719–726, 792.
- Students, 961.
- Students, University, 139, 157–160, 931.
- Submarine Cable, 318.
- Subscribers, Telephone, 317.
- Subsidies—
- Main Highways, 296, 412, 498.
- On Coal-production, 353, 600.
- On Food and Clothing, 600.
- On Rates, 498.
- Stabilization, 353, 408, 592, 596, 597, 600, 604, 877.
- To Farming Industry, 600, 877.
- To Hospital Boards, 121–123.
- To Miners, 357.
- To Pig-producers, 878.
- To Superannuation Funds, 481, 483, 486.
- To Transport Industry, 600.
- Subsidized Employment, 699.
- Subsidized Prospecting, 358.
- Subsidized Roads on Goldfields, 359.
- Succession Duty, 423, 424.
- Suffrage, 18, 489.
- Sugar—
- Consumption of, 744.
- Duty on, 251, 256.
- Exported, 216, 217.
- Fixed Price for, 618.
- Imports of, 241.
- Rationing of, 745.
- Used by Factories, 384, 385.
- Suicide, 76, 82, 85, 91, 164.
- Attempted, 179.
- Sulphur, 350, 389.
- Summary Convictions, 168, 176, 177, 178, 932.
- Summer Time (Daylight Saving), 789.
- Sunday (Raoul) Island, 809.
- Sunshine, 10, 11, 12, 13.
- Superannuation, 17, 478–486, 794, 796, 808.
- Benefits, Social Security, 455, 469.
- Superphosphate and Fertilizer Factories, 363–374, 381, 389.
- Superphosphate, Fixed Prices for, 618.
- Superphosphate, Subsidy on Manufacture, 878.
- Supplementary Medical, &c., Benefits, 467, 468, 469, 470.
- Supreme Court (see Courts).
- Surpluses, Consolidated Fund, 405, 942.
- Surrenders, Life Assurance, 538, 540.
- Surtax, 250, 256.
- Survey Publications, 872.
- Surveys, 868–873.
- Aerial, 871.
- Geodetic, 869.
- Of Coal Resources, 351, 358.
- Of Employment, 702–707.
- Of Housing, 393, 495, 649, 689.
- Of Retail Prices, 1007–1012.
- Of Ships, 274.
- Tidal, 872.
- Survey System, 868.
- Suspension of Legislation, 651, 681, 763.
- Sustenance Allowances, 688, 699.
- Suwarrow (Anchorage) Island, 2, 809.
- Swedes, 900–902, 908.
- Sweepstakes, 788.
- Swordfish, 344.
- Sympathetic Strikes, 719–726.
- Syphilis, 76, 91, 95, 106, 130.
- Syrians in New Zealand, 958.
- Systems of Rating, 493–495.
T
- Table Mortgages, 445, 572, 967.
- Takutea Island, 2, 809.
- Tallow exported, 216, 217, 223, 226, 227, 230, 269, 936.
- Tanneries, 363–374, 381, 386.
- Taranaki Ironsands, 348.
- Tariff, Customs, 249–261, 798.
- Tariffs and Trade Agreement (Geneva), 261, 798.
- Tasman Empire Airways, 307.
- Tax, Land and Income, 406, 415, 418–423, 586–590, 607–617, 792, 794, 799, 807.
- Taxation, 414–430, 592–605, 942.
- Amusements, 427.
- Customs, 249–261, 406, 415, 417, 599.
- Direct, 414, 597, 599, 604, 605.
- Employment Promotion, 417, 428, 636.
- Film-hire, 406, 428.
- Indirect, 592, 596, 597, 599, 604, 605.
- Local, 430, 493, 496–498, 601.
- Main Highways, 294, 298, 300, 415, 418, 599.
- Motor-spirits, 253, 255, 256, 294, 418, 599.
- National Security, 412, 415, 428, 599, 636.
- Orchards, 912.
- Racing, 426.
- Sales, 406, 415, 428, 599.
- Social Security, 411, 415, 428, 453, 599, 636.
- War, 255, 412, 414–430, 636.
- Taxis, 298.
- Taxpayers, Income, 607–617.
- Taxpayers, Land, 587–590.
- Tea—
- Consumption of, 744.
- Duty on, 251.
- Imports of, 241.
- Rationing of, 745.
- Teachers' Examinations, 140.
- Teachers' Superannuation Fund, 482.
- Teachers' Training Colleges, 141, 155–156.
- Teaching Aids, 156.
- Teaching Profession, 155–156, 805.
- Technical Correspondence Schools, 152.
- Technical Education, 139, 146–150, 151–152, 156, 931.
- Telegraph Services, 316, 318.
- Telegraph, Time Signals by, 790.
- Telephones, 316–318.
- Temperature Records, 10, 11, 12, 13.
- Temporary Dwellings, 966, 970.
- Tenancy and Rents, 690–692, 806.
- Tenants, Relief of, 570.
- Tenure of Crown Lands, 804, 858–862.
- Tenure of Dwellings, 967, 970.
- Tenure of Occupied Land, 851.
- Terminating Building Societies, 564–568.
- Territorial Mr Force, 194, 197, 198.
- Territorial Purees, 181–183.
- Pensions for, 470–478.
- Theatres, Cinematograph, 775, 776.
- Theatres, Fire Losses on, 555.
- Third-party Risks Insurance, 543, 544, 545, 546.
- Three Kings Islands, 1, 809.
- Threshing-machines, 895, 897–898.
- Tidal Survey, 872.
- Tile-making, 363–374, 381, 387.
- Timber—
- Carried on Railways, 282.
- Consumption of, 336–337.
- Export Duty on, 254.
- Exports of, 216, 217, 225, 226, 227, 337.
- Export Prices Index, 626, 627.
- Import Duty on, 252, 260.
- Imports of, 233, 247, 337.
- Output, 336–337, 386, 780.
- Plantations, 338–340, 851, 901, 911.
- Resources, 326–327.
- Royalties, 338, 498.
- Sales, 337.
- Trees, 331–334, 335, 336, 339, 340.
- Timbers, Strengths of, 335.
- Time lost—
- In Factories, 379.
- Through Industrial Accidents, 734–736.
- Through Industrial Disputes, 719–726.
- Time Service, 323, 789.
- Tin, 350.
- Tinware-works, 363–374, 381, 388.
- Tire-tax, 253, 255, 294, 300, 418.
- Title, Certificates of, issued, 855.
- Titles, Compulsory Registration of, 853.
- Tobacco, 875, 900–901, 913.
- Consumption of, 744.
- Duty on, 252, 254, 256, 793.
- Excise Duty on, 254, 256.
- Factories, 363–374, 381.
- Imports of, 233, 234, 241.
- Toheroa, 342, 343.
- Tokelau (Union) Islands, 2, 3, 19, 799, 800, 809, 826–828.
- Radio Stations, 828.
- Toll Communications, 316.
- Tongareva (Penrhyn) Island, 2, 318, 810.
- Ton-miles, Railway, 282.
- Tonnage of Cargo, 262–272.
- Tonnage of Registered Vessels, 272.
- Tonnage of Shipping, 262–273.
- Top-dressing, 910.
- Topographical Mapping, 871.
- Totalizator Investments, 427.
- Totalizator Taxation, 426.
- Tourist Agents Abroad, 846.
- Tourist Attractions, 790.
- Tourists, 25.
- Tourists' Rail Tickets issued, 282.
- Town Districts, 487–506.
- Area of, 37, 38.
- Bridges in, 292.
- Capital and Unimproved Values, 510.
- Debt, 500, 504.
- Employees of, 714.
- Mileage of Streets, 292.
- Population, 37, 38.
- Town Land, Mortgages on, 447, 573, 587–590.
- Town-planning, 495, 804.
- Tractors on Farms, 895, 896, 925.
- Trade, 202–261, 798, 935–939.
- Agreements, 213, 257–261.
- Balance of, 203–206.
- Cook Islands, 230, 249, 815.
- International Conference on, 210–212.
- Nauru, 829.
- Nine Island, 230, 249, 818.
- Of Ports, 262–272.
- Representatives, 846–849.
- Volume of, 208, 740.
- Western Samoa, 824.
- Trade Training of Discharged Servicemen, 761–764, 768.
- Trades Certification, 683, 800.
- Trade-marks, 777, 794.
- Trade-unions, 647, 675–679, 693–697.
- Trading Accounts, State, 410.
- Trading Banks, 514–522, 526, 527, 528, 945.
- Trading Companies' Deposits, 526, 529.
- Traffic—
- Accidents, 81, 284, 302–303.
- Air, 304–313, 806.
- Motor, 279, 290, 300–302.
- Offences, 167, 169, 176, 177–178, 179.
- Railway, 279–283, 948.
- Tramway, 285–291.
- Training Farms, 154, 763–766,
- Training of—
- Defence Forces, 181–200.
- Discharged Servicemen, 653, 761–765, 768.
- Nurses, 115.
- Police Recruits, 165.
- Teachers, 141, 155–156.
- Train-miles run, 281, 283, 948.
- Tramway District, 487–506.
- Tramways, 285–291, 498.
- Accidents, 81.
- Cable, 291.
- Transfer, Land, 852–855.
- Transhipments of Cargo, 268, 269–270.
- Transit Housing, 690.
- Transit Trade, 227–228.
- Trans-Pacific Air Services, 308–309, 313.
- Transport, 264–313, 518, 802, 805.
- Charges Committee, 619, 802.
- Co-ordination, 301, 802.
- Districts, Urban, 487–506, 714.
- Equipment, Imports of, 234, 235, 236.
- Licensing, 301, 802.
- Persons engaged in, 959, 960.
- Trans-Tasman Air Service, 307, 312.
- Trapping and Fishing, 960, 963.
- Travelling-time, 962.
- Trawling, 341.
- Treasury Bills, 432.
- Treaties of Peace, 793.
- Treaty of Waitangi, 863.
- Tree-planting, 338–340.
- Trees, Indigenous, 331–334.
- Trend of Population, 22.
- Triennial Parliaments, 17.
- Triplets born, 46–48.
- Trolley-buses, 285.
- Tropical Diseases, 813, 822, 828.
- Trout, Acclimatization of, 345.
- Trust, Invercargill Licensing, 788.
- Trust, Masterton Licensing, 788, 793.
- Trustee, Maori, 866.
- Trustee, Public, 769–771.
- Trustee Savings-banks, 524–525, 526, 529, 534, 804.
- Trust Territory, 2, 795, 799, 819–826, 828.
- Tuberculin Tests, 95.
- Tuberculosis, 73, 76, 77, 78, 85, 91, 92, 94, 95–96, 100, 110–112, 124, 132, 460, 801,
- Maori Deaths from, 85.
- Register, 96.
- Tungsten-ore, 347, 349.
- Turkeys, 926.
- Turnbull, Alexander, Library, 878.
- Turnery Factories, 363–374, 381.
- Turnips, 874, 875, 900–902, 908.
- Tussock Land, 852, 901, 910.
- Tussock Boards, Nassella, 488.
- Twins and Triplets horn, 46–48.
U
- Undergraduates, 157.
- Under-Secretaries, Parliamentary, 15, 835, 836.
- Undesirable Immigrants, Exclusion of, 27.
- Undischarged Bankrupts, 578.
- Unemployment, 648, 687–688, 698–718, 961.
- Benefits, 461, 464, 469, 688, 699.
- Taxation, 428, 636.
- Unexercised Overdraft Authorities, 519.
- Unformed Roads, 292.
- Unimproved Occupied Land, 851, 852.
- Unimproved Value of Land, 507–510.
- Holdings, 587–590.
- Land-tax assessed on, 420, 587, 588,
- Rating on, 494.
- Uninhabited Dwellings, 966.
- Union (Tokelau) Islands, 2, 3, 19, 809, 826–828.
- Radio Stations, 828.
- Unions, Trade, 647, 675–679, 693–697, 1000.
- United Kingdom—
- Debt domiciled in, 431, 438, 440, 504–506.
- New Zealand Representatives in, 847.
- Note Circulation, Index of, 520.
- Purchase of Primary Produce, 212, 626, 885–893, 924, 925.
- Representatives in New Zealand, 847.
- Social Security Reciprocity, 464, 802.
- United Nations, 3, 807, 819.
- United States of America—
- New Zealand Representatives in, 847.
- Representatives in New Zealand, 849.
- Retail Prices in, 1015.
- Universal Superannuation, 455, 469.
- University Education, 139, 157–160, 931.
- University Examinations, 114, 140.
- University Professors, 157, 159.
- University Scholarships, 158.
- Unpaid Fractions, Totalizator, 427.
- Unpaid Rates, Penalty on, 498.
- Unproductive Land, 850, 852.
- Untenanted Houses, 393.
- Upolo Island, 3, 819, 821.
- Uranium, 350.
- Urban Areas—
- Fire Losses, 551.
- Population, 32–33.
- 34, Urban Drainage Districts, 487–506, 714.
- Urban Drift, 32.
- Urban Farm Lands, Rating on, 493, 507.
- Urban Population, 32–34.
- Urban Security, Mortgages on, 447, 571, 573–574, 587, 588.
- Urban Transport Districts, 487–506, 714.
- Use or Purpose of Imports, 234–237.
- Utilization of Coal, 354.
V
- Vacancies, Employment, 707–709, 712.
- Valuation—
- Of Exports, 205, 213.
- Of Imports, 205, 231.
- Of Land, 507–510, 804.
- Of Personal Consumption, 594, 596.
- Of Superannuation Funds, 481, 482, 483.
- Value added in Manufacturing, 361, 362, 371–372, 375, 377, 940.
- Value of—
- Currency, 532–534.
- Exports, Effects of Prices on, 228–230.
- Factory Production, 361, 362, 371, 375, 377, 381–390, 779–782, 940.
- Farm Production, 779–782, 878–883.
- Goods available for Use, 738, 739.
- Land Holdings, 586–590.
- Materials used in Factories, 361, 362, 370, 372, 375, 377, 381–390, 940.
- Production, 738, 779–782.
- State Property, 583.
- Veal, 924.
- Consumption of, 743.
- Export of, 226, 227, 230.
- Vegetable Gardens, 899, 911.
- Vegetable-preserving Factories, 363–374, 381, 384.
- Vegetables, Consumption of, 744.
- Vegetables for the Armed Forces, 911.
- Vegetables, Price Fixation of, 619, 620.
- Vegetables, Retail Prices of, 621–622, 1000–1005.
- Vegetation, 14.
- Vehicles—
- Motor (see Motor-vehicles).
- Railway, 277.
- Tramway, 285.
- Venereal Diseases, 76, 91, 95, 100, 106, 130, 464.
- Vessels—
- Crews of, 25.
- Entered and cleared, 262–264.
- Nationality of, 264.
- Naval, 189.
- Radio Communication with, 318.
- Registered, 272.
- Survey of, 274.
- War, 191–193.
- Wrecked, 275.
- Veterans' Allowances, 452, 469, 470, 475.
- Veterinary Services, 866, 875.
- Victory Loans, 437.
- Vinegar-factories, 384.
- Vineyards, 851, 966, 913.
- Violent Deaths, 76, 81–82, 85, 91, 164, 362, 352, 357.
- Virgin Bush, Area of, 326, 852.
- Visible Trade-balance, 263–266.
- Visitors to New Zealand, 25–26.
- Visual Aids in Teaching, 156.
- Vital Statistics, 41–162, 936.
- Cook Islands, 812.
- Nine Island, 817.
- Western Samoa, 821.
- Viticulture, 851, 966, 913.
- Vocational Guidance, 150, 680, 700.
- Volcanoes, 4.
- Volume of—
- Exports, 208, 229.
- Factory Production, 378–379, 781.
- Farm Production, 781, 880–881.
- Goods available for Use, 740.
- Imports, 268, 740.
- Money in Circulation, 527.
- Production, 378, 738, 781–782, 881.
- Trade, 208, 740.
- Voluntary Contributions to Hospitals, 122.
- Voluntary Enlistment, 184.
- Voluntary Mental Patients, 131.
- Voting—
- At General Elections, 784.
- At Licensing Polls, 787.
- Qualifications, 18, 489.
- Vouchers, Audit of, 464.
W
- Wage, Basic, 668.
- Wage, Minimum, 657, 659, 665, 668, 794.
- Wage-cost Allowance, 890.
- Wage-earners, 363–365, 697, 714.
- Wage-rates, 366, 367, 634–643, 645, 657, 659, 660, 663, 668, 669–672.
- Wages—
- And Salary Payments, 591–606.
- And Wage-rate Legislation, 668–672.
- Increases in, 636, 657, 668–672, 794.
- Legislative Changes in, 636, 668–672.
- Lost through Industrial Accidents, 736.
- Lost through Industrial Disputes, 720–725.
- Of Cinematograph Theatre Employees, 775.
- Of Electric-supply Employees, 754.
- Of Factory Employees, 361, 362, 365–368, 377, 381–390, 940.
- Protection of, 650, 674–675.
- Reduction of, 636, 649, 669.
- Restoration of Cuts in, 636, 669.
- Shearers', 672.
- Stabilization of, 618, 637, 652, 672–674.
- Tax on, 411, 428, 454, 636.
- Waitangi, Treaty of, 863.
- Waitangi Treaty Site, Gift of, 339.
- Wakari Private Mental Hospital, 130, 133.
- War, 180–201.
- Administration, 182.
- Apprentices, 681.
- Consumption of Commodities, 745–747.
- Financial Transactions, 534.
- Labour Legislation, 651–653, 664, 672–674, 701.
- Mortgages, 571–572.
- Prices, 353, 618–619, 620, 877–878.
- Service in the Armed Forces, 182, 183.
- Bursaries for Soldiers' Dependants, 149.
- Apprentices, 681.
- Consumption of Commodities, 745–747.
- Financial Transactions, 534.
- Labour Legislation, 651–653, 664, 672–674, 701.
- Mortgages, 571–572.
- Prices, 353, 618–619, 620, 877–878.
- Service in the Armed Forces, 182, 183.
- Cabinet, 180.
- Apprentices, 681.
- Consumption of Commodities, 745–747.
- Financial Transactions, 534.
- Labour Legislation, 651–653, 664, 672–674, 701.
- Mortgages, 571–572.
- Prices, 353, 618–619, 620, 877–878.
- Service in the Armed Forces, 182, 183.
- Casualties, 200.
- Apprentices, 681.
- Consumption of Commodities, 745–747.
- Financial Transactions, 534.
- Labour Legislation, 651–653, 664, 672–674, 701.
- Mortgages, 571–572.
- Prices, 353, 618–619, 620, 877–878.
- Service in the Armed Forces, 182, 183.
- Damage Insurance, 403, 414 559–560.
- Apprentices, 681.
- Consumption of Commodities, 745–747.
- Financial Transactions, 534.
- Labour Legislation, 651–653, 664, 672–674, 701.
- Mortgages, 571–572.
- Prices, 353, 618–619, 620, 877–878.
- Service in the Armed Forces, 182, 183.
- Deaths Register, 64.
- Apprentices, 681.
- Consumption of Commodities, 745–747.
- Financial Transactions, 534.
- Labour Legislation, 651–653, 664, 672–674, 701.
- Mortgages, 571–572.
- Prices, 353, 618–619, 620, 877–878.
- Service in the Armed Forces, 182, 183.
- Debt, 433, 434, 437.
- Apprentices, 681.
- Consumption of Commodities, 745–747.
- Financial Transactions, 534.
- Labour Legislation, 651–653, 664, 672–674, 701.
- Mortgages, 571–572.
- Prices, 353, 618–619, 620, 877–878.
- Service in the Armed Forces, 182, 183.
- Expenditure, 183, 191, 199, 407, 413, 600.
- Apprentices, 681.
- Consumption of Commodities, 745–747.
- Financial Transactions, 534.
- Labour Legislation, 651–653, 664, 672–674, 701.
- Mortgages, 571–572.
- Prices, 353, 618–619, 620, 877–878.
- Service in the Armed Forces, 182, 183.
- Expenses Account, 412, 601, 602.
- Apprentices, 681.
- Consumption of Commodities, 745–747.
- Financial Transactions, 534.
- Labour Legislation, 651–653, 664, 672–674, 701.
- Mortgages, 571–572.
- Prices, 353, 618–619, 620, 877–878.
- Service in the Armed Forces, 182, 183.
- Loans, 437.
- Apprentices, 681.
- Consumption of Commodities, 745–747.
- Financial Transactions, 534.
- Labour Legislation, 651–653, 664, 672–674, 701.
- Mortgages, 571–572.
- Prices, 353, 618–619, 620, 877–878.
- Service in the Armed Forces, 182, 183.
- Measures affecting—
- Apprentices, 681.
- Consumption of Commodities, 745–747.
- Financial Transactions, 534.
- Labour Legislation, 651–653, 664, 672–674, 701.
- Mortgages, 571–572.
- Prices, 353, 618–619, 620, 877–878.
- Service in the Armed Forces, 182, 183.
- Pensions, 451–452, 469, 470–478, 651, 793, 797.
- Pensions Appeal Board, 477.
- Publications pertaining to, 996, 997.
- Purchases of Produce, 212, 349, 885–893.
- Service, 964.
- Taxation, 252–256, 412, 414–430, 636.
- Veterans' Allowances, 452, 469, 470, 475.
- Warships, 189, 191–193.
- Wartime Price Index, 620–621, 652, 1011–1012.
- Wartime Regulations, &c., 651–654.
- Wartime Restrictions on Consumption, 745–747.
- Waterfront Control, 652, 667.
- Water-power, 368, 748–759.
- Water-supply District, 487–506, 714.
- Wealth, 583–590.
- Weather, 9–13.
- Weights and Measures, 868, 900.
- Welfare of Workers, 657, 659, 661, 663, 666.
- Welfare, Maternal, 112.
- Welfare Organizations, 117.
- Wellington—
- Broadcasting Stations, 321–325.
- Building Values, 399.
- Dwellings, 401.
- Fires, 551.
- Population, 33, 34, 36.
- Rainfall, 10, 11, 12, 13.
- Retail Prices, 622, 623, 1006, 1007.
- Sales-tax Receipts, 429.
- Shipping, 263, 266–270.
- Sunshine, 10, 11, 12, 13.
- Temperature, 10, 11, 12, 13.
- Tramways, 285, 287–291.
- Western Samoa, 2, 3, 795, 799, 809, 819–826.
- Bibliography, 997.
- Population of, 19, 820.
- Radio Communication, 318.
- Trade, 824.
- Whale-oil, 216, 344, 830.
- Whales and Whaling, 344, 830.
- Wheat, 875, 897, 899–904, 908, 933.
- Fixed Prices for, 618.
- Imports of, 241.
- Milled, 383.
- Research Institute, 903.
- Restriction on Imports of, 903.
- Varieties of, 898.
- Whey Butter, 922.
- Whipping abolished, 170.
- White Island Sulphur, 350.
- Whitebait, 342–344.
- Wholesale Licences, 785.
- Wholesale Prices, 623–625, 628, 632, 633.
- Whooping-cough, 76, 85, 91, 100, 109.
- Widowed Persons, Numbers of, 953.
- Widowers, Remarriages of, 57.
- Widows—
- Benefits, 457, 464, 469.
- Pensions Act, 451.
- Remarriages of, 57.
- War Pensions, 471–478.
- Wild Pigs, Destruction of, 877.
- Wills administered by Public Trust Office, 769–771.
- Wine, Duty on, 252, 256.
- Wine, Consumption of, 744.
- Wine Licences, 785.
- Wireless (see Radio).
- Withdrawals from Savings-banks, 523, 524, 946.
- Wives, Aggregation of Income, 611.
- Wives, Allowances in respect of, 453–484.
- Wives' Petitions in Divorce, 62.
- Women—
- Auxiliary Air Force, 197, 198, 797.
- Auxiliary Army Corps, 181.
- Deaths of, in Childbirth, 76, 80, 91, 100, 102, 127.
- Eligible for Parliament, 16.
- Employed in Factories, 363.
- Industrial Workers, Recreation for, 119.
- Nationality Laws re, 28.
- Naval Service, 191.
- Of Child-bearing Ages, 44.
- Offences by, 166, 168, 176, 177.
- Police, 166.
- Suffrage for, 18, 647.
- Wage-rates of, 365, 366, 636, 641, 642, 645, 669.
- War Service Auxiliary, 200.
- Working-conditions of, 646, 656, 658, 660.
- Working-hours of, 643–645.
- Woodware Factories, 363–374, 381.
- Wool, 918–919, 936.
- Disposal Commission, 886.
- Export Price Index, 626, 627.
- Exported, 216, 217, 221, 226, 227, 230, 269, 918, 936.
- Financing Purchase of, 210.
- Levy 254, 919.
- Marketing of, 883–887.
- Prices for, 885–887.
- Purchase for War Purposes, 212, 885–886.
- Used at Local Mills, 389, 918.
- Woollen-mills, 363–374, 381, 389, 518.
- Wool-scouring Works, 363–374, 381, 385.
- Workers, Advances to, 444–450.
- Workers' Compensation, 544, 560, 648, 684–687, 728, 729, 796.
- Insurance, 643, 544, 557, 560.
- Workers' Dwellings, 394–396, 444–450, 496, 690.
- Workers' Educational Association, 161.
- Workers' Unions, 647, 675–679, 694–697.
- Workers' Weekly Railway Tickets, 282.
- Working Conditions, 654–668.
- Working Conditions in the Government Service, 666.
- Working Proprietors, 703–706.
- Working Railways Account, 278–281, 413, 948.
- Working-days lost through Industrial Disputes, 719–726.
- Working-hours, 379, 643–645, 656, 658, 660, 663, 665.
- Working-men's Clubs, 561.
- World Comparisons (see Comparisons).
- Wrecks, 275, 664.
X
- X-ray—
- Diagnostic Services, 467, 470.
- Examinations, 95, 467.
Y
- Yields of Butterfat, 922.
- Yields of Crops, 875, 898, 901–914, 933.
- Yields on Market Prices of Shares, 631.
- Youth Centres, 700.
- Youths—
- Wage-rates of, 636, 642.
- Working-conditions of, 656, 658, 660.
Z
- Zoology, 14.
- By Authority: R. E. OWEN, Government Printer, Wellington.—1950.